performance & grow th - annualreports.com
TRANSCRIPT
Annual Report 2012
PER
FOR
MA
NC
E &
GR
OW
TH
13/03/2013 09:36
DIS
TRIB
UTI
ON
PR
OD
UC
TSM
ATER
IALS
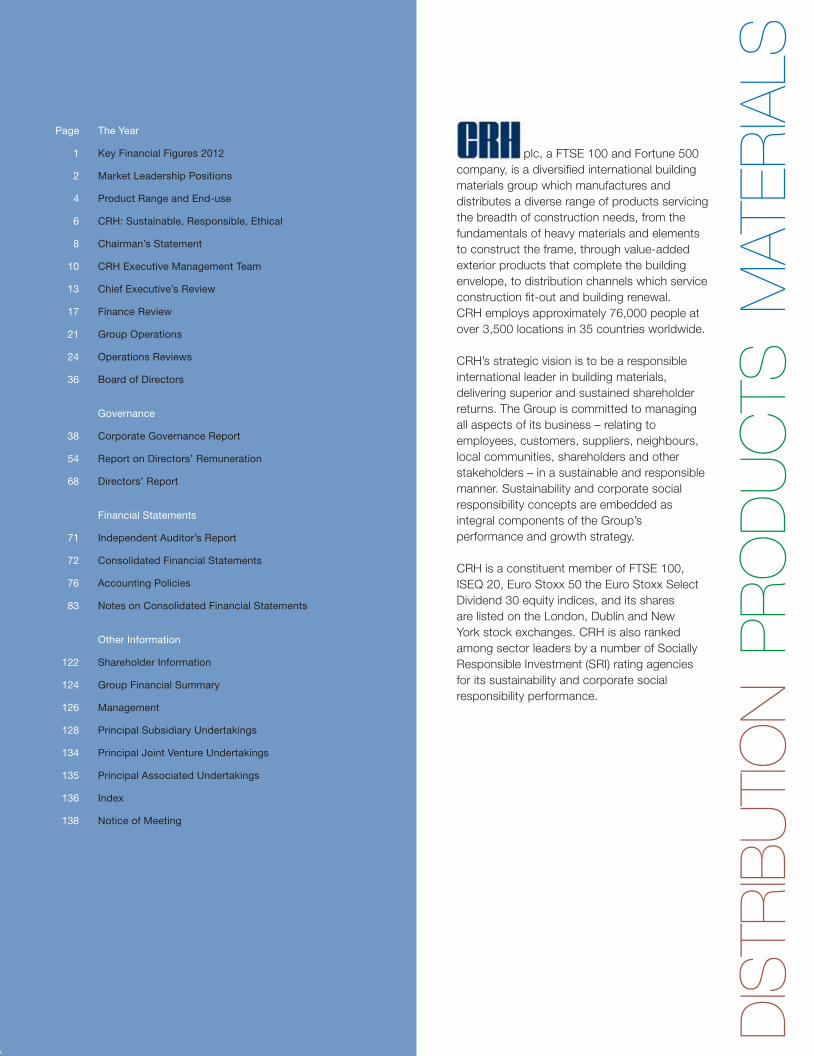
plc, a FTSE 100 and Fortune 500
company, is a diversified international building
materials group which manufactures and
distributes a diverse range of products servicing
the breadth of construction needs, from the
fundamentals of heavy materials and elements
to construct the frame, through value-added
exterior products that complete the building
envelope, to distribution channels which service
construction fit-out and building renewal.
CRH employs approximately 76,000 people at
over 3,500 locations in 35 countries worldwide.
CRH’s strategic vision is to be a responsible
international leader in building materials,
delivering superior and sustained shareholder
returns. The Group is committed to managing
all aspects of its business – relating to
employees, customers, suppliers, neighbours,
local communities, shareholders and other
stakeholders – in a sustainable and responsible
manner. Sustainability and corporate social
responsibility concepts are embedded as
integral components of the Group’s
performance and growth strategy.
CRH is a constituent member of FTSE 100,
ISEQ 20, Euro Stoxx 50 the Euro Stoxx Select
Dividend 30 equity indices, and its shares
are listed on the London, Dublin and New
York stock exchanges. CRH is also ranked
among sector leaders by a number of Socially
Responsible Investment (SRI) rating agencies
for its sustainability and corporate social
responsibility performance.
Page The Year
1 Key Financial Figures 2012
2 Market Leadership Positions
4 Product Range and End-use
6 CRH: Sustainable, Responsible, Ethical
8 Chairman’s Statement
10 CRH Executive Management Team
13 Chief Executive’s Review
17 Finance Review
21 Group Operations
24 Operations Reviews
36 Board of Directors
Governance
38 Corporate Governance Report
54 Report on Directors’ Remuneration
68 Directors’ Report
Financial Statements
71 Independent Auditor’s Report
72 Consolidated Financial Statements
76 Accounting Policies
83 Notes on Consolidated Financial Statements
Other Information
122 Shareholder Information
124 Group Financial Summary
126 Management
128 Principal Subsidiary Undertakings
134 Principal Joint Venture Undertakings
135 Principal Associated Undertakings
136 Index
138 Notice of Meeting
2013_Cover008.indd 2
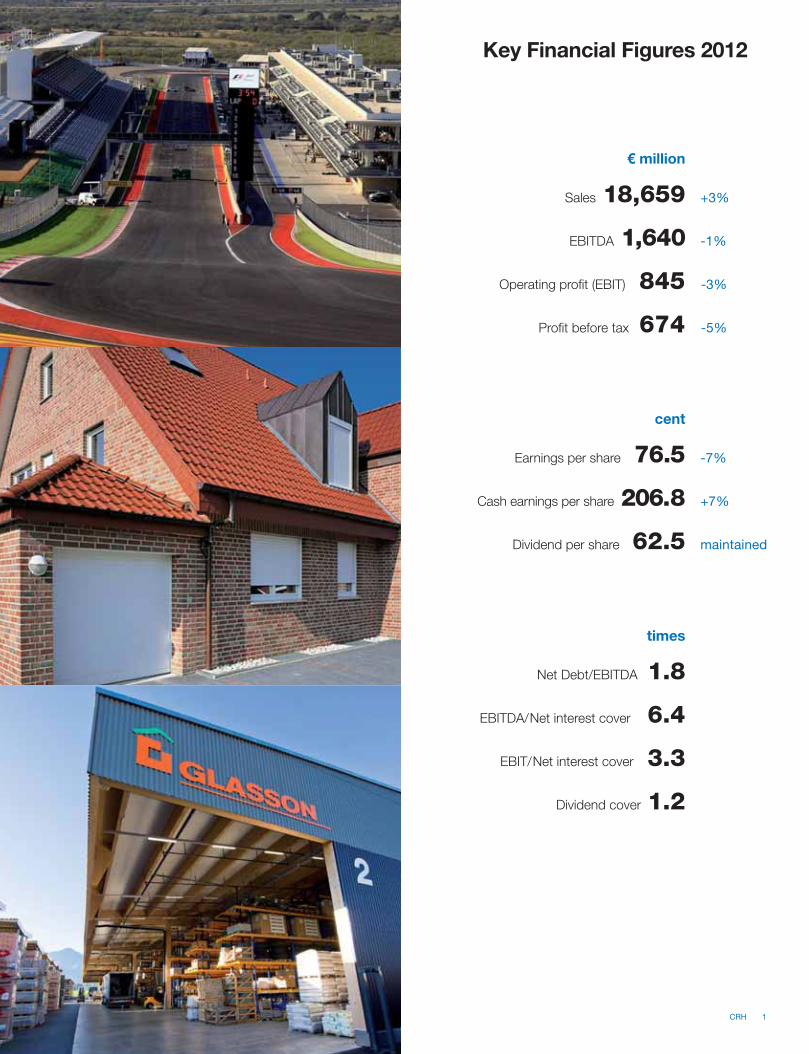
€ million
Sales 18,659 +3%
EBITDA 1,640 -1%
Operating profit (EBIT) 845 -3%
Profit before tax 674 -5%
cent
Earnings per share 76.5 -7%
Cash earnings per share 206.8 +7%
Dividend per share 62.5 maintained
times
Net Debt/EBITDA 1.8
EBITDA/Net interest cover 6.4
EBIT/Net interest cover 3.3
Dividend cover 1.2
Key Financial Figures 2012
CRH 1
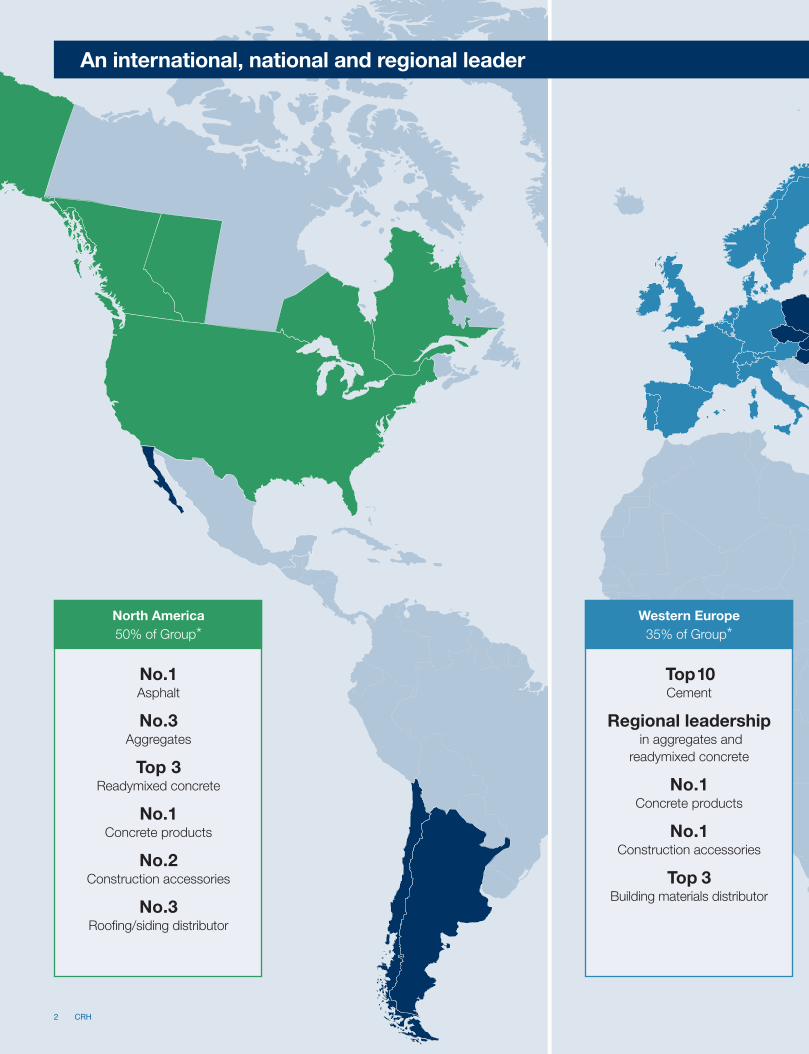
Western Europe
35% of Group*
Top 10Cement
Regional leadership in aggregates and
readymixed concrete
No.1Concrete products
No.1Construction accessories
Top 3Building materials distributor
North America
50% of Group*
No.1Asphalt
No.3Aggregates
Top 3Readymixed concrete
No.1Concrete products
No.2Construction accessories
No.3Roofing/siding distributor
An international, national and regional leader
2 CRH
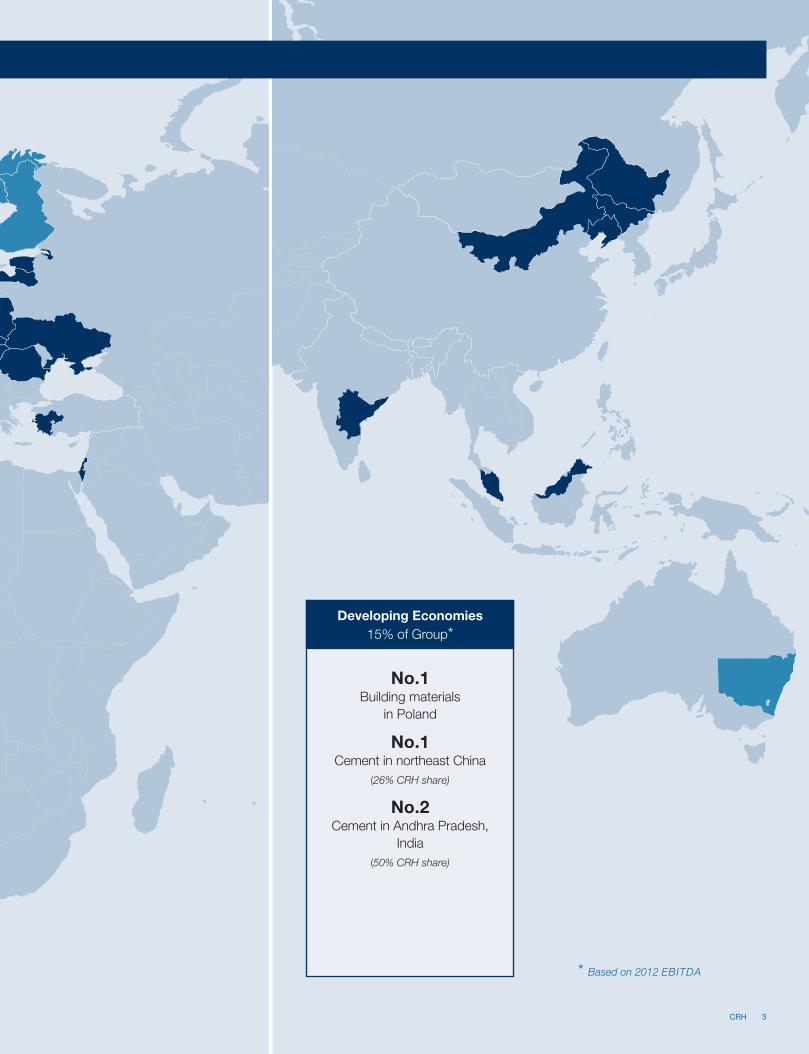
Developing Economies
15% of Group*
No.1Building materials
in Poland
No.1Cement in northeast China
(26% CRH share)
No.2Cement in Andhra Pradesh,
India
(50% CRH share)
* Based on 2012 EBITDA
CRH 3

Materials
Materials – 59% of Group*
CRH operates strong vertically-integrated primary materials businesses
which have strategically located long-term reserves, balanced end-use
exposure and leading market positions in all of the Group’s major markets.
This business model enables CRH to interact with the market at many
levels and to earn profit at multiple stages of the supply chain with the
pull-through of aggregates and cement into a broad range of downstream
products. This is underpinned by long-term permitted reserves which
totalled over 15 billion tonnes at end-2012. In addition the business
model provides a broad balance of exposure to end-use demand drivers
and multiple platforms for growth. CRH continuously invests in plant
and equipment for safety, quality, efficiency and customer service while
also seeking out value-creating expansion opportunities via greenfield
development and acquisitions in selected markets.
Products – 22% of Group*
CRH manufactures products for use in residential, non-residential and,
to a lesser extent, infrastructure construction applications. These include
building systems and engineered concrete solutions for use in the
electrical, transportation, and communications industries; architectural
concrete products to enhance the facade and surroundings of buildings;
and construction accessories to assist in the construction process.
Complementary value-added exterior products include architectural glass,
aluminium glazing systems, clay brick and block, outdoor security products
and shutters and awnings. Focussed on growth opportunities in stable
markets, these businesses offer customers a broad range of engineered
products and innovative building solutions to service both new build and
the growing repair, maintenance and improvement (RMI) demand in mature
economies.
Distribution – 19% of Group*
CRH distributes building materials to general building contractors,
specialist Sanitary, Heating and Plumbing (SHAP) contractors and
Do-It-Yourself (DIY) customers in Europe and to professional roofing/
siding and interior products contractors in the United States. The business
model centres on building an extensive network of locations that penetrate
major metropolitan areas and which, with strong category and logistics
management, maximise the franchise potential. With a network of over 780
branches in Europe and over 180 branches in the United States, CRH is a
leading international player in building materials distribution with exposure
to the growing RMI markets in Western Europe and in the United States.
Our diverse product range services the breadth of construction needs
Infrastructure
35%
Residential
35%
Non-residential
30%
RMI
50%
New
50%
Sector Exposure* End-use*
Residential – New
Non-residential – New
Infrastructure – New
* Based on 2012 EBITDA
4 CRH

Residential – RMI
Non-residential – RMI
Infrastructure – RMI
Residential
New: Vendome pavers manufactured by Oldcastle Architectural’s Canadian
subsidiary, Permacon, and Belgard Hardscape pavers from our United
States-manufactured Old World Collection were used in the driveway of this
construction project in Quebec, Canada, helping to blend the new property
into a neighbourhood where houses have been established for nearly
a century. The pavers of the driveway are intended to replicate old streets
paved with granite cobblestones.
RMI: Quester is the number one builders merchants in Austria with a prime
focus on professional contractors. In summer 2012 they opened a highly
energy efficient tile store in Wien-Auhof (shown) in co-operation with the
sanitary wholesalers SHT.
Non-residential
New: The uGate, a cantilever sliding gate made of aluminum which can be
operated by hand or mechanically, was introduced by Heras, the Netherlands-
based outdoor security specialist, in June 2012. This gate has maximum
dimensions of 12 metres width and 2.5 metres height, making it suitable for
many different applications. This picture shows a uGate at a BMW dealer in
Lochristi, Belgium. Heras distributes gates and fences throughout Europe.
RMI: The Monarch 1 building in The Hague was the first major renovated
building in the Netherlands to receive BREEAM sustainability certification, the
world’s foremost environmental assessment method and rating system for
buildings. The building was selectively deconstructed to the concrete skeleton
and rebuilt. To preserve climate control of the building 1,000 solar shading
elements were mounted on the facade; the horizontal profiles in the system
were developed by AVZ and the complete screens were assembled by Smits
Rolluiken, both part of Europe Products’ Shutters & Awnings business. Europe
Materials’ Cementbouw business supplied the concrete for the renovation.
Infrastructure
New: The transformation into a motorway of the E18 road is one of the most
extensive road projects ever in Finland and is due to open in 2015. The 53
kilometres Koskenkylä section (shown) will have six interchanges and 68 new
bridges. Rudus, Europe Materials’ Finnish aggregates and readymixed
concrete subsidiary, will be delivering 150,000 m³ of concrete and concrete
products (pipes, wells, railings) to this project.
RMI: Telluride Gravel, an Americas Materials company, performing full-depth
road reconstruction and embankment slide repairs on Colorado State
Highway 145 at Lizard Head Pass, Trout Lake, Colorado.
CRH 5
CRH’s success over 40 years of operation has been based on a solid foundation
and commitment to the fundamentals of doing business in a sustainable and
responsible manner. These fundamentals of business – strong customer and
supplier relationships, value-added products, efficient production processes and
targeted markets – are managed within an established sustainability framework
with a strong focus on four key areas: Health and Safety, Environment and
Climate Change, Governance, and People and Community. In each of these
areas, CRH sets and implements policies, develops management systems,
monitors performance and incorporates stakeholder feedback, aiming for
continuous improvement across all of its activities. CRH has formal structures
in place to identify, evaluate and manage potential risks and opportunities in
sustainability areas and the Group’s performance in this regard is reviewed
regularly by the Board of Directors.
As the global impacts of resource scarcity, climate change and changing
demographics become more apparent, CRH is committed to playing its part
in addressing these challenges while also generating business opportunities
through investment, development and innovation across its range of products
and throughout its processes. This approach is fully aligned with CRH’s strategic
vision – to be a responsible international leader in building materials, delivering
superior and sustained shareholder returns.
Health and Safety
The health and safety of everyone working for CRH continues to receive a
high priority and in 2012 further progress was made in reducing the number of
accidents. New initiatives were introduced during the year to augment existing
safety systems and further heighten awareness of safety, with the aim of fully
embedding a culture of safety at every level of the organisation. Safety in
emerging regions, contractor safety and transport safety remain key focus areas.
Despite these safety improvements, CRH deeply regrets that three fatalities
(two employees and one contractor) occurred in Group subsidiary companies
during 2012. The circumstances around each of these individual tragedies have
been examined and the lessons learned have been communicated across
all businesses and operations. The elimination of fatalities is a fundamental
objective of CRH.
Environment and Climate Change
With ever increasing demands on world resources and mounting pressures
on the global environment, CRH continues to focus on achieving the highest
standards of environmental management and control and on reducing its
environmental impact. Throughout the Group extensive programmes are in
place to improve energy efficiency, increase the use of alternative fuels, achieve
targeted air emission reductions, optimise water use, reduce waste and
increase recycling. CRH remains on target to meet its commitment to reduce
specific cement plant carbon emissions by 15% on 1990 levels by 2015 and
is also fully committed to the restoration of worked-out pits and quarries and
maintaining biodiversity in the locations in which it operates. Developments in
all of these areas, which are of increasing importance to customers and other
stakeholders, are ongoing and core to CRH’s activities.
Governance
CRH is widely recognised as operating to the highest levels of corporate
governance. The CRH Board complies fully with the requirements of the 2010
UK Corporate Governance Code and also with the applicable provisions of
the Sarbanes-Oxley Act. CRH places ethics at the forefront of all business
interactions and is firmly committed to the Group’s core values of integrity,
honesty and respect for the law. The Code of Business Conduct and related
policies set out clear guidance on conducting business in an ethical and
responsible way and confirm the long-standing Group commitment to human
and labour rights. Through a Group-wide compliance and ethics programme,
CRH ensures employees are appropriately trained, have access to secure
channels to report genuine issues and have additional support available if
needed. A detailed review of corporate governance, including further details
on the compliance and ethics programme, is provided on pages 38 to 53 of
this Report.
People and Community
At the heart of CRH are the people and communities which both support and are
supported by Group companies operating at over 3,500 locations worldwide.
CRH believes that continued sustainable business success depends on the
excellent relationships maintained with stakeholders – employees, customers,
suppliers, neighbours and others.
CRH provides significant employment, encourages personal development
and aims to create opportunities for employees at all levels as it meets the
leadership challenge of sustainable performance and growth.
CRH is rooted in local communities and through both its core business activities
and a variety of local social initiatives the Group supports community enterprises
and projects across all of its global operations.
Communications
CRH attaches great importance to communications with all stakeholders and
in 2012 maintained its open door policy on stakeholder engagement, holding
open days at many of its facilities, communicating regularly with key stakeholder
groups and encouraging feedback on a broad range of issues.
In November 2012, the Group organised capital markets days for investors and
sector analysts in London and New York. These events included presentations
on various aspects of CRH’s operations and strategy and, in keeping with the
Group’s practice of open dialogue, provided an opportunity for attendees to
meet with the senior executive and Divisional management team.
CRH remains committed to reporting on its sustainability performance in a
complete and transparent manner, and to publishing performance indicators
on key identified sustainability areas. An annual Sustainability Report, in line
with Global Reporting Initiative (GRI) guidelines, is published separately and is
available on www.crh.com. The independently-verified 2012 CRH Sustainability
Report will be available by mid-2013.
External Endorsements
In 2012, CRH maintained its distinguished record of being ranked among
sector leaders by a number of Socially Responsible Investment (SRI) rating
agencies. CRH continues as a constituent member of several sustainability
indices including the Dow Jones Sustainability Indexes and the FTSE4Good
Index. In addition, many Group companies have won high-ranking accolades
for excellence in sustainability achievements.
CRH: Sustainable, Responsible, Ethical
6 CRH

The Occupational Safety and
Health Administration (OSHA)
establishes, issues and enforces
national workplace safety
regulations in the United States.
In May 2012, Oldcastle Precast’s
Idaho Falls location was awarded
the prestigious VPP Star worksite
status for the second time after a
rigorous review of safety and health
management systems, ongoing
performance and thorough on-site
evaluation by OSHA’s Voluntary
Protection Program’s (VPP) team of
safety and health professionals.
A green roof regeneration scheme
in London, UK, was installed by
Cityroofs, part of Europe Products’
concrete landscaping business. An
indigenous mix of wildflowers and
grasses was planted to encourage
the diversity of flora and fauna in the
area. Cityroofs provides complete
elevated landscape solutions which
benefit the built environment and
contribute towards sustainable
development.
CRH/Oldcastle in the United States
supports Habitat for Humanity in
its mission to provide affordable
housing. In 2012 Oldcastle
sponsored its third Habitat home-
build, donating building materials
for a project in Atlanta, Georgia.
Pictured with the homeowner are a
number of the employee volunteers
who assisted in the project over a
seven-week period.
CRH 7
CRH’s operations across the globe faced mixed economic circumstances
during 2012. In our main markets, there was an ongoing improvement in
overall economic activity in the United States, which saw a welcome recovery
in residential construction, while consumer and investor confidence continued
to slow in European economies, particularly in the Netherlands. Against this
backdrop, Group profit before tax amounted to €674 million and earnings per
share were 76.5c. The profit and earnings per share outturns represented
declines of 5% and 7% respectively, compared with 2011 outturns of
€711 million and 82.6c.
The Group’s results and the performance of the separate business segments
are covered in detail in the Chief Executive’s review and in the Finance and
Operations reviews which follow.
Dividend
In August 2012 the Board decided to maintain the interim dividend of
18.5c. This took into account anticipated strong second-half cash flows
and the Group’s strong balance sheet. With full-year operating cash flow
before dividends of €0.5 billion and taking into account 2012 profit, capital
expenditure, development activity and portfolio rationalisation, the Board is
recommending a final dividend of 44c per share. If approved at the Annual
General Meeting in May 2013, this will maintain the full year 2012 dividend
of 62.5c per share.
Development Activity
Total acquisition activity for 2012 was over €0.6 billion, including deferred
consideration of approximately €0.1 billion. This reflects CRH’s long-
term value-based approach to developing our balanced portfolio. The
Materials transactions in the United States, including the acquisition of a
majority shareholding in Trap Rock Industries, an integrated aggregates
and asphalt business in New Jersey, bring strong asset-backed resource
positions and, when combined with existing operations, provide significant
opportunities for vertical integration. In Europe we added to our downstream
materials activities in Finland strengthening our presence in that country.
In the Products segment the 2012 acquisitions included seven concrete
paving facilities in Canada and Florida and a significant Shutters & Awnings
enterprise in Germany. These acquisitions reflect our focus on RMI and
sustainability segments and on the optimisation of production networks in
core regions. Our Distribution additions similarly reflected an RMI emphasis
with the ongoing development of our Sanitary, Heating and Plumbing
business in Europe.
Developing Regions
CRH’s strategy in developing regions is to achieve leading regional market
positions, initially through premium resource-backed assets and, over time,
to pursue vertical integration and develop downstream activities. CRH is
a 26% shareholder in Yatai Building Materials (YBM). YBM is the largest
cement producer in northeast China, with operations in the provinces of Jilin,
Heilongjiang and Liaoning. Since CRH’s purchase of its 26% shareholding in
early-2009, the business has nearly doubled in size. CRH also has operations
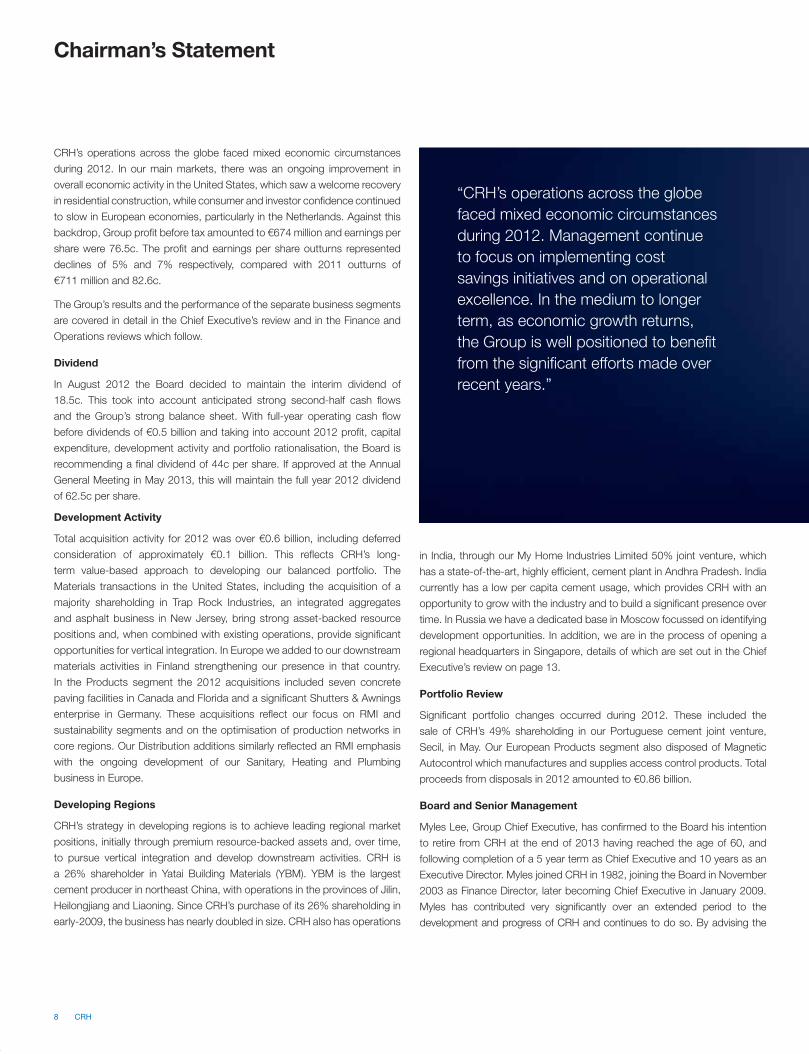
Chairman’s Statement
“CRH’s operations across the globe
faced mixed economic circumstances
during 2012. Management continue
to focus on implementing cost
savings initiatives and on operational
excellence. In the medium to longer
term, as economic growth returns,
the Group is well positioned to benefit
from the significant efforts made over
recent years.”
in India, through our My Home Industries Limited 50% joint venture, which
has a state-of-the-art, highly efficient, cement plant in Andhra Pradesh. India
currently has a low per capita cement usage, which provides CRH with an
opportunity to grow with the industry and to build a significant presence over
time. In Russia we have a dedicated base in Moscow focussed on identifying
development opportunities. In addition, we are in the process of opening a
regional headquarters in Singapore, details of which are set out in the Chief
Executive’s review on page 13.
Portfolio Review
Significant portfolio changes occurred during 2012. These included the
sale of CRH’s 49% shareholding in our Portuguese cement joint venture,
Secil, in May. Our European Products segment also disposed of Magnetic
Autocontrol which manufactures and supplies access control products. Total
proceeds from disposals in 2012 amounted to €0.86 billion.
Board and Senior Management
Myles Lee, Group Chief Executive, has confirmed to the Board his intention
to retire from CRH at the end of 2013 having reached the age of 60, and
following completion of a 5 year term as Chief Executive and 10 years as an
Executive Director. Myles joined CRH in 1982, joining the Board in November
2003 as Finance Director, later becoming Chief Executive in January 2009.
Myles has contributed very significantly over an extended period to the
development and progress of CRH and continues to do so. By advising the
8 CRH
Board of his decision well in advance of retirement, Myles has, in line with
long-established CRH practice, facilitated the planning and management of
his succession in an ordered and timely fashion. The Board has appointed a
Committee, which I will chair, to conduct the search for a successor to Myles.
Kieran McGowan retired from the Board and the Chairmanship following
the Annual General Meeting in May 2012. He joined the Board in 1998 and
became Chairman in 2007. Kieran’s contribution to CRH was significant
during that period and his leadership of the Board during his five years as
Chairman was exceptional.
Heather Ann McSharry became a non-executive Director in February 2012.
Further details in relation to the Board are set out in my letter to shareholders
in the Corporate Governance section of this Report on page 38.
Management and Staff
Important management changes occurred in the early part of 2012 in the
United States. Doug Black was appointed President and Chief Operating
Officer, Oldcastle, Inc. (the holding company for CRH’s operations in the
Americas), reporting to Mark Towe, Chief Executive Officer of Oldcastle.
Randy Lake succeeded Doug as Chief Executive Officer of Americas
Materials. Randy, who joined Oldcastle in 1996, most recently served as
Chief Executive Officer of Oldcastle Building Solutions, which focusses on
strategic and national accounts. Keith Haas was appointed Chief Executive
Officer of an expanded Oldcastle Building Products group, which consists
of our Architectural Products, Precast and Building Envelope activities. Keith
joined Oldcastle in 1995 and previously had responsibility for our combined
APG and Precast activities. This capacity to build from within shows the
strength and depth of our management team.
Our European management team has continued to focus on cost savings
initiatives, cash generation and operational excellence in meeting the
particularly severe economic downturn in Europe.
I thank Myles Lee and all CRH employees for their contribution and
commitment to the success of the Group.
Communication with Shareholders
My Board colleagues and I place great importance on communicating with
shareholders and I was pleased to receive investor feedback during 2012
commending CRH on its corporate governance performance. The various
means by which we communicate with shareholders are set out on page 52.
A schedule of documents and presentations available on the CRH website
is included on page 53.
In November 2012, CRH organised capital markets days in London and
New York. These events provided an opportunity for investors to engage
with CRH’s senior executive and Divisional management team. I attended
both events, which gave me an opportunity to hear the views of investors
in relation to the Group’s performance, strategy and engagement with the
investment community. The full suite of presentations and a video recording
of executive presentations is available on the CRH website.
Conclusion
Management’s views on the outlook for 2013 are set out in the Chief
Executive’s review and the various Operations Reviews. Overall, we expect
continued progress in our US and Canadian markets during 2013 and
another challenging year for our European Divisions. Management will
continue to focus on implementing identified cost savings initiatives and on
operational excellence. In the medium to longer term, as economic growth
returns, the Group is well positioned to benefit from the significant efforts
made by management over recent years.
Nicky Hartery
25 February 2013
CRH 9

Left to right: Doug Black,
Albert Manifold, Mark Towe,
Myles Lee, Henry Morris,
Maeve Carton, Erik Bax
10 CRH
Albert Manifold Chief Operating Officer
Nationality: Irish
Skills and experience: Albert was appointed Chief Operating Officer of CRH
and to the CRH Board with effect from 1 January 2009. He joined CRH in
1998. Prior to joining CRH he was Chief Operating Officer with a private equity
group. He has held a variety of senior positions, including Finance Director of
the Europe Materials Division and Group Development Director of CRH. Prior
to his current appointment, he was Managing Director of Europe Materials.
Qualifications: FCPA, MBA, MBS.
Henry Morris Managing Director Europe Materials
Nationality: Irish
Skills and experience: Henry joined Irish Cement Ltd. as a graduate. He
held a number of operational roles in CRH’s cement business prior to his
appointment as Managing Director of CRH’s Aerobord business in 1990.
Henry left to join Barlo Group plc in 1993 and returned to CRH in 2001 as
Regional Director, Finland and Switzerland. He was appointed Chief Operating
Officer, Europe Materials in 2007 and Managing Director of the Europe
Materials Division in January 2009.
Qualifications: BE, MBA.
Mark Towe Chief Executive Officer Oldcastle, Inc.
Nationality: United States
Skills and experience: Mark joined CRH in 1997 and was appointed a
CRH Board Director with effect from July 2008. In 2000, he was appointed
President of Oldcastle Materials, Inc. and became the Chief Executive Officer
of this Division in 2006. He was appointed to his current position of Chief
Executive Officer of Oldcastle, Inc. (the holding company for CRH’s operations
in the Americas) in July 2008. With approximately 40 years of experience in
the building materials industry, he has overall responsibility for the Group’s
aggregates, asphalt and readymixed concrete operations in the United States
and its products and distribution businesses in the Americas.
Erik Bax Managing Director Europe Products & Distribution
Nationality: Dutch
Skills and experience: Erik joined CRH in 1984 and has worked in
operational and commercial roles in various operating companies. He has
held a number of senior management positions including Managing Director
Europe Building Products from 2003 and Managing Director Europe
Distribution from 2007. Erik was appointed Managing Director of Europe
Products & Distribution in 2010.
Qualifications: B Eng, MBA.
Doug Black President and Chief Operating Officer Oldcastle, Inc.
Nationality: United States
Skills and experience: Doug started his career with CRH in 1995 as
Vice President of Business Development in Oldcastle, and the following year
he helped create the Oldcastle Distribution division. Doug was President of
Oldcastle Precast Southeast division from 1996 to 2000, was promoted to
Chief Operating Officer, Oldcastle Architectural in 2000 where he held the
position of President and Chief Executive Officer from 2002 to July 2006.
Doug then moved to Oldcastle Materials where he served two years as
President before being appointed Chief Executive Officer in 2008. He was
appointed to his current position of President and Chief Operating Officer,
Oldcastle, in February 2012.
Qualifications: BS, MBA.
Maeve Carton Finance Director
Nationality: Irish
Skills and experience: Since joining CRH in 1988, Maeve has held
a number of roles in the Group Finance area and was appointed Group
Controller in 2001, Head of Group Finance in January 2009 and to the position
of Finance Director in May 2010. She has broad-ranging experience of CRH’s
reporting, control, budgetary and capital expenditure processes and has
been extensively involved in CRH’s evaluation of acquisitions. Prior to joining
CRH, she worked for a number of years as a chartered accountant in an
international accountancy practice.
Qualifications: MA, FCA.
Myles Lee Chief Executive
Nationality: Irish
Skills and experience: Myles joined CRH in 1982. Prior to this he worked
in a professional accountancy practice and in the oil industry. He was
appointed General Manager Finance in 1988 and to the position of Finance
Director in November 2003. A civil engineer and chartered accountant, he
has 30 years’ experience of the building materials industry and of CRH’s
international expansion. He was appointed Group Chief Executive with effect
from 1 January 2009.
Qualifications: BE, FCA.
CRH Executive Management Team
CRH 11
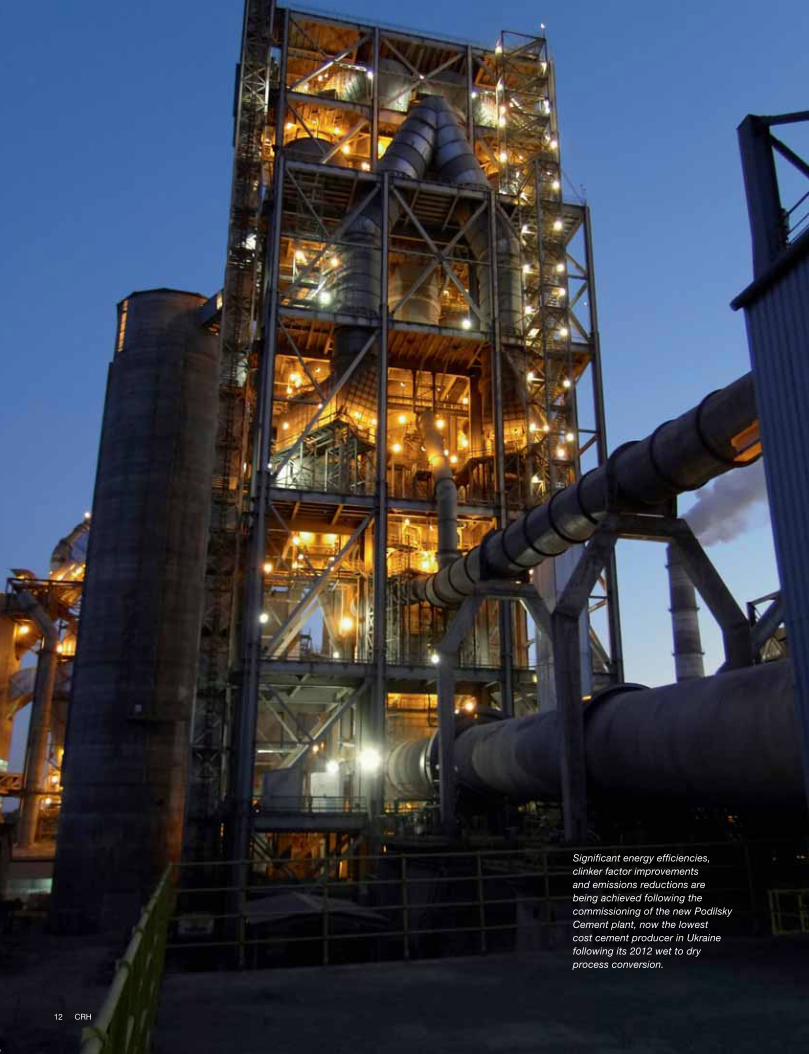
Significant energy efficiencies,
clinker factor improvements
and emissions reductions are
being achieved following the
commissioning of the new Podilsky
Cement plant, now the lowest
cost cement producer in Ukraine
following its 2012 wet to dry
process conversion.
12 CRH
Chief Executive’s Review
Key Aspects of 2012 Results
Reported sales at €18.7 billion showed an increase of 3%. Underlying
like-for-like sales fell 2% comprising a 3% increase in the Americas
outweighed by a 6% decline for European operations.
EBITDA amounted to €1,640 million, a 1% decline compared with the
€1,656 million reported for 2011. EBITDA is stated after charging costs of
€60 million (2011: €61 million) associated with the Group’s ongoing
restructuring efforts.
Operating profit fell 3% to €845 million (2011: €871 million) after combined
restructuring and impairment charges of €88 million (2011: €82 million).
A €175 million increase in profit on disposals was outweighed by a
€32 million increase in finance costs and a €154 million reduction in our share
of associates’ results due primarily to impairment charges in our Spanish
associate, Uniland. These movements combined with the €26 million decline
at operating profit level resulted in a €37 million, or 5%, fall in reported PBT to
€674 million (2011: €711 million).
Reported earnings per share were 7% lower at 76.5c (2011: 82.6c).
Although earnings per share fell back, strong cash generation and a
robust balance sheet saw the dividend unchanged at 62.5 cent; over the
past 29 years CRH has delivered compound growth in dividend of 11.8%
annually, with no dividend reduction over that extended period. Dividend
cover amounted to 1.2 times (2011: 1.3 times); before impairment charges
dividend cover was 1.6 times (2011: 1.4 times).
Year-end net debt at just under €3 billion was lower than the end-2011
level of €3.5 billion, while year-end net debt to EBITDA was also lower at
1.8 times (2011: 2.1 times).
2012 Operations
Results for 2012 reflect progress from our Americas operations helped by a
strong recovery in residential construction and improving overall economic
activity in the United States. Like-for-like sales grew by 3% while, with the
benefit of acquisitions and a stronger US Dollar exchange rate, reported
sales for our Americas activities rose by 15% and reported EBITDA of
€0.85 billion was 12% higher (2011: €0.76 billion).
Americas Materials reported a 7% increase in EBITDA at €0.57 billion;
while underlying volumes were slightly behind 2011 levels, acquisition
effects resulted in flat overall volumes in aggregates and a modest increase
in asphalt and readymixed concrete volumes. With the subdued volume
backdrop, markets remained competitive and margins declined somewhat.
Americas Products reported a 24% increase in EBITDA to €0.20 billion
as private markets outpaced infrastructure while EBITDA in Americas
Distribution moved ahead by 28% to €0.08 billion; both of these segments
saw improvements in margins in 2012.
In contrast to the trading experience in the Americas, our European businesses
had to contend with weakening consumer and investor confidence within the
Eurozone. Like-for-like sales for these Divisions fell by 6%. Reported sales,
including the impact of acquisitions and divestments, fell by 7% and reported
EBITDA of €0.79 billion was 12% lower (2011: €0.90 billion).
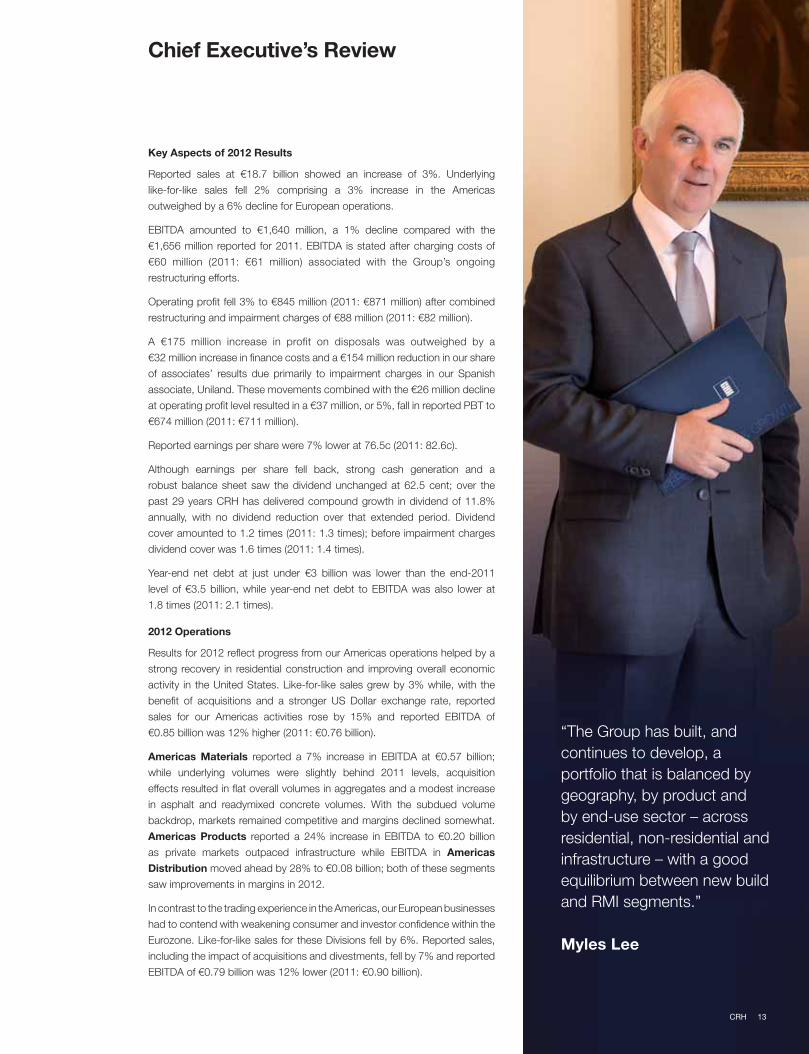
“The Group has built, and
continues to develop, a
portfolio that is balanced by
geography, by product and
by end-use sector – across
residential, non-residential and
infrastructure – with a good
equilibrium between new build
and RMI segments.”
Myles Lee
CRH 13
Europe Materials EBITDA fell by 7% to €0.41 billion; the decline primarily
reflected the disposal of our stake in Portuguese joint venture, Secil, which
was effected in May 2012. Good operational and restructuring efforts saw
margins broadly maintained at 2011 levels. Particularly tough trading in the
Netherlands impacted reported EBITDA in Europe Products (€0.15 billion,
down 22%) and in Europe Distribution (€0.23 billion, down 14%). Although
the second half of the year saw some margin stabilisation, most especially in
Distribution, full-year margins fell in both segments.
During 2012 we continued to advance the significant cost reduction initiatives
which have been progressively implemented since 2007 and which by
year-end had generated cumulative annualised savings of €2.2 billion. Total
restructuring costs associated with these initiatives and reflected in reported
EBITDA, amounted to €60 million in 2012 (2011: €61 million) and were
once again heavily focussed on our European Divisions (€43 million versus
€47 million in 2011).
Of particular note during 2012 was a substantial step-up in alternative fuel
usage in our European cement operations and increased usage of recycled
asphalt in our paving activities in North America. These initiatives mitigated
cost inflation in energy-related inputs.
While overall cost inflation was not as severe as in 2011, recovery of cost
increases continued to be challenging. This was particularly the case
in European markets as economic growth weakened through the year.
However, on a more positive note, we saw an improving price/cost dynamic
in our operations in the United States as the year progressed.
Group Strategy and Business Model
The Group has built, and continues to develop, a portfolio that is balanced
by geography, by product and by end-use sector – across residential,
non-residential and infrastructure – with a good equilibrium between new
build and RMI segments.
In developed markets, our build and grow approach aims to create clustered
groups of businesses with significant local market positions, augmented
from time to time by larger step-out transactions to create new platforms
for expansion.
For our Materials operations, the foundation is in extensive reserves of stone
to feed our cement, aggregates, asphalt and readymixed concrete activities.
We seek to build vertically-integrated operations generating significant
in-house demand for our resource-backed outputs while leveraging
capabilities and expertise across local, regional and national markets.
For Products our focus is to optimise our production networks in core
regions through selective acquisition activity, capital investment and, where
necessary, restructuring. This involves an ongoing portfolio review process
aimed at identifying those businesses which we wish to actively develop,
those we wish to sustain for their ongoing cash generating characteristics and
those which it is appropriate to divest. Product innovation and sustainability is
a key consideration in this review process.
For Distribution, the strategy is directed at building size and scale in core RMI
markets; driving value through scalable processes, enhanced procurement
opportunities and building new channel opportunities.
In developing markets, we see Materials opportunities as providing the
most suitable initial entry point for CRH given the basic building needs in
these regions. However, as these markets become more sophisticated
our development horizons will expand to consideration of Products and
Distribution opportunities but this takes time and will depend on the pace of
maturation of individual national and regional markets.
Across the various business segments our approach is to combine the
large scale disciplines of CRH with the entrepreneurial skills of our local
management.
In building the Group we have always prioritised financial returns both in
CRH’s bolt-on development activity in existing markets and in our step-outs
into new product segments and into new markets.
Strategy in Action 2012
Development activity completed during 2012, which amounted to
€0.65 billion, was very much aligned with the strategy outlined above.
Of the €0.33 billion of Materials development activity, roughly 70% arose in
the United States where we added a total of 0.6 billion tonnes of strategically
located aggregates reserves most particularly through the acquisition of a
majority share of New Jersey-based Trap Rock Industries. In Europe, we
substantially increased our presence in the Finnish readymixed concrete and
concrete products market, strengthening CRH’s vertically-integrated cement
and downstream positions in this resilient market.
Chief Executive’s Review | continued
14 CRH
Total 2012 development spend in the Products segment amounted to
€0.27 billion with a focus on RMI and sustainability segments and on the
optimisation of production networks in core markets. In Europe we significantly
expanded our RMI-oriented Shutters & Awnings business through the
acquisition of a major German player while, in North America, businesses
acquired from other public players in our sector served to strengthen core
operations in packaged products, concrete pavers and precast products in
both the United States and Canada.
Distribution acquisitions in Europe totaled €0.05 billion during 2012 with the
bulk of this expenditure incurred on the expansion of our Sanitary, Heating
and Plumbing channel in Belgium.
Organisation and People
The realigned management structure for our operations in the Americas,
outlined in last year’s Chief Executive Review, is now well embedded and
is, as expected, accelerating the capture of market growth opportunities as
United States construction recovers and is facilitating further streamlining of
common business processes and functions across our businesses.
During 2012 management took the decision to establish a regional CRH
headquarters in Singapore to oversee the expansion of our existing interests in
India and China and to pursue further development opportunities in the wider
region. This office will be led by Ken McKnight, Managing Director Asia, who
has transferred from our Europe Materials Division where he had responsibility
for Europe West and our operations in India and China. Ken will report directly
to Group Chief Operating Officer Albert Manifold while Europe Materials will
continue to support activity in the region from its operating resources. We view
the establishment of the Singapore office as a further step in the evolution of
CRH and an important catalyst for growth in Asia in the medium term.
Compliance and Ethics
Despite the worldwide downturn in our sector, the regulatory environment
in which CRH operates is continually changing and placing increased
responsibility on our personnel at all levels throughout the organisation.
Ensuring that our managers and employees act in a manner consistent with
CRH’s core values, and with the various local legal requirements with which
our operations throughout the world must comply, is a responsibility that we
take very seriously. Over the past few years we have enhanced our existing
compliance structures and undertaken a thorough review of the Group’s
Code of Business Conduct to ensure that our procedures and processes
reflect our commitment to integrity, honesty and respect for the law and
that we have a consistency of approach across key governance areas. Our
updated Code of Business Conduct and the subsidiary policies relating
to Ethical Procurement, Anti-Fraud, Anti-Bribery, Shares & Securities and
Competition/Anti-Trust Compliance have been widely circulated throughout
CRH supplemented by intensive compliance briefings and training.
2013 Outlook
After a slower second quarter, GDP in the United States picked up strongly
in the third quarter of 2012. However, some once-off factors contributed to
a weaker final quarter with GDP growth currently estimated at approximately
2% for 2012 as a whole. Despite this variable pattern, we believe that the
fundamentals are in place for continued positive momentum in the US
economy in 2013, although the moderate fiscal tightening resulting from
payroll tax increases may weigh somewhat on first-half economic growth.
Against this backdrop we expect our Americas operations to show progress
in 2013.
In contrast to the United States, economic growth in Europe turned
negative in the second quarter and full-year GDP for the European Union
as a whole is estimated to have fallen slightly. Current forecasts suggest
only modest growth at best for 2013. On the positive side, however, the
strong commitment from the European Central Bank to providing support
for peripheral Eurozone economies has resulted in a more stable financial
backdrop which is encouraging from a confidence building perspective and
is an essential prerequisite for European economic recovery. Nevertheless,
2013 will be another challenging year for our European Divisions with
significant actions, as already announced, being implemented to counteract
market weakness.
Assuming no major financial or energy market dislocations, we expect that
ongoing improvements in our businesses in the Americas combined with
further profit improvement initiatives throughout our operations will outweigh
continuing trading pressures in our European segments, enabling the Group
to achieve progress in 2013.
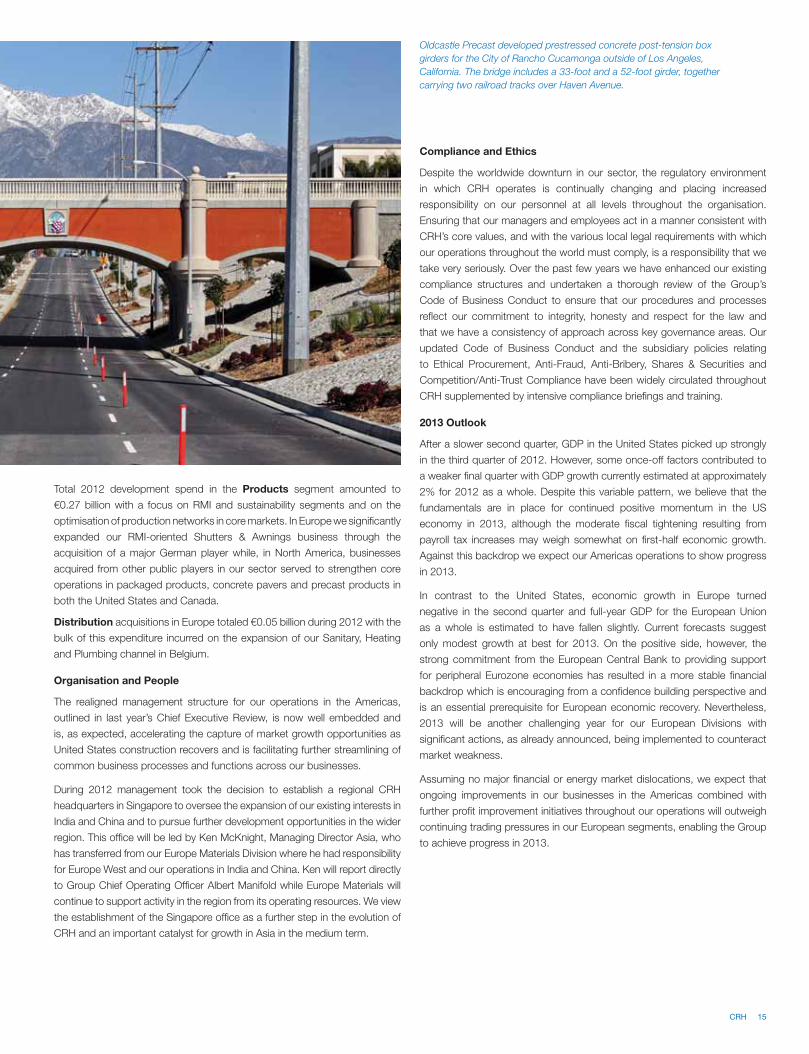
Oldcastle Precast developed prestressed concrete post-tension box
girders for the City of Rancho Cucamonga outside of Los Angeles,
California. The bridge includes a 33-foot and a 52-foot girder, together
carrying two railroad tracks over Haven Avenue.
CRH 15
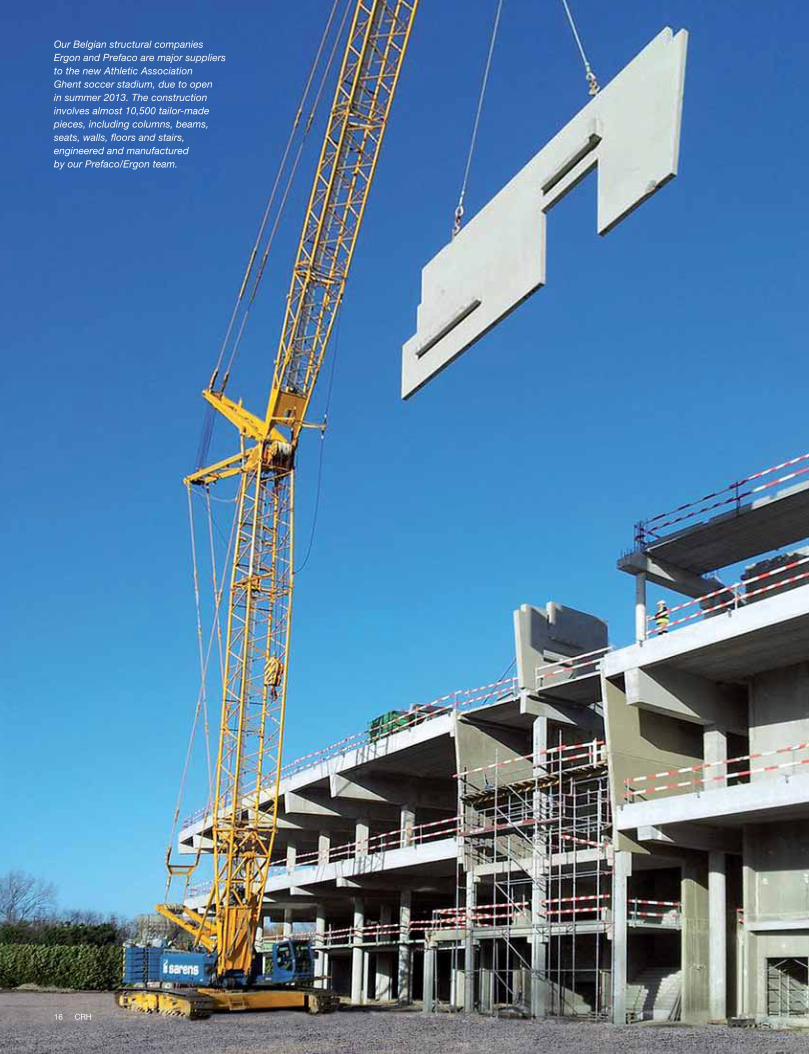
Our Belgian structural companies
Ergon and Prefaco are major suppliers
to the new Athletic Association
Ghent soccer stadium, due to open
in summer 2013. The construction
involves almost 10,500 tailor-made
pieces, including columns, beams,
seats, walls, floors and stairs,
engineered and manufactured
by our Prefaco/Ergon team.
16 CRH
Finance Review
“The Group remains in a very
strong and flexible financial
position with €1.8 billion of
cash, cash equivalents and
liquid investments together
with €1.8 billion of undrawn
committed bank facilities
at year-end. Year-end cash
balances would cover all debt
maturities in 2013 and 2014.”
Maeve Carton
The key aspects of CRH’s 2012 results are highlighted in the Chief Executive’s
overview on page 13. Improved trading for our Americas segments, reflecting
an overall pick-up in economic activity and a strong recovery in residential
construction, was more than offset by the impact of slowing momentum in
the economies of our major European markets. Table 1 overleaf analyses the
change in results from 2011 to 2012.
The Group remains in a very strong and flexible financial position with
€1.8 billion of cash, cash equivalents and liquid investments together with
€1.8 billion of undrawn committed bank facilities at year-end; year-end cash
balances would cover all debt maturities in 2013 and 2014. Net debt of just
under €3 billion at year-end 2012 was €0.5 billion lower than year-end 2011.
The net debt to EBITDA ratio at end-2012 was 1.8 times (2011: 2.1 times)
and, based on net debt-related interest costs of €258 million (excluding
non-debt-related financial expenses of €31 million (2011: €28 million),
EBITDA/net interest cover for the year was 6.4 times (2011: 7.2 times).
Key Components of 2012 Performance
Table 1 on page 18 summarises the key components of CRH’s performance
in 2012.
Additional detail on the sales, EBITDA and operating profit for each of CRH’s
six reporting segments is set out in the reviews on pages 24 to 35.
An 8% strengthening of the US Dollar over 2011 has been the main factor
in the positive exchange effects for 2012, adding approximately 4% to both
sales and pre-tax profits.
Acquisitions completed in 2011 and 2012 contributed incremental sales
revenue of €603 million and operating profit of €33 million in 2012. The impact
of divested activities was a negative €389 million in sales and €23 million at
operating profit level.
We continue to review and, when required, extend our cost reduction
programme. Costs of €60 million incurred in 2012 to implement these
savings were similar to last year (2011: €61 million).
Total impairment charges for 2012 at €174 million were significantly higher
than last year (2011: €32 million), and included €146 million related to
our 26% associate stake in Uniland, the Spanish cement producer. The
associates’ impairment of €11 million in 2011 related to our investment in
French distribution business Trialis which was divested in March 2011.
Revenue from ongoing operations decreased by €384 million (2%) in 2012,
with Europe segments declining 6% whereas Americas segments grew
3%. Competition remained intense, limiting our ability to recover input cost
increases, and as a result organic operating profit declined by €62 million.
Total net finance costs of €289 million included discount unwinding and
pension-related financial expenses of €31 million (2011: €28 million). Interest
on net debt increased to €258 million (2011: €229 million), due to the
stronger US Dollar, the ending of interest capitalisation on major cement plant
projects, the additional cost of our early-2012 €500 million bond issue and
lower interest income.
CRH 17
Earnings per share declined by 7% to 76.5c (2011: 82.6c), reflecting the lower
pre-tax profit for the year. Excluding non-cash depreciation, amortisation and
impairment charges, cash earnings per share increased by 7% to 206.8c
(2011: 194.0c).
Financial Performance Indicators
Some key financial performance indicators which, taken together, are a
measure of performance and financial strength are set out below in table 2.
The Group EBITDA margin declined by 0.4 percentage points as the
significant increase in input costs was not fully recovered in selling prices;
operating profit margin similarly declined to 4.5%. Management believes that
the EBITDA/net interest cover ratio is useful to investors because it matches
the earnings and cash generated by the business to the underlying funding
costs. With a higher level of net interest in 2012, the multiple of EBITDA to
debt-related interest reduced to 6.4 times (2011: 7.2 times), well in excess
of our covenant level of 4.5 times and in keeping with our commitment to
maintaining an investment grade rating.
The effective tax rate of 17.8% of pre-tax profit was higher than 2011 (16%),
reflecting the mix of Group profits by geographical region.
The share price at 31 December 2012 was €15.30, little changed from the
2011 closing price (€15.36); however, with the 2012 dividend at 62.5c,
the net return for shareholders for the year was a positive 4%. This follows
returns of +3% in 2011, -16% in 2010 and +22% in 2009. At year-end 2012,
CRH’s market capitalisation was €11.1 billion (2011: €11 billion), ranking the
Group at number four in its building materials peer group.
Total shareholders’ equity remained unchanged at €10.6 billion, with the
net comprehensive income for the year of €0.4 billion offset by dividends of
€0.4 billion. Year-end net debt of just under €3 billion was €0.5 billion lower
than year-end 2011, and accordingly the percentage of net debt to total
equity reduced to 28% (2011: 33%). With year-end market capitalisation
broadly in line with year-end 2011, the debt/market capitalisation percentage
was also lower at 27% (2011: 32%).
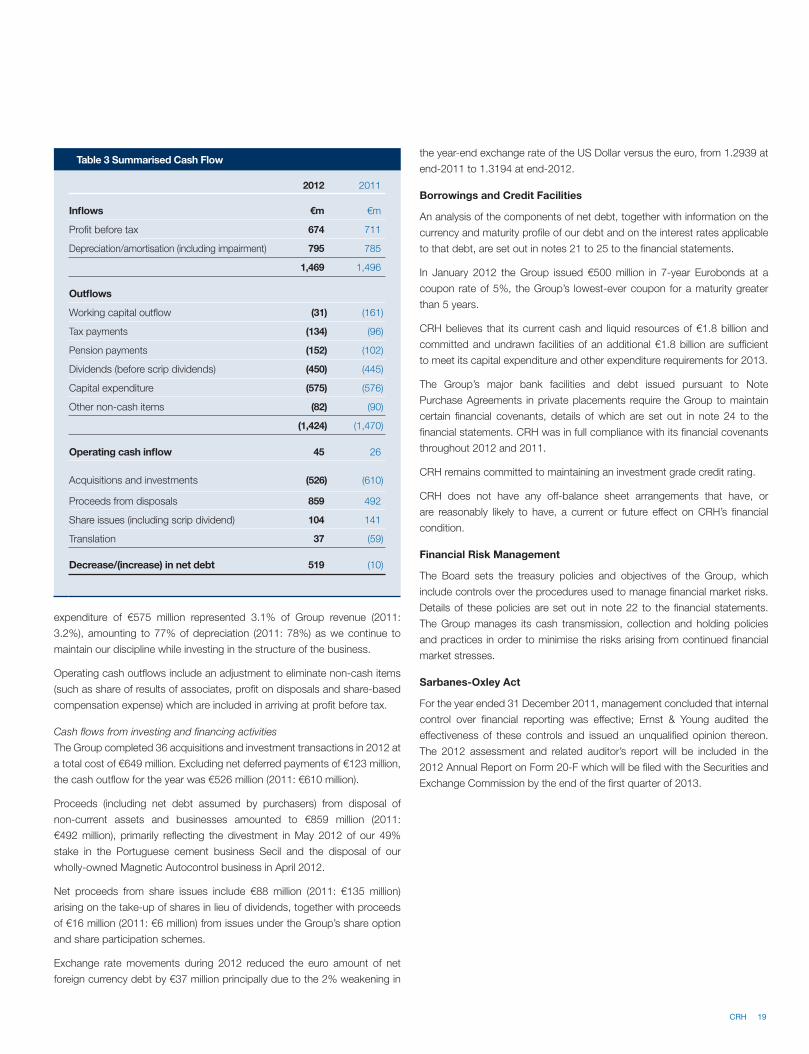
Liquidity and Capital Resources
Table 3 summarises the main cash flows for 2012 and 2011.
Cash flows from operations
Total operating cash inflows amounted to €1,469 million in 2012, a reduction
of €27 million compared with 2011, largely as a result of the 5% reduction in
profit before tax.
Operating cash outflows decreased to €1,424 million (2011: €1,470 million)
mainly due to a lower net working capital outflow. Working capital levels
are driven by trends in overall sales and also by seasonal weather patterns.
CRH believes that its working capital is sufficient for the Group’s present
requirements.
Payments during 2012 to address deficits in the Group’s defined benefit
pension schemes were €50 million higher than 2011. Stable capital
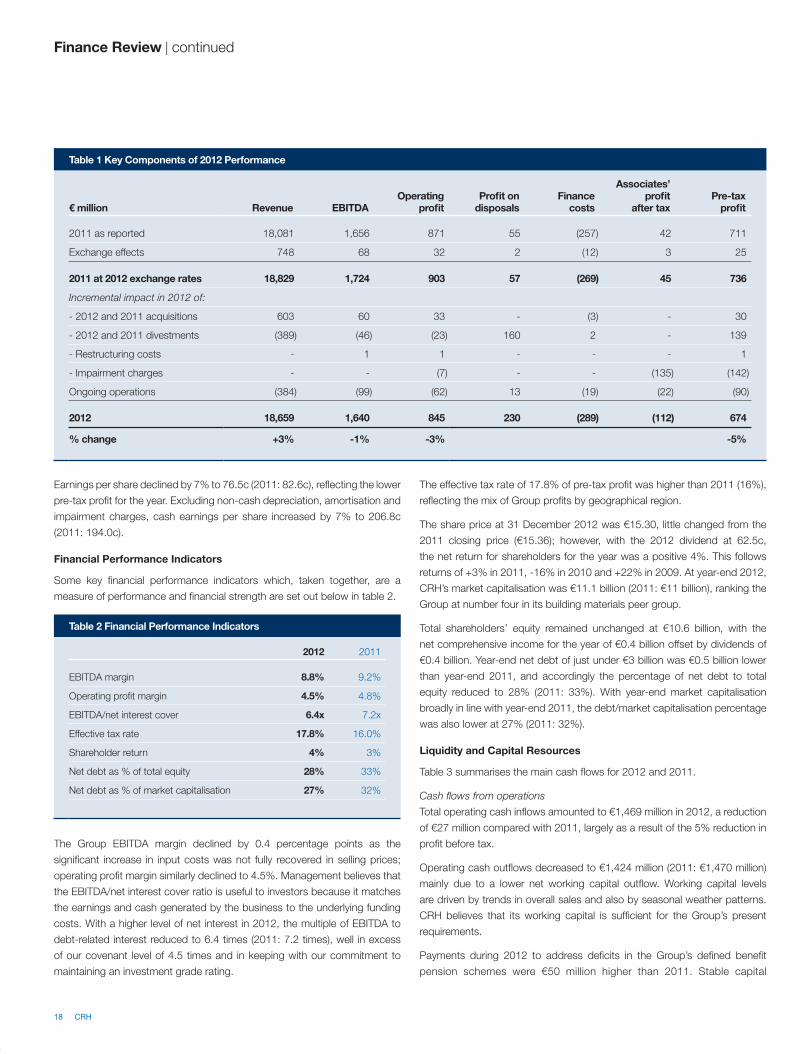
Table 1 Key Components of 2012 Performance
€ million Revenue EBITDAOperating
profitProfit on
disposalsFinance
costs
Associates’ profit
after taxPre-tax
profit
2011 as reported 18,081 1,656 871 55 (257) 42 711
Exchange effects 748 68 32 2 (12) 3 25
2011 at 2012 exchange rates 18,829 1,724 903 57 (269) 45 736
Incremental impact in 2012 of:
- 2012 and 2011 acquisitions 603 60 33 - (3) - 30
- 2012 and 2011 divestments (389) (46) (23) 160 2 - 139
- Restructuring costs - 1 1 - - - 1
- Impairment charges - - (7) - - (135) (142)
Ongoing operations (384) (99) (62) 13 (19) (22) (90)
2012 18,659 1,640 845 230 (289) (112) 674
% change +3% -1% -3% -5%
Table 2 Financial Performance Indicators
2012 2011
EBITDA margin 8.8% 9.2%
Operating profit margin 4.5% 4.8%
EBITDA/net interest cover 6.4x 7.2x
Effective tax rate 17.8% 16.0%
Shareholder return 4% 3%
Net debt as % of total equity 28% 33%
Net debt as % of market capitalisation 27% 32%
Finance Review | continued
18 CRH
expenditure of €575 million represented 3.1% of Group revenue (2011:
3.2%), amounting to 77% of depreciation (2011: 78%) as we continue to
maintain our discipline while investing in the structure of the business.
Operating cash outflows include an adjustment to eliminate non-cash items
(such as share of results of associates, profit on disposals and share-based
compensation expense) which are included in arriving at profit before tax.
Cash flows from investing and financing activities
The Group completed 36 acquisitions and investment transactions in 2012 at
a total cost of €649 million. Excluding net deferred payments of €123 million,
the cash outflow for the year was €526 million (2011: €610 million).
Proceeds (including net debt assumed by purchasers) from disposal of
non-current assets and businesses amounted to €859 million (2011:
€492 million), primarily reflecting the divestment in May 2012 of our 49%
stake in the Portuguese cement business Secil and the disposal of our
wholly-owned Magnetic Autocontrol business in April 2012.
Net proceeds from share issues include €88 million (2011: €135 million)
arising on the take-up of shares in lieu of dividends, together with proceeds
of €16 million (2011: €6 million) from issues under the Group’s share option
and share participation schemes.
Exchange rate movements during 2012 reduced the euro amount of net
foreign currency debt by €37 million principally due to the 2% weakening in
the year-end exchange rate of the US Dollar versus the euro, from 1.2939 at
end-2011 to 1.3194 at end-2012.
Borrowings and Credit Facilities
An analysis of the components of net debt, together with information on the
currency and maturity profile of our debt and on the interest rates applicable
to that debt, are set out in notes 21 to 25 to the financial statements.
In January 2012 the Group issued €500 million in 7-year Eurobonds at a
coupon rate of 5%, the Group’s lowest-ever coupon for a maturity greater
than 5 years.
CRH believes that its current cash and liquid resources of €1.8 billion and
committed and undrawn facilities of an additional €1.8 billion are sufficient
to meet its capital expenditure and other expenditure requirements for 2013.
The Group’s major bank facilities and debt issued pursuant to Note
Purchase Agreements in private placements require the Group to maintain
certain financial covenants, details of which are set out in note 24 to the
financial statements. CRH was in full compliance with its financial covenants
throughout 2012 and 2011.
CRH remains committed to maintaining an investment grade credit rating.
CRH does not have any off-balance sheet arrangements that have, or
are reasonably likely to have, a current or future effect on CRH’s financial
condition.
Financial Risk Management
The Board sets the treasury policies and objectives of the Group, which
include controls over the procedures used to manage financial market risks.
Details of these policies are set out in note 22 to the financial statements.
The Group manages its cash transmission, collection and holding policies
and practices in order to minimise the risks arising from continued financial
market stresses.
Sarbanes-Oxley Act
For the year ended 31 December 2011, management concluded that internal
control over financial reporting was effective; Ernst & Young audited the
effectiveness of these controls and issued an unqualified opinion thereon.
The 2012 assessment and related auditor’s report will be included in the
2012 Annual Report on Form 20-F which will be filed with the Securities and
Exchange Commission by the end of the first quarter of 2013.
Table 3 Summarised Cash Flow
2012 2011
Inflows €m €m
Profit before tax 674 711
Depreciation/amortisation (including impairment) 795 785
1,469 1,496
Outflows
Working capital outflow (31) (161)
Tax payments (134) (96)
Pension payments (152) (102)
Dividends (before scrip dividends) (450) (445)
Capital expenditure (575) (576)
Other non-cash items (82) (90)
(1,424) (1,470)
Operating cash inflow 45 26
Acquisitions and investments (526) (610)
Proceeds from disposals 859 492
Share issues (including scrip dividend) 104 141
Translation 37 (59)
Decrease/(increase) in net debt 519 (10)
CRH 19

Americas Products’ EnduraMax™
High-Performance Wall System was
used in the construction of the West
Wood High School in Blythewood,
South Carolina, a state-of-the-art
340,000 sq. ft. building, providing an
unmatched R-13.6 insulation factor.
20 CRH

Safety receives a high priority across the Group. During 2012, we
implemented further strategies and initiatives to enhance safety performance
and increase awareness throughout our operations. To address the
significant challenges in emerging regions, a rigorous benchmarking
process was completed during the year which will enhance our existing
structures and support our safety strategies in these regions.
Trading conditions in many of our key markets remained challenging in
2012. We responded with a continued focus on improving efficiencies,
adjusting our cost base and increased attention to procurement across the
Group. In addition, we continued to adjust our portfolio of investments to
strengthen the Group.
We concentrated on actions within our control, scaling our capacity
and managing our costs to adapt to changing demand patterns across
our businesses. We remain resolute in managing our cost base. Having
delivered over €2.2 billion of cost savings in the past 5 years, we have
identified further cost reductions of €0.3 billion in the three-year period to
the end of 2015.
Our operational teams continued to focus on initiatives to maximise our
performance and improve product quality and service to our customers.
Examples range from the increased use of alternative fuels in our cement
plants and recycled asphalt paving in our heavyside business, through
to providing engineered solutions to our customers in building products
and delivery optimisation in our distribution networks. In addition, we
achieved further progress through Group-wide initiatives, leveraging our
size, scale and expertise. Our global procurement programme continued
to deliver significant benefits through increased co-ordination and
further investment in processes and technology. Above all, the key to
the success of these programmes is in the calibre of our teams and
collaboration across the Group.
For 2013, we will continue to focus on cost effectiveness and operational
performance by combining strong local operations with an effective sharing
of Group resources and capabilities. We are confident that these targeted
actions taken by CRH will provide sustained benefits to the Group in the
years ahead.
Group Operations
“Our operations teams
continued to focus on
initiatives to maximise our
performance and improve
product quality and service
to our customers. In addition,
we achieved further progress
through Group-wide
initiatives, leveraging our size,
scale and expertise.”
Albert Manifold
CRH 21
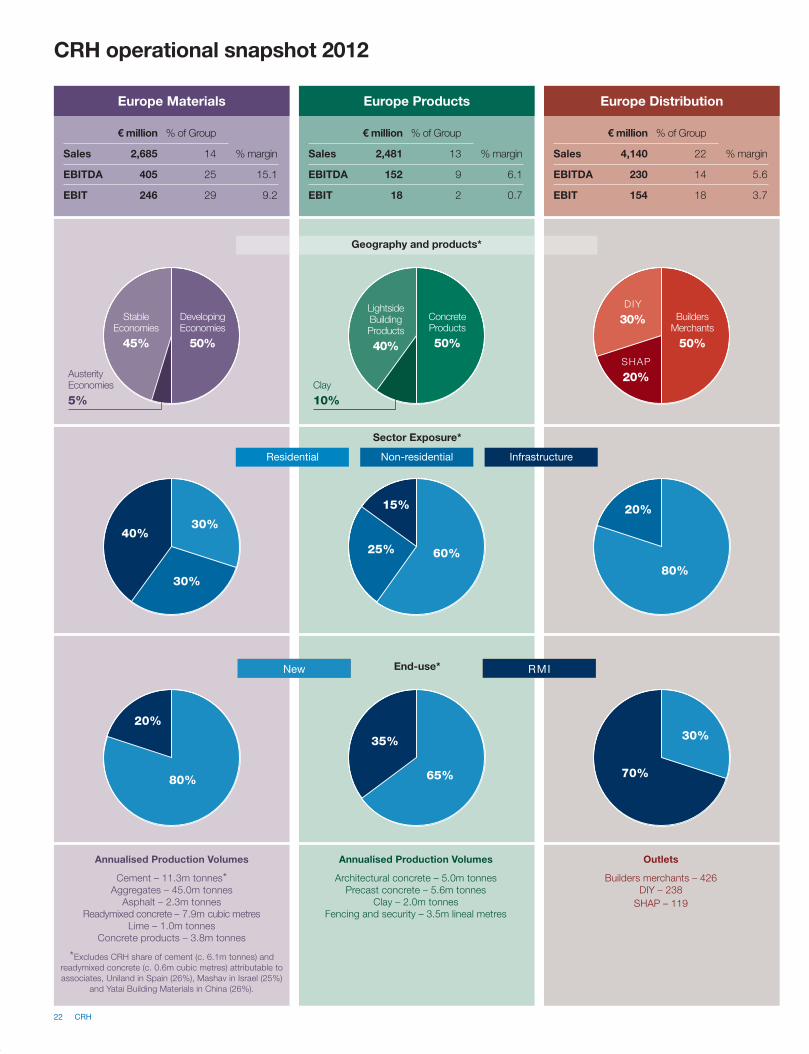
Annualised Production Volumes
Architectural concrete – 5.0m tonnes
Precast concrete – 5.6m tonnes
Clay – 2.0m tonnes
Fencing and security – 3.5m lineal metres
Annualised Production Volumes
Cement – 11.3m tonnes*Aggregates – 45.0m tonnes
Asphalt – 2.3m tonnes
Readymixed concrete – 7.9m cubic metres
Lime – 1.0m tonnes
Concrete products – 3.8m tonnes
*Excludes CRH share of cement (c. 6.1m tonnes) and
readymixed concrete (c. 0.6m cubic metres) attributable to
associates, Uniland in Spain (26%), Mashav in Israel (25%)
and Yatai Building Materials in China (26%).
Outlets
Builders merchants – 426
DIY – 238
SHAP – 119
Europe ProductsEurope Materials Europe Distribution
€ million % of Group
Sales 2,481 13 % margin
EBITDA 152 9 6.1
EBIT 18 2 0.7
€ million % of Group
Sales 2,685 14 % margin
EBITDA 405 25 15.1
EBIT 246 29 9.2
€ million % of Group
Sales 4,140 22 % margin
EBITDA 230 14 5.6
EBIT 154 18 3.7
Sector Exposure*
InfrastructureResidential Non-residential
End-use* RMINew
CRH operational snapshot 2012
70%
35% 30%
65%
20%
80%
40%
15% 20%30%
60%80%
30%
25%
Geography and products*
AusterityEconomies
5%Clay
10%
DIY
30%
SHAP
20%
DevelopingEconomies
50%
StableEconomies
45%
ConcreteProducts
50%
Lightside BuildingProducts
40%
BuildersMerchants
50%
22 CRH
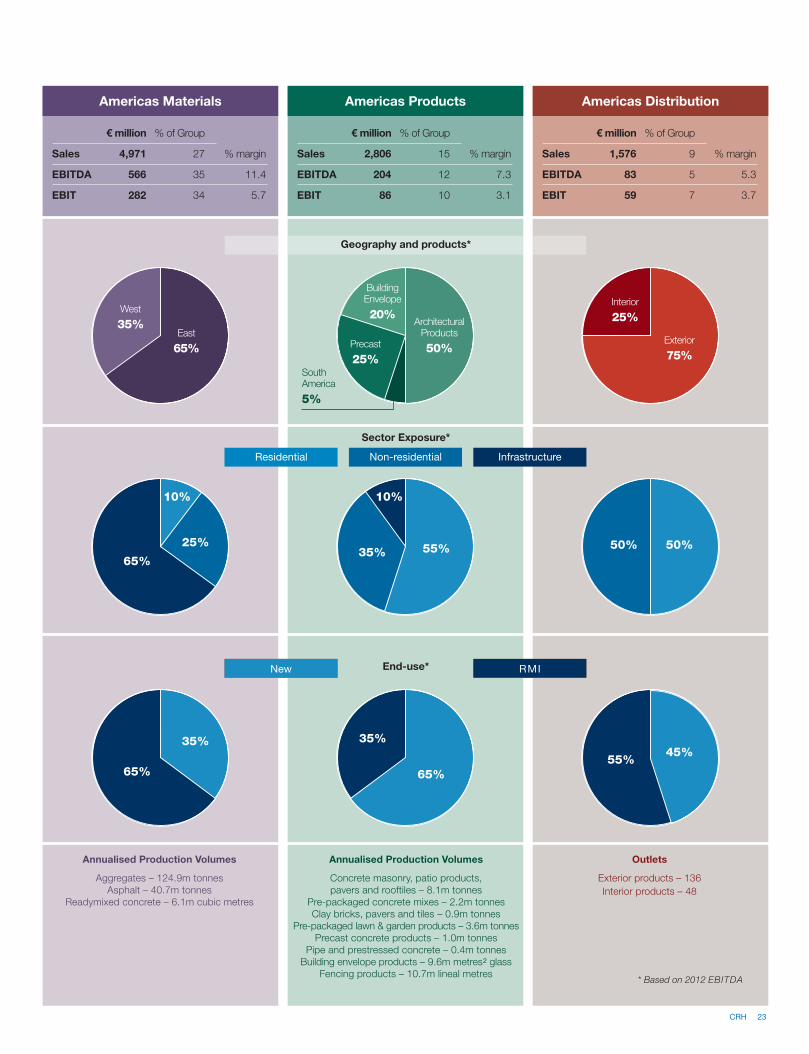
Annualised Production Volumes
Concrete masonry, patio products,
pavers and rooftiles – 8.1m tonnes
Pre-packaged concrete mixes – 2.2m tonnes
Clay bricks, pavers and tiles – 0.9m tonnes
Pre-packaged lawn & garden products – 3.6m tonnes
Precast concrete products – 1.0m tonnes
Pipe and prestressed concrete – 0.4m tonnes
Building envelope products – 9.6m metres2 glass
Fencing products – 10.7m lineal metres
Annualised Production Volumes
Aggregates – 124.9m tonnes
Asphalt – 40.7m tonnes
Readymixed concrete – 6.1m cubic metres
Outlets
Exterior products – 136
Interior products – 48
Americas ProductsAmericas Materials Americas Distribution
€ million % of Group
Sales 2,806 15 % margin
EBITDA 204 12 7.3
EBIT 86 10 3.1
€ million % of Group
Sales 4,971 27 % margin
EBITDA 566 35 11.4
EBIT 282 34 5.7
€ million % of Group
Sales 1,576 9 % margin
EBITDA 83 5 5.3
EBIT 59 7 3.7
Sector Exposure*
InfrastructureResidential Non-residential
End-use* RMINew
45%55%
35%
65%
35%
65%
55%35%
10%10%
50%50%25%
65%
Geography and products*
East
65%
West
35% ArchitecturalProducts
50%Precast
25%
Building Envelope
20%
Exterior
75%
Interior
25%
SouthAmerica
5%
* Based on 2012 EBITDA
CRH 23
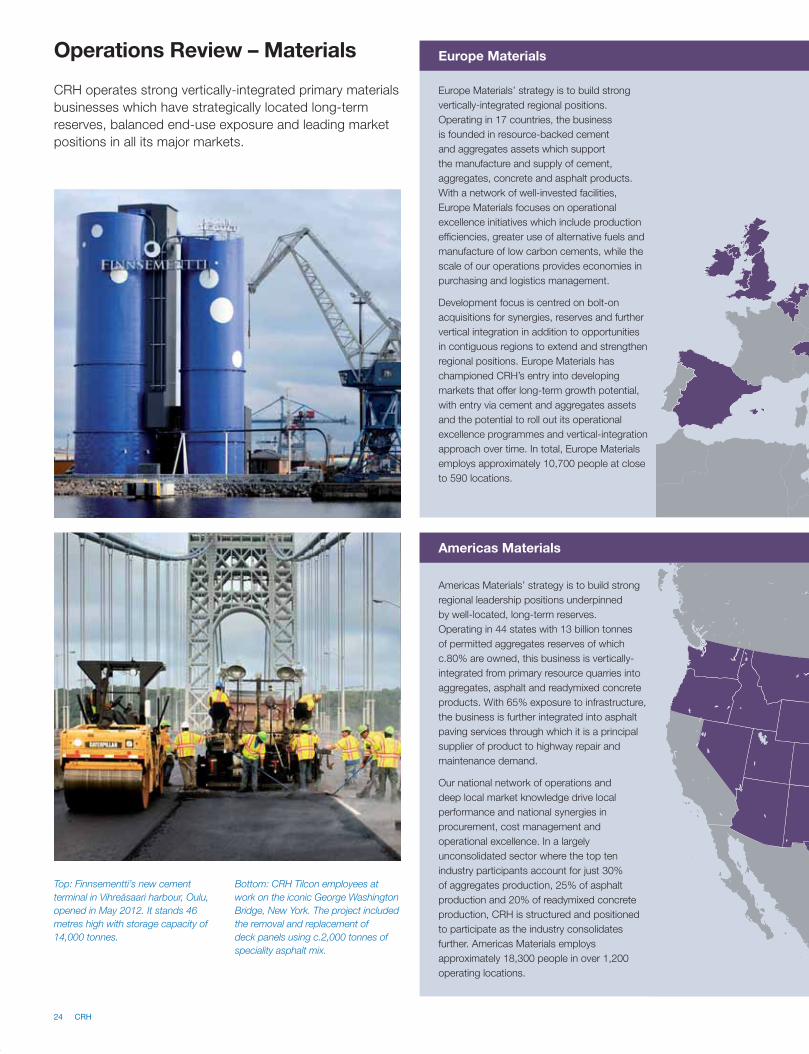
Operations Review – Materials
Top: Finnsementti’s new cement
terminal in Vihreäsaari harbour, Oulu,
opened in May 2012. It stands 46
metres high with storage capacity of
14,000 tonnes.
Bottom: CRH Tilcon employees at
work on the iconic George Washington
Bridge, New York. The project included
the removal and replacement of
deck panels using c.2,000 tonnes of
speciality asphalt mix.
CRH operates strong vertically-integrated primary materials
businesses which have strategically located long-term
reserves, balanced end-use exposure and leading market
positions in all its major markets.
Europe Materials’ strategy is to build strong
vertically-integrated regional positions.
Operating in 17 countries, the business
is founded in resource-backed cement
and aggregates assets which support
the manufacture and supply of cement,
aggregates, concrete and asphalt products.
With a network of well-invested facilities,
Europe Materials focuses on operational
excellence initiatives which include production
efficiencies, greater use of alternative fuels and
manufacture of low carbon cements, while the
scale of our operations provides economies in
purchasing and logistics management.
Development focus is centred on bolt-on
acquisitions for synergies, reserves and further
vertical integration in addition to opportunities
in contiguous regions to extend and strengthen
regional positions. Europe Materials has
championed CRH’s entry into developing
markets that offer long-term growth potential,
with entry via cement and aggregates assets
and the potential to roll out its operational
excellence programmes and vertical-integration
approach over time. In total, Europe Materials
employs approximately 10,700 people at close
to 590 locations.
Americas Materials’ strategy is to build strong
regional leadership positions underpinned
by well-located, long-term reserves.
Operating in 44 states with 13 billion tonnes
of permitted aggregates reserves of which
c.80% are owned, this business is vertically-
integrated from primary resource quarries into
aggregates, asphalt and readymixed concrete
products. With 65% exposure to infrastructure,
the business is further integrated into asphalt
paving services through which it is a principal
supplier of product to highway repair and
maintenance demand.
Our national network of operations and
deep local market knowledge drive local
performance and national synergies in
procurement, cost management and
operational excellence. In a largely
unconsolidated sector where the top ten
industry participants account for just 30%
of aggregates production, 25% of asphalt
production and 20% of readymixed concrete
production, CRH is structured and positioned
to participate as the industry consolidates
further. Americas Materials employs
approximately 18,300 people in over 1,200
operating locations.
Europe Materials
Americas Materials
24 CRH
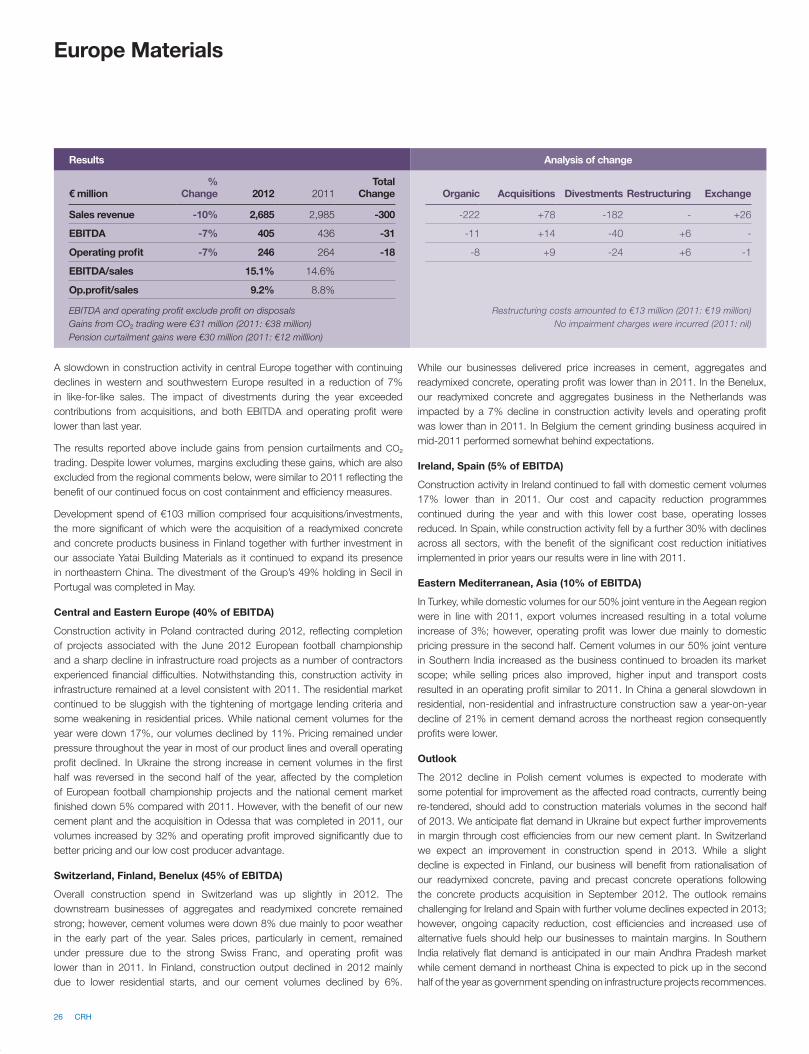
Market leadership positions
Asphalt
No.1 National producer
Aggregates
No.3 National producer
Readymixed concrete
Top 3 National producer
Reserves
Physical Proven & probable Years tolocation million tonnes depletion
Aggregates
East 8,789 129
West 4,198 87
Cement
American Cement 10 39
Total Americas 12,997
Total Materials 15,206
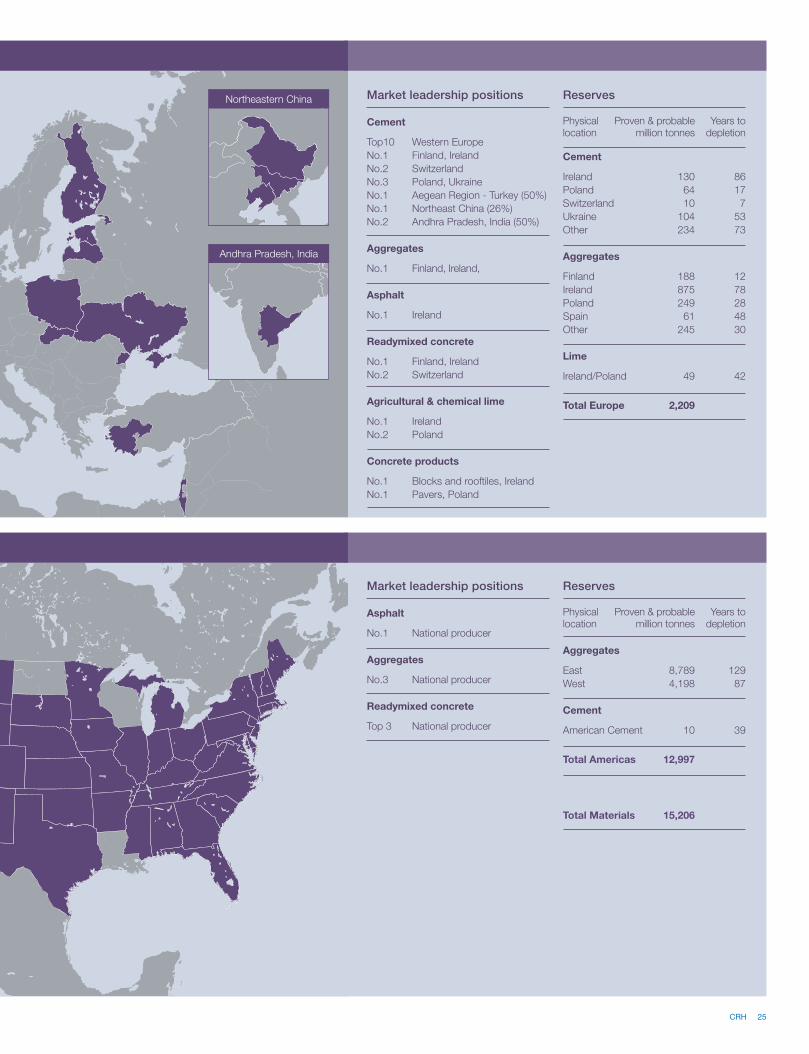
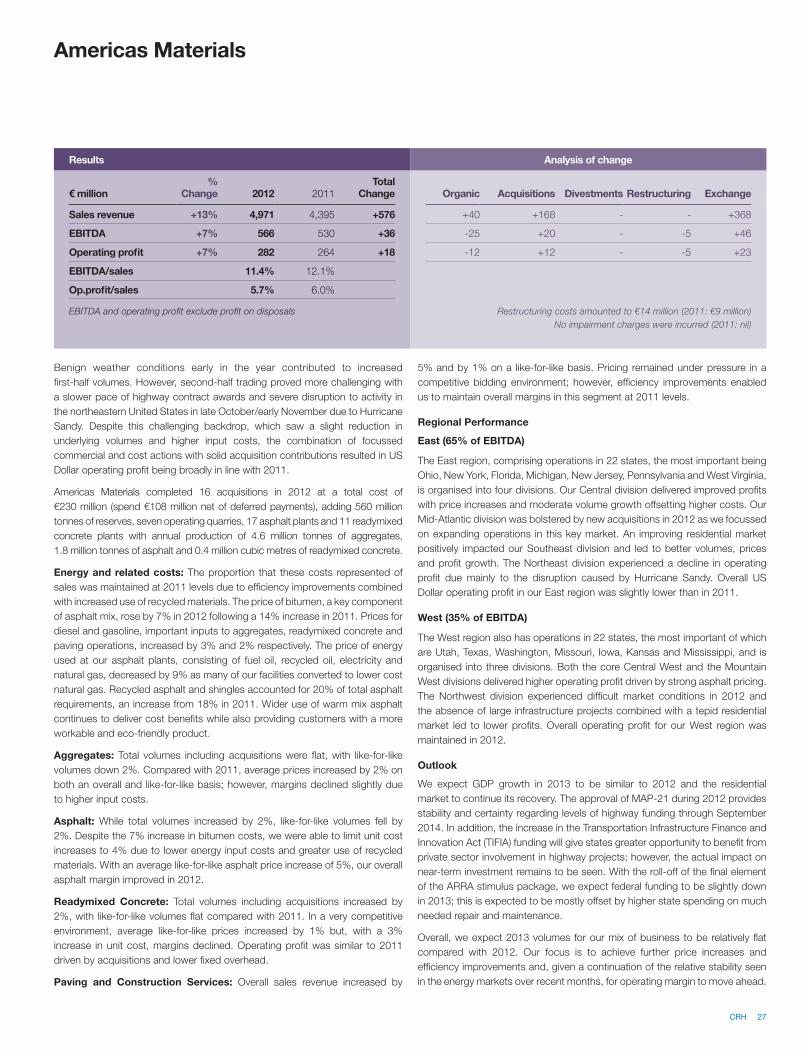
Market leadership positions
Cement
Top10 Western Europe
No.1 Finland, Ireland
No.2 Switzerland
No.3 Poland, Ukraine
No.1 Aegean Region - Turkey (50%)
No.1 Northeast China (26%)
No.2 Andhra Pradesh, India (50%)
Aggregates
No.1 Finland, Ireland,
Asphalt
No.1 Ireland
Readymixed concrete
No.1 Finland, Ireland
No.2 Switzerland
Agricultural & chemical lime
No.1 Ireland
No.2 Poland
Concrete products
No.1 Blocks and rooftiles, Ireland
No.1 Pavers, Poland
Reserves
Physical Proven & probable Years tolocation million tonnes depletion
Cement
Ireland 130 86
Poland 64 17
Switzerland 10 7
Ukraine 104 53
Other 234 73
Aggregates
Finland 188 12
Ireland 875 78
Poland 249 28
Spain 61 48
Other 245 30
Lime
Ireland/Poland 49 42
Total Europe 2,209
Northeastern China
Andhra Pradesh, India
CRH 25
Results Analysis of change
€ million%
Change 2012 2011Total
Change Organic Acquisitions Divestments Restructuring Exchange
Sales revenue -10% 2,685 2,985 -300 -222 +78 -182 - +26
EBITDA -7% 405 436 -31 -11 +14 -40 +6 -
Operating profit -7% 246 264 -18 -8 +9 -24 +6 -1
EBITDA/sales 15.1% 14.6%
Op.profit/sales 9.2% 8.8%
EBITDA and operating profit exclude profit on disposals
Gains from CO² trading were €31 million (2011: €38 million)
Pension curtailment gains were €30 million (2011: €12 milllion)
Restructuring costs amounted to €13 million (2011: €19 million)
No impairment charges were incurred (2011: nil)
Europe Materials
A slowdown in construction activity in central Europe together with continuing
declines in western and southwestern Europe resulted in a reduction of 7%
in like-for-like sales. The impact of divestments during the year exceeded
contributions from acquisitions, and both EBITDA and operating profit were
lower than last year.
The results reported above include gains from pension curtailments and CO²
trading. Despite lower volumes, margins excluding these gains, which are also
excluded from the regional comments below, were similar to 2011 reflecting the
benefit of our continued focus on cost containment and efficiency measures.
Development spend of €103 million comprised four acquisitions/investments,
the more significant of which were the acquisition of a readymixed concrete
and concrete products business in Finland together with further investment in
our associate Yatai Building Materials as it continued to expand its presence
in northeastern China. The divestment of the Group’s 49% holding in Secil in
Portugal was completed in May.
Central and Eastern Europe (40% of EBITDA)
Construction activity in Poland contracted during 2012, reflecting completion
of projects associated with the June 2012 European football championship
and a sharp decline in infrastructure road projects as a number of contractors
experienced financial difficulties. Notwithstanding this, construction activity in
infrastructure remained at a level consistent with 2011. The residential market
continued to be sluggish with the tightening of mortgage lending criteria and
some weakening in residential prices. While national cement volumes for the
year were down 17%, our volumes declined by 11%. Pricing remained under
pressure throughout the year in most of our product lines and overall operating
profit declined. In Ukraine the strong increase in cement volumes in the first
half was reversed in the second half of the year, affected by the completion
of European football championship projects and the national cement market
finished down 5% compared with 2011. However, with the benefit of our new
cement plant and the acquisition in Odessa that was completed in 2011, our
volumes increased by 32% and operating profit improved significantly due to
better pricing and our low cost producer advantage.
Switzerland, Finland, Benelux (45% of EBITDA)
Overall construction spend in Switzerland was up slightly in 2012. The
downstream businesses of aggregates and readymixed concrete remained
strong; however, cement volumes were down 8% due mainly to poor weather
in the early part of the year. Sales prices, particularly in cement, remained
under pressure due to the strong Swiss Franc, and operating profit was
lower than in 2011. In Finland, construction output declined in 2012 mainly
due to lower residential starts, and our cement volumes declined by 6%.
While our businesses delivered price increases in cement, aggregates and
readymixed concrete, operating profit was lower than in 2011. In the Benelux,
our readymixed concrete and aggregates business in the Netherlands was
impacted by a 7% decline in construction activity levels and operating profit
was lower than in 2011. In Belgium the cement grinding business acquired in
mid-2011 performed somewhat behind expectations.
Ireland, Spain (5% of EBITDA)
Construction activity in Ireland continued to fall with domestic cement volumes
17% lower than in 2011. Our cost and capacity reduction programmes
continued during the year and with this lower cost base, operating losses
reduced. In Spain, while construction activity fell by a further 30% with declines
across all sectors, with the benefit of the significant cost reduction initiatives
implemented in prior years our results were in line with 2011.
Eastern Mediterranean, Asia (10% of EBITDA)
In Turkey, while domestic volumes for our 50% joint venture in the Aegean region
were in line with 2011, export volumes increased resulting in a total volume
increase of 3%; however, operating profit was lower due mainly to domestic
pricing pressure in the second half. Cement volumes in our 50% joint venture
in Southern India increased as the business continued to broaden its market
scope; while selling prices also improved, higher input and transport costs
resulted in an operating profit similar to 2011. In China a general slowdown in
residential, non-residential and infrastructure construction saw a year-on-year
decline of 21% in cement demand across the northeast region consequently
profits were lower.
Outlook
The 2012 decline in Polish cement volumes is expected to moderate with
some potential for improvement as the affected road contracts, currently being
re-tendered, should add to construction materials volumes in the second half
of 2013. We anticipate flat demand in Ukraine but expect further improvements
in margin through cost efficiencies from our new cement plant. In Switzerland
we expect an improvement in construction spend in 2013. While a slight
decline is expected in Finland, our business will benefit from rationalisation of
our readymixed concrete, paving and precast concrete operations following
the concrete products acquisition in September 2012. The outlook remains
challenging for Ireland and Spain with further volume declines expected in 2013;
however, ongoing capacity reduction, cost efficiencies and increased use of
alternative fuels should help our businesses to maintain margins. In Southern
India relatively flat demand is anticipated in our main Andhra Pradesh market
while cement demand in northeast China is expected to pick up in the second
half of the year as government spending on infrastructure projects recommences.
26 CRH
Americas Materials
Benign weather conditions early in the year contributed to increased
first-half volumes. However, second-half trading proved more challenging with
a slower pace of highway contract awards and severe disruption to activity in
the northeastern United States in late October/early November due to Hurricane
Sandy. Despite this challenging backdrop, which saw a slight reduction in
underlying volumes and higher input costs, the combination of focussed
commercial and cost actions with solid acquisition contributions resulted in US
Dollar operating profit being broadly in line with 2011.
Americas Materials completed 16 acquisitions in 2012 at a total cost of
€230 million (spend €108 million net of deferred payments), adding 560 million
tonnes of reserves, seven operating quarries, 17 asphalt plants and 11 readymixed
concrete plants with annual production of 4.6 million tonnes of aggregates,
1.8 million tonnes of asphalt and 0.4 million cubic metres of readymixed concrete.
Energy and related costs: The proportion that these costs represented of
sales was maintained at 2011 levels due to efficiency improvements combined
with increased use of recycled materials. The price of bitumen, a key component
of asphalt mix, rose by 7% in 2012 following a 14% increase in 2011. Prices for
diesel and gasoline, important inputs to aggregates, readymixed concrete and
paving operations, increased by 3% and 2% respectively. The price of energy
used at our asphalt plants, consisting of fuel oil, recycled oil, electricity and
natural gas, decreased by 9% as many of our facilities converted to lower cost
natural gas. Recycled asphalt and shingles accounted for 20% of total asphalt
requirements, an increase from 18% in 2011. Wider use of warm mix asphalt
continues to deliver cost benefits while also providing customers with a more
workable and eco-friendly product.
Aggregates: Total volumes including acquisitions were flat, with like-for-like
volumes down 2%. Compared with 2011, average prices increased by 2% on
both an overall and like-for-like basis; however, margins declined slightly due
to higher input costs.
Asphalt: While total volumes increased by 2%, like-for-like volumes fell by
2%. Despite the 7% increase in bitumen costs, we were able to limit unit cost
increases to 4% due to lower energy input costs and greater use of recycled
materials. With an average like-for-like asphalt price increase of 5%, our overall
asphalt margin improved in 2012.
Readymixed Concrete: Total volumes including acquisitions increased by
2%, with like-for-like volumes flat compared with 2011. In a very competitive
environment, average like-for-like prices increased by 1% but, with a 3%
increase in unit cost, margins declined. Operating profit was similar to 2011
driven by acquisitions and lower fixed overhead.
Paving and Construction Services: Overall sales revenue increased by
5% and by 1% on a like-for-like basis. Pricing remained under pressure in a
competitive bidding environment; however, efficiency improvements enabled
us to maintain overall margins in this segment at 2011 levels.
Regional Performance
East (65% of EBITDA)
The East region, comprising operations in 22 states, the most important being
Ohio, New York, Florida, Michigan, New Jersey, Pennsylvania and West Virginia,
is organised into four divisions. Our Central division delivered improved profits
with price increases and moderate volume growth offsetting higher costs. Our
Mid-Atlantic division was bolstered by new acquisitions in 2012 as we focussed
on expanding operations in this key market. An improving residential market
positively impacted our Southeast division and led to better volumes, prices
and profit growth. The Northeast division experienced a decline in operating
profit due mainly to the disruption caused by Hurricane Sandy. Overall US
Dollar operating profit in our East region was slightly lower than in 2011.
West (35% of EBITDA)
The West region also has operations in 22 states, the most important of which
are Utah, Texas, Washington, Missouri, Iowa, Kansas and Mississippi, and is
organised into three divisions. Both the core Central West and the Mountain
West divisions delivered higher operating profit driven by strong asphalt pricing.
The Northwest division experienced difficult market conditions in 2012 and
the absence of large infrastructure projects combined with a tepid residential
market led to lower profits. Overall operating profit for our West region was
maintained in 2012.
Outlook
We expect GDP growth in 2013 to be similar to 2012 and the residential
market to continue its recovery. The approval of MAP-21 during 2012 provides
stability and certainty regarding levels of highway funding through September
2014. In addition, the increase in the Transportation Infrastructure Finance and
Innovation Act (TIFIA) funding will give states greater opportunity to benefit from
private sector involvement in highway projects; however, the actual impact on
near-term investment remains to be seen. With the roll-off of the final element
of the ARRA stimulus package, we expect federal funding to be slightly down
in 2013; this is expected to be mostly offset by higher state spending on much
needed repair and maintenance.
Overall, we expect 2013 volumes for our mix of business to be relatively flat
compared with 2012. Our focus is to achieve further price increases and
efficiency improvements and, given a continuation of the relative stability seen
in the energy markets over recent months, for operating margin to move ahead.
Results Analysis of change
€ million%
Change 2012 2011Total
Change Organic Acquisitions Divestments Restructuring Exchange
Sales revenue +13% 4,971 4,395 +576 +40 +168 - - +368
EBITDA +7% 566 530 +36 -25 +20 - -5 +46
Operating profit +7% 282 264 +18 -12 +12 - -5 +23
EBITDA/sales 11.4% 12.1%
Op.profit/sales 5.7% 6.0%
EBITDA and operating profit exclude profit on disposals Restructuring costs amounted to €14 million (2011: €9 million)
No impairment charges were incurred (2011: nil)
CRH 27

Operations Review – Products
Top: CRH companies Calduran
and Dycore came together in the
construction of the Eenspan project
in Zeewolde, Netherlands. Calduran
constructed and assembled the walls
of the office block/storage units in
Calduran Limestone whilst Dycore
supplied the slab flooring.
Bottom: Oldcastle BuildingEnvelope™
played a key role in a major expansion
and renovation of Iowa State
University’s student recreation centre
in Ames, Iowa, using products that
allow for high thermal performance and
maximum use of natural light.
CRH manufactures products for use in residential,
non-residential and, to a lesser extent, infrastructure
construction applications. Complementary value-added
exterior products include architectural glass, aluminium
glazing systems, clay brick and block, outdoor security
products and shutters and awnings.
Americas Products
Europe Products’ strategy is to build and grow scalable
businesses in the large European construction markets.
The strategy is pursued by increasing the penetration
of CRH products, developing positions to benefit
from scale and best practice. We create competitive
advantage through product, process and end-use
innovation, while maintaining a balanced exposure to
demand drivers.
Operating in 21 countries, this business is a regional
leader in concrete products, concrete landscaping, clay
products, construction accessories and outdoor security.
Leveraging the benefits of our regional platforms, we
realise operational and procurement synergies across
the network. Pan-European product development
provides construction solutions which increase
efficiencies on site, creating more design freedom for
architects while enhancing the built environment and
reducing energy consumption of buildings. Europe
Products’ development strategy is to further penetrate
the growing RMI markets of developed Europe and to
broaden the product range in developing regions as
construction markets in those regions become more
sophisticated. This segment employs approximately
16,100 people at close to 400 operating locations.
Americas Products’ strategy is to build an optimised
portfolio of businesses which offer leadership positions
across a balanced range of product markets and
end-use segments. Our activities are organized into
three product groups under the Oldcastle name:
Architectural Products (concrete masonry and
hardscapes, clay brick, packaged lawn and garden
products, packaged cement mixes, fencing), Precast
(utility, drainage and structural precast, construction
accessories) and BuildingEnvelope™ (glass and
aluminium glazing systems). A coordinated approach at
both a national and regional level achieves economies
of scale and facilitates sharing of best practices which
drive operational and commercial improvement. Through
Oldcastle’s North American research and development
centres, a continuous pipeline of innovative value-added
products and design solutions is maintained.
Operating in 40 states, CRH has the breadth of product
range and national footprint to provide a national service
to customers with the personal touch of a local supplier.
Focussing on strategic and national accounts, the
new Oldcastle Building Solutions initiative provides an
additional platform for growth as it is uniquely positioned
in the industry to offer solutions to customers across
all phases of building construction. Employees total
approximately 15,500 at over 400 locations.
Americas Products
Europe Products
28 CRH
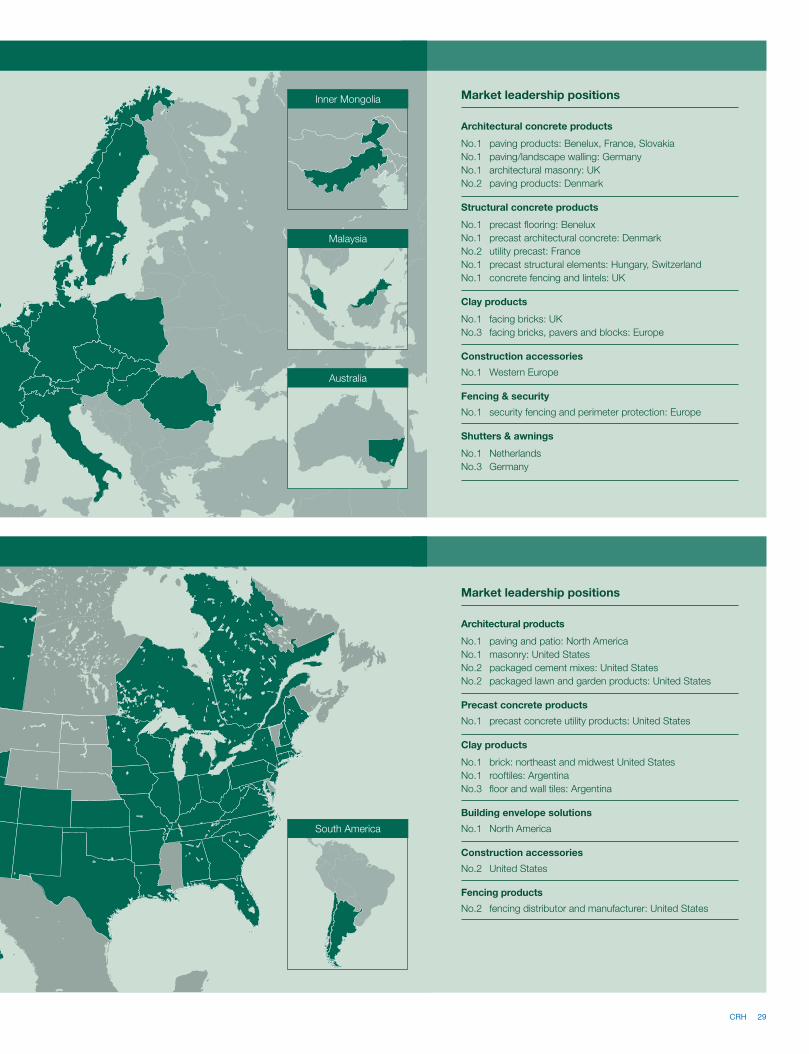
AUSTRALIA
Market leadership positions
Architectural concrete products
No.1 paving products: Benelux, France, Slovakia
No.1 paving/landscape walling: Germany
No.1 architectural masonry: UK
No.2 paving products: Denmark
Structural concrete products
No.1 precast flooring: Benelux
No.1 precast architectural concrete: Denmark
No.2 utility precast: France
No.1 precast structural elements: Hungary, Switzerland
No.1 concrete fencing and lintels: UK
Clay products
No.1 facing bricks: UK
No.3 facing bricks, pavers and blocks: Europe
Construction accessories
No.1 Western Europe
Fencing & security
No.1 security fencing and perimeter protection: Europe
Shutters & awnings
No.1 Netherlands
No.3 Germany
Market leadership positions
Architectural products
No.1 paving and patio: North America
No.1 masonry: United States
No.2 packaged cement mixes: United States
No.2 packaged lawn and garden products: United States
Precast concrete products
No.1 precast concrete utility products: United States
Clay products
No.1 brick: northeast and midwest United States
No.1 rooftiles: Argentina
No.3 floor and wall tiles: Argentina
Building envelope solutions
No.1 North America
Construction accessories
No.2 United States
Fencing products
No.2 fencing distributor and manufacturer: United States
Inner Mongolia
Australia
South America
Malaysia
CRH 29
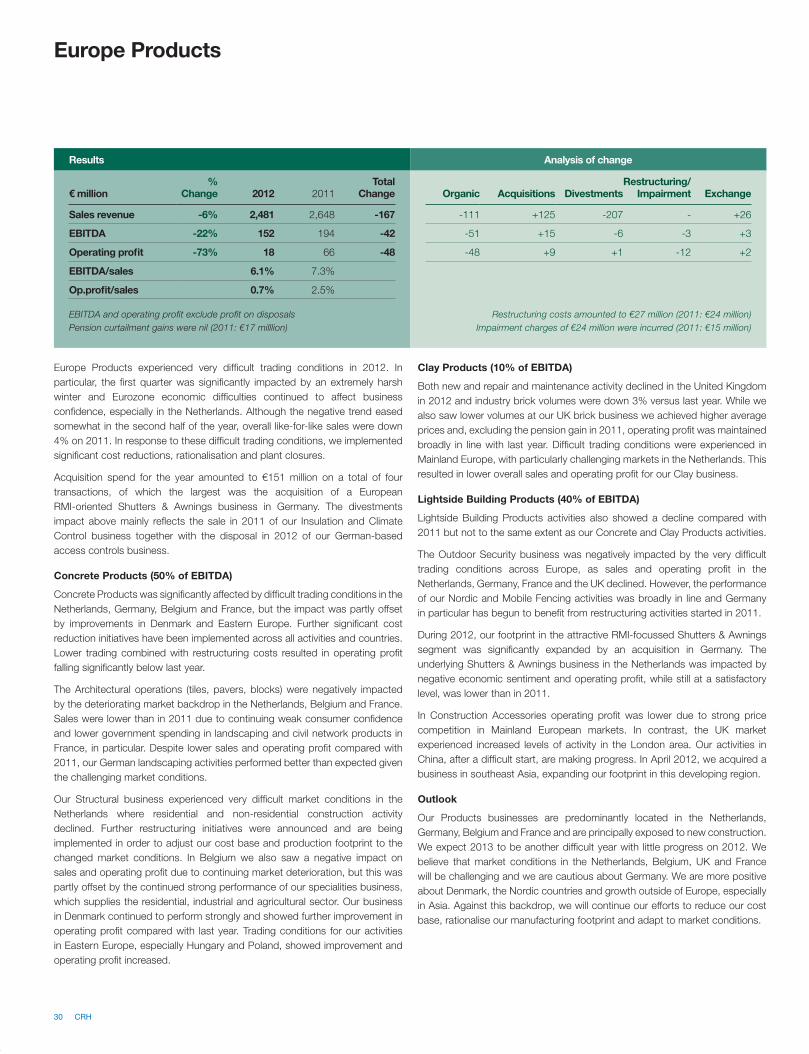
Europe Products
Europe Products experienced very difficult trading conditions in 2012. In
particular, the first quarter was significantly impacted by an extremely harsh
winter and Eurozone economic difficulties continued to affect business
confidence, especially in the Netherlands. Although the negative trend eased
somewhat in the second half of the year, overall like-for-like sales were down
4% on 2011. In response to these difficult trading conditions, we implemented
significant cost reductions, rationalisation and plant closures.
Acquisition spend for the year amounted to €151 million on a total of four
transactions, of which the largest was the acquisition of a European
RMI-oriented Shutters & Awnings business in Germany. The divestments
impact above mainly reflects the sale in 2011 of our Insulation and Climate
Control business together with the disposal in 2012 of our German-based
access controls business.
Concrete Products (50% of EBITDA)
Concrete Products was significantly affected by difficult trading conditions in the
Netherlands, Germany, Belgium and France, but the impact was partly offset
by improvements in Denmark and Eastern Europe. Further significant cost
reduction initiatives have been implemented across all activities and countries.
Lower trading combined with restructuring costs resulted in operating profit
falling significantly below last year.
The Architectural operations (tiles, pavers, blocks) were negatively impacted
by the deteriorating market backdrop in the Netherlands, Belgium and France.
Sales were lower than in 2011 due to continuing weak consumer confidence
and lower government spending in landscaping and civil network products in
France, in particular. Despite lower sales and operating profit compared with
2011, our German landscaping activities performed better than expected given
the challenging market conditions.
Our Structural business experienced very difficult market conditions in the
Netherlands where residential and non-residential construction activity
declined. Further restructuring initiatives were announced and are being
implemented in order to adjust our cost base and production footprint to the
changed market conditions. In Belgium we also saw a negative impact on
sales and operating profit due to continuing market deterioration, but this was
partly offset by the continued strong performance of our specialities business,
which supplies the residential, industrial and agricultural sector. Our business
in Denmark continued to perform strongly and showed further improvement in
operating profit compared with last year. Trading conditions for our activities
in Eastern Europe, especially Hungary and Poland, showed improvement and
operating profit increased.
Clay Products (10% of EBITDA)
Both new and repair and maintenance activity declined in the United Kingdom
in 2012 and industry brick volumes were down 3% versus last year. While we
also saw lower volumes at our UK brick business we achieved higher average
prices and, excluding the pension gain in 2011, operating profit was maintained
broadly in line with last year. Difficult trading conditions were experienced in
Mainland Europe, with particularly challenging markets in the Netherlands. This
resulted in lower overall sales and operating profit for our Clay business.
Lightside Building Products (40% of EBITDA)
Lightside Building Products activities also showed a decline compared with
2011 but not to the same extent as our Concrete and Clay Products activities.
The Outdoor Security business was negatively impacted by the very difficult
trading conditions across Europe, as sales and operating profit in the
Netherlands, Germany, France and the UK declined. However, the performance
of our Nordic and Mobile Fencing activities was broadly in line and Germany
in particular has begun to benefit from restructuring activities started in 2011.
During 2012, our footprint in the attractive RMI-focussed Shutters & Awnings
segment was significantly expanded by an acquisition in Germany. The
underlying Shutters & Awnings business in the Netherlands was impacted by
negative economic sentiment and operating profit, while still at a satisfactory
level, was lower than in 2011.
In Construction Accessories operating profit was lower due to strong price
competition in Mainland European markets. In contrast, the UK market
experienced increased levels of activity in the London area. Our activities in
China, after a difficult start, are making progress. In April 2012, we acquired a
business in southeast Asia, expanding our footprint in this developing region.
Outlook
Our Products businesses are predominantly located in the Netherlands,
Germany, Belgium and France and are principally exposed to new construction.
We expect 2013 to be another difficult year with little progress on 2012. We
believe that market conditions in the Netherlands, Belgium, UK and France
will be challenging and we are cautious about Germany. We are more positive
about Denmark, the Nordic countries and growth outside of Europe, especially
in Asia. Against this backdrop, we will continue our efforts to reduce our cost
base, rationalise our manufacturing footprint and adapt to market conditions.
Results Analysis of change
€ million%
Change 2012 2011Total
Change Organic Acquisitions DivestmentsRestructuring/
Impairment Exchange
Sales revenue -6% 2,481 2,648 -167 -111 +125 -207 - +26
EBITDA -22% 152 194 -42 -51 +15 -6 -3 +3
Operating profit -73% 18 66 -48 -48 +9 +1 -12 +2
EBITDA/sales 6.1% 7.3%
Op.profit/sales 0.7% 2.5%
EBITDA and operating profit exclude profit on disposals
Pension curtailment gains were nil (2011: €17 milllion)
Restructuring costs amounted to €27 million (2011: €24 million)
Impairment charges of €24 million were incurred (2011: €15 million)
30 CRH
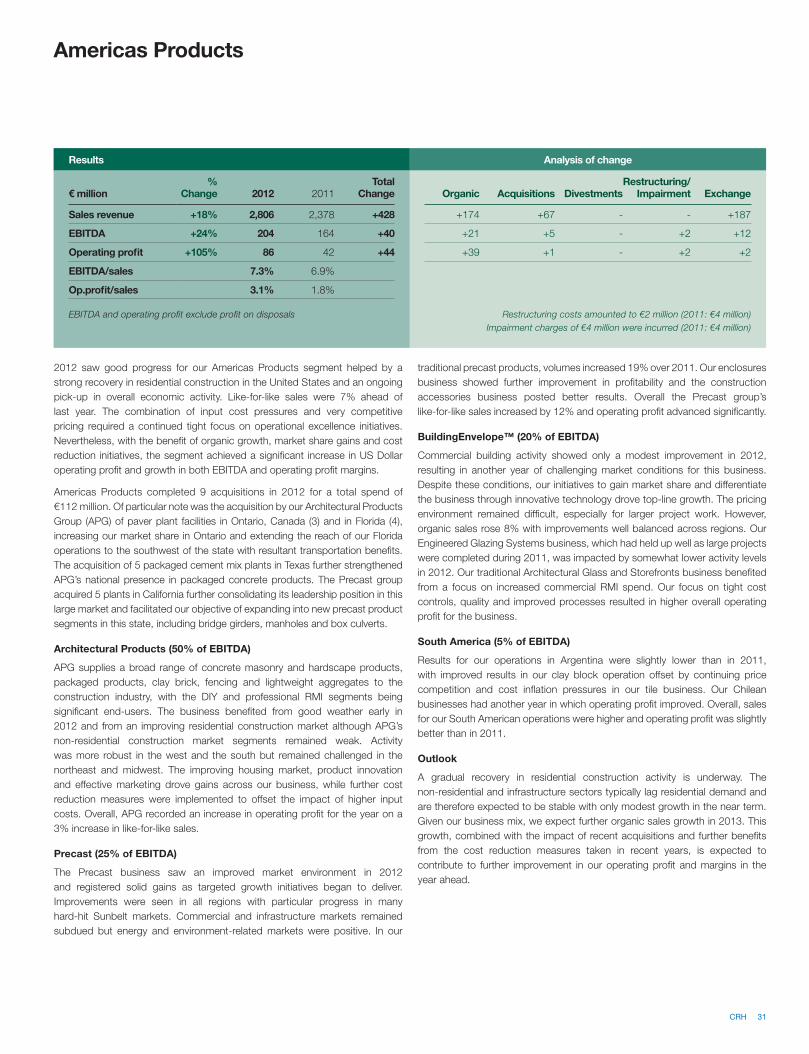
Americas Products
2012 saw good progress for our Americas Products segment helped by a
strong recovery in residential construction in the United States and an ongoing
pick-up in overall economic activity. Like-for-like sales were 7% ahead of
last year. The combination of input cost pressures and very competitive
pricing required a continued tight focus on operational excellence initiatives.
Nevertheless, with the benefit of organic growth, market share gains and cost
reduction initiatives, the segment achieved a significant increase in US Dollar
operating profit and growth in both EBITDA and operating profit margins.
Americas Products completed 9 acquisitions in 2012 for a total spend of
€112 million. Of particular note was the acquisition by our Architectural Products
Group (APG) of paver plant facilities in Ontario, Canada (3) and in Florida (4),
increasing our market share in Ontario and extending the reach of our Florida
operations to the southwest of the state with resultant transportation benefits.
The acquisition of 5 packaged cement mix plants in Texas further strengthened
APG’s national presence in packaged concrete products. The Precast group
acquired 5 plants in California further consolidating its leadership position in this
large market and facilitated our objective of expanding into new precast product
segments in this state, including bridge girders, manholes and box culverts.
Architectural Products (50% of EBITDA)
APG supplies a broad range of concrete masonry and hardscape products,
packaged products, clay brick, fencing and lightweight aggregates to the
construction industry, with the DIY and professional RMI segments being
significant end-users. The business benefited from good weather early in
2012 and from an improving residential construction market although APG’s
non-residential construction market segments remained weak. Activity
was more robust in the west and the south but remained challenged in the
northeast and midwest. The improving housing market, product innovation
and effective marketing drove gains across our business, while further cost
reduction measures were implemented to offset the impact of higher input
costs. Overall, APG recorded an increase in operating profit for the year on a
3% increase in like-for-like sales.
Precast (25% of EBITDA)
The Precast business saw an improved market environment in 2012
and registered solid gains as targeted growth initiatives began to deliver.
Improvements were seen in all regions with particular progress in many
hard-hit Sunbelt markets. Commercial and infrastructure markets remained
subdued but energy and environment-related markets were positive. In our
traditional precast products, volumes increased 19% over 2011. Our enclosures
business showed further improvement in profitability and the construction
accessories business posted better results. Overall the Precast group’s
like-for-like sales increased by 12% and operating profit advanced significantly.
BuildingEnvelope™ (20% of EBITDA)
Commercial building activity showed only a modest improvement in 2012,
resulting in another year of challenging market conditions for this business.
Despite these conditions, our initiatives to gain market share and differentiate
the business through innovative technology drove top-line growth. The pricing
environment remained difficult, especially for larger project work. However,
organic sales rose 8% with improvements well balanced across regions. Our
Engineered Glazing Systems business, which had held up well as large projects
were completed during 2011, was impacted by somewhat lower activity levels
in 2012. Our traditional Architectural Glass and Storefronts business benefited
from a focus on increased commercial RMI spend. Our focus on tight cost
controls, quality and improved processes resulted in higher overall operating
profit for the business.
South America (5% of EBITDA)
Results for our operations in Argentina were slightly lower than in 2011,
with improved results in our clay block operation offset by continuing price
competition and cost inflation pressures in our tile business. Our Chilean
businesses had another year in which operating profit improved. Overall, sales
for our South American operations were higher and operating profit was slightly
better than in 2011.
Outlook
A gradual recovery in residential construction activity is underway. The
non-residential and infrastructure sectors typically lag residential demand and
are therefore expected to be stable with only modest growth in the near term.
Given our business mix, we expect further organic sales growth in 2013. This
growth, combined with the impact of recent acquisitions and further benefits
from the cost reduction measures taken in recent years, is expected to
contribute to further improvement in our operating profit and margins in the
year ahead.
Results Analysis of change
€ million%
Change 2012 2011Total
Change Organic Acquisitions DivestmentsRestructuring/
Impairment Exchange
Sales revenue +18% 2,806 2,378 +428 +174 +67 - - +187
EBITDA +24% 204 164 +40 +21 +5 - +2 +12
Operating profit +105% 86 42 +44 +39 +1 - +2 +2
EBITDA/sales 7.3% 6.9%
Op.profit/sales 3.1% 1.8%
EBITDA and operating profit exclude profit on disposals Restructuring costs amounted to €2 million (2011: €4 million)
Impairment charges of €4 million were incurred (2011: €4 million)
CRH 31

Operations Review – Distribution
Top: CRH Bouwmaat, builders merchants in the
Netherlands, provide a one-stop wholesale cash
and carry facility with a wide range of products to
meet the needs of contractors in the RMI market.
Bottom: Allied, CRH’s distribution brand in the
United States, supplied the tiles needed to
reconstruct the roof of New Hope Presbyterian
Church in Castle Rock, Colorado, following a
severe hail storm in June 2012.
CRH distributes building materials to general building contractors, Sanitary,
Heating and Plumbing (SHAP) specialist contractors and Do-It-Yourself (DIY)
customers in Europe and to professional roofing/siding and interior products
contractors in the United States.
Europe Distribution’s strategy is to seek
opportunities to increase its network density in the
largely unconsolidated core European markets
while also investing in other attractive segments
of building materials distribution. Organisational
initiatives leverage expertise between DIY and
builders merchants and use best-in-class IT to
deliver operational excellence, optimise the supply
chain and provide superior customer service.
From a solid base in the Netherlands, CRH has
expanded its leading Builders Merchants positions
in Switzerland, Germany, Austria and France in
addition to growing its DIY “Gamma” format in
the Benelux. Substantial opportunities remain to
increase our existing network in core European
markets and to establish new platforms aimed at
growing our exposure to RMI market demand. An
example is CRH’s entry into the developing SHAP
distribution market through the acquisition of a
Swiss provider of high-end sanitary ware, since
replicated in contiguous markets in Germany and
Belgium. Europe Distribution employs approximately
11,900 people at over 780 operating locations.
Americas Distribution’s strategy is focussed on
being the supplier of choice to the professional
roofing and siding contractor and to applying
this successful distribution model to the Interior
Products segment. Demand in the Exterior
Products business is largely influenced by residential
and commercial replacement activity with the key
products having an average life span of 25 years.
The Interior Products division has less exposure to
replacement activity as demand is largely driven
by the new commercial construction market.
State-of-the-art IT, disciplined and focussed cash
management and well-established procurement
and commercial systems support supply chain
optimisation and enable CRH to provide superior
customer service.
Operating in 31 States, growth opportunities include
investment in new regions, in complementary
private label and energy-saving product offerings,
and in other attractive building materials distribution
segments that service professional dealer networks.
Employees total approximately 3,500 at over 180
operating locations.
Europe Distribution
Americas Distribution
32 CRH
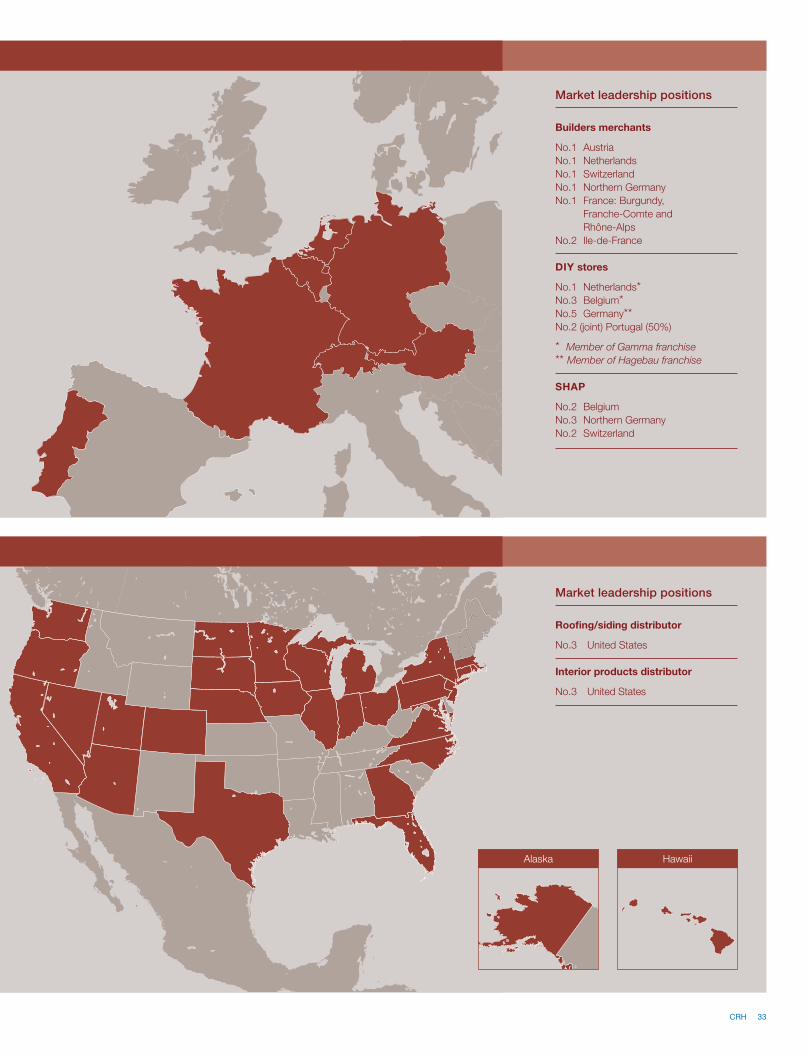
Market leadership positions
Roofing/siding distributor
No.3 United States
Interior products distributor
No.3 United States
Market leadership positions
Builders merchants
No.1 Austria
No.1 Netherlands
No.1 Switzerland
No.1 Northern Germany
No.1 France: Burgundy,
Franche-Comte and
Rhône-Alps
No.2 Ile-de-France
DIY stores
No.1 Netherlands*No.3 Belgium*No.5 Germany** No.2 (joint) Portugal (50%)
* Member of Gamma franchise
** Member of Hagebau franchise
SHAP
No.2 Belgium
No.3 Northern Germany
No.2 Switzerland
Alaska Hawaii
CRH 33
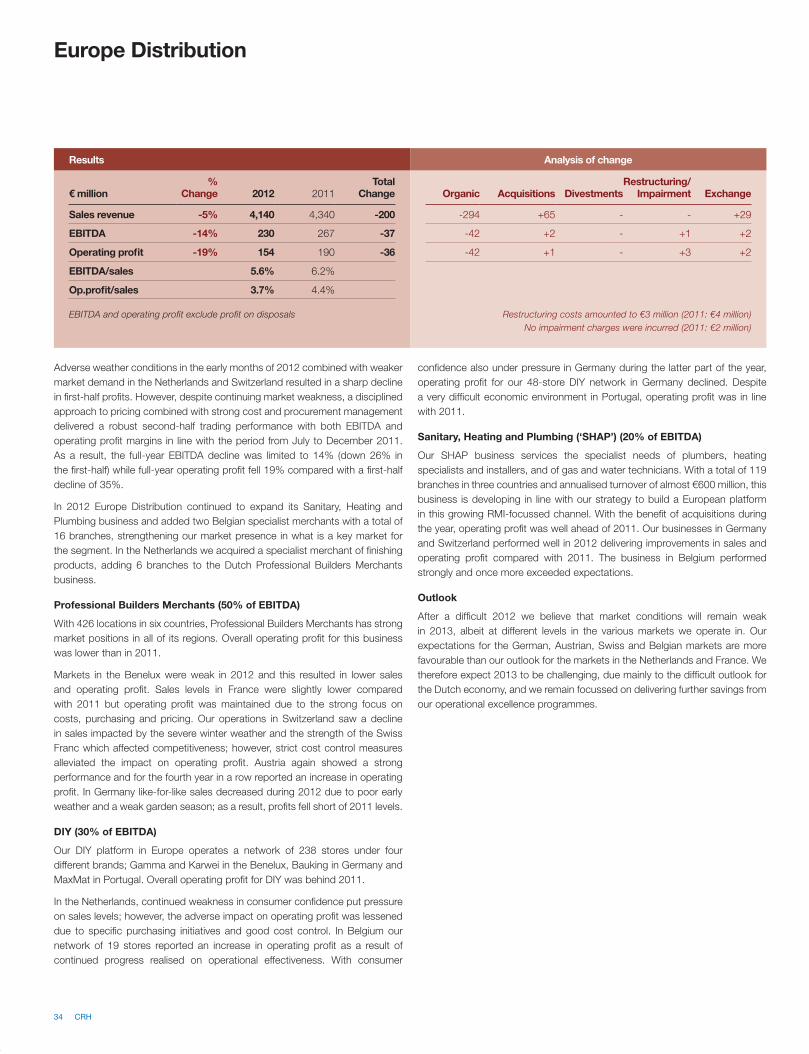
Europe Distribution
Americas Distribution
Adverse weather conditions in the early months of 2012 combined with weaker
market demand in the Netherlands and Switzerland resulted in a sharp decline
in first-half profits. However, despite continuing market weakness, a disciplined
approach to pricing combined with strong cost and procurement management
delivered a robust second-half trading performance with both EBITDA and
operating profit margins in line with the period from July to December 2011.
As a result, the full-year EBITDA decline was limited to 14% (down 26% in
the first-half) while full-year operating profit fell 19% compared with a first-half
decline of 35%.
In 2012 Europe Distribution continued to expand its Sanitary, Heating and
Plumbing business and added two Belgian specialist merchants with a total of
16 branches, strengthening our market presence in what is a key market for
the segment. In the Netherlands we acquired a specialist merchant of finishing
products, adding 6 branches to the Dutch Professional Builders Merchants
business.
Professional Builders Merchants (50% of EBITDA)
With 426 locations in six countries, Professional Builders Merchants has strong
market positions in all of its regions. Overall operating profit for this business
was lower than in 2011.
Markets in the Benelux were weak in 2012 and this resulted in lower sales
and operating profit. Sales levels in France were slightly lower compared
with 2011 but operating profit was maintained due to the strong focus on
costs, purchasing and pricing. Our operations in Switzerland saw a decline
in sales impacted by the severe winter weather and the strength of the Swiss
Franc which affected competitiveness; however, strict cost control measures
alleviated the impact on operating profit. Austria again showed a strong
performance and for the fourth year in a row reported an increase in operating
profit. In Germany like-for-like sales decreased during 2012 due to poor early
weather and a weak garden season; as a result, profits fell short of 2011 levels.
DIY (30% of EBITDA)
Our DIY platform in Europe operates a network of 238 stores under four
different brands; Gamma and Karwei in the Benelux, Bauking in Germany and
MaxMat in Portugal. Overall operating profit for DIY was behind 2011.
In the Netherlands, continued weakness in consumer confidence put pressure
on sales levels; however, the adverse impact on operating profit was lessened
due to specific purchasing initiatives and good cost control. In Belgium our
network of 19 stores reported an increase in operating profit as a result of
continued progress realised on operational effectiveness. With consumer
confidence also under pressure in Germany during the latter part of the year,
operating profit for our 48-store DIY network in Germany declined. Despite
a very difficult economic environment in Portugal, operating profit was in line
with 2011.
Sanitary, Heating and Plumbing (‘SHAP’) (20% of EBITDA)
Our SHAP business services the specialist needs of plumbers, heating
specialists and installers, and of gas and water technicians. With a total of 119
branches in three countries and annualised turnover of almost €600 million, this
business is developing in line with our strategy to build a European platform
in this growing RMI-focussed channel. With the benefit of acquisitions during
the year, operating profit was well ahead of 2011. Our businesses in Germany
and Switzerland performed well in 2012 delivering improvements in sales and
operating profit compared with 2011. The business in Belgium performed
strongly and once more exceeded expectations.
Outlook
After a difficult 2012 we believe that market conditions will remain weak
in 2013, albeit at different levels in the various markets we operate in. Our
expectations for the German, Austrian, Swiss and Belgian markets are more
favourable than our outlook for the markets in the Netherlands and France. We
therefore expect 2013 to be challenging, due mainly to the difficult outlook for
the Dutch economy, and we remain focussed on delivering further savings from
our operational excellence programmes.
Results Analysis of change
€ million%
Change 2012 2011Total
Change Organic Acquisitions DivestmentsRestructuring/
Impairment Exchange
Sales revenue -5% 4,140 4,340 -200 -294 +65 - - +29
EBITDA -14% 230 267 -37 -42 +2 - +1 +2
Operating profit -19% 154 190 -36 -42 +1 - +3 +2
EBITDA/sales 5.6% 6.2%
Op.profit/sales 3.7% 4.4%
EBITDA and operating profit exclude profit on disposals Restructuring costs amounted to €3 million (2011: €4 million)
No impairment charges were incurred (2011: €2 million)
34 CRH
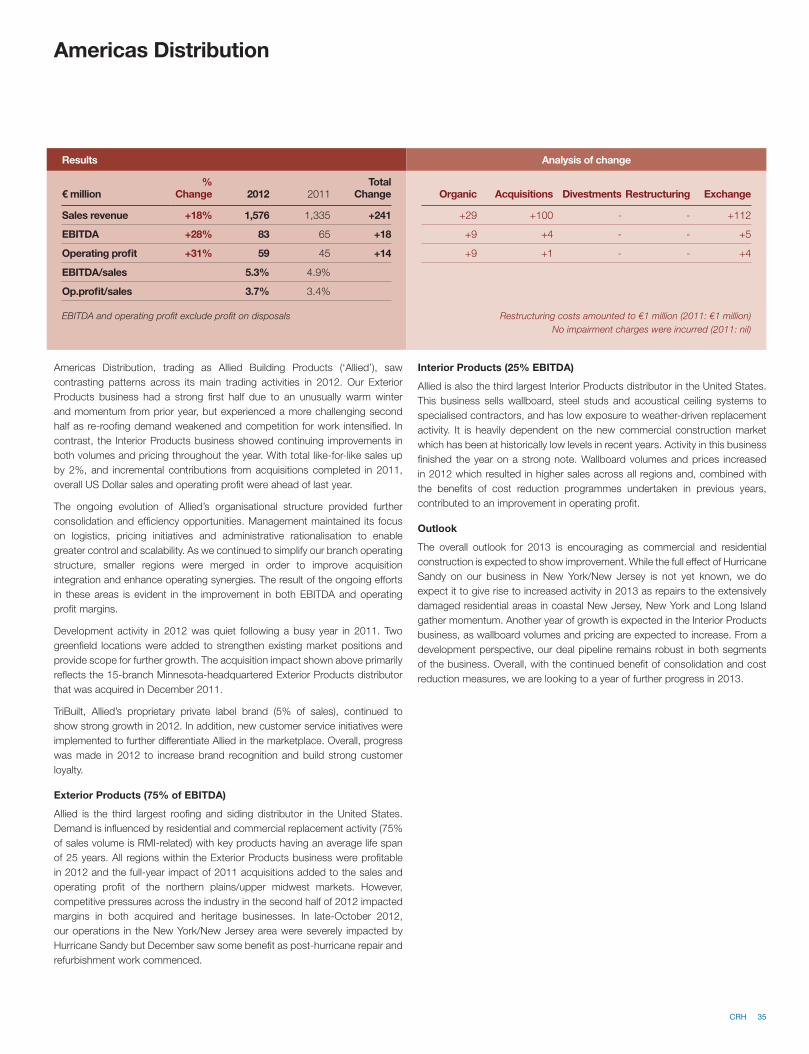
Americas Distribution
Americas Distribution, trading as Allied Building Products (‘Allied’), saw
contrasting patterns across its main trading activities in 2012. Our Exterior
Products business had a strong first half due to an unusually warm winter
and momentum from prior year, but experienced a more challenging second
half as re-roofing demand weakened and competition for work intensified. In
contrast, the Interior Products business showed continuing improvements in
both volumes and pricing throughout the year. With total like-for-like sales up
by 2%, and incremental contributions from acquisitions completed in 2011,
overall US Dollar sales and operating profit were ahead of last year.
The ongoing evolution of Allied’s organisational structure provided further
consolidation and efficiency opportunities. Management maintained its focus
on logistics, pricing initiatives and administrative rationalisation to enable
greater control and scalability. As we continued to simplify our branch operating
structure, smaller regions were merged in order to improve acquisition
integration and enhance operating synergies. The result of the ongoing efforts
in these areas is evident in the improvement in both EBITDA and operating
profit margins.
Development activity in 2012 was quiet following a busy year in 2011. Two
greenfield locations were added to strengthen existing market positions and
provide scope for further growth. The acquisition impact shown above primarily
reflects the 15-branch Minnesota-headquartered Exterior Products distributor
that was acquired in December 2011.
TriBuilt, Allied’s proprietary private label brand (5% of sales), continued to
show strong growth in 2012. In addition, new customer service initiatives were
implemented to further differentiate Allied in the marketplace. Overall, progress
was made in 2012 to increase brand recognition and build strong customer
loyalty.
Exterior Products (75% of EBITDA)
Allied is the third largest roofing and siding distributor in the United States.
Demand is influenced by residential and commercial replacement activity (75%
of sales volume is RMI-related) with key products having an average life span
of 25 years. All regions within the Exterior Products business were profitable
in 2012 and the full-year impact of 2011 acquisitions added to the sales and
operating profit of the northern plains/upper midwest markets. However,
competitive pressures across the industry in the second half of 2012 impacted
margins in both acquired and heritage businesses. In late-October 2012,
our operations in the New York/New Jersey area were severely impacted by
Hurricane Sandy but December saw some benefit as post-hurricane repair and
refurbishment work commenced.
Interior Products (25% EBITDA)
Allied is also the third largest Interior Products distributor in the United States.
This business sells wallboard, steel studs and acoustical ceiling systems to
specialised contractors, and has low exposure to weather-driven replacement
activity. It is heavily dependent on the new commercial construction market
which has been at historically low levels in recent years. Activity in this business
finished the year on a strong note. Wallboard volumes and prices increased
in 2012 which resulted in higher sales across all regions and, combined with
the benefits of cost reduction programmes undertaken in previous years,
contributed to an improvement in operating profit.
Outlook
The overall outlook for 2013 is encouraging as commercial and residential
construction is expected to show improvement. While the full effect of Hurricane
Sandy on our business in New York/New Jersey is not yet known, we do
expect it to give rise to increased activity in 2013 as repairs to the extensively
damaged residential areas in coastal New Jersey, New York and Long Island
gather momentum. Another year of growth is expected in the Interior Products
business, as wallboard volumes and pricing are expected to increase. From a
development perspective, our deal pipeline remains robust in both segments
of the business. Overall, with the continued benefit of consolidation and cost
reduction measures, we are looking to a year of further progress in 2013.
Results Analysis of change
€ million%
Change 2012 2011Total
Change Organic Acquisitions Divestments Restructuring Exchange
Sales revenue +18% 1,576 1,335 +241 +29 +100 - - +112
EBITDA +28% 83 65 +18 +9 +4 - - +5
Operating profit +31% 59 45 +14 +9 +1 - - +4
EBITDA/sales 5.3% 4.9%
Op.profit/sales 3.7% 3.4%
EBITDA and operating profit exclude profit on disposals Restructuring costs amounted to €1 million (2011: €1 million)
No impairment charges were incurred (2011: nil)
CRH 35
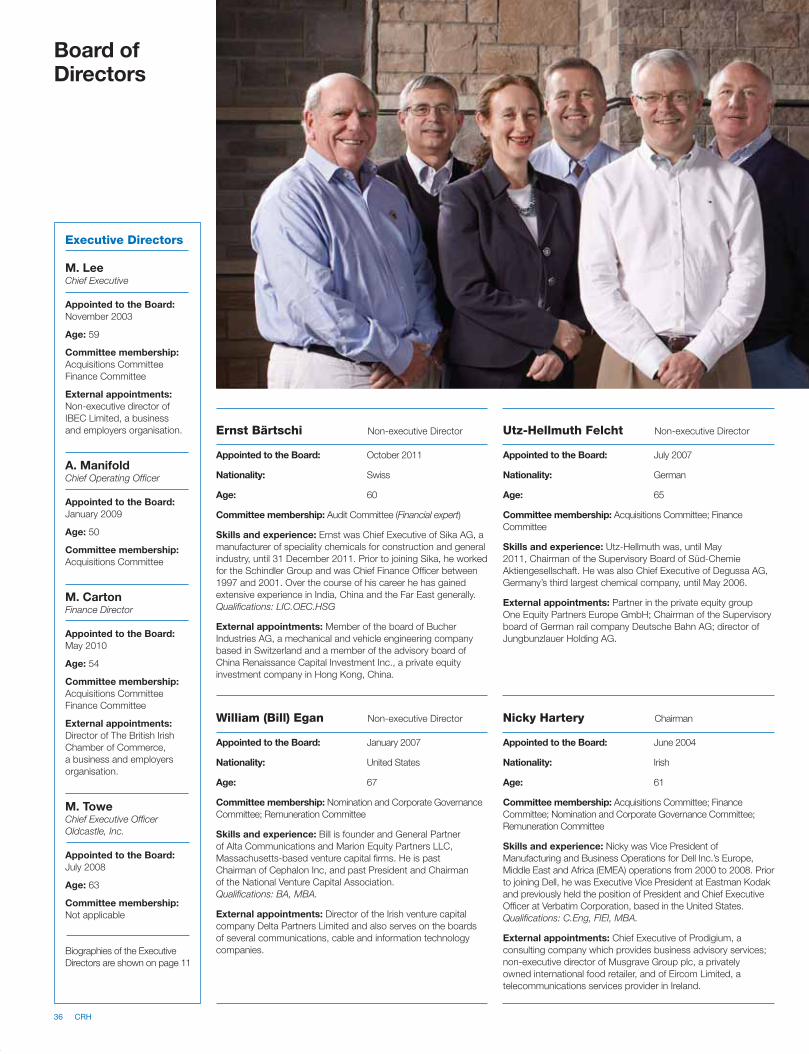
Board ofDirectors
William (Bill) Egan Non-executive Director
Appointed to the Board: January 2007
Nationality: United States
Age: 67
Committee membership: Nomination and Corporate Governance
Committee; Remuneration Committee
Skills and experience: Bill is founder and General Partner
of Alta Communications and Marion Equity Partners LLC,
Massachusetts-based venture capital firms. He is past
Chairman of Cephalon Inc, and past President and Chairman
of the National Venture Capital Association.
Qualifications: BA, MBA.
External appointments: Director of the Irish venture capital
company Delta Partners Limited and also serves on the boards
of several communications, cable and information technology
companies.
Ernst Bärtschi Non-executive Director
Appointed to the Board: October 2011
Nationality: Swiss
Age: 60
Committee membership: Audit Committee (Financial expert)
Skills and experience: Ernst was Chief Executive of Sika AG, a
manufacturer of speciality chemicals for construction and general
industry, until 31 December 2011. Prior to joining Sika, he worked
for the Schindler Group and was Chief Finance Officer between
1997 and 2001. Over the course of his career he has gained
extensive experience in India, China and the Far East generally.
Qualifications: LIC.OEC.HSG
External appointments: Member of the board of Bucher
Industries AG, a mechanical and vehicle engineering company
based in Switzerland and a member of the advisory board of
China Renaissance Capital Investment Inc., a private equity
investment company in Hong Kong, China.
Nicky Hartery Chairman
Appointed to the Board: June 2004
Nationality: Irish
Age: 61
Committee membership: Acquisitions Committee; Finance
Committee; Nomination and Corporate Governance Committee;
Remuneration Committee
Skills and experience: Nicky was Vice President of
Manufacturing and Business Operations for Dell Inc.’s Europe,
Middle East and Africa (EMEA) operations from 2000 to 2008. Prior
to joining Dell, he was Executive Vice President at Eastman Kodak
and previously held the position of President and Chief Executive
Officer at Verbatim Corporation, based in the United States.
Qualifications: C.Eng, FIEI, MBA.
External appointments: Chief Executive of Prodigium, a
consulting company which provides business advisory services;
non-executive director of Musgrave Group plc, a privately
owned international food retailer, and of Eircom Limited, a
telecommunications services provider in Ireland.
Utz-Hellmuth Felcht Non-executive Director
Appointed to the Board: July 2007
Nationality: German
Age: 65
Committee membership: Acquisitions Committee; Finance
Committee
Skills and experience: Utz-Hellmuth was, until May
2011, Chairman of the Supervisory Board of Süd-Chemie
Aktiengesellschaft. He was also Chief Executive of Degussa AG,
Germany’s third largest chemical company, until May 2006.
External appointments: Partner in the private equity group
One Equity Partners Europe GmbH; Chairman of the Supervisory
board of German rail company Deutsche Bahn AG; director of
Jungbunzlauer Holding AG.
Executive Directors
M. Lee
Chief Executive
Appointed to the Board:
November 2003
Age: 59
Committee membership:
Acquisitions Committee
Finance Committee
External appointments:
Non-executive director of
IBEC Limited, a business
and employers organisation.
A. Manifold Chief Operating Officer
Appointed to the Board:
January 2009
Age: 50
Committee membership:
Acquisitions Committee
M. Carton
Finance Director
Appointed to the Board:
May 2010
Age: 54
Committee membership:
Acquisitions Committee
Finance Committee
External appointments:
Director of The British Irish
Chamber of Commerce,
a business and employers
organisation.
M. Towe
Chief Executive Officer
Oldcastle, Inc.
Appointed to the Board:
July 2008
Age: 63
Committee membership:
Not applicable
Biographies of the Executive
Directors are shown on page 11
36 CRH
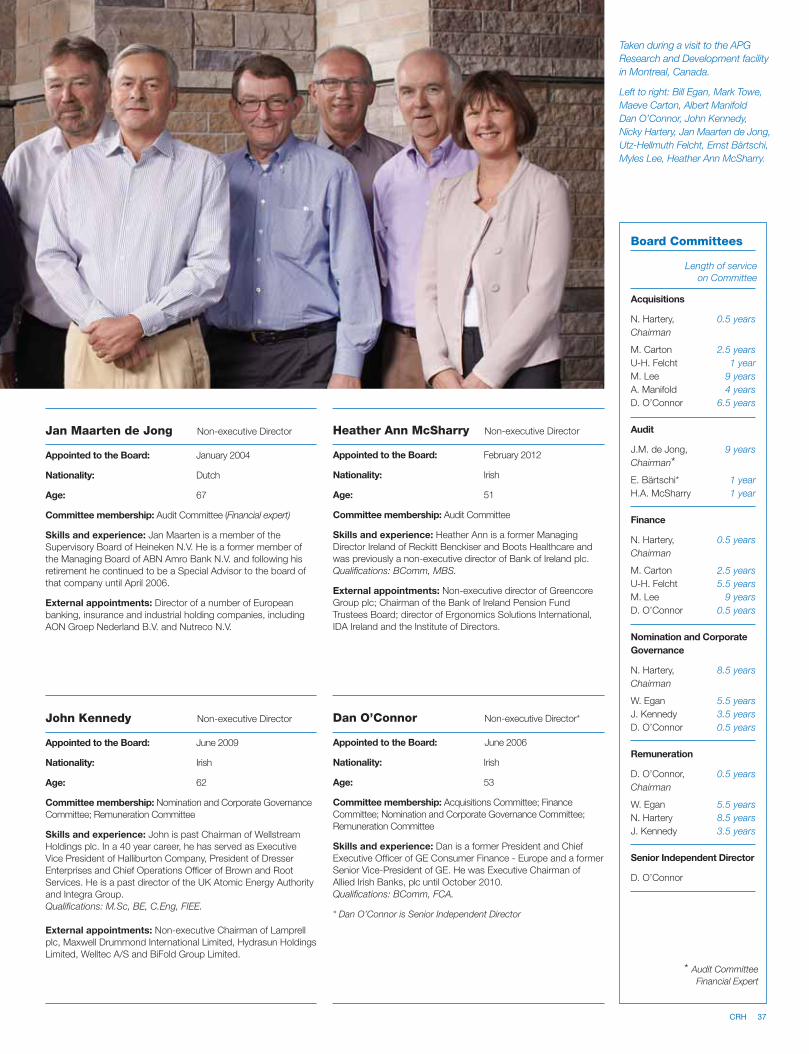
Taken during a visit to the APG
Research and Development facility
in Montreal, Canada.
Left to right: Bill Egan, Mark Towe,
Maeve Carton, Albert Manifold
Dan O’Connor, John Kennedy,
Nicky Hartery, Jan Maarten de Jong,
Utz-Hellmuth Felcht, Ernst Bärtschi,
Myles Lee, Heather Ann McSharry.
Board Committees
Length of service
on Committee
Acquisitions
N. Hartery, 0.5 years
Chairman
M. Carton 2.5 years
U-H. Felcht 1 year
M. Lee 9 years
A. Manifold 4 years
D. O’Connor 6.5 years
Audit
J.M. de Jong, 9 years
Chairman*
E. Bärtschi* 1 year
H.A. McSharry 1 year
Finance
N. Hartery, 0.5 years
Chairman
M. Carton 2.5 years
U-H. Felcht 5.5 years
M. Lee 9 years
D. O’Connor 0.5 years
Nomination and Corporate
Governance
N. Hartery, 8.5 years
Chairman
W. Egan 5.5 years
J. Kennedy 3.5 years
D. O’Connor 0.5 years
Remuneration
D. O’Connor, 0.5 years
Chairman
W. Egan 5.5 years
N. Hartery 8.5 years
J. Kennedy 3.5 years
Senior Independent Director
D. O’Connor
Jan Maarten de Jong Non-executive Director
Appointed to the Board: January 2004
Nationality: Dutch
Age: 67
Committee membership: Audit Committee (Financial expert)
Skills and experience: Jan Maarten is a member of the
Supervisory Board of Heineken N.V. He is a former member of
the Managing Board of ABN Amro Bank N.V. and following his
retirement he continued to be a Special Advisor to the board of
that company until April 2006.
External appointments: Director of a number of European
banking, insurance and industrial holding companies, including
AON Groep Nederland B.V. and Nutreco N.V.
John Kennedy Non-executive Director
Appointed to the Board: June 2009
Nationality: Irish
Age: 62
Committee membership: Nomination and Corporate Governance
Committee; Remuneration Committee
Skills and experience: John is past Chairman of Wellstream
Holdings plc. In a 40 year career, he has served as Executive
Vice President of Halliburton Company, President of Dresser
Enterprises and Chief Operations Officer of Brown and Root
Services. He is a past director of the UK Atomic Energy Authority
and Integra Group.
Qualifications: M.Sc, BE, C.Eng, FIEE.
External appointments: Non-executive Chairman of Lamprell
plc, Maxwell Drummond International Limited, Hydrasun Holdings
Limited, Welltec A/S and BiFold Group Limited.
Heather Ann McSharry Non-executive Director
Appointed to the Board: February 2012
Nationality: Irish
Age: 51
Committee membership: Audit Committee
Skills and experience: Heather Ann is a former Managing
Director Ireland of Reckitt Benckiser and Boots Healthcare and
was previously a non-executive director of Bank of Ireland plc.
Qualifications: BComm, MBS.
External appointments: Non-executive director of Greencore
Group plc; Chairman of the Bank of Ireland Pension Fund
Trustees Board; director of Ergonomics Solutions International,
IDA Ireland and the Institute of Directors.
Dan O’Connor Non-executive Director*
Appointed to the Board: June 2006
Nationality: Irish
Age: 53
Committee membership: Acquisitions Committee; Finance
Committee; Nomination and Corporate Governance Committee;
Remuneration Committee
Skills and experience: Dan is a former President and Chief
Executive Officer of GE Consumer Finance - Europe and a former
Senior Vice-President of GE. He was Executive Chairman of
Allied Irish Banks, plc until October 2010.
Qualifications: BComm, FCA.
* Dan O’Connor is Senior Independent Director
* Audit Committee
Financial Expert
CRH 37
38 CRH
CRH plc has a secondary listing on The Irish Stock Exchange.
For this reason, CRH plc is not subject to the same ongoing
listing requirements as those which would apply to an Irish
company with a primary listing on the Irish Stock Exchange
including the requirement that certain transactions require the
approval of shareholders. For further information, shareholders
should consult their own financial adviser. Further details on the
Group’s listing arrangements, including its primary listing on the
London Stock Exchange, are set out on page 40.
Governance Corporate Governance Report
Chairman’s Introduction
Contents
The CRH Board is responsible for the leadership,
oversight, control, development and long-term
success of the Group. We are also responsible for
instilling the appropriate culture, values and
behaviour throughout the organisation and are
committed to maintaining very high standards of
corporate governance and ethical business
conduct. The Corporate Governance Report sets
out in detail CRH’s key corporate governance
principles and practices, details the way in which
the Board operates and outlines how the 2010 UK
Corporate Governance Code, which applies to the
Company, is implemented. I have highlighted below
some of the more important elements of our
governance structures and those areas for which I
have specific responsibility as Chairman.
Board effectiveness and evaluation
As a non-executive Director since 2004, and
Senior Independent Director from May 2008 to
May 2012, I have found the CRH Board to be
highly effective, composed of knowledgeable
individuals with a wide range of business
experience, who enjoy working together towards
common goals, in an environment where no aspect
of the Group and its operations is off-limits for
debate and which is characterised by positive
interaction between executive and non-executive
Directors. One of the many attributes of my
predecessor as Chairman, Kieran McGowan, was
his ability to foster and support this environment,
particularly against the fast-evolving, uncertain
economic and financial backdrop of recent times.
When I became Chairman following the Annual
General Meeting in May 2012, one of my primary
goals was to ensure that the effectiveness of the
Board was maintained and, where possible,
enhanced and that the Board remains resolutely
focussed on fulfilling its responsibilities. I was,
therefore, very interested in the feedback from the
external Board evaluation exercise carried out in
2012. The outcome, which was very positive,
together with the relatively small number of
recommendations (outlined on page 42), supported
my view that the Board operates very effectively.
The outcome was also in line with the results of
annual internal Board evaluation exercises. Each
Board member participated fully in the external
evaluation process and felt that the resulting report
and recommendations were helpful and practical.
All of the recommendations have been
implemented or will, for timing reasons, be
implemented during 2013. From my perspective,
having an external “sense-check” on the
Page
38 Corporate Governance Report
38 Chairman’s Introduction
40 Listings and Corporate Governance Codes
40 Board of Directors
40 – Responsibilities
40 – Roles of Chairman and Chief Executive
40 – Membership
41 – Succession and diversity
41 – Independence
41 – Chairman
41 – Senior Independent Director
41 – Company Secretary
41 – Terms of appointment of non-executive Directors
41 – Induction, training and development
41 – Performance appraisal and Board evaluation
42 – External Board evaluation
42 – Directors’ retirement and re-election
43 – Board meetings
43 – Securities dealing policies and codes
44 Audit Committee
48 Nomination and Corporate Governance Committee
50 Remuneration Committee
50 Acquisitions Committee
50 Finance Committee
50 Risk Management and Internal Control
51 Compliance and Ethics
51 Attendance at Board/Committee meetings
52 Sustainability and Corporate Social Responsibility
52 Substantial Holdings
52 Communications with Shareholders
52 General Meetings
53 Memorandum and Articles of Association
53 Going Concern
53 Compliance Statement
53 Documents and presentations available on CRH website
54 Report on Directors’ Remuneration
68 Directors’ Report
Nicky Hartery
Chairman
performance of the Board was very useful; it
reminded us all that while the Board’s performance
is “very good”, relatively minor and focussed
adjustments, for example in the Group’s strategic
planning processes, can provide a basis for further
performance improvements and enable us to
better utilise the diverse skills and abilities of
individual Board members.
The Board and induction
It has been CRH’s practice since the formation of
the Group in the 1970s that the roles of Chairman
and Chief Executive are not combined. A summary
of our respective responsibilities are set out on
page 40.
It is also our practice that a majority of the Board
comprises non-executive Directors. My non-
executive Director colleagues are expected to
challenge management proposals constructively
and to examine and review management
performance in meeting agreed objectives and
targets. In addition, they are expected to draw on
their experience and knowledge in respect of any
challenges facing the Group and in relation to the
development of proposals on strategy.
Ernst Bärtschi and Heather Ann McSharry were
appointed to the Board in late-2011 and
early-2012 respectively. In order to provide them
with an in-depth understanding of the Group,
Kieran McGowan agreed a comprehensive
induction programme with each of them, which
was designed to cover their first year on the Board.
Following my appointment as Chairman, I met with
Ernst and Heather Ann approximately half way
through the programme to ensure that it was
meeting their needs. I would like to thank both of
them and the senior management team for the
time and effort they invested in the programme, the
details of which are set out on page 42.
My colleagues and I are committed to ensuring that
the Board is sufficiently diverse and appropriately
balanced, and these are core elements taken into
account by the Nomination and Corporate
Governance Committee when it makes
recommendations on Board appointments. The
renewal policy is described in detail on page 41.
Recent appointments have been very much in
keeping with these principles.
Performance appraisal, independence and
re-election
I have conducted a formal evaluation of the
performance of individual Directors, which
included training needs where appropriate. I can
confirm that each of the Directors continues to
perform effectively and to demonstrate strong
commitment to the role. Jan Maarten de Jong
was appointed a Director in January 2004
and has entered his tenth year on the Board.
Notwithstanding his tenure, we consider him to be
independent. In forming this view, we have taken
into account his performance as a non-executive
Director in terms of the judgement, objectivity and
commitment he brings to the Board. We have
invited him to serve as a Director for a further
period of one year, with the position to be
reviewed in 2014. In accordance with the policy
adopted in 2011, each Director will retire at the
Annual General Meeting on 8 May 2013. I strongly
recommend that each of them be re-elected.
Meetings and time commitment
I work closely with the Chief Executive and
Company Secretary in setting the agendas of the
Board to ensure that sufficient time is allocated to
strategy setting and review, performance
monitoring, portfolio management, including
acquisitions and divestments, succession
planning and talent management. The papers
for scheduled Board meetings are circulated
electronically in the week prior to the meeting.
The papers are regarded by the non-executive
Directors as being comprehensive. However,
following the feedback from the external
evaluation process, we have focussed over the
past year on rationalising the documentation
circulated to the Board. Further details in relation
to the agenda items dealt with by the Board
throughout the year are set out on page 43.
The Board makes two visits each year to Group
operations; one in Europe and one in North
America. Each visit lasts between three and five
days and incorporates a scheduled Board
meeting. In 2012, these visits were to Belgium in
Europe and to Montreal in Canada. Since my
appointment as Chairman, I have also visited our
joint venture in India and in the coming months I
will be visiting our operations in Ukraine and our
joint venture in China.
Prior to their appointment, potential non-executive
Directors are made aware of the calendar of
meetings and are asked to confirm that they are
able to allocate sufficient time to meet the
expectations of their role. My agreement is required
before a non-executive Director accepts additional
commitments that might impact adversely on the
time he or she is able to devote to CRH.
Risk management and ethics
Risk management continues to be the focus of
much attention in the context of both the
recessionary environment and high profile failures
of risk systems in global organisations. The
principal strategic risks which the Group faces are
set out in the Directors’ Report on pages 68 and
69. The Board has delegated responsibility for the
monitoring of risk management and internal
controls to the Audit Committee¹. However, the
Board retains ultimate responsibility for determining
the Group’s “risk appetite” and annually considers
a report in relation to the monitoring, controlling
and reporting of identified risks and uncertainties.
In recent years management has undertaken a
significant review of the Group’s risk management
framework to ensure that the systems in place are
appropriately robust and reflect the organisation
structure and diversity of the Group. The Board
and management are satisfied that appropriate risk
management and internal controls are in place
throughout the Group.
The international regulatory environment in which
the Group operates continues to evolve in the area
of compliance and ethics, with a significant step-up
in enforcement activity around the world. Our
stakeholders demand transparency from us in
terms of business ethics, particularly as we develop
a more diverse, global footprint. The Group’s
policies and procedures are designed to reinforce
our high standards of business conduct and
ensure our employees everywhere act in a manner
consistent with CRH’s core values to safeguard our
excellent reputation. As outlined on page 46, the
Head of Compliance and Ethics reports regularly to
the Audit Committee.
Conclusion
In summary, I believe that your Board operates very
effectively and that the Board’s governance
structures outlined above and in the remainder of
this report are appropriate and robust. As
Chairman, I am focussed on ensuring that CRH
remains at the forefront of best practice in this area.
Nicky Hartery
Chairman
February 2013
¹ In accordance with Section 91(6)(b) of the EC (Directive
2006/43) Regulations 2010
CRH 39
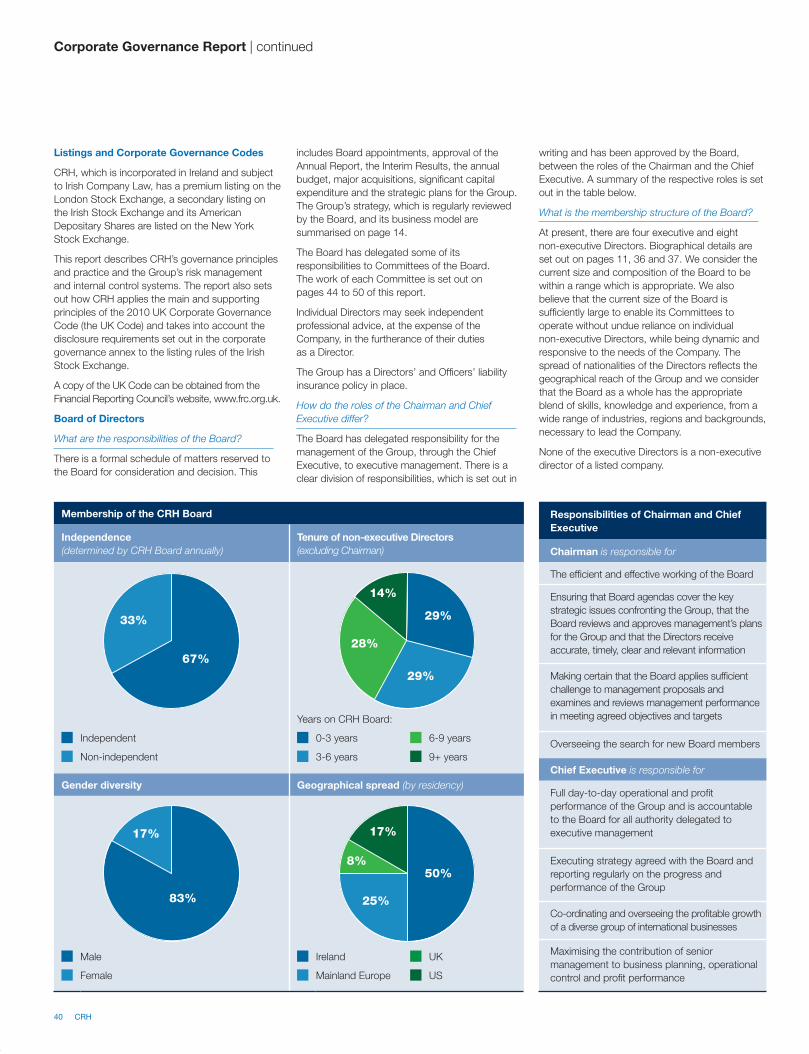
40 CRH
Listings and Corporate Governance Codes
CRH, which is incorporated in Ireland and subject
to Irish Company Law, has a premium listing on the
London Stock Exchange, a secondary listing on
the Irish Stock Exchange and its American
Depositary Shares are listed on the New York
Stock Exchange.
This report describes CRH’s governance principles
and practice and the Group’s risk management
and internal control systems. The report also sets
out how CRH applies the main and supporting
principles of the 2010 UK Corporate Governance
Code (the UK Code) and takes into account the
disclosure requirements set out in the corporate
governance annex to the listing rules of the Irish
Stock Exchange.
A copy of the UK Code can be obtained from the
Financial Reporting Council’s website, www.frc.org.uk.
Board of Directors
What are the responsibilities of the Board?
There is a formal schedule of matters reserved to
the Board for consideration and decision. This
includes Board appointments, approval of the
Annual Report, the Interim Results, the annual
budget, major acquisitions, significant capital
expenditure and the strategic plans for the Group.
The Group’s strategy, which is regularly reviewed
by the Board, and its business model are
summarised on page 14.
The Board has delegated some of its
responsibilities to Committees of the Board.
The work of each Committee is set out on
pages 44 to 50 of this report.
Individual Directors may seek independent
professional advice, at the expense of the
Company, in the furtherance of their duties
as a Director.
The Group has a Directors’ and Officers’ liability
insurance policy in place.
How do the roles of the Chairman and Chief
Executive differ?
The Board has delegated responsibility for the
management of the Group, through the Chief
Executive, to executive management. There is a
clear division of responsibilities, which is set out in
writing and has been approved by the Board,
between the roles of the Chairman and the Chief
Executive. A summary of the respective roles is set
out in the table below.
What is the membership structure of the Board?
At present, there are four executive and eight
non-executive Directors. Biographical details are
set out on pages 11, 36 and 37. We consider the
current size and composition of the Board to be
within a range which is appropriate. We also
believe that the current size of the Board is
sufficiently large to enable its Committees to
operate without undue reliance on individual
non-executive Directors, while being dynamic and
responsive to the needs of the Company. The
spread of nationalities of the Directors reflects the
geographical reach of the Group and we consider
that the Board as a whole has the appropriate
blend of skills, knowledge and experience, from a
wide range of industries, regions and backgrounds,
necessary to lead the Company.
None of the executive Directors is a non-executive
director of a listed company.
Corporate Governance Report | continued
Responsibilities of Chairman and Chief
Executive
Chairman is responsible for
The efficient and effective working of the Board
Ensuring that Board agendas cover the key
strategic issues confronting the Group, that the
Board reviews and approves management’s plans
for the Group and that the Directors receive
accurate, timely, clear and relevant information
Making certain that the Board applies sufficient
challenge to management proposals and
examines and reviews management performance
in meeting agreed objectives and targets
Overseeing the search for new Board members
Chief Executive is responsible for
Full day-to-day operational and profit
performance of the Group and is accountable
to the Board for all authority delegated to
executive management
Executing strategy agreed with the Board and
reporting regularly on the progress and
performance of the Group
Co-ordinating and overseeing the profitable growth
of a diverse group of international businesses
Maximising the contribution of senior
management to business planning, operational
control and profit performance
Membership of the CRH Board
Independence
(determined by CRH Board annually)
Tenure of non-executive Directors
(excluding Chairman)
33%
67%
14%
29%
28%
29%
Years on CRH Board:
Independent 0-3 years 6-9 years
Non-independent 3-6 years 9+ years
Gender diversity Geographical spread (by residency)
17%
83%
17%
25%
50%8%
Male Ireland UK
Female Mainland Europe US
How does the Board plan for succession and what
is its policy on diversity?
The Board plans for its own succession with the
assistance of the Nomination and Corporate
Governance Committee. For non-executive
appointments, independent consultants are
engaged to search for suitable candidates. The
process to identify, evaluate and appoint a
non-executive Director with the suitable
experience, skills and time commitment takes into
account both the needs of CRH and the tenure
and skills of existing board members. As a result,
non-executive renewal and refreshment is a
continuous process.
The non-executive Directors meet regularly with the
Chief Executive to discuss senior management
succession planning to ensure appropriate talent
management structures are in place to provide a
pool of potential candidates for key executive
Director appointments. External consultants are
engaged for executive Director recruitment if, and
when, required.
We are committed to ensuring that the Board is
sufficiently diverse and appropriately balanced. In
its work in the area of Board renewal, the
Nomination and Corporate Governance Committee
looks at the following four criteria when considering
non-executive Director candidates:
– international business experience, particularly in
the regions in which the Group operates or in
which it intends to expand;
– skills, knowledge and expertise in areas relevant
to the operation of the Board;
– diversity, including nationality and gender;
– the need for an appropriately sized Board.
During the ongoing process of Board renewal,
each, or a combination, of these factors can take
priority. Consequently, to date the Board has not
set specific objectives in relation to diversity.
What criteria are used to determine the
independence of non-executive Directors?
The independence of non-executive Board
members is considered annually. The Board is
assisted in this by the annual review carried out by
the Senior Independent Director which addresses
the independence of the individual members of the
Board (see Performance appraisal and Board
evaluation section on this page), and by the work
of the Nomination and Corporate Governance
Committee, which annually reviews each Board
member’s directorships and considers any relevant
business relationships between Board members.
We have concluded that all of the non-executive
Directors bring independent judgement to bear on
issues of strategy, performance, resources, key
appointments and standards, and have determined
that each of the non-executive Directors is
independent. In reaching that conclusion, we
considered the principles relating to independence
contained in the UK Code, together with the
guidance provided by a number of shareholder
voting agencies, and have taken the view that
independence is determined by a Director’s
character, objectivity and integrity. Those principles
and guidance highlight a number of factors that
might appear to affect the independence of
Directors, including former service as an executive,
extended service on the Board and cross-
directorships, while making it clear that a Director
may be considered independent notwithstanding
the presence of one or more of these factors.
When was the Chairman appointed and does he
have non-CRH commitments?
Nicky Hartery was appointed Chairman of the
Group following the conclusion of the 2012 Annual
General Meeting. On his appointment as Chairman,
he met the independence criteria set out in the UK
Code.
Although Nicky Hartery holds a number of other
directorships (see details on page 36), the Board
considers that these do not interfere with the
discharge of his duties to CRH. There has been no
change in his non-CRH commitments since his
appointment as Chairman.
Who is the Senior Independent Director?
Dan O’Connor was appointed as Senior
Independent Director in 2012. He is available to
shareholders who have concerns that cannot be
addressed through the Chairman, Chief Executive
or Finance Director.
Who is the Company Secretary?
Neil Colgan was appointed Company Secretary in
June 2009. The appointment and removal of the
Company Secretary is a matter for the Board. All
Directors have access to the advice and services of
the Company Secretary, who is responsible to the
Board for ensuring that Board procedures are
complied with.
What are the terms of appointment of non-
executive Directors?
Non-executive Directors are typically expected to
serve two three-year terms, although they may be
invited to serve for further periods. The standard
terms of the letter of appointment of non-executive
Directors are available for inspection at the
Company’s registered office and at the Annual
General Meeting.
How are the induction, training and development
needs of Directors catered for?
New Directors are provided with extensive briefing
materials on the Group and its operations, the
procedures relating to the Board and its
Committees and their duties and responsibilities as
Directors under legislation and regulations that
apply to the Company. The Chairman agrees a
tailored and comprehensive induction programme
with each new Director.
A typical induction programme, which generally
takes place over the first year of a Director’s
appointment, would cover the topics set out in the
Induction Programme panel on page 42.
Sessions are held with the Chairman at which
progress is reviewed and feedback is sought. New
Directors also meet with the Group’s stockbrokers.
For newly-appointed members of the Audit
Committee, training arrangements would include
the topics set out in the Induction Programme
panel on page 42.
New members of the Remuneration Committee
meet with the Committee’s remuneration
consultants in the year of their appointment to the
Committee.
Directors can also avail of opportunities to hear the
views of and meet with the Group’s investors and
analysts. Directors regularly receive copies of
research and analysis conducted on CRH and the
building materials sector. The Board receives
regular updates from the external auditors in
relation to regulatory and accounting
developments. Updates in relation to other relevant
matters, for example, changes in company law, are
provided from time to time.
What processes are in place for appraising the
performance of Directors and for evaluating the
effectiveness of the Board?
An annual review of individual Directors’
performance is conducted by the Chairman and
each Director is provided with feedback gathered
from other members of the Board. Performance is
assessed against a number of measures, including
the ability of the Director to contribute to the
development of strategy, to understand the major
risks affecting the Group, to contribute to the
cohesion of the Board, to commit the time required
to fulfil the role and to listen to and respect the
views of other Directors and the management
team. As part of that review process the Chairman
discusses with each individual their training and
development needs and, where appropriate,
agrees suitable arrangements to be put in place to
address those needs.
Each year, the Senior Independent Director
conducts an annual review of corporate
governance, the independence of Board members,
the operation and performance of the Board and
its Committees and the effectiveness of Board
communications. This is achieved through
discussion in one-to-one sessions with each
Director. The meetings, which cover specific topics
and allow for free-ranging discussion, provide a
forum for an open and frank discourse. The Senior
Independent Director circulates a written report to
the Board each year, which summarises the
outcome of the review and sets out any
Corporate Governance Report | continued
CRH 41
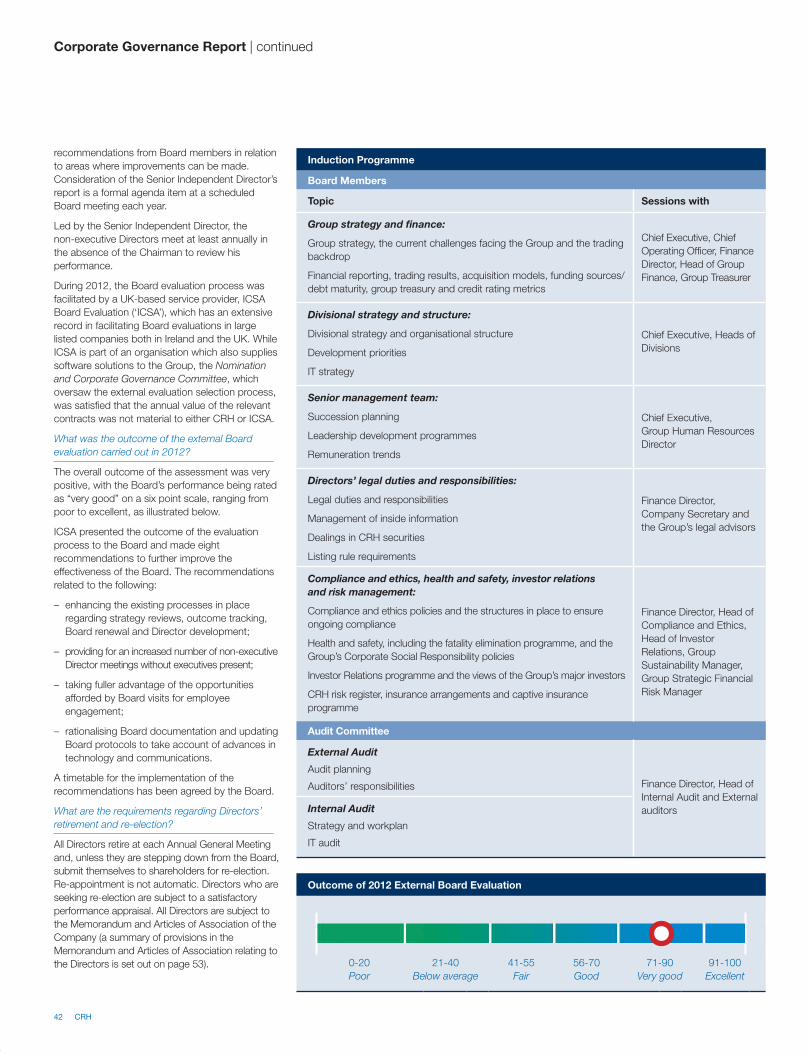
42 CRH
Corporate Governance Report | continued
recommendations from Board members in relation
to areas where improvements can be made.
Consideration of the Senior Independent Director’s
report is a formal agenda item at a scheduled
Board meeting each year.
Led by the Senior Independent Director, the
non-executive Directors meet at least annually in
the absence of the Chairman to review his
performance.
During 2012, the Board evaluation process was
facilitated by a UK-based service provider, ICSA
Board Evaluation (‘ICSA’), which has an extensive
record in facilitating Board evaluations in large
listed companies both in Ireland and the UK. While
ICSA is part of an organisation which also supplies
software solutions to the Group, the Nomination
and Corporate Governance Committee, which
oversaw the external evaluation selection process,
was satisfied that the annual value of the relevant
contracts was not material to either CRH or ICSA.
What was the outcome of the external Board
evaluation carried out in 2012?
The overall outcome of the assessment was very
positive, with the Board’s performance being rated
as “very good” on a six point scale, ranging from
poor to excellent, as illustrated below.
ICSA presented the outcome of the evaluation
process to the Board and made eight
recommendations to further improve the
effectiveness of the Board. The recommendations
related to the following:
– enhancing the existing processes in place
regarding strategy reviews, outcome tracking,
Board renewal and Director development;
– providing for an increased number of non-executive
Director meetings without executives present;
– taking fuller advantage of the opportunities
afforded by Board visits for employee
engagement;
– rationalising Board documentation and updating
Board protocols to take account of advances in
technology and communications.
A timetable for the implementation of the
recommendations has been agreed by the Board.
What are the requirements regarding Directors’
retirement and re-election?
All Directors retire at each Annual General Meeting
and, unless they are stepping down from the Board,
submit themselves to shareholders for re-election.
Re-appointment is not automatic. Directors who are
seeking re-election are subject to a satisfactory
performance appraisal. All Directors are subject to
the Memorandum and Articles of Association of the
Company (a summary of provisions in the
Memorandum and Articles of Association relating to
the Directors is set out on page 53).
Induction Programme
Board Members
Topic Sessions with
Group strategy and finance:
Group strategy, the current challenges facing the Group and the trading
backdrop
Financial reporting, trading results, acquisition models, funding sources/
debt maturity, group treasury and credit rating metrics
Chief Executive, Chief
Operating Officer, Finance
Director, Head of Group
Finance, Group Treasurer
Divisional strategy and structure:
Divisional strategy and organisational structure
Development priorities
IT strategy
Chief Executive, Heads of
Divisions
Senior management team:
Succession planning
Leadership development programmes
Remuneration trends
Chief Executive,
Group Human Resources
Director
Directors’ legal duties and responsibilities:
Legal duties and responsibilities
Management of inside information
Dealings in CRH securities
Listing rule requirements
Finance Director,
Company Secretary and
the Group’s legal advisors
Compliance and ethics, health and safety, investor relations and risk management:
Compliance and ethics policies and the structures in place to ensure
ongoing compliance
Health and safety, including the fatality elimination programme, and the
Group’s Corporate Social Responsibility policies
Investor Relations programme and the views of the Group’s major investors
CRH risk register, insurance arrangements and captive insurance
programme
Finance Director, Head of
Compliance and Ethics,
Head of Investor
Relations, Group
Sustainability Manager,
Group Strategic Financial
Risk Manager
Audit Committee
External Audit
Audit planning
Auditors’ responsibilities Finance Director, Head of
Internal Audit and External
auditorsInternal Audit
Strategy and workplan
IT audit
Outcome of 2012 External Board Evaluation
0-20
Poor
21-40
Below average
41-55
Fair
56-70
Good
71-90
Very good
91-100
Excellent
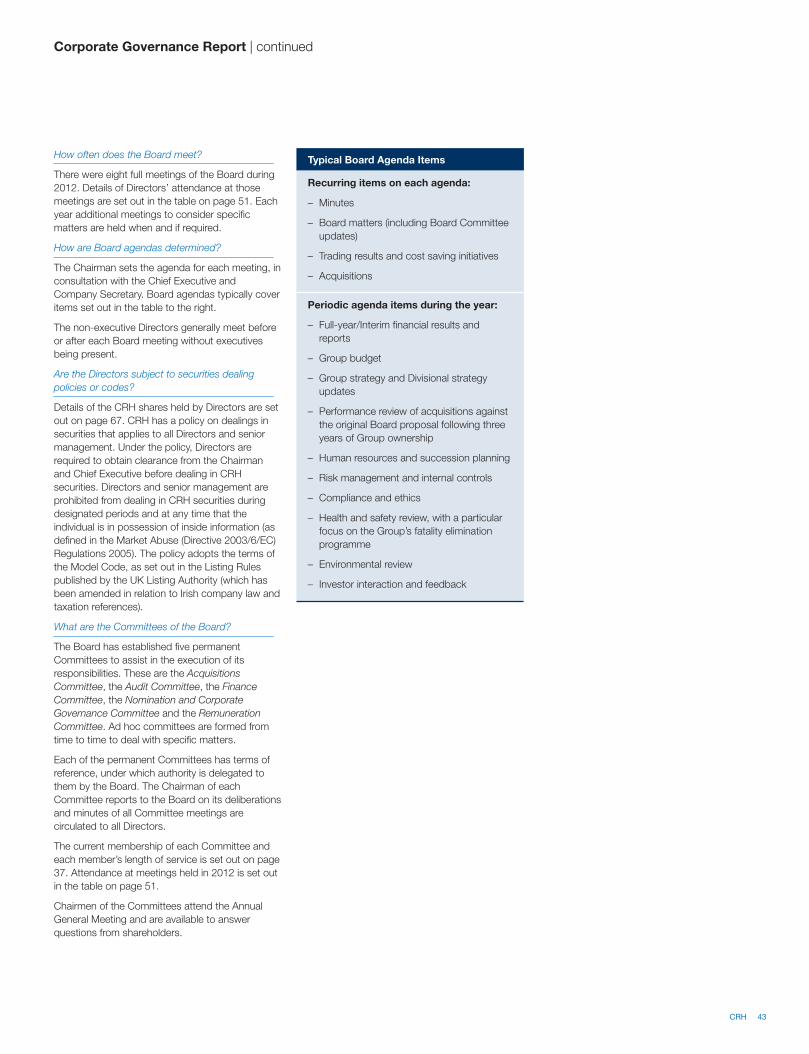
Corporate Governance Report | continued
How often does the Board meet?
There were eight full meetings of the Board during
2012. Details of Directors’ attendance at those
meetings are set out in the table on page 51. Each
year additional meetings to consider specific
matters are held when and if required.
How are Board agendas determined?
The Chairman sets the agenda for each meeting, in
consultation with the Chief Executive and
Company Secretary. Board agendas typically cover
items set out in the table to the right.
The non-executive Directors generally meet before
or after each Board meeting without executives
being present.
Are the Directors subject to securities dealing
policies or codes?
Details of the CRH shares held by Directors are set
out on page 67. CRH has a policy on dealings in
securities that applies to all Directors and senior
management. Under the policy, Directors are
required to obtain clearance from the Chairman
and Chief Executive before dealing in CRH
securities. Directors and senior management are
prohibited from dealing in CRH securities during
designated periods and at any time that the
individual is in possession of inside information (as
defined in the Market Abuse (Directive 2003/6/EC)
Regulations 2005). The policy adopts the terms of
the Model Code, as set out in the Listing Rules
published by the UK Listing Authority (which has
been amended in relation to Irish company law and
taxation references).
What are the Committees of the Board?
The Board has established five permanent
Committees to assist in the execution of its
responsibilities. These are the Acquisitions
Committee, the Audit Committee, the Finance
Committee, the Nomination and Corporate
Governance Committee and the Remuneration
Committee. Ad hoc committees are formed from
time to time to deal with specific matters.
Each of the permanent Committees has terms of
reference, under which authority is delegated to
them by the Board. The Chairman of each
Committee reports to the Board on its deliberations
and minutes of all Committee meetings are
circulated to all Directors.
The current membership of each Committee and
each member’s length of service is set out on page
37. Attendance at meetings held in 2012 is set out
in the table on page 51.
Chairmen of the Committees attend the Annual
General Meeting and are available to answer
questions from shareholders.
Typical Board Agenda Items
Recurring items on each agenda:
– Minutes
– Board matters (including Board Committee
updates)
– Trading results and cost saving initiatives
– Acquisitions
Periodic agenda items during the year:
– Full-year/Interim financial results and
reports
– Group budget
– Group strategy and Divisional strategy
updates
– Performance review of acquisitions against
the original Board proposal following three
years of Group ownership
– Human resources and succession planning
– Risk management and internal controls
– Compliance and ethics
– Health and safety review, with a particular
focus on the Group’s fatality elimination
programme
– Environmental review
– Investor interaction and feedback
CRH 43

44 CRH
The Audit Committee currently consists of
three non-executive Directors, considered by
the Board to be independent. As can be
seen from the biographical details on pages
36 and 37, the members of the Committee
bring to it experience and expertise from a
wide range of industries, including financial
services and sectors closely related to
building materials. The role and
responsibilities of the Committee are
summarised on page 46 along with the
typical calendar of meetings. I would like to
thank my colleagues on the Committee,
senior management and the auditors for their
significant commitment to the efficient and
effective operation of the Committee.
Ernst Bärtschi and Heather Ann McSharry
joined the Committee in March 2012. They
participated in an induction programme for
new Audit Committee members, details of
which are set out on page 42. Dan O’Connor
stepped down from the Committee on his
appointment as Senior Independent Director
in May 2012 and I would like to express my
sincere appreciation to Dan for his significant
contribution to the work of the Committee
since his appointment in 2006.
Ernst Bärtschi and I have been determined
by the Board to be the Committee’s financial
experts.
Review of Principal Activities in 2012
The Committee met nine times during the
course of 2012. The external auditors attend
the majority of Committee meetings and
report on any issues they believe should be
brought to the attention of the Committee; in
addition, they have direct access to me as
Chairman at all times. In 2012, the
Committee met with the Head of Internal
Audit and with the external auditors in the
absence of management.
Chairman’s overview
Audit Committee
Jan Maarten de Jong
Committee Chairman
Ernst Bärtschi
Heather Ann McSharry
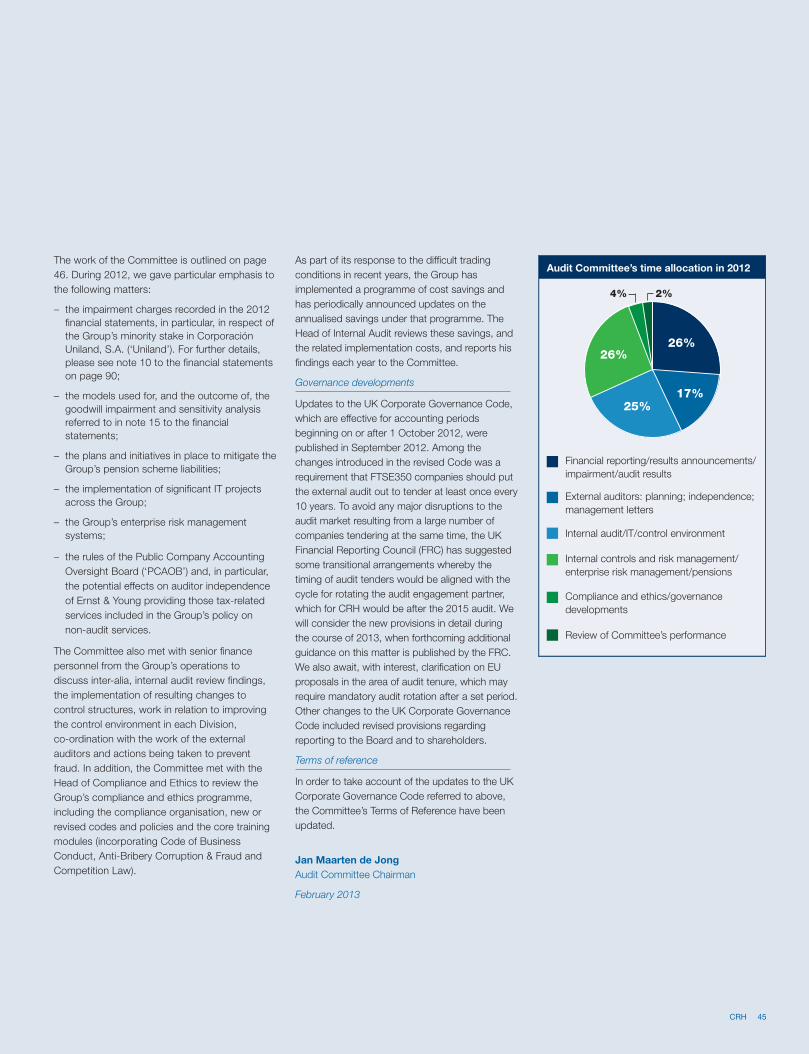
The work of the Committee is outlined on page
46. During 2012, we gave particular emphasis to
the following matters:
– the impairment charges recorded in the 2012
financial statements, in particular, in respect of
the Group’s minority stake in Corporación
Uniland, S.A. (‘Uniland’). For further details,
please see note 10 to the financial statements
on page 90;
– the models used for, and the outcome of, the
goodwill impairment and sensitivity analysis
referred to in note 15 to the financial
statements;
– the plans and initiatives in place to mitigate the
Group’s pension scheme liabilities;
– the implementation of significant IT projects
across the Group;
– the Group’s enterprise risk management
systems;
– the rules of the Public Company Accounting
Oversight Board (‘PCAOB’) and, in particular,
the potential effects on auditor independence
of Ernst & Young providing those tax-related
services included in the Group’s policy on
non-audit services.
The Committee also met with senior finance
personnel from the Group’s operations to
discuss inter-alia, internal audit review findings,
the implementation of resulting changes to
control structures, work in relation to improving
the control environment in each Division,
co-ordination with the work of the external
auditors and actions being taken to prevent
fraud. In addition, the Committee met with the
Head of Compliance and Ethics to review the
Group’s compliance and ethics programme,
including the compliance organisation, new or
revised codes and policies and the core training
modules (incorporating Code of Business
Conduct, Anti-Bribery Corruption & Fraud and
Competition Law).
As part of its response to the difficult trading
conditions in recent years, the Group has
implemented a programme of cost savings and
has periodically announced updates on the
annualised savings under that programme. The
Head of Internal Audit reviews these savings, and
the related implementation costs, and reports his
findings each year to the Committee.
Governance developments
Updates to the UK Corporate Governance Code,
which are effective for accounting periods
beginning on or after 1 October 2012, were
published in September 2012. Among the
changes introduced in the revised Code was a
requirement that FTSE350 companies should put
the external audit out to tender at least once every
10 years. To avoid any major disruptions to the
audit market resulting from a large number of
companies tendering at the same time, the UK
Financial Reporting Council (FRC) has suggested
some transitional arrangements whereby the
timing of audit tenders would be aligned with the
cycle for rotating the audit engagement partner,
which for CRH would be after the 2015 audit. We
will consider the new provisions in detail during
the course of 2013, when forthcoming additional
guidance on this matter is published by the FRC.
We also await, with interest, clarification on EU
proposals in the area of audit tenure, which may
require mandatory audit rotation after a set period.
Other changes to the UK Corporate Governance
Code included revised provisions regarding
reporting to the Board and to shareholders.
Terms of reference
In order to take account of the updates to the UK
Corporate Governance Code referred to above,
the Committee’s Terms of Reference have been
updated.
Jan Maarten de Jong
Audit Committee Chairman
February 2013
Audit Committee’s time allocation in 2012
26%
17%25%
26%
4% 2%
Financial reporting/results announcements/
impairment/audit results
External auditors: planning; independence;
management letters
Internal audit/IT/control environment
Internal controls and risk management/
enterprise risk management/pensions
Compliance and ethics/governance
developments
Review of Committee’s performance
CRH 45
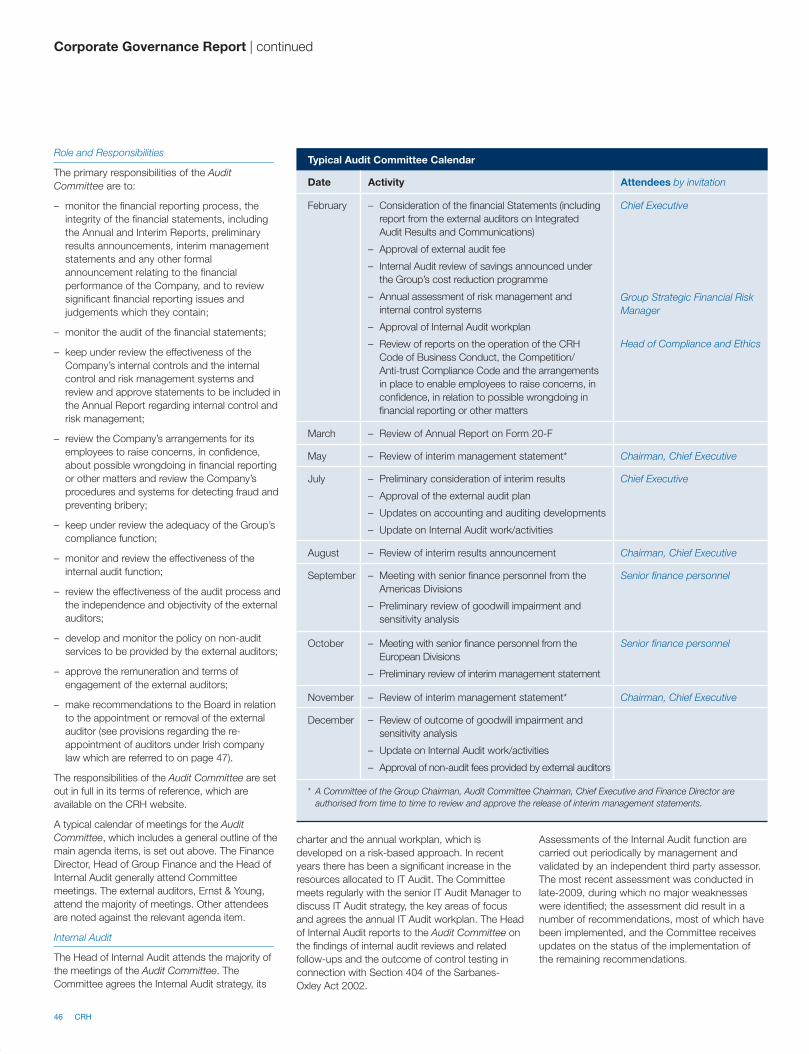
46 CRH
Role and Responsibilities
The primary responsibilities of the Audit
Committee are to:
– monitor the financial reporting process, the
integrity of the financial statements, including
the Annual and Interim Reports, preliminary
results announcements, interim management
statements and any other formal
announcement relating to the financial
performance of the Company, and to review
significant financial reporting issues and
judgements which they contain;
– monitor the audit of the financial statements;
– keep under review the effectiveness of the
Company’s internal controls and the internal
control and risk management systems and
review and approve statements to be included in
the Annual Report regarding internal control and
risk management;
– review the Company’s arrangements for its
employees to raise concerns, in confidence,
about possible wrongdoing in financial reporting
or other matters and review the Company’s
procedures and systems for detecting fraud and
preventing bribery;
– keep under review the adequacy of the Group’s
compliance function;
– monitor and review the effectiveness of the
internal audit function;
– review the effectiveness of the audit process and
the independence and objectivity of the external
auditors;
– develop and monitor the policy on non-audit
services to be provided by the external auditors;
– approve the remuneration and terms of
engagement of the external auditors;
– make recommendations to the Board in relation
to the appointment or removal of the external
auditor (see provisions regarding the re-
appointment of auditors under Irish company
law which are referred to on page 47).
The responsibilities of the Audit Committee are set
out in full in its terms of reference, which are
available on the CRH website.
A typical calendar of meetings for the Audit
Committee, which includes a general outline of the
main agenda items, is set out above. The Finance
Director, Head of Group Finance and the Head of
Internal Audit generally attend Committee
meetings. The external auditors, Ernst & Young,
attend the majority of meetings. Other attendees
are noted against the relevant agenda item.
Internal Audit
The Head of Internal Audit attends the majority of
the meetings of the Audit Committee. The
Committee agrees the Internal Audit strategy, its
charter and the annual workplan, which is
developed on a risk-based approach. In recent
years there has been a significant increase in the
resources allocated to IT Audit. The Committee
meets regularly with the senior IT Audit Manager to
discuss IT Audit strategy, the key areas of focus
and agrees the annual IT Audit workplan. The Head
of Internal Audit reports to the Audit Committee on
the findings of internal audit reviews and related
follow-ups and the outcome of control testing in
connection with Section 404 of the Sarbanes-
Oxley Act 2002.
Assessments of the Internal Audit function are
carried out periodically by management and
validated by an independent third party assessor.
The most recent assessment was conducted in
late-2009, during which no major weaknesses
were identified; the assessment did result in a
number of recommendations, most of which have
been implemented, and the Committee receives
updates on the status of the implementation of
the remaining recommendations.
Typical Audit Committee Calendar
Date Activity Attendees by invitation
February – Consideration of the financial Statements (including
report from the external auditors on Integrated
Audit Results and Communications)
– Approval of external audit fee
– Internal Audit review of savings announced under
the Group’s cost reduction programme
– Annual assessment of risk management and
internal control systems
– Approval of Internal Audit workplan
– Review of reports on the operation of the CRH
Code of Business Conduct, the Competition/
Anti-trust Compliance Code and the arrangements
in place to enable employees to raise concerns, in
confidence, in relation to possible wrongdoing in
financial reporting or other matters
Chief Executive
Group Strategic Financial Risk
Manager
Head of Compliance and Ethics
March – Review of Annual Report on Form 20-F
May – Review of interim management statement* Chairman, Chief Executive
July – Preliminary consideration of interim results
– Approval of the external audit plan
– Updates on accounting and auditing developments
– Update on Internal Audit work/activities
Chief Executive
August – Review of interim results announcement Chairman, Chief Executive
September – Meeting with senior finance personnel from the
Americas Divisions
– Preliminary review of goodwill impairment and
sensitivity analysis
Senior finance personnel
October – Meeting with senior finance personnel from the
European Divisions
– Preliminary review of interim management statement
Senior finance personnel
November – Review of interim management statement* Chairman, Chief Executive
December – Review of outcome of goodwill impairment and
sensitivity analysis
– Update on Internal Audit work/activities
– Approval of non-audit fees provided by external auditors
* A Committee of the Group Chairman, Audit Committee Chairman, Chief Executive and Finance Director are
authorised from time to time to review and approve the release of interim management statements.
Corporate Governance Report | continued
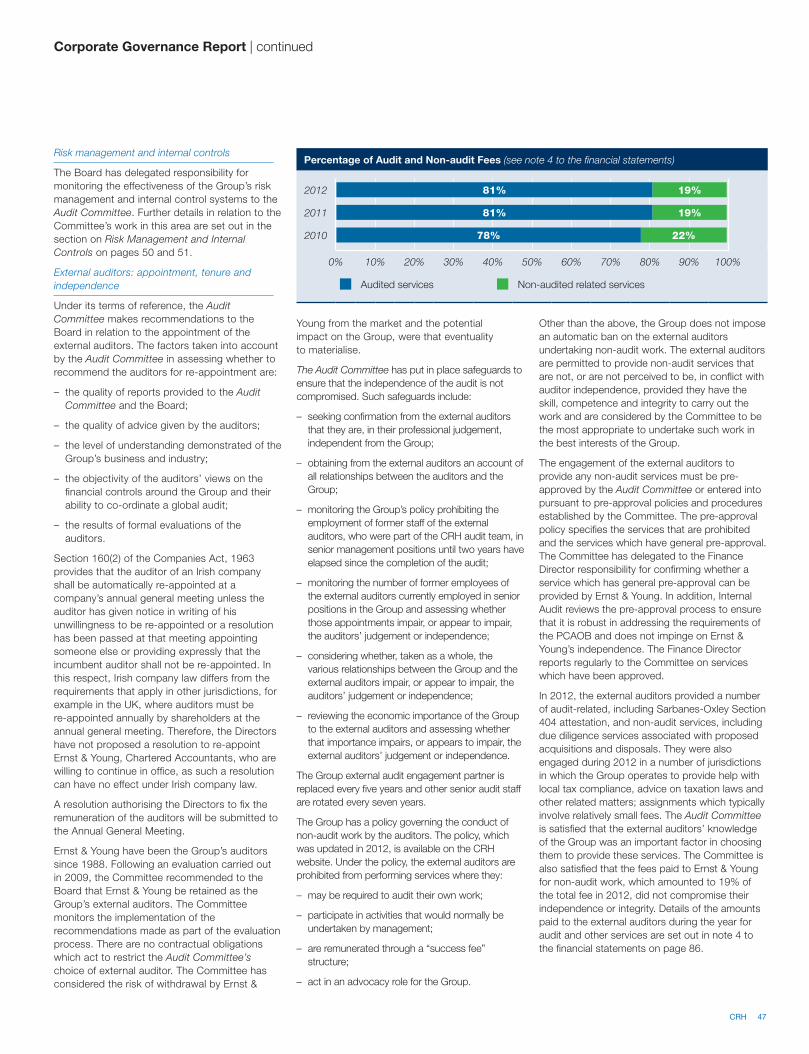
Risk management and internal controls
The Board has delegated responsibility for
monitoring the effectiveness of the Group’s risk
management and internal control systems to the
Audit Committee. Further details in relation to the
Committee’s work in this area are set out in the
section on Risk Management and Internal
Controls on pages 50 and 51.
External auditors: appointment, tenure and
independence
Under its terms of reference, the Audit
Committee makes recommendations to the
Board in relation to the appointment of the
external auditors. The factors taken into account
by the Audit Committee in assessing whether to
recommend the auditors for re-appointment are:
– the quality of reports provided to the Audit
Committee and the Board;
– the quality of advice given by the auditors;
– the level of understanding demonstrated of the
Group’s business and industry;
– the objectivity of the auditors’ views on the
financial controls around the Group and their
ability to co-ordinate a global audit;
– the results of formal evaluations of the
auditors.
Section 160(2) of the Companies Act, 1963
provides that the auditor of an Irish company
shall be automatically re-appointed at a
company’s annual general meeting unless the
auditor has given notice in writing of his
unwillingness to be re-appointed or a resolution
has been passed at that meeting appointing
someone else or providing expressly that the
incumbent auditor shall not be re-appointed. In
this respect, Irish company law differs from the
requirements that apply in other jurisdictions, for
example in the UK, where auditors must be
re-appointed annually by shareholders at the
annual general meeting. Therefore, the Directors
have not proposed a resolution to re-appoint
Ernst & Young, Chartered Accountants, who are
willing to continue in office, as such a resolution
can have no effect under Irish company law.
A resolution authorising the Directors to fix the
remuneration of the auditors will be submitted to
the Annual General Meeting.
Ernst & Young have been the Group’s auditors
since 1988. Following an evaluation carried out
in 2009, the Committee recommended to the
Board that Ernst & Young be retained as the
Group’s external auditors. The Committee
monitors the implementation of the
recommendations made as part of the evaluation
process. There are no contractual obligations
which act to restrict the Audit Committee’s
choice of external auditor. The Committee has
considered the risk of withdrawal by Ernst &
Young from the market and the potential
impact on the Group, were that eventuality
to materialise.
The Audit Committee has put in place safeguards to
ensure that the independence of the audit is not
compromised. Such safeguards include:
– seeking confirmation from the external auditors
that they are, in their professional judgement,
independent from the Group;
– obtaining from the external auditors an account of
all relationships between the auditors and the
Group;
– monitoring the Group’s policy prohibiting the
employment of former staff of the external
auditors, who were part of the CRH audit team, in
senior management positions until two years have
elapsed since the completion of the audit;
– monitoring the number of former employees of
the external auditors currently employed in senior
positions in the Group and assessing whether
those appointments impair, or appear to impair,
the auditors’ judgement or independence;
– considering whether, taken as a whole, the
various relationships between the Group and the
external auditors impair, or appear to impair, the
auditors’ judgement or independence;
– reviewing the economic importance of the Group
to the external auditors and assessing whether
that importance impairs, or appears to impair, the
external auditors’ judgement or independence.
The Group external audit engagement partner is
replaced every five years and other senior audit staff
are rotated every seven years.
The Group has a policy governing the conduct of
non-audit work by the auditors. The policy, which
was updated in 2012, is available on the CRH
website. Under the policy, the external auditors are
prohibited from performing services where they:
– may be required to audit their own work;
– participate in activities that would normally be
undertaken by management;
– are remunerated through a “success fee”
structure;
– act in an advocacy role for the Group.
Other than the above, the Group does not impose
an automatic ban on the external auditors
undertaking non-audit work. The external auditors
are permitted to provide non-audit services that
are not, or are not perceived to be, in conflict with
auditor independence, provided they have the
skill, competence and integrity to carry out the
work and are considered by the Committee to be
the most appropriate to undertake such work in
the best interests of the Group.
The engagement of the external auditors to
provide any non-audit services must be pre-
approved by the Audit Committee or entered into
pursuant to pre-approval policies and procedures
established by the Committee. The pre-approval
policy specifies the services that are prohibited
and the services which have general pre-approval.
The Committee has delegated to the Finance
Director responsibility for confirming whether a
service which has general pre-approval can be
provided by Ernst & Young. In addition, Internal
Audit reviews the pre-approval process to ensure
that it is robust in addressing the requirements of
the PCAOB and does not impinge on Ernst &
Young’s independence. The Finance Director
reports regularly to the Committee on services
which have been approved.
In 2012, the external auditors provided a number
of audit-related, including Sarbanes-Oxley Section
404 attestation, and non-audit services, including
due diligence services associated with proposed
acquisitions and disposals. They were also
engaged during 2012 in a number of jurisdictions
in which the Group operates to provide help with
local tax compliance, advice on taxation laws and
other related matters; assignments which typically
involve relatively small fees. The Audit Committee
is satisfied that the external auditors’ knowledge
of the Group was an important factor in choosing
them to provide these services. The Committee is
also satisfied that the fees paid to Ernst & Young
for non-audit work, which amounted to 19% of
the total fee in 2012, did not compromise their
independence or integrity. Details of the amounts
paid to the external auditors during the year for
audit and other services are set out in note 4 to
the financial statements on page 86.
Corporate Governance Report | continued
Percentage of Audit and Non-audit Fees (see note 4 to the financial statements)
2012 81% 19%
2011 81% 19%
2010 78% 22%
0% 10% 20% 30% 40% 50% 60% 70% 80% 90% 100%
Audited services Non-audited related services
CRH 47

48 CRH
The Nomination and Corporate Governance
Committee consists of four non-executive
Directors, all of whom are considered by the Board
to be independent. Our primary responsibilities are
to assist the Board in relation to the composition of
the Board and its Committees, ensuring phased
renewal and refreshment and overseeing
succession planning for the Board and for senior
management. To facilitate the search for suitable
candidates to serve as non-executive Directors, the
Committee uses the services of independent
consultants. When prospective candidates have
been identified, each member of the Committee
meets with them. In addition, we keep corporate
governance developments under review and make
recommendations to the Board when action is
required. We consult the Chief Executive on issues
considered by the Committee and he is invited to
attend meetings of the Committee, when
appropriate.
Further details regarding the operation of the
Committee are set out in the Role and
Responsibilities section on page 50.
In the past 12 months, we have allocated our time
broadly as set out in the panel opposite.
As reported in the 2011 Corporate Governance
Report, the Committee recommended to the Board
that Heather Ann McSharry be appointed as a
non-executive Director in February 2012 and the
Committee led the process which resulted in my
appointment as Chairman in May 2012.
During the remainder of 2012 and in the year to
date, we have continued to work with various
recruitment agencies in relation to the ongoing
process of Board renewal and refreshment.
Bill Egan and Jan Maarten de Jong were appointed
to the Board in 2007 and 2004 respectively.
Following a comprehensive performance review, on
the recommendation of the Committee, the Board
has asked Bill to continue on the Board for a third
three year term and Jan Maarten has been asked
to serve a further period of one year, with the
position to be reviewed in 2014.
Jan Maarten de Jong joined the Audit Committee
in 2004 and has acted as its Chairman since 2007.
Chairman’s overview
Nomination and Corporate
Governance Committee
John Kennedy
Bill Egan
Dan O’Connor
Nicky Hartery
Committee Chairman
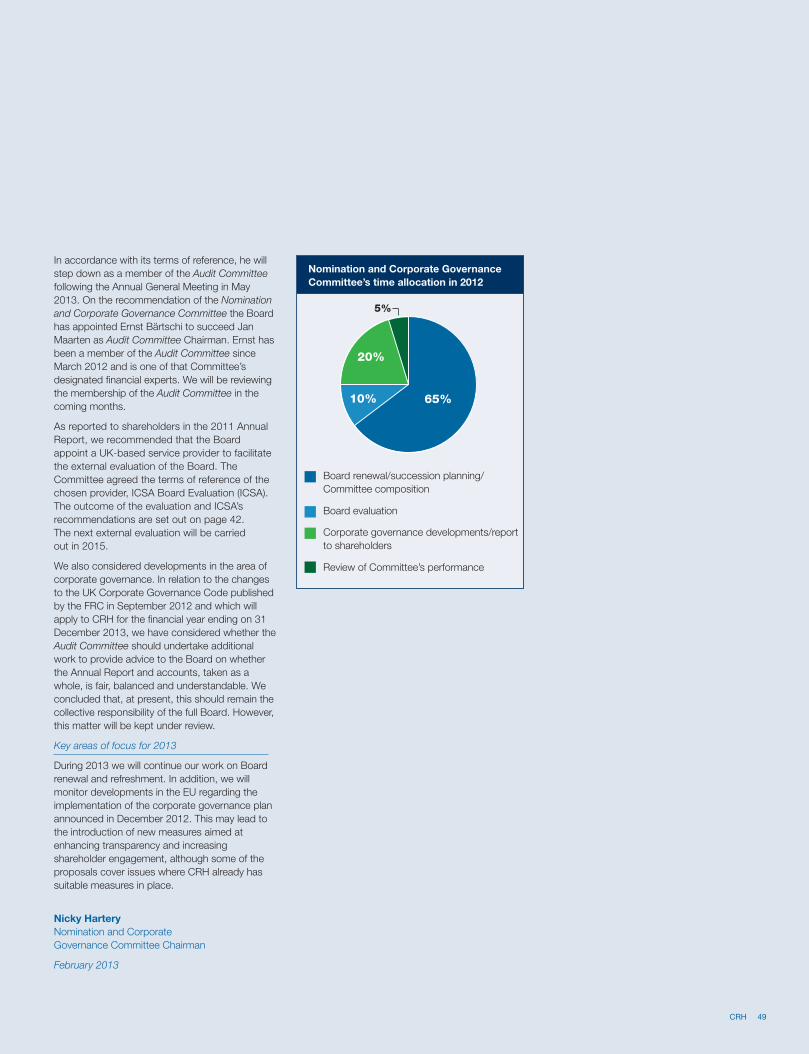
In accordance with its terms of reference, he will
step down as a member of the Audit Committee
following the Annual General Meeting in May
2013. On the recommendation of the Nomination
and Corporate Governance Committee the Board
has appointed Ernst Bärtschi to succeed Jan
Maarten as Audit Committee Chairman. Ernst has
been a member of the Audit Committee since
March 2012 and is one of that Committee’s
designated financial experts. We will be reviewing
the membership of the Audit Committee in the
coming months.
As reported to shareholders in the 2011 Annual
Report, we recommended that the Board
appoint a UK-based service provider to facilitate
the external evaluation of the Board. The
Committee agreed the terms of reference of the
chosen provider, ICSA Board Evaluation (ICSA).
The outcome of the evaluation and ICSA’s
recommendations are set out on page 42.
The next external evaluation will be carried
out in 2015.
We also considered developments in the area of
corporate governance. In relation to the changes
to the UK Corporate Governance Code published
by the FRC in September 2012 and which will
apply to CRH for the financial year ending on 31
December 2013, we have considered whether the
Audit Committee should undertake additional
work to provide advice to the Board on whether
the Annual Report and accounts, taken as a
whole, is fair, balanced and understandable. We
concluded that, at present, this should remain the
collective responsibility of the full Board. However,
this matter will be kept under review.
Key areas of focus for 2013
During 2013 we will continue our work on Board
renewal and refreshment. In addition, we will
monitor developments in the EU regarding the
implementation of the corporate governance plan
announced in December 2012. This may lead to
the introduction of new measures aimed at
enhancing transparency and increasing
shareholder engagement, although some of the
proposals cover issues where CRH already has
suitable measures in place.
Nicky Hartery
Nomination and Corporate
Governance Committee Chairman
February 2013
Nomination and Corporate Governance
Committee’s time allocation in 2012
65%10%
20%
Board renewal/succession planning/
Committee composition
Board evaluation
Corporate governance developments/report
to shareholders
Review of Committee’s performance
5%
CRH 49
50 CRH
Corporate Governance Report | continued
Role and Responsibilities
Under its terms of reference, the Nomination
and Corporate Governance Committee is
responsible for:
– regularly reviewing the size, structure and
composition (including skills, knowledge,
experience and diversity) of the Board and
making recommendations to the Board
regarding any changes;
– giving consideration to succession planning for
Directors and senior executives;
– identifying and recommending candidates to fill
Board vacancies;
– in respect of the appointment of a chairman,
preparing a job specification including the time
commitment expected;
– keeping under review the leadership needs of
the organisation;
– approving the terms of reference for external
board evaluations;
– keeping under review corporate governance
developments with the aim of ensuring that
CRH’s governance policies and practices
continue to be in line with best practice;
– ensuring that the principles and provisions set
out in the UK Code (and any other governance
code that applies to the Company) are
observed;
– reviewing the disclosures and statements made
in the Corporate Governance Report to
shareholders.
The Committee reviewed its terms of reference in
December 2012 and proposed minor updating
amendments, which the Board approved.
The factors taken into account by the Nomination
and Corporate Governance Committee in
considering the composition of the Board are set
out in the policy for Board renewal which is
detailed on page 41. The Committee establishes
processes for the identification of suitable
candidates for appointment to the Board and
oversees succession planning for the Board and
senior management.
As referred to in the section dealing with the
independence of non-executive Directors on page
41, each year the Committee reviews details of
the non-CRH directorships of each Director,
including any relationship between those
companies and the Group. The Committee also
reviews any business relationships between
individual Board members.
Remuneration Committee
The Report on Directors’ Remuneration on page 54
contains an overview of the operation of the
Remuneration Committee from Committee
Chairman Dan O’Connor.
Role and Responsibilities
Under its terms of reference, the Remuneration
Committee must be made up of at least three
members, all of whom must be independent
non-executive Directors. Members of the Committee
can serve for up to a maximum of three terms of
three years. The CRH Chairman may be a member
of the Committee provided his/her tenure on the
Board does not exceed 12 years. Only members of
the Committee have the right to attend Committee
meetings. However, other individuals such as the
Chairman, if not a member of the Committee, the
Chief Executive, the Group Human Resources
Director and external advisers may be invited to
attend for all or part of any meeting as and when
appropriate. The Chief Executive is fully consulted
about remuneration proposals.
The primary responsibilities of the Remuneration
Committee are as follows:
– to determine and agree with the Board the
remuneration policy for the Chairman and
executive Directors having regard to remuneration
trends across the Group;
– to recommend and monitor the level and
structure of remuneration for senior management;
– within the terms of the agreed policy and in
consultation with the Chairman and/or Chief
Executive, as appropriate, to determine the total
remuneration package of the Chairman and each
executive Director, including bonuses, incentive
payments and share options or other share
awards;
– to approve the design of, and the targets and
level of awards made under, the Group’s
performance-related incentive plans;
– to review the design of all share incentive plans
for approval by the Board and shareholders;
– to approve the vesting levels for share scheme
awards;
– to oversee any major changes to employee
benefit structures;
– to authorise the release of deferred share awards;
– to determine the policy for pension arrangements
for executive Directors and senior management;
– to establish the criteria for selecting, appointing
and setting the terms of reference of remuneration
consultants that advise the Committee.
The Committee reviewed its terms of reference in
December 2012 and proposed minor updating
amendments, which the Board approved.
Acquisitions Committee
The Acquisitions Committee has been delegated
authority by the Board to approve acquisitions,
divestments and capital expenditure projects
within certain limits.
Finance Committee
The Finance Committee is responsible for:
– advising the Board on the financial requirements
of the Group and on appropriate funding
arrangements;
– considering and making recommendations to
the Board in relation to the issue and buy-back
of shares and debt instruments and to the
Group’s financing arrangements;
– considering and making recommendations to
the Board in relation to dividend levels on the
Ordinary shares;
– keeping the Board advised of the financial
implications of Board decisions in relation to
acquisitions;
– assisting management, at their request, in
considering any financial or taxation aspect of
the Group’s affairs;
– reviewing the Group’s insurance arrangements.
Risk Management and Internal Control
The Board has delegated responsibility for the
monitoring of the effectiveness of the Group’s risk
management and internal control systems to the
Audit Committee¹. Such systems are designed to
manage rather than eliminate the risk of failure to
achieve business objectives and, in the case of
internal control systems, can provide only reasonable
and not absolute assurance against material
misstatement or loss.
The consolidated financial statements are prepared
subject to the oversight and control of the Finance
Director, ensuring correct data is captured from
Group locations and all required information for
disclosure in the consolidated financial statements is
provided. An appropriate control framework has
been put in place around the recording of
appropriate eliminating journals and other
adjustments. The consolidated financial statements
are reviewed by the CRH Financial Review and
Disclosure Group prior to being reviewed by the
Audit Committee and approved by the Board of
Directors. The Directors confirm that the Group’s
ongoing process for identifying, evaluating and
managing its principal risks and uncertainties (as
outlined in the Directors’ Report on pages 68 and 69)
is in accordance with the updated Turnbull guidance
(Internal Control: Revised Guidance for Directors on
the Combined Code) published in October 2005.
The process has been in place throughout the
accounting period and up to the date of approval of
the Annual Report and financial statements.
¹ In accordance with Section 91(6)(b) of the
EC (Directive 2006/43) Regulations 2010
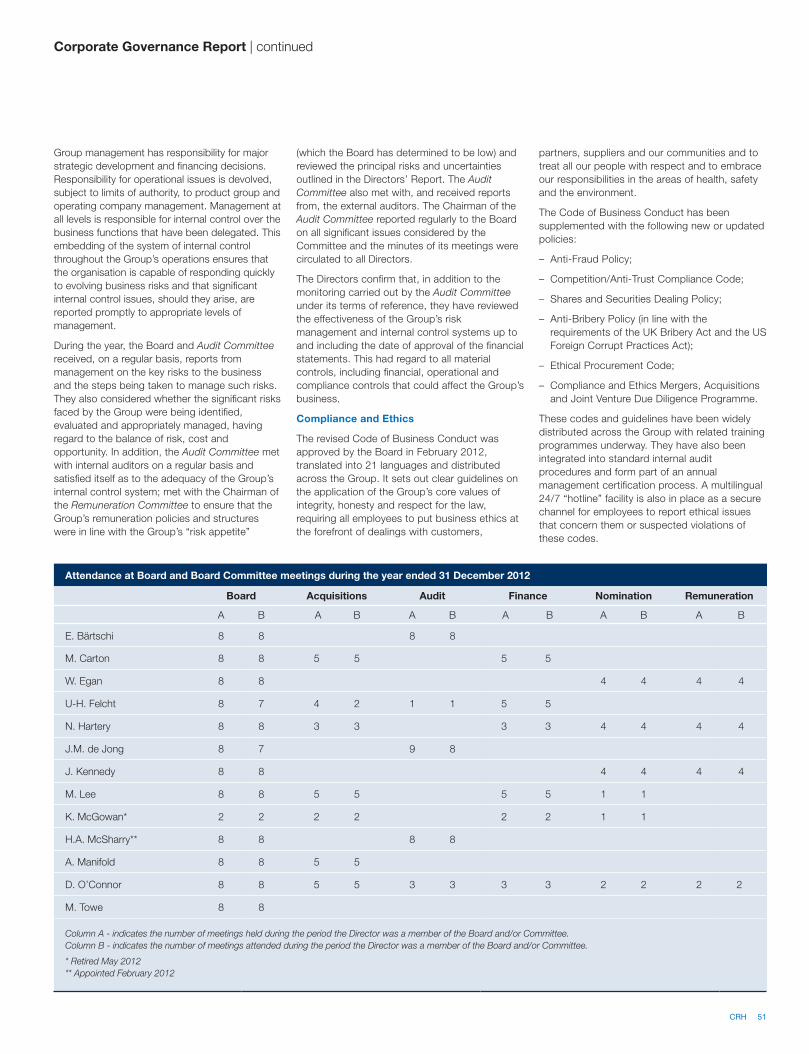
Attendance at Board and Board Committee meetings during the year ended 31 December 2012
Board Acquisitions Audit Finance Nomination Remuneration
A B A B A B A B A B A B
E. Bärtschi 8 8 8 8
M. Carton 8 8 5 5 5 5
W. Egan 8 8 4 4 4 4
U-H. Felcht 8 7 4 2 1 1 5 5
N. Hartery 8 8 3 3 3 3 4 4 4 4
J.M. de Jong 8 7 9 8
J. Kennedy 8 8 4 4 4 4
M. Lee 8 8 5 5 5 5 1 1
K. McGowan* 2 2 2 2 2 2 1 1
H.A. McSharry** 8 8 8 8
A. Manifold 8 8 5 5
D. O’Connor 8 8 5 5 3 3 3 3 2 2 2 2
M. Towe 8 8
Column A - indicates the number of meetings held during the period the Director was a member of the Board and/or Committee.
Column B - indicates the number of meetings attended during the period the Director was a member of the Board and/or Committee.
* Retired May 2012
** Appointed February 2012
Group management has responsibility for major
strategic development and financing decisions.
Responsibility for operational issues is devolved,
subject to limits of authority, to product group and
operating company management. Management at
all levels is responsible for internal control over the
business functions that have been delegated. This
embedding of the system of internal control
throughout the Group’s operations ensures that
the organisation is capable of responding quickly
to evolving business risks and that significant
internal control issues, should they arise, are
reported promptly to appropriate levels of
management.
During the year, the Board and Audit Committee
received, on a regular basis, reports from
management on the key risks to the business
and the steps being taken to manage such risks.
They also considered whether the significant risks
faced by the Group were being identified,
evaluated and appropriately managed, having
regard to the balance of risk, cost and
opportunity. In addition, the Audit Committee met
with internal auditors on a regular basis and
satisfied itself as to the adequacy of the Group’s
internal control system; met with the Chairman of
the Remuneration Committee to ensure that the
Group’s remuneration policies and structures
were in line with the Group’s “risk appetite”
(which the Board has determined to be low) and
reviewed the principal risks and uncertainties
outlined in the Directors’ Report. The Audit
Committee also met with, and received reports
from, the external auditors. The Chairman of the
Audit Committee reported regularly to the Board
on all significant issues considered by the
Committee and the minutes of its meetings were
circulated to all Directors.
The Directors confirm that, in addition to the
monitoring carried out by the Audit Committee
under its terms of reference, they have reviewed
the effectiveness of the Group’s risk
management and internal control systems up to
and including the date of approval of the financial
statements. This had regard to all material
controls, including financial, operational and
compliance controls that could affect the Group’s
business.
Compliance and Ethics
The revised Code of Business Conduct was
approved by the Board in February 2012,
translated into 21 languages and distributed
across the Group. It sets out clear guidelines on
the application of the Group’s core values of
integrity, honesty and respect for the law,
requiring all employees to put business ethics at
the forefront of dealings with customers,
partners, suppliers and our communities and to
treat all our people with respect and to embrace
our responsibilities in the areas of health, safety
and the environment.
The Code of Business Conduct has been
supplemented with the following new or updated
policies:
– Anti-Fraud Policy;
– Competition/Anti-Trust Compliance Code;
– Shares and Securities Dealing Policy;
– Anti-Bribery Policy (in line with the
requirements of the UK Bribery Act and the US
Foreign Corrupt Practices Act);
– Ethical Procurement Code;
– Compliance and Ethics Mergers, Acquisitions
and Joint Venture Due Diligence Programme.
These codes and guidelines have been widely
distributed across the Group with related training
programmes underway. They have also been
integrated into standard internal audit
procedures and form part of an annual
management certification process. A multilingual
24/7 “hotline” facility is also in place as a secure
channel for employees to report ethical issues
that concern them or suspected violations of
these codes.
Corporate Governance Report | continued
CRH 51
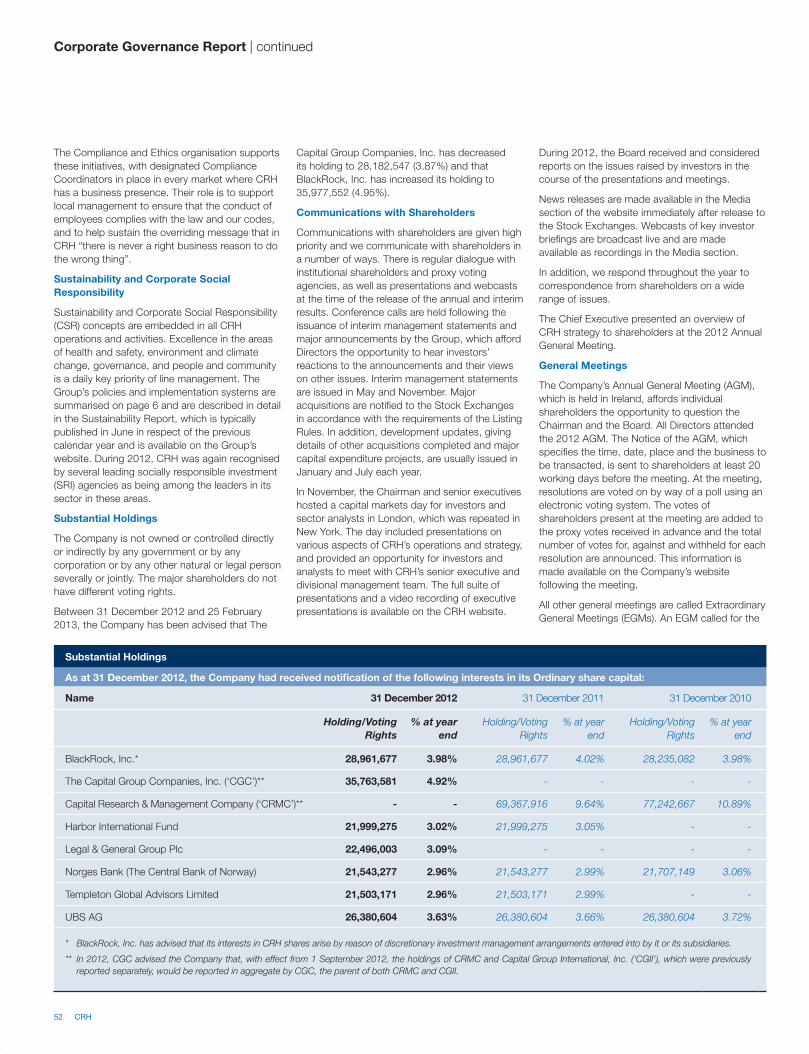
52 CRH
Corporate Governance Report | continued
The Compliance and Ethics organisation supports
these initiatives, with designated Compliance
Coordinators in place in every market where CRH
has a business presence. Their role is to support
local management to ensure that the conduct of
employees complies with the law and our codes,
and to help sustain the overriding message that in
CRH “there is never a right business reason to do
the wrong thing”.
Sustainability and Corporate Social
Responsibility
Sustainability and Corporate Social Responsibility
(CSR) concepts are embedded in all CRH
operations and activities. Excellence in the areas
of health and safety, environment and climate
change, governance, and people and community
is a daily key priority of line management. The
Group’s policies and implementation systems are
summarised on page 6 and are described in detail
in the Sustainability Report, which is typically
published in June in respect of the previous
calendar year and is available on the Group’s
website. During 2012, CRH was again recognised
by several leading socially responsible investment
(SRI) agencies as being among the leaders in its
sector in these areas.
Substantial Holdings
The Company is not owned or controlled directly
or indirectly by any government or by any
corporation or by any other natural or legal person
severally or jointly. The major shareholders do not
have different voting rights.
Between 31 December 2012 and 25 February
2013, the Company has been advised that The
Capital Group Companies, Inc. has decreased
its holding to 28,182,547 (3.87%) and that
BlackRock, Inc. has increased its holding to
35,977,552 (4.95%).
Communications with Shareholders
Communications with shareholders are given high
priority and we communicate with shareholders in
a number of ways. There is regular dialogue with
institutional shareholders and proxy voting
agencies, as well as presentations and webcasts
at the time of the release of the annual and interim
results. Conference calls are held following the
issuance of interim management statements and
major announcements by the Group, which afford
Directors the opportunity to hear investors’
reactions to the announcements and their views
on other issues. Interim management statements
are issued in May and November. Major
acquisitions are notified to the Stock Exchanges
in accordance with the requirements of the Listing
Rules. In addition, development updates, giving
details of other acquisitions completed and major
capital expenditure projects, are usually issued in
January and July each year.
In November, the Chairman and senior executives
hosted a capital markets day for investors and
sector analysts in London, which was repeated in
New York. The day included presentations on
various aspects of CRH’s operations and strategy,
and provided an opportunity for investors and
analysts to meet with CRH’s senior executive and
divisional management team. The full suite of
presentations and a video recording of executive
presentations is available on the CRH website.
During 2012, the Board received and considered
reports on the issues raised by investors in the
course of the presentations and meetings.
News releases are made available in the Media
section of the website immediately after release to
the Stock Exchanges. Webcasts of key investor
briefings are broadcast live and are made
available as recordings in the Media section.
In addition, we respond throughout the year to
correspondence from shareholders on a wide
range of issues.
The Chief Executive presented an overview of
CRH strategy to shareholders at the 2012 Annual
General Meeting.
General Meetings
The Company’s Annual General Meeting (AGM),
which is held in Ireland, affords individual
shareholders the opportunity to question the
Chairman and the Board. All Directors attended
the 2012 AGM. The Notice of the AGM, which
specifies the time, date, place and the business to
be transacted, is sent to shareholders at least 20
working days before the meeting. At the meeting,
resolutions are voted on by way of a poll using an
electronic voting system. The votes of
shareholders present at the meeting are added to
the proxy votes received in advance and the total
number of votes for, against and withheld for each
resolution are announced. This information is
made available on the Company’s website
following the meeting.
All other general meetings are called Extraordinary
General Meetings (EGMs). An EGM called for the
Substantial Holdings
As at 31 December 2012, the Company had received notification of the following interests in its Ordinary share capital:
Name 31 December 2012 31 December 2011 31 December 2010
Holding/Voting Rights
% at year end
Holding/Voting
Rights
% at year
end
Holding/Voting
Rights
% at year
end
BlackRock, Inc.* 28,961,677 3.98% 28,961,677 4.02% 28,235,082 3.98%
The Capital Group Companies, Inc. (‘CGC’)** 35,763,581 4.92% - - - -
Capital Research & Management Company (‘CRMC’)** - - 69,367,916 9.64% 77,242,667 10.89%
Harbor International Fund 21,999,275 3.02% 21,999,275 3.05% - -
Legal & General Group Plc 22,496,003 3.09% - - - -
Norges Bank (The Central Bank of Norway) 21,543,277 2.96% 21,543,277 2.99% 21,707,149 3.06%
Templeton Global Advisors Limited 21,503,171 2.96% 21,503,171 2.99% - -
UBS AG 26,380,604 3.63% 26,380,604 3.66% 26,380,604 3.72%
* BlackRock, Inc. has advised that its interests in CRH shares arise by reason of discretionary investment management arrangements entered into by it or its subsidiaries.
** In 2012, CGC advised the Company that, with effect from 1 September 2012, the holdings of CRMC and Capital Group International, Inc. (‘CGII’), which were previously
reported separately, would be reported in aggregate by CGC, the parent of both CRMC and CGII.
passing of a special resolution must be called by
at least 21 clear days’ notice.
A quorum for a general meeting of the Company
is constituted by five or more shareholders
present in person and entitled to vote. The
passing of resolutions at a meeting of the
Company, other than special resolutions, requires
a simple majority. To be passed, a special
resolution requires a majority of at least 75% of
the votes cast.
Shareholders have the right to attend, speak, ask
questions and vote at general meetings. In
accordance with Irish company law, the Company
specifies record dates for general meetings, by
which date shareholders must be registered in the
Register of Members of the Company to be
entitled to attend. Record dates are specified in
the notes to the Notice of a general meeting.
Shareholders may exercise their right to vote by
appointing a proxy/proxies, by electronic means
or in writing, to vote some or all of their shares.
The requirements for the receipt of valid proxy
forms are set out in the notes to the Notice
convening the meeting and in the notes on the
proxy form. A shareholder, or a group of
shareholders, holding at least 5% of the issued
share capital of the Company, has the right to
requisition a general meeting. A shareholder, or a
group of shareholders, holding at least 3% of the
issued share capital of the Company, has the right
to put an item on the agenda of an AGM or to
table a draft resolution for inclusion in the agenda
of a general meeting, subject to any contrary
provision in Irish company law.
Memorandum and Articles of Association
The Company’s Memorandum of Association sets
out the objects and powers of the Company. The
Articles of Association detail the rights attaching to
each share class; the method by which the
Company’s shares can be purchased or re-issued
and the provisions which apply to the holding of and
voting at general meetings. Details of transactions in
the Company’s own shares are included on pages
69 and 70 of the Directors’ Report.
The Articles of Association also set out the rules
relating to Directors, including their appointment,
retirement, re-election, duties and powers. The
Articles provide that no person other than a
Director retiring at the meeting shall, unless
recommended by the Directors, be eligible for
election to the office of Director at any General
Meeting unless not less than seven nor more than
21 days before the day appointed for the meeting
there shall have been left at the registered office
notice in writing, signed by a member duly
qualified to attend and vote at the meeting for
which such notice is given, of his intention to
propose such person for election and also notice
in writing signed by that person of his willingness
to be elected. The Articles also require that the
qualification of a Director shall be the holding
alone and not jointly with any other person of
1,000 Ordinary Shares in the capital of the
Company. A Director may act before acquiring his
qualification but must acquire the shares within
two months of his/her appointment or election.
Going Concern
The Company’s business activities, together with
the factors likely to affect its future development,
performance and position are set out in the Chief
Executive’s Review and in the Directors’ Report
on pages 13 to 15 and pages 68 to 70. The
financial position of the Company, its cash flows,
liquidity position and borrowing facilities are
described in the Finance Review on pages 17 to
19. In addition, notes 21 to 25 to the financial
statements include the Company’s objectives,
policies and processes for managing its capital;
its financial risk management objectives; details of
its financial instruments and hedging activities;
and its exposures to credit, currency and liquidity
risks.
The Company has considerable financial
resources and a large number of customers and
suppliers across different geographic areas and
industries. In addition, the local nature of building
materials means that the Group’s products are not
usually shipped cross-border.
Having assessed the relevant business risks, the
Directors believe that the Company is well placed
to manage these risks successfully and have a
reasonable expectation that the Company, and
the Group as a whole, have adequate resources
to continue in operational existence for the
foreseeable future. For this reason, they continue
to adopt the going concern basis in preparing the
financial statements.
Compliance Statement
In the period under review, CRH complied with
the provisions of the 2010 UK Corporate
Governance Code. The Company also complied
with the rules issued by the United States
Securities and Exchange Commission to
implement the Sarbanes-Oxley Act 2002, in
so far as they apply to the Group.
Documents Available on Website
The following are available on the CRH website, www.crh.com:
Corporate Governance section:
– Terms of reference of Acquisitions Committee (amended December 2010)
– Terms of reference of Audit Committee (amended December 2012)
– Terms of reference of Finance Committee (amended February 2004)
– Terms of reference of Nomination and Corporate Governance Committee (amended December 2012)
– Terms of reference of Remuneration Committee (amended December 2012)
– The Memorandum and Articles of Association of the Company
– Pre-approval policy for non-audit services provided by the auditors
– Compliance and ethics statement, Code of Business Conduct and Hotline contact numbers
Investor’s section:
– Annual and Interim Reports, the Annual Report on Form 20-F, the CSR Report, Interim
Management Statements and copies of presentations to analysts and investors
– News releases
– Presentations and video recordings of executive presentations at capital markets days in London
and New York in November 2012
– Webcast recordings of key investor briefings
– General Meeting dates, notices, shareholder circulars, presentations and poll results
– Answers to Frequently Asked Questions, including questions regarding dividends and shareholder
rights in respect of general meetings
Corporate Governance Report | continued
CRH 53
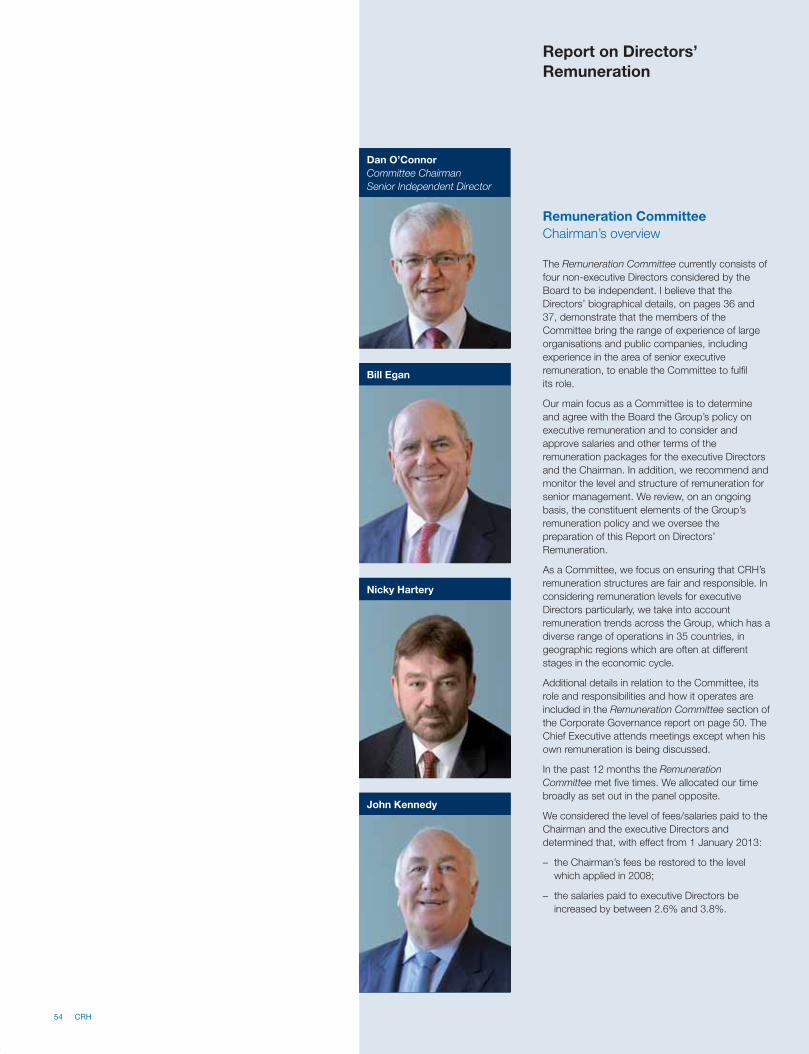
54 CRH
The Remuneration Committee currently consists of
four non-executive Directors considered by the
Board to be independent. I believe that the
Directors’ biographical details, on pages 36 and
37, demonstrate that the members of the
Committee bring the range of experience of large
organisations and public companies, including
experience in the area of senior executive
remuneration, to enable the Committee to fulfil
its role.
Our main focus as a Committee is to determine
and agree with the Board the Group’s policy on
executive remuneration and to consider and
approve salaries and other terms of the
remuneration packages for the executive Directors
and the Chairman. In addition, we recommend and
monitor the level and structure of remuneration for
senior management. We review, on an ongoing
basis, the constituent elements of the Group’s
remuneration policy and we oversee the
preparation of this Report on Directors’
Remuneration.
As a Committee, we focus on ensuring that CRH’s
remuneration structures are fair and responsible. In
considering remuneration levels for executive
Directors particularly, we take into account
remuneration trends across the Group, which has a
diverse range of operations in 35 countries, in
geographic regions which are often at different
stages in the economic cycle.
Additional details in relation to the Committee, its
role and responsibilities and how it operates are
included in the Remuneration Committee section of
the Corporate Governance report on page 50. The
Chief Executive attends meetings except when his
own remuneration is being discussed.
In the past 12 months the Remuneration
Committee met five times. We allocated our time
broadly as set out in the panel opposite.
We considered the level of fees/salaries paid to the
Chairman and the executive Directors and
determined that, with effect from 1 January 2013:
– the Chairman’s fees be restored to the level
which applied in 2008;
– the salaries paid to executive Directors be
increased by between 2.6% and 3.8%.
Remuneration Committee
Chairman’s overview
Report on Directors’
Remuneration
Nicky Hartery
Bill Egan
John Kennedy
Dan O’Connor
Committee Chairman
Senior Independent Director
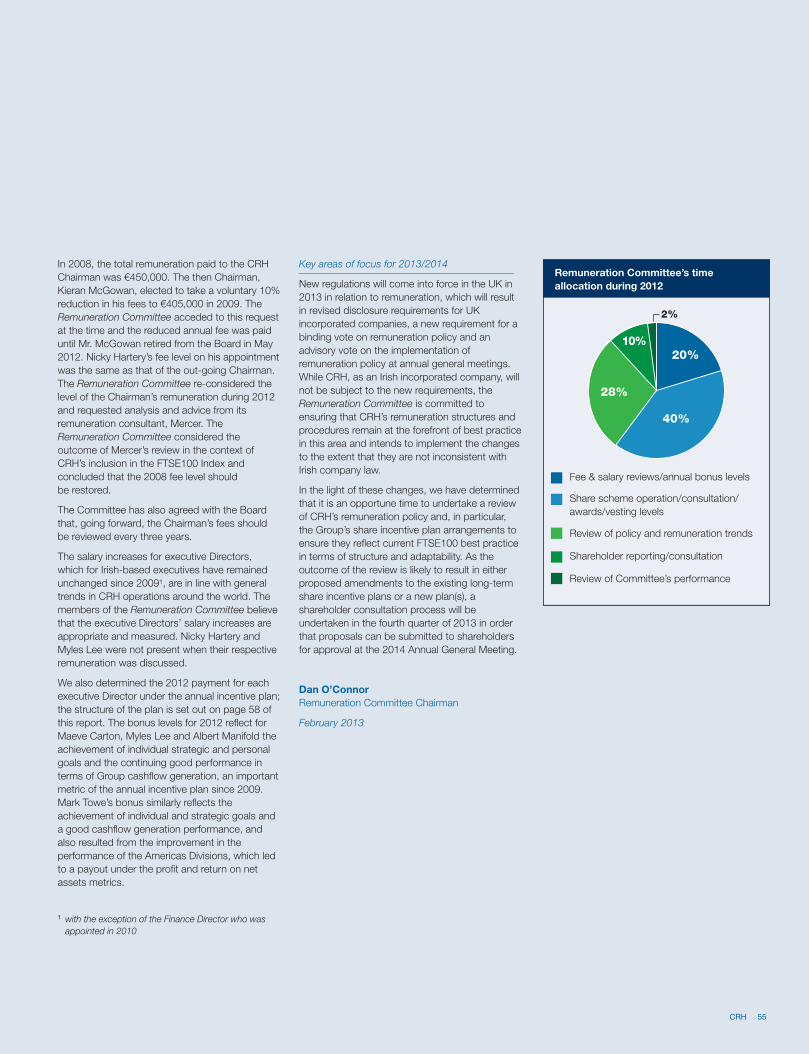
¹ with the exception of the Finance Director who was
appointed in 2010
In 2008, the total remuneration paid to the CRH
Chairman was €450,000. The then Chairman,
Kieran McGowan, elected to take a voluntary 10%
reduction in his fees to €405,000 in 2009. The
Remuneration Committee acceded to this request
at the time and the reduced annual fee was paid
until Mr. McGowan retired from the Board in May
2012. Nicky Hartery’s fee level on his appointment
was the same as that of the out-going Chairman.
The Remuneration Committee re-considered the
level of the Chairman’s remuneration during 2012
and requested analysis and advice from its
remuneration consultant, Mercer. The
Remuneration Committee considered the
outcome of Mercer’s review in the context of
CRH’s inclusion in the FTSE100 Index and
concluded that the 2008 fee level should
be restored.
The Committee has also agreed with the Board
that, going forward, the Chairman’s fees should
be reviewed every three years.
The salary increases for executive Directors,
which for Irish-based executives have remained
unchanged since 2009¹, are in line with general
trends in CRH operations around the world. The
members of the Remuneration Committee believe
that the executive Directors’ salary increases are
appropriate and measured. Nicky Hartery and
Myles Lee were not present when their respective
remuneration was discussed.
We also determined the 2012 payment for each
executive Director under the annual incentive plan;
the structure of the plan is set out on page 58 of
this report. The bonus levels for 2012 reflect for
Maeve Carton, Myles Lee and Albert Manifold the
achievement of individual strategic and personal
goals and the continuing good performance in
terms of Group cashflow generation, an important
metric of the annual incentive plan since 2009.
Mark Towe’s bonus similarly reflects the
achievement of individual and strategic goals and
a good cashflow generation performance, and
also resulted from the improvement in the
performance of the Americas Divisions, which led
to a payout under the profit and return on net
assets metrics.
Key areas of focus for 2013/2014
New regulations will come into force in the UK in
2013 in relation to remuneration, which will result
in revised disclosure requirements for UK
incorporated companies, a new requirement for a
binding vote on remuneration policy and an
advisory vote on the implementation of
remuneration policy at annual general meetings.
While CRH, as an Irish incorporated company, will
not be subject to the new requirements, the
Remuneration Committee is committed to
ensuring that CRH’s remuneration structures and
procedures remain at the forefront of best practice
in this area and intends to implement the changes
to the extent that they are not inconsistent with
Irish company law.
In the light of these changes, we have determined
that it is an opportune time to undertake a review
of CRH’s remuneration policy and, in particular,
the Group’s share incentive plan arrangements to
ensure they reflect current FTSE100 best practice
in terms of structure and adaptability. As the
outcome of the review is likely to result in either
proposed amendments to the existing long-term
share incentive plans or a new plan(s), a
shareholder consultation process will be
undertaken in the fourth quarter of 2013 in order
that proposals can be submitted to shareholders
for approval at the 2014 Annual General Meeting.
Dan O’Connor
Remuneration Committee Chairman
February 2013
Remuneration Committee’s time
allocation during 2012
20%
40%
28%
10%
2%
Fee & salary reviews/annual bonus levels
Share scheme operation/consultation/
awards/vesting levels
Review of policy and remuneration trends
Shareholder reporting/consultation
Review of Committee’s performance
CRH 55
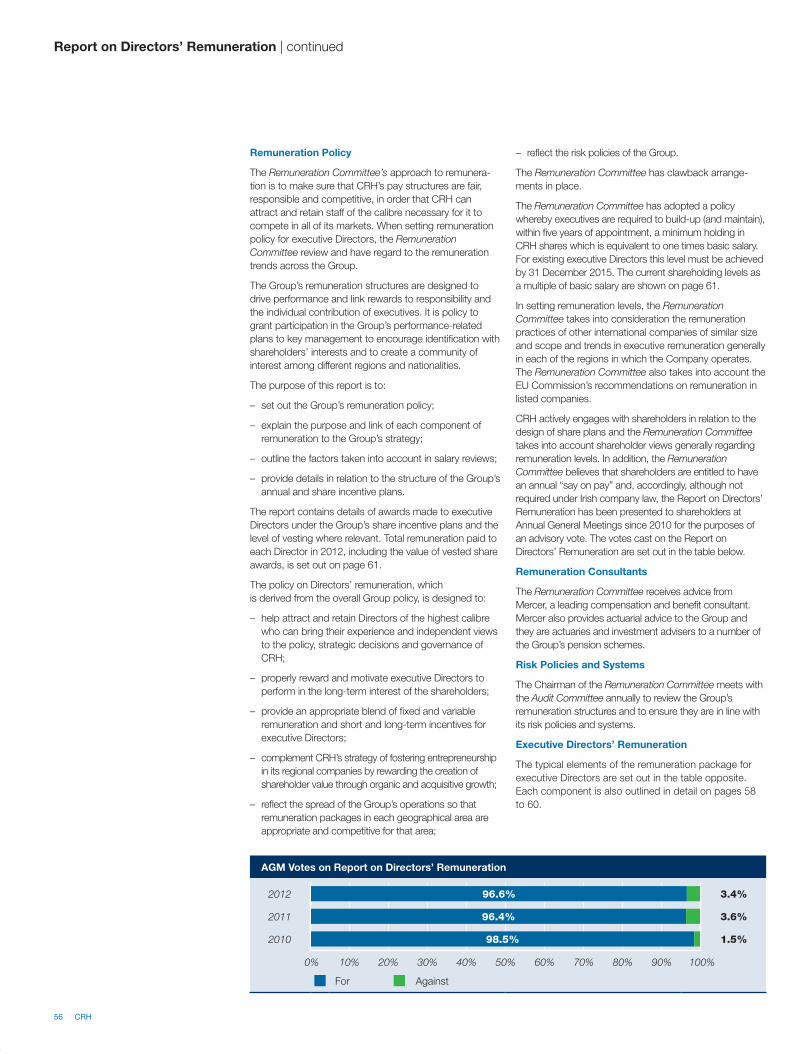
56 CRH
Remuneration Policy
The Remuneration Committee’s approach to remunera-
tion is to make sure that CRH’s pay structures are fair,
responsible and competitive, in order that CRH can
attract and retain staff of the calibre necessary for it to
compete in all of its markets. When setting remuneration
policy for executive Directors, the Remuneration
Committee review and have regard to the remuneration
trends across the Group.
The Group’s remuneration structures are designed to
drive performance and link rewards to responsibility and
the individual contribution of executives. It is policy to
grant participation in the Group’s performance-related
plans to key management to encourage identification with
shareholders’ interests and to create a community of
interest among different regions and nationalities.
The purpose of this report is to:
– set out the Group’s remuneration policy;
– explain the purpose and link of each component of
remuneration to the Group’s strategy;
– outline the factors taken into account in salary reviews;
– provide details in relation to the structure of the Group’s
annual and share incentive plans.
The report contains details of awards made to executive
Directors under the Group’s share incentive plans and the
level of vesting where relevant. Total remuneration paid to
each Director in 2012, including the value of vested share
awards, is set out on page 61.
The policy on Directors’ remuneration, which
is derived from the overall Group policy, is designed to:
– help attract and retain Directors of the highest calibre
who can bring their experience and independent views
to the policy, strategic decisions and governance of
CRH;
– properly reward and motivate executive Directors to
perform in the long-term interest of the shareholders;
– provide an appropriate blend of fixed and variable
remuneration and short and long-term incentives for
executive Directors;
– complement CRH’s strategy of fostering entrepreneurship
in its regional companies by rewarding the creation of
shareholder value through organic and acquisitive growth;
– reflect the spread of the Group’s operations so that
remuneration packages in each geographical area are
appropriate and competitive for that area;
– reflect the risk policies of the Group.
The Remuneration Committee has clawback arrange-
ments in place.
The Remuneration Committee has adopted a policy
whereby executives are required to build-up (and maintain),
within five years of appointment, a minimum holding in
CRH shares which is equivalent to one times basic salary.
For existing executive Directors this level must be achieved
by 31 December 2015. The current shareholding levels as
a multiple of basic salary are shown on page 61.
In setting remuneration levels, the Remuneration
Committee takes into consideration the remuneration
practices of other international companies of similar size
and scope and trends in executive remuneration generally
in each of the regions in which the Company operates.
The Remuneration Committee also takes into account the
EU Commission’s recommendations on remuneration in
listed companies.
CRH actively engages with shareholders in relation to the
design of share plans and the Remuneration Committee
takes into account shareholder views generally regarding
remuneration levels. In addition, the Remuneration
Committee believes that shareholders are entitled to have
an annual “say on pay” and, accordingly, although not
required under Irish company law, the Report on Directors’
Remuneration has been presented to shareholders at
Annual General Meetings since 2010 for the purposes of
an advisory vote. The votes cast on the Report on
Directors’ Remuneration are set out in the table below.
Remuneration Consultants
The Remuneration Committee receives advice from
Mercer, a leading compensation and benefit consultant.
Mercer also provides actuarial advice to the Group and
they are actuaries and investment advisers to a number of
the Group’s pension schemes.
Risk Policies and Systems
The Chairman of the Remuneration Committee meets with
the Audit Committee annually to review the Group’s
remuneration structures and to ensure they are in line with
its risk policies and systems.
Executive Directors’ Remuneration
The typical elements of the remuneration package for
executive Directors are set out in the table opposite.
Each component is also outlined in detail on pages 58
to 60.
AGM Votes on Report on Directors’ Remuneration
2012 96.6% 3.4%
2011 96.4% 3.6%
2010 98.5% 1.5%
0% 10% 20% 30% 40% 50% 60% 70% 80% 90% 100%
For Against
Report on Directors’ Remuneration | continued
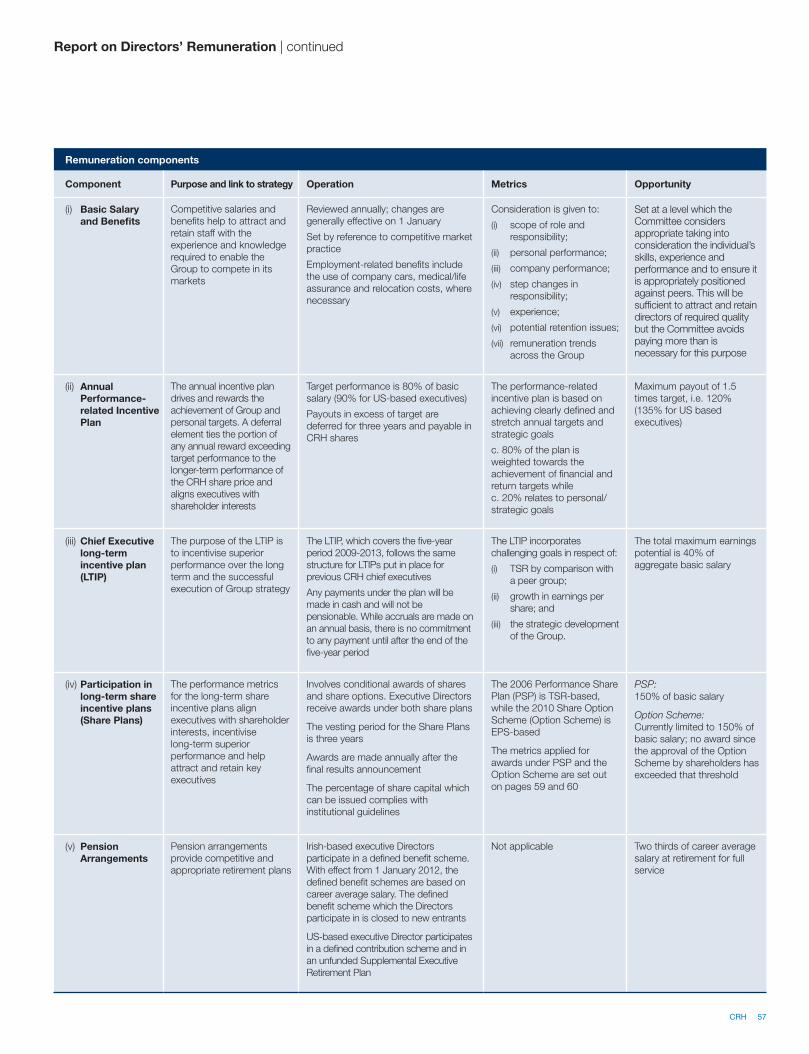
Remuneration components
Component Purpose and link to strategy Operation Metrics Opportunity
(i) Basic Salary
and Benefits
Competitive salaries and
benefits help to attract and
retain staff with the
experience and knowledge
required to enable the
Group to compete in its
markets
Reviewed annually; changes are
generally effective on 1 January
Set by reference to competitive market
practice
Employment-related benefits include
the use of company cars, medical/life
assurance and relocation costs, where
necessary
Consideration is given to:
(i) scope of role and
responsibility;
(ii) personal performance;
(iii) company performance;
(iv) step changes in
responsibility;
(v) experience;
(vi) potential retention issues;
(vii) remuneration trends
across the Group
Set at a level which the Committee considers appropriate taking into consideration the individual’s skills, experience and performance and to ensure it is appropriately positioned against peers. This will be sufficient to attract and retain directors of required quality but the Committee avoids paying more than is necessary for this purpose
(ii) Annual
Performance-
related Incentive
Plan
The annual incentive plan
drives and rewards the
achievement of Group and
personal targets. A deferral
element ties the portion of
any annual reward exceeding
target performance to the
longer-term performance of
the CRH share price and
aligns executives with
shareholder interests
Target performance is 80% of basic
salary (90% for US-based executives)
Payouts in excess of target are
deferred for three years and payable in
CRH shares
The performance-related
incentive plan is based on
achieving clearly defined and
stretch annual targets and
strategic goals
c. 80% of the plan is
weighted towards the
achievement of financial and
return targets while
c. 20% relates to personal/
strategic goals
Maximum payout of 1.5
times target, i.e. 120%
(135% for US based
executives)
(iii) Chief Executive
long-term
incentive plan
(LTIP)
The purpose of the LTIP is
to incentivise superior
performance over the long
term and the successful
execution of Group strategy
The LTIP, which covers the five-year
period 2009-2013, follows the same
structure for LTIPs put in place for
previous CRH chief executives
Any payments under the plan will be
made in cash and will not be
pensionable. While accruals are made on
an annual basis, there is no commitment
to any payment until after the end of the
five-year period
The LTIP incorporates
challenging goals in respect of:
(i) TSR by comparison with
a peer group;
(ii) growth in earnings per
share; and
(iii) the strategic development
of the Group.
The total maximum earnings
potential is 40% of
aggregate basic salary
(iv) Participation in
long-term share
incentive plans
(Share Plans)
The performance metrics
for the long-term share
incentive plans align
executives with shareholder
interests, incentivise
long-term superior
performance and help
attract and retain key
executives
Involves conditional awards of shares
and share options. Executive Directors
receive awards under both share plans
The vesting period for the Share Plans
is three years
Awards are made annually after the
final results announcement
The percentage of share capital which
can be issued complies with
institutional guidelines
The 2006 Performance Share
Plan (PSP) is TSR-based,
while the 2010 Share Option
Scheme (Option Scheme) is
EPS-based
The metrics applied for
awards under PSP and the
Option Scheme are set out
on pages 59 and 60
PSP: 150% of basic salary
Option Scheme:
Currently limited to 150% of
basic salary; no award since
the approval of the Option
Scheme by shareholders has
exceeded that threshold
(v) Pension
Arrangements
Pension arrangements
provide competitive and
appropriate retirement plans
Irish-based executive Directors
participate in a defined benefit scheme.
With effect from 1 January 2012, the
defined benefit schemes are based on
career average salary. The defined
benefit scheme which the Directors
participate in is closed to new entrants
US-based executive Director participates
in a defined contribution scheme and in
an unfunded Supplemental Executive
Retirement Plan
Not applicable Two thirds of career average
salary at retirement for full
service
Report on Directors’ Remuneration | continued
CRH 57
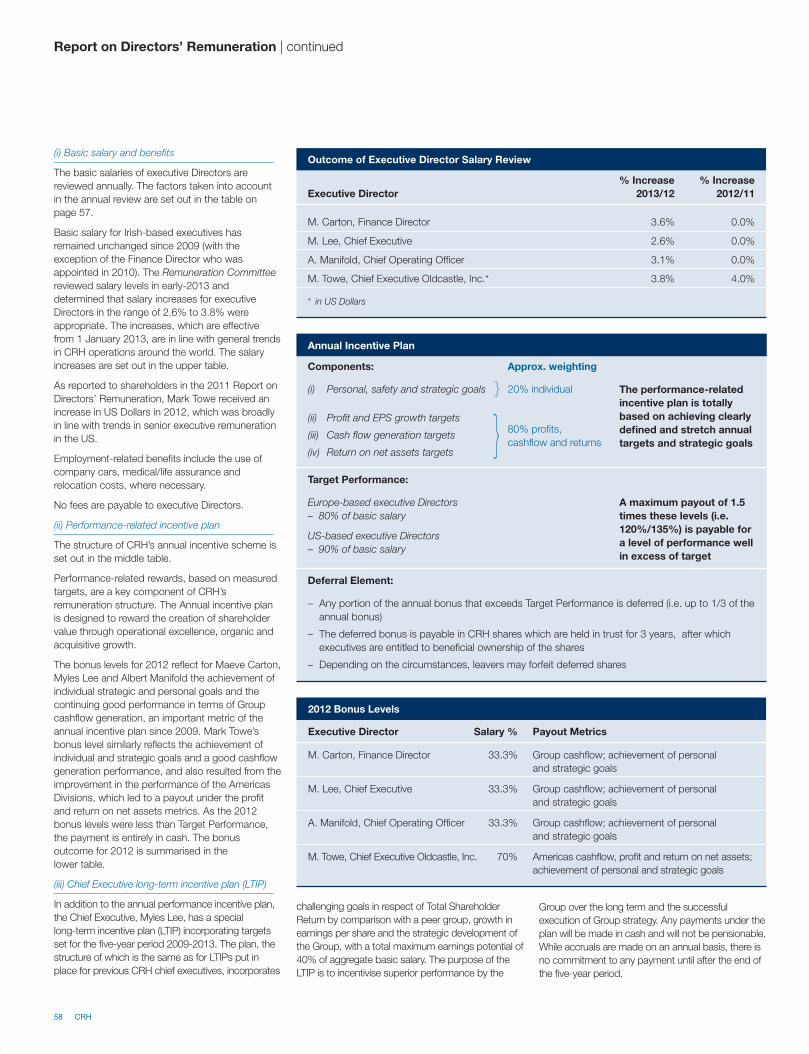
58 CRH
(i) Basic salary and benefits
The basic salaries of executive Directors are
reviewed annually. The factors taken into account
in the annual review are set out in the table on
page 57.
Basic salary for Irish-based executives has
remained unchanged since 2009 (with the
exception of the Finance Director who was
appointed in 2010). The Remuneration Committee
reviewed salary levels in early-2013 and
determined that salary increases for executive
Directors in the range of 2.6% to 3.8% were
appropriate. The increases, which are effective
from 1 January 2013, are in line with general trends
in CRH operations around the world. The salary
increases are set out in the upper table.
As reported to shareholders in the 2011 Report on
Directors’ Remuneration, Mark Towe received an
increase in US Dollars in 2012, which was broadly
in line with trends in senior executive remuneration
in the US.
Employment-related benefits include the use of
company cars, medical/life assurance and
relocation costs, where necessary.
No fees are payable to executive Directors.
(ii) Performance-related incentive plan
The structure of CRH’s annual incentive scheme is
set out in the middle table.
Performance-related rewards, based on measured
targets, are a key component of CRH’s
remuneration structure. The Annual incentive plan
is designed to reward the creation of shareholder
value through operational excellence, organic and
acquisitive growth.
The bonus levels for 2012 reflect for Maeve Carton,
Myles Lee and Albert Manifold the achievement of
individual strategic and personal goals and the
continuing good performance in terms of Group
cashflow generation, an important metric of the
annual incentive plan since 2009. Mark Towe’s
bonus level similarly reflects the achievement of
individual and strategic goals and a good cashflow
generation performance, and also resulted from the
improvement in the performance of the Americas
Divisions, which led to a payout under the profit
and return on net assets metrics. As the 2012
bonus levels were less than Target Performance,
the payment is entirely in cash. The bonus
outcome for 2012 is summarised in the
lower table.
(iii) Chief Executive long-term incentive plan (LTIP)
In addition to the annual performance incentive plan,
the Chief Executive, Myles Lee, has a special
long-term incentive plan (LTIP) incorporating targets
set for the five-year period 2009-2013. The plan, the
structure of which is the same as for LTIPs put in
place for previous CRH chief executives, incorporates
challenging goals in respect of Total Shareholder
Return by comparison with a peer group, growth in
earnings per share and the strategic development of
the Group, with a total maximum earnings potential of
40% of aggregate basic salary. The purpose of the
LTIP is to incentivise superior performance by the
Group over the long term and the successful
execution of Group strategy. Any payments under the
plan will be made in cash and will not be pensionable.
While accruals are made on an annual basis, there is
no commitment to any payment until after the end of
the five-year period.
2012 Bonus Levels
Executive Director Salary % Payout Metrics
M. Carton, Finance Director 33.3% Group cashflow; achievement of personal
and strategic goals
M. Lee, Chief Executive 33.3% Group cashflow; achievement of personal
and strategic goals
A. Manifold, Chief Operating Officer 33.3% Group cashflow; achievement of personal
and strategic goals
M. Towe, Chief Executive Oldcastle, Inc. 70% Americas cashflow, profit and return on net assets;
achievement of personal and strategic goals
Annual Incentive Plan
Components: Approx. weighting
(i) Personal, safety and strategic goals } 20% individual The performance-related
incentive plan is totally
based on achieving clearly
defined and stretch annual
targets and strategic goals
(ii) Profit and EPS growth targets
(iii) Cash flow generation targets
(iv) Return on net assets targets} 80% profits,
cashflow and returns
Target Performance:
Europe-based executive Directors
– 80% of basic salary
US-based executive Directors
– 90% of basic salary
A maximum payout of 1.5
times these levels (i.e.
120%/135%) is payable for
a level of performance well
in excess of target
Deferral Element:
– Any portion of the annual bonus that exceeds Target Performance is deferred (i.e. up to 1/3 of the
annual bonus)
– The deferred bonus is payable in CRH shares which are held in trust for 3 years, after which
executives are entitled to beneficial ownership of the shares
– Depending on the circumstances, leavers may forfeit deferred shares
Report on Directors’ Remuneration | continued
Outcome of Executive Director Salary Review
Executive Director
% Increase
2013/12
% Increase
2012/11
M. Carton, Finance Director 3.6% 0.0%
M. Lee, Chief Executive 2.6% 0.0%
A. Manifold, Chief Operating Officer 3.1% 0.0%
M. Towe, Chief Executive Oldcastle, Inc.* 3.8% 4.0%
* in US Dollars
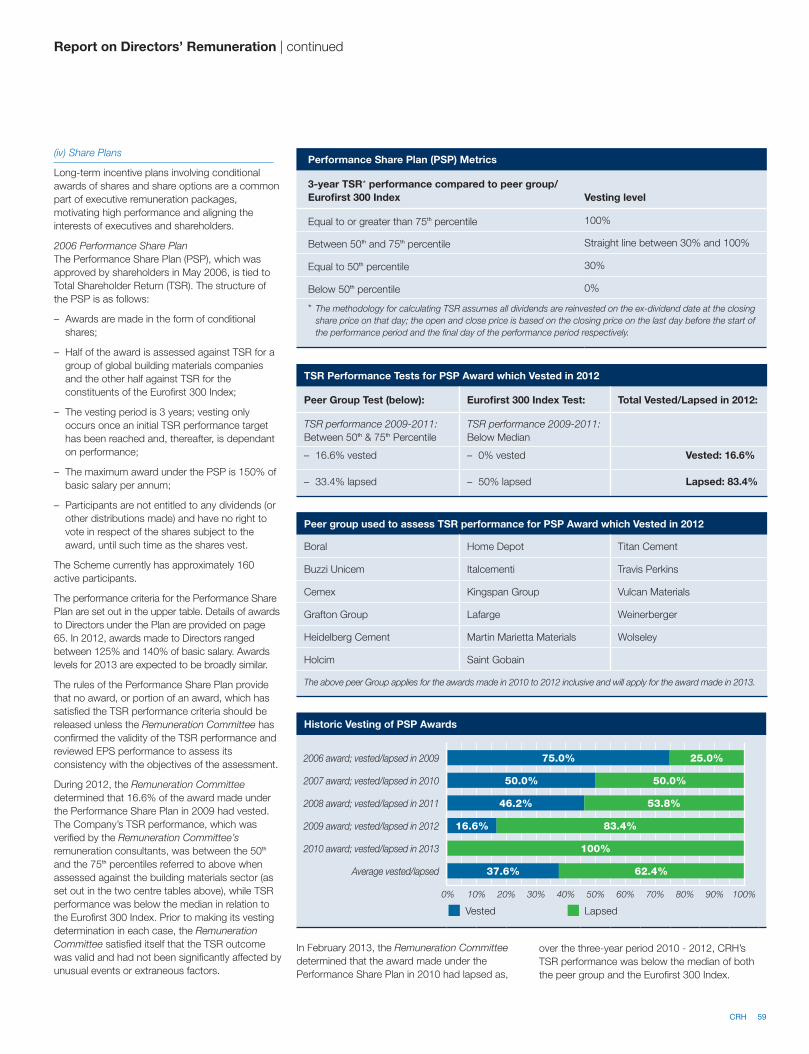
(iv) Share Plans
Long-term incentive plans involving conditional
awards of shares and share options are a common
part of executive remuneration packages,
motivating high performance and aligning the
interests of executives and shareholders.
2006 Performance Share Plan
The Performance Share Plan (PSP), which was
approved by shareholders in May 2006, is tied to
Total Shareholder Return (TSR). The structure of
the PSP is as follows:
– Awards are made in the form of conditional
shares;
– Half of the award is assessed against TSR for a
group of global building materials companies
and the other half against TSR for the
constituents of the Eurofirst 300 Index;
– The vesting period is 3 years; vesting only
occurs once an initial TSR performance target
has been reached and, thereafter, is dependant
on performance;
– The maximum award under the PSP is 150% of
basic salary per annum;
– Participants are not entitled to any dividends (or
other distributions made) and have no right to
vote in respect of the shares subject to the
award, until such time as the shares vest.
The Scheme currently has approximately 160
active participants.
The performance criteria for the Performance Share
Plan are set out in the upper table. Details of awards
to Directors under the Plan are provided on page
65. In 2012, awards made to Directors ranged
between 125% and 140% of basic salary. Awards
levels for 2013 are expected to be broadly similar.
The rules of the Performance Share Plan provide
that no award, or portion of an award, which has
satisfied the TSR performance criteria should be
released unless the Remuneration Committee has
confirmed the validity of the TSR performance and
reviewed EPS performance to assess its
consistency with the objectives of the assessment.
During 2012, the Remuneration Committee
determined that 16.6% of the award made under
the Performance Share Plan in 2009 had vested.
The Company’s TSR performance, which was
verified by the Remuneration Committee’s
remuneration consultants, was between the 50th
and the 75th percentiles referred to above when
assessed against the building materials sector (as
set out in the two centre tables above), while TSR
performance was below the median in relation to
the Eurofirst 300 Index. Prior to making its vesting
determination in each case, the Remuneration
Committee satisfied itself that the TSR outcome
was valid and had not been significantly affected by
unusual events or extraneous factors.
In February 2013, the Remuneration Committee
determined that the award made under the
Performance Share Plan in 2010 had lapsed as,
over the three-year period 2010 - 2012, CRH’s
TSR performance was below the median of both
the peer group and the Eurofirst 300 Index.
Performance Share Plan (PSP) Metrics
3-year TSR* performance compared to peer group/
Eurofirst 300 Index Vesting level
Equal to or greater than 75th percentile 100%
Between 50th and 75th percentile Straight line between 30% and 100%
Equal to 50th percentile 30%
Below 50th percentile 0%
* The methodology for calculating TSR assumes all dividends are reinvested on the ex-dividend date at the closing
share price on that day; the open and close price is based on the closing price on the last day before the start of
the performance period and the final day of the performance period respectively.
TSR Performance Tests for PSP Award which Vested in 2012
Peer Group Test (below): Eurofirst 300 Index Test: Total Vested/Lapsed in 2012:
TSR performance 2009-2011:
Between 50th & 75th Percentile
TSR performance 2009-2011:
Below Median
– 16.6% vested – 0% vested Vested: 16.6%
– 33.4% lapsed – 50% lapsed Lapsed: 83.4%
Peer group used to assess TSR performance for PSP Award which Vested in 2012
Boral Home Depot Titan Cement
Buzzi Unicem Italcementi Travis Perkins
Cemex Kingspan Group Vulcan Materials
Grafton Group Lafarge Weinerberger
Heidelberg Cement Martin Marietta Materials Wolseley
Holcim Saint Gobain
The above peer Group applies for the awards made in 2010 to 2012 inclusive and will apply for the award made in 2013.
Report on Directors’ Remuneration | continued
Historic Vesting of PSP Awards
2006 award; vested/lapsed in 2009 75.0% 25.0%
2007 award; vested/lapsed in 2010 50.0% 50.0%
2008 award; vested/lapsed in 2011 46.2% 53.8%
2009 award; vested/lapsed in 2012 16.6% 83.4%
2010 award; vested/lapsed in 2013 100%
Average vested/lapsed 37.6% 62.4%
0% 10% 20% 30% 40% 50% 60% 70% 80% 90% 100%
Vested Lapsed
CRH 59
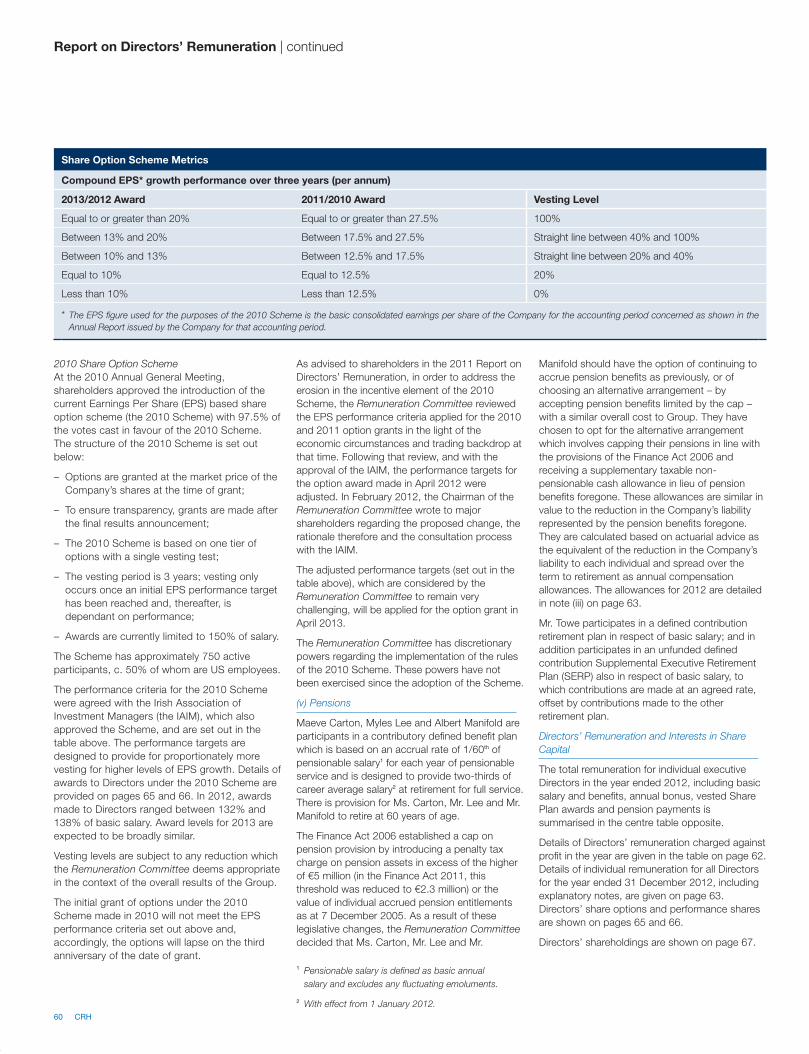
60 CRH
2010 Share Option Scheme
At the 2010 Annual General Meeting,
shareholders approved the introduction of the
current Earnings Per Share (EPS) based share
option scheme (the 2010 Scheme) with 97.5% of
the votes cast in favour of the 2010 Scheme.
The structure of the 2010 Scheme is set out
below:
– Options are granted at the market price of the
Company’s shares at the time of grant;
– To ensure transparency, grants are made after
the final results announcement;
– The 2010 Scheme is based on one tier of
options with a single vesting test;
– The vesting period is 3 years; vesting only
occurs once an initial EPS performance target
has been reached and, thereafter, is
dependant on performance;
– Awards are currently limited to 150% of salary.
The Scheme has approximately 750 active
participants, c. 50% of whom are US employees.
The performance criteria for the 2010 Scheme
were agreed with the Irish Association of
Investment Managers (the IAIM), which also
approved the Scheme, and are set out in the
table above. The performance targets are
designed to provide for proportionately more
vesting for higher levels of EPS growth. Details of
awards to Directors under the 2010 Scheme are
provided on pages 65 and 66. In 2012, awards
made to Directors ranged between 132% and
138% of basic salary. Award levels for 2013 are
expected to be broadly similar.
Vesting levels are subject to any reduction which
the Remuneration Committee deems appropriate
in the context of the overall results of the Group.
The initial grant of options under the 2010
Scheme made in 2010 will not meet the EPS
performance criteria set out above and,
accordingly, the options will lapse on the third
anniversary of the date of grant.
As advised to shareholders in the 2011 Report on
Directors’ Remuneration, in order to address the
erosion in the incentive element of the 2010
Scheme, the Remuneration Committee reviewed
the EPS performance criteria applied for the 2010
and 2011 option grants in the light of the
economic circumstances and trading backdrop at
that time. Following that review, and with the
approval of the IAIM, the performance targets for
the option award made in April 2012 were
adjusted. In February 2012, the Chairman of the
Remuneration Committee wrote to major
shareholders regarding the proposed change, the
rationale therefore and the consultation process
with the IAIM.
The adjusted performance targets (set out in the
table above), which are considered by the
Remuneration Committee to remain very
challenging, will be applied for the option grant in
April 2013.
The Remuneration Committee has discretionary
powers regarding the implementation of the rules
of the 2010 Scheme. These powers have not
been exercised since the adoption of the Scheme.
(v) Pensions
Maeve Carton, Myles Lee and Albert Manifold are
participants in a contributory defined benefit plan
which is based on an accrual rate of 1/60th of
pensionable salary1 for each year of pensionable
service and is designed to provide two-thirds of
career average salary2 at retirement for full service.
There is provision for Ms. Carton, Mr. Lee and Mr.
Manifold to retire at 60 years of age.
The Finance Act 2006 established a cap on
pension provision by introducing a penalty tax
charge on pension assets in excess of the higher
of €5 million (in the Finance Act 2011, this
threshold was reduced to €2.3 million) or the
value of individual accrued pension entitlements
as at 7 December 2005. As a result of these
legislative changes, the Remuneration Committee
decided that Ms. Carton, Mr. Lee and Mr.
Manifold should have the option of continuing to
accrue pension benefits as previously, or of
choosing an alternative arrangement – by
accepting pension benefits limited by the cap –
with a similar overall cost to Group. They have
chosen to opt for the alternative arrangement
which involves capping their pensions in line with
the provisions of the Finance Act 2006 and
receiving a supplementary taxable non-
pensionable cash allowance in lieu of pension
benefits foregone. These allowances are similar in
value to the reduction in the Company’s liability
represented by the pension benefits foregone.
They are calculated based on actuarial advice as
the equivalent of the reduction in the Company’s
liability to each individual and spread over the
term to retirement as annual compensation
allowances. The allowances for 2012 are detailed
in note (iii) on page 63.
Mr. Towe participates in a defined contribution
retirement plan in respect of basic salary; and in
addition participates in an unfunded defined
contribution Supplemental Executive Retirement
Plan (SERP) also in respect of basic salary, to
which contributions are made at an agreed rate,
offset by contributions made to the other
retirement plan.
Directors’ Remuneration and Interests in Share
Capital
The total remuneration for individual executive
Directors in the year ended 2012, including basic
salary and benefits, annual bonus, vested Share
Plan awards and pension payments is
summarised in the centre table opposite.
Details of Directors’ remuneration charged against
profit in the year are given in the table on page 62.
Details of individual remuneration for all Directors
for the year ended 31 December 2012, including
explanatory notes, are given on page 63.
Directors’ share options and performance shares
are shown on pages 65 and 66.
Directors’ shareholdings are shown on page 67.
Share Option Scheme Metrics
Compound EPS* growth performance over three years (per annum)
2013/2012 Award 2011/2010 Award Vesting Level
Equal to or greater than 20% Equal to or greater than 27.5% 100%
Between 13% and 20% Between 17.5% and 27.5% Straight line between 40% and 100%
Between 10% and 13% Between 12.5% and 17.5% Straight line between 20% and 40%
Equal to 10% Equal to 12.5% 20%
Less than 10% Less than 12.5% 0%
* The EPS figure used for the purposes of the 2010 Scheme is the basic consolidated earnings per share of the Company for the accounting period concerned as shown in the
Annual Report issued by the Company for that accounting period.
Report on Directors’ Remuneration | continued
1 Pensionable salary is defined as basic annual
salary and excludes any fluctuating emoluments.
2 With effect from 1 January 2012.
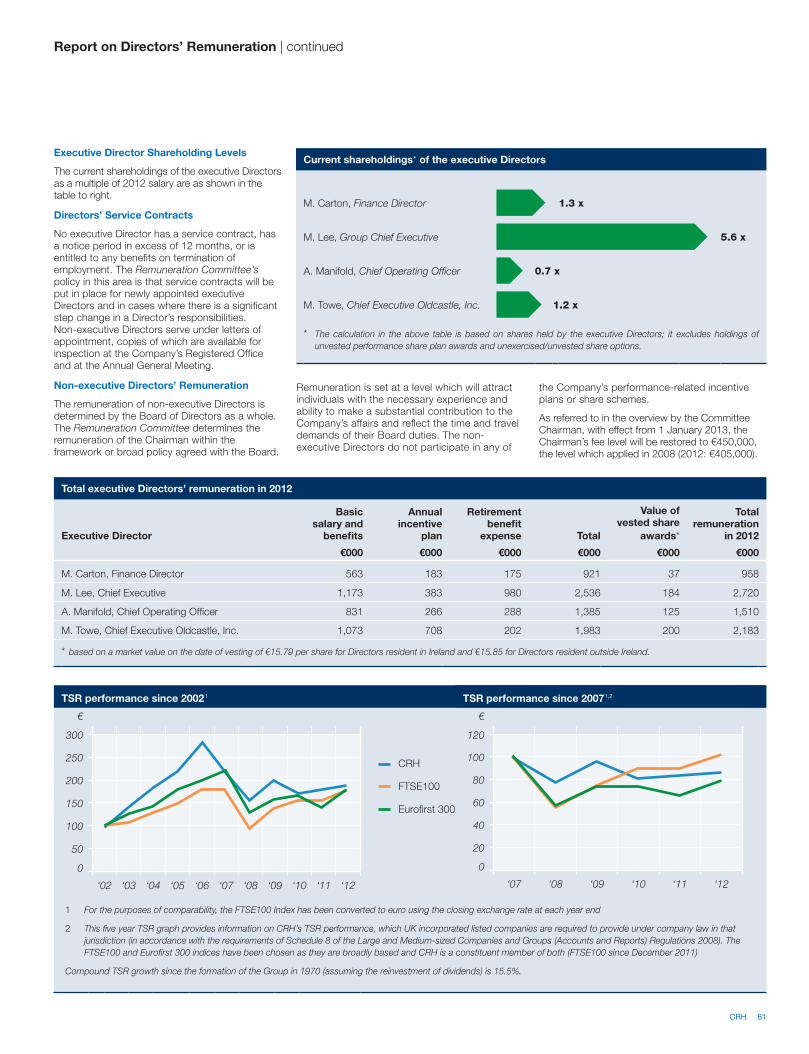
Executive Director Shareholding Levels
The current shareholdings of the executive Directors as a multiple of 2012 salary are as shown in the table to right.
Directors’ Service Contracts
No executive Director has a service contract, has a notice period in excess of 12 months, or is entitled to any benefits on termination of employment. The Remuneration Committee’s policy in this area is that service contracts will be put in place for newly appointed executive Directors and in cases where there is a significant step change in a Director’s responsibilities. Non-executive Directors serve under letters of appointment, copies of which are available for inspection at the Company’s Registered Office and at the Annual General Meeting.
Non-executive Directors’ Remuneration
The remuneration of non-executive Directors is determined by the Board of Directors as a whole. The Remuneration Committee determines the remuneration of the Chairman within the framework or broad policy agreed with the Board.
Remuneration is set at a level which will attract individuals with the necessary experience and ability to make a substantial contribution to the Company’s affairs and reflect the time and travel demands of their Board duties. The non-executive Directors do not participate in any of
the Company’s performance-related incentive plans or share schemes.
As referred to in the overview by the Committee Chairman, with effect from 1 January 2013, the Chairman’s fee level will be restored to €450,000, the level which applied in 2008 (2012: €405,000).
Current shareholdings* of the executive Directors
M. Carton, Finance Director 1.3 x
M. Lee, Group Chief Executive 5.6 x
A. Manifold, Chief Operating Officer 0.7 x
M. Towe, Chief Executive Oldcastle, Inc. 1.2 x
* The calculation in the above table is based on shares held by the executive Directors; it excludes holdings of
unvested performance share plan awards and unexercised/unvested share options.
Total executive Directors’ remuneration in 2012
Executive Director
Basic salary and
benefits
Annual incentive
plan
Retirement benefit
expense Total
Value of vested share
awards*
Totalremuneration
in 2012
€000 €000 €000 €000 €000 €000
M. Carton, Finance Director 563 183 175 921 37 958
M. Lee, Chief Executive 1,173 383 980 2,536 184 2,720
A. Manifold, Chief Operating Officer 831 266 288 1,385 125 1,510
M. Towe, Chief Executive Oldcastle, Inc. 1,073 708 202 1,983 200 2,183
* based on a market value on the date of vesting of €15.79 per share for Directors resident in Ireland and €15.85 for Directors resident outside Ireland.
Report on Directors’ Remuneration | continued
TSR performance since 2002
1
€
300
250CRH
200FTSE100
150Eurofirst 300
100
50
0
‘02 ‘03 ‘04 ‘05 ‘06 ‘07 ‘08 ‘09 ‘10 ‘11 ‘12
1 For the purposes of comparability, the FTSE100 Index has been converted to euro using the closing exchange rate at each year end
2 This five year TSR graph provides information on CRH’s TSR performance, which UK incorporated listed companies are required to provide under company law in that
jurisdiction (in accordance with the requirements of Schedule 8 of the Large and Medium-sized Companies and Groups (Accounts and Reports) Regulations 2008). The
FTSE100 and Eurofirst 300 indices have been chosen as they are broadly based and CRH is a constituent member of both (FTSE100 since December 2011)
Compound TSR growth since the formation of the Group in 1970 (assuming the reinvestment of dividends) is 15.5%.
TSR performance since 2007
1,2
€
120
100
80
60
40
20
0
‘07 ‘08 ‘09 ‘10 ‘11 ‘12
CRH 61
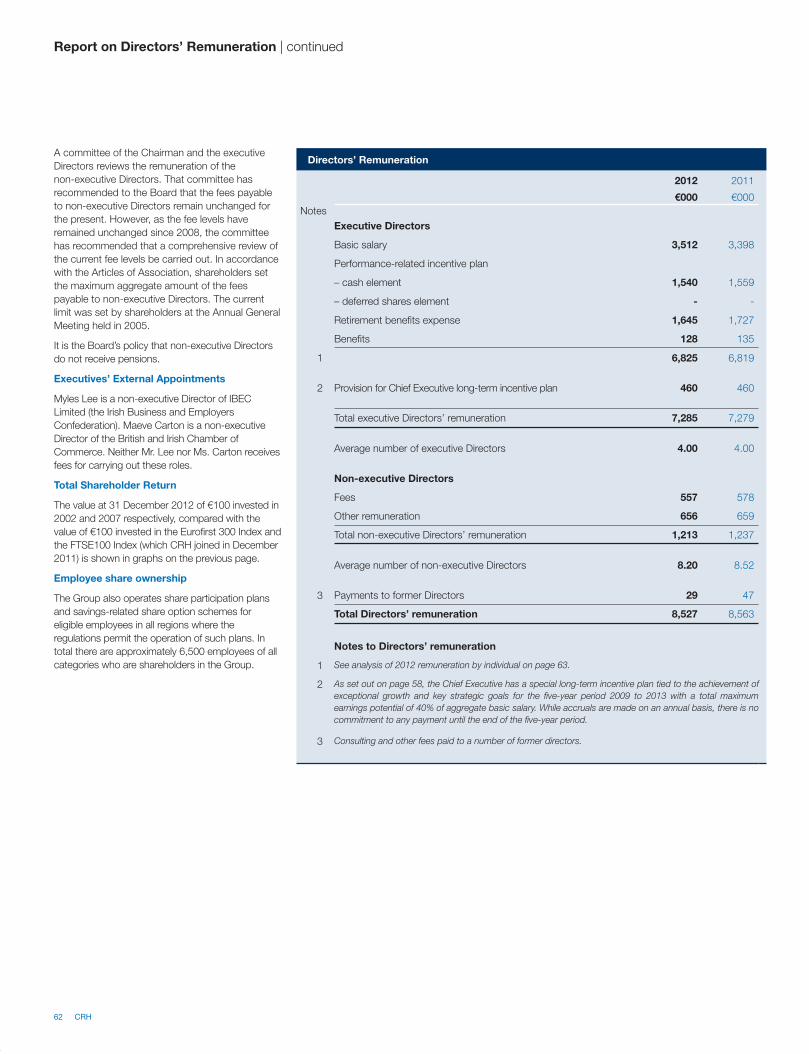
62 CRH
A committee of the Chairman and the executive
Directors reviews the remuneration of the
non-executive Directors. That committee has
recommended to the Board that the fees payable
to non-executive Directors remain unchanged for
the present. However, as the fee levels have
remained unchanged since 2008, the committee
has recommended that a comprehensive review of
the current fee levels be carried out. In accordance
with the Articles of Association, shareholders set
the maximum aggregate amount of the fees
payable to non-executive Directors. The current
limit was set by shareholders at the Annual General
Meeting held in 2005.
It is the Board’s policy that non-executive Directors
do not receive pensions.
Executives’ External Appointments
Myles Lee is a non-executive Director of IBEC
Limited (the Irish Business and Employers
Confederation). Maeve Carton is a non-executive
Director of the British and Irish Chamber of
Commerce. Neither Mr. Lee nor Ms. Carton receives
fees for carrying out these roles.
Total Shareholder Return
The value at 31 December 2012 of €100 invested in
2002 and 2007 respectively, compared with the
value of €100 invested in the Eurofirst 300 Index and
the FTSE100 Index (which CRH joined in December
2011) is shown in graphs on the previous page.
Employee share ownership
The Group also operates share participation plans
and savings-related share option schemes for
eligible employees in all regions where the
regulations permit the operation of such plans. In
total there are approximately 6,500 employees of all
categories who are shareholders in the Group.
Report on Directors’ Remuneration | continued
Directors’ Remuneration
2012 2011
€000 €000
Notes
Executive Directors
Basic salary 3,512 3,398
Performance-related incentive plan
– cash element 1,540 1,559
– deferred shares element - -
Retirement benefits expense 1,645 1,727
Benefits 128 135
1 6,825 6,819
2 Provision for Chief Executive long-term incentive plan 460 460
Total executive Directors’ remuneration 7,285 7,279
Average number of executive Directors 4.00 4.00
Non-executive Directors
Fees 557 578
Other remuneration 656 659
Total non-executive Directors’ remuneration 1,213 1,237
Average number of non-executive Directors 8.20 8.52
3 Payments to former Directors 29 47
Total Directors’ remuneration 8,527 8,563
Notes to Directors’ remuneration
1 See analysis of 2012 remuneration by individual on page 63.
2 As set out on page 58, the Chief Executive has a special long-term incentive plan tied to the achievement of
exceptional growth and key strategic goals for the five-year period 2009 to 2013 with a total maximum
earnings potential of 40% of aggregate basic salary. While accruals are made on an annual basis, there is no
commitment to any payment until the end of the five-year period.
3 Consulting and other fees paid to a number of former directors.
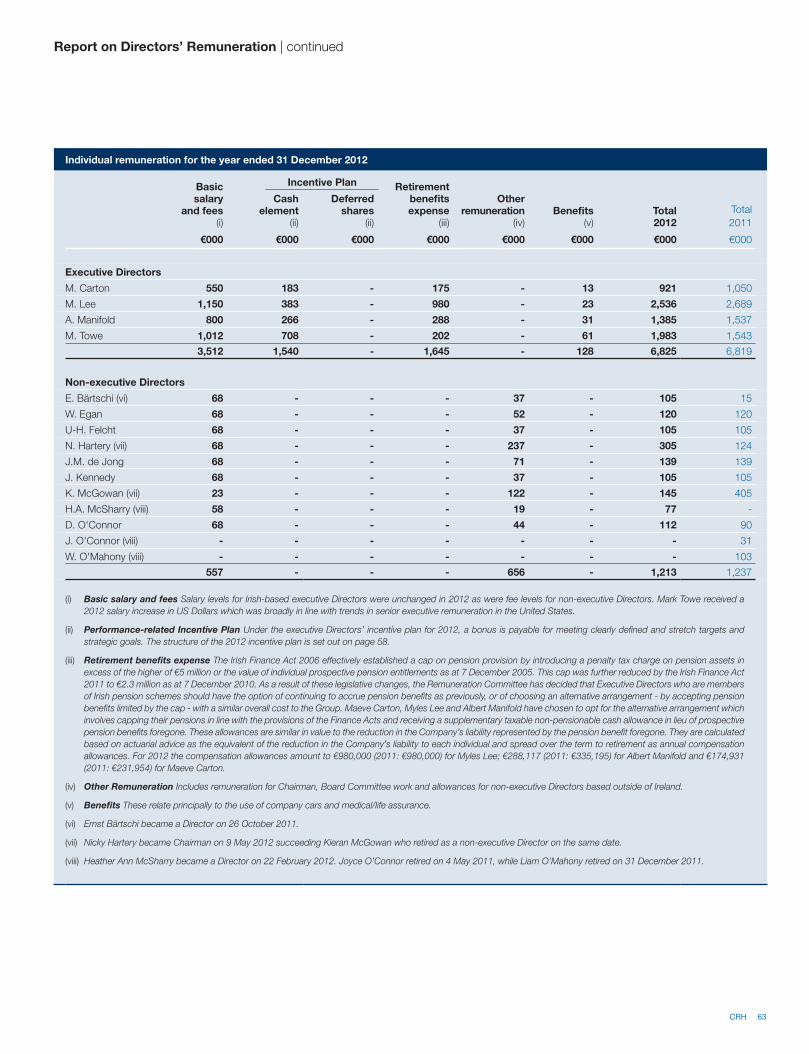
Report on Directors’ Remuneration | continued
Individual remuneration for the year ended 31 December 2012
Basic salary
and fees(i)
Incentive Plan Retirementbenefitsexpense
(iii)
Other remuneration
(iv)Benefits
(v)Total2012
Total
2011
Cash element
(ii)
Deferredshares
(ii)
€000 €000 €000 €000 €000 €000 €000 €000
Executive Directors
M. Carton 550 183 - 175 - 13 921 1,050
M. Lee 1,150 383 - 980 - 23 2,536 2,689
A. Manifold 800 266 - 288 - 31 1,385 1,537
M. Towe 1,012 708 - 202 - 61 1,983 1,543
3,512 1,540 - 1,645 - 128 6,825 6,819
Non-executive Directors
E. Bärtschi (vi) 68 - - - 37 - 105 15
W. Egan 68 - - - 52 - 120 120
U-H. Felcht 68 - - - 37 - 105 105
N. Hartery (vii) 68 - - - 237 - 305 124
J.M. de Jong 68 - - - 71 - 139 139
J. Kennedy 68 - - - 37 - 105 105
K. McGowan (vii) 23 - - - 122 - 145 405
H.A. McSharry (viii) 58 - - - 19 - 77 -
D. O'Connor 68 - - - 44 - 112 90
J. O'Connor (viii) - - - - - - - 31
W. O'Mahony (viii) - - - - - - - 103
557 - - - 656 - 1,213 1,237
(i) Basic salary and fees Salary levels for Irish-based executive Directors were unchanged in 2012 as were fee levels for non-executive Directors. Mark Towe received a
2012 salary increase in US Dollars which was broadly in line with trends in senior executive remuneration in the United States.
(ii) Performance-related Incentive Plan Under the executive Directors’ incentive plan for 2012, a bonus is payable for meeting clearly defined and stretch targets and
strategic goals. The structure of the 2012 incentive plan is set out on page 58.
(iii) Retirement benefits expense The Irish Finance Act 2006 effectively established a cap on pension provision by introducing a penalty tax charge on pension assets in
excess of the higher of €5 million or the value of individual prospective pension entitlements as at 7 December 2005. This cap was further reduced by the Irish Finance Act
2011 to €2.3 million as at 7 December 2010. As a result of these legislative changes, the Remuneration Committee has decided that Executive Directors who are members
of Irish pension schemes should have the option of continuing to accrue pension benefits as previously, or of choosing an alternative arrangement - by accepting pension
benefits limited by the cap - with a similar overall cost to the Group. Maeve Carton, Myles Lee and Albert Manifold have chosen to opt for the alternative arrangement which
involves capping their pensions in line with the provisions of the Finance Acts and receiving a supplementary taxable non-pensionable cash allowance in lieu of prospective
pension benefits foregone. These allowances are similar in value to the reduction in the Company’s liability represented by the pension benefit foregone. They are calculated
based on actuarial advice as the equivalent of the reduction in the Company’s liability to each individual and spread over the term to retirement as annual compensation
allowances. For 2012 the compensation allowances amount to €980,000 (2011: €980,000) for Myles Lee; €288,117 (2011: €335,195) for Albert Manifold and €174,931
(2011: €231,954) for Maeve Carton.
(iv) Other Remuneration Includes remuneration for Chairman, Board Committee work and allowances for non-executive Directors based outside of Ireland.
(v) Benefits These relate principally to the use of company cars and medical/life assurance.
(vi) Ernst Bärtschi became a Director on 26 October 2011.
(vii) Nicky Hartery became Chairman on 9 May 2012 succeeding Kieran McGowan who retired as a non-executive Director on the same date.
(viii) Heather Ann McSharry became a Director on 22 February 2012. Joyce O’Connor retired on 4 May 2011, while Liam O’Mahony retired on 31 December 2011.
CRH 63
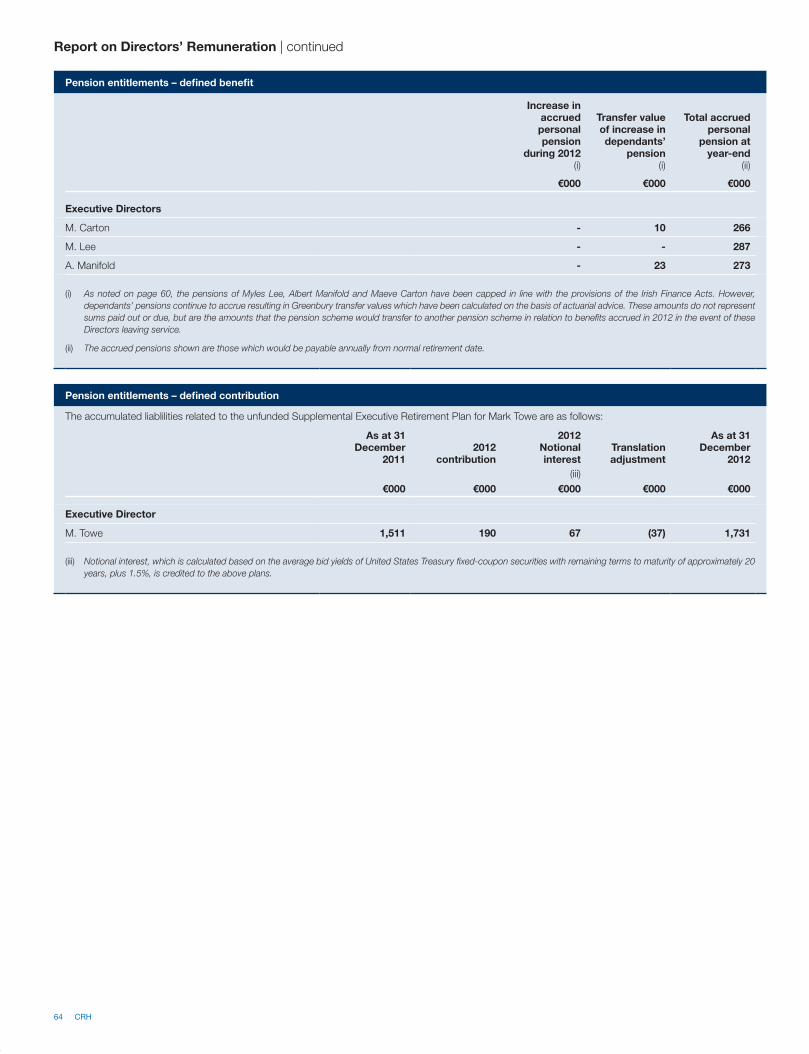
64 CRH
Pension entitlements – defined benefit
Increase inaccruedpersonal pension
during 2012 (i)
Transfer valueof increase independants’
pension (i)
Total accruedpersonal
pension atyear-end
(ii)
€000 €000 €000
Executive Directors
M. Carton - 10 266
M. Lee - - 287
A. Manifold - 23 273
(i) As noted on page 60, the pensions of Myles Lee, Albert Manifold and Maeve Carton have been capped in line with the provisions of the Irish Finance Acts. However,
dependants’ pensions continue to accrue resulting in Greenbury transfer values which have been calculated on the basis of actuarial advice. These amounts do not represent
sums paid out or due, but are the amounts that the pension scheme would transfer to another pension scheme in relation to benefits accrued in 2012 in the event of these
Directors leaving service.
(ii) The accrued pensions shown are those which would be payable annually from normal retirement date.
Pension entitlements – defined contribution
The accumulated liablilities related to the unfunded Supplemental Executive Retirement Plan for Mark Towe are as follows:
As at 31December
20112012
contribution
2012Notionalinterest
Translationadjustment
As at 31December
2012
(iii)
€000 €000 €000 €000 €000
Executive Director
M. Towe 1,511 190 67 (37) 1,731
(iii) Notional interest, which is calculated based on the average bid yields of United States Treasury fixed-coupon securities with remaining terms to maturity of approximately 20
years, plus 1.5%, is credited to the above plans.
Report on Directors’ Remuneration | continued
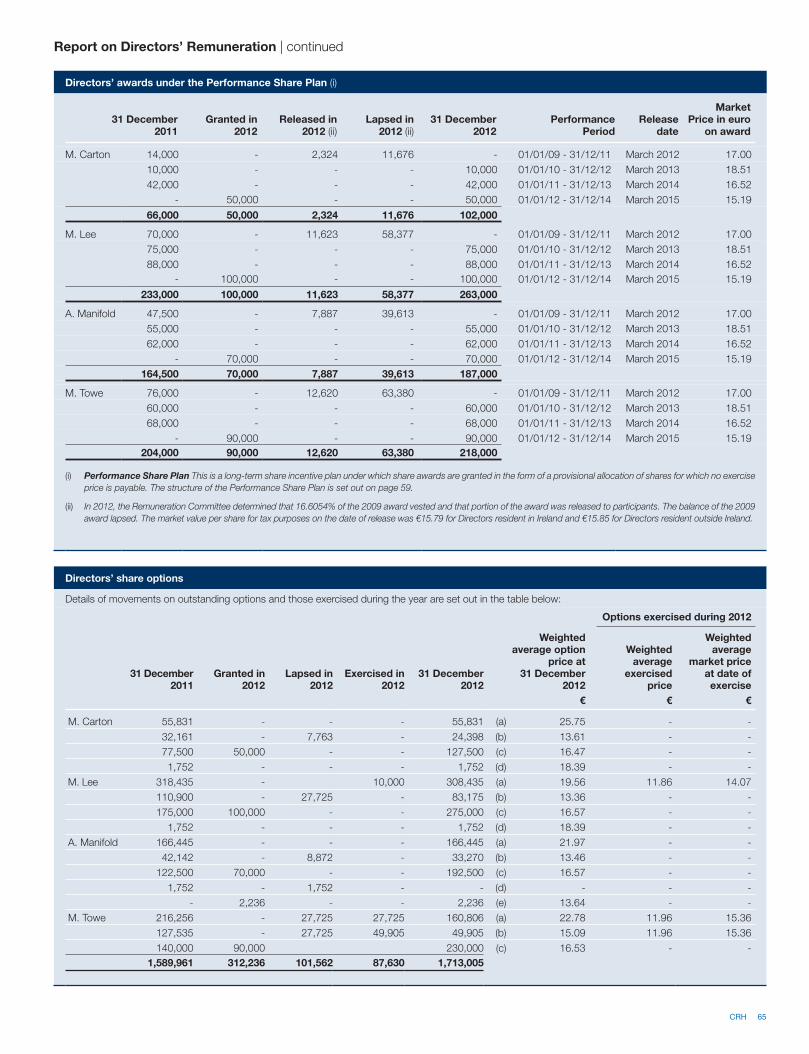
Report on Directors’ Remuneration | continued
Directors’ awards under the Performance Share Plan (i)
31 December2011
Granted in 2012
Released in 2012 (ii)
Lapsed in 2012 (ii)
31 December 2012
Performance Period
Release date
MarketPrice in euro
on award
M. Carton 14,000 - 2,324 11,676 - 01/01/09 - 31/12/11 March 2012 17.00
10,000 - - - 10,000 01/01/10 - 31/12/12 March 2013 18.51
42,000 - - - 42,000 01/01/11 - 31/12/13 March 2014 16.52
- 50,000 - - 50,000 01/01/12 - 31/12/14 March 2015 15.19
66,000 50,000 2,324 11,676 102,000
M. Lee 70,000 - 11,623 58,377 - 01/01/09 - 31/12/11 March 2012 17.00
75,000 - - - 75,000 01/01/10 - 31/12/12 March 2013 18.51
88,000 - - - 88,000 01/01/11 - 31/12/13 March 2014 16.52
- 100,000 - - 100,000 01/01/12 - 31/12/14 March 2015 15.19
233,000 100,000 11,623 58,377 263,000
A. Manifold 47,500 - 7,887 39,613 - 01/01/09 - 31/12/11 March 2012 17.00
55,000 - - - 55,000 01/01/10 - 31/12/12 March 2013 18.51
62,000 - - - 62,000 01/01/11 - 31/12/13 March 2014 16.52
- 70,000 - - 70,000 01/01/12 - 31/12/14 March 2015 15.19
164,500 70,000 7,887 39,613 187,000
M. Towe 76,000 - 12,620 63,380 - 01/01/09 - 31/12/11 March 2012 17.00
60,000 - - - 60,000 01/01/10 - 31/12/12 March 2013 18.51
68,000 - - - 68,000 01/01/11 - 31/12/13 March 2014 16.52
- 90,000 - - 90,000 01/01/12 - 31/12/14 March 2015 15.19
204,000 90,000 12,620 63,380 218,000
(i) Performance Share Plan This is a long-term share incentive plan under which share awards are granted in the form of a provisional allocation of shares for which no exercise
price is payable. The structure of the Performance Share Plan is set out on page 59.
(ii) In 2012, the Remuneration Committee determined that 16.6054% of the 2009 award vested and that portion of the award was released to participants. The balance of the 2009
award lapsed. The market value per share for tax purposes on the date of release was €15.79 for Directors resident in Ireland and €15.85 for Directors resident outside Ireland.
Directors’ share options
Details of movements on outstanding options and those exercised during the year are set out in the table below:
Options exercised during 2012
31 December2011
Granted in 2012
Lapsed in 2012
Exercised in 2012
31 December2012
Weighted average option
price at 31 December
2012
Weighted average
exercised price
Weighted average
market price at date of exercise
€ € €
M. Carton 55,831 - - - 55,831 (a) 25.75 - -
32,161 - 7,763 - 24,398 (b) 13.61 - -
77,500 50,000 - - 127,500 (c) 16.47 - -
1,752 - - - 1,752 (d) 18.39 - -
M. Lee 318,435 - 10,000 308,435 (a) 19.56 11.86 14.07
110,900 - 27,725 - 83,175 (b) 13.36 - -
175,000 100,000 - - 275,000 (c) 16.57 - -
1,752 - - - 1,752 (d) 18.39 - -
A. Manifold 166,445 - - - 166,445 (a) 21.97 - -
42,142 - 8,872 - 33,270 (b) 13.46 - -
122,500 70,000 - - 192,500 (c) 16.57 - -
1,752 - 1,752 - - (d) - - -
- 2,236 - - 2,236 (e) 13.64 - -
M. Towe 216,256 - 27,725 27,725 160,806 (a) 22.78 11.96 15.36
127,535 - 27,725 49,905 49,905 (b) 15.09 11.96 15.36
140,000 90,000 230,000 (c) 16.53 - -
1,589,961 312,236 101,562 87,630 1,713,005
CRH 65
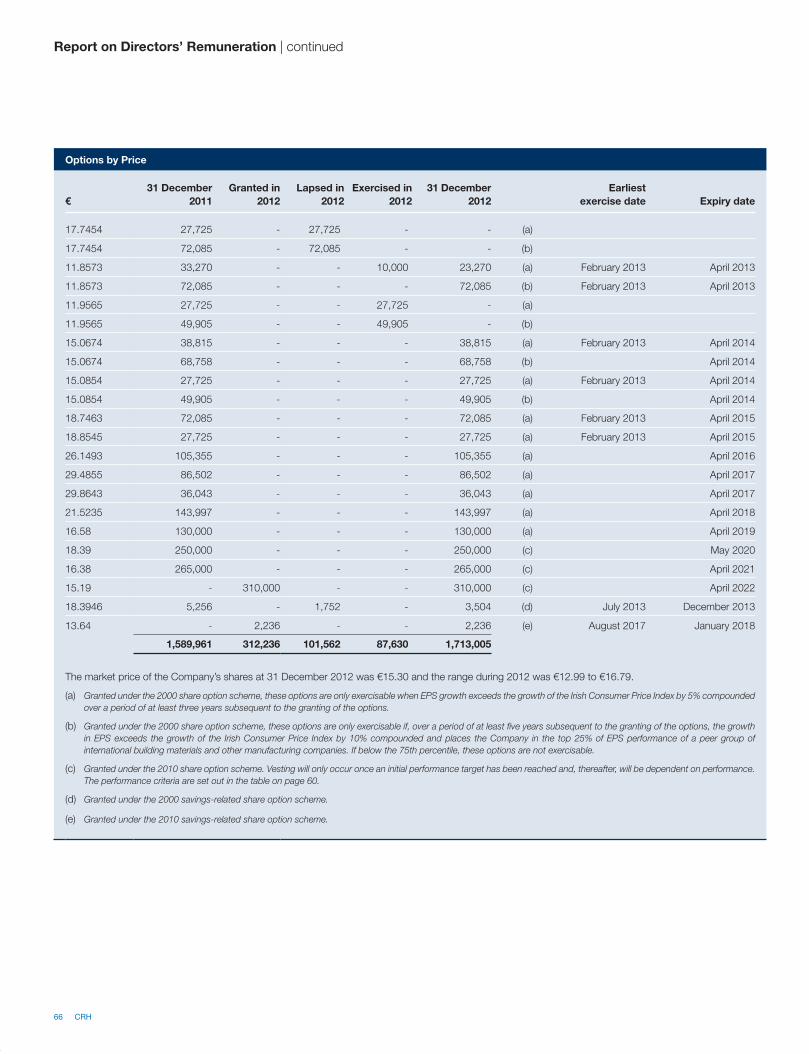
66 CRH
Report on Directors’ Remuneration | continued
Options by Price
€
31 December
2011
Granted in
2012
Lapsed in
2012
Exercised in
2012
31 December
2012
Earliest
exercise date Expiry date
17.7454 27,725 - 27,725 - - (a)
17.7454 72,085 - 72,085 - - (b)
11.8573 33,270 - - 10,000 23,270 (a) February 2013 April 2013
11.8573 72,085 - - - 72,085 (b) February 2013 April 2013
11.9565 27,725 - - 27,725 - (a)
11.9565 49,905 - - 49,905 - (b)
15.0674 38,815 - - - 38,815 (a) February 2013 April 2014
15.0674 68,758 - - - 68,758 (b) April 2014
15.0854 27,725 - - - 27,725 (a) February 2013 April 2014
15.0854 49,905 - - - 49,905 (b) April 2014
18.7463 72,085 - - - 72,085 (a) February 2013 April 2015
18.8545 27,725 - - - 27,725 (a) February 2013 April 2015
26.1493 105,355 - - - 105,355 (a) April 2016
29.4855 86,502 - - - 86,502 (a) April 2017
29.8643 36,043 - - - 36,043 (a) April 2017
21.5235 143,997 - - - 143,997 (a) April 2018
16.58 130,000 - - - 130,000 (a) April 2019
18.39 250,000 - - - 250,000 (c) May 2020
16.38 265,000 - - - 265,000 (c) April 2021
15.19 - 310,000 - - 310,000 (c) April 2022
18.3946 5,256 - 1,752 - 3,504 (d) July 2013 December 2013
13.64 - 2,236 - - 2,236 (e) August 2017 January 2018
1,589,961 312,236 101,562 87,630 1,713,005
The market price of the Company’s shares at 31 December 2012 was €15.30 and the range during 2012 was €12.99 to €16.79.
(a) Granted under the 2000 share option scheme, these options are only exercisable when EPS growth exceeds the growth of the Irish Consumer Price Index by 5% compounded
over a period of at least three years subsequent to the granting of the options.
(b) Granted under the 2000 share option scheme, these options are only exercisable if, over a period of at least five years subsequent to the granting of the options, the growth
in EPS exceeds the growth of the Irish Consumer Price Index by 10% compounded and places the Company in the top 25% of EPS performance of a peer group of
international building materials and other manufacturing companies. If below the 75th percentile, these options are not exercisable.
(c) Granted under the 2010 share option scheme. Vesting will only occur once an initial performance target has been reached and, thereafter, will be dependent on performance.
The performance criteria are set out in the table on page 60.
(d) Granted under the 2000 savings-related share option scheme.
(e) Granted under the 2010 savings-related share option scheme.
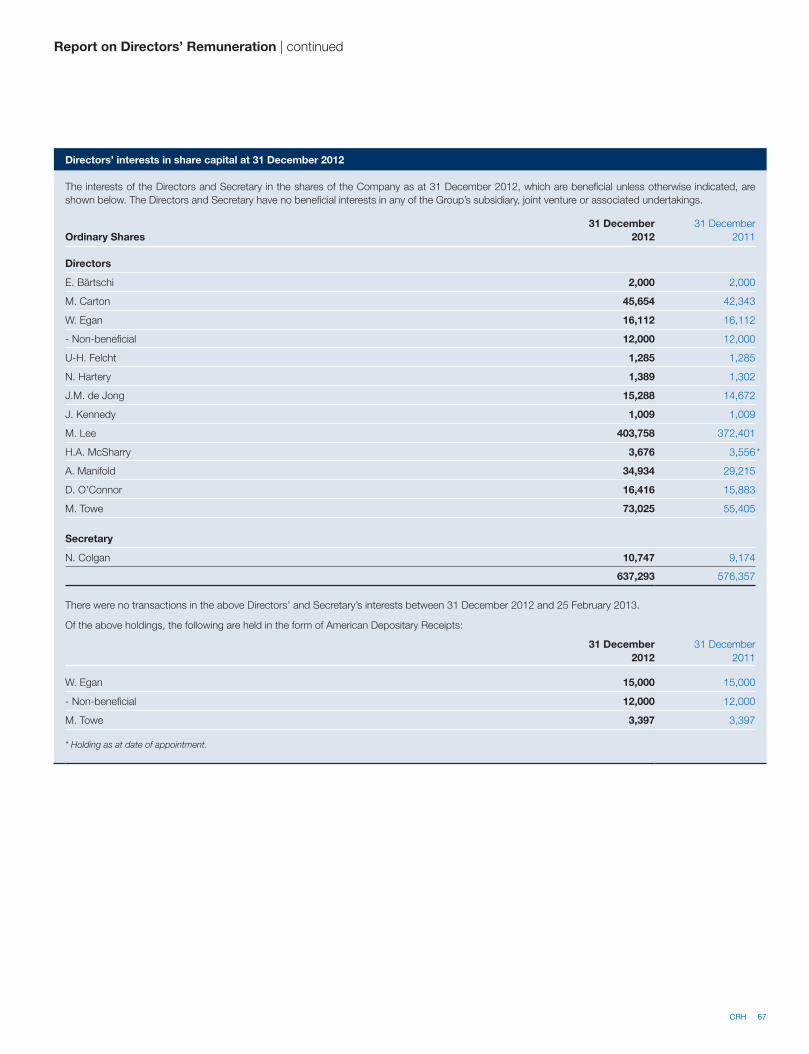
Directors’ interests in share capital at 31 December 2012
The interests of the Directors and Secretary in the shares of the Company as at 31 December 2012, which are beneficial unless otherwise indicated, are
shown below. The Directors and Secretary have no beneficial interests in any of the Group’s subsidiary, joint venture or associated undertakings.
Ordinary Shares
31 December
2012
31 December
2011
Directors
E. Bärtschi 2,000 2,000
M. Carton 45,654 42,343
W. Egan 16,112 16,112
- Non-beneficial 12,000 12,000
U-H. Felcht 1,285 1,285
N. Hartery 1,389 1,302
J.M. de Jong 15,288 14,672
J. Kennedy 1,009 1,009
M. Lee 403,758 372,401
H.A. McSharry 3,676 3,556 *
A. Manifold 34,934 29,215
D. O'Connor 16,416 15,883
M. Towe 73,025 55,405
Secretary
N. Colgan 10,747 9,174
637,293 576,357
There were no transactions in the above Directors’ and Secretary’s interests between 31 December 2012 and 25 February 2013.
Of the above holdings, the following are held in the form of American Depositary Receipts:
31 December
2012
31 December
2011
W. Egan 15,000 15,000
- Non-beneficial 12,000 12,000
M. Towe 3,397 3,397
* Holding as at date of appointment.
Report on Directors’ Remuneration | continued
CRH 67
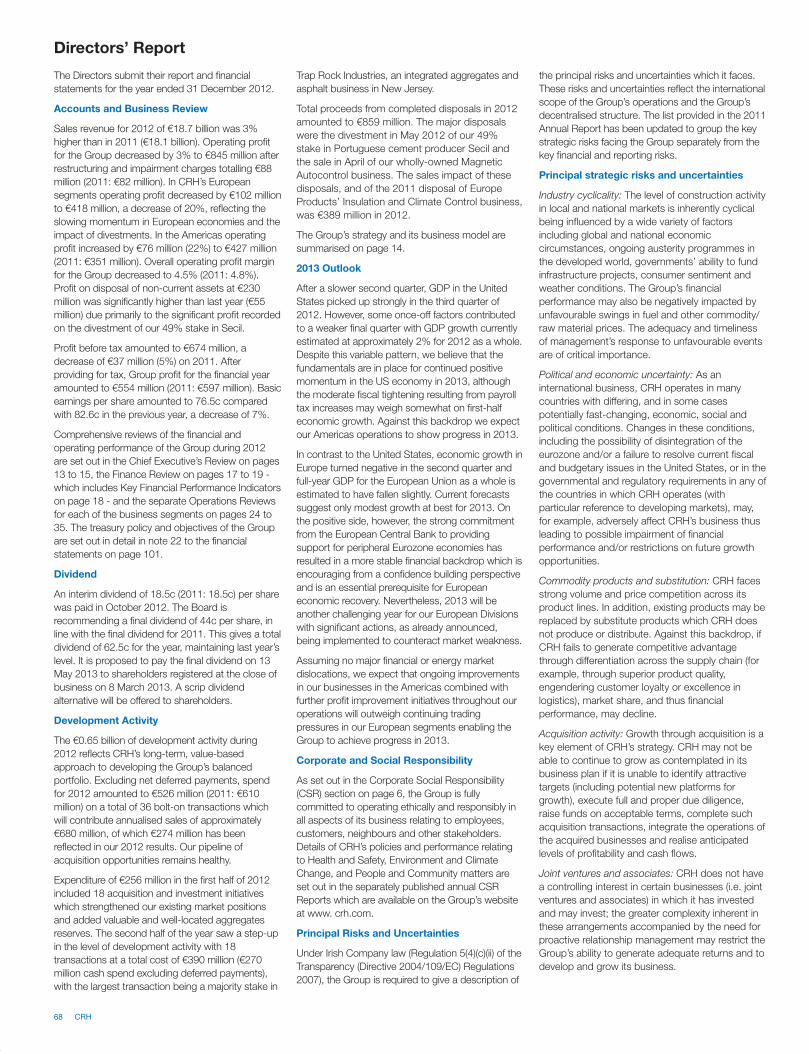
68 CRH
The Directors submit their report and financial
statements for the year ended 31 December 2012.
Accounts and Business Review
Sales revenue for 2012 of €18.7 billion was 3%
higher than in 2011 (€18.1 billion). Operating profit
for the Group decreased by 3% to €845 million after
restructuring and impairment charges totalling €88
million (2011: €82 million). In CRH’s European
segments operating profit decreased by €102 million
to €418 million, a decrease of 20%, reflecting the
slowing momentum in European economies and the
impact of divestments. In the Americas operating
profit increased by €76 million (22%) to €427 million
(2011: €351 million). Overall operating profit margin
for the Group decreased to 4.5% (2011: 4.8%).
Profit on disposal of non-current assets at €230
million was significantly higher than last year (€55
million) due primarily to the significant profit recorded
on the divestment of our 49% stake in Secil.
Profit before tax amounted to €674 million, a
decrease of €37 million (5%) on 2011. After
providing for tax, Group profit for the financial year
amounted to €554 million (2011: €597 million). Basic
earnings per share amounted to 76.5c compared
with 82.6c in the previous year, a decrease of 7%.
Comprehensive reviews of the financial and
operating performance of the Group during 2012
are set out in the Chief Executive’s Review on pages
13 to 15, the Finance Review on pages 17 to 19 -
which includes Key Financial Performance Indicators
on page 18 - and the separate Operations Reviews
for each of the business segments on pages 24 to
35. The treasury policy and objectives of the Group
are set out in detail in note 22 to the financial
statements on page 101.
Dividend
An interim dividend of 18.5c (2011: 18.5c) per share
was paid in October 2012. The Board is
recommending a final dividend of 44c per share, in
line with the final dividend for 2011. This gives a total
dividend of 62.5c for the year, maintaining last year’s
level. It is proposed to pay the final dividend on 13
May 2013 to shareholders registered at the close of
business on 8 March 2013. A scrip dividend
alternative will be offered to shareholders.
Development Activity
The €0.65 billion of development activity during
2012 reflects CRH’s long-term, value-based
approach to developing the Group’s balanced
portfolio. Excluding net deferred payments, spend
for 2012 amounted to €526 million (2011: €610
million) on a total of 36 bolt-on transactions which
will contribute annualised sales of approximately
€680 million, of which €274 million has been
reflected in our 2012 results. Our pipeline of
acquisition opportunities remains healthy.
Expenditure of €256 million in the first half of 2012
included 18 acquisition and investment initiatives
which strengthened our existing market positions
and added valuable and well-located aggregates
reserves. The second half of the year saw a step-up
in the level of development activity with 18
transactions at a total cost of €390 million (€270
million cash spend excluding deferred payments),
with the largest transaction being a majority stake in
Trap Rock Industries, an integrated aggregates and
asphalt business in New Jersey.
Total proceeds from completed disposals in 2012
amounted to €859 million. The major disposals
were the divestment in May 2012 of our 49%
stake in Portuguese cement producer Secil and
the sale in April of our wholly-owned Magnetic
Autocontrol business. The sales impact of these
disposals, and of the 2011 disposal of Europe
Products’ Insulation and Climate Control business,
was €389 million in 2012.
The Group’s strategy and its business model are
summarised on page 14.
2013 Outlook
After a slower second quarter, GDP in the United
States picked up strongly in the third quarter of
2012. However, some once-off factors contributed
to a weaker final quarter with GDP growth currently
estimated at approximately 2% for 2012 as a whole.
Despite this variable pattern, we believe that the
fundamentals are in place for continued positive
momentum in the US economy in 2013, although
the moderate fiscal tightening resulting from payroll
tax increases may weigh somewhat on first-half
economic growth. Against this backdrop we expect
our Americas operations to show progress in 2013.
In contrast to the United States, economic growth in
Europe turned negative in the second quarter and
full-year GDP for the European Union as a whole is
estimated to have fallen slightly. Current forecasts
suggest only modest growth at best for 2013. On
the positive side, however, the strong commitment
from the European Central Bank to providing
support for peripheral Eurozone economies has
resulted in a more stable financial backdrop which is
encouraging from a confidence building perspective
and is an essential prerequisite for European
economic recovery. Nevertheless, 2013 will be
another challenging year for our European Divisions
with significant actions, as already announced,
being implemented to counteract market weakness.
Assuming no major financial or energy market
dislocations, we expect that ongoing improvements
in our businesses in the Americas combined with
further profit improvement initiatives throughout our
operations will outweigh continuing trading
pressures in our European segments enabling the
Group to achieve progress in 2013.
Corporate and Social Responsibility
As set out in the Corporate Social Responsibility
(CSR) section on page 6, the Group is fully
committed to operating ethically and responsibly in
all aspects of its business relating to employees,
customers, neighbours and other stakeholders.
Details of CRH’s policies and performance relating
to Health and Safety, Environment and Climate
Change, and People and Community matters are
set out in the separately published annual CSR
Reports which are available on the Group’s website
at www. crh.com.
Principal Risks and Uncertainties
Under Irish Company law (Regulation 5(4)(c)(ii) of the
Transparency (Directive 2004/109/EC) Regulations
2007), the Group is required to give a description of
the principal risks and uncertainties which it faces.
These risks and uncertainties reflect the international
scope of the Group’s operations and the Group’s
decentralised structure. The list provided in the 2011
Annual Report has been updated to group the key
strategic risks facing the Group separately from the
key financial and reporting risks.
Principal strategic risks and uncertainties
Industry cyclicality: The level of construction activity
in local and national markets is inherently cyclical
being influenced by a wide variety of factors
including global and national economic
circumstances, ongoing austerity programmes in
the developed world, governments’ ability to fund
infrastructure projects, consumer sentiment and
weather conditions. The Group’s financial
performance may also be negatively impacted by
unfavourable swings in fuel and other commodity/
raw material prices. The adequacy and timeliness
of management’s response to unfavourable events
are of critical importance.
Political and economic uncertainty: As an
international business, CRH operates in many
countries with differing, and in some cases
potentially fast-changing, economic, social and
political conditions. Changes in these conditions,
including the possibility of disintegration of the
eurozone and/or a failure to resolve current fiscal
and budgetary issues in the United States, or in the
governmental and regulatory requirements in any of
the countries in which CRH operates (with
particular reference to developing markets), may,
for example, adversely affect CRH’s business thus
leading to possible impairment of financial
performance and/or restrictions on future growth
opportunities.
Commodity products and substitution: CRH faces
strong volume and price competition across its
product lines. In addition, existing products may be
replaced by substitute products which CRH does
not produce or distribute. Against this backdrop, if
CRH fails to generate competitive advantage
through differentiation across the supply chain (for
example, through superior product quality,
engendering customer loyalty or excellence in
logistics), market share, and thus financial
performance, may decline.
Acquisition activity: Growth through acquisition is a
key element of CRH’s strategy. CRH may not be
able to continue to grow as contemplated in its
business plan if it is unable to identify attractive
targets (including potential new platforms for
growth), execute full and proper due diligence,
raise funds on acceptable terms, complete such
acquisition transactions, integrate the operations of
the acquired businesses and realise anticipated
levels of profitability and cash flows.
Joint ventures and associates: CRH does not have
a controlling interest in certain businesses (i.e. joint
ventures and associates) in which it has invested
and may invest; the greater complexity inherent in
these arrangements accompanied by the need for
proactive relationship management may restrict the
Group’s ability to generate adequate returns and to
develop and grow its business.
Directors’ Report
Human resources: Existing processes to recruit,
develop and retain talented individuals and promote
their mobility within a decentralised Group may be
inadequate thus giving rise to management attrition
and difficulties in succession planning and potentially
impeding the continued realisation of the Group’s
core strategy of performance and growth.
Corporate communications: As a publicly-listed
company, CRH undertakes regular communication
with its stakeholders. Given that these
communications may contain forward-looking
statements, which by their nature involve
uncertainty, actual results and developments may
differ from those communicated due to a variety of
external and internal factors giving rise to
reputational risk.
Corporate Social Responsibility: CRH is subject to
stringent and evolving laws, regulations, standards
and best practices in the area of Corporate Social
Responsibility (comprising corporate governance,
environmental management and climate change
(specifically capping of emissions), health and safety
management and social performance) which may
give rise to increased ongoing remediation and/or
other compliance costs and may adversely affect
the Group’s reported results and financial condition.
Laws and regulations: CRH is subject to many laws
and regulations (both local and international),
including those relating to competition law,
corruption and fraud, throughout the many
jurisdictions in which it operates and is thus exposed
to changes in those laws and regulations and to the
outcome of any investigations conducted by
governmental, international and other regulatory
authorities, which may result in the imposition of
fines and/or sanctions for non-compliance and may
damage the Group’s reputation.
Principal financial and reporting risks and
uncertainties
Financial instruments: CRH uses financial
instruments throughout its businesses giving rise to
interest rate, foreign currency, credit/counterparty
and liquidity risks. A downgrade of CRH’s credit
ratings may give rise to increases in funding costs in
respect of future debt and may impair the Group’s
ability to raise funds on acceptable terms. In
addition, against the backdrop of heightened
uncertainties, in particular in the eurozone,
insolvency of the financial institutions with which
CRH conducts business (or a downgrade in their
credit ratings) may lead to losses in CRH’s liquid
investments, derivative assets and cash and cash
equivalents balances or render it more difficult either
to utilise the Group’s existing debt capacity or
otherwise obtain financing for the Group’s
operations.
Defined benefit pension schemes: CRH operates
a number of defined benefit pension schemes in
certain of its operating jurisdictions. The assets
and liabilities of these schemes may exhibit
significant period-on-period volatility attributable
primarily to asset valuations, changes in bond
yields and longevity. In addition to future service
contributions, significant cash contributions may
be required to remediate deficits applicable to
past service.
Insurance counterparties: In its worldwide insurance
programme, the Group carries appropriate levels of
insurance for typical business risks (including
product liability) with various leading insurance
companies. However, in the event of the failure of
one or more of its insurance counterparties, the
Group could be impacted by losses where recovery
from such counterparties is not possible.
Foreign currency translation: CRH’s activities are
conducted primarily in the local currency of the
country of operation resulting in low levels of foreign
currency transactional risk. The principal foreign
exchange risks to which the consolidated financial
statements are exposed pertain to adverse
movements in reported results when translated into
euro (which is the Group’s reporting currency)
together with declines in the euro value of the
Group’s net investments which are denominated in a
wide basket of currencies other than the euro.
Goodwill impairment: Significant under-performance
in any of CRH’s major cash-generating units may
give rise to a material write-down of goodwill which
would have a substantial impact on the Group’s
income and equity.
Inspections by Public Company Accounting
Oversight Board (‘PCAOB’): Our auditors, like other
independent registered public accounting firms
operating in Ireland and a number of other European
countries, are not currently permitted to be subject
to inspection by the PCAOB, and as such, investors
are deprived of the benefits of PCAOB inspections.
The principal financial and reporting risks and
uncertainties are subject to further disclosure in the
notes to the consolidated financial statements and
the accompanying accounting policies.
As demonstrated by CRH’s proven record of
superior performance, the Group’s management
team has substantial and long experience in dealing
with the impact of these risks. The mechanisms
through which the principal risks and uncertainties
are managed are addressed in the “Risk
Management and Internal Control” section of the
Corporate Governance Report.
Report on Directors’ Remuneration
Resolution 3 to be proposed at the Annual General
Meeting deals with the Report on Directors’
Remuneration, as set out on pages 54 to 67, which
the Board has decided to present to shareholders
for the purposes of a non-binding advisory vote.
This is in line with international best practice and the
Directors believe that the resolution will afford
shareholders an opportunity to have a “say on pay”.
Board of Directors
Mr. K. McGowan retired from the Board on
9 May 2012.
Ms. H.A. McSharry was appointed to the Board on
22 February 2012.
Under the Company’s Articles of Association,
co-opted Directors are required to submit
themselves to shareholders for election at the
Annual General Meeting following their appointment
and all the Directors are required to submit
themselves for re-election at intervals of not more
than three years. However, in accordance with the
provisions contained in the UK Corporate
Governance Code, the Board has decided that all
Directors eligible for re-election should retire at each
Annual General Meeting and offer themselves for
re-election.
Auditors
Section 160(2) of the Companies Act, 1963 provides
that the auditor of an Irish company shall be
automatically re-appointed at a company’s annual
general meeting unless the auditor has given notice
in writing of his unwillingness to be re-appointed or a
resolution has been passed at that meeting
appointing someone else or providing expressly that
the incumbent auditor shall not be re-appointed. In
this respect, Irish company law differs from the
requirements that apply in other jurisdictions, for
example in the UK, where auditors must be
re-appointed annually by shareholders at the Annual
General Meeting. The Auditors, Ernst & Young,
Chartered Accountants, are willing to continue in
office.
As required under Irish law, a resolution authorising
the Directors to fix the remuneration of the Auditors
will be submitted to the Annual General Meeting.
Disapplication of Pre-emption Rights
A special resolution will be proposed at the Annual
General Meeting to renew the Directors’ authority to
disapply statutory pre-emption rights in relation to
allotments of shares for cash. In respect of
allotments other than for rights issues to ordinary
shareholders and employees’ share schemes, the
authority is limited to Ordinary/Income Shares
(including the re-issue of Treasury Shares) having a
nominal value of €12,474,000, representing 5%
approximately of the issued Ordinary/Income share
capital at 25 February 2013. This authority will expire
on the earlier of the date of the Annual General
Meeting in 2014 or 7 August 2014.
The Directors intend to follow the Pre-Emption
Group’s Statement of Principles in that allotments of
shares for cash and the re-issue of Treasury Shares
on a non pre-emptive basis, other than for rights
issues to ordinary shareholders and employees’
share schemes, will not exceed 7.5% of the issued
Ordinary/Income share capital within a rolling three
year period without prior consultation with
shareholders.
Transactions in Own Shares
During 2012, 1,317,872 (2011: 287,950) Treasury
Shares were re-issued under the Group’s Share
Schemes. In addition, 226,617 (2011: 150,330)
Ordinary Shares were transferred to the Trustees of
the CRH plc Employee Benefit Trust at €15.82 per
Ordinary Share for the purpose of satisfying the
release of awards, made under the CRH 2006
Performance Share Plan, which vested in 2012. As
at 25 February 2013, 7,360,558 shares were held
as Treasury Shares, equivalent to 1.01% of the
Ordinary Shares in issue (excluding Treasury
Shares).
A special resolution will be proposed at the 2013
Annual General Meeting to renew the authority of
the Company, or any of its subsidiaries, to purchase
up to 10% of the Company’s Ordinary/ Income
Shares in issue at the date of the Annual General
Directors’ Report | continued
CRH 69
70 CRH
Meeting. If approved, the minimum price which may
be paid for shares purchased by the Company shall
not be less than the nominal value of the shares and
the maximum price will be 105% of the higher of the
last independent trade in the Company’s shares (or
current independent bid, if higher) and the average
market price of such shares over the preceding five
days. A special resolution will also be proposed for
the purpose of setting the maximum and minimum
prices at which Treasury Shares (effectively shares
purchased and not cancelled) may be re-issued
off-market by the Company. If granted, both of these
authorities will expire on the earlier of the date of the
Annual General Meeting in 2014 or 7 August 2014.
As at 25 February 2013, options to subscribe for
a total of 24,332,209 Ordinary/Income Shares are
outstanding, representing 3.35% of the issued
Ordinary/lncome share capital (excluding Treasury
Shares). If the authority to purchase Ordinary/
Income Shares was used in full, the options would
represent 3.72% of the remaining shares in issue.
The Directors do not have any current intention of
exercising the power to purchase the Company’s
own shares and will only do so if they consider it
to be in the best interests of the Company and its
shareholders.
Annual General Meeting
Your attention is drawn to the Notice of Meeting
set out on pages 138 and 139.
Your Directors believe that the resolutions to be
proposed at the Meeting are in the best interests
of the Company and its shareholders as a whole
and, therefore, recommend you to vote in favour
of the resolutions. Your Directors intend to vote in
favour of the resolutions in respect of their own
beneficial holdings of Ordinary Shares, amounting
in total, on 25 February 2013, to 614,546
Ordinary Shares, representing approximately
0.09% of the issued Ordinary share capital of your
Company.
Subsidiary, Joint Venture and Associated
Undertakings
The Group has over 1,000 subsidiary, joint venture
and associated undertakings. The principal ones
as at 31 December 2012 are listed on pages 128
to 135.
Statement of Directors’ Responsibilities
The Directors, whose names are listed on pages
36 and 37, are responsible for preparing the
Annual Report and Financial Statements in
accordance with applicable laws and regulations.
Company law in the Republic of Ireland requires
the Directors to prepare financial statements for
each financial year which give a true and fair view
of the state of affairs of the Parent Company and
of the Group and of the profit or loss of the Group
for that period (consolidated financial statements).
In preparing the consolidated financial statements,
the Directors are required to:
– select suitable accounting policies and then
apply them consistently;
– make judgements and estimates that are
reasonable and prudent;
– comply with applicable International Financial
Reporting Standards as adopted by the European
Union, subject to any material departures
disclosed and explained in the financial
statements; and
– prepare the financial statements on the going
concern basis unless it is inappropriate to
presume that the Group will continue in business.
The Directors are also required by the Transparency
(Directive 2004/109/EC) Regulations 2007 and the
Transparency Rules of the Central Bank of Ireland to
include a management report containing a fair
review of the business and a description of the
principal risks and uncertainties facing the Group.
The Directors confirm that they have complied with
the above requirements in preparing the 2012
Annual Report and consolidated financial
statements.
The considerations set out above for the Group are
also required to be addressed by the Directors in
preparing the financial statements of the Parent
Company (which are set out on pages 118 to 121,
in respect of which the applicable accounting
standards are those which are generally accepted in
the Republic of Ireland.
The Directors have elected to prepare the Parent
Company’s Financial Statements in accordance with
Generally Accepted Accounting Practice in Ireland
(Irish GAAP) comprising the financial reporting
standards issued by the Accounting Standards
Board and promulgated by the Institute of Chartered
Accountants in Ireland, together with the Companies
Acts, 1963 to 2012.
The Directors are responsible for keeping proper
books of account which disclose with reasonable
accuracy at any time the financial position of the
Parent Company and which enable them to ensure
that the consolidated financial statements are
prepared in accordance with applicable International
Financial Reporting Standards as adopted by the
European Union and comply with the provisions of
the Companies Acts, 1963 to 2012 and Article 4 of
the IAS Regulation.
The Directors have appointed appropriate
accounting personnel, including a professionally
qualified Finance Director, in order to ensure that
those requirements are met. The books and
accounting records of the Company are maintained
at the principal executive offices located at Belgard
Castle, Clondalkin, Dublin 22.
The Directors are also responsible for safeguarding
the assets of the Group and hence for taking
reasonable steps for the prevention and detection of
fraud and other irregularities.
Directors’ Report | continued
On behalf of the Board,
N. Hartery, M. Lee,
Directors
25 February 2013
Regulatory Information
This section contains information which is
required to be provided for regulatory purposes.
2009 Corporate Governance Regulations:
For the purpose of Statutory Instrument
450/2009 European Communities (Directive
2006/46) Regulations 2009, as amended by
Statutory Instrument 83/2010 European
Communities (Directive 2006/46/EC)
(Amendment) Regulations 2010, the Corporate
Governance report on pages 38 to 53 is
deemed to be incorporated in this part of the
Directors’ Report. Details of the Company’s
employee shares schemes and capital structure
can be found in notes 8 and 29 to the financial
statements on pages 88 and 89 and 113 and
114 respectively.
2006 Takeover Regulations:
For the purpose of Regulation 21 of Statutory
Instrument 255/2006 European Communities
(Takeover Bids (Directive 2004/25/EC))
Regulations 2006, the rules relating to the
appointment and replacement of Directors are
summarised in the section on “Board of
Directors” in this Report on page 69 and in the
following sections of the Corporate Governance
Report: “Membership of the Board” on page 40,
“Directors’ retirement and re-election” on page
42 and “Memorandum and Articles of
Association” on page 53. The Company’s
Memorandum and Articles of Association, which
are available on the CRH website, are deemed
to be incorporated in this part of the Directors’
Report. The Group has certain banking facilities
and bond issues outstanding which may require
repayment in the event that a change in control
occurs with respect to the Company. In
addition, the Company’s share option schemes
and Performance Share Plan contain change of
control provisions which can allow for the
acceleration of the exercisability of share options
and the vesting of share awards in the event
that a change of control occurs with respect to
the Company.
2007 Transparency Regulations:
For the purpose of Statutory Instrument
277/2007 Transparency (Directive 2004/109/
EC) Regulations 2007, the report on Corporate
Social Responsibility as published on the CRH
website is deemed to be incorporated in this
part of the Directors’ Report, together with the
following sections of this Annual Report: the
Chairman’s Statement on pages 8 and 9, the
Chief Executive’s review on pages 13 to 15, the
Finance Review on pages 17 to 19, the
Operations Reviews on pages 24 to 35, the
details of earnings per Ordinary Share in note 13
to the consolidated financial statements, details
of derivative financial instruments in note 25, the
details of the re-issue of Treasury Shares in note
29 and details of employees
in note 6.
We have audited the financial statements of CRH plc for the year ended 31
December 2012 which comprise the Consolidated Income Statement, the
Consolidated Statement of Comprehensive Income, the Consolidated and
Company Balance Sheets, the Consolidated Statement of Changes in Equity,
the Consolidated Statement of Cash Flows, the Accounting Policies, the
related notes 1 to 33 (Group) and the related notes 1 to 12 (Company). The
financial reporting framework that has been applied in the preparation of the
Group Financial Statements is Irish law and International Financial Reporting
Standards (IFRSs) as adopted by the European Union. The financial reporting
framework that has been applied in the preparation of the Company Financial
Statements is Irish law and accounting standards issued by the Financial
Reporting Council and promulgated by the Institute of Chartered Accountants
in Ireland (Generally Accepted Accounting Practice in Ireland).
This Report is made solely to the Company’s members, as a body, in
accordance with section 193 of the Companies Act, 1990. Our audit work has
been undertaken so that we might state to the Company’s members those
matters we are required to state to them in an auditor’s report and for no other
purpose. To the fullest extent permitted by law, we do not accept or assume
responsibility to anyone other than the Company and the Company’s members
as a body, for our audit work, for this Report, or for the opinions we have
formed.
Respective responsibilities of Directors and Auditors
As explained more fully in the Statement of Directors’ Responsibilities the
Directors are responsible for the preparation of the financial statements giving
a true and fair view. Our responsibility is to audit and express an opinion on
the financial statements in accordance with Irish law and International
Standards on Auditing (UK and Ireland). Those standards require us to
comply with the Auditing Practices Board’s Ethical Standards for Auditors.
Scope of the audit of the financial statements
An audit involves obtaining evidence about the amounts and disclosures in
the financial statements sufficient to give reasonable assurance that the
financial statements are free from material misstatement, whether caused by
fraud or error. This includes an assessment of: whether the accounting
policies are appropriate to the Group and the Company’s circumstances and
have been consistently applied and adequately disclosed; the reasonableness
of significant accounting estimates made by the Directors; and the overall
presentation of the financial statements. In addition, we read all the financial
and non-financial information in the Annual Report to identify material
inconsistencies with the audited financial statements. If we become aware of
any apparent material misstatements or inconsistencies we consider the
implications for our Report.
Opinion on financial statements
In our opinion:
– the Group Financial Statements give a true and fair view, in accordance with
IFRSs as adopted by the European Union, of the state of the Group’s affairs
as at 31 December 2012 and of its profit for the year then ended;
– the Company Balance Sheet gives a true and fair view in accordance with
Generally Accepted Accounting Practice in Ireland of the state of the
Company’s affairs as at 31 December 2012; and
– the financial statements have been properly prepared in accordance with
the requirements of the Companies Acts 1963 to 2012 and, as regards the
Group Financial Statements, Article 4 of the IAS Regulation.
Matters on which we are required to report by the Companies Acts
1963 to 2012
– We have obtained all the information and explanations which we consider
necessary for the purposes of our audit.
– In our opinion proper books of account have been kept by the Company.
– The Company Balance Sheet is in agreement with the books of account.
– The net assets of the Company, as stated in the Company Balance Sheet
are more than half of the amount of its called-up share capital and, in our
opinion, on that basis there did not exist at 31 December 2012 a financial
situation which under section 40(1) of the Companies (Amendment) Act,
1983 would require the convening of an extraordinary general meeting of
the Company.
– In our opinion the information given in the Directors’ Report is consistent
with the financial statements and the description in the Corporate
Governance Report of the main features of the internal control and risk
management systems in relation to the process for preparing the Group
Financial Statements is consistent with the Group Financial Statements.
Matters on which we are required to report by exception
We have nothing to report in respect of the following:
Under the Companies Acts 1963 to 2012 we are required to report to you if,
in our opinion, the disclosures of Directors’ remuneration and transactions
specified by law are not made.
Under the Listing Rules we are required to review:
– the Directors’ Statement in relation to going concern;
– the part of the Corporate Governance Report relating to the Company’s
compliance with the nine provisions of the UK Corporate Governance Code
specified for our review; and
– certain elements of the disclosures in the report by the Board on Directors’
remuneration.
Independent Auditor’s Reportto the members of CRH public limited company
Breffni Maguire
for and on behalf of Ernst & Young
Dublin
25 February 2013
CRH 71
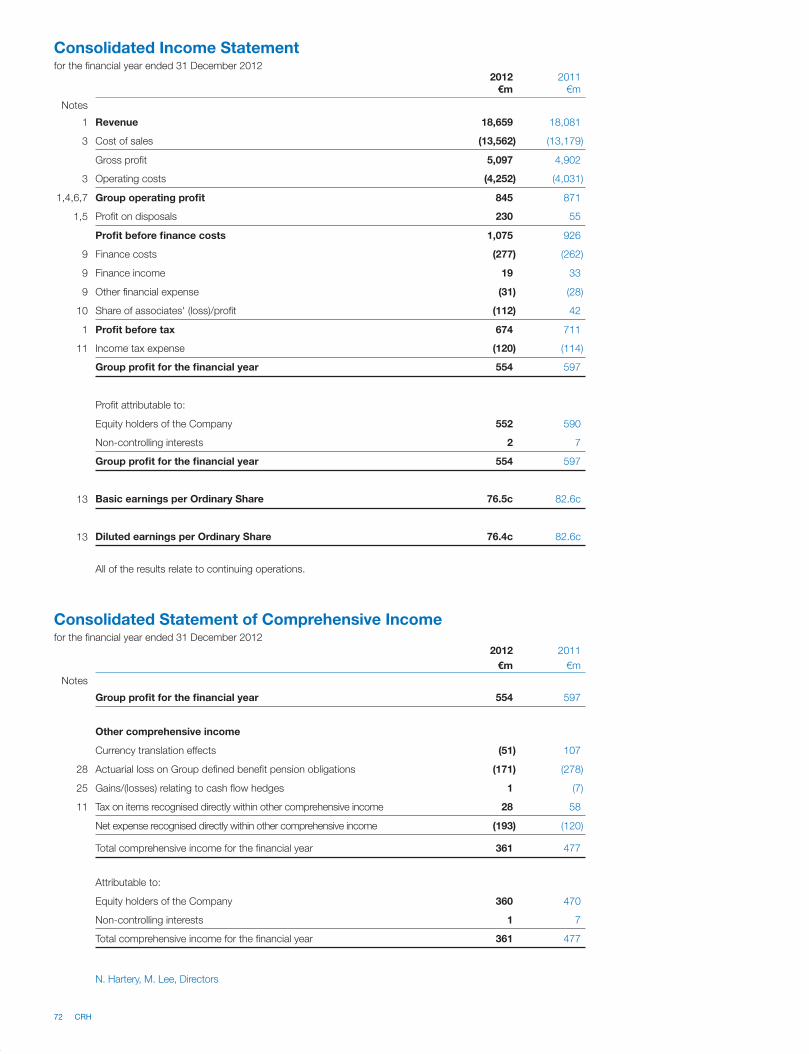
72 CRH
Consolidated Income Statementfor the financial year ended 31 December 2012
2012 2011€m €m
Notes
1 Revenue 18,659 18,081
3 Cost of sales (13,562) (13,179)
Gross profit 5,097 4,902
3 Operating costs (4,252) (4,031)
1,4,6,7 Group operating profit 845 871
1,5 Profit on disposals 230 55
Profit before finance costs 1,075 926
9 Finance costs (277) (262)
9 Finance income 19 33
9 Other financial expense (31) (28)
10 Share of associates' (loss)/profit (112) 42
1 Profit before tax 674 711
11 Income tax expense (120) (114)
Group profit for the financial year 554 597
Profit attributable to:
Equity holders of the Company 552 590
Non-controlling interests 2 7
Group profit for the financial year 554 597
13 Basic earnings per Ordinary Share 76.5c 82.6c
13 Diluted earnings per Ordinary Share 76.4c 82.6c
All of the results relate to continuing operations.
Consolidated Statement of Comprehensive Incomefor the financial year ended 31 December 2012
2012 2011
€m €m
Notes
Group profit for the financial year 554 597
Other comprehensive income
Currency translation effects (51) 107
28 Actuarial loss on Group defined benefit pension obligations (171) (278)
25 Gains/(losses) relating to cash flow hedges 1 (7)
11 Tax on items recognised directly within other comprehensive income 28 58
Net expense recognised directly within other comprehensive income (193) (120)
Total comprehensive income for the financial year 361 477
Attributable to:
Equity holders of the Company 360 470
Non-controlling interests 1 7
Total comprehensive income for the financial year 361 477
N. Hartery, M. Lee, Directors
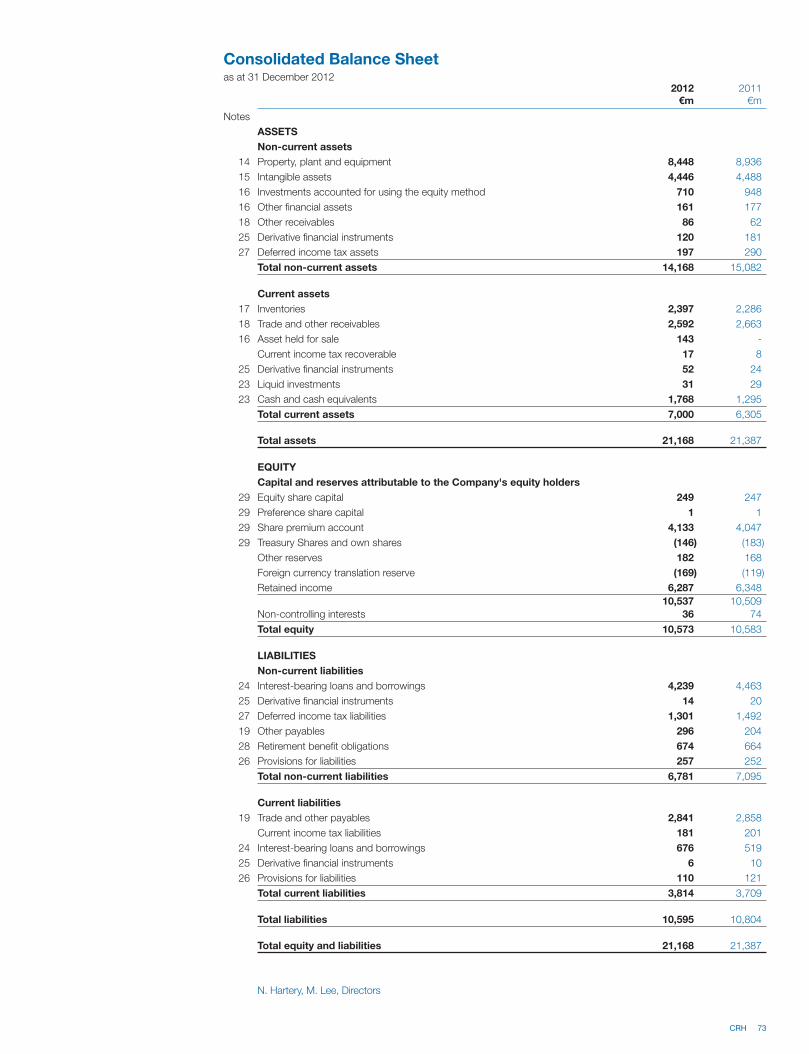
CRH 73
N. Hartery, M. Lee, Directors
Consolidated Balance Sheetas at 31 December 2012
2012 2011€m €m
Notes
ASSETS
Non-current assets
14 Property, plant and equipment 8,448 8,936
15 Intangible assets 4,446 4,488
16 Investments accounted for using the equity method 710 948
16 Other financial assets 161 177
18 Other receivables 86 62
25 Derivative financial instruments 120 181
27 Deferred income tax assets 197 290
Total non-current assets 14,168 15,082
Current assets
17 Inventories 2,397 2,286
18 Trade and other receivables 2,592 2,663
16 Asset held for sale 143 -
Current income tax recoverable 17 8
25 Derivative financial instruments 52 24
23 Liquid investments 31 29
23 Cash and cash equivalents 1,768 1,295
Total current assets 7,000 6,305
Total assets 21,168 21,387
EQUITY
Capital and reserves attributable to the Company's equity holders
29 Equity share capital 249 247
29 Preference share capital 1 1
29 Share premium account 4,133 4,047
29 Treasury Shares and own shares (146) (183)
Other reserves 182 168
Foreign currency translation reserve (169) (119)
Retained income 6,287 6,348
10,537 10,509
Non-controlling interests 36 74
Total equity 10,573 10,583
LIABILITIES
Non-current liabilities
24 Interest-bearing loans and borrowings 4,239 4,463
25 Derivative financial instruments 14 20
27 Deferred income tax liabilities 1,301 1,492
19 Other payables 296 204
28 Retirement benefit obligations 674 664
26 Provisions for liabilities 257 252
Total non-current liabilities 6,781 7,095
Current liabilities
19 Trade and other payables 2,841 2,858
Current income tax liabilities 181 201
24 Interest-bearing loans and borrowings 676 519
25 Derivative financial instruments 6 10
26 Provisions for liabilities 110 121
Total current liabilities 3,814 3,709
Total liabilities 10,595 10,804
Total equity and liabilities 21,168 21,387
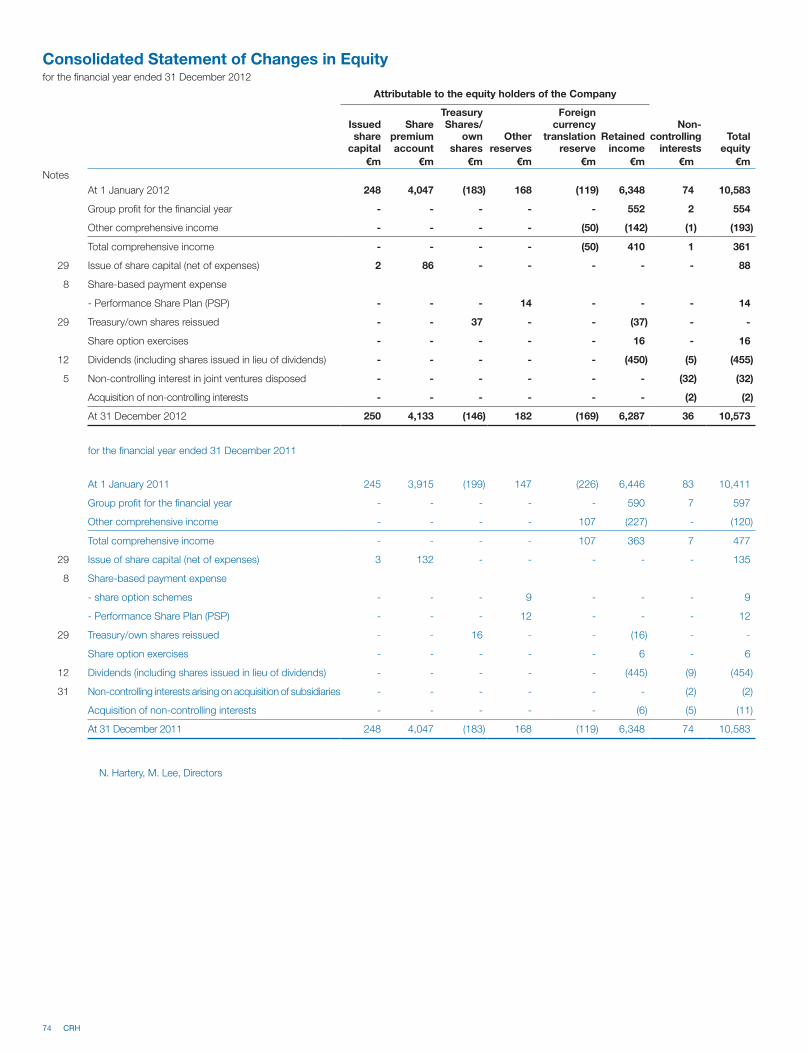
74 CRH
Consolidated Statement of Changes in Equityfor the financial year ended 31 December 2012
Attributable to the equity holders of the Company
Issuedshare
capital
Sharepremiumaccount
TreasuryShares/
ownshares
Otherreserves
Foreigncurrency
translationreserve
Retainedincome
Non- controlling
interestsTotal
equity
€m €m €m €m €m €m €m €m
Notes
At 1 January 2012 248 4,047 (183) 168 (119) 6,348 74 10,583
Group profit for the financial year - - - - - 552 2 554
Other comprehensive income - - - - (50) (142) (1) (193)
Total comprehensive income - - - - (50) 410 1 361
29 Issue of share capital (net of expenses) 2 86 - - - - - 88
8 Share-based payment expense
- Performance Share Plan (PSP) - - - 14 - - - 14
29 Treasury/own shares reissued - - 37 - - (37) - -
Share option exercises - - - - - 16 - 16
12 Dividends (including shares issued in lieu of dividends) - - - - - (450) (5) (455)
5 Non-controlling interest in joint ventures disposed - - - - - - (32) (32)
Acquisition of non-controlling interests - - - - - - (2) (2)
At 31 December 2012 250 4,133 (146) 182 (169) 6,287 36 10,573
for the financial year ended 31 December 2011
At 1 January 2011 245 3,915 (199) 147 (226) 6,446 83 10,411
Group profit for the financial year - - - - - 590 7 597
Other comprehensive income - - - - 107 (227) - (120)
Total comprehensive income - - - - 107 363 7 477
29 Issue of share capital (net of expenses) 3 132 - - - - - 135
8 Share-based payment expense
- share option schemes - - - 9 - - - 9
- Performance Share Plan (PSP) - - - 12 - - - 12
29 Treasury/own shares reissued - - 16 - - (16) - -
Share option exercises - - - - - 6 - 6
12 Dividends (including shares issued in lieu of dividends) - - - - - (445) (9) (454)
31 Non-controlling interests arising on acquisition of subsidiaries - - - - - - (2) (2)
Acquisition of non-controlling interests - - - - - (6) (5) (11)
At 31 December 2011 248 4,047 (183) 168 (119) 6,348 74 10,583
N. Hartery, M. Lee, Directors
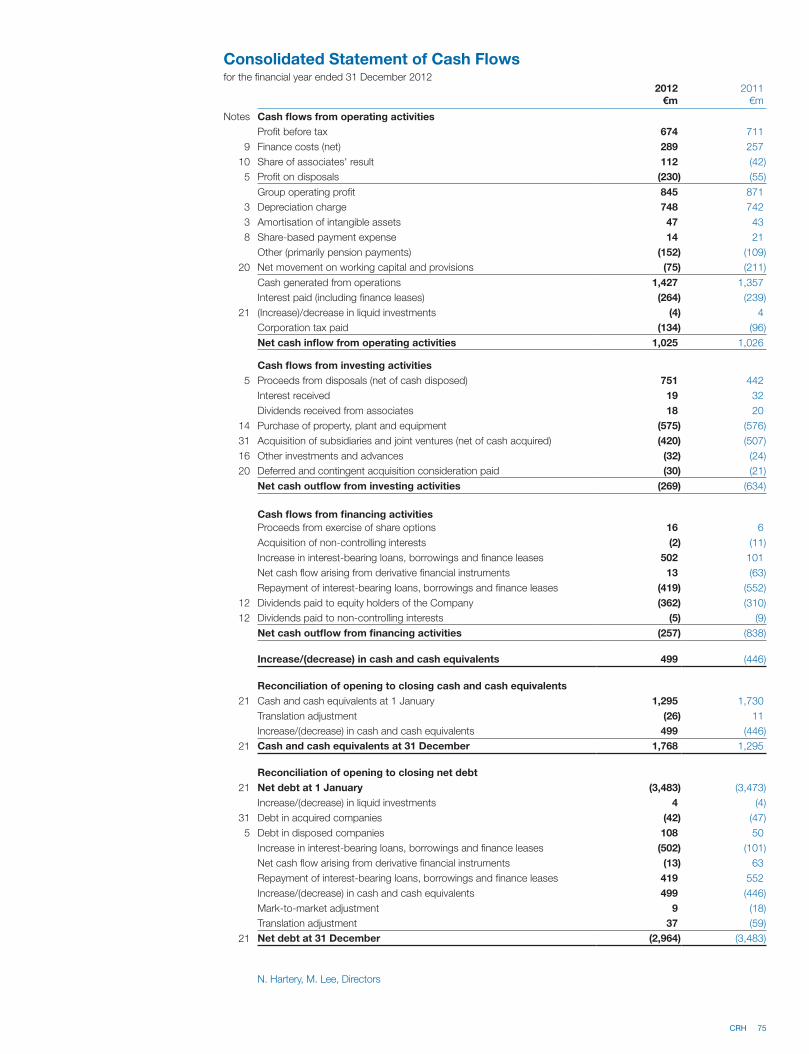
CRH 75
Consolidated Statement of Cash Flowsfor the financial year ended 31 December 2012
2012 2011€m €m
Notes Cash flows from operating activities
Profit before tax 674 711
9 Finance costs (net) 289 257
10 Share of associates' result 112 (42)
5 Profit on disposals (230) (55)
Group operating profit 845 871
3 Depreciation charge 748 742
3 Amortisation of intangible assets 47 43
8 Share-based payment expense 14 21
Other (primarily pension payments) (152) (109)
20 Net movement on working capital and provisions (75) (211)
Cash generated from operations 1,427 1,357
Interest paid (including finance leases) (264) (239)
21 (Increase)/decrease in liquid investments (4) 4
Corporation tax paid (134) (96)
Net cash inflow from operating activities 1,025 1,026
Cash flows from investing activities
5 Proceeds from disposals (net of cash disposed) 751 442
Interest received 19 32
Dividends received from associates 18 20
14 Purchase of property, plant and equipment (575) (576)
31 Acquisition of subsidiaries and joint ventures (net of cash acquired) (420) (507)
16 Other investments and advances (32) (24)
20 Deferred and contingent acquisition consideration paid (30) (21)
Net cash outflow from investing activities (269) (634)
Cash flows from financing activities
Proceeds from exercise of share options 16 6
Acquisition of non-controlling interests (2) (11)
Increase in interest-bearing loans, borrowings and finance leases 502 101
Net cash flow arising from derivative financial instruments 13 (63)
Repayment of interest-bearing loans, borrowings and finance leases (419) (552)
12 Dividends paid to equity holders of the Company (362) (310)
12 Dividends paid to non-controlling interests (5) (9)
Net cash outflow from financing activities (257) (838)
Increase/(decrease) in cash and cash equivalents 499 (446)
Reconciliation of opening to closing cash and cash equivalents
21 Cash and cash equivalents at 1 January 1,295 1,730
Translation adjustment (26) 11
Increase/(decrease) in cash and cash equivalents 499 (446)
21 Cash and cash equivalents at 31 December 1,768 1,295
Reconciliation of opening to closing net debt
21 Net debt at 1 January (3,483) (3,473)
Increase/(decrease) in liquid investments 4 (4)
31 Debt in acquired companies (42) (47)
5 Debt in disposed companies 108 50
Increase in interest-bearing loans, borrowings and finance leases (502) (101)
Net cash flow arising from derivative financial instruments (13) 63
Repayment of interest-bearing loans, borrowings and finance leases 419 552
Increase/(decrease) in cash and cash equivalents 499 (446)
Mark-to-market adjustment 9 (18)
Translation adjustment 37 (59)
21 Net debt at 31 December (2,964) (3,483)
N. Hartery, M. Lee, Directors
76 CRH
Statement of Compliance
The Consolidated Financial Statements of CRH plc have been prepared in
accordance with International Financial Reporting Standards (IFRS) as adopted
by the European Union, which comprise standards and interpretations approved
by the International Accounting Standards Board (IASB). IFRS as adopted by the
European Union differ in certain respects from IFRS as issued by the IASB.
However, the Consolidated Financial Statements for the financial years presented
would be no different had IFRS as issued by the IASB been applied. References
to IFRS hereafter should be construed as references to IFRS as adopted by the
European Union.
CRH plc, the Parent Company, is a publicly traded limited company incorporated
and domiciled in the Republic of Ireland.
Basis of Preparation
The Consolidated Financial Statements, which are presented in euro millions,
have been prepared under the historical cost convention as modified by the
measurement at fair value of share-based payments, retirement benefit
obligations and certain financial assets and liabilities including derivative financial
instruments.
The accounting policies set out below have been applied consistently by all the
Group’s subsidiaries, joint ventures and associates to all periods presented in
these Consolidated Financial Statements.
Certain prior year disclosures have been amended to conform to current year
presentation.
In accordance with Section 148(8) of the Companies Act, 1963 and Section 71
(A) of the Companies (Amendment) Act, 1986, the Company is availing of the
exemption from presenting its individual profit and loss account to the Annual
General Meeting and from filing it with the Registrar of Companies.
Adoption of IFRS and International Financial Reporting Interpretations
Committee (IFRIC) interpretations
(i) IFRS and IFRIC interpretations adopted during the financial year
The Group has adopted the following new and revised IFRS in respect of the
2012 year-end:
– IAS 12 Income Taxes (amendment)
– IFRS 7 Financial Instruments: Disclosures (amendment)
The application of the above standards and interpretations did not result in
material changes in the Group’s Consolidated Financial Statements.
(ii) IFRS and IFRIC interpretations being adopted in 2013
A number of new standards and amendments to standards and interpretations
are effective for annual periods beginning after 1 January 2013, and have not
been applied in preparing these Consolidated Financial Statements as they are
not yet effective for the Group. The Group will adopt these standards from 1
January 2013.
– IFRS 10 Consolidated Financial Statements*
IFRS 10 builds on existing principles by identifying the concept of control as the
determining factor in whether an entity should be included within the Consolidated
Financial Statements of the Group. Based on the preliminary analyses performed,
IFRS 10 is not expected to have a material impact on the currently held
investments of the Group.
– IFRS 11 Joint Arrangements*, IAS 28 Investments in Associates and Joint
Ventures
IFRS 11 replaces IAS 31 Interests in Joint Ventures. The Group currently uses
proportionate consolidation to account for its joint ventures. The Group has
performed an assessment of IFRS 11 and has concluded that our principal joint
arrangements are joint ventures as defined under IFRS 11.
With the application of the new standard, the Group’s investments in joint
ventures will be accounted for using the equity method of accounting. The
change to equity accounting will have no impact on the Group’s profit after tax,
but will impact each line item in the Consolidated Income Statement. The impact
of IFRS 11 on the current period (which will be the comparative period as of 31
December 2013) will be to increase the Group’s share of equity-accounted
investments (which currently only include the results of our associate investments)
by €28 million, decrease revenue by €575 million and operating profit by €40
million, and reduce finance costs and income tax expense by €2 million and €10
million respectively.
The Group’s Consolidated Balance Sheet will also be impacted on a line by line
basis. The Group’s investments accounted for using the equity method will
increase by €587 million. The Group’s non-current assets will decrease by €71
million and non-current liabilities will decrease by €165 million. The impact on
current assets and current liabilities will be a reduction of €191 million and €97
million respectively.
– IFRS 12 Disclosure of Interests in Other Entities*
IFRS 12 includes all of the disclosures that were previously in IAS 27 related to
consolidated financial statements, as well as all of the disclosures that were
previously included in IAS 31 and IAS 28. These disclosures relate to an entity’s
interests in subsidiaries, joint arrangements, associates and structured entities. A
number of new disclosures are also required. IFRS 12 has no impact on the
Group’s financial performance.
– IFRIC 20 Stripping Costs in the Production Phase of a Surface Mine
IFRIC 20 provides guidance on the accounting treatment for stripping costs
incurred during the production phase of a surface mine used to extract mineral
resources. The Group currently expenses all stripping costs as incurred. Under
IFRIC 20 the Group is required to capitalise (as a non-current asset) any current
period stripping costs that provide economic benefits beyond the current period.
This would result in a reduction in operating expenses which would be offset by
an increased depletion charge. IFRIC 20 will not have a material impact on the
Group’s financial position or performance.
– IAS 19 Employee Benefits (revised)
The application of the revised standard will result in a number of amendments to
the Group’s current accounting for retirement benefit obligations, including a
change to the calculation of the net interest expense in the Consolidated Income
Statement, adjustments to the current service cost for risk sharing between
employer and employees and the adoption of generational-based mortality
tables across all schemes.
The most significant change is in how net interest expense will be calculated.
Currently the Group’s Consolidated Income Statement includes a credit for the
expected return on assets and an interest expense in respect of the pension
liability. Under the revised standard the Group will no longer take a credit for the
expected return on assets and the net interest expense will be calculated by
multiplying the year-end discount rate by the year-end net pension liability. Under
this method the 2013 interest expense will be approximately €21 million (2012:
increase in interest expense recorded of approximately €18 million). The other
amendments to IAS 19 are anticipated to have a less significant impact on the
Group and primarily affect the Group’s Swiss retirement benefit obligations.
Additional disclosure requirements relating to the sensitivity of the defined benefit
obligation to changes in each significant actuarial assumptions will also be
required.
– IAS 1 Presentation of Financial Statements - amendments
The amendments to IAS 1 changes the grouping of items presented in Other
Comprehensive Income. The amendments affect presentation only and have no
impact on the Group’s financial performance.
– IFRS 7 Financial Instruments: Disclosures - amendments
Accounting Policies (including key accounting estimates and assumptions)
* CRH prepares its Consolidated Financial Statements in compliance with IFRS as issued by the EU and prepares its form 20-F in compliance with IFRS as issued by the IASB. IFRS
10, 11 and 12 have an effective date of 1 January 2014 for IFRS as issued by the EU. The IASB has an effective date for these standards of 1 January 2013. To ensure consistency
between the 2013 Annual Report and form 20-F, CRH will early adopt IFRS 10, 11 and 12 in 2013.
CRH 77
These amendments require an entity to disclose information about rights to set-
off and related arrangements (e.g. collateral agreements). These amendments
will not impact the Group’s financial position or performance.
– IFRS 13 Fair Value Measurement
IFRS 13 establishes a single source of guidance under IFRS for all fair value
measurements. IFRS 13 will not have a material impact on the Group’s financial
position or performance.
– Annual Improvements May 2012
These improvements will not have a material impact on the Group.
(iii) IFRS and IFRIC interpretations effective subsequent to the CRH 2013
financial year-end:
– IFRS 9 Financial Instruments - Classification and Measurement effective 1
January 2015
IFRS 9, as issued, reflects the first phase of the IASB’s work on the replacement
of IAS 39 and applies to classification and measurement of financial assets and
financial liabilities as defined in IAS 39. In subsequent phases, the IASB will
address hedge accounting and impairment of financial assets. The Group will
quantify the effect in conjunction with the other phases, when the final standard
including all phases is issued.
There are no other IFRSs or IFRIC interpretations that are not yet effective that
would be expected to have a material impact on the Group.
Key Accounting Policies which involve Estimates, Assumptions and
Judgements
The preparation of the Consolidated Financial Statements in accordance with
IFRS requires management to make certain estimates, assumptions and
judgements that affect the application of accounting policies and the reported
amounts of assets, liabilities, income and expenses at the end of the reporting
period. Management believes that the estimates, assumptions and judgements
upon which it relies are reasonable based on the information available to it at the
time that those estimates, assumptions and judgements are made. In some
cases, the accounting treatment of a particular transaction is specifically dictated
by IFRS and does not require management’s judgement in its application.
Management consider that their use of estimates, assumptions and judgements
in the application of the Group’s accounting policies are inter-related and
therefore discuss them together below. The critical accounting policies which
involve significant estimates or assumptions or judgements, the actual outcome
of which could have a material impact on the Group’s results and financial
position outlined below, are as follows:
Provisions for liabilities – Note 26
A provision is recognised when the Group has a present obligation (either legal or
constructive) as a result of a past event, it is probable that a transfer of economic
benefits will be required to settle the obligation and a reliable estimate can be
made of the amount of the obligation. Where the Group anticipates that a
provision will be reimbursed, the reimbursement is recognised as a separate
asset only when it is virtually certain that the reimbursement will arise. The
expense relating to any provision is presented in the Consolidated Income
Statement net of any reimbursement. Provisions are measured at the present
value of the expenditures expected to be required to settle the obligation. The
increase in the provision due to passage of time is recognised as interest
expense. Provisions arising on business combination activity are recognised only
to the extent that they would have qualified for recognition in the financial
statements of the acquiree prior to acquisition. Provisions are not recognised for
future operating losses.
Rationalisation and redundancy provisions
Provisions for rationalisation and redundancy are established when a detailed
restructuring plan has been drawn up, resolved upon by the responsible decision-
making level of management and communicated to the employees who are
affected by the plan. These provisions are recognised at the present value of
future disbursements and cover only expenses that arise directly from
restructuring measures, are necessary for restructuring and exclude costs related
to future business operations. Restructuring measures may include the sale or
termination of business units, site closures, and relocation of business activities,
changes in management structure or a fundamental reorganisation of
departments or business units.
Environmental and remediation provisions
The measurement of environmental and remediation provisions is based on an
evaluation of currently available facts with respect to each individual site and
considers factors such as existing technology, currently enacted laws and
regulations and prior experience in remediation of sites. Inherent uncertainties
exist in such evaluations primarily due to unknown conditions, changing
governmental regulations and legal standards regarding liability, the protracted
length of the clean-up periods and evolving technologies. The environmental and
remediation liabilities provided for in the Consolidated Financial Statements reflect
the information available to management at the time of determination of the liability
and are adjusted periodically as remediation efforts progress or as additional
technical or legal information becomes available. Due to the inherent uncertainties
described above, many of which are not under management’s control, the
accounting for such items could result in different amounts if management used
different assumptions or if different conditions occur in future accounting periods.
Legal contingencies
The status of each significant claim and legal proceeding in which the Group is
involved is reviewed by management on a periodic basis and the Group’s potential
financial exposure is assessed. If the potential loss from any claim or legal
proceeding is considered probable, and the amount can be estimated, a liability is
recognised for the estimated loss. Because of the uncertainties inherent in such
matters, the related provisions are based on the best information available at the
time; the issues taken into account by management and factored into the
assessment of legal contingencies include, as applicable, the status of settlement
negotiations, interpretations of contractual obligations, prior experience with
similar contingencies/claims, the availability of insurance to protect against the
downside exposure and advice obtained from legal counsel and other third
parties. As additional information becomes available on pending claims, the
potential liability is reassessed and revisions are made to the amounts accrued
where appropriate. Such revisions in the estimates of the potential liabilities could
have a material impact on the results of operations and financial position of the
Group.
Retirement benefit obligations – Note 28
Costs arising in respect of the Group’s defined contribution pension schemes are
charged to the Consolidated Income Statement in the period in which they are
incurred. The Group has no legal or constructive obligation to pay further
contributions in the event that the fund does not hold sufficient assets to meet its
benefit commitments.
The liabilities and costs associated with the Group’s defined benefit pension
schemes (both funded and unfunded) are assessed on the basis of the projected
unit credit method by professionally qualified actuaries and are arrived at using
actuarial assumptions based on market expectations at the balance sheet date.
The discount rates employed in determining the present value of the schemes’
liabilities are determined by reference to market yields at the balance sheet date
on high-quality corporate bonds of a currency and term consistent with the
currency and term of the associated post-employment benefit obligations.
When the benefits of a defined benefit scheme are improved, the portion of the
increased benefit relating to past service by employees is recognised as an
expense in the Consolidated Income Statement on a straight-line basis over the
average period until the benefits become vested. To the extent that the enhanced
benefits vest immediately, the related expense is recognised immediately in the
Consolidated Income Statement.
The net surplus or deficit arising on the Group’s defined benefit pension schemes,
together with the liabilities associated with the unfunded schemes, are shown
either within non-current assets or non-current liabilities in the Consolidated
Balance Sheet. The deferred tax impact of pension scheme surpluses and deficits
is disclosed separately within deferred tax assets or liabilities as appropriate.
Actuarial gains and losses are recognised immediately in the Consolidated
Statement of Comprehensive Income.
78 CRH
Accounting Policies | continued
The defined benefit pension asset or liability in the Consolidated Balance Sheet
comprises the total for each plan of the present value of the defined benefit
obligation less the fair value of plan assets out of which the obligations are to be
settled directly. Plan assets are assets that are held by a long-term employee
benefit fund or qualifying insurance policies. Fair value is based on market price
information and, in the case of published securities, it is the published bid price.
The value of any defined benefit asset is limited to the present value of any
economic benefits available in the form of refunds from the plan and reductions
in the future contributions to the plan.
The Group’s obligation in respect of post-employment healthcare and life
assurance benefits represents the amount of future benefit that employees have
earned in return for service in the current and prior periods. The obligation is
computed on the basis of the projected unit credit method and is discounted to
present value using a discount rate equating to the market yield at the balance
sheet date on high-quality corporate bonds of a currency and term consistent
with the currency and estimated term of the post-employment obligations.
Assumptions
The assumptions underlying the actuarial valuations from which the amounts
recognised in the Consolidated Financial Statements are determined (including
discount rates, expected return on plan assets, rate of increase in future
compensation levels, mortality rates and healthcare cost trend rates) are updated
annually based on current economic conditions and for any relevant changes to
the terms and conditions of the pension and post-retirement plans. These
assumptions can be affected by (i) for the discount rate, changes in the rates of
return on high-quality corporate bonds; (ii) for the expected return on plan assets,
changes in the pension plans’ strategic asset allocations to various investment
types or to long-term return trend rates in the capital markets in which the
pension fund assets are invested; (iii) for future compensation levels, future labour
market conditions and (iv) for healthcare cost trend rates, the rate of medical cost
inflation in the relevant regions. The weighted average actuarial assumptions
used and sensitivity analysis in relation to the discount rates employed in the
determination of pension and other post-retirement liabilities are contained in
Note 28 to the Consolidated Financial Statements.
While management believes that the assumptions used are appropriate,
differences in actual experience or changes in assumptions may affect the
obligations and expenses recognised in future accounting periods. The assets
and liabilities of defined benefit pension schemes may exhibit significant period-
on-period volatility attributable primarily to asset valuations, changes in bond
yields and longevity. In addition to future service contributions, significant cash
contributions may be required to remediate past service deficits.
Taxation – current and deferred – Notes 11 and 27
Current tax represents the expected tax payable (or recoverable) on the taxable
profit for the year using tax rates enacted for the period. Any interest or penalties
arising are included within current tax. Where items are accounted for outside of
profit or loss, the related income tax is recognised either in other comprehensive
income or directly in equity as appropriate.
Deferred tax is recognised using the liability method on temporary differences
arising at the balance sheet date between the tax bases of assets and liabilities
and their carrying amounts in the Consolidated Financial Statements. However,
deferred tax liabilities are not recognised if they arise from the initial recognition of
goodwill; in addition, deferred income tax is not accounted for if it arises from
initial recognition of an asset or liability in a transaction other than a business
combination that at the time of the transaction affects neither accounting nor
taxable profit or loss. No provision has been made for temporary differences
applicable to investments in subsidiaries and interests in joint ventures as the
Group is in a position to control the timing of reversal of the temporary differences
and it is probable that the temporary differences will not reverse in the foreseeable
future. Due to the absence of control in the context of associates (significant
influence only), deferred tax liabilities are recognised where appropriate in respect
of CRH’s investments in these entities on the basis that the exercise of significant
influence would not necessarily prevent earnings being remitted by other
shareholders in the undertaking.
Deferred tax is determined using tax rates (and laws) that have been enacted or
substantially enacted by the balance sheet date and are expected to apply when
the related deferred income tax asset is realised or the deferred income tax
liability is settled. Deferred tax assets and liabilities are not subject to discounting.
Deferred tax assets are recognised in respect of all deductible temporary
differences, carry-forward of unused tax credits and unused tax losses to the
extent that it is probable that taxable profits will be available against which the
temporary differences can be utilised. The carrying amounts of deferred tax
assets are subject to review at each balance sheet date and are reduced to the
extent that future taxable profits are considered to be inadequate to allow all or
part of any deferred tax asset to be utilised.
The Group’s income tax charge is based on reported profit and expected
statutory tax rates, which reflect various allowances and reliefs and tax planning
opportunities available to the Group in the multiple tax jurisdictions in which it
operates. The determination of the Group’s provision for income tax requires
certain judgements and estimates in relation to matters where the ultimate tax
outcome may not be certain. The recognition or non-recognition of deferred tax
assets as appropriate also requires judgement as it involves an assessment of
the future recoverability of those assets. In addition, the Group is subject to tax
audits which can involve complex issues that could require extended periods for
resolution. Although management believes that the estimates included in the
Consolidated Financial Statements and its tax return positions are reasonable, no
assurance can be given that the final outcome of these matters will not be
different than that which is reflected in the Group’s historical income tax provisions
and accruals. Any such differences could have a material impact on the income
tax provision and profit for the period in which such a determination is made.
Property, plant and equipment – Note 14
The Group’s accounting policy for property, plant and equipment is considered
critical because the carrying value of €8,448 million at 31 December 2012
represents a significant portion (40%) of total assets at that date. Property, plant
and equipment are stated at cost less any accumulated depreciation and any
accumulated impairments except for certain items that had been revalued to fair
value prior to the date of transition to IFRS (1 January 2004).
Repair and maintenance expenditure is included in an asset’s carrying amount or
recognised as a separate asset, as appropriate, only when it is probable that
future economic benefits associated with the item will flow to the Group and the
cost of the item can be measured reliably. All other repair and maintenance
expenditure is charged to the Consolidated Income Statement during the
financial period in which it is incurred.
Borrowing costs incurred in the construction of major assets which take a
substantial period of time to complete are capitalised in the financial period in
which they are incurred.
In the application of the Group’s accounting policy, judgement is exercised by
management in the determination of residual values and useful lives. Depreciation
and depletion is calculated to write off the book value of each item of property,
plant and equipment over its useful economic life on a straight-line basis at the
following rates:
Land and buildings: The book value of mineral-bearing land, less an estimate of
its residual value, is depleted over the period of the mineral extraction in the
proportion which production for the year bears to the latest estimates of mineral
reserves. Land other than mineral-bearing land is not depreciated. In general,
buildings are depreciated at 2.5% per annum (“p.a.”).
Plant and machinery: These are depreciated at rates ranging from 3.3% p.a. to
20% p.a. depending on the type of asset. Plant and machinery includes transport
which is, on average, depreciated at 20% p.a.
Depreciation methods, useful lives and residual values are reviewed at each
financial year-end. Changes in the expected useful life or the expected pattern of
consumption of future economic benefits embodied in the asset are accounted
for by changing the depreciation period or method as appropriate on a
prospective basis.
Impairment of long-lived assets and goodwill – Notes 14 and 15
Impairment of property, plant and equipment and goodwill
The carrying values of items of property, plant and equipment are reviewed for
indicators of impairment at each reporting date and are subject to impairment
testing when events or changes in circumstances indicate that the carrying
values may not be recoverable. Goodwill is subject to impairment testing on an
annual basis and at any time during the year if an indicator of impairment is
considered to exist. In the year in which a business combination is effected and
CRH 79
where some or all of the goodwill allocated to a particular cash-generating unit
arose in respect of that combination, the cash-generating unit is tested for
impairment prior to the end of the relevant annual period.
Property, plant and equipment assets are reviewed for potential impairment by
applying a series of external and internal indicators specific to the assets
under consideration; these indicators encompass macroeconomic issues
including the inherent cyclicality of the building materials sector, actual
obsolescence or physical damage, a deterioration in forecast performance in
the internal reporting cycle and restructuring and rationalisation programmes.
Where the carrying value exceeds the estimated recoverable amount (being
the greater of fair value less costs to sell and value-in-use), an impairment loss
is recognised by writing down the assets to their recoverable amount. In
assessing value-in-use, the estimated future cash flows are discounted to
their present value using a pre-tax discount rate that reflects current market
assessments of the time value of money and the risks specific to the asset for
which the future cash flow estimates have not been adjusted. The estimates
of future cash flows exclude cash inflows or outflows attributable to financing
activities and income tax. For an asset that does not generate largely
independent cash inflows, the recoverable amount is determined by reference
to the cash-generating unit to which the asset belongs. Impairment losses
arising in respect of goodwill are not reversed once recognised.
Goodwill relating to associates is included in the carrying amount of the
investment and is neither amortised nor individually tested for impairment.
Where indicators of impairment of an investment arise in accordance with the
requirements of IAS 39 Financial Instruments: Recognition and Measurement,
the carrying amount is tested for impairment by comparing its recoverable
amount with its carrying amount.
The impairment testing process requires management to make significant
judgements and estimates regarding the future cash flows expected to be
generated by the use of and, if applicable, the eventual disposal of, long-lived
assets and goodwill as well as other factors to determine the fair value of the
assets. Management periodically evaluates and updates the estimates based
on the conditions which influence these variables. A detailed discussion of the
impairment methodology applied and key assumptions used by the Group in
the context of long-lived assets and goodwill are provided in Notes 14 and 15
to the Consolidated Financial Statements.
The assumptions and conditions for determining impairments of long-lived
assets and goodwill reflect management’s best assumptions and estimates,
but these items involve inherent uncertainties described above, many of which
are not under management’s control. As a result, the accounting for such
items could result in different estimates or amounts if management used
different assumptions or if different conditions occur in future accounting
periods.
Other Significant Accounting Policies
Basis of consolidation
The Consolidated Financial Statements include the financial statements of the
Parent Company and all subsidiaries, joint ventures and associates, drawn up
to 31 December each year. The financial year-ends of the Group’s subsidiaries,
joint ventures and associates are co-terminous.
Subsidiaries
The financial statements of subsidiaries are included in the Consolidated
Financial Statements from the date on which control over the operating and
financial decisions is obtained and cease to be consolidated from the date on
which the Group loses control. The existence and effect of potential voting
rights that are currently exercisable or convertible are considered in determining
the existence or otherwise of control. A change in the ownership interest of a
subsidiary, without a change of control, is accounted for as an equity
transaction.
Non-controlling interests represent the portion of the equity of a subsidiary not
attributable either directly or indirectly to the Parent Company and are
presented separately in the Consolidated Income Statement and within equity
in the Consolidated Balance Sheet, distinguished from Parent Company
shareholders’ equity. Acquisitions of non-controlling interests are accounted
for as transactions with equity holders in their capacity as equity holders and
therefore no goodwill is recognised as a result of such transactions. On an
acquisition by acquisition basis, the Group recognises any non-controlling
interest in the acquiree either at fair value or at the non-controlling interest’s
proportionate share of the acquiree’s net assets.
Joint ventures – Note 2
The Group’s share of results and net assets of joint ventures (jointly controlled
entities which are entities in which the Group holds an interest on a long-term
basis and which are jointly controlled by the Group and one or more other
venturers under a contractual arrangement) are accounted for on the basis of
proportionate consolidation from the date on which the contractual agreements
stipulating joint control are finalised and are derecognised when joint control
ceases. The Group combines its share of the joint ventures’ individual income
and expenses, assets and liabilities and cash flows on a line-by-line basis with
similar items in the Consolidated Financial Statements.
Loans to joint ventures (after proportionate elimination) are classified as loans
and receivables within financial assets and are recorded at amortised cost.
Associates – Note 10
Entities other than subsidiaries and joint ventures in which the Group has a
participating interest, and over whose operating and financial policies the Group is
in a position to exercise significant influence, are accounted for as associates
using the equity method and are included in the Consolidated Financial Statements
from the date on which significant influence is deemed to arise until the date on
which such influence ceases to exist. Under the equity method, the Consolidated
Income Statement reflects the Group’s share of profit after tax of the related
associates. Investments in associates are carried in the Consolidated Balance
Sheet at cost adjusted in respect of post-acquisition changes in the Group’s share
of net assets, less any impairment in value. If necessary, impairment losses on the
carrying amount of an investment are reported within the Group’s share of
associates’ profit after tax in the Consolidated Income Statement. If the Group’s
share of losses exceeds the carrying amount of an associate, the carrying amount
is reduced to nil and recognition of further losses is discontinued except to the
extent that the Group has incurred obligations in respect of the associate.
Transactions eliminated on consolidation
Intra-group balances and transactions, income and expenses, and any unrealised
gains or losses arising from such transactions, are eliminated in preparing the
Consolidated Financial Statements. Unrealised gains arising from transactions
with joint ventures and associates are eliminated to the extent of the Group’s
interest in the entity. Unrealised losses are eliminated in the same manner as
unrealised gains, but only to the extent that there is no evidence of impairment in
the Group’s interest in the entity.
Revenue recognition
Revenue represents the value of goods and services supplied and is net of
trade discounts and value added tax/sales tax. Other than in the case of
construction contracts, revenue is recognised to the extent that revenue and
related costs incurred or to be incurred are subject to reliable measurement,
that it is probable that economic benefits will flow to the Group and that the
significant risks and rewards of ownership have passed to the buyer, usually
on delivery of the goods.
Construction contracts
The Group engages primarily in the performance of fixed price contracts, as
opposed to cost plus contracts, and recognises revenue in accordance with the
percentage-of-completion method, with the completion percentage being
computed generally by reference to the proportion that contract costs incurred
at the balance sheet date bear to the total estimated costs of the contract.
Contract costs are recognised as incurred. When the outcome of a construction
contract can be estimated reliably and it is probable that the contract will be
profitable, contract revenue is recognised over the period of the contract. When
the outcome of a construction contract cannot be estimated reliably, contract
revenue is recognised only to the extent of contract costs incurred where it is
probable that these costs will be recoverable. When it is probable that total
contract costs will exceed total contract revenue, the expected loss is
recognised immediately as an expense. Revenue and/or costs in respect of
variations or contracts claims and incentive payments, to the extent that they
arise, are recognised when it is probable that the amount, which can be
measured reliably, will be recovered from/paid to the customer.
80 CRH
If circumstances arise that may change the original estimates of revenues, costs
or extent of progress towards completion, estimates are revised. These revisions
may result in increases or decreases in revenue or costs and are reflected in
income in the period in which the circumstances that give rise to the revision
became known by management.
Segment reporting – Note 1
Operating segments are reported in a manner consistent with the internal
organisational and management structure and the internal reporting information
provided to the Chief Operating Decision-Maker who is responsible for allocating
resources and assessing performance of the operating segments.
Share-based payments – Note 8
The Group operates both Share Option Schemes and a Performance Share
Plan. Its policy in relation to the granting of share options and the granting of
awards under the Performance Share Plan together with the nature of the
underlying market and non-market performance and other vesting conditions are
addressed in the Report on Directors’ Remuneration on page 59. The Group’s
employee share options and shares awarded under the Performance Share Plan
are equity-settled share-based payments as defined in IFRS 2 Share-Based
Payment.
Share options
For share option awards, the Group measures the services received and the
corresponding increase in equity at fair value at the grant date using the trinomial
model (a lattice option-pricing model in accordance with IFRS 2). Fair value is
determined on the basis that the services to be rendered by employees as
consideration for the granting of share options will be received over the vesting
period, which is assessed as at the grant date. The share options granted by the
Company are at market value at date of grant and are not subject to market-
based vesting conditions within the meaning of IFRS 2.
The cost is recognised, together with a corresponding increase in equity, over the
period in which the performance and/or service conditions are fulfilled. The
cumulative expense recognised at each reporting date until the vesting date
reflects the extent to which the vesting period has expired and the Group’s best
estimate of the number of equity instruments that will ultimately vest. The
Consolidated Income Statement expense/credit for a period represents the
movement in cumulative expense recognised at the beginning and end of that
period. The cumulative charge to the Consolidated Income Statement is reversed
only where the performance condition is not met or where an employee in receipt
of share options leaves service prior to completion of the expected vesting period
and those options forfeit in consequence.
No expense is recognised for awards that do not ultimately vest, except for
share-based payments where vesting is conditional upon a non-vesting condition
which is treated as vesting irrespective of whether or not it is satisfied, provided
that all other performance and/or service conditions are satisfied.
Where an award is cancelled, it is treated as if it is vested on the date of
cancellation, and any expense not yet recognised for the award is recognised
immediately. This includes any award where non-vesting conditions within the
control of either the Company or the employee are not met. All cancellations of
awards are treated equally.
The proceeds received net of any directly attributable transaction costs are
credited to share capital (nominal value) and share premium when the options are
exercised.
The dilutive effect of outstanding options is reflected as additional share dilution
in the determination of diluted earnings per share.
To the extent that the Group receives a tax deduction relating to the services paid
in shares, deferred tax in respect of share options is provided on the basis of the
difference between the market price of the underlying equity as at the date of the
financial statements and the exercise price of the option; where the amount of
any tax deduction (or estimated future tax deduction) exceeds the amount of the
related cumulative remuneration expense, the current or deferred tax associated
with the excess is recognised directly in equity.
The Group has no exposure in respect of cash-settled share-based payment
transactions and share-based payment transactions with cash alternatives.
Awards under the Performance Share Plan
The fair value of shares awarded under the Performance Share Plan is determined
using a Monte Carlo simulation technique and is expensed in the Consolidated
Income Statement over the vesting period. The Performance Share Plan contains
inter alia a total shareholder return-based (and hence market-based) vesting
condition; accordingly, the fair value assigned to the related equity instruments at
the grant date is adjusted so as to reflect the anticipated likelihood as at the grant
date of achieving the market-based vesting condition. Awards are treated as
vesting irrespective of whether or not the market condition is satisfied, provided
that all other performance and/or service conditions are satisfied.
Business combinations – Note 31
The Group applies the acquisition method in accounting for business
combinations. The cost of an acquisition is measured as the aggregate of the
consideration transferred (excluding amounts relating to the settlement of pre-
existing relationships), the amount of any non-controlling interest in the acquiree
and, in a business combination achieved in stages, the acquisition-date fair value
of the acquirer’s previously-held equity interest in the acquiree. Transaction costs
that the Group incurs in connection with a business combination are expensed
as incurred.
To the extent that settlement of all or any part of a business combination is
deferred, the fair value of the deferred component is determined through
discounting the amounts payable to their present value at the date of exchange.
The discount component is unwound as an interest charge in the Consolidated
Income Statement over the life of the obligation. Where a business combination
agreement provides for an adjustment to the cost of the combination contingent
on future events, the amount of the adjustment is included in the cost at the
acquisition date at fair value. The fair value of contingent consideration at
acquisition date is arrived at through discounting the expected payment (based
on scenario modelling) to present value. In general, in order for contingent
consideration to become payable, pre-defined profit and/or profit/net asset ratios
must be exceeded. Subsequent changes to the fair value of the contingent
consideration will be recognised in profit or loss unless the contingent
consideration is classified as equity, in which case it is not remeasured and
settlement is accounted for within equity.
The assets and liabilities (and contingent liabilities, if relevant) arising on business
combination activity are measured at their acquisition-date fair values. In the case
of a business combination achieved in stages, the acquisition-date fair value of
the acquirer’s previously-held equity interest in the acquiree is remeasured to fair
value as at the acquisition date through profit or loss. When the initial accounting
for a business combination is determined provisionally, any adjustments to the
provisional values allocated to the identifiable assets and liabilities (and contingent
liabilities, if relevant) are made within the measurement period, a period of no
more than one year from the acquisition date.
Goodwill – Note 15
Goodwill arising on a business combination is initially measured at cost being the
excess of the cost of an acquisition over the net identifiable assets and liabilities
assumed at the date of acquisition and relates to the future economic benefits
arising from assets which are not capable of being individually identified and
separately recognised. Following initial recognition, goodwill is measured at cost
less any accumulated impairment losses. If the cost of the acquisition is lower
than the fair value of the net assets of the subsidiary acquired, the identification
and measurement of the related assets and liabilities and contingent liabilities are
revisited and the cost is reassessed with any remaining balance recognised
immediately in the Consolidated Income Statement.
Goodwill applicable to jointly controlled entities is accounted for on the basis of
proportionate consolidation and is therefore included in the goodwill caption in
the Consolidated Balance Sheet, net of any impairment. The carrying amount of
goodwill in respect of associates is included in investments in associates (i.e.
within financial assets) under the equity method in the Consolidated Balance
Sheet.
Where a subsidiary is disposed of or terminated through closure, the carrying
value of any goodwill which arose on acquisition of that subsidiary is included in
the determination of the net profit or loss on disposal/termination.
Accounting Policies | continued
CRH 81
Intangible assets (other than goodwill) arising on business combinations
– Note 15
An intangible asset is capitalised separately from goodwill as part of a business
combination at cost (fair value at date of acquisition) to the extent that it is
probable that the expected future economic benefits attributable to the asset will
flow to the Group and that its cost can be measured reliably.
Subsequent to initial recognition, intangible assets are carried at cost less any
accumulated amortisation and any accumulated impairment losses. The carrying
values of definite-lived intangible assets (the Group does not currently have any
indefinite-lived intangible assets other than goodwill) are reviewed for indicators
of impairment at each reporting date and are subject to impairment testing when
events or changes in circumstances indicate that the carrying values may not be
recoverable.
The amortisation of intangible assets is calculated to write off the book value of
definite-lived intangible assets over their useful lives on a straight-line basis on the
assumption of zero residual value. In general, definite-lived intangible assets are
amortised over periods ranging from one to ten years, depending on the nature
of the intangible asset.
Amortisation periods, useful lives, expected patterns of consumption and
residual values are reviewed at each financial year-end. Changes in the expected
useful life or the expected pattern of consumption of future economic benefits
embodied in the asset are accounted for by changing the amortisation period or
method as appropriate on a prospective basis.
Other financial assets – Note 16
All investments are initially recognised at the fair value of the consideration given
plus any directly attributable transaction costs. Where equity investments are
actively traded in organised financial markets, fair value is determined by
reference to Stock Exchange quoted market bid prices at the close of business
on the balance sheet date. Unquoted equity investments are recorded at
historical cost and are included within financial assets in the Consolidated
Balance Sheet given that it is impracticable to determine fair value in accordance
with IAS 39 Financial Instruments: Recognition and Measurement. Where non-
derivative financial assets meet the definition of “loans and receivables” under
IAS 39, such balances are, following initial recognition, recorded at amortised
cost using the effective interest method less any allowance for impairment. Gains
and losses are recognised in profit or loss when the loans and receivables are
derecognised or impaired as well as through the amortisation process.
Leases – Notes 4 and 30
Leases where the lessor retains substantially all the risks and rewards of ownership
are classified as operating leases. Operating lease rentals are charged to the
Consolidated Income Statement on a straight-line basis over the lease term.
Inventories and construction contracts – Note 17
Inventories are stated at the lower of cost and net realisable value. Cost is based
on the first-in, first-out principle (and weighted average, where appropriate) and
includes all expenditure incurred in acquiring the inventories and bringing them to
their present location and condition. Raw materials are valued on the basis of
purchase cost on a first-in, first-out basis. In the case of finished goods and
work-in-progress, cost includes direct materials, direct labour and attributable
overheads based on normal operating capacity and excludes borrowing costs.
Net realisable value is the estimated proceeds of sale less all further costs to
completion, and less all costs to be incurred in marketing, selling and distribution.
Estimates of net realisable value are based on the most reliable evidence available
at the time the estimates are made, taking into consideration fluctuations of price
or cost directly relating to events occurring after the end of the period, the
likelihood of short-term changes in buyer preferences, product obsolescence or
perishability (all of which are generally low given the nature of the Group’s
products) and the purpose for which the inventory is held. Materials and other
supplies held for use in the production of inventories are not written down below
cost if the finished goods, in which they will be incorporated, are expected to be
sold at or above cost.
Amounts recoverable on construction contracts, which are included in
receivables, are stated at the net invoiced value of the work done less amounts
received as progress payments on account. Cumulative costs incurred, net of
amounts transferred to cost of sales, after deducting foreseeable losses,
provisions for contingencies and payments on account not matched with
revenue, are included as construction contract balances in inventories. Cost
includes all expenditure directly related to specific projects and an allocation of
fixed and variable overheads incurred in the Group’s contract activities based on
normal operating capacity.
Trade and other receivables – Note 18
Trade receivables are carried at original invoice amount less an allowance for
potentially uncollectible debts. Provision is made when there is objective evidence
that the Group will not be in a position to collect the associated debts. Bad debts
are written-off in the Consolidated Income Statement on identification.
Cash and cash equivalents – Note 23
Cash and cash equivalents comprise cash balances held for the purpose of
meeting short-term cash commitments and investments which are readily
convertible to a known amount of cash and are subject to an insignificant risk of
change in value. Bank overdrafts are included within current interest-bearing
loans and borrowings in the Consolidated Balance Sheet. Where the overdrafts
are repayable on demand and form an integral part of cash management, they
are netted against cash and cash equivalents for the purposes of the Consolidated
Statement of Cash Flows.
Liquid investments – Note 23
Liquid investments comprise short-term deposits and current asset investments
which are held as readily disposable stores of value and include investments in
government gilts and commercial paper and deposits of less than one year in
duration. As the maturity of these investments is greater than three months,
these investments are treated as financial assets and are categorised as either
“held-for-trading” or “loans and receivables”. Where relevant, the fair value of
liquid investments is determined by reference to the traded value of actively
traded instruments.
Derivative financial instruments and hedging practices – Note 25
In order to manage interest rate, foreign currency and commodity risks and to
realise the desired currency profile of borrowings, the Group employs derivative
financial instruments (principally interest rate swaps, currency swaps and forward
foreign exchange contracts).
At the inception of a derivative transaction, the Group documents the relationship
between the hedged item and the hedging instrument together with its risk
management objective and the strategy underlying the proposed transaction.
The Group also documents its assessment, both at the inception of the hedging
relationship and subsequently on an ongoing basis, of the effectiveness of the
hedging instrument in offsetting movements in the fair values or cash flows of the
hedged items.
Derivative financial instruments are stated at fair value. Where derivatives do not
fulfil the criteria for hedge accounting, changes in fair values are reported in the
Consolidated Income Statement. The fair value of interest rate and currency
swaps is the estimated amount the Group would pay or receive to terminate the
swap at the balance sheet date taking into account interest and currency rates
at that date and the creditworthiness of the swap counterparties. The fair value
of forward exchange contracts is calculated by reference to forward exchange
rates for contracts with similar maturity profiles and equates to the quoted market
price at the balance sheet date (being the present value of the quoted forward
price).
Fair value and cash flow hedges
The Group uses fair value hedges and cash flow hedges in its treasury activities.
For the purposes of hedge accounting, hedges are classified either as fair value
hedges (which entail hedging the exposure to movements in the fair value of a
recognised asset or liability or an unrecognised firm commitment that could affect
profit or loss) or cash flow hedges (which hedge exposure to fluctuations in future
cash flows derived from a particular risk associated with a recognised asset or
liability, or a highly probable forecast transaction that could affect profit or loss).
Where the conditions for hedge accounting are satisfied and the hedging
instrument concerned is classified as a fair value hedge, any gain or loss
stemming from the re-measurement of the hedging instrument to fair value is
reported in the Consolidated Income Statement. In addition, any gain or loss on
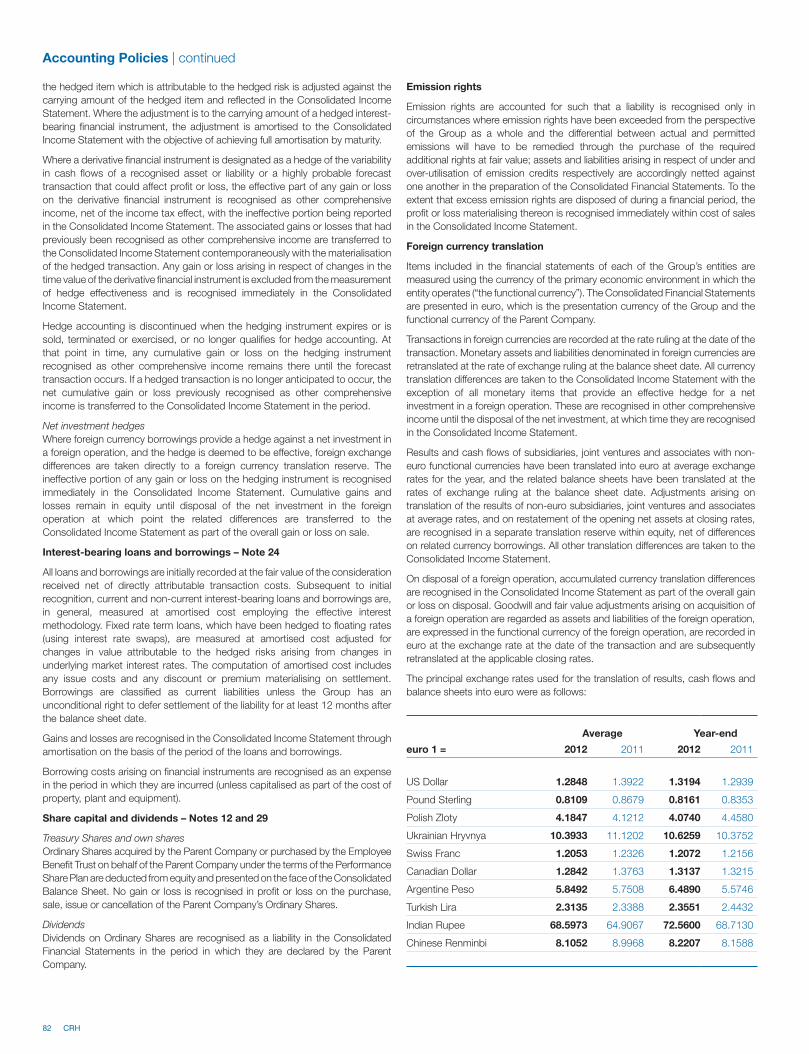
82 CRH
the hedged item which is attributable to the hedged risk is adjusted against the
carrying amount of the hedged item and reflected in the Consolidated Income
Statement. Where the adjustment is to the carrying amount of a hedged interest-
bearing financial instrument, the adjustment is amortised to the Consolidated
Income Statement with the objective of achieving full amortisation by maturity.
Where a derivative financial instrument is designated as a hedge of the variability
in cash flows of a recognised asset or liability or a highly probable forecast
transaction that could affect profit or loss, the effective part of any gain or loss
on the derivative financial instrument is recognised as other comprehensive
income, net of the income tax effect, with the ineffective portion being reported
in the Consolidated Income Statement. The associated gains or losses that had
previously been recognised as other comprehensive income are transferred to
the Consolidated Income Statement contemporaneously with the materialisation
of the hedged transaction. Any gain or loss arising in respect of changes in the
time value of the derivative financial instrument is excluded from the measurement
of hedge effectiveness and is recognised immediately in the Consolidated
Income Statement.
Hedge accounting is discontinued when the hedging instrument expires or is
sold, terminated or exercised, or no longer qualifies for hedge accounting. At
that point in time, any cumulative gain or loss on the hedging instrument
recognised as other comprehensive income remains there until the forecast
transaction occurs. If a hedged transaction is no longer anticipated to occur, the
net cumulative gain or loss previously recognised as other comprehensive
income is transferred to the Consolidated Income Statement in the period.
Net investment hedges
Where foreign currency borrowings provide a hedge against a net investment in
a foreign operation, and the hedge is deemed to be effective, foreign exchange
differences are taken directly to a foreign currency translation reserve. The
ineffective portion of any gain or loss on the hedging instrument is recognised
immediately in the Consolidated Income Statement. Cumulative gains and
losses remain in equity until disposal of the net investment in the foreign
operation at which point the related differences are transferred to the
Consolidated Income Statement as part of the overall gain or loss on sale.
Interest-bearing loans and borrowings – Note 24
All loans and borrowings are initially recorded at the fair value of the consideration
received net of directly attributable transaction costs. Subsequent to initial
recognition, current and non-current interest-bearing loans and borrowings are,
in general, measured at amortised cost employing the effective interest
methodology. Fixed rate term loans, which have been hedged to floating rates
(using interest rate swaps), are measured at amortised cost adjusted for
changes in value attributable to the hedged risks arising from changes in
underlying market interest rates. The computation of amortised cost includes
any issue costs and any discount or premium materialising on settlement.
Borrowings are classified as current liabilities unless the Group has an
unconditional right to defer settlement of the liability for at least 12 months after
the balance sheet date.
Gains and losses are recognised in the Consolidated Income Statement through
amortisation on the basis of the period of the loans and borrowings.
Borrowing costs arising on financial instruments are recognised as an expense
in the period in which they are incurred (unless capitalised as part of the cost of
property, plant and equipment).
Share capital and dividends – Notes 12 and 29
Treasury Shares and own shares
Ordinary Shares acquired by the Parent Company or purchased by the Employee
Benefit Trust on behalf of the Parent Company under the terms of the Performance
Share Plan are deducted from equity and presented on the face of the Consolidated
Balance Sheet. No gain or loss is recognised in profit or loss on the purchase,
sale, issue or cancellation of the Parent Company’s Ordinary Shares.
Dividends
Dividends on Ordinary Shares are recognised as a liability in the Consolidated
Financial Statements in the period in which they are declared by the Parent
Company.
Emission rights
Emission rights are accounted for such that a liability is recognised only in
circumstances where emission rights have been exceeded from the perspective
of the Group as a whole and the differential between actual and permitted
emissions will have to be remedied through the purchase of the required
additional rights at fair value; assets and liabilities arising in respect of under and
over-utilisation of emission credits respectively are accordingly netted against
one another in the preparation of the Consolidated Financial Statements. To the
extent that excess emission rights are disposed of during a financial period, the
profit or loss materialising thereon is recognised immediately within cost of sales
in the Consolidated Income Statement.
Foreign currency translation
Items included in the financial statements of each of the Group’s entities are
measured using the currency of the primary economic environment in which the
entity operates (“the functional currency”). The Consolidated Financial Statements
are presented in euro, which is the presentation currency of the Group and the
functional currency of the Parent Company.
Transactions in foreign currencies are recorded at the rate ruling at the date of the
transaction. Monetary assets and liabilities denominated in foreign currencies are
retranslated at the rate of exchange ruling at the balance sheet date. All currency
translation differences are taken to the Consolidated Income Statement with the
exception of all monetary items that provide an effective hedge for a net
investment in a foreign operation. These are recognised in other comprehensive
income until the disposal of the net investment, at which time they are recognised
in the Consolidated Income Statement.
Results and cash flows of subsidiaries, joint ventures and associates with non-
euro functional currencies have been translated into euro at average exchange
rates for the year, and the related balance sheets have been translated at the
rates of exchange ruling at the balance sheet date. Adjustments arising on
translation of the results of non-euro subsidiaries, joint ventures and associates
at average rates, and on restatement of the opening net assets at closing rates,
are recognised in a separate translation reserve within equity, net of differences
on related currency borrowings. All other translation differences are taken to the
Consolidated Income Statement.
On disposal of a foreign operation, accumulated currency translation differences
are recognised in the Consolidated Income Statement as part of the overall gain
or loss on disposal. Goodwill and fair value adjustments arising on acquisition of
a foreign operation are regarded as assets and liabilities of the foreign operation,
are expressed in the functional currency of the foreign operation, are recorded in
euro at the exchange rate at the date of the transaction and are subsequently
retranslated at the applicable closing rates.
The principal exchange rates used for the translation of results, cash flows and
balance sheets into euro were as follows:
Average Year-end
euro 1 = 2012 2011 2012 2011
US Dollar 1.2848 1.3922 1.3194 1.2939
Pound Sterling 0.8109 0.8679 0.8161 0.8353
Polish Zloty 4.1847 4.1212 4.0740 4.4580
Ukrainian Hryvnya 10.3933 11.1202 10.6259 10.3752
Swiss Franc 1.2053 1.2326 1.2072 1.2156
Canadian Dollar 1.2842 1.3763 1.3137 1.3215
Argentine Peso 5.8492 5.7508 6.4890 5.5746
Turkish Lira 2.3135 2.3388 2.3551 2.4432
Indian Rupee 68.5973 64.9067 72.5600 68.7130
Chinese Renminbi 8.1052 8.9968 8.2207 8.1588
Accounting Policies | continued
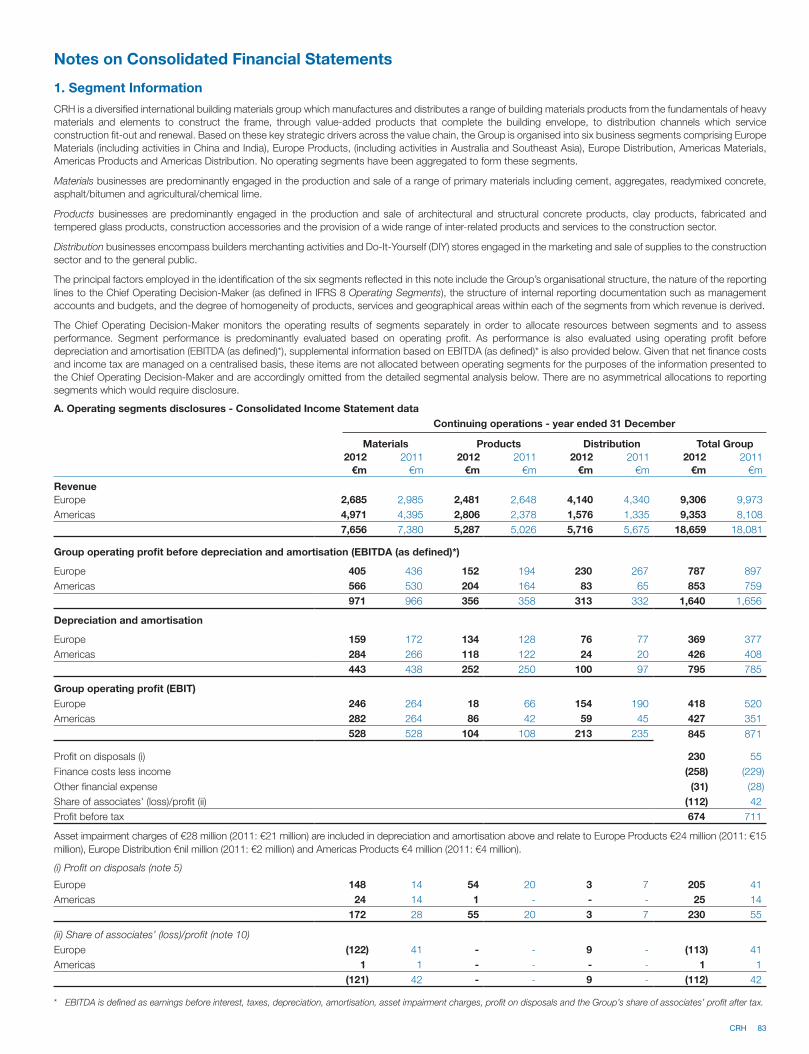
CRH 83
Notes on Consolidated Financial Statements
1. Segment Information
CRH is a diversified international building materials group which manufactures and distributes a range of building materials products from the fundamentals of heavy
materials and elements to construct the frame, through value-added products that complete the building envelope, to distribution channels which service
construction fit-out and renewal. Based on these key strategic drivers across the value chain, the Group is organised into six business segments comprising Europe
Materials (including activities in China and India), Europe Products, (including activities in Australia and Southeast Asia), Europe Distribution, Americas Materials,
Americas Products and Americas Distribution. No operating segments have been aggregated to form these segments.
Materials businesses are predominantly engaged in the production and sale of a range of primary materials including cement, aggregates, readymixed concrete,
asphalt/bitumen and agricultural/chemical lime.
Products businesses are predominantly engaged in the production and sale of architectural and structural concrete products, clay products, fabricated and
tempered glass products, construction accessories and the provision of a wide range of inter-related products and services to the construction sector.
Distribution businesses encompass builders merchanting activities and Do-It-Yourself (DIY) stores engaged in the marketing and sale of supplies to the construction
sector and to the general public.
The principal factors employed in the identification of the six segments reflected in this note include the Group’s organisational structure, the nature of the reporting
lines to the Chief Operating Decision-Maker (as defined in IFRS 8 Operating Segments), the structure of internal reporting documentation such as management
accounts and budgets, and the degree of homogeneity of products, services and geographical areas within each of the segments from which revenue is derived.
The Chief Operating Decision-Maker monitors the operating results of segments separately in order to allocate resources between segments and to assess
performance. Segment performance is predominantly evaluated based on operating profit. As performance is also evaluated using operating profit before
depreciation and amortisation (EBITDA (as defined)*), supplemental information based on EBITDA (as defined)* is also provided below. Given that net finance costs
and income tax are managed on a centralised basis, these items are not allocated between operating segments for the purposes of the information presented to
the Chief Operating Decision-Maker and are accordingly omitted from the detailed segmental analysis below. There are no asymmetrical allocations to reporting
segments which would require disclosure.
A. Operating segments disclosures - Consolidated Income Statement data
Continuing operations - year ended 31 December
Materials Products Distribution Total Group
2012 2011 2012 2011 2012 2011 2012 2011
€m €m €m €m €m €m €m €m
Revenue
Europe 2,685 2,985 2,481 2,648 4,140 4,340 9,306 9,973
Americas 4,971 4,395 2,806 2,378 1,576 1,335 9,353 8,108
7,656 7,380 5,287 5,026 5,716 5,675 18,659 18,081
Group operating profit before depreciation and amortisation (EBITDA (as defined)*)
Europe 405 436 152 194 230 267 787 897
Americas 566 530 204 164 83 65 853 759
971 966 356 358 313 332 1,640 1,656
Depreciation and amortisation
Europe 159 172 134 128 76 77 369 377
Americas 284 266 118 122 24 20 426 408
443 438 252 250 100 97 795 785
Group operating profit (EBIT)
Europe 246 264 18 66 154 190 418 520
Americas 282 264 86 42 59 45 427 351
528 528 104 108 213 235 845 871
Profit on disposals (i) 230 55
Finance costs less income (258) (229)
Other financial expense (31) (28)
Share of associates' (loss)/profit (ii) (112) 42
Profit before tax 674 711
Asset impairment charges of €28 million (2011: €21 million) are included in depreciation and amortisation above and relate to Europe Products €24 million (2011: €15
million), Europe Distribution €nil million (2011: €2 million) and Americas Products €4 million (2011: €4 million).
(i) Profit on disposals (note 5)
Europe 148 14 54 20 3 7 205 41
Americas 24 14 1 - - - 25 14
172 28 55 20 3 7 230 55
(ii) Share of associates’ (loss)/profit (note 10)
Europe (122) 41 - - 9 - (113) 41
Americas 1 1 - - - - 1 1
(121) 42 - - 9 - (112) 42
* EBITDA is defined as earnings before interest, taxes, depreciation, amortisation, asset impairment charges, profit on disposals and the Group’s share of associates’ profit after tax.
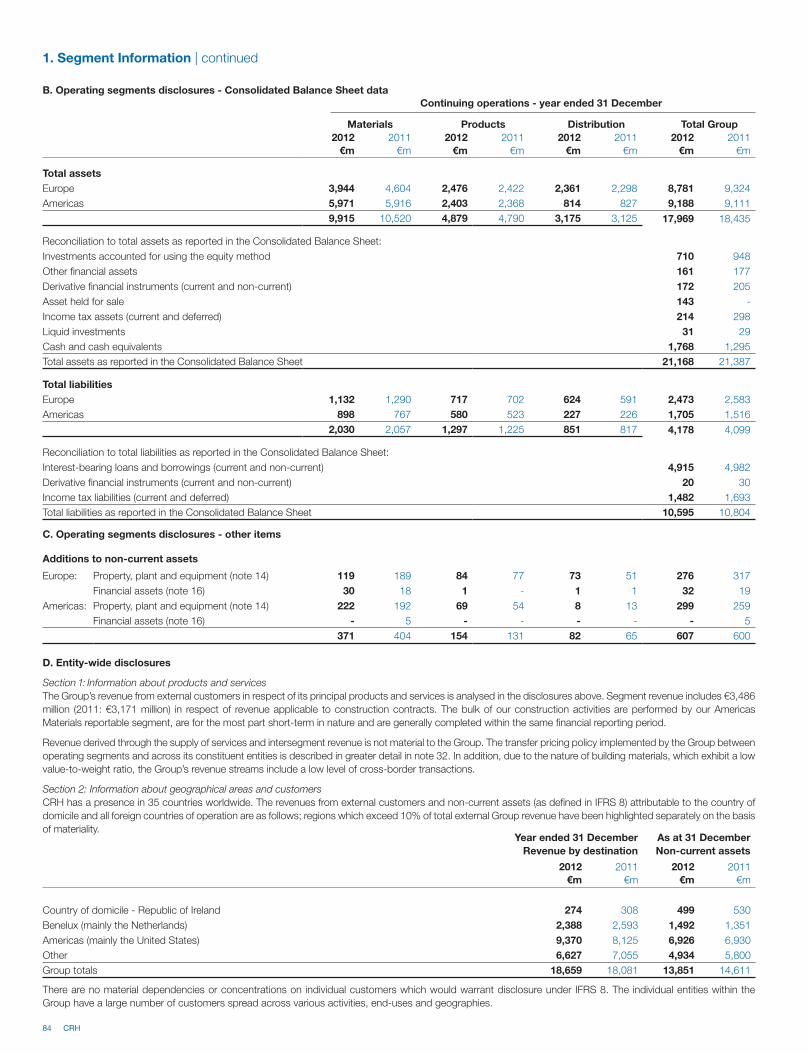
84 CRH
B. Operating segments disclosures - Consolidated Balance Sheet data
Continuing operations - year ended 31 December
Materials Products Distribution Total Group
2012 2011 2012 2011 2012 2011 2012 2011
€m €m €m €m €m €m €m €m
Total assets
Europe 3,944 4,604 2,476 2,422 2,361 2,298 8,781 9,324
Americas 5,971 5,916 2,403 2,368 814 827 9,188 9,111
9,915 10,520 4,879 4,790 3,175 3,125 17,969 18,435
Reconciliation to total assets as reported in the Consolidated Balance Sheet:
Investments accounted for using the equity method 710 948
Other financial assets 161 177
Derivative financial instruments (current and non-current) 172 205
Asset held for sale 143 -
Income tax assets (current and deferred) 214 298
Liquid investments 31 29
Cash and cash equivalents 1,768 1,295
Total assets as reported in the Consolidated Balance Sheet 21,168 21,387
Total liabilities
Europe 1,132 1,290 717 702 624 591 2,473 2,583
Americas 898 767 580 523 227 226 1,705 1,516
2,030 2,057 1,297 1,225 851 817 4,178 4,099
Reconciliation to total liabilities as reported in the Consolidated Balance Sheet:
Interest-bearing loans and borrowings (current and non-current) 4,915 4,982
Derivative financial instruments (current and non-current) 20 30
Income tax liabilities (current and deferred) 1,482 1,693
Total liabilities as reported in the Consolidated Balance Sheet 10,595 10,804
Year ended 31 December
Revenue by destination
As at 31 December
Non-current assets
2012 2011 2012 2011
€m €m €m €m
Country of domicile - Republic of Ireland 274 308 499 530
Benelux (mainly the Netherlands) 2,388 2,593 1,492 1,351
Americas (mainly the United States) 9,370 8,125 6,926 6,930
Other 6,627 7,055 4,934 5,800
Group totals 18,659 18,081 13,851 14,611
There are no material dependencies or concentrations on individual customers which would warrant disclosure under IFRS 8. The individual entities within the
Group have a large number of customers spread across various activities, end-uses and geographies.
C. Operating segments disclosures - other items
Additions to non-current assets
Europe: Property, plant and equipment (note 14) 119 189 84 77 73 51 276 317
Financial assets (note 16) 30 18 1 - 1 1 32 19
Americas: Property, plant and equipment (note 14) 222 192 69 54 8 13 299 259
Financial assets (note 16) - 5 - - - - - 5
371 404 154 131 82 65 607 600
D. Entity-wide disclosures
Section 1: Information about products and services
The Group’s revenue from external customers in respect of its principal products and services is analysed in the disclosures above. Segment revenue includes €3,486
million (2011: €3,171 million) in respect of revenue applicable to construction contracts. The bulk of our construction activities are performed by our Americas
Materials reportable segment, are for the most part short-term in nature and are generally completed within the same financial reporting period.
Revenue derived through the supply of services and intersegment revenue is not material to the Group. The transfer pricing policy implemented by the Group between
operating segments and across its constituent entities is described in greater detail in note 32. In addition, due to the nature of building materials, which exhibit a low
value-to-weight ratio, the Group’s revenue streams include a low level of cross-border transactions.
Section 2: Information about geographical areas and customers
CRH has a presence in 35 countries worldwide. The revenues from external customers and non-current assets (as defined in IFRS 8) attributable to the country of
domicile and all foreign countries of operation are as follows; regions which exceed 10% of total external Group revenue have been highlighted separately on the basis
of materiality.
1. Segment Information | continued
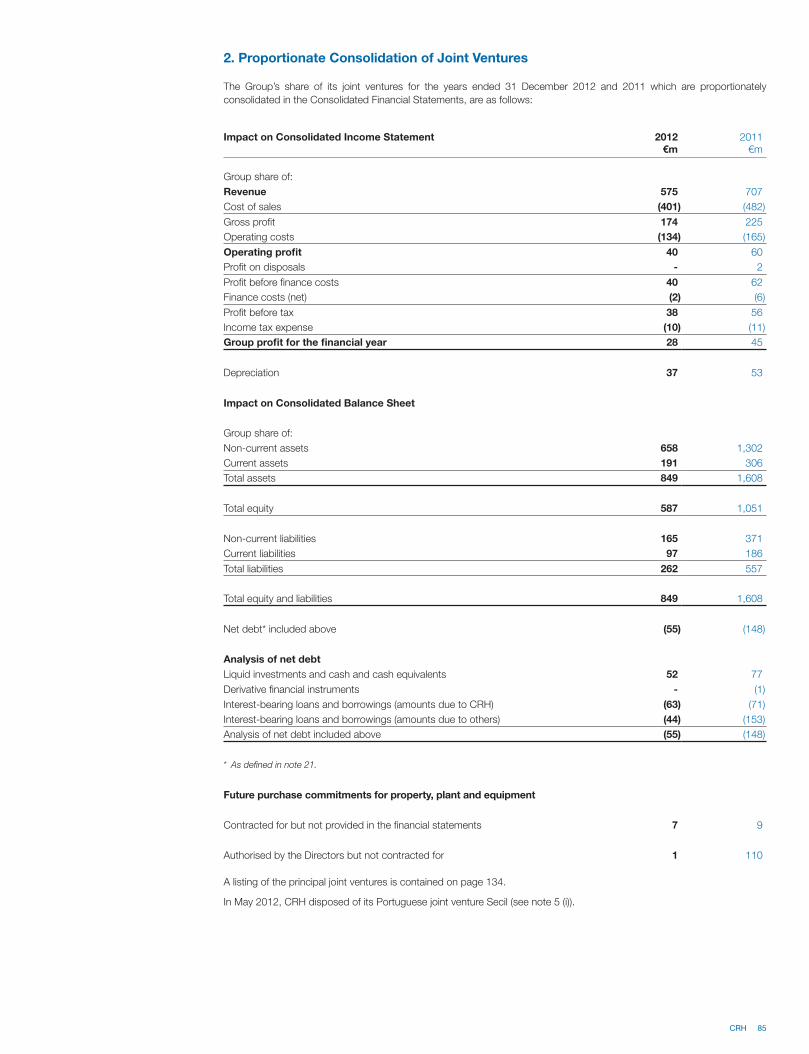
CRH 85
2. Proportionate Consolidation of Joint Ventures
The Group’s share of its joint ventures for the years ended 31 December 2012 and 2011 which are proportionately
consolidated in the Consolidated Financial Statements, are as follows:
Impact on Consolidated Income Statement 2012 2011€m €m
Group share of:
Revenue 575 707
Cost of sales (401) (482)
Gross profit 174 225
Operating costs (134) (165)
Operating profit 40 60
Profit on disposals - 2
Profit before finance costs 40 62
Finance costs (net) (2) (6)
Profit before tax 38 56
Income tax expense (10) (11)
Group profit for the financial year 28 45
Depreciation 37 53
Impact on Consolidated Balance Sheet
Group share of:
Non-current assets 658 1,302
Current assets 191 306
Total assets 849 1,608
Total equity 587 1,051
Non-current liabilities 165 371
Current liabilities 97 186
Total liabilities 262 557
Total equity and liabilities 849 1,608
Net debt* included above (55) (148)
Analysis of net debt
Liquid investments and cash and cash equivalents 52 77
Derivative financial instruments - (1)
Interest-bearing loans and borrowings (amounts due to CRH) (63) (71)
Interest-bearing loans and borrowings (amounts due to others) (44) (153)
Analysis of net debt included above (55) (148)
* As defined in note 21.
Future purchase commitments for property, plant and equipment
Contracted for but not provided in the financial statements 7 9
Authorised by the Directors but not contracted for 1 110
A listing of the principal joint ventures is contained on page 134.
In May 2012, CRH disposed of its Portuguese joint venture Secil (see note 5 (i)).
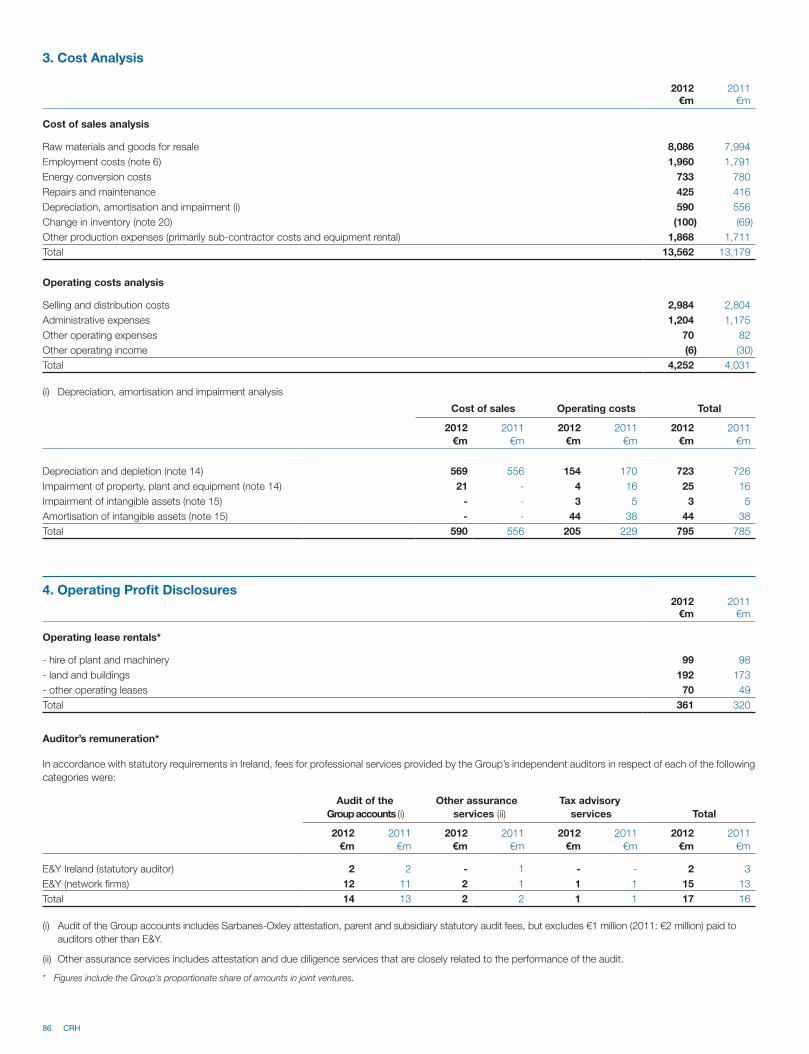
86 CRH
3. Cost Analysis
2012 2011€m €m
Cost of sales analysis
Raw materials and goods for resale 8,086 7,994
Employment costs (note 6) 1,960 1,791
Energy conversion costs 733 780
Repairs and maintenance 425 416
Depreciation, amortisation and impairment (i) 590 556
Change in inventory (note 20) (100) (69)
Other production expenses (primarily sub-contractor costs and equipment rental) 1,868 1,711
Total 13,562 13,179
Operating costs analysis
Selling and distribution costs 2,984 2,804
Administrative expenses 1,204 1,175
Other operating expenses 70 82
Other operating income (6) (30)
Total 4,252 4,031
(i) Depreciation, amortisation and impairment analysis
4. Operating Profit Disclosures2012 2011
€m €m
Operating lease rentals*
- hire of plant and machinery 99 98
- land and buildings 192 173
- other operating leases 70 49
Total 361 320
Cost of sales Operating costs Total
2012 2011 2012 2011 2012 2011
€m €m €m €m €m €m
Depreciation and depletion (note 14) 569 556 154 170 723 726
Impairment of property, plant and equipment (note 14) 21 - 4 16 25 16
Impairment of intangible assets (note 15) - - 3 5 3 5
Amortisation of intangible assets (note 15) - - 44 38 44 38
Total 590 556 205 229 795 785
Auditor’s remuneration*
In accordance with statutory requirements in Ireland, fees for professional services provided by the Group’s independent auditors in respect of each of the following
categories were:
Audit of the Other assurance Tax advisory
Group accounts (i) services (ii) services Total
2012 2011 2012 2011 2012 2011 2012 2011
€m €m €m €m €m €m €m €m
E&Y Ireland (statutory auditor) 2 2 - 1 - - 2 3
E&Y (network firms) 12 11 2 1 1 1 15 13
Total 14 13 2 2 1 1 17 16
(i) Audit of the Group accounts includes Sarbanes-Oxley attestation, parent and subsidiary statutory audit fees, but excludes €1 million (2011: €2 million) paid to
auditors other than E&Y.
(ii) Other assurance services includes attestation and due diligence services that are closely related to the performance of the audit.
* Figures include the Group’s proportionate share of amounts in joint ventures.
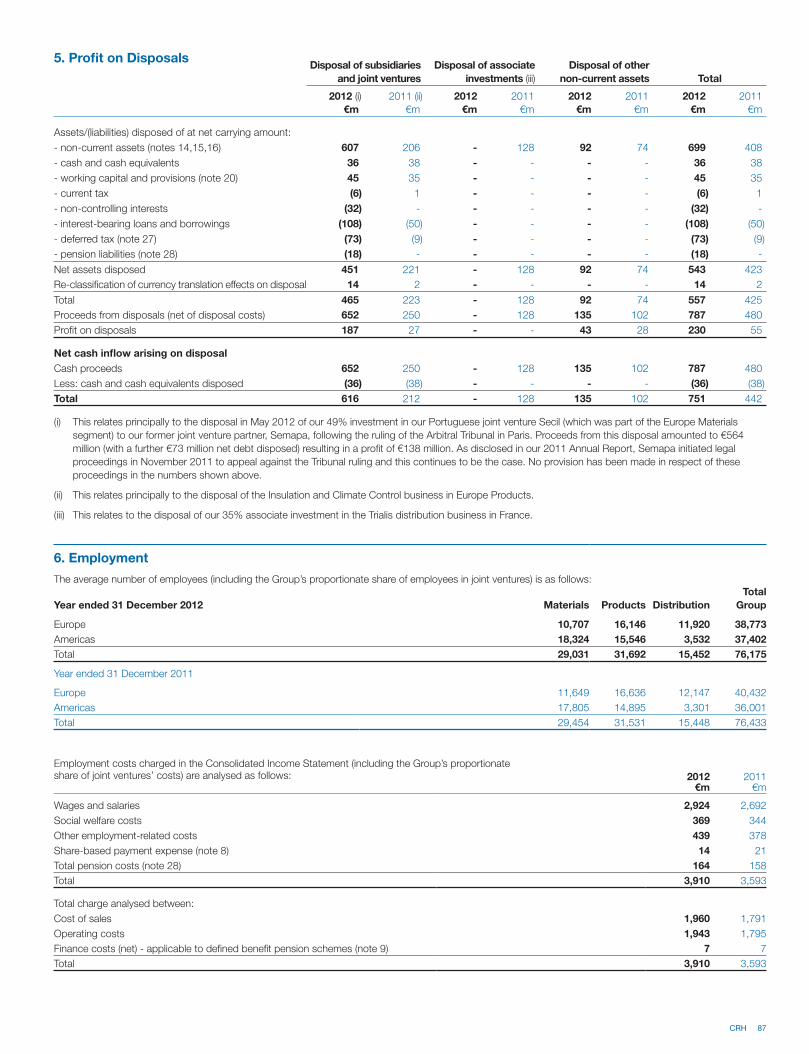
CRH 87
5. Profit on DisposalsDisposal of subsidiaries
and joint ventures
Disposal of associate
investments (iii)
Disposal of other
non-current assets Total
2012 (i) 2011 (ii) 2012 2011 2012 2011 2012 2011
€m €m €m €m €m €m €m €m
Assets/(liabilities) disposed of at net carrying amount:
- non-current assets (notes 14,15,16) 607 206 - 128 92 74 699 408
- cash and cash equivalents 36 38 - - - - 36 38
- working capital and provisions (note 20) 45 35 - - - - 45 35
- current tax (6) 1 - - - - (6) 1
- non-controlling interests (32) - - - - - (32) -
- interest-bearing loans and borrowings (108) (50) - - - - (108) (50)
- deferred tax (note 27) (73) (9) - - - - (73) (9)
- pension liabilities (note 28) (18) - - - - - (18) -
Net assets disposed 451 221 - 128 92 74 543 423
Re-classification of currency translation effects on disposal 14 2 - - - - 14 2
Total 465 223 - 128 92 74 557 425
Proceeds from disposals (net of disposal costs) 652 250 - 128 135 102 787 480
Profit on disposals 187 27 - - 43 28 230 55
Net cash inflow arising on disposal
Cash proceeds 652 250 - 128 135 102 787 480
Less: cash and cash equivalents disposed (36) (38) - - - - (36) (38)
Total 616 212 - 128 135 102 751 442
(i) This relates principally to the disposal in May 2012 of our 49% investment in our Portuguese joint venture Secil (which was part of the Europe Materials
segment) to our former joint venture partner, Semapa, following the ruling of the Arbitral Tribunal in Paris. Proceeds from this disposal amounted to €564
million (with a further €73 million net debt disposed) resulting in a profit of €138 million. As disclosed in our 2011 Annual Report, Semapa initiated legal
proceedings in November 2011 to appeal against the Tribunal ruling and this continues to be the case. No provision has been made in respect of these
proceedings in the numbers shown above.
(ii) This relates principally to the disposal of the Insulation and Climate Control business in Europe Products.
(iii) This relates to the disposal of our 35% associate investment in the Trialis distribution business in France.
6. Employment
The average number of employees (including the Group’s proportionate share of employees in joint ventures) is as follows:
Year ended 31 December 2012 Materials Products Distribution
Total
Group
Europe 10,707 16,146 11,920 38,773
Americas 18,324 15,546 3,532 37,402
Total 29,031 31,692 15,452 76,175
Year ended 31 December 2011
Europe 11,649 16,636 12,147 40,432
Americas 17,805 14,895 3,301 36,001
Total 29,454 31,531 15,448 76,433
Employment costs charged in the Consolidated Income Statement (including the Group’s proportionate share of joint ventures’ costs) are analysed as follows: 2012 2011
€m €m
Wages and salaries 2,924 2,692
Social welfare costs 369 344
Other employment-related costs 439 378
Share-based payment expense (note 8) 14 21
Total pension costs (note 28) 164 158
Total 3,910 3,593
Total charge analysed between:
Cost of sales 1,960 1,791
Operating costs 1,943 1,795
Finance costs (net) - applicable to defined benefit pension schemes (note 9) 7 7
Total 3,910 3,593
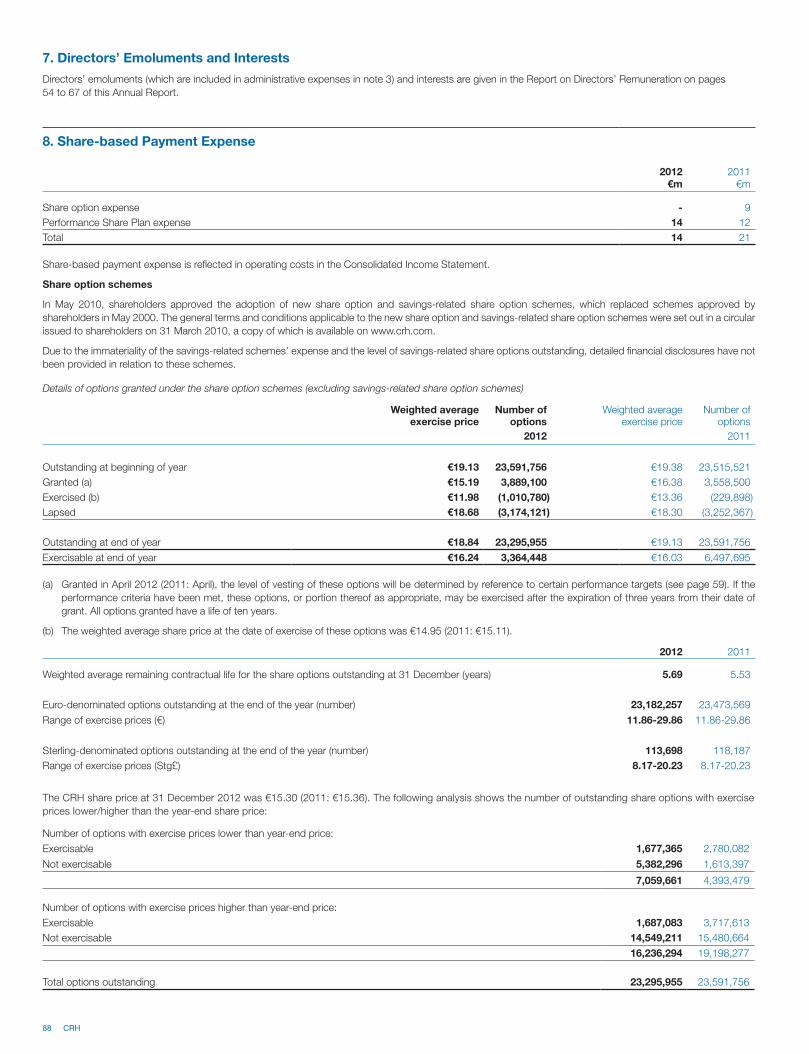
88 CRH
8. Share-based Payment Expense
2012 2011€m €m
Share option expense - 9
Performance Share Plan expense 14 12
Total 14 21
Share-based payment expense is reflected in operating costs in the Consolidated Income Statement.
Share option schemes
In May 2010, shareholders approved the adoption of new share option and savings-related share option schemes, which replaced schemes approved by
shareholders in May 2000. The general terms and conditions applicable to the new share option and savings-related share option schemes were set out in a circular
issued to shareholders on 31 March 2010, a copy of which is available on www.crh.com.
Due to the immateriality of the savings-related schemes’ expense and the level of savings-related share options outstanding, detailed financial disclosures have not
been provided in relation to these schemes.
Details of options granted under the share option schemes (excluding savings-related share option schemes)
Weighted average exercise price
Number of options
Weighted average exercise price
Number of options
2012 2011
Outstanding at beginning of year €19.13 23,591,756 €19.38 23,515,521
Granted (a) €15.19 3,889,100 €16.38 3,558,500
Exercised (b) €11.98 (1,010,780) €13.36 (229,898)
Lapsed €18.68 (3,174,121) €18.30 (3,252,367)
Outstanding at end of year €18.84 23,295,955 €19.13 23,591,756
Exercisable at end of year €16.24 3,364,448 €16.03 6,497,695
(a) Granted in April 2012 (2011: April), the level of vesting of these options will be determined by reference to certain performance targets (see page 59). If the
performance criteria have been met, these options, or portion thereof as appropriate, may be exercised after the expiration of three years from their date of
grant. All options granted have a life of ten years.
(b) The weighted average share price at the date of exercise of these options was €14.95 (2011: €15.11).
2012 2011
Weighted average remaining contractual life for the share options outstanding at 31 December (years) 5.69 5.53
Euro-denominated options outstanding at the end of the year (number) 23,182,257 23,473,569
Range of exercise prices (€) 11.86-29.86 11.86-29.86
Sterling-denominated options outstanding at the end of the year (number) 113,698 118,187
Range of exercise prices (Stg£) 8.17-20.23 8.17-20.23
The CRH share price at 31 December 2012 was €15.30 (2011: €15.36). The following analysis shows the number of outstanding share options with exercise
prices lower/higher than the year-end share price:
Number of options with exercise prices lower than year-end price:
Exercisable 1,677,365 2,780,082
Not exercisable 5,382,296 1,613,397
7,059,661 4,393,479
Number of options with exercise prices higher than year-end price:
Exercisable 1,687,083 3,717,613
Not exercisable 14,549,211 15,480,664
16,236,294 19,198,277
Total options outstanding 23,295,955 23,591,756
7. Directors’ Emoluments and Interests
Directors’ emoluments (which are included in administrative expenses in note 3) and interests are given in the Report on Directors’ Remuneration on pages
54 to 67 of this Annual Report.
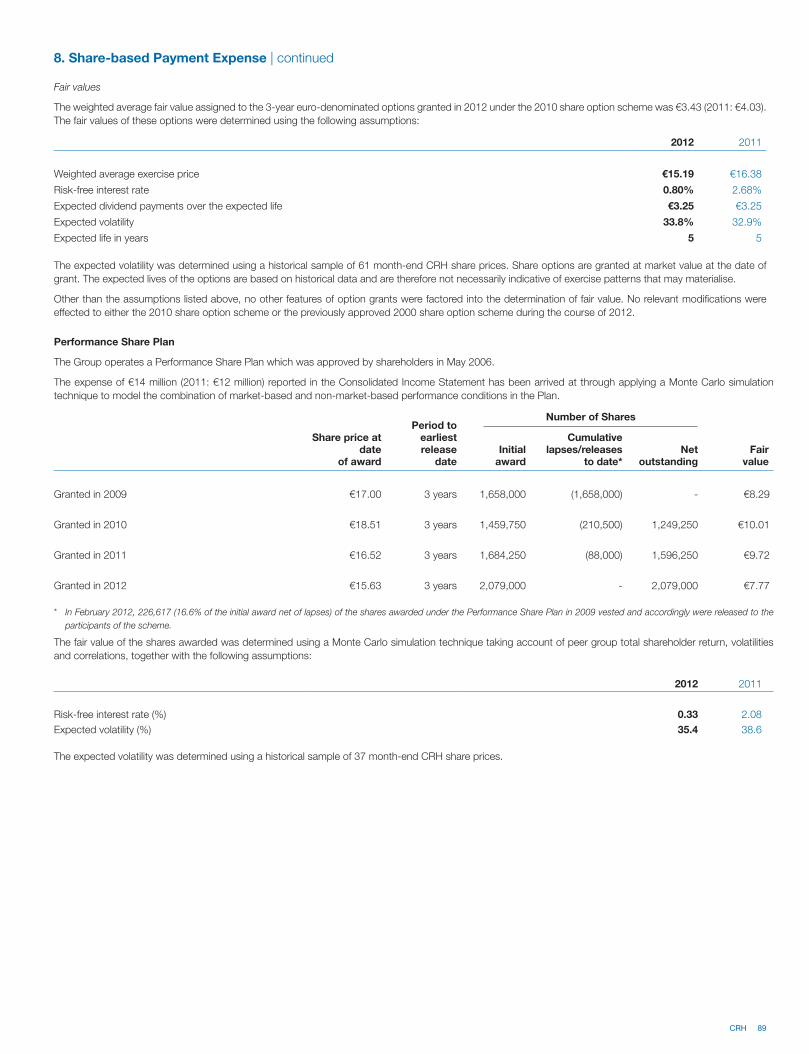
CRH 89
8. Share-based Payment Expense | continued
Fair values
The weighted average fair value assigned to the 3-year euro-denominated options granted in 2012 under the 2010 share option scheme was €3.43 (2011: €4.03).
The fair values of these options were determined using the following assumptions:
2012 2011
Weighted average exercise price €15.19 €16.38
Risk-free interest rate 0.80% 2.68%
Expected dividend payments over the expected life €3.25 €3.25
Expected volatility 33.8% 32.9%
Expected life in years 5 5
The expected volatility was determined using a historical sample of 61 month-end CRH share prices. Share options are granted at market value at the date of
grant. The expected lives of the options are based on historical data and are therefore not necessarily indicative of exercise patterns that may materialise.
Other than the assumptions listed above, no other features of option grants were factored into the determination of fair value. No relevant modifications were
effected to either the 2010 share option scheme or the previously approved 2000 share option scheme during the course of 2012.
Performance Share Plan
The Group operates a Performance Share Plan which was approved by shareholders in May 2006.
The expense of €14 million (2011: €12 million) reported in the Consolidated Income Statement has been arrived at through applying a Monte Carlo simulation
technique to model the combination of market-based and non-market-based performance conditions in the Plan.
Share price at date
of award
Period to earliest release
date
Number of Shares
Fair value
Initialaward
Cumulativelapses/releases
to date*Net
outstanding
Granted in 2009 €17.00 3 years 1,658,000 (1,658,000) - €8.29
Granted in 2010 €18.51 3 years 1,459,750 (210,500) 1,249,250 €10.01
Granted in 2011 €16.52 3 years 1,684,250 (88,000) 1,596,250 €9.72
Granted in 2012 €15.63 3 years 2,079,000 - 2,079,000 €7.77
* In February 2012, 226,617 (16.6% of the initial award net of lapses) of the shares awarded under the Performance Share Plan in 2009 vested and accordingly were released to the
participants of the scheme.
The fair value of the shares awarded was determined using a Monte Carlo simulation technique taking account of peer group total shareholder return, volatilities
and correlations, together with the following assumptions:
2012 2011
Risk-free interest rate (%) 0.33 2.08
Expected volatility (%) 35.4 38.6
The expected volatility was determined using a historical sample of 37 month-end CRH share prices.
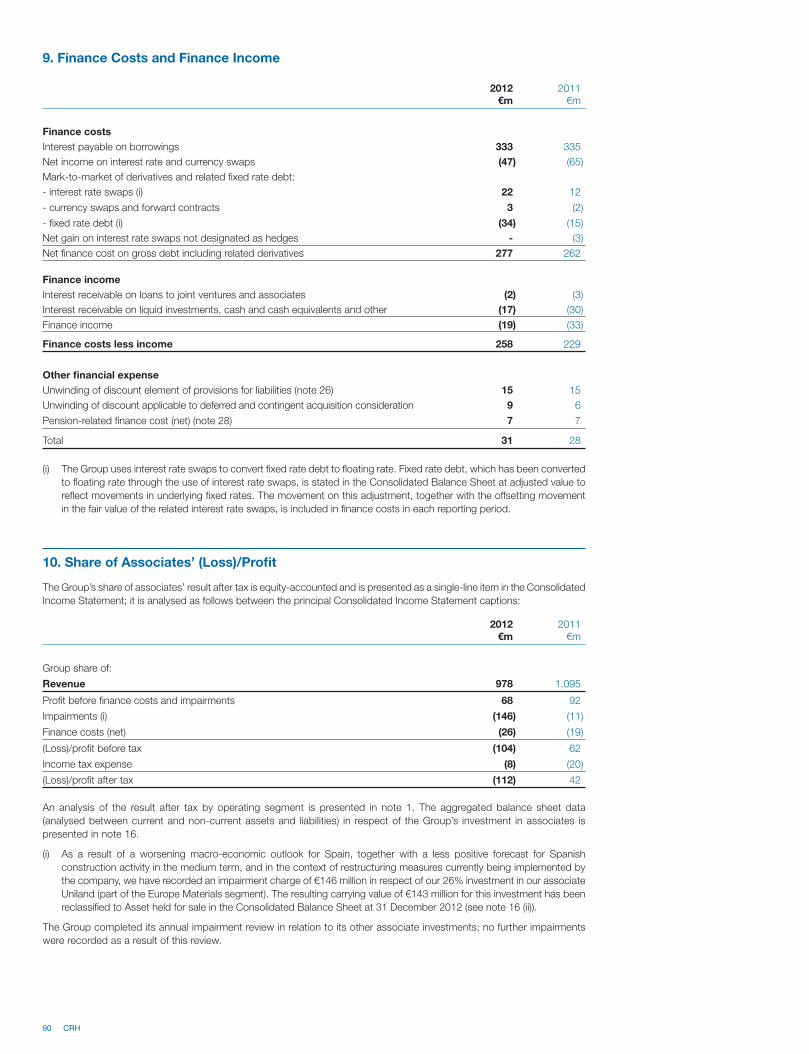
90 CRH
9. Finance Costs and Finance Income
2012 2011€m €m
Finance costs
Interest payable on borrowings 333 335
Net income on interest rate and currency swaps (47) (65)
Mark-to-market of derivatives and related fixed rate debt:
- interest rate swaps (i) 22 12
- currency swaps and forward contracts 3 (2)
- fixed rate debt (i) (34) (15)
Net gain on interest rate swaps not designated as hedges - (3)
Net finance cost on gross debt including related derivatives 277 262
Finance income
Interest receivable on loans to joint ventures and associates (2) (3)
Interest receivable on liquid investments, cash and cash equivalents and other (17) (30)
Finance income (19) (33)
Finance costs less income 258 229
Other financial expense
Unwinding of discount element of provisions for liabilities (note 26) 15 15
Unwinding of discount applicable to deferred and contingent acquisition consideration 9 6
Pension-related finance cost (net) (note 28) 7 7
Total 31 28
(i) The Group uses interest rate swaps to convert fixed rate debt to floating rate. Fixed rate debt, which has been converted
to floating rate through the use of interest rate swaps, is stated in the Consolidated Balance Sheet at adjusted value to
reflect movements in underlying fixed rates. The movement on this adjustment, together with the offsetting movement
in the fair value of the related interest rate swaps, is included in finance costs in each reporting period.
10. Share of Associates’ (Loss)/Profit
The Group’s share of associates’ result after tax is equity-accounted and is presented as a single-line item in the Consolidated
Income Statement; it is analysed as follows between the principal Consolidated Income Statement captions:
2012 2011€m €m
Group share of:
Revenue 978 1,095
Profit before finance costs and impairments 68 92
Impairments (i) (146) (11)
Finance costs (net) (26) (19)
(Loss)/profit before tax (104) 62
Income tax expense (8) (20)
(Loss)/profit after tax (112) 42
An analysis of the result after tax by operating segment is presented in note 1. The aggregated balance sheet data
(analysed between current and non-current assets and liabilities) in respect of the Group’s investment in associates is
presented in note 16.
(i) As a result of a worsening macro-economic outlook for Spain, together with a less positive forecast for Spanish
construction activity in the medium term, and in the context of restructuring measures currently being implemented by
the company, we have recorded an impairment charge of €146 million in respect of our 26% investment in our associate
Uniland (part of the Europe Materials segment). The resulting carrying value of €143 million for this investment has been
reclassified to Asset held for sale in the Consolidated Balance Sheet at 31 December 2012 (see note 16 (ii)).
The Group completed its annual impairment review in relation to its other associate investments; no further impairments
were recorded as a result of this review.
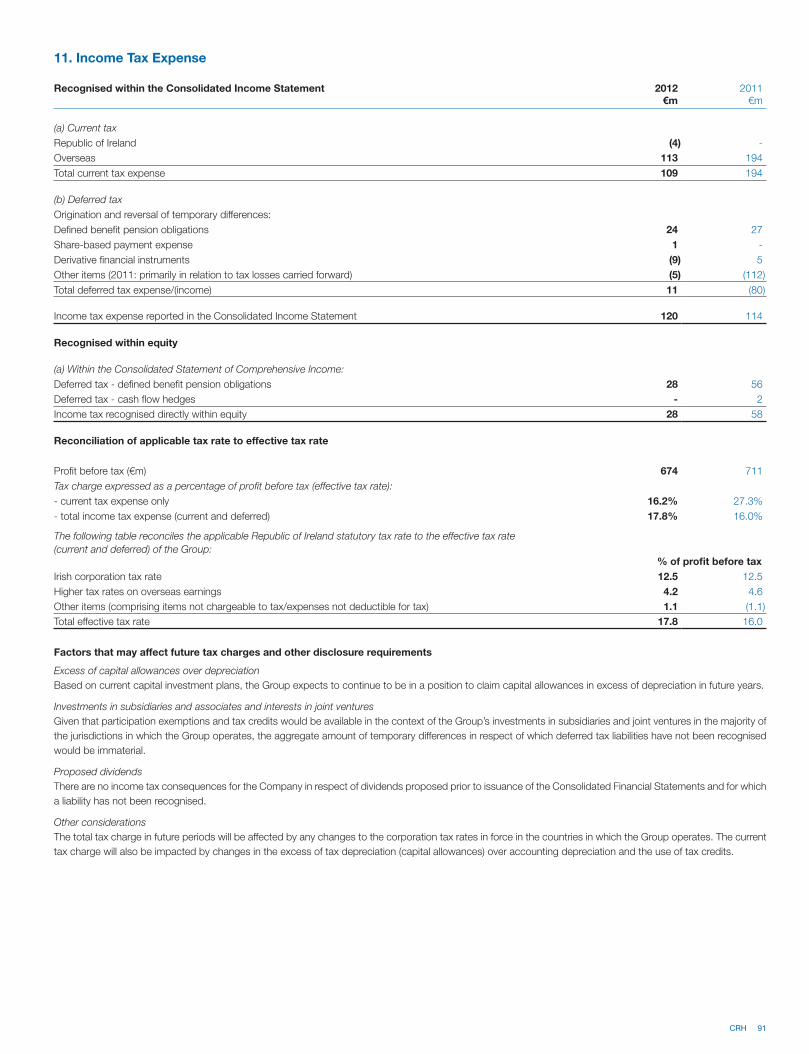
CRH 91
11. Income Tax Expense
Recognised within the Consolidated Income Statement 2012 2011€m €m
(a) Current tax
Republic of Ireland (4) -
Overseas 113 194
Total current tax expense 109 194
(b) Deferred tax
Origination and reversal of temporary differences:
Defined benefit pension obligations 24 27
Share-based payment expense 1 -
Derivative financial instruments (9) 5
Other items (2011: primarily in relation to tax losses carried forward) (5) (112)
Total deferred tax expense/(income) 11 (80)
Income tax expense reported in the Consolidated Income Statement 120 114
Recognised within equity
(a) Within the Consolidated Statement of Comprehensive Income:
Deferred tax - defined benefit pension obligations 28 56
Deferred tax - cash flow hedges - 2
Income tax recognised directly within equity 28 58
Reconciliation of applicable tax rate to effective tax rate
Profit before tax (€m) 674 711
Tax charge expressed as a percentage of profit before tax (effective tax rate):
- current tax expense only 16.2% 27.3%
- total income tax expense (current and deferred) 17.8% 16.0%
The following table reconciles the applicable Republic of Ireland statutory tax rate to the effective tax rate
(current and deferred) of the Group:% of profit before tax
Irish corporation tax rate 12.5 12.5
Higher tax rates on overseas earnings 4.2 4.6
Other items (comprising items not chargeable to tax/expenses not deductible for tax) 1.1 (1.1)
Total effective tax rate 17.8 16.0
Factors that may affect future tax charges and other disclosure requirements
Excess of capital allowances over depreciation
Based on current capital investment plans, the Group expects to continue to be in a position to claim capital allowances in excess of depreciation in future years.
Investments in subsidiaries and associates and interests in joint ventures
Given that participation exemptions and tax credits would be available in the context of the Group’s investments in subsidiaries and joint ventures in the majority of
the jurisdictions in which the Group operates, the aggregate amount of temporary differences in respect of which deferred tax liabilities have not been recognised
would be immaterial.
Proposed dividends
There are no income tax consequences for the Company in respect of dividends proposed prior to issuance of the Consolidated Financial Statements and for which
a liability has not been recognised.
Other considerations
The total tax charge in future periods will be affected by any changes to the corporation tax rates in force in the countries in which the Group operates. The current
tax charge will also be impacted by changes in the excess of tax depreciation (capital allowances) over accounting depreciation and the use of tax credits.
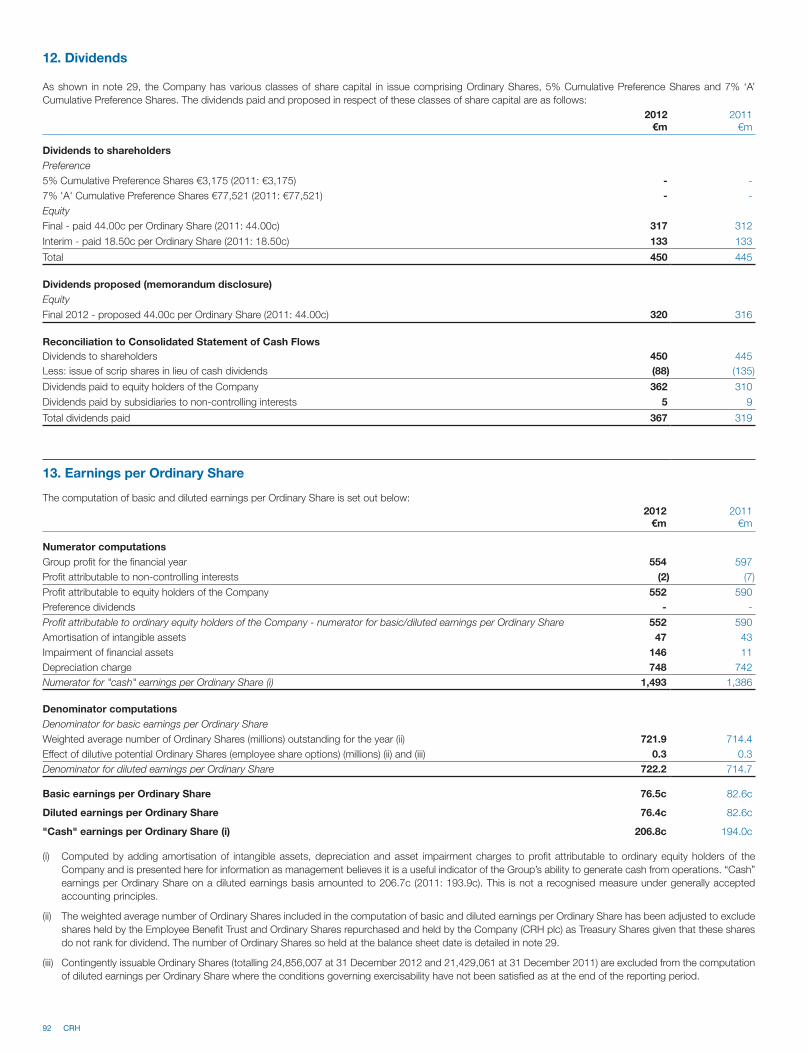
92 CRH
12. Dividends
As shown in note 29, the Company has various classes of share capital in issue comprising Ordinary Shares, 5% Cumulative Preference Shares and 7% ‘A’
Cumulative Preference Shares. The dividends paid and proposed in respect of these classes of share capital are as follows:
2012 2011€m €m
Dividends to shareholders
Preference
5% Cumulative Preference Shares €3,175 (2011: €3,175) - -
7% 'A' Cumulative Preference Shares €77,521 (2011: €77,521) - -
Equity
Final - paid 44.00c per Ordinary Share (2011: 44.00c) 317 312
Interim - paid 18.50c per Ordinary Share (2011: 18.50c) 133 133
Total 450 445
Dividends proposed (memorandum disclosure)
Equity
Final 2012 - proposed 44.00c per Ordinary Share (2011: 44.00c) 320 316
Reconciliation to Consolidated Statement of Cash Flows
Dividends to shareholders 450 445
Less: issue of scrip shares in lieu of cash dividends (88) (135)
Dividends paid to equity holders of the Company 362 310
Dividends paid by subsidiaries to non-controlling interests 5 9
Total dividends paid 367 319
13. Earnings per Ordinary Share
The computation of basic and diluted earnings per Ordinary Share is set out below:
2012 2011€m €m
Numerator computations
Group profit for the financial year 554 597
Profit attributable to non-controlling interests (2) (7)
Profit attributable to equity holders of the Company 552 590
Preference dividends - -
Profit attributable to ordinary equity holders of the Company - numerator for basic/diluted earnings per Ordinary Share 552 590
Amortisation of intangible assets 47 43
Impairment of financial assets 146 11
Depreciation charge 748 742
Numerator for "cash" earnings per Ordinary Share (i) 1,493 1,386
Denominator computations
Denominator for basic earnings per Ordinary Share
Weighted average number of Ordinary Shares (millions) outstanding for the year (ii) 721.9 714.4
Effect of dilutive potential Ordinary Shares (employee share options) (millions) (ii) and (iii) 0.3 0.3
Denominator for diluted earnings per Ordinary Share 722.2 714.7
Basic earnings per Ordinary Share 76.5c 82.6c
Diluted earnings per Ordinary Share 76.4c 82.6c
"Cash" earnings per Ordinary Share (i) 206.8c 194.0c
(i) Computed by adding amortisation of intangible assets, depreciation and asset impairment charges to profit attributable to ordinary equity holders of the
Company and is presented here for information as management believes it is a useful indicator of the Group’s ability to generate cash from operations. “Cash”
earnings per Ordinary Share on a diluted earnings basis amounted to 206.7c (2011: 193.9c). This is not a recognised measure under generally accepted
accounting principles.
(ii) The weighted average number of Ordinary Shares included in the computation of basic and diluted earnings per Ordinary Share has been adjusted to exclude
shares held by the Employee Benefit Trust and Ordinary Shares repurchased and held by the Company (CRH plc) as Treasury Shares given that these shares
do not rank for dividend. The number of Ordinary Shares so held at the balance sheet date is detailed in note 29.
(iii) Contingently issuable Ordinary Shares (totalling 24,856,007 at 31 December 2012 and 21,429,061 at 31 December 2011) are excluded from the computation
of diluted earnings per Ordinary Share where the conditions governing exercisability have not been satisfied as at the end of the reporting period.
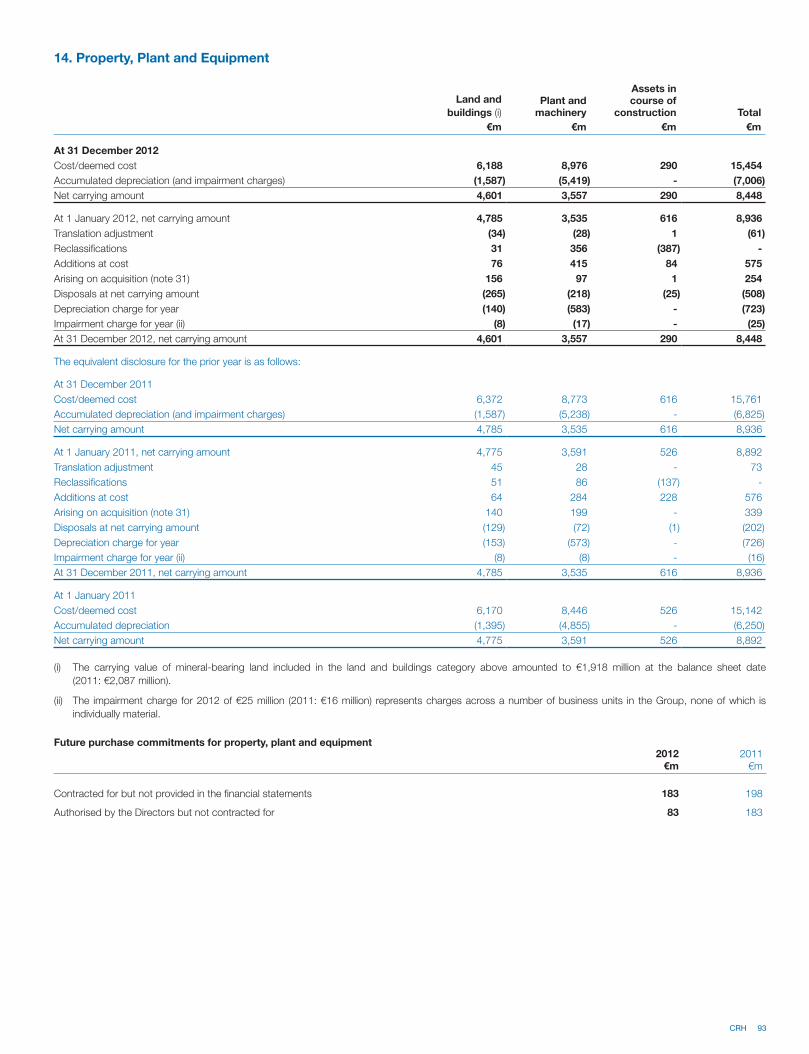
CRH 93
14. Property, Plant and Equipment
Land and
buildings (i)Plant and
machinery
Assets in course of
construction Total
€m €m €m €m
At 31 December 2012
Cost/deemed cost 6,188 8,976 290 15,454
Accumulated depreciation (and impairment charges) (1,587) (5,419) - (7,006)
Net carrying amount 4,601 3,557 290 8,448
At 1 January 2012, net carrying amount 4,785 3,535 616 8,936
Translation adjustment (34) (28) 1 (61)
Reclassifications 31 356 (387) -
Additions at cost 76 415 84 575
Arising on acquisition (note 31) 156 97 1 254
Disposals at net carrying amount (265) (218) (25) (508)
Depreciation charge for year (140) (583) - (723)
Impairment charge for year (ii) (8) (17) - (25)
At 31 December 2012, net carrying amount 4,601 3,557 290 8,448
The equivalent disclosure for the prior year is as follows:
At 31 December 2011
Cost/deemed cost 6,372 8,773 616 15,761
Accumulated depreciation (and impairment charges) (1,587) (5,238) - (6,825)
Net carrying amount 4,785 3,535 616 8,936
At 1 January 2011, net carrying amount 4,775 3,591 526 8,892
Translation adjustment 45 28 - 73
Reclassifications 51 86 (137) -
Additions at cost 64 284 228 576
Arising on acquisition (note 31) 140 199 - 339
Disposals at net carrying amount (129) (72) (1) (202)
Depreciation charge for year (153) (573) - (726)
Impairment charge for year (ii) (8) (8) - (16)
At 31 December 2011, net carrying amount 4,785 3,535 616 8,936
At 1 January 2011
Cost/deemed cost 6,170 8,446 526 15,142
Accumulated depreciation (1,395) (4,855) - (6,250)
Net carrying amount 4,775 3,591 526 8,892
(i) The carrying value of mineral-bearing land included in the land and buildings category above amounted to €1,918 million at the balance sheet date
(2011: €2,087 million).
(ii) The impairment charge for 2012 of €25 million (2011: €16 million) represents charges across a number of business units in the Group, none of which is
individually material.
Future purchase commitments for property, plant and equipment2012 2011
€m €m
Contracted for but not provided in the financial statements 183 198
Authorised by the Directors but not contracted for 83 183
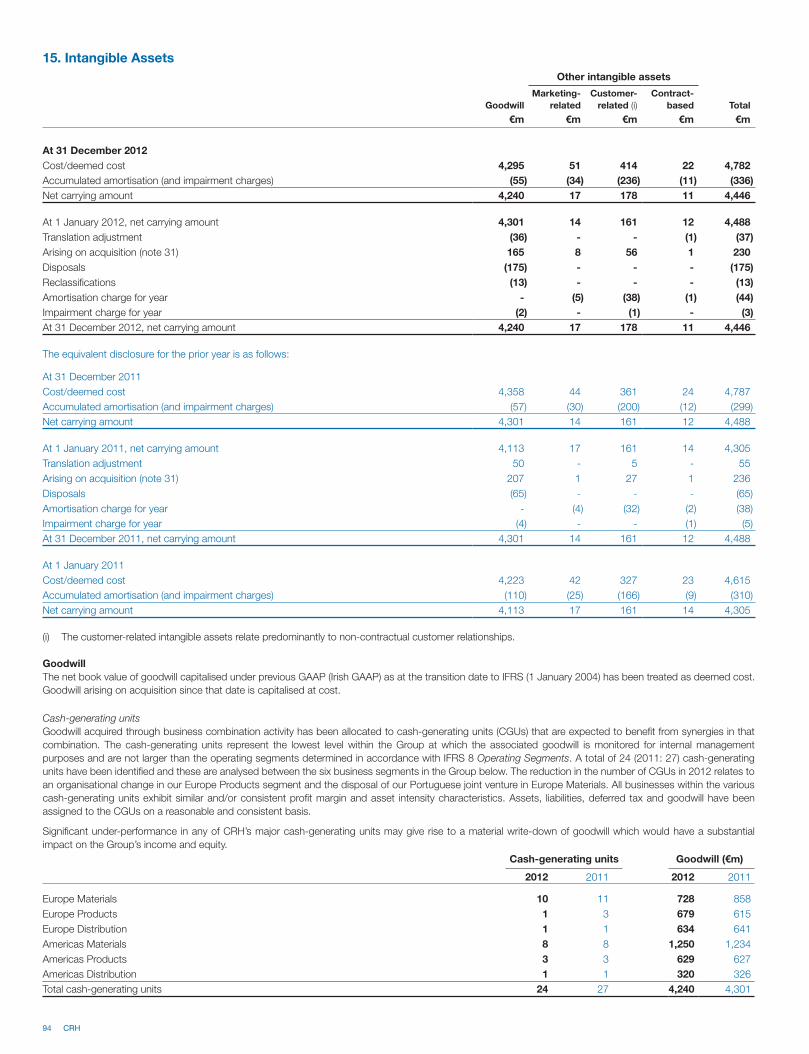
94 CRH
15. Intangible Assets
Other intangible assets
Goodwill
Marketing-
related
Customer-
related (i)
Contract-
based Total
€m €m €m €m €m
At 31 December 2012
Cost/deemed cost 4,295 51 414 22 4,782
Accumulated amortisation (and impairment charges) (55) (34) (236) (11) (336)
Net carrying amount 4,240 17 178 11 4,446
At 1 January 2012, net carrying amount 4,301 14 161 12 4,488
Translation adjustment (36) - - (1) (37)
Arising on acquisition (note 31) 165 8 56 1 230
Disposals (175) - - - (175)
Reclassifications (13) - - - (13)
Amortisation charge for year - (5) (38) (1) (44)
Impairment charge for year (2) - (1) - (3)
At 31 December 2012, net carrying amount 4,240 17 178 11 4,446
The equivalent disclosure for the prior year is as follows:
At 31 December 2011
Cost/deemed cost 4,358 44 361 24 4,787
Accumulated amortisation (and impairment charges) (57) (30) (200) (12) (299)
Net carrying amount 4,301 14 161 12 4,488
At 1 January 2011, net carrying amount 4,113 17 161 14 4,305
Translation adjustment 50 - 5 - 55
Arising on acquisition (note 31) 207 1 27 1 236
Disposals (65) - - - (65)
Amortisation charge for year - (4) (32) (2) (38)
Impairment charge for year (4) - - (1) (5)
At 31 December 2011, net carrying amount 4,301 14 161 12 4,488
At 1 January 2011
Cost/deemed cost 4,223 42 327 23 4,615
Accumulated amortisation (and impairment charges) (110) (25) (166) (9) (310)
Net carrying amount 4,113 17 161 14 4,305
(i) The customer-related intangible assets relate predominantly to non-contractual customer relationships.
Goodwill
The net book value of goodwill capitalised under previous GAAP (Irish GAAP) as at the transition date to IFRS (1 January 2004) has been treated as deemed cost.
Goodwill arising on acquisition since that date is capitalised at cost.
Cash-generating units
Goodwill acquired through business combination activity has been allocated to cash-generating units (CGUs) that are expected to benefit from synergies in that
combination. The cash-generating units represent the lowest level within the Group at which the associated goodwill is monitored for internal management
purposes and are not larger than the operating segments determined in accordance with IFRS 8 Operating Segments. A total of 24 (2011: 27) cash-generating
units have been identified and these are analysed between the six business segments in the Group below. The reduction in the number of CGUs in 2012 relates to
an organisational change in our Europe Products segment and the disposal of our Portuguese joint venture in Europe Materials. All businesses within the various
cash-generating units exhibit similar and/or consistent profit margin and asset intensity characteristics. Assets, liabilities, deferred tax and goodwill have been
assigned to the CGUs on a reasonable and consistent basis.
Significant under-performance in any of CRH’s major cash-generating units may give rise to a material write-down of goodwill which would have a substantial
impact on the Group’s income and equity.
Cash-generating units Goodwill (€m)
2012 2011 2012 2011
Europe Materials 10 11 728 858
Europe Products 1 3 679 615
Europe Distribution 1 1 634 641
Americas Materials 8 8 1,250 1,234
Americas Products 3 3 629 627
Americas Distribution 1 1 320 326
Total cash-generating units 24 27 4,240 4,301
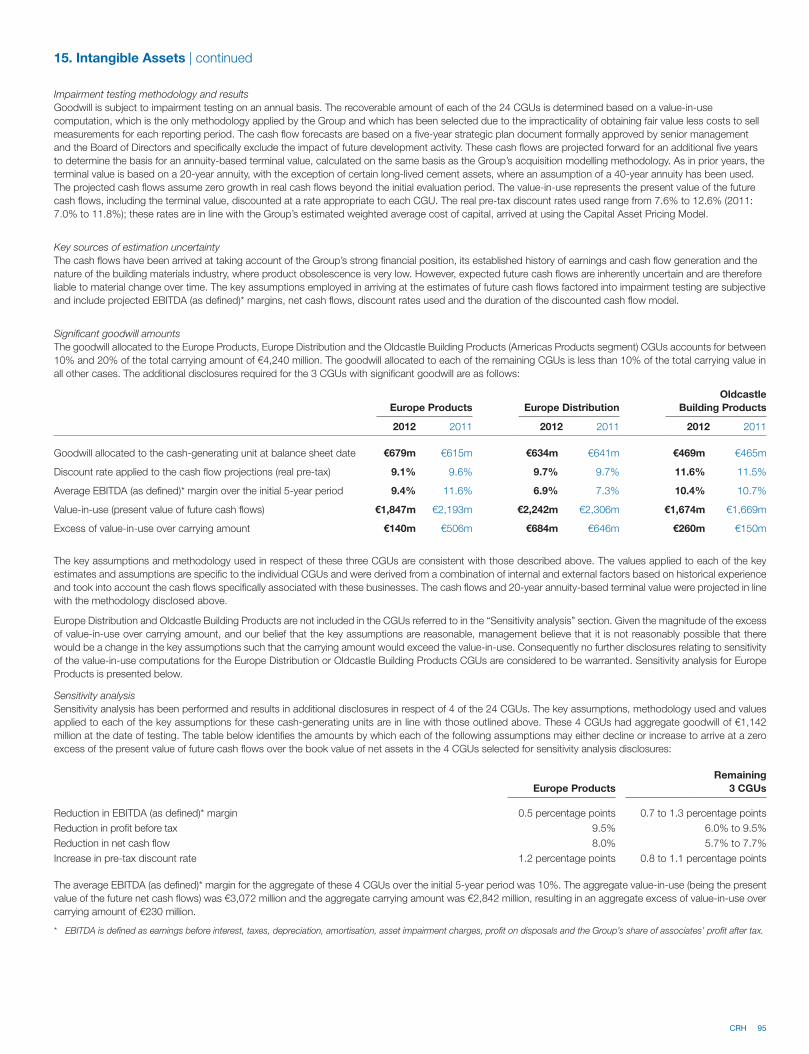
CRH 95
15. Intangible Assets | continued
Impairment testing methodology and results
Goodwill is subject to impairment testing on an annual basis. The recoverable amount of each of the 24 CGUs is determined based on a value-in-use
computation, which is the only methodology applied by the Group and which has been selected due to the impracticality of obtaining fair value less costs to sell
measurements for each reporting period. The cash flow forecasts are based on a five-year strategic plan document formally approved by senior management
and the Board of Directors and specifically exclude the impact of future development activity. These cash flows are projected forward for an additional five years
to determine the basis for an annuity-based terminal value, calculated on the same basis as the Group’s acquisition modelling methodology. As in prior years, the
terminal value is based on a 20-year annuity, with the exception of certain long-lived cement assets, where an assumption of a 40-year annuity has been used.
The projected cash flows assume zero growth in real cash flows beyond the initial evaluation period. The value-in-use represents the present value of the future
cash flows, including the terminal value, discounted at a rate appropriate to each CGU. The real pre-tax discount rates used range from 7.6% to 12.6% (2011:
7.0% to 11.8%); these rates are in line with the Group’s estimated weighted average cost of capital, arrived at using the Capital Asset Pricing Model.
Key sources of estimation uncertainty
The cash flows have been arrived at taking account of the Group’s strong financial position, its established history of earnings and cash flow generation and the
nature of the building materials industry, where product obsolescence is very low. However, expected future cash flows are inherently uncertain and are therefore
liable to material change over time. The key assumptions employed in arriving at the estimates of future cash flows factored into impairment testing are subjective
and include projected EBITDA (as defined)* margins, net cash flows, discount rates used and the duration of the discounted cash flow model.
Significant goodwill amounts
The goodwill allocated to the Europe Products, Europe Distribution and the Oldcastle Building Products (Americas Products segment) CGUs accounts for between
10% and 20% of the total carrying amount of €4,240 million. The goodwill allocated to each of the remaining CGUs is less than 10% of the total carrying value in
all other cases. The additional disclosures required for the 3 CGUs with significant goodwill are as follows:
Sensitivity analysis
Sensitivity analysis has been performed and results in additional disclosures in respect of 4 of the 24 CGUs. The key assumptions, methodology used and values
applied to each of the key assumptions for these cash-generating units are in line with those outlined above. These 4 CGUs had aggregate goodwill of €1,142
million at the date of testing. The table below identifies the amounts by which each of the following assumptions may either decline or increase to arrive at a zero
excess of the present value of future cash flows over the book value of net assets in the 4 CGUs selected for sensitivity analysis disclosures:
Europe Products
Remaining
3 CGUs
Reduction in EBITDA (as defined)* margin 0.5 percentage points 0.7 to 1.3 percentage points
Reduction in profit before tax 9.5% 6.0% to 9.5%
Reduction in net cash flow 8.0% 5.7% to 7.7%
Increase in pre-tax discount rate 1.2 percentage points 0.8 to 1.1 percentage points
The average EBITDA (as defined)* margin for the aggregate of these 4 CGUs over the initial 5-year period was 10%. The aggregate value-in-use (being the present
value of the future net cash flows) was €3,072 million and the aggregate carrying amount was €2,842 million, resulting in an aggregate excess of value-in-use over
carrying amount of €230 million.
* EBITDA is defined as earnings before interest, taxes, depreciation, amortisation, asset impairment charges, profit on disposals and the Group’s share of associates’ profit after tax.
Europe Products Europe Distribution
Oldcastle
Building Products
2012 2011 2012 2011 2012 2011
Goodwill allocated to the cash-generating unit at balance sheet date €679m €615m €634m €641m €469m €465m
Discount rate applied to the cash flow projections (real pre-tax) 9.1% 9.6% 9.7% 9.7% 11.6% 11.5%
Average EBITDA (as defined)* margin over the initial 5-year period 9.4% 11.6% 6.9% 7.3% 10.4% 10.7%
Value-in-use (present value of future cash flows) €1,847m €2,193m €2,242m €2,306m €1,674m €1,669m
Excess of value-in-use over carrying amount €140m €506m €684m €646m €260m €150m
The key assumptions and methodology used in respect of these three CGUs are consistent with those described above. The values applied to each of the key
estimates and assumptions are specific to the individual CGUs and were derived from a combination of internal and external factors based on historical experience
and took into account the cash flows specifically associated with these businesses. The cash flows and 20-year annuity-based terminal value were projected in line
with the methodology disclosed above.
Europe Distribution and Oldcastle Building Products are not included in the CGUs referred to in the “Sensitivity analysis” section. Given the magnitude of the excess
of value-in-use over carrying amount, and our belief that the key assumptions are reasonable, management believe that it is not reasonably possible that there
would be a change in the key assumptions such that the carrying amount would exceed the value-in-use. Consequently no further disclosures relating to sensitivity
of the value-in-use computations for the Europe Distribution or Oldcastle Building Products CGUs are considered to be warranted. Sensitivity analysis for Europe
Products is presented below.
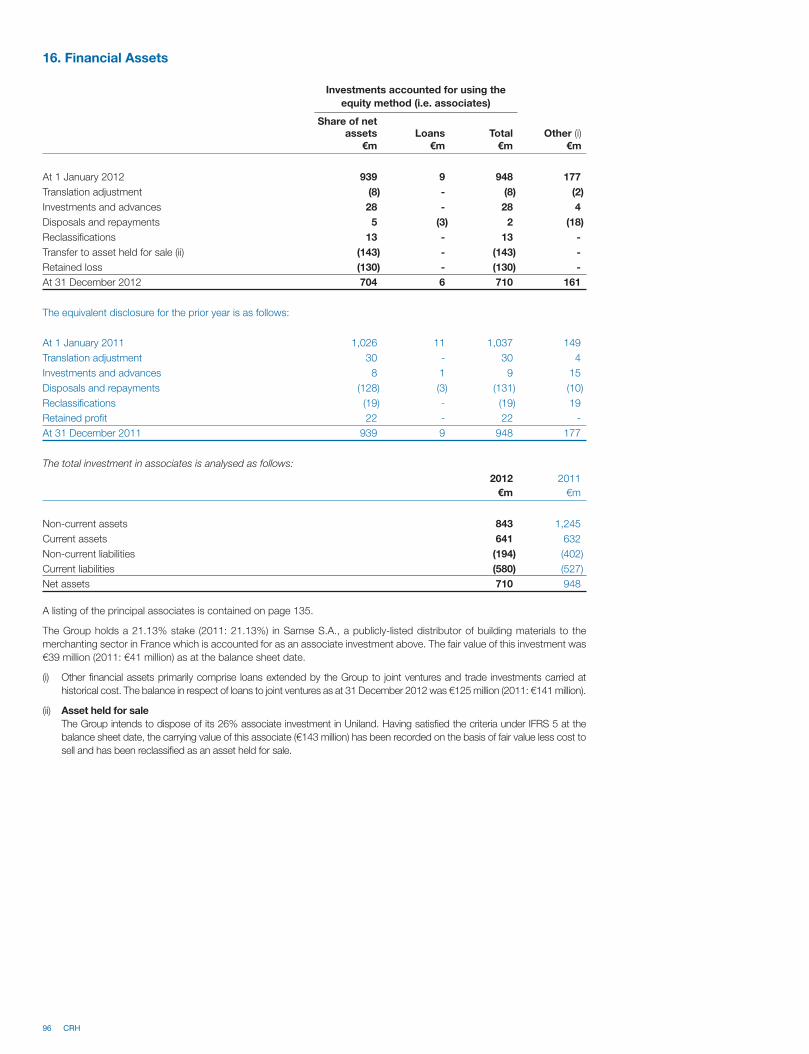
96 CRH
16. Financial Assets
Investments accounted for using the
equity method (i.e. associates)
Share of net assets Loans Total Other (i)
€m €m €m €m
At 1 January 2012 939 9 948 177
Translation adjustment (8) - (8) (2)
Investments and advances 28 - 28 4
Disposals and repayments 5 (3) 2 (18)
Reclassifications 13 - 13 -
Transfer to asset held for sale (ii) (143) - (143) -
Retained loss (130) - (130) -
At 31 December 2012 704 6 710 161
The equivalent disclosure for the prior year is as follows:
At 1 January 2011 1,026 11 1,037 149
Translation adjustment 30 - 30 4
Investments and advances 8 1 9 15
Disposals and repayments (128) (3) (131) (10)
Reclassifications (19) - (19) 19
Retained profit 22 - 22 -
At 31 December 2011 939 9 948 177
The total investment in associates is analysed as follows:
2012 2011
€m €m
Non-current assets 843 1,245
Current assets 641 632
Non-current liabilities (194) (402)
Current liabilities (580) (527)
Net assets 710 948
A listing of the principal associates is contained on page 135.
The Group holds a 21.13% stake (2011: 21.13%) in Samse S.A., a publicly-listed distributor of building materials to the
merchanting sector in France which is accounted for as an associate investment above. The fair value of this investment was
€39 million (2011: €41 million) as at the balance sheet date.
(i) Other financial assets primarily comprise loans extended by the Group to joint ventures and trade investments carried at
historical cost. The balance in respect of loans to joint ventures as at 31 December 2012 was €125 million (2011: €141 million).
(ii) Asset held for sale
The Group intends to dispose of its 26% associate investment in Uniland. Having satisfied the criteria under IFRS 5 at the
balance sheet date, the carrying value of this associate (€143 million) has been recorded on the basis of fair value less cost to
sell and has been reclassified as an asset held for sale.
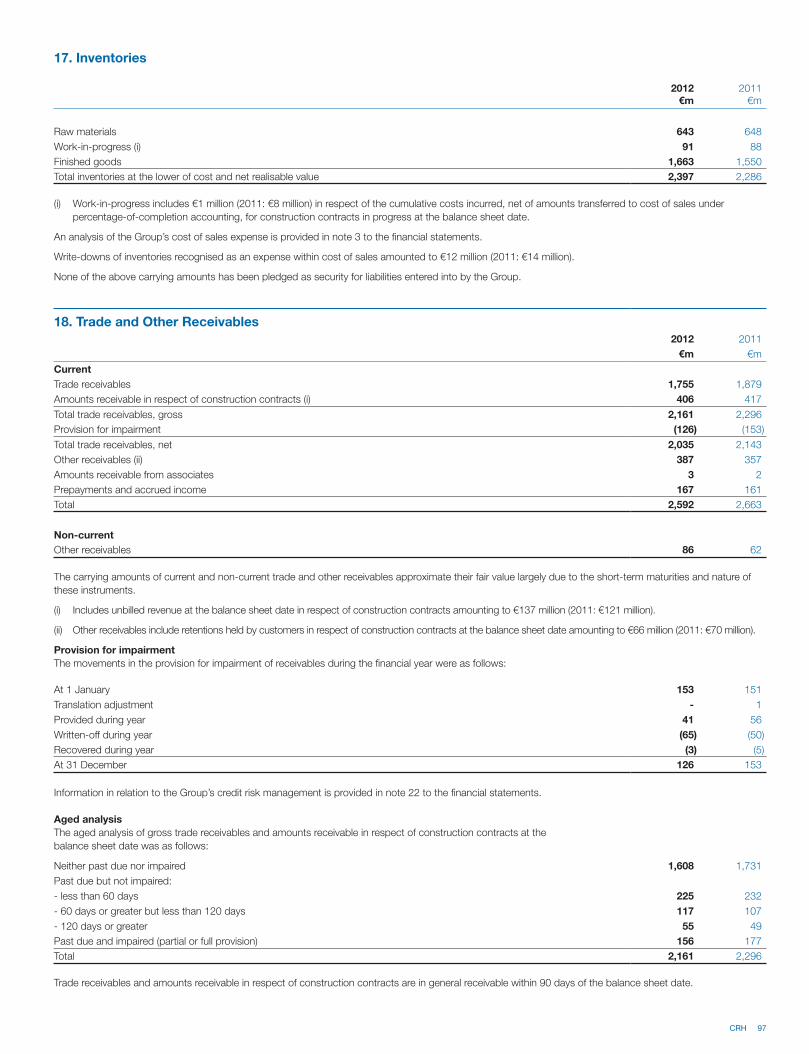
CRH 97
17. Inventories
2012 2011€m €m
Raw materials 643 648
Work-in-progress (i) 91 88
Finished goods 1,663 1,550
Total inventories at the lower of cost and net realisable value 2,397 2,286
(i) Work-in-progress includes €1 million (2011: €8 million) in respect of the cumulative costs incurred, net of amounts transferred to cost of sales under
percentage-of-completion accounting, for construction contracts in progress at the balance sheet date.
An analysis of the Group’s cost of sales expense is provided in note 3 to the financial statements.
Write-downs of inventories recognised as an expense within cost of sales amounted to €12 million (2011: €14 million).
None of the above carrying amounts has been pledged as security for liabilities entered into by the Group.
18. Trade and Other Receivables
2012 2011
€m €m
Current
Trade receivables 1,755 1,879
Amounts receivable in respect of construction contracts (i) 406 417
Total trade receivables, gross 2,161 2,296
Provision for impairment (126) (153)
Total trade receivables, net 2,035 2,143
Other receivables (ii) 387 357
Amounts receivable from associates 3 2
Prepayments and accrued income 167 161
Total 2,592 2,663
Non-current
Other receivables 86 62
The carrying amounts of current and non-current trade and other receivables approximate their fair value largely due to the short-term maturities and nature of
these instruments.
(i) Includes unbilled revenue at the balance sheet date in respect of construction contracts amounting to €137 million (2011: €121 million).
(ii) Other receivables include retentions held by customers in respect of construction contracts at the balance sheet date amounting to €66 million (2011: €70 million).
Provision for impairment
The movements in the provision for impairment of receivables during the financial year were as follows:
At 1 January 153 151
Translation adjustment - 1
Provided during year 41 56
Written-off during year (65) (50)
Recovered during year (3) (5)
At 31 December 126 153
Information in relation to the Group’s credit risk management is provided in note 22 to the financial statements.
Aged analysis
The aged analysis of gross trade receivables and amounts receivable in respect of construction contracts at the
balance sheet date was as follows:
Neither past due nor impaired 1,608 1,731
Past due but not impaired:
- less than 60 days 225 232
- 60 days or greater but less than 120 days 117 107
- 120 days or greater 55 49
Past due and impaired (partial or full provision) 156 177
Total 2,161 2,296
Trade receivables and amounts receivable in respect of construction contracts are in general receivable within 90 days of the balance sheet date.
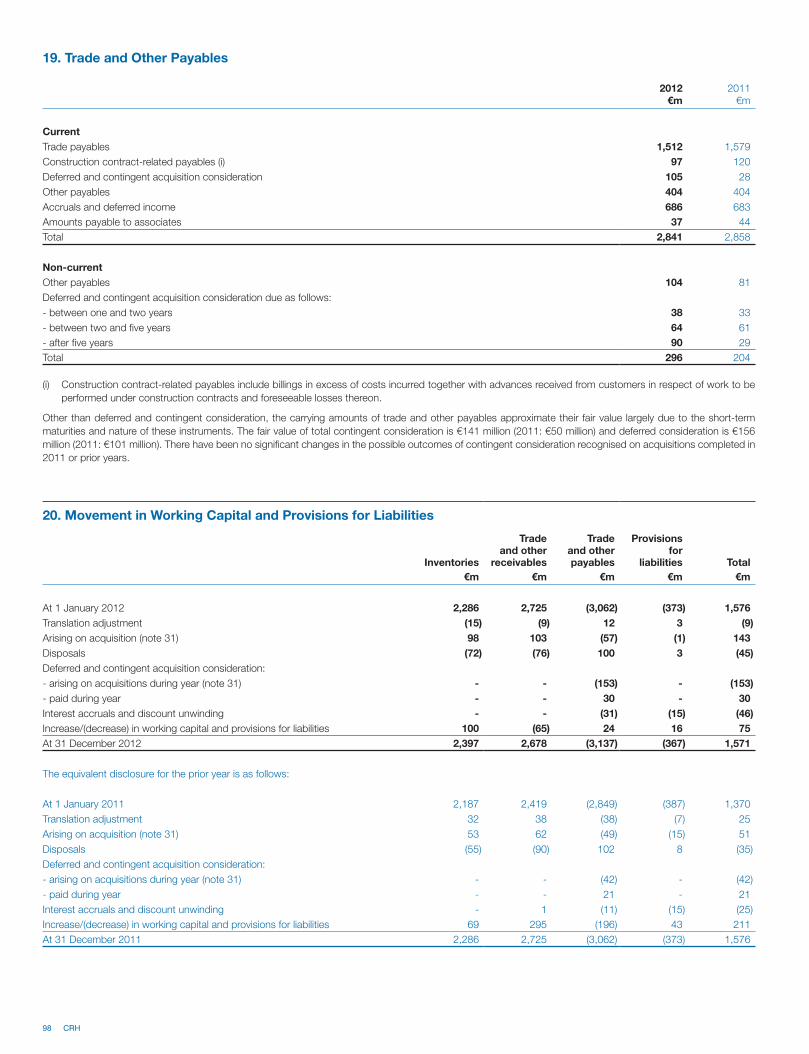
98 CRH
19. Trade and Other Payables
2012 2011€m €m
Current
Trade payables 1,512 1,579
Construction contract-related payables (i) 97 120
Deferred and contingent acquisition consideration 105 28
Other payables 404 404
Accruals and deferred income 686 683
Amounts payable to associates 37 44
Total 2,841 2,858
Non-current
Other payables 104 81
Deferred and contingent acquisition consideration due as follows:
- between one and two years 38 33
- between two and five years 64 61
- after five years 90 29
Total 296 204
(i) Construction contract-related payables include billings in excess of costs incurred together with advances received from customers in respect of work to be
performed under construction contracts and foreseeable losses thereon.
Other than deferred and contingent consideration, the carrying amounts of trade and other payables approximate their fair value largely due to the short-term
maturities and nature of these instruments. The fair value of total contingent consideration is €141 million (2011: €50 million) and deferred consideration is €156
million (2011: €101 million). There have been no significant changes in the possible outcomes of contingent consideration recognised on acquisitions completed in
2011 or prior years.
20. Movement in Working Capital and Provisions for Liabilities
Inventories
Trade and other
receivables
Trade and other payables
Provisions for
liabilities Total
€m €m €m €m €m
At 1 January 2012 2,286 2,725 (3,062) (373) 1,576
Translation adjustment (15) (9) 12 3 (9)
Arising on acquisition (note 31) 98 103 (57) (1) 143
Disposals (72) (76) 100 3 (45)
Deferred and contingent acquisition consideration:
- arising on acquisitions during year (note 31) - - (153) - (153)
- paid during year - - 30 - 30
Interest accruals and discount unwinding - - (31) (15) (46)
Increase/(decrease) in working capital and provisions for liabilities 100 (65) 24 16 75
At 31 December 2012 2,397 2,678 (3,137) (367) 1,571
The equivalent disclosure for the prior year is as follows:
At 1 January 2011 2,187 2,419 (2,849) (387) 1,370
Translation adjustment 32 38 (38) (7) 25
Arising on acquisition (note 31) 53 62 (49) (15) 51
Disposals (55) (90) 102 8 (35)
Deferred and contingent acquisition consideration:
- arising on acquisitions during year (note 31) - - (42) - (42)
- paid during year - - 21 - 21
Interest accruals and discount unwinding - 1 (11) (15) (25)
Increase/(decrease) in working capital and provisions for liabilities 69 295 (196) 43 211
At 31 December 2011 2,286 2,725 (3,062) (373) 1,576
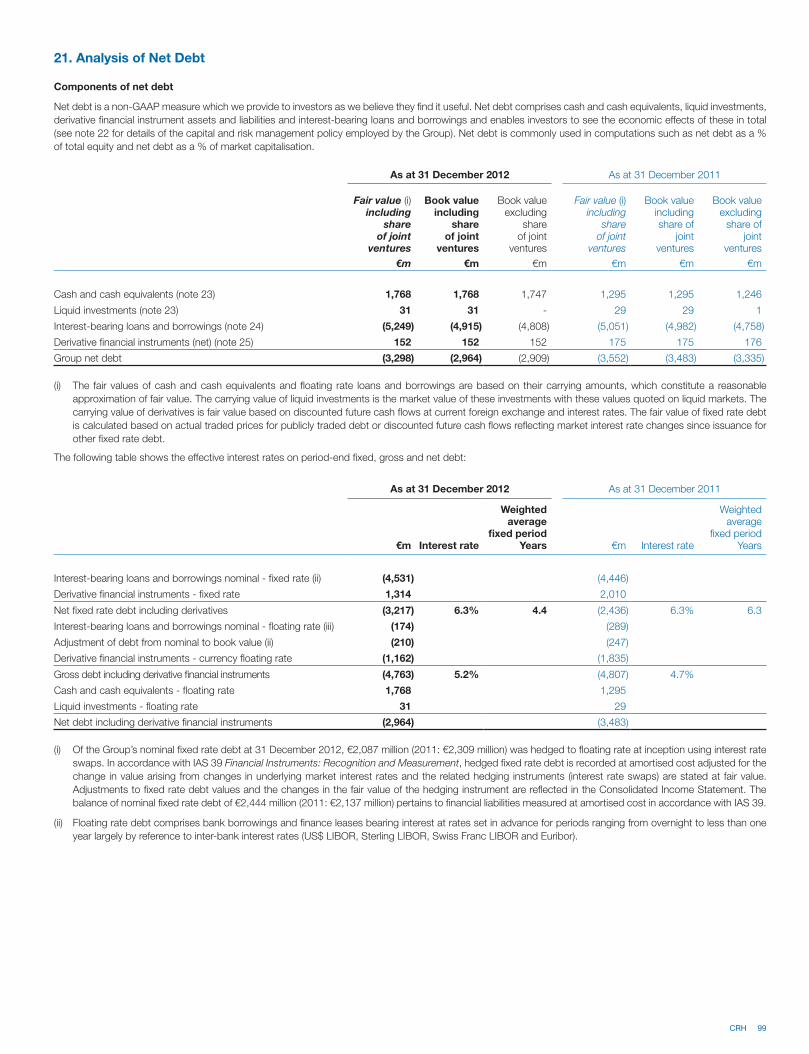
CRH 99
21. Analysis of Net Debt
Components of net debt
Net debt is a non-GAAP measure which we provide to investors as we believe they find it useful. Net debt comprises cash and cash equivalents, liquid investments,
derivative financial instrument assets and liabilities and interest-bearing loans and borrowings and enables investors to see the economic effects of these in total
(see note 22 for details of the capital and risk management policy employed by the Group). Net debt is commonly used in computations such as net debt as a %
of total equity and net debt as a % of market capitalisation.
As at 31 December 2012 As at 31 December 2011
Fair value (i) including
share of joint
ventures
Book value including
share of joint
ventures
Book value excluding
share of joint
ventures
Fair value (i) including
share of joint
ventures
Book value including share of
joint ventures
Book value excluding
share of joint
ventures
€m €m €m €m €m €m
Cash and cash equivalents (note 23) 1,768 1,768 1,747 1,295 1,295 1,246
Liquid investments (note 23) 31 31 - 29 29 1
Interest-bearing loans and borrowings (note 24) (5,249) (4,915) (4,808) (5,051) (4,982) (4,758)
Derivative financial instruments (net) (note 25) 152 152 152 175 175 176
Group net debt (3,298) (2,964) (2,909) (3,552) (3,483) (3,335)
(i) The fair values of cash and cash equivalents and floating rate loans and borrowings are based on their carrying amounts, which constitute a reasonable
approximation of fair value. The carrying value of liquid investments is the market value of these investments with these values quoted on liquid markets. The
carrying value of derivatives is fair value based on discounted future cash flows at current foreign exchange and interest rates. The fair value of fixed rate debt
is calculated based on actual traded prices for publicly traded debt or discounted future cash flows reflecting market interest rate changes since issuance for
other fixed rate debt.
The following table shows the effective interest rates on period-end fixed, gross and net debt:
As at 31 December 2012 As at 31 December 2011
€m Interest rate
Weighted average
fixed period Years €m Interest rate
Weighted average
fixed period Years
Interest-bearing loans and borrowings nominal - fixed rate (ii) (4,531) (4,446)
Derivative financial instruments - fixed rate 1,314 2,010
Net fixed rate debt including derivatives (3,217) 6.3% 4.4 (2,436) 6.3% 6.3
Interest-bearing loans and borrowings nominal - floating rate (iii) (174) (289)
Adjustment of debt from nominal to book value (ii) (210) (247)
Derivative financial instruments - currency floating rate (1,162) (1,835)
Gross debt including derivative financial instruments (4,763) 5.2% (4,807) 4.7%
Cash and cash equivalents - floating rate 1,768 1,295
Liquid investments - floating rate 31 29
Net debt including derivative financial instruments (2,964) (3,483)
(i) Of the Group’s nominal fixed rate debt at 31 December 2012, €2,087 million (2011: €2,309 million) was hedged to floating rate at inception using interest rate
swaps. In accordance with IAS 39 Financial Instruments: Recognition and Measurement, hedged fixed rate debt is recorded at amortised cost adjusted for the
change in value arising from changes in underlying market interest rates and the related hedging instruments (interest rate swaps) are stated at fair value.
Adjustments to fixed rate debt values and the changes in the fair value of the hedging instrument are reflected in the Consolidated Income Statement. The
balance of nominal fixed rate debt of €2,444 million (2011: €2,137 million) pertains to financial liabilities measured at amortised cost in accordance with IAS 39.
(ii) Floating rate debt comprises bank borrowings and finance leases bearing interest at rates set in advance for periods ranging from overnight to less than one
year largely by reference to inter-bank interest rates (US$ LIBOR, Sterling LIBOR, Swiss Franc LIBOR and Euribor).
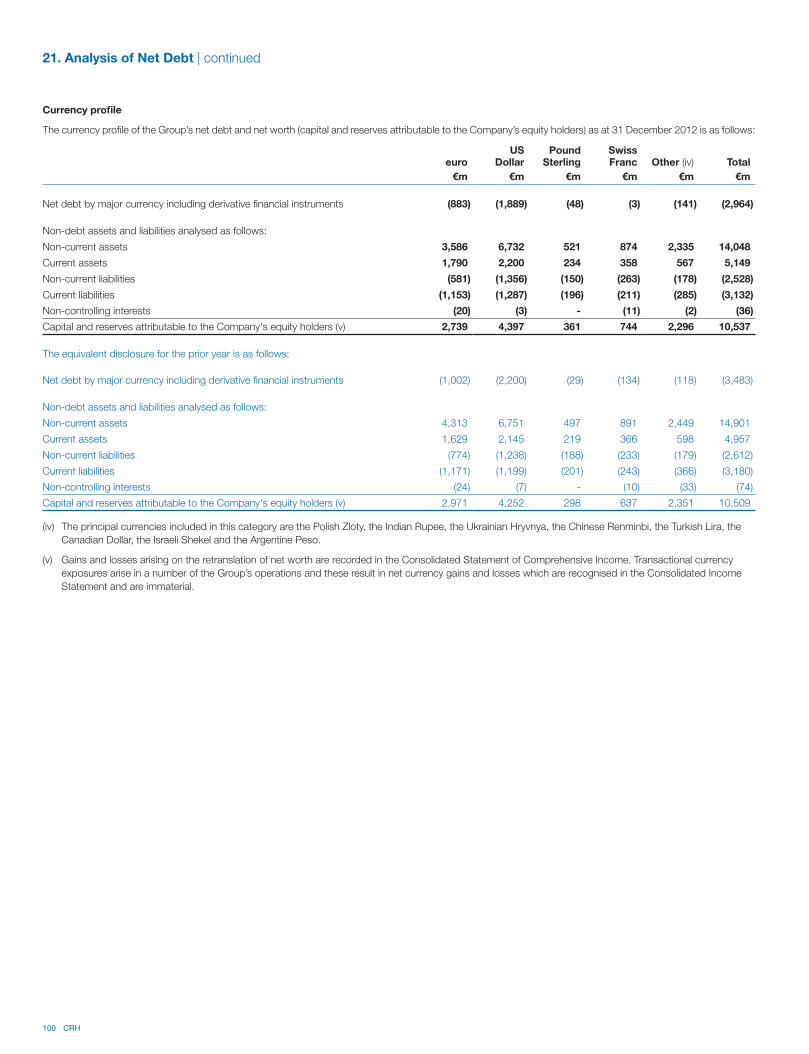
100 CRH
Currency profile
The currency profile of the Group’s net debt and net worth (capital and reserves attributable to the Company’s equity holders) as at 31 December 2012 is as follows:
euroUS
DollarPound
SterlingSwissFranc Other (iv) Total
€m €m €m €m €m €m
Net debt by major currency including derivative financial instruments (883) (1,889) (48) (3) (141) (2,964)
Non-debt assets and liabilities analysed as follows:
Non-current assets 3,586 6,732 521 874 2,335 14,048
Current assets 1,790 2,200 234 358 567 5,149
Non-current liabilities (581) (1,356) (150) (263) (178) (2,528)
Current liabilities (1,153) (1,287) (196) (211) (285) (3,132)
Non-controlling interests (20) (3) - (11) (2) (36)
Capital and reserves attributable to the Company's equity holders (v) 2,739 4,397 361 744 2,296 10,537
The equivalent disclosure for the prior year is as follows:
Net debt by major currency including derivative financial instruments (1,002) (2,200) (29) (134) (118) (3,483)
Non-debt assets and liabilities analysed as follows:
Non-current assets 4,313 6,751 497 891 2,449 14,901
Current assets 1,629 2,145 219 366 598 4,957
Non-current liabilities (774) (1,238) (188) (233) (179) (2,612)
Current liabilities (1,171) (1,199) (201) (243) (366) (3,180)
Non-controlling interests (24) (7) - (10) (33) (74)
Capital and reserves attributable to the Company's equity holders (v) 2,971 4,252 298 637 2,351 10,509
(iv) The principal currencies included in this category are the Polish Zloty, the Indian Rupee, the Ukrainian Hryvnya, the Chinese Renminbi, the Turkish Lira, the
Canadian Dollar, the Israeli Shekel and the Argentine Peso.
(v) Gains and losses arising on the retranslation of net worth are recorded in the Consolidated Statement of Comprehensive Income. Transactional currency
exposures arise in a number of the Group’s operations and these result in net currency gains and losses which are recognised in the Consolidated Income
Statement and are immaterial.
21. Analysis of Net Debt | continued
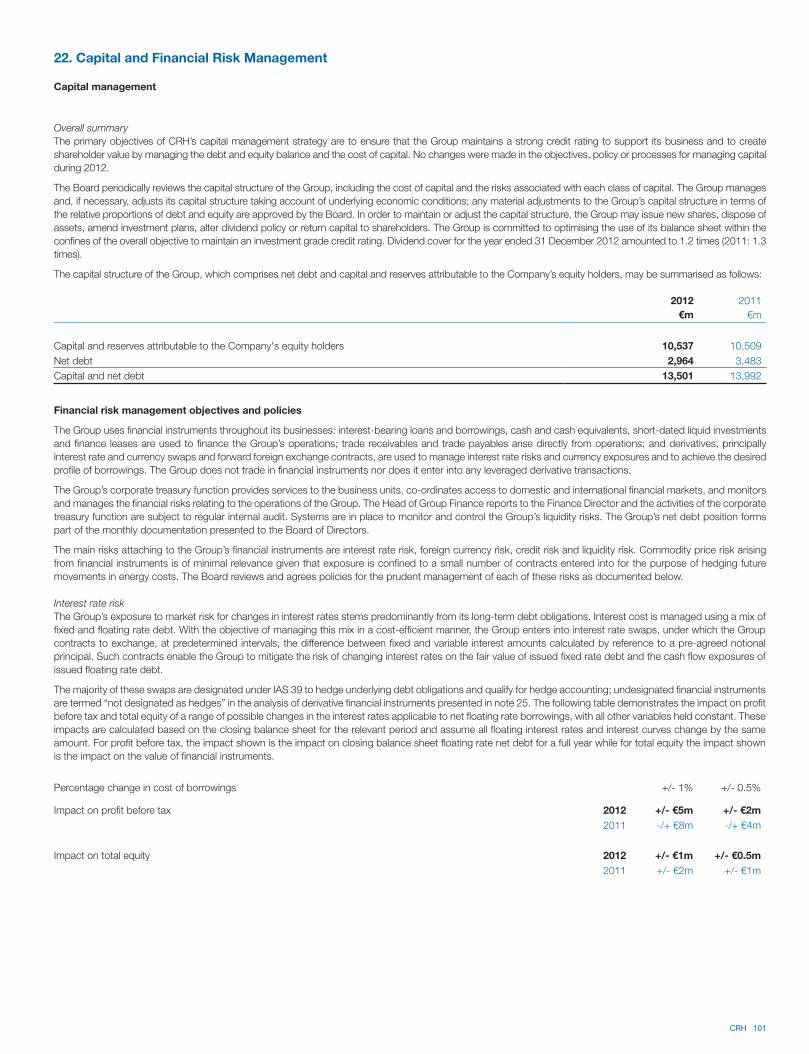
CRH 101
22. Capital and Financial Risk Management
Capital management
Overall summary
The primary objectives of CRH’s capital management strategy are to ensure that the Group maintains a strong credit rating to support its business and to create
shareholder value by managing the debt and equity balance and the cost of capital. No changes were made in the objectives, policy or processes for managing capital
during 2012.
The Board periodically reviews the capital structure of the Group, including the cost of capital and the risks associated with each class of capital. The Group manages
and, if necessary, adjusts its capital structure taking account of underlying economic conditions; any material adjustments to the Group’s capital structure in terms of
the relative proportions of debt and equity are approved by the Board. In order to maintain or adjust the capital structure, the Group may issue new shares, dispose of
assets, amend investment plans, alter dividend policy or return capital to shareholders. The Group is committed to optimising the use of its balance sheet within the
confines of the overall objective to maintain an investment grade credit rating. Dividend cover for the year ended 31 December 2012 amounted to 1.2 times (2011: 1.3
times).
The capital structure of the Group, which comprises net debt and capital and reserves attributable to the Company’s equity holders, may be summarised as follows:
2012 2011
€m €m
Capital and reserves attributable to the Company's equity holders 10,537 10,509
Net debt 2,964 3,483
Capital and net debt 13,501 13,992
Financial risk management objectives and policies
The Group uses financial instruments throughout its businesses: interest-bearing loans and borrowings, cash and cash equivalents, short-dated liquid investments
and finance leases are used to finance the Group’s operations; trade receivables and trade payables arise directly from operations; and derivatives, principally
interest rate and currency swaps and forward foreign exchange contracts, are used to manage interest rate risks and currency exposures and to achieve the desired
profile of borrowings. The Group does not trade in financial instruments nor does it enter into any leveraged derivative transactions.
The Group’s corporate treasury function provides services to the business units, co-ordinates access to domestic and international financial markets, and monitors
and manages the financial risks relating to the operations of the Group. The Head of Group Finance reports to the Finance Director and the activities of the corporate
treasury function are subject to regular internal audit. Systems are in place to monitor and control the Group’s liquidity risks. The Group’s net debt position forms
part of the monthly documentation presented to the Board of Directors.
The main risks attaching to the Group’s financial instruments are interest rate risk, foreign currency risk, credit risk and liquidity risk. Commodity price risk arising
from financial instruments is of minimal relevance given that exposure is confined to a small number of contracts entered into for the purpose of hedging future
movements in energy costs. The Board reviews and agrees policies for the prudent management of each of these risks as documented below.
Interest rate risk
The Group’s exposure to market risk for changes in interest rates stems predominantly from its long-term debt obligations. Interest cost is managed using a mix of
fixed and floating rate debt. With the objective of managing this mix in a cost-efficient manner, the Group enters into interest rate swaps, under which the Group
contracts to exchange, at predetermined intervals, the difference between fixed and variable interest amounts calculated by reference to a pre-agreed notional
principal. Such contracts enable the Group to mitigate the risk of changing interest rates on the fair value of issued fixed rate debt and the cash flow exposures of
issued floating rate debt.
The majority of these swaps are designated under IAS 39 to hedge underlying debt obligations and qualify for hedge accounting; undesignated financial instruments
are termed “not designated as hedges” in the analysis of derivative financial instruments presented in note 25. The following table demonstrates the impact on profit
before tax and total equity of a range of possible changes in the interest rates applicable to net floating rate borrowings, with all other variables held constant. These
impacts are calculated based on the closing balance sheet for the relevant period and assume all floating interest rates and interest curves change by the same
amount. For profit before tax, the impact shown is the impact on closing balance sheet floating rate net debt for a full year while for total equity the impact shown
is the impact on the value of financial instruments.
Percentage change in cost of borrowings +/- 1% +/- 0.5%
Impact on profit before tax 2012 +/- €5m +/- €2m
2011 -/+ €8m -/+ €4m
Impact on total equity 2012 +/- €1m +/- €0.5m
2011 +/- €2m +/- €1m
102 CRH
Credit/counterparty risk
In addition to cash at bank and in hand, the Group holds significant cash balances which are invested on a short-term basis and are classified as either cash
equivalents or liquid investments (see note 23). These deposits and other financial instruments (principally certain derivatives and loans and receivables included
within financial assets) give rise to credit risk on amounts due from counterparty financial institutions (stemming from their insolvency or a downgrade in their credit
ratings). Credit risk is managed by limiting the aggregate amount and duration of exposure to any one counterparty primarily depending on its credit rating and by
regular review of these ratings. Acceptable credit ratings are high investment-grade ratings - generally counterparties have ratings of A2/A or higher from Moody’s/
Standard & Poor’s ratings agencies. The maximum exposure arising in the event of default on the part of the counterparty (including insolvency) is the carrying value
of the relevant financial instrument.
In its worldwide insurance programme, the Group carries appropriate levels of insurance for typical business risks (including product liability) with various leading
insurance companies. However, in the event of the failure of one or more of its insurance counterparties, the Group could be impacted by losses where recovery
from such counterparties is not possible.
Credit risk arising in the context of the Group’s operations is not significant with the total bad debt provision at the balance sheet date amounting to 5.8% of gross
trade receivables (2011: 6.7%). Customer credit risk is managed at appropriate Group locations according to established policies, procedures and controls.
Customer credit quality is assessed in line with strict credit rating criteria and credit limits established where appropriate. Outstanding customer balances are
regularly monitored and a review for indicators of impairment (evidence of financial difficulty of the customer, payment default, breach of contract etc.) is carried out
at each reporting date. Significant balances are reviewed individually while smaller balances are grouped and assessed collectively. Receivables balances are in
general unsecured and non-interest-bearing. The trade receivables balances disclosed in note 18 comprise a large number of customers spread across the Group’s
activities and geographies with balances classified as neither past due nor impaired representing 74% of the total trade receivables balance at the balance sheet
date (2011: 75%); amounts receivable from related parties (notes 18 and 32) are immaterial. Factoring and credit guarantee arrangements are employed in certain
of the Group’s operations where deemed to be of benefit by operational management.
Liquidity risk
The principal liquidity risks faced by the Group stem from the maturation of debt obligations and derivative transactions. A downgrade of CRH’s credit ratings may
give rise to increases in funding costs in respect of future debt and may impair the Group’s ability to raise funds on acceptable terms. The Group’s corporate treasury
function ensures that sufficient resources are available to meet such liabilities as they fall due through a combination of liquid investments, cash and cash
equivalents, cash flows and undrawn committed bank facilities. Flexibility in funding sources is achieved through a variety of means including (i) maintaining cash
and cash equivalents and liquid resources only with a diversity of highly-rated counterparties; (ii) limiting the maturity of such balances; (iii) borrowing the bulk of the
Group’s debt requirements under committed bank lines or other term financing; and (iv) having surplus committed lines of credit.
The undrawn committed facilities available to the Group as at the balance sheet date are quantified in note 24; these facilities span a wide number of highly-rated
financial institutions thus minimising any potential exposure arising from concentrations in borrowing sources. The repayment schedule (analysed by maturity date)
applicable to the Group’s outstanding interest-bearing loans and borrowings as at the balance sheet date is also presented in note 24.
Foreign currency risk
Due to the nature of building materials, which in general exhibit a low value-to-weight ratio, CRH’s activities are conducted primarily in the local currency of the
country of operation resulting in low levels of foreign currency transaction risk; variances arising in this regard are reflected in operating costs or cost of sales in the
Consolidated Income Statement in the period in which they arise.
Given the Group’s presence in 35 countries worldwide, the principal foreign exchange risk arises from fluctuations in the euro value of the Group’s net investment
in a wide basket of currencies other than the euro; such changes are reported separately within the Consolidated Statement of Comprehensive Income. A currency
profile of the Group’s net debt and net worth is presented in note 21. The Group’s established policy is to spread its net worth across the currencies of its various
operations with the objective of limiting its exposure to individual currencies and thus promoting consistency with the geographical balance of its operations. In order
to achieve this objective, the Group manages its borrowings, where practicable and cost effective, to hedge a portion of its foreign currency assets. Hedging is done
using currency borrowings in the same currency as the assets being hedged or through the use of other hedging methods such as currency swaps.
The following table demonstrates the sensitivity of profit before tax and equity to selected movements in the relevant €/US$ exchange rate (with all other variables
held constant); the US Dollar has been selected as the appropriate currency for this analysis given the materiality of the Group’s activities in the United States. The
impact on profit before tax is based on changing the €/US$ exchange rate used in calculating profit before tax for the period. The impact on total equity and financial
instruments is calculated by changing the €/US$ exchange rate used in measuring the closing balance sheet.
Percentage change in relevant €/US$ exchange rate +/- 5% +/- 2.5%
Impact on profit before tax 2012 -/+ €14m -/+ €7m
2011 -/+ €8m -/+ €4m
Impact on total equity* 2012 -/+ €210m -/+ €108m
2011 -/+ €203m -/+ €104m
* Includes the impact on financial instruments which is as follows: 2012 +/- €90m +/- €46m
2011 +/- €105m +/- €54m
Financial instruments include deposits, money market funds, bank loans, medium term notes and other fixed term debt, interest rate swaps, commodity swaps
and foreign exchange contracts. They exclude trade receivables and trade payables.
22. Capital and Financial Risk Management | continued
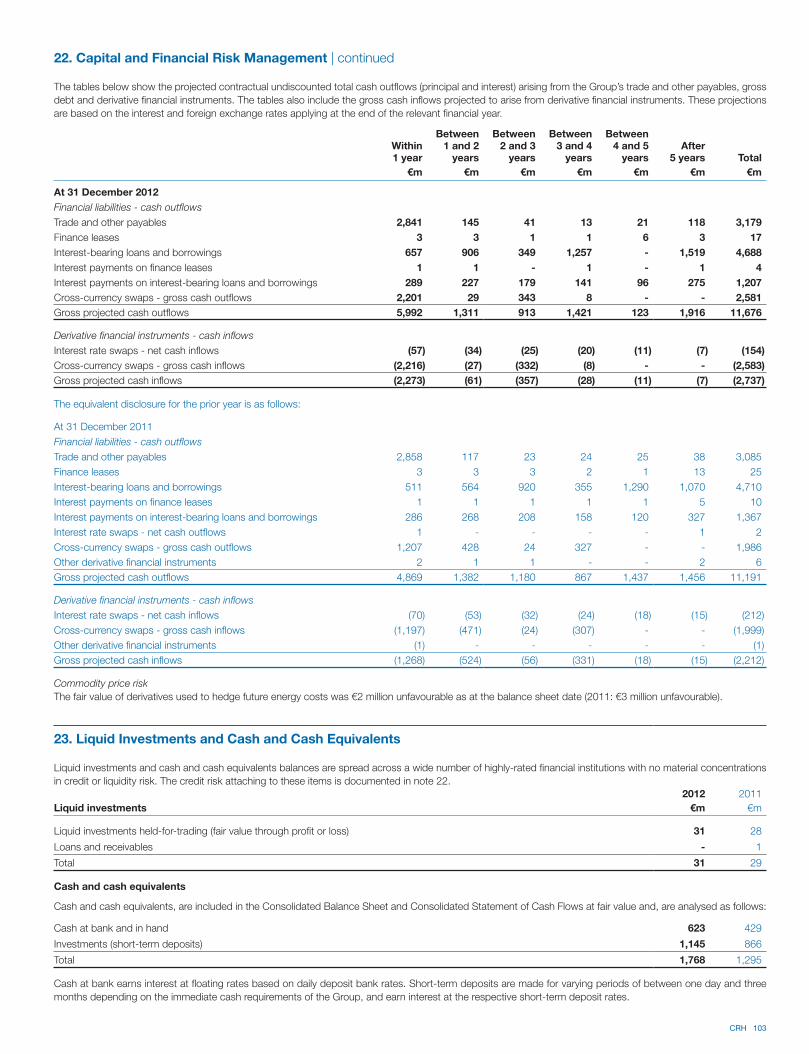
CRH 103
The tables below show the projected contractual undiscounted total cash outflows (principal and interest) arising from the Group’s trade and other payables, gross
debt and derivative financial instruments. The tables also include the gross cash inflows projected to arise from derivative financial instruments. These projections
are based on the interest and foreign exchange rates applying at the end of the relevant financial year.
Within1 year
Between 1 and 2
years
Between 2 and 3
years
Between 3 and 4
years
Between 4 and 5
yearsAfter
5 years Total
€m €m €m €m €m €m €m
At 31 December 2012
Financial liabilities - cash outflows
Trade and other payables 2,841 145 41 13 21 118 3,179
Finance leases 3 3 1 1 6 3 17
Interest-bearing loans and borrowings 657 906 349 1,257 - 1,519 4,688
Interest payments on finance leases 1 1 - 1 - 1 4
Interest payments on interest-bearing loans and borrowings 289 227 179 141 96 275 1,207
Cross-currency swaps - gross cash outflows 2,201 29 343 8 - - 2,581
Gross projected cash outflows 5,992 1,311 913 1,421 123 1,916 11,676
Derivative financial instruments - cash inflows
Interest rate swaps - net cash inflows (57) (34) (25) (20) (11) (7) (154)
Cross-currency swaps - gross cash inflows (2,216) (27) (332) (8) - - (2,583)
Gross projected cash inflows (2,273) (61) (357) (28) (11) (7) (2,737)
22. Capital and Financial Risk Management | continued
The equivalent disclosure for the prior year is as follows:
At 31 December 2011
Financial liabilities - cash outflows
Trade and other payables 2,858 117 23 24 25 38 3,085
Finance leases 3 3 3 2 1 13 25
Interest-bearing loans and borrowings 511 564 920 355 1,290 1,070 4,710
Interest payments on finance leases 1 1 1 1 1 5 10
Interest payments on interest-bearing loans and borrowings 286 268 208 158 120 327 1,367
Interest rate swaps - net cash outflows 1 - - - - 1 2
Cross-currency swaps - gross cash outflows 1,207 428 24 327 - - 1,986
Other derivative financial instruments 2 1 1 - - 2 6
Gross projected cash outflows 4,869 1,382 1,180 867 1,437 1,456 11,191
Derivative financial instruments - cash inflows
Interest rate swaps - net cash inflows (70) (53) (32) (24) (18) (15) (212)
Cross-currency swaps - gross cash inflows (1,197) (471) (24) (307) - - (1,999)
Other derivative financial instruments (1) - - - - - (1)
Gross projected cash inflows (1,268) (524) (56) (331) (18) (15) (2,212)
Commodity price risk
The fair value of derivatives used to hedge future energy costs was €2 million unfavourable as at the balance sheet date (2011: €3 million unfavourable).
23. Liquid Investments and Cash and Cash Equivalents
Liquid investments and cash and cash equivalents balances are spread across a wide number of highly-rated financial institutions with no material concentrations
in credit or liquidity risk. The credit risk attaching to these items is documented in note 22.
2012 2011
Liquid investments €m €m
Liquid investments held-for-trading (fair value through profit or loss) 31 28
Loans and receivables - 1
Total 31 29
Cash and cash equivalents
Cash and cash equivalents, are included in the Consolidated Balance Sheet and Consolidated Statement of Cash Flows at fair value and, are analysed as follows:
Cash at bank and in hand 623 429
Investments (short-term deposits) 1,145 866
Total 1,768 1,295
Cash at bank earns interest at floating rates based on daily deposit bank rates. Short-term deposits are made for varying periods of between one day and three
months depending on the immediate cash requirements of the Group, and earn interest at the respective short-term deposit rates.
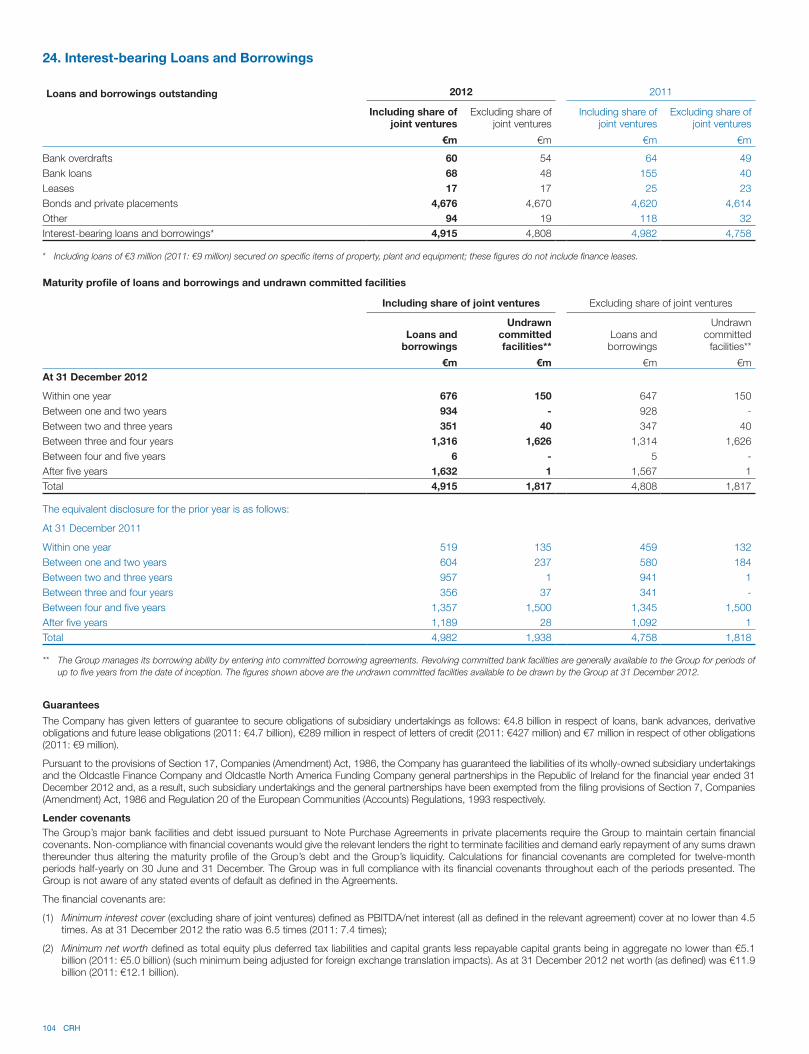
104 CRH
24. Interest-bearing Loans and Borrowings
Loans and borrowings outstanding 2012 2011
Including share of joint ventures
Excluding share of joint ventures
Including share of joint ventures
Excluding share of joint ventures
€m €m €m €m
Bank overdrafts 60 54 64 49
Bank loans 68 48 155 40
Leases 17 17 25 23
Bonds and private placements 4,676 4,670 4,620 4,614
Other 94 19 118 32
Interest-bearing loans and borrowings* 4,915 4,808 4,982 4,758
* Including loans of €3 million (2011: €9 million) secured on specific items of property, plant and equipment; these figures do not include finance leases.
Maturity profile of loans and borrowings and undrawn committed facilities
Including share of joint ventures Excluding share of joint ventures
Loans and borrowings
Undrawn committed facilities**
Loans and borrowings
Undrawn committed
facilities**
€m €m €m €m
At 31 December 2012
Within one year 676 150 647 150
Between one and two years 934 - 928 -
Between two and three years 351 40 347 40
Between three and four years 1,316 1,626 1,314 1,626
Between four and five years 6 - 5 -
After five years 1,632 1 1,567 1
Total 4,915 1,817 4,808 1,817
The equivalent disclosure for the prior year is as follows:
At 31 December 2011
Within one year 519 135 459 132
Between one and two years 604 237 580 184
Between two and three years 957 1 941 1
Between three and four years 356 37 341 -
Between four and five years 1,357 1,500 1,345 1,500
After five years 1,189 28 1,092 1
Total 4,982 1,938 4,758 1,818
** The Group manages its borrowing ability by entering into committed borrowing agreements. Revolving committed bank facilities are generally available to the Group for periods of
up to five years from the date of inception. The figures shown above are the undrawn committed facilities available to be drawn by the Group at 31 December 2012.
Guarantees
The Company has given letters of guarantee to secure obligations of subsidiary undertakings as follows: €4.8 billion in respect of loans, bank advances, derivative obligations and future lease obligations (2011: €4.7 billion), €289 million in respect of letters of credit (2011: €427 million) and €7 million in respect of other obligations (2011: €9 million).
Pursuant to the provisions of Section 17, Companies (Amendment) Act, 1986, the Company has guaranteed the liabilities of its wholly-owned subsidiary undertakings and the Oldcastle Finance Company and Oldcastle North America Funding Company general partnerships in the Republic of Ireland for the financial year ended 31 December 2012 and, as a result, such subsidiary undertakings and the general partnerships have been exempted from the filing provisions of Section 7, Companies (Amendment) Act, 1986 and Regulation 20 of the European Communities (Accounts) Regulations, 1993 respectively.
Lender covenants
The Group’s major bank facilities and debt issued pursuant to Note Purchase Agreements in private placements require the Group to maintain certain financial covenants. Non-compliance with financial covenants would give the relevant lenders the right to terminate facilities and demand early repayment of any sums drawn thereunder thus altering the maturity profile of the Group’s debt and the Group’s liquidity. Calculations for financial covenants are completed for twelve-month periods half-yearly on 30 June and 31 December. The Group was in full compliance with its financial covenants throughout each of the periods presented. The Group is not aware of any stated events of default as defined in the Agreements.
The financial covenants are:
(1) Minimum interest cover (excluding share of joint ventures) defined as PBITDA/net interest (all as defined in the relevant agreement) cover at no lower than 4.5 times. As at 31 December 2012 the ratio was 6.5 times (2011: 7.4 times);
(2) Minimum net worth defined as total equity plus deferred tax liabilities and capital grants less repayable capital grants being in aggregate no lower than €5.1 billion (2011: €5.0 billion) (such minimum being adjusted for foreign exchange translation impacts). As at 31 December 2012 net worth (as defined) was €11.9 billion (2011: €12.1 billion).
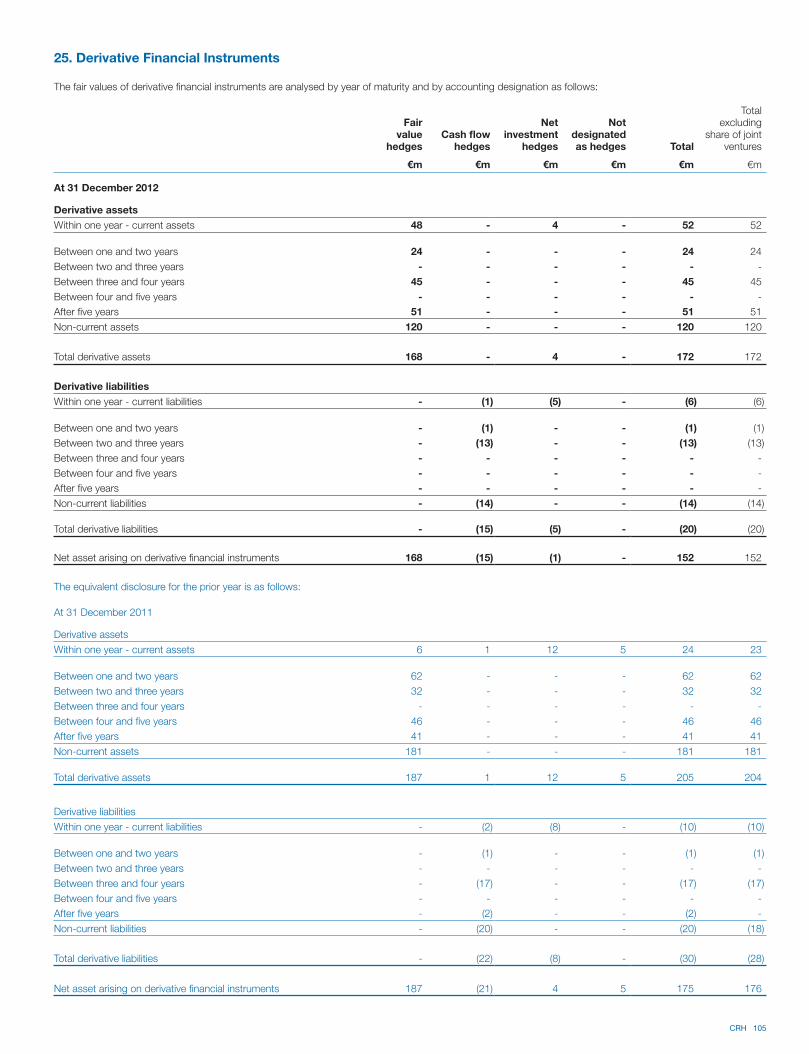
CRH 105
25. Derivative Financial Instruments
The fair values of derivative financial instruments are analysed by year of maturity and by accounting designation as follows:
Fair value
hedgesCash flow
hedges
Net investment
hedges
Not designated as hedges Total
Total excluding
share of joint ventures
€m €m €m €m €m €m
At 31 December 2012
Derivative assets
Within one year - current assets 48 - 4 - 52 52
Between one and two years 24 - - - 24 24
Between two and three years - - - - - -
Between three and four years 45 - - - 45 45
Between four and five years - - - - - -
After five years 51 - - - 51 51
Non-current assets 120 - - - 120 120
Total derivative assets 168 - 4 - 172 172
Derivative liabilities
Within one year - current liabilities - (1) (5) - (6) (6)
Between one and two years - (1) - - (1) (1)
Between two and three years - (13) - - (13) (13)
Between three and four years - - - - - -
Between four and five years - - - - - -
After five years - - - - - -
Non-current liabilities - (14) - - (14) (14)
Total derivative liabilities - (15) (5) - (20) (20)
Net asset arising on derivative financial instruments 168 (15) (1) - 152 152
The equivalent disclosure for the prior year is as follows:
At 31 December 2011
Derivative assets
Within one year - current assets 6 1 12 5 24 23
Between one and two years 62 - - - 62 62
Between two and three years 32 - - - 32 32
Between three and four years - - - - - -
Between four and five years 46 - - - 46 46
After five years 41 - - - 41 41
Non-current assets 181 - - - 181 181
Total derivative assets 187 1 12 5 205 204
Derivative liabilities
Within one year - current liabilities - (2) (8) - (10) (10)
Between one and two years - (1) - - (1) (1)
Between two and three years - - - - - -
Between three and four years - (17) - - (17) (17)
Between four and five years - - - - - -
After five years - (2) - - (2) -
Non-current liabilities - (20) - - (20) (18)
Total derivative liabilities - (22) (8) - (30) (28)
Net asset arising on derivative financial instruments 187 (21) 4 5 175 176
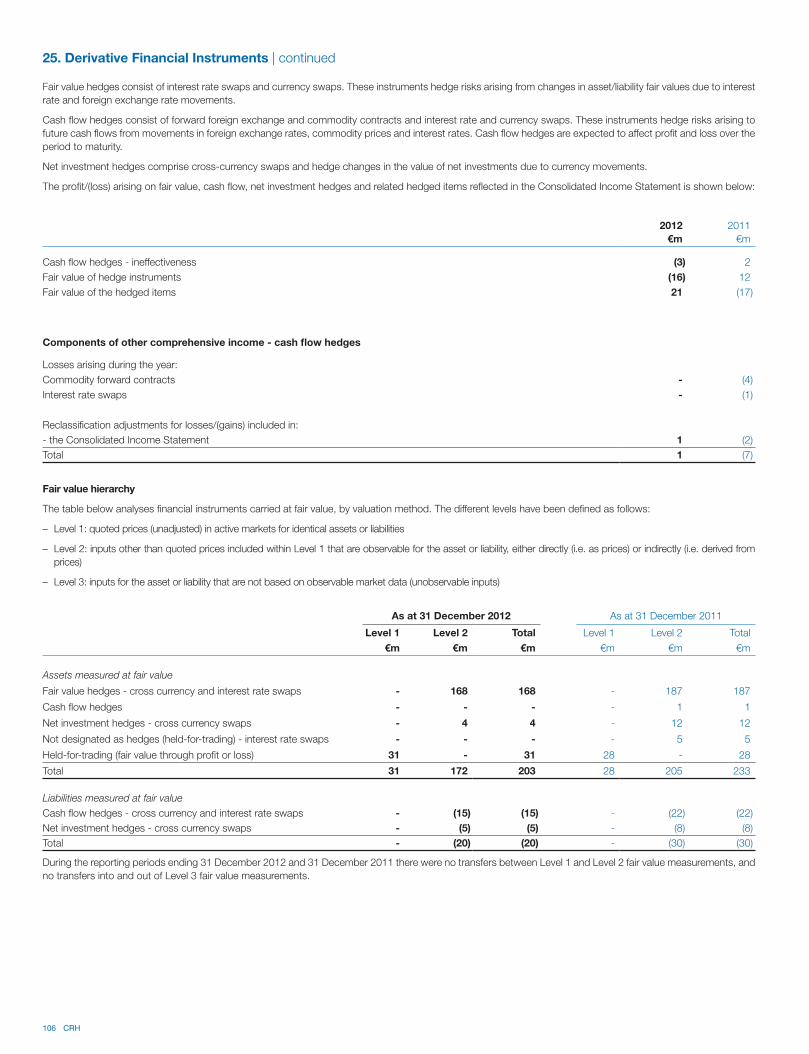
106 CRH
Components of other comprehensive income - cash flow hedges
Losses arising during the year:
Commodity forward contracts - (4)
Interest rate swaps - (1)
Reclassification adjustments for losses/(gains) included in:
- the Consolidated Income Statement 1 (2)
Total 1 (7)
Fair value hedges consist of interest rate swaps and currency swaps. These instruments hedge risks arising from changes in asset/liability fair values due to interest
rate and foreign exchange rate movements.
Cash flow hedges consist of forward foreign exchange and commodity contracts and interest rate and currency swaps. These instruments hedge risks arising to
future cash flows from movements in foreign exchange rates, commodity prices and interest rates. Cash flow hedges are expected to affect profit and loss over the
period to maturity.
Net investment hedges comprise cross-currency swaps and hedge changes in the value of net investments due to currency movements.
The profit/(loss) arising on fair value, cash flow, net investment hedges and related hedged items reflected in the Consolidated Income Statement is shown below:
2012 2011
€m €m
Cash flow hedges - ineffectiveness (3) 2
Fair value of hedge instruments (16) 12
Fair value of the hedged items 21 (17)
25. Derivative Financial Instruments | continued
Fair value hierarchy
The table below analyses financial instruments carried at fair value, by valuation method. The different levels have been defined as follows:
– Level 1: quoted prices (unadjusted) in active markets for identical assets or liabilities
– Level 2: inputs other than quoted prices included within Level 1 that are observable for the asset or liability, either directly (i.e. as prices) or indirectly (i.e. derived from
prices)
– Level 3: inputs for the asset or liability that are not based on observable market data (unobservable inputs)
As at 31 December 2012 As at 31 December 2011
Level 1 Level 2 Total Level 1 Level 2 Total
€m €m €m €m €m €m
Assets measured at fair value
Fair value hedges - cross currency and interest rate swaps - 168 168 - 187 187
Cash flow hedges - - - - 1 1
Net investment hedges - cross currency swaps - 4 4 - 12 12
Not designated as hedges (held-for-trading) - interest rate swaps - - - - 5 5
Held-for-trading (fair value through profit or loss) 31 - 31 28 - 28
Total 31 172 203 28 205 233
Liabilities measured at fair value
Cash flow hedges - cross currency and interest rate swaps - (15) (15) - (22) (22)
Net investment hedges - cross currency swaps - (5) (5) - (8) (8)
Total - (20) (20) - (30) (30)
During the reporting periods ending 31 December 2012 and 31 December 2011 there were no transfers between Level 1 and Level 2 fair value measurements, and
no transfers into and out of Level 3 fair value measurements.
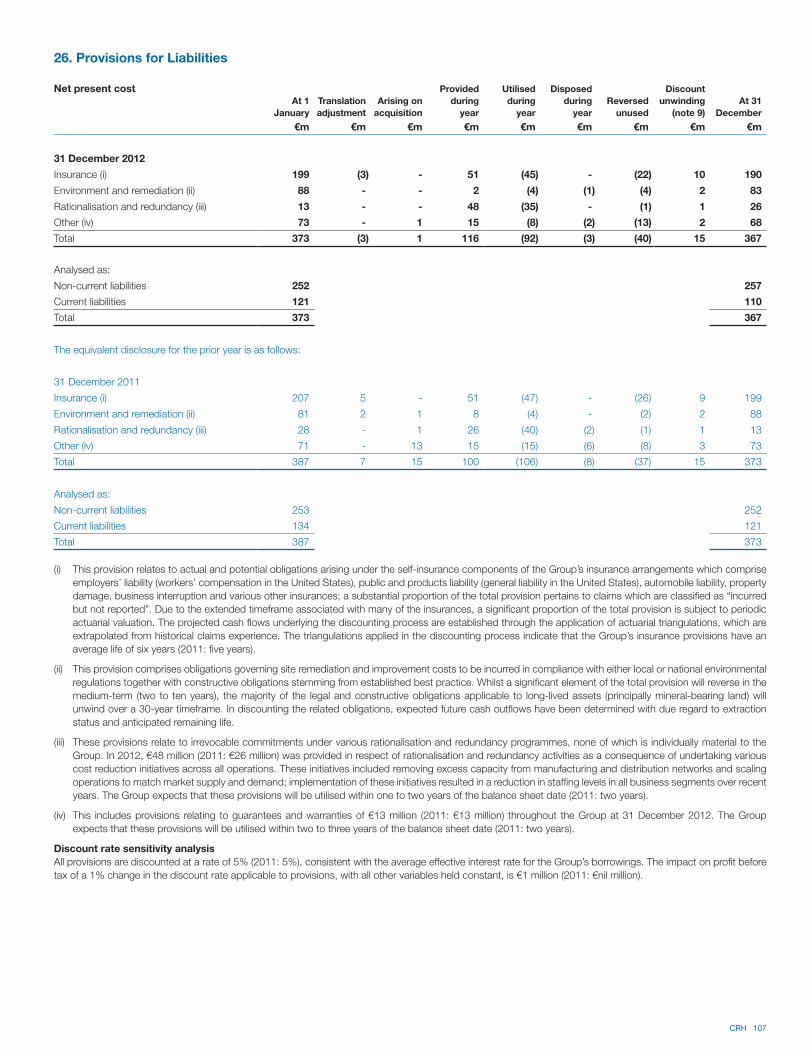
CRH 107
26. Provisions for Liabilities
Net present costAt 1
January
Translation
adjustment
Arising on
acquisition
Provided
during
year
Utilised
during
year
Disposed
during
year
Reversed
unused
Discount
unwinding
(note 9)
At 31
December
€m €m €m €m €m €m €m €m €m
31 December 2012
Insurance (i) 199 (3) - 51 (45) - (22) 10 190
Environment and remediation (ii) 88 - - 2 (4) (1) (4) 2 83
Rationalisation and redundancy (iii) 13 - - 48 (35) - (1) 1 26
Other (iv) 73 - 1 15 (8) (2) (13) 2 68
Total 373 (3) 1 116 (92) (3) (40) 15 367
Analysed as:
Non-current liabilities 252 257
Current liabilities 121 110
Total 373 367
The equivalent disclosure for the prior year is as follows:
31 December 2011
Insurance (i) 207 5 - 51 (47) - (26) 9 199
Environment and remediation (ii) 81 2 1 8 (4) - (2) 2 88
Rationalisation and redundancy (iii) 28 - 1 26 (40) (2) (1) 1 13
Other (iv) 71 - 13 15 (15) (6) (8) 3 73
Total 387 7 15 100 (106) (8) (37) 15 373
Analysed as:
Non-current liabilities 253 252
Current liabilities 134 121
Total 387 373
(i) This provision relates to actual and potential obligations arising under the self-insurance components of the Group’s insurance arrangements which comprise
employers’ liability (workers’ compensation in the United States), public and products liability (general liability in the United States), automobile liability, property
damage, business interruption and various other insurances; a substantial proportion of the total provision pertains to claims which are classified as “incurred
but not reported”. Due to the extended timeframe associated with many of the insurances, a significant proportion of the total provision is subject to periodic
actuarial valuation. The projected cash flows underlying the discounting process are established through the application of actuarial triangulations, which are
extrapolated from historical claims experience. The triangulations applied in the discounting process indicate that the Group’s insurance provisions have an
average life of six years (2011: five years).
(ii) This provision comprises obligations governing site remediation and improvement costs to be incurred in compliance with either local or national environmental
regulations together with constructive obligations stemming from established best practice. Whilst a significant element of the total provision will reverse in the
medium-term (two to ten years), the majority of the legal and constructive obligations applicable to long-lived assets (principally mineral-bearing land) will
unwind over a 30-year timeframe. In discounting the related obligations, expected future cash outflows have been determined with due regard to extraction
status and anticipated remaining life.
(iii) These provisions relate to irrevocable commitments under various rationalisation and redundancy programmes, none of which is individually material to the
Group. In 2012, €48 million (2011: €26 million) was provided in respect of rationalisation and redundancy activities as a consequence of undertaking various
cost reduction initiatives across all operations. These initiatives included removing excess capacity from manufacturing and distribution networks and scaling
operations to match market supply and demand; implementation of these initiatives resulted in a reduction in staffing levels in all business segments over recent
years. The Group expects that these provisions will be utilised within one to two years of the balance sheet date (2011: two years).
(iv) This includes provisions relating to guarantees and warranties of €13 million (2011: €13 million) throughout the Group at 31 December 2012. The Group
expects that these provisions will be utilised within two to three years of the balance sheet date (2011: two years).
Discount rate sensitivity analysis
All provisions are discounted at a rate of 5% (2011: 5%), consistent with the average effective interest rate for the Group’s borrowings. The impact on profit before
tax of a 1% change in the discount rate applicable to provisions, with all other variables held constant, is €1 million (2011: €nil million).
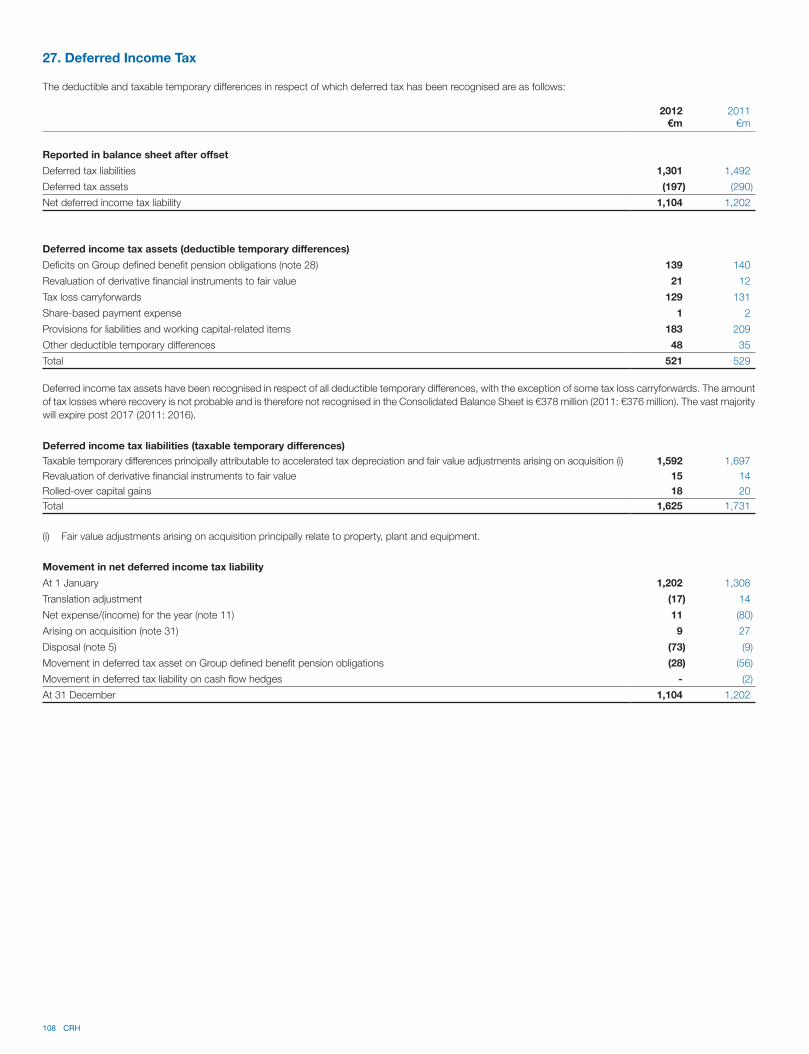
108 CRH
27. Deferred Income Tax
The deductible and taxable temporary differences in respect of which deferred tax has been recognised are as follows:
2012 2011€m €m
Reported in balance sheet after offset
Deferred tax liabilities 1,301 1,492
Deferred tax assets (197) (290)
Net deferred income tax liability 1,104 1,202
Deferred income tax assets (deductible temporary differences)
Deficits on Group defined benefit pension obligations (note 28) 139 140
Revaluation of derivative financial instruments to fair value 21 12
Tax loss carryforwards 129 131
Share-based payment expense 1 2
Provisions for liabilities and working capital-related items 183 209
Other deductible temporary differences 48 35
Total 521 529
Deferred income tax assets have been recognised in respect of all deductible temporary differences, with the exception of some tax loss carryforwards. The amount
of tax losses where recovery is not probable and is therefore not recognised in the Consolidated Balance Sheet is €378 million (2011: €376 million). The vast majority
will expire post 2017 (2011: 2016).
Deferred income tax liabilities (taxable temporary differences)
Taxable temporary differences principally attributable to accelerated tax depreciation and fair value adjustments arising on acquisition (i) 1,592 1,697
Revaluation of derivative financial instruments to fair value 15 14
Rolled-over capital gains 18 20
Total 1,625 1,731
(i) Fair value adjustments arising on acquisition principally relate to property, plant and equipment.
Movement in net deferred income tax liability
At 1 January 1,202 1,308
Translation adjustment (17) 14
Net expense/(income) for the year (note 11) 11 (80)
Arising on acquisition (note 31) 9 27
Disposal (note 5) (73) (9)
Movement in deferred tax asset on Group defined benefit pension obligations (28) (56)
Movement in deferred tax liability on cash flow hedges - (2)
At 31 December 1,104 1,202
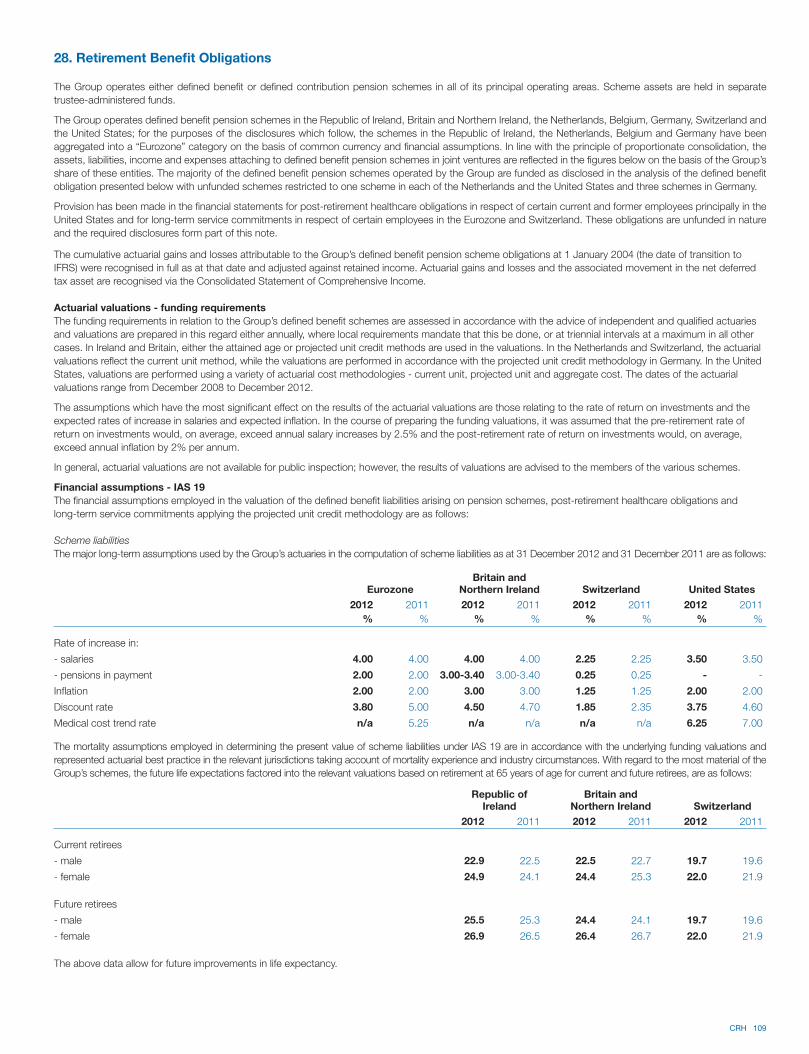
CRH 109
The Group operates either defined benefit or defined contribution pension schemes in all of its principal operating areas. Scheme assets are held in separate
trustee-administered funds.
The Group operates defined benefit pension schemes in the Republic of Ireland, Britain and Northern Ireland, the Netherlands, Belgium, Germany, Switzerland and
the United States; for the purposes of the disclosures which follow, the schemes in the Republic of Ireland, the Netherlands, Belgium and Germany have been
aggregated into a “Eurozone” category on the basis of common currency and financial assumptions. In line with the principle of proportionate consolidation, the
assets, liabilities, income and expenses attaching to defined benefit pension schemes in joint ventures are reflected in the figures below on the basis of the Group’s
share of these entities. The majority of the defined benefit pension schemes operated by the Group are funded as disclosed in the analysis of the defined benefit
obligation presented below with unfunded schemes restricted to one scheme in each of the Netherlands and the United States and three schemes in Germany.
Provision has been made in the financial statements for post-retirement healthcare obligations in respect of certain current and former employees principally in the
United States and for long-term service commitments in respect of certain employees in the Eurozone and Switzerland. These obligations are unfunded in nature
and the required disclosures form part of this note.
The cumulative actuarial gains and losses attributable to the Group’s defined benefit pension scheme obligations at 1 January 2004 (the date of transition to
IFRS) were recognised in full as at that date and adjusted against retained income. Actuarial gains and losses and the associated movement in the net deferred
tax asset are recognised via the Consolidated Statement of Comprehensive Income.
Actuarial valuations - funding requirements
The funding requirements in relation to the Group’s defined benefit schemes are assessed in accordance with the advice of independent and qualified actuaries
and valuations are prepared in this regard either annually, where local requirements mandate that this be done, or at triennial intervals at a maximum in all other
cases. In Ireland and Britain, either the attained age or projected unit credit methods are used in the valuations. In the Netherlands and Switzerland, the actuarial
valuations reflect the current unit method, while the valuations are performed in accordance with the projected unit credit methodology in Germany. In the United
States, valuations are performed using a variety of actuarial cost methodologies - current unit, projected unit and aggregate cost. The dates of the actuarial
valuations range from December 2008 to December 2012.
The assumptions which have the most significant effect on the results of the actuarial valuations are those relating to the rate of return on investments and the
expected rates of increase in salaries and expected inflation. In the course of preparing the funding valuations, it was assumed that the pre-retirement rate of
return on investments would, on average, exceed annual salary increases by 2.5% and the post-retirement rate of return on investments would, on average,
exceed annual inflation by 2% per annum.
In general, actuarial valuations are not available for public inspection; however, the results of valuations are advised to the members of the various schemes.
Financial assumptions - IAS 19
The financial assumptions employed in the valuation of the defined benefit liabilities arising on pension schemes, post-retirement healthcare obligations and
long-term service commitments applying the projected unit credit methodology are as follows:
Scheme liabilities
The major long-term assumptions used by the Group’s actuaries in the computation of scheme liabilities as at 31 December 2012 and 31 December 2011 are as follows:
EurozoneBritain and
Northern Ireland Switzerland United States
2012 2011 2012 2011 2012 2011 2012 2011
% % % % % % % %
Rate of increase in:
- salaries 4.00 4.00 4.00 4.00 2.25 2.25 3.50 3.50
- pensions in payment 2.00 2.00 3.00-3.40 3.00-3.40 0.25 0.25 - -
Inflation 2.00 2.00 3.00 3.00 1.25 1.25 2.00 2.00
Discount rate 3.80 5.00 4.50 4.70 1.85 2.35 3.75 4.60
Medical cost trend rate n/a 5.25 n/a n/a n/a n/a 6.25 7.00
The mortality assumptions employed in determining the present value of scheme liabilities under IAS 19 are in accordance with the underlying funding valuations and
represented actuarial best practice in the relevant jurisdictions taking account of mortality experience and industry circumstances. With regard to the most material of the
Group’s schemes, the future life expectations factored into the relevant valuations based on retirement at 65 years of age for current and future retirees, are as follows:
Republic of Ireland
Britain andNorthern Ireland Switzerland
2012 2011 2012 2011 2012 2011
Current retirees
- male 22.9 22.5 22.5 22.7 19.7 19.6
- female 24.9 24.1 24.4 25.3 22.0 21.9
Future retirees
- male 25.5 25.3 24.4 24.1 19.7 19.6
- female 26.9 26.5 26.4 26.7 22.0 21.9
The above data allow for future improvements in life expectancy.
28. Retirement Benefit Obligations
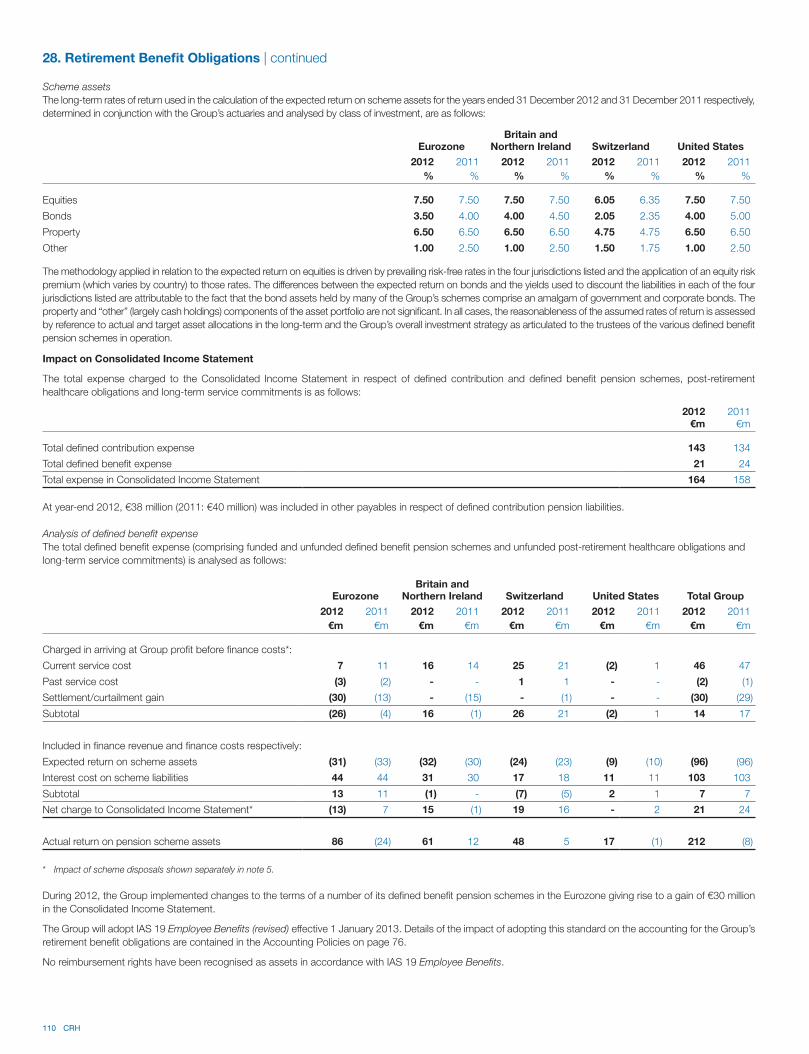
110 CRH
Scheme assets
The long-term rates of return used in the calculation of the expected return on scheme assets for the years ended 31 December 2012 and 31 December 2011 respectively,
determined in conjunction with the Group’s actuaries and analysed by class of investment, are as follows:
EurozoneBritain and
Northern Ireland Switzerland United States
2012 2011 2012 2011 2012 2011 2012 2011
% % % % % % % %
Equities 7.50 7.50 7.50 7.50 6.05 6.35 7.50 7.50
Bonds 3.50 4.00 4.00 4.50 2.05 2.35 4.00 5.00
Property 6.50 6.50 6.50 6.50 4.75 4.75 6.50 6.50
Other 1.00 2.50 1.00 2.50 1.50 1.75 1.00 2.50
The methodology applied in relation to the expected return on equities is driven by prevailing risk-free rates in the four jurisdictions listed and the application of an equity risk
premium (which varies by country) to those rates. The differences between the expected return on bonds and the yields used to discount the liabilities in each of the four
jurisdictions listed are attributable to the fact that the bond assets held by many of the Group’s schemes comprise an amalgam of government and corporate bonds. The
property and “other” (largely cash holdings) components of the asset portfolio are not significant. In all cases, the reasonableness of the assumed rates of return is assessed
by reference to actual and target asset allocations in the long-term and the Group’s overall investment strategy as articulated to the trustees of the various defined benefit
pension schemes in operation.
EurozoneBritain and
Northern Ireland Switzerland United States Total Group
2012 2011 2012 2011 2012 2011 2012 2011 2012 2011
€m €m €m €m €m €m €m €m €m €m
Charged in arriving at Group profit before finance costs*:
Current service cost 7 11 16 14 25 21 (2) 1 46 47
Past service cost (3) (2) - - 1 1 - - (2) (1)
Settlement/curtailment gain (30) (13) - (15) - (1) - - (30) (29)
Subtotal (26) (4) 16 (1) 26 21 (2) 1 14 17
Included in finance revenue and finance costs respectively:
Expected return on scheme assets (31) (33) (32) (30) (24) (23) (9) (10) (96) (96)
Interest cost on scheme liabilities 44 44 31 30 17 18 11 11 103 103
Subtotal 13 11 (1) - (7) (5) 2 1 7 7
Net charge to Consolidated Income Statement* (13) 7 15 (1) 19 16 - 2 21 24
Actual return on pension scheme assets 86 (24) 61 12 48 5 17 (1) 212 (8)
* Impact of scheme disposals shown separately in note 5.
During 2012, the Group implemented changes to the terms of a number of its defined benefit pension schemes in the Eurozone giving rise to a gain of €30 million
in the Consolidated Income Statement.
The Group will adopt IAS 19 Employee Benefits (revised) effective 1 January 2013. Details of the impact of adopting this standard on the accounting for the Group’s
retirement benefit obligations are contained in the Accounting Policies on page 76.
No reimbursement rights have been recognised as assets in accordance with IAS 19 Employee Benefits.
Impact on Consolidated Income Statement
The total expense charged to the Consolidated Income Statement in respect of defined contribution and defined benefit pension schemes, post-retirement
healthcare obligations and long-term service commitments is as follows:
2012 2011€m €m
Total defined contribution expense 143 134
Total defined benefit expense 21 24
Total expense in Consolidated Income Statement 164 158
At year-end 2012, €38 million (2011: €40 million) was included in other payables in respect of defined contribution pension liabilities.
Analysis of defined benefit expense
The total defined benefit expense (comprising funded and unfunded defined benefit pension schemes and unfunded post-retirement healthcare obligations and
long-term service commitments) is analysed as follows:
28. Retirement Benefit Obligations | continued
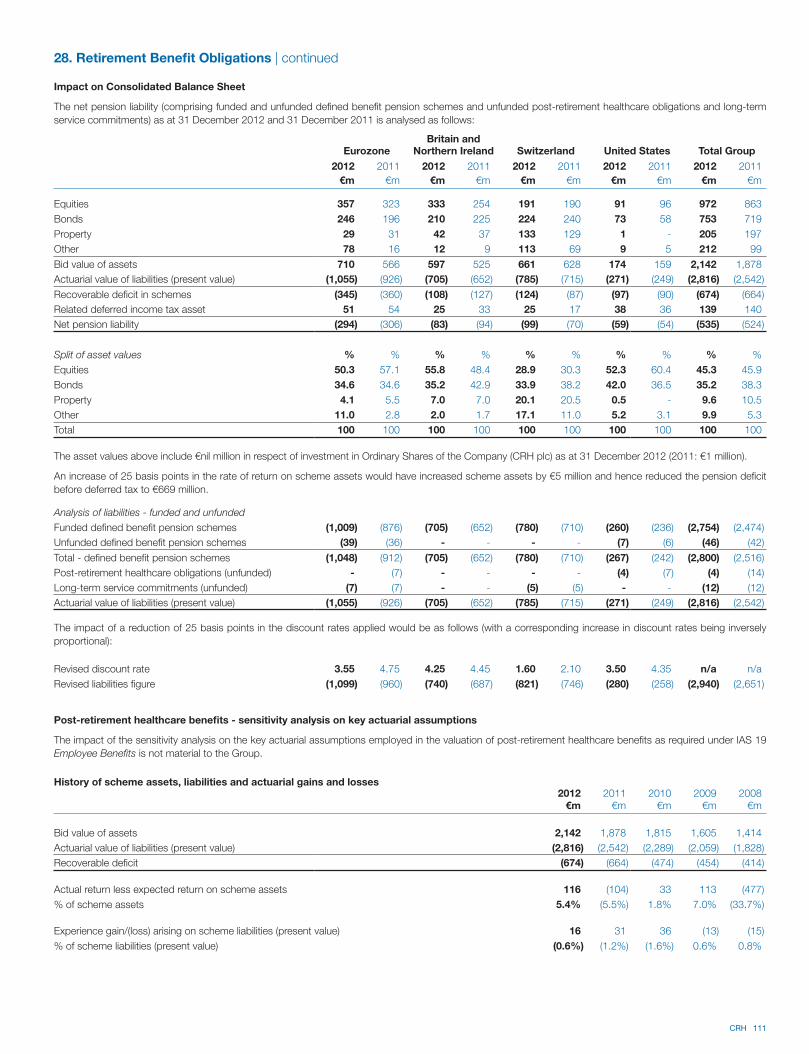
CRH 111
Impact on Consolidated Balance Sheet
The net pension liability (comprising funded and unfunded defined benefit pension schemes and unfunded post-retirement healthcare obligations and long-term
service commitments) as at 31 December 2012 and 31 December 2011 is analysed as follows:
EurozoneBritain and
Northern Ireland Switzerland United States Total Group
2012 2011 2012 2011 2012 2011 2012 2011 2012 2011
€m €m €m €m €m €m €m €m €m €m
Equities 357 323 333 254 191 190 91 96 972 863
Bonds 246 196 210 225 224 240 73 58 753 719
Property 29 31 42 37 133 129 1 - 205 197
Other 78 16 12 9 113 69 9 5 212 99
Bid value of assets 710 566 597 525 661 628 174 159 2,142 1,878
Actuarial value of liabilities (present value) (1,055) (926) (705) (652) (785) (715) (271) (249) (2,816) (2,542)
Recoverable deficit in schemes (345) (360) (108) (127) (124) (87) (97) (90) (674) (664)
Related deferred income tax asset 51 54 25 33 25 17 38 36 139 140
Net pension liability (294) (306) (83) (94) (99) (70) (59) (54) (535) (524)
Split of asset values % % % % % % % % % %
Equities 50.3 57.1 55.8 48.4 28.9 30.3 52.3 60.4 45.3 45.9
Bonds 34.6 34.6 35.2 42.9 33.9 38.2 42.0 36.5 35.2 38.3
Property 4.1 5.5 7.0 7.0 20.1 20.5 0.5 - 9.6 10.5
Other 11.0 2.8 2.0 1.7 17.1 11.0 5.2 3.1 9.9 5.3
Total 100 100 100 100 100 100 100 100 100 100
The asset values above include €nil million in respect of investment in Ordinary Shares of the Company (CRH plc) as at 31 December 2012 (2011: €1 million).
An increase of 25 basis points in the rate of return on scheme assets would have increased scheme assets by €5 million and hence reduced the pension deficit
before deferred tax to €669 million.
Analysis of liabilities - funded and unfunded
Funded defined benefit pension schemes (1,009) (876) (705) (652) (780) (710) (260) (236) (2,754) (2,474)
Unfunded defined benefit pension schemes (39) (36) - - - - (7) (6) (46) (42)
Total - defined benefit pension schemes (1,048) (912) (705) (652) (780) (710) (267) (242) (2,800) (2,516)
Post-retirement healthcare obligations (unfunded) - (7) - - - - (4) (7) (4) (14)
Long-term service commitments (unfunded) (7) (7) - - (5) (5) - - (12) (12)
Actuarial value of liabilities (present value) (1,055) (926) (705) (652) (785) (715) (271) (249) (2,816) (2,542)
The impact of a reduction of 25 basis points in the discount rates applied would be as follows (with a corresponding increase in discount rates being inversely
proportional):
Revised discount rate 3.55 4.75 4.25 4.45 1.60 2.10 3.50 4.35 n/a n/a
Revised liabilities figure (1,099) (960) (740) (687) (821) (746) (280) (258) (2,940) (2,651)
28. Retirement Benefit Obligations | continued
Post-retirement healthcare benefits - sensitivity analysis on key actuarial assumptions
The impact of the sensitivity analysis on the key actuarial assumptions employed in the valuation of post-retirement healthcare benefits as required under IAS 19
Employee Benefits is not material to the Group.
History of scheme assets, liabilities and actuarial gains and losses2012 2011 2010 2009 2008
€m €m €m €m €m
Bid value of assets 2,142 1,878 1,815 1,605 1,414
Actuarial value of liabilities (present value) (2,816) (2,542) (2,289) (2,059) (1,828)
Recoverable deficit (674) (664) (474) (454) (414)
Actual return less expected return on scheme assets 116 (104) 33 113 (477)
% of scheme assets 5.4% (5.5%) 1.8% 7.0% (33.7%)
Experience gain/(loss) arising on scheme liabilities (present value) 16 31 36 (13) (15)
% of scheme liabilities (present value) (0.6%) (1.2%) (1.6%) 0.6% 0.8%
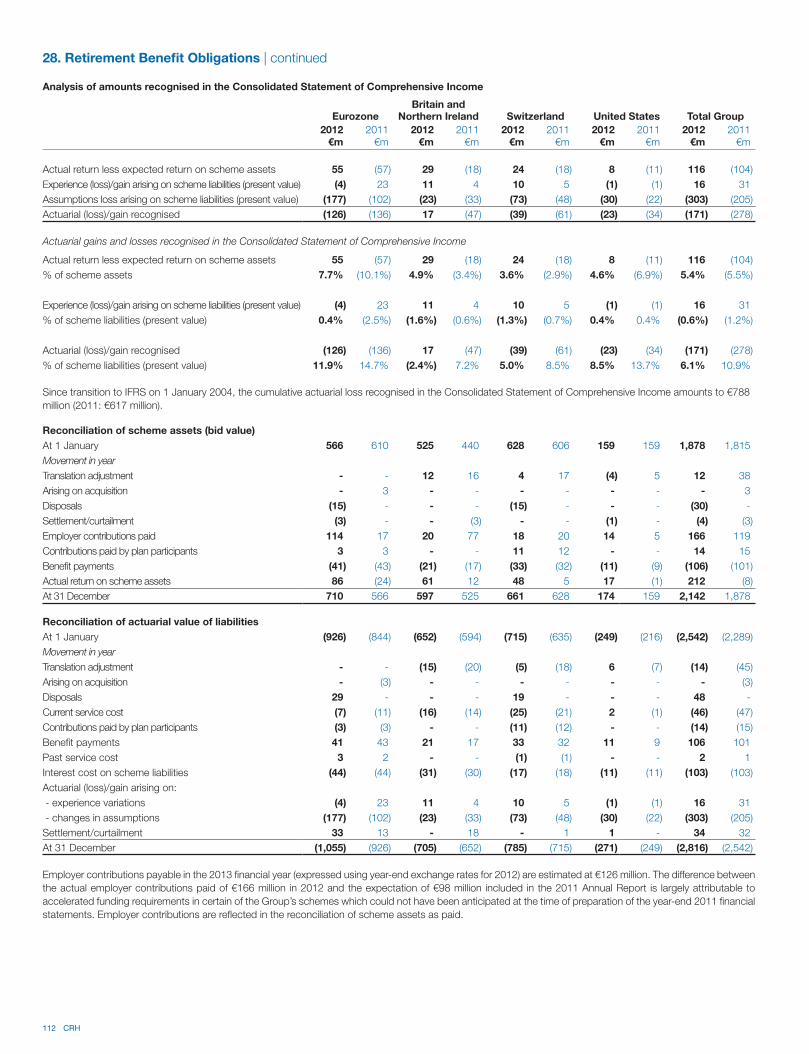
112 CRH
Analysis of amounts recognised in the Consolidated Statement of Comprehensive Income
EurozoneBritain and
Northern Ireland Switzerland United States Total Group
2012 2011 2012 2011 2012 2011 2012 2011 2012 2011€m €m €m €m €m €m €m €m €m €m
Actual return less expected return on scheme assets 55 (57) 29 (18) 24 (18) 8 (11) 116 (104)
Experience (loss)/gain arising on scheme liabilities (present value) (4) 23 11 4 10 5 (1) (1) 16 31
Assumptions loss arising on scheme liabilities (present value) (177) (102) (23) (33) (73) (48) (30) (22) (303) (205)
Actuarial (loss)/gain recognised (126) (136) 17 (47) (39) (61) (23) (34) (171) (278)
Actuarial gains and losses recognised in the Consolidated Statement of Comprehensive Income
Actual return less expected return on scheme assets 55 (57) 29 (18) 24 (18) 8 (11) 116 (104)
% of scheme assets 7.7% (10.1%) 4.9% (3.4%) 3.6% (2.9%) 4.6% (6.9%) 5.4% (5.5%)
Experience (loss)/gain arising on scheme liabilities (present value) (4) 23 11 4 10 5 (1) (1) 16 31
% of scheme liabilities (present value) 0.4% (2.5%) (1.6%) (0.6%) (1.3%) (0.7%) 0.4% 0.4% (0.6%) (1.2%)
Actuarial (loss)/gain recognised (126) (136) 17 (47) (39) (61) (23) (34) (171) (278)
% of scheme liabilities (present value) 11.9% 14.7% (2.4%) 7.2% 5.0% 8.5% 8.5% 13.7% 6.1% 10.9%
Since transition to IFRS on 1 January 2004, the cumulative actuarial loss recognised in the Consolidated Statement of Comprehensive Income amounts to €788
million (2011: €617 million).
Reconciliation of scheme assets (bid value)
At 1 January 566 610 525 440 628 606 159 159 1,878 1,815
Movement in year
Translation adjustment - - 12 16 4 17 (4) 5 12 38
Arising on acquisition - 3 - - - - - - - 3
Disposals (15) - - - (15) - - - (30) -
Settlement/curtailment (3) - - (3) - - (1) - (4) (3)
Employer contributions paid 114 17 20 77 18 20 14 5 166 119
Contributions paid by plan participants 3 3 - - 11 12 - - 14 15
Benefit payments (41) (43) (21) (17) (33) (32) (11) (9) (106) (101)
Actual return on scheme assets 86 (24) 61 12 48 5 17 (1) 212 (8)
At 31 December 710 566 597 525 661 628 174 159 2,142 1,878
28. Retirement Benefit Obligations | continued
Reconciliation of actuarial value of liabilities
At 1 January (926) (844) (652) (594) (715) (635) (249) (216) (2,542) (2,289)
Movement in year
Translation adjustment - - (15) (20) (5) (18) 6 (7) (14) (45)
Arising on acquisition - (3) - - - - - - - (3)
Disposals 29 - - - 19 - - - 48 -
Current service cost (7) (11) (16) (14) (25) (21) 2 (1) (46) (47)
Contributions paid by plan participants (3) (3) - - (11) (12) - - (14) (15)
Benefit payments 41 43 21 17 33 32 11 9 106 101
Past service cost 3 2 - - (1) (1) - - 2 1
Interest cost on scheme liabilities (44) (44) (31) (30) (17) (18) (11) (11) (103) (103)
Actuarial (loss)/gain arising on:
- experience variations (4) 23 11 4 10 5 (1) (1) 16 31
- changes in assumptions (177) (102) (23) (33) (73) (48) (30) (22) (303) (205)
Settlement/curtailment 33 13 - 18 - 1 1 - 34 32
At 31 December (1,055) (926) (705) (652) (785) (715) (271) (249) (2,816) (2,542)
Employer contributions payable in the 2013 financial year (expressed using year-end exchange rates for 2012) are estimated at €126 million. The difference between
the actual employer contributions paid of €166 million in 2012 and the expectation of €98 million included in the 2011 Annual Report is largely attributable to
accelerated funding requirements in certain of the Group’s schemes which could not have been anticipated at the time of preparation of the year-end 2011 financial
statements. Employer contributions are reflected in the reconciliation of scheme assets as paid.
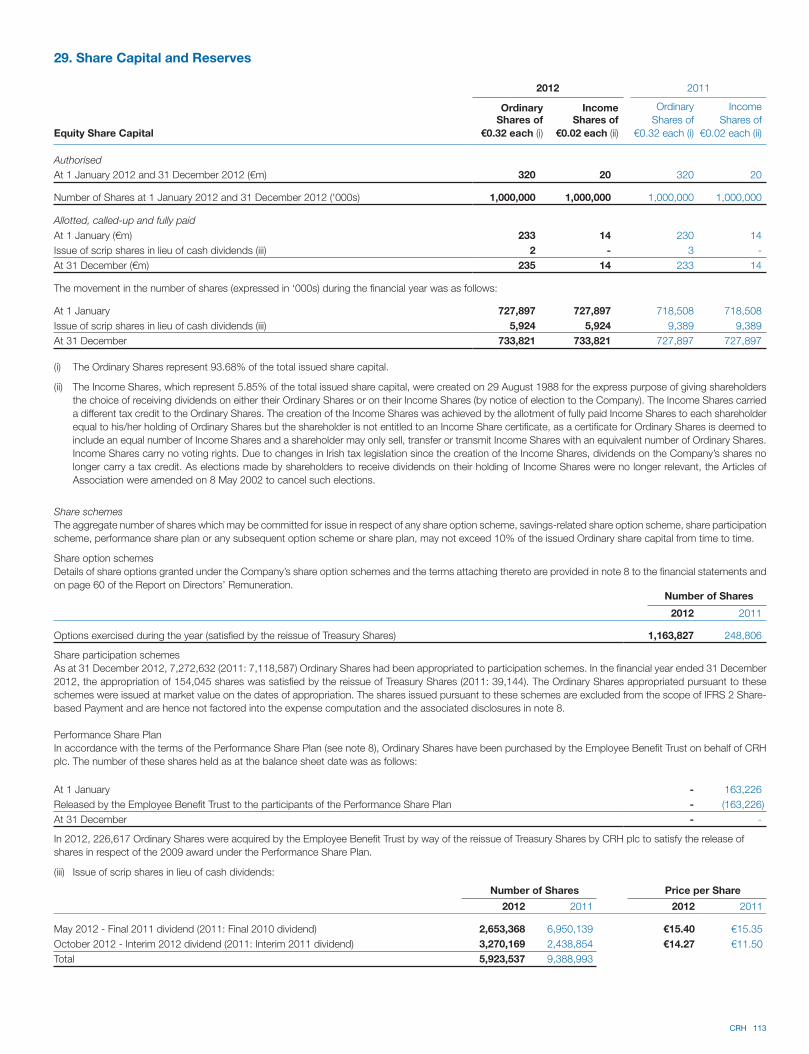
CRH 113
29. Share Capital and Reserves
2012 2011
Equity Share Capital
OrdinaryShares of
€0.32 each (i)
IncomeShares of
€0.02 each (ii)
Ordinary
Shares of
€0.32 each (i)
Income
Shares of
€0.02 each (ii)
Authorised
At 1 January 2012 and 31 December 2012 (€m) 320 20 320 20
Number of Shares at 1 January 2012 and 31 December 2012 ('000s) 1,000,000 1,000,000 1,000,000 1,000,000
Allotted, called-up and fully paid
At 1 January (€m) 233 14 230 14
Issue of scrip shares in lieu of cash dividends (iii) 2 - 3 -
At 31 December (€m) 235 14 233 14
The movement in the number of shares (expressed in ‘000s) during the financial year was as follows:
At 1 January 727,897 727,897 718,508 718,508
Issue of scrip shares in lieu of cash dividends (iii) 5,924 5,924 9,389 9,389
At 31 December 733,821 733,821 727,897 727,897
(i) The Ordinary Shares represent 93.68% of the total issued share capital.
(ii) The Income Shares, which represent 5.85% of the total issued share capital, were created on 29 August 1988 for the express purpose of giving shareholders
the choice of receiving dividends on either their Ordinary Shares or on their Income Shares (by notice of election to the Company). The Income Shares carried
a different tax credit to the Ordinary Shares. The creation of the Income Shares was achieved by the allotment of fully paid Income Shares to each shareholder
equal to his/her holding of Ordinary Shares but the shareholder is not entitled to an Income Share certificate, as a certificate for Ordinary Shares is deemed to
include an equal number of Income Shares and a shareholder may only sell, transfer or transmit Income Shares with an equivalent number of Ordinary Shares.
Income Shares carry no voting rights. Due to changes in Irish tax legislation since the creation of the Income Shares, dividends on the Company’s shares no
longer carry a tax credit. As elections made by shareholders to receive dividends on their holding of Income Shares were no longer relevant, the Articles of
Association were amended on 8 May 2002 to cancel such elections.
Share schemes
The aggregate number of shares which may be committed for issue in respect of any share option scheme, savings-related share option scheme, share participation
scheme, performance share plan or any subsequent option scheme or share plan, may not exceed 10% of the issued Ordinary share capital from time to time.
Share option schemes
Details of share options granted under the Company’s share option schemes and the terms attaching thereto are provided in note 8 to the financial statements and
on page 60 of the Report on Directors’ Remuneration.Number of Shares
2012 2011
Options exercised during the year (satisfied by the reissue of Treasury Shares) 1,163,827 248,806
Share participation schemes
As at 31 December 2012, 7,272,632 (2011: 7,118,587) Ordinary Shares had been appropriated to participation schemes. In the financial year ended 31 December
2012, the appropriation of 154,045 shares was satisfied by the reissue of Treasury Shares (2011: 39,144). The Ordinary Shares appropriated pursuant to these
schemes were issued at market value on the dates of appropriation. The shares issued pursuant to these schemes are excluded from the scope of IFRS 2 Share-
based Payment and are hence not factored into the expense computation and the associated disclosures in note 8.
Performance Share Plan
In accordance with the terms of the Performance Share Plan (see note 8), Ordinary Shares have been purchased by the Employee Benefit Trust on behalf of CRH
plc. The number of these shares held as at the balance sheet date was as follows:
At 1 January - 163,226
Released by the Employee Benefit Trust to the participants of the Performance Share Plan - (163,226)
At 31 December - -
In 2012, 226,617 Ordinary Shares were acquired by the Employee Benefit Trust by way of the reissue of Treasury Shares by CRH plc to satisfy the release of
shares in respect of the 2009 award under the Performance Share Plan.
(iii) Issue of scrip shares in lieu of cash dividends:
Number of Shares Price per Share
2012 2011 2012 2011
May 2012 - Final 2011 dividend (2011: Final 2010 dividend) 2,653,368 6,950,139 €15.40 €15.35
October 2012 - Interim 2012 dividend (2011: Interim 2011 dividend) 3,270,169 2,438,854 €14.27 €11.50
Total 5,923,537 9,388,993
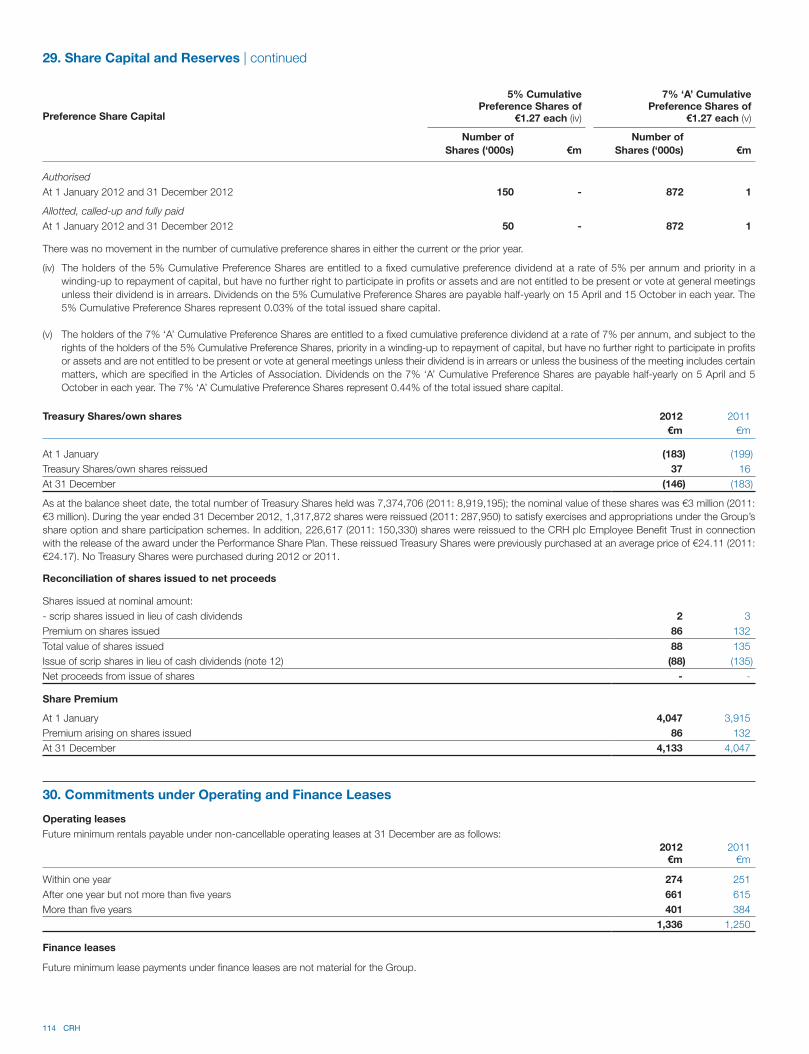
114 CRH
29. Share Capital and Reserves | continued
Preference Share Capital
5% CumulativePreference Shares of
€1.27 each (iv)
7% ‘A’ CumulativePreference Shares of
€1.27 each (v)
Number of
Shares (‘000s) €m
Number of
Shares (‘000s) €m
Authorised
At 1 January 2012 and 31 December 2012 150 - 872 1
Allotted, called-up and fully paid
At 1 January 2012 and 31 December 2012 50 - 872 1
There was no movement in the number of cumulative preference shares in either the current or the prior year.
(iv) The holders of the 5% Cumulative Preference Shares are entitled to a fixed cumulative preference dividend at a rate of 5% per annum and priority in a
winding-up to repayment of capital, but have no further right to participate in profits or assets and are not entitled to be present or vote at general meetings
unless their dividend is in arrears. Dividends on the 5% Cumulative Preference Shares are payable half-yearly on 15 April and 15 October in each year. The
5% Cumulative Preference Shares represent 0.03% of the total issued share capital.
(v) The holders of the 7% ‘A’ Cumulative Preference Shares are entitled to a fixed cumulative preference dividend at a rate of 7% per annum, and subject to the
rights of the holders of the 5% Cumulative Preference Shares, priority in a winding-up to repayment of capital, but have no further right to participate in profits
or assets and are not entitled to be present or vote at general meetings unless their dividend is in arrears or unless the business of the meeting includes certain
matters, which are specified in the Articles of Association. Dividends on the 7% ‘A’ Cumulative Preference Shares are payable half-yearly on 5 April and 5
October in each year. The 7% ‘A’ Cumulative Preference Shares represent 0.44% of the total issued share capital.
Treasury Shares/own shares 2012 2011
€m €m
At 1 January (183) (199)
Treasury Shares/own shares reissued 37 16
At 31 December (146) (183)
As at the balance sheet date, the total number of Treasury Shares held was 7,374,706 (2011: 8,919,195); the nominal value of these shares was €3 million (2011:
€3 million). During the year ended 31 December 2012, 1,317,872 shares were reissued (2011: 287,950) to satisfy exercises and appropriations under the Group’s
share option and share participation schemes. In addition, 226,617 (2011: 150,330) shares were reissued to the CRH plc Employee Benefit Trust in connection
with the release of the award under the Performance Share Plan. These reissued Treasury Shares were previously purchased at an average price of €24.11 (2011:
€24.17). No Treasury Shares were purchased during 2012 or 2011.
Reconciliation of shares issued to net proceeds
Shares issued at nominal amount:
- scrip shares issued in lieu of cash dividends 2 3
Premium on shares issued 86 132
Total value of shares issued 88 135
Issue of scrip shares in lieu of cash dividends (note 12) (88) (135)
Net proceeds from issue of shares - -
Share Premium
At 1 January 4,047 3,915
Premium arising on shares issued 86 132
At 31 December 4,133 4,047
30. Commitments under Operating and Finance Leases
Operating leases
Future minimum rentals payable under non-cancellable operating leases at 31 December are as follows:
2012 2011€m €m
Within one year 274 251
After one year but not more than five years 661 615
More than five years 401 384
1,336 1,250
Finance leases
Future minimum lease payments under finance leases are not material for the Group.
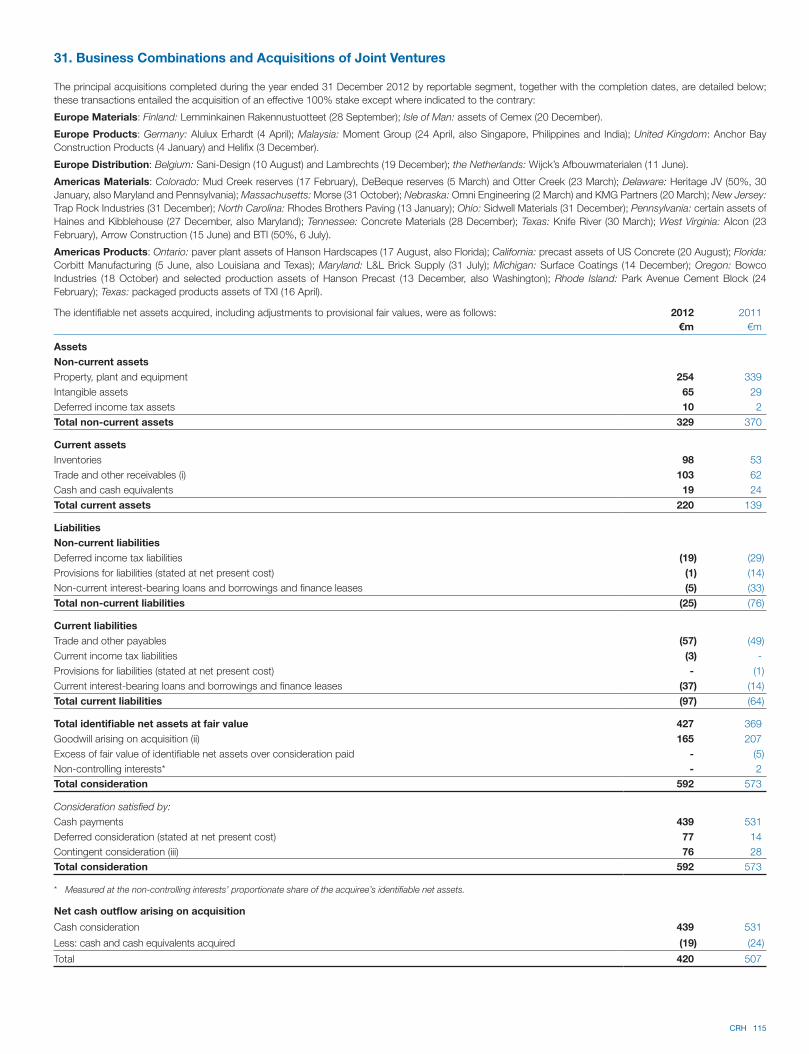
CRH 115
31. Business Combinations and Acquisitions of Joint Ventures
The principal acquisitions completed during the year ended 31 December 2012 by reportable segment, together with the completion dates, are detailed below;
these transactions entailed the acquisition of an effective 100% stake except where indicated to the contrary:
Europe Materials: Finland: Lemminkainen Rakennustuotteet (28 September); Isle of Man: assets of Cemex (20 December).
Europe Products: Germany: Alulux Erhardt (4 April); Malaysia: Moment Group (24 April, also Singapore, Philippines and India); United Kingdom: Anchor Bay
Construction Products (4 January) and Helifix (3 December).
Europe Distribution: Belgium: Sani-Design (10 August) and Lambrechts (19 December); the Netherlands: Wijck’s Afbouwmaterialen (11 June).
Americas Materials: Colorado: Mud Creek reserves (17 February), DeBeque reserves (5 March) and Otter Creek (23 March); Delaware: Heritage JV (50%, 30
January, also Maryland and Pennsylvania); Massachusetts: Morse (31 October); Nebraska: Omni Engineering (2 March) and KMG Partners (20 March); New Jersey:
Trap Rock Industries (31 December); North Carolina: Rhodes Brothers Paving (13 January); Ohio: Sidwell Materials (31 December); Pennsylvania: certain assets of
Haines and Kibblehouse (27 December, also Maryland); Tennessee: Concrete Materials (28 December); Texas: Knife River (30 March); West Virginia: Alcon (23
February), Arrow Construction (15 June) and BTI (50%, 6 July).
Americas Products: Ontario: paver plant assets of Hanson Hardscapes (17 August, also Florida); California: precast assets of US Concrete (20 August); Florida:
Corbitt Manufacturing (5 June, also Louisiana and Texas); Maryland: L&L Brick Supply (31 July); Michigan: Surface Coatings (14 December); Oregon: Bowco
Industries (18 October) and selected production assets of Hanson Precast (13 December, also Washington); Rhode Island: Park Avenue Cement Block (24
February); Texas: packaged products assets of TXI (16 April).
The identifiable net assets acquired, including adjustments to provisional fair values, were as follows: 2012 2011
€m €m
Assets
Non-current assets
Property, plant and equipment 254 339
Intangible assets 65 29
Deferred income tax assets 10 2
Total non-current assets 329 370
Current assets
Inventories 98 53
Trade and other receivables (i) 103 62
Cash and cash equivalents 19 24
Total current assets 220 139
Liabilities
Non-current liabilities
Deferred income tax liabilities (19) (29)
Provisions for liabilities (stated at net present cost) (1) (14)
Non-current interest-bearing loans and borrowings and finance leases (5) (33)
Total non-current liabilities (25) (76)
Current liabilities
Trade and other payables (57) (49)
Current income tax liabilities (3) -
Provisions for liabilities (stated at net present cost) - (1)
Current interest-bearing loans and borrowings and finance leases (37) (14)
Total current liabilities (97) (64)
Total identifiable net assets at fair value 427 369
Goodwill arising on acquisition (ii) 165 207
Excess of fair value of identifiable net assets over consideration paid - (5)
Non-controlling interests* - 2
Total consideration 592 573
Consideration satisfied by:
Cash payments 439 531
Deferred consideration (stated at net present cost) 77 14
Contingent consideration (iii) 76 28
Total consideration 592 573
* Measured at the non-controlling interests’ proportionate share of the acquiree’s identifiable net assets.
Net cash outflow arising on acquisition
Cash consideration 439 531
Less: cash and cash equivalents acquired (19) (24)
Total 420 507
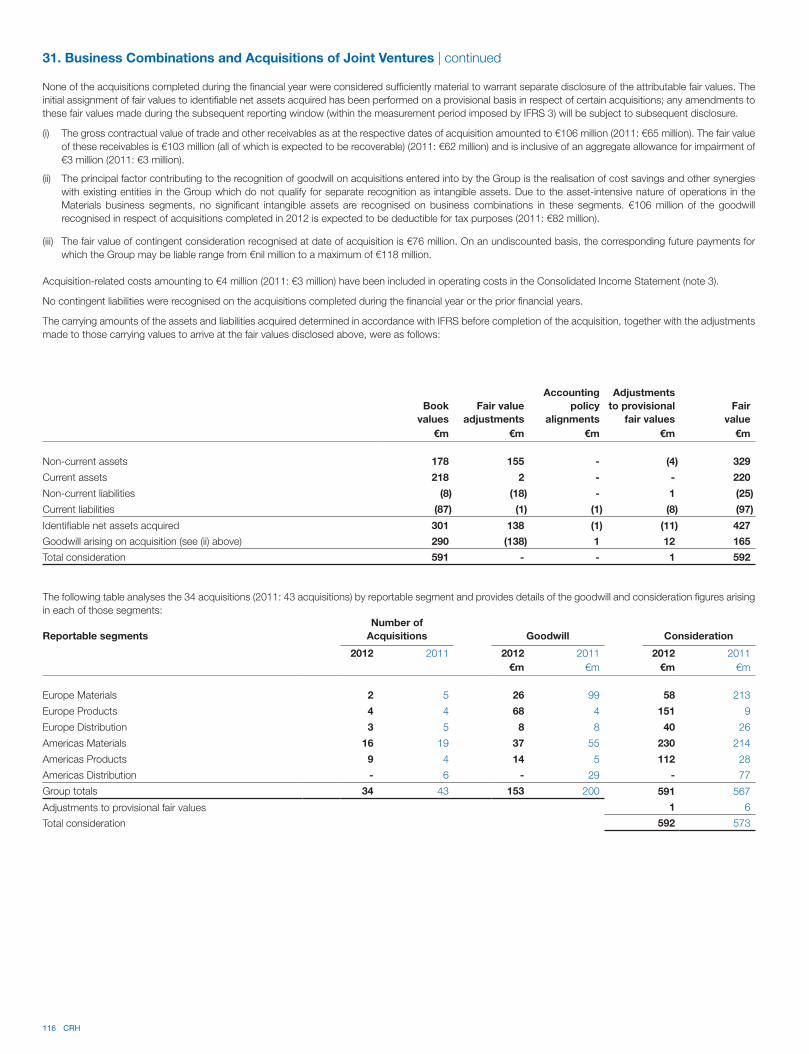
116 CRH
None of the acquisitions completed during the financial year were considered sufficiently material to warrant separate disclosure of the attributable fair values. The
initial assignment of fair values to identifiable net assets acquired has been performed on a provisional basis in respect of certain acquisitions; any amendments to
these fair values made during the subsequent reporting window (within the measurement period imposed by IFRS 3) will be subject to subsequent disclosure.
(i) The gross contractual value of trade and other receivables as at the respective dates of acquisition amounted to €106 million (2011: €65 million). The fair value
of these receivables is €103 million (all of which is expected to be recoverable) (2011: €62 million) and is inclusive of an aggregate allowance for impairment of
€3 million (2011: €3 million).
(ii) The principal factor contributing to the recognition of goodwill on acquisitions entered into by the Group is the realisation of cost savings and other synergies
with existing entities in the Group which do not qualify for separate recognition as intangible assets. Due to the asset-intensive nature of operations in the
Materials business segments, no significant intangible assets are recognised on business combinations in these segments. €106 million of the goodwill
recognised in respect of acquisitions completed in 2012 is expected to be deductible for tax purposes (2011: €82 million).
31. Business Combinations and Acquisitions of Joint Ventures | continued
(iii) The fair value of contingent consideration recognised at date of acquisition is €76 million. On an undiscounted basis, the corresponding future payments for
which the Group may be liable range from €nil million to a maximum of €118 million.
Acquisition-related costs amounting to €4 million (2011: €3 million) have been included in operating costs in the Consolidated Income Statement (note 3).
No contingent liabilities were recognised on the acquisitions completed during the financial year or the prior financial years.
The carrying amounts of the assets and liabilities acquired determined in accordance with IFRS before completion of the acquisition, together with the adjustments
made to those carrying values to arrive at the fair values disclosed above, were as follows:
Book
values
Fair value
adjustments
Accounting
policy
alignments
Adjustments
to provisional
fair values
Fair
value
€m €m €m €m €m
Non-current assets 178 155 - (4) 329
Current assets 218 2 - - 220
Non-current liabilities (8) (18) - 1 (25)
Current liabilities (87) (1) (1) (8) (97)
Identifiable net assets acquired 301 138 (1) (11) 427
Goodwill arising on acquisition (see (ii) above) 290 (138) 1 12 165
Total consideration 591 - - 1 592
The following table analyses the 34 acquisitions (2011: 43 acquisitions) by reportable segment and provides details of the goodwill and consideration figures arising
in each of those segments:
Reportable segments
Number of
Acquisitions Goodwill Consideration
2012 2011 2012 2011 2012 2011
€m €m €m €m
Europe Materials 2 5 26 99 58 213
Europe Products 4 4 68 4 151 9
Europe Distribution 3 5 8 8 40 26
Americas Materials 16 19 37 55 230 214
Americas Products 9 4 14 5 112 28
Americas Distribution - 6 - 29 - 77
Group totals 34 43 153 200 591 567
Adjustments to provisional fair values 1 6
Total consideration 592 573
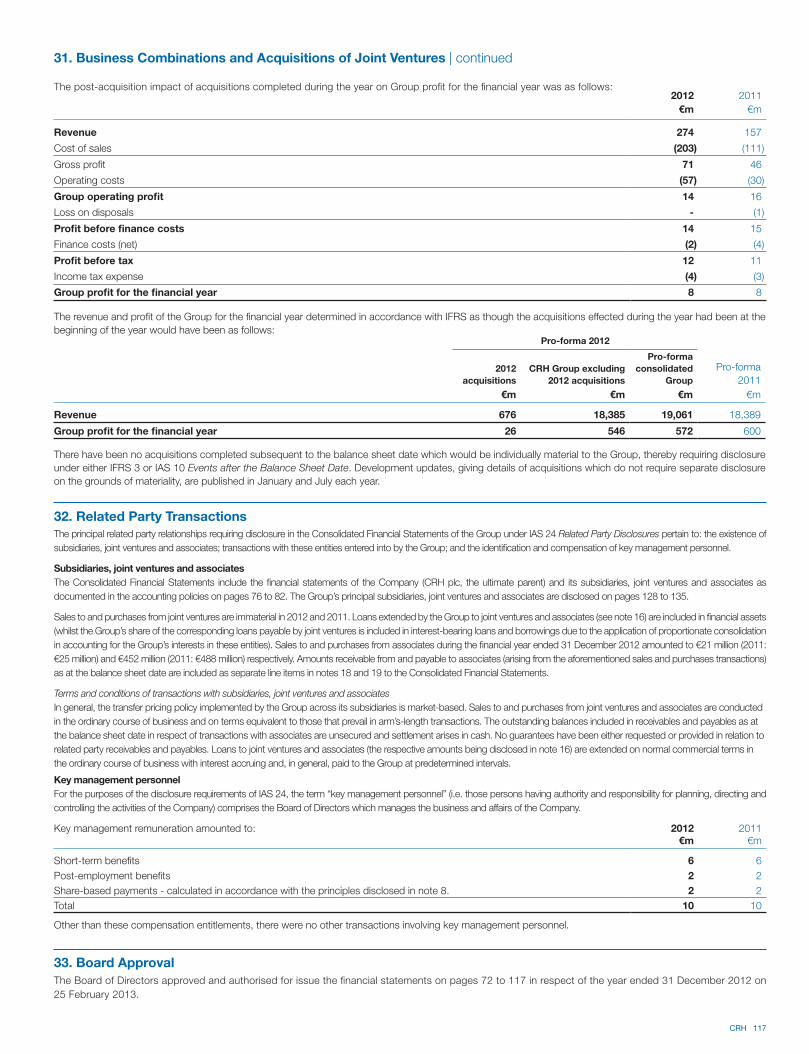
CRH 117
Key management remuneration amounted to: 2012 2011€m €m
Short-term benefits 6 6
Post-employment benefits 2 2
Share-based payments - calculated in accordance with the principles disclosed in note 8. 2 2
Total 10 10
Other than these compensation entitlements, there were no other transactions involving key management personnel.
32. Related Party Transactions
The principal related party relationships requiring disclosure in the Consolidated Financial Statements of the Group under IAS 24 Related Party Disclosures pertain to: the existence of
subsidiaries, joint ventures and associates; transactions with these entities entered into by the Group; and the identification and compensation of key management personnel.
Subsidiaries, joint ventures and associates
The Consolidated Financial Statements include the financial statements of the Company (CRH plc, the ultimate parent) and its subsidiaries, joint ventures and associates as
documented in the accounting policies on pages 76 to 82. The Group’s principal subsidiaries, joint ventures and associates are disclosed on pages 128 to 135.
Sales to and purchases from joint ventures are immaterial in 2012 and 2011. Loans extended by the Group to joint ventures and associates (see note 16) are included in financial assets
(whilst the Group’s share of the corresponding loans payable by joint ventures is included in interest-bearing loans and borrowings due to the application of proportionate consolidation
in accounting for the Group’s interests in these entities). Sales to and purchases from associates during the financial year ended 31 December 2012 amounted to €21 million (2011:
€25 million) and €452 million (2011: €488 million) respectively. Amounts receivable from and payable to associates (arising from the aforementioned sales and purchases transactions)
as at the balance sheet date are included as separate line items in notes 18 and 19 to the Consolidated Financial Statements.
Terms and conditions of transactions with subsidiaries, joint ventures and associates
In general, the transfer pricing policy implemented by the Group across its subsidiaries is market-based. Sales to and purchases from joint ventures and associates are conducted
in the ordinary course of business and on terms equivalent to those that prevail in arm’s-length transactions. The outstanding balances included in receivables and payables as at
the balance sheet date in respect of transactions with associates are unsecured and settlement arises in cash. No guarantees have been either requested or provided in relation to
related party receivables and payables. Loans to joint ventures and associates (the respective amounts being disclosed in note 16) are extended on normal commercial terms in
the ordinary course of business with interest accruing and, in general, paid to the Group at predetermined intervals.
Key management personnel
For the purposes of the disclosure requirements of IAS 24, the term “key management personnel” (i.e. those persons having authority and responsibility for planning, directing and
controlling the activities of the Company) comprises the Board of Directors which manages the business and affairs of the Company.
33. Board Approval
The Board of Directors approved and authorised for issue the financial statements on pages 72 to 117 in respect of the year ended 31 December 2012 on
25 February 2013.
The revenue and profit of the Group for the financial year determined in accordance with IFRS as though the acquisitions effected during the year had been at the
beginning of the year would have been as follows:Pro-forma 2012
2012
acquisitions
CRH Group excluding
2012 acquisitions
Pro-forma
consolidated
Group
Pro-forma
2011
€m €m €m €m
Revenue 676 18,385 19,061 18,389
Group profit for the financial year 26 546 572 600
There have been no acquisitions completed subsequent to the balance sheet date which would be individually material to the Group, thereby requiring disclosure
under either IFRS 3 or IAS 10 Events after the Balance Sheet Date. Development updates, giving details of acquisitions which do not require separate disclosure
on the grounds of materiality, are published in January and July each year.
The post-acquisition impact of acquisitions completed during the year on Group profit for the financial year was as follows:2012 2011
€m €m
Revenue 274 157
Cost of sales (203) (111)
Gross profit 71 46
Operating costs (57) (30)
Group operating profit 14 16
Loss on disposals - (1)
Profit before finance costs 14 15
Finance costs (net) (2) (4)
Profit before tax 12 11
Income tax expense (4) (3)
Group profit for the financial year 8 8
31. Business Combinations and Acquisitions of Joint Ventures | continued
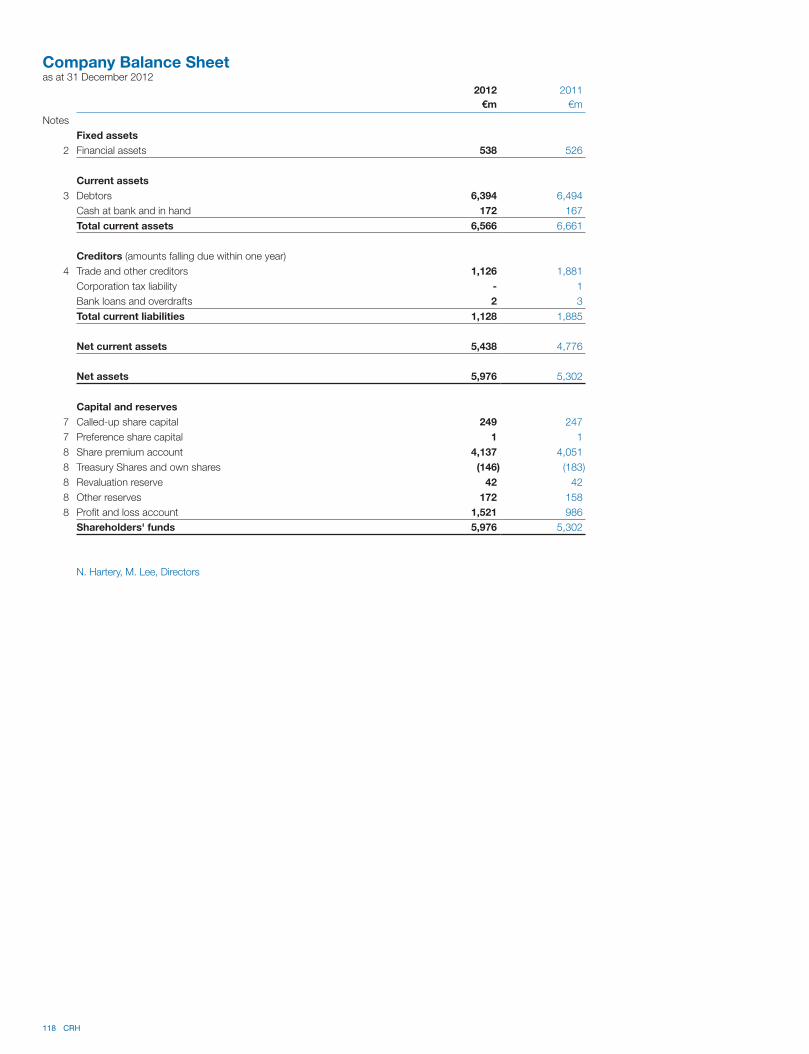
118 CRH
Company Balance Sheetas at 31 December 2012
2012 2011
€m €m
Notes
Fixed assets
2 Financial assets 538 526
Current assets
3 Debtors 6,394 6,494
Cash at bank and in hand 172 167
Total current assets 6,566 6,661
Creditors (amounts falling due within one year)
4 Trade and other creditors 1,126 1,881
Corporation tax liability - 1
Bank loans and overdrafts 2 3
Total current liabilities 1,128 1,885
Net current assets 5,438 4,776
Net assets 5,976 5,302
Capital and reserves
7 Called-up share capital 249 247
7 Preference share capital 1 1
8 Share premium account 4,137 4,051
8 Treasury Shares and own shares (146) (183)
8 Revaluation reserve 42 42
8 Other reserves 172 158
8 Profit and loss account 1,521 986
Shareholders' funds 5,976 5,302
N. Hartery, M. Lee, Directors

CRH 119
Notes to the Company Balance Sheet
1. Accounting Policies
Basis of accounting
The financial statements have been prepared under the historical cost convention in accordance with the Companies Acts,
1963 to 2012 and Generally Accepted Accounting Practice in the Republic of Ireland (“Irish GAAP”). The following
paragraphs describe the principal accounting policies under Irish GAAP, which have been applied consistently.
Operating income and expense
Operating income and expense arises from the Company’s principal activities as a holding company for the Group and are
accounted for on an accruals basis.
Financial assets
Fixed asset investments, including investments in subsidiaries, are stated at cost (and at valuation at 31 December 1980
for those investments in existence at that date) less any accumulated impairments and are reviewed for impairment if there
are indications that the carrying value may not be recoverable.
Foreign currencies
The reporting currency of the Company is euro. Transactions in foreign currencies are translated at the rates of exchange
ruling at the transaction date. Monetary assets and liabilities denominated in foreign currencies are translated into euro at
the rates of exchange ruling at the balance sheet date, with a corresponding charge or credit to the profit and loss
account.
Share issue expenses and share premium account
Costs of share issues are written off against the premium arising on issues of share capital.
Share-based payments
The Company has applied the requirements of FRS 20 Share-based Payment.
The accounting policy applicable to share-based payments is consistent with that applied under IFRS and is accordingly
addressed in detail on pages 76 to 82 of the Consolidated Financial Statements.
Cash flow statement
The Company has taken advantage of the exemption afforded by FRS 1 Cash Flow Statements not to provide a statement
of cash flows.
Treasury Shares and own shares
Treasury Shares
Own equity instruments (i.e. Ordinary Shares) acquired by the Company are deducted from equity and presented on the
face of the Company Balance Sheet. No gain or loss is recognised in profit or loss on the purchase, sale, issue or
cancellation of the Company’s Ordinary Shares.
Own shares
Ordinary Shares purchased by the Employee Benefit Trust on behalf of the Company under the terms of the Performance
Share Plan are recorded as a deduction from equity on the face of the Company Balance Sheet.
Dividends
Dividends on Ordinary Shares are recognised as a liability in the Company’s Financial Statements in the period in which
they are declared by the Company
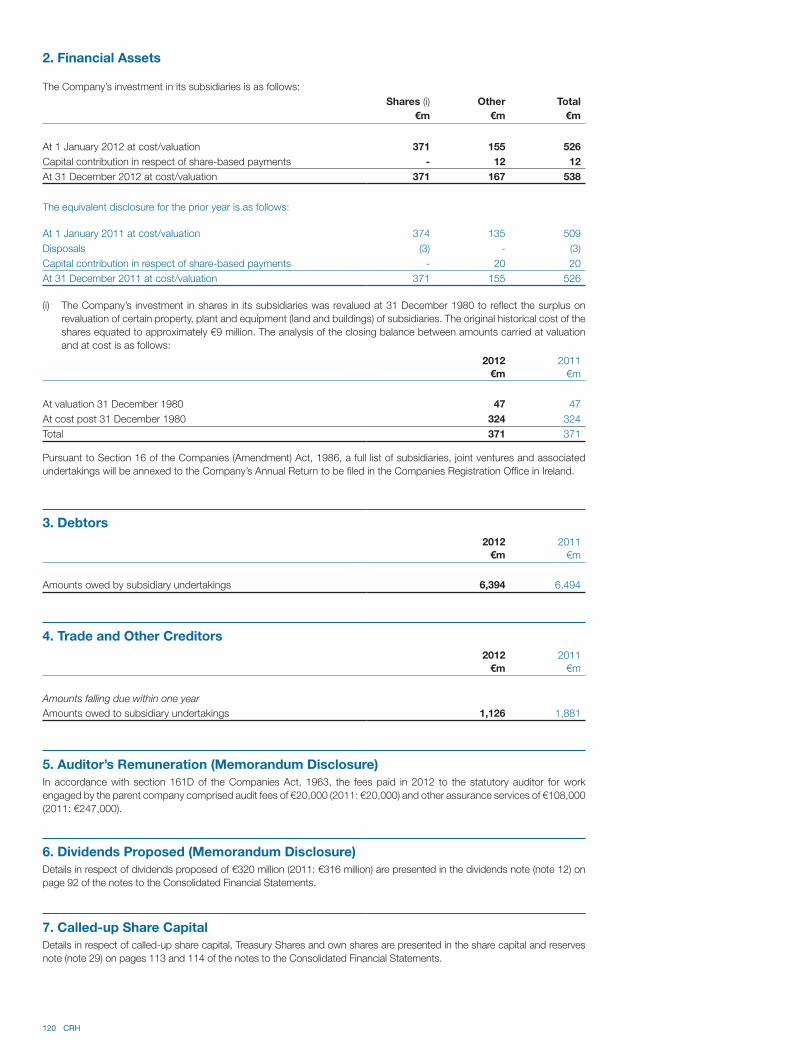
120 CRH
2. Financial Assets
The Company’s investment in its subsidiaries is as follows:
Shares (i) Other Total
€m €m €m
At 1 January 2012 at cost/valuation 371 155 526
Capital contribution in respect of share-based payments - 12 12
At 31 December 2012 at cost/valuation 371 167 538
The equivalent disclosure for the prior year is as follows:
At 1 January 2011 at cost/valuation 374 135 509
Disposals (3) - (3)
Capital contribution in respect of share-based payments - 20 20
At 31 December 2011 at cost/valuation 371 155 526
(i) The Company’s investment in shares in its subsidiaries was revalued at 31 December 1980 to reflect the surplus on
revaluation of certain property, plant and equipment (land and buildings) of subsidiaries. The original historical cost of the
shares equated to approximately €9 million. The analysis of the closing balance between amounts carried at valuation
and at cost is as follows:
2012 2011
€m €m
At valuation 31 December 1980 47 47
At cost post 31 December 1980 324 324
Total 371 371
Pursuant to Section 16 of the Companies (Amendment) Act, 1986, a full list of subsidiaries, joint ventures and associated
undertakings will be annexed to the Company’s Annual Return to be filed in the Companies Registration Office in Ireland.
3. Debtors
2012 2011
€m €m
Amounts owed by subsidiary undertakings 6,394 6,494
4. Trade and Other Creditors
2012 2011
€m €m
Amounts falling due within one year
Amounts owed to subsidiary undertakings 1,126 1,881
5. Auditor’s Remuneration (Memorandum Disclosure)
In accordance with section 161D of the Companies Act, 1963, the fees paid in 2012 to the statutory auditor for work
engaged by the parent company comprised audit fees of €20,000 (2011: €20,000) and other assurance services of €108,000
(2011: €247,000).
6. Dividends Proposed (Memorandum Disclosure)
Details in respect of dividends proposed of €320 million (2011: €316 million) are presented in the dividends note (note 12) on
page 92 of the notes to the Consolidated Financial Statements.
7. Called-up Share Capital
Details in respect of called-up share capital, Treasury Shares and own shares are presented in the share capital and reserves
note (note 29) on pages 113 and 114 of the notes to the Consolidated Financial Statements.
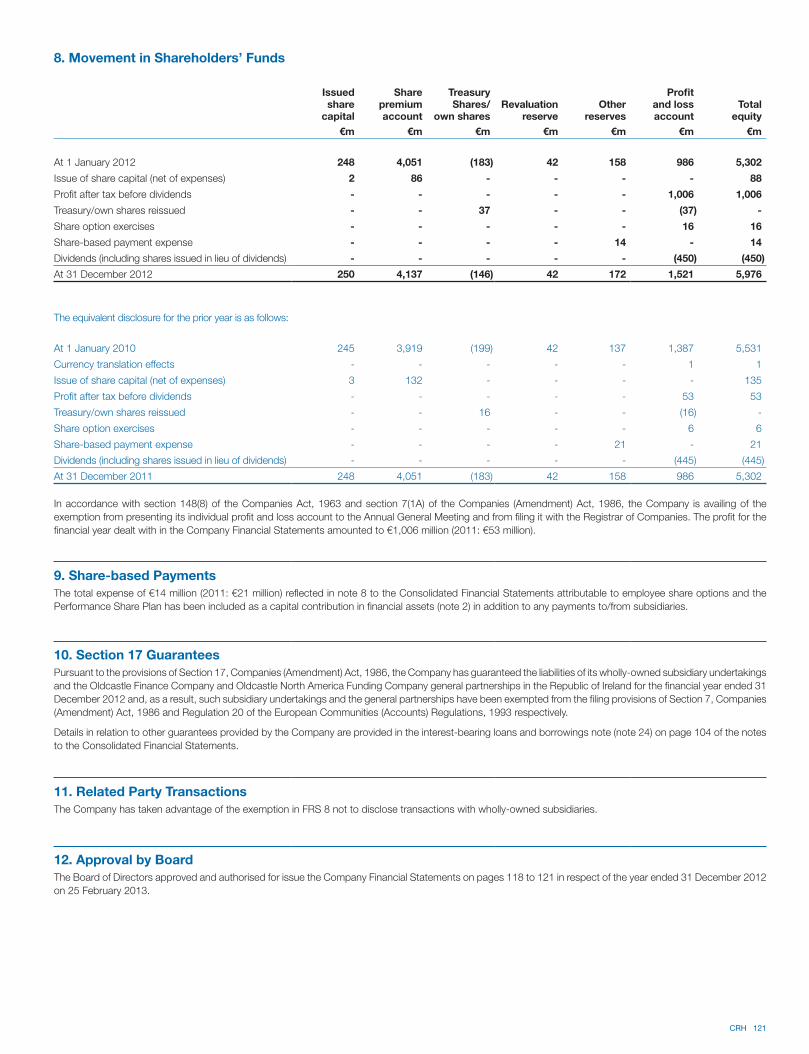
CRH 121
8. Movement in Shareholders’ Funds
Issued share
capital
Sharepremiumaccount
Treasury Shares/
own sharesRevaluation
reserveOther
reserves
Profit and loss account
Total
equity
€m €m €m €m €m €m €m
At 1 January 2012 248 4,051 (183) 42 158 986 5,302
Issue of share capital (net of expenses) 2 86 - - - - 88
Profit after tax before dividends - - - - - 1,006 1,006
Treasury/own shares reissued - - 37 - - (37) -
Share option exercises - - - - - 16 16
Share-based payment expense - - - - 14 - 14
Dividends (including shares issued in lieu of dividends) - - - - - (450) (450)
At 31 December 2012 250 4,137 (146) 42 172 1,521 5,976
The equivalent disclosure for the prior year is as follows:
At 1 January 2010 245 3,919 (199) 42 137 1,387 5,531
Currency translation effects - - - - - 1 1
Issue of share capital (net of expenses) 3 132 - - - - 135
Profit after tax before dividends - - - - - 53 53
Treasury/own shares reissued - - 16 - - (16) -
Share option exercises - - - - - 6 6
Share-based payment expense - - - - 21 - 21
Dividends (including shares issued in lieu of dividends) - - - - - (445) (445)
At 31 December 2011 248 4,051 (183) 42 158 986 5,302
In accordance with section 148(8) of the Companies Act, 1963 and section 7(1A) of the Companies (Amendment) Act, 1986, the Company is availing of the
exemption from presenting its individual profit and loss account to the Annual General Meeting and from filing it with the Registrar of Companies. The profit for the
financial year dealt with in the Company Financial Statements amounted to €1,006 million (2011: €53 million).
9. Share-based Payments
The total expense of €14 million (2011: €21 million) reflected in note 8 to the Consolidated Financial Statements attributable to employee share options and the
Performance Share Plan has been included as a capital contribution in financial assets (note 2) in addition to any payments to/from subsidiaries.
10. Section 17 Guarantees
Pursuant to the provisions of Section 17, Companies (Amendment) Act, 1986, the Company has guaranteed the liabilities of its wholly-owned subsidiary undertakings
and the Oldcastle Finance Company and Oldcastle North America Funding Company general partnerships in the Republic of Ireland for the financial year ended 31
December 2012 and, as a result, such subsidiary undertakings and the general partnerships have been exempted from the filing provisions of Section 7, Companies
(Amendment) Act, 1986 and Regulation 20 of the European Communities (Accounts) Regulations, 1993 respectively.
Details in relation to other guarantees provided by the Company are provided in the interest-bearing loans and borrowings note (note 24) on page 104 of the notes
to the Consolidated Financial Statements.
11. Related Party Transactions
The Company has taken advantage of the exemption in FRS 8 not to disclose transactions with wholly-owned subsidiaries.
12. Approval by Board
The Board of Directors approved and authorised for issue the Company Financial Statements on pages 118 to 121 in respect of the year ended 31 December 2012
on 25 February 2013.
122 CRH
Shareholder Information
Dividend payments
An interim dividend of 18.5c was paid in respect of Ordinary Shares on 19
October 2012.
A final dividend of 44c, if approved at the 2013 Annual General Meeting, will be
paid in respect of Ordinary Shares on 13 May 2013 to shareholders on the
Register of Members as at the close of business on 8 March 2013. A scrip
alternative will be offered to shareholders.
Dividend Withholding Tax (DWT) must be deducted from dividends paid by an
Irish resident company, unless a shareholder is entitled to an exemption and has
submitted a properly completed exemption form to the Company’s Registrars,
Capita Registrars (Ireland) Limited (“Capita Registrars”). DWT applies to
dividends paid by way of cash or by way of shares under a scrip dividend
scheme and is deducted at the standard rate of Income Tax (currently 20%).
Non-resident shareholders and certain Irish companies, trusts, pension
schemes, investment undertakings and charities may be entitled to claim
exemption from DWT. Copies of the exemption form may be obtained from
Capita Registrars. Shareholders should note that DWT will be deducted from
dividends in cases where a properly completed form has not been received by
the record date for a dividend. Individuals who are resident in Ireland for tax
purposes are not entitled to an exemption.
Shareholders who wish to have their dividend paid direct to a bank account, by
electronic funds transfer, should complete the required dividend mandate form
and submit it to Capita Registrars. A copy of the mandate form can be obtained
from the shareholder services section of the CRH website, www.crh.com, under
“Equity Investors”. Alternatively, shareholders can contact Capita Registrars to
obtain a mandate form (see contact details below). Tax vouchers will be sent to
the shareholder’s registered address under this arrangement.
Dividends are generally paid in euro. However, in order to avoid costs to
shareholders, dividends are paid in Sterling and US Dollars to shareholders
whose address, according to the Share Register, is in the UK and the United
States respectively, unless they require otherwise.
Dividends in respect of 7% ‘A’ Cumulative Preference Shares are paid half-yearly
on 5 April and 5 October.
Dividends in respect of 5% Cumulative Preference Shares are paid half-yearly on
15 April and 15 October.
CREST
Transfer of the Company’s shares takes place through the CREST system.
Shareholders have the choice of holding their shares in electronic form or in the
form of share certificates.
As the above mentioned dividend payment arrangements can be inflexible for
institutional shareholders, where shares are held in CREST, dividends are
automatically paid in euro unless a currency election is made. CREST members
should use the facility in CREST to make currency elections. Such elections
must be made in respect of entire holdings as partial elections are not
permissible.
CRH 123
Share price data
2012 2011
€ Stg£ € Stg£*
Share price at 31 December 15.30 12.48 15.36 12.80
Market capitalisation 11.1 bn 9.1 bn 11.0 bn 9.2 bn
Share price movement during year:
- high 16.79 14.09 17.00 14.27
- low 12.99 10.52 10.50 9.03
* With effect from 9 November 2011, CRH Ordinary Shares listed on the London Stock
Exchange traded in Sterling GB pence rather than in euro. The Sterling high and low
prices referred to above have been converted from euro at the exchange rate
prevailing on the relevant dates.
Shareholdings as at 31 December 2012
Ownership of Ordinary Shares
Geographic location*
Number of
shares held
% of
total
‘000s
Europe/Other 134,156 18.28
Ireland 27,834 3.79
North America 303,056 41.30
Retail 114,339 15.58
United Kingdom 147,061 20.04
Treasury 7,375 1.01
733,821 100
* This represents a best estimate of the number of shares controlled by fund managers
resident in the geographic regions indicated. Private shareholders are classified as
retail above.
HoldingsNumber of
shareholders
% of
total
Number of
shares held
% of
total
‘000s
1 - 1,000 15,408 59.37 5,321 0.73
1,001 - 10,000 8,986 34.63 26,194 3.57
10,001 - 100,000 1,169 4.51 32,286 4.40
100,001 - 1,000,000 302 1.16 104,248 14.20
Over 1,000,000 86 0.33 565,772 77.10
25,951 100 733,821 100
Stock Exchange listings
CRH has a premium listing on the London Stock Exchange and a secondary
listing on the Irish Stock Exchange. The Group’s American Depositary Shares
(ADSs), each representing one Ordinary Share, are listed on the New York
Stock Exchange (NYSE). The ADSs are evidenced by American Depositary
Receipts.
Financial calendar
Announcement of final results for 2012 26 February 2013
Ex-dividend date 6 March 2013
Record date for dividend 8 March 2013
Latest date for receipt of scrip forms 25 April 2013
Interim Management Statement 8 May 2013
Annual General Meeting 8 May 2013
Dividend payment date and first day of dealing in
scrip dividend shares 13 May 2013
Announcement of interim results for 2013 20 August 2013
Interim Management Statement 12 November 2013
Website
The Group’s website, www.crh.com, provides the full text of the Annual and
Interim Reports, the Annual Report on Form 20-F, which is filed annually with the
United States Securities and Exchange Commission, interim management
statements and copies of presentations to analysts and investors. News
releases are made available, in the Media section of the website, immediately
after release to the Stock Exchanges.
Electronic communications
Following the introduction of the 2007 Transparency Regulations, and in order to
adopt a more environmentally friendly and cost effective approach, the Company
provides the Annual Report to shareholders electronically via the CRH website,
www.crh.com, and only sends a printed copy to those shareholders who
specifically request a copy. Shareholders who choose to do so can receive other
shareholder communications, for example, notices of general meetings and
shareholder circulars, electronically. However, shareholders will continue to
receive printed proxy forms, dividend documentation and, if the Company
deems it appropriate, other documentation by post. Shareholders can alter the
method by which they receive communications by contacting Capita Registrars.
Electronic proxy voting
Shareholders may lodge a proxy form for the 2013 Annual General Meeting
electronically. Shareholders who wish to submit proxies via the internet may do
so by accessing Capita Registrars’ website as described below.
CREST members wishing to appoint a proxy via CREST should refer to the
CREST Manual and the notes to the Notice of the Annual General Meeting.
Registrars
Enquiries concerning shareholdings should be addressed to:
Capita Registrars
P.O. Box 7117
Dublin 2
Ireland
Telephone: +353 (0) 1 553 0050 *
Fax: +353 (0) 1 224 0700 *
* Contact numbers have changed with effect from 28 January 2013
Shareholders with access to the internet may check their accounts by accessing
Capita Registrars’ website, www.capitaregistrars.ie and selecting “Shareholder
Portal”. This facility allows shareholders to check their shareholdings and dividend
payments, register e-mail addresses, vote electronically and download standard
forms required to initiate changes in details held by Capita Registrars. Shareholders
will need to register for a User ID before using some of the services.
American Depositary Receipts (ADRs)
The ADR programme is administered by the Bank of New York Mellon and
enquiries regarding ADRs should be addressed to:
The Bank of New York Mellon
P.O. Box 358516
Pittsburgh
PA 15252-8516
U.S.A.
Telephone: Toll Free Number (United States residents): 1-888-269-2377
International: +1 201-680-6825
E-mail: [email protected]
Website: www.bnymellon.com/shareowner
Frequently Asked Questions (FAQ)
The Group’s website contains answers to questions frequently asked by
shareholders, including questions regarding shareholdings, dividends payments,
electronic communications and shareholder rights. The FAQ can be accessed in
the Investors’ section of the website under “Equity Investors”.
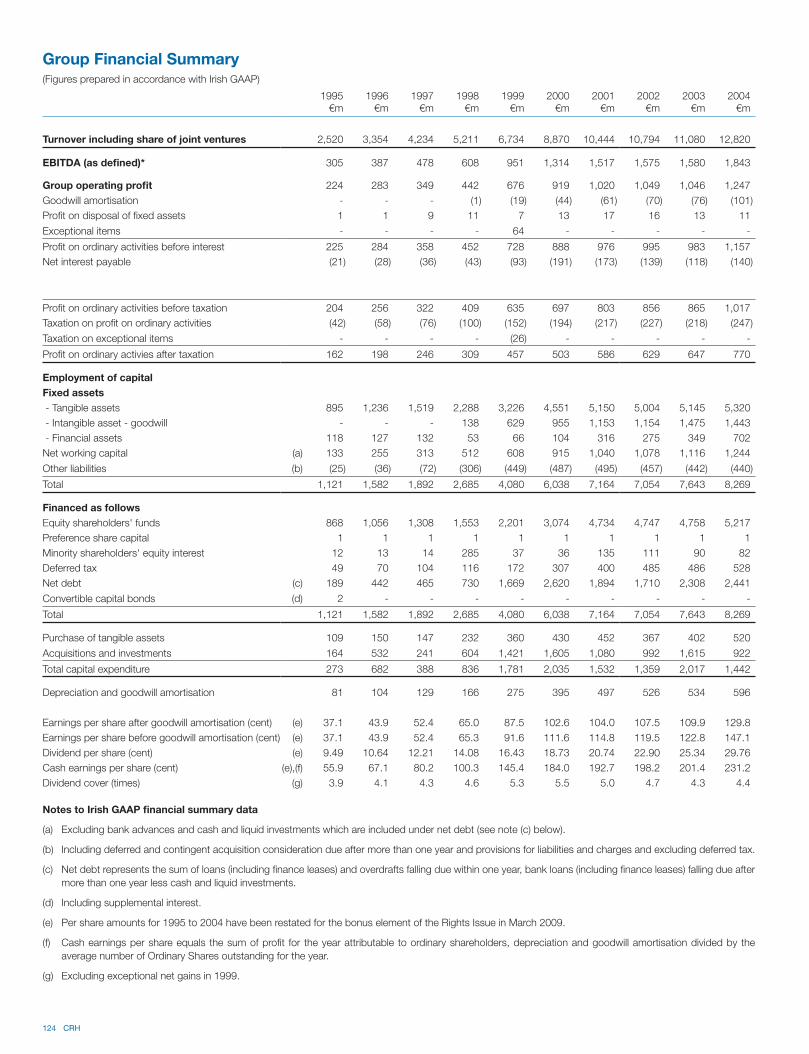
124 CRH
Group Financial Summary(Figures prepared in accordance with Irish GAAP)
1995 1996 1997 1998 1999 2000 2001 2002 2003 2004€m €m €m €m €m €m €m €m €m €m
Turnover including share of joint ventures 2,520 3,354 4,234 5,211 6,734 8,870 10,444 10,794 11,080 12,820
EBITDA (as defined)* 305 387 478 608 951 1,314 1,517 1,575 1,580 1,843
Group operating profit 224 283 349 442 676 919 1,020 1,049 1,046 1,247
Goodwill amortisation - - - (1) (19) (44) (61) (70) (76) (101)
Profit on disposal of fixed assets 1 1 9 11 7 13 17 16 13 11
Exceptional items - - - - 64 - - - - -
Profit on ordinary activities before interest 225 284 358 452 728 888 976 995 983 1,157
Net interest payable (21) (28) (36) (43) (93) (191) (173) (139) (118) (140)
Profit on ordinary activities before taxation 204 256 322 409 635 697 803 856 865 1,017
Taxation on profit on ordinary activities (42) (58) (76) (100) (152) (194) (217) (227) (218) (247)
Taxation on exceptional items - - - - (26) - - - - -
Profit on ordinary activies after taxation 162 198 246 309 457 503 586 629 647 770
Employment of capital
Fixed assets
- Tangible assets 895 1,236 1,519 2,288 3,226 4,551 5,150 5,004 5,145 5,320
- Intangible asset - goodwill - - - 138 629 955 1,153 1,154 1,475 1,443
- Financial assets 118 127 132 53 66 104 316 275 349 702
Net working capital (a) 133 255 313 512 608 915 1,040 1,078 1,116 1,244
Other liabilities (b) (25) (36) (72) (306) (449) (487) (495) (457) (442) (440)
Total 1,121 1,582 1,892 2,685 4,080 6,038 7,164 7,054 7,643 8,269
Financed as follows
Equity shareholders' funds 868 1,056 1,308 1,553 2,201 3,074 4,734 4,747 4,758 5,217
Preference share capital 1 1 1 1 1 1 1 1 1 1
Minority shareholders' equity interest 12 13 14 285 37 36 135 111 90 82
Deferred tax 49 70 104 116 172 307 400 485 486 528
Net debt (c) 189 442 465 730 1,669 2,620 1,894 1,710 2,308 2,441
Convertible capital bonds (d) 2 - - - - - - - - -
Total 1,121 1,582 1,892 2,685 4,080 6,038 7,164 7,054 7,643 8,269
Purchase of tangible assets 109 150 147 232 360 430 452 367 402 520
Acquisitions and investments 164 532 241 604 1,421 1,605 1,080 992 1,615 922
Total capital expenditure 273 682 388 836 1,781 2,035 1,532 1,359 2,017 1,442
Depreciation and goodwill amortisation 81 104 129 166 275 395 497 526 534 596
Earnings per share after goodwill amortisation (cent) (e) 37.1 43.9 52.4 65.0 87.5 102.6 104.0 107.5 109.9 129.8
Earnings per share before goodwill amortisation (cent) (e) 37.1 43.9 52.4 65.3 91.6 111.6 114.8 119.5 122.8 147.1
Dividend per share (cent) (e) 9.49 10.64 12.21 14.08 16.43 18.73 20.74 22.90 25.34 29.76
Cash earnings per share (cent) (e),(f) 55.9 67.1 80.2 100.3 145.4 184.0 192.7 198.2 201.4 231.2
Dividend cover (times) (g) 3.9 4.1 4.3 4.6 5.3 5.5 5.0 4.7 4.3 4.4
Notes to Irish GAAP financial summary data
(a) Excluding bank advances and cash and liquid investments which are included under net debt (see note (c) below).
(b) Including deferred and contingent acquisition consideration due after more than one year and provisions for liabilities and charges and excluding deferred tax.
(c) Net debt represents the sum of loans (including finance leases) and overdrafts falling due within one year, bank loans (including finance leases) falling due after
more than one year less cash and liquid investments.
(d) Including supplemental interest.
(e) Per share amounts for 1995 to 2004 have been restated for the bonus element of the Rights Issue in March 2009.
(f) Cash earnings per share equals the sum of profit for the year attributable to ordinary shareholders, depreciation and goodwill amortisation divided by the
average number of Ordinary Shares outstanding for the year.
(g) Excluding exceptional net gains in 1999.
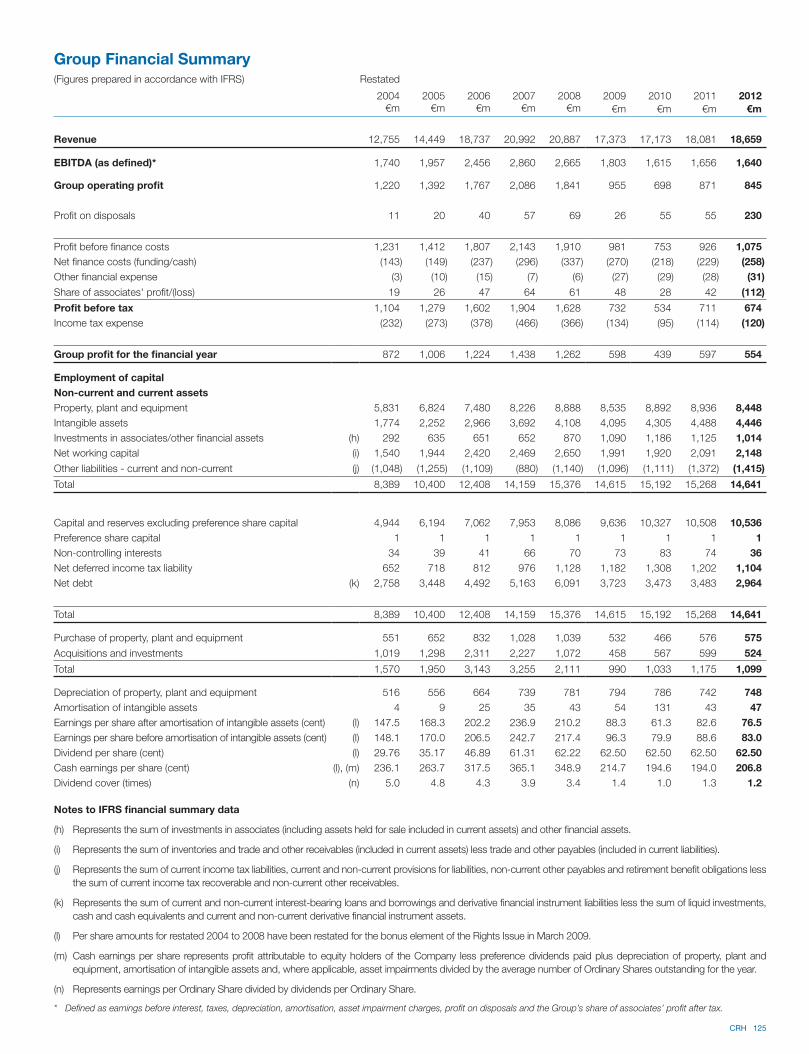
CRH 125
Group Financial Summary(Figures prepared in accordance with IFRS) Restated
2004 2005 2006 2007 2008 2009 2010 2011 2012
€m €m €m €m €m €m €m €m €m
Revenue 12,755 14,449 18,737 20,992 20,887 17,373 17,173 18,081 18,659
EBITDA (as defined)* 1,740 1,957 2,456 2,860 2,665 1,803 1,615 1,656 1,640
Group operating profit 1,220 1,392 1,767 2,086 1,841 955 698 871 845
Profit on disposals 11 20 40 57 69 26 55 55 230
Profit before finance costs 1,231 1,412 1,807 2,143 1,910 981 753 926 1,075
Net finance costs (funding/cash) (143) (149) (237) (296) (337) (270) (218) (229) (258)
Other financial expense (3) (10) (15) (7) (6) (27) (29) (28) (31)
Share of associates' profit/(loss) 19 26 47 64 61 48 28 42 (112)
Profit before tax 1,104 1,279 1,602 1,904 1,628 732 534 711 674
Income tax expense (232) (273) (378) (466) (366) (134) (95) (114) (120)
Group profit for the financial year 872 1,006 1,224 1,438 1,262 598 439 597 554
Employment of capital
Non-current and current assets
Property, plant and equipment 5,831 6,824 7,480 8,226 8,888 8,535 8,892 8,936 8,448
Intangible assets 1,774 2,252 2,966 3,692 4,108 4,095 4,305 4,488 4,446
Investments in associates/other financial assets (h) 292 635 651 652 870 1,090 1,186 1,125 1,014
Net working capital (i) 1,540 1,944 2,420 2,469 2,650 1,991 1,920 2,091 2,148
Other liabilities - current and non-current (j) (1,048) (1,255) (1,109) (880) (1,140) (1,096) (1,111) (1,372) (1,415)
Total 8,389 10,400 12,408 14,159 15,376 14,615 15,192 15,268 14,641
Capital and reserves excluding preference share capital 4,944 6,194 7,062 7,953 8,086 9,636 10,327 10,508 10,536
Preference share capital 1 1 1 1 1 1 1 1 1
Non-controlling interests 34 39 41 66 70 73 83 74 36
Net deferred income tax liability 652 718 812 976 1,128 1,182 1,308 1,202 1,104
Net debt (k) 2,758 3,448 4,492 5,163 6,091 3,723 3,473 3,483 2,964
Total 8,389 10,400 12,408 14,159 15,376 14,615 15,192 15,268 14,641
Purchase of property, plant and equipment 551 652 832 1,028 1,039 532 466 576 575
Acquisitions and investments 1,019 1,298 2,311 2,227 1,072 458 567 599 524
Total 1,570 1,950 3,143 3,255 2,111 990 1,033 1,175 1,099
Depreciation of property, plant and equipment 516 556 664 739 781 794 786 742 748
Amortisation of intangible assets 4 9 25 35 43 54 131 43 47
Earnings per share after amortisation of intangible assets (cent) (l) 147.5 168.3 202.2 236.9 210.2 88.3 61.3 82.6 76.5
Earnings per share before amortisation of intangible assets (cent) (l) 148.1 170.0 206.5 242.7 217.4 96.3 79.9 88.6 83.0
Dividend per share (cent) (l) 29.76 35.17 46.89 61.31 62.22 62.50 62.50 62.50 62.50
Cash earnings per share (cent) (l), (m) 236.1 263.7 317.5 365.1 348.9 214.7 194.6 194.0 206.8
Dividend cover (times) (n) 5.0 4.8 4.3 3.9 3.4 1.4 1.0 1.3 1.2
Notes to IFRS financial summary data
(h) Represents the sum of investments in associates (including assets held for sale included in current assets) and other financial assets.
(i) Represents the sum of inventories and trade and other receivables (included in current assets) less trade and other payables (included in current liabilities).
(j) Represents the sum of current income tax liabilities, current and non-current provisions for liabilities, non-current other payables and retirement benefit obligations less
the sum of current income tax recoverable and non-current other receivables.
(k) Represents the sum of current and non-current interest-bearing loans and borrowings and derivative financial instrument liabilities less the sum of liquid investments,
cash and cash equivalents and current and non-current derivative financial instrument assets.
(l) Per share amounts for restated 2004 to 2008 have been restated for the bonus element of the Rights Issue in March 2009.
(m) Cash earnings per share represents profit attributable to equity holders of the Company less preference dividends paid plus depreciation of property, plant and
equipment, amortisation of intangible assets and, where applicable, asset impairments divided by the average number of Ordinary Shares outstanding for the year.
(n) Represents earnings per Ordinary Share divided by dividends per Ordinary Share.
* Defined as earnings before interest, taxes, depreciation, amortisation, asset impairment charges, profit on disposals and the Group’s share of associates’ profit after tax.
126 CRH
Executive Directors/Secretary
Myles Lee
Chief Executive
Albert Manifold
Chief Operating Officer
Maeve Carton
Finance Director
Mark Towe
Chief Executive Officer Oldcastle, Inc.
Neil Colgan
Company Secretary
Senior Group Staff
Human Resources, Risk
Jack Golden
Group Human Resources Director
John Byrne
Head of Internal Audit
Ros O’Shea
Head of Compliance & Ethics
Declan Condren
Group Strategic Financial Risk Manager
Strategy, Sustainability
Noel O’Mahony
Head of Group Strategy & Development
Pat McCleery
Group Sustainability Manager
Communications, Investor Relations
Éimear O’Flynn
Corporate Communications
Frank Heisterkamp
Head of Investor Relations
Finance, Tax, Treasury
Rossa McCann
Head of Group Finance
Paul Barry
Group Controller
Pat O’Shea
Group Taxation Director
Anthony Fitzgerald
Group Treasurer
Europe
Materials
Henry Morris
Managing Director
Alan Connolly
Finance Director
Eamon Geraghty
Technical Director
Philip Wheatley
Development Director
John Corbett
Human Resources
Director
John McKeon
Procurement Director
Adrian Streuli
Cement Operations
Manager
Michael O’Sullivan
RMC & Aggregates
Operations Manager
Grainne McKenna
Head of Finance
Europe West
Jim Mintern
Regional Director
Europe West
Barry Leonard
Managing Director
Irish Cement
Larry Byrne
Managing Director
Clogrennane Lime
Jim Farrell
Managing Director
Roadstone-Wood Group
Eamonn Sweeney
Managing Director
Northstone
Seamus Lynch
Country Manager
Benelux
Sebastia Alegre
Managing Director
Beton Catalan – Spain
Central Europe
Owen Rowley
Regional Director
Central Europe
Urs Sandmeier
Country Manager
Switzerland
Mariusz Bogacz
Country Manager
Finland
Kalervo Matikainen
Managing Director
Finnsementti – Finland
Lauri Kivekäs
Managing Director
Rudus – Finland
Mark Lowry
Country Manager
Poland
Mossy O’Connor
Cement Director
Poland
Dominik Piskorski
Concrete Products
Director
Poland
Brian Walsh
Lime, RMC, Aggregates &
Blacktop Director
Poland & Slovakia
Europe East
Declan Maguire
Regional Director
Europe East
David Dillon
Country Director
Russia
Declan Maguire
Country Director
Ukraine
Products & Distribution
Erik Bax
Managing Director
Edwin Bouwman
Finance Director
Ivo Wetsels
Human Resources
Director
Products
Francisco Irazusta
Managing Director
Products
Kees Verburg
Business Development
Director Products
Marc Asselberg
Chief Information Officer
Products
Jean-Luc Bernard
Managing Director
Construction Accessories
Kees-Jan van ‘t Westeinde
Managing Director
Shutters & Awnings
Gerben Stilma
Managing Director
Netherlands
Dirk Vael
Managing Director
Belgium
Edwin van den Berg
Managing Director
Central & Eastern Europe
Wayne Sheppard
Managing Director
UK
Alain Kirchmeyer
Managing Director
France
Distribution
Marc St. Nicolaas
Managing Director
Distribution
Peter Erkamp
Finance Director
Distribution
Erik de Groot
Organisation Development
Director Distribution
Tom Beyers
Development Director
Distribution
Erik de Groot
Managing Director
Builders Merchants
Switzerland
Ulrich Paulmann
Managing Director
Builders Merchants
Austria
Peter Stravers
Managing Director
Builders Merchants
Benelux
Khaled Bachir
Managing Director
Builders Merchants France
Emiel Hopmans
Managing Director
DIY Europe
Christoph Lehrmann
Managing Director
Bauking Germany
Taco van Vroonhoven
Managing Director
Sanitary ware, Heating
& Plumbing
Asia
Ken McKnight
Managing Director
CRH Asia
Oliver Mahon
Country Director
India
Peter Buckley
Country Director
China
Ee Ming Wong
Country Manager
China
Management

CRH 127
The Americas
Mark Towe
Chief Executive Officer
Doug Black
President & Chief
Operating Officer
Michael O’Driscoll
Chief Financial Officer
Gary Hickman
Senior Vice President Tax &
Risk Management
Michael Lynch
Executive Vice President
Development
Bill Miller
Vice President & General
Counsel
Joe Myers
President
Building Solutions
Mark Schack
Executive Vice President
Talent Management
North America
Materials
Randy Lake
Chief Executive Officer
Charles Brown
Chief Financial Officer
Pascal Convers
Senior Vice President
Development
John Keating
President & Chief Operating
Officer, East
Doug Radabaugh
Chief Financial Officer, East
John Parson
President & Chief Operating
Officer, West
Jeff Schaffer
Executive Vice President,
West
Northeast
Chris Madden
President
Northeast Division
Christian Zimmermann
President
New England North
Dan Stover
President
New England South
John Cooney, Jr.
President
New York Region
George Thompson
Chairman
Tilcon New Jersey
Sean O’Sullivan
President
Tilcon New Jersey
William Stavola
President
Trap Rock
Central
John Powers
President
Central Division
Ty Nofziger
President
Shelly
Gregg Campbell
President
Michigan Paving & Material
Mid-Atlantic
Dan Cooperrider
President
Mid-Atlantic Division
Mark Snyder
President
MidA
Willie Crane
President
AMG – North
Kevin Bragg
President
AMG – South
Southeast
Rob Duke
President
Southeast Division
David Church
President
Mid-South Materials
Northwest
Jim Gauger
President
Northwest Division
Mark Murphy
Vice President
East Region
Craig Mayfield
Vice President
Central Region
Mountain West
Scott Parson
President
Mountain West Division
Randy Anderson
President
Staker Parson North
Michael Kurz
President
Staker Parson South
Rich Umbel
President
Southwest Region
Bob Rowberry
President
Jack B. Parson
Central West
Kirk Randolph
President
Central West Division
Chris Lodge
President
AR/OK & TN/MS
Raymond Lane
President
Texas Region
Craig Lamberty
President
Midwest Region
Building Products
Keith Haas
Chief Executive Officer
Paul Valentine
Chief Financial Officer
Doug Crawford
Vice President Development
& Strategy
Architectural Products
Rick Mergens
President
Mike Schaeffer
Chief Financial Officer
Tim Ortman
President
Masonry & Hardscapes
Eoin Lehane
President
National Group
Peter Kiley
Executive Vice President
Strategic Sales
Precast
Dave Steevens
President
Bob Quinn
Chief Administrative Officer
Eric Farinha
Chief Financial Officer
BuildingEnvelope™
Ted Hathaway
Chief Executive Officer
Brian Reilly
Chief Administrative Officer
Jim Avanzini
Chief Operating Officer
Architectural Glass &
Storefronts
Mary Carol Witry
Chief Operating Officer
Engineered Glazing Systems
Distribution
Robert Feury, Jr.
Chief Executive Officer
Frank Furia
Chief Financial Officer
Jamie Kutzer
Chief Administrative Officer
John McLaughlin
President
Exterior Products
Ron Pilla
President
Interior Products
South America
Juan Carlos Girotti
Managing Director
CRH Sudamericana &
Canteras Cerro Negro
Bernardo Alamos
Managing Director
Vidrios Dell Orto & South
American Glass Group
Federico Ferro
Managing Director
Cormela
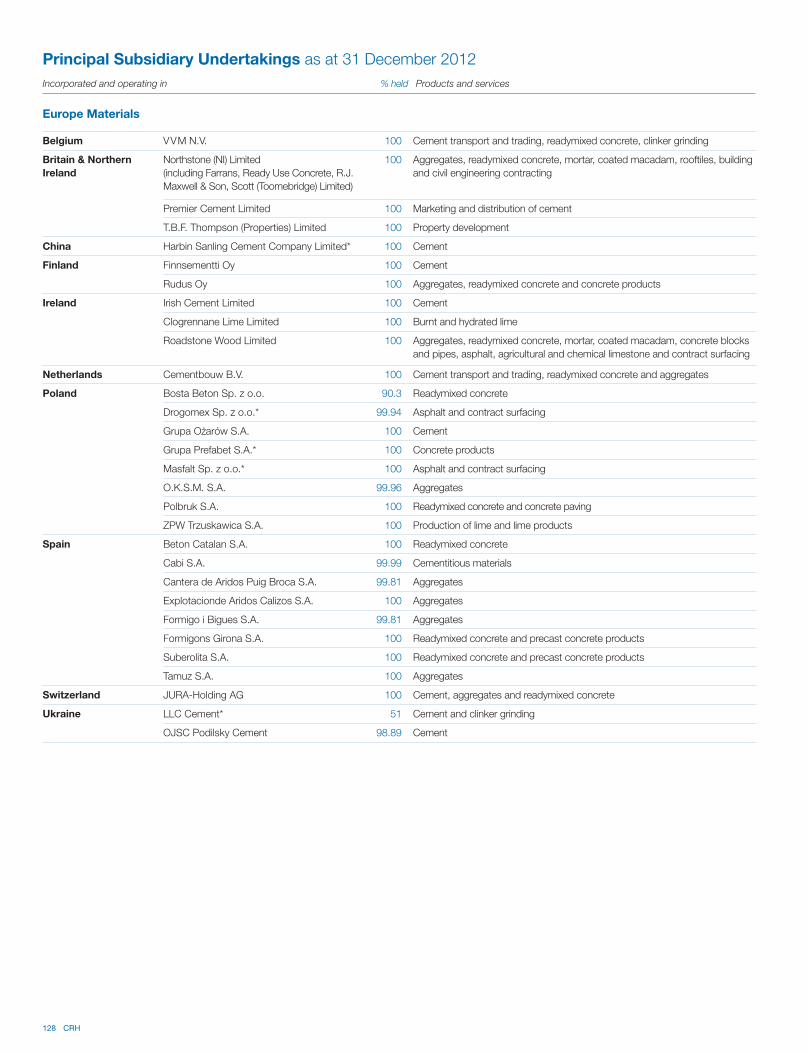
128 CRH
Belgium VVM N.V. 100 Cement transport and trading, readymixed concrete, clinker grinding
Britain & Northern
Ireland
Northstone (NI) Limited
(including Farrans, Ready Use Concrete, R.J.
Maxwell & Son, Scott (Toomebridge) Limited)
100 Aggregates, readymixed concrete, mortar, coated macadam, rooftiles, building
and civil engineering contracting
Premier Cement Limited 100 Marketing and distribution of cement
T.B.F. Thompson (Properties) Limited 100 Property development
China Harbin Sanling Cement Company Limited* 100 Cement
Finland Finnsementti Oy 100 Cement
Rudus Oy 100 Aggregates, readymixed concrete and concrete products
Ireland Irish Cement Limited 100 Cement
Clogrennane Lime Limited 100 Burnt and hydrated lime
Roadstone Wood Limited 100 Aggregates, readymixed concrete, mortar, coated macadam, concrete blocks
and pipes, asphalt, agricultural and chemical limestone and contract surfacing
Netherlands Cementbouw B.V. 100 Cement transport and trading, readymixed concrete and aggregates
Poland Bosta Beton Sp. z o.o. 90.3 Readymixed concrete
Drogomex Sp. z o.o.* 99.94 Asphalt and contract surfacing
Grupa O.z arów S.A. 100 Cement
Grupa Prefabet S.A.* 100 Concrete products
Masfalt Sp. z o.o.* 100 Asphalt and contract surfacing
O.K.S.M. S.A. 99.96 Aggregates
Polbruk S.A. 100 Readymixed concrete and concrete paving
ZPW Trzuskawica S.A. 100 Production of lime and lime products
Spain Beton Catalan S.A. 100 Readymixed concrete
Cabi S.A. 99.99 Cementitious materials
Cantera de Aridos Puig Broca S.A. 99.81 Aggregates
Explotacionde Aridos Calizos S.A. 100 Aggregates
Formigo i Bigues S.A. 99.81 Aggregates
Formigons Girona S.A. 100 Readymixed concrete and precast concrete products
Suberolita S.A. 100 Readymixed concrete and precast concrete products
Tamuz S.A. 100 Aggregates
Switzerland JURA-Holding AG 100 Cement, aggregates and readymixed concrete
Ukraine LLC Cement* 51 Cement and clinker grinding
OJSC Podilsky Cement 98.89 Cement
Incorporated and operating in % held Products and services
Europe Materials
Principal Subsidiary Undertakings as at 31 December 2012
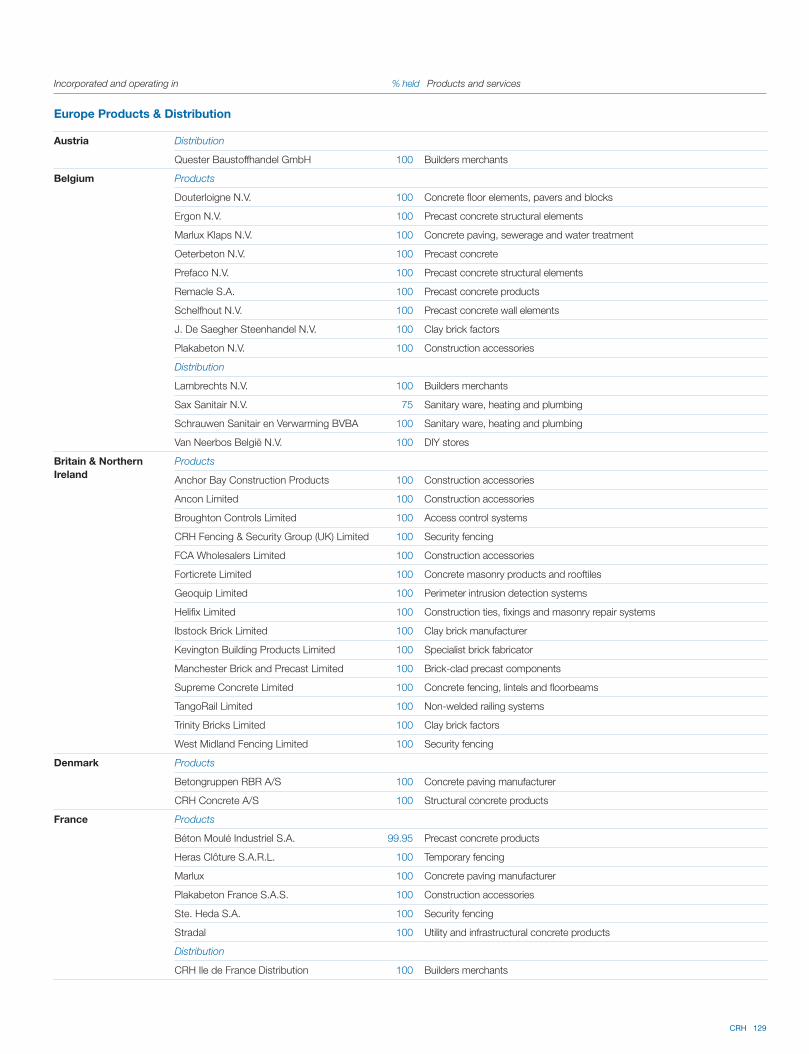
CRH 129
Austria Distribution
Quester Baustoffhandel GmbH 100 Builders merchants
Belgium Products
Douterloigne N.V. 100 Concrete floor elements, pavers and blocks
Ergon N.V. 100 Precast concrete structural elements
Marlux Klaps N.V. 100 Concrete paving, sewerage and water treatment
Oeterbeton N.V. 100 Precast concrete
Prefaco N.V. 100 Precast concrete structural elements
Remacle S.A. 100 Precast concrete products
Schelfhout N.V. 100 Precast concrete wall elements
J. De Saegher Steenhandel N.V. 100 Clay brick factors
Plakabeton N.V. 100 Construction accessories
Distribution
Lambrechts N.V. 100 Builders merchants
Sax Sanitair N.V. 75 Sanitary ware, heating and plumbing
Schrauwen Sanitair en Verwarming BVBA 100 Sanitary ware, heating and plumbing
Van Neerbos België N.V. 100 DIY stores
Britain & Northern
Ireland
Products
Anchor Bay Construction Products 100 Construction accessories
Ancon Limited 100 Construction accessories
Broughton Controls Limited 100 Access control systems
CRH Fencing & Security Group (UK) Limited 100 Security fencing
FCA Wholesalers Limited 100 Construction accessories
Forticrete Limited 100 Concrete masonry products and rooftiles
Geoquip Limited 100 Perimeter intrusion detection systems
Helifix Limited 100 Construction ties, fixings and masonry repair systems
Ibstock Brick Limited 100 Clay brick manufacturer
Kevington Building Products Limited 100 Specialist brick fabricator
Manchester Brick and Precast Limited 100 Brick-clad precast components
Supreme Concrete Limited 100 Concrete fencing, lintels and floorbeams
TangoRail Limited 100 Non-welded railing systems
Trinity Bricks Limited 100 Clay brick factors
West Midland Fencing Limited 100 Security fencing
Denmark Products
Betongruppen RBR A/S 100 Concrete paving manufacturer
CRH Concrete A/S 100 Structural concrete products
France Products
Béton Moulé Industriel S.A. 99.95 Precast concrete products
Heras Clôture S.A.R.L. 100 Temporary fencing
Marlux 100 Concrete paving manufacturer
Plakabeton France S.A.S. 100 Construction accessories
Ste. Heda S.A. 100 Security fencing
Stradal 100 Utility and infrastructural concrete products
Distribution
CRH Ile de France Distribution 100 Builders merchants
Incorporated and operating in % held Products and services
Europe Products & Distribution
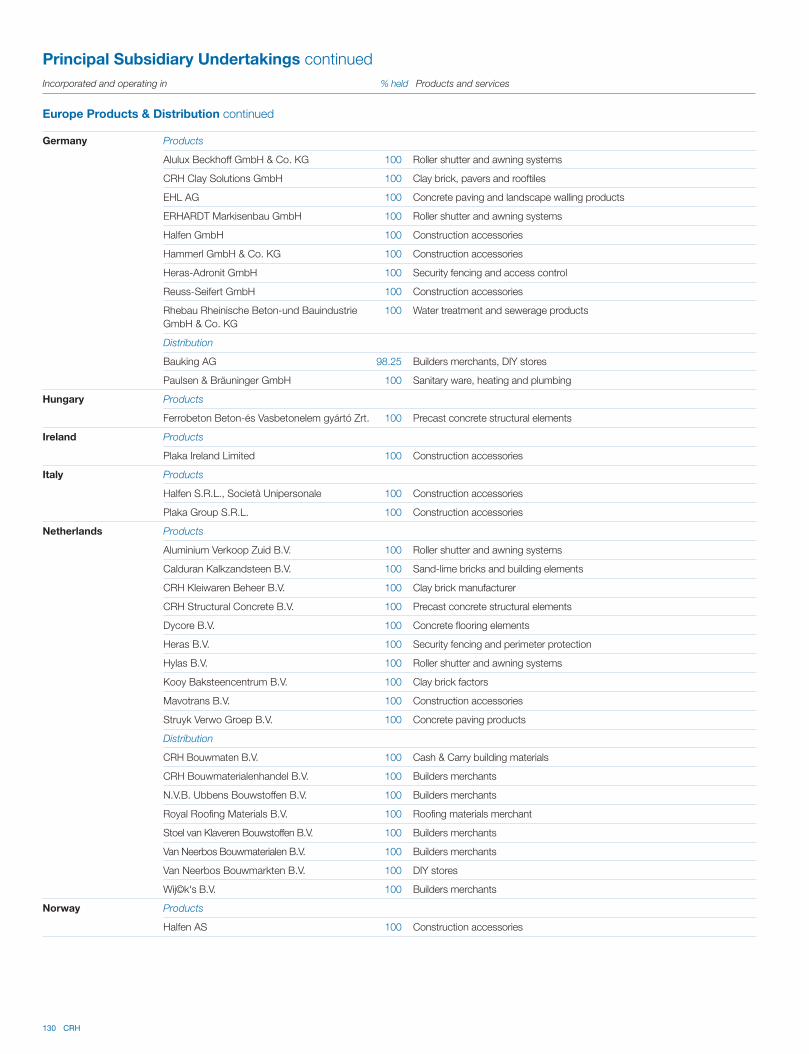
130 CRH
Germany Products
Alulux Beckhoff GmbH & Co. KG 100 Roller shutter and awning systems
CRH Clay Solutions GmbH 100 Clay brick, pavers and rooftiles
EHL AG 100 Concrete paving and landscape walling products
ERHARDT Markisenbau GmbH 100 Roller shutter and awning systems
Halfen GmbH 100 Construction accessories
Hammerl GmbH & Co. KG 100 Construction accessories
Heras-Adronit GmbH 100 Security fencing and access control
Reuss-Seifert GmbH 100 Construction accessories
Rhebau Rheinische Beton-und Bauindustrie
GmbH & Co. KG
100 Water treatment and sewerage products
Distribution
Bauking AG 98.25 Builders merchants, DIY stores
Paulsen & Bräuninger GmbH 100 Sanitary ware, heating and plumbing
Hungary Products
Ferrobeton Beton-és Vasbetonelem gyártó Zrt. 100 Precast concrete structural elements
Ireland Products
Plaka Ireland Limited 100 Construction accessories
Italy Products
Halfen S.R.L., Società Unipersonale 100 Construction accessories
Plaka Group S.R.L. 100 Construction accessories
Netherlands Products
Aluminium Verkoop Zuid B.V. 100 Roller shutter and awning systems
Calduran Kalkzandsteen B.V. 100 Sand-lime bricks and building elements
CRH Kleiwaren Beheer B.V. 100 Clay brick manufacturer
CRH Structural Concrete B.V. 100 Precast concrete structural elements
Dycore B.V. 100 Concrete flooring elements
Heras B.V. 100 Security fencing and perimeter protection
Hylas B.V. 100 Roller shutter and awning systems
Kooy Baksteencentrum B.V. 100 Clay brick factors
Mavotrans B.V. 100 Construction accessories
Struyk Verwo Groep B.V. 100 Concrete paving products
Distribution
CRH Bouwmaten B.V. 100 Cash & Carry building materials
CRH Bouwmaterialenhandel B.V. 100 Builders merchants
N.V.B. Ubbens Bouwstoffen B.V. 100 Builders merchants
Royal Roofing Materials B.V. 100 Roofing materials merchant
Stoel van Klaveren Bouwstoffen B.V. 100 Builders merchants
Van Neerbos Bouwmaterialen B.V. 100 Builders merchants
Van Neerbos Bouwmarkten B.V. 100 DIY stores
Wij©k's B.V. 100 Builders merchants
Norway Products
Halfen AS 100 Construction accessories
Incorporated and operating in % held Products and services
Europe Products & Distribution continued
Principal Subsidiary Undertakings continued
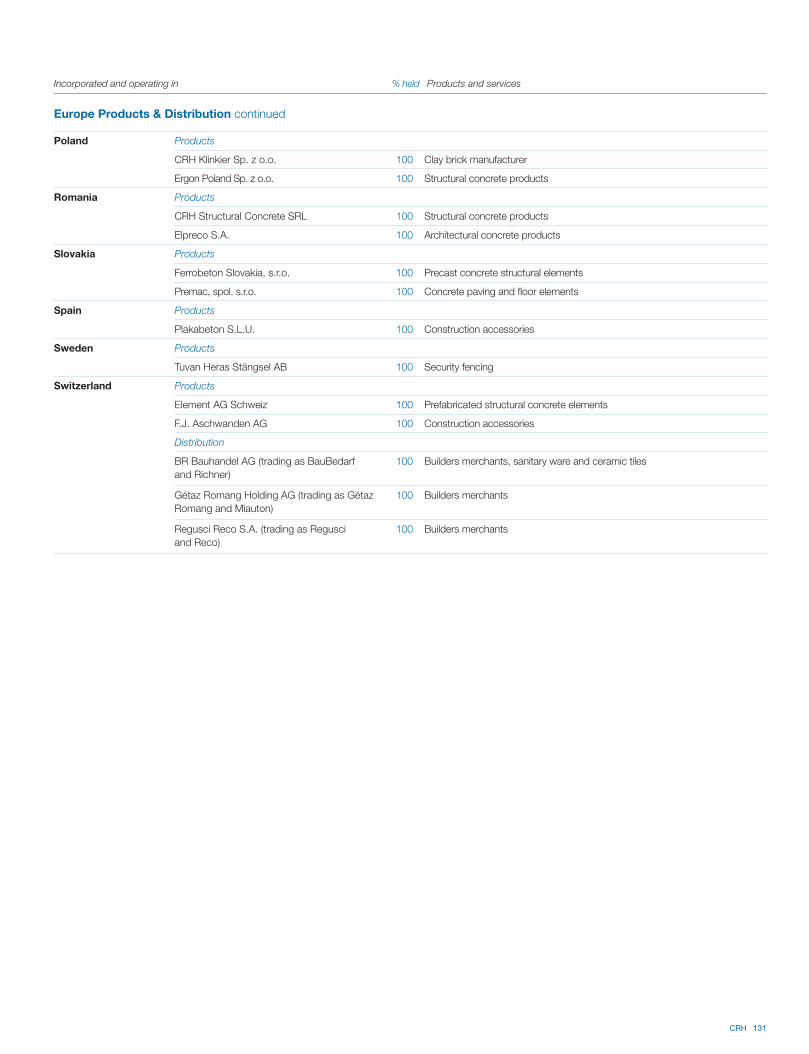
CRH 131
Incorporated and operating in % held Products and services
Europe Products & Distribution continued
Poland Products
CRH Klinkier Sp. z o.o. 100 Clay brick manufacturer
Ergon Poland Sp. z o.o. 100 Structural concrete products
Romania Products
CRH Structural Concrete SRL 100 Structural concrete products
Elpreco S.A. 100 Architectural concrete products
Slovakia Products
Ferrobeton Slovakia, s.r.o. 100 Precast concrete structural elements
Premac, spol. s.r.o. 100 Concrete paving and floor elements
Spain Products
Plakabeton S.L.U. 100 Construction accessories
Sweden Products
Tuvan Heras Stängsel AB 100 Security fencing
Switzerland Products
Element AG Schweiz 100 Prefabricated structural concrete elements
F.J. Aschwanden AG 100 Construction accessories
Distribution
BR Bauhandel AG (trading as BauBedarf
and Richner)
100 Builders merchants, sanitary ware and ceramic tiles
Gétaz Romang Holding AG (trading as Gétaz
Romang and Miauton)
100 Builders merchants
Regusci Reco S.A. (trading as Regusci
and Reco)
100 Builders merchants
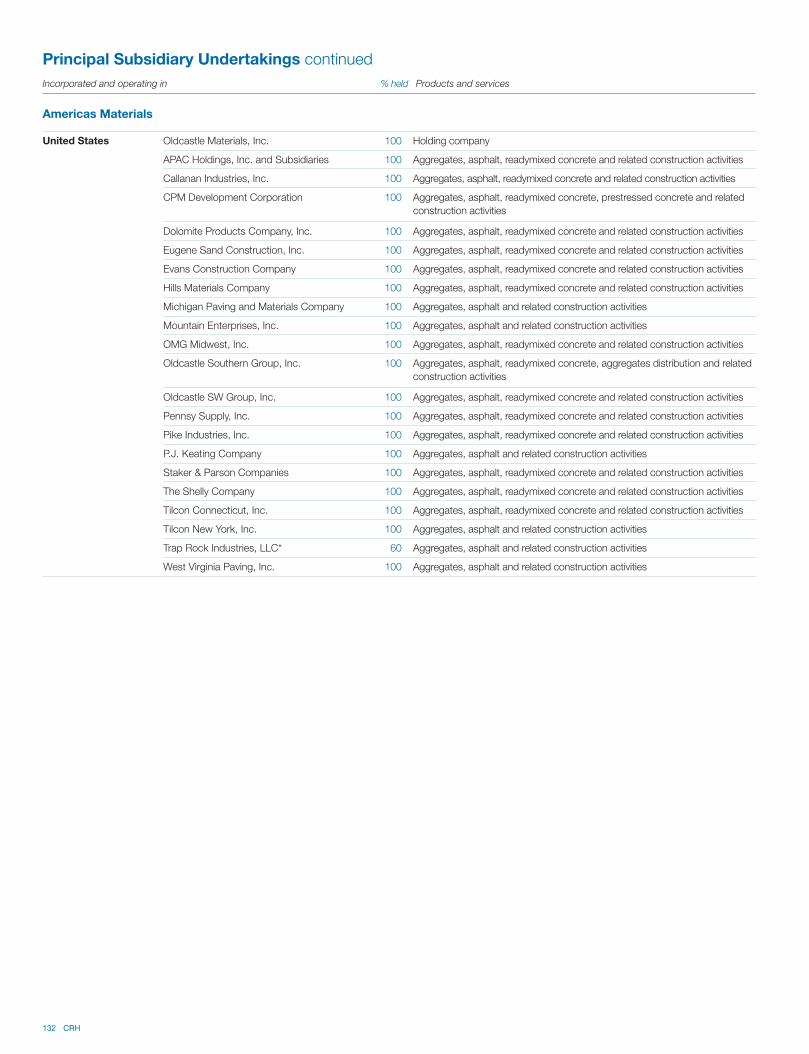
132 CRH
Incorporated and operating in % held Products and services
Americas Materials
Principal Subsidiary Undertakings continued
United States Oldcastle Materials, Inc. 100 Holding company
APAC Holdings, Inc. and Subsidiaries 100 Aggregates, asphalt, readymixed concrete and related construction activities
Callanan Industries, Inc. 100 Aggregates, asphalt, readymixed concrete and related construction activities
CPM Development Corporation 100 Aggregates, asphalt, readymixed concrete, prestressed concrete and related
construction activities
Dolomite Products Company, Inc. 100 Aggregates, asphalt, readymixed concrete and related construction activities
Eugene Sand Construction, Inc. 100 Aggregates, asphalt, readymixed concrete and related construction activities
Evans Construction Company 100 Aggregates, asphalt, readymixed concrete and related construction activities
Hills Materials Company 100 Aggregates, asphalt, readymixed concrete and related construction activities
Michigan Paving and Materials Company 100 Aggregates, asphalt and related construction activities
Mountain Enterprises, Inc. 100 Aggregates, asphalt and related construction activities
OMG Midwest, Inc. 100 Aggregates, asphalt, readymixed concrete and related construction activities
Oldcastle Southern Group, Inc. 100 Aggregates, asphalt, readymixed concrete, aggregates distribution and related
construction activities
Oldcastle SW Group, Inc. 100 Aggregates, asphalt, readymixed concrete and related construction activities
Pennsy Supply, Inc. 100 Aggregates, asphalt, readymixed concrete and related construction activities
Pike Industries, Inc. 100 Aggregates, asphalt, readymixed concrete and related construction activities
P.J. Keating Company 100 Aggregates, asphalt and related construction activities
Staker & Parson Companies 100 Aggregates, asphalt, readymixed concrete and related construction activities
The Shelly Company 100 Aggregates, asphalt, readymixed concrete and related construction activities
Tilcon Connecticut, Inc. 100 Aggregates, asphalt, readymixed concrete and related construction activities
Tilcon New York, Inc. 100 Aggregates, asphalt and related construction activities
Trap Rock Industries, LLC* 60 Aggregates, asphalt and related construction activities
West Virginia Paving, Inc. 100 Aggregates, asphalt and related construction activities
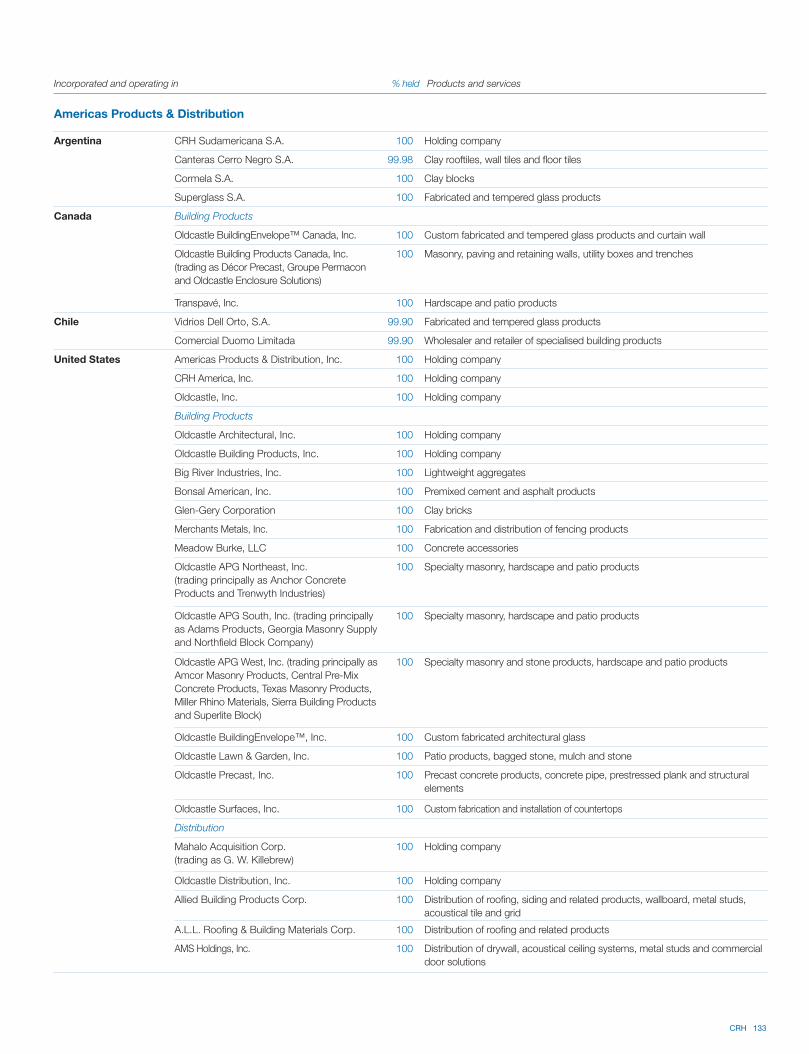
CRH 133
Incorporated and operating in % held Products and services
Americas Products & Distribution
Argentina CRH Sudamericana S.A. 100 Holding company
Canteras Cerro Negro S.A. 99.98 Clay rooftiles, wall tiles and floor tiles
Cormela S.A. 100 Clay blocks
Superglass S.A. 100 Fabricated and tempered glass products
Canada Building Products
Oldcastle BuildingEnvelope™ Canada, Inc. 100 Custom fabricated and tempered glass products and curtain wall
Oldcastle Building Products Canada, Inc.
(trading as Décor Precast, Groupe Permacon
and Oldcastle Enclosure Solutions)
100 Masonry, paving and retaining walls, utility boxes and trenches
Transpavé, Inc. 100 Hardscape and patio products
Chile Vidrios Dell Orto, S.A. 99.90 Fabricated and tempered glass products
Comercial Duomo Limitada 99.90 Wholesaler and retailer of specialised building products
United States Americas Products & Distribution, Inc. 100 Holding company
CRH America, Inc. 100 Holding company
Oldcastle, Inc. 100 Holding company
Building Products
Oldcastle Architectural, Inc. 100 Holding company
Oldcastle Building Products, Inc. 100 Holding company
Big River Industries, Inc. 100 Lightweight aggregates
Bonsal American, Inc. 100 Premixed cement and asphalt products
Glen-Gery Corporation 100 Clay bricks
Merchants Metals, Inc. 100 Fabrication and distribution of fencing products
Meadow Burke, LLC 100 Concrete accessories
Oldcastle APG Northeast, Inc.
(trading principally as Anchor Concrete
Products and Trenwyth Industries)
100 Specialty masonry, hardscape and patio products
Oldcastle APG South, Inc. (trading principally
as Adams Products, Georgia Masonry Supply
and Northfield Block Company)
100 Specialty masonry, hardscape and patio products
Oldcastle APG West, Inc. (trading principally as
Amcor Masonry Products, Central Pre-Mix
Concrete Products, Texas Masonry Products,
Miller Rhino Materials, Sierra Building Products
and Superlite Block)
100 Specialty masonry and stone products, hardscape and patio products
Oldcastle BuildingEnvelope™, Inc. 100 Custom fabricated architectural glass
Oldcastle Lawn & Garden, Inc. 100 Patio products, bagged stone, mulch and stone
Oldcastle Precast, Inc. 100 Precast concrete products, concrete pipe, prestressed plank and structural
elements
Oldcastle Surfaces, Inc. 100 Custom fabrication and installation of countertops
Distribution
Mahalo Acquisition Corp.
(trading as G. W. Killebrew)
100 Holding company
Oldcastle Distribution, Inc. 100 Holding company
Allied Building Products Corp. 100 Distribution of roofing, siding and related products, wallboard, metal studs,
acoustical tile and grid
A.L.L. Roofing & Building Materials Corp. 100 Distribution of roofing and related products
AMS Holdings, Inc. 100 Distribution of drywall, acoustical ceiling systems, metal studs and commercial
door solutions
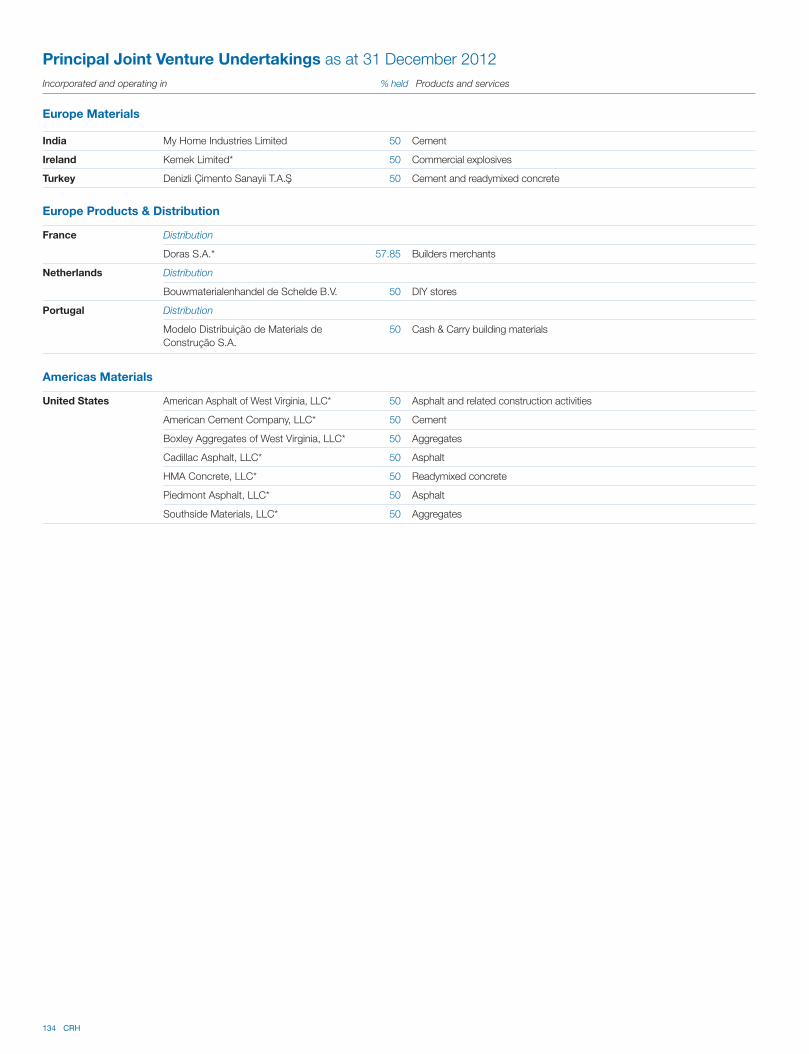
134 CRH
India My Home Industries Limited 50 Cement
Ireland Kemek Limited* 50 Commercial explosives
Turkey Denizli Çimento Sanayii T.A. . 50 Cement and readymixed concrete
Europe Products & Distribution
France Distribution
Doras S.A.* 57.85 Builders merchants
Netherlands Distribution
Bouwmaterialenhandel de Schelde B.V. 50 DIY stores
Portugal Distribution
Modelo Distribuição de Materials de
Construção S.A.
50 Cash & Carry building materials
Americas Materials
United States American Asphalt of West Virginia, LLC* 50 Asphalt and related construction activities
American Cement Company, LLC* 50 Cement
Boxley Aggregates of West Virginia, LLC* 50 Aggregates
Cadillac Asphalt, LLC* 50 Asphalt
HMA Concrete, LLC* 50 Readymixed concrete
Piedmont Asphalt, LLC* 50 Asphalt
Southside Materials, LLC* 50 Aggregates
Incorporated and operating in % held Products and services
Europe Materials
Principal Joint Venture Undertakings as at 31 December 2012
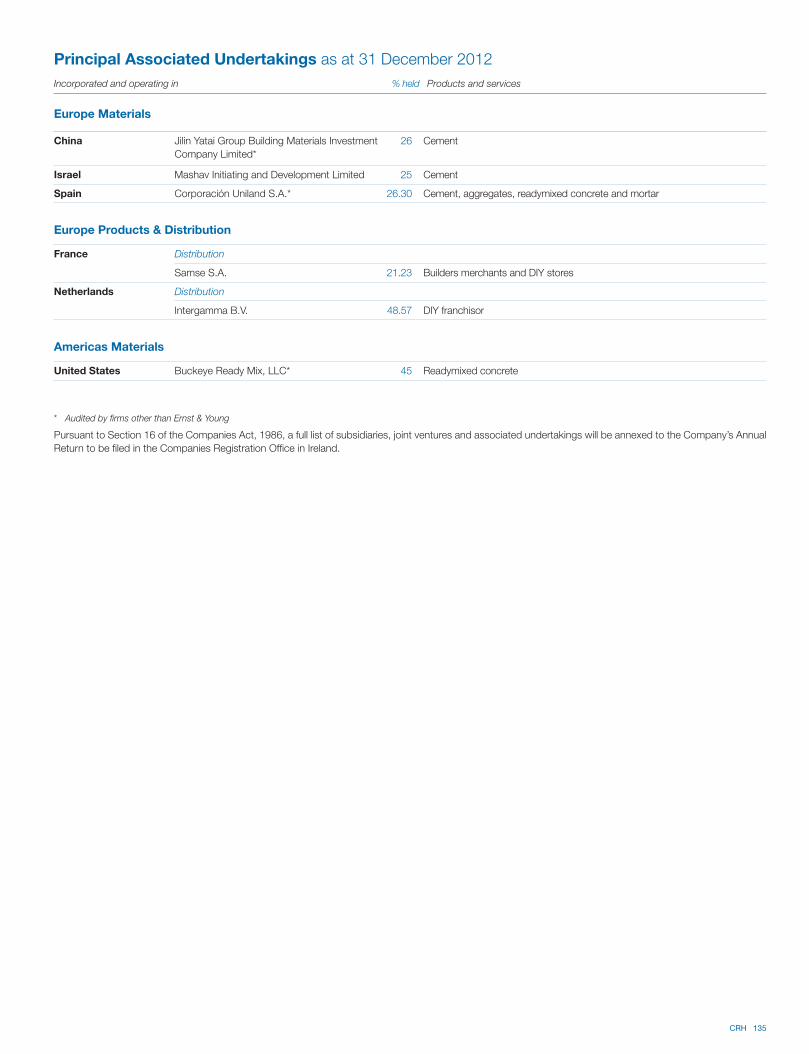
CRH 135
China Jilin Yatai Group Building Materials Investment
Company Limited*
26 Cement
Israel Mashav Initiating and Development Limited 25 Cement
Spain Corporación Uniland S.A.* 26.30 Cement, aggregates, readymixed concrete and mortar
Europe Products & Distribution
France Distribution
Samse S.A. 21.23 Builders merchants and DIY stores
Netherlands Distribution
Intergamma B.V. 48.57 DIY franchisor
Americas Materials
United States Buckeye Ready Mix, LLC* 45 Readymixed concrete
* Audited by firms other than Ernst & Young
Pursuant to Section 16 of the Companies Act, 1986, a full list of subsidiaries, joint ventures and associated undertakings will be annexed to the Company’s Annual
Return to be filed in the Companies Registration Office in Ireland.
Incorporated and operating in % held Products and services
Europe Materials
Principal Associated Undertakings as at 31 December 2012
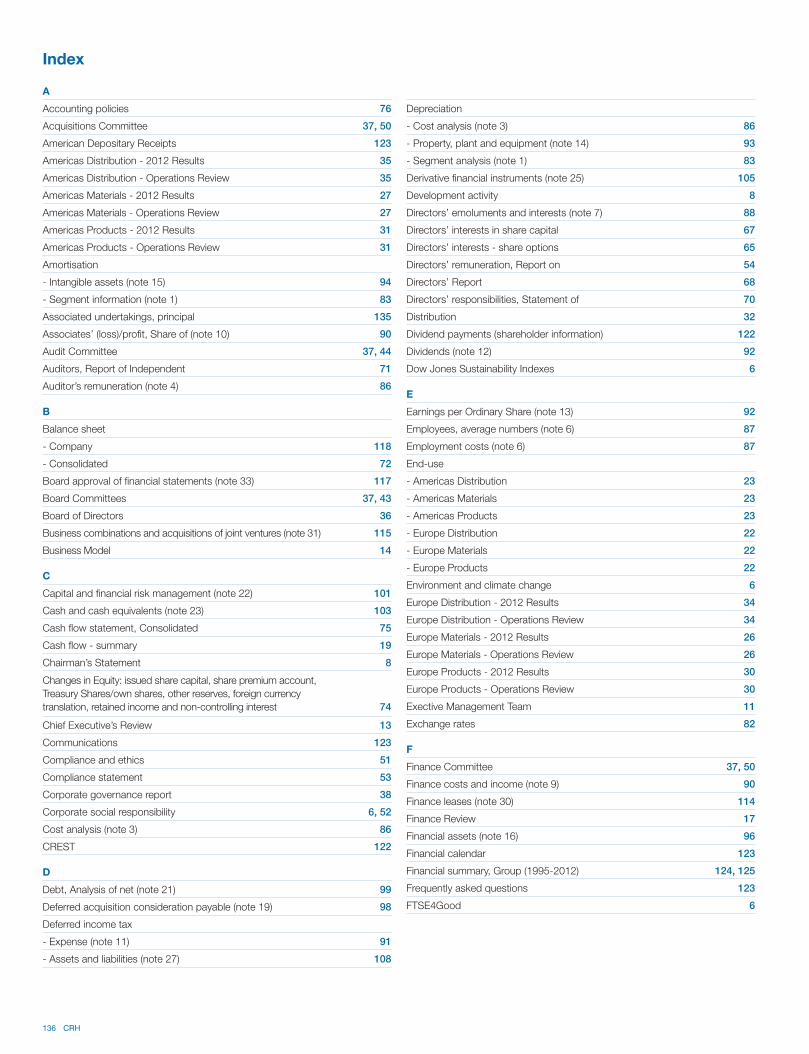
136 CRH
Index
A
Accounting policies 76
Acquisitions Committee 37, 50
American Depositary Receipts 123
Americas Distribution - 2012 Results 35
Americas Distribution - Operations Review 35
Americas Materials - 2012 Results 27
Americas Materials - Operations Review 27
Americas Products - 2012 Results 31
Americas Products - Operations Review 31
Amortisation
- Intangible assets (note 15) 94
- Segment information (note 1) 83
Associated undertakings, principal 135
Associates’ (loss)/profit, Share of (note 10) 90
Audit Committee 37, 44
Auditors, Report of Independent 71
Auditor’s remuneration (note 4) 86
B
Balance sheet
- Company 118
- Consolidated 72
Board approval of financial statements (note 33) 117
Board Committees 37, 43
Board of Directors 36
Business combinations and acquisitions of joint ventures (note 31) 115
Business Model 14
C
Capital and financial risk management (note 22) 101
Cash and cash equivalents (note 23) 103
Cash flow statement, Consolidated 75
Cash flow - summary 19
Chairman’s Statement 8
Changes in Equity: issued share capital, share premium account,
Treasury Shares/own shares, other reserves, foreign currency
translation, retained income and non-controlling interest 74
Chief Executive’s Review 13
Communications 123
Compliance and ethics 51
Compliance statement 53
Corporate governance report 38
Corporate social responsibility 6, 52
Cost analysis (note 3) 86
CREST 122
D
Debt, Analysis of net (note 21) 99
Deferred acquisition consideration payable (note 19) 98
Deferred income tax
- Expense (note 11) 91
- Assets and liabilities (note 27) 108
Depreciation
- Cost analysis (note 3) 86
- Property, plant and equipment (note 14) 93
- Segment analysis (note 1) 83
Derivative financial instruments (note 25) 105
Development activity 8
Directors’ emoluments and interests (note 7) 88
Directors’ interests in share capital 67
Directors’ interests - share options 65
Directors’ remuneration, Report on 54
Directors’ Report 68
Directors’ responsibilities, Statement of 70
Distribution 32
Dividend payments (shareholder information) 122
Dividends (note 12) 92
Dow Jones Sustainability Indexes 6
E
Earnings per Ordinary Share (note 13) 92
Employees, average numbers (note 6) 87
Employment costs (note 6) 87
End-use
- Americas Distribution 23
- Americas Materials 23
- Americas Products 23
- Europe Distribution 22
- Europe Materials 22
- Europe Products 22
Environment and climate change 6
Europe Distribution - 2012 Results 34
Europe Distribution - Operations Review 34
Europe Materials - 2012 Results 26
Europe Materials - Operations Review 26
Europe Products - 2012 Results 30
Europe Products - Operations Review 30
Exective Management Team 11
Exchange rates 82
F
Finance Committee 37, 50
Finance costs and income (note 9) 90
Finance leases (note 30) 114
Finance Review 17
Financial assets (note 16) 96
Financial calendar 123
Financial summary, Group (1995-2012) 124, 125
Frequently asked questions 123
FTSE4Good 6
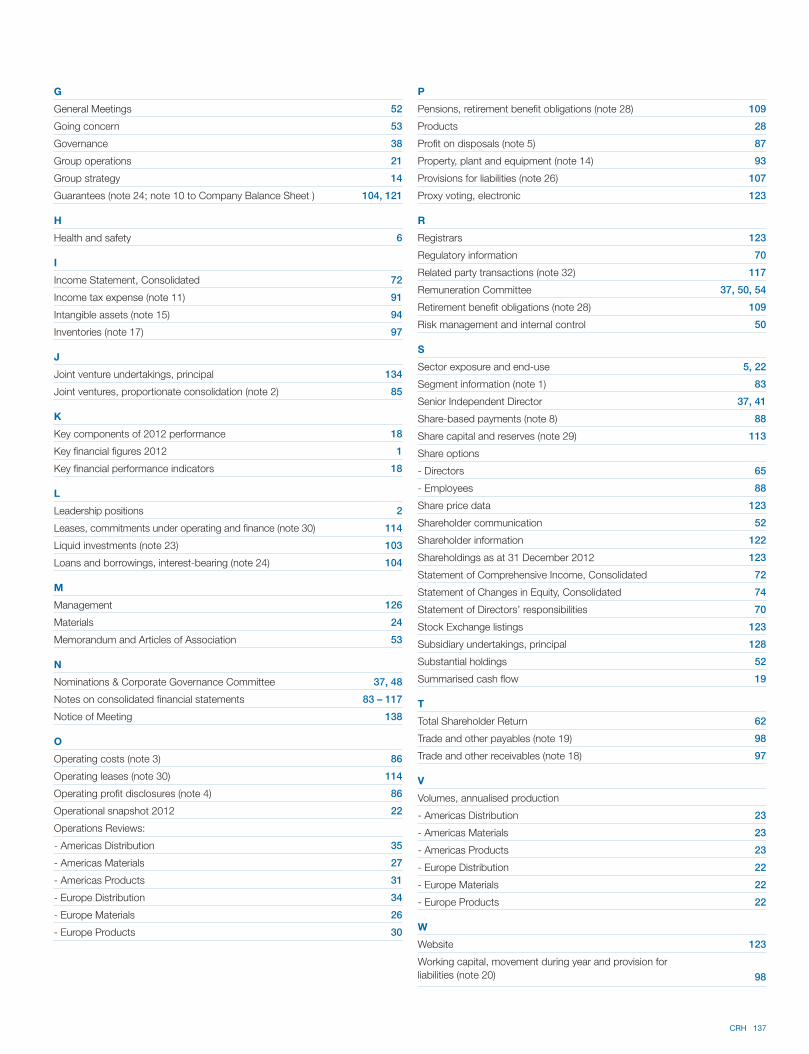
CRH 137
G
General Meetings 52
Going concern 53
Governance 38
Group operations 21
Group strategy 14
Guarantees (note 24; note 10 to Company Balance Sheet ) 104, 121
H
Health and safety 6
I
Income Statement, Consolidated 72
Income tax expense (note 11) 91
Intangible assets (note 15) 94
Inventories (note 17) 97
J
Joint venture undertakings, principal 134
Joint ventures, proportionate consolidation (note 2) 85
K
Key components of 2012 performance 18
Key financial figures 2012 1
Key financial performance indicators 18
L
Leadership positions 2
Leases, commitments under operating and finance (note 30) 114
Liquid investments (note 23) 103
Loans and borrowings, interest-bearing (note 24) 104
M
Management 126
Materials 24
Memorandum and Articles of Association 53
N
Nominations & Corporate Governance Committee 37, 48
Notes on consolidated financial statements 83 – 117
Notice of Meeting 138
O
Operating costs (note 3) 86
Operating leases (note 30) 114
Operating profit disclosures (note 4) 86
Operational snapshot 2012 22
Operations Reviews:
- Americas Distribution 35
- Americas Materials 27
- Americas Products 31
- Europe Distribution 34
- Europe Materials 26
- Europe Products 30
P
Pensions, retirement benefit obligations (note 28) 109
Products 28
Profit on disposals (note 5) 87
Property, plant and equipment (note 14) 93
Provisions for liabilities (note 26) 107
Proxy voting, electronic 123
R
Registrars 123
Regulatory information 70
Related party transactions (note 32) 117
Remuneration Committee 37, 50, 54
Retirement benefit obligations (note 28) 109
Risk management and internal control 50
S
Sector exposure and end-use 5, 22
Segment information (note 1) 83
Senior Independent Director 37, 41
Share-based payments (note 8) 88
Share capital and reserves (note 29) 113
Share options
- Directors 65
- Employees 88
Share price data 123
Shareholder communication 52
Shareholder information 122
Shareholdings as at 31 December 2012 123
Statement of Comprehensive Income, Consolidated 72
Statement of Changes in Equity, Consolidated 74
Statement of Directors’ responsibilities 70
Stock Exchange listings 123
Subsidiary undertakings, principal 128
Substantial holdings 52
Summarised cash flow 19
T
Total Shareholder Return 62
Trade and other payables (note 19) 98
Trade and other receivables (note 18) 97
V
Volumes, annualised production
- Americas Distribution 23
- Americas Materials 23
- Americas Products 23
- Europe Distribution 22
- Europe Materials 22
- Europe Products 22
W
Website 123
Working capital, movement during year and provision for
liabilities (note 20) 98
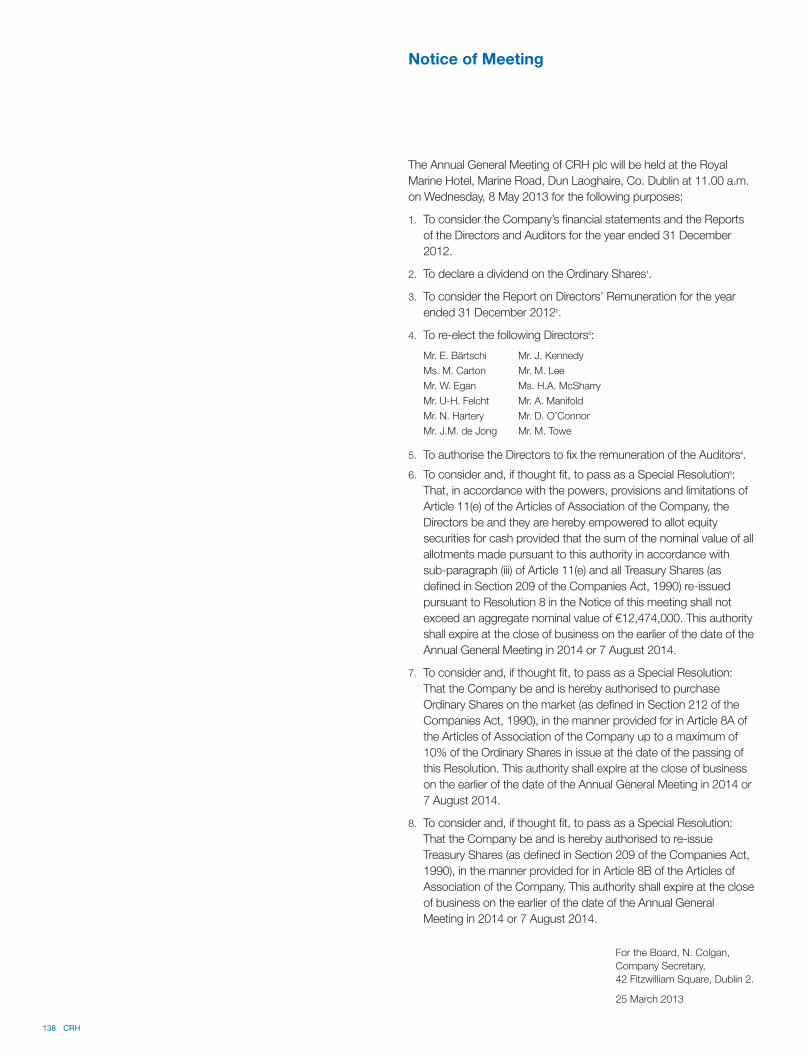
138 CRH
The Annual General Meeting of CRH plc will be held at the Royal
Marine Hotel, Marine Road, Dun Laoghaire, Co. Dublin at 11.00 a.m.
on Wednesday, 8 May 2013 for the following purposes:
1. To consider the Company’s financial statements and the Reports
of the Directors and Auditors for the year ended 31 December
2012.
2. To declare a dividend on the Ordinary Shares1.
3. To consider the Report on Directors’ Remuneration for the year
ended 31 December 20122.
4. To re-elect the following Directors3:
Mr. E. Bärtschi Mr. J. Kennedy
Ms. M. Carton Mr. M. Lee
Mr. W. Egan Ms. H.A. McSharry
Mr. U-H. Felcht Mr. A. Manifold
Mr. N. Hartery Mr. D. O’Connor
Mr. J.M. de Jong Mr. M. Towe
5. To authorise the Directors to fix the remuneration of the Auditors4.
6. To consider and, if thought fit, to pass as a Special Resolution5:
That, in accordance with the powers, provisions and limitations of
Article 11(e) of the Articles of Association of the Company, the
Directors be and they are hereby empowered to allot equity
securities for cash provided that the sum of the nominal value of all
allotments made pursuant to this authority in accordance with
sub-paragraph (iii) of Article 11(e) and all Treasury Shares (as
defined in Section 209 of the Companies Act, 1990) re-issued
pursuant to Resolution 8 in the Notice of this meeting shall not
exceed an aggregate nominal value of €12,474,000. This authority
shall expire at the close of business on the earlier of the date of the
Annual General Meeting in 2014 or 7 August 2014.
7. To consider and, if thought fit, to pass as a Special Resolution:
That the Company be and is hereby authorised to purchase
Ordinary Shares on the market (as defined in Section 212 of the
Companies Act, 1990), in the manner provided for in Article 8A of
the Articles of Association of the Company up to a maximum of
10% of the Ordinary Shares in issue at the date of the passing of
this Resolution. This authority shall expire at the close of business
on the earlier of the date of the Annual General Meeting in 2014 or
7 August 2014.
8. To consider and, if thought fit, to pass as a Special Resolution:
That the Company be and is hereby authorised to re-issue
Treasury Shares (as defined in Section 209 of the Companies Act,
1990), in the manner provided for in Article 8B of the Articles of
Association of the Company. This authority shall expire at the close
of business on the earlier of the date of the Annual General
Meeting in 2014 or 7 August 2014.
Notice of Meeting
For the Board, N. Colgan,
Company Secretary,
42 Fitzwilliam Square, Dublin 2.
25 March 2013
(1) The final dividend, if approved, will be paid on the Ordinary Shares on 13 May 2013
to persons who were registered as shareholders at the close of business on 8
March 2013.
(2) Resolution 3 is an advisory resolution and is not binding on the Company.
(3) In accordance with the provisions of the U.K. Corporate Governance Code, all
Directors retire and offer themselves for re-election. Biographical details for each
Director are set out on pages 11, 36 and 37 in the 2012 Annual Report.
(4) Resolution 5 authorises the Directors to fix the remuneration of the Auditors.
Section 162(2) of the Companies Act, 1963 provides that the auditor of an Irish
company shall be automatically re-appointed at a company’s annual general
meeting unless the auditor has given notice in writing of his unwillingness to be
re-appointed or a resolution has been passed at that meeting appointing someone
else or providing expressly that the incumbent auditor shall not be re-appointed.
The Auditors, Ernst & Young, Chartered Accountants, are willing to continue in
office and, accordingly, will be automatically re-appointed at the conclusion of the
2013 Annual General Meeting.
(5) Resolution 6 proposes to renew the Directors’ authority to dis-apply statutory
pre-emption rights in relation to allotments of shares up to a maximum of 5% of the
issued Ordinary/Income share capital of the Company at 25 February 2013. This
limit is in accordance with generally accepted best practice. The Directors intend to
follow the Pre-Emption Group’s Statement of Principles in that allotments of shares
for cash and the re-issue of Treasury Shares on a non pre-emptive basis, other than
for rights issues to ordinary shareholders and employee share schemes, will not
exceed 7.5% of the issued Ordinary/Income share capital within a rolling three year
period without prior consultation with shareholders.
(6) Any member entitled to attend, speak, ask questions and vote at this Meeting may
exercise his or her right to vote by appointing one or more proxies. A member may
appoint the Chairman or another person, who need not be a member(s) of the
Company, as a proxy, by electronic means or in writing, to vote some or all of their
shares. A proxy form is enclosed. Appointment of a proxy does not preclude a
member from attending, speaking and asking questions at the meeting should they
subsequently wish to do so.
(7) To be valid, proxy forms must be delivered in writing, together with any power of
attorney or other authority under which it is signed or a certified copy thereof, to the
Company’s Registrar, Capita Registrars (Ireland) Limited (“Capita Registrars”), to
P.O. Box 7117, Dublin 2 (if delivered by post) or to 2 Grand Canal Square, Dublin 2
(if delivered by hand), not later than 11.00 a.m. on Monday, 6 May 2013.
Shareholders who wish to submit proxies by electronic means may do so up to the
same deadline by accessing the Registrars’ website, www.capitaregistrars.ie and
selecting “Shareholder Portal”. Shareholders who do not receive a proxy form by
post, or who wish to be sent paper copies of documents relating to the meeting,
should contact Capita Registrars (Tel. +353 1 553 0050).
(8) CREST members may appoint one or more proxies through the CREST electronic
proxy appointment service in accordance with the procedures described in the
CREST Manual. CREST Personal Members or other CREST sponsored members
who have appointed a voting service provider(s) should refer to their CREST
sponsor or voting service provider(s), who will be able to take the appropriate action
on their behalf. Further information on CREST procedures and requirements is
contained in the CREST Manual. The message appointing a proxy(ies) must be
received by the Registrar (ID 7RA08) not later than 11.00 a.m. on Monday, 6 May
2013. For this purpose, the time of receipt will be taken to be the time (as
determined by the timestamp generated by the CREST system) from which the
Registrar is able to retrieve the message by enquiry to CREST in the manner
prescribed by CREST. The Company may treat as invalid a proxy instruction in the
circumstances set out in Regulation 35(5)(a) of the Companies Act, 1990
(Uncertificated Securities) Regulations, 1996.
(9) ADR holders wishing to attend the meeting must obtain a proxy form from The Bank
of New York Mellon (BNY), which will enable them to attend and vote on the
business to be transacted. ADR holders may instruct BNY as to the way in which
the shares represented by their ADRs should be voted by completing and returning
the voting card provided by BNY in accordance with the instructions given.
(10) Pursuant to Section 134A of the Companies Act, 1963 and Regulation 14 of the
Companies Act, 1990 (Uncertificated Securities) Regulations, 1996, the Company
hereby specifies that only those shareholders registered in the Register of Members
of the Company as at 6.00 p.m. on Monday, 6 May 2013 shall be entitled to attend,
speak, ask questions and vote at the Annual General Meeting in respect of the
number of shares registered in their name at that time.
(11) Pursuant to Section 133B(1)(a) of the Companies Act, 1963 and subject to any
contrary provision in company law, shareholders, holding at least 3% of the
Company’s issued share capital, or at least 3% of the voting rights, have the right to
put an item on the agenda, or table a draft resolution for an item on the agenda, of a
general meeting. In the case of the 2013 Annual General Meeting, the latest date for
submission of such requests/resolutions will be 27 March 2013. Further information
in relation to shareholders’ rights can be obtained from the CRH website, www.crh.
com.
(12) Shareholders entitled to attend the Annual General Meeting have the right to ask
questions relating to items on the agenda.
(13) Pursuant to Section 138 of the Companies Act, 1963, where a poll is taken at the
Annual General Meeting, a shareholder, present in person or by proxy, holding more
than one share need not cast all his/her votes in the same way.
(14) A copy of this Notice and copies of documentation relating to the 2013 Annual
General Meeting, including proxy forms, are available on the CRH website, www.
crh.com. To access these documents, select AGM under “Equity Investors” in the
Investors section of the website.
CRH 139
The International Building
Materials Group
CRH plc
Belgard Castle
Clondalkin
Dublin 22
Ireland
Telephone: +353 1 404 1000
Fax: +353 1 404 1007
E-mail: [email protected]
Website: www.crh.com
Registered Office
42 Fitzwilliam Square
Dublin 2
Ireland
Telephone: +353 1 634 4340
Fax: +353 1 676 5013
E-mail: [email protected]
CRH® is a registered
trade mark of CRH plc.
Desig
ned
and
pro
duced
by
Lunt
McIn
tyre
. P
rinte
d b
y P
rintR
un.
13/03/2013 09:36

Loaded CSX railcars leave Oldcastle Materials’ newest greenfield
quarry – Warren County – located in Camak, Georgia, USA. With
an annual capacity of 3.2 million tonnes, this quarry serves the
immediate market and, through Conrad Yelvington Distributors, also
serves the broader region including eastern Georgia, coastal South
Carolina and northern Florida by railcar. In addition to Oldcastle
Materials, five other Oldcastle companies were engaged during
the development of the quarry: Georgia Masonry Supply, Merchant
Metals, Oldcastle BuildingEnvelope and Oldcastle Surfaces;
Oldcastle Precast manufactured 3,000 linear feet of reinforced
concrete pipe as well as the concrete rail crossing.
2013_Cover008.indd 1