perched at the mito-nuclear crossroads: divergent mitochondrial lineages correlate with environment...
TRANSCRIPT

Perched at the mito-nuclear crossroads: divergent
mitochondrial lineages correlate with environment in the face of ongoing nuclear gene flow in an Australian bird
Journal: Evolution
Manuscript ID: 12-0536.R2
Manuscript Type: Original Article
Date Submitted by the Author: n/a
Complete List of Authors: Pavlova, Alexandra; Monash University, School of Biological Sciences and
Australian Centre for Biodiversity Amos, Nevil; Monash University, School of Biological Sciences and Australian Centre for Biodiversity Joseph, Leo; CSIRO Australia, Ecosystem Sciences Loynes, Kate; The Australian National University, Division of Evolution, Ecology and Genetics Austin, Jeremy; The University of Adelaide, School of Earth & Environmental Sciences; Museum Victoria, Sciences Department Keogh, Scott; The Australian National University, Evolution, Ecology & Genetics Stone, Graham; University of Edinburgh, Institute of Evolutionary Biology Nicholls, James; University of Edinburgh, Institute of Evolutionary Biology
Sunnucks, Paul; Monash University, School of Biological Sciences and Australian Centre for Biodiversity
Keywords: Gene Flow, Molecular Evolution, Phylogeography, Selection - Natural, Coalescent Theory, Genetic Drift
Evolution: For Review Only

1
PERCHED AT THE MITO-NUCLEAR CROSSROADS: DIVERGENT MITOCHONDRIAL LINEAGES
CORRELATE WITH ENVIRONMENT IN THE FACE OF ONGOING NUCLEAR GENE FLOW IN AN
AUSTRALIAN BIRD
Alexandra Pavlova1, J. Nevil Amos1, Leo Joseph2 , Kate Loynes3, Jeremy J. Austin4,5, J. Scott
Keogh3, Graham N. Stone6, James A. Nicholls6, and Paul Sunnucks1
1School of Biological Sciences and Australian Centre for Biodiversity, Clayton Campus,
Monash University, Wellington Road, Clayton, VIC 3800, Australia
2Australian National Wildlife Collection, CSIRO Ecosystem Sciences, GPO Box 1700,
Canberra, ACT 2601
3 Division of Evolution, Ecology and Genetics, Building 116, Daley Rd, Research School of
Biology, The Australian National University, Canberra, ACT 0200 Australia
4Australian Centre for Ancient DNA (ACAD), School of Earth & Environmental Sciences,
The University of Adelaide, Darling Building, North Terrace Campus, SA 5005, Australia
5Sciences Department, Museum Victoria, Carlton Gardens, Melbourne, Vic, 3001, Australia
6 Institute of Evolutionary Biology, University of Edinburgh, The King’s Buildings, West
Mains Road, Edinburgh EH9 3JT, Scotland
Keywords: evolutionary history, sPCA, dbRDA, female-linked selection, eastern yellow
robin, Eopsaltria australis
Corresponding author: Alexandra Pavlova
School of Biological Sciences and Australian Centre for Biodiversity, Clayton campus,
Monash University, Wellington Road, Clayton, VIC 3800, Australia
Page 1 of 101 Evolution: For Review Only
123456789101112131415161718192021222324252627282930313233343536373839404142434445464748495051525354555657585960
2
Phone: (+61) 3 9905 5902; Fax: (+61) 3 9905 5613
Email: [email protected]
Running title: Evolution of the eastern yellow robin
Word count: 6916 words of text (excluding tables, figure captions and literature cited)
This manuscript has 3 tables and 4 figures
We have/will archive our data on sequences, microsatellites and CHD markers, geographic
coordinates, climatic variables, sex, etc in Dryad and GenBank.
Page 2 of 101Evolution: For Review Only
123456789101112131415161718192021222324252627282930313233343536373839404142434445464748495051525354555657585960

3
ABSTRACT
Relationships among multi-locus genetic variation, geography and environment can
reveal how evolutionary processes affect genomes. We examined the evolution of an
Australian bird, the eastern yellow robin Eopsaltria australis, using mitochondrial (mtDNA)
and nuclear (nDNA) genetic markers, and bioclimatic variables. In southeastern Australia,
two divergent mtDNA lineages occur east and west of the Great Dividing Range,
perpendicular to latitudinal nDNA structure. We evaluated alternative scenarios to explain
this striking discordance in landscape genetic patterning. Stochastic mtDNA lineage sorting
can be rejected because the mtDNA lineages are essentially distinct geographically for >1500
km. Vicariance is unlikely: the Great Dividing Range is neither a current barrier nor was it at
the Last Glacial Maximum according to species distribution modeling; nuclear gene flow
inferred from coalescent analysis affirms this. Female philopatry contradicts known female-
biased dispersal. Contrasting mtDNA and nDNA demographies indicate their evolutionary
histories are decoupled. Distance-based redundancy analysis, in which environmental
temperatures explain mtDNA variance above that explained by geographic position and
isolation-by-distance, favors a non-neutral explanation for mitochondrial phylogeographic
patterning. Thus, observed mito-nuclear discordance accords with environmental selection on
a female-linked trait, such as mtDNA, mtDNA-nDNA interactions or genes on W-
chromosome, driving mitochondrial divergence in the presence of nuclear gene flow.
Page 3 of 101 Evolution: For Review Only
123456789101112131415161718192021222324252627282930313233343536373839404142434445464748495051525354555657585960

4
INTRODUCTION 1
Evolutionary processes (e.g. genetic drift, natural selection and gene flow) operate at 2
different times and places in species’ histories, differentially affecting genomes and phenotypes; 3
thus understanding their roles in speciation remains challenging (Coyne and Orr 2004; Price 4
2008; Butlin et al. 2009; Smadja and Butlin 2011). Discordant geographic patterns within and 5
among genomes in a species could result from coalescent variance (Lohse et al. 2010), 6
genetically localized selective sweeps (Bensch et al. 2006), life history traits (e.g. sex-biased 7
philopatry/dispersal; Turmelle et al. 2011), different modes of marker inheritance (and thus 8
effective population sizes), or differential marker behavior following secondary contact (Petit 9
and Excoffier 2009). A recent review (Toews and Brelsford 2012) found that mito-nuclear 10
discordance, a major difference in the patterns of differentiation between mitochondrial and 11
nuclear DNA, is a common phenomenon in animal systems. In the great majority of reviewed 12
cases, mito-nuclear discordance arose following allopatric divergence and secondary contact 13
(Toews and Brelsford 2012). This is expressed either in more structuring and/or narrower 14
geographic clines in mtDNA compared with nDNA (usually explained by nuclear introgression 15
and/or sex-biased asymmetries including dispersal, mating or offspring survival) or relatively 16
less structuring and/or wider geographic clines of mtDNA, usually explained by adaptive 17
introgression of mtDNA, demographic disparities including genetic drift, or sex-biased 18
asymmetries. Historic isolation and secondary contact can also result in coexistence of deeply 19
divergent mitochondrial lineages in sympatry in one panmictic population (Zink et al. 2008; 20
Webb et al. 2011; Hogner et al. 2012). However, in four cases, all involving avian systems, 21
strong mitochondrial but not nuclear structure has arisen in the absence of obvious geographic 22
isolation (Irwin et al. 2005; Cheviron and Brumfield 2009; Ribeiro et al. 2011; Spottiswoode et 23
Page 4 of 101Evolution: For Review Only
123456789101112131415161718192021222324252627282930313233343536373839404142434445464748495051525354555657585960

5
al. 2011). Further, in two bird species, mitochondrial but not nuclear structure correlated with 24
environmental variation (Cheviron and Brumfield 2009; Ribeiro et al. 2011), suggesting that 25
mtDNA haplotypes might be differentially adapted to environmental conditions. Growing 26
evidence of selection on mtDNA (Ballard and Whitlock 2004; Bazin et al. 2006; Meiklejohn et 27
al. 2007) indicates that this process might be more common than recognized, although it is rarely 28
tested for in phylogeographic studies (Toews and Brelsford 2012). Links between mitochondrial 29
variation and energy metabolism (Mishmar et al. 2003; Tieleman et al. 2009) suggest that 30
mtDNA data should be routinely examined in relation to environmental variables in species 31
distributed over wide ranges of climatic conditions. Multilocus investigation of spatial genetic 32
structure in relation to environmental variation should lead to better understanding of 33
evolutionary forces shaping molecular variation. 34
The eastern yellow robin Eopsaltria australis (Passeriformes: Petroicidae) is a common 35
and widespread bird of mesic woodlands and forests of tropical to temperate eastern Australia 36
(Barrett et al. 2003). The species’ distribution spans 20º of latitude, associated with a wide range 37
of climates (Higgins and Peter 2002). Superimposed on this climatic gradient, the Great Dividing 38
Range, a mountain chain of modest elevation peaking at 2228 metres above sea level, runs the 39
entire length of the eastern coastline, and imposes climates that are generally drier and warmer 40
further inland (Bowman et al. 2010; Byrne et al. 2011). Comprehensive, continent-wide bird 41
surveys at 1º grids (1998-2002) showed E. australis to be evenly distributed and breeding 42
throughout the Great Dividing Range (Barrett et al. 2003). Dispersal of E. australis is limited 43
and significantly female-biased (Higgins and Peter 2002; Debus and Ford 2012; Harrisson et al. 44
2012), thus local adaptation is feasible (Schneider et al. 1999). So, too, is neutral divergence in 45
allopatry: aridification and cooling during Pleistocene glacial cycles have promoted divergence 46
Page 5 of 101 Evolution: For Review Only
123456789101112131415161718192021222324252627282930313233343536373839404142434445464748495051525354555657585960

6
and speciation of some forest and woodland Australian mesic organisms (Sunnucks et al. 2006; 47
Symula et al. 2008; Malekian et al. 2010; Byrne et al. 2011). 48
A preliminary molecular data set (Loynes et al. 2009) showed two highly divergent 49
mitochondrial ND2 haplogroups in E. australis (> 6% divergence), whereas one polymorphic 50
nuclear gene and two nuclear introns were not structured. Using mitochondrial COI Christidis et 51
al. (2011) confirmed this mitochondrial subdivision and suggested that, pending further 52
phylogeographic study, the haplogroups may comprise separate species. Notably, the 53
haplogroups did not correspond to the recognized subspecies, northern E. a. chrysorrhoa and 54
southern E. a. australis (Schodde and Mason 1999), suggesting a possibility of mito-nuclear 55
discordance. Interpreting strong mtDNA divergence as indicative of speciation is based on the 56
usually untested assumption that mitochondrial lineages will behave as if under neutral 57
evolution. Although in some cases this assumption might be valid (Harrison 1989; Zink and 58
Barrowclough 2008), simulations show that even weak selection for local adaptations can result 59
in strong phylogeographic structure of a uniparentally inherited locus, where divergent clades are 60
geographically localized and differently adapted (Irwin 2012). Here we report an intriguing 61
phylogeographic pattern in E. australis, where two major mtDNA lineages were distributed 62
roughly eastwards or westwards of the Great Dividing Range in southeastern Australia, 63
perpendicular to roughly latitudinal isolation-by-distance of some nuclear loci, and we test 64
rigorously whether selection or one or more neutral process better explains this mito-nuclear 65
discordance. We used multiple types of loci (mitochondrial ND2 gene, nuclear microsatellites 66
and introns) having different rates of evolution and patterns of inheritance (autosomal, Z-linked, 67
and female-limited W-linked), and climatic variables, applied over the full range of the species in 68
landscape genetic and genealogical frameworks. First, we tested if mitochondrial haplogroups 69
Page 6 of 101Evolution: For Review Only
123456789101112131415161718192021222324252627282930313233343536373839404142434445464748495051525354555657585960

7
diverged by drift in allopatry followed by secondary contact (as in the majority of cases reviewed 70
by Toews and Brelsford 2012). Under this hypothesis, we expected to observe low habitat 71
suitability for E. australis on and along the Great Dividing Range (an agent of vicariance for 72
some taxa along the length of Australia's eastern seaboard; Byrne et al. 2011) during the Last 73
Glacial Maximum (LGM). We used species distribution modeling to test this. Second, we tested 74
if mitochondrial divergence in E. australis occurred in the presence of nuclear gene flow. Under 75
divergence with gene flow (Pinho and Hey 2010), some nuclear gene flow between mtDNA 76
haplogroups is expected. We tested this by fitting an isolation-with-migration (IMA) model to 77
nDNA data. Finally, we tested the hypothesis that female-linked environmental selection 78
(including selection on mtDNA and linked nuclear genes; Rand et al. 2004; Meiklejohn et al. 79
2007; Dowling et al. 2008; Tieleman et al. 2009; Shen et al. 2010; Moghadam et al. 2012) 80
resulted in mtDNA divergence in the presence of nuclear gene flow between populations defined 81
by their mtDNA haplogroups. This hypothesis includes the case where dispersal (which is 82
female-biased in E. australis) between environmentally-divergent areas is lower than dispersal 83
between similar areas. Under the female-linked selection hypothesis, decoupled evolutionary 84
history of mtDNA and nDNA is expected to result in different patterns of geographic structure 85
for these genomes, and mtDNA may show associations with environmental variation, after 86
spatial autocorrelation has been controlled for. We tested these predictions using 87
phylogeographic, landscape genetic and distance-based redundancy analyses. 88
METHODS 89
Modeling present and Last Glacial Maximum species distributions 90
To understand how current and late Pleistocene climatic variation in temperature and 91
humidity might have impacted the spatial distribution of E. australis (and its genetic variation), 92
Page 7 of 101 Evolution: For Review Only
123456789101112131415161718192021222324252627282930313233343536373839404142434445464748495051525354555657585960

8
and to test for a vicariant effect of the Great Dividing Range, we modeled current and LGM 93
distributions of this species using the machine-learning maximum entropy model implemented in 94
MaxEnt 3.3.3e (Phillips et al. 2006). Nineteen bioclimatic variables for the present and the LGM 95
(Busby 1991) at a resolution of 2.5 arc-minutes (~5 km2 grid) were obtained from the WorldClim 96
1.4 database (Hijmans et al. 2005). Layers were visualized and cropped to span from latitude 97
46°S to 5°S and longitude 130°S to 156°S using DIVA-GIS 7.4.0 (Hijmans 2009). Presence data 98
comprised 454 presence localities of E. australis in the Atlas of Living Australia 99
(http://www.ala.org.au). A set of 341 randomly chosen presence points (75%) was used to train 100
MaxEnt model under current climatic conditions, and a set of 113 points (25%) was used to test 101
the model. The fit of several preliminary MaxEnt models generated with different combinations 102
of variables was compared using the area under the receiver operating curve (AUC). The final 103
model of current species distribution was generated using six variables that maximized AUC: 104
max temperature of warmest month, min temperature of coldest month, mean diurnal range, 105
precipitation of wettest month, precipitation of driest month, and precipitation seasonality. LGM 106
distribution was modeled by projecting the final current model onto the set of these six variables 107
estimated for the LGM (see supplementary material S1 for details). 108
Sampling and molecular methods 109
Genomic DNA was extracted from 63 frozen tissues of E. australis spanning the species’ 110
entire geographic range (Australian National Wildlife Collection, CSIRO Ecosystems Sciences, 111
Canberra) following Kearns et al. (2009), and from 44 blood samples collected in the south and 112
north of the species’ range following Harrisson et al. (2012) (Fig. 1, supplementary material S2). 113
Individuals were screened for eight autosomal nuclear microsatellites, Cpi3, Cpi8 (Doerr 2005), 114
Escmu6 (Hanotte et al. 1994), HrU2 (Primmer et al. 1995), Pocc6 (Bensch et al. 1997), Smm7 115
Page 8 of 101Evolution: For Review Only
123456789101112131415161718192021222324252627282930313233343536373839404142434445464748495051525354555657585960

9
(Maguire et al. 2006), Pgm1 and Pgm7 (Dowling et al. 2003) following Harrisson et al. (2012), 116
and for allele-length polymorphism in the female-specific CHD-W locus and its Z-chromosome 117
homolog CHD-Z (Griffiths et al. 1998; supplementary material S3). Pgm1 had suspected null 118
alleles, and Pgm7 was found to be Z-linked and extremely variable, thus neither were used in 119
analyses. The other six microsatellite loci were previously shown to be in Hardy-Weinberg 120
equilibrium and independently segregating in E. australis (Harrisson et al. 2012). 121
The mitochondrial (mtDNA) ND2 gene was amplified using primers L5215 (Hackett 122
1996) and H6313 (Sorenson et al. 1999) following Kearns et al. (2009) and sequenced 123
commercially in both directions using the amplification primers (Macrogen, Korea). Six nuclear 124
introns [aldolase B intron 4 (AB4), glyceraldehyde-3-phosphate dehydrogenase intron 11 125
(GAPDH), phosphenolpyruvate carboxykinase intron 9 (GTP), Z-linked muscle skeletal receptor 126
tyrosine kinase intron 3 (MUSK-I3), rhodopsin intron 2 (RI2) and transforming growth factor-β2 127
intron 5 (TGFβ2)] were amplified in 47 individuals (Table 1, supplementary material S2) using 128
published primers (Waltari and Edwards 2002; Sorenson et al. 2004; McCracken and Sorenson 129
2005; Vallender et al. 2007). All nuclear DNA (nDNA) PCRs contained MgCl2 (1.5 mM), 1x 130
KCl buffer, 0.125 µM each dNTP, 0.4 µM primers, 0.01 units/µl Taq polymerase and 0.2 mg/ml 131
BSA, and the microsatellite touchdown protocol above was applied. Nuclear loci were sequenced 132
using forward primers by the UK NERC Genepool sequencing facility (University of Edinburgh, 133
UK). For a subset of individuals representing all inferred haplotypes (see below), nuclear loci 134
were further sequenced in reverse direction to check that they did not represent sequencing 135
errors. 136
Chromatograms were edited and aligned in Geneious Pro 4.8.5 (Drummond et al. 2010). 137
The mitochondrial origin of ND2 sequences was supported by lack of stop-codons, 138
Page 9 of 101 Evolution: For Review Only
123456789101112131415161718192021222324252627282930313233343536373839404142434445464748495051525354555657585960
10
insertions/deletions or sequence ambiguities. For nuclear introns containing indels, only the first 139
fragments of sequence, where the majority of sequences were unambiguous, were analyzed 140
(Table 1), and individuals heterozygous for indels within these fragments were removed from 141
analysis (1 for GAPDH, 5 for GTP, 8 for TGFβ2). Gametic phases of heterozygous sequences 142
were reconstructed using the PHASE 2.1 algorithm (Stephens et al. 2001; Stephens and Donnelly 143
2003) implemented in DNASP v5.10.1 (Librado and Rozas 2009). Due to presence of many rare 144
alleles for some loci, haplotypes for small proportions of individuals (0.07 for GTP, 0.19 for 145
MUSK-I3, 0.01 for RI2, 0.18 for TGFβ2 and 0.16 for MC1R) were resolved with <80% 146
probability. We used all best pairs of haplotypes for analyses to avoid systematic bias in 147
estimates of population genetic parameters (Garrick et al. 2010), although incorrectly resolved 148
haplotypes could slightly influence estimates of linkage disequilibrium, recombination and 149
coalescence analyses (Balakrishnan and Edwards 2009). Introns were checked for recombination 150
in DNASP using the four-gamete test (Hudson and Kaplan 1985). 151
Multilocus phylogeography and spatial analysis of genetic variation 152
Relationships among haplotypes for mtDNA and nDNA loci were visualized on a 153
median-joining network (Bandelt et al. 1999) constructed in NETWORK v4.5.1.6 (www.fluxus-154
engineering.com). Owing to recombination, nuclear gene networks may not represent true 155
genealogical relationships, but are nonetheless useful for assessing allele clustering with respect 156
to mtDNA-defined lineages. Support for mitochondrial ND2 haplogroups and their divergence 157
times were estimated in BEAST 1.6.1 and 1.7 (Drummond and Rambaut 2007; Drummond et al. 158
2012) using all 100 ND2 sequences (supplementary material S4). STRUCTURE 2.3.3 (Pritchard et 159
al. 2000) and TESS 2.3.1 (Chen et al. 2007) were used to explore genotype substructuring in 160
microsatellites and autosomal introns (supplementary material S5). Spatial principal component 161
Page 10 of 101Evolution: For Review Only
123456789101112131415161718192021222324252627282930313233343536373839404142434445464748495051525354555657585960

11
analysis (sPCA; Jombart et al. 2008) implemented through the functions spca and global.rtest in 162
the package ADEGENET v1.2-8 (Jombart 2008) for R (R Development Core Team 2011) was used 163
to investigate spatial patterns of genetic variation. SPCA maximizes the product of spatial 164
autocorrelation and genetic variance to summarize multivariate data on allele frequencies into a 165
few uncorrelated axes. This approach is powerful for detecting cryptic spatial patterns that are 166
not associated with high genetic variation (Jombart et al. 2008); unlike STRUCTURE or TESS, it 167
does not require Hardy-Weinberg or linkage equilibria, and can be applied to sequence data. We 168
used a Gabriel graph and introduced a small amount of random noise to coordinates of multiple 169
individuals collected at the same location (function jitter, factor=1, amount=0.1; the network was 170
robust to the addition of noise). Analyses were run separately for ND2, each of the sequenced 171
nuclear markers, and the dataset of six microsatellites (removing 9 individuals with missing 172
scores for a locus). 173
Multiple processes, such as isolation-by-distance and local selection (e.g. isolation-by-174
adaptation; Nosil et al. 2008), can simultaneously shape spatial structure of variation of different 175
molecular markers. To separate the effect of geographic position, which may reflect local 176
processes, from any underlying effect of isolation-by-distance, we applied redundancy analysis 177
(RDA, function rda, R package VEGAN; Dixon 2003; Oksanen et al. 2011). RDA is a constrained 178
ordination technique, coupled with an ANOVA-like permutation test that tests whether a given 179
predictor explains residual variation in response after fitting (conditioning on) other predictors 180
first. We tested whether geographic position can explain genetic variance of nuclear loci beyond 181
what can be explained by the isolation-by-distance effect. As the response, we used data on 182
presence or absence of each identified allele (microsatellites) or variant nucleotide at 183
polymorphic sites (sequences) in each individual, computed using a genind constructor and 184
Page 11 of 101 Evolution: For Review Only
123456789101112131415161718192021222324252627282930313233343536373839404142434445464748495051525354555657585960
12
centred and scaled using scaleGen (R package ADEGENET). The two predictors were geographic 185
position (latitude and longitude, analyzed together for simplicity of interpretation) and pairwise 186
geographic distance between locations. For RDA (and also distance-based RDA, below) the 187
information about an individual’s pairwise geographic distances to other individuals was reduced 188
to a few columns using the following procedure. First, geographic distances between locations, 189
initially computed with function rdist.earth (R package FIELDS), were expressed as a rectangular 190
matrix using principal coordinates of the neighbourhood matrix procedure (pcnm; Borcard and 191
Legendre 2002) implemented in function pcnm in VEGAN. Then this rectangular matrix was 192
reduced to ≤3 columns best explaining genetic variance. For that, we fitted all pcnm axes as 193
predictors of allele presence using RDA, and chose up to three axes significant at P<0.05 to 194
represent geographic distances in the final RDAs. This approach is more powerful than Mantel 195
tests, which require multivariate environmental data (such as latitude, longitude and 196
environmental variables) to be expressed as distances (Legendre and Fortin 2010). For the final 197
RDAs, we tested for the ability of each predictor to explain significant variance in allele 198
presence-absence data alone (marginal tests), and after fitting the other predictor first 199
(conditional tests). Significance was assessed with 999 permutations (of the rows and columns of 200
the predictor matrix for marginal tests, or of the rows and columns of the multivariate residual 201
matrix for conditional tests). A predictor variable that explained significant (P<0.05) genetic 202
variance in marginal and conditional tests was inferred to have major effect on genetic structure. 203
If both marginal tests were significant but conditional tests were not, both variables were inferred 204
to influence genetic variation. RDAs were performed on each sequenced nuclear marker, and 205
complete genotypes at six microsatellites. For mitochondrial ND2 sequences, effects of 206
Page 12 of 101Evolution: For Review Only
123456789101112131415161718192021222324252627282930313233343536373839404142434445464748495051525354555657585960
13
geographic position and distance were explored using distance-based redundancy analysis 207
(dbRDA) as explained below. 208
Genetic diversity, genetic differentiation and selection 209
For each sequenced locus, we calculated haplotype diversity (Hd), nucleotide diversity 210
(π), pairwise Φst between haplogroups, Tajima's D (Tajima 1996) and Fu’s Fs (Fu 1997) tests for 211
selective neutrality using ARLEQUIN 3.11 (Excoffier et al. 2005). DNASP was used to test for 212
selection on ND2 itself using the McDonald-Kreitman (MK) test (McDonald and Kreitman 213
1991), two individuals with missing data for two sites were removed from this analysis (for 214
additional tests for selection see supplementary material S7). ARLEQUIN was used to compute 215
expected heterozygosity (He) and FST between haplogroups for six microsatellites 216
(supplementary material S6). Calculations were performed for all data, and for the two 217
populations defined by mtDNA haplogroups. 218
Isolation-with-migration analysis (IMA2) 219
We fitted the model of isolation-with-migration (Hey and Nielsen 2004) as implemented 220
in IMA2.0 (Hey and Nielsen 2007) to the multilocus dataset comprising the largest non-221
recombining fragments of four autosomal introns that had no signature of selection (AB4, 222
GAPDH, MUSK-I3 and TGFβ2), the size-variable Z-linked intron (CHD-Z) and six autosomal 223
microsatellites for the two populations defined by mtDNA haplogroup membership (A1 and B– 224
see Results, omitting three individuals from an isolated northernmost population). Under this 225
classification, any migration detected between haplogroups would indicate presence of nuclear 226
gene flow inconsistent with vicariant divergence. The fit of a full migration model was compared 227
to that of a no-migration sub-model using a likelihood ratio test. Parameter estimates were 228
converted to demographic units (number of years or individuals) using a generation time of 3.5 229
Page 13 of 101 Evolution: For Review Only
123456789101112131415161718192021222324252627282930313233343536373839404142434445464748495051525354555657585960

14
years (calculated as average age of reproductive females, assuming age of first reproduction of 1 230
year and lifespan of 6 years) and mutation rates of Lerner et al. (2011) (see supplementary 231
material S8 for details of analyses). 232
Distance-based redundancy analysis (dbRDA) 233
We used dbRDA (Legendre and Anderson 1999) implemented in the capscale function 234
in R-package VEGAN to test whether mitochondrial divergence occurred as a result of selection 235
acting upon a female-linked trait (broadly defined, i.e. mtDNA, mtDNA-nDNA interaction, or 236
genes on the W-chromosome). We examined whether the two bioclimatic variables that were 237
most informative in predicting the E. australis distribution (supplementary material S1) explain 238
mitochondrial variation above that explained by geographic position and/or distance between 239
individuals (Legendre and Fortin 2010). In this analysis, individuals were the units of 240
observation, and pairwise inter-individual TN93+G mitochondrial genetic distances [calculated 241
in MEGA5 (Tamura et al. 2011) excluding two individuals with missing sites; supplementary 242
material S4] were treated as information on multivariate response (and not as a single univariate 243
response variable as in Mantel tests; Geffen et al. 2004). Predictors (standardized to a zero mean 244
and unit variance) were two environmental variables: maximum temperature of warmest month 245
(max.temp) and precipitation of driest month (precipitation), and three geographic variables: 246
latitude, longitude and geographic distance between samples represented by the first significant 247
(P<0.05) pcnm axis (as explained above for RDA). The final dbRDA analyses included (1) 248
marginal tests, where the relationship between mtDNA genetic distances and each of the 249
predictors was analyzed separately, (2) conditional tests, where significance of environmental 250
variables (max.temp or precipitation) as predictors of mtDNA distances was assessed after first 251
fitting other variables one at a time or together, and (3) the reciprocal conditional tests, where 252
Page 14 of 101Evolution: For Review Only
123456789101112131415161718192021222324252627282930313233343536373839404142434445464748495051525354555657585960

15
significance of geographic variables was similarly assessed by first fitting environmental 253
variables. Significance was assessed with 999 permutations. Environmental variables were 254
inferred to explain mtDNA variance over that explained by geographic position and distance if 255
marginal as well as conditional tests were significant. Significant association of mitochondrial 256
variation and climatic variables beyond its correlation with geographic position and distance 257
would provide strong evidence against hypotheses assuming neutral behavior of mtDNA. 258
RESULTS 259
Current and LGM species distribution models 260
Current and LGM species distribution models (supplementary material S1) predict the 261
northernmost (Wet Tropics) range of E. australis to be isolated from the remainder. Thus, for 262
this outlying region, vicariant effects might have acted at some time. In contrast, the species is 263
predicted under LGM and current conditions to have a continuous distribution on and along the 264
Great Dividing Range, except for a proportionally small area of habitat unsuitability (localized 265
glaciation) during the LGM in the mountains of southeastern Victoria and southern New South 266
Wales (Barrows et al. 2001). These predicted distributions provide no basis to expect vicariant 267
patterns due to the Great Dividing Range (arguing against allopatric divergence). Two variables 268
describing extremes of climatic conditions, maximum temperature of warmest month and 269
precipitation of driest month, explained the majority of variance in E. australis presence (50% 270
and 38% respectively in the final model). 271
MtDNA phylogeography 272
The 100 individuals sequenced for 1002 base pairs of ND2 revealed 102 polymorphic 273
sites (80 parsimony informative), defining 40 haplotypes (GenBank accession numbers 274
KC466740 - KC466839). All individuals fell into one of haplogroup A or B, between which 275
Page 15 of 101 Evolution: For Review Only
123456789101112131415161718192021222324252627282930313233343536373839404142434445464748495051525354555657585960
16
there was 6.6% net nucleotide divergence (Bayesian posterior probability=1, MCC BEAST tree, 276
supplementary material S4, and ND2 network, Fig. 2). Assuming neutral evolution with rates 277
similar to ND2 rate of the Hawaiian honeycreepers (Lerner et al. 2011), the haplogroups A and B 278
diverged in the early Pleistocene, ~1.5 (95% highest posterior density [HPD] 0.975-2.147) 279
million years ago. Five of 53 fixed differences between A and B represented non-synonymous 280
but biochemically conservative amino acid substitutions (Grantham 1974; supplementary 281
material S7). Haplogroup A was widespread north to south, and inland of the Great Dividing 282
Range in southeastern Australia (Fig. 1a, red points), while haplogroup B was principally 283
coastwards and restricted to southeastern Australia (Fig. 1a, black points). Two locations, 284
Tenterfield and Shelbourne (Fig. 1a) had individuals of both haplogroups. Haplogroup A 285
comprised haplogroups A1 (widespread except Wet Tropics) and northernmost A2 (three Wet 286
Tropics individuals; Bayesian posterior probability=1; net divergence 1%; MCC tree, 287
supplementary material S4), which diverged in the mid Pleistocene, ~212 (95% HPD 104-341) 288
thousand years ago, assuming neutral evolution. One of 10 fixed differences between A1 and A2 289
was non-synonymous. Consistent with these results, SPCA of mtDNA (Fig. 3) detected two 290
significant global structures (P<0.001), the first (mt-sPC1) reflecting sharp A versus B 291
subdivision, and the second (mt-sPC2) subdivision between A2 (Wet Tropics) and the rest 292
(A1+B). 293
Sex-linked CHD variation and population structure inferred from nuclear microsatellites 294
For 32 females and 64 males sequenced for ND2 and sexed by CHD variation, the 295
distribution of two W-linked (female-limited) alleles exactly matched mtDNA haplogroup 296
variation (allele 366 was restricted to haplogroup A, allele 362 to B), while the two Z-linked 297
alleles were widespread and unstructured with respect to haplogroups (supplementary material 298
Page 16 of 101Evolution: For Review Only
123456789101112131415161718192021222324252627282930313233343536373839404142434445464748495051525354555657585960

17
S3). Ninety-two individuals were genotyped for six microsatellites. Genotypic analyses in 299
STRUCTURE and TESS suggested two genetic clusters, with a gradual north to south change of 300
individual cluster probabilities (Fig. 1b, Supplementary material S5). SPCA on microsatellites 301
detected two significant global structures (P<0.001; Fig. 3). The strongest structure (msat-sPC1) 302
showed a roughly north-south cline similar to that detected by STRUCTURE and TESS; the second, 303
subtle structure (msat-sPC2) showed a cline across the Great Dividing Range perpendicular to 304
msat-sPC1, directionally consistent with the major mitochondrial lineage subdivision (Fig. 3). 305
Isolation-by-distance (IBD) was a dominant process shaping microsatellite variation: geographic 306
distances alone could explain the variance in microsatellite frequencies (P=0.005, marginal RDA 307
test; Table 2), and remained significant even after geographic position was fitted first (P=0.017 308
conditional RDA test). In contrast, geographic position, although significant when fitted alone 309
(P=0.005, marginal RDA test), did not explain microsatellite structure after geographic distances 310
were controlled for (P=0.1, the reciprocal conditional RDA test). 311
Geographic variation of sequenced nuclear introns 312
Sequences were obtained from six nuclear introns in 31-47 individuals, which had two to 313
19 alleles (Table 1; GenBank accession numbers KC466694 - KC466739, KC466694 - 314
KC467012). No intron displayed clusters or allele-sharing concordant with mitochondrial 315
haplogroup designations (Fig. 2). Two genetic clusters detected by genotypic analysis of the 316
autosomal introns in TESS were consistent with north-south gradient in cluster membership 317
detected from microsatellites (Supplementary material S5). Significant spatial structure was 318
suggested by sPCA for GAPDH (P=0.053) and for MUSK-I3 (P=0.065; Fig 3) in which 319
southwestern individuals were somewhat differentiated from the rest; no structure was found for 320
the other sequenced introns (P>0.15; RI2 was not tested as only two haplotypes were present). 321
Page 17 of 101 Evolution: For Review Only
123456789101112131415161718192021222324252627282930313233343536373839404142434445464748495051525354555657585960
18
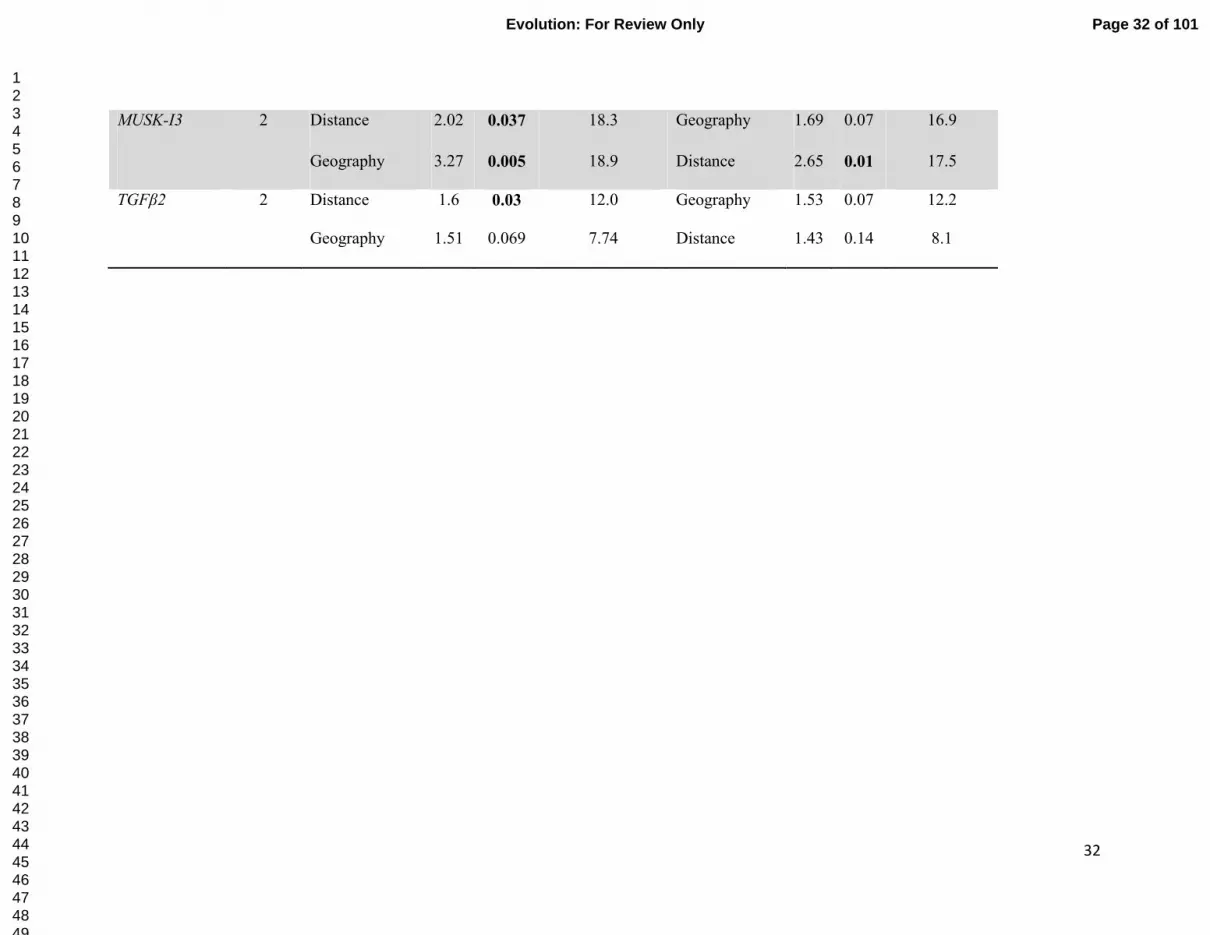
RDA (Table 2) showed that IBD as well as geographic position explained variation in GTP (both 322
P<0.05 on marginal tests, P>0.05 on conditional tests), geographic position explained variation 323
in AB4, GAPDH and MUSK-I3 beyond that explained by IBD (P<0.05 on marginal and 324
conditional tests); and IBD but not geographic position explained patterns in TFGβ2 (P<0.05 on 325
marginal test). 326
Population genetic variability, differentiation and selection 327
Within-haplogroup nucleotide diversity was lower for ND2 than that for four (of six) 328
nuclear loci (AB4, GAPDH, MUSK-I3 and TGFβ2; Table 1); π for nuclear loci ranged 0-0.0075 329
and 0.0003-0.0102, and for ND2 was 0.0013 and 0.0023 for A1 and B, respectively. Significant 330
differentiation between A1 and B was detected for ND2 (ΦST=0.968; P<0.001), inevitable under 331
reciprocal monophyly. Much lower but significant A1-B differentiation was also found for 332
nuclear introns AB4 (ΦST=0.047; P=0.03), GAPDH (ΦST=0.065; P=0.01), GTP (ΦST=0.034; 333
P=0.02) and for microsatellites (FST=0.029; P<0.001), but not for MUSK-I3, RI2 or TGFβ2 334
(P>0.05; Table 1). Significantly negative Tajima’s D and/or Fu’s Fs, indicative of population 335
expansion, purifying selection or genetic hitchhiking, were found in three loci with the lowest 336
nucleotide diversity (for A1 in ND2 and GTP, and for B in ND2, GTP and RI2). Further, a MK 337
test for selection on ND2 detected significant deficiency of non-synonymous polymorphism 338
between A1 and B (Fisher’s exact test P=0.047) with 50 synonymous and 5 non-synonymous 339
changes fixed between groups, compared to 30 synonymous and 10 non-synonymous 340
polymorphisms present within groups; MK tests between haplogroups A and B or between A1 341
and A2 were not significant (P>0.05). Thus, purifying selection is indicated to have acted upon 342
ND2; positive selection can be rejected (additional tests in supplementary material S7). 343
IMA2 analyses 344
Page 18 of 101Evolution: For Review Only
123456789101112131415161718192021222324252627282930313233343536373839404142434445464748495051525354555657585960
19
Coalescent analysis of nuclear data in IMA2 could not definitively estimate some model 345
parameters for two populations defined by their mitochondrial haplogroup membership (details 346
in supplementary material S8), thus, and because assumptions of the model might not be met, 347
IMA2 results should be interpreted with caution. Based on all nuclear loci, populations A and B 348
were estimated to have diverged in the late Pleistocene or Holocene, ~7,000 (95%HPD 700-349
149,000) years ago. Posterior distributions of some Θ parameters did not reach zero, 350
nevertheless, each of them had a distinct peak within the range of prior parameter distributions. 351
Demographic estimates of population sizes from all nuclear data were NA=14 (95%HPD 3-86), 352
NB=13 (2-101) and NANC=186 (122-222) thousand individuals (for A, B and ancestral 353
populations, respectively). Although non-zero probabilities were associated with all prior values 354
of coalescent migration parameters, peak posterior distribution estimates suggested some 355
migration between populations. Migration estimates from all nuclear data converted to 356
population migration rate (2Nm) corresponded to forward-in-time gene movement of 6.2 (95% 357
HPD 0-32) genes per generation from A to B and 3.8 (0-22) genes per generation from B to A. 358
IMA2 was unable to conclusively reject the no-migration submodel based on a likelihood ratio 359
test. 360
Environmental, latitudinal and IBD effects associated with mtDNA diversity 361
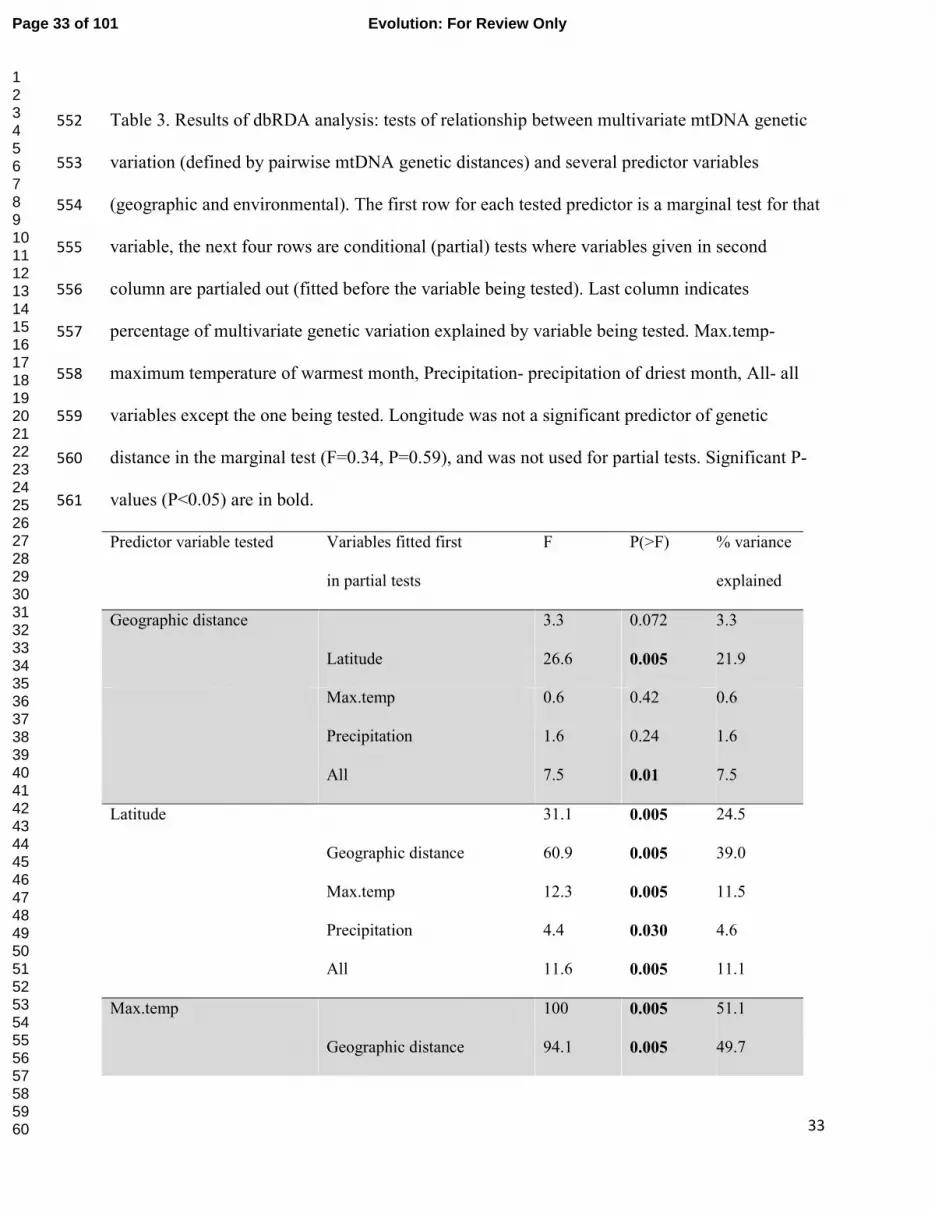
DbRDA (Table 3) showed that maximum temperature of warmest month (max.temp), 362
precipitation of driest month, and latitude explain a significant amount of variance in mtDNA 363
genetic distances (marginal tests P<0.005), accounting for 51, 47 and 24% of genetic variance in 364
marginal tests, respectively, whereas longitude and geographic distance do not (P=0.59 and 365
P=0.072). So we excluded longitude from partial tests but retained geographic distance which 366
was close to significance. There was evidence of strong correlation of environmental variation 367
Page 19 of 101 Evolution: For Review Only
123456789101112131415161718192021222324252627282930313233343536373839404142434445464748495051525354555657585960

20
with mtDNA haplogroups: max.temp remained a significant predictor of genetic distances even 368
when other variables were fitted first alone or together (P=0.005; Table 3). Precipitation seems 369
somewhat less influential than max.temp: it remained significant when the three other variables 370
were fitted individually, or the two geographic variables were fitted first (P=0.005), but not when 371
max.temp plus the two geographic variables were fitted first (P=0.38; Table 3). Latitude 372
remained significant after first fitting the other variables alone or together (P<0.05; Table 3). 373
Overall, these results suggest that max.temp and latitude may play an important role in shaping 374
mitochondrial genetic structure of E. australis. Haplogroup A individuals occupied locations 375
with higher maximum temperatures of the warmest month and lower precipitation of the driest 376
month than those of haplogroup B (Fig. 4). 377
DISCUSSION 378
We attempted to clarify the evolutionary processes shaping a profound mito-nuclear 379
discordance in the Australian bird, the eastern yellow robin Eopsaltria australis, in which the 380
major patterns of spatial variation in mtDNA and nDNA are perpendicular. We addressed several 381
evolutionary scenarios, applying a series of landscape-genetic, spatial-genetic and genealogical 382
tests. 383
Deep mitochondrial divergence can arise by chance in a continuous population, when 384
dispersal and population size are low, due to the stochastic nature of the coalescent process 385
(Irwin 2002). However, such an effect is highly unlikely in E. australis, where the two 386
haplogroups have a sharp spatial division within this continuously distributed, common, 387
widespread species (Barrett et al. 2003). The haplogroups abut over >1500 km with substantial 388
potential for mixing, yet only in two sampled locations did they co-occur (Fig. 1). Random 389
processes also cannot explain correlation of mtDNA lineages with environmental variables. 390
Page 20 of 101Evolution: For Review Only
123456789101112131415161718192021222324252627282930313233343536373839404142434445464748495051525354555657585960

21
Under a scenario of allopatric divergence followed by secondary contact, common 391
neutral explanations for more structured mtDNA than nDNA include incompletely sorted nuclear 392
lineages, nuclear introgression, and/or sex-biased asymmetries such as dispersal, mating or 393
offspring production/survival (Toews and Brelsford 2012). While the species distribution models 394
did indicate vicariance as a plausible explanation of the A1-A2 split at or after the Last Glacial 395
Maximum, there is little basis for vicariance in the range of Eopsaltria australis south of the Wet 396
Tropics. The species is common and widespread along the Great Dividing Range (Barrett et al. 397
2003), and its likely presence there during the LGM is inferred from our species distribution 398
models (although the LGM populations on parts of the Range could have been sparse, according 399
to relatively low probability of occurrence; supplementary material S1). Geographic 400
inconsistencies between mtDNA and nDNA structure rule out incomplete lineage sorting as a 401
cause of discordance (Toews and Brelsford 2012). Historical lack of gene flow across the Great 402
Dividing Range but not in other directions would be expected to structure both mitochondrial 403
and microsatellite variation: yet no geographically distinct genetic clusters were detected for 404
microsatellites. Instead, the major spatial pattern for microsatellites is latitudinal isolation-by-405
distance, with only mild IBD across the Great Dividing Range. This suggests that distance, rather 406
than a barrier, has structured nuclear variation. This, and inference of some nuclear gene 407
exchange from coalescent analysis in IMA2 (tempered by parameter uncertainty), suggests that 408
some nuclear gene flow between haplogroups has occurred. Different demographic histories 409
were inferred from mtDNA and nDNA data: significant Tajima’s D and Fu’s Fs neutrality tests, 410
suggestive of population expansion, purifying selection or hitchhiking, were detected for mtDNA 411
and two least variable nuclear loci, not for any of the more variable nuclear markers. Population 412
expansion would be expected to yield generally consistent signals across different markers, thus 413
Page 21 of 101 Evolution: For Review Only
123456789101112131415161718192021222324252627282930313233343536373839404142434445464748495051525354555657585960
22
non-neutral evolution or hitchhiking of some loci appears more likely, which was also supported 414
by the MK test for ND2. This suggests that evolutionary histories of mitochondrial and nuclear 415
genomes are decoupled. The same conclusion arises from contrasting A-B divergence times 416
estimated from the two genomes while accounting for coalescent variance: the late Pleistocene-417
Holocene divergence of ~7,000 (700-149,000) years ago estimated by IMA2 from nuclear data 418
(Supplementary material S8) is much more recent than the early Pleistocene mitochondrial 419
lineage divergence of ~1.5 (1-2.1) million years ago estimated by BEAST from ND2 420
(Supplementary material S4). Although we note that the divergence time estimates of BEAST and 421
IMA2 are not strictly comparable because IMA2 incorporated migration into the model, the 422
difference represents evidence that mtDNA and nDNA cannot both be responding solely to 423
neutral processes. 424
Very strong female philopatry unrelated to selection, and selection correlated with 425
mtDNA, are both expected to limit female but not male movement and gene flow across 426
populations and thus to impact mtDNA more and nDNA less than expected in the absence of 427
these effects. However, the female philopatry needed to explain observed patterns in the data 428
contrasts strongly with what is known about the biology of E. australis: field observations 429
(Debus and Ford 2012) and population genetic data (Harrisson et al. 2012) show that females 430
disperse significantly further than males (at least ~7 km and ~1 km, respectively; Debus and 431
Ford 2012). It is possible that females prefer to settle in habitats similar to their natal habitats, 432
whereas males are less discriminating (Tonnis et al. 2005). However, behavior where females 433
were so unable or unwilling to disperse or settle between adjacent haplogroup ranges over >1500 434
km of contact seems likely to be linked to some major fitness advantage, implying female-linked 435
selection. 436
Page 22 of 101Evolution: For Review Only
123456789101112131415161718192021222324252627282930313233343536373839404142434445464748495051525354555657585960

23
If we reject the selectively neutral hypotheses as unparsimonious, it remains to consider 437
possibilities involving female/mtDNA-linked selection. Geographically localized haplogroups 438
and very shallow coalescent times within haplogroups compared to between-haplogroups 439
observed in E. australis are consistent with simulation scenarios under local selection and low to 440
moderate dispersal (Irwin 2012). The correlation of environmental variables with the spatial 441
distribution of mtDNA variation, after controlling for IBD and geographic position (dbRDA 442
results, Table 3) is consistent with environmental selection. The most informative bioclimatic 443
variables with regards to species occurrence (maximum temperature of the warmest month and, 444
to a lesser extent, precipitation of the driest month) explained significant mitochondrial 445
patterning beyond that explained by latitude and IBD, suggesting that these climatic factors may 446
be associated with female-linked selection. 447
These results, coupled with the arguments against selectively neutral explanations, lead 448
us to propose that the most likely solution to the geographically perpendicular mito-nuclear 449
discordance in E. australis is female-linked selection (broadly-defined), taken here to include 450
selection on one or more of mtDNA, nuclear-encoded genes for proteins involved in oxidative 451
phosphorylation, nuclear-encoded genes for mitochondrial proteins, joint mito-nuclear genotype 452
or W-linked parts of the genome (Rand et al. 2004; Meiklejohn et al. 2007; Dowling et al. 2008; 453
Tieleman et al. 2009; Shen et al. 2010; Moghadam et al. 2012), female biology including biased 454
habitat selection (as in Tonnis et al. 2005) and ‘divergence hitchhiking’ (gene flow reduced as a 455
side effect of strong divergent selection on genes involved in local adaptation; Via 2012). 456
Nuclear gene flow within E. australis appears to be structured by isolation-by-distance along the 457
gradients in two perpendicular directions: latitudinal (main microsatellite structure, msat-sPC1; 458
Fig. 3) and across the Great Dividing Range (the cryptic second structure in the microsatellites, 459
Page 23 of 101 Evolution: For Review Only
123456789101112131415161718192021222324252627282930313233343536373839404142434445464748495051525354555657585960
24
msat-sPC2, directionally consistent with distribution of TESS clusters from analysis of sequenced 460
introns assuming three genetic clusters [supplementary material S5], which could be a signature 461
of gene flow impeded by arrested dispersal or survival of females across the Range). The 462
inference of isolation-by-distance is also supported by congruent geographic structure in color of 463
the upper tail-coverts, which changes from bright yellow to olive-green from north to south and 464
east to west in E. australis (Ford 1979). Keast (1958) and Ford (1979) suggested that this color 465
variation arose due to local ecotypic selection where brighter yellow is preferred in darker 466
environments where it would be more useful for signaling. Thus selective pressures driving 467
evolution of female-linked traits and color variation could be different and their evolution 468
unlinked. Overall, dramatic mito-nuclear discordance in E. australis suggests that natural 469
selection constrains mitochondrial but not selectively neutral nuclear gene flow along 470
environmental gradients. 471
More research is needed to understand the mechanisms through which putative selection 472
on female-linked traits in E. australis operates. Passerine birds from hotter and drier 473
environments have lower basal metabolic rates and evaporative water loss (Tieleman et al. 2003; 474
Williams and Tieleman 2005). Selection on mitochondrial genotypes can drive such adaptive 475
responses because the mitochondrial genome plays an important role in the regulation of energy 476
metabolism in birds (Tieleman et al. 2009). For E. australis, the MK tests suggested purifying 477
selection on ND2, thus positive selection appears not to impact ND2 directly, but could act upon 478
other mtDNA-encoded genes, or indirectly on nDNA-encoded genes that produce structural 479
proteins imported into the mitochondria or on the joint mito-nuclear genotype, mito-nuclear 480
hybrids being selected against in the contact zone between two haplogroups (Dowling et al. 481
2008; Ballard and Melvin 2010). Of all reviewed cases of mito-nuclear discordance (Toews and 482
Page 24 of 101Evolution: For Review Only
123456789101112131415161718192021222324252627282930313233343536373839404142434445464748495051525354555657585960

25
Brelsford 2012), only two other studies, both involving birds, report association between mtDNA 483
and environmental variation in the presence of nuclear gene flow when evidence for previous 484
isolation is lacking. In the Rufous-collared Sparrow Zonotrichia capensis, mitochondrial but not 485
nuclear gene flow was significantly reduced along elevational gradients, suggesting that 486
mitochondrial haplotypes could be locally adapted (Cheviron and Brumfield 2009). A 487
relationship between a gradient of aridity and mitochondrial but not nuclear or morphological 488
diversity has been reported in the South African arid-zone endemic Karoo scrub-robin 489
Cercotrichas coryphaeus raising the possibility of common mechanisms for adaptations to 490
extreme environmental conditions (Ribeiro et al. 2011). Due to linked inheritance with the W-491
chromosome, mtDNA may also reflect female-specific selection on W-linked genes, as has been 492
demonstrated for the evolution of gene expression on the W-chromosome (Moghadam et al. 493
2012). Thus it may not be coincidental that all three studies (Cheviron and Brumfield 2009; 494
Ribeiro et al. 2011; the present study) reporting association between mtDNA and environmental 495
variation in the presence of nuclear gene flow are from birds. Whatever the mechanism, any 496
environmental selection acting on female-linked traits in E. australis would strongly inhibit the 497
sympatry of mitochondrial lineages across a climatic gradient associated with the Great Dividing 498
Range. 499
Conclusions 500
Our study of E. australis benefitted from a combination of landscape genetic, spatial 501
genetic and coalescent analyses of multiple locus types and environmental variables in building 502
an integrated understanding of evolutionary processes operating at different scales. It also 503
presents a striking example of how geographically structured mtDNA diversity can unreliably 504
reflect species’ evolutionary history when neutrality is assumed and not thoroughly tested. It is 505
Page 25 of 101 Evolution: For Review Only
123456789101112131415161718192021222324252627282930313233343536373839404142434445464748495051525354555657585960

26
beneficial to incorporate tests for the effect on genetic variation of geographic position and 506
environmental variation, in addition to IBD, into phylogeographic studies, and to try and tease 507
apart their almost inevitable correlations. Correlation between mitochondrial genetic variation 508
and geographic position, when distance is controlled for, warrants additional exploration of 509
potential selection pressures driving evolution of female-linked traits. Discovery of two highly 510
divergent haplogroups apparently under strong environmental selection within a putatively 511
continuous population of E. australis (possibly a common pattern for species whose range spans 512
environmental gradients) provides another example of divergence with gene flow (Pinho and 513
Hey 2010), which has potentially profound implications for management and taxonomy. The 514
evidence for female-linked environmental selection implies that mtDNA haplogroups are not 515
ecologically exchangeable sensu Crandall et al. (2000). For example, translocation among 516
haplogroup regions may result in negative fitness consequences, and on the evidence here would 517
be an inadvisable management strategy. Our study illustrates how the use of mtDNA as a 518
barcoding tool to define species or lineages (Baker et al. 2009) can be severely compromised 519
without the knowledge to appreciate the role of mtDNA-correlated selection in such units. 520
ACKNOWLEDGEMENTS 521
Funding was provided by the Australian Research Council Linkage Grant (LP0776322), 522
the Victorian Department of Sustainability and Environment (DSE), Museum of Victoria, 523
Victorian Department of Primary Industries, Parks Victoria, North Central Catchment 524
Management Authority, Goulburn Broken Catchment Management Authority, CSIRO 525
Ecosystem Sciences, and the Australian National Wildlife Collection Foundation. NA was 526
funded by a Monash University Faculty of Science Dean’s Postgraduate Scholarship and Birds 527
Australia with additional support from the Holsworth Wildlife Research Endowment. Blood 528
Page 26 of 101Evolution: For Review Only
123456789101112131415161718192021222324252627282930313233343536373839404142434445464748495051525354555657585960
27
samples from Victoria were collected under DSE permits (number 10004294 under the Wildlife 529
Act 1975 and the National Parks Act 1975, and number NWF10455 under section 52 of the 530
forest Act 1958). We thank Alan Lill, Naoko Takeuchi and other collectors of specimens and all 531
agencies who granted permission to collect specimens, Robert Palmer for curatorial assistance, 532
Suzanne Metcalfe for help with mitochondrial sequencing, and Katherine Harrisson for help with 533
nuclear sequencing. Computationally intensive analyses (STRUCTURE) were performed on the 534
Monash Sun Grid courtesy of Monash eResearch. We thank the UK NERC Genepool facility for 535
sequencing support. We are grateful to Darren Irwin, John Endler, Evolution editorial input 536
including that of Kenneth Petren, three anonymous reviewers for their comments on the earlier 537
drafts of the manuscript, to Thibaut Jombart for advice on analyses of spatial genetic structures, 538
Gaynor Dolman, Hugh Ford and Peter Teske for helpful discussions. 539
540
Page 27 of 101 Evolution: For Review Only
123456789101112131415161718192021222324252627282930313233343536373839404142434445464748495051525354555657585960

28
Table 1. Descriptive statistics for all samples and members of distinct mitochondrial clades for sequenced loci (Wet tropics individuals 541
belonging to clade A2 were not sequenced for nDNA). N ind- number of individuals, N alleles- Number of alleles, bp- base pairs, S-542
polymorphic sites, H-number of haplotypes, Hd- haplotype diversity (expected heterozygosity), π- nucleotide diversity, Rm- minimum 543
number of recombinant events, n/s- not significant (P>0.05), n/a- not applicable. Significant ΦST -values are in bold. 544
Locus Data N
ind
N
alleles
Length,
bp
Indels,
bp
S H Hd π Fu's Fs, P Tajima's D,
P
ΦST A1
vs B
Rm
AB4 autosomal
intron
All 44 88 196 1 2 3 0.447 0.0025 0.613 n/s 0.343 n/s 0.047
P=0.027
0
Clade A 20 40 196 1 1 3 0.405 0.0022 -0.078 n/s 0.565 n/s
Clade B 22 44 195 0 2 3 0.519 0.0030 0.609 n/s 0.474 n/s
GAPDH autosomal
intron
All 46 92 317 0 8 10 0.818 0.0047 -2.217 n/s -0.147 n/s 0.065
P=0.009
1
Clade A 21 42 317 0 6 8 0.866 0.0054 -1.263 n/s 0.577 n/s
Clade B 23 46 317 0 6 6 0.723 0.0036 -0.742 n/s -0.432 n/s
GTP autosomal
intron
All 42 84 456 1 8 10 0.410 0.0011 -8.403
P<0.001
-1.942
P<0.001
0.034
P=0.018
0
Clade A 19 38 456 0 4 5 0.292 0.0007 -3.671
P=0.001
-1.630
P=0.016
Page 28 of 101Evolution: For Review Only
123456789101112131415161718192021222324252627282930313233343536373839404142434445464748495051525354555657585960

29
Clade B 21 42 456 1 7 8 0.535 0.0018 -4.128
P=0.004
-1.502
P=0.056
MUSK-
I3
Z-linked
intron
All 31 51 519 0 21 15 0.810 0.0078 -2.240 n/s -0.416 n/s 0.061
P=0.072
3
Clade A 20 32 519 0 17 9 0.673 0.0065 -0.114 n/s -0.671 n/s
Clade B 11 17 519 0 18 10 0.919 0.0102 0.516 n/s -0.033 n/s
RI2 autosomal
intron
All 47 94 292 0 2 2 0.021 0.0002 -1.421 n/s -1.386 n/s -0.001
n/s
0
Clade A 22 44 292 0 0 1 0.000 0.0000 0 n/a 0 n/s
Clade B 23 46 292 0 2 2 0.044 0.0003 -0.783 n/s -1.473
P=0.03
TGFβ2 autosomal
intron
All 39 78 595 1 24 19 0.870 0.0070 -3.420 n/s -0.443 n/s 0.007
n/s
4
Clade A 20 40 595 0 23 16 0.868 0.0075 -3.465 n/s -0.599 n/s
Clade B 17 34 594 1 12 9 0.857 0.0066 0.553 n/s 0.935 n/s
ND2 mt coding All 100 100 1002 0 102 40 0.908 0.0334 2.785 n/s 2.303
P=0.01
0.968
P<0.001
n/a
mt coding Clades 97 97 1002 0 94 38 0.902 0.0332 3.382 n/s 2.704
Page 29 of 101 Evolution: For Review Only
123456789101112131415161718192021222324252627282930313233343536373839404142434445464748495051525354555657585960

30
A1+B P=0.002
Clade A1 53 97 1002 0 26 20 0.738 0.0017 -16.418
P<0.001
-2.276
P<0.001
Clade A2 3 97 1002 0 2 2 0.667 0.0013 - -
Clade B 44 97 1002 0 16 18 0.901 0.0023 -10.728
P<0.001
-1.158 n/s
545
Page 30 of 101Evolution: For Review Only
123456789101112131415161718192021222324252627282930313233343536373839404142434445464748495051525354555657585960

31
Table 2. Redundancy (RDA) analysis: separating the effect of IBD and geographic position (latitude and longitude analyzed together) 546
on multivariate distribution of allele frequencies (presence-absence) for six microsatellites and nuclear loci. Distance- geographic 547
distance (represented as a rectangular matrix of pcnm axes), Geography - joint effect of latitude and longitude, N pcnm axes- number 548
of significant pcnm axes representing geographic distance. Marginal tests show the relationship between allele frequencies and either 549
distance or geographic position alone. Conditional tests show the same relationships, but having first fitted the alternative variable 550
(geographic position and distance, respectively) as the covariates in the analyses. Significant P-values (P<0.05) are in bold. 551
Marginal tests Conditional tests
Locus (Loci)
N pcnm
axes
Predictor
Variable tested F P
% variance
explained
Variables
fitted first F P
% variance
explained
Microsatellites 3 Distance 2.62 0.005 9.1 Geography 1.4 0.017 5.2
Geography 3.15 0.005 7.3 Distance 1.33 0.107 3.3
AB4 2 Distance 0.41 0.87 1.9 Geography 1.58 0.19 7.5
Geography 2.44 0.049 10.7 Distance 3.6 0.023 15.7
GAPDH 3 Distance 1.96 0.015 12.3 Geography 1.58 0.08 10.6
Geography 3.14 0.005 12.8 Distance 2.5 0.015 11.1
GTP 3 Distance 1.8 0.015 12.4 Geography 1.53 0.08 11.3
Geography 1.92 0.01 9.0 Distance 1.53 0.15 7.8
Page 31 of 101 Evolution: For Review Only
123456789101112131415161718192021222324252627282930313233343536373839404142434445464748495051525354555657585960
32
MUSK-I3 2 Distance 2.02 0.037 18.3 Geography 1.69 0.07 16.9
Geography 3.27 0.005 18.9 Distance 2.65 0.01 17.5
TGFβ2 2 Distance 1.6 0.03 12.0 Geography 1.53 0.07 12.2
Geography 1.51 0.069 7.74 Distance 1.43 0.14 8.1
Page 32 of 101Evolution: For Review Only
123456789101112131415161718192021222324252627282930313233343536373839404142434445464748495051525354555657585960
33
Table 3. Results of dbRDA analysis: tests of relationship between multivariate mtDNA genetic 552
variation (defined by pairwise mtDNA genetic distances) and several predictor variables 553
(geographic and environmental). The first row for each tested predictor is a marginal test for that 554
variable, the next four rows are conditional (partial) tests where variables given in second 555
column are partialed out (fitted before the variable being tested). Last column indicates 556
percentage of multivariate genetic variation explained by variable being tested. Max.temp- 557
maximum temperature of warmest month, Precipitation- precipitation of driest month, All- all 558
variables except the one being tested. Longitude was not a significant predictor of genetic 559
distance in the marginal test (F=0.34, P=0.59), and was not used for partial tests. Significant P-560
values (P<0.05) are in bold. 561
Predictor variable tested Variables fitted first
in partial tests
F P(>F) % variance
explained
Geographic distance 3.3 0.072 3.3
Latitude 26.6 0.005 21.9
Max.temp 0.6 0.42 0.6
Precipitation 1.6 0.24 1.6
All 7.5 0.01 7.5
Latitude 31.1 0.005 24.5
Geographic distance 60.9 0.005 39.0
Max.temp 12.3 0.005 11.5
Precipitation 4.4 0.030 4.6
All 11.6 0.005 11.1
Max.temp 100 0.005 51.1
Geographic distance 94.1 0.005 49.7
Page 33 of 101 Evolution: For Review Only
123456789101112131415161718192021222324252627282930313233343536373839404142434445464748495051525354555657585960

34
Latitude 70.6 0.005 42.6
Geog. distance + latitude 57.8 0.005 38.1
Precipitation 27.0 0.005 22.0
All 33.2 0.005 26.3
Precipitation 86.4 0.005 47.4
Geographic distance 82.4 0.005 46.5
Latitude 47.6 0.005 33.4
Geog. distance + latitude 18.8 0.005 16.7
Max.temp 18.3 0.005 16.1
All 0.7 0.38 0.8
562
Page 34 of 101Evolution: For Review Only
123456789101112131415161718192021222324252627282930313233343536373839404142434445464748495051525354555657585960
35
LITERATURE CITED 563
Baker, A. J., E. S. Tavares, and R. F. Elbourne. 2009. Countering criticisms of single 564
mitochondrial DNA gene barcoding in birds. Molecular Ecology Resources 9:257-268. 565
Balakrishnan, C. N., and S. V. Edwards. 2009. Nucleotide variation, linkage disequilibrium and 566
founder-facilitated speciation in wild populations of the zebra finch (Taeniopygia 567
guttata). Genetics 181:645. 568
Ballard, J. W. O., and R. G. Melvin. 2010. Linking the mitochondrial genotype to the organismal 569
phenotype. Mol Ecol 19:1523-1539. 570
Ballard, J. W. O., and M. C. Whitlock. 2004. The incomplete natural history of mitochondria. 571
Mol Ecol 13:729-744. 572
Bandelt, H.-J., P. Forster, and A. Roehl. 1999. Median-joining networks for inferring 573
intraspecific phylogenies. Molecular Biology & Evolution 16:37-48. 574
Barrett, G., A. Silcocks, S. Barry, R. Cunningham, and R. Poulter. 2003. The New Atlas of 575
Australian Birds. Royal Australasian Ornithologists Union, Melbourne. 576
Barrows, T. T., J. O. Stone, L. K. Fifield, and R. G. Cresswell. 2001. Late Pleistocene glaciation 577
of the Kosciuszko Massif, Snowy Mountains, Australia. Quat. Res. 55:179-189. 578
Bazin, E., S. Glemin, and N. Galtier. 2006. Population size does not influence mitochondrial 579
genetic diversity in animals. Science 312:570-572. 580
Bensch, S., D. E. Irwin, J. H. Irwin, L. Kvist, and S. Akesson. 2006. Conflicting patterns of 581
mitochondrial and nuclear DNA diversity in Phylloscopus warblers. Mol Ecol 15:161-582
171. 583
Bensch, S., T. Price, and J. Kohn. 1997. Isolation and characterization of microsatellite loci in a 584
Phylloscopus warbler. Mol Ecol 6:91-92. 585
Page 35 of 101 Evolution: For Review Only
123456789101112131415161718192021222324252627282930313233343536373839404142434445464748495051525354555657585960
36
Borcard, D., and P. Legendre. 2002. All-scale spatial analysis of ecological data by means of 586
principal coordinates of neighbour matrices. Ecol Model 153:51-68. 587
Bowman, D. M. J. S., G. K. Brown, M. F. Braby, J. R. Brown, L. G. Cook, M. D. Crisp, F. Ford, 588
S. Haberle, J. Hughes, Y. Isagi, L. Joseph, J. McBride, G. Nelson, and P. Y. Ladiges. 589
2010. Biogeography of the Australian monsoon tropics. J Biogeogr 37:201-216. 590
Busby, J. R. 1991. BIOCLIM a bioclimatic analysis and prediction system. Pp. 64–68 in C. R. 591
Margules, and M. P. Austin, eds. Nature Conservation: Cost Effective Biological Surveys 592
and Data Analysis. CSIRO, Canberra. 593
Butlin, R., D. Schluter, and J. R. Bridle. 2009. Speciation and patterns of diversity. Cambridge 594
University Press, Cambridge, UK. 595
Byrne, M., D. Steane, L. Joseph, D. Yeates, G. Jordan, D. Crayn, K. Aplin, D. Cantrill, L. G. 596
Cook, M. D. Crisp, J. S. Keogh, J. Melville, C. Moritz, N. Porch, J. M. K. Sniderman, P. 597
Sunnucks, and P. H. Weston. 2011. Decline of a biome: evolution, contraction, 598
fragmentation, extinction and invasion of the Australian mesic zone biota. J Biogeogr In 599
press. 600
Chen, C., E. Durand, F. Forbes, and O. Francois. 2007. Bayesian clustering algorithms 601
ascertaining spatial population structure: a new computer program and a comparison 602
study. Mol Ecol Notes 7:747-756. 603
Cheviron, Z. A., and R. T. Brumfield. 2009. Migration-selection balance and local adaptation of 604
mitochondrial haplotypes in rufous-collared sparrows (Zonotrichia capensis) along an 605
elevational gradient. Evolution 63:1593-1605. 606
Page 36 of 101Evolution: For Review Only
123456789101112131415161718192021222324252627282930313233343536373839404142434445464748495051525354555657585960
37
Christidis, L., M. Irestedt, D. Rowe, W. E. Boles, and J. A. Norman. 2011. Mitochondrial and 607
nuclear DNA phylogenies reveal a complex evolutionary history in the Australasian 608
robins (Passeriformes: Petroicidae). Mol Phylogenet Evol 61:726–738. 609
Coyne, J., and H. A. Orr. 2004. Speciation. Sinauer, Sunderland, Massachusetts. 610
Crandall, K. A., O. R. P. Bininda-Emonds, G. M. Mace, and R. K. Wayne. 2000. Considering 611
evolutionary processes in conservation biology. Trends Ecol Evol 15:290-295. 612
Debus, S. J. S., and H. A. Ford. 2012. Responses of Eastern Yellow Robins Eopsaltria australis 613
to translocation into vegetation remnants in a fragmented landscape. Pac Conserv Biol in 614
press. 615
Dixon, P. 2003. VEGAN, a package of R functions for community ecology. J Veg Sci 14:927-616
930. 617
Doerr, E. D. 2005. Characterization of microsatellite loci in the brown treecreeper (Climacteris 618
picumnus) and cross-species amplification in the white-throated treecreeper (Cormobates 619
leucophaeus). Mol Ecol Notes 5:654-656. 620
Dowling, D., U. Friberg, and J. Lindell. 2008. Evolutionary implications of non-neutral 621
mitochondrial genetic variation. Trends Ecol Evol 23:546-554. 622
Dowling, D. K., G. J. Adcock, and R. A. Mulder. 2003. Novel polymorphic microsatellite 623
markers for paternity analysis in the red-capped robin (Petroica goodenovii: Aves). Mol 624
Ecol Notes 3:517-519. 625
Drummond, A., and A. Rambaut. 2007. BEAST: Bayesian evolutionary analysis by sampling 626
trees. BMC Evol Biol 7:214. 627
Page 37 of 101 Evolution: For Review Only
123456789101112131415161718192021222324252627282930313233343536373839404142434445464748495051525354555657585960

38
Drummond, A. J., B. Ashton, S. Buxton, M. Cheung, A. Cooper, J. Heled, M. Kearse, R. Moir, 628
S. Stones-Havas, S. Sturrock, T. Thierer, and A. Wilson. 2010. Geneious v5.1. Available 629
from http://www.geneious.com. 630
Drummond, A. J., M. A. Suchard, D. Xie, and A. Rambaut. 2012. Bayesian phylogenetics with 631
BEAUti and the BEAST 1.7. Mol Biol Evol 29:1969-1973. 632
Excoffier, L., G. Laval, and S. S. 2005. Arlequin ver. 3.0: An integrated software package for 633
population genetics data analysis. Evolutionary Bioinformatics Online 1:47-50. 634
Ford, J. C. 1979. Speciation or Subspeciation in the Yellow Robins? Emu 79:103-106. 635
Fu, Y.-X. 1997. Statistical tests of neutrality of mutations against population growth, hitchhiking 636
and backgroud selection. Genetics 147:915-925. 637
Garrick, R. C., P. Sunnucks, and R. J. Dyer. 2010. Nuclear gene phylogeography using PHASE: 638
dealing with unresolved genotypes, lost alleles, and systematic bias in parameter 639
estimation. BMC Evol Biol 10:118. 640
Geffen, E. L. I., M. J. Anderson, and R. K. Wayne. 2004. Climate and habitat barriers to 641
dispersal in the highly mobile grey wolf. Mol Ecol 13:2481-2490. 642
Grantham, R. 1974. Amino acid difference formula to help explain protein evolution. Science 643
185:862-864. 644
Griffiths, R., M. C. Double, K. Orr, and R. J. G. Dawson. 1998. A DNA test to sex most birds. 645
Mol Ecol 7:1071-1075. 646
Hackett, S. J. 1996. Molecular Phylogenetics and Biogeography of Tanagers in the Genus 647
Ramphocelus (Aves). Mol Phylogenet Evol 5:368-382. 648
Page 38 of 101Evolution: For Review Only
123456789101112131415161718192021222324252627282930313233343536373839404142434445464748495051525354555657585960

39
Hanotte, O., C. Zanon, A. Pugh, C. Greig, A. Dixon, and T. Burke. 1994. Isolation and 649
characterization of microsatellite loci in a passerine bird: The reed bunting Emberiza 650
schoeniclus. Mol Ecol 3:529-530. 651
Harrison, R. G. 1989. Animal mitochondrial DNA as a genetic marker in population and 652
evolutionary biology. Trends Ecol. Evol. 4(1):6-11. 653
Harrisson, K., A. Pavlova, J. N. Amos, N. Takeuchi, A. Lill, J. Q. Radford, and P. Sunnucks. 654
2012. Fine-scale effects of habitat loss and fragmentation despite large-scale gene flow 655
for some regionally declining woodland bird species. Landsc Ecol 27:813-827. 656
Hey, J., and R. Nielsen. 2004. Multilocus methods for estimating population sizes, migration 657
rates and divergence time, with applications to the divergence of Drosophila 658
pseudoobscura and D-persimilis. Genetics 167:747-760. 659
Hey, J., and R. Nielsen. 2007. Integration within the Felsenstein equation for improved Markov 660
chain Monte Carlo methods in population genetics. Proceedings of the National Academy 661
of Sciences 104:2785-2790. 662
Higgins, P. J., and J. M. Peter, eds. 2002. Handbook of Australian, New Zealand and Antarctic 663
Birds. Volume 6: Pardalotes to Shrike-thrushes. Oxford University Press, Melbourne. 664
Hijmans, R. J., S. E. Cameron, J. L. Parra, P. G. Jones, and A. Jarvis. 2005. Very high resolution 665
interpolated climate surfaces for global land areas. International Journal of Climatology 666
25:1965–1978. 667
Hijmans, R. J. 2009. DIVA-GIS, version 7. A geographic information system for the analysis of 668
biodiversity data. Available at: http://www.diva-gis.org. 669
Hogner, S., T. Laskemoen, J. T. Lifjeld, J. Porkert, O. Kleven, T. Albayrak, B. Kabasakal, and 670
A. Johnsen. 2012. Deep sympatric mitochondrial divergence without reproductive 671
Page 39 of 101 Evolution: For Review Only
123456789101112131415161718192021222324252627282930313233343536373839404142434445464748495051525354555657585960

40
isolation in the common redstart Phoenicurus phoenicurus. Ecology and Evolution doi: 672
10.1002/ece3.398. 673
Hudson, R. R., and N. L. Kaplan. 1985. Statistical properties of the number of recombination 674
events in the history of a sample of DNA sequences. Genetics 111:147. 675
Irwin, D. E. 2002. Phylogeographic breaks without geographic barriers to gene flow. Evolution 676
56:2383-2394. 677
Irwin, D. E., S. Bensch, J. H. Irwin, and T. D. Price. 2005. Speciation by distance in a ring 678
species. Science 307:414-416. 679
Irwin, D. E. 2012. Local adaptation along smooth ecological gradients causes phylogeographic 680
breaks and phenotypic clustering. The American Naturalist 180:35-49. 681
Jombart, T. 2008. Adegenet: a R package for the multivariate analysis of genetic markers. 682
Bioinformatics 24:1403-1405. 683
Jombart, T., S. Devillard, A. B. Dufour, and D. Pontier. 2008. Revealing cryptic spatial patterns 684
in genetic variability by a new multivariate method. Heredity 101:92-103. 685
Kearns, A. M., L. Joseph, S. V. Edwards, and M. C. Double. 2009. Inferring the phylogeography 686
and evolutionary history of the splendid fairy-wren Malurus splendens from 687
mitochondrial DNA and spectrophotometry. J Avian Biol 40:7-17. 688
Legendre, P., and M. J. Anderson. 1999. Distance-based redundancy analysis: Testing 689
multispecies responses in multifactorial ecological experiments. Ecol Monogr 69:1-24. 690
Legendre, P., and M.-J. Fortin. 2010. Comparison of the Mantel test and alternative approaches 691
for detecting complex multivariate relationships in the spatial analysis of genetic data. 692
Molecular ecology resources 10:831-844. 693
Page 40 of 101Evolution: For Review Only
123456789101112131415161718192021222324252627282930313233343536373839404142434445464748495051525354555657585960

41
Lerner, H. R. L., M. Meyer, H. F. James, M. Hofreiter, and R. C. Fleischer. 2011. Multilocus 694
Resolution of Phylogeny and Timescale in the Extant Adaptive Radiation of Hawaiian 695
Honeycreepers. Curr Biol 21:1838-1844. 696
Librado, P., and J. Rozas. 2009. DnaSP v5: a software for comprehensive analysis of DNA 697
polymorphism data. Bioinformatics 25:1451. 698
Lohse, K., B. Sharanowski, and G. N. Stone. 2010. Quantifying the Pleistocene history of the 699
oak gall parasitoid Cecidostiba fungosa using twenty intron loci. Evolution 64:2664-700
2681. 701
Loynes, K., L. Joseph, and J. S. Keogh. 2009. Multi-locus phylogeny clarifies the systematics of 702
the Australo-Papuan robins (Family Petroicidae, Passeriformes). Mol Phylogenet Evol 703
53:212-219. 704
Maguire, G. S., P. J. Guay, and R. A. Mulder. 2006. Isolation and characterization of 705
microsatellite markers in the southern emu-wren (Stipiturus malachurus: Aves). Mol 706
Ecol Notes 6:422-424. 707
Malekian, M., S. J. B. Cooper, J. A. Norman, L. Christidis, and S. M. Carthew. 2010. Molecular 708
systematics and evolutionary origins of the genus Petaurus (Marsupialia: Petauridae) in 709
Australia and New Guinea. Mol Phylogenet Evol 54:122-135. 710
McCracken, K. G., and M. D. Sorenson. 2005. Is homoplasy or lineage sorting the source of 711
incongruent mtDNA and nuclear gene trees in the stiff-tailed ducks (Nomonyx-Oxyura)? 712
Syst Biol 54:35. 713
McDonald, J. H., and M. Kreitman. 1991. Adaptive protein evolution at the Adh locus in 714
Drosophila. Nature 351:652-654. 715
Page 41 of 101 Evolution: For Review Only
123456789101112131415161718192021222324252627282930313233343536373839404142434445464748495051525354555657585960

42
Meiklejohn, C. D., K. L. Montooth, and D. M. Rand. 2007. Positive and negative selection on 716
the mitochondrial genome. Trends Genet 23:259-263. 717
Mishmar, D., E. Ruiz-Pesini, P. Golik, V. Macaulay, A. G. Clark, S. Hosseini, M. Brandon, K. 718
Easley, E. Chen, and M. D. Brown. 2003. Natural selection shaped regional mtDNA 719
variation in humans. Proceedings of the National Academy of Sciences 100:171. 720
Moghadam, H. K., M. A. Pointer, A. E. Wright, S. Berlin, and J. E. Mank. 2012. W chromosome 721
expression responds to female-specific selection. Proceedings of the National Academy 722
of Sciences 109:8207-8211. 723
Nosil, P., S. P. Egan, and D. J. Funk. 2008. Heterogeneous genomic differentiation between 724
walking-stick ecotypes: ‘‘Isolation by adaptation’’ and multiple roles for divergent 725
selection. Evolution 62:316–336. 726
Oksanen, J., F. G. Blanchet, R. Kindt, P. Legendre, R. B. O'Hara, G. L. Simpson, P. Solymos, M. 727
Henry, H. Stevens, and H. Wagner. 2011. vegan: Community Ecology Package. R 728
package version 1.17-11. 729
Petit, R. J., and L. Excoffier. 2009. Gene flow and species delimitation. Trends Ecol Evol 730
24:386-393. 731
Phillips, S., R. Anderson, and R. Schapire. 2006. Maximum entropy modeling of species 732
geographic distributions. Ecol Model 190:231-259. 733
Pinho, C., and J. Hey. 2010. Divergence with Gene Flow: Models and Data. Annual Review of 734
Ecology, Evolution, and Systematics 41:215-230. 735
Price, T. 2008. Speciation in birds. Roberts and Company Publishers., Greenwood Village, 736
Colorado. 737
Page 42 of 101Evolution: For Review Only
123456789101112131415161718192021222324252627282930313233343536373839404142434445464748495051525354555657585960
43
Primmer, C. R., A. P. Moller, and H. Ellegren. 1995. Resolving genetic relationships with 738
microsatellite markers: A parentage testing system for the swallow Hirundo rustica. Mol 739
Ecol 4:493-498. 740
Pritchard, J. K., M. Stephens, and P. Donnelly. 2000. Inference of population structure using 741
multilocus genotype data. Genetics 155:945-959. 742
R Development Core Team. 2011. R: A Language and Environment for Statistical Computing. R 743
Foundation for Statistical Computing, Vienna, Austria. 744
Rand, D. M., R. A. Haney, and A. J. Fry. 2004. Cytonuclear coevolution: the genomics of 745
cooperation. Trends Ecol Evol 19:645-653. 746
Ribeiro, Â. M., P. Lloyd, and R. C. K. Bowie. 2011. A tight balance between natural selection 747
and gene flow in a southern African arid-zone endemic bird. Evolution DOI: 748
10.1111/j.1558-5646.2011.01397.x. 749
Schneider, C. J., T. B. Smith, B. Larison, and C. Moritz. 1999. A test of alternative models of 750
diversification in tropical rainforests: Ecological gradients vs. rainforest refugia. Proc 751
Natl Acad Sci U S A 96:13869-13873. 752
Schodde, R., and I. J. Mason. 1999. The directory of Australian birds. A taxonomic and 753
zoogeographic atlas of the biodiversity of birds in Australia and its Territories. 754
Passerines. CSIRO Publishing Collingwood. 755
Shen, Y. Y., L. Liang, Z. H. Zhu, W. P. Zhou, D. M. Irwin, and Y. P. Zhang. 2010. Adaptive 756
evolution of energy metabolism genes and the origin of flight in bats. Proceedings of the 757
National Academy of Sciences 107:8666-8671. 758
Smadja, C. M., and R. K. Butlin. 2011. A framework for comparing processes of speciation in 759
the presence of gene flow. Mol Ecol 20:5123–5140. 760
Page 43 of 101 Evolution: For Review Only
123456789101112131415161718192021222324252627282930313233343536373839404142434445464748495051525354555657585960

44
Sorenson, M. D., J. C. Ast, D. E. Dimcheff, T. Yuri, and D. P. Mindell. 1999. Primers for a PCR-761
Based Approach to Mitochondrial Genome Sequencing in Birds and Other Vertebrates. 762
Mol Phylogenet Evol 12:105-114. 763
Sorenson, M. D., C. N. Balakrishnan, and R. B. Payne. 2004. Clade-limited colonization in 764
brood parasitic finches (Vidua spp.). Syst Biol 53:140. 765
Spottiswoode, C. N., K. F. Stryjewski, S. Quader, J. F. R. Colebrook-Robjent, and M. D. 766
Sorenson. 2011. Ancient host specificity within a single species of brood parasitic bird. 767
Proceedings of the National Academy of Sciences 108:17738-17742. 768
Stephens, M., and P. Donnelly. 2003. A comparison of bayesian methods for haplotype 769
reconstruction from population genotype data. The American Journal of Human Genetics 770
73:1162-1169. 771
Stephens, M., N. J. Smith, and P. Donnelly. 2001. A new statistical method for haplotype 772
reconstruction from population data. The American Journal of Human Genetics 68:978-773
989. 774
Sunnucks, P., M. J. Blacket, J. M. Taylor, C. J. Sands, S. A. Ciavaglia, R. C. Garrick, N. N. Tait, 775
D. M. Rowell, and A. Pavlova. 2006. A tale of two flatties: different responses of two 776
terrestrial flatworms to past environmental climatic fluctuations at Tallaganda in montane 777
southeastern Australia. Mol Ecol 15:4513-4531. 778
Symula, R., J. S. Keogh, and D. C. Cannatella. 2008. Ancient phylogeographic divergence in 779
southeastern Australia among populations of the widespread common froglet, Crinia 780
signifera. Mol Phylogenet Evol 47:569-580. 781
Tajima, F. 1996. The amount of DNA polymorphism maintained in a finite population when the 782
neutral mutation rate varies among sites. Genetics 143:1457-1465. 783
Page 44 of 101Evolution: For Review Only
123456789101112131415161718192021222324252627282930313233343536373839404142434445464748495051525354555657585960

45
Tamura, K., D. Peterson, N. Peterson, G. Stecher, M. Nei, and S. Kumar. 2011. MEGA5: 784
Molecular Evolutionary Genetics Analysis using Maximum Likelihood, Evolutionary 785
Distance, and Maximum Parsimony Methods. Mol Biol Evol (submitted). 786
Tieleman, B. I., M. A. Versteegh, A. Fries, B. Helm, N. J. Dingemanse, H. L. Gibbs, and J. B. 787
Williams. 2009. Genetic modulation of energy metabolism in birds through 788
mitochondrial function. Proceedings of the Royal Society B: Biological Sciences 789
276:1685. 790
Tieleman, B. I., J. B. Williams, and P. Bloomer. 2003. Adaptation of metabolism and 791
evaporative water loss along an aridity gradient. Proceedings of the Royal Society of 792
London. Series B: Biological Sciences 270:207. 793
Toews, D. P. L., and A. Brelsford. 2012. The biogeography of mitochondrial and nuclear 794
discordance in animals. Mol Ecol 21:3907-3930. 795
Tonnis, B., P. R. Grant, B. R. Grant, and K. Petren. 2005. Habitat selection and ecological 796
speciation in Galápagos warbler finches (Certhidea olivacea and Certhidea fusca). 797
Proceedings of the Royal Society B: Biological Sciences 272:819-826. 798
Turmelle, A. S., T. H. Kunz, and M. D. Sorenson. 2011. A tale of two genomes: contrasting 799
patterns of phylogeographic structure in a widely distributed bat. Mol Ecol. 800
Vallender, R., R. J. Robertson, V. L. Friesen, and I. J. Lovette. 2007. Complex hybridization 801
dynamics between golden-winged and blue-winged warblers (Vermivora chrysoptera and 802
Vermivora pinus) revealed by AFLP, microsatellite, intron and mtDNA markers. Mol 803
Ecol 16:2017-2029. 804
Page 45 of 101 Evolution: For Review Only
123456789101112131415161718192021222324252627282930313233343536373839404142434445464748495051525354555657585960

46
Via, S. 2012. Divergence hitchhiking and the spread of genomic isolation during ecological 805
speciation-with-gene-flow. Philosophical Transactions of the Royal Society B: Biological 806
Sciences 367:451-460. 807
Waltari, E., and S. V. Edwards. 2002. Evolutionary dynamics of intron size, genome size, and 808
physiological correlates in archosaurs. Am Nat:539-552. 809
Webb, W. C., J. M. Marzluff, and K. E. Omland. 2011. Random interbreeding between cryptic 810
lineages of the Common Raven: evidence for speciation in reverse. Mol Ecol 20:2390-811
2402. 812
Williams, J. B., and B. I. Tieleman. 2005. Physiological adaptation in desert birds. Bioscience 813
55:416-425. 814
Zink, R. M., and G. F. Barrowclough. 2008. Mitochondrial DNA under siege in avian 815
phylogeography. Mol Ecol 17:2107-2121. 816
Zink, R. M., A. Pavlova, S. Drovetski, and S. Rohwer. 2008. Mitochondrial phylogeographies of 817
five widespread Eurasian bird species. Journal of Ornithology 149:399-413. 818
Page 46 of 101Evolution: For Review Only
123456789101112131415161718192021222324252627282930313233343536373839404142434445464748495051525354555657585960

47
FIGURE CAPTIONS 819
Figure 1. (a) Sampling localities (dots) and geographic distribution of mitochondrial haplogroups 820
(colors): light red dots - A1, dark red dots - A2, black dots - B; numbers show distribution of 821
haplotypes (labeled as on Fig. 3). Insets show two locations where both haplogroups were 822
sampled: in Tenterfield, a haplogroup A male was collected on the same day from the same 823
group of birds as a haplogroup B male and female; in Shelbourne, a haplogroup B male and 824
haplogroup A male were caught in May and October 2008, respectively. (b) Distribution of Q-825
values (pie charts within circles) for two microsatellite genetic clusters (‘red’ and ‘black’), 826
detected by STRUCTURE; each circle’s outer border color shows the mitochondrial haplogroup for 827
each individual: light red - A1, dark red - A2, black - B; samples are spaced apart for easier 828
viewing. Altitudinal layers of the Great Dividing Range are: light grey - 200 to 500 m, grey - 500 829
to 1000 m, dark grey - above 1000 m. 830
831
Figure 2. Haplotype networks for mitochondrial ND2 and six nuclear introns. Circles indicate 832
unique haplotypes, with area proportional to haplotype frequency. Connections between circles 833
are a single mutation unless indicated otherwise (italic). Colors correspond to the haplogroups: 834
grey- A (light grey - A1, corresponding to light red dots on Fig. 1A, dark grey - A2 [two 835
haplotypes, H9 and H12, on mtDNA network], dark red dot on Fig. 1A), white - B (black dots on 836
Fig. 1A); black pies on nuclear networks indicate individuals sequenced for nDNA but not for 837
mtDNA (thus, mtDNA haplogroup for these individuals was unknown). 838
839
Figure 3. Geographic distribution of spatial principal component (sPCA) scores for 840
mitochondrial ND2 (mt-sPC1 and mt-sPC2), microsatellites (msat-sPC1 and msat-sPC2), 841
Page 47 of 101 Evolution: For Review Only
123456789101112131415161718192021222324252627282930313233343536373839404142434445464748495051525354555657585960
48
GAPDH (GAPDH-sPC1) and MUSK-I3 (MUSK-I3-sPC1). Large black squares indicate samples 842
well differentiated from those denoted by large white squares, small squares are less 843
differentiated. Lines indicate values of sPCA scores for interpolated surface (lags). Narrowly 844
spread lines and a lack of small squares indicate discontinuity or sharp geographic transition 845
between two groups (as for mtDNA). Presence of smaller squares and broadly spread lines 846
indicate a cline (as for microsatellites). 847
848
Figure 4. Distribution of two major mtDNA lineages of Eopsaltria australis in environmental 849
space, as defined by two BIOCLIM variables, max temperature of warmest month and 850
precipitation of driest month. Two localities where both haplogroups occurred together are 851
marked with arrows.852
853
Page 48 of 101Evolution: For Review Only
123456789101112131415161718192021222324252627282930313233343536373839404142434445464748495051525354555657585960
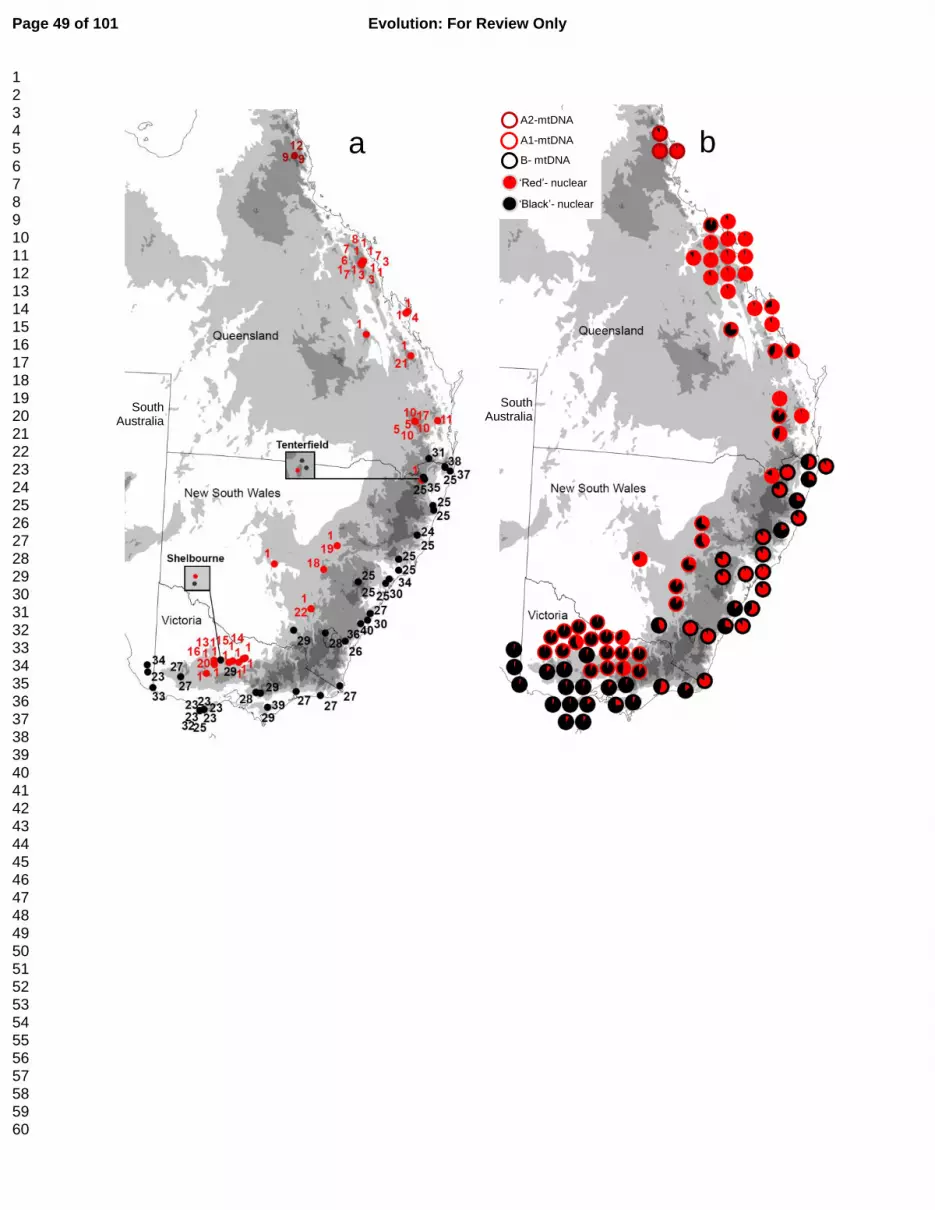
A1-mtDNA
B- mtDNA
A2-mtDNA
‘Red’- nuclear
‘Black’- nuclear
South Australia
South Australia
a b
Page 49 of 101 Evolution: For Review Only
123456789101112131415161718192021222324252627282930313233343536373839404142434445464748495051525354555657585960

H30
H31
H35H37
H24
H25
H38
H40
H36
H34
H33
H39
H27
H26
H32
H23
H29
H28
H16H8
H20
53 mutations
10 mutations
H4
H12H9
H19
H3 H7
H2
H22
H14
H15
H13
H17
H10
H11
H5
H21
H1
H18
H6
2
42
2
2
2
2
2
4
3
2
2
3
2
3
2
2
2
2
ND2 AB4 GAPDH
GTP MUSK-I4
TGFβ2
RI2
Page 50 of 101Evolution: For Review Only
123456789101112131415161718192021222324252627282930313233343536373839404142434445464748495051525354555657585960

Mt-sPC1 Mt-sPC2
Msat-sPC2Msat-sPC1
GAPDH-sPC1
MUSK-I4-sPC1I3
Page 51 of 101 Evolution: For Review Only
123456789101112131415161718192021222324252627282930313233343536373839404142434445464748495051525354555657585960
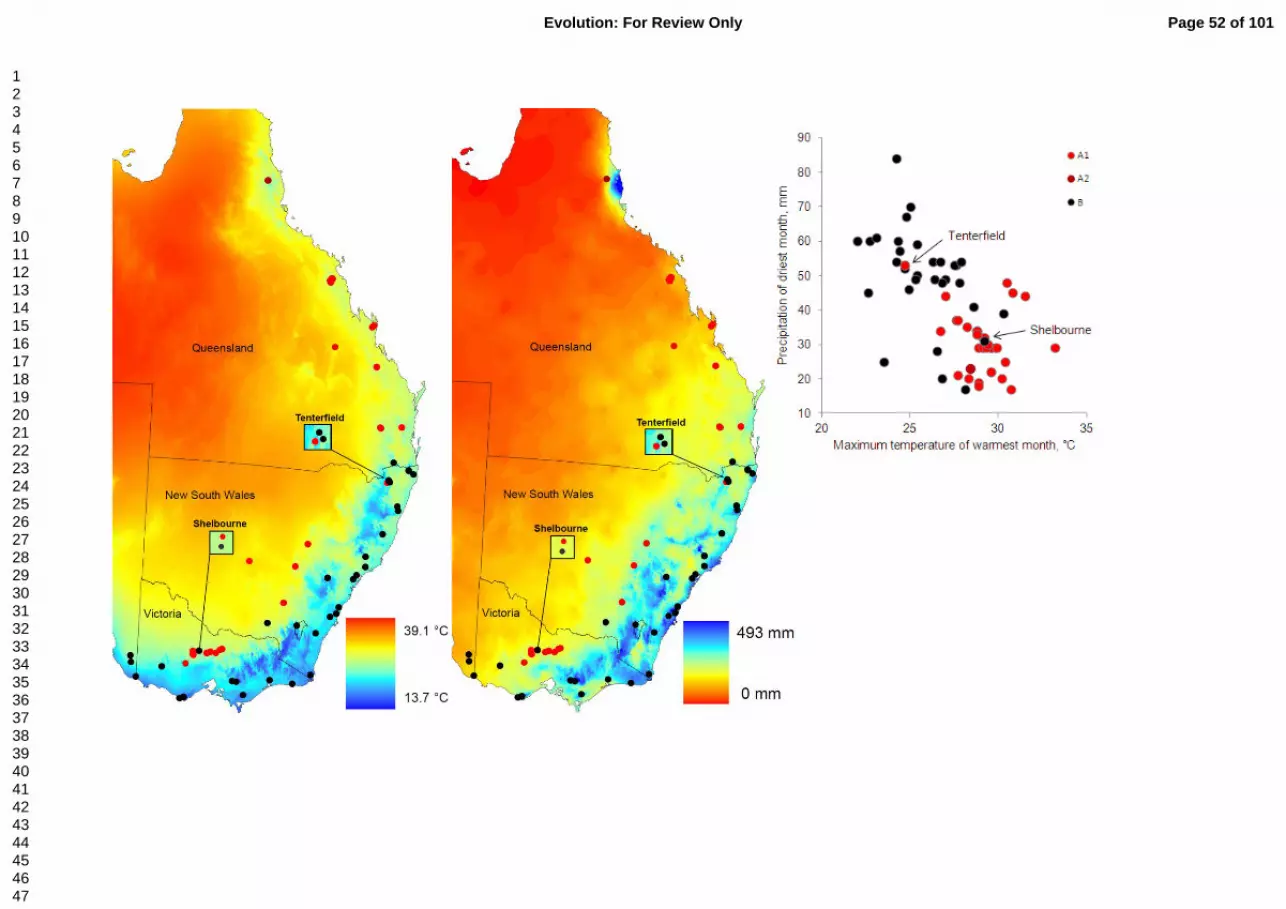
Page 52 of 101Evolution: For Review Only
123456789101112131415161718192021222324252627282930313233343536373839404142434445464748495051525354555657585960

1
PERCHED AT THE MITO-NUCLEAR CROSSROADS: DIVERGENT MITOCHONDRIAL LINEAGES
CORRELATE WITH ENVIRONMENT IN THE FACE OF ONGOING NUCLEAR GENE FLOW IN AN
AUSTRALIAN BIRD
Alexandra Pavlova1, J. Nevil Amos1, Leo Joseph2 , Kate Loynes3, Jeremy J. Austin4,5, J. Scott
Keogh3, Graham N. Stone6, James A. Nicholls6, and Paul Sunnucks1
1School of Biological Sciences and Australian Centre for Biodiversity, Clayton Campus,
Monash University, Wellington Road, Clayton, VIC 3800, Australia
2Australian National Wildlife Collection, CSIRO Ecosystem Sciences, GPO Box 1700,
Canberra, ACT 2601
3 Division of Evolution, Ecology and Genetics, Building 116, Daley Rd, Research School of
Biology, The Australian National University, Canberra, ACT 0200 Australia
4Australian Centre for Ancient DNA (ACAD), School of Earth & Environmental Sciences,
The University of Adelaide, Darling Building, North Terrace Campus, SA 5005, Australia
5Sciences Department, Museum Victoria, Carlton Gardens, Melbourne, Vic, 3001, Australia
6 Institute of Evolutionary Biology, University of Edinburgh, The King’s Buildings, West
Mains Road, Edinburgh EH9 3JT, Scotland
Keywords: evolutionary history, sPCA, dbRDA, female-linked selection, eastern yellow
robin, Eopsaltria australis
Corresponding author: Alexandra Pavlova
School of Biological Sciences and Australian Centre for Biodiversity, Clayton campus,
Monash University, Wellington Road, Clayton, VIC 3800, Australia
Page 53 of 101 Evolution: For Review Only
123456789101112131415161718192021222324252627282930313233343536373839404142434445464748495051525354555657585960

2
Phone: (+61) 3 9905 5902; Fax: (+61) 3 9905 5613
Email: [email protected]
Running title: Evolution of the eastern yellow robin
Word count: 6950 6916 words of text (excluding tables, figure captions and literature cited)
This manuscript has 3 tables and 4 figures
We have/intend towill archive our sequencing data in GenBank, and other data (on
sequences, microsatellites and CHD markers, geographic coordinates, climatic variables, sex,
etc) in Dryad and GenBank.
Formatted: English (Australia)
Field Code Changed
Formatted: English (Australia)
Formatted: English (Australia)
Page 54 of 101Evolution: For Review Only
123456789101112131415161718192021222324252627282930313233343536373839404142434445464748495051525354555657585960

3
ABSTRACT
Relationships among multi-locus genetic variation, geography and environmental
variation can reveal how evolutionary processes affect genomes. We examined the evolution
of an Australian bird, the eastern yellow robin Eopsaltria australis, using mitochondrial
(mtDNA) and nuclear (nDNA) genetic markers, and bioclimatic variables. In southeastern
Australia, two divergent mtDNA lineages occur east and west of the Great Dividing Range,
perpendicular to latitudinal nDNA structure. We evaluated alternative scenarios to explain
this striking discordance in landscape genetic patterning. Stochastic mtDNA lineage sorting
implausibly explains this pattern can be rejected because the mtDNA lineages are essentially
distinct geographically for >1500 km. Vicariance is unlikely: the Great Dividing Range itself
is currently notis neither a current barrier nor was it at the Last Glacial Maximum according
to species distribution modeling; nuclear gene flow inferred from coalescent analysis affirms
this too. Female philopatry contradicts known female-biased dispersal. Contrasting mtDNA
and nDNA demographies for mtDNA and nDNA suggestindicate that their evolutionary
histories are decoupled have been decoupled. A non-neutral explanation for geographic
patterning of mtDNA variation is supported by dDistance-based redundancy analysis, in
which shows environmental temperatures to explain significant mtDNA variance variation
above impacts of that explained by geographic position and isolation-by-distance, favors a
non-neutral explanation for mitochondrial phylogeographic patterning. Thus, observed mito-
nuclear discordance is consistentaccords with environmental selection on a female-linked
trait, such as mtDNA, mtDNA-nDNA interactions or genes on W-chromosome, driving
mitochondrial divergence in the presence of nuclear gene flow.
Page 55 of 101 Evolution: For Review Only
123456789101112131415161718192021222324252627282930313233343536373839404142434445464748495051525354555657585960

4
INTRODUCTION 1
Evolutionary processes (e.g. genetic drift, natural selection and gene flow) operate at 2
different times and places in species’ histories, differentially affecting genomes and phenotypes; 3
thus understanding their roles in speciation remains challenging (Coyne and Orr 2004; Price 4
2008; Butlin et al. 2009; Smadja and Butlin 2011). Discordant geographic patterns within and 5
among genomes in a species could result from coalescent variance (Lohse et al. 2010), 6
genetically localized selective sweeps (Bensch et al. 2006), life history traits (e.g. sex-biased 7
philopatry/dispersal; Turmelle et al. 2011), different modes of marker inheritance (and thus 8
effective population sizes), or differential marker behavior following secondary contact (Petit 9
and Excoffier 2009). A recent review (Toews and Brelsford 2012) found that mito-nuclear 10
discordance, a major difference in the patterns of differentiation between mitochondrial and 11
nuclear DNA, is a common phenomenon in animal systems. In the great majority of reviewed 12
cases, mito-nuclear discordance arose following allopatric divergence and secondary contact 13
(Toews and Brelsford 2012). This is expressed either in more structuring and/or narrower 14
geographic clines in mtDNA compared with nDNA (usually explained by nuclear introgression 15
and/or sex-biased asymmetries including dispersal, mating or offspring survival) or relatively 16
less structuring and/or wider geographic clines of mtDNA, usually explained by adaptive 17
introgression of mtDNA, demographic disparities including genetic drift, or sex-biased 18
asymmetries. Historic isolation and secondary contact can also result in coexistence of deeply 19
divergent mitochondrial lineages in sympatry in one panmictic population (Zink et al. 2008; 20
Webb et al. 2011; Hogner et al. 2012). However, in four cases, all involving avian systems, 21
strong mitochondrial but not nuclear structure has arisen in the absence of obvious geographic 22
isolation (Irwin et al. 2005; Cheviron and Brumfield 2009; Ribeiro et al. 2011; Spottiswoode et 23
Page 56 of 101Evolution: For Review Only
123456789101112131415161718192021222324252627282930313233343536373839404142434445464748495051525354555657585960

5
al. 2011). Further, in two bird species, mitochondrial but not nuclear structure correlated with 24
environmental variation (Cheviron and Brumfield 2009; Ribeiro et al. 2011), suggesting that 25
mtDNA haplotypes might be differentially adapted to environmental conditions. Growing 26
evidence of selection on mtDNA (Ballard and Whitlock 2004; Bazin et al. 2006; Meiklejohn et 27
al. 2007) indicates that this process might be more common than recognized, although it is rarely 28
tested for in phylogeographic studies (Toews and Brelsford 2012). Links between mitochondrial 29
variation and energy metabolism (Mishmar et al. 2003; Tieleman et al. 2009) suggest that 30
mtDNA data should be routinely examined in relation to environmental variables in species 31
distributed over wide ranges of climatic conditions. Multilocus investigation of spatial genetic 32
structure in relation to environmental variation should lead to better understanding of 33
evolutionary forces shaping molecular variation. 34
Here we report an intriguing phylogeographic pattern in an Australian bird, where two 35
major mtDNA lineages were distributed roughly eastwards or westwards of the Great Dividing 36
Range in southeastern Australia, perpendicular to roughly latitudinal isolation-by-distance of 37
some nuclear loci, and we assess the processes shaping this molecular pattern. The eastern 38
yellow robin Eopsaltria australis (Passeriformes: Petroicidae) is a common and widespread bird 39
of mesic woodlands and forests of tropical to temperate eastern Australia (Barrett et al. 2003). 40
The species’ distribution spans 20º of latitude, associated with a wide range of climates (Higgins 41
and Peter 2002). Superimposed on this climatic gradient, the Great Dividing Range, a mountain 42
chain of modest elevation peaking at 2228 metres above sea level, runs the entire length of the 43
eastern coastline, and imposes climates that are generally drier and warmer further inland 44
(Bowman et al. 2010; Byrne et al. 2011). Comprehensive, continent-wide bird surveys at 1º grids 45
(1998-2002) showed E. australis to be evenly distributed and breeding throughout the Great 46
Page 57 of 101 Evolution: For Review Only
123456789101112131415161718192021222324252627282930313233343536373839404142434445464748495051525354555657585960

6
Dividing Range (Barrett et al. 2003). Dispersal of E. australis is limited and significantly 47
female-biased (Higgins and Peter 2002; Debus and Ford 2012; Harrisson et al. 2012), thus local 48
adaptation is feasible (Schneider et al. 1999). So, too, is neutral divergence in allopatry: 49
aridification and cooling during Pleistocene glacial cycles have promoted divergence and 50
speciation of some forest and woodland Australian mesic organisms (Sunnucks et al. 2006; 51
Symula et al. 2008; Malekian et al. 2010; Byrne et al. 2011). 52
A preliminary molecular data set (Loynes et al. 2009) showed two highly divergent 53
mitochondrial ND2 haplogroups in E. australis (> 6% divergence), whereas one polymorphic 54
nuclear gene and two nuclear introns were not structured. Using mitochondrial COI Christidis et 55
al. (2011) confirmed this mitochondrial subdivision and suggested that, pending further 56
phylogeographic study, the haplogroups may comprise separate species. Notably, the 57
haplogroups did not correspond to the recognized subspecies, northern E. a. chrysorrhoa and 58
southern E. a. australis (Schodde and Mason 1999), suggesting a possibility of mito-nuclear 59
discordance. Interpreting strong mtDNA divergence as indicative of speciation is based on the 60
usually untested assumption that mitochondrial lineages will behave as if under neutral 61
evolution. Although in some cases this assumption might be valid (Harrison 1989; Zink and 62
Barrowclough 2008), simulations show that even weak selection for local adaptations can result 63
in strong phylogeographic structure of a uniparentally inherited locus, where divergent clades are 64
geographically localized and differently adapted (Irwin 2012). Here we report an intriguing 65
phylogeographic pattern in E. australisan Australian bird, where two major mtDNA lineages 66
were distributed roughly eastwards or westwards of the Great Dividing Range in southeastern 67
Australia, perpendicular to roughly latitudinal isolation-by-distance of some nuclear loci, and we 68
assess the processes shaping this molecular pattern., The aim of this study was toand we test 69
Page 58 of 101Evolution: For Review Only
123456789101112131415161718192021222324252627282930313233343536373839404142434445464748495051525354555657585960
7
rigorously whether selection or one or more neutral process better explains this the extreme 70
mtDNA divergence and mito-nuclear discordance observed in E. australis. We used multiple 71
types of loci (mitochondrial ND2 gene, nuclear microsatellites and introns) having different rates 72
of evolution and patterns of inheritance (autosomal, Z-linked, and female-limited W-linked), and 73
climatic variables, applied over the full range of the species in landscape genetic and 74
genealogical frameworks. First, we tested if mitochondrial haplogroups diverged by drift in 75
allopatry followed by secondary contact (as in the majority of cases reviewed by Toews and 76
Brelsford 2012). Under this hypothesis, we expected to observe low habitat suitability for E. 77
australis on and along the Great Dividing Range (an agent of vicariance for some taxa along the 78
length of Australia's eastern seaboard; Byrne et al. 2011) during the Last Glacial Maximum 79
(LGM). We used species distribution modeling to test this. Second, we tested if mitochondrial 80
divergence in E. australis occurred in the presence of nuclear gene flow. Under divergence with 81
gene flow (Pinho and Hey 2010), some nuclear gene flow between mtDNA haplogroups is 82
expected. We tested this by fitting an isolation-with-migration (IMA) model to nDNA data. 83
Finally, we tested the hypothesis that female-linked environmental selection (including selection 84
on mtDNA and linked nuclear genes; Rand et al. 2004; Meiklejohn et al. 2007; Dowling et al. 85
2008; Tieleman et al. 2009; Shen et al. 2010; Moghadam et al. 2012) resulted in mtDNA 86
divergence in the presence of nuclear gene flow between populations defined by their mtDNA 87
haplogroups. This hypothesis includes the case where dispersal (which is female-biased in E. 88
australis) between environmentally-divergent areas is lower than dispersal between similar 89
areas, because such bias demands a selective explanation. Under the female-linked selection 90
hypothesis, decoupled evolutionary history of mtDNA and nDNA is expected to result in 91
different patterns of geographic structure for these genomes, and mtDNA may show associations 92
Page 59 of 101 Evolution: For Review Only
123456789101112131415161718192021222324252627282930313233343536373839404142434445464748495051525354555657585960

8
with environmental variation, after spatial autocorrelation has been controlled for. We tested 93
these predictions using phylogeographic, landscape genetic and distance-based redundancy 94
analyses. 95
METHODS 96
Modeling present and Last Glacial Maximum species distributions 97
To understand how current and late Pleistocene climatic variation in temperature and 98
humidity might have impacted the spatial distribution of E. australis (and its genetic variation), 99
and to test for a vicariant effect of the Great Dividing Range, we modeled current and LGM 100
distributions of this species using the machine-learning maximum entropy model implemented in 101
MaxEnt 3.3.3e (Phillips et al. 2006). Nineteen bioclimatic variables for the present and the LGM 102
(Busby 1991) at a resolution of 2.5 arc-minutes (~5 km2 grid) were obtained from the WorldClim 103
1.4 database (Hijmans et al. 2005). Layers were visualized and cropped to span from latitude 104
46°S to 5°S and longitude 130°S to 156°S using DIVA-GIS 7.4.0 (Hijmans 2009). Presence data 105
comprised 454 presence localities of E. australis in the Atlas of Living Australia 106
(http://www.ala.org.au). A set of 341 randomly chosen presence points (75%) was used to train 107
MaxEnt model under current climatic conditions, and a set of 113 points (25%) was used to test 108
the model. The fit of several preliminary MaxEnt models generated with different combinations 109
of variables was compared using the area under the receiver operating curve (AUC). The final 110
model of current species distribution was generated using six variables that maximized AUC: 111
max temperature of warmest month, min temperature of coldest month, mean diurnal range, 112
precipitation of wettest month, precipitation of driest month, and precipitation seasonality. LGM 113
distribution was modeled by projecting the final current model onto the set of these six variables 114
estimated for the LGM (see supplementary material S1 for details). 115
Page 60 of 101Evolution: For Review Only
123456789101112131415161718192021222324252627282930313233343536373839404142434445464748495051525354555657585960
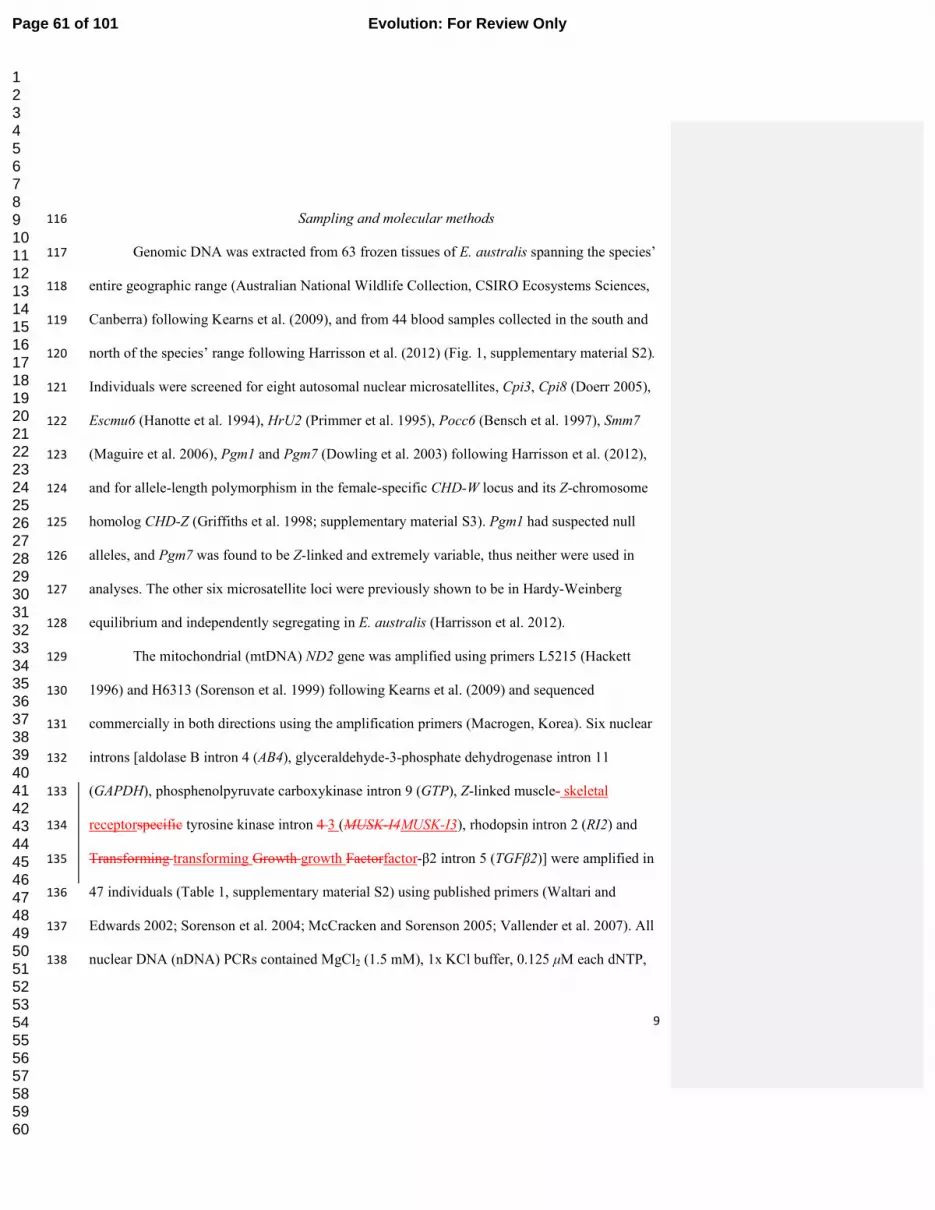
9
Sampling and molecular methods 116
Genomic DNA was extracted from 63 frozen tissues of E. australis spanning the species’ 117
entire geographic range (Australian National Wildlife Collection, CSIRO Ecosystems Sciences, 118
Canberra) following Kearns et al. (2009), and from 44 blood samples collected in the south and 119
north of the species’ range following Harrisson et al. (2012) (Fig. 1, supplementary material S2). 120
Individuals were screened for eight autosomal nuclear microsatellites, Cpi3, Cpi8 (Doerr 2005), 121
Escmu6 (Hanotte et al. 1994), HrU2 (Primmer et al. 1995), Pocc6 (Bensch et al. 1997), Smm7 122
(Maguire et al. 2006), Pgm1 and Pgm7 (Dowling et al. 2003) following Harrisson et al. (2012), 123
and for allele-length polymorphism in the female-specific CHD-W locus and its Z-chromosome 124
homolog CHD-Z (Griffiths et al. 1998; supplementary material S3). Pgm1 had suspected null 125
alleles, and Pgm7 was found to be Z-linked and extremely variable, thus neither were used in 126
analyses. The other six microsatellite loci were previously shown to be in Hardy-Weinberg 127
equilibrium and independently segregating in E. australis (Harrisson et al. 2012). 128
The mitochondrial (mtDNA) ND2 gene was amplified using primers L5215 (Hackett 129
1996) and H6313 (Sorenson et al. 1999) following Kearns et al. (2009) and sequenced 130
commercially in both directions using the amplification primers (Macrogen, Korea). Six nuclear 131
introns [aldolase B intron 4 (AB4), glyceraldehyde-3-phosphate dehydrogenase intron 11 132
(GAPDH), phosphenolpyruvate carboxykinase intron 9 (GTP), Z-linked muscle- skeletal 133
receptorspecific tyrosine kinase intron 4 3 (MUSK-I4MUSK-I3), rhodopsin intron 2 (RI2) and 134
Transforming transforming Growth growth Factorfactor-β2 intron 5 (TGFβ2)] were amplified in 135
47 individuals (Table 1, supplementary material S2) using published primers (Waltari and 136
Edwards 2002; Sorenson et al. 2004; McCracken and Sorenson 2005; Vallender et al. 2007). All 137
nuclear DNA (nDNA) PCRs contained MgCl2 (1.5 mM), 1x KCl buffer, 0.125 µM each dNTP, 138
Page 61 of 101 Evolution: For Review Only
123456789101112131415161718192021222324252627282930313233343536373839404142434445464748495051525354555657585960
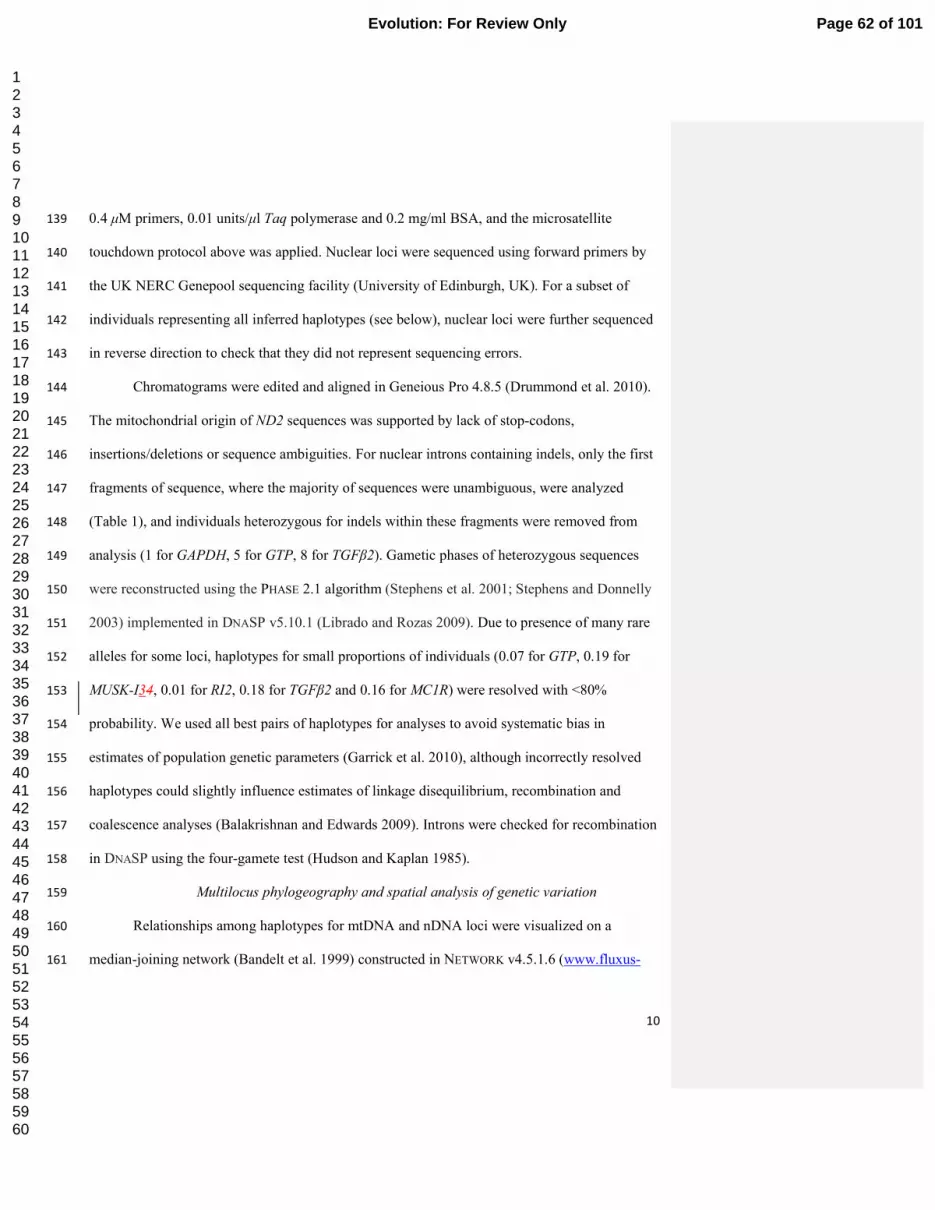
10
0.4 µM primers, 0.01 units/µl Taq polymerase and 0.2 mg/ml BSA, and the microsatellite 139
touchdown protocol above was applied. Nuclear loci were sequenced using forward primers by 140
the UK NERC Genepool sequencing facility (University of Edinburgh, UK). For a subset of 141
individuals representing all inferred haplotypes (see below), nuclear loci were further sequenced 142
in reverse direction to check that they did not represent sequencing errors. 143
Chromatograms were edited and aligned in Geneious Pro 4.8.5 (Drummond et al. 2010). 144
The mitochondrial origin of ND2 sequences was supported by lack of stop-codons, 145
insertions/deletions or sequence ambiguities. For nuclear introns containing indels, only the first 146
fragments of sequence, where the majority of sequences were unambiguous, were analyzed 147
(Table 1), and individuals heterozygous for indels within these fragments were removed from 148
analysis (1 for GAPDH, 5 for GTP, 8 for TGFβ2). Gametic phases of heterozygous sequences 149
were reconstructed using the PHASE 2.1 algorithm (Stephens et al. 2001; Stephens and Donnelly 150
2003) implemented in DNASP v5.10.1 (Librado and Rozas 2009). Due to presence of many rare 151
alleles for some loci, haplotypes for small proportions of individuals (0.07 for GTP, 0.19 for 152
MUSK-I34, 0.01 for RI2, 0.18 for TGFβ2 and 0.16 for MC1R) were resolved with <80% 153
probability. We used all best pairs of haplotypes for analyses to avoid systematic bias in 154
estimates of population genetic parameters (Garrick et al. 2010), although incorrectly resolved 155
haplotypes could slightly influence estimates of linkage disequilibrium, recombination and 156
coalescence analyses (Balakrishnan and Edwards 2009). Introns were checked for recombination 157
in DNASP using the four-gamete test (Hudson and Kaplan 1985). 158
Multilocus phylogeography and spatial analysis of genetic variation 159
Relationships among haplotypes for mtDNA and nDNA loci were visualized on a 160
median-joining network (Bandelt et al. 1999) constructed in NETWORK v4.5.1.6 (www.fluxus-161
Page 62 of 101Evolution: For Review Only
123456789101112131415161718192021222324252627282930313233343536373839404142434445464748495051525354555657585960

11
engineering.com). Owing to recombination, nuclear gene networks may not represent true 162
genealogical relationships, but are nonetheless useful for assessing allele clustering with respect 163
to mtDNA-defined lineages. Support for mitochondrial ND2 haplogroups and their divergence 164
times were estimated in BEAST 1.6.1 and 1.7 (Drummond and Rambaut 2007; Drummond et al. 165
2012) using all 100 ND2 sequences (supplementary material S4). STRUCTURE 2.3.3 (Pritchard et 166
al. 2000) and TESS 2.3.1 (Chen et al. 2007) were used to explore genotype substructuring in 167
microsatellites and autosomal introns (supplementary material S5). Spatial principal component 168
analysis (sPCA; Jombart et al. 2008) implemented through the functions spca and global.rtest in 169
the package ADEGENET v1.2-8 (Jombart 2008) for R (R Development Core Team 2011) was used 170
to investigate spatial patterns of genetic variation. SPCA maximizes the product of spatial 171
autocorrelation and genetic variance to summarize multivariate data on allele frequencies into a 172
few uncorrelated axes. This approach is powerful for detecting cryptic spatial patterns that are 173
not associated with high genetic variation (Jombart et al. 2008); unlike STRUCTURE or TESS, it 174
does not require Hardy-Weinberg or linkage equilibria, and can be applied to sequence data. We 175
used a Gabriel graph and introduced a small amount of random noise to coordinates of multiple 176
individuals collected at the same location (function jitter, factor=1, amount=0.1; the network was 177
robust to the addition of noise). Analyses were run separately for ND2, each of the sequenced 178
nuclear markers, and the dataset of six microsatellites (removing 9 individuals with missing 179
scores for a locus). 180
Multiple processes, such as isolation-by-distance and local selection (e.g. isolation-by-181
adaptation; Nosil et al. 2008), can simultaneously shape spatial structure of variation of different 182
molecular markers. To separate the effect of geographic position, which may reflect local 183
processes, from any underlying effect of isolation-by-distance, we applied redundancy analysis 184
Page 63 of 101 Evolution: For Review Only
123456789101112131415161718192021222324252627282930313233343536373839404142434445464748495051525354555657585960
12
(RDA, function rda, R package VEGAN; Dixon 2003; Oksanen et al. 2011). RDA is a constrained 185
ordination technique, coupled with an ANOVA-like permutation test that tests whether a given 186
predictor explains residual variation in response after fitting (conditioning on) other predictors 187
first. We tested whether geographic position can explain genetic variance of nuclear loci beyond 188
what can be explained by the isolation-by-distance effect. As the response, we used data on 189
presence or absence of each identified allele (microsatellites) or variant nucleotide at 190
polymorphic sites (sequences) in each individual, computed using a genind constructor and 191
centred and scaled using scaleGen (R package ADEGENET). The two predictors were geographic 192
position (latitude and longitude, analyzed together for simplicity of interpretation) and pairwise 193
geographic distance between locations. For RDA (and also distance-based RDA, below) the 194
information about an individual’s pairwise geographic distances to other individuals was reduced 195
to a few columns using the following procedure. First, geographic distances between locations, 196
initially computed with function rdist.earth (R package FIELDS), were expressed as a rectangular 197
matrix using principal coordinates of the neighbourhood matrix procedure (pcnm; Borcard and 198
Legendre 2002) implemented in function pcnm in VEGAN. Then this rectangular matrix was 199
reduced to ≤3 columns best explaining genetic variance. For that, we fitted all pcnm axes as 200
predictors of allele presence using RDA, and chose up to three axes significant at P<0.05 to 201
represent geographic distances in the final RDAs. This approach is more powerful than Mantel 202
tests, which require multivariate environmental data (such as latitude, longitude and 203
environmental variables) to be expressed as distances (Legendre and Fortin 2010). For the final 204
RDAs, we tested for the ability of each predictor to explain significant variance in allele 205
presence-absence data alone (marginal tests), and after fitting the other predictor first 206
(conditional tests). Significance was assessed with 999 permutations (of the rows and columns of 207
Page 64 of 101Evolution: For Review Only
123456789101112131415161718192021222324252627282930313233343536373839404142434445464748495051525354555657585960

13
the predictor matrix for marginal tests, or of the rows and columns of the multivariate residual 208
matrix for conditional tests). A predictor variable that explained significant (P<0.05) genetic 209
variance in marginal and conditional tests was inferred to have major effect on genetic structure. 210
If both marginal tests were significant but conditional tests were not, both variables were inferred 211
to influence genetic variation. RDAs were performed on each sequenced nuclear marker, and 212
complete genotypes at six microsatellites. For mitochondrial ND2 sequences, effects of 213
geographic position and distance were explored using distance-based redundancy analysis 214
(dbRDA) as explained below. 215
Genetic diversity, genetic differentiation and selection 216
For each sequenced locus, we calculated haplotype diversity (Hd), nucleotide diversity 217
(π), pairwise Φst between haplogroups, Tajima's D (Tajima 1996) and Fu’s Fs (Fu 1997) tests for 218
selective neutrality using ARLEQUIN 3.11 (Excoffier et al. 2005). DNASP was used to test for 219
selection on ND2 itself using the McDonald-Kreitman (MK) test (McDonald and Kreitman 220
1991), two individuals with missing data for two sites were removed from this analysis (for 221
additional tests for selection see supplementary material S7). ARLEQUIN was used to compute 222
expected heterozygosity (He) and FST between haplogroups for six microsatellites 223
(supplementary material S6). Calculations were performed for all data, and for the two 224
populations defined by mtDNA haplogroups. 225
Isolation-with-migration analysis (IMA2) 226
We fitted the model of isolation-with-migration (Hey and Nielsen 2004) as implemented 227
in IMA2.0 (Hey and Nielsen 2007) to the multilocus dataset comprising the largest non-228
recombining fragments of four autosomal introns that had no signature of selection (AB4, 229
GAPDH, MUSK-I34 and TGFβ2), the size-variable Z-linked intron (CHD-Z) and six autosomal 230
Page 65 of 101 Evolution: For Review Only
123456789101112131415161718192021222324252627282930313233343536373839404142434445464748495051525354555657585960
14
microsatellites for the two populations defined by mtDNA haplogroup membership (A1 and B– 231
see Results, omitting three individuals from an isolated northernmost population). Under this 232
classification, any migration detected between haplogroups would indicate presence of nuclear 233
gene flow inconsistent with vicariant divergence. The fit of a full migration model was compared 234
to that of a no-migration sub-model using a likelihood ratio test. Parameter estimates were 235
converted to demographic units (number of years or individuals) using a generation time of 3.5 236
years (calculated as average age of reproductive females, assuming age of first reproduction of 1 237
year and lifespan of 6 years) and mutation rates of Lerner et al. (2011) (see supplementary 238
material S8 for details of analyses). 239
Distance-based redundancy analysis (dbRDA) 240
We used dbRDA (Legendre and Anderson 1999) implemented in the capscale function 241
in R-package VEGAN to test whether mitochondrial divergence occurred as a result of selection 242
acting upon a female-linked trait (broadly defined, i.e. mtDNA, mtDNA-nDNA interaction, or 243
genes on the W-chromosome). We examined whether the two bioclimatic variables that were 244
most informative in predicting the E. australis distribution (supplementary material S1) explain 245
mitochondrial variation above that explained by geographic position and/or distance between 246
individuals (Legendre and Fortin 2010). In this analysis, individuals were the units of 247
observation, and pairwise inter-individual TN93+G mitochondrial genetic distances [calculated 248
in MEGA5 (Tamura et al. 2011) excluding two individuals with missing sites; supplementary 249
material S4] were treated as information on multivariate response (and not as a single univariate 250
response variable as in Mantel tests; Geffen et al. 2004). Predictors (standardized to a zero mean 251
and unit variance) were two environmental variables: maximum temperature of warmest month 252
(max.temp) and precipitation of driest month (precipitation), and three geographic variables: 253
Page 66 of 101Evolution: For Review Only
123456789101112131415161718192021222324252627282930313233343536373839404142434445464748495051525354555657585960
15
latitude, longitude and geographic distance between samples represented by the first significant 254
(P<0.05) pcnm axis (as explained above for RDA). The final dbRDA analyses included (1) 255
marginal tests, where the relationship between mtDNA genetic distances and each of the 256
predictors was analyzed separately, (2) conditional tests, where significance of environmental 257
variables (max.temp or precipitation) as predictors of mtDNA distances was assessed after first 258
fitting other variables one at a time or together, and (3) the reciprocal conditional tests, where 259
significance of geographic variables was similarly assessed by first fitting environmental 260
variables. Significance was assessed with 999 permutations. Environmental variables were 261
inferred to explain mtDNA variance over that explained by geographic position and distance if 262
marginal as well as conditional tests were significant. Significant association of mitochondrial 263
variation and climatic variables beyond its correlation with geographic position and distance 264
would provide strong evidence against hypotheses assuming neutral behavior of mtDNA. 265
RESULTS 266
Current and LGM species distribution models 267
Current and LGM species distribution models (supplementary material S1) predict the 268
northernmost (Wet Tropics) range of E. australis to be isolated from the remainder. Thus, for 269
this outlying region, vicariant effects might have acted at some time. In contrast, the species is 270
predicted under LGM and current conditions to have a continuous distribution on and along the 271
Great Dividing Range, except for a proportionally small area of habitat unsuitability (localized 272
glaciation) during the LGM in the mountains of southeastern Victoria and southern New South 273
Wales (Barrows et al. 2001). These predicted distributions provide no basis to expect vicariant 274
patterns due to the Great Dividing Range (arguing against allopatric divergence). Two variables 275
describing extremes of climatic conditions, maximum temperature of warmest month and 276
Page 67 of 101 Evolution: For Review Only
123456789101112131415161718192021222324252627282930313233343536373839404142434445464748495051525354555657585960

16
precipitation of driest month, explained the majority of variance in E. australis presence (50% 277
and 38% respectively in the final model). 278
MtDNA phylogeography 279
The 100 individuals sequenced for 1002 base pairs of ND2 revealed 102 polymorphic 280
sites (80 parsimony informative), defining 40 haplotypes (GenBank accession numbers 281
KC466740 - KC466839xxxx-yyyy). All individuals fell into one of haplogroup A or B, between 282
which there was 6.6% net nucleotide divergence (Bayesian posterior probability=1, MCC BEAST 283
tree, supplementary material S4, and ND2 network, Fig. 2). Assuming neutral evolution with 284
rates similar to ND2 rate of the Hawaiian honeycreepers (Lerner et al. 2011), the haplogroups A 285
and B diverged in the early Pleistocene, ~1.5 (95% highest posterior density [HPD] 0.975-2.147) 286
million years ago. Five of 53 fixed differences between A and B represented non-synonymous 287
but biochemically conservative amino acid substitutions (Grantham 1974; supplementary 288
material S7). Haplogroup A was widespread north to south, and inland of the Great Dividing 289
Range in southeastern Australia (Fig. 1a, red points), while haplogroup B was principally 290
coastwards and restricted to southeastern Australia (Fig. 1a, black points). Two locations, 291
Tenterfield and Shelbourne (Fig. 1a) had individuals of both haplogroups. Haplogroup A 292
comprised haplogroups A1 (widespread except Wet Tropics) and northernmost A2 (three Wet 293
Tropics individuals; Bayesian posterior probability=1; net divergence 1%; MCC tree, 294
supplementary material S4), which diverged in the mid Pleistocene, ~212 (95% HPD 104-341) 295
thousand years ago, assuming neutral evolution. One of 10 fixed differences between A1 and A2 296
was non-synonymous. Consistent with these results, SPCA of mtDNA (Fig. 3) detected two 297
significant global structures (P<0.001), the first (mt-sPC1) reflecting sharp A versus B 298
Page 68 of 101Evolution: For Review Only
123456789101112131415161718192021222324252627282930313233343536373839404142434445464748495051525354555657585960

17
subdivision, and the second (mt-sPC2) subdivision between A2 (Wet Tropics) and the rest 299
(A1+B). 300
Sex-linked CHD variation and population structure inferred from nuclear microsatellites 301
For 32 females and 64 males sequenced for ND2 and sexed by CHD variation, the 302
distribution of two W-linked (female-limited) alleles exactly matched mtDNA haplogroup 303
variation (allele 366 was restricted to haplogroup A, allele 362 to B), while the two Z-linked 304
alleles were widespread and unstructured with respect to haplogroups (supplementary material 305
S3). Ninety-two individuals were genotyped for six microsatellites. Genotypic analyses in 306
STRUCTURE and TESS suggested two genetic clusters, with a gradual north to south change of 307
individual cluster probabilities (Fig. 1b, Supplementary material S5). SPCA on microsatellites 308
detected two significant global structures (P<0.001; Fig. 3). The strongest structure (msat-sPC1) 309
showed a roughly north-south cline similar to that detected by STRUCTURE and TESS; the second, 310
subtle structure (msat-sPC2) showed a cline across the Great Dividing Range perpendicular to 311
msat-sPC1, directionally consistent with the major mitochondrial lineage subdivision (Fig. 3). 312
Isolation-by-distance (IBD) was a dominant process shaping microsatellite variation: geographic 313
distances alone could explain the variance in microsatellite frequencies (P=0.005, marginal RDA 314
test; Table 2), and remained significant even after geographic position was fitted first (P=0.017 315
conditional RDA test). In contrast, geographic position, although significant when fitted alone 316
(P=0.005, marginal RDA test), did not explain microsatellite structure after geographic distances 317
were controlled for (P=0.1, the reciprocal conditional RDA test). 318
Geographic variation of sequenced nuclear introns 319
Sequences were obtained from six nuclear introns in 31-47 individuals, which had two to 320
19 alleles (Table 1; GenBank accession numbers KC466694 - KC466739, KC466694 - 321
Page 69 of 101 Evolution: For Review Only
123456789101112131415161718192021222324252627282930313233343536373839404142434445464748495051525354555657585960
18
KC467012xxxx-yyyy). No intron displayed clusters or allele-sharing concordant with 322
mitochondrial haplogroup designations (Fig. 2). Two genetic clusters detected by genotypic 323
analysis of the autosomal introns in TESS were consistent with north-south gradient in cluster 324
membership detected from microsatellites (Supplementary material S5). Significant spatial 325
structure was suggested by sPCA for GAPDH (P=0.053) and for MUSK-I4MUSK-I3 (P=0.065; 326
Fig 3) in which southwestern individuals were somewhat differentiated from the rest; no 327
structure was found for the other sequenced introns (P>0.15; RI2 was not tested as only two 328
haplotypes were present). RDA (Table 2) showed that IBD as well as geographic position 329
explained variation in GTP (both P<0.05 on marginal tests, P>0.05 on conditional tests), 330
geographic position explained variation in AB4, GAPDH and MUSK-I4MUSK-I3 beyond that 331
explained by IBD (P<0.05 on marginal and conditional tests); and IBD but not geographic 332
position explained patterns in TFGβ2 (P<0.05 on marginal test). 333
Population genetic variability, differentiation and selection 334
Within-haplogroup nucleotide diversity was lower for ND2 than that for four (of six) 335
nuclear loci (AB4, GAPDH, MUSK-I4MUSK-I3 and TGFβ2; Table 1); π for nuclear loci ranged 336
0-0.0075 and 0.0003-0.0102, and for ND2 was 0.0013 and 0.0023 for A1 and B, respectively. 337
Significant differentiation between A1 and B was detected for ND2 (ΦST=0.968; P<0.001), 338
inevitable under reciprocal monophyly. Much lower but significant A1-B differentiation was also 339
found for nuclear introns AB4 (ΦST=0.047; P=0.03), GAPDH (ΦST=0.065; P=0.01), GTP 340
(ΦST=0.034; P=0.02) and for microsatellites (FST=0.029; P<0.001), but not for MUSK-I4MUSK-341
I3, RI2 or TGFβ2 (P>0.05; Table 1). Significantly negative Tajima’s D and/or Fu’s Fs, indicative 342
of population expansion, purifying selection or genetic hitchhiking, were found in three loci with 343
the lowest nucleotide diversity (for A1 in ND2 and GTP, and for B in ND2, GTP and RI2). 344
Page 70 of 101Evolution: For Review Only
123456789101112131415161718192021222324252627282930313233343536373839404142434445464748495051525354555657585960

19
Further, a MK test for selection on ND2 detected significant deficiency of non-synonymous 345
polymorphism between A1 and B (Fisher’s exact test P=0.047) with 50 synonymous and 5 non-346
synonymous changes fixed between groups, compared to 30 synonymous and 10 non-347
synonymous polymorphisms present within groups; MK tests between haplogroups A and B or 348
between A1 and A2 were not significant (P>0.05). Thus, purifying selection is indicated to have 349
acted upon ND2; positive selection can be rejected (additional tests in supplementary material 350
S7). 351
IMA2 analyses 352
Coalescent analysis of nuclear data in IMA2 could not definitively estimate some model 353
parameters for two populations defined by their mitochondrial haplogroup membership (details 354
in supplementary material S8), thus, and because assumptions of the model might not be met, 355
IMA2 results should be interpreted with caution. Based on all nuclear loci, populations A and B 356
were estimated to have diverged in the late Pleistocene or Holocene, ~7,000 (95%HPD 700-357
149,000) years ago. Posterior distributions of some Θ parameters did not reach zero, 358
nevertheless, each of them had a distinct peak within the range of prior parameter distributions. 359
Demographic estimates of population sizes from all nuclear data were NA=14 (95%HPD 3-86), 360
NB=13 (2-101) and NANC=186 (122-222) thousand individuals (for A, B and ancestral 361
populations, respectively). Although non-zero probabilities were associated with all prior values 362
of coalescent migration parameters, peak posterior distribution estimates suggested some 363
migration between populations. Migration estimates from all nuclear data converted to 364
population migration rate (2Nm) corresponded to forward-in-time gene movement of 6.2 (95% 365
HPD 0-32) genes per generation from A to B and 3.8 (0-22) genes per generation from B to A. 366
Page 71 of 101 Evolution: For Review Only
123456789101112131415161718192021222324252627282930313233343536373839404142434445464748495051525354555657585960
20
IMA2 was unable to conclusively reject the no-migration submodel based on a likelihood ratio 367
test. 368
Environmental, latitudinal and IBD effects associated with mtDNA diversity 369
DbRDA (Table 3) showed that maximum temperature of warmest month (max.temp), 370
precipitation of driest month, and latitude explain a significant amount of variance in mtDNA 371
genetic distances (marginal tests P<0.005), accounting for 51, 47 and 24% of genetic variance in 372
marginal tests, respectively, whereas longitude and geographic distance do not (P=0.59 and 373
P=0.072). So we excluded longitude from partial tests but retained geographic distance which 374
was close to significance. There was evidence of strong correlation of environmental variation 375
with mtDNA haplogroups: max.temp remained a significant predictor of genetic distances even 376
when other variables were fitted first alone or together (P=0.005; Table 3). Precipitation seems 377
somewhat less influential than max.temp: it remained significant when the three other variables 378
were fitted individually, or the two geographic variables were fitted first (P=0.005), but not when 379
max.temp plus the two geographic variables were fitted first (P=0.38; Table 3). Latitude 380
remained significant after first fitting the other variables alone or together (P<0.05; Table 3). 381
Overall, these results suggest that max.temp and latitude may play an important role in shaping 382
mitochondrial genetic structure of E. australis. Haplogroup A individuals occupied locations 383
with higher maximum temperatures of the warmest month and lower precipitation of the driest 384
month than those of haplogroup B (Fig. 4). 385
DISCUSSION 386
We attempted to clarify the evolutionary processes shaping a profound mito-nuclear 387
discordance in the Australian bird, the eastern yellow robin Eopsaltria australis, in which the 388
major patterns of spatial variation in mtDNA and nDNA are perpendicular. We addressed several 389
Page 72 of 101Evolution: For Review Only
123456789101112131415161718192021222324252627282930313233343536373839404142434445464748495051525354555657585960
21
evolutionary scenarios, applying a series of landscape-genetic, spatial-genetic and genealogical 390
tests. 391
Deep mitochondrial divergence can arise by chance in a continuous population, when 392
dispersal and population size are low, due to the stochastic nature of the coalescent process 393
(Irwin 2002). However, such an effect is highly unlikely in E. australis, where the two 394
haplogroups have a sharp spatial division within this continuously distributed, common, 395
widespread species (Barrett et al. 2003). The haplogroups abut over >1500 km with substantial 396
potential for mixing, yet only in two sampled locations did they co-occur (Fig. 1). Random 397
processes also cannot explain correlation of mtDNA lineages with environmental variables. 398
Under a scenario of allopatric divergence followed by secondary contact, common 399
neutral explanations for more structured mtDNA than nDNA include incompletely sorted nuclear 400
lineages, nuclear introgression, and/or sex-biased asymmetries such as dispersal, mating or 401
offspring production/survival (Toews and Brelsford 2012). While the species distribution models 402
did indicate vicariance as a plausible explanation of the A1-A2 split at or after the Last Glacial 403
Maximum, there is little basis for vicariance in the range of Eopsaltria australis south of the Wet 404
Tropics. The species is common and widespread along the Great Dividing Range (Barrett et al. 405
2003), and its likely presence there during the LGM is inferred from our species distribution 406
models (although the LGM populations on parts of the Range could have been sparse, according 407
to relatively low probability of occurrence; supplementary material S1). Geographic 408
inconsistencies between mtDNA and nDNA structure rule out incomplete lineage sorting as a 409
cause of discordance (Toews and Brelsford 2012). Historical lack of gene flow across the Great 410
Dividing Range but not in other directions would be expected to structure both mitochondrial 411
and microsatellite variation: yet no geographically distinct genetic clusters were detected for 412
Page 73 of 101 Evolution: For Review Only
123456789101112131415161718192021222324252627282930313233343536373839404142434445464748495051525354555657585960

22
microsatellites. Instead, the major spatial pattern for microsatellites is latitudinal isolation-by-413
distance, with only mild IBD across the Great Dividing Range. This suggests that distance, rather 414
than a barrier, has structured nuclear variation. This, and inference of some nuclear gene 415
exchange from coalescent analysis in IMA2 (tempered by parameter uncertainty), suggests that 416
some nuclear gene flow between haplogroups has occurred. Different demographic histories 417
were inferred from mtDNA and nDNA data: significant Tajima’s D and Fu’s Fs neutrality tests, 418
suggestive of population expansion, purifying selection or hitchhiking, were detected for mtDNA 419
and two least variable nuclear loci, not for any of the more variable nuclear markers. Population 420
expansion would be expected to yield generally consistent signals across different markers, thus 421
non-neutral evolution or hitchhiking of some loci appears more likely, which was also supported 422
by the MK test for ND2. This suggests that evolutionary histories of mitochondrial and nuclear 423
genomes are decoupled. The same conclusion arises from contrasting A-B divergence times 424
estimated from the two genomes while accounting for coalescent variance: the late Pleistocene-425
Holocene divergence of ~7,000 (700-149,000) years ago estimated by IMA2 from nuclear data 426
(Supplementary material S8) is much more recent than the early Pleistocene mitochondrial 427
lineage divergence of ~1.5 (1-2.1) million years ago estimated by BEAST from ND2 428
(Supplementary material S4). Although we note that the divergence time estimates of BEAST and 429
IMA2 are not strictly comparable because IMA2 incorporated migration into the model, the 430
difference represents evidence that mtDNA and nDNA cannot both be responding solely to 431
neutral processes. 432
Very strong female philopatry unrelated to selection, and selection correlated with 433
mtDNA, are both expected to limit female but not male movement and gene flow across 434
populations and thus to impact mtDNA more and nDNA less than expected in the absence of 435
Page 74 of 101Evolution: For Review Only
123456789101112131415161718192021222324252627282930313233343536373839404142434445464748495051525354555657585960

23
these effects. However, the female philopatry needed to explain observed patterns in the data 436
contrasts strongly with what is known about the biology of E. australis: field observations 437
(Debus and Ford 2012) and population genetic data (Harrisson et al. 2012) show that females 438
disperse significantly further than males (at least ~7 km and ~1 km, respectively; Debus and 439
Ford 2012). It is possible that females prefer to settle in habitats similar to their natal habitats, 440
whereas males are less discriminating (Tonnis et al. 2005). However, behavior where if females 441
are were so unable or unwilling to disperse or settle between adjacent haplogroup ranges over 442
>1500 km of contact, isseems likely to be linked the observed pattern demands explanation 443
bytoto some major fitness advantage, implying female-linked selection. Unlike a scenario 444
involving mtDNA-linked selection, neither female philopatry nor female habitat preferences 445
explain the origin of mtDNA divergence, given that there was no evidence for vicariance, and 446
chance split is highly unlikely. 447
If we reject the selectively neutral hypotheses as unparsimonious, it remains to consider 448
possibilities involving female/mtDNA-linked selection. Geographically localized haplogroups 449
and very shallow coalescent times within haplogroups compared to between-haplogroups 450
observed in E. australis are consistent with simulation scenarios under local selection and low to 451
moderate dispersal (Irwin 2012). The correlation of environmental variables with the spatial 452
distribution of mtDNA variation, after controlling for IBD and geographic position (dbRDA 453
results, Table 3) is consistent with environmental selection. The most informative bioclimatic 454
variables with regards to species occurrence (maximum temperature of the warmest month and, 455
to a lesser extent, precipitation of the driest month) explained significant mitochondrial 456
patterning beyond that explained by latitude and IBD, suggesting that these climatic factors may 457
be associated with female-linked selection. 458
Page 75 of 101 Evolution: For Review Only
123456789101112131415161718192021222324252627282930313233343536373839404142434445464748495051525354555657585960
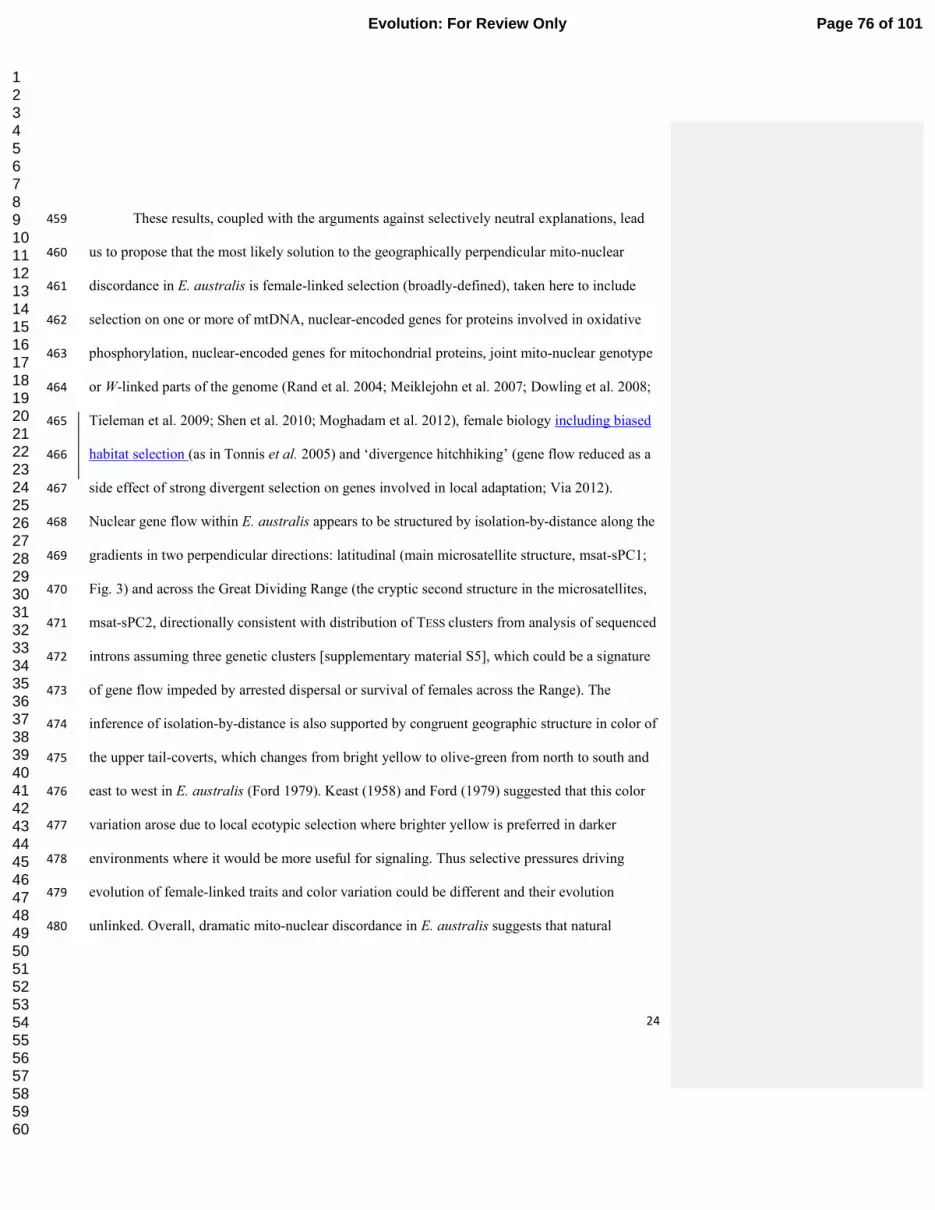
24
These results, coupled with the arguments against selectively neutral explanations, lead 459
us to propose that the most likely solution to the geographically perpendicular mito-nuclear 460
discordance in E. australis is female-linked selection (broadly-defined), taken here to include 461
selection on one or more of mtDNA, nuclear-encoded genes for proteins involved in oxidative 462
phosphorylation, nuclear-encoded genes for mitochondrial proteins, joint mito-nuclear genotype 463
or W-linked parts of the genome (Rand et al. 2004; Meiklejohn et al. 2007; Dowling et al. 2008; 464
Tieleman et al. 2009; Shen et al. 2010; Moghadam et al. 2012), female biology including biased 465
habitat selection (as in Tonnis et al. 2005) and ‘divergence hitchhiking’ (gene flow reduced as a 466
side effect of strong divergent selection on genes involved in local adaptation; Via 2012). 467
Nuclear gene flow within E. australis appears to be structured by isolation-by-distance along the 468
gradients in two perpendicular directions: latitudinal (main microsatellite structure, msat-sPC1; 469
Fig. 3) and across the Great Dividing Range (the cryptic second structure in the microsatellites, 470
msat-sPC2, directionally consistent with distribution of TESS clusters from analysis of sequenced 471
introns assuming three genetic clusters [supplementary material S5], which could be a signature 472
of gene flow impeded by arrested dispersal or survival of females across the Range). The 473
inference of isolation-by-distance is also supported by congruent geographic structure in color of 474
the upper tail-coverts, which changes from bright yellow to olive-green from north to south and 475
east to west in E. australis (Ford 1979). Keast (1958) and Ford (1979) suggested that this color 476
variation arose due to local ecotypic selection where brighter yellow is preferred in darker 477
environments where it would be more useful for signaling. Thus selective pressures driving 478
evolution of female-linked traits and color variation could be different and their evolution 479
unlinked. Overall, dramatic mito-nuclear discordance in E. australis suggests that natural 480
Page 76 of 101Evolution: For Review Only
123456789101112131415161718192021222324252627282930313233343536373839404142434445464748495051525354555657585960
25
selection constrains mitochondrial but not selectively neutral nuclear gene flow along 481
environmental gradients. 482
More research is needed to understand the mechanisms through which putative selection 483
on female-linked traits in E. australis operates. Passerine birds from hotter and drier 484
environments have lower basal metabolic rates and evaporative water loss (Tieleman et al. 2003; 485
Williams and Tieleman 2005). Selection on mitochondrial genotypes can drive such adaptive 486
responses because the mitochondrial genome plays an important role in the regulation of energy 487
metabolism in birds (Tieleman et al. 2009). For E. australis, the MK tests suggested purifying 488
selection on ND2, thus positive selection appears not to impact ND2 directly, but could act upon 489
other mtDNA-encoded genes, or indirectly on nDNA-encoded genes that produce structural 490
proteins imported into the mitochondria or on the joint mito-nuclear genotype, mito-nuclear 491
hybrids being selected against in the contact zone between two haplogroups (Dowling et al. 492
2008; Ballard and Melvin 2010). Of all reviewed cases of mito-nuclear discordance (Toews and 493
Brelsford 2012), only two other studies, both involving birds, report association between mtDNA 494
and environmental variation in the presence of nuclear gene flow when evidence for previous 495
isolation is lacking. In the Rufous-collared Sparrow Zonotrichia capensis, mitochondrial but not 496
nuclear gene flow was significantly reduced along elevational gradients, suggesting that 497
mitochondrial haplotypes could be locally adapted (Cheviron and Brumfield 2009). A 498
relationship between a gradient of aridity and mitochondrial but not nuclear or morphological 499
diversity has been reported in the South African arid-zone endemic Karoo scrub-robin 500
Cercotrichas coryphaeus raising the possibility of common mechanisms for adaptations to 501
extreme environmental conditions (Ribeiro et al. 2011). Due to linked inheritance with the W-502
chromosome, mtDNA may also reflect female-specific selection on W-linked genes, as has been 503
Page 77 of 101 Evolution: For Review Only
123456789101112131415161718192021222324252627282930313233343536373839404142434445464748495051525354555657585960
26
demonstrated for the evolution of gene expression on the W-chromosome (Moghadam et al. 504
2012). Thus it may not be coincidental that all three studies (Cheviron and Brumfield 2009; 505
Ribeiro et al. 2011; the present study) reporting association between mtDNA and environmental 506
variation in the presence of nuclear gene flow are from birds. Whatever the mechanism, any 507
environmental selection acting on female-linked traits in E. australis would strongly inhibit the 508
sympatry of mitochondrial lineages across a climatic gradient associated with the Great Dividing 509
Range. 510
Conclusions 511
Our study of E. australis benefitted from a combination of landscape genetic, spatial 512
genetic and coalescent analyses of multiple locus types and environmental variables in building 513
an integrated understanding of evolutionary processes operating at different scales. It also 514
presents a striking example of how geographically structured mtDNA diversity can unreliably 515
reflect species’ evolutionary history when neutrality is assumed and not thoroughly tested. It is 516
beneficial to incorporate tests for the effect on genetic variation of geographic position and 517
environmental variation, in addition to IBD, into phylogeographic studies, and to try and tease 518
apart their almost inevitable correlations. Correlation between mitochondrial genetic variation 519
and geographic position, when distance is controlled for, warrants additional exploration of 520
potential selection pressures driving evolution of female-linked traits. Discovery of two highly 521
divergent haplogroups apparently under strong environmental selection within a putatively 522
continuous population of E. australis (possibly a common pattern for species whose range spans 523
environmental gradients) provides another example of divergence with gene flow (Pinho and 524
Hey 2010), which has potentially profound implications for management and taxonomy. The 525
evidence for female-linked environmental selection implies that mtDNA haplogroups are not 526
Page 78 of 101Evolution: For Review Only
123456789101112131415161718192021222324252627282930313233343536373839404142434445464748495051525354555657585960

27
ecologically exchangeable sensu Crandall et al. (2000). For example, translocation among 527
haplogroup regions may result in negative fitness consequences, and on the evidence here would 528
be an inadvisable management strategy. Our study illustrates how the use of mtDNA as a 529
barcoding tool to define species or lineages (Baker et al. 2009) can be severely compromised 530
without the knowledge to appreciate the role of mtDNA-correlated selection in such units. 531
ACKNOWLEDGEMENTS 532
Funding was provided by the Australian Research Council Linkage Grant (LP0776322), 533
the Victorian Department of Sustainability and Environment (DSE), Museum of Victoria, 534
Victorian Department of Primary Industries, Parks Victoria, North Central Catchment 535
Management Authority, Goulburn Broken Catchment Management Authority, CSIRO 536
Ecosystem Sciences, and the Australian National Wildlife Collection Foundation. NA was 537
funded by a Monash University Faculty of Science Dean’s Postgraduate Scholarship and Birds 538
Australia with additional support from the Holsworth Wildlife Research Endowment. Blood 539
samples from Victoria were collected under DSE permits (number 10004294 under the Wildlife 540
Act 1975 and the National Parks Act 1975, and number NWF10455 under section 52 of the 541
forest Act 1958). We thank Alan Lill, Naoko Takeuchi and other collectors of specimens and all 542
agencies who granted permission to collect specimens, Robert Palmer for curatorial assistance, 543
Suzanne Metcalfe for help with mitochondrial sequencing, and Katherine Harrisson for help with 544
nuclear sequencing. Computationally intensive analyses (STRUCTURE) were performed on the 545
Monash Sun Grid courtesy of Monash eResearch. We thank the UK NERC Genepool facility for 546
sequencing support. We are grateful to Darren Irwin, John Endler, Evolution editorial input 547
including that of Kenneth Petren, three anonymous reviewers for their comments on the earlier 548
Page 79 of 101 Evolution: For Review Only
123456789101112131415161718192021222324252627282930313233343536373839404142434445464748495051525354555657585960

28
drafts of the manuscript, to Thibaut Jombart for advice on analyses of spatial genetic structures, 549
Gaynor Dolman, Hugh Ford and Peter Teske for helpful discussions. 550
551
Page 80 of 101Evolution: For Review Only
123456789101112131415161718192021222324252627282930313233343536373839404142434445464748495051525354555657585960

29
Table 1. Descriptive statistics for all samples and members of distinct mitochondrial clades for sequenced loci (Wet tropics individuals 552
belonging to clade A2 were not sequenced for nDNA). N ind- number of individuals, N alleles- Number of alleles, bp- base pairs, S-553
polymorphic sites, H-number of haplotypes, Hd- haplotype diversity (expected heterozygosity), π- nucleotide diversity, Rm- minimum 554
number of recombinant events, n/s- not significant (P>0.05), n/a- not applicable. Significant ΦST -values are in bold. 555
Locus Data N
ind
N
alleles
Length,
bp
Indels,
bp
S H Hd π Fu's Fs, P Tajima's D,
P
ΦST A1
vs B
Rm
AB4 autosomal
intron
All 44 88 196 1 2 3 0.447 0.0025 0.613 n/s 0.343 n/s 0.047
P=0.027
0
Clade A 20 40 196 1 1 3 0.405 0.0022 -0.078 n/s 0.565 n/s
Clade B 22 44 195 0 2 3 0.519 0.0030 0.609 n/s 0.474 n/s
GAPDH autosomal
intron
All 46 92 317 0 8 10 0.818 0.0047 -2.217 n/s -0.147 n/s 0.065
P=0.009
1
Clade A 21 42 317 0 6 8 0.866 0.0054 -1.263 n/s 0.577 n/s
Clade B 23 46 317 0 6 6 0.723 0.0036 -0.742 n/s -0.432 n/s
GTP autosomal
intron
All 42 84 456 1 8 10 0.410 0.0011 -8.403
P<0.001
-1.942
P<0.001
0.034
P=0.018
0
Clade A 19 38 456 0 4 5 0.292 0.0007 -3.671
P=0.001
-1.630
P=0.016
Page 81 of 101 Evolution: For Review Only
123456789101112131415161718192021222324252627282930313233343536373839404142434445464748495051525354555657585960
30
Clade B 21 42 456 1 7 8 0.535 0.0018 -4.128
P=0.004
-1.502
P=0.056
MUSK-
I4MUSK-
I3
Z-linked
intron
All 31 51 519 0 21 15 0.810 0.0078 -2.240 n/s -0.416 n/s 0.061
P=0.072
3
Clade A 20 32 519 0 17 9 0.673 0.0065 -0.114 n/s -0.671 n/s
Clade B 11 17 519 0 18 10 0.919 0.0102 0.516 n/s -0.033 n/s
RI2 autosomal
intron
All 47 94 292 0 2 2 0.021 0.0002 -1.421 n/s -1.386 n/s -0.001
n/s
0
Clade A 22 44 292 0 0 1 0.000 0.0000 0 n/a 0 n/s
Clade B 23 46 292 0 2 2 0.044 0.0003 -0.783 n/s -1.473
P=0.03
TGFβ2 autosomal
intron
All 39 78 595 1 24 19 0.870 0.0070 -3.420 n/s -0.443 n/s 0.007
n/s
4
Clade A 20 40 595 0 23 16 0.868 0.0075 -3.465 n/s -0.599 n/s
Clade B 17 34 594 1 12 9 0.857 0.0066 0.553 n/s 0.935 n/s
ND2 mt coding All 100 100 1002 0 102 40 0.908 0.0334 2.785 n/s 2.303
P=0.01
0.968
P<0.001
n/a
Page 82 of 101Evolution: For Review Only
123456789101112131415161718192021222324252627282930313233343536373839404142434445464748495051525354555657585960

31
mt coding Clades
A1+B
97 97 1002 0 94 38 0.902 0.0332 3.382 n/s 2.704
P=0.002
Clade A1 53 97 1002 0 26 20 0.738 0.0017 -16.418
P<0.001
-2.276
P<0.001
Clade A2 3 97 1002 0 2 2 0.667 0.0013 - -
Clade B 44 97 1002 0 16 18 0.901 0.0023 -10.728
P<0.001
-1.158 n/s
556
Page 83 of 101 Evolution: For Review Only
123456789101112131415161718192021222324252627282930313233343536373839404142434445464748495051525354555657585960
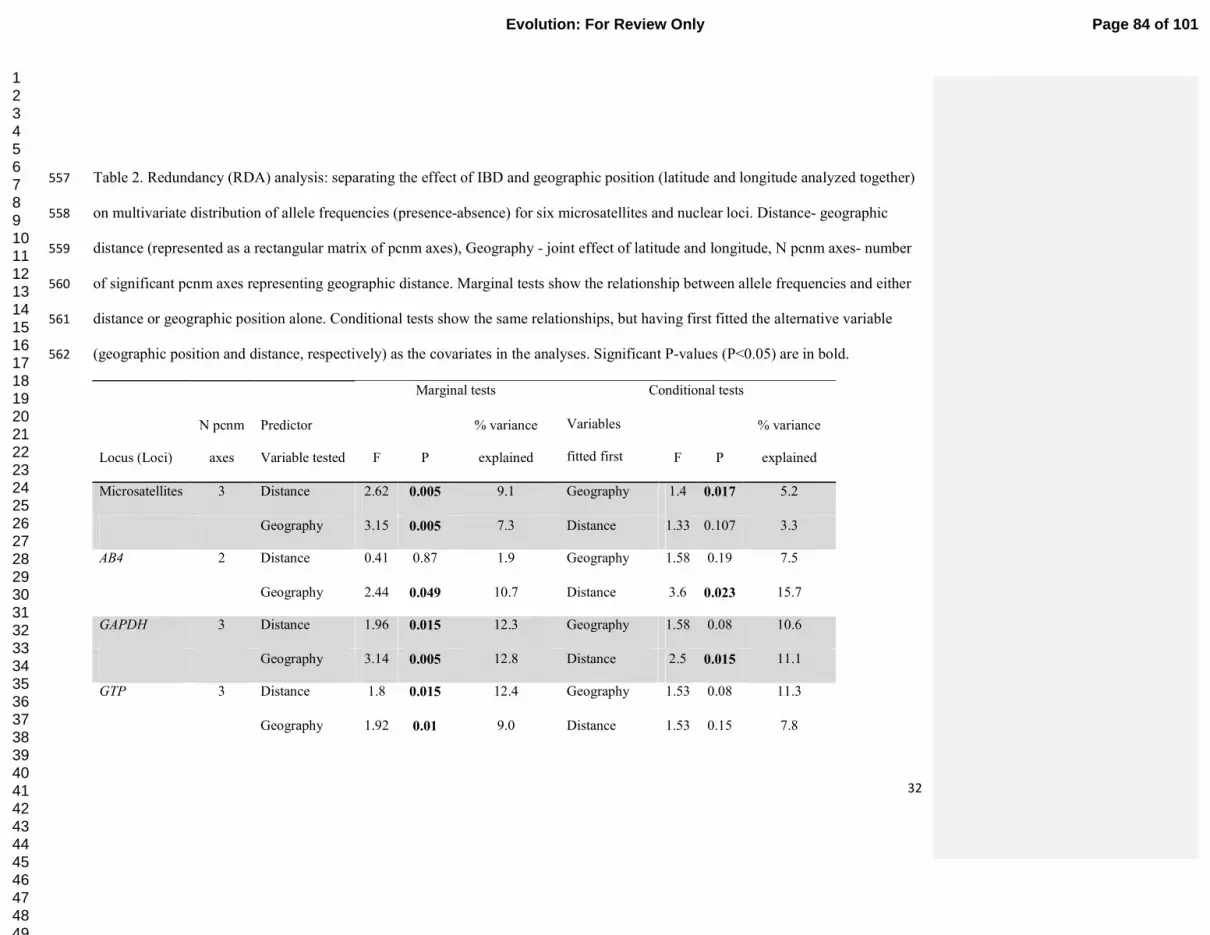
32
Table 2. Redundancy (RDA) analysis: separating the effect of IBD and geographic position (latitude and longitude analyzed together) 557
on multivariate distribution of allele frequencies (presence-absence) for six microsatellites and nuclear loci. Distance- geographic 558
distance (represented as a rectangular matrix of pcnm axes), Geography - joint effect of latitude and longitude, N pcnm axes- number 559
of significant pcnm axes representing geographic distance. Marginal tests show the relationship between allele frequencies and either 560
distance or geographic position alone. Conditional tests show the same relationships, but having first fitted the alternative variable 561
(geographic position and distance, respectively) as the covariates in the analyses. Significant P-values (P<0.05) are in bold. 562
Marginal tests Conditional tests
Locus (Loci)
N pcnm
axes
Predictor
Variable tested F P
% variance
explained
Variables
fitted first F P
% variance
explained
Microsatellites 3 Distance 2.62 0.005 9.1 Geography 1.4 0.017 5.2
Geography 3.15 0.005 7.3 Distance 1.33 0.107 3.3
AB4 2 Distance 0.41 0.87 1.9 Geography 1.58 0.19 7.5
Geography 2.44 0.049 10.7 Distance 3.6 0.023 15.7
GAPDH 3 Distance 1.96 0.015 12.3 Geography 1.58 0.08 10.6
Geography 3.14 0.005 12.8 Distance 2.5 0.015 11.1
GTP 3 Distance 1.8 0.015 12.4 Geography 1.53 0.08 11.3
Geography 1.92 0.01 9.0 Distance 1.53 0.15 7.8
Page 84 of 101Evolution: For Review Only
123456789101112131415161718192021222324252627282930313233343536373839404142434445464748495051525354555657585960
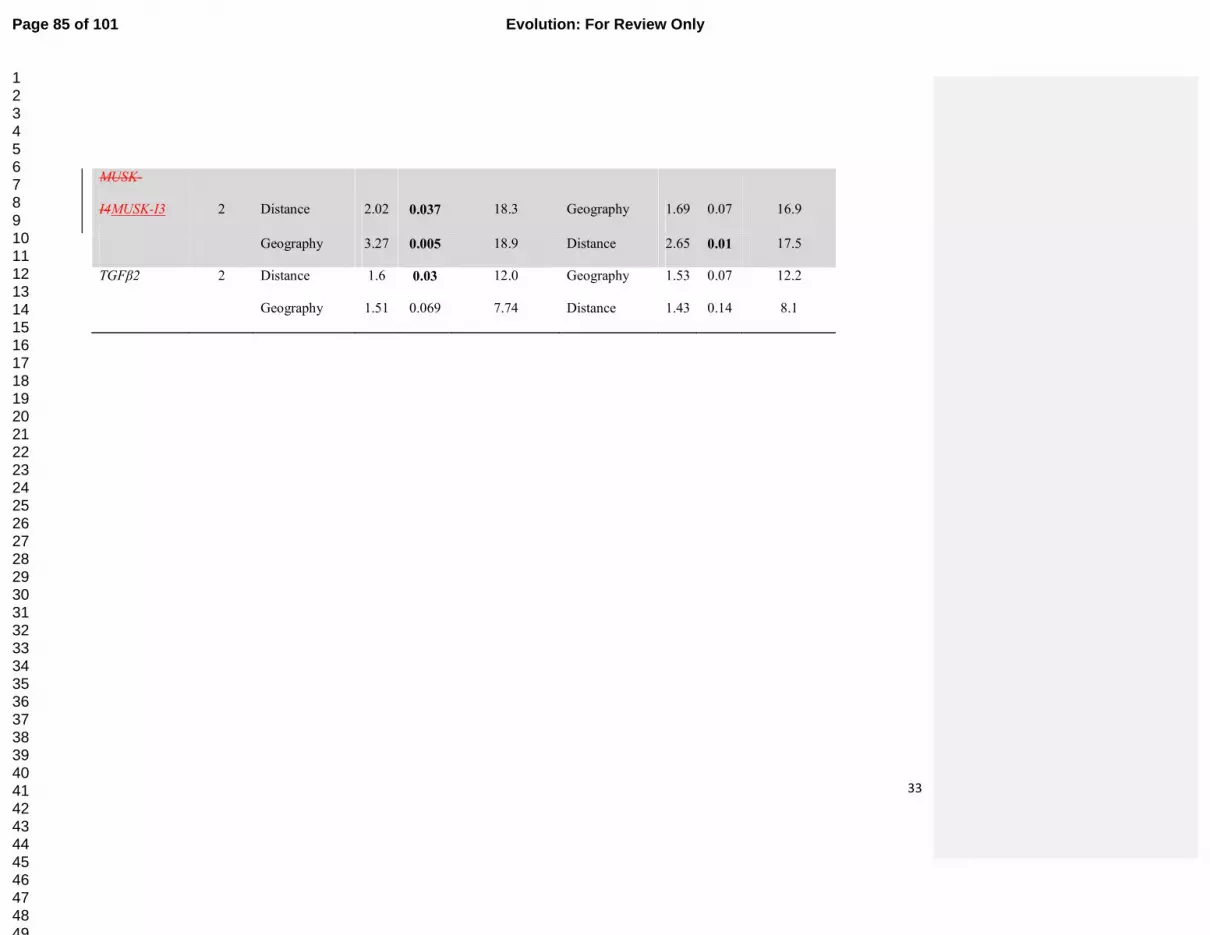
33
MUSK-
I4MUSK-I3 2 Distance 2.02 0.037 18.3 Geography 1.69 0.07 16.9
Geography 3.27 0.005 18.9 Distance 2.65 0.01 17.5
TGFβ2 2 Distance 1.6 0.03 12.0 Geography 1.53 0.07 12.2
Geography 1.51 0.069 7.74 Distance 1.43 0.14 8.1
Page 85 of 101 Evolution: For Review Only
123456789101112131415161718192021222324252627282930313233343536373839404142434445464748495051525354555657585960

34
Table 3. Results of dbRDA analysis: tests of relationship between multivariate mtDNA genetic 563
variation (defined by pairwise mtDNA genetic distances) and several predictor variables 564
(geographic and environmental). The first row for each tested predictor is a marginal test for that 565
variable, the next four rows are conditional (partial) tests where variables given in second 566
column are partialed out (fitted before the variable being tested). Last column indicates 567
percentage of multivariate genetic variation explained by variable being tested. Max.temp- 568
maximum temperature of warmest month, Precipitation- precipitation of driest month, All- all 569
variables except the one being tested. Longitude was not a significant predictor of genetic 570
distance in the marginal test (F=0.34, P=0.59), and was not used for partial tests. Significant P-571
values (P<0.05) are in bold. 572
Predictor variable tested Variables fitted first
in partial tests
F P(>F) % variance
explained
Geographic distance 3.3 0.072 3.3
Latitude 26.6 0.005 21.9
Max.temp 0.6 0.42 0.6
Precipitation 1.6 0.24 1.6
All 7.5 0.01 7.5
Latitude 31.1 0.005 24.5
Geographic distance 60.9 0.005 39.0
Max.temp 12.3 0.005 11.5
Precipitation 4.4 0.030 4.6
All 11.6 0.005 11.1
Max.temp 100 0.005 51.1
Geographic distance 94.1 0.005 49.7
Page 86 of 101Evolution: For Review Only
123456789101112131415161718192021222324252627282930313233343536373839404142434445464748495051525354555657585960

35
Latitude 70.6 0.005 42.6
Geog. distance + latitude 57.8 0.005 38.1
Precipitation 27.0 0.005 22.0
All 33.2 0.005 26.3
Precipitation 86.4 0.005 47.4
Geographic distance 82.4 0.005 46.5
Latitude 47.6 0.005 33.4
Geog. distance + latitude 18.8 0.005 16.7
Max.temp 18.3 0.005 16.1
All 0.7 0.38 0.8
573
Page 87 of 101 Evolution: For Review Only
123456789101112131415161718192021222324252627282930313233343536373839404142434445464748495051525354555657585960

36
LITERATURE CITED 574
Baker, A. J., E. S. Tavares, and R. F. Elbourne. 2009. Countering criticisms of single 575
mitochondrial DNA gene barcoding in birds. Molecular Ecology Resources 9:257-268. 576
Balakrishnan, C. N., and S. V. Edwards. 2009. Nucleotide variation, linkage disequilibrium and 577
founder-facilitated speciation in wild populations of the zebra finch (Taeniopygia 578
guttata). Genetics 181:645. 579
Ballard, J. W. O., and R. G. Melvin. 2010. Linking the mitochondrial genotype to the organismal 580
phenotype. Mol Ecol 19:1523-1539. 581
Ballard, J. W. O., and M. C. Whitlock. 2004. The incomplete natural history of mitochondria. 582
Mol Ecol 13:729-744. 583
Bandelt, H.-J., P. Forster, and A. Roehl. 1999. Median-joining networks for inferring 584
intraspecific phylogenies. Molecular Biology & Evolution 16:37-48. 585
Barrett, G., A. Silcocks, S. Barry, R. Cunningham, and R. Poulter. 2003. The New Atlas of 586
Australian Birds. Royal Australasian Ornithologists Union, Melbourne. 587
Barrows, T. T., J. O. Stone, L. K. Fifield, and R. G. Cresswell. 2001. Late Pleistocene glaciation 588
of the Kosciuszko Massif, Snowy Mountains, Australia. Quat. Res. 55:179-189. 589
Bazin, E., S. Glemin, and N. Galtier. 2006. Population size does not influence mitochondrial 590
genetic diversity in animals. Science 312:570-572. 591
Bensch, S., D. E. Irwin, J. H. Irwin, L. Kvist, and S. Akesson. 2006. Conflicting patterns of 592
mitochondrial and nuclear DNA diversity in Phylloscopus warblers. Mol Ecol 15:161-593
171. 594
Bensch, S., T. Price, and J. Kohn. 1997. Isolation and characterization of microsatellite loci in a 595
Phylloscopus warbler. Mol Ecol 6:91-92. 596
Page 88 of 101Evolution: For Review Only
123456789101112131415161718192021222324252627282930313233343536373839404142434445464748495051525354555657585960

37
Borcard, D., and P. Legendre. 2002. All-scale spatial analysis of ecological data by means of 597
principal coordinates of neighbour matrices. Ecol Model 153:51-68. 598
Bowman, D. M. J. S., G. K. Brown, M. F. Braby, J. R. Brown, L. G. Cook, M. D. Crisp, F. Ford, 599
S. Haberle, J. Hughes, Y. Isagi, L. Joseph, J. McBride, G. Nelson, and P. Y. Ladiges. 600
2010. Biogeography of the Australian monsoon tropics. J Biogeogr 37:201-216. 601
Busby, J. R. 1991. BIOCLIM a bioclimatic analysis and prediction system. Pp. 64–68 in C. R. 602
Margules, and M. P. Austin, eds. Nature Conservation: Cost Effective Biological Surveys 603
and Data Analysis. CSIRO, Canberra. 604
Butlin, R., D. Schluter, and J. R. Bridle. 2009. Speciation and patterns of diversity. Cambridge 605
University Press, Cambridge, UK. 606
Byrne, M., D. Steane, L. Joseph, D. Yeates, G. Jordan, D. Crayn, K. Aplin, D. Cantrill, L. G. 607
Cook, M. D. Crisp, J. S. Keogh, J. Melville, C. Moritz, N. Porch, J. M. K. Sniderman, P. 608
Sunnucks, and P. H. Weston. 2011. Decline of a biome: evolution, contraction, 609
fragmentation, extinction and invasion of the Australian mesic zone biota. J Biogeogr In 610
press. 611
Chen, C., E. Durand, F. Forbes, and O. Francois. 2007. Bayesian clustering algorithms 612
ascertaining spatial population structure: a new computer program and a comparison 613
study. Mol Ecol Notes 7:747-756. 614
Cheviron, Z. A., and R. T. Brumfield. 2009. Migration-selection balance and local adaptation of 615
mitochondrial haplotypes in rufous-collared sparrows (Zonotrichia capensis) along an 616
elevational gradient. Evolution 63:1593-1605. 617
Page 89 of 101 Evolution: For Review Only
123456789101112131415161718192021222324252627282930313233343536373839404142434445464748495051525354555657585960

38
Christidis, L., M. Irestedt, D. Rowe, W. E. Boles, and J. A. Norman. 2011. Mitochondrial and 618
nuclear DNA phylogenies reveal a complex evolutionary history in the Australasian 619
robins (Passeriformes: Petroicidae). Mol Phylogenet Evol 61:726–738. 620
Coyne, J., and H. A. Orr. 2004. Speciation. Sinauer, Sunderland, Massachusetts. 621
Crandall, K. A., O. R. P. Bininda-Emonds, G. M. Mace, and R. K. Wayne. 2000. Considering 622
evolutionary processes in conservation biology. Trends Ecol Evol 15:290-295. 623
Debus, S. J. S., and H. A. Ford. 2012. Responses of Eastern Yellow Robins Eopsaltria australis 624
to translocation into vegetation remnants in a fragmented landscape. Pac Conserv Biol in 625
press. 626
Dixon, P. 2003. VEGAN, a package of R functions for community ecology. J Veg Sci 14:927-627
930. 628
Doerr, E. D. 2005. Characterization of microsatellite loci in the brown treecreeper (Climacteris 629
picumnus) and cross-species amplification in the white-throated treecreeper (Cormobates 630
leucophaeus). Mol Ecol Notes 5:654-656. 631
Dowling, D., U. Friberg, and J. Lindell. 2008. Evolutionary implications of non-neutral 632
mitochondrial genetic variation. Trends Ecol Evol 23:546-554. 633
Dowling, D. K., G. J. Adcock, and R. A. Mulder. 2003. Novel polymorphic microsatellite 634
markers for paternity analysis in the red-capped robin (Petroica goodenovii: Aves). Mol 635
Ecol Notes 3:517-519. 636
Drummond, A., and A. Rambaut. 2007. BEAST: Bayesian evolutionary analysis by sampling 637
trees. BMC Evol Biol 7:214. 638
Page 90 of 101Evolution: For Review Only
123456789101112131415161718192021222324252627282930313233343536373839404142434445464748495051525354555657585960

39
Drummond, A. J., B. Ashton, S. Buxton, M. Cheung, A. Cooper, J. Heled, M. Kearse, R. Moir, 639
S. Stones-Havas, S. Sturrock, T. Thierer, and A. Wilson. 2010. Geneious v5.1. Available 640
from http://www.geneious.com. 641
Drummond, A. J., M. A. Suchard, D. Xie, and A. Rambaut. 2012. Bayesian phylogenetics with 642
BEAUti and the BEAST 1.7. Mol Biol Evol 29:1969-1973. 643
Excoffier, L., G. Laval, and S. S. 2005. Arlequin ver. 3.0: An integrated software package for 644
population genetics data analysis. Evolutionary Bioinformatics Online 1:47-50. 645
Ford, J. C. 1979. Speciation or Subspeciation in the Yellow Robins? Emu 79:103-106. 646
Fu, Y.-X. 1997. Statistical tests of neutrality of mutations against population growth, hitchhiking 647
and backgroud selection. Genetics 147:915-925. 648
Garrick, R. C., P. Sunnucks, and R. J. Dyer. 2010. Nuclear gene phylogeography using PHASE: 649
dealing with unresolved genotypes, lost alleles, and systematic bias in parameter 650
estimation. BMC Evol Biol 10:118. 651
Geffen, E. L. I., M. J. Anderson, and R. K. Wayne. 2004. Climate and habitat barriers to 652
dispersal in the highly mobile grey wolf. Mol Ecol 13:2481-2490. 653
Grantham, R. 1974. Amino acid difference formula to help explain protein evolution. Science 654
185:862-864. 655
Griffiths, R., M. C. Double, K. Orr, and R. J. G. Dawson. 1998. A DNA test to sex most birds. 656
Mol Ecol 7:1071-1075. 657
Hackett, S. J. 1996. Molecular Phylogenetics and Biogeography of Tanagers in the Genus 658
Ramphocelus (Aves). Mol Phylogenet Evol 5:368-382. 659
Page 91 of 101 Evolution: For Review Only
123456789101112131415161718192021222324252627282930313233343536373839404142434445464748495051525354555657585960
40
Hanotte, O., C. Zanon, A. Pugh, C. Greig, A. Dixon, and T. Burke. 1994. Isolation and 660
characterization of microsatellite loci in a passerine bird: The reed bunting Emberiza 661
schoeniclus. Mol Ecol 3:529-530. 662
Harrison, R. G. 1989. Animal mitochondrial DNA as a genetic marker in population and 663
evolutionary biology. Trends Ecol. Evol. 4(1):6-11. 664
Harrisson, K., A. Pavlova, J. N. Amos, N. Takeuchi, A. Lill, J. Q. Radford, and P. Sunnucks. 665
2012. Fine-scale effects of habitat loss and fragmentation despite large-scale gene flow 666
for some regionally declining woodland bird species. Landsc Ecol 27:813-827. 667
Hey, J., and R. Nielsen. 2004. Multilocus methods for estimating population sizes, migration 668
rates and divergence time, with applications to the divergence of Drosophila 669
pseudoobscura and D-persimilis. Genetics 167:747-760. 670
Hey, J., and R. Nielsen. 2007. Integration within the Felsenstein equation for improved Markov 671
chain Monte Carlo methods in population genetics. Proceedings of the National Academy 672
of Sciences 104:2785-2790. 673
Higgins, P. J., and J. M. Peter, eds. 2002. Handbook of Australian, New Zealand and Antarctic 674
Birds. Volume 6: Pardalotes to Shrike-thrushes. Oxford University Press, Melbourne. 675
Hijmans, R. J., S. E. Cameron, J. L. Parra, P. G. Jones, and A. Jarvis. 2005. Very high resolution 676
interpolated climate surfaces for global land areas. International Journal of Climatology 677
25:1965–1978. 678
Hijmans, R. J. 2009. DIVA-GIS, version 7. A geographic information system for the analysis of 679
biodiversity data. Available at: http://www.diva-gis.org. 680
Hogner, S., T. Laskemoen, J. T. Lifjeld, J. Porkert, O. Kleven, T. Albayrak, B. Kabasakal, and 681
A. Johnsen. 2012. Deep sympatric mitochondrial divergence without reproductive 682
Page 92 of 101Evolution: For Review Only
123456789101112131415161718192021222324252627282930313233343536373839404142434445464748495051525354555657585960
41
isolation in the common redstart Phoenicurus phoenicurus. Ecology and Evolution doi: 683
10.1002/ece3.398. 684
Hudson, R. R., and N. L. Kaplan. 1985. Statistical properties of the number of recombination 685
events in the history of a sample of DNA sequences. Genetics 111:147. 686
Irwin, D. E. 2002. Phylogeographic breaks without geographic barriers to gene flow. Evolution 687
56:2383-2394. 688
Irwin, D. E., S. Bensch, J. H. Irwin, and T. D. Price. 2005. Speciation by distance in a ring 689
species. Science 307:414-416. 690
Irwin, D. E. 2012. Local adaptation along smooth ecological gradients causes phylogeographic 691
breaks and phenotypic clustering. The American Naturalist 180:35-49. 692
Jombart, T. 2008. Adegenet: a R package for the multivariate analysis of genetic markers. 693
Bioinformatics 24:1403-1405. 694
Jombart, T., S. Devillard, A. B. Dufour, and D. Pontier. 2008. Revealing cryptic spatial patterns 695
in genetic variability by a new multivariate method. Heredity 101:92-103. 696
Kearns, A. M., L. Joseph, S. V. Edwards, and M. C. Double. 2009. Inferring the phylogeography 697
and evolutionary history of the splendid fairy-wren Malurus splendens from 698
mitochondrial DNA and spectrophotometry. J Avian Biol 40:7-17. 699
Legendre, P., and M. J. Anderson. 1999. Distance-based redundancy analysis: Testing 700
multispecies responses in multifactorial ecological experiments. Ecol Monogr 69:1-24. 701
Legendre, P., and M.-J. Fortin. 2010. Comparison of the Mantel test and alternative approaches 702
for detecting complex multivariate relationships in the spatial analysis of genetic data. 703
Molecular ecology resources 10:831-844. 704
Page 93 of 101 Evolution: For Review Only
123456789101112131415161718192021222324252627282930313233343536373839404142434445464748495051525354555657585960
42
Lerner, H. R. L., M. Meyer, H. F. James, M. Hofreiter, and R. C. Fleischer. 2011. Multilocus 705
Resolution of Phylogeny and Timescale in the Extant Adaptive Radiation of Hawaiian 706
Honeycreepers. Curr Biol 21:1838-1844. 707
Librado, P., and J. Rozas. 2009. DnaSP v5: a software for comprehensive analysis of DNA 708
polymorphism data. Bioinformatics 25:1451. 709
Lohse, K., B. Sharanowski, and G. N. Stone. 2010. Quantifying the Pleistocene history of the 710
oak gall parasitoid Cecidostiba fungosa using twenty intron loci. Evolution 64:2664-711
2681. 712
Loynes, K., L. Joseph, and J. S. Keogh. 2009. Multi-locus phylogeny clarifies the systematics of 713
the Australo-Papuan robins (Family Petroicidae, Passeriformes). Mol Phylogenet Evol 714
53:212-219. 715
Maguire, G. S., P. J. Guay, and R. A. Mulder. 2006. Isolation and characterization of 716
microsatellite markers in the southern emu-wren (Stipiturus malachurus: Aves). Mol 717
Ecol Notes 6:422-424. 718
Malekian, M., S. J. B. Cooper, J. A. Norman, L. Christidis, and S. M. Carthew. 2010. Molecular 719
systematics and evolutionary origins of the genus Petaurus (Marsupialia: Petauridae) in 720
Australia and New Guinea. Mol Phylogenet Evol 54:122-135. 721
McCracken, K. G., and M. D. Sorenson. 2005. Is homoplasy or lineage sorting the source of 722
incongruent mtDNA and nuclear gene trees in the stiff-tailed ducks (Nomonyx-Oxyura)? 723
Syst Biol 54:35. 724
McDonald, J. H., and M. Kreitman. 1991. Adaptive protein evolution at the Adh locus in 725
Drosophila. Nature 351:652-654. 726
Page 94 of 101Evolution: For Review Only
123456789101112131415161718192021222324252627282930313233343536373839404142434445464748495051525354555657585960

43
Meiklejohn, C. D., K. L. Montooth, and D. M. Rand. 2007. Positive and negative selection on 727
the mitochondrial genome. Trends Genet 23:259-263. 728
Mishmar, D., E. Ruiz-Pesini, P. Golik, V. Macaulay, A. G. Clark, S. Hosseini, M. Brandon, K. 729
Easley, E. Chen, and M. D. Brown. 2003. Natural selection shaped regional mtDNA 730
variation in humans. Proceedings of the National Academy of Sciences 100:171. 731
Moghadam, H. K., M. A. Pointer, A. E. Wright, S. Berlin, and J. E. Mank. 2012. W chromosome 732
expression responds to female-specific selection. Proceedings of the National Academy 733
of Sciences 109:8207-8211. 734
Nosil, P., S. P. Egan, and D. J. Funk. 2008. Heterogeneous genomic differentiation between 735
walking-stick ecotypes: ‘‘Isolation by adaptation’’ and multiple roles for divergent 736
selection. Evolution 62:316–336. 737
Oksanen, J., F. G. Blanchet, R. Kindt, P. Legendre, R. B. O'Hara, G. L. Simpson, P. Solymos, M. 738
Henry, H. Stevens, and H. Wagner. 2011. vegan: Community Ecology Package. R 739
package version 1.17-11. 740
Petit, R. J., and L. Excoffier. 2009. Gene flow and species delimitation. Trends Ecol Evol 741
24:386-393. 742
Phillips, S., R. Anderson, and R. Schapire. 2006. Maximum entropy modeling of species 743
geographic distributions. Ecol Model 190:231-259. 744
Pinho, C., and J. Hey. 2010. Divergence with Gene Flow: Models and Data. Annual Review of 745
Ecology, Evolution, and Systematics 41:215-230. 746
Price, T. 2008. Speciation in birds. Roberts and Company Publishers., Greenwood Village, 747
Colorado. 748
Page 95 of 101 Evolution: For Review Only
123456789101112131415161718192021222324252627282930313233343536373839404142434445464748495051525354555657585960

44
Primmer, C. R., A. P. Moller, and H. Ellegren. 1995. Resolving genetic relationships with 749
microsatellite markers: A parentage testing system for the swallow Hirundo rustica. Mol 750
Ecol 4:493-498. 751
Pritchard, J. K., M. Stephens, and P. Donnelly. 2000. Inference of population structure using 752
multilocus genotype data. Genetics 155:945-959. 753
R Development Core Team. 2011. R: A Language and Environment for Statistical Computing. R 754
Foundation for Statistical Computing, Vienna, Austria. 755
Rand, D. M., R. A. Haney, and A. J. Fry. 2004. Cytonuclear coevolution: the genomics of 756
cooperation. Trends Ecol Evol 19:645-653. 757
Ribeiro, Â. M., P. Lloyd, and R. C. K. Bowie. 2011. A tight balance between natural selection 758
and gene flow in a southern African arid-zone endemic bird. Evolution DOI: 759
10.1111/j.1558-5646.2011.01397.x. 760
Schneider, C. J., T. B. Smith, B. Larison, and C. Moritz. 1999. A test of alternative models of 761
diversification in tropical rainforests: Ecological gradients vs. rainforest refugia. Proc 762
Natl Acad Sci U S A 96:13869-13873. 763
Schodde, R., and I. J. Mason. 1999. The directory of Australian birds. A taxonomic and 764
zoogeographic atlas of the biodiversity of birds in Australia and its Territories. 765
Passerines. CSIRO Publishing Collingwood. 766
Shen, Y. Y., L. Liang, Z. H. Zhu, W. P. Zhou, D. M. Irwin, and Y. P. Zhang. 2010. Adaptive 767
evolution of energy metabolism genes and the origin of flight in bats. Proceedings of the 768
National Academy of Sciences 107:8666-8671. 769
Smadja, C. M., and R. K. Butlin. 2011. A framework for comparing processes of speciation in 770
the presence of gene flow. Mol Ecol 20:5123–5140. 771
Page 96 of 101Evolution: For Review Only
123456789101112131415161718192021222324252627282930313233343536373839404142434445464748495051525354555657585960

45
Sorenson, M. D., J. C. Ast, D. E. Dimcheff, T. Yuri, and D. P. Mindell. 1999. Primers for a PCR-772
Based Approach to Mitochondrial Genome Sequencing in Birds and Other Vertebrates. 773
Mol Phylogenet Evol 12:105-114. 774
Sorenson, M. D., C. N. Balakrishnan, and R. B. Payne. 2004. Clade-limited colonization in 775
brood parasitic finches (Vidua spp.). Syst Biol 53:140. 776
Spottiswoode, C. N., K. F. Stryjewski, S. Quader, J. F. R. Colebrook-Robjent, and M. D. 777
Sorenson. 2011. Ancient host specificity within a single species of brood parasitic bird. 778
Proceedings of the National Academy of Sciences 108:17738-17742. 779
Stephens, M., and P. Donnelly. 2003. A comparison of bayesian methods for haplotype 780
reconstruction from population genotype data. The American Journal of Human Genetics 781
73:1162-1169. 782
Stephens, M., N. J. Smith, and P. Donnelly. 2001. A new statistical method for haplotype 783
reconstruction from population data. The American Journal of Human Genetics 68:978-784
989. 785
Sunnucks, P., M. J. Blacket, J. M. Taylor, C. J. Sands, S. A. Ciavaglia, R. C. Garrick, N. N. Tait, 786
D. M. Rowell, and A. Pavlova. 2006. A tale of two flatties: different responses of two 787
terrestrial flatworms to past environmental climatic fluctuations at Tallaganda in montane 788
southeastern Australia. Mol Ecol 15:4513-4531. 789
Symula, R., J. S. Keogh, and D. C. Cannatella. 2008. Ancient phylogeographic divergence in 790
southeastern Australia among populations of the widespread common froglet, Crinia 791
signifera. Mol Phylogenet Evol 47:569-580. 792
Tajima, F. 1996. The amount of DNA polymorphism maintained in a finite population when the 793
neutral mutation rate varies among sites. Genetics 143:1457-1465. 794
Page 97 of 101 Evolution: For Review Only
123456789101112131415161718192021222324252627282930313233343536373839404142434445464748495051525354555657585960
46
Tamura, K., D. Peterson, N. Peterson, G. Stecher, M. Nei, and S. Kumar. 2011. MEGA5: 795
Molecular Evolutionary Genetics Analysis using Maximum Likelihood, Evolutionary 796
Distance, and Maximum Parsimony Methods. Mol Biol Evol (submitted). 797
Tieleman, B. I., M. A. Versteegh, A. Fries, B. Helm, N. J. Dingemanse, H. L. Gibbs, and J. B. 798
Williams. 2009. Genetic modulation of energy metabolism in birds through 799
mitochondrial function. Proceedings of the Royal Society B: Biological Sciences 800
276:1685. 801
Tieleman, B. I., J. B. Williams, and P. Bloomer. 2003. Adaptation of metabolism and 802
evaporative water loss along an aridity gradient. Proceedings of the Royal Society of 803
London. Series B: Biological Sciences 270:207. 804
Toews, D. P. L., and A. Brelsford. 2012. The biogeography of mitochondrial and nuclear 805
discordance in animals. Mol Ecol 21:3907-3930. 806
Tonnis, B., P. R. Grant, B. R. Grant, and K. Petren. 2005. Habitat selection and ecological 807
speciation in Galápagos warbler finches (Certhidea olivacea and Certhidea fusca). 808
Proceedings of the Royal Society B: Biological Sciences 272:819-826. 809
Turmelle, A. S., T. H. Kunz, and M. D. Sorenson. 2011. A tale of two genomes: contrasting 810
patterns of phylogeographic structure in a widely distributed bat. Mol Ecol. 811
Vallender, R., R. J. Robertson, V. L. Friesen, and I. J. Lovette. 2007. Complex hybridization 812
dynamics between golden-winged and blue-winged warblers (Vermivora chrysoptera and 813
Vermivora pinus) revealed by AFLP, microsatellite, intron and mtDNA markers. Mol 814
Ecol 16:2017-2029. 815
Page 98 of 101Evolution: For Review Only
123456789101112131415161718192021222324252627282930313233343536373839404142434445464748495051525354555657585960
47
Via, S. 2012. Divergence hitchhiking and the spread of genomic isolation during ecological 816
speciation-with-gene-flow. Philosophical Transactions of the Royal Society B: Biological 817
Sciences 367:451-460. 818
Waltari, E., and S. V. Edwards. 2002. Evolutionary dynamics of intron size, genome size, and 819
physiological correlates in archosaurs. Am Nat:539-552. 820
Webb, W. C., J. M. Marzluff, and K. E. Omland. 2011. Random interbreeding between cryptic 821
lineages of the Common Raven: evidence for speciation in reverse. Mol Ecol 20:2390-822
2402. 823
Williams, J. B., and B. I. Tieleman. 2005. Physiological adaptation in desert birds. Bioscience 824
55:416-425. 825
Zink, R. M., and G. F. Barrowclough. 2008. Mitochondrial DNA under siege in avian 826
phylogeography. Mol Ecol 17:2107-2121. 827
Zink, R. M., A. Pavlova, S. Drovetski, and S. Rohwer. 2008. Mitochondrial phylogeographies of 828
five widespread Eurasian bird species. Journal of Ornithology 149:399-413. 829
Page 99 of 101 Evolution: For Review Only
123456789101112131415161718192021222324252627282930313233343536373839404142434445464748495051525354555657585960
48
FIGURE CAPTIONS 830
Figure 1. (a) Sampling localities (dots) and geographic distribution of mitochondrial haplogroups 831
(colors): light red dots - A1, dark red dots - A2, black dots - B; numbers show distribution of 832
haplotypes (labeled as on Fig. 3). Insets show two locations where both haplogroups were 833
sampled: in Tenterfield, a haplogroup A male was collected on the same day from the same 834
group of birds as a haplogroup B male and female; in Shelbourne, a haplogroup B male and 835
haplogroup A male were caught in May and October 2008, respectively. (b) Distribution of Q-836
values (pie charts within circles) for two microsatellite genetic clusters (‘red’ and ‘black’), 837
detected by STRUCTURE; each circle’s outer border color shows the mitochondrial haplogroup for 838
each individual: light red - A1, dark red - A2, black - B; samples are spaced apart for easier 839
viewing. Altitudinal layers of the Great Dividing Range are: light grey - 200 to 500 m, grey - 500 840
to 1000 m, dark grey - above 1000 m. 841
842
Figure 2. Haplotype networks for mitochondrial ND2 and six nuclear introns. Circles indicate 843
unique haplotypes, with area proportional to haplotype frequency. Connections between circles 844
are a single mutation unless indicated otherwise (italic). Colors correspond to the haplogroups: 845
grey- A (light grey - A1, corresponding to light red dots on Fig. 1A, dark grey - A2 [two 846
haplotypes, H9 and H12, on mtDNA network], dark red dot on Fig. 1A), white - B (black dots on 847
Fig. 1A); black pies on nuclear networks indicate individuals sequenced for nDNA but not for 848
mtDNA (thus, mtDNA haplogroup for these individuals was unknown). 849
850
Figure 3. Geographic distribution of spatial principal component (sPCA) scores for 851
mitochondrial ND2 (mt-sPC1 and mt-sPC2), microsatellites (msat-sPC1 and msat-sPC2), 852
Page 100 of 101Evolution: For Review Only
123456789101112131415161718192021222324252627282930313233343536373839404142434445464748495051525354555657585960

49
GAPDH (GAPDH-sPC1) and MUSK-I4MUSK-I3 (MUSK-I4MUSK-I3-sPC1). Large black 853
squares indicate samples well differentiated from those denoted by large white squares, small 854
squares are less differentiated. Lines indicate values of sPCA scores for interpolated surface 855
(lags). Narrowly spread lines and a lack of small squares indicate discontinuity or sharp 856
geographic transition between two groups (as for mtDNA). Presence of smaller squares and 857
broadly spread lines indicate a cline (as for microsatellites). 858
859
Figure 4. Distribution of two major mtDNA lineages of Eopsaltria australis in environmental 860
space, as defined by two BIOCLIM variables, max temperature of warmest month and 861
precipitation of driest month. Two localities where both haplogroups occurred together are 862
marked with arrows.863
864
Page 101 of 101 Evolution: For Review Only
123456789101112131415161718192021222324252627282930313233343536373839404142434445464748495051525354555657585960