pension reform and income inequality among the elderly in 15 european countries
TRANSCRIPT
Electronic copy available at: http://ssrn.com/abstract=1909838
Leiden Law School
Department of Economics Research Memorandum 2011.03 Pension reform and income inequality among the elderly in 15 European countries
Olaf van Vliet, Jim Been, Koen Caminada and Kees Goudswaard L e i d e n U n i v e r s i t y

Electronic copy available at: http://ssrn.com/abstract=1909838
Correspondence to Leiden Law School Department of Economics P.O. Box 9520 2300 RA Leiden The Netherlands Phone ++31 71 527 7756 (7855) Email: [email protected] Website: www.economie.leidenuniv.nl
Editors Prof. dr. C.L.J. Caminada Dr B.C.J. van Velthoven
Pension reform and income inequality among the
elderly in 15 European countries ∗∗∗∗
Olaf van Vliet, Jim Been, Koen Caminada and Kees Goudswaard
Leiden Law School, Leiden University
Department of Economics
Research program Reforming Social Security
(www.hsz.leidenuniv.nl)
P.O. Box 9520, 2300 RA Leiden, The Netherlands
Phone: ++31 71 527 7756
E-mail: [email protected]
E-mail: [email protected]
E-mail: [email protected] E-mail: [email protected]
Abstract
The ageing of populations and hampering economic growth increase pressure on public fi-
nances in many advanced capitalist societies. Consequently, governments have adopted pen-
sion reforms in order to relieve pressure on public finances. These reforms have contributed
to a relative shift from public to private pension schemes. Since private social security plans
are generally less redistributive than public social security, it can be hypothesized that the
privatization of pension plans has led to higher levels of income inequality among the elderly.
Existing empirical literature has mainly focused on cross-country comparisons at one moment
in time or on time-series for a single country. This study contributes to the income inequality
and pension literature by empirically analysing the distributional effects of shifts from public
to private pension provision in 15 European countries for the period 1995-2007, using pooled
time series cross-section regression analyses. Remarkably, we do not find empirical evidence
that shifts from public to private pension provision lead to higher levels of income inequality
or poverty among elderly people. The results appear to be robust for a wide range of econo-
metric specifications.
JEL-codes: H53, H55, and I32
Key words: income inequality, pension reform, public/private-mix, retirement, welfare state
∗ Revised version of a paper presented at the 18th International Research Seminar of the Foundation for Inter-
national Studies on Social Security, Sigtuna, Sweden, 8-10 June, 2011. We would like to thank the partici-
pants, in particular Bjørn Hvinden, Tim van Rie, Frank Vandenbroucke and Peter Whiteford, for their helpful
suggestions. In addition, thanks to Marike Knoef and Ben van Velthoven for their useful comments. This
study is part of the research program ‘Reforming Social Security’: www.hsz.leidenuniv.nl. Financial support of
Stichting Instituut GAK is gratefully acknowledged.


- 1 -
1. Introduction
The ageing of populations has triggered pension reform in many industrialized countries over
the past decades. Plans to alleviate the pressure of ageing on public finances have resulted in
a trend towards more private pension provision (OECD, 2009; Orenstein, 2011). In the pen-
sion literature, remarkably little attention has been paid to the distributive effects of these
reforms for the elderly. Since private social security arrangements generally entail less in-
come redistribution than public social security (Goudswaard and Caminada, 2010), it could be
expected that shifts from public to private in the pension provision lead to higher levels of
income inequality and poverty among elderly people (Arza, 2008). This would imply a trade-
off between alleviating the pressure on public finances on the one hand and income inequality
among the elderly on the other. The empirical literature in this field exists mainly of either
cross-national studies at one moment in time (for example Smeeding and Williamson, 2001)
or descriptive analyses for a single country (for example Milligan, 2008). As a consequence,
relatively little insight has been gained about how pension reforms have influenced income
inequality and poverty among the elderly in advanced capitalist countries over the past dec-
ades.
The aim of this study is to examine the relationship between the developments in pension
systems and the variation in income inequality and poverty among the elderly across coun-
tries and over time. First, we will analyze to what extent reforms have resulted in a trend
towards relatively more private pension provision across advanced capitalist countries. To that
end we use the most recent release of the OECD Social Expenditure database (2010). Indeed,
in the pension systems of many countries there have been shifts from public to private in the
period 1995-2007, but there is substantial variation across countries. Subsequently, it will be
examined to what extent these shifts have influenced income inequality levels and poverty
rates among the elderly, based on a number of pooled time series cross-section regression
analyses. Our focus on annual macro data for a relatively short period implies that this paper
does not contain an integral income redistribution analysis based on the discounted values of
lifetime income, contributions paid and benefits received. The main result of our analysis is
that a relatively higher private share of pension provision in a country is not associated with
higher levels of income inequality or poverty in that country. With respect to inequality and
poverty, the analysis mainly relies on EU ECHP/SILC data (Eurostat, 2011a), but the results
appear to be robust for other data and for a wide range of econometric specifications.
This paper is structured as follows. In section 2 the relationship between pension reform and
income inequality among elderly people is introduced. Section 3 describes the data, measures
and method used in this study. Section 4 presents descriptive statistics, the results of the
regression analyses and the sensitivity analyses. In section 5 some explanations for our find-
ings will be discussed and the paper closes with the conclusions in section 6.
2. Pension reforms
2.1 Public and private pensions
In an era of ageing populations, relieving public finances is one of the most important drivers
of pension reform. An increase in the number of pensioners relative to the labour force leads
to increasing budgetary pressure. Budgetary problems as a consequence of cyclical shocks,
such as the recession of 2008-2009, may increase the pressure to reform (public) pension
systems even further. However, even though the pressure to reform pensions is high, pension
reforms are in reality often unruly. Since pensions are based on long-term contracts, reforms
are complicated by institutional path dependency (Myles and Pierson, 2001). Changes as
higher statutory pension ages or reductions of pension benefits are often controversial from a
political viewpoint and therefore difficult to realize. Hence, many countries have chosen for a
- 2 -
different approach to pension reform. This approach, which is often labeled ‘pension privatiza-
tion’, entails shifts from public pension provision to a mix of public and private pension provi-
sions and a change from the defined benefit to the defined contribution system (OECD, 2009;
Orenstein, 2011).1 In Germany, for instance, the 2001 pension reform consisted of a reduc-
tion of the public pension levels and the introduction of state-subsidized, voluntary private
pension schemes (Natali and Rhodes, 2008). Based on a comparative case study, Arza (2008)
shows that this is the type of pension reform that has also been opted for in Italy, Sweden,
Poland and the United Kingdom.
The relevant question here is how relative shifts in the pension provision would affect the in-
come distribution among elderly people. Public pension plans are generally based on income-
related funding and flat rate benefits, which relatively strongly benefit lower income groups.
Therefore, public pensions are expected to generate a more equal income distribution and
less poverty among the elderly. In a number of OECD countries, the level of public pension
benefits is such that a relatively small percentage of pensioners falls below the poverty line.
Private pension plans, in contrast, are based on a link between contributions paid and benefits
received and therefore are not expected to contain elements of (ex ante) income redistribu-
tion. A private pension insurance is actuarially fair as a rule. This means that each individual
is provided with benefits whose actuarial value is equal to his contributions, given the chance
of the insured event occurring. This is the case for individual private pension insurances that
have a defined contribution character. However, private earnings-related pension schemes (in
the second pillar) may not be actuarially fair and may contain elements of redistribution. This
is often the case when (supplementary) private schemes are negotiated by social partners in
collective labour contracts. These schemes are mandatory for (a group of) workers. Defined
benefit pension schemes, for example, generally redistribute resources both within genera-
tions (for instance through redistributive elements such as thresholds or ceilings) and across
generations (risk sharing, back service). Also, tax advantages (to households or to employ-
ers) can be used to stimulate the provision of private pensions. This is often the case in sup-
plementary pension programs, where contributions are tax exempt (Yoo and De Serres,
2004). The fiscal advantages related to, for example, supplementary private pension plans
are positively related to income levels in most countries and thus favor the rich (Goudswaard
and Caminada, 2010). In general, as Ferrarini and Nelson (2003, pp. 14-15) showed, social
insurance is less equalising after taxation in all countries.
In summary, it seems plausible that private pension schemes will generate less income redis-
tribution from rich to poor than public programs, although at this stage their distributional
impact in a cross-country analysis is not fully clear. In other words, there are good reasons to
expect that relative shifts from public to private pensions lead to higher income inequality
among the elderly.
2.2 Earlier findings
Much literature analyses the relationship between social security and income inequality in
general. Based on a cross-national study at the macro level Smeeding and Williamson (2001)
conclude that high levels of public social spending are associated with low levels of income
inequality and poverty. Caminada and Goudswaard (2005) and Goudswaard and Caminada
(2010) compare the redistributive effects of public and private social security. Taking a broad
definition of social security and based on an international comparative analysis, they conclude
that the redistributive effect of private social security is smaller than that of public social se-
curity. However, Caminada et al. (2011) find no significant effects of private social expendi-
ture on poverty rates.
1 A shift from public to private pension provision alleviates the pressure on public finances, but it does not
solve financing problems of the pension system. If a deficit of the pension system is considered as unsus-
tainable, the only solution to make it sustainable is reducing benefits, increasing contributions, or both, ei-
ther publicly or privately (Barr and Diamond, 2009).

- 3 -
Interestingly, the findings for pensions seem to be less ambiguous than for social security in
general. A number of cross-sectional studies indicate that income inequality among elderly
people is lower as larger shares of the income of the elderly exist of public pension benefits
(Brown and Prus, 2004; Weller, 2004; Fukawa, 2006). The number of studies on the income
effects of private pensions is considerably smaller, but Schirle (2009) found for Canada that a
larger private share in the pension provision is associated with an increasing income inequal-
ity among elderly people. Combining the results of the studies on public and private pensions,
it seems plausible that a shift from public to private leads to more income inequality among
the elderly.
Comparable effects of shifts in the public/private-mix of pensions have been found for poverty
among elderly people. Based on country-specific analyses over time, Oshio and Shimizutani
(2005) and Milligan (2008) concluded that a larger public share in the pension provision is
related to less poverty among elderly people. Hughes and Steward (2004) found that in-
creases in the private share are associated with an increase in the poverty rate among elderly
people.
From a methodological perspective, the empirical literature on pension reform and income
inequality can be divided into two types of studies. The first type consists of cross-sectional
studies, comparing a number of countries in a certain year (Brown and Prus, 2004; Weller,
2004; Fukawa, 2006). In these studies, the effects of pension reform cannot be analysed over
time. The second type of studies is mainly focused on developments over a longer period but,
for a single country (Schirle, 2009; Milligan, 2008, Myles, 2000; Oshio and Shimizutani,
2005). In these studies, it is quite difficult to examine whether the findings also hold for other
comparable pension reforms in other countries. Therefore, in this study the dimension time
will be incorporated into a cross-sectional analysis.
3. Data, measures and method
3.1 Public and private pension expenditure
Most comparative studies on welfare states rely on social expenditures as indicator to analyse
welfare state reforms across different countries. In order to examine changes in the pub-
lic/private-mix of pension provision, we use data from the most recent OECD Social Expendi-
ture Database (2010). This database contains social expenditure data on both public and pri-
vate pension schemes. In this database, programmes are classified as social when two condi-
tions are simultaneously satisfied (Adema and Ladaique, 2009; Adema, 2010). First, they
have to be intended to serve a social purpose, such as old-age.2 Second, they have to involve
either inter-personal redistribution or compulsory participation. Hence, purely private old-age
plans which are the result of direct market transactions by individual people are not included.3
The distinction between public and private social security is based on the institution that con-
trols the financial flows, namely public agencies or private bodies.
Our study analyses public and private social pension expenditure, both expressed as percent-
age of GDP and as millions of U.S. dollars (constant (2000) prices, ppp) per pensioner. A rele-
vant measure is the share of private social pension expenditure as percentage of total social
pension expenditure. This measure provides a good indication of shifts in the public/private-
mix. The measure for private social pension expenditure indicates the total of expenditures on
mandatory and voluntary pension schemes.4 Furthermore, the indicators include expenditures
2 According to Adema and Ladaique (2009), other policy areas with a social purpose are: survivors, incapac-
ity related benefits, health, family, active labour market policies, unemployment, housing and a category of
other social security areas.
3 Neither are alternative old-age provisions such as home ownership included. 4 The OECD Social Expenditure Database also provides the possibility to present expenditures on mandatory
and voluntary private pension separately. However, since the classification of private pension spending into
mandatory and voluntary pension schemes is not unequivocal, we mainly use the total of these two catego-
- 4 -
on incomes of people who retired at the statutory retirement age and of early retirees.5 Ex-
penditures on survivor pensions are not included in the indicators.
In a cross-national analysis at the macro-level, expenditure indicators have some limitations
(Van Vliet, 2010). First, differences in expenditure patterns may be driven by differences in
demographic trends across countries. When increases in pension expenditure fall short of in-
creases in the number of retirees, this may have negative consequences for the incomes of
elderly people and for the income inequality among the elderly. To control for the ageing of
populations, we include a control variable measuring the percentage of population aged 65
and above.6 For this measure we use data from Eurostat (2011b). Second, expenditures do
not indicate institutional differences in pension systems, such as a pay-as-you-go versus a
funded system, or a defined benefit versus a defined contribution system. Third, the variation
in the tax treatment of contributions and benefits across countries is not taken into account.
Ideally, we would use net expenditure on pensions, after tax, but international standardized
data for such an indicator are unfortunately not available for a longer period. Despite these
limitations, pension expenditures can give an indication of shifts from public to private pen-
sions.
3.2 Income inequality and poverty among the elderly
For income inequality and poverty among the elderly, the study relies on two indicators pro-
vided by Eurostat (2011a). Income inequality among the elderly is measured by the S80/S20
ratio of people aged 65 and over. This indicator is constructed by dividing the total disposable
income of the top twenty percent incomes of elderly by the total equivalised disposable in-
come of the bottom twenty percent incomes of people aged 65 and over. A higher value of
this indicator implies a higher inequality among the elderly. Although this indicator gives a
good indication of income inequality at the extremes of the distribution, it neglects shifts be-
tween other quintiles. Therefore, the Gini-coefficient and the Atkinson index may be preferred
measures of income inequality. However, data on income inequality among elderly measured
by either the Gini coefficient or the Atkinson index are not available for a reasonable number
of years.7
Poverty among the elderly is measured by the percentage of people aged 65 and over who
live below the poverty line of 60% of median equivalised (disposable) income of the total
population. This poverty line of 60% is also officially used as poverty measure by the Euro-
pean Union. A higher value of this indicator implies a higher rate of poverty among elderly.
Note that this indicator is a relative poverty line and can therefore be seen as a detailed rep-
resentation of income inequality for the lower part of the income distribution.
ries. As a robustness check, we also analysed the income effects of mandatory and voluntary pension
schemes separately, which did not alter the results (reported below). Note that the classification into pub-
lic, mandatory private and voluntary private pensions coincides with the classification into first, second and
third pillar pensions respectively.
5 Expenditures on public pensions also include spending on some other services for the elderly (see Vanden-
broucke and Vleminckx, 2011).
6 Note that people aged 65 and over is used as a proxy for the number of pensioners. Although the age of 65
is the statutory age of receiving pensions for men in most countries used in this analysis (except for Den-
mark (67 until 2002, after that 65), France (60), Ireland (66), Italy (respectively 60, 62, 64 until 2002, af-
ter that 65) and Norway (67), in reality the average age of retirement is lower than the statutory age in all
described countries. Moreover, the statutory pension age may differ for women (ISSA, 2011).
7 However, we employed a number of regressions with Gini-coefficients as robustness check. The results are
discussed in Section 4.
- 5 -
3.3 Method
To examine the relationship between pension reform and income inequality among the eld-
erly, we run a number of pooled time series cross-section regression analyses. Our estimat-
ions take the following form:
ittiitwitwit ZXQ ελµδβα +++++= ,, '' (1)
In Equation 1, Q represents the dependent variables of income inequality (S80/S20) or pov-
erty (PL 60) among the elderly. Variables describing the pension system, public pension ex-
penditures, private pension expenditures and total pension expenditures (all as a percentage
of GDP) and the private share of pension expenditures (private pension expenditures as per-
centage of total pension expenditures), are represented in X. The control variables ageing
(share of people aged 65 and over relative to total population) and GDP per capita are repre-
sented in Z. For the latter variable we use data from the OECD (2011).8 Recognising that the
variation in income inequality and poverty among the elderly may be related to unobserved
country- and year-specific effects, country (i) and year (t) dummies are modeled by µ and λ,
respectively. The error-term ε follows an AR(1)-process to correct for autocorrelation. In addi-
tion, we use panel-corrected standard errors to correct for panel-heteroskedasticity and si-
multaneous spatial correlation (Beck and Katz, 1995).
Constrained by data availability, the study covers 15 European countries – Austria, Belgium,
Denmark, Finland, France, Germany, Greece, Ireland, Italy, Luxembourg, the Netherlands,
Norway, Portugal, Sweden and the United Kingdom - for the years 1995 up till 2007. In the
dataset, a number of observations is missing. This is in particular the case for the income
inequality and poverty data and especially for Scandinavian countries. However, all countries
are included in the regression analyses. Several sensitivity tests, which are discussed below,
indicate that results do not suffer from the missing data.
4. Empirical analysis
4.1 Descriptive statistics
Table 1 illustrates the developments in pension expenditures for the included countries from
1995 up till 2007. On average, social expenditures as a percentage of GDP on both public and
private pensions have been increased. Hence, total pension expenditure as a percentage of
GDP has increased too. Furthermore, the data show an increase in the private share of total
pension expenditure, albeit to a limited extent. Private spending as a share of total pension
expenditure rose on average from 14.3 percent in 1995 to 14.9 percent in 2007.9 This indi-
cates a relative shift from public to private in the pension provision. More interestingly, there
is substantial variation in the developments of private pension expenditure as a share of total
pension expenditure across countries. In Belgium for instance, social expenditures on private
pensions increased more than expenditures on public pensions. This has resulted in a shift
from public to private in the total pension expenditure.10
In other countries, such as Denmark,
Ireland, Italy, the Netherlands, Sweden and the UK, shifts in the public/private-mix are the
result of opposing trends in public and private pension expenditure. Indeed, there is a nega-
tive correlation between yearly changes in private and public pension expenditure of -0.22
which is significant at the 1 percent level.11
8 Real GDP per capita in constant (2000) prices ppp.
9 This is an unweigted average of the countries
10 This trend fits well with the trend that is reported in Peeters et al (2003), which is based on data from
national sources. 11 This in line with the partial substitution effect that has been found for total public and total private social
expenditure (Van Vliet, 2011).
- 6 -
Table 1. Pension expenditures in European countries, 1995-2007
Public pension expenditure
as percentage of GDP
Private pension expenditure
as percentage of GDP
Total pension expenditure as
percentage of GDP
Private pension expenditure
as percentage of total pen-
sion expenditure
1995 2007 Change
95-07 1995 2007
Change
95-07
1995 2007
Change
95-07
1995 2007
Change
95-07
Austria 10.0 10.7 0.7 0.4 0.5 0.1 10.4 11.3 0.8 3.7 4.7 0.9
Belgium 7.0 7.1 0.1 1.3 2.8 1.5 8.3 9.9 1.6 15.5 28.4 12.8
Denmark 8.4 7.3 -1.1 1.8 2.2 0.3 10.2 9.5 -0.7 18.0 23.0 5.0
Finland 8.5 8.4 -0.1 0.3 0.2 -0.1 8.8 8.6 -0.2 3.4 2.2 -1.1
France 10.6 11.1 0.5 0.1 0.2 0.1 10.7 11.2 0.5 1.0 1.5 0.5
Germany 8.0 8.7 0.7 0.7 0.7 0.1 8.6 9.4 0.8 7.6 7.9 0.3
Greece 9.2 10.0 0.9 0.4 0.4 0.0 9.5 10.4 0.9 3.8 3.5 -0.3
Ireland 2.9 3.1 0.2 1.1 0.9 -0.2 3.9 4.0 0.1 26.8 22.4 -4.4
Italy 9.3 11.7 2.4 2.8 1.3 -1.5 12.2 13.1 0.9 23.4 10.1 -13.3
Luxembourg 8.2 4.8 -3.4 0.6 0.3 -0.3 8.8 5.2 -3.7 6.8 6.6 -0.2
Netherlands 5.5 5.3 -0.3 2.6 3.5 0.9 8.1 8.8 0.7 31.9 40.2 8.4
Norway 7.1 6.2 -0.8 0.6 0.6 -0.1 7.7 6.8 -0.9 8.2 8.5 0.3
Portugal 6.0 9.2 3.2 0.2 0.2 0.0 6.2 9.4 3.2 2.7 1.8 -0.8
Sweden 9.8 9.0 -0.8 1.9 2.1 0.2 11.7 11.1 -0.7 16.3 19.0 2.7
United Kingdom 5.5 5.8 0.3 4.7 4.5 -0.2 10.2 10.3 0.0 46.2 43.8 -2.5
Mean 7.7 7.9 0.2 1.3 1.4 0.1 9.0 9.3 0.2 14.3 14.9 0.6
Note: Figures for Luxembourg (1995) are based on linear extrapolation.
Source: OECD Social Expenditure Database (OECD, 2010) and own calculations.
- 7 -
Table 2 shows a general trend towards less income inequality and less poverty among the
elderly in the period 1995-2007.12 In 2007, the average income inequality among elderly
(mean 12 countries) has decreased by almost 18 percent compared to 1995. A decreasing
trend over time is also shown by the poverty rate among the elderly which has decreased by
almost 9 percent on average. There is some variation in trends between countries still. Greece
and Portugal, for example, have shown a huge decline in poverty rates among elderly over
time. However, Finland and Ireland have faced a relatively large increase in poverty among
elderly in the same period. These trends are robust with respect to the poverty lines applied
(50, 60 or 70 percent of median equivalised income). Nevertheless, different patterns of pov-
erty can be seen within countries. Germany and the Netherlands, for example, have shown a
decrease in poverty rates among elderly when using poverty line of 50 percent while both
countries have shown an increase in poverty rates in the same period when using a poverty
line of 60 and 70 percent. These observations imply that relatively more elderly live at risk of
poverty in 2007 compared to 1995, but less elderly find themselves at the absolute bottom of
the income distribution.
Table 2. Trends in social outcomes among elderly people, 1995-2007
Income inequality among the
elderly (S80/S20) Poverty among the elderly (PL 60)
1995 2007 Change
95-07 1995 2007
Change
95-07
Austria 4.0 3.2 -0.8 20.0 14.0 -6.0
Belgium 4.9 3.4 -1.5 25.0 23.0 -2.0
Denmark - 2.7 - - 17.7 -
Finland 3.0 2.9 -0.1 12.0 21.6 9.6
France 4.8 4.0 -0.8 19.0 13.1 -5.9
Germany 4.9 4.2 -0.7 15.0 16.2 1.2
Greece 7.6 4.8 -2.8 35.0 22.9 -12.1
Ireland 3.9 3.4 -0.5 19.0 28.3 9.3
Italy 4.6 4.7 0.1 18.0 21.9 3.9
Luxembourg 4.1 3.2 -0.9 12.0 7.2 -4.8
Netherlands 4.2 3.2 -1.0 8.0 9.5 1.5
Norway - 2.8 - - 14.1 -
Portugal 6.6 6.0 -0.6 38.0 25.5 -12.5
Sweden - 2.8 - - 9.9 -
United Kingdom 4.9 4.4 -0.5 32.0 27.6 -4.4
Mean (all countries) 4.8 3.7 -1.1 21.1 18.2 -2.9
Mean (12 countries) 5.2 4.3 -0.9 23.0 21.0 -2.0
Note: Mean 12 countries excluding Denmark, Norway and Sweden.
Source: Eurostat SILC-database (Eurostat, 2011a) and own calculations.
12 These results should be interpreted with caution, because there is a disruption in the time series of inequal-
ity and poverty indicators presented in Table 2. Until 2001, data were provided by the European Commu-
nity Household Panel survey (ECHP). Since 2005 all EU-15 countries provide data from the new European
Union Statistics on Income and Living Conditions (EU-SILC). During the transitional period poverty indica-
tors were provided by national sources which were harmonized ex-post as closely as possible with EU-SILC
definitions by Eurostat. Despite the fact that most EU-SILC variables are defined in the same way as the
corresponding ECHP variables, some differences arise. The transition from ECHP to EU-SILC possibly ex-
plains the large number of missing observations in this period. See for more details Eurostat (2005).
- 8 -
4.2 Regression results
The social outcomes presented above suggest that there is no evidence that an increasing
share of private pensions leads to higher income inequality and poverty among elderly. In
Belgium for instance, the country with the largest relative shift from public to private, income
inequality and poverty among the elderly decreased. In Italy, the country with the largest
relative shift from private to public, an increase in income inequality and poverty rates among
the elderly can be observed. In order to take our analysis beyond the descriptive statistics, we
continue with regression analyses on the 15 European countries over the years 1995-2007.
The results of the regression analyses are presented in Table 3A and Table 3B. The effects of
public pension expenditure as percentage of GDP on income inequality among the elderly are
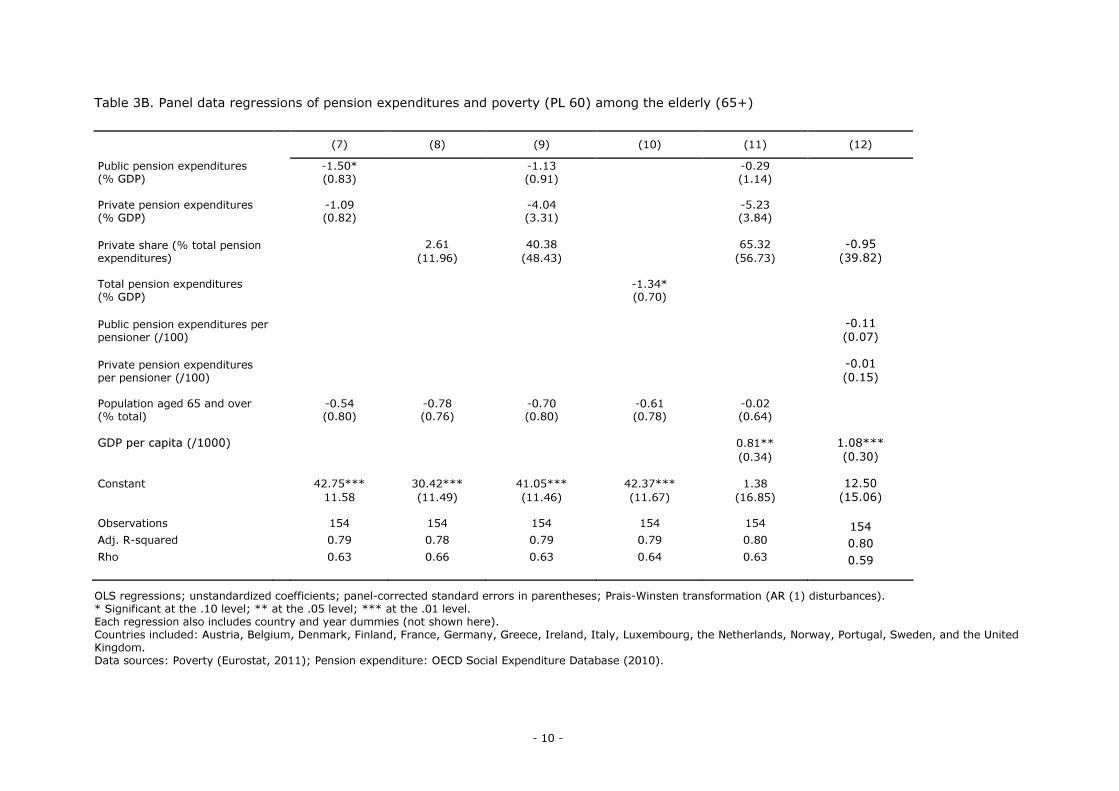
negative, but not significant. Model 7 indicates that public pension expenditure as percentage
of GDP is negatively and significantly related to poverty among the elderly. Consistent with
our expectations based on the literature, this suggests that higher social spending on public
pensions is associated with lower poverty rates among the elderly. However, the results in
Models 9 and 11 indicate that there is only weak evidence for this relationship.
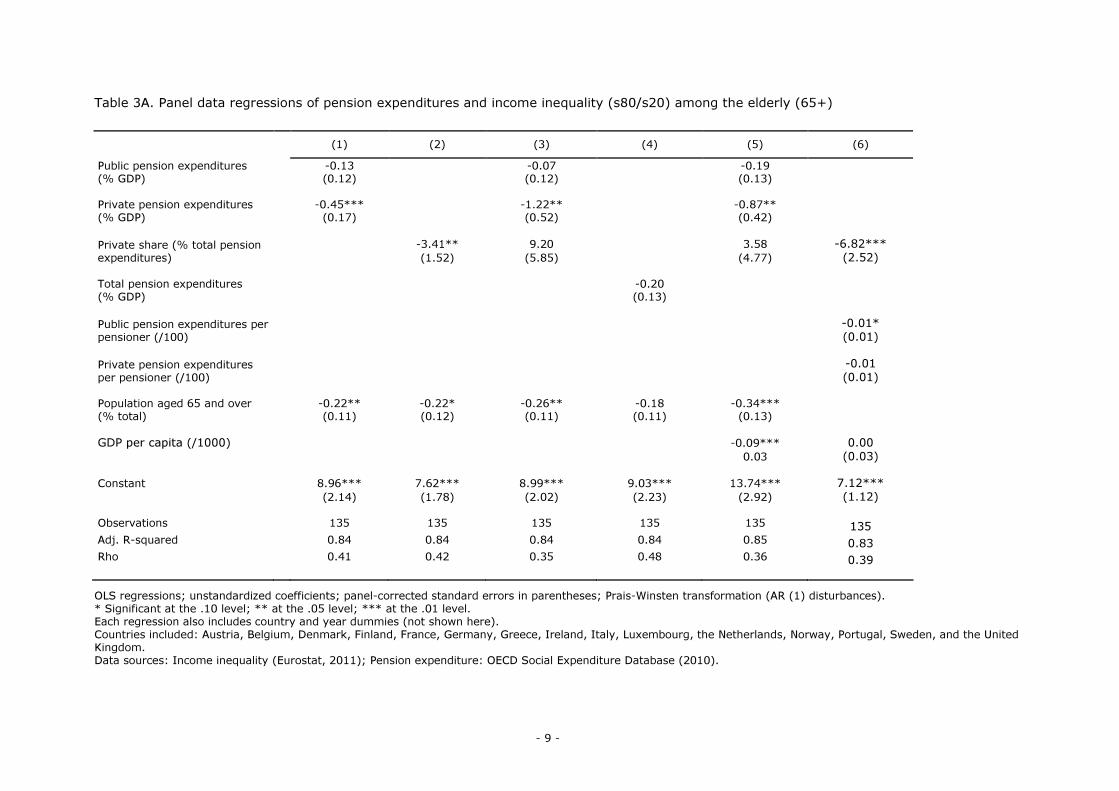
With respect to private pension expenditure as percentage of GDP, the results do not indicate
a positive effect of private pension expenditure on income inequality. In contrast, the nega-
tive coefficients suggest that private pension expenditure as a percentage of GDP is nega-
tively related to income inequality among the elderly. Model 2 indicates also a negative coeffi-
cient for private pension expenditure as percentage of total pension expenditure, but the
Models 3 and 5 show a positive effect for the private share of the pension provision, albeit not
significant. However, when pension expenditure is expressed in dollars per pensioner, to ex-
clude any denominator effect of GDP, the results indicate a negative effect for the private
pension expenditure as a share of total pension expenditure again. This implies that higher
spending on private pensions in general, and a shift from public to private pensions in particu-
lar, are not associated with higher income inequality among the elderly. Turning to poverty,
all measures for private pension provision are not significantly related to poverty among the
elderly.
The results for total pension expenditure are comparable to the case of public pension expen-
ditures. Total pension expenditure as a percentage of GDP, which consists of the sum of pub-
lic and private pension expenditure, is negatively and significantly correlated with poverty
among the elderly, while no significant correlation can be observed between total pension
expenditures and income inequality among the elderly.
As to graying populations, the results indicate that the effect of graying on income inequality
and poverty among the elderly is limited. It seems that the percentage of the population aged
65 and over is slightly negatively correlated with income inequality among the elderly, while
no correlation can be observed between this variable and poverty among the elderly. The re-
sults suggest that there is no clear linkage between GDP per capita and income inequality
among the elderly. However, GDP per capita is positively and significantly associated with
poverty rates among the elderly.
In concise, the results of the regression analyses suggest that higher private expenditure for
pensions as a percentage of GDP, per pensioner and as a share of total pension expenditure
are not associated with higher levels of income inequality among the population aged 65 and
above. Furthermore, the regression analyses indicate a poor linkage between private provi-
sions of pension schemes and poverty rates among the elderly. Taken together, these results
do not provide evidence for the expectation that shifts from public to private pension provi-
sion are associated with higher levels of income inequality.
- 9 -
Table 3A. Panel data regressions of pension expenditures and income inequality (s80/s20) among the elderly (65+)
(1) (2) (3) (4) (5) (6)
-0.13 -0.07 -0.19 Public pension expenditures
(% GDP) (0.12) (0.12) (0.13)
-0.45*** -1.22** -0.87** Private pension expenditures
(% GDP) (0.17) (0.52) (0.42)
-3.41** 9.20 3.58 -6.82*** Private share (% total pension
expenditures) (1.52) (5.85) (4.77) (2.52)
-0.20 Total pension expenditures
(% GDP) (0.13)
-0.01* Public pension expenditures per
pensioner (/100) (0.01)
-0.01 Private pension expenditures
per pensioner (/100) (0.01)
-0.22** -0.22* -0.26** -0.18 -0.34*** Population aged 65 and over
(% total) (0.11) (0.12) (0.11) (0.11) (0.13)
GDP per capita (/1000) -0.09*** 0.00
0.03 (0.03)
Constant 8.96*** 7.62*** 8.99*** 9.03*** 13.74*** 7.12***
(2.14) (1.78) (2.02) (2.23) (2.92) (1.12)
Observations 135 135 135 135 135 135 Adj. R-squared 0.84 0.84 0.84 0.84 0.85 0.83 Rho 0.41 0.42 0.35 0.48 0.36 0.39
OLS regressions; unstandardized coefficients; panel-corrected standard errors in parentheses; Prais-Winsten transformation (AR (1) disturbances).
* Significant at the .10 level; ** at the .05 level; *** at the .01 level.
Each regression also includes country and year dummies (not shown here).
Countries included: Austria, Belgium, Denmark, Finland, France, Germany, Greece, Ireland, Italy, Luxembourg, the Netherlands, Norway, Portugal, Sweden, and the United
Kingdom.
Data sources: Income inequality (Eurostat, 2011); Pension expenditure: OECD Social Expenditure Database (2010).
- 10 -
Table 3B. Panel data regressions of pension expenditures and poverty (PL 60) among the elderly (65+)
(7) (8) (9) (10) (11) (12)
-1.50* -1.13 -0.29 Public pension expenditures
(% GDP) (0.83) (0.91) (1.14)
-1.09 -4.04 -5.23 Private pension expenditures
(% GDP) (0.82) (3.31) (3.84)
2.61 40.38 65.32 -0.95 Private share (% total pension
expenditures) (11.96) (48.43) (56.73) (39.82)
-1.34* Total pension expenditures
(% GDP) (0.70)
-0.11 Public pension expenditures per
pensioner (/100) (0.07)
-0.01 Private pension expenditures
per pensioner (/100) (0.15)
-0.54 -0.78 -0.70 -0.61 -0.02 Population aged 65 and over
(% total) (0.80) (0.76) (0.80) (0.78) (0.64)
GDP per capita (/1000) 0.81** 1.08***
(0.34) (0.30)
Constant 42.75*** 30.42*** 41.05*** 42.37*** 1.38 12.50
11.58 (11.49) (11.46) (11.67) (16.85) (15.06)
Observations 154 154 154 154 154 154 Adj. R-squared 0.79 0.78 0.79 0.79 0.80 0.80 Rho 0.63 0.66 0.63 0.64 0.63 0.59
OLS regressions; unstandardized coefficients; panel-corrected standard errors in parentheses; Prais-Winsten transformation (AR (1) disturbances).
* Significant at the .10 level; ** at the .05 level; *** at the .01 level.
Each regression also includes country and year dummies (not shown here).
Countries included: Austria, Belgium, Denmark, Finland, France, Germany, Greece, Ireland, Italy, Luxembourg, the Netherlands, Norway, Portugal, Sweden, and the United
Kingdom.
Data sources: Poverty (Eurostat, 2011); Pension expenditure: OECD Social Expenditure Database (2010).

- 11 -
4.3 Sensitivity analyses
Since the results are not in line with our expectations based on both theoretical and empirical
literature on pension reform and income inequality, we perform a variety of robustness
checks. First, we examine the dependence of the results on different specifications of the em-
pirical model. Estimations without correction for autocorrelation or panel-corrected standard
errors do not alter the result that shifts towards more private pensions are not correlated with
higher income inequality or poverty levels among the elderly. With respect to the most impor-
tant independent variable, the share of private pension expenditure as percentage of total
pension expenditure, it should be noted that the variation within countries over time is rather
small. In combination with country fixed-effects, this reduces in itself the chance to find any
significant effects for this variable. Therefore, we ran the analyses also without country fixed-
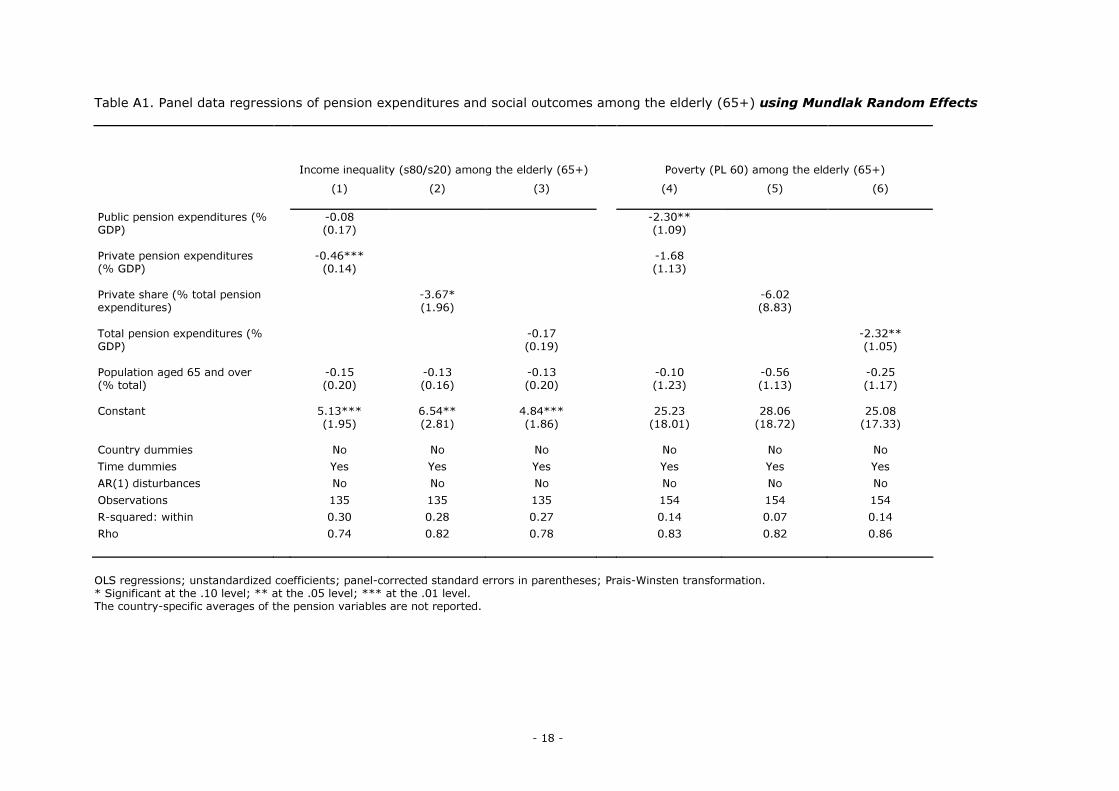
effects, which did not alter the results. In addition, we applied the Mundlak random effects
specification13 (Mundlak, 1978) to correct for the small variation over time in the independent
variable, showing that our results are robust (shown in Table A1 of the Annex). Other specifi-
cations that we applied, such as first differences, log-transformations, lagged variables or the
exclusion of year fixed-effects did not change the results. Neither do the results change if an
independent variable as graying is excluded (Table A2) or if a measure for a country’s wealth
such as GDP per capita is included (Table A3).
To further probe the robustness of our results, we take into account that our analyses are
based on unbalanced panels owing to a number of missing observations. This is especially the
case for Scandinavian countries with regard to the inequality and poverty indicators. This
could lead to biased results, since Denmark, Finland, Norway and Sweden have below aver-
age poverty and inequality levels. Therefore, we also ran regressions in which the number of
observations is extended. Table A4 shows the regression results where both the dependent
and the independent variables are linearly inter- and extrapolated. In Table A5 only the de-
pendent variables are linearly inter- and extrapolated. Since extrapolation is associated with
more uncertainty than interpolation, we also show the regression results for only interpolated
dependent variables in Table A6. Tables A7 and A8 show the regression results of interpolated
data for dependent variables using more sophisticated techniques such as cubic- and cubic
spline interpolation respectively.14 All tables show that our results are not biased by the miss-
ing observations. This is also confirmed by the results of regression analyses in which the
group of Scandinavian countries is omitted (Table A9). These results are in line with the find-
ings of Gustafsson and Johansson (1999), who found that the group of Scandinavian countries
do not influence the results of regression analyses on income inequality and social expendi-
ture very strongly. Moreover, the results are neither affected by excluding the countries one
by one in the regression analyses (not reported). We also tested to what extent the results
are driven by the countries with the largest shifts in the public/private-mix, namely Belgium,
Italy and the Netherlands. Regressions without these three countries yielded similar results.
Finally, we examine the sensitivity of the results for the use of alternative indicators and data
sources. With regard to poverty, the results of estimation of poverty lines among the elderly
of 50 and 70 percent are comparable with the results of the poverty line of 60 percent (Table
A10). Subsequently, Table A11 presents our main empirical specification for four different
indicators for income inequality among the elderly based on data from the OECD (2008).15
13 The empirical specification takes the form:
ittiitwiwitwit ZXXQ ελµδφβα ++++++= ,,, ''' . Interpretation of the
model is similar to equation (1) except that X is the country-specific average of pension expenditure vari-
ables over time and ),0(~ 2σµ Ni.
14 We use several inter- and extrapolation techniques such as linear inter- and extrapolation, cubic interpola-
tion and cubic spline interpolation. For applications of linear interpolation, see for example L’horty and
Rault (2003), Clarke et al. (2008), Stern (2005) and Toroj (2008). An example of cubic spline interpolation
in economics, which is based on polynomial instead of linear methods, can be found in Nanda and Ross
(2008).
15 The main advantage of these OECD data is the availability of more sophisticated income inequality indica-
tors. However, the most important disadvantage of these data is that at most 6 data points per country are
- 12 -
Our results with respect to the linkage between the share of private pension expenditure and
income inequality among the elderly appear to be robust for Gini coefficients before and after
taxes and transfers, the standard coefficient of variation and the mean log deviation. Addi-
tionally, the replication of the results presented in Table 3 with Gini coefficients16 and poverty
lines17 among the elderly from the Luxembourg Income Study (LIS, 2011) confirm our empiri-
cal results. As to the independent variable, the measures for private pension expenditure can
be disaggregated into mandatory and voluntary private pension expenditure. The results of
the regression analyses with the disaggregated measure do not differ from the results with
the aggregated measures (Table A12). In summary, the combined evidence of these robust-
ness checks suggest that our results are robust with respect to different specifications, vari-
ables and data sources.
5. Discussion
A number of tentative explanations is conceivable for our main finding that shifts towards
relatively more private pensions are not related to higher levels of income inequality among
the elderly. The level of supplementary pension benefits is often strongly related to the in-
come level during working life. A more private pension provision therefore leads to a higher
supplementary pension for higher incomes than for lower incomes. But it could be possible
that even though the absolute increase in private pension benefits is smaller for lower in-
comes than for higher incomes, the relative increase for lower incomes is much larger than for
higher incomes. This is illustrated by Myles (2002) in a study on pension reform in Canada in
the beginning of the 1990s. Burtless (2006) also states that the effects of changes in the pub-
lic/private-mix of pensions on replacement rates - the income from pensions relative to in-
come from work in the past - vary along the income distribution. A possible scenario is that
the coverage of private pensions has increased and that this is mainly the case for lower in-
come groups. This can be an explanation for the fact that we did not find a relationship be-
tween shifts in the public/private-mix of pensions and income inequality and poverty among
the elderly. Hence, further research at the macro-level could be focused on specifying the
effects of pension reform for different quintiles of the income distribution.
In addition, it should be noted that the analyses in this study do not account for determinants
of income at the individual level. On the one hand, this concerns general personal characteris-
tics which determine income such as education. On the other hand, current individual pension
benefits are determined by long-term effects such as previous wages, contributions paid and
macro-economic conditions in the past. It is hardly possible to capture this time dimension in
a macro-level analysis. Another factor that might influence pension benefits and incomes of
elderly people is the prevalence of deficiencies in contributions paid in the past (Esping-
Anderson and Myles, 2006). Future empirical research based on micro-data, in which it is
possible to control for individual characteristics, may provide more insight into the relation-
ship between pension reform and income inequality.
Finally, the use of pension expenditure data at the macro-level implies some restrictions.
Much information can be lost in classifying pension programmes into pillars (Whitehouse,
2002). Moreover, as mentioned above, shifts in pension expenditure can only give a rough
indication of changes in institutional characteristics of pension systems.
available in the waves from mid 1970s till mid 2000s. Another advantage is that these data are available
for a longer period and a larger group of countries than the Eurostat (2011a) data. Our results also hold for
this larger country group and longer period (see Table A11).
16 The Gini coefficient among the elderly is provided by Wang and Caminada (2011) who constructed this
indicator from the micro data.
17 The 40, 50 and 60 percent poverty lines among the elderly are taken from the LIS Key Data (2011).
- 13 -
6. Conclusion
In many industrialized countries, public pension systems have been reformed in order to alle-
viate the pressure on public finances resulting from ageing populations. This has often led to
shifts in the pension provision from public to private. The average magnitude of these shifts
remains limited, but in a number of countries there have been substantial changes. Since
private pensions are probably less redistributive than public pensions, these shifts could be
hypothesized to lead to more income inequality among retirees. This study contributes to the
income inequality and pension literature by empirically analyzing the income effects of shifts
in the public/private-mix of pensions in 15 European countries for the period 1995-2007, us-
ing pooled time series cross-section regression analyses. The most important finding is that
shifts in the pension provision from public to private do not (yet) seem to entail higher levels
of income inequality or poverty among people aged 65 and older. Intriguingly, this finding is
not in line with expectations in the literature on pension reform and income inequality
(Hughes and Stewart, 2004; Weller, 2004: Oshio and Shimizutani, 2005; Fukawa, 2006;
Arza, 2008; Milligan, 2008) and with literature on the redistributive effects of public and pri-
vate social security in general (Caminada and Goudswaard, 2005; Goudswaard and Cami-
nada, 2010). A tentative explanation for this finding is that more people in lower income dec-
iles have been covered by private pension plans. As a result, the increases in the pension
benefits of people with lower incomes were relatively larger than for people with higher in-
comes.
The policy implication of our findings seems to be that the pressure of the pension expendi-
tures on public finances can be alleviated without serious consequences for income inequality
or poverty among elderly people. However, this policy implication should be taken with much
caution, even though the results are robust for other data sources and a broad range of alter-
native econometric specifications. As suggested before, our results could be explained by in-
creases in the coverage of private supplementary pension schemes rather than policy re-
forms. A higher coverage of private programs also causes a shift from public to private, but
will probably have a rather different distributional impact compared to cutting public pension
benefits. In addition, empirical research at the macro-level goes along with a number of limi-
tations with respect to institutional characteristics of pension systems and individual charac-
teristics of pensioners.
Finally, it should be noted that our analysis does not include the years after 2007. This implies
that we have no prospect of the income effects of the pension reforms which are triggered by
the credit crisis at the beginning of the twenty-first century. The results of this study provide
no reason to expect that recent reforms in many European countries will lead to more income
inequality and higher poverty rates among the elderly. Future research should provide more
insight into the answer to this question.
- 14 -
References
Adema, W. (2010) ‘The Welfare State across Selected OECD Countries: How much does it
really cost and how good is it in reducing poverty?’, in: B. Reynolds, S. Healy, and M.
Collins (eds.), The Future of the Welfare State, Dublin: Social Justice Ireland: 20-50.
Adema, W. and M. Ladaique (2009) How Expensive is the Welfare State? Gross and Net Indi-
cators in the OECD Social Expenditure Database. OECD Social, Employment and Migration
Working Papers No. 92. Paris: OECD.
Arza, C. (2008), ‘Changing European welfare: The new distributional principles of pension
policy’, in: C. Arza and M. Kohli (eds.) Pension Reform in Europe: Politics, policies and out-
come, New York: Routledge: 109-131.
Barr, N., and P. Diamond (2009), ‘Reforming pensions: Principles, analytical errors, and policy
directions’, International Social Security Review 62(2): 5-29.
Beck, N., and J.N. Katz (1995), ‘What to do (and not to do) with time-series-cross-section
data’, American Political Science Review 89(3): 634-647.
Brown, R.L., and S.G. Prus (2004), ‘Social Transfers and Income Inequality in Old Age: A Mul-
tinational Perspective’ , North American Actuarial Journal 8(4): 30-36.
Burtless, G., (2006), ‘Poverty and inequality’, in: G.L. Clark, A.H. Munnel and J.M. Orszag
(eds.), The Oxford Handbook of Pensions and Retirement Income, Oxford: Oxford Univer-
sity Press: 740-758.
Caminada, K., and K. Goudswaard (2005), ‘Are Public and Private Social Expenditures Com-
plementary?’, International Advances in Economic Research 11(2): 175-189.
Caminada, C.L.J., K.P. Goudswaard and F. Koster (2011), ‘Social Income Transfers and Pov-
erty: a cross country analysis for OECD countries, International Journal of Social Welfare,
forthcoming.
Casey, B.H., and A. Yamada (2002), ‘The public-private mix of retirement income in nine
OECD countries: Some evidence from micro-data and an exploration of its Implications’,
Luxembourg Income Study Working Paper Series No. 311.
Clarke, P.M., D.G. Fiebig, and U.G. Gerdtham (2008), ‘Optimal recall length in survey design’,
Journal of Health Economics 27(5): 1275-1284.
Eurostat (2005), ‘The continuity of indicators during the transition between ECHP and EU-
SILC’, Working Paper and Studies, Brussels: Eurostat.
Eurostat (2011a), SILC-database, Brussels: Eurstat. Website:
http://epp.eurostat.ec.europa.eu/portal/page/portal/statistics/search_database
Eurostat (2011b), Population Statistics, Brussels: Eurostat. Website:
http://epp.eurostat.ec.europa.eu/portal/page/portal/population/introduction
Esping-Anderson, G., and J. Myles (2006), ‘Sustainable and equitable retirement in a life
course perspective’, in: G.L. Clark, A.H. Munnel en J.M. Orszag (eds.) The Oxford Handbook
of Pensions and Retirement Income, Oxford: Oxford University Press: 839-857.
Ferrarini, T., and K. Nelson, (2003), ‘Taxation of Social Insurance and Redistribution: A Com-
parative Analysis of Ten Welfare States’, Journal of European Social Policy 13(1): 21-33.
Fukawa, T. (2006), ‘Sustainable structure of the Japanese public pension system viewed from
a Germany-Japan comparison’, The Japanese journal of social Security Policy 6(1): 131-
143.
- 15 -
Goudswaard, K., and K. Caminada (2010), ‘The Redistributive Effect of Public and Private So-
cial Programmes: A Cross-country Empirical Analysis’, International Social Security Review
63(1): 1-19.
Gustafsson, B., and M. Johansson (1999), ‘In search of smoking guns: What makes income
inequality vary over time in different countries?’, American Sociological Review 64(4): 585-
605.
Hughes, G., and J. Stewart (2004), Reforming pensions in Europe: Evolution of pension fi-
nancing and sources of retirement income, Cheltenham: Edward Elgar.
International Social Security Administration (2010), Social Security Programs throughout the
World, ISSA, Washington.
L’horty, Y. and C. Rault (2003), ‘Why is French unemployment so high?’, Journal of Applied
Economics 6(1): 127-156
Luxembourg Income Study (2011), LIS Key Figures Database, Luxemburg. Website:
http://www.lisproject.org/key-figures/key-figures.htm
Milligan, K. (2008), ‘The evolution of elderly poverty in Canada’, Canadian public Policy
34(s1): 79-94.
Mundlak, Y. (1978), ‘On the Pooling of Time Series and Cross Section Data’, Econometrica
46(1): 69-85.
Myles, J. (2000), ‘The maturation of Canada’s retirement income system: income levels, in-
come inequality and low-income among the elderly’, Research Paper Series Statistics Can-
ada No. 147.
Myles, J., and P. Pierson (2001), ‘The comparative political economy of pension reform’, in: P.
Pierson (ed.) The new politics of the welfare state, Oxford: Oxford University Press: 305-
333.
Nanda, A., and S.L. Ross (2008), ‘The impact of property condition disclosure laws on housing
prices: Evidence from an event study using propensity scores’, Department of Economics
Working Paper Series University of Connecticut, No. 2008-39R.
Natali, D. and M. Rhodes (2008), ‘The “new politics” of pension reforms in Continental
Europe’, in: C. Arza and M. Kohli (eds.) Pension Reform in Europe: Politics, policies and
outcome, New York: Routledge: 25-46.
OECD (2008), Income Distribution and Poverty Database mid 1970s – mid 2000s, Paris:
OECD. Website:
http://www.oecd.org/document/14/0,3746,en_2649_33933_38910286_1_1_1_1,00.html
OECD (2009), Pensions at a Glance: Retirement-Income Systems in OECD countries, Paris:
OECD.
OECD (2010), Social Expenditures Database 1980-2007, Paris: OECD. Website:
http://www.oecd.org/document/9/0,3343,en_2649_34637_38141385_1_1_1_1,00.html
OECD (2011), National Accounts, Paris: OECD. Website:
http://stats.oecd.org/index.aspx?queryid=26646
Orenstein, M.A. (2011), ‘Pension privatization in crisis: Death or rebirth of a global policy
trend?’, International Social Security Review, 64(3): 65-80.
Oshio, T., and S. Shimizutani (2005), ‘The impact of public pension benefits on income and
poverty of the elderly in Japan’, The Japanese journal of social Security Policy, 4(2): 54-66.

- 16 -
Peeters, H., V. Van Gestel, G. Gieselink, J. Berghman and B. Van Buggenhout (2003) Invisible
Pensions in Belgium: On the nature, scope and distribution of second and third pillar pen-
sions. Research report SB/2003-12. Leuven: Catholic University of Leuven.
Schirle, T. (2009), ‘Income inequality among seniors in Canada: the role of women’s Labour
Market Experience’, CLSRN Working Paper no. 10.
Smeeding, T.M., and J. Williamson (2001), ‘Income maintenance in Old Age: What can be
learned from cross-national comparisons’, Luxembourg Income Study Working Paper No.
263.
Stern, D.I. (2005), ‘Reversal in the trend of global anthropogenic sulfur emissions’, Rensse-
laer Working Papers in Economics, No. 0504.
Toroj, A. (2008), ‘Estimation of weights for the Monetary Conditions Index in Poland’, De-
partment of Applied Econometrics Working Papers Warsaw School of Economics, No. 6.
Vandenbroucke, F., and K. Vleminckx (2011), ‘Disappointing poverty trends: is the social in-
vestment state to blame? An exercise in soul-searching for policy-makers’, accepted for
publication in Journal of European Social Policy (CBS Working Paper 11/01, available at
www.centreforsocialpolicy.eu).
Van Vliet, O. (2010), ‘Divergence within Convergence: Europeanisation of Social and Labour
Market Policies’, Journal of European Integration 32(3): 269-290.
Van Vliet, O. (2011), Convergence and Europeanisation: The Political Economy of Social and
Labour Market Policies, Leiden: Leiden University Press.
Wang, C., and K. Caminada (2011), ‘Disentangle income inequality and the redistributive ef-
fect of social transfers and taxes in 36 LIS countries’, Department of Economics Research
Memorandum 2011.02. Leiden: Leiden University.
Weller, C.E. (2004), ‘The future of public pensions in the OECD’, Cambridge Journal of Eco-
nomics 28(4): 489-504.
Yoo, K-Y., and A. de Serres (2004), ‘Tax treatment of private pension savings in OECD coun-
tries’, OECD Economic Studies, no.39 (2): 73-110.
- 17 -
Annex: Sensitivity analyses
Table 3 of the main text presents the results of panel data regressions of pension expendi-
tures and social outcomes among the elderly (65+). Tables A1 to A13 below present the re-
sult of several robustness checks:
Table A1. Panel data regressions of pension expenditures and social outcomes among the
elderly (65+) using Mundlak Random Effects
Table A2. Panel data regressions of pension expenditures and social outcomes among the
elderly (65+) excluding graying (population aged 65 and over, % total)
Table A3. Panel data regressions of pension expenditures and social outcomes among the
elderly (65+) including GDP per capita
Table A4. Panel data regressions of pension expenditures and social outcomes among the
elderly (65+) with linearly inter- and extrapolated dependent and independent
variables
Table A5. Panel data regressions of pension expenditures and social outcomes among the
elderly (65+) with linearly inter- and extrapolated independent variables
Table A6. Panel data regressions of pension expenditures and social outcomes among the
elderly (65+) with linearly interpolated independent variables
Table A7. Panel data regressions of pension expenditures and social outcomes among the
elderly (65+) with cubically interpolated independent variables
Table A8. Panel data regressions of pension expenditures and social outcomes among the
elderly (65+) with cubically spline interpolated independent variables
Table A9. Panel data regressions of pension expenditures and social outcomes among the
elderly (65+) excluding Scandinavian countries
Table A10. Panel data regressions of pension expenditures and different poverty lines (PL
50, PL 70) among the elderly (65+)
Table A11. Panel data regressions of pension expenditures and income inequality among
the elderly (65+) using income distribution variables of OECD (2010) instead of
Eurostat (2011)
Table A12. Panel data regressions of pension expenditures and social outcomes among the
elderly (65+) using a decomposition of private pension expenditures into man-
datory and voluntary expenditures
- 18 -
Table A1. Panel data regressions of pension expenditures and social outcomes among the elderly (65+) using Mundlak Random Effects
Income inequality (s80/s20) among the elderly (65+) Poverty (PL 60) among the elderly (65+)
(1) (2) (3) (4) (5) (6)
-0.08 -2.30** Public pension expenditures (%
GDP) (0.17) (1.09)
-0.46*** -1.68 Private pension expenditures
(% GDP) (0.14) (1.13)
-3.67* -6.02 Private share (% total pension
expenditures) (1.96) (8.83)
-0.17 -2.32** Total pension expenditures (%
GDP) (0.19) (1.05)
-0.15 -0.13 -0.13 -0.10 -0.56 -0.25 Population aged 65 and over
(% total) (0.20) (0.16) (0.20) (1.23) (1.13) (1.17)
Constant 5.13*** 6.54** 4.84*** 25.23 28.06 25.08
(1.95) (2.81) (1.86) (18.01) (18.72) (17.33)
Country dummies No No No No No No
Time dummies Yes Yes Yes Yes Yes Yes
AR(1) disturbances No No No No No No
Observations 135 135 135 154 154 154
R-squared: within 0.30 0.28 0.27 0.14 0.07 0.14
Rho 0.74 0.82 0.78 0.83 0.82 0.86
OLS regressions; unstandardized coefficients; panel-corrected standard errors in parentheses; Prais-Winsten transformation.
* Significant at the .10 level; ** at the .05 level; *** at the .01 level.
The country-specific averages of the pension variables are not reported.
- 19 -
Table A2. Panel data regressions of pension expenditures and social outcomes among the elderly (65+) excluding graying
Income inequality (s80/s20) among the elderly (65+) Poverty (PL 60) among the elderly (65+)
(1) (2) (3) (4) (5) (6)
-0.18 -1.63** Public pension expenditures (%
GDP) (0.14) (0.79)
-0.41** -1.02 Private pension expenditures
(% GDP) (0.18) (0.84)
Private share (% total pension
expenditures)
-2.99** 3.93
(1.25) (11.05)
-0.23 -1.43** Total pension expenditures (%
GDP) (0.14) (0.70)
Population aged 65 and
over (% total)
Constant 6.25*** 4.37*** 34.23*** 36.13*** 18.86*** 34.23***
(1.48) (0.11) (7.50) (8.24) (1.46) (7.50)
Country dummies Yes Yes Yes Yes Yes Yes
Time dummies Yes Yes Yes Yes Yes Yes
AR(1) disturbances Yes Yes Yes Yes Yes Yes
Observations 135 135 135 154 154 154
Adj. R-squared 0.84 0.83 0.84 0.79 0.78 0.79
Rho 0.42 0.42 0.47 0.62 0.65 0.64
OLS regressions; unstandardized coefficients; panel-corrected standard errors in parentheses; Prais-Winsten transformation.
* Significant at the .10 level; ** at the .05 level; *** at the .01 level.
- 20 -
Table A3. Panel data regressions of pension expenditures and social outcomes among the elderly (65+) including GDP per capita
Income inequality (s80/s20) among the elderly (65+) Poverty (PL 60) among the elderly (65+)
(1) (2) (3) (4) (5) (6)
-0.22* -0.94 Public pension expenditures (%
GDP) (0.12) (1.01)
-0.58*** -0.50 Private pension expenditures
(% GDP) (0.18) (0.97)
-4.39*** 7.98 Private share (% total pension
expenditures) (1.51) (14.05)
-0.28** -0.78 Total pension expenditures (%
GDP) (0.14) (0.87)
GDP per capita (/1000) -0.10*** -0.08** -0.08*** 0.71** 0.81*** 0.70**
(0.03) (0.03) (0.03) (0.36) (0.29) (0.36)
Population aged 65 and over
(% total) -0.33*** -0.32** -0.27** 0.13 0.11 0.04
(0.12) (0.13) (0.12) (0.65) (0.64) (0.67)
Constant 14.03*** 11.05*** 13.32*** 9.03 -3.42 8.98
(2.95) (2.35) (3.06) (16.89) (9.30) (16.52)
Country dummies Yes Yes Yes Yes Yes Yes
Time dummies Yes Yes Yes Yes Yes Yes
AR(1) disturbances Yes Yes Yes Yes Yes Yes
Observations 135 135 135 154 154 154
Adj. R-squared 0.85 0.84 0.85 0.79 0.79 0.79
Rho 0.36 0.34 0.46 0.64 0.65 0.65
OLS regressions; unstandardized coefficients; panel-corrected standard errors in parentheses; Prais-Winsten transformation.
* Significant at the .10 level; ** at the .05 level; *** at the .01 level.
- 21 -
Table A4. Panel data regressions of pension expenditures and social outcomes among the elderly (65+) with linearly inter- and extrapolated
dependent and independent variables
Income inequality (s80/s20) among the elderly (65+) Poverty (PL 60) among the elderly (65+)
(1) (2) (3) (4) (5) (6)
0.08 -0.06 Public pension expenditures (%
GDP) (0.07) (0.48)
-0.34*** -0.03 Private pension expenditures
(% GDP) (0.12) (0.77)
-5.31*** 1.42 Private share (% total pension
expenditures) (1.64) (12.04)
0.07 0.03 Total pension expenditures (%
GDP) (0.09) (0.55)
-0.00 0.03 0.03 1.64*** 1.58*** 1.57*** Population aged 65 and over
(% total) (0.10) (0.10) (0.09) (0.55) (0.48) (0.51)
Constant 3.77*** 4.14*** 3.16* -3.69 -3.53 -3.69
(1.46) (1.52) (1.83) (6.74) (7.54) (7.64)
Country dummies Yes Yes Yes Yes Yes Yes
Time dummies Yes Yes Yes Yes Yes Yes
AR(1) disturbances Yes Yes Yes Yes Yes Yes
Observations 195 195 195 195 195 195
Adj. R-squared 0.75 0.76 0.75 0.72 0.71 0.71
Rho 0.55 0.58 0.61 0.70 0.74 0.73
OLS regressions; unstandardized coefficients; panel-corrected standard errors in parentheses; Prais-Winsten transformation.
* Significant at the .10 level; ** at the .05 level; *** at the .01 level.

- 22 -
Table A5. Panel data regressions of pension expenditures and social outcomes among the elderly (65+) with linearly inter- and extrapolated
independent variables
Income inequality (s80/s20) among the elderly (65+) Poverty (PL 60) among the elderly (65+)
(1) (2) (3) (4) (5) (6)
0.18 -0.02 Public pension expenditures (%
GDP) (0.10 (0.58)
-0.25** 0.03 Private pension expenditures
(% GDP) (0.13 (0.72)
-5.20*** -1.70 Private share (% total pension
expenditures) (1.57) (9.47)
0.07 0.00 Total pension expenditures (%
GDP) (0.09) (0.52)
-0.01 0.04 0.05 1.68*** 1.67*** 1.66*** Population aged 65 and over
(% total) (0.12) (0.12) (.11) (0.44) (0.36) (0.43)
Constant
2.76 3.97** 2.90 -4.75 -4.82 -4.66
(2.06) (.76) (2.03) (5.85) (5.61) (5.90)
Country dummies Yes Yes Yes Yes Yes Yes
Time dummies Yes Yes Yes Yes Yes Yes
AR(1) disturbances Yes Yes Yes Yes Yes Yes
Observations 189 189 189 189 189 189
Adj. R-squared 0.76 0.76 0.75 0.72 0.71 0.71
Rho 0.60 0.60 0.61 0.71 0.72 0.71
OLS regressions; unstandardized coefficients; panel-corrected standard errors in parentheses; Prais-Winsten transformation.
* Significant at the .10 level; ** at the .05 level; *** at the .01 level.
- 23 -
Table A6. Panel data regressions of pension expenditures and social outcomes among the elderly (65+) with linearly interpolated
independent variables
Income inequality (s80/s20) among the elderly (65+) Poverty (PL 60) among the elderly (65+)
(1) (2) (3) (4) (5) (6)
-0.09 -1.38 Public pension expenditures (%
GDP) (0.11) (0.64)
-0.35*** -1.05 Private pension expenditures
(% GDP) (0.13) (0.79)
-2.90** -1.33 Private share (% total pension
expenditures) (1.44) (10.64)
-0.16 -1.22** Total pension expenditures (%
GDP) (0.11) (0.57)
-0.21** -0.21* -0.18* -0.45 -0.63 -0.50 Population aged 65 and over
(% total) (0.10) (0.11) (0.10) (0.57) (0.54) (0.56)
Constant 8.43*** 7.47*** 8.50*** 40.28*** 28.40*** 39.54***
(1.91) (1.63) (1.94) (.55) (8.35) 8.64
Country dummies Yes Yes Yes Yes Yes Yes
Time dummies Yes Yes Yes Yes Yes Yes
AR(1) disturbances Yes Yes Yes Yes Yes Yes
Observations 164 164 164 169 169 169
Adj. R-squared 0.83 0.83 0.83 0.75 0.73 0.74
Rho 0.43 0.45 0.49 0.62 0.66 0.64
OLS regressions; unstandardized coefficients; panel-corrected standard errors in parentheses; Prais-Winsten transformation.
* Significant at the .10 level; ** at the .05 level; *** at the .01 level.

- 24 -
Table A7. Panel data regressions of pension expenditures and social outcomes among the elderly (65+) with cubically interpolated
independent variables
Income inequality (s80/s20) among the elderly (65+) Poverty (PL 60) among the elderly (65+)
(1) (2) (3) (4) (5) (6)
-0.09 -1.39** Public pension expenditures (%
GDP) (0.11) (0.64)
-0.33** -1.02 Private pension expenditures
(% GDP) (0.14) (0.78)
-2.73* 1.58 Private share (% total pension
expenditures) (1.47) (10.51)
-0.15 -1.23** Total pension expenditures (%
GDP) (0.11) (0.56)
-0.20** -0.21* -0.18* -0.45 -0.64 -0.51 Population aged 65 and over
(% total) (0.10) (0.11) (0.10) (0.52) (0.50) (0.52)
Constant 8.37*** 7.43*** 8.46*** 40.41*** 28.58*** 39.73***
(1.97) (1.67) (2.00) (8.02) (7.70) (8.09)
Country dummies Yes Yes Yes Yes Yes Yes
Time dummies Yes Yes Yes Yes Yes Yes
AR(1) disturbances Yes Yes Yes Yes Yes Yes
Observations 164 164 164 168 168 168
Adj. R-squared 0.83 0.82 0.82 0.75 0.74 0.75
Rho 0.48 0.48 0.53 0.62 0.65 0.63
OLS regressions; unstandardized coefficients; panel-corrected standard errors in parentheses; Prais-Winsten transformation.
* Significant at the .10 level; ** at the .05 level; *** at the .01 level.
- 25 -
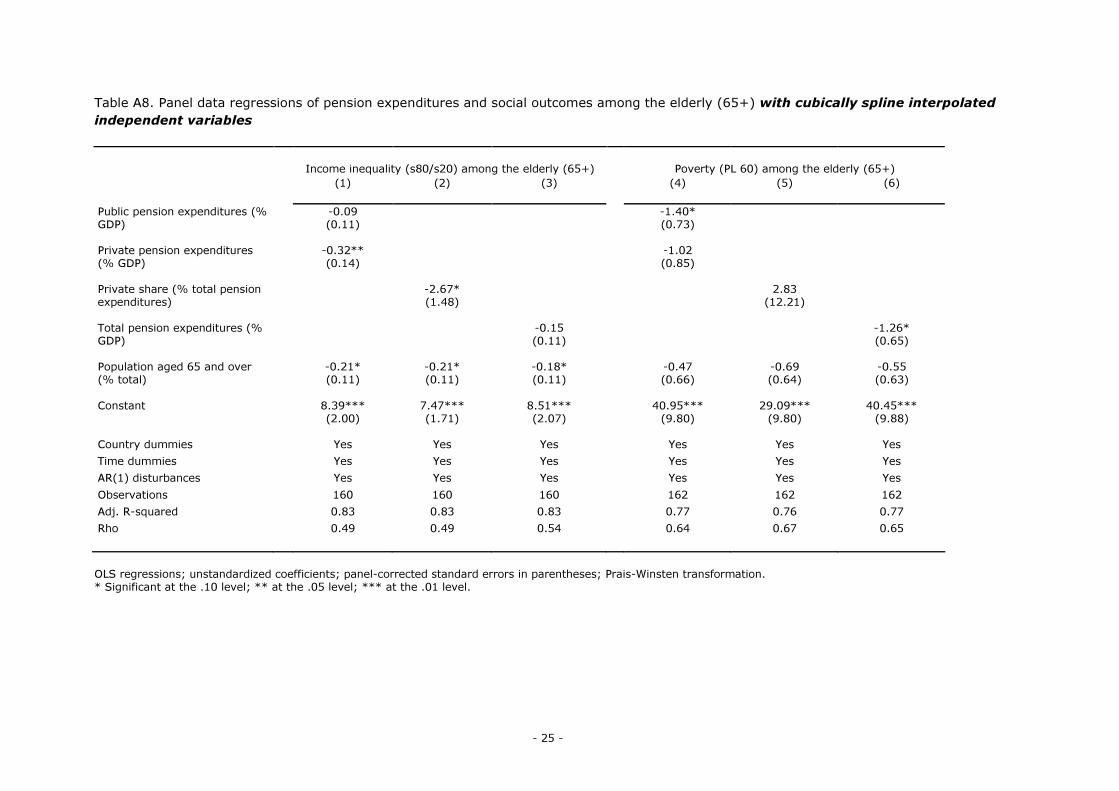
Table A8. Panel data regressions of pension expenditures and social outcomes among the elderly (65+) with cubically spline interpolated
independent variables
Income inequality (s80/s20) among the elderly (65+) Poverty (PL 60) among the elderly (65+)
(1) (2) (3) (4) (5) (6)
-0.09 -1.40* Public pension expenditures (%
GDP) (0.11) (0.73)
-0.32** -1.02 Private pension expenditures
(% GDP) (0.14) (0.85)
-2.67* 2.83 Private share (% total pension
expenditures) (1.48) (12.21)
-0.15 -1.26* Total pension expenditures (%
GDP) (0.11) (0.65)
-0.21* -0.21* -0.18* -0.47 -0.69 -0.55 Population aged 65 and over
(% total) (0.11) (0.11) (0.11) (0.66) (0.64) (0.63)
Constant 8.39*** 7.47*** 8.51*** 40.95*** 29.09*** 40.45***
(2.00) (1.71) (2.07) (9.80) (9.80) (9.88)
Country dummies Yes Yes Yes Yes Yes Yes
Time dummies Yes Yes Yes Yes Yes Yes
AR(1) disturbances Yes Yes Yes Yes Yes Yes
Observations 160 160 160 162 162 162
Adj. R-squared 0.83 0.83 0.83 0.77 0.76 0.77
Rho 0.49 0.49 0.54 0.64 0.67 0.65
OLS regressions; unstandardized coefficients; panel-corrected standard errors in parentheses; Prais-Winsten transformation.
* Significant at the .10 level; ** at the .05 level; *** at the .01 level.

- 26 -
Table A9. Panel data regressions of pension expenditures and social outcomes among the elderly (65+) excluding Scandinavian countries
Income inequality (s80/s20) among the elderly (65+) Poverty (PL 60) among the elderly (65+)
(1) (2) (3) (4) (5) (6)
0.00 -1.58* Public pension expenditures (%
GDP) (0.11) (0.84)
-0.31** -0.90 Private pension expenditures
(% GDP) (0.16) (0.81)
-2.77* 7.10 Private share (% total pension
expenditures) (1.56) (12.12)
-0.06 -1.30* Total pension expenditures (%
GDP) (0.11) (0.69)
-0.24** -0.22** -0.21* -0.94 -1.18 -1.06 Population aged 65 and over
(% total) (0.11) (0.11) (0.11) (0.75) (0.73) (0.74)
Constant 7.96*** 7.70*** 8.00** 49.86*** 36.79*** 49.06***
(1.81) (1.67) (1.85) (11.40) (10.92) (11.46)
Country dummies Yes Yes Yes Yes Yes Yes
Time dummies Yes Yes Yes Yes Yes Yes
AR(1) disturbances Yes Yes Yes Yes Yes Yes
Observations 112 112 112 123 123 123
Adj. R-squared 0.85 0.86 0.86 0.79 0.78 0.79
Rho 0.45 0.48 0.54 0.61 0.65 0.63
OLS regressions; unstandardized coefficients; panel-corrected standard errors in parentheses; Prais-Winsten transformation.
* Significant at the .10 level; ** at the .05 level; *** at the .01 level.
- 27 -
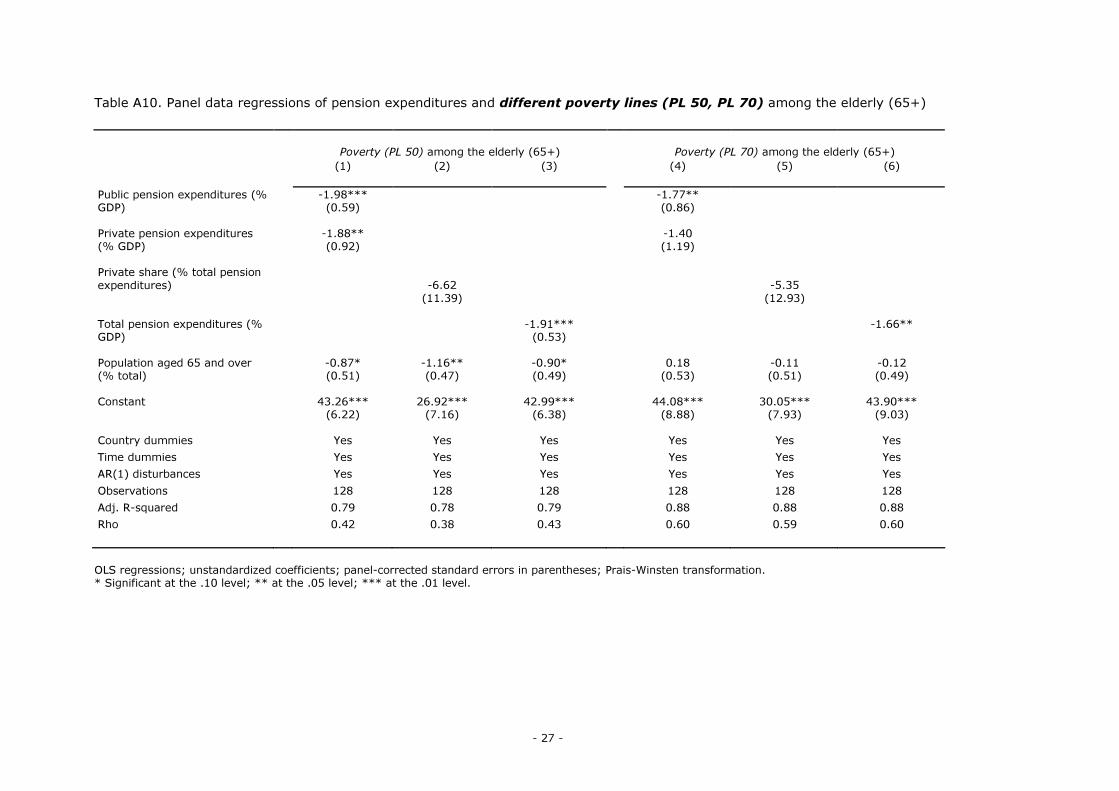
Table A10. Panel data regressions of pension expenditures and different poverty lines (PL 50, PL 70) among the elderly (65+)
Poverty (PL 50) among the elderly (65+) Poverty (PL 70) among the elderly (65+)
(1) (2) (3) (4) (5) (6)
-1.98*** -1.77** Public pension expenditures (%
GDP) (0.59) (0.86)
-1.88** -1.40 Private pension expenditures
(% GDP) (0.92) (1.19)
Private share (% total pension
expenditures)
-6.62 -5.35
(11.39) (12.93)
-1.91*** -1.66** Total pension expenditures (%
GDP) (0.53)
-0.87* -1.16** -0.90* 0.18 -0.11 -0.12 Population aged 65 and over
(% total) (0.51) (0.47) (0.49) (0.53) (0.51) (0.49)
Constant 43.26*** 26.92*** 42.99*** 44.08*** 30.05*** 43.90***
(6.22) (7.16) (6.38) (8.88) (7.93) (9.03)
Country dummies Yes Yes Yes Yes Yes Yes
Time dummies Yes Yes Yes Yes Yes Yes
AR(1) disturbances Yes Yes Yes Yes Yes Yes
Observations 128 128 128 128 128 128
Adj. R-squared 0.79 0.78 0.79 0.88 0.88 0.88
Rho 0.42 0.38 0.43 0.60 0.59 0.60
OLS regressions; unstandardized coefficients; panel-corrected standard errors in parentheses; Prais-Winsten transformation.
* Significant at the .10 level; ** at the .05 level; *** at the .01 level.
- 28 -
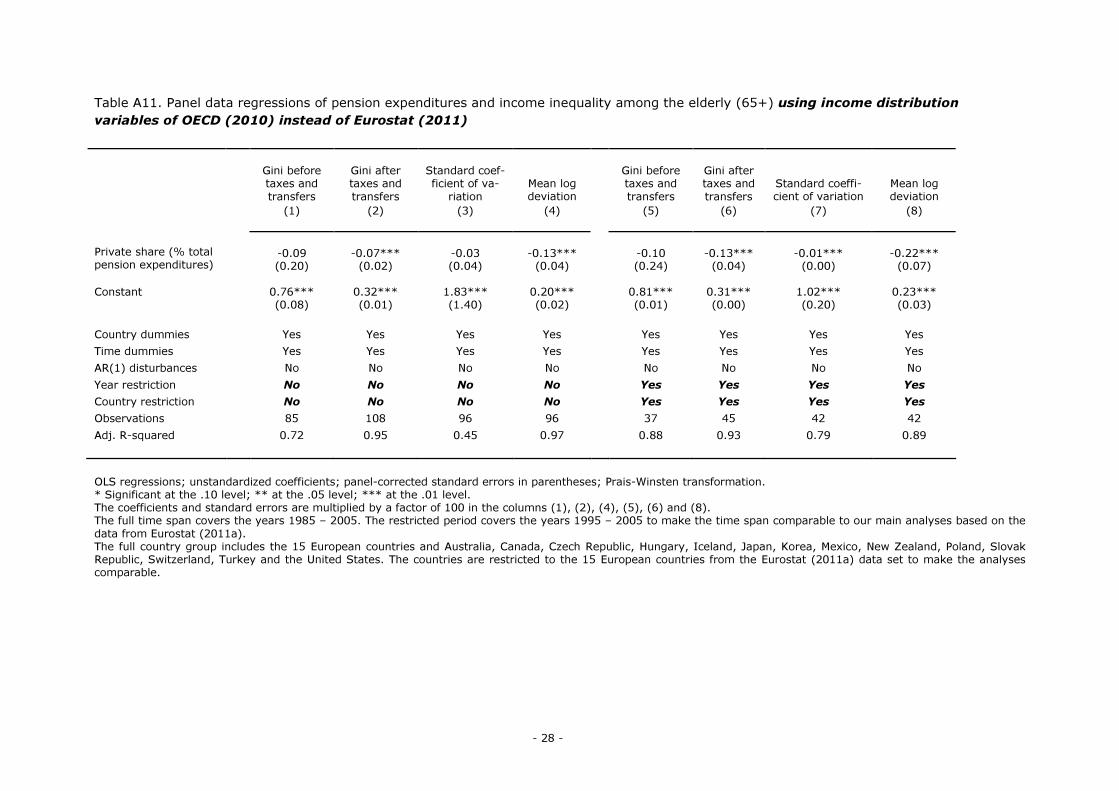
Table A11. Panel data regressions of pension expenditures and income inequality among the elderly (65+) using income distribution
variables of OECD (2010) instead of Eurostat (2011)
Gini before
taxes and
transfers
Gini after
taxes and
transfers
Standard coef-
ficient of va-
riation
Mean log
deviation
Gini before
taxes and
transfers
Gini after
taxes and
transfers
Standard coeffi-
cient of variation
Mean log
deviation
(1) (2) (3) (4) (5) (6) (7) (8)
-0.09 -0.07*** -0.03 -0.13*** -0.10 -0.13*** -0.01*** -0.22*** Private share (% total
pension expenditures) (0.20) (0.02) (0.04) (0.04) (0.24) (0.04) (0.00) (0.07)
Constant 0.76*** 0.32*** 1.83*** 0.20*** 0.81*** 0.31*** 1.02*** 0.23***
(0.08) (0.01) (1.40) (0.02) (0.01) (0.00) (0.20) (0.03)
Country dummies Yes Yes Yes Yes Yes Yes Yes Yes
Time dummies Yes Yes Yes Yes Yes Yes Yes Yes
AR(1) disturbances No No No No No No No No
Year restriction No No No No Yes Yes Yes Yes
Country restriction No No No No Yes Yes Yes Yes
Observations 85 108 96 96 37 45 42 42
Adj. R-squared 0.72 0.95 0.45 0.97 0.88 0.93 0.79 0.89
OLS regressions; unstandardized coefficients; panel-corrected standard errors in parentheses; Prais-Winsten transformation.
* Significant at the .10 level; ** at the .05 level; *** at the .01 level.
The coefficients and standard errors are multiplied by a factor of 100 in the columns (1), (2), (4), (5), (6) and (8).
The full time span covers the years 1985 – 2005. The restricted period covers the years 1995 – 2005 to make the time span comparable to our main analyses based on the
data from Eurostat (2011a).
The full country group includes the 15 European countries and Australia, Canada, Czech Republic, Hungary, Iceland, Japan, Korea, Mexico, New Zealand, Poland, Slovak
Republic, Switzerland, Turkey and the United States. The countries are restricted to the 15 European countries from the Eurostat (2011a) data set to make the analyses
comparable.

- 29 -
Table A12. Panel data regressions of pension expenditures and social outcomes among the elderly (65+) using a decomposition of private
pension expenditures into mandatory and voluntary expenditures
Income inequality (s80/s20) among the elderly
(65+) Poverty (PL 60) among the elderly (65+)
(1) (2) (3) (4) (5) (6)
-0.43* -1.66 Public pension expenditures (% GDP) (0.23) (2.08)
-0.37 -1.40 Mandatory pension expenditures
(% GDP) (0.30) (2.50)
-0.76*** -0.66 Voluntary pension expenditures
(% GDP) (0.13) (0.84)
-3.31** -7.55* 12.61 -1.83 Voluntary share (% total pension
expenditures) (1.39) (1.14) (11.95) (10.23)
1.57 1.71 Mandatory share (% total pen-
sion expenditures) (1.90) (17.89)
0.17** -0.19* 0.18** 1.65 -0.84 1.45 Population aged 65 and over (%
total) (0.08) (0.11) (0.09) (1.13) (0.75) (1.13)
Constant omitted 4.39* 1.30 10.02 30.99*** -6.74
(0.11) (1.70) (29.26) (11.25) (21.34)
Country dummies Yes Yes Yes Yes Yes Yes
Time dummies Yes Yes Yes Yes Yes Yes
AR(1) disturbances Yes Yes Yes Yes Yes Yes
Observations 49 135 49 60 154 60
Adjusted R-squared 0.67 0.84 0.67 0.82 0.78 0.82
Rho -0.02 0.41 -0.04 0.44 0.65 0.46
OLS regressions; unstandardized coefficients; panel-corrected standard errors in parentheses; Prais-Winsten transformation.
* Significant at the .10 level; ** at the .05 level; *** at the .01 level.
Research Memorandum Department of Economics Research Memoranda
- are available from Department of Economics homepage at : http://www.economie.leidenuniv.nl
- can be ordered at Leiden University, Department of Economics, P.O. Box 9520, 2300 RA Leiden, The Nether-
lands Phone ++71 527 7756; E-mail: [email protected]
2011.03 Olaf van Vliet, Jim Been, Koen Caminada and Kees Goudswaard
Pension reform and income inequality among the elderly in 15 European countries
2011.02 Chen Wang and Koen Caminada
Disentangling income inequality and the redistributive effect of social transfers and taxes in
36 LIS countries
2011.01 Anton Rommelse
Een geschiedenis van het arbeidsongeschiktheidsbeleid in Nederland
2010.03 Joop de Kort
The Right to Development or the Development of Rights
2010.02 Carolien Klein Haarhuis and Ben van Velthoven
Legal Aid and Legal Expenses Insurance, Complements or Substitutes? The Case of The
Netherlands?
2010.01 Koen Caminada, Kees Goudswaard and Ferry Koster
Social Income Transfers and Poverty Alleviation in OECD Countries.
2009.03 Megan Martin and Koen Caminada
Welfare Reform in the United States. A descriptive policy analysis.
2009.02 Koen Caminada and Kees Goudswaard
Social Expenditure and Poverty Reduction in the EU and other OECD Countries.
2009.01 Maroesjka Versantvoort
Complementariteit in arbeid- en zorgtijd.
2008.06 Koen Caminada and Kees Goudswaard
Effectiveness of poverty reduction in the EU.
2008.05 Koen, Caminada, Kees Goudswaard and Olaf van Vliet
Patterns of welfare state indicators in the EU. Is there convergence?
2008.04 Kees Goudswaard and Koen Caminada
The redistributive impact of public and private social expenditure.
2008.03 Karen M. Anderson and Michael Kaeding
Pension systems in the European Union: Variable patterns of influence in Italy, the
Netherlands and Belgium.
2008.02 Maroesjka Versantvoort
Time use during the life course in USA, Norway and the Netherlands: a HAPC-analysis.
2008.01 Maroesjka Versantvoort
Studying time use variations in 18 countries applying a life course perspective.
2007.06 Olaf van Vliet and Michael Kaeding
Globalisation, European Integration and Social Protection – Patterns of Change or Continuity?
2007.05 Ben van Velthoven
Kosten-batenanalyse van criminaliteitsbeleid. Over de methodiek in het algemeen en Neder-
landse toepassingen in het bijzonder. 2007.04 Ben van Velthoven
Rechtseconomie tussen instrumentaliteit en normativiteit.
2007.03 Guido Suurmond
Compliance to fire safety regulation. The effects of the enforcement strategy.
2007.02 Maroesjka Versantvoort
Een schets van de sociaal-economische effecten van verlof en de beleidsmatige dilemma’s die
daaruit volgen.
2007.01 Henk Nijboer
A Social Europe: Political Utopia or Efficient Economics? An assessment from a public
economic approach.
2006.04 Aldo Spanjer
European gas regulation: A change of focus.
2006.03 Joop de Kort and Rilka Dragneva
Russia’s Role in Fostering the CIS Trade Regime.
2006.02 Ben van Velthoven
Incassoproblemen in het licht van de rechtspraak.
2006.01 Jurjen Kamphorst en Ben van Velthoven
De tweede feitelijke instantie in de belastingrechtspraak.
2005.03 Koen Caminada and Kees Goudswaard
Budgetary costs of tax facilities for pension savings: an empirical analysis.
2005.02 Henk Vording en Allard Lubbers
How to limit the budgetary impact of the European Court's tax decisions?
2005.01 Guido Suurmond en Ben van Velthoven
Een beginselplicht tot handhaving: liever regels dan discretionaire vrijheid.
2004.04 Ben van Velthoven en Marijke ter Voert
Paths to Justice in the Netherlands. Looking for signs of social exclusion.
2004.03 Guido Suurmond
Brandveiligheid in de horeca. Een economische analyse van de handhaving in een represen-
tatieve gemeente.
2004.02 Kees Goudswaard, Koen Caminada en Henk Vording
Naar een transparanter loonstrookje?
2004.01 Koen Caminada and Kees Goudswaard
Are public and private social expenditures complementary?
2003.01 Joop de Kort
De mythe van de globalisering. Mondialisering, regionalisering of gewoon internationale
economie?
2002.04 Koen Caminada en Kees Goudswaard
Inkomensgevolgen van veranderingen in de arbeidsongeschiktheidsregelingen en het nabe-
staandenpensioen.
2002.03 Kees Goudswaard
Houdbare solidariteit.
2002.02 Ben van Velthoven
Civiele en administratieve rechtspleging in Nederland 1951-2000; deel 1: tijdreeksanalyse.
2002.01 Ben van Velthoven
Civiele en administratieve rechtspleging in Nederland 1951-2000; deel 2: tijdreeksdata.
2001.03 Koen Caminada and Kees Goudswaard
International Trends in Income Inequality and Social Policy.
2001.02 Peter Cornelisse and Kees Goudswaard
On the Convergence of Social Protection Systems in the European Union.
2001.01 Ben van Velthoven
De rechtsbijstandsubsidie onderzocht. En hoe nu verder?
2000.01
Koen Caminada
Pensioenopbouw via de derde pijler. Ontwikkeling, omvang en verdeling van premies lijfren-
ten volgens de Inkomensstatistiek.
1999.03
Koen Caminada and Kees Goudswaard
Social Policy and Income Distribution. An Empirical Analysis for the Netherlands.

1999.02
Koen Caminada
Aftrekpost eigen woning: wie profiteert in welke mate? Ontwikkeling, omvang en verdeling
van de hypotheekrenteaftrek en de bijtelling fiscale huurwaarde.
1999.01 Ben van Velthoven and Peter van Wijck
Legal cost insurance under risk-neutrality.
1998.02 Koen Caminada and Kees Goudswaard
Inkomensherverdeling door sociale zekerheid: de verdeling van uitkeringen en premieheffing
in 1990 en 1995.
1998.01 Cees van Beers
Biased Estimates of Economic Integration Effects in the Trade Flow Equation.
1997.04 Koen Caminada and Kees Goudswaard
Distributional effects of a flat tax: an empirical analysis for the Netherlands.
1997.03 Ernst Verwaal
Compliance costs of intra-community business transactions. Magnitude, determinants and
policy implications.
1997.02 Julia Lane, Jules Theeuwes and David Stevens
High and low earnings jobs: the fortunes of employers and workers.
1997.01 Marcel Kerkhofs and Maarten Lindeboom
Age related health dynamics and changes in labour and market status.
1996.07 Henk Vording
The case for equivalent taxation of social security benefits in Europe.
1996.06 Kees Goudswaard and Henk Vording
Is harmonisation of income transfer policies in the European Union feasible?
1996.05 Cees van Beers and Jeroen C.J.M. van den Bergh
The impact of environmental policy on trade flows: an empirical analysis.
1996.04 P.W. van Wijck en B.C.J. van Velthoven
Een economische analyse van het Amerikaanse en het continentale systeem van proceskos-
tentoerekening.
1996.03 Arjan Heyma
Retirement and choice constraints: a dynamic programming approach.
1996.02 B.C.J. van Velthoven en P.W. van Wijck
De economie van civiele geschillen; rechtsbijstand versus no cure no pay.
1996.01 Jan Kees Winters
Unemployment in many-to-one matching models.
1995.05 Maarten Lindeboom and Marcel Kerkhofs
Time patterns of work and sickness absence. Unobserved effects in a multi-state duration
model.
1995.04 Koen Caminada en Kees Goudswaard
De endogene ontwikkeling van de belastingdruk: een macro-analyse voor de periode 1960-
1994.
1995.03 Henk Vording and Kees Goudswaard
Legal indexation of social security benefits: an international comparison of systems and their
effects.
1995.02 Cees van Beers and Guido Biessen
Trade potential and structure of foreign trade: the case of Hungary and Poland.
1995.01 Isolde Woittiez and Jules Theeuwes
Well-being and labour market status.
1994.10 K.P. Goudswaard
Naar een beheersing van de Antilliaanse overheidsschuld.
1994.09 Kees P. Goudswaard, Philip R. de Jong and Victor Halberstadt
The realpolitik of social assistance: The Dutch experience in international comparison.
1994.08 Ben van Velthoven
De economie van misdaad en straf, een overzicht en evaluatie van de literatuur.
1994.07 Jules Theeuwes en Ben van Velthoven
De ontwikkeling van de criminaliteit in Nederland, 1950-1990: een economische analyse.
1994.06 Gerard J. van den Berg and Maarten Lindeboom
Durations in panel data subject to attrition: a note on estimation in the case of a stock
sample.
1994.05 Marcel Kerkhofs and Maarten Lindeboom
Subjective health measures and state dependent reporting errors.
1994.04 Gerard J. van den Berg and Maarten Lindeboom
Attrition in panel data and the estimation of dynamic labor market models.
1994.03 Wim Groot
Wage and productivity effects of enterprise-related training.
1994.02 Wim Groot
Type specific returns to enterprise-related training.
1994.01 Marcel Kerkhofs
A Quadratic model of home production decisions.