patterns of pcdds and pcdfs in human milk and food and their characterization by artificial neural...
TRANSCRIPT
Chemosphere 54 (2004) 1375–1382
www.elsevier.com/locate/chemosphere
Patterns of PCDDs and PCDFs in human milk and foodand their characterization by artificial neural networks
M. Nadal a, G. Espinosa b, M. Schuhmacher a,b, J.L. Domingo a,*
a Laboratory of Toxicology and Environmental Health, School of Medicine, ‘‘Rovira i Virgili’’ University,
San Lorenzo 21, 43201 Reus, Spainb Environmental Engineering Laboratory, Department of Chemical Engineering, ‘‘Rovira i Virgili’’ University,
Campus Sescelades, 43007 Tarragona, Spain
Received 2 April 2003; received in revised form 11 September 2003; accepted 10 October 2003
Abstract
Artificial neural network (ANN) has been recently introduced as a tool for data analysis. In this study, Kohonen’s
self-organizing maps (SOMs), a special type of neural network, were applied to a set of PCDD/PCDF concentrations
found in 54 human milk and 83 food samples, which were collected in a number of countries all over the world. Data
were obtained from the scientific literature. The purpose of the study was to find a potential relationship between
PCDD/PCDF congener profiles in human milk and the dietary habits of the different countries in which samples were
collected. The comparison of the SOM component planes for human milk and foodstuffs indicates that those countries
with a greater fish consumption show also higher PCDD/PCDF concentrations in human milk. SOMs enable both the
visualization of sample units and the visualization of congener distribution.
� 2003 Elsevier Ltd. All rights reserved.
Keywords: Kohonen’s self-organizing maps (SOMs); Polychlorinated dibenzo-p-dioxins (PCDDs); Polychlorinated dibenzofurans
(PCDFs); Human milk samples; Food samples
1. Introduction
Polychlorinated dibenzo-p-dioxins (PCDDs) and
dibenzofurans (PCDFs) are a lipophilic group of or-
ganic compounds that are widely spread in the envi-
ronment. They are potent toxicant with a potential to
produce a broad spectrum of adverse effects (Schecter,
1994). Moreover, in recent years it has been established
that 2,3,7,8-tetrachlorodibenzo-p-dioxin (TeCDD) is a
powerful endocrine disruptor and a known human car-
cinogen (Becher and Flesch-Janys, 1998; McGregor
et al., 1998; Kogevinas, 2001). PCDD/Fs occur in water,
air, soil, sediments and biota in areas influenced by
*Corresponding author. Tel.: +34-977-759380; fax: +34-977-
759322.
E-mail address: [email protected] (J.L. Domingo).
0045-6535/$ - see front matter � 2003 Elsevier Ltd. All rights reserv
doi:10.1016/j.chemosphere.2003.10.045
human activities, as well as in remote areas. Because of
the persistence of these environmental pollutants, they
are found in every level of the food chain. Consequently,
PCDD/Fs are introduced in human body mainly
through the diet (Liem et al., 2000). These contaminants
may be retained in the human body being accumulated
in fat tissues, or may be metabolised to more polar
compounds and excreted or retained in the body (WHO/
ICPS, 1989). Half-lives for the different congeners have
been identified, being observed that they depend on
variables such as the dose (Johansson and Hanberg,
2000). Human milk contains many lipid soluble com-
pounds that are also present in mother’s adipose tissue
(WHO/ICPS, 1987). It can be assumed that the levels of
PCDD/Fs in human milk are representative for those in
plasma, serum lipids and adipose tissue (van Leeuwen
and Malisch, 2002). Therefore, levels of these contami-
nants in human milk would reflect the body burden and
ed.
1376 M. Nadal et al. / Chemosphere 54 (2004) 1375–1382
can thus be used as an indicator for the overall exposure
of the general population (Grandjean et al., 1995).
PCDD/PCDF levels in human milk are mainly
influenced by personal data, such as age of the mother,
number of breast-fed children, and length of nursing
period (F€uurst, 2000). While PCDD/F levels decrease
with the number of breast-fed babies and the length of
breast-feeding, they increase slightly with the age of the
mother. However, the zone of residence, either urban or
rural, seems to have scarce influence on the body bur-
den. This is not surprising taking into account that the
main route of human PCDD/F exposure is through the
diet, making up more than 95% of total daily intake
(Travis and Hattemer-Frey, 1987; Sweetman et al.,
2000). Consequently, consumption of contaminated
food may lead to elevated PCDD/F levels in human
milk.
The typical congener pattern distribution of PCDD/
Fs for human milk is characterized, on a concentration
basis, by the most chlorinated PCDD congeners such as
1,2,3,6,7,8-HxCDD and OCDD, while for PCDF a de-
crease in concentrations is observed from the less (i.e.,
2,3,4,7,8-PeCDF) to the most (i.e., 1,2,3,4,7,8,9-HpCDF
and OCDF) chlorinated congeners (Sonawane, 1995).
However, the levels and patterns of PCDD/Fs in human
milk vary substantially depending on the specific coun-
tries and geographical areas.
In recent years, a number of studies have focused on
comparing I-TEQ concentrations in human milk from
different countries. However, very few studies have paid
attention to the variation of PCDD/F profiles in human
milk. Although human milk congener composition may
vary widely due to differential partitioning or metabo-
lism of compounds, residue profiles in human milk may
also differ locally because of the wide variation of die-
tary habits (Schuhmacher et al., 1999a,b; Yufit et al.,
2002).
Analysis of PCDD/Fs can create large data sets,
which are difficult to interpret. Chemometric methods
can notably improve the analyst’s ability to describe and
model residues in samples. Advances in the theory and
technology of artificial neural networks (ANN) provide
the potential for new approaches to the problem of
classification and diagnosis. ANN consists of several
‘‘layers’’ of neurons, an input layer, hidden layers, and
output layers. Input layers take the input and distribute
it to the hidden layers. These hidden layers do all the
necessary computation and output the results to the
output layer (Kohonen, 1993). ANN advantages can
be categorized into three areas: (i) pattern recognition
and classification, (ii) prediction and control, and (iii)
information management. These strengths can be ap-
plied in many ways. ANN is the technology of choice
when dealing with situations where other technologies
are not applicable because of incomplete data, low fault
tolerance, or high noise. ANN are robust enough to deal
with the high error margins that are found in data-rich,
but understanding-poor circumstances. The purpose
of the present chemometric study was to provide an
understanding of the differences in the distribution of
PCDD/F congener profiles in human milk. The main
objectives of the study were the following: (1) to classify
human milk samples from a number of countries
through ANN application to PCDD/F concentrations,
and to study the variations in congener profiles, (2) to
classify foodstuffs by ANN application and to compare
their congener profiles, and (3) to compare maps ob-
tained after ANN application in milk and food samples
for a number of countries in order to find potential
relationships between dietary habits and PCDD/F con-
gener profiles in human milk.
2. Experimental
2.1. Artificial neural networks (ANN)
ANN consists of computing units called artificial
neurons. Kohonen’s self-organizing maps (SOMs) are
the special type of neural networks, which provides
projection of multidimensional data into one-, two-, or
in special cases into a three-dimensional space. In the
present study, SOM analysis was used to determine if
potential changes in PCDD/F profiles in human milk
samples at different geographical locations could be
identified, and if they could be explained by different
dietary habits and/or different congener distribution in
foodstuffs. This method was developed by Kohonen
(1982), and it is one of the most popular neural network
models. The SOM algorithm is based on unsupervised
competitive learning, which means that the training is
entirely data-driven and that the neurones of the map
compete among them (Vesanto, 2000). SOM is a process
based on data mining, which could be considered as the
successor of the classic statistical tools. Statistics and
data mining pursue the same aim: to build compact and
understandable models by incorporating the relation-
ships between the description of a situation and the re-
sults concerning this description. The main difference is
that data mining techniques build the models automati-
cally while classical statistical tools need to be wielded
by a trained statistician with a clear (or possibly pre-
conceived) idea about what is looking for. Another po-
sitive aspect is that SOM owns a clustering procedure,
which has been shown to be equivalent or superior to
some other cluster analysis methods (Waller et al., 1998).
The SOM algorithm resembles other Vector Quan-
tization (VQ) algorithms such as k-means (Bishop,
1995). SOM is a multidimensional scaling method,
which projects data from input space to a lower-
dimensional output space. In the SOM, similar input
vectors are projected onto nearby neurons on the map.
M. Nadal et al. / Chemosphere 54 (2004) 1375–1382 1377
The SOM algorithm relies on two main aspects: the in-
put data set, and the output data set or map.
Input data. Each data item is associated with an n-length vector of elements. These elements are commonly
called features, attributes, or properties of the data.
Output map. The map is an array of nodes (also
called neurons). This array is usually two-dimensional,
but it could be of higher order. It is often laid out in a
rectangular or hexagonal lattice. Each node has an
associated reference vector of the same size as each input
feature vector. The input vectors are compared to these
references.
The simplest description of the SOM algorithm is the
following:
1. The reference vectors contained in all the nodes are
randomly initialized.
2. An input vector is randomly selected from the input
set.
3. Using some metric (Euclidean, usually), the input
vector is compared to each node’s reference vector.
4. The node whose reference vector is the best match
(minimum difference) is chosen as the winning node
for that particular input vector.
5. The neighboring nodes (nodes which are topograph-
ically close in the array) to the winning node are then
updated by a certain amount. This update simply
changes the properties of the reference vectors by a
small amount, in order to they are more similar to
the input vector.
6. Go to step 1.
To interpret the results, SOM visualization process
starts with the map itself. SOM is composed by several
nodes (whose total number depends on data amount),
and each of those has a specific weight. SOM can be
divided into so many c-planes (component planes) as
data variables, representing the variable contribution to
each node in the map. SOM can be thought as a cake
consisting of component layers. Each component plane
is a horizontal layer of this cake, while each reference
vector is a vertical slice. The c-planes are visualized by
taking from each reference vector the value of the
component, and depicting this as a gray height on the
grid. By viewing several component planes at the same
time, it is also easy to see simple correlations between
components (Vesanto, 1997).
2.2. Data analysis
Data from fifty-four human milk samples corre-
sponding to more than 1000 individually collected
samples (pooled or mean values from different locations)
from various countries were studied. The congener
profile from each sample was taken from the second
WHO study or from the literature (Iida et al., 1999;
Schecter and P€aapke, 2000; Calheiros et al., 2002; Focantet al., 2002; F€uurst and P€aapke, 2002; Liao et al., 2002;
M€uuller et al., 2002a; Yufit et al., 2002). Forty-three
samples were from Europe (Eastern and Western), seven
pooled samples belonged to USA and Canada, and four
were from Asia. When the level of a congener was re-
ported to be below the limit of detection, a value of zero
was assumed for that level (ND¼ 0). A SOM for the 17
2,3,7,8-substituted PCDD/F congeners was run.
On the other hand, to understand the results of the
distributions of PCDD/F congener profiles of human
milk for the different countries, a SOM for different food
samples from around the world was again applied. We
ran the model with 83 samples (pooled of different sub-
samples or mean values), obtained from a number of
studies of different countries, including data from our
laboratory (Startin et al., 1990; Schecter et al., 1995;
Malisch, 1998; Domingo et al., 1999; Lee et al., 2000;
Tsutsumi et al., 2001; Coutinho et al., 2002; Eljarrat
et al., 2002; Kiviranta et al., 2002; M€uuller et al., 2002b;Traag et al., 2002; Wu et al., 2002). Food samples in-
cluded: beef (hamburger, steak, liver, hind-shank), pork
(bacon, sausage, hot dogs, steak, liver, hamburger, jam,
salami), chicken (liver, breast, sausage), lamb (steak),
white fish (angler fish, hake), seafood (mussel, prawn,
shrimp), tinned fish (mussel, tuna, sardine), blue fish
(sardine, tuna, salmon, trout, mackerel), milk (whole,
semi-skimmed), dairy products (cheese, yoghurt, cream),
vegetables (lettuce, chard, spinach, chickpeas, cauli-
flower, green beans), pulses (lentils, beans), cereals (spa-
ghettis, rice, bread), fruits (orange, banana, apple), fats
and oils (margarine, sunflower, olive, corn), and eggs.
One of the problems in the visualization of a com-
plex data set is that usually they contain so much
information that it is impossible to show it all in a
single figure. The numbers of visual dimensions deter-
mine how many different kinds of information can be
efficiently inserted into one visualization. Typical visual
dimension includes position, size, and color (or texture)
(Vesanto, 2000).
3. Results and discussion
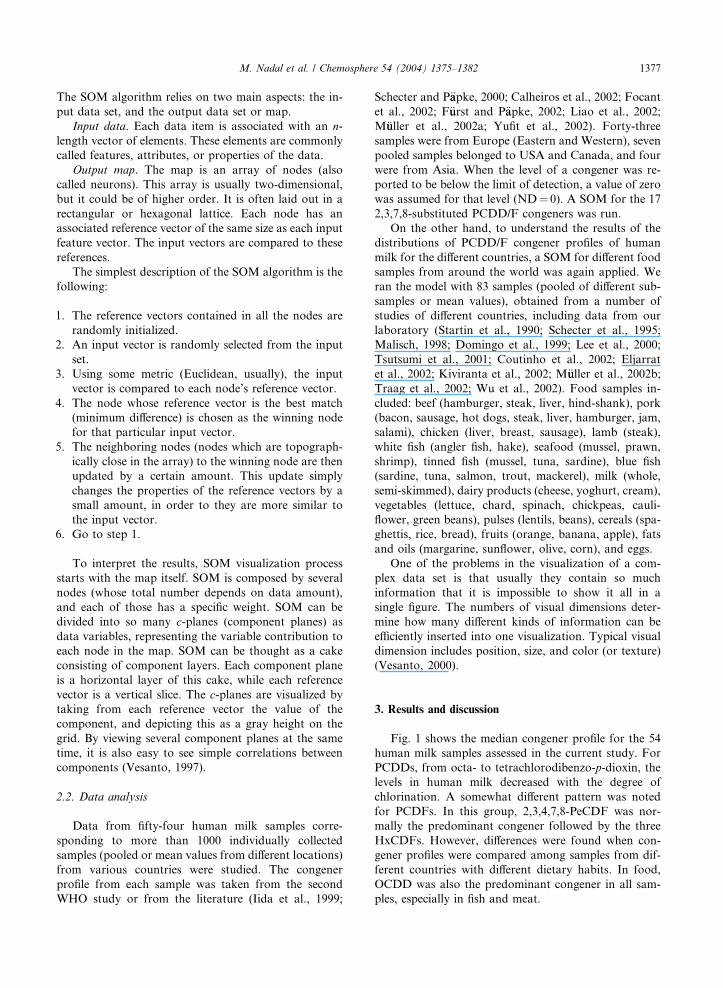
Fig. 1 shows the median congener profile for the 54
human milk samples assessed in the current study. For
PCDDs, from octa- to tetrachlorodibenzo-p-dioxin, the
levels in human milk decreased with the degree of
chlorination. A somewhat different pattern was noted
for PCDFs. In this group, 2,3,4,7,8-PeCDF was nor-
mally the predominant congener followed by the three
HxCDFs. However, differences were found when con-
gener profiles were compared among samples from dif-
ferent countries with different dietary habits. In food,
OCDD was also the predominant congener in all sam-
ples, especially in fish and meat.
0
50
100
150
200
250
2,3,
7,8-
TCDD
1,
2,3,
7,8-
PeCD
D
1,2,
3,4,
7,8-
HxCD
D
1,2,
3,6,
7,8-
HxCD
D
1,2,
3,4,
7,8-
HxCD
D
1,2,
3,4,
6,7,
8-Hp
CDD
OC
DD2,
3,7,
8-TC
DF
1,2,
3,7,
8-Pe
CDF
2,
3,4,
7,8-
PeCD
F
1,2,
3,4,
7,8-
HxCD
F
1,2,
3,6,
7,8-
HxCD
F
1,2,
3,7,
8,9-
HxCD
F
2,3,
4,6,
7,8-
HxCD
F
1,2,
3,4,
6,7,
8-Hp
CDF
1,2,
3,4,
7,8,
9-Hp
CDF
OC
DF
pg/g
fat
Fig. 1. Profile of PCDD/F congeners corresponding to human milk samples from a number of countries.
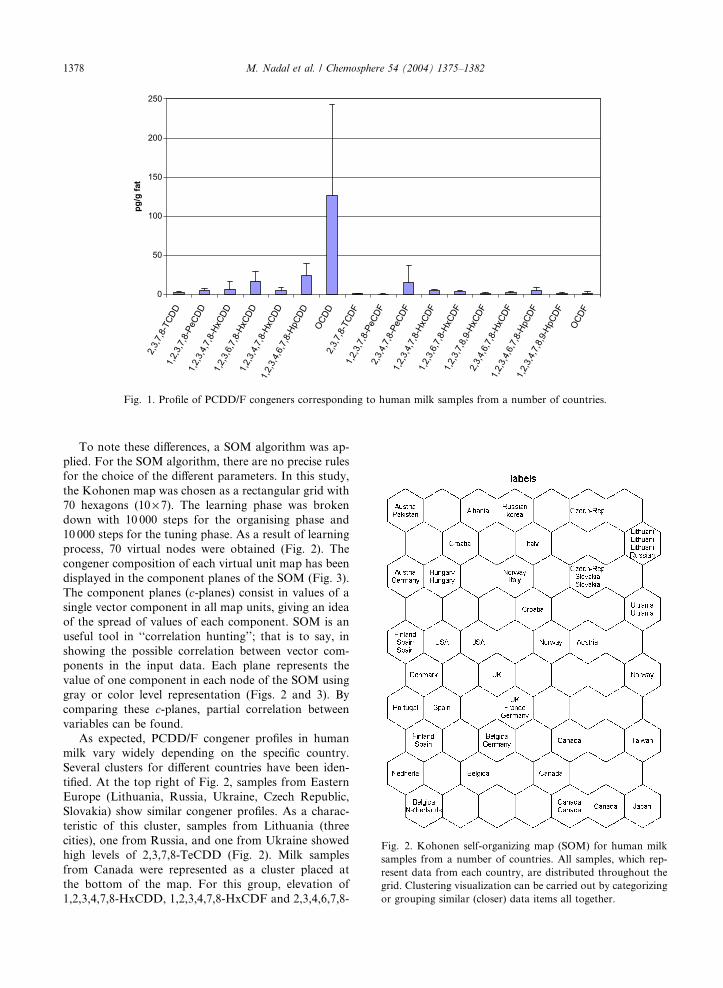
Fig. 2. Kohonen self-organizing map (SOM) for human milk
samples from a number of countries. All samples, which rep-
resent data from each country, are distributed throughout the
grid. Clustering visualization can be carried out by categorizing
or grouping similar (closer) data items all together.
1378 M. Nadal et al. / Chemosphere 54 (2004) 1375–1382
To note these differences, a SOM algorithm was ap-
plied. For the SOM algorithm, there are no precise rules
for the choice of the different parameters. In this study,
the Kohonen map was chosen as a rectangular grid with
70 hexagons (10 · 7). The learning phase was broken
down with 10 000 steps for the organising phase and
10 000 steps for the tuning phase. As a result of learning
process, 70 virtual nodes were obtained (Fig. 2). The
congener composition of each virtual unit map has been
displayed in the component planes of the SOM (Fig. 3).
The component planes (c-planes) consist in values of a
single vector component in all map units, giving an idea
of the spread of values of each component. SOM is an
useful tool in ‘‘correlation hunting’’; that is to say, in
showing the possible correlation between vector com-
ponents in the input data. Each plane represents the
value of one component in each node of the SOM using
gray or color level representation (Figs. 2 and 3). By
comparing these c-planes, partial correlation between
variables can be found.
As expected, PCDD/F congener profiles in human
milk vary widely depending on the specific country.
Several clusters for different countries have been iden-
tified. At the top right of Fig. 2, samples from Eastern
Europe (Lithuania, Russia, Ukraine, Czech Republic,
Slovakia) show similar congener profiles. As a charac-
teristic of this cluster, samples from Lithuania (three
cities), one from Russia, and one from Ukraine showed
high levels of 2,3,7,8-TeCDD (Fig. 2). Milk samples
from Canada were represented as a cluster placed at
the bottom of the map. For this group, elevation of
1,2,3,4,7,8-HxCDD, 1,2,3,4,7,8-HxCDF and 2,3,4,6,7,8-

Fig. 3. Component planes of the SOM results for human milk samples from a number of countries (abbreviations: TD: 2,3,7,8-
TeCDD, PED: 1,2,3,7,8-PeCDD, HXDA: 1,2,3,4,7,8-HXCDD, HXDB: 1,2,3,6,7,8-HxCDD, HXDC: 1,2,3,7,8,9-HxCDD, HPD:
1,2,3,4,6,7,8-HpCDD, OD: OCDD, TF: 2,3,7,8-TeCDF, PEFA: 1,2,3,7,8-PeCDF, PEFB: 2,3,4,7,8-PeCDF, HXFA: 1,2,3,4,7,8-
HxCDF, HXFB: 1,2,3,6,7,8-HxCDF, HXFC: 1,2,3,7,8,9-HxCDF, HXFD: 2,3,4,6,7,8-HxCDF, HPFA: 1,2,3,4,6,7,8-HpCDF, HPFB:
1,2,3,4,7,8,9-HpCDF, OF: OCDF). In the 17 component planes, each hexagon represents one map unit. Colors indicate the value of
the component in that unit (higher the value is, lighter the color is). Hexagons in the same place on different component planes
correspond to the same map unit, and show the levels of the components in the weight vector of that unit.
M. Nadal et al. / Chemosphere 54 (2004) 1375–1382 1379
HxCDF congeners can be observed. Close to this group
is Japan, which shows an elevated concentration of the
congeners 1,2,3,7,8-PeCDD, 1,2,3,6,7,8-HxCDD, 2,3,7,
8-TeCDF, 1,2,3,7,8-PeCDF, 1,2,3,4,7,8-HxCDF, 1,2,3,
6,7,8-HxCDF, and 1,2,3,4,7,8,9-HpCDF. On the other
hand, Taiwan shows also elevated concentrations
of 2,3,7,8-TeCDF, 1,2,3,7,8-PeCDF and 1,2,3,7,8,9-
HxCDF (Fig. 3). Human milk samples from Western
Europe (Belgium, The Netherlands, Germany, France,
UK, Spain, Portugal, Finland, Denmark) show a similar
behavior characterized by an increase of PCDDs (1,2,
3,7,8-PeCDD, 1,2,3,6,7,8-HxCDD, 1,2,3,7,8,9-HxCDD,
1,2,3,4,6,7,8-HpCDD and OCDD). USA samples are
also clustered into this group.
Dietary habits depend on each specific region and
country. For example, it is known that Japan has a
greater fish and seafood consumption than other coun-
tries, while Nordic and Mediterranean countries are also
important fish-consumers. In turn, countries from Cen-
tre Europe are important consumers of meat (pork,
chicken). Canadians consume amounts of fish and milk
similar to Swedish, while in contrast, Korea and Taiwan
are low milk consumers. In Korea, the highest contri-
bution to total PCDD/F exposure was due to rice, squid,
milk, beef, egg and mackerel (Lee et al., 2000).
In order to establish a correlation between variations
in PCDD/F congener profiles in human milk with the
dietary habits of a number of countries, a SOM for
different foodstuffs was applied (Figs. 4 and 5). A great
variation of the PCDD/F congener profile depending on
the specific food group (fish, meat, milk products) was
noted. However, is it important to remark that for
samples of a same group (i.e., fish), different profiles can
be observed depending on their respective origins.
SOM algorithm was applied for the congeners pro-
files of the 83 samples assessed. As a result of the
learning process, a map with 70 virtual nodes was ob-
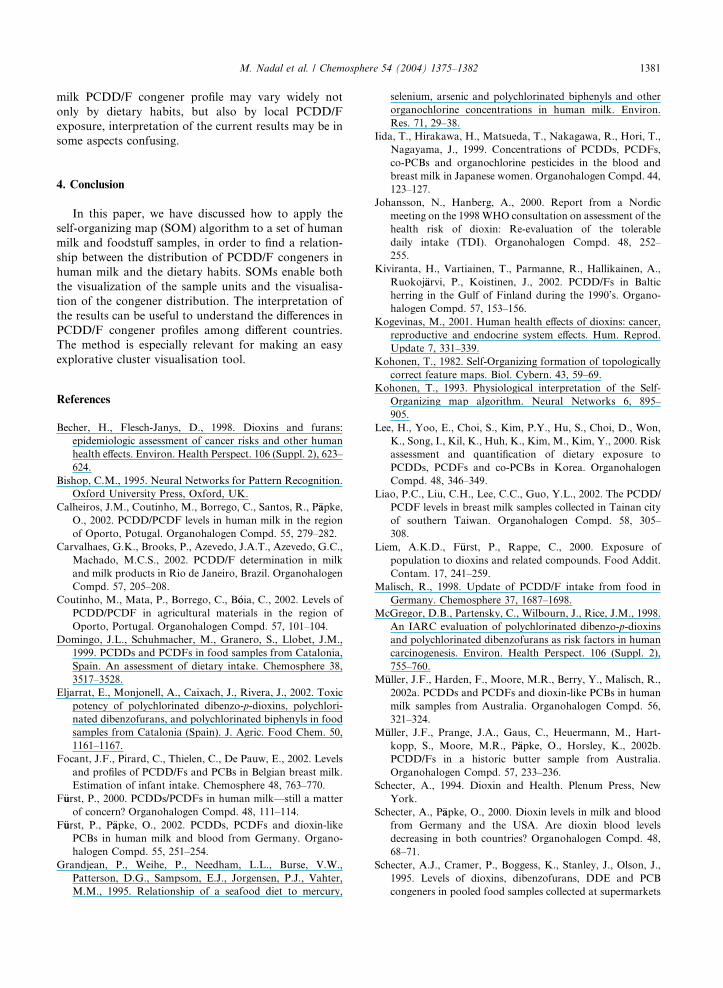
tained (Fig. 4). The congener composition of each vir-
tual unit map has been displayed in the component
planes of the SOM (Fig. 5). It can be observed that food
samples are clustered in three groups (Fig. 4). The first
group is placed at the upper part of the map and inte-
grates vegetables, fruits, cereals and beans, being char-
acterized for low levels of all PCDD/F congeners. Fish
and seafood are placed at the bottom left side of the map
and samples are characterized by an elevation of the
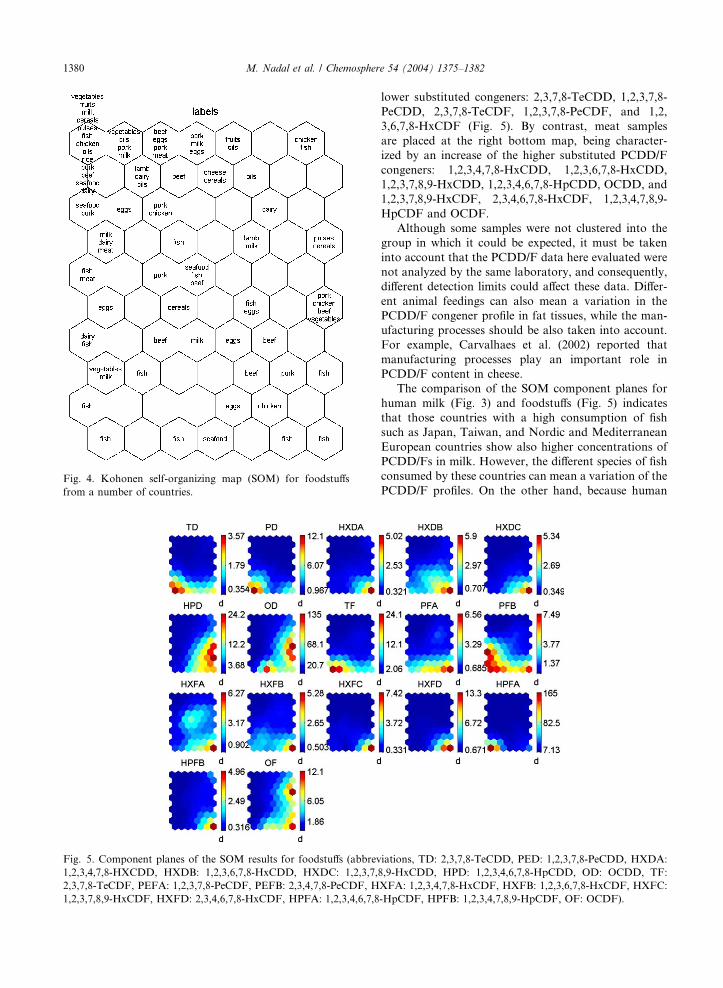
Fig. 4. Kohonen self-organizing map (SOM) for foodstuffs
from a number of countries.
Fig. 5. Component planes of the SOM results for foodstuffs (abbrev
1,2,3,4,7,8-HXCDD, HXDB: 1,2,3,6,7,8-HxCDD, HXDC: 1,2,3,7,
2,3,7,8-TeCDF, PEFA: 1,2,3,7,8-PeCDF, PEFB: 2,3,4,7,8-PeCDF, H
1,2,3,7,8,9-HxCDF, HXFD: 2,3,4,6,7,8-HxCDF, HPFA: 1,2,3,4,6,7,8
1380 M. Nadal et al. / Chemosphere 54 (2004) 1375–1382
lower substituted congeners: 2,3,7,8-TeCDD, 1,2,3,7,8-
PeCDD, 2,3,7,8-TeCDF, 1,2,3,7,8-PeCDF, and 1,2,
3,6,7,8-HxCDF (Fig. 5). By contrast, meat samples
are placed at the right bottom map, being character-
ized by an increase of the higher substituted PCDD/F
congeners: 1,2,3,4,7,8-HxCDD, 1,2,3,6,7,8-HxCDD,
1,2,3,7,8,9-HxCDD, 1,2,3,4,6,7,8-HpCDD, OCDD, and
1,2,3,7,8,9-HxCDF, 2,3,4,6,7,8-HxCDF, 1,2,3,4,7,8,9-
HpCDF and OCDF.
Although some samples were not clustered into the
group in which it could be expected, it must be taken
into account that the PCDD/F data here evaluated were
not analyzed by the same laboratory, and consequently,
different detection limits could affect these data. Differ-
ent animal feedings can also mean a variation in the
PCDD/F congener profile in fat tissues, while the man-
ufacturing processes should be also taken into account.
For example, Carvalhaes et al. (2002) reported that
manufacturing processes play an important role in
PCDD/F content in cheese.
The comparison of the SOM component planes for
human milk (Fig. 3) and foodstuffs (Fig. 5) indicates
that those countries with a high consumption of fish
such as Japan, Taiwan, and Nordic and Mediterranean
European countries show also higher concentrations of
PCDD/Fs in milk. However, the different species of fish
consumed by these countries can mean a variation of the
PCDD/F profiles. On the other hand, because human
iations, TD: 2,3,7,8-TeCDD, PED: 1,2,3,7,8-PeCDD, HXDA:
8,9-HxCDD, HPD: 1,2,3,4,6,7,8-HpCDD, OD: OCDD, TF:
XFA: 1,2,3,4,7,8-HxCDF, HXFB: 1,2,3,6,7,8-HxCDF, HXFC:
-HpCDF, HPFB: 1,2,3,4,7,8,9-HpCDF, OF: OCDF).
M. Nadal et al. / Chemosphere 54 (2004) 1375–1382 1381
milk PCDD/F congener profile may vary widely not
only by dietary habits, but also by local PCDD/F
exposure, interpretation of the current results may be in
some aspects confusing.
4. Conclusion
In this paper, we have discussed how to apply the
self-organizing map (SOM) algorithm to a set of human
milk and foodstuff samples, in order to find a relation-
ship between the distribution of PCDD/F congeners in
human milk and the dietary habits. SOMs enable both
the visualization of the sample units and the visualisa-
tion of the congener distribution. The interpretation of
the results can be useful to understand the differences in
PCDD/F congener profiles among different countries.
The method is especially relevant for making an easy
explorative cluster visualisation tool.
References
Becher, H., Flesch-Janys, D., 1998. Dioxins and furans:
epidemiologic assessment of cancer risks and other human
health effects. Environ. Health Perspect. 106 (Suppl. 2), 623–
624.
Bishop, C.M., 1995. Neural Networks for Pattern Recognition.
Oxford University Press, Oxford, UK.
Calheiros, J.M., Coutinho, M., Borrego, C., Santos, R., P€aapke,
O., 2002. PCDD/PCDF levels in human milk in the region
of Oporto, Potugal. Organohalogen Compd. 55, 279–282.
Carvalhaes, G.K., Brooks, P., Azevedo, J.A.T., Azevedo, G.C.,
Machado, M.C.S., 2002. PCDD/F determination in milk
and milk products in Rio de Janeiro, Brazil. Organohalogen
Compd. 57, 205–208.
Coutinho, M., Mata, P., Borrego, C., B�ooia, C., 2002. Levels of
PCDD/PCDF in agricultural materials in the region of
Oporto, Portugal. Organohalogen Compd. 57, 101–104.
Domingo, J.L., Schuhmacher, M., Granero, S., Llobet, J.M.,
1999. PCDDs and PCDFs in food samples from Catalonia,
Spain. An assessment of dietary intake. Chemosphere 38,
3517–3528.
Eljarrat, E., Monjonell, A., Caixach, J., Rivera, J., 2002. Toxic
potency of polychlorinated dibenzo-p-dioxins, polychlori-
nated dibenzofurans, and polychlorinated biphenyls in food
samples from Catalonia (Spain). J. Agric. Food Chem. 50,
1161–1167.
Focant, J.F., Pirard, C., Thielen, C., De Pauw, E., 2002. Levels
and profiles of PCDD/Fs and PCBs in Belgian breast milk.
Estimation of infant intake. Chemosphere 48, 763–770.
F€uurst, P., 2000. PCDDs/PCDFs in human milk––still a matter
of concern? Organohalogen Compd. 48, 111–114.
F€uurst, P., P€aapke, O., 2002. PCDDs, PCDFs and dioxin-like
PCBs in human milk and blood from Germany. Organo-
halogen Compd. 55, 251–254.
Grandjean, P., Weihe, P., Needham, L.L., Burse, V.W.,
Patterson, D.G., Sampsom, E.J., Jorgensen, P.J., Vahter,
M.M., 1995. Relationship of a seafood diet to mercury,
selenium, arsenic and polychlorinated biphenyls and other
organochlorine concentrations in human milk. Environ.
Res. 71, 29–38.
Iida, T., Hirakawa, H., Matsueda, T., Nakagawa, R., Hori, T.,
Nagayama, J., 1999. Concentrations of PCDDs, PCDFs,
co-PCBs and organochlorine pesticides in the blood and
breast milk in Japanese women. Organohalogen Compd. 44,
123–127.
Johansson, N., Hanberg, A., 2000. Report from a Nordic
meeting on the 1998WHO consultation on assessment of the
health risk of dioxin: Re-evaluation of the tolerable
daily intake (TDI). Organohalogen Compd. 48, 252–
255.
Kiviranta, H., Vartiainen, T., Parmanne, R., Hallikainen, A.,
Ruokoj€aarvi, P., Koistinen, J., 2002. PCDD/Fs in Baltic
herring in the Gulf of Finland during the 1990’s. Organo-
halogen Compd. 57, 153–156.
Kogevinas, M., 2001. Human health effects of dioxins: cancer,
reproductive and endocrine system effects. Hum. Reprod.
Update 7, 331–339.
Kohonen, T., 1982. Self-Organizing formation of topologically
correct feature maps. Biol. Cybern. 43, 59–69.
Kohonen, T., 1993. Physiological interpretation of the Self-
Organizing map algorithm. Neural Networks 6, 895–
905.
Lee, H., Yoo, E., Choi, S., Kim, P.Y., Hu, S., Choi, D., Won,
K., Song, I., Kil, K., Huh, K., Kim, M., Kim, Y., 2000. Risk
assessment and quantification of dietary exposure to
PCDDs, PCDFs and co-PCBs in Korea. Organohalogen
Compd. 48, 346–349.
Liao, P.C., Liu, C.H., Lee, C.C., Guo, Y.L., 2002. The PCDD/
PCDF levels in breast milk samples collected in Tainan city
of southern Taiwan. Organohalogen Compd. 58, 305–
308.
Liem, A.K.D., F€uurst, P., Rappe, C., 2000. Exposure of
population to dioxins and related compounds. Food Addit.
Contam. 17, 241–259.
Malisch, R., 1998. Update of PCDD/F intake from food in
Germany. Chemosphere 37, 1687–1698.
McGregor, D.B., Partensky, C., Wilbourn, J., Rice, J.M., 1998.
An IARC evaluation of polychlorinated dibenzo-p-dioxins
and polychlorinated dibenzofurans as risk factors in human
carcinogenesis. Environ. Health Perspect. 106 (Suppl. 2),
755–760.
M€uuller, J.F., Harden, F., Moore, M.R., Berry, Y., Malisch, R.,
2002a. PCDDs and PCDFs and dioxin-like PCBs in human
milk samples from Australia. Organohalogen Compd. 56,
321–324.
M€uuller, J.F., Prange, J.A., Gaus, C., Heuermann, M., Hart-
kopp, S., Moore, M.R., P€aapke, O., Horsley, K., 2002b.
PCDD/Fs in a historic butter sample from Australia.
Organohalogen Compd. 57, 233–236.
Schecter, A., 1994. Dioxin and Health. Plenum Press, New
York.
Schecter, A., P€aapke, O., 2000. Dioxin levels in milk and blood
from Germany and the USA. Are dioxin blood levels
decreasing in both countries? Organohalogen Compd. 48,
68–71.
Schecter, A.J., Cramer, P., Boggess, K., Stanley, J., Olson, J.,
1995. Levels of dioxins, dibenzofurans, DDE and PCB
congeners in pooled food samples collected at supermarkets
1382 M. Nadal et al. / Chemosphere 54 (2004) 1375–1382
across the United States. Organohalogen Compd. 26, 125–
128.
Schuhmacher, M., Domingo, J.L., Llobet, J.M., Kiviranta, H.,
Vartiainen, T., 1999a. PCDD/F concentrations in milk of
non-occupationally exposed women living in Southern
Catalonia, Spain. Chemosphere 38, 995–1004.
Schuhmacher, M., Domingo, J.L., Llobet, J.M., Lindstr€oom, G.,Wingfors, H., 1999b. Dioxin and dibenzofurans concentra-
tions in adipose tissue of a general population from
Tarragona, Spain. Chemosphere 38, 2475–2487.
Sonawane, B.R., 1995. Chemical contaminants in human milk:
an overview. Environ. Health Perspect. 103, 197–205.
Startin, J.R., Rose, M., Wright, C., Parker, I., Gilbert, J., 1990.
Surveillance of British foods for PCDDs and PCDFs.
Chemosphere 20, 793–798.
Sweetman, A.J., Alcock, R.E., Wittsiepe, J., Jones, K.C., 2000.
Human exposure to PCDD/Fs in the UK: the development
of a modelling approach to give historical and future
perspectives. Environ. Int. 26, 37–47.
Traag, W., Portier, L., Bovee, T., Van der Weg, G., Onstenk,
C., Elghouch, N., Coors, R., Kraats, C., Hoogenboom, R.,
2002. Residues of dioxins and coplanar PCBs in eggs of free
range chickens. Organohalogen Compd. 57, 245–248.
Travis, C., Hattemer-Frey, H., 1987. Human exposure to
2,3,7,8-TCDD. Chemosphere 26, 2331–2342.
Tsutsumi, T., Yangi, T., Nakamura, M., Kono, Y., Uchibe, H.,
Iida, T., Hori, T., Nakagawa, R., Tobiishi, K., Matsuda, R.,
Sasaki, K., Toyoda, M., 2001. Update of daily intake of
PCDDs, PCDFs, and dioxin-like PCBs from food in Japan.
Chemosphere 45, 1129–1137.
van Leeuwen, F., Malisch, R., 2002. Results of the third round
of the WHO-coordinated exposure study on the levels of
PCBs, PCDDs and PCDFs in human milk. Organohalogen
Compd. 56, 311–316.
Vesanto, J., 1997. Data mining techniques based on the Self-
Organizing Map. Thesis for the degree of Master of Science
in Engineering, Helsinki University of Technology.
Vesanto, J., 2000. Using SOM in data mining. Thesis, Helsinki
University of Technology.
Waller, N.G., Kaiser, H.A., Illian, J.B., Manry, M., 1998.
Cluster analysis with Kohonen neural networks. Psycho-
metrika 63, 5–22.
WHO/ICPS, 1987. Principles of Toxicokinetic Studies. Envi-
ronmental Health Criteria 57. World Health Organization,
Geneva, Switzerland.
WHO/ICPS, 1989. Polychlorinated Dibenzo-p-Dioxins and
Dibenzofurans. Environmental Health Criteria 88. World
Health Organization, Geneva, Switzerland.
Wu, Y., Li, J., Zhao, Y., Chen, Z., Li, W., Chen, J., 2002.
Dietary intake of polychlorinated dibenzo-p-dioxins
(PCDDs) and dibenzofurans (PCDFs) in population from
China. Organohalogen Compd. 57, 221–223.
Yufit, S., van Leeuwen, R., Malisch, R., Samsonov, D., 2002.
Contamination of human milk with PCDDs, PCDFs, and
PCBs in two Russian cities. Organohalogen Compd. 56,
333–356.