may 2018 - milk producers organisation
TRANSCRIPT
May 2018
2
Executive summary
Milk production during April 2018 is estimated at 243-million litres, 6,0% more than in April 2017. During the first four months of 2018 1 019-million litres of milk was produced, up 5,8% on the previous year. During 2017, imports exceeded exports by 8 million litres. During the first quarter of 2018 import volumes exceeded export volumes by 15-million litres. The SA dairy market changed in 2017 from a nett export status to a nett import status industry and it seems that this trend will continue for 2018. The retail prices of fresh milk per litre for milk packaged in 2-litre plastic containers are indicated in Figure 8. The graph indicates that this price has levelled off since July 2017 with the farm to retail price spread reducing sharply. The milk:feed price ratio for April 2018 is 1.7, slightly better than in March 2018 which favours milk production. However, the reduction in the producer price for milk that occurred at the beginning of May will reduce this ratio to roughly 1.5 which will start to influence milk production negatively. World dairy product prices are a mix of abundant stock in the skimmed milk powder market in the EU while butter is reaching record prices due to low stock levels. Full cream milk powder and cheddar prices are showing mild upward momentum. Chinese demand has recovered, but the level of skimmed milk powder stock levels will prevent dairy product prices to build up proper momentum to move to higher sustainable levels with the exception of butter.
The growth of 5,8% in milk flow in SA during the first four months of 2018 and the net import status of dairy products during the same period in SA will depress producer prices for the next four months. Low grain prices will continue to support milk production throughout the winter. These drivers will reduce the probability and level of any winter producer price increases. The current drivers in the SA milk market are so dominant that it will limit the SA milk price to benefit from increases in the international market if the latter occurs. The SA dairy market will start to look at the summer rain predictions and the way in which that season starts will be the next driver influencing SA milk producer price.
Info blocks Frequently milk producers and other role players ask about the meaning and implications of specific market trends on the total dairy market balance and how it will change future markets. While the Milk Producers’ Organisation cannot and will not try to predict the future in any detail, the possible general impact of specific changes will be discussed in this document in a series of “info blocks”, similar to this one. This information should not be regarded as financial advice. While this report is compiled from sources that are deemed to be reliable, MPO cannot take responsibility for any decisions based on the information in this report.
3
Contents
Executive summary ............................................................................................................. 2
Contents............................................................................................................................... 3
List of figures ...................................................................................................................... 4
List of tables ........................................................................................................................ 4
1. Milk supply, demand and prices ................................................................................. 5
1.1 Milk production ........................................................................................................ 5
1.2 Dairy imports ........................................................................................................... 5
1.1 Dairy exports ........................................................................................................... 7
1.2 Net exports .............................................................................................................. 7
1.3 Total milk supply ..................................................................................................... 8
1.4 Milk demand ............................................................................................................ 9
1.4 Producer prices ......................................................................................................10
1.5 Retail prices ...........................................................................................................10
1.6 Feed prices ............................................................................................................11
1.7 Input prices ............................................................................................................13
1.8 International prices .................................................................................................14
1.9 Import parity and producer prices ...........................................................................16
2. Economic overview .....................................................................................................17
2.1 International economic outlook ...............................................................................17
2.2 South African economy ..........................................................................................18
2.2.1 Economic activity and growth ..........................................................................18
2.2.2 Household debt and income ............................................................................20
2.2.3 Inflation ...........................................................................................................20
3. Outlook ........................................................................................................................21
4
List of figures
Figure 1 Monthly milk production (Mil.L.). ........................................................................... 5
Figure 2 Annual imports, mass and milk equivalent basis, 2009-2014 ................................ 6
Figure 3 Monthly cumulative imports, (Mil.L.) milk equivalent basis 6
Figure 4 Monthly cumulative dairy exports (Mil.L.), milk equivalent basis .......................... 7
Figure 5 Cumulative net exports, milk equivalent basis (Mil.L.) , 2010-2015 ....................... 7
Figure 6 Monthly milk supply 2011 - 2016…………………………………………………… 9
Figure 7 Monthly milk producer prices, 2010-2015 ........................................................... 10
Figure 8 Monthly producer and retail prices, 2010-2015 ................................................... 11
Figure 9 Calculated dairy feed prices, 2010-2015 ............................................................ 12
Figure 10 Milk:feed price ratio, 2010-2015 ......................................................................... 13
Figure 11 Quarterly milk production cost and producer price index, 2009-2014 ................. 14
Figure 12 Monthly FAO food price indexes, 2010-2015 ...................................................... 14
Figure 13 Monthly international dairy product prices (US$/ton), 2010-2015 ....................... 15
Figure 14 International dairy product prices (Rand/ton), 2010-2015 ................................... 15
Figure 15 Monthly producer and import parity prices, 2010-2015 ....................................... 17
Figure 16 International economic growth and estimated growth, 2010-2015 ...................... 18
Figure 17 Leading and co-incident indicator of economic activity ....................................... 19
Figure 18 Quarterly change in real gross domestic product, 2010-2015 ............................. 19
Figure 19 Consumer price index and consumer price inflation, 2007-2015 ........................ 20
List of tables
Table 1 Retail market growth ............................................................................................ 9
5
1. Milk supply, demand and prices
1.1 Milk production
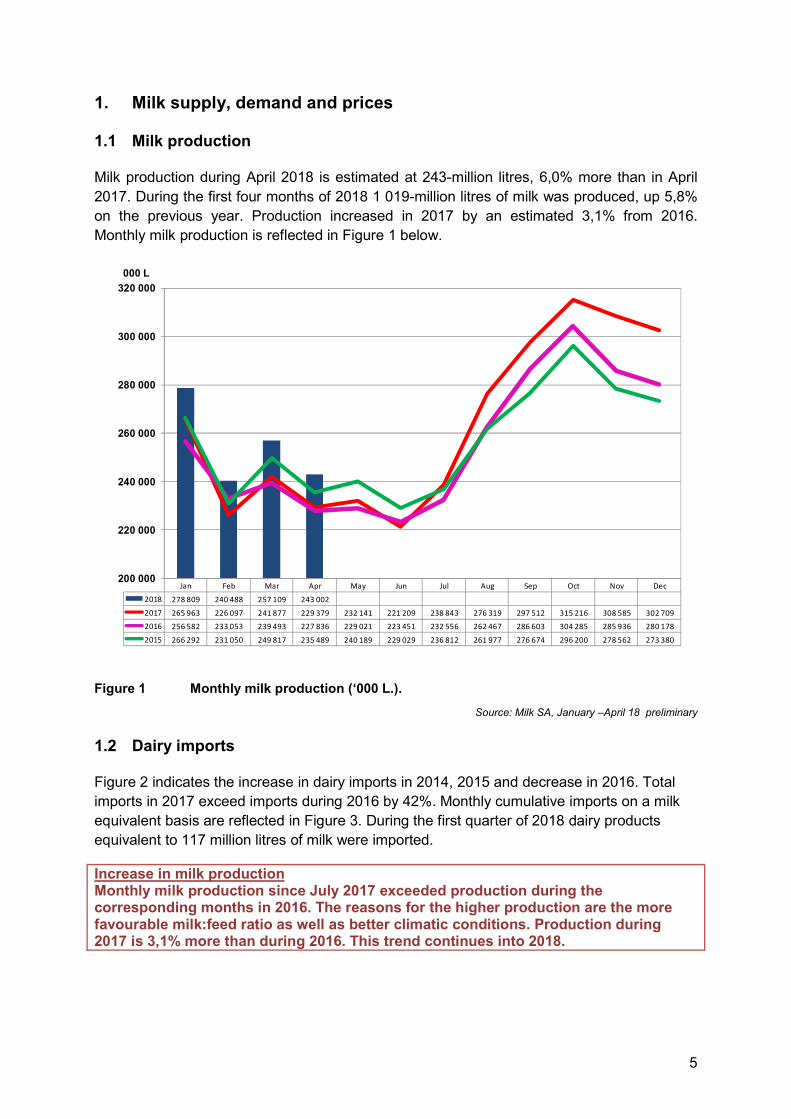
Milk production during April 2018 is estimated at 243-million litres, 6,0% more than in April 2017. During the first four months of 2018 1 019-million litres of milk was produced, up 5,8% on the previous year. Production increased in 2017 by an estimated 3,1% from 2016. Monthly milk production is reflected in Figure 1 below.
Jan Feb Mar Apr May Jun Jul Aug Sep Oct Nov Dec
2018 278 809 240 488 257 109 243 002
2017 265 963 226 097 241 877 229 379 232 141 221 209 238 843 276 319 297 512 315 216 308 585 302 709
2016 256 582 233 053 239 493 227 836 229 021 223 451 232 556 262 467 286 603 304 285 285 936 280 178
2015 266 292 231 050 249 817 235 489 240 189 229 029 236 812 261 977 276 674 296 200 278 562 273 380
200 000
220 000
240 000
260 000
280 000
300 000
320 000
000 L
Figure 1 Monthly milk production (‘000 L.).
Source: Milk SA, January –April 18 preliminary
1.2 Dairy imports
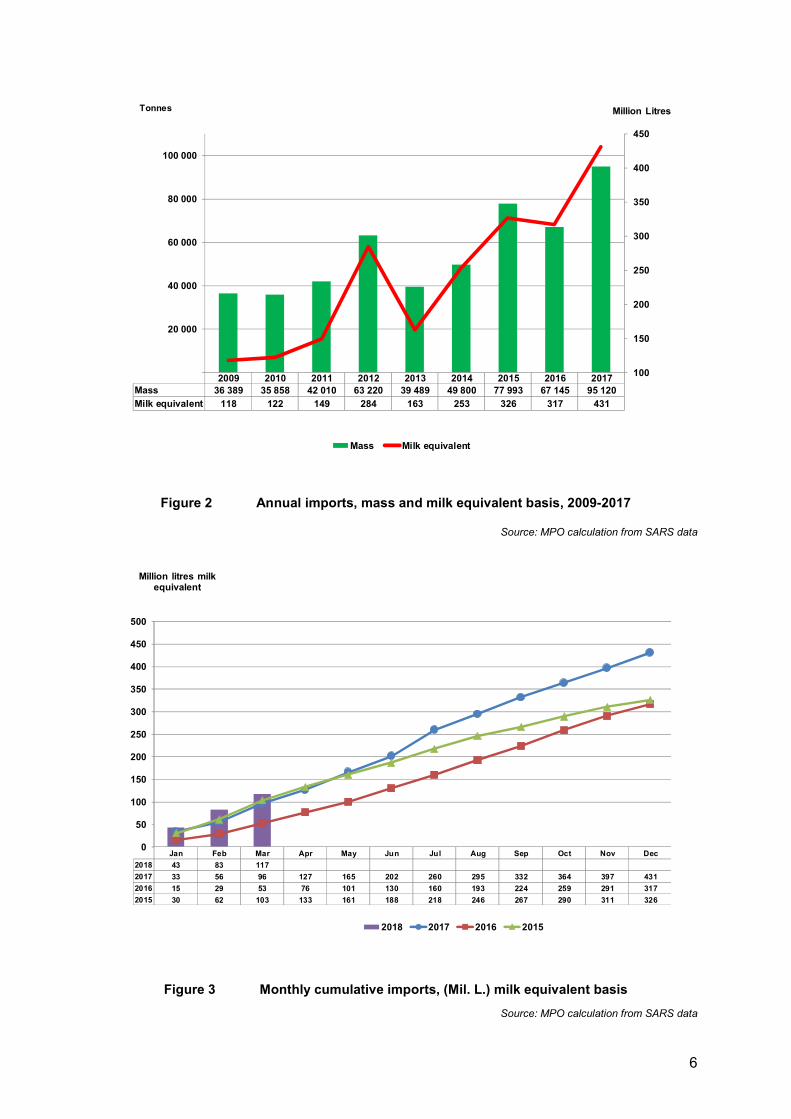
Figure 2 indicates the increase in dairy imports in 2014, 2015 and decrease in 2016. Total imports in 2017 exceed imports during 2016 by 42%. Monthly cumulative imports on a milk equivalent basis are reflected in Figure 3. During the first quarter of 2018 dairy products equivalent to 117 million litres of milk were imported.
Increase in milk production Monthly milk production since July 2017 exceeded production during the corresponding months in 2016. The reasons for the higher production are the more favourable milk:feed ratio as well as better climatic conditions. Production during 2017 is 3,1% more than during 2016. This trend continues into 2018.
6
2009 2010 2011 2012 2013 2014 2015 2016 2017Mass 36 389 35 858 42 010 63 220 39 489 49 800 77 993 67 145 95 120Milk equivalent 118 122 149 284 163 253 326 317 431
100
150
200
250
300
350
400
450
20 000
40 000
60 000
80 000
100 000
Million Litres
Mass Milk equivalent
Tonnes
Figure 2 Annual imports, mass and milk equivalent basis, 2009-2017
Source: MPO calculation from SARS data
Jan Feb Mar Apr May Jun Jul Aug Sep Oct Nov Dec
2018 43 83 117
2017 33 56 96 127 165 202 260 295 332 364 397 431
2016 15 29 53 76 101 130 160 193 224 259 291 317
2015 30 62 103 133 161 188 218 246 267 290 311 326
0
50
100
150
200
250
300
350
400
450
500
Million litres milk equivalent
2018 2017 2016 2015
Figure 3 Monthly cumulative imports, (Mil. L.) milk equivalent basis
Source: MPO calculation from SARS data
7
1.1 Dairy exports
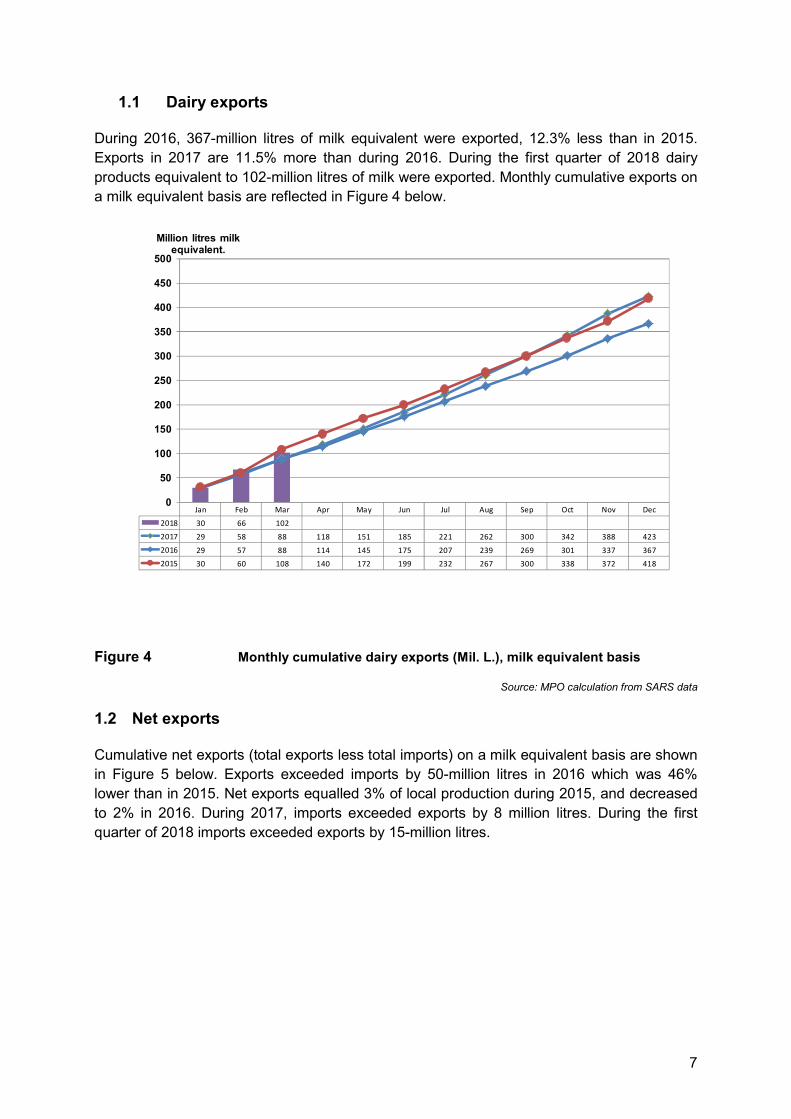
During 2016, 367-million litres of milk equivalent were exported, 12.3% less than in 2015. Exports in 2017 are 11.5% more than during 2016. During the first quarter of 2018 dairy products equivalent to 102-million litres of milk were exported. Monthly cumulative exports on a milk equivalent basis are reflected in Figure 4 below.
Jan Feb Mar Apr May Jun Jul Aug Sep Oct Nov Dec
2018 30 66 102
2017 29 58 88 118 151 185 221 262 300 342 388 423
2016 29 57 88 114 145 175 207 239 269 301 337 367
2015 30 60 108 140 172 199 232 267 300 338 372 418
0
50
100
150
200
250
300
350
400
450
500
Million litres milk equivalent.
Figure 4 Monthly cumulative dairy exports (Mil. L.), milk equivalent basis
Source: MPO calculation from SARS data
1.2 Net exports
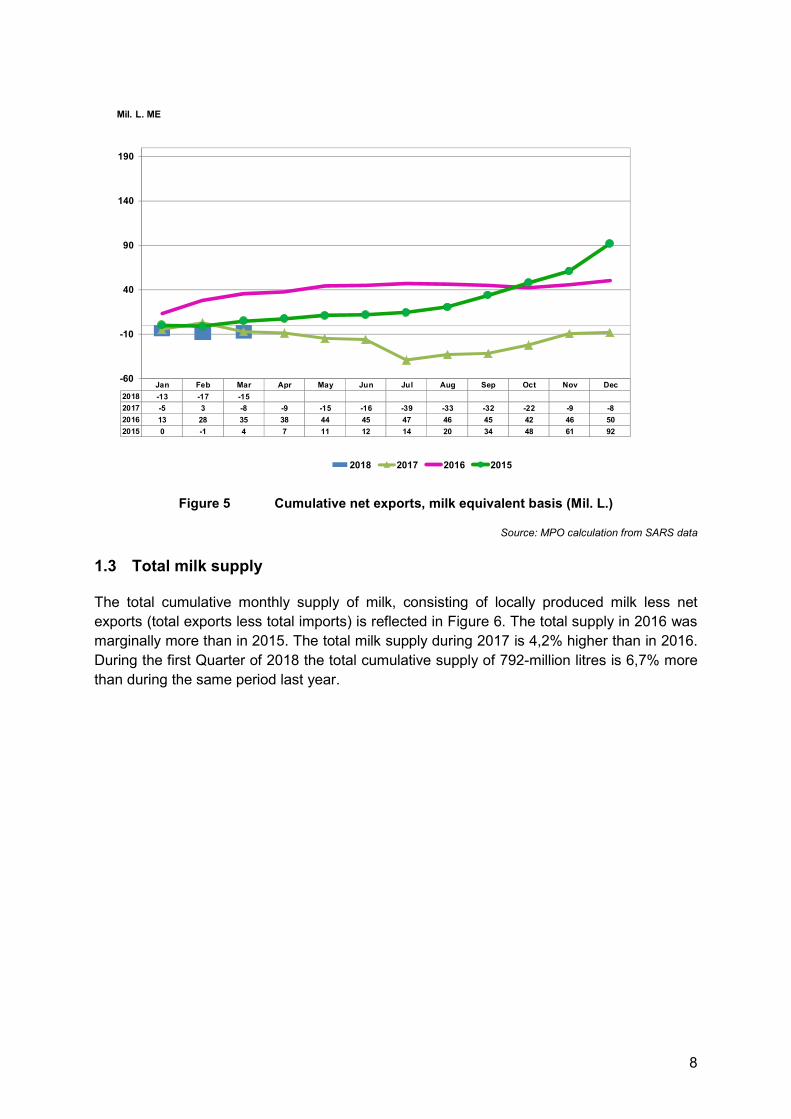
Cumulative net exports (total exports less total imports) on a milk equivalent basis are shown in Figure 5 below. Exports exceeded imports by 50-million litres in 2016 which was 46% lower than in 2015. Net exports equalled 3% of local production during 2015, and decreased to 2% in 2016. During 2017, imports exceeded exports by 8 million litres. During the first quarter of 2018 imports exceeded exports by 15-million litres.
8
Jan Feb Mar Apr May Jun Jul Aug Sep Oct Nov Dec
2018 -13 -17 -15
2017 -5 3 -8 -9 -15 -16 -39 -33 -32 -22 -9 -8
2016 13 28 35 38 44 45 47 46 45 42 46 50
2015 0 -1 4 7 11 12 14 20 34 48 61 92
-60
-10
40
90
140
190
Mil. L. ME
2018 2017 2016 2015
Figure 5 Cumulative net exports, milk equivalent basis (Mil. L.)
Source: MPO calculation from SARS data
1.3 Total milk supply
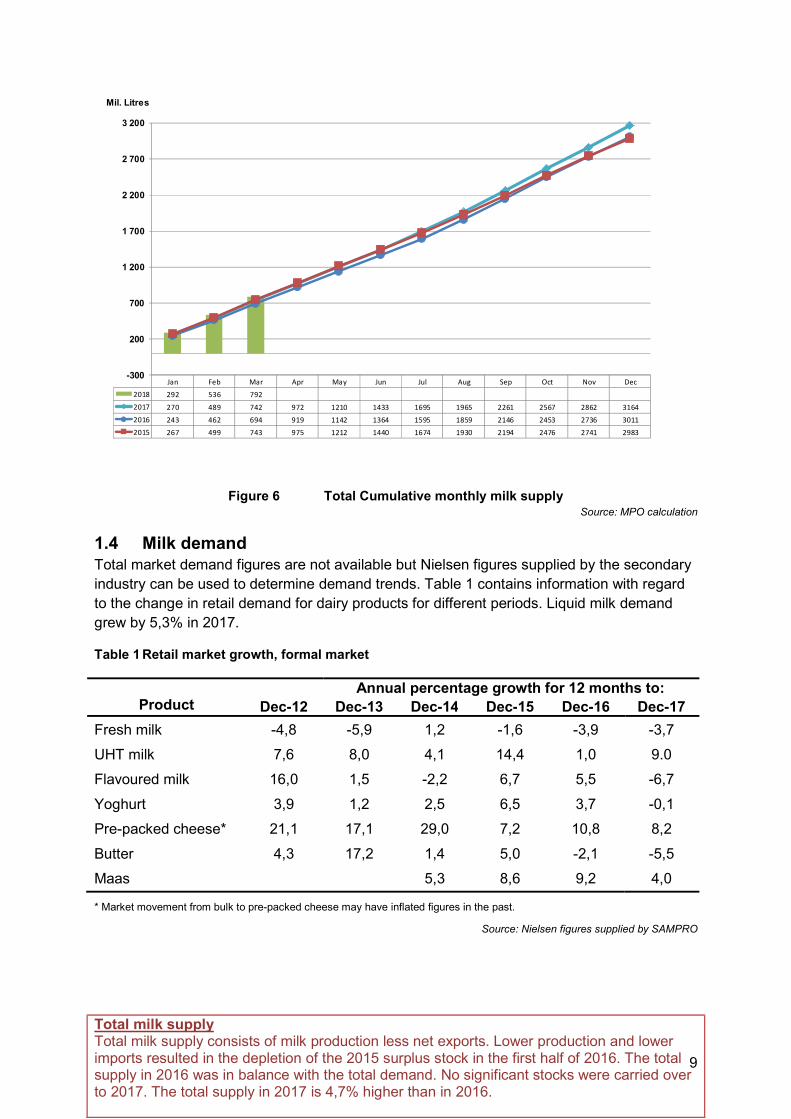
The total cumulative monthly supply of milk, consisting of locally produced milk less net exports (total exports less total imports) is reflected in Figure 6. The total supply in 2016 was marginally more than in 2015. The total milk supply during 2017 is 4,2% higher than in 2016. During the first Quarter of 2018 the total cumulative supply of 792-million litres is 6,7% more than during the same period last year.
9
Jan Feb Mar Apr May Jun Jul Aug Sep Oct Nov Dec
2018 292 536 792
2017 270 489 742 972 1210 1433 1695 1965 2261 2567 2862 3164
2016 243 462 694 919 1142 1364 1595 1859 2146 2453 2736 3011
2015 267 499 743 975 1212 1440 1674 1930 2194 2476 2741 2983
-300
200
700
1 200
1 700
2 200
2 700
3 200
Mil. Litres
Figure 6 Total Cumulative monthly milk supply
Source: MPO calculation
1.4 Milk demand
Total market demand figures are not available but Nielsen figures supplied by the secondary industry can be used to determine demand trends. Table 1 contains information with regard to the change in retail demand for dairy products for different periods. Liquid milk demand grew by 5,3% in 2017.
Table 1 Retail market growth, formal market
Product
Annual percentage growth for 12 months to: Dec-12 Dec-13 Dec-14 Dec-15 Dec-16 Dec-17
Fresh milk -4,8 -5,9 1,2 -1,6 -3,9 -3,7
UHT milk 7,6 8,0 4,1 14,4 1,0 9.0
Flavoured milk 16,0 1,5 -2,2 6,7 5,5 -6,7
Yoghurt 3,9 1,2 2,5 6,5 3,7 -0,1
Pre-packed cheese* 21,1 17,1 29,0 7,2 10,8 8,2
Butter 4,3 17,2 1,4 5,0 -2,1 -5,5
Maas 5,3 8,6 9,2 4,0
* Market movement from bulk to pre-packed cheese may have inflated figures in the past.
Source: Nielsen figures supplied by SAMPRO
Total milk supply Total milk supply consists of milk production less net exports. Lower production and lower imports resulted in the depletion of the 2015 surplus stock in the first half of 2016. The total supply in 2016 was in balance with the total demand. No significant stocks were carried over to 2017. The total supply in 2017 is 4,7% higher than in 2016.
10
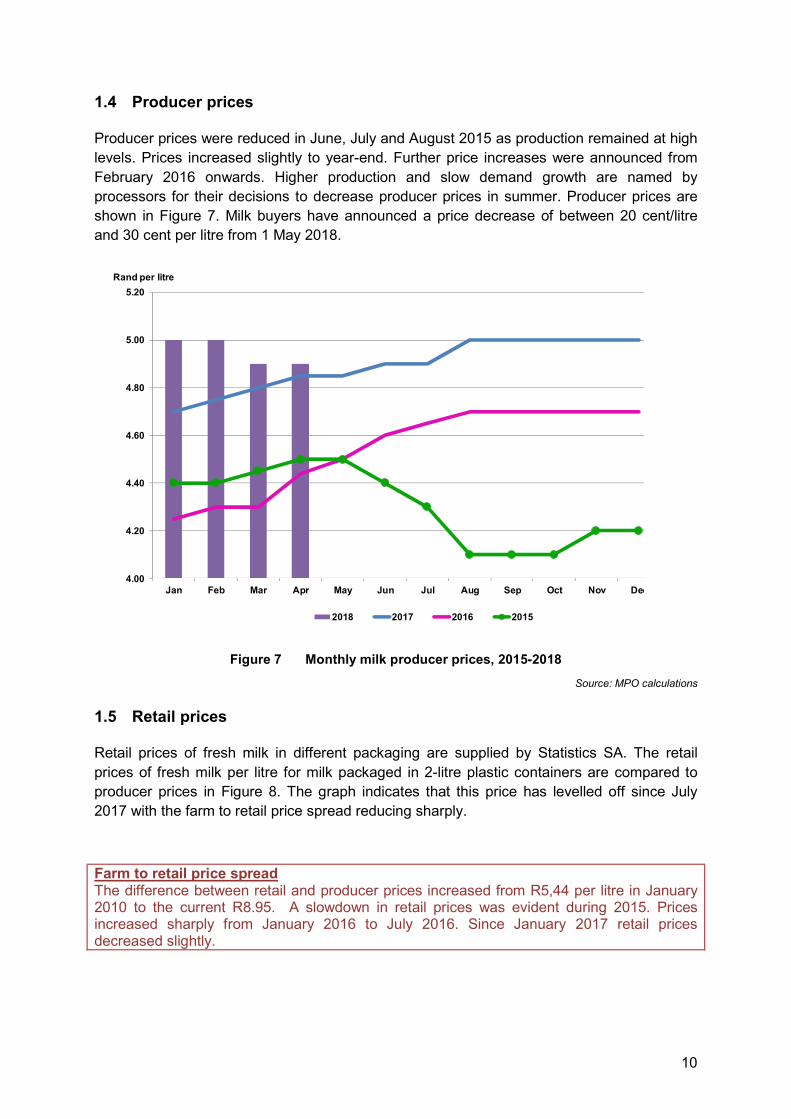
1.4 Producer prices
Producer prices were reduced in June, July and August 2015 as production remained at high levels. Prices increased slightly to year-end. Further price increases were announced from February 2016 onwards. Higher production and slow demand growth are named by processors for their decisions to decrease producer prices in summer. Producer prices are shown in Figure 7. Milk buyers have announced a price decrease of between 20 cent/litre and 30 cent per litre from 1 May 2018.
4.00
4.20
4.40
4.60
4.80
5.00
5.20
Jan Feb Mar Apr May Jun Jul Aug Sep Oct Nov Dec
Rand per litre
2018 2017 2016 2015
Figure 7 Monthly milk producer prices, 2015-2018
Source: MPO calculations
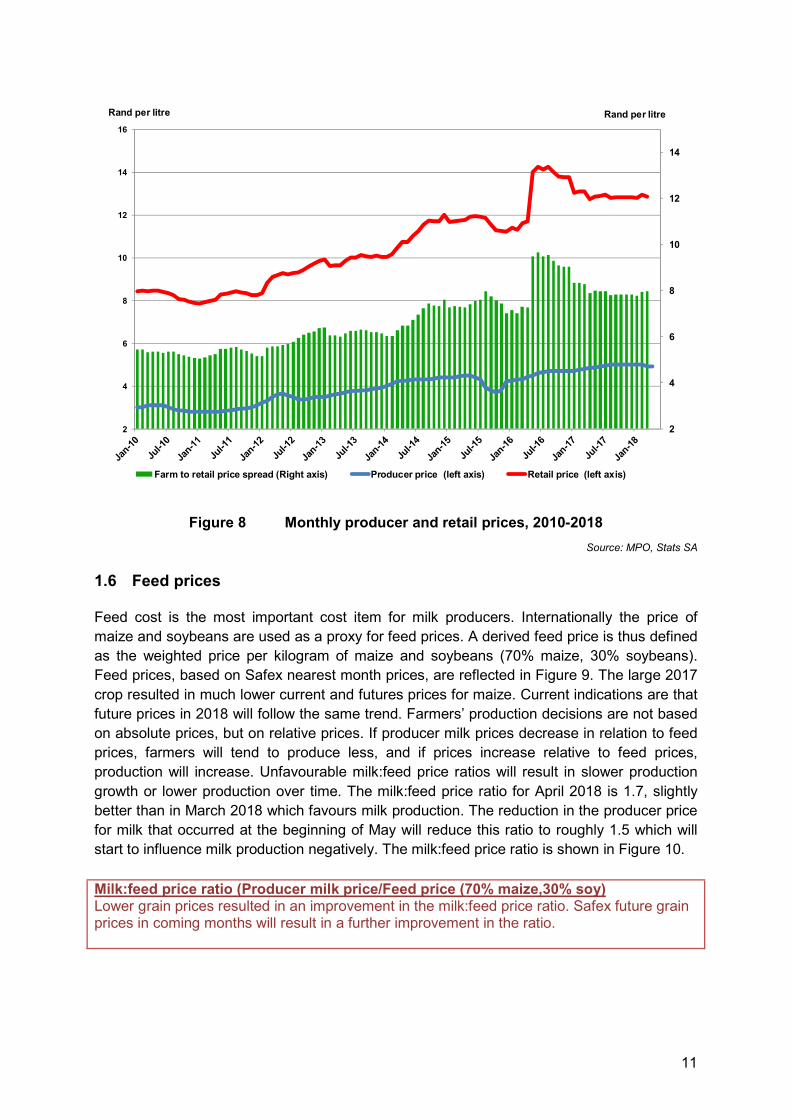
1.5 Retail prices
Retail prices of fresh milk in different packaging are supplied by Statistics SA. The retail prices of fresh milk per litre for milk packaged in 2-litre plastic containers are compared to producer prices in Figure 8. The graph indicates that this price has levelled off since July 2017 with the farm to retail price spread reducing sharply.
Farm to retail price spread The difference between retail and producer prices increased from R5,44 per litre in January 2010 to the current R8.95. A slowdown in retail prices was evident during 2015. Prices increased sharply from January 2016 to July 2016. Since January 2017 retail prices decreased slightly.
11
2
4
6
8
10
12
14
2
4
6
8
10
12
14
16
Rand per litreRand per litre
Farm to retail price spread (Right axis) Producer price (left axis) Retail price (left axis)
Figure 8 Monthly producer and retail prices, 2010-2018
Source: MPO, Stats SA
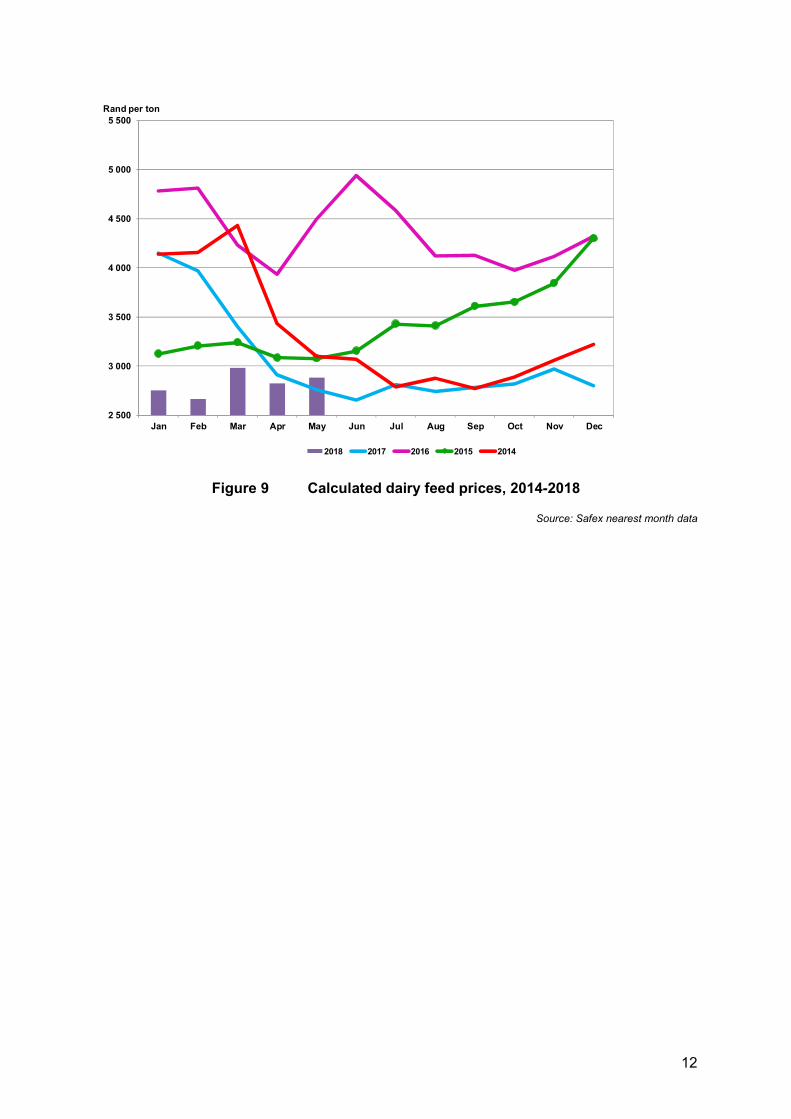
1.6 Feed prices
Feed cost is the most important cost item for milk producers. Internationally the price of maize and soybeans are used as a proxy for feed prices. A derived feed price is thus defined as the weighted price per kilogram of maize and soybeans (70% maize, 30% soybeans). Feed prices, based on Safex nearest month prices, are reflected in Figure 9. The large 2017 crop resulted in much lower current and futures prices for maize. Current indications are that future prices in 2018 will follow the same trend. Farmers’ production decisions are not based on absolute prices, but on relative prices. If producer milk prices decrease in relation to feed prices, farmers will tend to produce less, and if prices increase relative to feed prices, production will increase. Unfavourable milk:feed price ratios will result in slower production growth or lower production over time. The milk:feed price ratio for April 2018 is 1.7, slightly better than in March 2018 which favours milk production. The reduction in the producer price for milk that occurred at the beginning of May will reduce this ratio to roughly 1.5 which will start to influence milk production negatively. The milk:feed price ratio is shown in Figure 10.
Milk:feed price ratio (Producer milk price/Feed price (70% maize,30% soy) Lower grain prices resulted in an improvement in the milk:feed price ratio. Safex future grain prices in coming months will result in a further improvement in the ratio.
12
2 500
3 000
3 500
4 000
4 500
5 000
5 500
Jan Feb Mar Apr May Jun Jul Aug Sep Oct Nov Dec
Rand per ton
2018 2017 2016 2015 2014
Figure 9 Calculated dairy feed prices, 2014-2018
Source: Safex nearest month data

13
Jan Feb Mar Apr May Jun Jul Aug Sep Oct Nov Dec
2018 1.8 1.9 1.6 1.7
2017 1.1 1.2 1.4 1.7 1.8 1.8 1.7 1.8 1.8 1.8 1.7 1.8
2016 0.9 0.9 1.0 1.1 1.0 0.9 1.0 1.1 1.1 1.2 1.1 1.1
2015 1.4 1.4 1.4 1.5 1.5 1.4 1.3 1.2 1.1 1.1 1.1 1.0
2014 1.0 1.0 0.9 1.2 1.4 1.4 1.5 1.5 1.6 1.5 1.4 1.4
0.80
1.00
1.20
1.40
1.60
1.80
2.00
Milk : feed price ratio
2018 2017 2016 2015 2014
Figure 10 Milk: feed price ratio, 2014-2018
Source: MPO calculations
1.7 Input prices
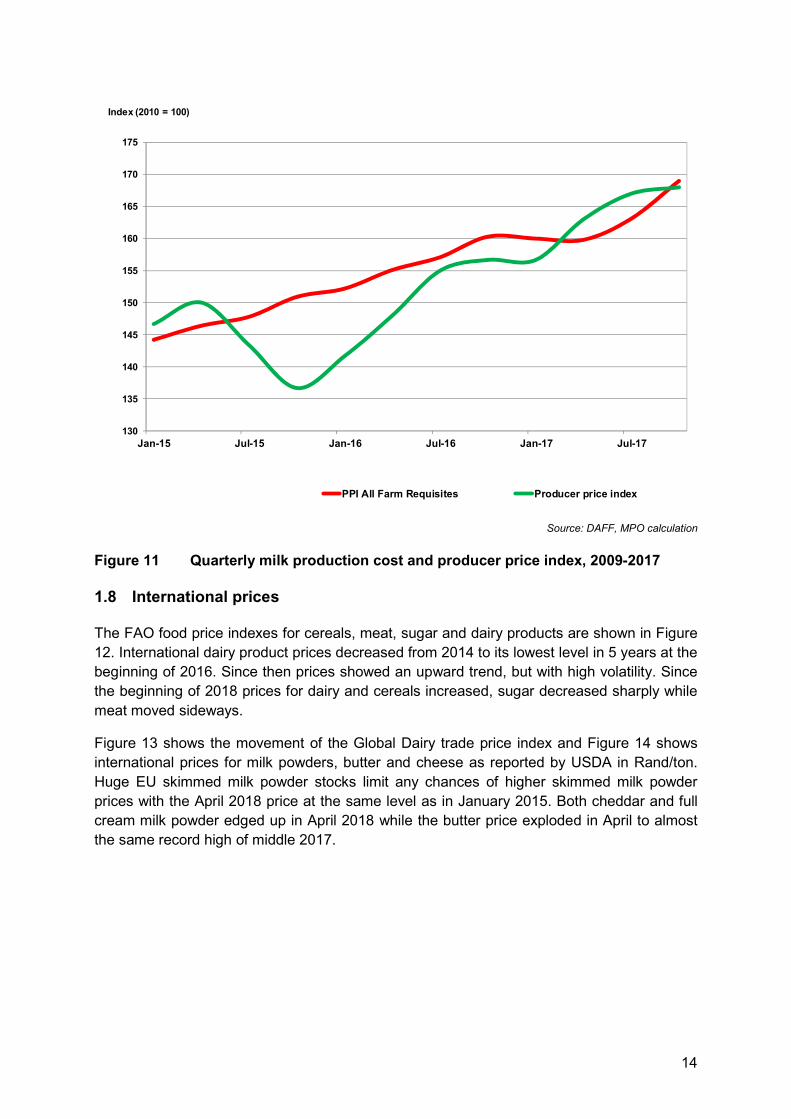
The National Department of Agriculture publishes price indexes for farm requisites on a quarterly basis. As with all indexes, this index simplifies a very complex data-set to a level that does not correspond to individual farm data-sets. However, the trend in this index gives an indication of the direction of input price changes. The farm requisite index and producer price index are shown in Figure 11.
14
130
135
140
145
150
155
160
165
170
175
Jan-15 Jul-15 Jan-16 Jul-16 Jan-17 Jul-17
Index (2010 = 100)
PPI All Farm Requisites Producer price index
Source: DAFF, MPO calculation
Figure 11 Quarterly milk production cost and producer price index, 2009-2017
1.8 International prices
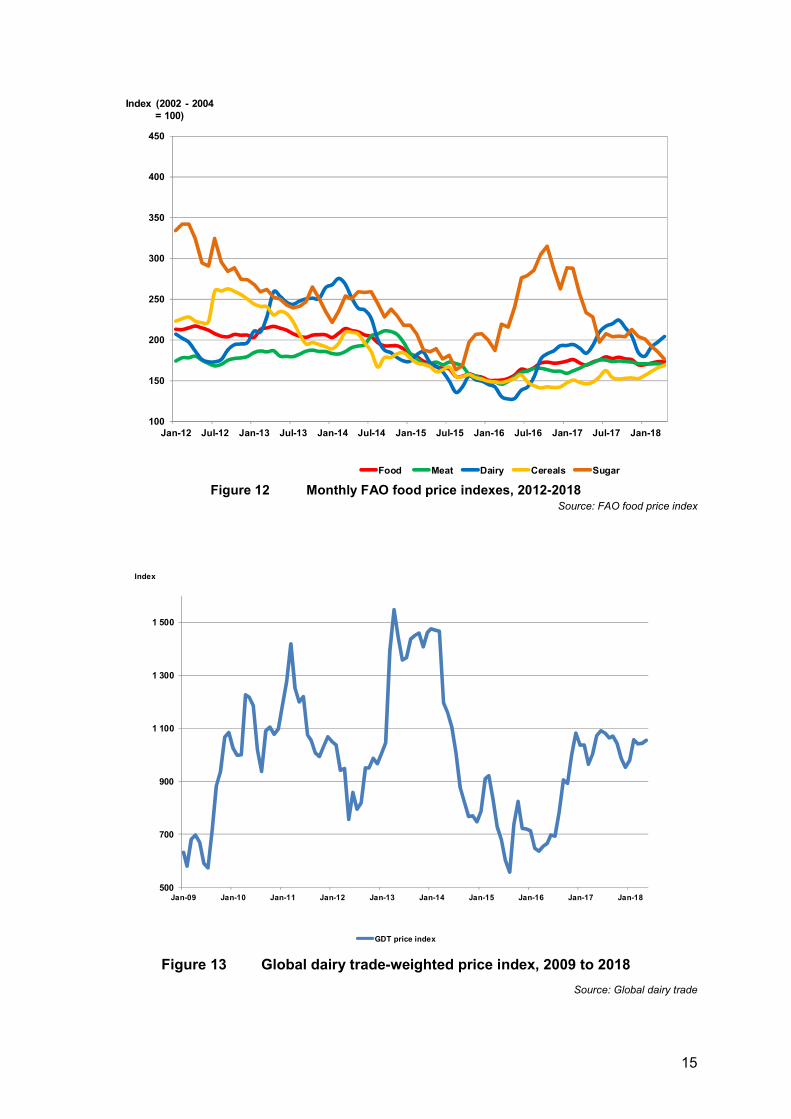
The FAO food price indexes for cereals, meat, sugar and dairy products are shown in Figure 12. International dairy product prices decreased from 2014 to its lowest level in 5 years at the beginning of 2016. Since then prices showed an upward trend, but with high volatility. Since the beginning of 2018 prices for dairy and cereals increased, sugar decreased sharply while meat moved sideways.
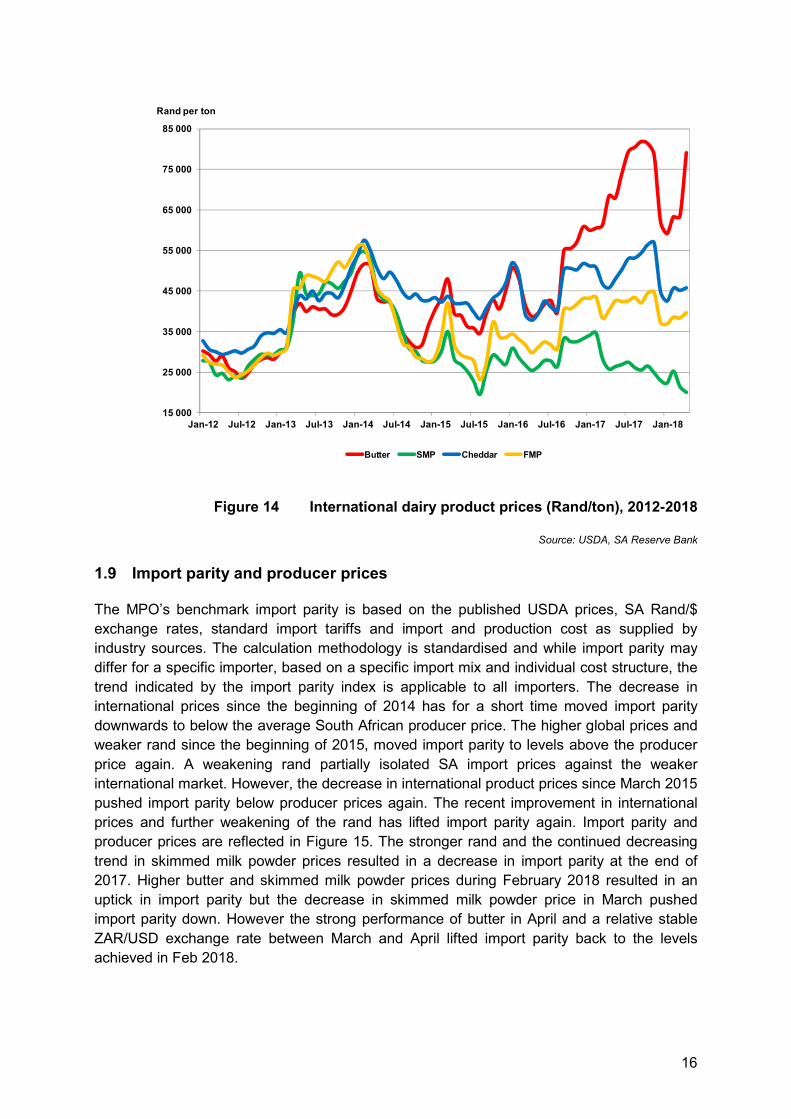
Figure 13 shows the movement of the Global Dairy trade price index and Figure 14 shows international prices for milk powders, butter and cheese as reported by USDA in Rand/ton. Huge EU skimmed milk powder stocks limit any chances of higher skimmed milk powder prices with the April 2018 price at the same level as in January 2015. Both cheddar and full cream milk powder edged up in April 2018 while the butter price exploded in April to almost the same record high of middle 2017.
15
100
150
200
250
300
350
400
450
Jan-12 Jul-12 Jan-13 Jul-13 Jan-14 Jul-14 Jan-15 Jul-15 Jan-16 Jul-16 Jan-17 Jul-17 Jan-18
Index (2002 - 2004 = 100)
Food Meat Dairy Cereals Sugar Figure 12 Monthly FAO food price indexes, 2012-2018
Source: FAO food price index
500
700
900
1 100
1 300
1 500
Jan-09 Jan-10 Jan-11 Jan-12 Jan-13 Jan-14 Jan-15 Jan-16 Jan-17 Jan-18
Index
GDT price index
Figure 13 Global dairy trade-weighted price index, 2009 to 2018
Source: Global dairy trade
16
15 000
25 000
35 000
45 000
55 000
65 000
75 000
85 000
Jan-12 Jul-12 Jan-13 Jul-13 Jan-14 Jul-14 Jan-15 Jul-15 Jan-16 Jul-16 Jan-17 Jul-17 Jan-18
Rand per ton
Butter SMP Cheddar FMP
Figure 14 International dairy product prices (Rand/ton), 2012-2018
Source: USDA, SA Reserve Bank
1.9 Import parity and producer prices
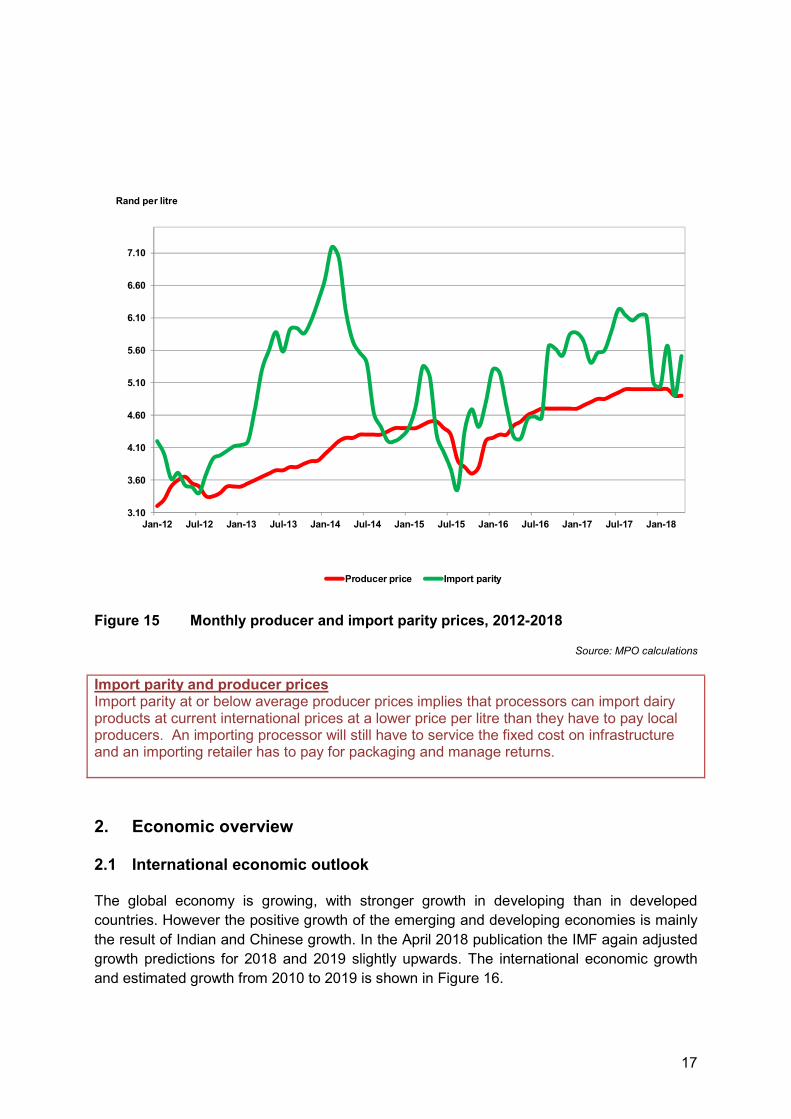
The MPO’s benchmark import parity is based on the published USDA prices, SA Rand/$ exchange rates, standard import tariffs and import and production cost as supplied by industry sources. The calculation methodology is standardised and while import parity may differ for a specific importer, based on a specific import mix and individual cost structure, the trend indicated by the import parity index is applicable to all importers. The decrease in international prices since the beginning of 2014 has for a short time moved import parity downwards to below the average South African producer price. The higher global prices and weaker rand since the beginning of 2015, moved import parity to levels above the producer price again. A weakening rand partially isolated SA import prices against the weaker international market. However, the decrease in international product prices since March 2015 pushed import parity below producer prices again. The recent improvement in international prices and further weakening of the rand has lifted import parity again. Import parity and producer prices are reflected in Figure 15. The stronger rand and the continued decreasing trend in skimmed milk powder prices resulted in a decrease in import parity at the end of 2017. Higher butter and skimmed milk powder prices during February 2018 resulted in an uptick in import parity but the decrease in skimmed milk powder price in March pushed import parity down. However the strong performance of butter in April and a relative stable ZAR/USD exchange rate between March and April lifted import parity back to the levels achieved in Feb 2018.
17
3.10
3.60
4.10
4.60
5.10
5.60
6.10
6.60
7.10
Jan-12 Jul-12 Jan-13 Jul-13 Jan-14 Jul-14 Jan-15 Jul-15 Jan-16 Jul-16 Jan-17 Jul-17 Jan-18
Rand per litre
Producer price Import parity
Figure 15 Monthly producer and import parity prices, 2012-2018
Source: MPO calculations
Import parity and producer prices Import parity at or below average producer prices implies that processors can import dairy products at current international prices at a lower price per litre than they have to pay local producers. An importing processor will still have to service the fixed cost on infrastructure and an importing retailer has to pay for packaging and manage returns.
2. Economic overview
2.1 International economic outlook
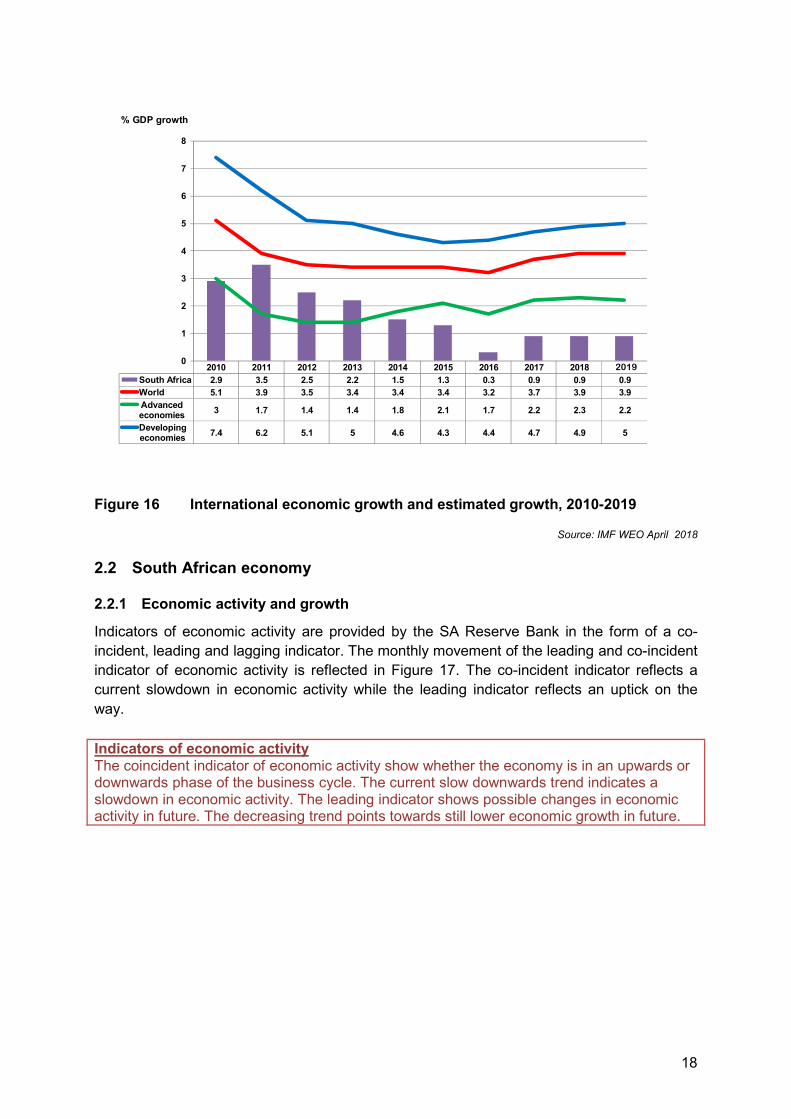
The global economy is growing, with stronger growth in developing than in developed countries. However the positive growth of the emerging and developing economies is mainly the result of Indian and Chinese growth. In the April 2018 publication the IMF again adjusted growth predictions for 2018 and 2019 slightly upwards. The international economic growth and estimated growth from 2010 to 2019 is shown in Figure 16.
18
2010 2011 2012 2013 2014 2015 2016 2017 2018South Africa 2.9 3.5 2.5 2.2 1.5 1.3 0.3 0.9 0.9 0.9World 5.1 3.9 3.5 3.4 3.4 3.4 3.2 3.7 3.9 3.9Advancedeconomies 3 1.7 1.4 1.4 1.8 2.1 1.7 2.2 2.3 2.2
Developingeconomies 7.4 6.2 5.1 5 4.6 4.3 4.4 4.7 4.9 5
0
1
2
3
4
5
6
7
8
% GDP growth
2019
Figure 16 International economic growth and estimated growth, 2010-2019
Source: IMF WEO April 2018
2.2 South African economy
2.2.1 Economic activity and growth
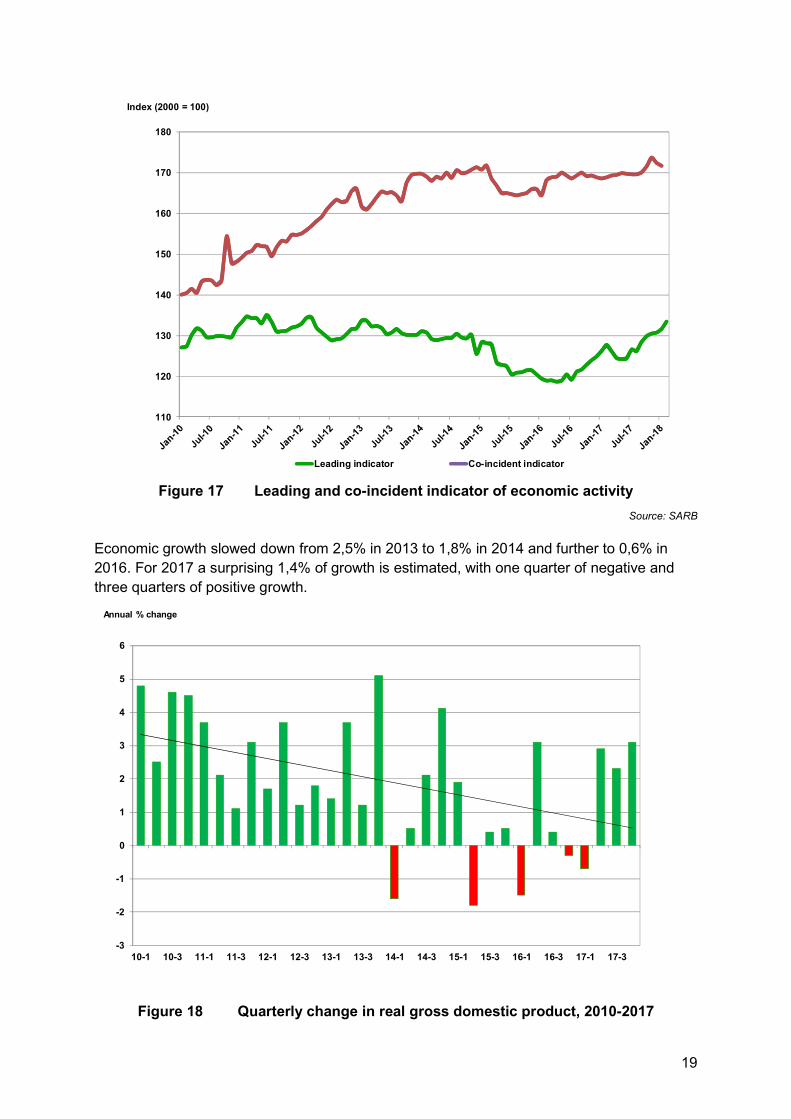
Indicators of economic activity are provided by the SA Reserve Bank in the form of a co-incident, leading and lagging indicator. The monthly movement of the leading and co-incident indicator of economic activity is reflected in Figure 17. The co-incident indicator reflects a current slowdown in economic activity while the leading indicator reflects an uptick on the way. Indicators of economic activity The coincident indicator of economic activity show whether the economy is in an upwards or downwards phase of the business cycle. The current slow downwards trend indicates a slowdown in economic activity. The leading indicator shows possible changes in economic activity in future. The decreasing trend points towards still lower economic growth in future.
19
110
120
130
140
150
160
170
180
Index (2000 = 100)
Leading indicator Co-incident indicator
Figure 17 Leading and co-incident indicator of economic activity
Source: SARB
Economic growth slowed down from 2,5% in 2013 to 1,8% in 2014 and further to 0,6% in 2016. For 2017 a surprising 1,4% of growth is estimated, with one quarter of negative and three quarters of positive growth.
-3
-2
-1
0
1
2
3
4
5
6
10-1 10-3 11-1 11-3 12-1 12-3 13-1 13-3 14-1 14-3 15-1 15-3 16-1 16-3 17-1 17-3
Annual % change
Figure 18 Quarterly change in real gross domestic product, 2010-2017
20
Source: Stats SA
2.2.2 Household debt and income
House hold debt as a percentage of house hold income has been on a declining trend since January 2015. The percentage was in January 2015 78% and reduced to 71.2% in April 2017.
2.2.3 Inflation
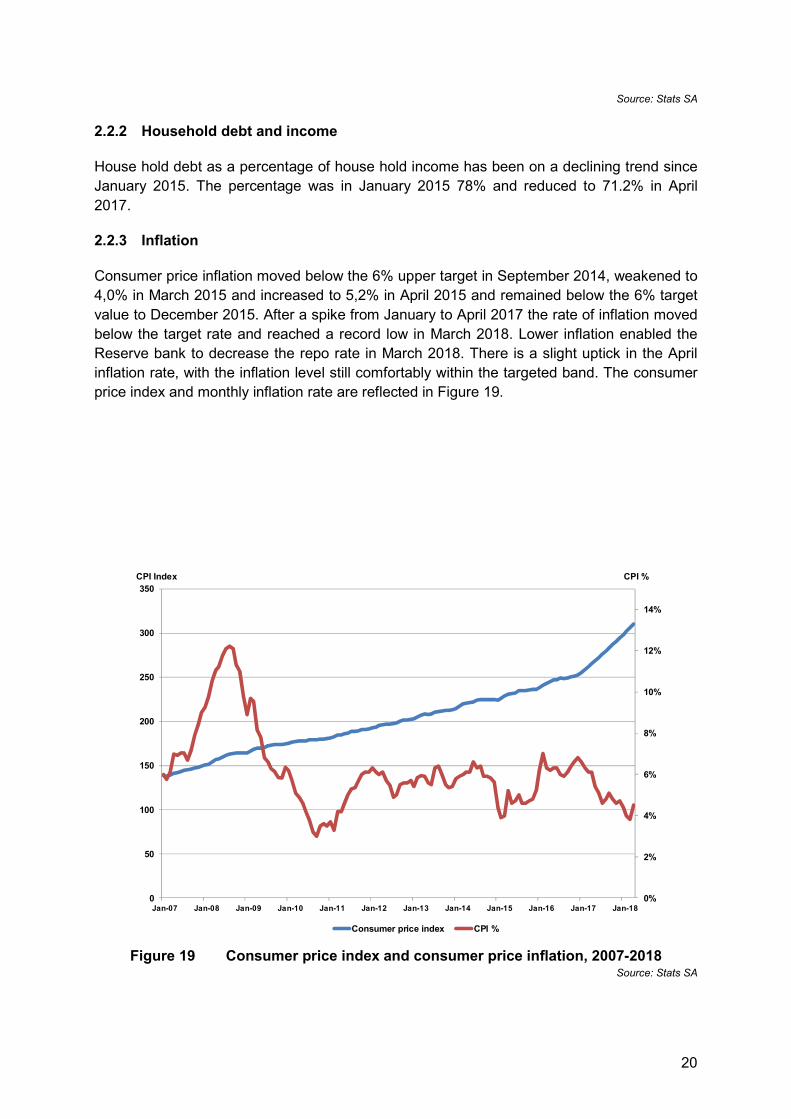
Consumer price inflation moved below the 6% upper target in September 2014, weakened to 4,0% in March 2015 and increased to 5,2% in April 2015 and remained below the 6% target value to December 2015. After a spike from January to April 2017 the rate of inflation moved below the target rate and reached a record low in March 2018. Lower inflation enabled the Reserve bank to decrease the repo rate in March 2018. There is a slight uptick in the April inflation rate, with the inflation level still comfortably within the targeted band. The consumer price index and monthly inflation rate are reflected in Figure 19.
0%
2%
4%
6%
8%
10%
12%
14%
0
50
100
150
200
250
300
350
Jan-07 Jan-08 Jan-09 Jan-10 Jan-11 Jan-12 Jan-13 Jan-14 Jan-15 Jan-16 Jan-17 Jan-18
CPI %CPI Index
Consumer price index CPI %
Figure 19 Consumer price index and consumer price inflation, 2007-2018
Source: Stats SA
21
3. Outlook
The growth of almost 5,8% in milk flow during the first four months of 2018 and the net import status of dairy products during the same period resulted in lower producer prices.. Low grain prices will continue to support milk production throughout the winter. These drivers will reduce the probability and level of any winter producer price increases. World dairy product prices are a mix of abundant stock in the skimmed milk powder market while butter is reaching record prices due to low stock levels. Full cream milk powder and cheddar prices are showing mild upward momentum in April. Chinese demand has recovered, but the level of skimmed milk powder stock levels will prevent dairy product prices to build up proper momentum to move to higher sustainable levels with the exception of butter. The current drivers in the milk market are so dominant that it will limit the SA milk price to benefit from increases in the international market if the latter occurs. The SA dairy market will start to look at the summer rain predictions and the way in which that season start will be the next driver influencing SA milk producer price.
Consumer price index (CPI) and inflation The CPI is the value of a basket of goods and services on retail price level. The change in the value of this basket compared to the same period a year ago is called the rate of inflation. The Reserve Bank tries to keep the rate of inflation between 3% and 6%.