paper no 1 of 1963, india
TRANSCRIPT
CENSUS OF INDIA
PAPER No. 1 OF 1963
1961 CENSUS-RELIGION

CONTENTS
Note
Religion Table
PAGES
i-xxxvii
1-49
NOTE
The question on Religion at the Census of 1961 was worded as follows: Q.5(b) Religion
The instruction to the enumerator on the mode of filling the question was:
For Hindu Muslim Christian Jain Buddhist Sikh
write H write M write C write J write B write S
For others write the answers actually returned.
Separate statistics have been published in this paper on the six numerically important religions of India: Buddhism, Christianity, Hinduism, Jainism, Muslims and Sikhism. Other religions
(i)
have been collectively presented under 'Others', The full tables on Religion will be published in Union Table C-VII.
The statement on pages ii-vii shows the growth of the six religions and other religions taken together during 1951-61.
In consequence of the re-organisation of States and Union Territories, certain areas were transferred from one political unit to another for which tabulations by single religions were not made in 1951 or thereafter. The strength of each religion for such areas was therefore estimated for 1951 by the ratio and proportion methods. These estimates pertain to areas and populations of which the details will be available in Union Census Report Volume I Part II-A. They are, however, insignificant compared to the actual figures available for 1951.
ii
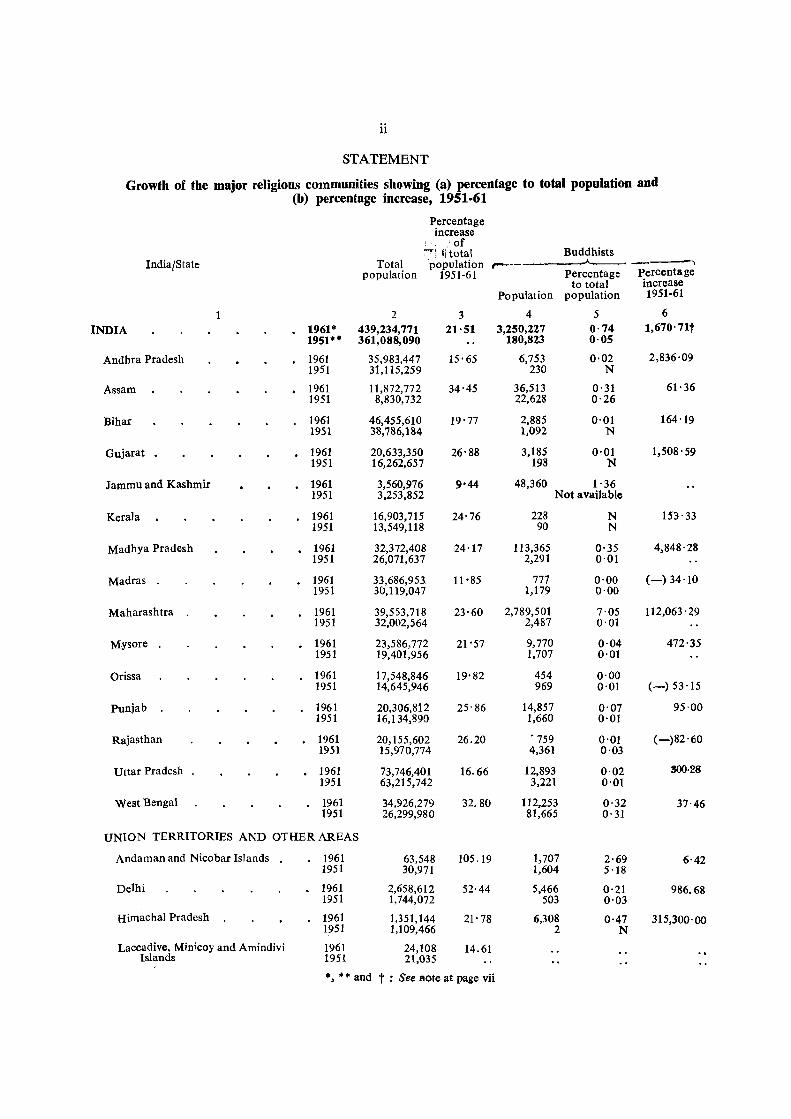
STATEMENT
Growth of the major religious communities showing (a) percentage to total population and (b) percentage increase, 1951·61
Percentage increase
, . ' of ~: Ii total Buddhists
India/State Total 'population ,...._-~~---"'\ population 1951-61 Percentage Percentage
to total increase Population population 1951-61
2 3 4 5 6
INDIA 1961* 439,234,771 21'51 3,250,227 0·74 1,670' 71t 1951"'* 361,088,090 180,823 0·05
Andhra Pradesh 1961 35,983,447 15'65 6,753 0·02 2,836'09 1951 31,115,259 230 N
Assam . 1961 11,872,772 34'45 36,513 0'31 61· 36 1951 8,830,732 22,628 0·26
Bihar 1961 46,455,610 19'77 2,885 0'01 164'19 1951 38,786,184 1,092 N
Gujarat 1961 20,633,350 26'88 3,185 0'01 1,508' 59 1951 16,262,657 198 N
Jammu and Kashmir 1961 3,560,976 9'44 48,360 1'36 1951 3,253,852 Not available
Kerala 1961 16,903,715 24'76 228 N 153'33 1951 13,549,118 90 N
Madhya Pradesh 1961 32,372,408 24'17 113,365 0'35 4,848'28 1951 26,071,637 2,291 0·01
Madras 1961 33,686,953 11'85 777 0'00 (-)34'10 1951 30,119,047 1,179 0·00
Maharashtra 1961 39,553,718 23'60 2,789,501 7·05 I12,063'29 1951 32,002,564 2,487 0'01
Mysore 1961 23,586,772 21'57 9,770 0'04 472'35 1951 19,401,956 1,707 0'01
Orissa 1961 17,548,846 19'82 454 0'00 1951 14,645,946 969 0'01 (-) 53·15
Punjab 1961 20,306,812 25' 86 14,857 0'07 95·00 1951 16,134,890 1,660 0'01
Rajasthan 1961 20,155,602 26.20 . 759 0'01 (-)82'60 1951 15,970,774 4,361 0'03
Uttar Pradesh 1961 73,746,401 16.66 12,893 0·02 300·28 1951 63,215,742 3,221 0'01
West Bengal 1961 34,926,279 32.80 112,253 0·32 37'46 1951 26,299,980 81,665 0'31
UNION TERRITORIES AND OTHER AREAS
Andaman and Nicobar Islands 1961 63,548 105.19 1,707 2·69 6'42 1951 30,971 1,604 5·18
Delhi 1961 2,658,612 52'44 5,466 0'21 986.68 1951 1,744,072 503 0'03
Himachal Pradesh 1961 1,351,144 21' 78 6,308 0·47 315,300'00 1951 1,109,466 2 N
Laccadive, Minicoy and Amindivi 1961 24,108 14.61 Islands 1951 21,035
., ** and t : See l'Iote at page vii
iii
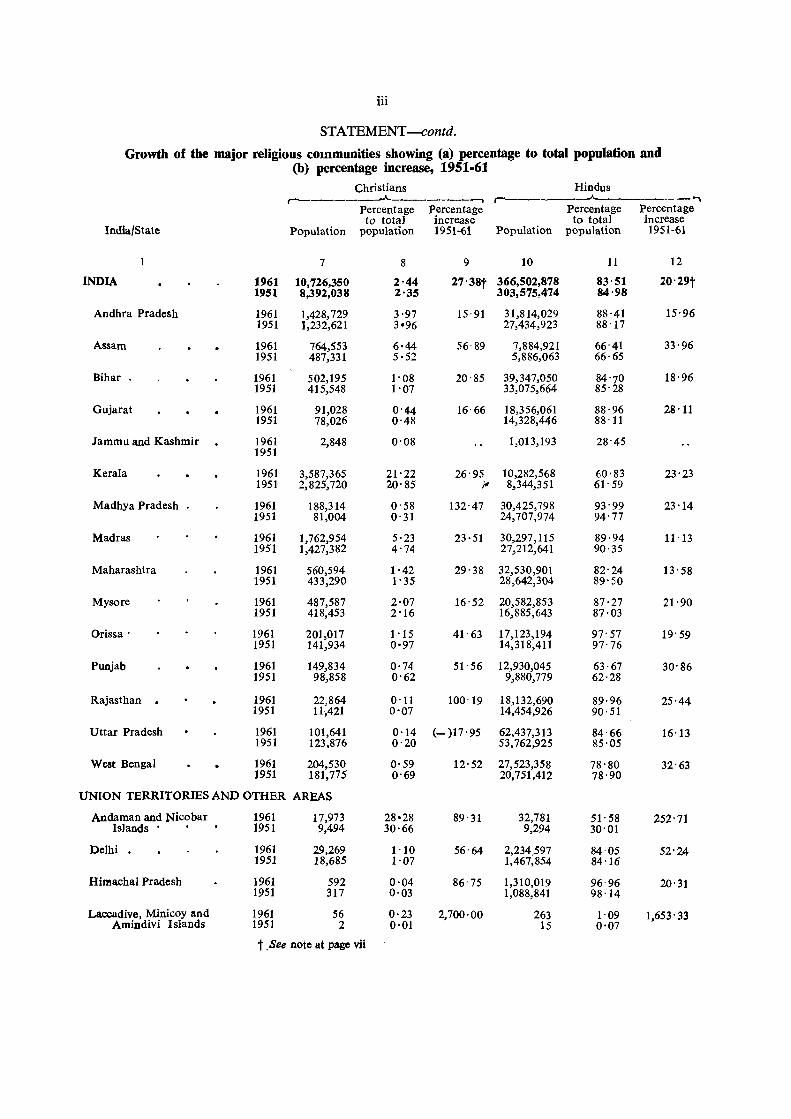
STATEMENT-contd.
Growth of the major religious communities showing (a) percentage to total population and (b) percentage increase, 1951·61
Christians Hindus r-------A-------~ r------~ "'" Percentage Percentage Percentage Percentage
to total increase to total increase India{State Population population 1951-61 Population popUlation 1951-61
7 8 9 10 11 12
INDIA 1961 10,726,350 2·44 27· 38t 366,502,878 83·51 10·29t 1951 8,392,038 2'35 303,575,474 84·98
Andhra Pradesh 1961 1,428,729 3·97 15·91 31,814,029 88·41 15·96 1951 1,232,621 3·96 27,434,923 88 ·17
Assam 1961 764,553 6'44 56·89 7,884,921 66·41 33·96 1951 487,331 5·52 5,886,063 66·65
Bihar. 1961 502,195 1· 08 20·85 39,347,050 84·70 18·96 1951 415,548 1·07 33,075,664 85·28
Gujarat 1961 91,028 0'44 16'66 18,356,061 88·96 28·11 1951 78,026 0·48 14,328,446 88'11
Jammu and Kashmir 1961 2,848 0·08 1,013,193 28·45 1951
Kerala 1961 3,587,365 21·22 26·95 10,282,568 60·83 23·23 1951 2,825,720 20·85 /I. 8,344,351 61·59
Madhya Pradesh 1961 188,314 0·58 132·47 30,425,798 93·99 23'14 1951 81,004 0·31 24,707,974 94·77
Madras 1961 1,762,954 5·23 23'51 30,297,115 89·94 11·13 1951 1,427,382 4·74 27,212,641 90·35
Maharashtra 1961 560,594 1·42 29·38 32,530,901 82· 24 13·58 1951 433,290 1·35 28,642,304 89·50
Mysore 1961 487,587 2·07 16·52 20,582,853 87·27 21·90 1951 418,453 2'16 16,885,643 87·03
Orissa· 1961 201,017 1·15 41'63 17,123,194 97·57 19·59 1951 141,934 0'97 14,318,411 97·76
Punjab 1961 149,834 0·74 51· 56 12,930,045 63·67 30·86 1951 98,858 0·62 9,880,779 62·28
Rajasthan . 1961 22,864 0·11 100'19 18,132,690 89·96 25·44 1951 11',421 0'07 14,454,926 90·51
Uttar Pradesh 1961 101,641 0·14 (- )17·95 62,437,313 84·66 16·13 1951 123,876 0·20 53,762,925 85·05
West Bengal 1961 204,530 0·59 12·52 27,523,358 78·80 32·63 1951 181,775 0·69 20,751,412 78·90
UNION TERRITORIES AND OTHER AREAS
Andaman and Nicobar 1961 17,973 28·28 89'31 32,781 51·58 252·71 Islands 1951 9,494 30'66 9,294 30·01
Delhi . 1961 29,269 1'10 56'64 2,234,597 84'05 52·24 1951 18,685 1·07 1,467,854 84·16
Himachal Pradesh 1961 592 0·04 86·75 1,310,019 96'96 20·31 1951 317 0·03 1,088,841 98·14
Laccadive, Minicoy and 1961 56 0·23 2,700'00 263 1'09 1,653·33 Amindivi Islands 1951 2 0·01 15 0·07
t _See note at page vii
ii,
STATEMENT-contd.
Growth of the major religious communities showing (a) percentage to total population and (b) percentage increase, 1951-61
Jains Muslims r---------""'-- -, r----------"--- -,
Percentage P~rcentage Percentage Percentage India/State to total Increase to total increase
Population population 1951-61 Population population 1951-61
13 14 15 16 17 18
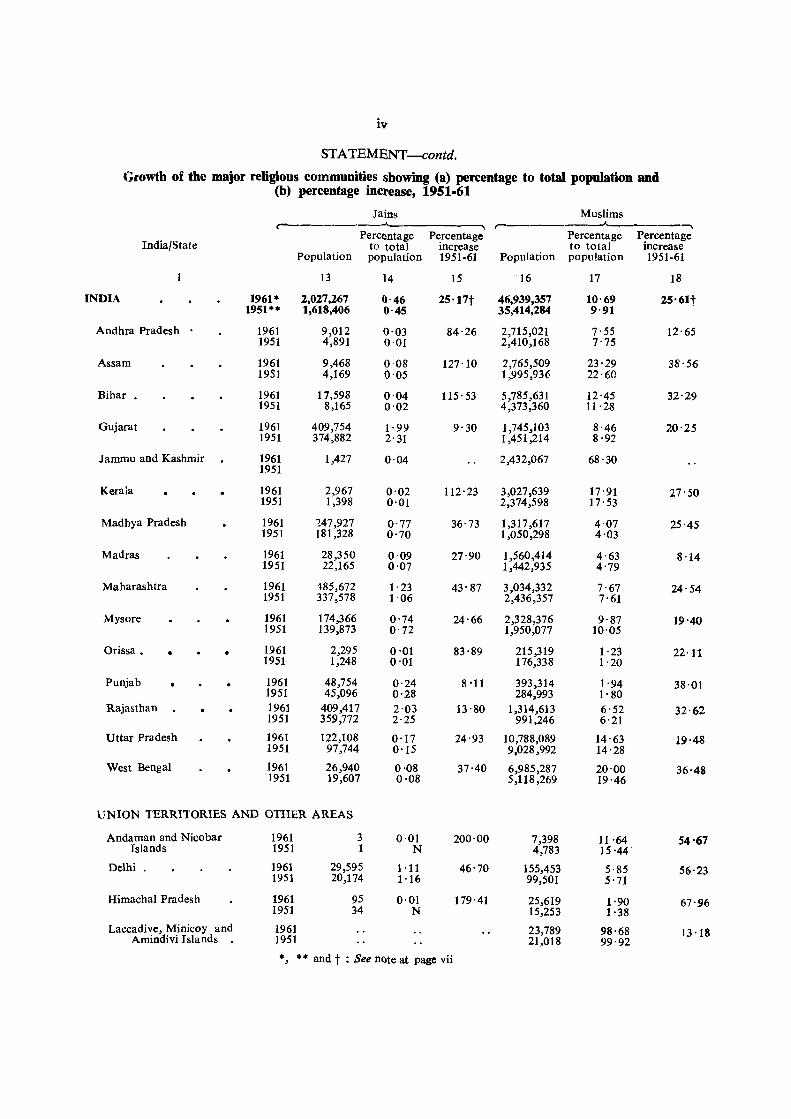
INDIA 1961* 2,027,267 0'46 25'17t 46,939,357 10'69 25'61t 1951** 1,618,406 0'45 35,414,284 9'91
Andhra Pradesh 1961 9,012 0'03 84'26 2,715,021 7·55 12'65 1951 4,891 0·01 2,410,168 7'75
Assam 1961 9,468 0·08 127'10 2,765,509 23·29 38'56 1951 4,169 0'05 1,995,936 22'60
Bihar. 1961 17,598 0·04 115' 53 5,785,631 12'45 32'29 1951 8,165 0'02 4,373,360 )),28
Gujarat 1961 409,754 1,99 9'30 1,745,103 8'46 20'25 1951 374,882 2'31 1,451,214 8,92
Jammu and Kashmir 1961 1,427 0·04 2,432,067 68·30 1951
Kerala 1961 2,967 0'02 112,23 3,027,639 17'91 27'50 1951 1,398 0,01 2,374,598 17'53
Madhya Pradesh 1961 147,927 0·77 36'73 1,317,617 4·07 25'45 1951 [81,328 0'70 1,050,298 4·03
Madras 1961 28,350 0·09 27·90 1,560,414 4'63 8'14 1951 22,165 0·07 1,442,935 4'79
Maharashtra 1961 185,672 1· 23 43'87 3,034,332 7'67 24'54 1951 337,578 1'06 2,436,357 7'61
Mysore 1961 174,366 0'74 24'66 2,328,376 9'87 19'40 1951 139,873 0·72 1,950,077 10'05
Orissa. • 1961 2,295 0'01 83·89 215,319 1'23 22'11 1951 1,248 0'01 116,338 1·20
Punjab 1961 48,754 0·24 8'11 393,314 1'94 38'01 1951 45,096 0'28 284,993 1'80
Rajasthan 1961 409,417 2'03 13'80 1,314,613 6'52 32'62 1951 359,772 2'25 991,246 6'21
Uttar Pradesh 1961 122,108 0·17 24'93 10,788,089 14'63 19'48 1951 97,744 0'15 9,028,992 14'28
West Bengal 1961 26,940 0,08 37'40 6,985,287 20'00 36'48 1951 19,607 0·08 5,118,269 19'46
UNION TERRITORIES AND OTHER AREAS
Andaman and Nicobar 1961 3 0·01 200'00 7,398 11 ,64 54'67 Islands 1951 1 N 4,783 15,44'
Delhi. 1961 29,595 ),11 46'70 155,453 5·85 56,23 1951 20,174 l'Hi 99,501 5'71
Himachal Pradesh 1961 95 0·01 179'41 25,619 1'90 67'96 1951 34 N 15,253 1'38
Laccadive, Minicoy and 1961 23,789 98'68 13 '18 Amindivi Islands 1951 21,018 99'92
*, ** and t : See nOte at page vii
v
STATEMENT ---contd.
Growth of the major religious communities showing (a) percentage to total population and (b) percentage increase, 1951·61
Sikhs Others ,...---------"---------,
,--_____ -..A-______ ~
Percentage P~rcentage Percentage Pt:rcentage India/State to total Increase to total Increase
Population population 1951-61 Population population 1951-61
19 20 21 22 23 24
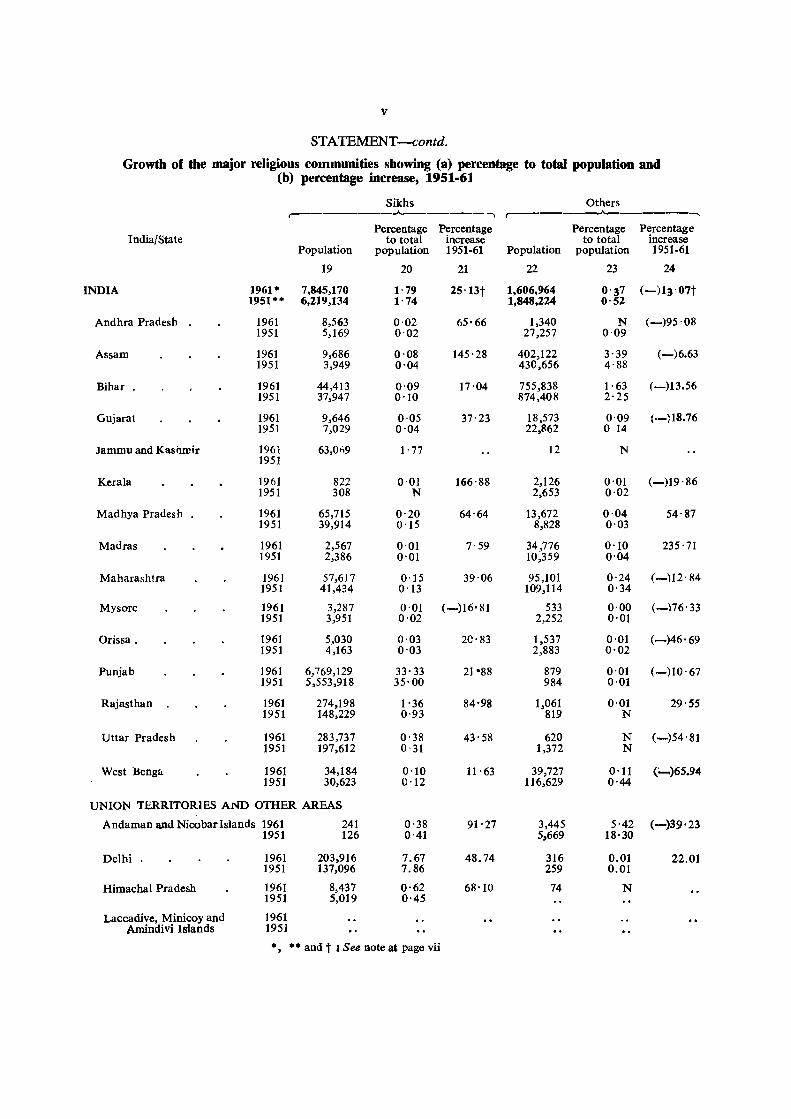
INDIA 1961· 7,845,170 1·79 25'13t 1,606,964 0'37 (-)13' 07t 1951** 6,219,134 1·74 1,848,224 0'52
Andhra Pradesh 1961 8,563 0·02 65'66 1,340 N (-)95'08 1951 5,169 0·02 27,257 0·09
Assam 1961 9,686 0'08 145'28 402,122 3'39 (-)6.63 1951 3,949 0'04 430,656 4·88
Bihar. 1961 44,413 0'09 17·04 755,838 l' 63 (-)13.56 1951 37,947 0'10 874,408 2·25
Gujarat 1961 9,646 0·05 37'23 18,573 0'09 (·-)18.76 1951 7,029 0·04 22,862 o 14
Jammu and Kashmir 196i 63,01)9 1'77 12 N 1951
Kerala 1961 822 0·01 166'88 2,126 0'01 (-)19·86 1951 308 N 2,653 0·02
Madhya Pradesh 1961 65,715 0'20 64'64 13,672 0·04 54·87 1951 39,914 0'15 8,828 0·03
Madras 1961 2,567 0·01 7'59 34,776 0'10 235'71 1951 2,386 0'01 10,359 0'04
Maharashtra 1961 57,617 0'15 39·06 95,101 0'24 (-)12'84 1951 41,434 0'13 109,114 0'34
Mysol'c 1961 3,287 0'01 (-)16'81 533 0·00 (-)76'33 1951 3,951 0'02 2,252 0'01
Orissa. 1961 5,030 0·03 2C'83 1,537 0'01 (-)46'69 1951 4,163 0'03 2,883 0'02
Punjab 1961 6,769,129 33'33 21 ·88 879 0'01 (-)10'67 1951 5,553,918 35'00 984 0'01
Rajasthan 1961 274,198 1'36 84·98 1,061 0'01 29·55 1951 148,229 0·93 819 N
Uttar Pradesh 1961 283,737 0'38 43'58 620 N (-)54'81 1951 197,612 0'31 1,372 N
West lienga 1961 34,184 0·10 11'63 39,727 0'11 (-.)65.94 1951 30,623 C'12 116,629 0·44
UNION TERRITORIES AND OTHER AREAS
Andaman and NicobarIslands 1961 241 0'38 91'27 3,445 5'42 (-)39'23 1951 126 0'41 5,669 18'30
Delhi . 1961 203,916 7.67 48.74 316 0.01 22.01 1951 137,096 7.86 259 0.01
Himachal Pradesh 1961 8,437 0·62 68'10 74 N 1951 5,019 0·45
Laccadive, Minicoy and 1961 Amindivi Islands 195]
., •• and t I See Bote at page vii
vi
STATEMENT~ontd.
Growth of the major religious communities sbowing (a) percentage to total population and (b) percentage increase, 1951·61.
India/State Total population
2
Percentage increase
of total
population 1951-61
3
Buddhists ,-____ __.A", '"""\
Percentage Percentage to total increase
Population populatio 195 - 1
4 5 6
UNION TERRITORIES AND OTHER AREAS-contd.
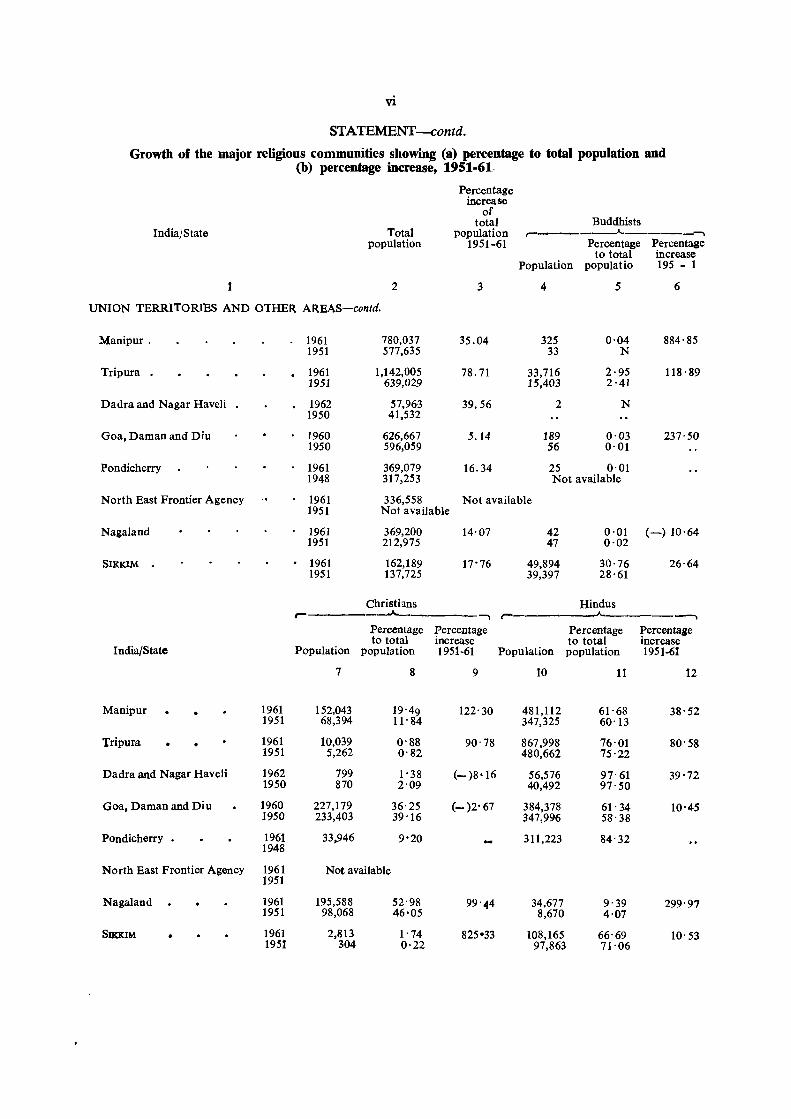
Manipur.
Tripura
Dadra and Nagar Havcli
Goa, Daman and Diu
Pondicherry
North East Frontier Agency
Nagaland
SIKKIM •
India/State
Manipur
Tripura
Dadra and Nagar Haveli
Goa, Daman and Di u
Pondicherry •
1961 1951
1961 1951
1962 1950
1960 1950
1961 1948
North East Frontier Agency 1961
Nagaland
SIKKIM
1951
1961 1951
1961 1951
1961 1951
• 1961 1951
1962 1950
1960 1950
1961 1948
780,037 577,635
1,142,005 639,029
57,963 41,532
626,667 596,059
369,079 317,253
35.04
78.71
39.56
5.14
16.34
325 33
33,716 15,403
2
189 56
0'04 N
2'95 2'41
N
0·03 0·01
25 0·01 Not available
884'85
118 '89
237'50
1961 1951
336,558 Not available
1961 1951
1961 1951
Not available
369,200 212,975
162,189 137,725
Christians
14'07
17'76
r--------"------'"""\ Percentage Percentage to total increase
Population popUlation 1951-61
7
152,043 68,394
10,039 5,262
799 870
227,179 233,403
33,946
Not available
195,588 98,068
2,813 304
8
19'49 11'84
0'88 0'82
1'38 2'09
36'25 39'16
9'20
52'98 46'05
1'74 0'22
9
122'30
90'78
(-)8·16
(- )2' 67
99'44
42 47
49,894 39,397
0·01 (-) 10,64 0·02
30,76 26'64 28'61
Hindus r-----____.A.-----.-'"""\
Percentage Percentage to total increase
Population population 1951-61
10
481,112 347,325
867,998 480,662
56,576 40,492
384,378 347,996
311,223
34,677 8,670
108,165 97,863
11
61'68 60'13
76'01 75'22
97' 61 97'50
61' 34 58'38
84'32
9'39 4'07
66'69 71'06
12
38'52
80'58
39'72
10'45
299'97
10'53
vh
STATEMENT-concld.
Growth of the major religious communities showing (a) percentage to total population and (b) percentage increase, 1951·61_
Jains Muslims __..Jo.. r-
Percentage Percentage Percentage Percentage India/State to total increase to total increase
Population population 1951-61 Population population 1951-61
1 13 14 15 16 17 18
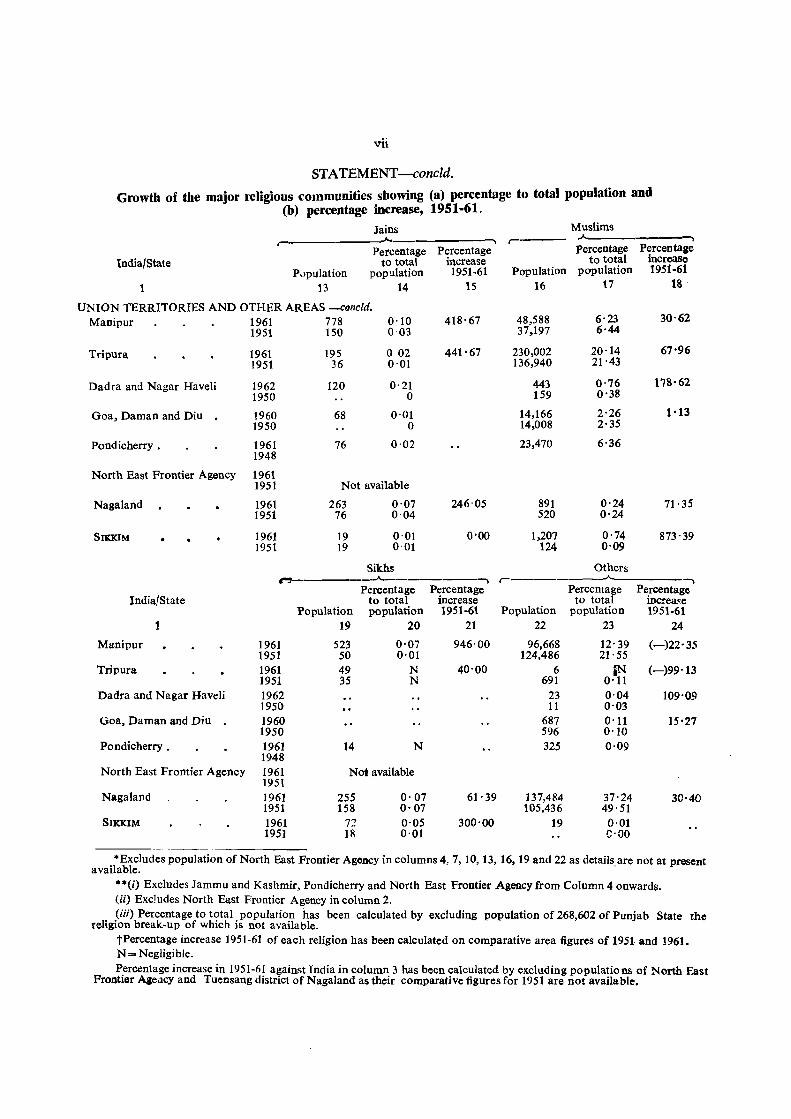
UNION TERRITORIES AND OTHER AREAS -concld. Manipur 1961 778 0-10 418'67 48,588 6-23 30'62
1951 150 0'03 37,197 6'44
Tripura 1961 195 o 02 441'67 230,002 20·14 67'96 1951 36 0'01 136,940 21'43
Dadra and Nagar Haveli 1962 120 0'21 443 0'76 178'62 1950 0 159 0'38
Goa, Daman and Diu 1960 68 0·01 14,166 2'26 1'13 1950 0 14,008 2'35
Pondicherry. 1961 76 0·02 23,470 6·36 1948
NQrth East Frontier Agency 1961 1951 Not available
Nagaland 1961 263 0-07 246'05 891 0'24 71'35 1951 76 0·04 520 0'24
SIKKIM 1961 19 0·01 0'00 1,207 0'74 873'39 1951 19 0'01 124 0'09
Sikhs Others ~-----"-----------. r----------"-- --.
Percentage Percentage Percentage Pt:rcentage India!State to total increase to total mcrease
Population population 1951-61 Population population 1951-61 1 19 20 21 22 23 24
Manipur 1961 523 0-07 946'00 96,668 12-39 (-)22'35 1951 50 0'01 124,486 21'55
Tripura 1961 49 N 40'00 6 iN (-)99'13 1951 35 N 691 0'11
Dadra and Nagar Haveli 1962 23 0'04 109'09 1950 11 0'03
Goa, Daman and Diu 1960 687 0'11 15'27 1950 596 0'10
Pondicherry . 1961 14 N 325 0'09 1948
North East Frontier Agency 1961 Not available 1951
Nagaland 1961 255 0'07 61'39 137,484 37'24 30'40 1951 158 0'07 105,436 49'51
SIKKIM 1961 72 0'05 300'00 19 0'01 1951 18 0-01 C'OO
*Excludes population of North East Frontier Agency in columns 4,7, 10, 13, 16, 19 and 22 as details are not at present available. .
**(i) Excludes Jammu and Kashmir, Pondicherry and North East Frontier Agency from Column 4 onwards. (ii) Exc!udes North East Frontier Agency in column 2. (iii) Percentage to total population has been calculated by excluding population of 268,602 of Punjab State the
religion break-up of which is not available. tPercentage increase 1951-61 of each religion has been calculated on comparative area figures of 1951 and 1961. N = Negligible. Percentage increase in 1951-61 against India in column 3 has been calculated by excluding populations of North East
Frontier Agency and Tuensang district of Nagaland as their comparative figures for 1951 are not available.

BRIEF NOTES ON THE SIX NUMERICALLY MAJOR RELIGIONS
Buddhists'
In the whole of India the number of Buddhists went up from 180,823 in 1951 to 3,250,227 in 1961. The population of Buddhists to total population was 0·05 in 1951 and 0·74 in 1961. The decadal percentage increase of Buddhists on 1951 was as much as 1,670'71.
This striking increase has been due in part to the neo-Buddhist movement which swept the country during the decade. The movement seems to have taken in its stride all states and Union
States which show high increase in the Buddhist
population
Himachal Pradesh
Maharashtra
Madhya Pradesh
Andhra Pradesh
Gujarat
Delhi
Manipur
Punjab
Mysore
Uttar Pradesh
Goa, Daman and Diu
Bihar
Kerala
Tripura
Assam
West Bengal
Territories except Madras, Orissa and Raiasthan. The three latter States saw proportionate as we!: as actual decreases in the Buddhist population. The figures for Jammu and Kashmir for 1951 are not available, no census having been taken that year.
The States and Union Territories which show high increases for Buddhists are ranked below in descending order of percentage increase during 1951-61.
Population ~ ___ -A. __ ---.
1951 1961
2 6,308
2,487 2,789,501
2,291 113.365
230 6,753
198 3,185
503 5,466
33 325
1,660 14,857
1,707 9,770
3,221 12,893
56 189
1,092 2,885
90 228
15,403 33,716
22,628 36,513
81,665 112,253
Percentage increase of Buddhists
1951-61
315,300
112,063
4,848
2,836
1,509
987
885
795
472
300
238
164
153
119
61
37
Percentage to total population of State ,--___ ..A. ____ --,
1951 1961
N 0'47
0·01 7'05
0-01 0.35
N 0-02
N 0'01
0-03 0-21
N 0'04
0-01 0-07
0·01 0-04
0'01 0·02
0'01 0-03
N 0'01
N N
2-41 2'95
0_26 0'31
0·31 0·32
The following States and territories show either low increases or decreases in the Buddhist population.
Nagaland 47 42 -11 0'02 0-01
Madras 1,179 777 -34 0'00 0·00
Orissa 969 454 -53 0'01 0-00
Rajasthan 4,361 759 -83 0·03 0·01
Andaman and Nicdbar Islands 1,604 1,707 +6 5·18 2·69
SU{XIM 39,397 49,894 +27 28.61 30·76
viii
Ix
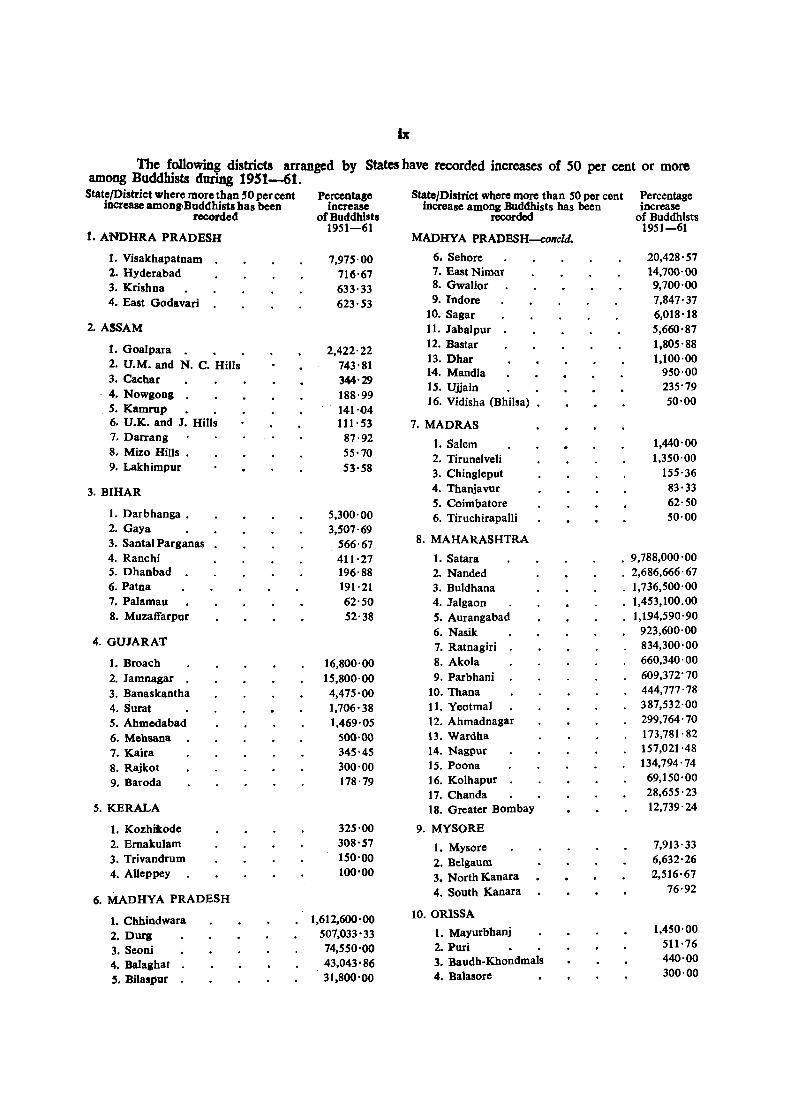
The following districts arranged by among Buddhists during t9~t-6t.
State/District where more than ,0 per cent increase among,Buddhists has been
States have recorded increases of 50 per cent or more
recorded
I. ANDHRA PRADESH
1. Visakhapatnam 2. Hyderabad 3. Krishna 4. East Godavari
2. ASSAM
1.0oalpara 2. U.M. and N. C. Hills 3. Cacbar 4. Nowgong . 5. Kamrup 6. U.K. and J. Hills 7. Darrang 8. Mizo Hills. 9. Lakhimpur
3. BIHAR
1. Darbhanga . 2. Gaya 3. Santal Parganas 4. Ranchi 5. Dhanbad 6. Patna 7. Palamau 8. Muzafi'arpur
4. GUJARAT
1. Broach 2. Jamnagar 3. Banaskantha 4. Surat 5. Ahmedabad 6. Mehsana 7. Kaira 8. Rajkot 9. Baroda
5. KERALA
1. Kozhit:ode 2. Emakulam 3. Trivandrum 4. AUeppey
6. MADHYA PRADESH
1. Chhindwara 2. Durg 3. Seoni 4. Balashat 5. Bilaspur
Percentage increase
of Buddhists 1951-61
7,975'00 716'67 633·33 623'53
2,422'22 743'81 344'29 188'99 141'04 111'53
87·92 55'70 53'58
5,300'00 3,507'69
566'67 411'27 196·88 191·21 62'50 52'38
16,800'00 15,800'00 4,475'00 1,706'38 1,469,05
500·00 345-45 300-00 178-79
325-00 308'57 150'00 100'00
1,612,600'00 507,033'33 74,550'00
.43,043'86 31,800'00
State/District where more than 50 per cent increase among Buddhists has been
recorded
MADRY A PRADESH-concld.
6. Sehore 7. East Nimar 8. Gwalior 9. Indore
10. Sagar 11. Jabalpur 12. Bastar 13. Dhar 14. Mandla 15. Ujjain J 6. Vidisha (Bhitsa)
7. MADRAS
1. Salem 2. Tirunelveli 3. Chingleput 4. Thanjavur 5. Coimbatore 6. Tiruchirapalli
8. MAHARASHTRA
Percentage increase
of Buddhists 1951-61
20,428'57 14,700-00 9,700'00 7,847'37 6,018'18 5,660-87 1,805-88 1,100'00
950-00 235'79 50-00
1,440'00 1,350-00
155-36 83·33 62-50 50·00
1. Satara . 9,788,000'00 2. Nanded . 2,686,666 -67
3. Buldhana 1,736,500'00
4. Jalgaon 1,453,100_00
5. Aurangabad 1,194,590-90
6. Nasik 923,600'00
7. Ratnagiri 834,300-00
8. Akola 660,340-00
9. Parbhani 609,372'70
10. Thana 444,777-78
11. Yeotmal 387,532-00
12. Ahmadnagar 299,764-70
13. Wardha 173,781'82
14. Nagpur 157,021-48
15. Poona 134,794'74
16. Kolhapur 69,150-00
17_ Chanda 28,655-23
18. Greater Bombay 12,739-24
9. MYSORE
1. Mysore 7,913-33
2. Belgaum 6,632'26
3. North K.anara )2,516' 67
4. South Kanara 76-92
10. ORISSA
1. Mayurbhanj 1,450-00
2. Purl 511·76
3. Baudh-Kbondmals 440-00
4. Balasore 300'00
·x
State/District where more than 50 per cent increase among Buddhists has been
recorded
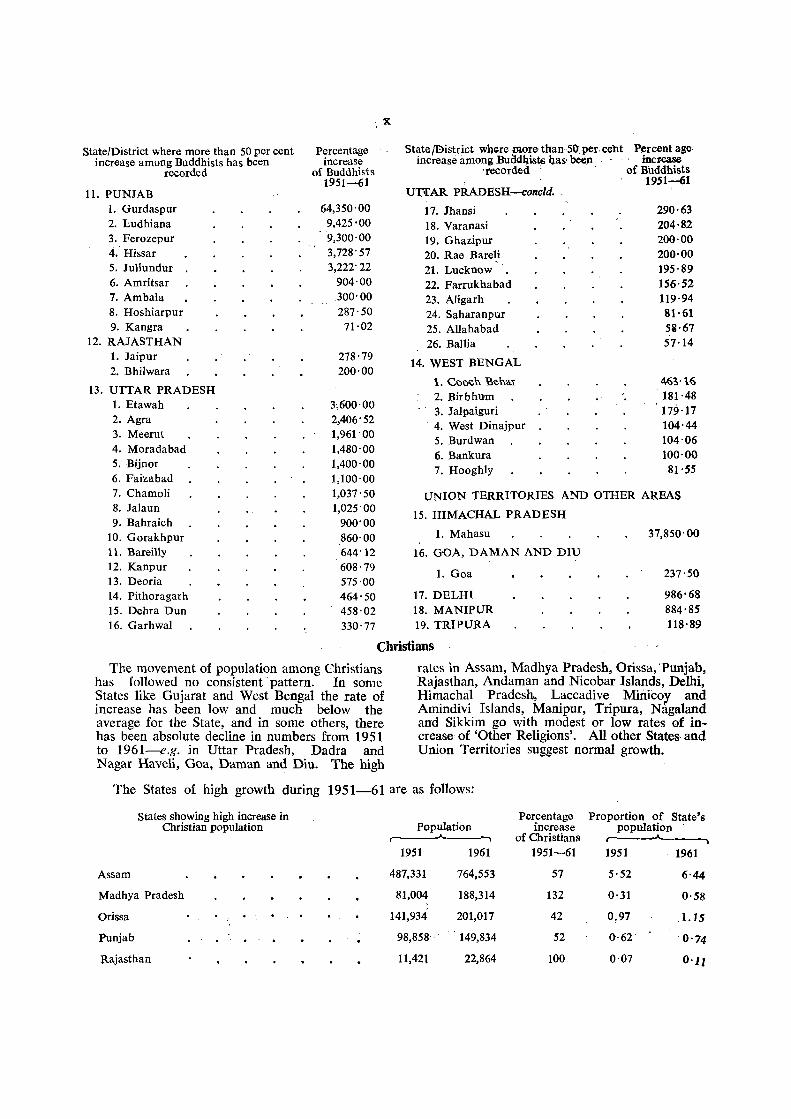
11. PUNJAB 1. Gurdaspur 2. Ludhiana 3. Ferozepur 4. Hissar 5. Jullundur 6. Amritsar 7. Ambala 8. Hoshiarpur 9. Kangra
12. RAJASTHAN 1. Jaipur 2. Bhilwara
13. UTTAR PRADESH 1. Etawah 2. Agra 3. Meerut 4. Moradabad 5. Bijnor 6. Faizabad 7. Chamoli 8. Jalaun 9. Bahraich
10. Gorakhpur 11. Bareilly 12. Kanpur 13. Deoria 14. Pithoragarh 15. Dehra Dun
Percentage increase
of Buddhists 1951-61
64,350'00 9,425'00 9,300'00 3,728' 57 3,222' 22
904·00 .300' 00 287·50
71·02
278'79 200·00
3;600,00 2,406'52 1,961'00 1,480'00 1,400'00 1,100'00 1,037' 50 1,025'00
900'00 860'00 644'12 608'79 575'00 464'50 458·02
State /Bistrict whe.re more than SO: per· cebt Percent age increase among Budd4ists Q.as· beep.. . .. increase
'recorded . of B'uddhists 1951-61
U'ITAR PRADESH-concld ..
17. Jhansi 290·63 18. Varanasi 204·82 19. Ghazipur 200·00 20. Rae BareJi 200·00
'.
21. Lucknow 195·89 22. Farrukhabad 156·52 23. Aligarh 119·94 24. Saharanpur 81·61 25. Allahabad 5&·67 26. Ballia 57·14
14. WEST BENGAL
\. Coocn "Ben?...: 463'1<;
2. Birbhum 181·48 3. Jalpaiguri 179·17 4. West Dinajpur 104·44 5. Burdwan 104·06 6. Bankura 100·00 7. Hooghly 81·55
UNION TERRITORIES AND OTHER AREAS
15. HIMACHAL PRADESH
1. Mahasu
16. GOA, DAMAN AND DIU
1. Goa
17. DELHI 18. MANIPUR
37,850'00
16. Garhwal 330'77 19. TRIPURA
237'50
986'68 884·85 118·89
Christians
The movement of population among Christians has followed no consistent' pattern. In some States like Gujarat and West Bengal the rate of increase has been low and much below the average for the State, and in some others, there has been absolute decline in numbers from 1951 to 1961-----f.g. in Uttar Pradesh, Dadra and Nagar Haveli, Goa, Daman and Diu. The high
rates in Assam, Madhya Pradesh, Orissa, 'Punjab, Rajasthan, Andaman and Nicobar Islands, Delhi, Himachal Pradesh, Laccadive MiniCoy and Amindivi Islands, Manipur, Tripura, Nagaland and Sikkim go with modest or low rates of increase of 'Other Religions'. All other States' and Union Territories suggest normal growth.
The States of high growth during 1951-61 are as follows:
States showing high increase in Per~entage Proportion of State's Christian population Population Increase population .A._-., of Christians r---~
1951 1961 1951-61 1951 1961
Assam 487,331 764,553 57 5·52 6'44
Madhya Pradesh 81,004 188,314 132 0·31 0'58
Orissa 141,934 201,017 42 0,97 1.15 ..
Punjab . 98,858· . 149,834 52 0·62 '0'74
Rajasthan 11,421 22,864 100 0·07 0'11
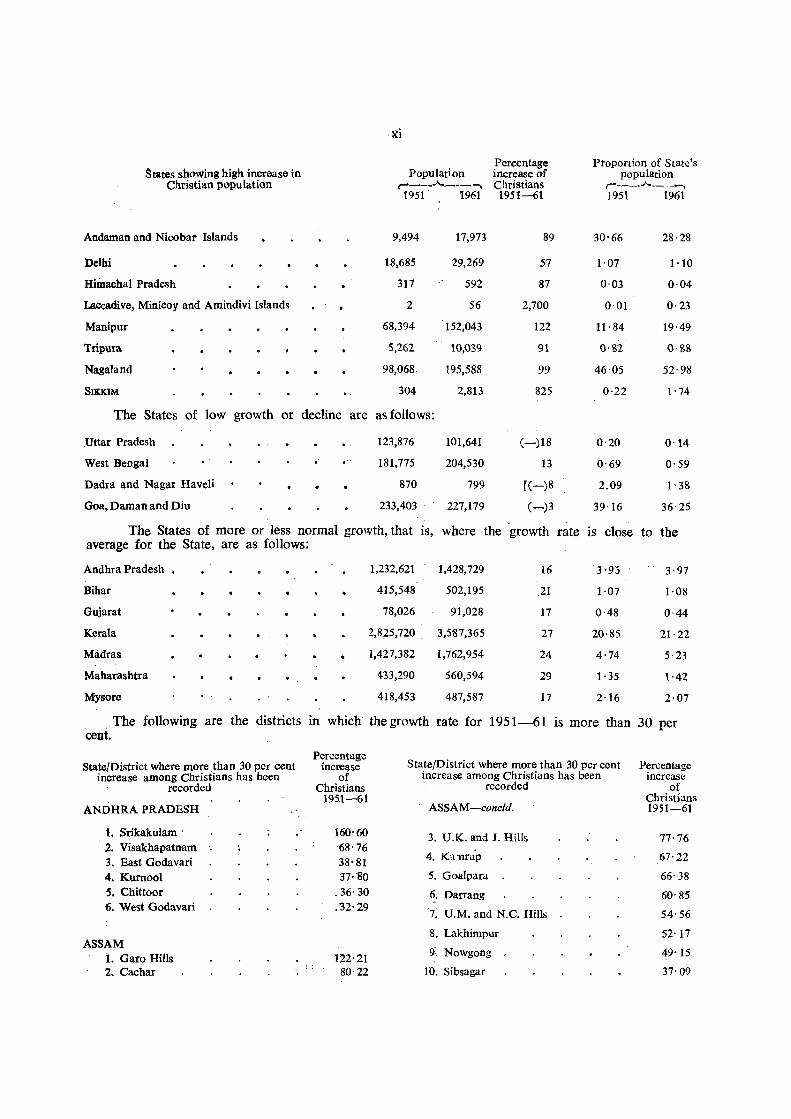
States showing high increase in Christian population
Andaman and Nicobar Islands
Delhi
Himachal Pradesh
Laccadive, Minicoy and Amindivi Islands
Manipur
Tripura
Nagaland
SIKKIM
The States of low growth or
Uttar Pradesh
West Bengal
Dadra and Nagar Haveli
Goa, Daman and Diu
decline are
..
)(i
Population r--_ ...... _-- ...... 1951 1961
9,494 17,973
18,685 29,269
317 592
2 56
68,394 152,043
5,262 1(),039
98,068 195,588
304 2,813
as follows:
123,876 101,641
181,775 204,530
870 799
233,403 ' 227,179
Percentage irtcrease of Christians 1951-61
89
57
87
2,700
122
91
99
825
(-)18
13
« -:-)8
(-)3
The States of more or less normal growth, that is, where the growth rate average for the State, are as follows:
Andhra Pradesh 1,232,621 1,428,729 16
Bihar . 415,548 502,195 ,21
Gujarat 78,026 91,028 17
Kerala 2,825,720 3,5"87,365 27
Madras 1,427,382 1,762,954 24
Maharashtra 433,290 560,594 29
Mysore 418,453 487,587 17
Proportion of State's population
r---"-----, 1951 1961
30'66 28·28
1·07 1·10
0'03 0·04
0'01 0·23
11·84 19·49
()'82 0·88
46·05 52·98
0·22 1'74
0'20 0'14
0'69 0·59
2.09 1'38
39·16 36·25
is close to the
'3,95 3·97
1·07 1·08
0-48 0·44
20·85 21·22
4'74 5·23
1·35 1'42
2·16 2·07
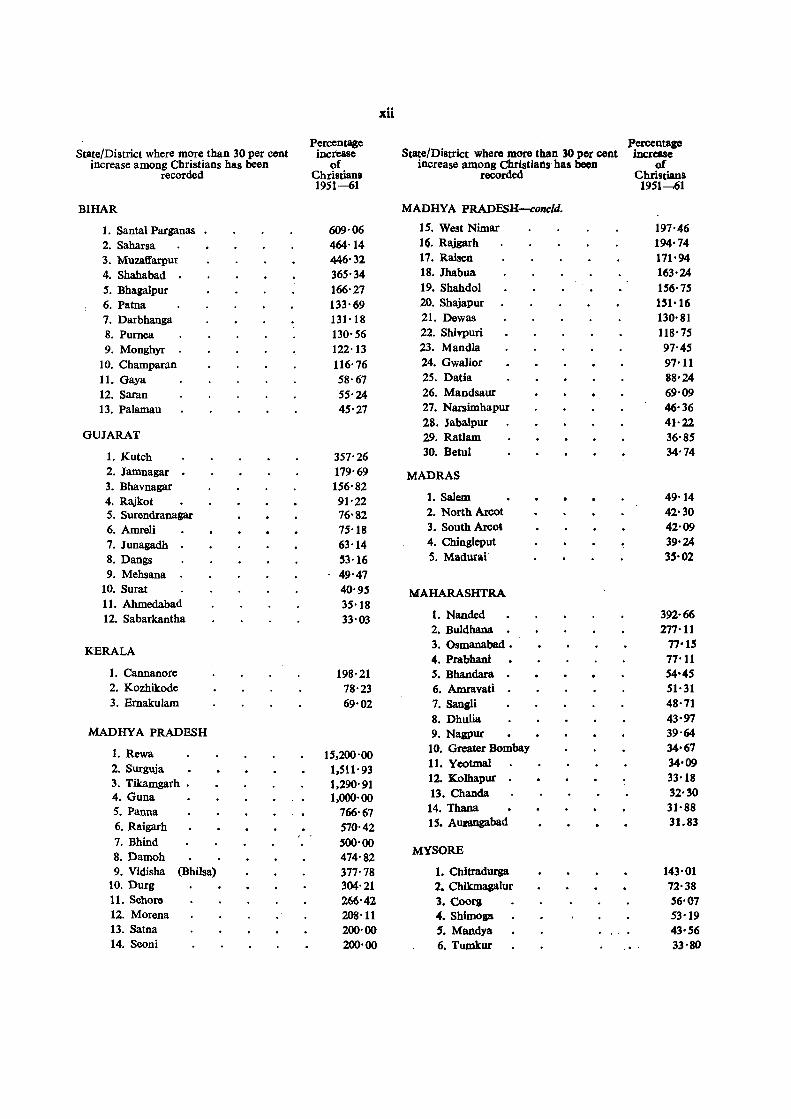
. The following are the districts in which the growth rate for 1951-61 is more than 30 per cent.
Percentage StatejDistrict where more than 30 per cent Percentage StatejDistrict where more ,than 30 per cent inc1'C1;lse
increase among Christians has been of increase among Christians has been increase recorded Christians recorded of
1951-61 Christians ANDHRA PRADESH ASSAM-cone/d. 1951-61
1. Srikakulam ' 160'60 3. U.K. and J. Hills 77-76 2. Visakhapatnam 68'76
4. K'lun.ip 3. East Godavari 38'81 67'22
4. Kuroool 37·80 5. Goalpara 66'38
5. Chittoor .36'30 ~. Darraog 60'85 6. West Godavari .32'29
7. U.M. and N.C. Hills 54'56
8. Lakhimpur 52· 17 ASSAM
9~ Nowgong 49' 15 i. Garo Hills 122' 21 2. Cachar ' . 80·22 10. Sibsagar 37'09
.. xu
State/District where more than 30 per cent Percentage
State/District where more than 30 POt cent ~ercentage
increase mcrease increase among Christians has been of increase among Christians-has boon of
recorded Christiana recorded Christians 1951-61 1951---.61
BIHAR MADHYA PRADESH-conc/d.
1. Santal Parganas 609·06 15. West Nimar 197·46
2. Saharsa 464·14 16. Rajgarh 194·74
3. Muzaffarpur 446·32 17. Raisen 171'94
4. Shahabad 365·34 18. Jhabua 163·24
5. Bhagalpur 166·27 19. Shahdol 156'75 6. Patna 133·69 20. Shajapur UI'16 7. Darbhanga 131·18 21. Dewas 130'81
8. Purnea 130'56 22. Shivpuri 118'75 9. Monghyr 122'13 23. Mandla 97'45
10. Champaran 116'76 24. Gwalior 97'11 11. Gaya 58·67 25. Datia 88'24 12. Saran 55'24 26. Mandsaur 69'09 13. Palamau 45'27 27. Narsimhapur 46·36
28. Jabalpur 41-22 GUJARAT 29. Ratlam 36'85
1. Kutch 357'26 30. Betul 34'74
2. Jamnagar 179'69 MADRAS 3. Bhavnagar 156'82 4. Rajkot 91'22 1. Salem 49·14
5. Surendranagar 76'82 2. North Arcot 42·30
6. Amreli 75'18 3. South A.rcot 42'09
7. Junagadh 63'14 4. Chingleput 39'24
8. Dangs ~3'16 5. Madurai 35-02
9. Mehsana 49'47 10. Surat 40'95 MAHARASHTRA 11. Ahmedabad 35'18 12. Sabarkantha 33·03 l. Nanded 392-66
2. Buldhana 277'11
KERALA 3_ Osmanabad. 77'15 4. Prabhani 77'11
1. Cannanore 198'21 5. Bhandara . 54'45 2. Kozhikode 78·23 6. Amravati 51'31 3. Ernakulam 69'02 7. Sangli 48·71
8. Dhulia 43'97 MADHYA PRADESH 9. Nagpur 39·64
1. Rewa 15,200'00 10. Greater Bombay 34'67
2. Surguja 1.511' 93 11. Yeotmal ]4'09
3. Tikamgarh • 1,290·91 12. Kolhapur 33'18
4. Guna 1,000'00 13. Chanda 32'30
5. Panna 766-67 14. Thana 31'88
6. Raigarh 570'42 15. Aurangabad 31.83
7. Bhind 500·00 8. Damoh 474·82
MYSORE
9. Vidisha (Bhilsa) 377'78 1. Cbitradurga 143'01 10. Durg 304'21 2. Chikmagalur 72'38 11. Sehore 266'42 3. Coorg 56'07 12. Morena 208'11 4. Shimoaa 53'19 13. Satna 200'00 S. Mandya 43'56 14. Seoni 200'00 6. Tumkur 33'80

State/District where more than 30 per cent , increase among Christians has been
recorded
ORISSA
1. Keonjhar 2. Mayurbhanj 3. Puri 4. Baudh-Khondmals 5. Sundargarh • 6. Ganjam 7. Kalahandi 8. Sambalpur 9. Koraput
PUNJAB
1. Mahendragarh 2. Kamal 3. Rohtak 4. Amritsar 5. Ludhiana 6. Kangra 7. Patiala 8. Hoshiarpur . 9. Ferozepur
10. HJssar 11. Jullundur 12. Ambala
RAJASTHAN
1. Ihunjhunu 2. Jalsalmer 3. Nagaur 4. Bhllwara 5. Sikar 6. Ganganapr 7. Dungarpur • 8. Bharatpur 9. Sawal Madhopur
10. Bundl 11. Sirohi 12. Jodhpur
,/
13. Banswara 14. Alwar 15. Jalpur 16. Pall 17. Ajmer 18. Bibner 19. Jhalawar 20. Churu 21. Kota
.
P.rcentago increase of
Christians 1951-61
227'35 187' 13 48·37 47·18 45'79 44'80 41'59 30'97 30'72
480'00 328·22 132'03 128'69 120'02 110'61 89'47 78'97 78'61 67'82 46'31 30'05
12,900·00 2,200'00 1,588' 89 1,067'74
625'00 575'68 528'51 440'00 331'44 318'75 227'13 163'20 108'20 96'30 89'53 88'30 71'52 64'84 46'34 43'28 39'31
xiii
State/District wher. more than 30 per cent Percentage increase among Christians has been increase of
recorded, Christians 1951-61
UTI AR PRADESH
1. Chamoli 1,900'00 2. Bara Banki . 393'48 3. Jaunpur 221·21 4. Sultanpur 192'63 5. Unnao 153'09 6. Sitapur 83·09 7. Mirzapur 82'33 8. Azamgarh 80'26 9. Varanasi 71'41
10. Gonda 68'39 11. Naini Tal 62'69 12. Pilibhit 48'93 13. Bilhraich 46'99 14. Hamirpur 42'62 15. Shahjahanpur 34'73 16. Gorakhpur 31'61 17. Hardoi 30'34
WEST BENGAL
1. Cooch Behar 165'12 2. Birbhum 162'97 3. West Dinajpur 161'34 4. Maida 145'78 5. Hooghly 107'481 6. Jalpaiguri 90'61 7. Nadia 84'20 8. Bankura 67'07 9. Darjeeling 66'31
UNION TERRITORIES AND OTHER AREAS
H MACHAL PRADESH
1. Sirmur 1.063'16 2. Bilaspur 600'00 3. Mahasu 138'82
NAG ALAND
1. Tuensang 882·26 2. Mokokchung 118'87
LACCADIVE, MINICOY AND AMINDIVI ISLANDS 2,700'00
SIKKIM 825'33 MANIPUR 122'30 TRIPURA 90'78 ANDAMAN AND NICOBAR
ISLANDS 89'31 DELHI 56'64
xiv
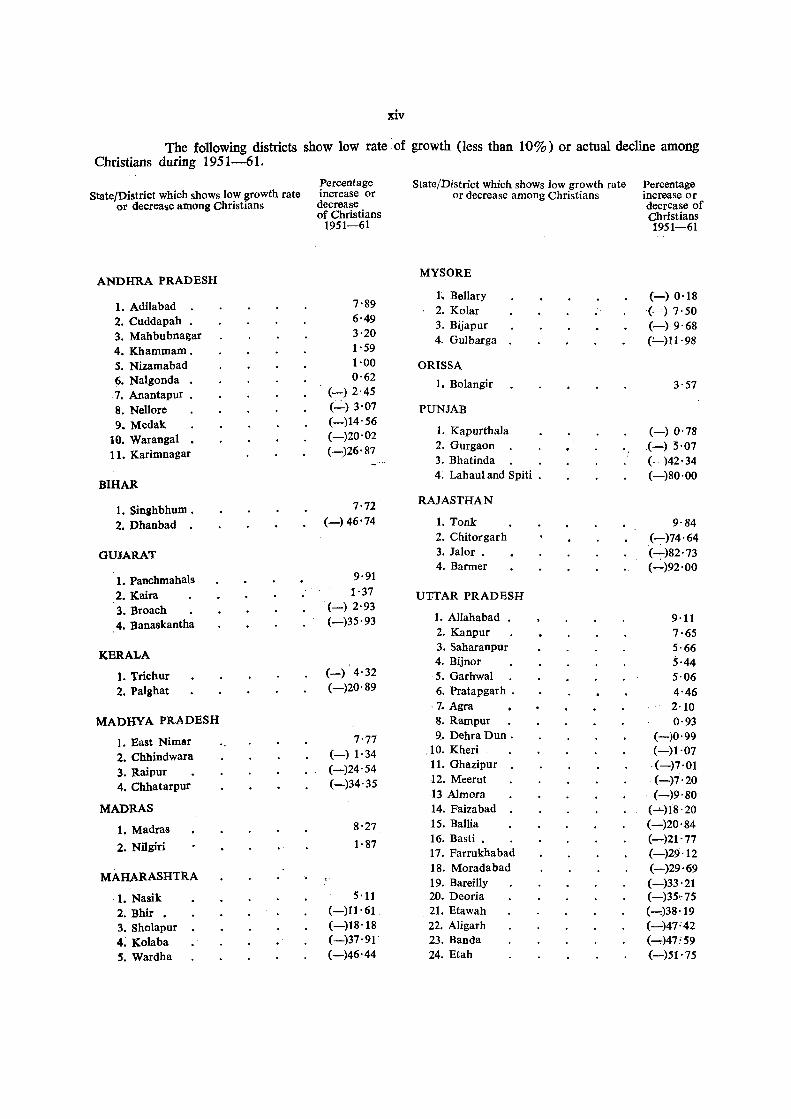
The following districts show low rate of growth (less than 10%) or actual decline among Christians during 1951-61.
State/District which shows low growth rate or decrease among Christians
ANDHRA PRADESH
1. Adilabad 2. Cuddapah 3. Mahbubnagar 4. Khammam. S. Nizamabad 6. Nalgonda • 7. Anantapur . 8. Nellore 9. Medak
10. Warangal 11. Karimnagar
BIHAR
1. Singhbhum . 2. Dhanbad
GUJARA!J'
1. Panchmahals 2. Kaira 3. Broach
.4. Banaskantha
KERALA
1. Trichur 2. Palghat
MADHYA PRADESH
1. East Nimllr 2. Chhindwara 3. Raipur 4. Chhatarpur
MADRAS
1. Madras
2. Nilgiri
MAH.ARASHTRA
·1. Nasik 2. Bhir • 3. Sholapur 4~ Kolaba S. Wardha
Percentage increase or decrease of Christians
1951-61
7'89 6'49 3·20 1'59 1'00 0·62
. (~) 2·45
(-) 3'07 (-)14'56 (-)20·02 (-:)26'87
7'72 (-) 46'74
9·91 1·37
(-) 2'93 (-)35·93
(-) 4·32 (-)20·89
7'77 (-) 1·34 (-)24'54 (-)34·35
8'27
1·87
5'11 (-)11'61 (-)18'18 (-)37'91 (-)46'44
State/District which shows low growth rate or decrease among Christians
MYSORE
1~ Bellary 2. Kolar 3. Bijapur 4. Gulbarga
ORISSA
1. Bolangir
PUNJAB
1. Kapurthala 2. Gurgaon 3. Bhatinda 4: Labaul and Spiti .
RAJASTHAN
1. Tonk 2. Chitorgarh 3. Jalor . 4. Barmer
U11TAR PRADESH
1. Allahabad . 2. Kanpur 3. Saharan pur 4. Bijnor 5. Garhwal 6. Pratapgarh .
·7. Agra S. Rampur 9. Dehra Dun.
.10. Kheri 11. Ghazipur 12. Meerut 13 Almora 14. Faizabad 15. Ballia 16. Basti • 17. Farrukhabad IS. Moradabad 19. Bareilly 20. Deoria 21. Etawah 22. Aligarh 23. Banda 24. Etah
Percentage increase or decrease of Christians 1951-61
(-) 0·18 (_:.) 7·50 (-) 9·68 (1-)11'98
3'57
(-) 0·78 (-) 5·07 (-)42·34 (-)80·00
9'84 (~)74·64
(~)82'73
(-)92'00
9'11 7'65 5'66 5·44 5'06 4'46 2·10 0·93
(-)0'99 (-)1'07 ·(-)7'01 (-)7'20 (-)9'80
(-'-)IS' 20 (-)20'84 (-)21'77 (-)29·12 (-)29'69 (-)33'21 (-)35"75 (.....,)3S·19 (-)47'42 ( ...... )47:59 (-)51'75
xv
State/District which shows Percentage StatefDistrict which shows Percentage low growth rate or decrease increase or low growth rate or decrease increase or
among Christians decrease of among Christians decrease of Christians Christians ~951-61 1951-61
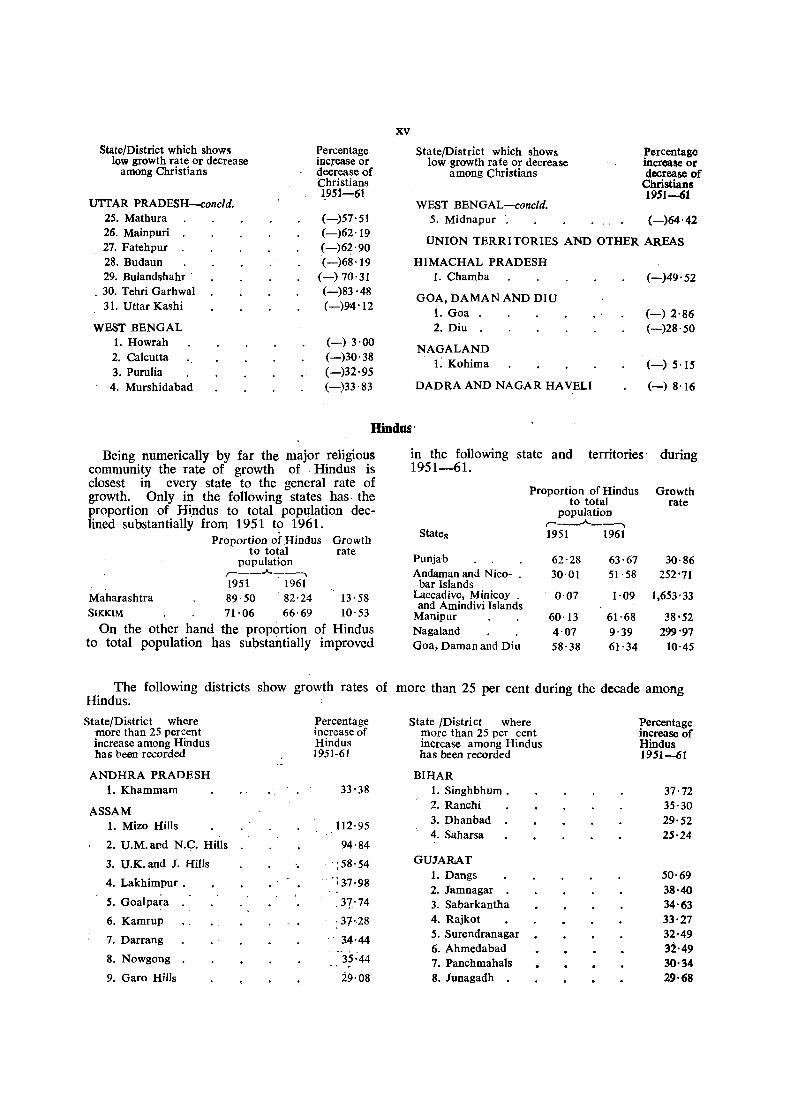
UTTAR PRADESH-concld. WEST BENGAL-concld. 25. Mathura (-)57'51 5. Midnapur (-)64'42 26. Mainpuri (-)62'19
UNION TERRITORIES AND OTHER AREAS 27. Fatehpur (-)62'90 28. Budaun (-)68'19 HIMACHAL PRADESH 29. Bulands,hahr ' (-) 70'31 1. Chamba (-)49'52
_,30. Tehri Garhwal (-)83 ·48 GOA, DAMAN AND DIU
31. Uttar Kashi (-)94'12 1. Goa (-) 2'86
WEST BENGAL 2. Diu (-)28'50 1. Howrah (-) 3·00
NAGALAND 2. Calcutta (-)30'38
1: Kohima (-) 5·15 3. Purulia (-)32'95 4. Murshidabad (-)33'83 DADRA AND NAGAR HA VELI (-) 8'16
Hindus'
Being numerically by far the major religious community the rate of growth of, Hindus is closest in every state to the general rate of growth. Only in the following states has, the proportion of Hindus to total population declined substantially from 1951 t? 1961.
Proportion of Hindus Growth to total rate
population r---...... -~ 1951 ' 1961
Maharashtra 89·50 82·24 13,58 SIKKIM 71·06 66,69 10·53
On the other hand the proportion of Hindus to total population has substantially improved
in the following state and territories' 1951-61.
Proportion of Hindus to total
population r--_ ...... _-...,
States 1951 1961
Punjab 62·28 63·67 Andaman and Nico- 30,01 51,58
bar Islands Laccadive, Minicoy . 0·07 1·09 and Amindivi Islands
Manipur 60,13 61·68 Nagaland 4·07 9·39 Goa, Daman and Diu 58'38 61·34
during
Growth rate
30·86 252'71
1,653'33
38·52 299'97
10'45
The following districts show growth rates of more than 25 per cent during the decade among Hindus.
State/District where Percentage S ta te /Distri ct where Percentage more than 25 percent increase of more than 25 per cent increase of increase among Hindus Hindus increase among Hindus Hindus has been recorded 1951-61 has been recorded J951-{il
ANDHRA PRADESH BIHAR 1. Khammam ., 33·38 1. Singhbhum • 37'72
ASSAM 2. Ranchi 35·30
1. Mizo Hills 112· 95 3. Dhanbad 29'52 4. Saharsa 25'24
2. U.M.and N.C. Hills 94'84
3. U.K. and J. Hills ' ;58'54 GUJAlM.T
'\37'98 1. Dangs 50'69
4. Lakhimpur . 2. Jamnagar 38·40
s. Goalpara 37: 74 3. Sabarkantha 34'63 6. Kamrup ,37',28 4. Rajkot 33'27
7. Darrang " 14'44 5. Surendranagar 32·49 6. Ahmedabad 32'49
8. Nowgong 35'44 7. Panchmahals 30'34 9. Garo Hills i9'08 8. Junagadh 29·68

xvi
State/District where Percentage Sta te/District where Pcrcentage more than 25 percent increase of !llorc than 25 per. cent increase of increase among Hindus Hindus Increase among Hindus Hindus has been recorded 1951-1961 has been recorded 1951-61
GUJARA T -cone/d. PUNJAB
9. Banaskantha 29'21 1. Bhatinda 74'49
10. Kutch 27·90 2. Jullundur 54'19
11. Amreli 27'13 3. Hissar 43·94 12. Bhavnagar 26·86 4. Amritsar 43'92 13. Baroda 26·29 5. Gurdaspur . 42'59 6. Sangrur 39'70 KERALA 7. Kapurthala 34'53
1. Kottayam 40·37 8. Ferozepur 34'08 2. Alleppey 36'70 9. Karnal 32'88 3. Trivandrum. 34'43 10. PaHala 32'22 4. Quilon 29'50 11. Ambala 31'06 5. Trichur 28'34 12. Gurgaon 27'44
13. Rohtak 26'72 MAD SA PRADESH
1. Sehore 48'36 RAJASTHAN 2. Jhabua 33'89 3. Raisen 30'35 1. Ganganagar 57'61 4. West Nimar 29'95 2. Bikaner 34'99 5, Dewas 29'02 3. Banswara . 33'30 6. East Nimar 29'00 4. Dungarpur 32' 38 7. Ratlam 28'09 5. Jator 32'10 8. Dhar 28'06 6. Bar,mer 31'24 9. Bastar 27'76 7. Jodhpur 31'10
10. Panna 27'12 8. Churu 27'64 11. Shahdol 26'80 9. Kota . 26'19 12. Indore 25'54 10. Jaipur 25'12
MADRAS
1. Nilgiri 35'74 UTTAR PR'ADESH
2. Madras 27'11 1. Naini Tal 61'30 2. Rampur 28'13
MAHARASHTRA
1. Greater Bombay. 31'81 WEST BENGAl.
MYSORE 63'46 1. Cooch Behlll
1. Shimoga 53'93 2. Jalpaiguri 50' 53 2. Chikmagalur 42'06 3. 24-Parganas 46'04 3. Coorg 38'97 4. Nadia 45·61 4. North Kanara 33'20
5. kdwan 41'62 5. Chitradurga 25'47 6 •. J;looghly 39·56 6. Hassan 25'44
!'f •. l)arjeeling 35'19 7. Mandya 25'13 ."~Birbbum 34'75
. 9: Murshidabad 31'92 ORISSA 10. Midnapur 29·94
1. Sundergarh 34'96 11. lWlkura 29'66 2. Balasore 28'29 J~. West Dinajpur 26'79 ~. Keonjhar . 26'04 ,1'. Howrah 26'30
State/District where more than 25 per cent increase among
Hindus has been recorded
Percentage increase of
Hindus 1951-61
UNION TERRITORIES AND OTHER AREAS
NAG ALAND
1. Kohima
2. Mokokchung
LACCADIVE, MINICOY AMINDIVI ISLANDS
AND
363'89
92'83
1,653' 33
State/District where more than 25 per cent increase among Hindus has been recorded
ANDAMAN AND NICOBAR ISLANDS
TRIPURA
DELHI
DADR,A AND NAGAR HAVELI •
MANIPUR .
Percentage increase of
Hindus 1951-61
252'71
80'58
52·24
39·72
38'52
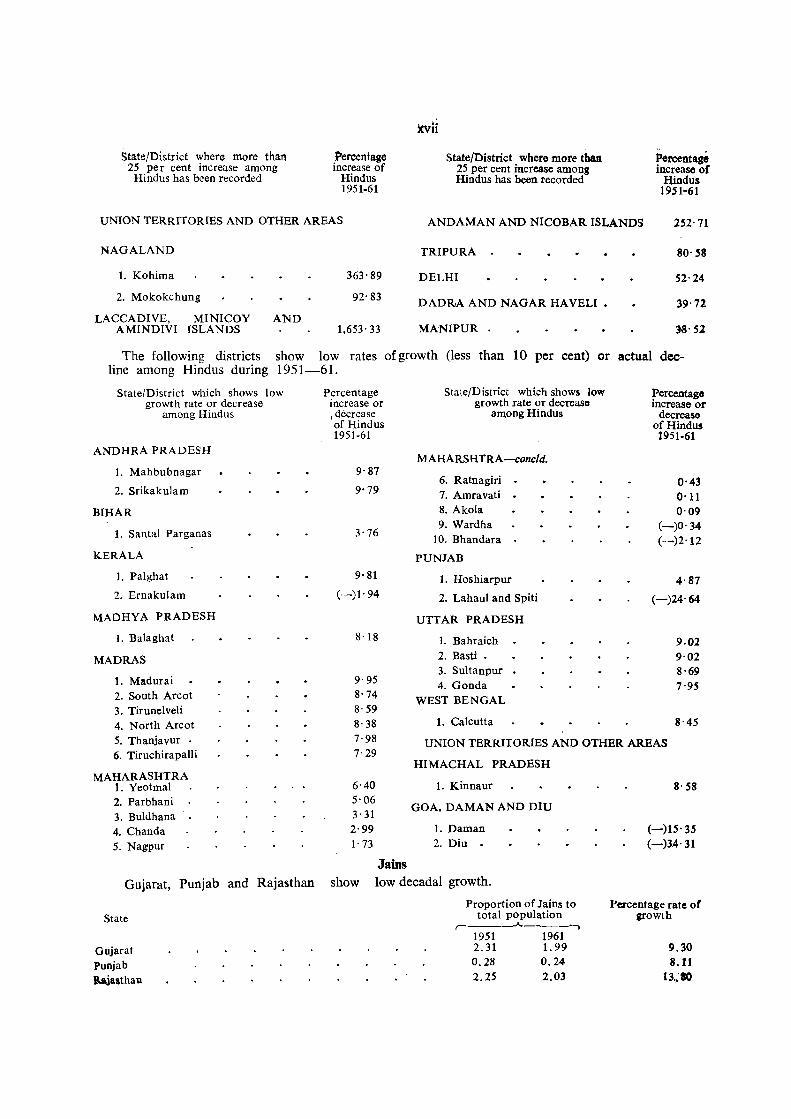
The following districts show low rates of growth (less than 10 per cent) or actual decline among Hindus during 1951-61.
State/District which shows low growth rate or decrease
among Hindus
ANDHRA PRADESH
1. Mahbubnagar
2. Srikakulam
BIHAR
1. Santal Parganas
KERALA
1. Palgbat
2. Ernakulam
MADHYA PRADESH
1. Balagbat
MADRAS
1. Madurai 2. South Arcot 3. Tirunelveli 4. North Arcot 5. Thanjavur . 6. Tiruchirapalli
MAHARASHTRA 1. Yeotmal 2. Parbhani 3. Buldhana 4. Chanda 5. Nagpur
Percentage increase or , decrease of Hindus 1951-61
9'87
9'79
3'76
9'81
(-)1' 94
8'18
9'95 8'74 8·59 8'38 7'98 7'29
6'40 5'06 3·31 2·99 l' 73
.Jams
State/D istrict which shows low ?ercentago growth rate or decrease Increase or
among Hindus decrease of Hindus 1951-61
MAHARSHTRA-concld.
6. Ratnagiri 0'43 7. Amravati 0'11 8. Akola 0'09 9. Wardha (-)0' 3'4
10. Bhandara (--)2'12 PUNJAB
1. Hoshiarpur 4·87 2. Lahaul and Spiti (-)24'64
UTTAR PRADESH
1. Bahraich 9.02 2. Basti - 9'02 3. Sultan pur 8'69 4. Gonda 7'95
WEST BENGAL
1. Calcutta 8'45
UNION TERRITORIES AND OTHER AREAS
HIMACHAL PRADESH
1. Kinnaur
GOA, DAMAN AND DIU
1. Daman 2. Diu •
8'58
(-)15' 3S (-)34'31
Gujarat, Punjab and Rajasthan show low decadal growth.
State
Gujarat Punjab Rajasthan
Proportion of Jain5 to total population
,-------"---_......, 1951 1961 2.31 1.99 0.28 0.24 2.25 2.03
l'ercentage rate of growth
9.30 8.U
13,,:10
. • ~ i j(VUl
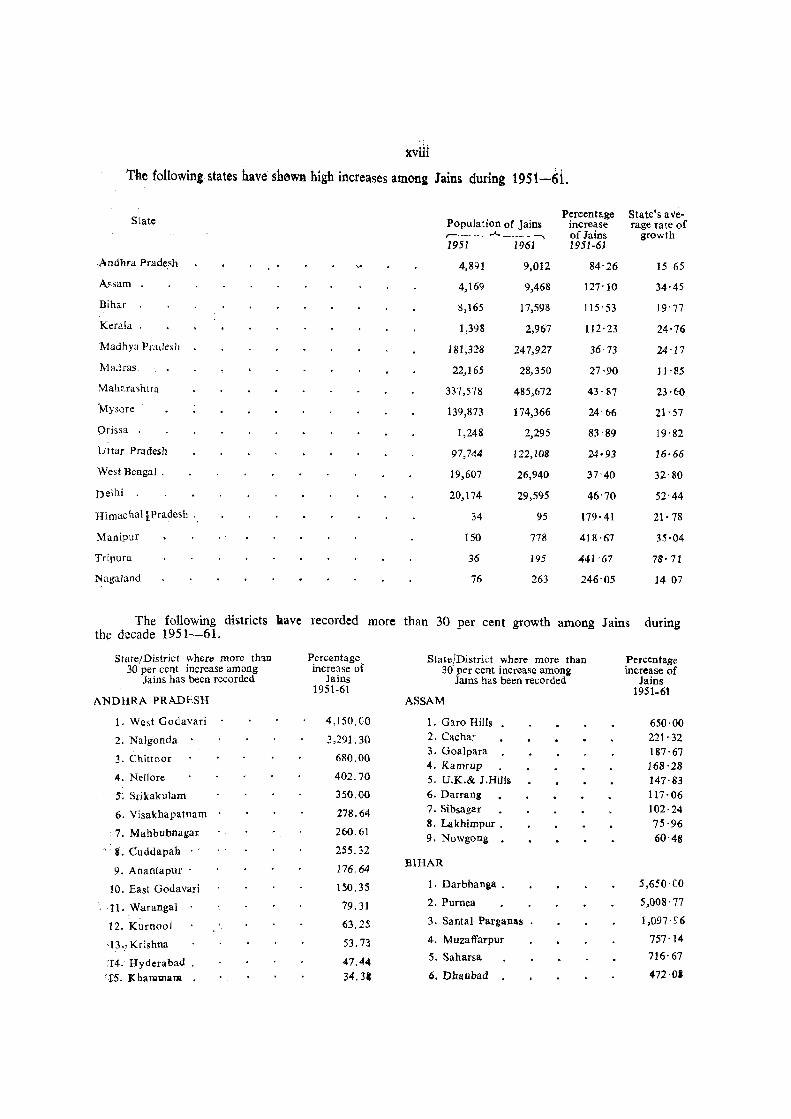
The following, states have Sb0WB high increases among Jains during 1951-6i.
Percentage State's ave-State Population of Jains increase rage rate of
,----~----, of Jains growth 1951 19(j1 1951-(jJ
Andhra Prade,sh 4,891 9,012 84'26 15 65
Assam 4,169 9,468 127 '10 34'45
Bihar 8,165 17,598 115'53 19'77
Keraia 1,398 2,967 112'23 24'76
MadhYil Pradesh 181,328 247,927 36· 73 24 '17
Madras 22,165 28,350 27·90 ] 1·85
MahQra~htra 337,578 485,672 43'87 23·60
Mysore 139,873 174,366 24'66 21'57
Orissa 1,248 2,295 83'89 19'82
Uttar Pradesh 97,744 122,108 24·93 1(j·66
West Bengal. 19,607 26,940 37'40 32'80
Delhi 20,174 29,595 46'70 52'44
Himachal [Pradesh. 34 95 179'41 21'78
Manipur 150 778 418·67 35·04
Tripura 36 195 441'67 78· 71
Nagaland 76 263 246'05 ]4 07
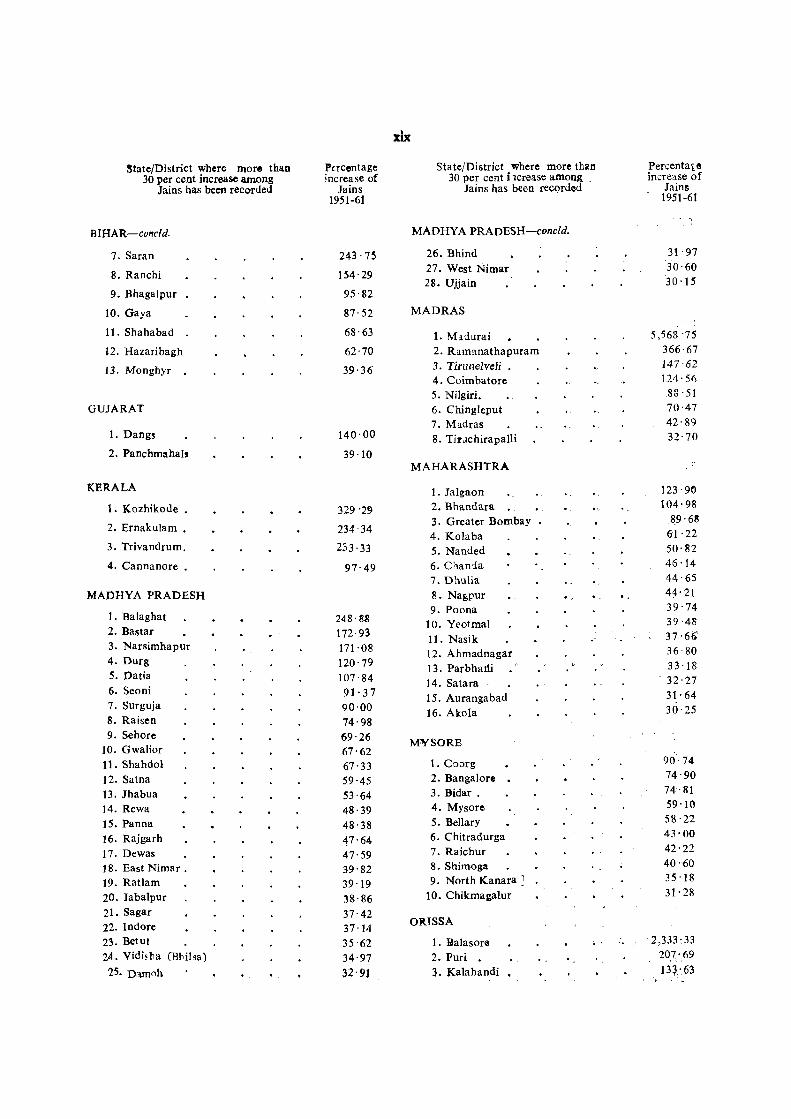
The following districts kaye recorded more than 30 per cent growth among Jains during the decade 1951-61.
State/District where more than Percentage State/District where more than Percentage 30 per cent increase among increase of 30 per cent increase among increase of
Jains has been recorded Jains Jams has been recorded Jains 1951-61 1951-61
ANDHRA PRADESH ASSAM
1. West Godavari 4,150.CO 1. Garo Hills 650·00
2. Nalgonda 3,291. 30 2. Cachar 221'32
680.00 3. Goalpara 187'67
3. Chittoor 4. Kamrup 168'28
4. Nellore 402.70 5. U.K.& J.HilIs 147'83 5; Srikakulam 350.00 6. Darrang 117'06
6. Visakhapatnam . 278.64 7. Sibsagar 102·24 8. Lakhimpur . 75·96
. : 7. Mahbubnagar 260.61 9. Nowgong 60'48
.~. S. Cuddapah . ' 255.32
9. Anantapur . 176.64 BIHAR
10. East Godavari 1 SO. 35 1. Darbhanga . 5,650 CO
11. Warangal 79.31 2. Purnea 5,008' 77
12. Kurnool 63.25 3. Santal Parganas 1,097'5'6
13., Krishna 53.73 4. Muzaffarpur 757'14
':14. Hyderabad 47.44 5. Saharsa 716'67
'T5. Khalllmalll 34.31 6. Dhanbad 472'01
xix
State/District where more than Percentage State/District where more than Percenta~e
30 per cent increase among increase of 30 per cent i 1crease among incrc:lse of Jains has been recorded Jains Jains has been recorded Jains
1951-61 1951-61
BIHAR-concld. MADHYA PRADESH-concld.
7. Saran 243'75 26. Bhind 31'97
8. Ranchi 154'29 27. West Nirnar 30·60
28. Ujjain '30 '15, 9. Bhagalpur 95·82
10. Gaya 87·52 MADRAS
11. Shahabad 68'63 1. Mldurai 5,568 '75
12. Hazaribagh 62'70 2. Ramanathapuram 366·67
13. Monghyr 39·36 3. Tirunelve}i . 147'62
4. Coimbatore 1.24' 56
5. Nilgiri. ,88' 51
GUJARAT 6. Chingleput 70'47
7. Madras 42'89 1. Dangs 140'00 8. TiNchirapaIli 32'70
2. Panchmahals 39·10 MAHARASHTRA
KJ:!RALA 1. JaJgaon 123'9(')
1. Kozhikode • 329'29 2. Bhandara 104,98
2. Ernakulam • 234'34 3. Greater Bombay • 89'68
4. Kolaba 61·22 3. Trivandrurn. 233'33 5. Nanded 50'82
4. Cannanore . 97'49 6. Crranda 46·14
7. Dhulia 44·65
MADHYA PRADESH 8. Nagpur .. 44'21
1. Balaghat 9. Poona 39'74
248'88 10. YeotmaJ 39·48 2. Bastar . 172·93 11. Nasik 37·61) 3. Narsimhapur 171 . 08 12. Ahmadnagar 36 80 4. DUrg 120'79 13. Parbharli 33 '18 5. Datia 107'84 . 32 ·27 14. Satara 6. Seoni 91· 3 7 31· 64 15. Aurangabad 7. Surguja 90'00 16. Akola 30'25 8. Raisen 74'98 9. Sehore 69·26
10. Gwalior M¥SORE
67'62 11. Shahdol 67'33 1. Coorg 90'74
12. Satna 59'45 2. Bangalore 74·90
13. Jhabua 53'64 3. Bidar . 14·81
]4. Rewa 48·39 4. Mysore 59'10
15. Panna 48'38 5. Bellary 58'22
16. Rajgarh 47'64 6. Chitradurga 43'00
17. Dewas 47,59 7. Raichur 42'22
18. EastNirnar. 39·82 8. Shimoga 40'60
19. Ratlam 39 ·19 9. North Kanara : 35,'18
20. Jabalpur 38'86 10. Chikmagalur 31·28
21. Sagar 37'42 22. Indore 37 ·14
OR.ISSA
23. Betut 35 '62 1. Balasore • <'. 2,333' 33
24. Vidj~ha (BJoi1sa) 34·97 2. Puri 207'69
25. o.lm<lh . . 32'91 3. Kalahandi 13~:.63 ",
xx
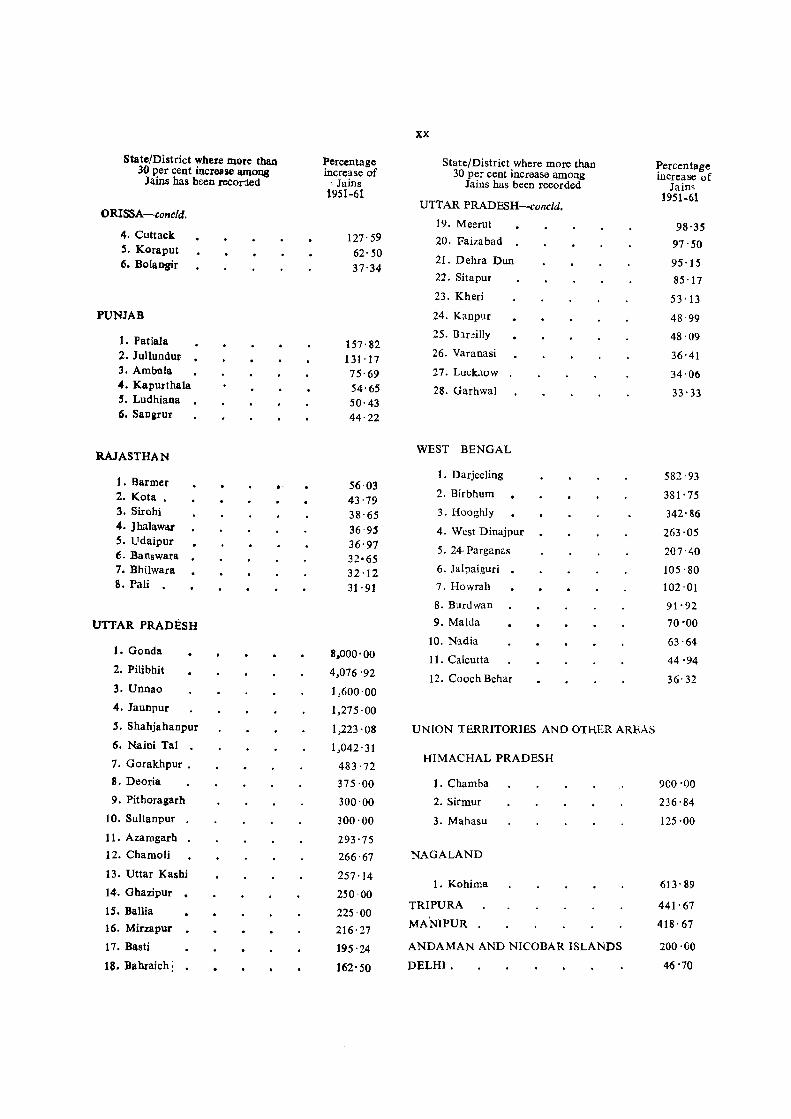
State/District where more than Percentage State/District where more than Percentage 30 per cent increase lUllong increase of 30 per cent increase among increase of Jains has been recOr:1ed \ Jains Jains has been recorded Jain> 1951-61 1951-61
UTTAR PRADESH-concld. ORISSA-cone/d.
19. Meerut 98'35 4. Cuttack 127' 59 20. Faizabad 97'50 S. Koraput 62'50
21. Dehra Dun 95 '15 6. Bolansir 37'34 22. Sitapur 85'17
23. Kheri 53 '13
PUNJAB 24. Kanpur 48·99
1. Patiala 157'82 25. Blrcilly 48'09
2. Jullundur 131'17 26. Varanasi 36'41
3. Ambala 75'69 27. Luckaow 34'06 4. Kapurthala 54'65 28. Garhwal 33'33 S. Ludhiana 50'43 6. Sangruf 44'22
RAJASTHAN WEST BENGAL
1. Darjeeling 582'93 1. Barmer ." 56'03 2. Birbhum 381'75 2. Kota • 43'79
3. Sirohi 38'65 3. Hooghly 342'86 4. Jhalawar 36'95 4. West Dinajpur 263·05 5. Udaipur 36'97 5. 24- Parganas 207'40 (;. Banswara 32'65 7. Bhilwara 32 '12 6. Jalpaiguri 105 -80 S. Pali 31' 91 7. Howrah 102'01
8. Burdwan 91'92
UTTAR PRADESH 9. Malda 70'00
10. Nadia 63·64 1. Gonda 8,000'00 11. Calcutta 44 '94 2. Pilibhit 4,076 '92 12. Coach Behar 36· 32 3. Unnao 1,600'00 4. Jaunpur 1,275 ·00
S. Shahjahanpur 1,223 '08 UNION TERRITORIES AND OTHER AREAS
6. Naini Tal 1,042' 31
7. Gorakhpur . 483·72 HIMACHAL PRADESH
8. Deoria 375·00 1. Chamba 9CO'OO 9. Pithoragarh 300 00 2. Sirmur 236'84
10. Sultanpuf 300'00 3. Mahasu 125'00
11. Azamgarh 293'75 12. Chamoli 266·67 NAG ALAND
13. Uttar Kashi 257'14 1. Kohima 613'89
14. Ghazipur . 250-00 TRIPURA 441'67 15. Ballia 225·00 MANIPUR 418·67 16. Mirzapur . 216·27
17. Basti 195 '24 ANDAMAN AND NICOBAR ISLANDS 200·CO
18. Bahraich! 162'50 DELH1. 4()'70
xxi
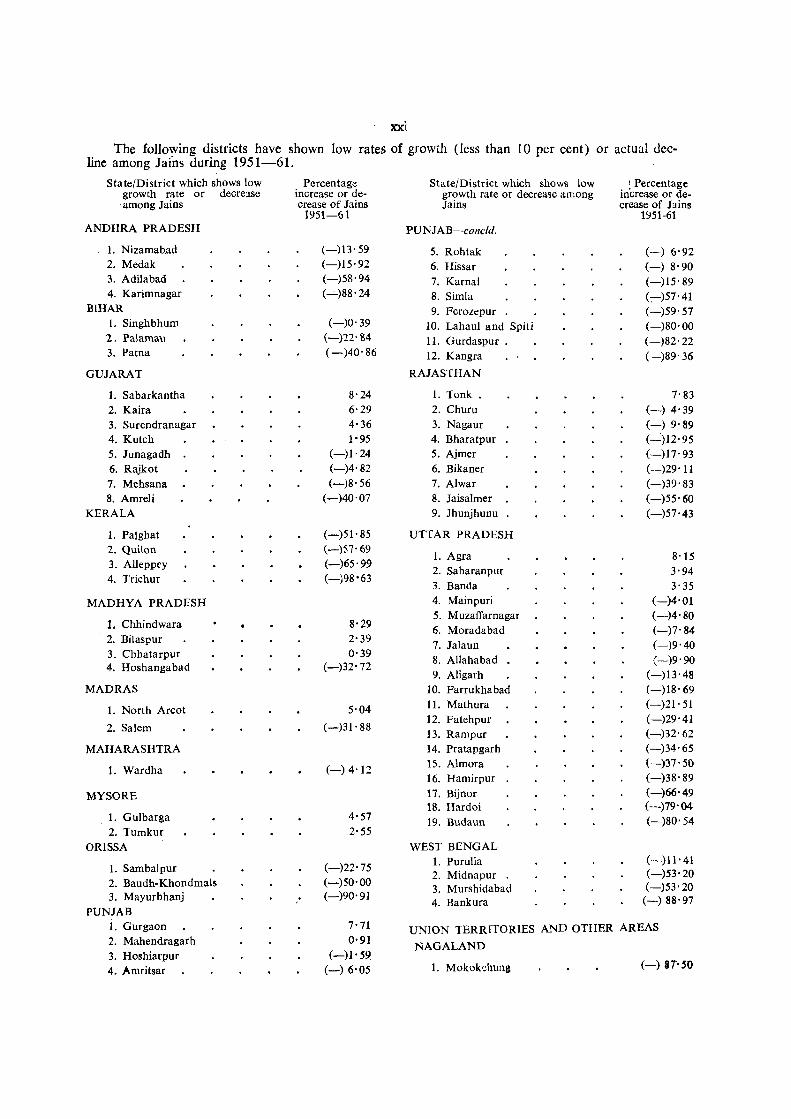
The following districts have shown low rates of growth (less than 10 per cent) or actual decline among Jains during 1951-61.
State/District which shows low Percentage State/District which shows low I Percentage growth rate or decrease increase or de- growth rate or decrea~e among increase or de-among Jains crease of Jains Jains crease of Jains
1951-61 1951-61 ANDHRA PRADESH PUNJAB-cancld.
1. Nizamab.ad (-)13' 59 5. Rohtak (-) 6'92 2. Medak (-)15'92 6. Hissar (-) 8' 90 3. Adilabad (-)58'94 7. Kamal (-)15' 89 4. Karimnagar (-'-)88' 24 8. Simla (:---)57'41
BIHAR 9. Ferozepur (-)59' 57 1. Singhbhum (-)0' 39 10. Lahaul and Spiti (-)80'00 2. Palamau (-)22'84 11. Gurdaspur . (-)82'22 3. Patna (-)40'86 12. Kangra (-)89' 36
GUJARAT RAJASTHAN
1. Sabarkantha 8'24 1. Tonk, 7'83 2. Kaira 6'29 2. Churu (-) 4'39 3. Surendranagar 4'36 3. Nagaur (-) 9'89 4. Kutch 1'95 4. Bharatpur (--':)12' 95 5. Junagadh (-)1'24 5. Ajmer (-)17'93 6. Rajkot (-)4'82 6. Bikaner (-)29'11 7. Mehsana (-)8' 56 7. Alwar (-)39' 83 8. Amreli (-)40'07 8. Jaisalmer (-)55'60
KERALA 9. Jhunjhunu (-}57'43
1. Pal ghat (-)51'85 UTTAR PRADESH 2. Quilon (-)57'69
1. Agra 8'15 3. Alleppcy (-)65'99
2. Saharanpur 3'94 4. Trichur (-)98'63
3. Banda 3'35
MADHYA PRADESH 4. Mainpuri (-)4'01
1. Chhindwara 8,29 5. Muzaffamagar (-)4'80 6. Moradabad (-)7' 84
2. Bilaspur 2'39 7. Jalaun (-)9' 40 3. Chhatarpur 0'39
8. Allahabad (-)9'90 4. Hoshangabad (-)32'72
9. Aligarh (-)13'48 MADRAS 10. Farrukhabad (-)18' 69
1. North Areot 5'04 11. Mathura (-)21' 51
2. Salem (-)31'88 12. Fatehpur (-)29'41 13. Rampur (-)32'62
MAHARASHTRA 14. Pratapgarh (-)34' 65
1. Wardha (-) 4'12 15. Almora (-)37'50 16. Hamirpur (-)38'89
MYSORE 17. Bijnor (-)66'49 18. Hardoi (-)79'04
1. Gulbarga 4'57 19. Budaun (-)80'54 2. Tumkur 2'55
ORISSA WEST BENGAL
1. Sambalpur (-)22'75 1. Purulia (-)11'41 2. Midnapur (-)53'20
2. Baudh-Khondmals (-)50'00 3. Murshidabad (-)53'20
3. Mayurbhanj (-)90'91 4. Bankura (-) 88'97
PUNJAB 1. Gurgaon 7'71 UNION TERRITORIES AND OTHER AREAS 2. Mahendragarh 0'91 NAGALAND 3. Hoshiarpur (-)1' 59
(-) 8T'50 4. Amritsar (-) 6'05 1. Mokokchung
xxii
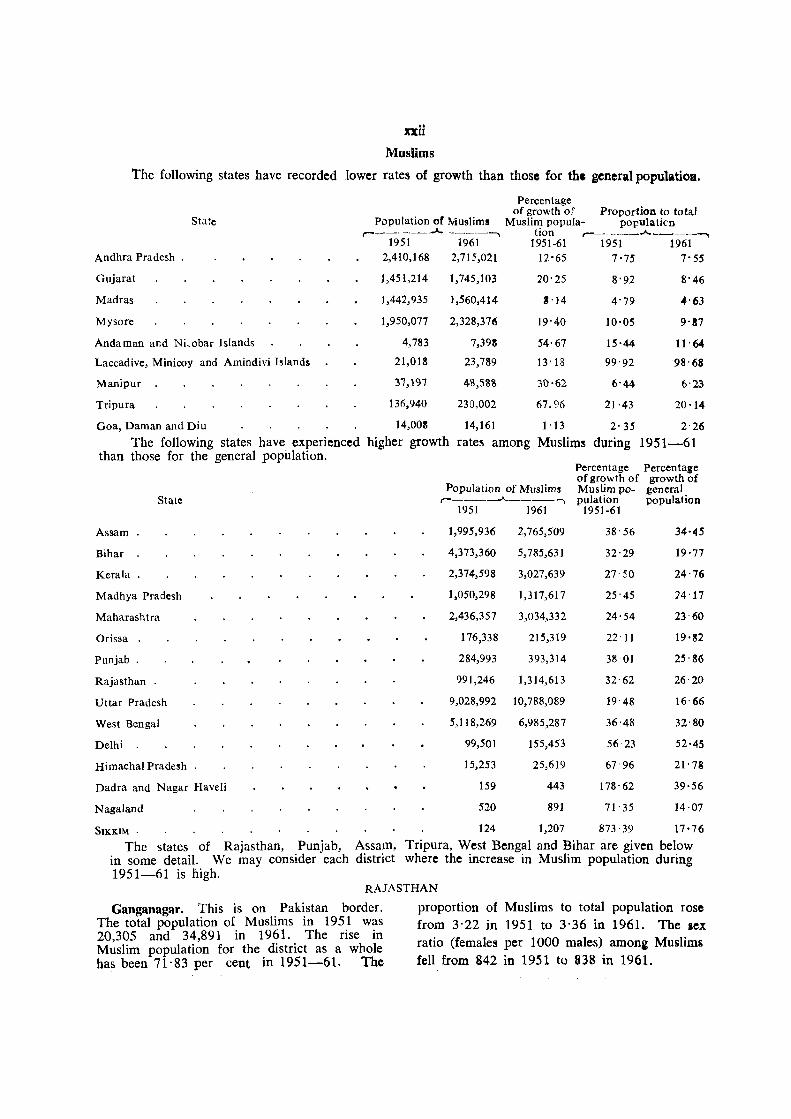
Muslims
The following states have recorded lower rates of growth than thoso for th. general populatioll.
Andhra Pradesh.
Gujarat
Madras
Mysore
State
Andaman and Ni,obar Islands
Laccadive, Minicoy and Amindivi Islands
Manipur
Tripura
Population of Muslims r-~------.A.-.----.,
1951 1961 2,410,168 2,715,021
1,451,214 1,745,103
1,442,935 1,560,414
1,950,077 2,328,376
4,783 7,393
21,018 23,789
37,197 4~,588
136,940 230,002
Percentage of growth of Proportion to total
Muslim popula- populaticn tion ,-____ .A. __ --__ --,
1951-61 1951 1961 11'65 7'75 7'55
20'25 8'92 8'46
3'14 4'79 -4'63
19'40 10'05 9'37
54'67 15'44 11'64
13'18 99'92 98'68
31),62 6'44 6'23
67.96 21·43 20'14
Goa, Daman and Diu 14,008 14,161 1'13 2· 35 2' 26
The following states have experienced higher growth rates among Muslims during 1951-61 than those for the general population.
State
Assam
Bihar
Kerala
Madhya Pradesh
Maharashtra
Orissa
Punjab
Rajasthan
Uttar Pradesh
West Bengal
Delhi .
Himachal Pradesh .
Dadra and Nagar Haveli
Nagaland
SIKKIM .
The states of Rajasthan, Punjab, Assam, in some detail. We may consider each district 1951-61 is high.
Percentage Percentage
Population of Muslims of growth of growth of Muslim po- general
r------"----- .. pulation population 1951 1961 1951-61
1,995,936 2,765,509 38'56 34'45
4,373,360 5,785,631 32'29 19'77
2,374,598 3,027,639 27' 50 24·76
1,050,298 1,317,617 25'45 24'17
2,436,357 3,034,332 24'54 23'60
176,338 215,319 22'11 19'82
284,993 393,314 38-01 25'86
991,246 1,314,613 32'62 26'20
9,028,992 10,788,089 19'48 16·66
5,118,269 6,985,287 36'48 32·80
99,501 155,453 56 23 52'45
15,253 25,619 67'96 21' 73
159 443 178'62 39·56
520 891 71- 35 14·07
124 1,207 873·39 17'76
Tripura, West Bengal and Bihar are given below where the increase in Muslim population during
RAJASTHAN
Ganganagar. This is on Pakistan border. The total population of Muslims in 1951 was 20,305 and 34,891 in 1961. The rise in Muslim population for the district as a whole has been 71'83 per cent in 1951-61. The
proportion of Muslims to total popUlation rose from 3-22 in 1951 to 3-36 in 1961. The sex ratio (females per 1000 males) amon, Muslims fell from 842 in 1951 to 838 in 1961.
kxHi
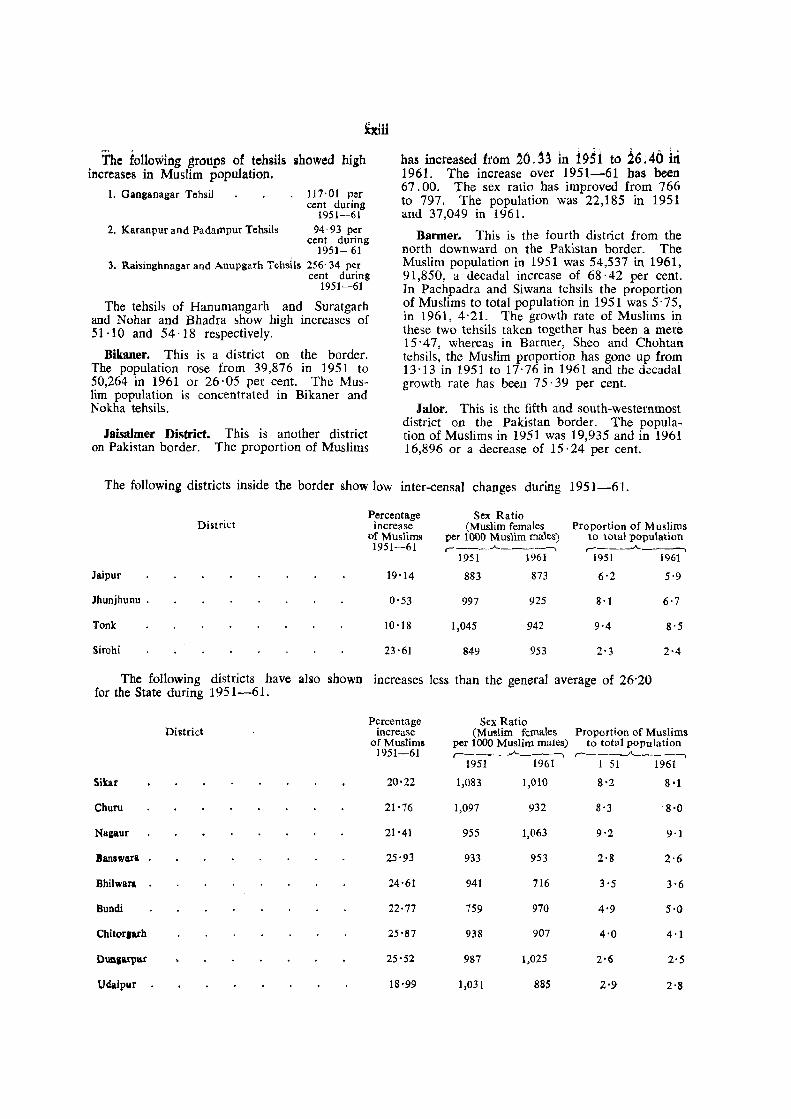
The folloWing groups of tchsils showed high increases in Muslim population,
1. Ganganagar Tehsil
2. Karanpur and Padampur Tehsils
117,01 per cent during
1951-61 94'93 per
cent during 1951-61
3. Raisinghnagar and Anupgarh 'I'ehshs 256' 34 per cent during
1951-61
The tehsils of Hanumangarh and Suratgarh and Nohar and Bhadra show high increases of 51·10 and 54·18 respectively.
Bikaner. This is a district on the border. The popUlation rose from 39,876 in 1951 to 50,264 in 1961 or 26·05 per cent. The Muslim population is concentrated in Bikaner and Nokha tehsils,
Jaisalmer District. This is another district on Pakistan border. The proportion of Muslims
has incteased from ~O,13 in i9~i to i6AO iti 1961. The increase over 1951-61 has been 67.00, The sex ratio has improved from 766 to 797. The population was 22,185 in 1951 and 37,049 in 1961.
Barmer. This is the fourth district from the north downward on the Pakistan border. The Muslim popUlation in 1951 was 54,537 in 1961, 91,850, a decadal increase of 68 ·42 per cent. In Pachpadra and Siwana tehsils the proportion of Muslims to total population in 1951 was 5'75, in 1961, 4'21. The growth rate of Muslims in these two tehsils taken together has been a mere 15'47, whereas in Barmer, Sheo and Chohtan tchsils, the Muslim proportion has gone up from 13'13 in 1951 to 17'76 in 1961 and the decadal growth rate has been 75·39 per cent.
Jalor, This is the fifth and south-westernmost district on the Pakistan border. The population of Muslims in 1951 was 19,935 and in 1961 16,896 or a decrease of 15·24 per cent.
The following districts inside the border show low inter-censal changes during 1951-61.
P,ercentage Sex Ratio District Increase (Muslim females Proportion of Muslims
of Muslims per 1000 Muslim males) to total -population 1951-61 r---.A..----., r--__,A.------.
1951 1961 1951 1961
JaiPUf 19'14 883 873 6·2 5-9
JhunjhuDu . 0'53 997 925 8 'I 6'7
Tonk: 10'18 1,045 942 9'4 8'5
Sirohi 23'61 849 953 2'3 2'4
The following districts have also shown increases less than the general average of 26'20 for the State during 1951-61.
Percentage Sex Ratio District increase (Muslim females Proportion of Muslims
of Muslims per 1000 Muslim males) to total population 1951-61 r---__ ..A-__ '_~ r-----.)\..._---,
1951 1961 1 51 1961
Sikar 20'22 1,083 1,010 8'2 8'1
Churu 21'76 1,097 932 8'3 8'0
Napur 21'41 955 1,063 9'2 9·1
Banswar& 25'93 933 953 2'8 2·6
Bhilwara 24'61 941 716 3'5 3'6
Bundi 22,77 759 970 4'9 5'0
Chitor.arh 25'87 938 907 4'0 4 '1
Dunlarpur 25'52 987 1,025 2'6 2'5
Udaipur 18'99 1,031 885 2'9 2'8
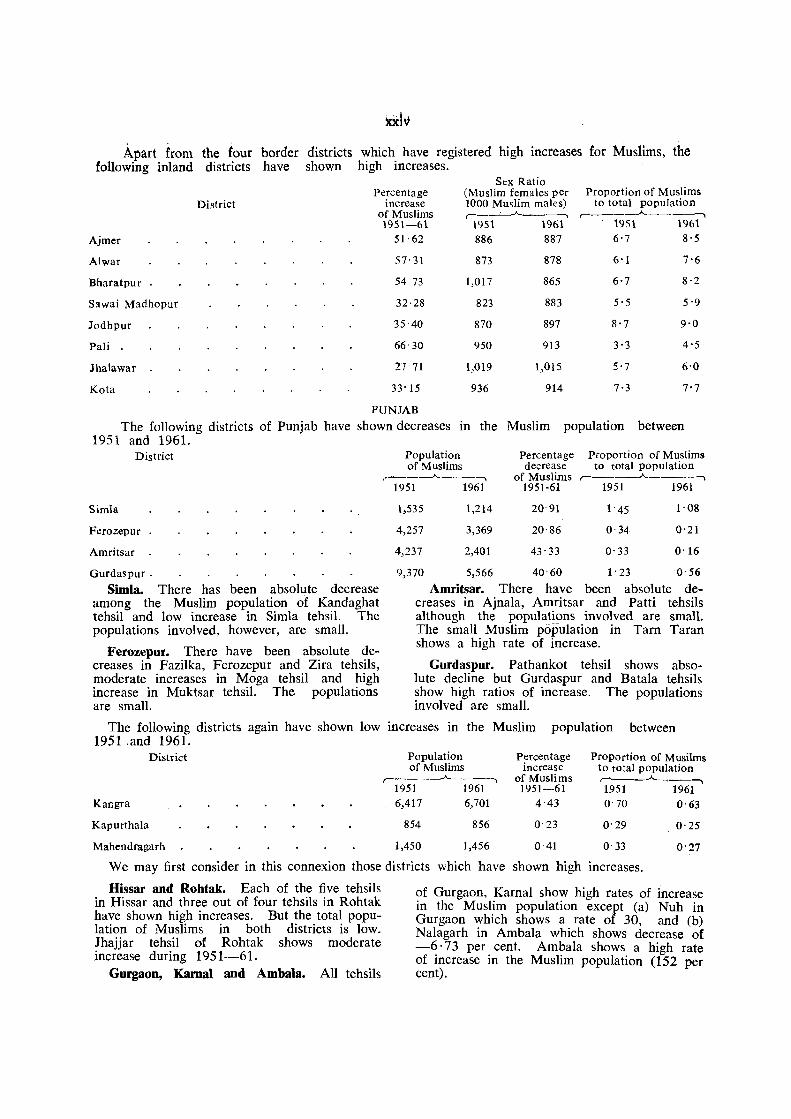
Apart from the four border districts which have registered high increases for Muslims, the following inland districts have shown high increases.
StX Ratio Percentage (Muslim females per Proportion of Muslims
population District increase 1000 Muslim males) to total of Muslims r--~' _...A- _ __.~ r------'--------,
Ajmer
Alwar
Bharatpur
Sawai MadhopUf
Jodhpur
Pali .
Jhalawa.r
Kota
1951-61 51·62
57·31
54 73
32·28
35 40
66'30
27 71
33' 15
1951 886
873
1,017
823
870
950
1,019
936
1961 1951 1961 887 6'7 8,5
878 6'1 7'6
865 6'7 8·2
883 5'5 5'9
897 8'7 9'0
913 3'3 4'5
1,015 5'7 6'0
914 7·3 7'7
PUNJAB
The following districts of Punjab have 1951 and 1961.
shown decreases in the Muslim population between
District
Simla
Ferozepur
Amritsar
Gurdaspur.
Simla. There has been absolute decrease among the Muslim population of Kandaghat tehsil and low increase in Simla tehsil. The populations involved, however, are small.
Ferozepur. There have been absolute decreases in Fazilka, Ferozepur and Zira tehsils, moderate increases in Moga tehsil and high increase in Muktsar tehsil. The populations are small.
Population of Muslims
~,._. __ __A... ___ ~
1951
1,535
4,257
4,237
1961
1,214
3,369
2,401
Percentage decrease
of Muslims 1951-61
20'91
20-86
43'33
Proportion of Muslims to total population
r---__,.)o.._----, 1951
l' 45
0'34
0'33
1961
1'08
0'21
0'16
9,370 5,566 40-60 1'23 0'56
Amritsar. There have been absolute decreases in Ajnala, Amritsar and Patti tehsils although the populations involved are small. The small Muslim population in Tarn Taran shows a high rate of increase.
Gurdaspur. Pathankot tehsil shows absolute decline but Gurdaspur and Batala tehsils show high ratios of increase. The populations involved are small.
The following districts again have shown low increases in the Muslim population between 1951 ;and 1961.
District
Kangra
Kapurthala
Mahendragarh
Population of Muslims
r-------'--_.------, 1951 1961 6,417 6,701
854 856
Percentage increase
of Muslims 1951-61
4'43
0-23
Proportion of Musilms to total population r--_..A.._-----, 1951 1961 0-70 0'63
0'29 0'25
1,450 1,456 0'41 0·33 0'27
We may first conslder in this connexion those districts which have shown high increases.
Hissar and Rohtak. Each of the five tehsils in Hissar and three out of four tehsils in Rohtak have shown high increases. But the total population of Muslims in both districts is low. Jhajjar tehsil of Rohtak shows moderate increase during 1951-61.
Gurgaon, Kamal and Ambala. All tehsils
of Gurgaon, Kamal show high rates of increase in the Muslim population except (a) Nuh in Gurgaon which shows a rate of 30, and (b) Nalagarh in Ambala which shows decrease of -6·73 per cent. Ambala shows a high rate of increase in the Muslim population (152 per cent).

Lahaul and Spiti. More than 1,200 Muslims have newly settled in Lahaul and Spiti during the last decade. The population in 1951 was only 2.
Hoshiarpur. All the tehsils of Hoshiarpur have shown high rates of increase in the Muslim population.
Ludhiana. The figures suggest that Muslims have moved from Jagraon (0.00 per cent) and Samrala (10·77 per cent) tehsils to Ludhiana tehsil.
Bhatinda. In Bhatinda, too, there is evidence of shift from Bhatinda tehsil to Faridkot and Mansa tehsils.
xxv Kangra. Nurpur and Palampur tehsils show
absolute declines, Kangra and Dera Gopipur tehsils show low and moderate increases respectively while Kulu and Hamirpur tehsils show high ratios of increase. The population involv· ed in each case is small.
Kapurthala. Kapurthala tehsil shows ab-solute decline while Phagwara tehsil shows low increase. The populations are small.
Mahendtagarh. Dadri tehsil shows increase of 32·30 per cent while Mahendragarh and Namaul show absolute decline. The popula~ tions are small.
Patiala. The rate of increase among Mus- The combined Muslim populatioIi of these lims has been high in all the four tehsils. three districts in 1951 was small.
The following districts have shown moderate increases during 1951-61. Percentage Proportion of Muslims
District Population Increase to total population ,-----"-----, of Muslims ,-__.A, __ -,
1951 1961 1951-61 1951 1961 Jullundur 2,569 3,184 23' 94 O· 26 0 . 26 Sangrur 44,704 55,738 24'68 4'02 3·91
Sangrur shows absolute declines in Bamala and Malerkotla tehsils but high ratios of increase in Sangrur, Narwana and Jind tehsils.
The following districts have shown high increases.
District
Hissar Roht!lk Gurgaon Karnal Ambala Lahaul and Spiti . Hoshiarpur Ludhiana Bhatinda Patiala
Population of Muslims ,----A-_---, 1951 1961
3,312 6,203 2,562 7,349
163,663 216,767 3,646 14,159
24,424 40,351 2 1,210
1,360 7,050 3,357 4,686 1,677 3,340 5,597 11,714
Percentage Proportion of Muslims increase to total population
of Muslims ,-----"--"'1 1951-61 1951 1961
87·29 0'32 0'40 186'85 0'23 0'52
32'45 16'91 17'47 288'34 0'34 0'95 65·21 2'40 2'94
60,400'00 0'02 5· 9>2 418 38 0'12 0'57 39'59 o 42 0'46 99'17 o 21 0'32 109'29 0'72 1 '12
ASSAM
Goalpara. The thanas of Bilashipara and Dhubri have jointly shown an increase of 20·69 per cent in the Muslim population between 1951 and 1961 and those of Salmara and Mankachar have shown an increase of 23·59. All other thanas have shown high increase as follows:
Thana
Gossaigaon and Golokganj
Kokrajhar, Sidli and Bijni
North Salmara
Lakhipur, Goalpara, Dudhnai
Percentage increase
of Muslims 1951-61
56'42
87'30
86'47
48'90
Kamrup. The thanas of Barama and Nalbari have recorded more or less a normal figure of increase, 23 ·49 per cent, for their Muslim population. The thanas of Sorbhog and Patacharkuchi have shown an absolute decline (-1. 85 per cent). The remaining thanas which have shown high increases are arranged below in descending order of percentage increase during 1951-61.
Percentage Thana increase of
Muslims 1951-61
Gauhati and Jalukbari 86'43 Rangia • Chhaygaon, Boko and Palasbari Barpeta, Tarabari (Baghbu) Hajo Kamalpur
77'38 60'88 41'96 37'65
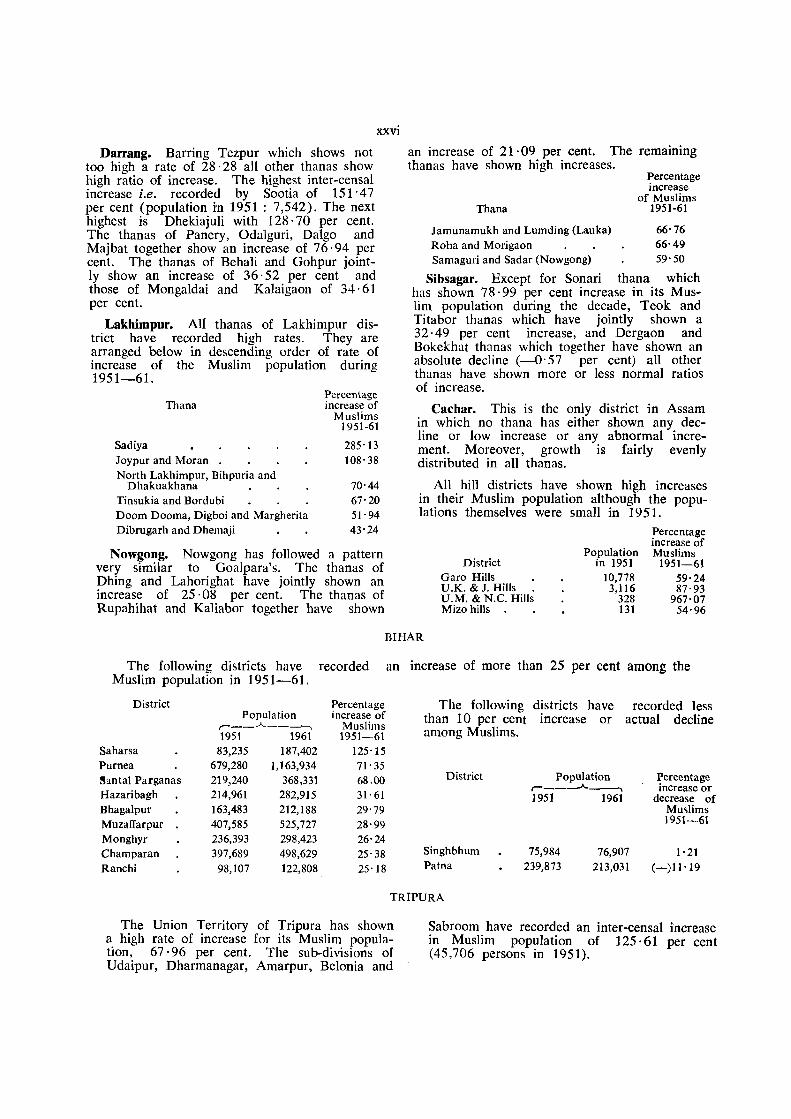
Darrang. Barring Tezpur which shows not too high a rate of 28· 28 all other thanas show high ratio of increase. The highest inter-censal increase i.e. recorded by Sootia of 151'47 per cent (population in 1951 : 7,542). The next highest is Dhekiajuli with 128·70 per cent. The thanas of Panery, Odalguri, Dalgo and Majbat together show an increase of 76·94 per cent. The thanas of Behali and Gohpur jointly show an increase of 36·52 per cent and those of Mongaldai and Kalaigaon of 34·61 per cent.
xxvi
Lakhimpur. All thanas of Lakhimpur district have recorded high rates. They are arranged below in descending order of rate of increase of the Muslim population during 1951-61.
Thana
Sadiya Joypur and Moran North Lakhimpur, Bihpuria and
Dhakuakhana Tinsukia and Bordubi Doom Dooma, Digboi and Margherita Dibrugarh and Dhemaji
Percentage increase of
Muslims 1951-61
285'13 108'38
70·44 67'20 51'94 43'24
Nowgong. Nowgong has followed a pattern very similar to Goalpara's. The thanas of Dhing and Lahorighat have jointly shown an increase of 25 ·08 per cent. The thanas of Rupahihat and Kaliabor together have shown
an increase of 21·09 per cent. The remaining than as have shown high increases.
Thana
Percentage increase
of Muslims 1951-61
Jamunamukh and Lumding (Lauka) 66'76 Roha and Morigaon 66' 49 Samaguri and Sadar (Nowgong) 59' 50
Sibsagar. Except for Sonari thana which has shown 78·99 per cent increase in its Mus· lim population during the decade, Teok and Titabor thanas which have jointly shown a 32·49 per cent increase, and Dergaon and Bokekhat thanas which together have shown an absolute decline (-0'57 per cent) all other thanas have shown more or less normal ratios of increase.
Cachar. This is the only district in Assam in which no thana has either shown any decline or low increase or any abnormal increment. Moreover, growth is fairly evenly distributed in all thanas.
All hill districts have shown high increases in their Muslim population although the populations themselves were small in 1951.
District Garo Hills U.K. & J. Hills . U.M. & N.C. Hills Mizo hills .
Population in 1951
10,778 3,116
328 131
Percentage increase of Muslims
1951-61 59'24 87'93
967'07 54'96
BIHAR
The following districts have recorded an increase of more than 25 per cent among the Muslim population in 1951-61.
District Percentage The following districts have recorded less PopUlation increase of than 10 per cent increase or actual decline ,--__ _A....~-__ _.... Muslims
1951 1961 1951-61 among Muslims. Saharsa 83,235 187,402 125'15 Purnea 679,280 1,163,934 71' 35 lbntal Parganas 219,240 36S,331 6S.00 District Population 1?ercentage
Hazaribagh 214,961 282,915 31'61 r----"-_____ mcrease or 1951 1961 decrease of
Bhagalpur 163,483 212,188 29'79 Mu~lims
Muzaffarpur 407,585 525,727 28'99 1951-61
Monghyr 236,393 298,423 26'24 Champaran 397,689 498,629 25'38 Singhbhum 75,984 76,907 1· 21
Ranchi 98,107 122,80S 25'18 Patna 239,873 213,031 (-)11'19
TRIPURA
The Union Territory of Tripura has shown a. high rate of increase for its Muslim populatIon, 67·96 per cent. The sub-divisions of Udaipur, Dharmanagar, Amarpur, Belonia and
Sabroom have recorded an inter-censal increase in Muslim population of 125·61 per cent (45,706 persons in 1951).
xxvii WEST BENGAL
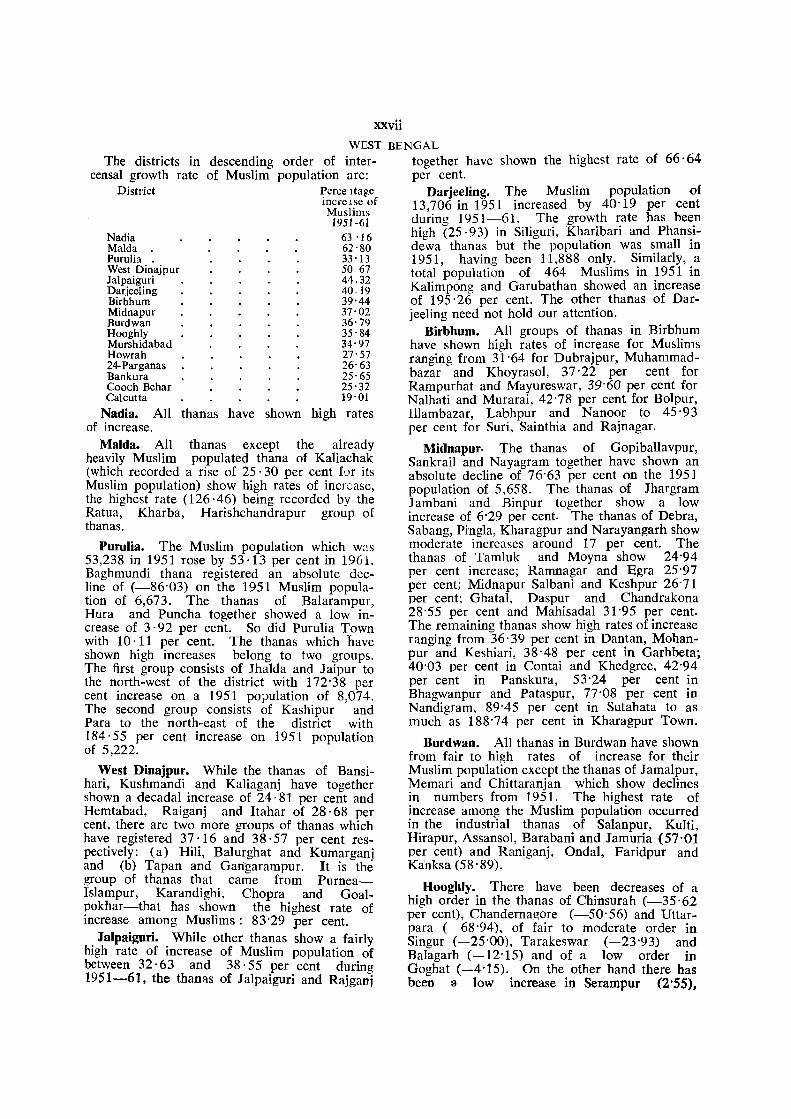
The districts in descending order of intercensal growth rate of Muslim population are:
District Perce Itage
Nadia Maida Purulia . West Dinajpur Jalpaiguri Darjeeling Birbhum Midnapur Burdwan Hooghly Murshidabad Howrah 24-Parganas Bankura Cooch Behar Calcutta
increlse of Muslims 1951-61
63 '16 62'80 33'13 50 67 44.32 40.19 39'44 37'02 36'79 35'84 34'97 27'57 26'63 25'65 25'32 19'01
Nadia. All thanas have shown high rates of increase.
MaIda. All thanas except the already heavily Muslim populated thana of Kaliachak (which recorded a rise of 25·30 per cent for its Muslim population) show high rates of increase, the highest rate (126· 46) being recorded by the Ratua, Kharba, Harishchandrapur group of thanas.
Purulia. The Muslim population which W:lS
53,238 in 1951 rose by 53 ·13 per cent in 1961. Baghmundi thana registered an absolute decline of (-86'03) on the 1951 Muslim population of 6,673. The thanas of Balarampur, Hura and Punch a together showed a low increase of 3·92 per cent. So did Purulia Town with 10·11 per cent. The thanas which have shown high increases belong to two groups. The first group consists of Jhalda and J aipur to the north-west of the district with 172'38 per cent increase on a 1951 pOj)ulation of 8,074. The second group consists of Kashipur and Para to the north-east of the district with 184·55 per cent increase on 1951 population of 5,222.
West Dinajpur. While the than as of Bansihari, Kushmandi and Kaliaganj have together shown a decadal increase of 24· 81 per cent and Hemtabad, Raiganj and Itahar of 28·68 per cent, there are two more groups of thanas which have registered 37· 16 and 38·57 per cent respectively: (a) Hili, Balurghat and Kumarganj and (b) Tapan and Gangarampur. It is the group of thanas that came from PurneaIslampur, Karandighi, Chopra and Goalpokhar-that has shown the highest rate of increase among Muslims: 83'29 per cent.
Jalpaiguri. While other thanas show a fairly high rate of increase of Muslim population of between 32·63 and 38·55 per cent during 1951-61, the than as of Jalpaiguri and Rajganj
together have shown the highest rate of 66·64 per cent.
Darjeeling. The Muslim population of 13,706 in 1951 increased by 40'19 per cent during 1951-61. The growth rate has been high (25,93) in Siliguri, Kharibari and Ph ansidewa thanas but the population was small in 1951, having been 11,888 only. Similarly, a total population of 464 Muslims in 1951 in Kalimpong and Garubathan showed an increase of 195' 26 per cent. The other thanas of Darjeeling need not hold our attention.
Birbhum. All groups of thanas in Birbhum have shown high rates of increase for Muslims ranging from 31 '64 for Dubrajpur, Muhammadbazar and Khoyrasol, 37'22 per cent for Rampurhat and Mayureswar, 39'60 per cent for Nalhati and Murarai, 42'78 per cent for Bolpur, Illambazar, Labhpur and Nanoor to 45'93 per cent for Suri, Sainthia and Rajnagar.
Midnapur. The thanas of Gopiballavpur, Sankrail and Nayagram together have shown an absolute decline of 76'63 per cent on the 1951 population of 5,658. The thanas of Jhargram J ambani and Binpur together show a low increase of 6'29 per cent. The thanas of Debra, Sabang, Pingla, Kharagpur and Narayangarh show moderate increases around 17 per cent. The thanas of Tamluk and Moyna show 24'94 per cent increase; Ramnagar and Egra 25'97 per cent; Midnapur Salbani and Keshpur 26'71 per cent; Ghata1. Daspur and Chandrakona 28'55 per cent and Mahisadal 31'95 per cent. The remaining thanas show high rates of increase ranging from 36, 39 per cent in Dantan, Mohanpur and Keshiari, 38' 48 per cent in Garhbeta; 40'03 per cent in Contai and Khedgree, 42'94 per cent in Panskura, 53'24 per cent in Bhagwanpur and Pataspur, 77-08 per cent in Nandigram. 89'45 per cent in Sutahata to as much as 188'74 per cent in Kharagpur Town.
Burdwan. All thanas in Burdwan have shown from fair to high rates of increase for their Muslim population except the than as of Jamalpur, Memari and Chittaranjan which show declines in numbers from 1951. The highest rate of increase among the Muslim population occurred in the industrial thanas of Salanpur, Kulti, Hirapur, Assansol, Barabani and Jamuria (57'01 per cent) and Raniganj, Ondal, Faridpur and Kanksa (58'89).
Hooghly. There have been decreases of a high order in the thanas of Chinsurah (-35'62 per cent), Chandernagore (-50'56) and Uttarpara (-68'94), of fair to moderate order in Singur (-25'00), Tarakeswar (-23'93) and Balagarh (-12 '15) and of a low order in Goghat (-4'15). On the other hand there has been a low increase in Serampur (2'55),

xxviii
moderate increase in Pursura (19'70) and high' increase in the following thanas :
Thana
Percentage incre;tse of
Muslims 1951-61
Pandua 118'55 Chanditala 114'49 Jangipara 80'27 Polba 75'41 HaripaJ 73' 27 Bhadreswar 73' 17 Arambag 68' 55 D haniakhali 57' 61 Khanakul 57' 22 Magra . 37· 50
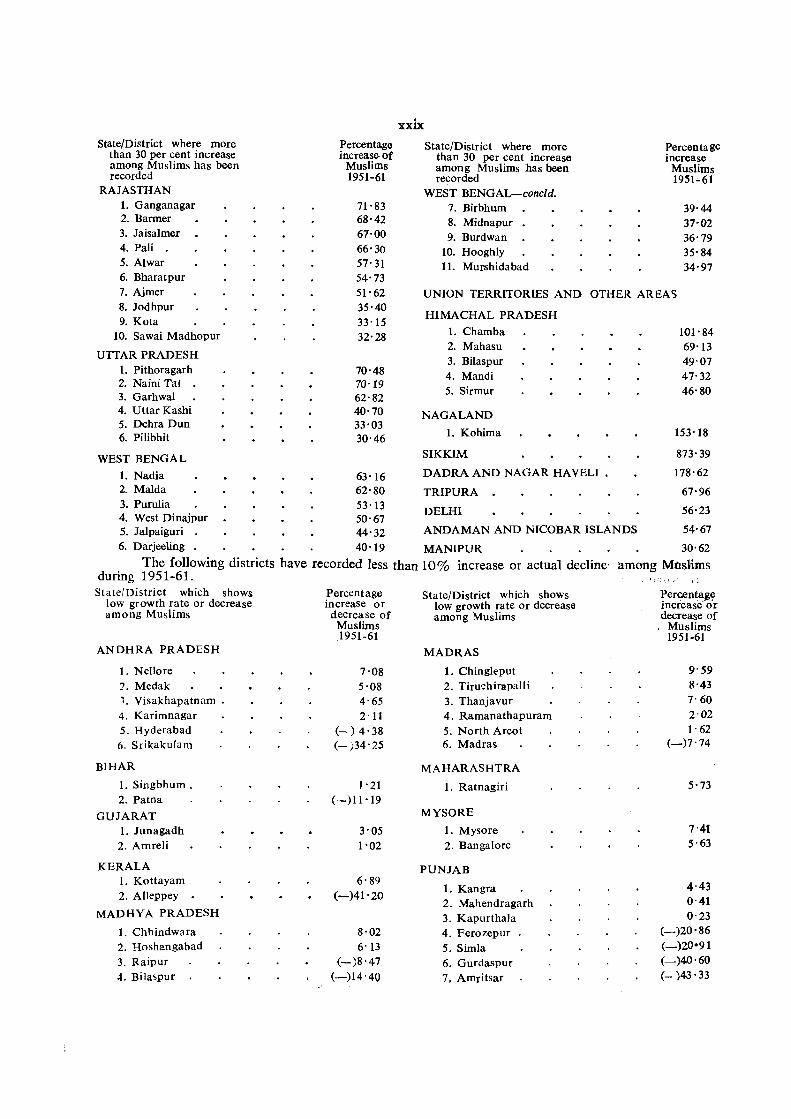
The following districts have recorded increases
StatejDistrict where more than 30 per cent increase among Muslims has been recodcd
ASSAM
1. U.M. & N.C. Hills 2. U.K. & J. Hills 3. Lakhimpur 4. Garo Hills 5. Darrang 6. Mizo Hills 7. Goalpara 8. Now!;ong 9. Kamrup
BIHAR
1. Saharsa 2. Purnea 3. Santal Parganas 4. Hazaribagh
GUJARAT
1. Dangs 2. Sabarkantha 3. Bimaskantha 4. Surendranagar
KERALA
1. Quilon 2. Trichur 3. Trivandrum 4. Kozhikode
MADHYA PRADESH
1. Raigarh 2. Damoh 3. Durg 4. Surguja 5. Narsimhapur 6. Shahdol 7. Seoni 8. Vidisha CBhilsa) 9. Sidhi
10. Rewa 11. Chhatarpur :\2' Balaghat
Percentage increase
of Muslims 1951-61
967'07 87'93 68·14 59'24 58'71 54'96 40'54 38'89 38'72
125' 15 71'35 68'00 31' 61
152'60 35'33 31'20 31'11
78·74 55·66 39·20 33'30
207'79 136'68 77'94 62'72 60'74 59'55 56'59 56·35 52'54 45'62 43'10 4-2·44
Murshidabad. The rate of increase in the Muslim population of this district has been high. The thanas of Farakka, Samserganj and Suti together have shown an increase of 27' 69 per cent; Raghunathganj and Sagardighi have recorded an increase of 30'33 per cent; Bhagwangola and Raninagar 30'76; Murshidabad, Iiaganj, Lalgola and Nabagram 35'73; Kandi and Bharatpur 36·38; Khargram and Burwan 36'48; Beldanga, Nawada and Hariharpara 40'08 per cent; and Berhampur, Domkal and Ialangi 42:40.
of over 30% among Muslims during 1951-61.
State/District where more than 30 per cent Increllse among Muslims has been recorded
MADHYA PRADESH--concld.
13. Satna 14. Panna 15. West Nimar 16. Morena 17. Bhind 18. Dewas 19. Sagar 20. Betul 21. Shajapur
MADRAS 1. Nilgiri
MAHARASHTRA 1. Nasik 2. Thana 3. Akola 4. Sangli 5. Kolhapur
MYSORE 1. Coorg 2. Shimoga 3. Chikmagalur 4. North Kanara 5. Mandya 6. Chitradurga
ORISSA 1. Sundargarh 2. Keonjhar 3. Baudh-Khondmals
PUNJAB 1. Lahaul and Spiti . 2. Hoshiarpur 3. Kamal 4. Rohtak 5. Patiala 6. Bhatinda 7. Hissar 8. Ambala 9. Ludhiana
10. Gursaon
Percentage increase
of Muslims 1951-61
40·84 37'23 35·45 35·09 34·55 32·50 32·01 30·80 30'34
38'08
55·85 50'26 37·69 33'24 31' 37
51· 37 48·08 46'91 37'21 34·11 30'23
102'00 44'59 37'65
60,400'00 418·38 288'34 186'85 109'29 99'17 87·29 65'21 39'59 n-4~
State/District where more than 30 per cent increase among Muslims has been recorded
RAJASTHAN 1. Ganganagar 2. Barmer 3. Jaisalmer 4. Pali . 5. Alwar 6. Bharatpur 7. Ajmer 8. Jodhpur 9. Kota
10. Sawai Madhopur
UTTAR PRADESH 1. Pithoragarh 2. Naini Tal • 3. Garhwal 4. Uttar Kashi 5. Dehra Dun 6. Pilibhit
WEST BENGAL
1. Nadia 2. Maida
Percentage increase. of
Muslims 1951-61
71'83 68'42 67'00 66'30 57'31 54'73 51'62 35'40 33'15 32'28
70'48 70'19 62'82 40'70 33'03 30'46
63'16 62'80
3. Purulia 53' 13 4. West Dinajpur 50' 67 5. Jalpaiguri . 44' 32
xxix
State/District where more than 30 per cent increase among Muslims has been recorded
WEST BENGAL-concld. 7. Birbhum 8. Midnapur 9. Burdwan
10. Hooghly 11. Murshida bad
Percentage increase
Muslims 1951 ... 61
39'44 37'02 36'79 35'84 34'97
UNION TERRITORIES AND OTHER AREA')
HIMACHAL PRADESH
1. Chamba 101' 84 2. Mahasu 69'13 3. Bilaspur 4. Mandi 5. Sirmur
NAGALAND
1. Kohima
SIKKIM
DADRA AND NAGAR HA VELI •
TRIPURA
DELHI
ANDAMAN AND NICOBAR ISLANDS
49'07 47'32 46'80
153'18
873'39
178'62
67'96
56'23
6. Darjeeling . 40'19 MANIPUR
54'67
.30'62
among Mnslims The following districts have recorded less than 10% increase or actual declineduring 1951-61.
State/District which shows low growth rate or decrease among Muslims
ANDHRA PRADESH
1. Nellore 2. Medak '. Visakhapatnam . 4. Karimnagar 5. Hyderabad 6. Srikakulam
BIHAR
1. Singbhum . 2. Patna
GUJARAT I. Junagadh 2. Amreli
KERALA 1. Kottayam 2. AUeppey
MADHYA PRADESH
l. Chhindwara 2. Hoshangabad 3_ Raipur 4. Bilaspur
Percentage increase or decrease of
Muslims 1951-61
7'08 5'08 4'65 2'11
(-) 4'38 (-;34'25
I' 21 (-)11'19
3'05 1'02
6'89 (-)41'20
8'02 6'13
(-)8'47 (-)14'40
State/District which shows low growth rate or decrease among Muslims
MADRAS
1. Chingleput 2. Tiruchirapalli 3. Thanjavur 4. Ramanathapuram 5. North Arcot 6. Madras
MAHARASHTRA
1. Ratnagiri
MYSORE
1. Mysore 2. Bangalore
PUNJAB
1. Kangra 2. Mahendragarh 3. Kapurthala 4. Ferozepur 5. Simla 6. Gurdaspur 7. Amritsar
('::',1,'
Percenta~W increase or decrease of
Muslims 1951-61
9'59 8'43 7-60 2-02 1- 62
(-)7-74
5'73
7'41 5·63
4'43 0-41 0-23
(-)20'86 (-)20·91 (-)40'60 (- )43·33
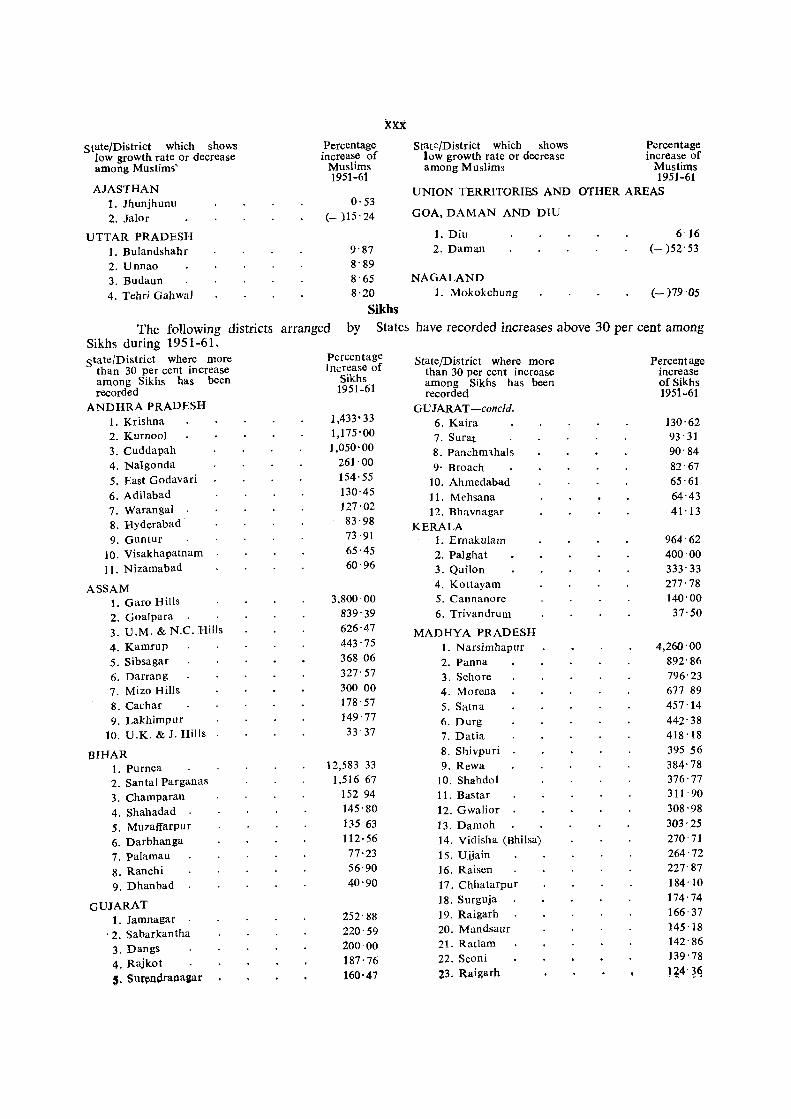
State/District which shows low growth rate or decrease among MUslims'
AJASTHAN 1. Jhunjhunu 2. Jalor
UTTAR PRADESH 1. Bulandshahr 2. Unnao 3. Budaun 4. Tehri Gahwal
Percentage increase of
Muslims 1951-61
o· 53 (- )15'24
9'87 8'89
xxx Stat~/District which shows
low growth rate or decrease among Muslims
UNION TERRITORIES AND
GOA, DAMAN AND DIU
1. Diu 2. Daman
8' 65 NAGALAND 8' 20 1. Mokokchung
Sikhs
Percentage increase of
MUslims 1951-61
OTHER AREAS
6·16 (-)52'53
(-)79'05
The following districts arranged by States have recorded increases above 30 per cent among Sikhs during 1951-61. state/District where more
than 30 per cent increase among Sikhs has been recorded
ANDHRA PRADESH I. Krishna 2. Kurnool 3. Cuddapah 4. Nalgonda 5. East Godavari 6. Adilabad 7. Warangal . 8. Hyderabad 9. Guntur
10. Visakhapatnam 11. Nizamabad
ASSAM 1. Garo Hills 2. Goalpara 3. U.M. & N.C. Hills
4. Kamrup 5. Sibsagar 6. Darrang 7. Mizo Hills 8. Cachar 9. Lakhimpur
10. U.K. & J. Hills
BlHAR 1. Purnea 2. Santal Parganas 3. Champaran 4. Shahadad . 5. Muzaifarpur 6. Darbhanga 7. palamau 8. Ranchi 9. Dhanbad
GUJARAT 1. Jamnagar
. 2. Sabarkantha 3. Dangs 4. Rajkot ,. SUl"~llprapa~r
Percentage Increase of
Sikhs 1951-61
1,433' 33 1,175'00 1,050'00
261'00 154'55 130·45 127'02 83'98 73'91 65·45 60'96
3,800 00 839'39 626'47 443'75 368 06 327'57 300 00 178'57 149 77 33'37
12,583 33 1,516 67
152 94 145'80 13563 112·56 77'23 56'90 40'90
252'88 220'59 200'00 187'76 160'47
State/District where more than 30 per cent increase among Sikhs has been recorded
GUJARAT -concld. 6. Kaira 7. Surat 8. Panchmlhals 9· Broach
10. Ahmedabad 11. Mehsana 12. Bhavnagar
KERALA 1. Ernakulam 2. Pal ghat 3. Quilon 4. Kottayam 5. Cannanore 6. Trivandrum
MADHYA PRADESH 1. Narsimhapur 2. Panna 3. Sehore 4. Morena 5. Satna 6. Durg 7. Datia 8. Shivpuri 9. Rewa
10. Shah do I 11. Bastar 12. Gwalior 13. Damoh 14. Vidisha (Bhilsa) 15. Ujjain 16. Raisen 17. Chhatarpur 18. Surguja 19. Raigarh 20. Mandsaur 21. Ratlam 22. Seoni 23. Raigarh
Percentage increase of Sikhs 1951-61
130'62 93'31 90'84 82'67 65'61 64'43 41·13
964'62 400'00 333'33 277·78 140'00 37'50
4,260-00 892-86 796-23 677 89 457-14 442-38 418 -18 395 56 384-78 376-77 311 . 90 308-98 303-25 270'71 264-72 227'87 184-10 174-74 166·37 145·18 142'86 139-78 q4'~~
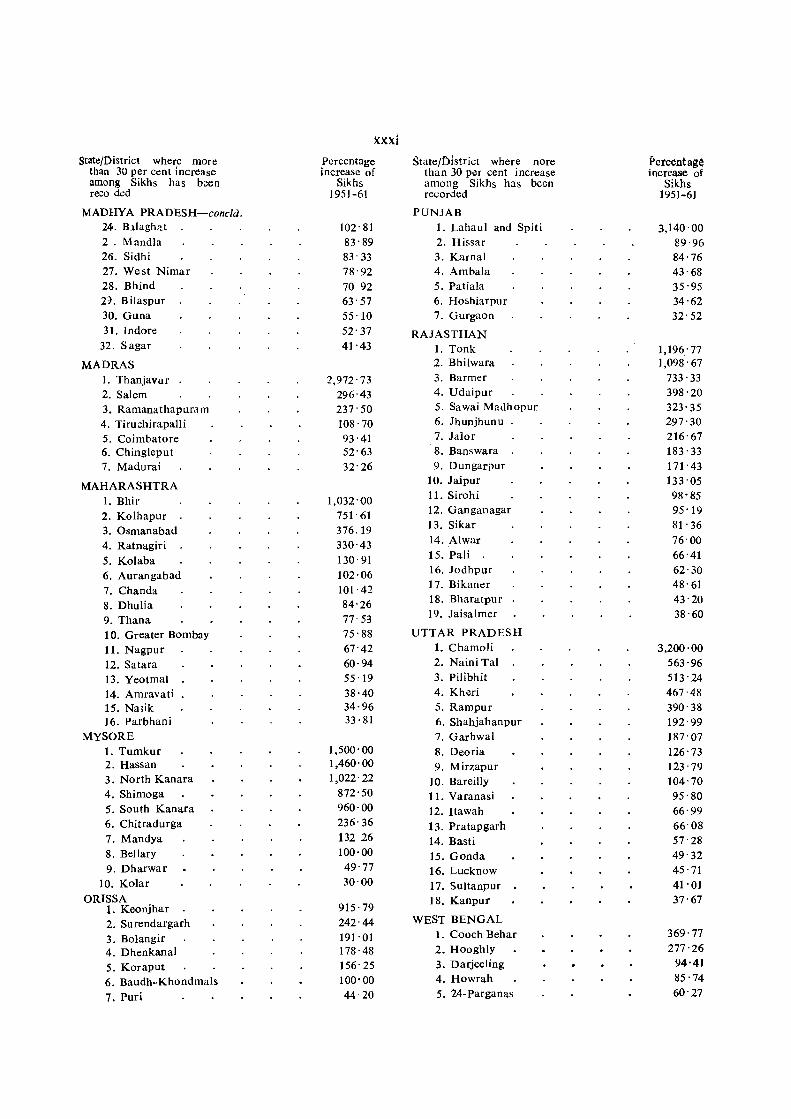
State/District where more than 30 per cc:nt increase among Sikhs has b.::en reeo ded
MADHYA PRADESH-concld. 24. B.llagh;tt 2 . Mandla 26. Sidhi 27. West Nimar 28. Bhind 2). BiIaspur 30. Guna 31. Indore
32. Sagar
MADRAS I. Thanjavur 2. Salem 3. Ramanathapufam 4. Tiruchirapalli 5. Coimbatore 6. Chingleput 7. Madurai
MAHARASHTRA I. Bhir 2. Kolhapur 3. Osmanabad 4. Ratnagiri 5. Kolaba 6. Aurangabad 7. Chanda 8. Dhulia 9. Thana 10. Greater Bombay 11. Nagpur 12. Satara 13. Yeotmal 14. Amravati 15. Na;ik 16. Parbhani
MYSORE 1. Tumkur 2. Hassan 3. North Kanara 4. Shimoga 5. South Kanara 6. Chitradurga 7. Mandya 8. Bellary 9. Dharwar
10. Kolar ORISSA
1. Keonjhar 2. Surendargarh 3. Bolangir 4. Dhenkanal 5. Koraput 6. Baudh·,Khondmals
7. Puri
xxxi Percentage increase of
Sikhs 1951-61
102' 81 83'89 83'33 78'92 70 92 63'57 55·10 52'37 41,43
2,972'73 296·43 237'50 108'70 93'41 52'63 32'26
1,032'00 751'61 376,19 330'43 130 91 102·06 101,42 84'26 77'53 75'88 67'42 60·94 55 '19 38'40 34·96 33'81
1,500'00 1,460'00 1,022' 22
872' 50 960·00 236'36 132 26 100·00 49'77 30'00
915,79 242'44 191'01 178,48 156'25 100'00 44'20
state/District where ,nore than 30 per cent increase among Sikhs has been re<.:orded
PUNJAB 1. Lahaul and Spiti 2. Hissar 3. Karnal 4. Ambala 5. Patiala 6. Hoshiarpur 7. Gurgaon
RAJASTHAN 1. Tonk 2. Bhilwara 3, Barmer 4. Udaipur 5. Sawai Madhopur 6. Jhunjhunu 7. Jalor 8. Banswara 9. Dungarpur
10. Jaipur 11. Sirohi 12. Ganganagar 13. Sikar 14. Alwar 15. Pali 16. Jodhpur 17. Bikaner 18. Bharatpur 19. Jaisalmer
UTTAR PRADESH 1. Chamoli 2. Naini Tal 3. Pilibhit 4. Kheri 5. Rampur 6. Shahjahanpur 7. Garhwal 8. Deoria 9. Mirzapur
10. Bareilly 11. Varanasi 12. Itawah 13. Pratapgarh 14. Basti 15. Gonda 16. Lucknow 17. Sultanpur 18. Kanpur
WEST BENGAL 1. Cooch Behar 2. Hooghly 3. Darjeeling 4. Howrah 5. 24-Parganas
Percentag~ increase of
Sikhs 1951-61
3,140'00 89'96 84'76 43'68 35'95 34'62 32'52
1,196'77 1,098' 67
733'33 398'20 323'35 297'30 216'67 183'33 171'43 133'05 98'85 95'19 81'36 76'00 66'41 62'30 48'61 43'20 38'60
3,200'00 563'96 513'24 467,48 390'38 192'99 187'07 126'73 123'79 104'70 95'80 66'99 66'08 57'28 49'32 45'71 41'01 37'67
369'77 277'26
94'41 85'74 60'27
State/District where more than 30 per Cent increase among Sikhs has been recorded
Percentage increase of
Sikhs 1951-61
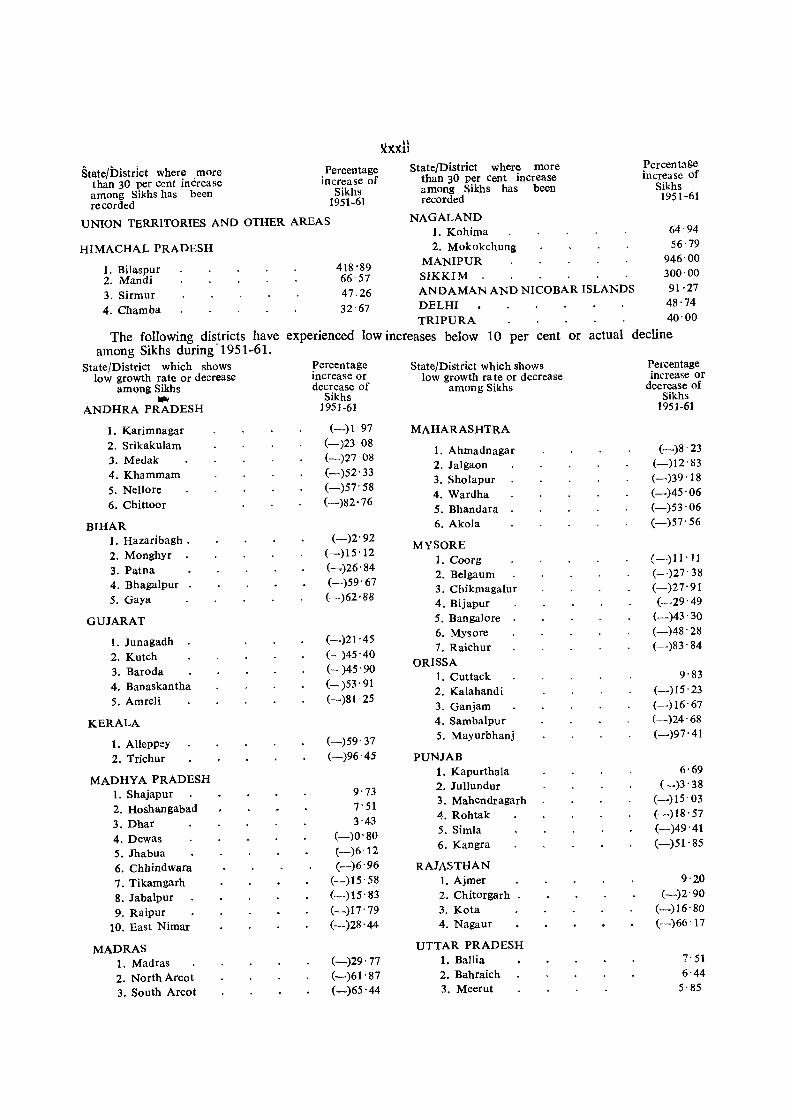
UNION TERRITORIES AND OTHER AREAS
HIMACHAL PRADESH
1. Bilaspur 2. Mandi 3. Sirmur 4. Chamba
418'89 66 57 47.26 32'67
~xxH State/District where more
than 30 per cent increase among Sikhs has been recorded
NAGALAND 1. Kohima 2. Mokokchung
MANIPUR SIKKIM . ANDAMAN AND NICOBAR ISLANDS DELHI
Percentage increase of
Sikhs 1951-61
64'94 56'79
946'00 300'00 91·27 48·74
TRIPURA 40' 00
The following dis~ricts have experienced low increases below 10 per cent or actual decline among Sikhs during 1951-61.
State/District which shows low growth rate or decrease
among Sikhs .... ANDHRA PRADESH
1. Karimnagar 2. Srikakulam 3. Medak 4. Khammam 5. Nellore 6. Chittoor
BIHAR 1. Hazaribagh . 2. Monghyr • 3. Patna 4. Bhagalpur . 5. Gaya
GUJARAT
I. Junagadh 2. Kutch 3. Baroda 4. Banaskantha 5. Amreli
KERALA
1. Alleppey 2. Trichur
MADHYA PRADESH 1. Shajapur 2. Hoshangabad 3. Dhar 4. Dewas 5. Jhabua 6. Chhindwara 7. Tikamgarh 8. Jabalpur 9. Raipur
10. East Nimar
MADRAS 1. Madras 2. North Arcot 3. South Areot
Percentage increase or decrease of
Sikhs 1951-61
(-)1 97 (-)23 08 (-)27 08 (-)52'33 (-)57' 58 (-)82·76
(-)2'92 (-)15'12 (-.,)26'84 (-)59' 67 (--)62'88
(-)21'45 (- )45-40 (- )45- 90 (-)53-91 (-)81'25
(-)59' 37 (-)96'45
9'73 7-51 3'43
(-)0-80 (--)6 12 (-)6-96
(-)15- 58 (-.)15-83 (-)17-79 (--)28-44
(-)29-77 (-)61- 87 (-)65'44
State/District which shows Percentage low growth rate or decrease increase or
among Sikhs decrease of Sikhs
1951-61
MAHARASHTRA
1. Ahmadnagar (-)8' 23
2. Jalgaon (-)12'83
3. Sholapur (-)39'18
4. Wardha (-)45'06
5. Bhandara (-)53'06
6. Akola (-)57'56
MYSORE 1. Coorg (--)11'11
2. Belgaum (-)27' 38
3. Cbikmagalur (-)27'91
4. Bijapur (-29'49
5. Bangalore (-)43'30
6. Mysore (-)48'28
7. Raichur (-)83 -84
ORISSA 1. Cuttack 9'83
2. Kalahandi (-)15'23
3. Ganjam (-)16'67
4. Sambalpur (-)24'68
5. Mayurbhanj (-)97'41
PUNJAB 1. Kapurthala 6'69
2. JulJundur (-)3' 38
3. Mahendragarh (-)15'03
4·. Rohtak (-)18-57
5. Simla (-)49-41
6. Kangra (-)51-85
RAJASTHAN 1. Ajmer 9-20
2. Chitorgarh . (-)2-90
3. Kota (-)16-80
4. Nagaur (--)66-17
UTTAR PRADESH 1. Ballia 7-51
2. Bahraich 6-44
3. Meerut 5'85
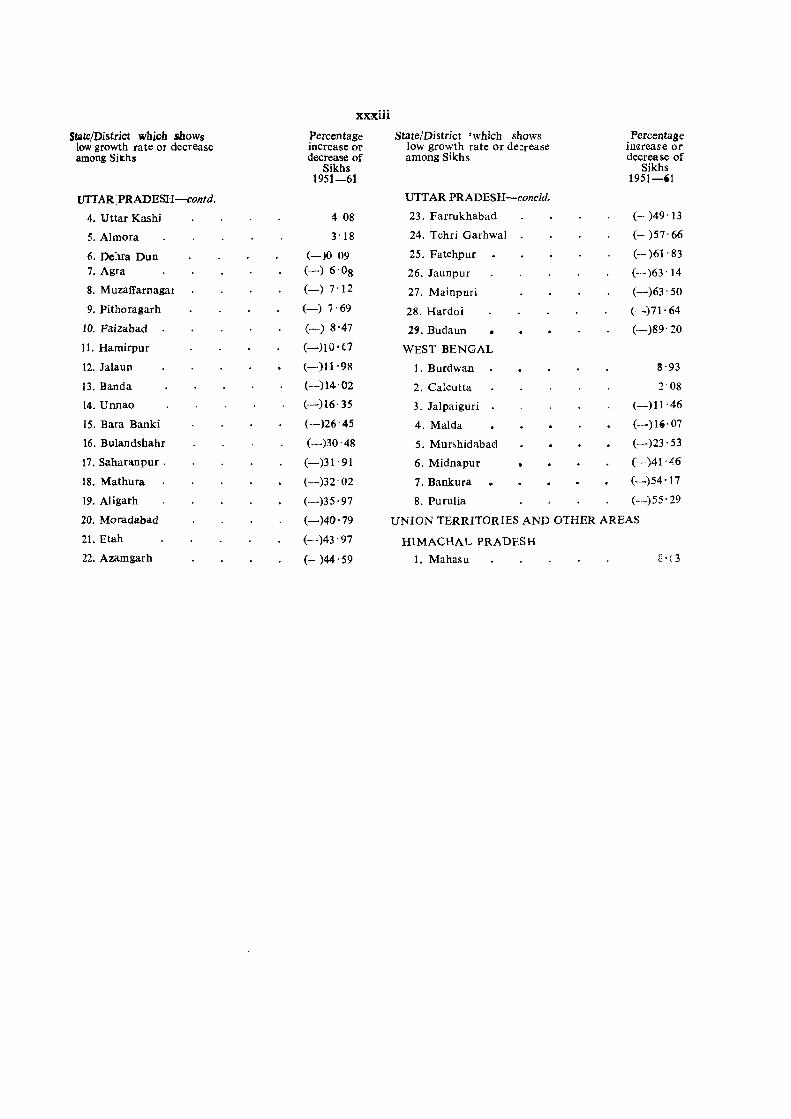
xxxiii
Slate/District which ibows Percentage State/District 'which shows . Percentage low growth rate or decrease increase or low growth rate or de:rease merease or among Sikhs decrease of among Sikhs decrease of
Sikhs Sikhs 1951-61 1951-'1
UTTAR.PRADESH-contd. UTTAR PRADESH-concid.
4. Uttar Kashi 4 08 23. Farrukhabad (- )49'13
5. Aimora 3 '18 24. Tehri Garhwal (- )57'66
6. De:ua Dun (-)0 09 25. Fatehpur (- )61' 83
7. Agra (-) 6'08 26. Jaunpur (-)63'14
8. Muzajfarnagar (-)7'12 27. Mainptlri (-)63' 50
9. Pithoragarh (-) 7 '69 28. Hardoi (-)71' 64
10. Faizabad (-) 8·47 29. Budaun (-)89' 20
II. Hamirpur (-)10 0 0 WEST BENGAL
12. Jalaun (-·)11'98 1. Burdwan 8'93
13. Banda (--)14'02 2. Calcutta 2-08
14. Unnao (--)16' 35 3. Jalpaiguri (-)11'46
15. Bara Banki (-)26-45 4. MaIda (-)1"07
16. Bulandshahr (-)30-48 5. Mur~hidabad (-)23' 53
17. Saharanpur . (-)31'91 6. Midnapur (-)41-46
18. Mathura (-)32-02 7. Bankura (-)54 0 17
19. Aligarh (-)35 -97 8. Purulia (-)55'29
20. Moradabad (-)40-79 UNION TERRITORIES AND OTHER AREAS
21. Etah (--)43' 97 HIMACHAL PRADESH
22. Azamgarh (- )44-59 1. Mahasu IH3
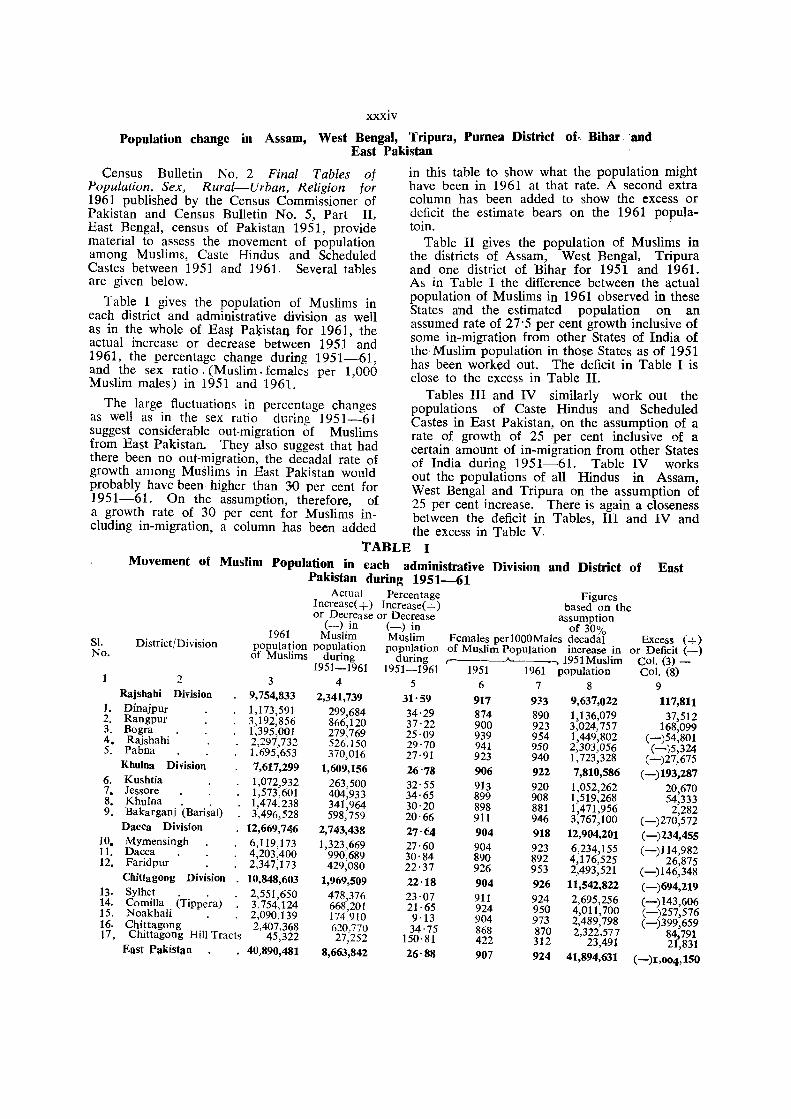
xxxiv
PopUlation change in Assam, West Bengal, Tripura, Pumea District of·. Bihar and East Pakistan
Census Bulletin No. 2 Final Tables of Population, Sex, Rural-Urban, Religion for 1961 published by the Census Commissioner of Pakistan and Census Bulletin No.5, Part II, East Bengal, census of Pakistan 1951, prov_ide material to assess the movement of populatIon among Muslims, Caste Hindus and Scheduled Castes between 1951 and 1961. Several tables are given below.
Table I gives the population of Muslims in each district and administrative division as well as in the whole of East Pa~istall for 1961, the actual increase or dec;ease between 1951 and 1961, the percentage change during 1951-61, and the sex ratio. (Muslim. females per 1,000 Muslim males) in 1951 and 1961.
in this table to show what the population might have been in 1961 at that rate. A second extra column has been added to show the excess or deficit the estimate bears on the 1961 populatoin.
Table II gives the population of Musli~s in the districts of Assam, West Bengal, Tnpura and one district of Bihar for 1951 and 1961. As in Table I the difference between the actual population of Muslims in 1961 observed in these States and the estimated population on an assumed rate of 27'5 per cent growth inclusive of some in-migration from other States of India of the Muslim population in those States as of 1951 has been worked out. The deficit in Table I is close to the excess in Table II.
Tables III and IV similarly work out the The large fluctuations in percentage changes populations of C~ste Hindus and S~heduled
as well as in the sex ratio during 1951-61 Castes in East PakIstan, on the assumptlOn of a suggest considerable out-migration of Muslims rate of growth of 25 per cent inclusive of a from East Pakistan.. They also suggest that had certain amount of in-migration from other States there been no out-migration, the decadal rate of of India during 1951-61. Table IV works growth among Muslims in East Pakistan would out the populations of all Hindus in Assam, probably have been higher than 30 per cent for West Bengal and Tripura on the assumption of 1951-61. On the assumption, therefore, of 25 per cent increase. There is again a closeness a growth rate of 30 per cent for Muslims in- between the deficit in Tables, III and IV and eluding in-migration, a column has been added the excess in Table V.
81. No.
1. 2. 3. 4. 5.
6. 7. 8. 9.
10. 11. 12.
13. 14. 15. 16. 17,
TABLE I Movement of Muslim Population in each administrative Division and District of East
Pakistan during 1951-61 Actual Percentage Figures
J ncrease( + ) Increase( + ) based on the or Decrease or Decrease assumption
(-) in (-) in of 30% (+) 1961 Muslim Muslim Females per1000Maies decadal Excess District!Division pO~lation population population of Muslim Population increase in or Deficit (-) of uslims during during ,---__ ---A.. ___ ., 1951Muslim Col. (3)-
1951-1961 1951-1961 1951 1961 population Col. (8) :2 3 4 5 6 7 8 9
Rajshahi Division 9,754,833 2,341,739 31'59 917 9~3 9,637,022 117,811 Dinajpur 1,173,591 299,684 34'29 874 890 1,136,079 37,512 Rangpur 3,192,856 866,120 37'22 900 923 3,024,757 168,099 Bogra 1,395,001 279,769 25·09 939 954 1,449,802 (-)54,801 Rajshahi 2,297,732 526.150 29·70 941 950 2,303,056 (-~5,324 Pabna 1,695,653 370,016 27·91 923 940 1,723,328 (-)27,675 Khulna Division 7,617,299 1,609,156 26'78 906 922 7,810,586 (-)193,287 Kushtia 1,072,932 263,500 32'55 913 920 1,052,262 20,670 Jessore 1,573,601 404,933 34'65 899 908 1,519,268 54,333 Khulna 1,474,238 341,964 30'20 898 881 1,471,956 2,282 Bakarganj (Barisal) 3,496,528 598,759 20'66 911 946 3,767,100 (-)270,572 Dacca Division 12,669,7.1..6 2,743,438 27·64 904 918 12,904,201 (-)234,455 Mymensingh 6,119,173 1,323,669 27'60 904 923 6,234,155 (-)114,982 Dacca 4,203,400 990,689 30'84 890 892 4,176,525 26,875 Faridpur 2,347,173 429,080 22·37 926 953 2,493,521 (-)146,348 ChittagoDg Division 10,848,603 1,969,509 22'18 904 926 11,542,822 (-)694,219 Sylhet 2,551,650 478,376 23·07 911 924 2,695,256 (-)143,606 Comilla (Tippera) 3,754,124 668,201 21·65 924 950 4,011,700 (-)257,576 Noakhali . 2,090,139 174.910 9·13 904 973 2,489,798 (-)399,659 Chittagong 2,407,368 620,770 34'75 868 870 2,322,577 84,791 Chittagong Hill Tracts 45,322 27,252 150·81 422 312 23,491 21,831 East J'akistan . 40,890,481 8,663,842 26·88 907 924 41,894,631 (-)1,004,150
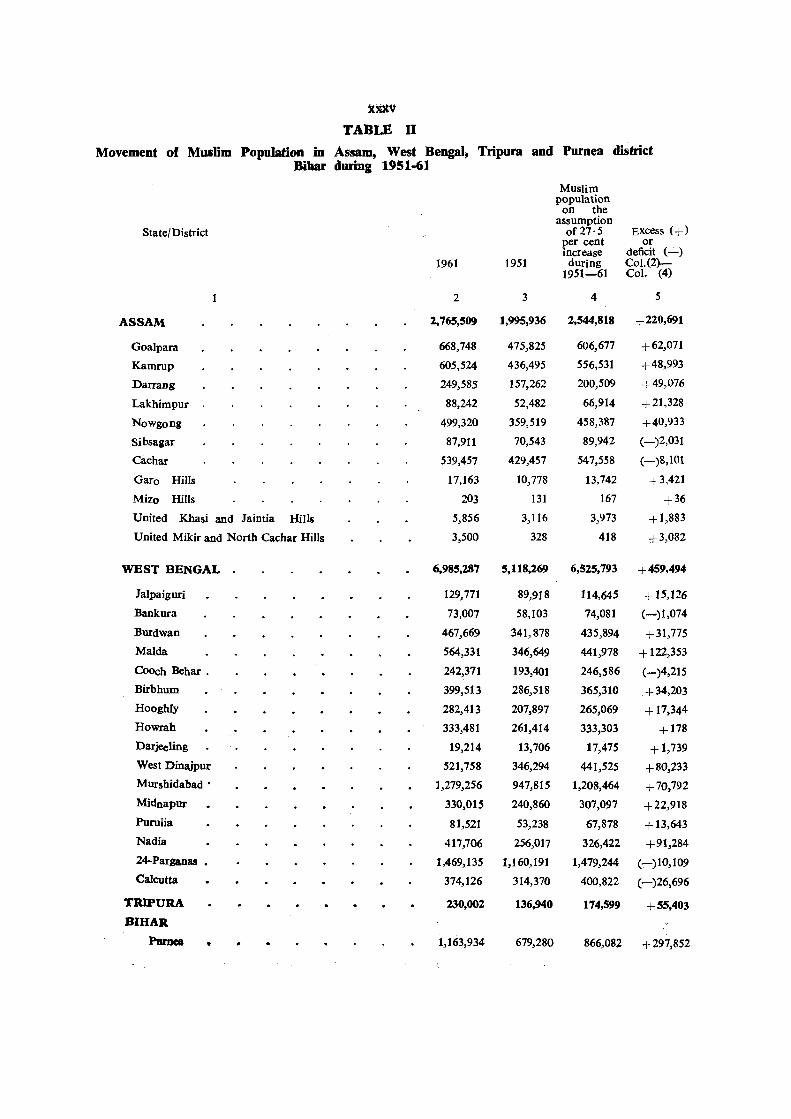
b~\t
TABLE II
Movement of Muslim Population in Assam, West BengalJ Tripura and Purnea district Bihar during 1951·61
State/District
ASSAM
Goalpara
Kamrup
Darrang
Lakhimpur
Nowgong
Sibsagar
Cachar
Garo Hills
Mizo Hills
United Khasi and Jaintia HiI15
United Mikir and North Cachar Hills
WEST BENGAL
Jalpaiguri
Bankura
Burdwan
MaIda
Cooch Behar .
Birbhum
Hooghly
Howrah
Darjeeling
West Dinajpur
Murshidabad .
Midnapur
Purulia
Nadia
24-Parganas •
Calcutta
TRIPURA
BIHAR
Purnea •
1961
2
2,765,509
668,748
605,524
249,585
88,242
499,320
87,911
539,457
17,163
103
5,856
3,500
6,985,287
129,771
73,007
467,669
564,331
242,371
399,513
282,413
333,481
19,214
521,758
1,279,256
330,015
81,521
417,706
1,469,135
374,126
230,002
1,163,934
1951
3
1,995,936
475,825
436,495
157,262
52,482
359,519
70,543
429,457
10,778
131
3,116
328
5,118,269
89,918
58,103
341,878
346,649
193,401
286,518
207,897
261,414
13,706
346,294
947,815
240,860
53,238
256,017
1,160,191
314,370
136,940
679,280
MUslim population
on the assumption
of 27·5 per cent increase during
1951-61
4
2,544,818
606,677
556,531
200,509
66,914
458,387
89,942
547,558
13,742
167
3,973
418
6,525,793
114,645
74,081
435,894
441,978
246,586
365,310
265,069
333,303
17,475
441,525
1,208,464
307,097
67,878
326,422
1,479,244
400,822
174,599
Excess (+) or
deficit (~) Col. (2)Col. (4)
5
+220,691
+62,071
+48,993
+49,076
+21,328
+40,933
(-)2,031
(-)8,101
1- 3,421
+36
+1,883
+3,082
+459,494
+15,126
(-)1,074
+31,775
+122,353
(-)4,215
+34,203
+ 17,344
+178
+1,739
+80,233
+ 70,792
+22,918
+ 13,643
+91,284
(:--)10,109
(-)26,696
+55,403
866,082 + 297,852
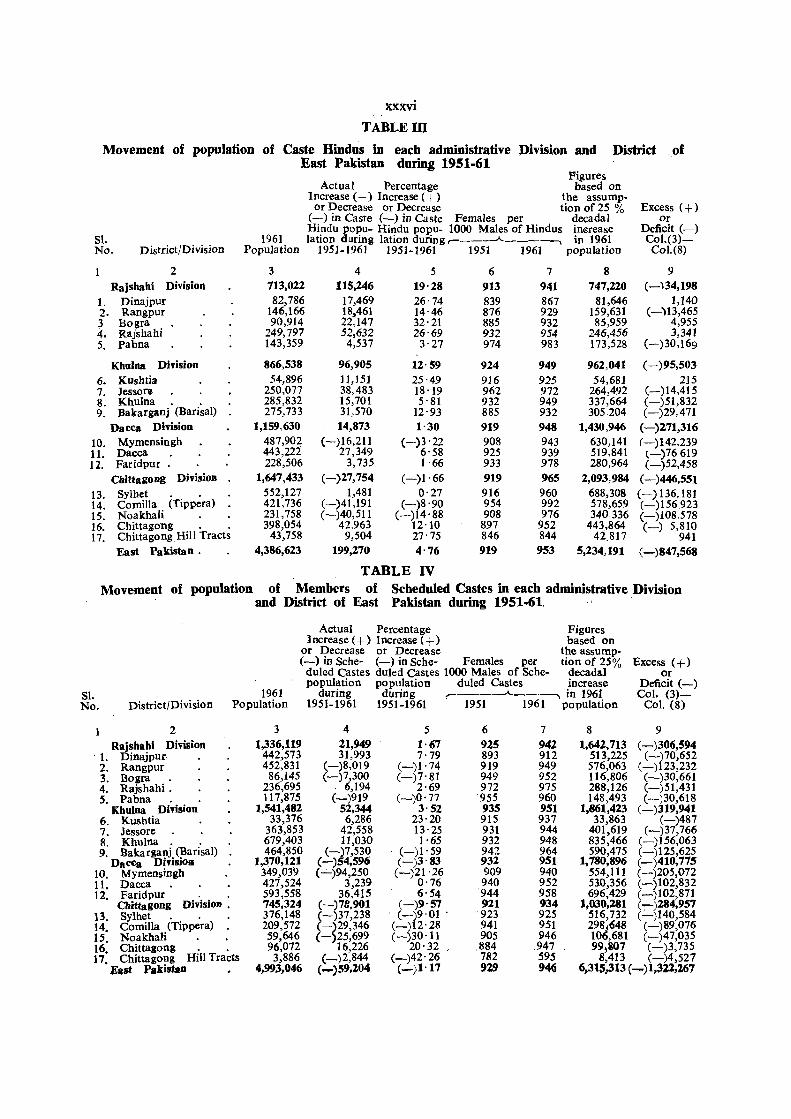
xxxvi
TABLEID
Movement of population of Caste Hindus in each administrative Division and District .of
SI. No. District/Division
2 Rajshahi Division
1. Dinajpur 2. Rangpur 3 Bogra 4. Rajshahi 5. Pabna
Khulna Division 6. Kushtia 7. Jessore 8. Khulna. . 9. Bakaraanj (Barisal)
Dacca Division 10. Mymensingh 11. Dacca 12. Faridpur.
Chittagong Division
13. Sylhet . . 14. Comilla (Tippera) 15. Noakhali 16. Chittagong . . 17. ChittagongHill Tracts
East Pakistan.
East Pakistan during 1951·61
1961 Population
3 713,022 82,786
146,166 90,914
249,797 143,359
866,538 54,896
250,077 285,832 275,733
1,159,630 487,902 443,222 228,506
1,647,433 552,127 421,736 231,758 398,054
43,758 4,386,623
Figures Actual Percentage based on
Increase (+) Increase ( + ) the assump-or Decrease or Decrease tion of 25 %
(-) in Caste (-) in Caste Females per decadal Hindu popu- Hindu popu- 1000 Males of Hindus in€rease lation during lation during ,-__ ...-A. __ ----. in 1961
1951-1961 1951-1961 1951 1961 popUlation
4 115,246
17,469 18,461 22,147 52,632
4,537
96,905 11,151 38,483 15,701 31,570
14,873 (-)16,211
27,349 3,735
(-)27,754 1,481
(-)41,191 (-)40,511
42,963 9,504
199,270
5 19'28 26'74 14·46 32'21 26-69
3·27
12,59 25,49 18'19 5'81
12'93 1·30
(-)3'22 6'58 1'66
(-)1'66 0'27
(-)8'90 (-)14'88
12'10 27'75 4,76
TABLE IV
6 913 839 876 885 932 974
924 916 962 932 885 919 908 925 933 919 916 954 908
897 846 919
7
941 867 929 932 954 983
949 925 972 949 932 948 943 939 978 965 960 992 976
952 844 953
8 747,220
81,646 159,631 85,959
246,456 173,528
962,041 54,681
264,492 337,664 305204
1,430,946 630,141 519,841 280,964
2,093,984 688,308 578,659 340336
443,864 42,817
5,234,191
Excess (+) or
Deficit (-) Col.(3)Col.(8)
9 (-)34,198
1,140 (-)13,465
4,955 3,341
(-)30,1 69
(-)95,503 215
(-)14,415 (-)51,832 (-)29,471
(-)271,316 (-)142,239 ~-)76 619 (-)52,458
(-)446,551 (-) 136, 181 (-)156923 (-)108.578 (-) 5,810
941 (-)847,568
Movement of population of Members of Scheduled Castes in each administrative Division and District of East Pakistan during 1951 .. 61.
Actual Percentage Figures Increase (+) Increase (+) based on
or Decrease or Decrease the assump-(-) in Sche- (-) in Sche- Females per tion of 25%
Sl. No. District/Division
2 Rajshabi Divillion
. 1. Dinajpur 2. Rangpur 3. Bogra . 4. Rajshahi. 5. Pabna
Kbulna Di,ision 6. Kushtia 7. Jessore 8. Khulna. . 9. Bakarganj (Barisal)
Dacca Didsiou 10. Mymensingh 11. Dacca 12. Faridpur
Cbittagong Division. 13. Sylhet . . 14. Comilla (Tippera) 15. Noakhali
1961 Population
3 1,336,119
442,573 452,831
86,145 236,695 117,875
1,541,482 33,376
363,853 679,403 464,850
1,370,121 349,039 427,524 593,558 745,324 376,148 209,572
16. Chittagong 17. Chittagong Hill Tracts
East PakistaD
59,646 96,072 3,886
4,993,046
duled Castes duled Castes 1000 Males of Sche- decadal Excess (+)
or Deficit (-)
Col. (3)Col. (8)
population popUlation duled Castes increase during during ,..------'-----., in 1961
1951-1961 1951-1961 1951 1961 population
4 21,949 31,993
(-)8,019 (-)7,300
. 6,194 (-)919
52,344 6,286
42,558 11,030
(-)7,530 (-)54,596 (":"")94,250
3,239 36,415
(-)78,901 (-)37,238 (-)29,346 (-)25,699
16,226 (_)2,844
(_)59,Z04
5 1'67 7,79
(-)1'74 (-)7'81
2'69 (-)0'77
3'52 23,20 13'25 1,65
(-)1' 59 (-)3'83 (-)21'26
0'76 6,54
(-)9'57 . (--)9,01 . (-)12'28 ( -)30'11
20,32 . (-)42'26 (_)1'17
6 925 893 919 949 972 955 935 915 931 932 942 932 909 940 944 921 923 941 905
.884 782 919
7
942 912 949 952 975 960 951 937 944 948 964 951 940 952 958 934 925 951 946
.947 595 946
8 9 1,642,713 (-)306,594
513,225 (-)70,652 576,063 (-)123,232 116,806 (-)30,661 288,126 (-)51,431 148,493 (-)30,618
1,861,423 (-)319,941 33,863 (-)487
401,619 (-)37,766 835,466 (-)156,063 590,475 (-)125,625
1,780,896 (-)410;775 554,111 (-)205,072 530,356 (-)102,832 696,429 (-)102,871
1,030,281 ( i )284,957 516,732 (-)140,584 298.648 (-)89,076 106,681 (-)47,035 99~B07 (-)3,735
8,413 (-)4,527 6,315,313 (-)1,3Zl,267
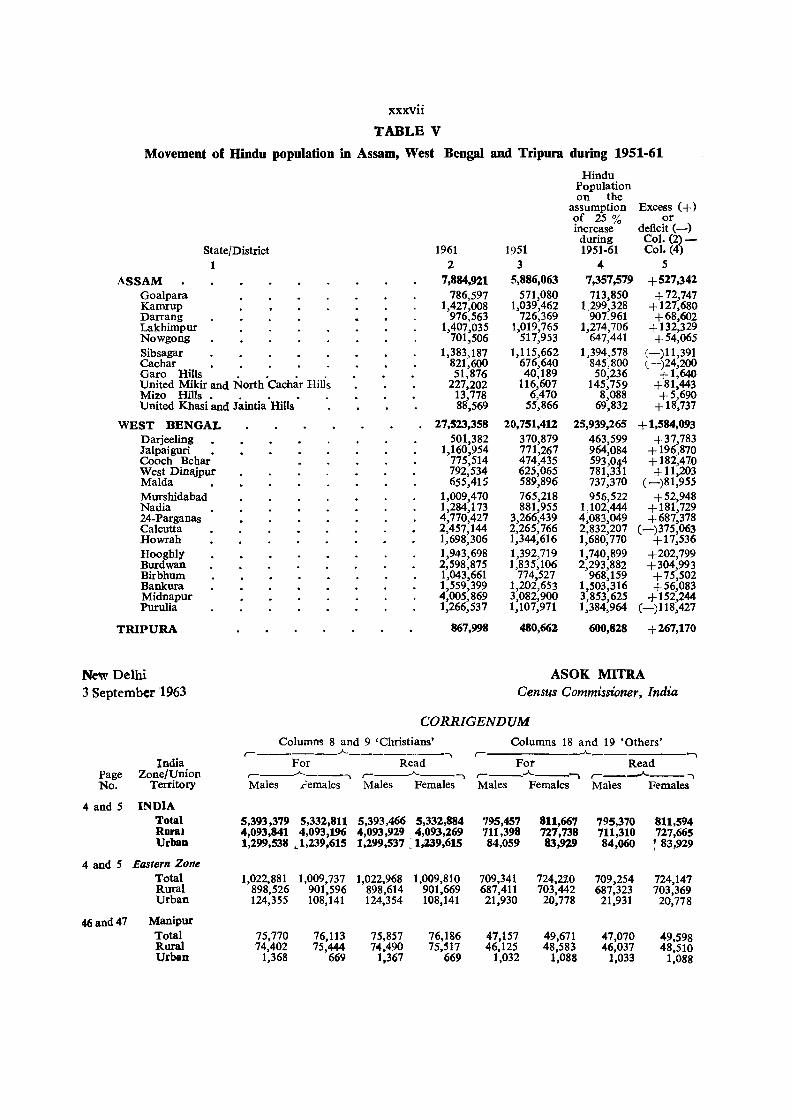
xxxvii
TABLE V
Movement of Hindu population in Assam, West Bengal and Tripura during 1951·61
State/District 1
ASSAM Goalpara Kamrup Darrang Lakhimpur Nowgong Sibsagar Cachar Garo Hills . . . . United Mikir and North Cachar Hills Mizo Hills • United Khasi and Jaintia Hills
WEST BENGAL Darjeeling Jalpaiguri • Cooch Behar West Dinajpur MaIda Murshidabad Nadia 24-ParganaS Calcutta Howrah Hooghly Burdwan Birbhum Bankura Midnapur Purulia
TRIPURA
New Delhi 3 September '1963
1961 2
7,884,921 786,597
1,427,008 976,563
1,407,035 701,506
1,383,187 821,600 51,876
227,202 13,778 88,569
27,523,358 501,382
1,160,954 775,514 792,534 655,415
1,009,470 1,284,173 4,770,427 2,457,144 1,698,306 1,943,698 2,598,875 1,043,661 1,559,399 4,005,869 1,266,537
867,998
Hindu Population on the
assumption Excess (+) of 25 % or increase deficit (-) during
1951 1951-61 Col. (2j-Col. (4
3 4 5 5,886,063 7,357,579 +527,342
571,080 713,850 +72,747 1,039,462 1~299,328 +127,680
726,369 907,961 +68,602 1,019,765 1,274,706 +132,329
517,953 647,441 +54,065 1,115,662 1,394,578 (-)11,391
676,640 845,800 (-)24,200 40,189 50,236 + 1,640
116,607 145,759 +81,443 6,470 8,088 +5,690
55,866 69,832 + 18,737
20,751,412 25,939,265 +1,584,093 370,879 463,599 +37,783 771,267 964,084 +196,870 474,435 593,044 + 182,470 625,065 781,331 +11,203 589,896 737,370 (-)81,955 765,218 956,522 +52,948 881,955 1,102,444 +181,729
3,266,439 4,083,049 +687,378 2,265,766 2,832,207 (-)375,063 1,344,616 1,680,770 +17,536 1,392,719 1,740,899 +202,799 1,835,106 2,293,882 +304,993
774,527 968,159 +75,502 1,202,653 1,503,316 +56,083 3,082,900 3,853,625 +152,244 1,107,971 1,384,964 (-)118,427
480,662 600,828 +267,170
ASOK MITRA Census Commissioner, India
CORRIGENDUM Columns 8 and 9 'Christians' Columns 18 and 19 'Others' r-_______ .A. ----...... r-----
India For Read For Read Page Zone/Union No. Territory
r-__..A..---, r--__..A..-_, r-----"---'t r--~-- ...... Males ~.;'emales Males Females Males Females Males F<."males
4 and 5 INDIA Total 5,393,379 5,332,811 5,393,466 5,332,884 795,457 811,667 795,370 811,594 Roral Urbaa
4,093,841 4,093,196 4,093,9Z9 4,093,269 '111,398 7Z7,738 711,310 7Z7,665 1,299,538 ~ 1,239,615 1,299,537 : 1,Z39,615 84,059 83,9Z9 84,060 ~ 83,9Z9
4 and 5 Eastern Zone Total Rural Urban
1,022,881 1,009,737 1,022,968 1,009,810 709,341 724,220 709,254 724,147 898,526 901,596 898,614 901,669 687,411 703,442 687,323 703,369 124,355 108,141 124,354 108,141 21,930 20,778 21,931 20,778
46 and 47 Manipur Total Rural Urban
75,770 76,113 75,857 76,186 47,157 49,671 47,070 49,598 74,402 75,444 74,490 75.Sl7 46.125 48,583 46,037 48,510
1,368 669 1,367 669 1,032 1,088 1,033 1,088

1961 CENSUS-RELIGION

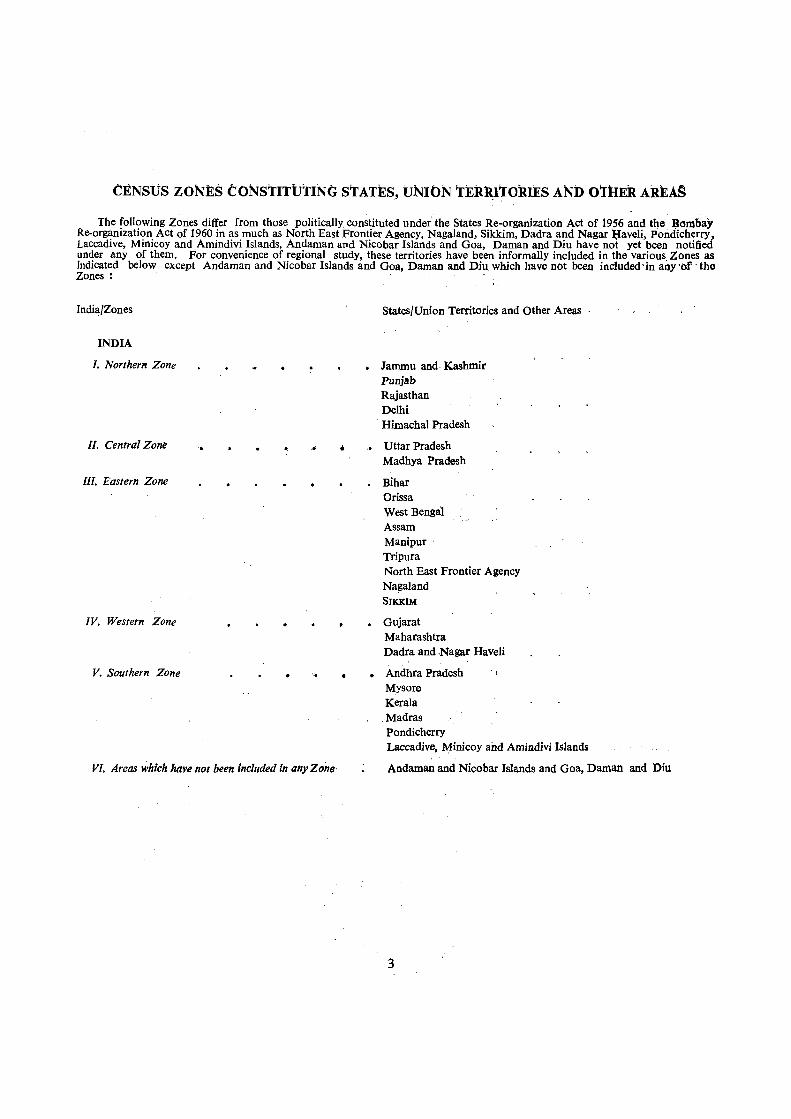
CENSUS ZONES toNSTITtJ'fING STATES, UNIbN TER~ITORIES AND OTHER AREAS
The following Z~nes differ from those politically constituted under the States Re-organization Act of 1956 and th.e, Bombay Re-organization Act of 1960 in as much as North East Frontier Agency, Nagaland, Sikkim, Dadra and Nagar l:Iaveli, Pondicherry, Laccadive, Minicoy and Amindivi Islands, Andaman aDd Nicobar Islands and Goa, Daman and Diu have not yet been notified under 4ny of them. For convenience of regional study, these territories have been informally included in the various, Zones as Indicated below except Andaman and Nicobar Islands and Goa, Daman and Diu, which have not been included'in any 'of ·the Zones: '
India/Zones
INDIA
I. Northern Zone
II. Central Zone ..
III. Eastern Zone
IV. Western Zone
V. Southern Zone ". •
VI. Areas which have not been incillded in any Zone
States/Union Territories and Other Areas
• Jammu and, Kashmir Punjab Rajasthan Delhi
, Himachal Pradesh
:. Uttar Pradesh Madhya Pradesh
• Bihar Orissa West Bengal Assam Manipur ' Tripura North East Frontier Agency Na~aland
SrKKIM
• Gujarat Maharashtra Dadra and Nagar Haveli
• Andhra Pradesh Mysore Kerala ,Madras Pondicherry Laccadive, Minicoy and Amindivi !slandi
Andaman and Nicobar Islands and Goa, Daman and Diu
3
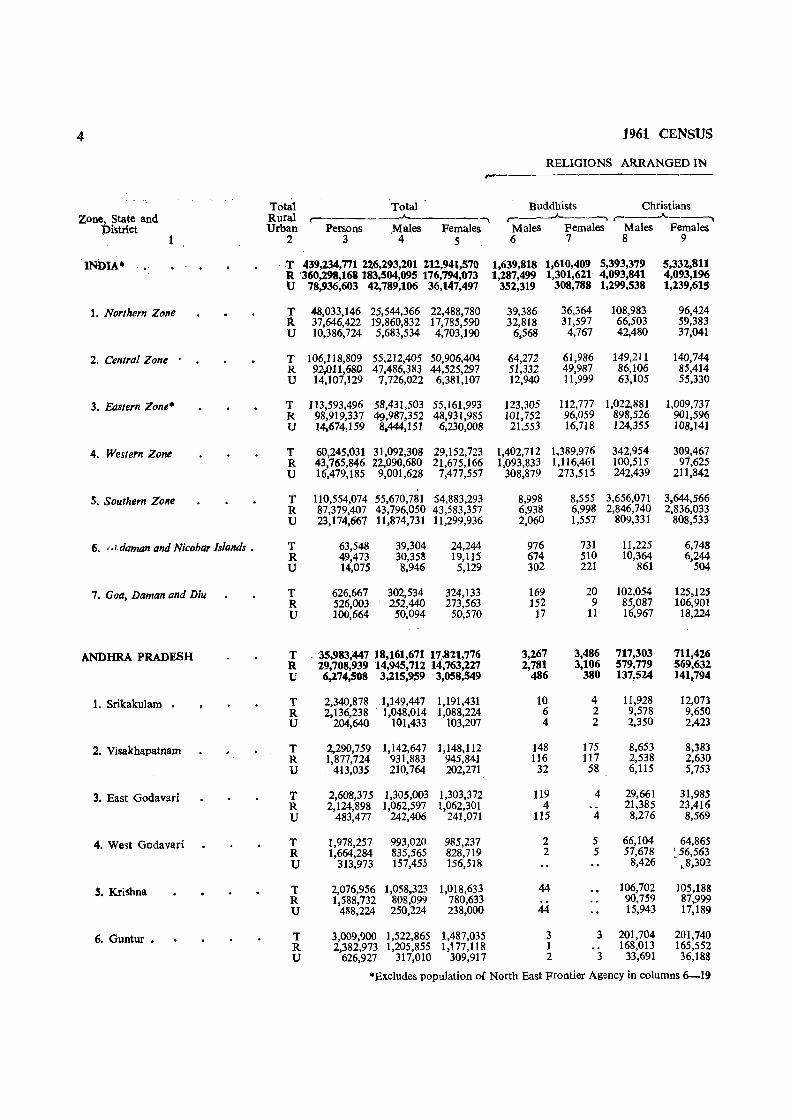
4 1961 CENSUS
RELIGIONS ARRANGED IN ,.---------------
Total Total Buddhists Christians Zone, State and Rural ~-----~------, r---~-----' r------"------,
Pistrict Urban Persons Males Females Males Females Males Females 1 2 3 4 5 6 7 8 9
INbIA· , .' T 439,234,771 226,293,201 212,941,570 1,639,818 1,610,409 5,393,379 5,332,811 R '360,298,161 183,504,095 176,794,073 1,287,499 1,301,621- 4,093,841 4,093,196 U 78,936,603 42,789,106 36,147,497 352,319 308,788 1,299,538 1,239,615
1. Northern Zone T 48,033,146 25,544,366 22,488,780 39,386 36,364 108,983 96,424 R 37,646,422 19,860,832 17,785,590 32,818 31,597 66,503 59,383 U 10,386,724 5,683,534 4,703,190 6,568 4,767 42,480 37,041
2. Central Zone T 106,118,809 55,212,405 50,906,404 64,272 61,986 149,211 140,744 R 92,011.,680 47,486,383 44,525,297 51,332 49,987 86,106 85,414 u 14,107,129 7,726,022 6,381,107 12,940 11,999 63,105 55,330
3. Eastern Zone· T 113,593,496 58,431,503 55,161,993 123,305 112,777 1,022,881 1,009,737 R 98,919,337 49,987,352 48,931,985 101,752 96,059 898,526 901,596 lJ 14,674,159 8.444,151 6,230,008 21,553 16,718 124,355 108,141
4. Western Zone T 60,245,031 31,092,308 29,152,723 1,402,712 1,389,976 342,954 30~,467 R 43,765,846 22,090,680 21,675,166 1,093,833 1,116,461 100,515 97,625 U 16,479,185 9,001,628 7,477,557 308,879 273,515 242,439 211,842
S. Southern Zone T 110,554,074 55,670,781 54,883,293 8,998 8,555 3,656,071 3,644,566 R 87,379,407 43,796,050 43,583,357 6,93S 6,998 2,846,740 2,836,033 U 23,174,667 11,874,731 11,299,936 2,060 1,557 809,331 808,533
6. -'>I.damon and Nicobor Islands • T 63,548 39,304 24,244 976 731 11,225 6,748 R 49,473 30,3511 19,115 674 510 10,364 6,244 U 14,075 8,946 5,129 302 221 861 504
7. Goa, Daman ond Diu T 626,667 302,534 324,133 169 20 102,054 125,125 R 526,003 252,440 273,563 152 9 85,087 106,901 U 100,664 50,094 50,570 17 11 16,967 18,224
ANDHRA PRADESH T . 35,983,447 18,161,671 17,821,776 3,267 3,486 717,303 711,426 R 29,708,939 14,945,712 14,763,227 2,781 3,106 579,779 569,632 U 6,274,508 3,215,959 3,058,549 486 380 137,524 141.794
1. Srikakulam T 2,340,878 1,149,447 1,191,431 10 4 11,928 12,073 R 2,136,238 1,048,014 1,088,224 6 2 9,578 9,650 U 204,640 101,433 103,207 4 2 2,350 2,423
2. Visakhapatnam T 2.290,759 1,142,647 1,148,112 148 175 8,653 8,383 R 1,877,724 931,883 945,841 116 117 2,538 2,630 U 413,035 210,764 202,271 32 58 6,115 5,753
3. East Godavari T 2,608,375 1,305,003 1,303,372 119 4 29,661 31,985 R 2,124,898 1,062,597 1,062,301 4 21,385 23,416 U 483,477 242,406 241,071 115 4 8,276 8,569
4. West Godavari T 1,978,257 993,020 985,237 2 5 66,104 64,865 R 1,664,284 835,565 828,719 2 5 57,678 ~56,563 U 313,973 157,455 156,518 8,426 ,8,302
S. Krishna T 2,076,956 1,058,323 1,018,633 44 106,702 105,188 R 1,588,732 808,099 780,633 90,759 87,999 U 488,224 250,224 238,000 44 15,943 17,189
6. Guntur • T 3,009,900 1,522,865 1,487,035 3 3 201,704 201,740 R 2,382,973 1,205,855 1,177,118 1 ., 168,013 165,552 U 626,927 317,010 309,917 2 3 33,691 36,188
.Excludes population or North East Frontier Agency in columns 6-19
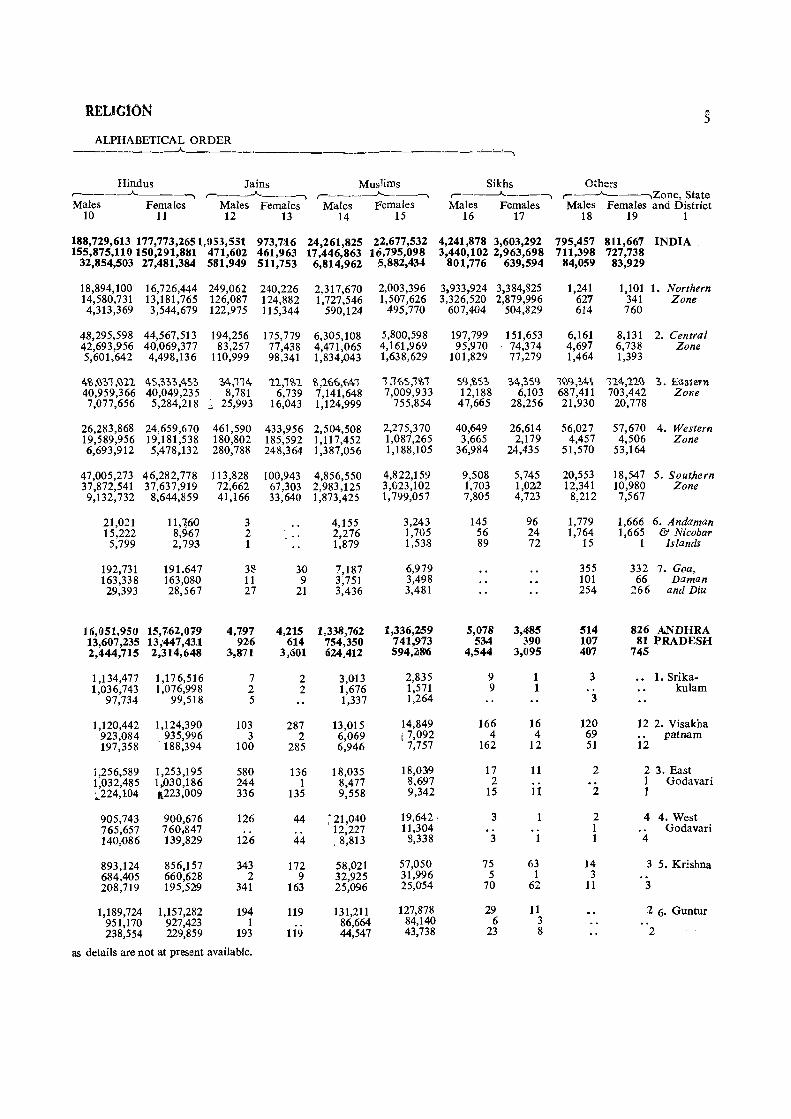
REtletON .5 ALPHABETICAL ORDER ________ -A _________________ --______ -~~~
Hindus Jains Muslims Sikhs Othe:s r------A. ___ ~ r---_.A. ___ ~ r------..f.----~ r-------A.---~ ,---..A..-------.,Zone State Males Females Males Females Males I'emales Males Females Males Females and District
10 11 12 13 14 15 16 17 18 19 1
188,729,613 177,773,2651,053,551 973,7116 24,261,825 22,677,532 4,241,878 3,603,292 795,457 811,667 INDIA 155,875,110 150,291,8t11 471,602 461,963 17,446,863 16,795;098 3,440,102 2,963,698 711,398 727,738
32,854,503 27,481,384 581,949 511,753 6,814,962 S,882,434 801,776 639,594 84,059 83,929
18,894,100 16,726,444 249,062 240,226 2,317,670 2,003,396 3,933,924 3,384,825 1,241 1,101 1. Northern 14,580,731 13,181,765 126,087 124,882 1,727,546 1,507,626 3,326,520 2,879,996 627 341 Zone 4,313,369 3,544,679 122,975 115,344 590,124 495,770 607,404 504,829 614 760
48,295,598 44,567,513 194,256 175,779 6,305,108 5,800,598 197,799 151,653 6,161 8,131 2. Central 42,693,956 40,069,377 83,257 77,438 4,471,065 4,161,969 95,970 74,374 4,697 6,731l Zone 5,601,642 4,498,136 110,999 98,341 1,834,:043 1,638,629 101,829 77,279 1,464 1,393
4£',~:,1 ,~1l 4S,:,:,:,AS:, :'4,114 11,1£,1 £',1{,{"M1 1,%5,1£,1 5~,£'5:, %,:,5~ 1W3,:A1 114,'l1~ :'. EUa1ern 40,959,366 40,049,235 8,781 6,739 7,141,648 7,009,933 12,188 6,103 687,411 703,442 Zone 7,077,656 5,284,218 ~ 25,993 16,043 1,124,999 755,854 47,665 28,256 21,930 20,778
26,283,868 24,659,670 461,590 433,956 2,504,508 2,275,370 40,649 26,614 56,027 57,670 4. Western 19,589,956 19,181,538 180,802 185,592 1,117,452 1,087,265 3,665 2,179 4,457 4,506 Zone 6,693,912 5,478,132 280,788 248,364 1,387,056 1,188,105 36,984 24,435 51,570 53,164
47,005,273 46,282,778 113,828 100,943 4,856,550 4,822,159 9,508 5,745 20,553 18,547 5. Southern 37,872,541 37,637,919 72,662 67,303 2,983,125 3,023,102 1,703 1,022 12,341 10,980 Zone 9,132,732 8,644,859 41,166 33,640 1,873,425 1,799,057 7,805 4,723 8,212 7,567
21,021 11,7,60 3 4,155 3,243 145 96 1.779 1,666 6. Andaman 15,222 8,967 2 2,276 1,705 56 24 1;764 1,665 & Nicobar 5,799 2,793 1 1,879 1,538 89 72 15 1 Islands
192,731 191.647 38 3<0 7,187 6,979 355 332 7. Goa. 163,338 163,000 11 9 3,751 3,498 101 66 Daman 29,393 28,567 27 21 3,436 3,481 254 266 and Diu
15,051,950 15,7,62,079 4,797 4,215 1,338,762 1,336,259 5,078 3,485 514 826 ANDHRA 13,607,235 13,447,43.1 9206 614 754,350 741,.973 534 390 107 81 PRADESH 2,444,715 2,314,648 3~871 3,601 624,412 594,218'6 4,544 3,095 407 745
1,134,477 1,176,516 7 2 3,013 2.835 9 1 3 1. Srika-1,036,743 1,076,998 2 2 1,676 1,571 9 1 kulam
97,734 99,518 5 1,337 1,264 3
1,120,442 1,124,390 103 287 13,015 14,849 166 16 120 12 2. Visakha 923,084 1 935,996 3 2 6,069 [7,092 4 4 69 patnam 197,358 188.394 100 285 6,946 7,757 162 12 51 12
i,256,589 1,253,195 580 1:)6 18,035 18,0319 17 11 2 2 3. East 1,032,485 IJl30,186 244 1 8,477 8,697 2 1 Godavari .. 224,104 11223 ,009 336 135 9,558 9,342 15 11 2 1
905,743 900,676 126 44 : 21,040 19,642· 3 2 4 4. West 765,657 760,847 .. .. 12,227 11,304 1 Godavari 140,086 139,829 126 44 .8,813 S,338 3 1 4
893,124 856,157 343 172 58,021 57,050 75 63 14 3 5. Krishna 684,405 660,628 2 9 32,925 31,996 5 1 3 208,719 195,529 341 163 25,096 25,054 70 62 11 3
1,189,724 1,157,282 194 119 131,211 127,878 29 11 26. Guntur 951,170 927,423 1 .. 86,664 84,140 6 3 238,554 229,859 193 119 44,547 43,738 23 8 2
as details are not at present available.
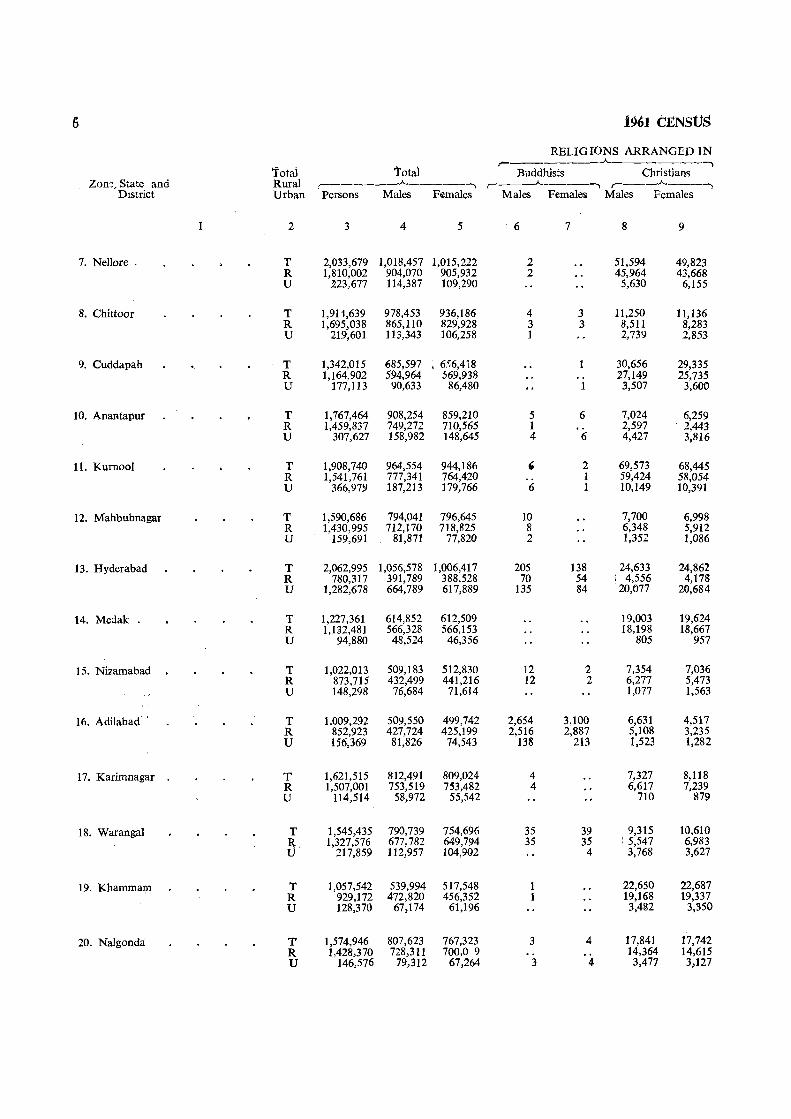
1961 CENSUS
RELIGIONS ARRANGED IN
'totai total r--------A..-------1
Buddhists Christians Zon~, State and Rural :-_____ _..A.. _____ , ,.-__ --A.. ____ -, ,.-__ --A.. ___ ,
District Urban Persons Males F€males Males Females Males Females
1 2 3 4 5 6 7 8 9
7. Nellore . T 2,033,679 1,018,457 1,015,222 2 51,594 49,823 R 1,810,002 904,070 905,932 2 45,964 43,668 U '2.23,677 114,387 109,290 5,630 6,155
8. Chittoor T 1,911,639 978,453 936,186 4 3 11,250 11,136 R 1,695,038 865,110 829,928 3 3 8,511 8,283 U 219,601 113,343 106,258 1 2,739 2.853
9. Cuddapah T 1,342,015 685,597 , 6.'i6,418 30,656 29,335 R 1,164,902 594,964 ';69,938 27,149 25,735 U 177,113 90,633 86,480 1 3,507 3,600
10. Anantapur T 1,767,464 908,254 859,210 5 6 7,024 6,259 R 1,459,837 749,272 710,565 1 2,597 2,443 U 307,627 158,982 148,645 4 6 4,427 3,816
11. KurnooI T 1,908,740 964,554 944,186 , 2 69,573 68,445 R 1,541,761 777,341 764,420 .. 1 59,424 58,054 U 366,979 187,213 179,766 6 1 10,149 10,391
12. Mahbubnagar T 1,590,686 794,041 796,645 10 7,700 6,998 R 1,430,995 712,170 718,825 8 6,348 5,912 U 159,691 81,871 77,820 2 1,352 1,086
13. Hyderabad T 2,062,995 1,056,578 1,006,417 205 138 24,633 24,862 R 780,317 391,789 388,528 70 54 ! 4,556 4,178 U 1,282,678 664,789 617,889 135 84 20,077 20,684
14. Medak . T 1,227,361 614,852 612,509 19,003 19,624 R I,B2,481 566,328 566,153 18,198 18,667 U 94,880 48,524 46,356 805 957
15. Nizamabad T 1,022,013 509,183 512,830 12 2 7,354 7,036 R 873,715 432,499 441,216 12 2 6,277 5,473 U 148,298 76,684 71,614 1,077 1,563
16. Adilabad' . T 1,009,292 509,550 499,742 2,654 3,100 6,631 4,517 R 852,923 427,724 425,199 2,516 2,887 5,108 3,235 U 156,369 81,826 74,543 138 213 1,523 1,282
17. Karimnagar T 1,621,515 812,491 809,024 4 7,327 8,118 R 1,507,001 753,519 753,482 4 6,617 7,239 U 114,514 58,972 55,542 710 879
18. Warangal T 1,545,435 790,739 754,696 35 39 9,315 10,610 R. 1,327,576 677,782 649,794 35 35 ! 5,547 6,983 U 217,859 112,957 104,902 4 3,768 3,627
19. Khammam T 1,057,542 539,994 517,548 1 22,650 22,687 R 929,172 472,820 456,352 1 19,168 19,337 U 128,370 67,174 61,196 3,482 3,350
20. Nalgonda T 1,574,946 807,623 767,323 3 4 17,841 17,742 R 1,428,370 728,311 700,0 9 14,364 14,615 U 146,576 79,312 67,264 3 4 3,477 3,127
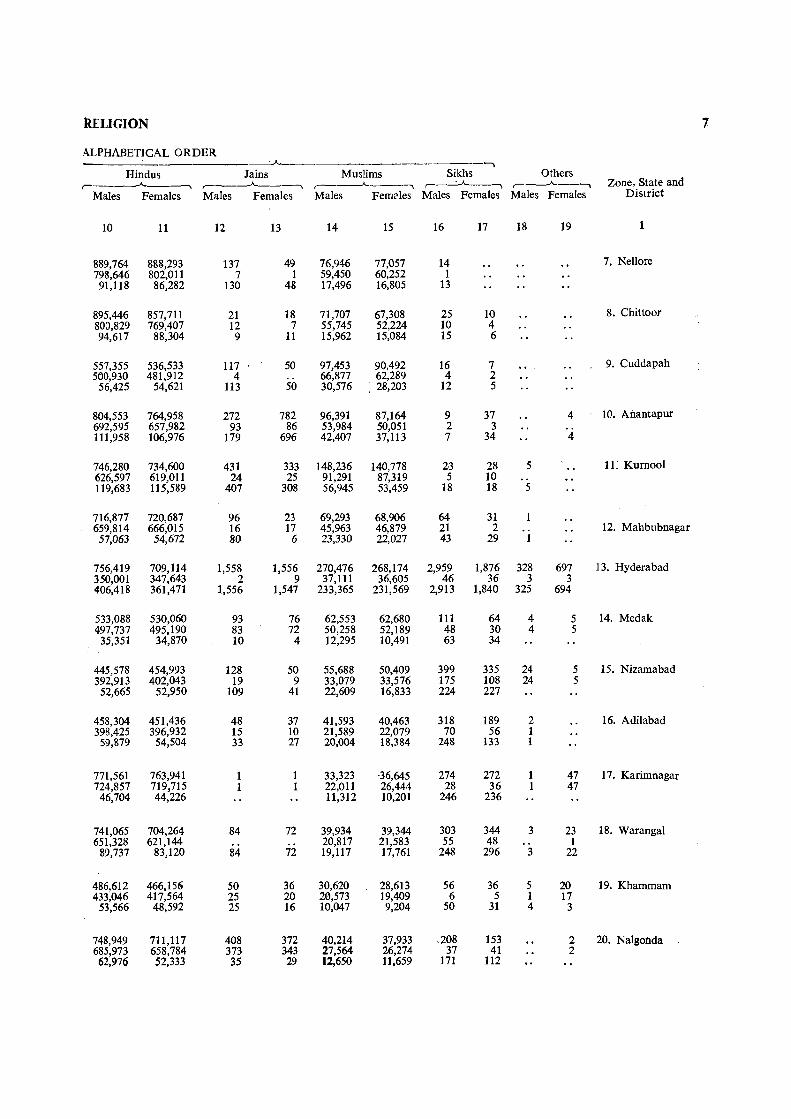
RELIGION 7
ALPHABETICAL ORDER ~-------------.,
Hindus Jains Muslims Sikhs Others , __ ----A-______ ,----A-______ ,--__ __.A_ ___ .-, r--~---' ,------'---, Zone, State and
Males Females Males Females Males Fem~les Males Females Males Females District
10 11 12 13 14 15 16 17 18 19 1
889,764 882,293 137 49 76,946 77,057 14 7. NeIIore 798,646 802,011 7 1 59,450 60,252 1 91,118 86,282 130 48 17,496 16,805 13
895,446 857,711 21 18 71,707 67,308 25 10 8. Chitto or 800,829 769,407 12 7 55,745 52,224 10 4 94,617 88,304 9 11 15,962 15,084 15 6
557,355 536,533 117 50 97,453 90,492 16 7 9. Cuddapah 500,930 481,912 4 .. 66,877 62,289 4 2
56,425 54,621 113 50 30,576 : 28,203 12 5
804,553 764,958 272 782 96,391 87,164 9 37 4 10. Ailantapur 692,595 657,982 93 86 53,984 50,051 2 3 111,958 106,976 179 696 42,407 37,113 7 34 4
746,280 734,600 431 333 148,236 140,778 23 28 5 It: Kurnool 626,597 619,011 24 25 91,291 87,319 5 10 119,683 115,589 407 308 56,945 53,459 18 18 5
716,877 720,687 96 23 69,293 68,906 64 31 659,814 666,015 16 17 45,963 46,879 21 2 12. Mahbubnagar
57,063 54,672 80 6 23,330 22,027 43 29 1
756,419 709,114 1,558 1,556 270,476 268,174 2,959 1,876 328 697 13. Hyderabad 350,001 347,643 2 9 37,111 36,605 46 36 3 3 406,418 361,471 1,556 1,547 233,365 231,569 2,913 1,840 325 694
533,088 530,060 93 76 62,553 62,680 111 64 4 5 14. Medak 497,737 495,190 83 72 50,258 52,189 48 30 4 5
35,351 34,870 10 4 12,295 10,491 63 34
445,578 454,993 128 50 55,688 50,409 399 335 24 5 15. Nizamabad 392,913 402,043 19 9 33,079 33,576 175 108 24 5
52,665 52,950 109 41 22,609 16,833 224 227
458,304 451,436 48 37 41,593 40,463 318 189 2 16. Adilabad 398,425 396,932 15 10 21,589 22,079 70 56 1
59,879 54,504 33 27 20,004 18,384 248 133 1
771,561 763,941 1 1 33,323 ·36,645 274 272 1 47 17. Karimnagar 724,857 719,715 1 1 22,011 26,444 28 36 1 47
46,704 44,226 11,312 10,201 246 236
741,065 704,264 84 72 39,934 39,344 303 344 3 23 18. Warangal 651,328 621,144 20,817 21,583 55 48 1
89,737 83,120 84 72 19,117 17,761 248 296 3 22
486,612 466,156 50 36 30,620 28,613 56 36 5 20 19. Khammam 433,046 417,564 25 20 20,573 19,409 6 5 1 17
53,566 48,592 25 16 10,047 9,204 50 31 4 3
748,949 711,117 408 372 40,214 37,933 208 153 2 20. Nalgonda 685,973 658,784 373 343 27,564 26,274 37 41 2 62,976 52,333 35 29 12,650 11,659 171 112
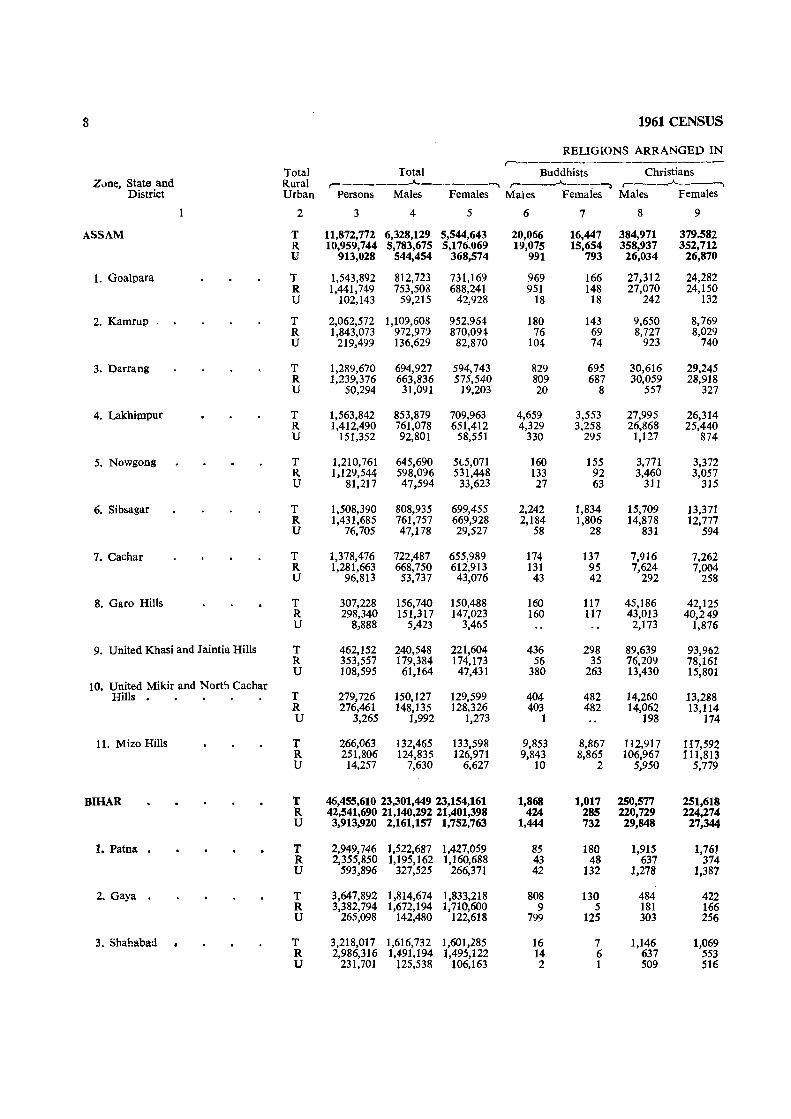
8 1961 CENSUS
RELIGIONS ARRANGED IN r-------------------
Tot,,-l Total Buddhists Christians Zone, State and Rural ,------_j...------, r--___..A..---:-~ ,-___ ..A.--.-,
District Urban Persons Males Females Males Females Males Females
1 2 3 4 5 6 7 8 9
ASSAM T 11,872,772 6,328,129 5,544,643 20,066 16,447 384,971 379.582 R 10,959,744 5,783,675 5,176,069 19,075 15,654 358,937 352,712 1J 913,028 544,454 368,574 991 793 26,034 26,870
1. Goalpara T 1,543,892 812,723 731,169 969 166 27,312 24,282 R 1,441,749 753,5013 688,241 951 148 27,070 24,150 U 102,143 59,215 42,928 18 18 242 132
2. Kamrup . T 2,062,572 1,109,608 952,964 180 143 9,650 8,769 R 1,843,073 972,979 870,094 76 69 8,727 8,029 U 219,499 136,629 82,870 104 74 923 740
3. Darrang T 1,289,670 694,927 594,743 829 695 30,616 29,245 R 1,239,376 663,836 575,540 809 687 30,059 28,918 U 50,294 31,091 19,203 20 8 557 327
4. Lakhilnpur T 1,563,842 853,879 709,963 4,659 3,553 27,995 26,314 R 1,412,490 761,078 651,412 4,329 3,258 26,868 25,440 U 151,352 92,801 58,551 330 295 1,127 874
5. Nowgong T 1,210,761 645,690 5(.5,071 160 155 3,771 3,372 R 1,129,544 598,096 531,448 133 92 3,460 3,057 U 81,217 47,594 33,623 27 63 311 315
6. Sibsagar T 1,508,390 808,935 699,455 2,242 1,834 15,709 13,371 R 1,431,685 761,757 669,928 2,184 1,806 14,878 12,777 U 76,705 47,178 29,527 58 28 831 594
7. Cachar T 1,378,476 722,487 655,989 174 137 7,916 7,262 R 1,281,663 668,750 612,913 131 95 7,624 7,004 U 96,813 53,737 43,076 43 42 292 258
8. Garo Hills T 307,228 156,740 150,488 160 117 45,186 42,125 R 298,340 151,317 147,023 160 117 43,013 40,249 U 8,888 5,423 3,465 2,173 1,876
9. United Khasi and Jaintia Hills T 462,152 240,548 221,604 436 298 89,639 93,962 R 353,557 179,384 174,173 56 35 76,209 78,161 U 108,595 61,164 47,431 380 263 13,430 15,801
10. United Mikir and North Cachar Hills . T 279,726 150,127 129,599 404 482 14,260 13,288
R 276,461 148,135 128,326 403 482 14,062 13,114 U 3,265 1,992 1,273 1 198 174
11. Mizo Hills T 266,063 132,465 133,598 9,853 8,867 112,917 117,592 R 251,806 124,835 126,971 9,843 8,865 106,967 111,813 U 14,257 7,630 6,627 10 2 5,950 5,779
BIHAR T 46,455,610 23,301,449 23,154,161 1,868 1,017 250,577 251,618 R 42,541,690 21,140,292 21,401,398 424 285 220,729 224,274 U 3,913,920 2,161,157 1,752,763 1,444 732 29,848 27,344
1. Patna . T 2,949,746 1,522,687 1,427,059 85 180 1,915 1,76! R 2,355,850 1,195,162 1,160,688 43 48 637 374 U 593,896 327,525 266,371 42 132 1,278 1,387
2. Gaya T 3,647,892 1,814,674 1,833,218 808 130 484 422 R 3,382,794 1,672,194 1,710,600 9 5 181 166 U 265,098 142,480 122,618 799 125 303 256
3. Shahabad T 3,218,017 1,616,732 1,601,285 16 7 1,146 1,069 R 2,986,316 1,491,194 1,495,122 14 6 637 .553 U 231,701 125,538 106,163 2 1 509 516
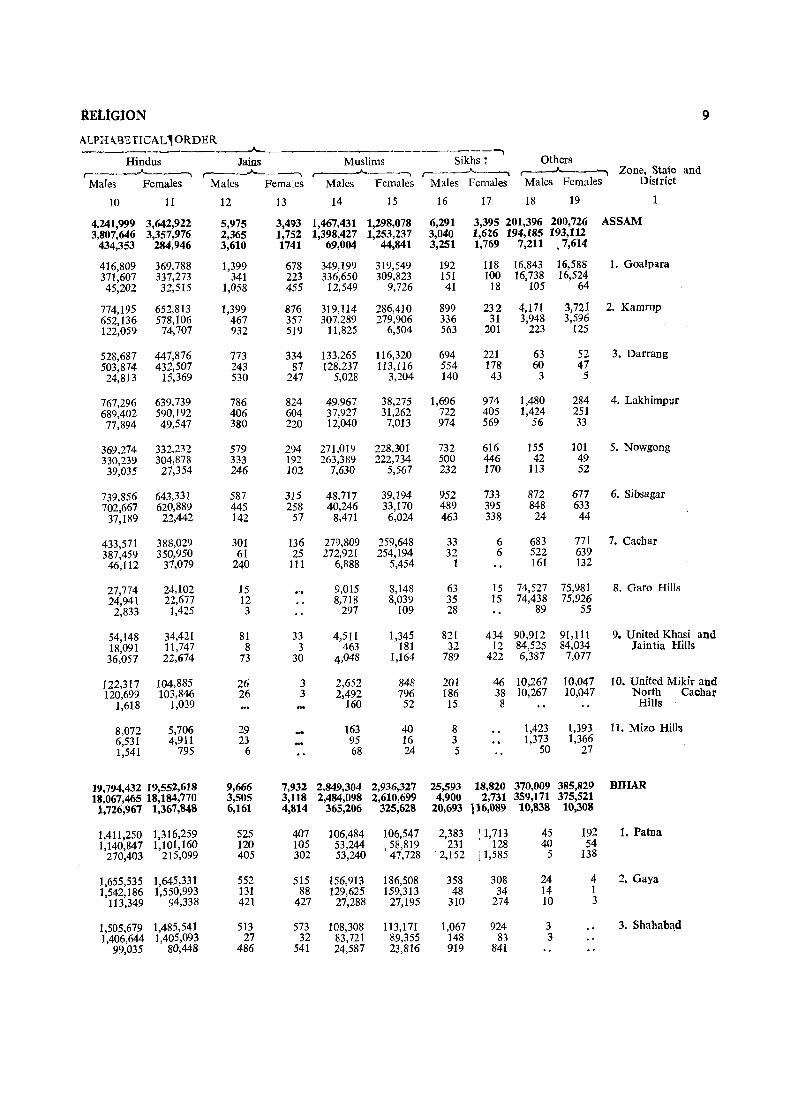
ltEtiGION 9
AlPH<\llETfCAL.,ORDER ________ - ____ --A--- -- ...... Hindus Jains Muslims Sikhs ~ Others
,--.....________., .A- I ,-----"----., , _ ___.A.. _________
r------"----...... Zone, State and Males Females Males Females Males Females Males Females Males Females District
10 11 12 13 14 15 16 17 18 19
4,241,999 3,642,922 5,975 3,493 1,467,431 1,298,078 6,291 3,395 201,396 200,726 ASSAM 3,807,646 3,357,976 2,365 1,752 1,398,427 1,253,237 3,040 1,6Z6 194,185 193,112
434,353 284,946 3,610 1741 69,004 44,841 3,251 1,769 7,211 .7,614
416,809 369,788 1,399 678 349,199 319,549 192 118 16,843 16,588 1. Goalpara 371,607 337,273 341 223 336,650 309,823 151 100 16,738 16,524 45,202 32,515 1,058 455 12,549 9,726 41 18 105 64
774,195 652,813 1,399 876 319,114 286,410 899 232 4,171 3,721 2. Kamrup 652,136 578,106 467 357 307,289 279,906 336 31 3,948 3,596 122,059 74,707 932 519 II,825 6,504 563 201 223 125
528,687 447,876 773 334 133,265 116,320 694 221 63 52 3. Darrang 503,874 432,507 243 87 128,237 113,116 554 178 60 47
24,813 15,369 530 247 5,028 3,204 140 43 3 5
767,296 639,739 786 824 49,967 38,275 1,696 974 1,480 284 4. Lakhimpur 689,402 590,192 406 604 37,927 31,262 722 405 1,424 251 77,894 49,547 380 220 12,040 7,013 974 569 56 33
369,274 332,232 579 294 271,019 228,301 732 616 155 101 5. Nowgong 330,239 304,878 333 192 263,389 222,734 500 446 42 49 39,035 27,354 246 102 7,630 5,567 232 170 113 52
739,856 643,331 587 315 48,717 39,194 952 733 872 677 6. Sibsagar 702,667 620,889 445 258 40,246 33,170 489 395 848 633
37,189 22,442 142 57 8,471 6,024 463 338 24 44
433,571 388,029 301 136 279,809 259,648 33 6 683 771 7. Cachar 387,459 350,950 61 25 272,921 254,194 32 6 522 639
46,112 37,079 240 111 6,888 5,454 1 161 132
27,774 24,102 15 9,015 8,148 63 15 74,527 75,981 8. Garo Hills 24,941 22,677 12 8,718 8,039 35 15 74,438 75,926
2,833 1,425 3 297 109 28 89 55
54,148 34,421 81 33 4,511 1,345 821 434 90,912 91,111 9. United Khasi and 18,091 11,747 8 3 463 181 32 12 84,525 84,034 Jain tia Hills 36,057 22,674 73 30 4,048 1,164 789 422 6,387 7,077
122,317 104,885 26 3 2,652 848 201 46 10,267 10,047 10. United Mikir and 120,699 103,846 26 3 2,492 796 186 38 10,267 10,047 North Cachall
1,618 1,039 160 52 15 8 Hills
8,072 5,706 29 163 40 8 1,423 1,393 11. Mizo Hills 6,531 4,911 23 95 16 3 1,373 1,366 1,541 795 6 68 24 5 50 27
19,794,432 19,552,618 9,666 7,932 2,849,304 2,936,327 25,593 18,820 370,009 385,829 BIHAR 18,067,465 18,184,770 3,505 3,118 2,484,098 2,610,699 4,90IJ 2,731 359,171 375,521
1,726,967 1,367,848 6,161 4,814 365,206 325,628 20,693 116,089 10,838 10,308
1,411,250 1,316,259 525 407 106,484 106,547 2,383 ; 1,713 45 192 1. Patna 1,140,847 1,101,160 120 105 53,244 1 58,819 231 128 40 54
270,403 215,099 405 302 53,240 47,728 2,152 [1,585 5 138
1,655,535 1,645,331 552 515 156,913 186,508 358 308 24 4 2. Gaya 1,542,186 1,550,993 131 88 129,625 159,313 48 34 14 1
113,349 94,338 421 427 27,288 27,195 310 274 10 3
1,505,679 1,485,541 513 573 108,308 113,171 1,067 924 3 3. Shahab!l;d 1,406,644 1,405,093 27 32 83,721 89,355 148 83 3
99,035 80,448 486 541 24,587 23,816 919 841
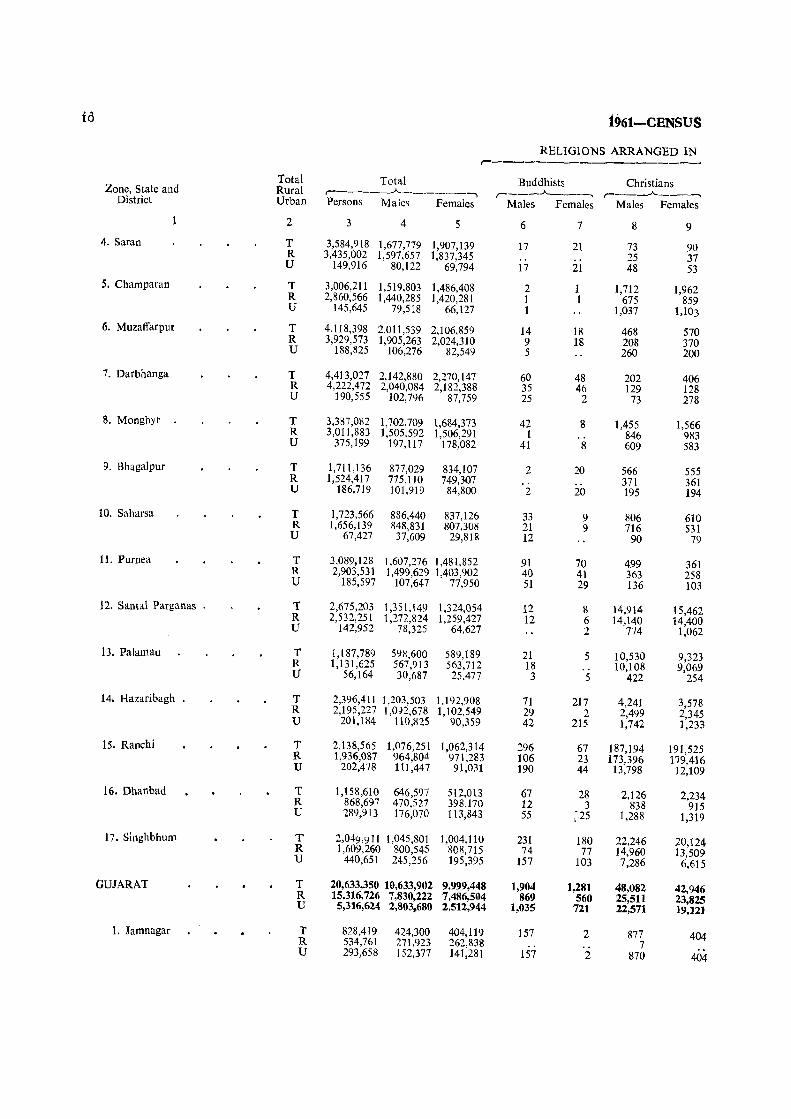
fd 1961-CENSUS
RELIGIONS ARRANGED IN r-----------------
Total Total Buddhists Christians Zone, State and Rural ,-_____ .A. ______ , , ___ .A. ___ , ,-----"--------, District Urban Persons Males Females Males Females Males Females
2 3 4 5 6 7 8 9 4. Saran T 3,584,918 1,677,779 1,907,139 17 21 73 90 R 3,435,002 1,597,657 1,837,345 25 37
U 149,916 80,122 69,794 17 21 48 53
S. Champaran T 3,006,211 1,519,803 1,486,408 2 1 1,712 1,962 R 2,860,566 1,440,285 1,420,281 1 1 675 859 U 145,645 79,518 66,127 1 1,037 1,103
6. Muzaffarpur T 4,118,398 2,011,539 2,106,859 14 18 468 570 R 3,929,573 1,905,263 2,024,310 9 18 208 370 U 188,825 106,276 82,549 5 260 200
7. Darbhanga T 4,413,027 2,142,880 2,270,147 60 48 202 406 R 4,222,472 2,040,084 2,182,388 35 46 129 128 U 190,555 102,796 87,759 25 2 73 278
8. Monghyr T 3,387,082 1,702,709 1,684,373 42 8 1,455 1,566 R 3,011,883 1,505,592 1,506,291 1 846 983 U 375,199 197,117 178,082 41 8 609 583
9. Bhagalpur T 1,711.136 877,029 834,107 2 20 566 555 R 1,524,417 775,110 749,307 371 361 U 186,719 101,919 84,800 2 20 195 194
10. Saharsa T 1,723,566 886,440 837,126 33 9 806 610 R 1,656,139 848,831 807,308 21 9 716 531 U 67,427 37,609 29,81R 12 90 79
11. Purnea T 3,089,128 1,607,276 1,481,852 91 70 499 361 R 2,903,531 1,499,629 1,403,902 40 41 363 258 U 185,597 107,647 77,950 51 29 136 103
12. Santal Parganas . T 2,675,203 1,35 \,149 1,324,054 12 8 14,914 15,462 R 2,532,251 1,272,824 1,259,427 12 6 14,140 14,400 U 142,952 78,325 64,627 2 774 1,062
13. Palamau T 1,187,789 598,600 589,189 21 5 10,530 9,323 R 1,131,625 567,913 563,712 18 .. 10,108 9,069 U 56,164 30,687 25,477 3 5 422 254
14. Hazaribagh . T 2,396,411 1,203,503 1,192,908 71 217 4,241 3,578 R 2,195,227 I,On,678 1,102,549 29 2 2,499 2,345 U 201,184 110,825 90,359 42 215 1,742 1,233
15. Ranchi T 2.138,565 1,076,251 1,062,314 296 67 187,194 191,525 R 1,936,087 964,804 971,283 106 23 173,396 179,416 U 202,478 111,447 91,031 190 44 13,798 12,109
16. Dhanbad T 1,158,610 646,597 512,013 67 28 2,126 2,234 R 868,697 470.527 398,170 12 3 838 915 U 289,913 176;070 113,843 55 ~25 1,288 1,319
17. Singhbhull1 T 2,049,911 1,045,801 1,004,110 231 180 22,246 20,124 R 1,609,260 800,545 808,715 74 77 14,960 13,509 U 440,651 245,256 195,395 157 103 7,286 6,615
GUJARAT T 20,633,350 10,633,902 9,999,448 1,904 1,281 48,082 42,946 R 15,316,726 7,830,222 7,486,504 869 560 25,511 23,825 U 5,316,624 2,803,680 2,512,944 1,035 721 22,571 19,121
1. Jamnagar T 828,419 424,300 404,119 157 2 877 404 R 534,761 271,923 262,838 .. 7 U 293,658 152,377 141,281 157 2 870 404
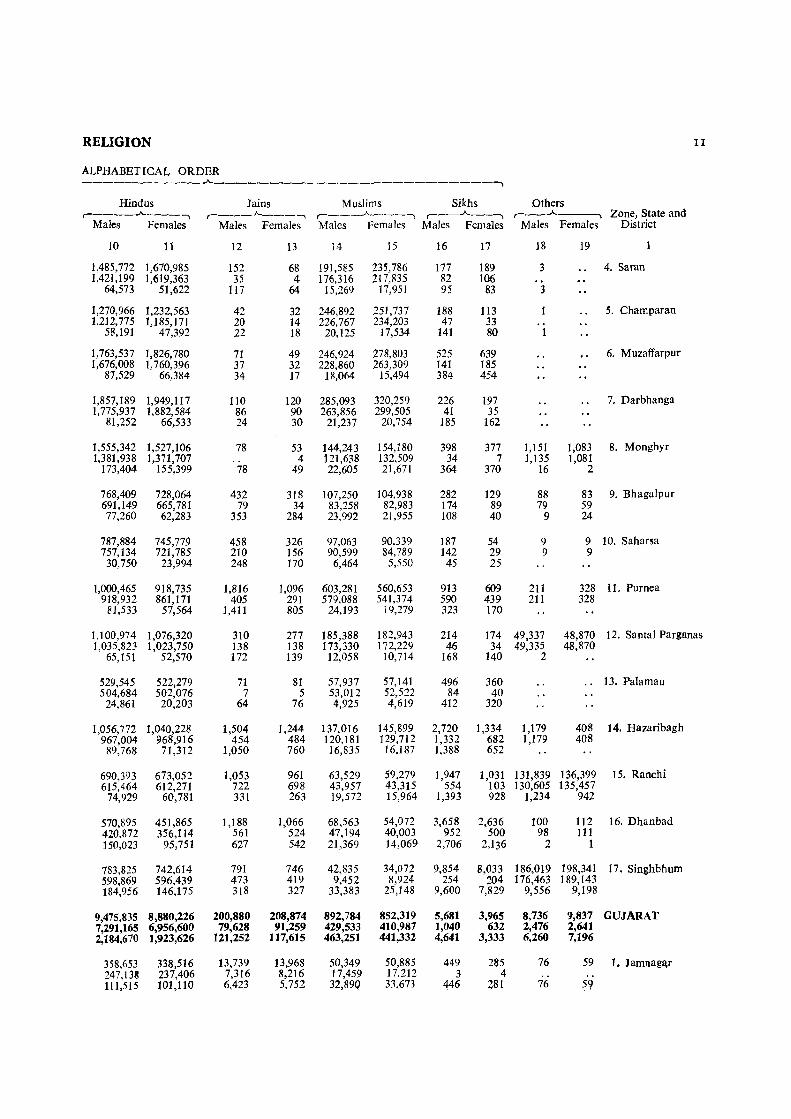
RELIGION II
ALPHABETICAL ORDER ___________ --A-_________________________ ,
Hindus Jains Muslims Sikhs Qthers r----_..-J\._---l ,--___ ..A-___ -, , __ __A. ___ , , __ .A-__ , , __ .A-_--., Zone, State and
Males Females Males Females Males Females Males Females Males Females District
10 11 12 13 14 15 16 17 18 19
1,485,772 1,670,985 152 68 191,585 235,786 177 189 3 4. Saran 1,421,199 1,619,363 35 4 176,316 217,835 82 106
64,573 51,622 117 64 15,269 17,951 95 83 3
1,270,966 1,232,563 42 32 246,892 251,737 188 113 5. Champaran 1,212,775 1,185,171 20 14 226,767 234,203 47 33
58,191 47,392 22 18 20,125 17,534 141 80 1
1,763,537 1,826,780 71 49 246,924 278,803 525 639 6. Muzaffarpur 1,676,008 1,760,396 37 32 228,860 263,309 141 185
87,529 66,384 34 17 18,064 15,494 384 454
1,857,189 1,949,117 110 120 285,093 320,259 226 197 7. Darbhanga 1,775,937 1,882,584 86 90 263,856 299,505 41 35
81,252 66,533 24 30 21,237 20,754 185 162
1,555,342 1,527,106 78 53 144,243 154,180 398 377 1,151 1,083 8. Monghyr 1,381,938 1,371,707 4 121,638 132,509 34 7 1,135 1,081
173,404 155,399 78 49 22,605 21,671 364 370 16 2
768,409 728,064 432 318 107,250 104,938 282 129 88 83 9. Bhagalpur 691,149 665,781 79 34 83,258 82,983 174 89 79 59 77,260 62,283 353 284 23,992 21,955 108 40 9 24
787,884 745,779 458 326 97,063 90,339 187 54 9 9 10. Saharsa 757,134 721,785 210 156 90,599 84,789 142 29 9 9
30,750 23,994 248 170 6,464 5,550 45 25
1,000,465 918,735 1,816 1,096 603,281 560,653 913 609 211 328 11. Purnea 918,932 861,171 405 291 579,088 541,374 590 439 211 328
81,533 57,564 1,411 805 24,193 19,279 323 170
1,100,974 1,076,320 310 277 185,388 182,943 214 174 49,337 48,870 12. Santa! Parganas 1,035,823 1,023,750 138 138 173,330 172,229 46 34 49,335 48,870
65,151 52,570 172 139 12,058 10,714 168 140 2
529,545 522,279 71 81 57,937 57,141 496 360 ., 13. Pa!amau 504,684 502,076 7 5 53,012 52,522 84 40
24,861 20,203 64 76 4,925 4,619 412 320
1,056,772 1,040,228 1,504 1,244 137,016 145,899 2,720 1,334 1,179 408 14. Hazaribagh 967,004 968,916 454 484 120,181 129,712 1,332 682 1,179 408 89,768 71,312 1,050 760 16,835 16,187 1,388 652
690,393 673,052 1,053 961 63,529 59,279 1,947 1,031 131,839 136,399 15. Ranchi 615,464 612,271 722 698 43,957 43,315 554 103 130,605 135,457
74,929 60,781 331 263 19,572 15,964 1,393 928 1,234 942
570,895 451,865 1,188 1,066 68,563 54,072 3,658 2,636 100 112 16. Dhanbad 420,872 356,114 561 524 47,194 40,003 952 500 98 111 150,023 95,751 627 542 21,369 14,069 2,706 2,136 2 1
783,825 742,614 791 746 42,835 34,072 9,854 8,033 186,019 198,341 17. Singhbhum 598,869 596,439 473 419 9,452 8,924 254 204 176,463 189,143 184,956 146,175 318 327 33,383 25,148 9,600 7,829 9,556 9,198
9,475,835 8,880,226 200,880 208,874 892,784 852,319 5,681 3,965 8,736 9,837 GUJARAT 7,291,165 6,956,600 79,628 91,259 429,533 410,987 1,040 632 2,476 2,641 2,184,670 1,923,626 121,252 117,615 463,251 441,332 4,641 3,333 6,260 7,196
358,653 338,516 13,739 13,968 50,349 50,885 449 285 76 59 1. ]amnagl\r 247,138 237,406 7,316 8,216 17,459 17,212 3 4 111,515 101,110 6,423 5,752 32,89Q 33,673 446 281 76 59
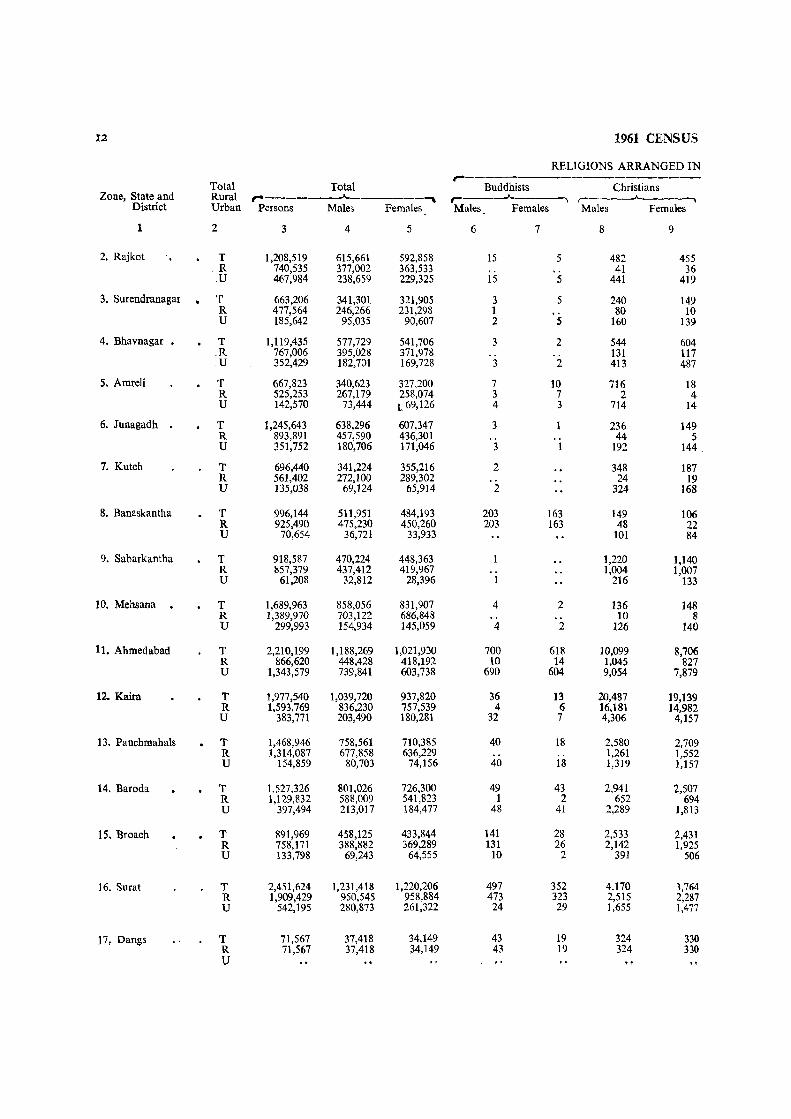
12 1961 CENSUS
RELIGIONS ARRANGED IN
Total Total ,-
Buddhists Christians Zone, State and Rural ~------~-------~ ,------"------, ,------"-------..
District Urban Persons Males Females Males Females Males Females
1 2 3 4 5 6 7 8 9
2. Rajkot T 1,208,519 615,661 592,858 15 5 482 455 R 740,535 377,002 363,533 41 36 U 467,984 238,659 229,325 15 5 441 419
3. Surendranagar • T 663,206 341,301 321,905 3 5 240 149 R 477,564 246,266 231,298 1 80 10 U 185,642 95,035 90,607 2 5 160 139
4. Bhavnagar • T 1,119,435 577,729 541,706 3 2 544 604 .R 767,006 395,028 371,978 .. 131 117 U 352,429 182,701 169,728 3 2 413 487
5. Amreli T 667,823 340,623 327,200 7 10 716 18 R 525,253 267,179 258,074 3 7 2 4 U 142,570 73,444 l69,126 4 3 714 14
6. Junagadh . T 1,245,643 638,296 607,347 3 236 149 R 893,891 457,590 436,301 .. 44 5 U 351,752 180,706 171,046 3 1 192 144
7. Kutch T 696,440 341,224 355,216 2 348 187 R 561,402 272,100 289,302 24 19 U 135,038 69,124 65,914 2 324 168
8. Banaskantha T 996,144 511,951 484,193 203 163 149 106 R 925,490 475,230 450,260 203 163 48 22 U 70,654 36,721 33,933 101 84
9. Sabarkantha T 918,587 470,224 448,363 1,220 1,140 R 857,379 437,412 419,967 .. 1,004 1,007 U 61,208 32,812 28,396 1 216 133
10. Mehsana . T 1,689,963 858,056 831,907 4 2 136 148 R 1,389,970 703,122 686,848 .. 10 8 U 299,993 154,934 145,059 4 2 126 140
11. Ahmedabad T 2,210,199 1,188,269 1,021,930 700 618 10,099 8,706 R 866,620 448,428 418,192 10 14 1,045 827 U 1,343,579 739,841 603,738 690 604 9,054 7,879
12. Kaira T 1,977,540 1,039,720 937,820 36 13 20,487 19,139 R 1,593,769 836,230 757,539 4 6 16,181 14,982 U 383,771 203,490 180,281 32 7 4,306 4,157
13. Panchmaha1s T 1,468,946 758,561 710,385 40 18 2,580 2,709 R 1,314,087 677,858 636,229 .. 1,261 1,552 U 154,859 80,703 74,156 40 18 1,319 1,157
14. Baroda T 1,527,326 801,026 726,300 49 43 2,941 2,507 R 1,129,832 588,009 541,823 1 2 652 694 U 397,494 213,017 184,477 48 41 2,289 1,813
15. Broach T 891,969 458,125 433,844 141 28 2,533 2,431 R 758,171 388,882 369,289 131 26 2,142 1,925 U 133,798 69,243 64,555 10 2 391 506
16. Surat T 2,451,624 1,'231,418 1,220,206 497 352 4,170 3,764 R 1,909,429 950,545 958,884 473 323 2,515 2,287 U 542,195 280,873 261,322 24 29 1,655 1,477
P, Dangs T 71,567 37,418 34,149 43 19 324 330 R 71,567 37,418 34,149 43 19 324 330 U "

RELIGION 13
ALPHABETICAL ORDER _____ ~ ____ ..A. -. Hindus Jains Muslims Sikhs Others
,~ ___ ..A... __ --, ,...--_....A. ___ --, r----A------, r----"------. ,-_____"'_----, Zone, State and Males Females Males Females Males Females Males Females Males Females District
10 11 12 13 14 15 16 17 18 19
540,007 513,883 13,697 14,138 61,173 64,174 177 105 110 98 2. Rajkot 351,890 338,686 1,706 1,771 23,345 23,031 14 5 6 4 188,117 175,197 11,991 12,367 37,828 41,143 163 100 104 94
305,629 286,786 13,471 13,838 21,868 21,074 69 43 21 10 3. Surendranagar 232,146 217,770 2,876 2,888 11,159 10,629 1 3 1 73,483 69,016 10,595 10,950 10,709 10,445 68 43 ]8 9
521,192 486,799 18.276 17,928 37,481 36,198 128 71 105 104 4. Bhavnagar 377,661 355,034 5,006 5,142 12,198 11,658 30 24 2 3 143,531 131,765 13,270 12,786 25,283 24,540 98 47 103 101
317,605 304,486 2,622 3,357 19,653 19,322 14 4 6 3 5. Amreli 257,691 248,835 1,071 1,152 8,404 8,074 8 2 .. 59,914 55,651 1,551 2,205 11,249 11,248 6 2 6 3
570,924 540,581 4,120 4,478 62,825 61,978 165 117 23 43 6. Junagadh 432,281 412,074 866 959 24,348 23,253 50 8 1 2 138,643 128,507 3,254 3,519 38,477 38,725 115 109 22 41
249,704 253,092 26,328 37,287 64,630 64,518 160 101 52 31 7. Kutch 199,362 206,876 22,886 33,472 49,801 48,928 27 6 1
50,342 46,216 3,442 3,815 14,829 15,590 133 95 52 30
461,745 434,208 14,995 15,096 34,796 34,565 34 19 29 36 8. Banaskantha 437,266 412,550 10,885 10,830 26,808 26,683 17 10 3 2 24,479 21,658 4,110 4,266 7,988 7,882 17 9 26 34
441.278 420,746 5,172 5,360 22,485 21,073 65 44 3 .. 9. Sabarkantha 418,226 402,027 3,473 3,759 14,685 13,159 24 15 23,052 18,719 1,699 1,601 7,800 7,914 41 29 3
794,651 767,766 13,177 13,543 49,900 50,298 177 142 11 8 10. Mehsana 664,627 647,716 6,454 7,041 32,000 32,073 30 6 1 4 130,024 120,050 6,723 6,502 17,900 18,225 147 136 10 4
1,000,387 859,429 42,669 39,194 131,194 111,367 2,077 1,482 1,143 1,134 11. Ahmedabad 425,335 395,994 4,432 4,500 17,447 16,777 153 72 6 8 575,052 463,435 38,237 34,694 113,747 94,590 1,924 1,410 1,137 1,126
917,967 825,836 8,353 8,155 92,526 84,416 281 201 70 60 12. Kaira 759,471 687,166 3,316 3,180 57,168 52,131 84 64 6 10 158,496 138,670 5,037 4,975 35,358 32,285 197 137 64 50
721,453 673,934 2,245 2,120 31,832 31,272 269 210 142 122 13. Panchmahals 665,533 625,598 731 481 10,279 8,571 35 18 19 9 55,920 48,336 1,514 1,639 21,553 22,701 234 192 123 113
726,513 660,176 7,605 6,977 62,986 55,894 556 368 376 335 14. Baroda 551,760 509,610 2,295 2,120 33,205 29,344 58 27 38 26 174,753 150,566 5,310 4,857 29,781 26,550 498 341 338 309
379,140 358,665 2,647 2,558 72,896 69,376 181 93 587 693 15. Broach 328,708 312,161 1,865 1,809 55,786 53,171 67 24 183 173
50,432 46,504 782 749 17,110 16,205 114 69 404 520
1,132,447 1,121,915 11,750 10,867 75,752 75,569 844 658 5,958 7,081 16. Surat 905,530 913,689 4,436 3,929 35,003 35,953 404 325 2,184 2,378 226,917 208,226 7,314 6,938 40,749 39,616 440 333 3,774 4,703
36,540 33,408 14 10 438 340 35 22 24 20 17. Dangs 36,540 33,408 14 10 438 340 35 22 24 20
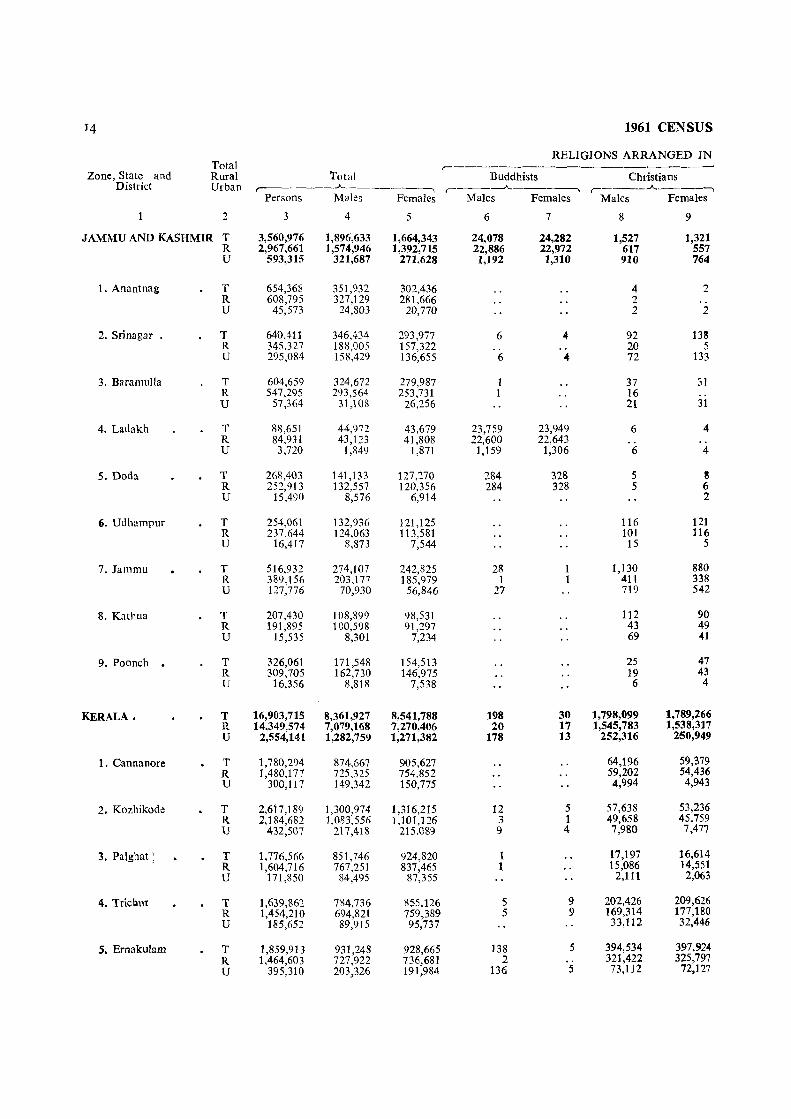
I4 1961 CENSUS
RELIGIONS ARRANGED IN Total r-------------------------
Zone, State and Rural Total Buddhists Christians District Urban ,------~-------~ r-------A-----~ , ____ . ..A.. ____ --,
Persons Males Females Males Females Males Females
2 3 4 5 6 7 8 9
JAMMU AND KASHMIR T 3,560,976 1,896,633 1,664,343 24,078 24,282 1,527 1,321 R 2,967,661 1,574,946 1,392,715 22,886 22,972 617 557 U 593,315 321,687 271,628 1,192 1,310 910 764
1. Anantnag T 654,368 351,932 302,436 4 2 R 608,795 327,129 281,666 2 " U 45,573 24,803 20,770 2 2
2. Srinagar • T 640,411 346.434 293,977 6 4 92 138 R 345,327 188,005 157,322 .. 20 5 U 295,084 158,429 136,655 6 4 72 133
3. Baramulla T 604,659 324,672 279,987 1 37 31 R 547,295 293,564 253,731 1 16 U 57,364 31,108 26,256 21 31
4, Ladakh T 88,651 44,972 43,679 23,759 23,949 6 4 R 84,931 43,123 41,808 22,600 22,643 U 3,720 1,849 1,871 1,159 1,306 6 4
5. Doda T 268,403 141,133 127,270 284 328 5 8 R 252,913 132,557 120,356 284 328 5 6 U 15,490 8,576 6,914 2
6. Udhampur T 254,061 132,936 121,125 116 121 R 237,644 124,063 113,581 101 116 U 16,417 8,873 7,544 15 5
7. Jammu T 516,932 274,107 242,825 28 1 1,130 880 R 389,156 203,177 185,979 1 1 411 338 U 1'27,776 70,930 56,846 27 719 542
8. Kathua T 207,430 108,899 98,531 112 90 R 191,895 100,598 91,297 43 49 U 15,535 8,301 7,234 69 41
9. Poonch . T 326,061 171,548 154,513 25 47 R 309,705 162,730 146,975 19 43 U 16,356 8,818 7,538 6 4
KERALA. T 16,903,715 8,361,927 8,541,788 198 30 1,798,099 1,789,266 R 14,349,574 7,079,168 7,270,406 20 17 1,545,783 1,538,317 U 2,554,141 1,282,759 1,271,382 178 13 252,316 250,949
1. Cannanore T 1,780,294 874,667 905,627 64,196 59,379 R 1,480,177 725,325 754,852 59,202 54,436 U 300,117 149,342 150,775 4,994 4,943
2. Kozhikode T 2,617,189 1,300,974 1,316,215 12 5 57,638 53,236 R 2,184,682 1,083,556 1,101,126 3 1 49,658 45,759 U 432,5()7 217,418 215,089 9 4 7,980 7,477
3. Palghat; T 1,776,566 851,746 924,820 1 17,197 16,614 R 1,604,716 767,251 837,465 1 15,086 14,551 U 171,850 84,495 87,355 2,111 2,063
4. Trichut T 1,639,862 784,736 855,126 5 9 202,426 209,626 R 1,454,210 694,821 759,389 5 9 169,314 177,180 U 185,652 89,915 95,737 33,112 32,446
S. Ernakulam T 1,859,913 931,248 928,665 138 5 394,534 397,924 R 1,464,603 727,922 736,681 2 321,422 325,797 U 395,310 203,326 191,984 136 5 73,112 72,127
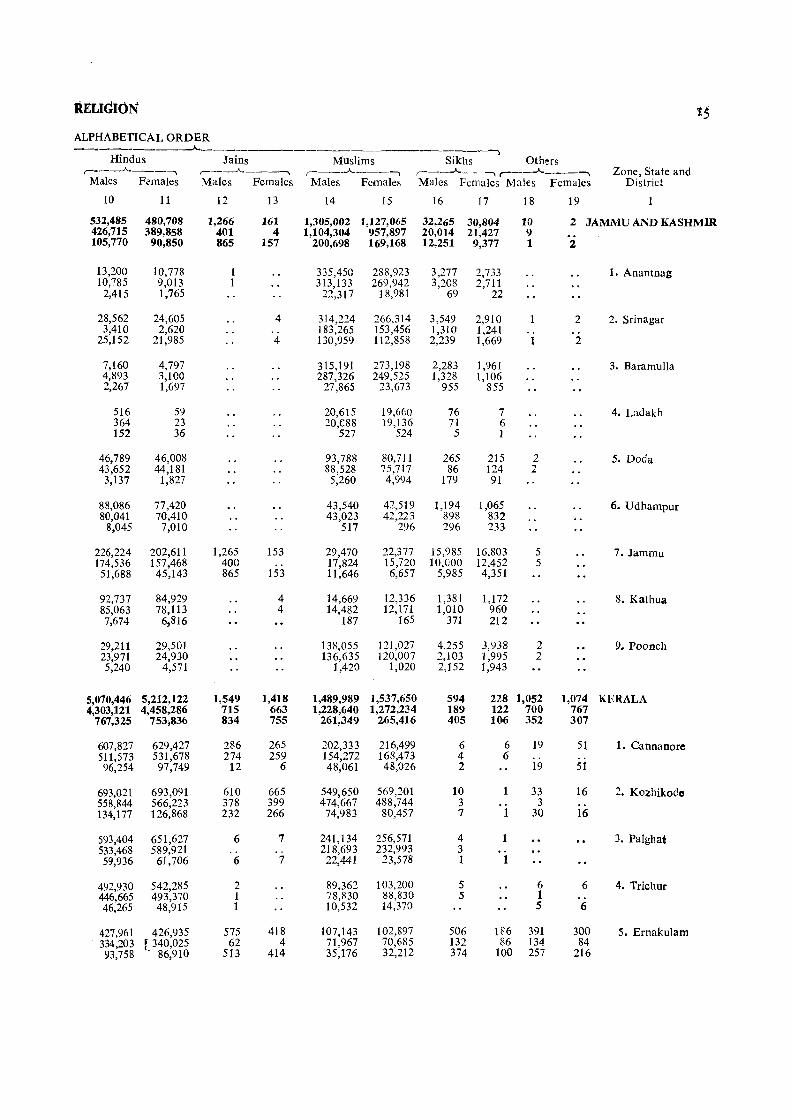
RELIGION IS ALPHABETICAL ORDER ----------___j..-----------------------------,
Hindus Jains Muslims Sikhs Others r-----"--------... ,------"----~ r---. .A.-----, r---.A._--, r--.A.---""",\ Zone, State and
Males F."males Males Females Males Females Males Females Males Females District
10 11 12 13 14 15 16 17 18 19
532,485 480,708 1,266 161 1,305,002 1,127,065 32,265 30,804 10 2 JAMMU AND KASHMIR 426,715 389,858 401 4 1,104,304 957,897 20,014 21,427 9 105,770 90,850 865 157 200,698 169,168 12,251 9,377 1 2
13,200 10,778 1 335,450 288,923 3,277 2,733 1. Anantnag 10,785 9,013 1 313,133 269,942 3,2G8 2,711
2,415 1,765 22,317 18,981 69 22
28,562 24,605 4 314,224 266,314 3,549 2,910 2 2. Srinagar 3,410 2,620 183,265 153,456 1,310 1,241
25,152 21,985 4 130,959 112,858 2,239 1,669 2
7,160 4,797 315,191 273,198 2,283 1,961 3. Baramulla 4,893 3,100 287,326 249,525 1,328 1,106 2,267 1,697 27,865 23,673 955 855
516 59 20,615 19,660 76 7 4. Ladakh 364 23 20,088 19,136 71 6 152 36 527 524 5 1
46,789 46,008 93,788 80,711 265 215 2 S. Doda 43,652 44,181 88,528 75,717 86 124 2 3,137 1,827 5,260 4,994 179 91
88,086 77,420 43,540 42,519 1,194 1,065 6. Udhampur 80,041 70,410 43,023 42,223 898 832
8,045 7,010 517 296 296 233
226,224 202,611 1,265 153 29,470 22,377 15,985 16,803 5 7. Jammu 174,536 157,468 400 .. 17,824 15,720 10,000 12,452 5 51,688 45,143 865 153 11,646 6,657 5,985 4,351
92,737 84,929 4 14,669 12,336 1,381 1,172 8. Kalhua 85,063 78,113 4 14,482 12,171 1,010 960 7,674 6,816 187 165 371 212
29,211 29,501 138,055 121,027 4,255 3,938 2 9. Poonch 23,971 24,930 136,635 120,007 2,103 1,995 2 5,240 4,571 1,420 1,020 2,152 1,943
5,070,446 5,212,122 1,549 1,418 1,489,989 1,537,650 594 228 1,052 1,074 KERALA 4,303,121 4,458,286 715 663 1,228,640 1,272,234 189 122 700 767
767,325 753,836 834 755 261,349 265,416 405 106 352 307
607,827 629,427 286 265 202,333 216,499 6 6 19 51 1. Cannanore 511,573 531,678 274 259 154,272 168,473 4 6 96,254 97,749 12 6 48,061 48,026 2 19 51
693,021 693,091 610 665 549,650 569,201 10 33 16 2. Kozhikode 558,844 566,223 378 399 474,667 488,744 3 3 134,177 126,868 232 266 74,983 80,457 7 1 30 16
593,404 651,627 6 7 241,134 256,571 4 1 3. PaIghat 533,468 589,921 218,693 232,993 3 59,936 61,706 6 7 22,441 23,578 1 1
492,930 542,285 2 89,362 103,200 5 6 6 4. Trichur 446,665 493,370 1 78,830 88,830 5 1 46,265 48,915 1 10,532 14,370 5 6
427,961 426,935 575 418 107,143 102,897 506 186 391 300 5. ErnakuJam 334,203 f 340,025 62 4 71,967 70,685 132 86 134 84 93,758 - 86,910 513 414 35,176 32,212 374 100 257 216

16 1961 CENSUS
RELIGIONS ARRANGED IN
total ,----------------------
Total Buddhists Christians Zone, State and Rural ~-----~------, ,-----''-----, ,-----''-----,
District Urban Persons Males Females Males Females Males Females
2 3 4 5 6 7 8 9
6. Kottayam. T 1,732,880 882,580 850,300 3 414,881 403,058 R 1,567,411 798,454 768,957 3 378,635 366,789 U 165,469 84,126 81,343 36,246 36,269
7. Alleppey T 1,811,252 893,435 917,817 29 256,311 259,089 R 1,500,821 739,248 761,573 2 216,762 218,355 U 310,431 154,187 156,244 27 39,549 40,734
8. Quilon T 1,941,228 972,657 968,571 2 3 235,539 236,466 R 1,796,992 898,746 898,246 1 3 217,772 219,009 U 144,236 73,911 70,325 1 17,767 17,457
9. Trivandrum T 1,744,531 869,884 874,647 8 7 155,377 153,874 R 1,295,962 643,845 652,117 3 3 117,932 116,441 U 448,569 226,039 222,530 5 4 37,445 37,433
MADHYA PRADESH T 32,372,408 16,578,204 15,794,204 57,238 56,127 95,804 92,510 R 27,745,174 14,085,038 13,660,136 47,959 47,181 63,846 65,381 U 4,627,234 2,493,166 2,134,068 9,279 8,946 31,958 27,129
1. Morena T 783,348 426,061 357,287 9 1 79 35 R 716,221 388,901 327,320 9 1 56 12 U 67,127 37,160 29,967 23 23
2. Bhind T 641,169 346,797 294,372 6 4 11 13 R 593,516 320,175 273,341 2 4 1 1 U 47,653 26,622 21,031 4 10 12
3. Gwalior T 657,876 353,813 304,063 49 49 538 485 R 333,428 178,648 154,780 38 25 U 324,448 175,165 149,283 49 49 SOO 460
4. Datia T 200,467 105,640 94,827 238 218 12 20 R 171,037 90,264 80,773 11 13 5 7 U 29,430 15,376 14,054 227 205 7 13
5. Shivpuri T 557,954 295,543 262,411 4 1 24 II R 519,072 274,718 244,354 4 I 15 4 U 38,882 20,825 18,057 9 7
6. Guna. T 595,825 313,814 282,011 5 54 199 R 520,955 274,021 246,931 2 5 155 U 74,870 39,790 35,080 3 49 44
7. Tikamgarh T 455,662 239,035 216,627 122 31 R 435,193 228,339 206,854 76 12' U 20,469 10,696 9,773 46 19
8. Chhatarpur T 587,373 310,653 276,720 241 191: R 531,054 280,559 250,495 58 48: U 56,319 30,094 26,225 183 1431
9. Panna T 331,257 170,942 160,315 47 31 R 314,520 162,132 152,388 19 11 U 16,737 8,810 7,927 28 20
10. Satna T 694,370 353,430 340,940 6 8 lR5 133 R 630,916 318,866 312,050 27 11 U 63,454 34,564 28,890 6 8 158 122
11. Rewa T 772,602 388,887 383,715 r2 4 160 146 R 729,537 364,483 365,054 15 14 U 43,065 24,404 18,661 2 4 145 131
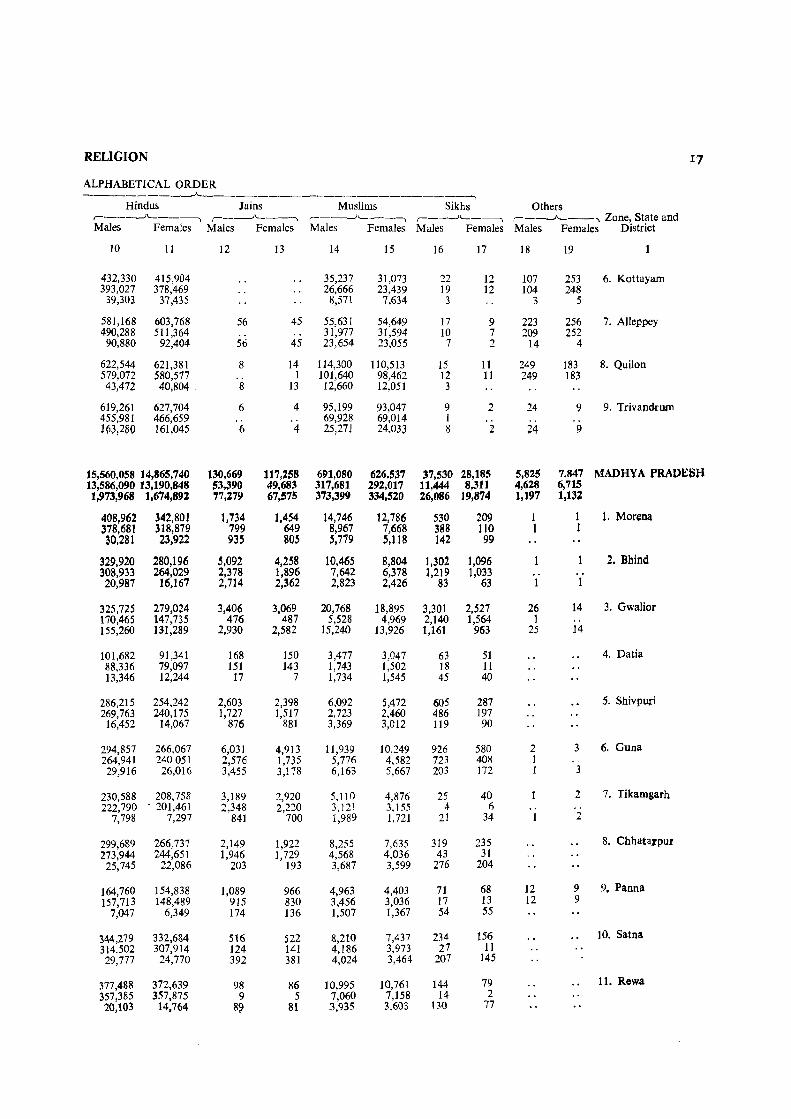
RELIGION 17
ALPHABETICAL ORDER --_______ -A ________________________ ~
Hindus Jains Muslims Sikhs Others r---____;"'__--~ r-__)"'__---, r----_)\..._--~ r-----'I.._-~ r-----"--_.., Zone, State and Males Females Males Females Males Females Males Females Males Females District
10 11 12 13 14 15 16 17 18 19
432,330 415,904 35,237 31,073 22 12 107 253 6. Kottayam 393,027 378,469 26,666 23,439 19 12 104 248
39,303 37,435 8,571 7,634 3 3 5
581,168 603,768 56 45 55,631 54,649 17 9 223 256 7. Alleppey 490,288 511,364 .. 31,977 31,594 10 7 209 252
90,880 92,404 56 45 23,654 23,055 7 2 14 4
622,544 621,381 8 14 114,300 110,513 15 11 249 183 8. Quilon 579,072 580,577 1 101,640 98,462 12 11 249 183 43,472 40,804 . 8 13 12,660 12,051 3
619,261 627,704 6 4 95,199 93,047 9 2 24 9 9. Trivandrll:lD 455,981 466,659 .. 69,928 69,014 1 .. . . 163,280 161,045 6 4 25,271 24,033 8 2 24 9
15,560,058 14,865,740 130,669 117,258 691,080 626,537 37,530 28,185 5,825 7.847 MADHYA PllAPESH 13,586,090 13,190,848 53,390 49,683 317,681 292,017 11,444 8,311 4,628 6,715 1,973,968 1,614,892 '17,279 67,575 373,399 334,520 26,086 19,874 1,197 1,132
408,962 342,801 1,734 1,454 14,746 12,786 530 209 1 1 1. MorCIlll 378,681 318,879 799 649 8,967 7,668 388 110 1 1 30,281 23,922 935 80S 5,779 5,118 142 99
329,920 280,196 5,092 4,258 10,465 8,804 1,302 1,096 2. Bhind 308,933 264,029 2,378 1,896 7,642 6,378 1,219 1,033 20,987 16,167 2,714 2,362 2,823 2,426 83 63 1 1
325,725 279,024 3,406 3,069 20,768 18,895 3,301 2,527 26 14 3. Gwalior 170,465 147,735 476 487 5,528 4,969 2,140 1,564 1 .. 155,260 131,289 2,930 2,582 15,240 13,926 1,161 963 25 14
101,682 91,341 168 150 3,477 3,047 63 51 4. Dalia 88,336 79,097 151 143 1,743 1,502 18 11 13,346 12,244 17 7 1,734 1,545 45 40
286,215 254,242 2,603 2,398 6,092 S,472 605 287 S. Shivpuri 269,763 240,175 1,727 1,517 2,723 2,460 486 197
16,452 14,067 876 881 3,369 3,012 119 90
294,857 266,067 6,031 4,913 11,939 10,249 926 580 2 3 6. Guoa 264,941 240051 2,576 1,735 5,776 4,582 723 408 1 29,916 26,016 3,455 3,178 6,163 5,667 203 172 1 3
230,588 208,758 3,189 2,920 5.11n 4,876 25 40 2 7. Tikamgarh 222,790 " 201,461 2,348 2,220 3,121 3,155 4 6 ..
7,798 7,297 841 700 1,989 1,721 21 34 1 2
299,689 266.737 2,149 1,922 8,255 7,635 319 235 8. Chhatal'Pur 273,944 244;651 1,946 1,729 4,568 4,036 43 31
25,745 22,086 203 193 3,687 3,599 276 204
164,760 154,838 1,089 966 4,963 4,403 71 68 12 9 9. Panna 157,713 148,489 915 830 3,456 3,036 17 13 12 9
7,047 6,349 174 136 1,507 1,367 54 55
~44,279 332,684 516 522 8,210 7,437 234 156 10. Satna 314.502 307,914 124 141 4,186 3,973 27 11 29,777 24,770 392 381 4,024 3,464- 207 145
377,488 372,639 98 86 10,995 10,761 144 79 11. Rewa 357,385 357,875 9 5 7,060 7,158 14 2 20,103 14,764 89 81 3,935 3,603 130 77
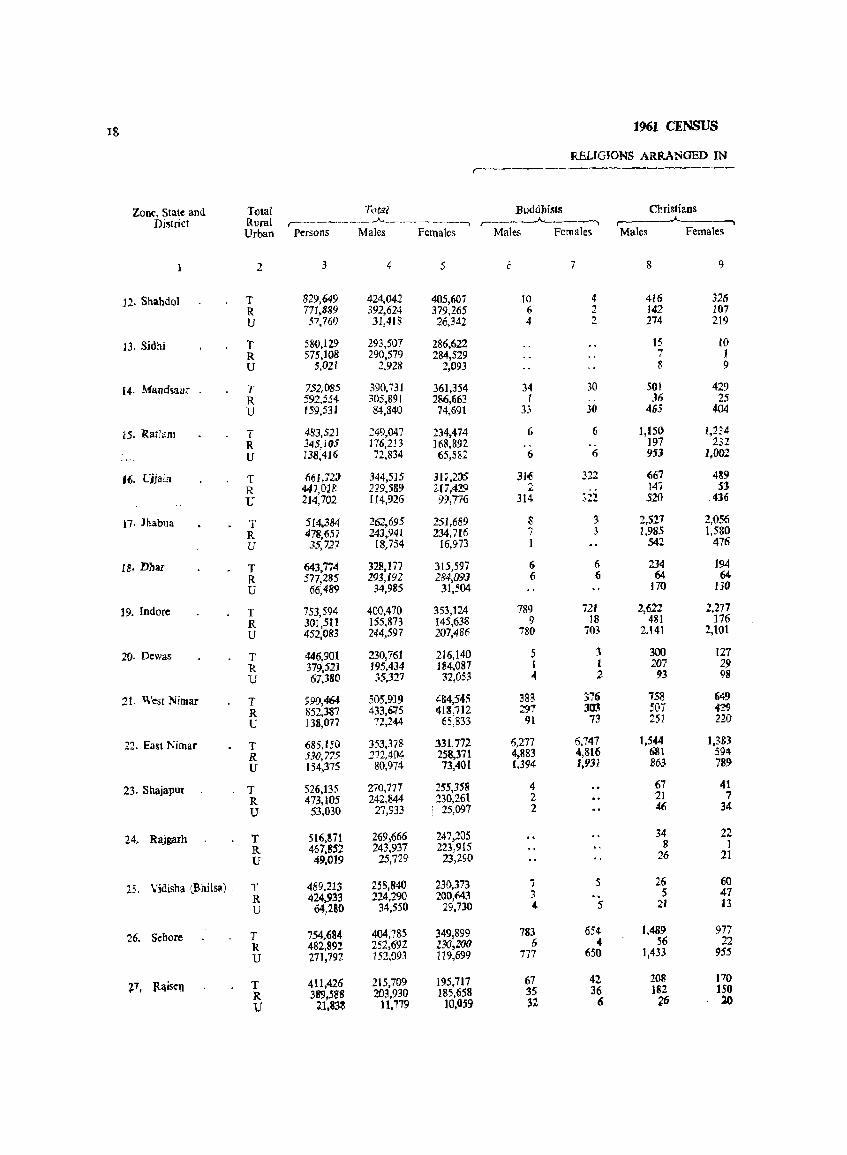
IS 1961 CENSUS
RELIGIONS ARRANGED IN ,------~---------
Zone, State and Total Total Buddhists Christians District Rural
,---_______ ~ __ _.A_ _____ ~_~ ___ _, ,----____,._______--, ,---___ .A.
Urban Persons Males Females Males Females Males Females
2 3 4 5 C 7 8 9
J2. Shahdol T 829,649 424,042 405,607 10 4 416 326 R 771,889 392,624 379,265 6 2 142 107 U 57,761) 31,418 26,342 4 2; 214 219
13. 8idhj T 580,129 293,507 286,622 15 10 R 575,108 290,579 284,529 7 1 U 5,021 2,928 2,093 8 9
14. Mandsaur T 7.52,085 390,731 361,354 34 30 501 429 R 592,554 305,B91 286,663 r -- 36 25 U r 59,531 84,840 74,691 33 31} 465 404
15. Ratlam T 483,521 ~49,047 234,474 6 6 1,.50 1,214 R 345.W5 176,213 168,892 .. .. 197 232
U 138;416 72,834 65,582 6 6 953 1,002
16. Cjjai.:, T 661,72::1 344,515 311,2;)5 316 322 667 489 R 44?,On 215';589 217,429 ;: 14,/ 53
U 214,702 114,926 99,77'6 314 ... , 520 .436 ~""-,,,
n. Jha.bua T 5[4,384 162,695 251,689 S 3 2,527 2,{)56 R 478,657 243,941 234,716 7 .3 1,985 1,580 U 35,727 IS,754 16,975 542 476
IS. Dbar T 643,774 328,177 315,597 6 6 234 194
R 577,285 193,192 284,{)9J 6 6 64 64 U 66,489 34,985 31,504 170 130
19. Indore T 753,594 400,470 353,124 789 721 2,622 2,277
R 301,511 155,873 145,638 9 18 481 176
U 452,083 244,597 207,486 780 703 2.141 2,101
20. Dewas T 446,901 230,761 216,140 5 3 300 127 R 379,521 J95,434 184,087 1 I 2()7 29 U 67,380 35,327 32,053 " 2 93 98
21. West Nilllar T 5:90,464 505,919 oj:&4,545 m. 376 7$8 649
R 852,387 433,6.75 418,112 297 303 507 429 U 138,07/ 72,244 65,833 91 73 251 220
22. East Nimar T 685,150 353,378- 331.772 6,277 6,747 1,544 1,3&3
R 5J(),775 271,404 258,371 4,~83 4,816 681 594
U 154,375 80,974 73,401 {,394 1,931 863 789
23. Shajaput T 526,135 270,771 255,358 4 67 41
R 473,105 242.844 230,261 2 21 7
U 53,030 27,933 , 25,097 2 46 34
24. Rajgarh T 516,871 269,666 247,205 34 22 R 467,g52 243,937 223,915 8 1
U 49,019 25,729 23,290 26 21
25. Vidisha -lBhilS<1) . T 489,213 2511,840 230,373 7 :S 26 60
R 424,933 224,290 200,643 3 .. 5 41 U 64,2tO 34,550 29,730 4 5 21 13
26. Sehore T 754,6804 4(]4,785 349,899 783 654 1,489 977
R 482,892 252,692 13(J,Z<JO [, 4 56 22
U 271,792 152,093 119,699 777 650 1,433 955
'P, Ri\i~n T 4t1,426 215,709 195,717 67 42 20S 170
R 311'9,5S"8 203,930 185,658 :35 36 182 150
U 21.833 11,779 10,059 32 6 16 20
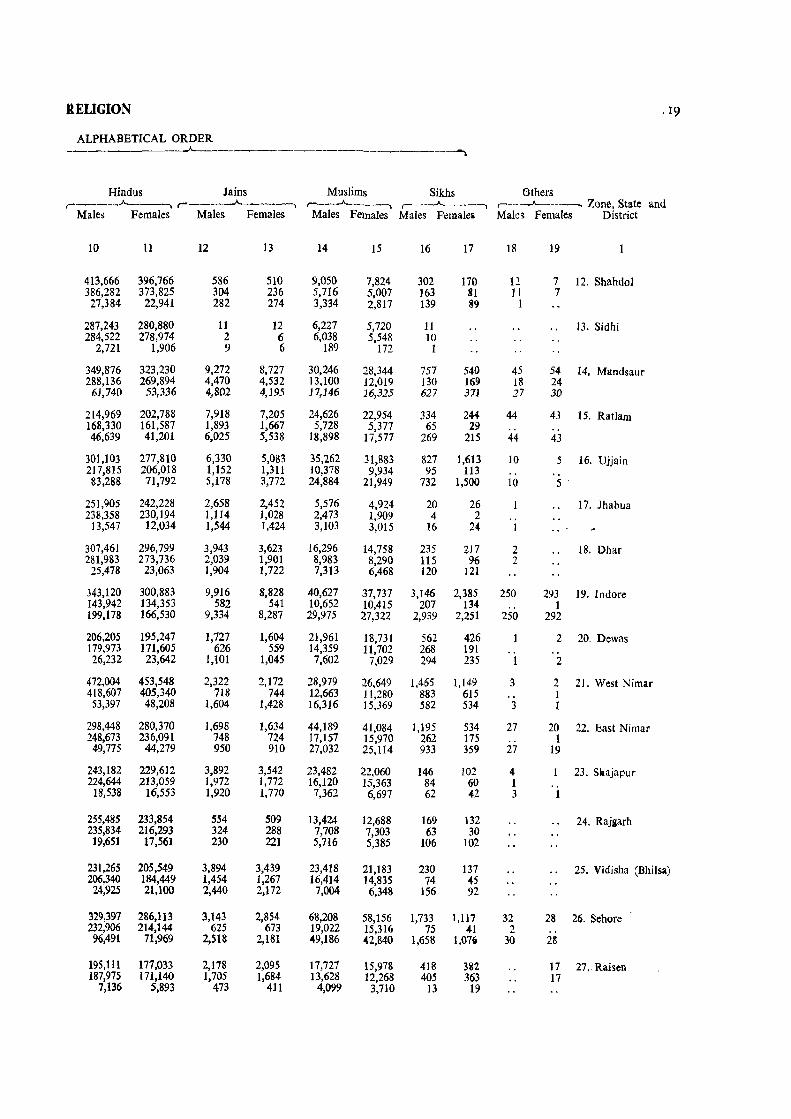
R.ELIGION ,19
ALPHABETICAL ORDER --A. _______ ~ _____________ ~
Hindus Jains Muslims Sikhs Others r-----.A.-------, r---______.A._...__--__, ,_----A.~ _ __, , __ A-_--, ,-- ---"'------.. Zone, State and
Male~ Females Males Females Males Females Males Femalei Males Females District
10 11 12 13 14 15 16 17 18 19
413,666 396,766 586 510 9,050 7,824 302 170 12 7 12. Shahdol 386,282 373,825 304 236 5,716 5,007 163 81 11 7 27,384 22,941 282 274 3,334 2,817 139 89 1
287,243 280,880 11 12 6,227 5,720 11 13. Sidhi 284,522 278,974 2 6 6,038 5,548 10
2,721 1,906 9 6 189 172 1
349,876 323,230 9,272 8,727 30,246 28,344 757 540 45 54 14, Mandsaur 288,136 269,894 4,470 4,532 13,100 12,019 130 16C} 18 24
61,74D 53,336 4,802 4,195 17,146 16,325 627 371 27 30
214,969 202,788 7,918 7,205 24,626 22,954 334 244- 44 43 15. Ratiam 168,330 161,587 1,893 1,667 5,728 5,377 65 29 " " 46,639 41,201 6,025 5,538 18,898 17,577 269 215 44 43
301,103 277,810 6,330 5,083 35,262 31,883 827 1,613 10 5 16. Ujjain 217,815 206,018 1,152 1,311 10,378 9,934 95 113 .. " 83,288 71,792 5,178 3,772 24,884 21,949 732 1,500 10 5
251,905 242,228 2,658 2,452 5,576 4,924 20 26 17. Jhabua 238,358 230,194 1,114 1,028 2,473 1,909 4 2 ..
13,547 12,034 1,544 1,424 3,103 3,015 16 24 1
307,461 296,799 3,943 3,623 16,296 14,758 235 217 2 18, Dhar 281,983 273,736 2,039 1,901 8,983 8,290 115 96 2
25,478 23,063 1,904 1,722 7,313 6,468 120 121
343,120 300,883 9,916 8,828 40,627 37,737 3,146 2,385 250 293 19. Indore 143,942 134,353 582 541 10,652 10,415 207 134- .. 1 199,178 166,530 9,334 8,287 29,975 ~7,322 2,939 2,251 250 292
206,205 195,247 1,727 1,604 21,961 18,731 562 426 2 20. Dewas 179,973 171,605 626 559 14,359 11,702 268 191 .. .. 26,232 23,642 1,101 1,045 7,602 7,029 294 235 1 2
472,004 453,548 2,322 2,172 28,979 26,649 1,465 1,149 3 2 21. West Nimar 418,607 405,340 718 744 12,663 11,280 883 615 .. 1 53,397 48,208 1,604 1,428 16,316 15,369 582 534 3 1
298,448 280,370 1,698 1,634 44,189 41,084 1,195 534 27 20 22. East Nimar 248,673 236,091 748 724 17,157 15,970 262 175 .. 1 49,775 44,279 950 910 27,032 25,114 933 359 27 19
243,182 229,612 3,892 3,542 23,482 :Z2,060 146 102 4- 23. Sltajapur 224,644 213,059 1,972 1,772 16,120 15,363 84 60 1
18,538 16,553 1,920 1,770 7,362 6,697 62 42 3 1
255,485 233,854 554 509 13,424 12,688 169 132 24. Rajgarh 235,834 216,293 324 288 7,708 7,303 63 30 19,651 17,561 230 221 5,716 5,385 106 102
231,265 205,549 3,894 3,439 23,418 21,183 230 137 25. Vidisha (BhiIsa) 206,340 184,449 1,454 1,267 16,414 14,835 74 45 24,925 21,100 2,440 2,172 7,004 6,348 156 92
329,397 286,113 3,143 2,854 68,208 58,156 1,733 1,117 32 28 26. Sehore 232,906 214,144 625 673 19,022 15,316 75 41 2 .. 96,491 71,969 2,518 2,181 49,186 42,840 1,658 1,07' 30 28
195,lll 177,033 2,178 2,095 17,721 15,978 418 382 17 27.> Raisen 187,975 171,140 1,705 1,684 13,628 12,268 405 363 17
7;136 5,893 473 411 4,099 3,710 13 19
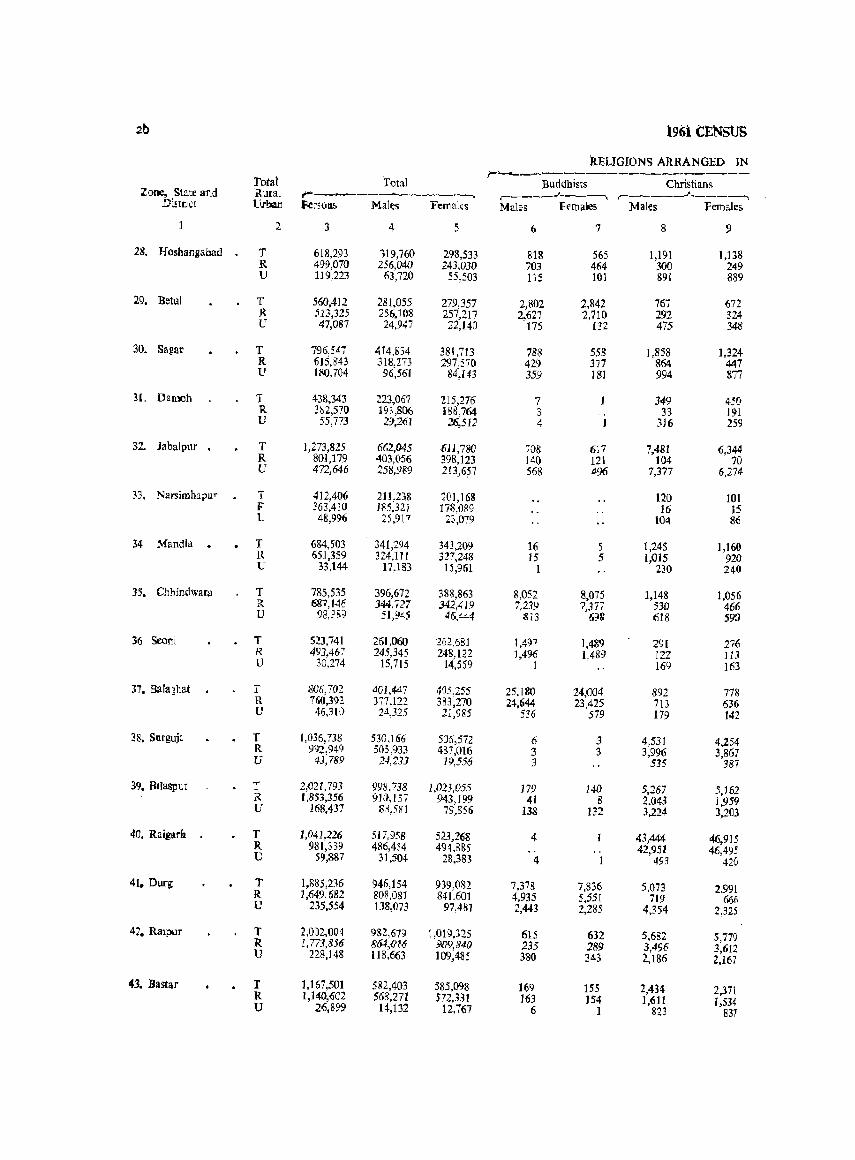
2b 1961 CENSUS
REUGIONS ARRANGED IN ;-----------------------_.-
Total TNal Buddhists Christians Zone, State and R'lIa: r-------J-----, r----A --., r----'--------,
D:suict Lil"bail F.er,oru. M.ales Fema;::s Malfs Feraale~ Males Fem::.le~
"'0 ~ 4 5 6 7 8 5) .. .J
28. Hoshangahad T 618,293 119,760 298,533 818 565 1,191 1,138 R 499,070 256,040 243.030 703 464 300 249 U 119,223 63,720 55,503 115 101 891 889
29. Betul T 560,412 28l.055 279,357 2,802 2,842 767 672 R 513,325 256,108 257,217 2,627 2,710 292 324 U 47,087 24,947 22,140 115 U2 475 348
30. Sagar T 796.547 414.834 381,713 788 558 ],858 1,324 R 6J5,843 318,273 297,570 429 371 864 447 U 180,704 96,561 84,I43 359 181 994 877
H. Damoh T 43&,343 223,067 215,276 7 349 450 R 382.570 19:'.806 iSS,764 3 " B 191 V 55)73 2:t;26 I 26,512 4 1 316 259
32. Jabalput . T 1,273,825 662,045 611,780 iGS 617 7,481 6,344 R 801,179 403,056 398,123 140 121 J04 70 U 472,646 258,989 213,657 568 496 7,377 6,274
33. NarsimhapuT I 412,406 211,2:\& 201,16& 120 101 F 363,410 185.32) 178,089 16 15 l 4&,996 25,9\7 23,079 104 86
34 MandJa . T 684,503 341,294 343,209 16 5 1,245 1,160 R 651,359 324,11 1 327.248 15 5 1,015 920 U :B,144 17 ,1S3 15,961 1 230 240
35. Chhindwara T 785,535 396,672 388.863 8,052 8,075 1,148 1,056 R 687,I..:1c 344,727 342,419 7239 7)77 .530 466 V 98.3~SI 51,9<'5 45.<-<-4 8i3 598 tilB 55Y.1
36 Seont T 523,741 251,060 '262,6E:I 1,4f)7 1,489 291 276 R 493,46:' 245,345 248,122 1,496 1.4&9 122 113 U 30,274 15,715 14,559 1 169 163
37. Balashat T 806,702 401,4:1.7 405.255 25.]80 24,004 892 778 R 760,392 377,122 38\270 24,644 23,425 7U 636 U 46,310 24,325 lI,nS 536 579 179 142
38. SUTguj<' T 1,036,738 530,166 505,572 6 3 4 .. 531 4,254 R 9';)2.949 50),933 487;CIl6 3 3 3,996 3,867 U 43)89 24,23J 1:),556 3 535 387
39. BIJaspur T 2,021,793 998,738 1,023.055 179 14D 5,267 5.162 R 1.853,356 91ll,ISi 943.]99 41 B 2,043 ],959 U ]68,437 83,5H1 79.856 138 132 3,224 3,203
40. Raigarh T 1,041,226 517,958 523,26S 4 43,444 46,,915 R 981.33f) 486,454 49U8S .. 42,951 46,495 l! 59,887 :;1,50~ 28,383 4 1 493 42{)
41. Durg T 1,885,236 946,154 939,082 7,37!! 7,836 5,0.73 2,991 R 1,649,682 808,081 841.601 4,935 5,55! 719 666 e 235,554 138,073 97,481 2,443 2,285 4,354 2325
4]. RalPllT T 2,OCl2.0IH 982,679 t ,019,325 615 632 5,6S2 5,779 R I, 773,S56 864,<N6 909,840 235 289 3,496 3,612 U 22S,148 118,663 109,485 380 343 2,186 2,167
43. Bastar T 1,167,501 582,403 585,098 169 155 2,434 2,371 R 1,140,ti02 56S,2il 572,331 163 154 1,6Jl 1,534 U 2(i,S99 14,132 12,767 6 1 823 837
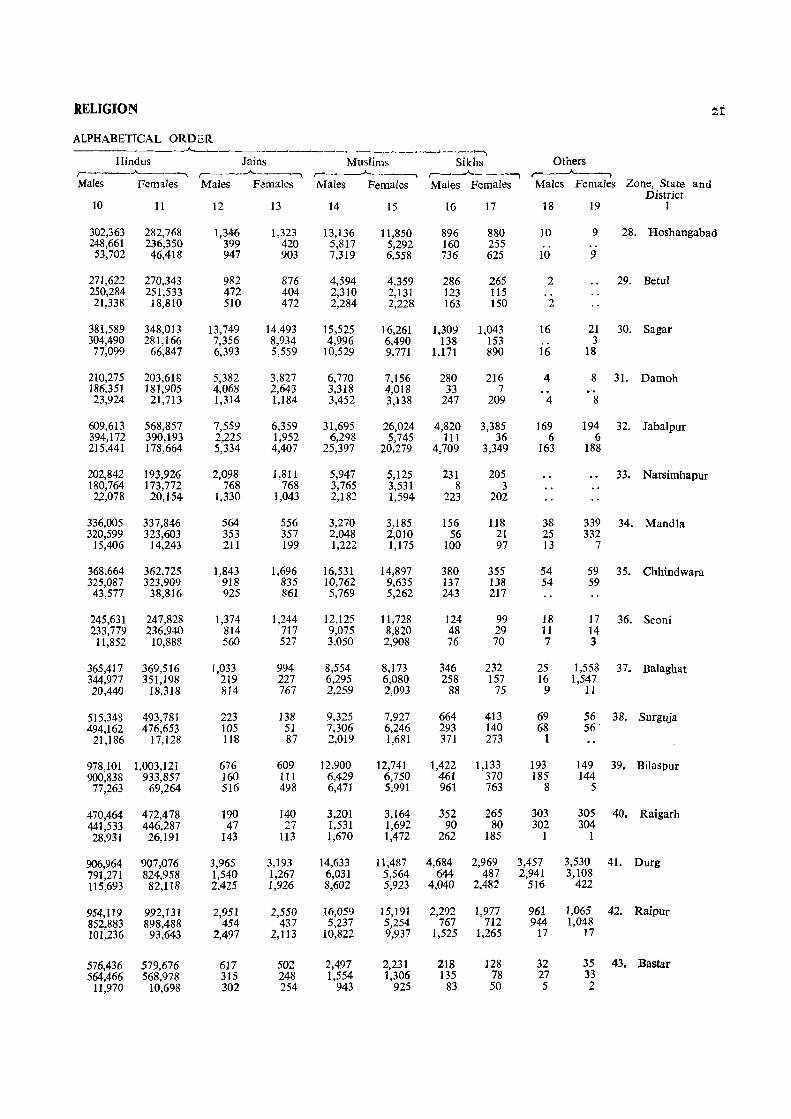
RELIGION ~t
ALPHABETICAL ORDER .A-----~_~~ _________ . __ ~_'__'I
Hindus Jains Muslims Sikhs Others ,----"------. r-----"----, r-----A. __ --, r--__.A..---, r----'-------, Males Females Males F.!males Males Females Males Females Males Females Zone, State and
District 10 11 12 13 14 15 16 17 18 19 I
302,363 282,768 1,346 1,323 13,136 11,850 896 880 10 9 28. Hoshangabad 248,661 236,350 399 420 5,817 5,292 160 255 . . .. 53,702 46,418 947 903 7,319 6,558 736 625 10 9
271,622 270,343 982 876 4,594 4,359 286 265 2 29. Betul 250,284 251,533 472 404 2,310 2,131 123 115 .. 21,338 18,810 510 472 2,284 2,228 163 150 2
381,589 348,013 13,749 14,493 15,525 16,261 1,309 1,043 16 21 30. Sagar 304,490 281,166 7,356 8,934 4,996 6,490 138 153 3 77,099 66,847 6,393 5,559 10,529 9,771 1,171 890 16 18
210,275 203,618 5,382 3,827 6,770 7,156 280 216 4 8 31. Damoh 186.351 181,905 4,068 2,643 3,318 4,018 33 7 23,924 21,713 1,314 1,184 3,452 3,138 247 209 4 8
609,613 568,857 7,559 6,359 31,695 26,024 4,820 3,385 169 194 32. Jabalpur 394,172 390,193 2,225 1,952 6,298 5,745 111 36 6 6 215,441 178,664 5,334 4,407 25,397 20,279 4,709 3,349 163 188
202,842 193,926 2,098 1,811 5,947 5,125 231 205 33. Narsimhapur 180,764 173,772 768 768 3,765 3,531 8 3 22,078 20,154 1,330 1,043 2,182 1,594 223 202
336,005 337,846 564 556 3,270 3,185 156 118 38 339 34. Mandla 320,599 323,603 353 357 2,048 2,010 56 21 25 332
15,406 14,243 211 199 1,222 1,175 100 97 13 7
368,664 362,725 1,843 1,696 16,531 14,897 380 355 54 59 35. Chhindwara 325,087 323,909 918 835 10,762 9,635 137 138 54 59
43,577 38,816 925 861 5,769 5,262 243 217
245,631 247,828 1,374 1,244 12,125 11,728 124 99 18 17 36. Seoni 233,779 236,940 814 717 9,075 8,820 48 29 11 14 11,852 10,888 560 527 3,050 2,908 76 70 7 3
365,417 369,516 1,033 994 8,554 8,173 346 232 25 1,558 37. Balaghat 344,977 351,198 219 227 6,295 6,080 258 157 16 1,547 20,440 18,318 814 767 2,259 2,093 88 75 9 11
515,348 493,781 223 138 9,325 7,927 664 413 69 56 38. Surguja 494,162 476,653 105 51 7,306 6,246 293 140 68 56
21,186 17,128 118 87 2,019 1,681 371 273 1
978,101 1,003,121 676 609 12,900 12,741 1,422 1,133 193 149 39. Bilaspur 900,838 933,857 160 111 6,429 6,750 461 370 185 144 77,263 69,264 516 498 6,471 5,991 961 763 8 5
470,464 472,4 78 190 140 3,201 3,164 352 265 303 305 40. Raigarh 441,533 446,287 47 27 1,531 1,692 90 80 302 304 28,931 26,191 143 113 1,670 1,472 262 185 1 1
906,964 907,076 3,965 3,193 14,633 11,487 4,684 2,969 3,457 3,530 41. Durg 791,271 824.958 1,540 1,267 6,031 5,564 644 487 2,941 3,108 115,693 82,118 2,425 1,926 8,602 5,923 4,040 2,482 516 422
954,119 992,131 2,951 2,550 16,059 15,191 2,292 1,977 961 1,065 42. Raipur 852,883 898,488 454 437 5,237 5,254 767 712 944 1,048 101,236 93,643 2,497 2,113 10,822 9,937 1,525 1,265 17 17
576,436 579,676 617 502 2,497 2,231 218 128 32 35 43. Bastar 564,466 568,978 315 248 1,554 1,306 135 78 27 33
11,970 10,698 302 254 943 925 83 50 5 2
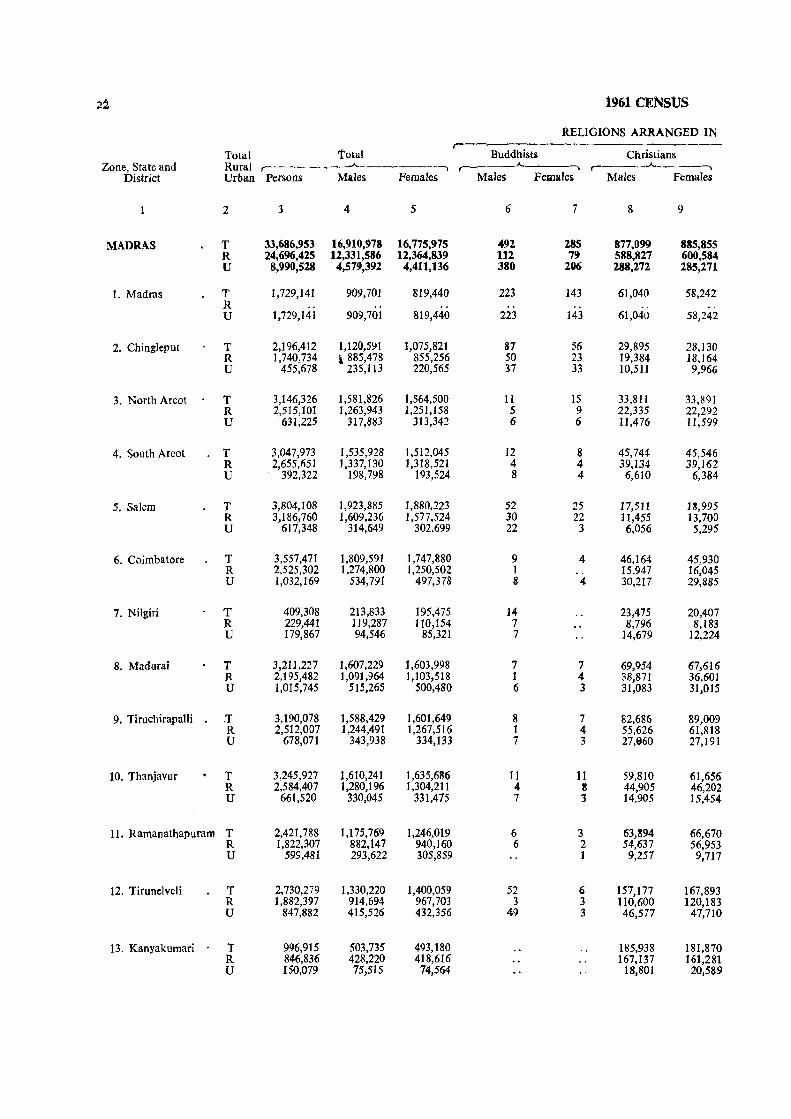
2i 1961 CENsUS
RELIGIONS ARRANGED IN r-
Total total Buddhisu Christians Zone, State and Rural ~-----~-----,
A.. __ --, , ___ .A. ___ --,
District Urban Persons Males Females Males Females Males Females
2 3 4 5 6 7 8 9
MADRAS T 33,686,953 16,910,978 16,775,975 492 285 877,099 885,855 R 24,696,425 12,331,586 12,364,839 112 79 588,827 600,584 U 8,990,528 4,579,392 4,411,136 380 206 288,272 285,271
I. Madras T 1,729,141 909,701 819,440 223 143 61,040 58,242 R .. .. . . U 1,729,141 909,701 819,440 223 143 61,040 58,242
2. Chingleput T 2,196,412 1,120,591 1,075,821 87 56 29,895 28,130 R 1,740,734 i: 885,478 855,256 50 23 19,384 18,164 U 455,678 235,113 220,565 37 33 10,511 9,966
3. North Areot T 3,146,326 1,581,826 1,564,500 11 15 33,811 33,891 R 2,515,101 1,263,943 1,251,158 5 9 22,335 22,292 U 631,225 317,883 313,342 6 6 11,476 1l,599
4. South Areot T 3,047,973 1,535,928 1,512,045 12 8 45,744- 45,546 R 2,655,651 1,337,130 1,318,521 4 4 39,134 39,162 U 392,322 198,798 193,524 8 4 6,610 6,384
5. Salem T 3,804,108 1,923,885 1,880,223 52 25 17,511 13,995 R 3,186,760 1,609,236 1,577,524 30 22 11,455 13,700 U 617,348 314,649 302,699 22 3 6,056 5,295
6. Coimbatore T 3,557,471 1,809,591 1,747,880 9 4 46,164 45,930 R 2,525,302 1,274,800 1,250,502 I .. 15,947 16,045 U 1,032,169 534,791 497,378 8 4 30,217 29,885
7. Nilgiri T 409,308 213,833 195,475 14 23,475 20,407 R 229,441 119,287 110,154 7 8,796 8,183 U 179,867 94,546 85,321 7 14,679 ]2,224
8. Madurai T 3,211,227 1,607,229 1,603,998 7 7 69,954 67,616 R 2,195,482 1,091,964 ],103,518 1 4 38,871 36,601 U 1,015,745 515,265 500,480 6 3 31,083 31,015
9. Tiruchirapa1li . .T 3,190,078 1,588,429 1,601,649 8 7 82,686 89,009 R 2,512,007 1,244,491 1,267,516 1 4 55,626 61,818 U 678,071 343,938 334,133 7 3 27,960 27,191
10. Thanjavur T 3,245,927 1,610,241 1,635,686 11 11 59,810 61,656 R 2,584,407 1,280,196 1,304,211 4 8 44,905 46,202 U 661,520 330,045 331,475 7 3 14,905 15,454
11. Ramanathapuram T 2,421,788 1,175,769 1,246,019 6 3 63,894 66,670 R 1,822,307 882,147 940,160 6 2 54,637 56,953 U 599,481 293,622 305,859 1 9,257 9,717
12. Tirunelveli T 2,730,279 1,330,220 1,400,059 52 6 157,177 167,893 R 1,882,397 914,694- 967,703 3 3 110,600 120,183 U 847,882 415,526 432,356 49 3 46,577 47,710
13. Kanyakumari T 996,915 503,735 493,180 185,938 181,870 R 846,836 428,220 418,616 167,137 161,281 U lSO,079 75,515 74,564 18,801 20,589
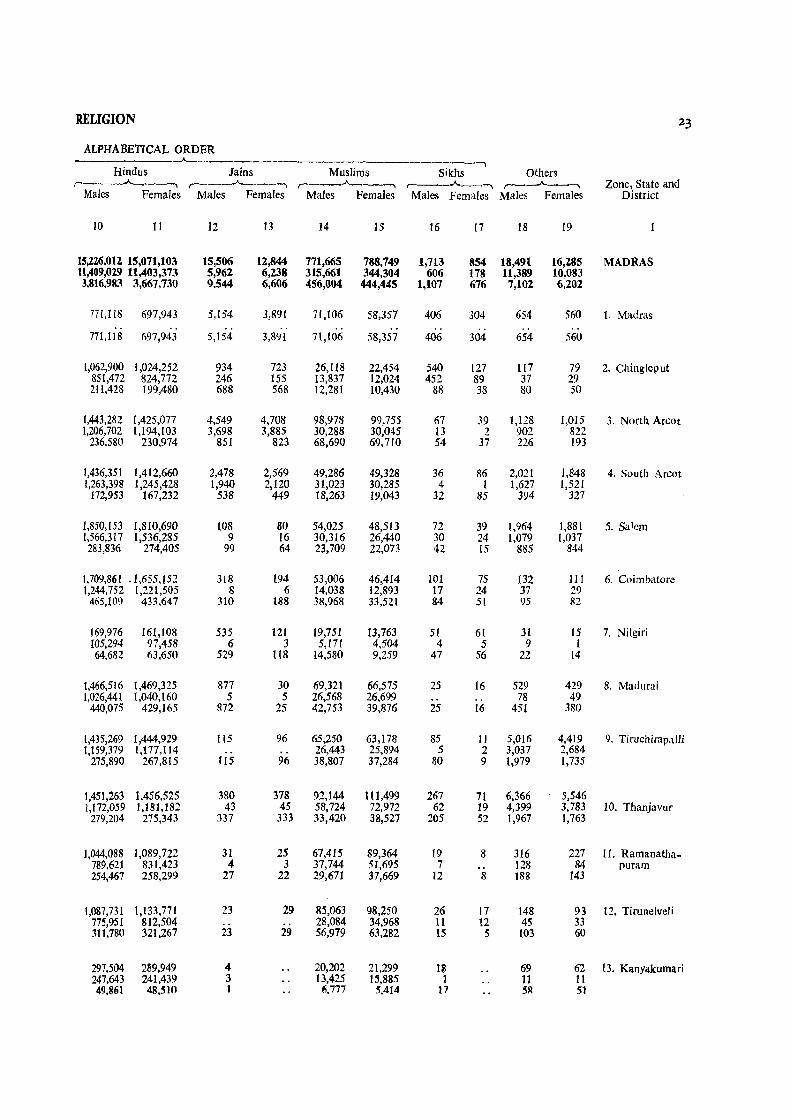
RELIGION 23
ALPHABETICAL ORDER _.__. , Hindus Jains Muslims Sikhs Others
r---..A._-_, r----·-"----, r-~-..A.---, r-----"----, ,....--__..A. __ , Zone, State and Males Females Males Females Males Females Males Females Males Females District
10 1 I 12 13 14 15 16 17 18 19
15,226,012 15,071,103 15,506 12,844 771,665 788,749 1,713 854 18,491 16,285 MADRAS 1l,409,029 11,403,373 5,962 6,238 315,661 344,304 606 178 11,389 10,083 3,816,983 3,667,730 9,544 6,606 456,004 444,445 1,107 676 7,102 6,202
771,Il8 697,943 5,154 3,891 71,106 58,357 406 304 654 560 t. Madras " .. .. .. .. o • .. 00 o •
771,118 697,943 5,154 3,891 71,106 58,357 406 304 654 560
1,062,900 1,024,252 934 723 26,1l8 22,454 540 127 117 79 2. Chingleput 851,472 824,772 246 ISS 13,837 12,024 452 89 37 29 211,428 199,480 688 568 12,281 10,430 88 38 80 50
1,443,282 1,425,077 4,549 4,708 98,978 99,755 67 39 1,128 1,015 3. North Areot 1,206,702 1,194,103 3,698 3,885 30,288 30,045 13 2 902 822
236,580 230,974 8S1 823 68,690 69,710 54 37 226 193
1,436,351 1,412,660 2,478 2,569 49,286 49,328 36 86 2,021 1,848 4. South Areot 1,263,398 1,245,428 1,940 2,120 31,023 30,285 4 1 1,627 1,521
172,953 167,232 538 449 18,263 19,043 32 85 394 327
1,850,153 1,810,690 108 80 54,025 48,513 72 39 1,964 1,881 5. Salem 1,566,317 1,536,285 9 16 30,316 26,440 30 24 1,079 1,037 283,836 274,405 99 64 23,709 22,073 42 15 885 844
1,709,861 .1,655,152 318 194 53,006 46,414 101 75 132 111 6. Coimbatore 1,244,752 1,221,505 8 6 14,038 12,893 17 24 37 29
465,109 433,647 310 188 38,968 33,521 84 51 95 82
169,976 161,108 535 121 19,751 13,763 51 61 31 15 7. Nilgiri I05,294 97,458 6 3 5,171 4,504 4 5 9 I 64,682 63,650 529 118 14,580 9,259 47 56 22 14
1.466,516 1,469,325 877 30 69,321 66,575 25 16 529 429 8. Madurai 1,026,441 1,040,160 5 5 26,568 26,699 .. 78 49
440,075 429,165 872 25 42,753 39,876 25 16 451 380
1,435,269 1,444,929 115 96 65,250 63,178 85 11 5,016 4,419 9. Tiruchirapalli 1,159,379 1,177,114 .. .. 26,443 25,894 5 2 3,037 2,684
275,890 267,815 115 96 38,807 37,284 80 9 1,979 1,735
1,451,263 1,456,525 380 378 92,144 111,499 267 71 6,366 5,546 1,172,059 1,181,182 43 45 58,724 72,972 62 19 4,399 3,783 10. Thanjavur
279,204 275,343 337 333 33,420 38,527 205 52 1,967 1,763
1,044,088 1,089,722 31 2S 67,415 89,364 19 8 316 227 11. Ramanatba_ 789,621 831,423 4 3 37,744 51,695 7 .. 128 84 puram 254,467 258,299 27 22 29,671 37,669 12 8 188 143
1,087,731 1,133,771 23 29 85,063 98,250 26 17 148 93 12, Tirunelveli 775,951 812,504 28,084 34,968 11 12 45 33 311,780 321,267 23 29 56,979 63,282 15 5 t03 60
297,504 2B9,949 4 20,202 21,299 18 69 62 13. Kanyakumari 247,643 241,439 3 13,425 15,885 1 11 11 49,861 48,510 1 6.777 5.414 17 5$1 51
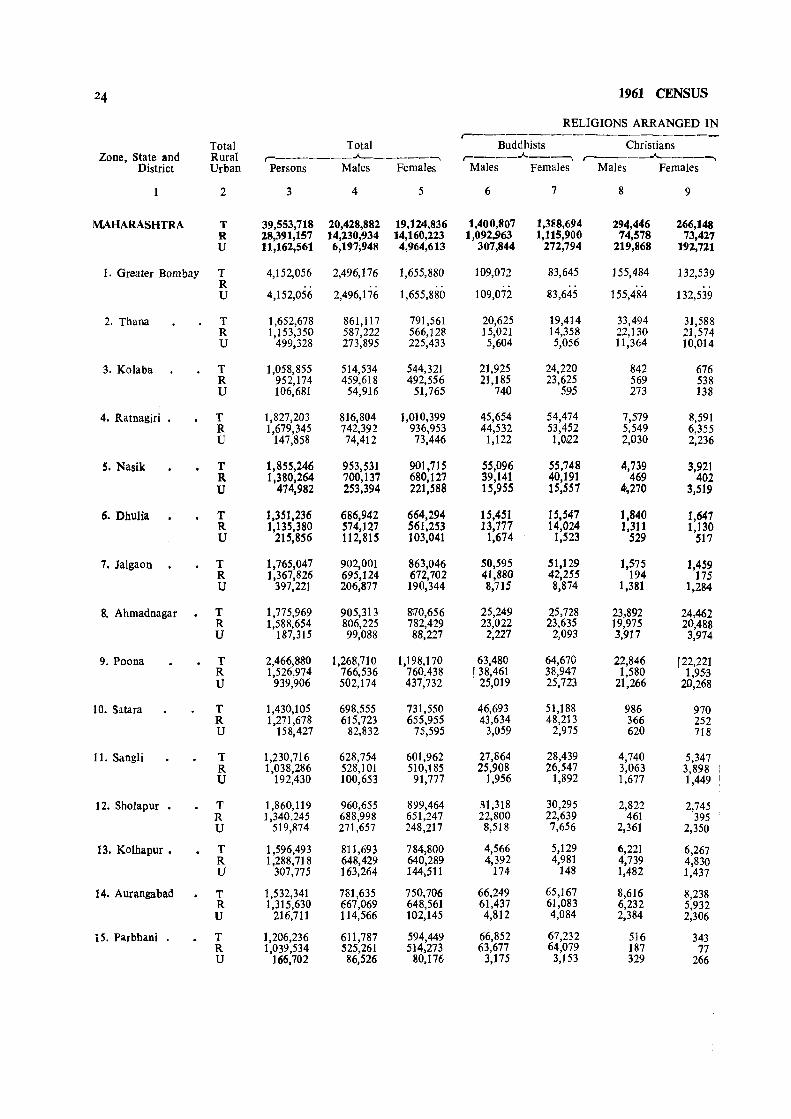
24 1961 CENSUS
RELIGIONS ARRANGED IN ,-------------------
Total Total Buddhists Christians Zone, State and Rural
,-_______ A ______ ~ • ___ A __ ~ .------""'------, District Urban Persons Males Females Males Females Males Females
2 3 4 5 6 7 8 9
MAHARASHTRA T 39,553,718 20,428,882 19,124,836 1,400,807 1,3ti8,694 294,446 266,148 R 28,391,157 14,230,934 14,160,223 1,092,963 1,115,900 74,578 73,427 U 11,162,561 6,197;948 4,964,613 307,844 272,794 219,1168 192,721
1. Greater Bombay T 4,152,056 2,496,176 1,655,880 109,072 83,645 155,484 132,539 R .. .. U 4,152,056 2,496,176 1,655,880 109,072 83,645 155,484 132,539
2. Thana T 1,652,678 861,117 791,561 20,625 19,414 33,494 31,588 R 1,153,350 587,222 566,128 ] 5,021 14,358 22,130 21,574 U 499,328 273,895 225,433 5,604 5,056 11,364 10,014
3. Kolaba T 1,058,855 514,534 544,321 21,925 24,220 842 676 R 952,174 459,618 492,556 21,185 23,625 569 538 U 106,681 54,916 51,765 740 595 273 138
4. Ratnagjri . T 1,827,203 816,804 1,010,399 45,654 54,474 7,579 8,591 R 1,679,345 742,392 936,953 44,532 53,452 5,549 6,355 U 147,858 74,412 73,446 1,122 I,Oa2 2,030 2,236
S. Nasik T 1,855,246 953,531 901,715 55,096 55,748 4,739 3,921 R 1,380,264 700,137 680,127 39,141 40,191 469 402 U 474,982 253,394 221,588 15,955 15,557 ~.270 3,519
6. Dhulia T 1,351,236 686,942 664,294 15,451 15,547 1,840 1,647 R 1,135,380 574,127 561,253 13,777 14,024 1,311 1,130 U 215,856 112,815 103,041 1,674 1,523 529 517
7. JaJgaon T 1,765,047 902,001 863,046 50,595 51,129 1,575 1,459 R 1,367,826 695,124 672,702 41,880 42,255 194 175 U 397,221 206,877 190,344 8,715 8,874 1,381 1,284
8. Ahmadnagar T 1,775,969 905,313 8170,656 25,249 25,728 23,892 24,462 R 1,588,654 806,225 782,429 23,022 23,635 19,975 20,488 U 187,315 99,088 88,227 2,227 2,093 3,917 3,974
9. Poona T 2,466,880 1,268,710 1,198,170 63,480 64,670 22,846 f22,221 R 1,526,974 766,536 760.438 f 38,461 38,947 1,580 1,953 U 939,906 502,174 437;732 25,019 25,723 21,266 20,268
10. Satara T 1,430,105 698,555 731,550 46,693 51,188 986 970 R 1,271,678 615,723 655,955 43,634 48,213 366 252 U 158,427 82,832 75,595 3,059 2,975 620 718
11. Sangli T 1,230,716 628,754 601,962 27,864 28,439 4,740 5,347 R 1,038,286 528,101 510,185 25,908 26,547 3,063 3,898 U 192,430 100,653 91,777 1,956 1,892 1,677 1,449 i
12. Sho1apur • T 1,860,119 960,655 899,464 :~1,318 30,295 2,822 2,745 R 1,340,245 688,998 651,247 22,800 22,639 461 395 U 519,874 271,657 248,217 8,518 7,656 2,361 2,350
13. Kolhapur • T 1,596,493 811,693 784,800 4,566 5,129 6,221 6,267 R 1,288,718 648,429 640,289 4,392 4,981 4,739 4,830 U 307,775 163,264 144,511 174 148 1,482 1,437
14. Aunmgabad T 1,532,341 781,635 750,706 66,249 65,167 8,616 8,238 R 1,315,630 667,069 648,561 61,437 61,083 6,232 5,932 U 216,711 114,566 102,145 4,812 4,084 2,384 2,306
15. Parbhani . T 1,206,236 611,787 594,449 66,852 67,232 516 343 R 1,039,534 525,261 514,273 63,677 64,079 187 77 U 166,702 86,526 80,176 3,175 3,153 329 266
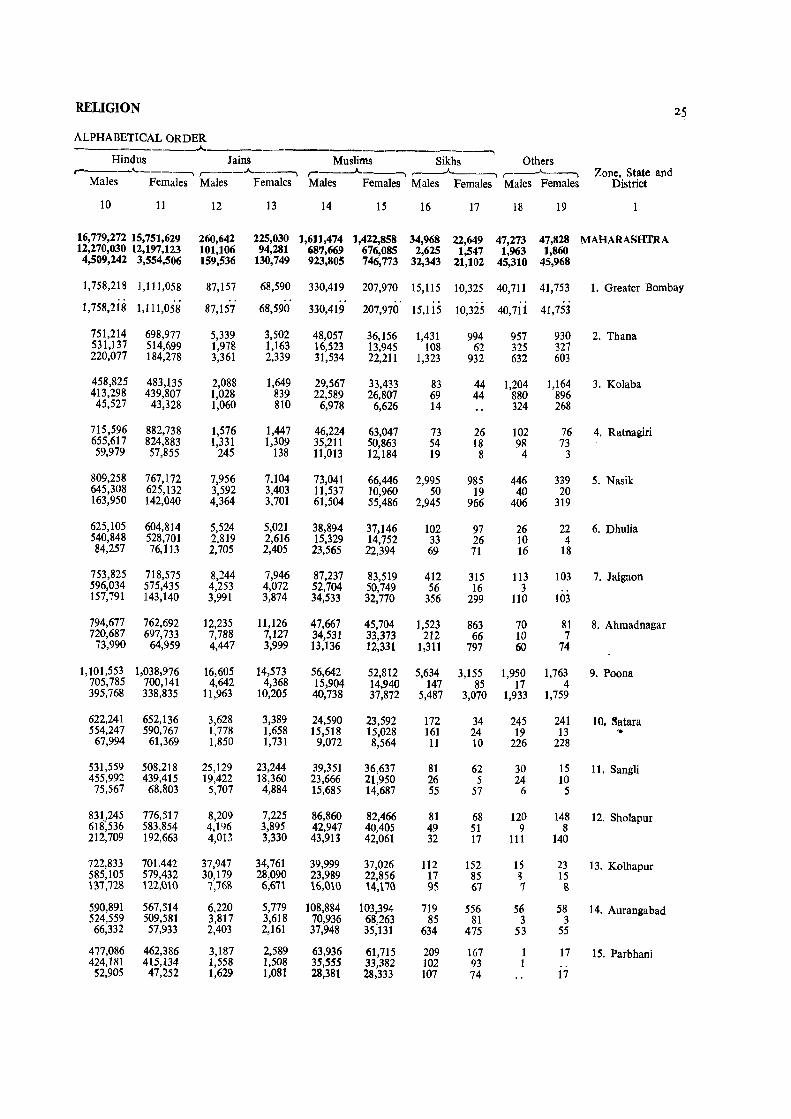
RELIGION 25
ALPHABETICAL ORDER -----------~--------------------------, Hindus Jains Muslims Sikhs Others ,-----'---_--, ,-___ .A.. __ ---, ,-_---A.. __ -, r----'-----, r----"-----. Zone, State and
Males Females Males Females Males Females Males Females Males Females District
10 11 12 13 14 15 16 17 18 19
16,779,272 15,751,629 260,642 225,030 1,611,474 1,422,858 34,968 22,649 47,273 47,828 MAHARASHTRA 12,270,030 12,197,123 101,106 94,281 687,669 676,085 2,625 1,547 1,963 1,860 4,509,242 3,554,506 159,536 130,749 923,805 746,773 32,343 21,102 45,310 45,968
1,758,218 1,111,058 87,157 68,590 330,419 207,970 15,115 10,325 40,711 41,753 1. Greater Bombay
1,758,218 1,111,058 87,157 68,590 330,4]9 207,970 ..
15,115 10,325 40,711 41,753
751,214 698,977 5,339 3,502 48,057 36,156 1,431 994 957 930 2. Thana 531,137 514,699 1,978 1,163 16,523 13,945 108 62 325 327 220,077 184,278 3,361 2,339 31,534 22,211 1,323 932 632 603
458,825 483,135 2,088 1,649 29,567 33,433 83 44 1,204 1,164 3. Kolaba 413,298 439,807 1,028 839 22,589 26,807 69 44 880 896 45,527 43,328 1,060 810 6,978 6,626 14 324 268
715,596 882,738 1,576 1,447 46,224 63,047 73 26 102 76 4. Ratnagiri 655,617 824,883 1,331 1,309 35,211 50,863 54 18 98 73 59,979 57,855 245 138 11,013 12,184 19 8 4 3
809,258 767,172 7,956 7,104 73,041 66,446 2,995 985 446 3J9 S. Nasik 645,308 625,132 3,592 3,403 11,537 10,960 50 19 40 20 163,950 142,040 4,364 3,701 61,504 55,486 2,945 966 406 319
625,105 604,814 5,524 5,021 38,894 37,146 102 97 26 22 6. Dhulia 540,848 528,701 2,819 2,616 15,329 14,752 33 26 10 4 84,257 76,113 2,705 2,405 23,565 22,394 69 71 16 18
753,825 718,575 8,:244 7,946 87,237 83,519 412 315 113 103 7. Jalgaon 596,034 575,435 4,253 4,072 52,704 50,749 56 16 3 157,791 143,140 3,991 3,874 34,533 32,770 356 299 110 103
794,677 762,692 12,235 11,126 47,667 45,704 1,523 863 70 81 8. Ahmadnagar 720,687 697,733 7,788 7,127 34,531 33,373 212 66 10 7 73,990 64,959 4,447 3,999 13,136 12,331 1,311 797 60 74
1,101,553 ],038,976 16,605 14,573 56,642 52,812 5,634 3,155 1,950 1,763 9. Poona 705,785 700,141 4,642 4,368 15,904 14,940 147 85 17 4 395,768 338,835 11,963 10,205 40,738 37,872 5,487 3,070 1,933 1,759
622,241 652,136 3,628 3,389 24,590 23,592 172 34 245 241 ]0. ~atara 554,247 590,767 1,778 1,658 15,518 15,028 161 24 19 13 ... 67,994 61,369 1,850 1,731 9,072 8,564 11 10 226 228
531,559 508,218 25,129 23,244 39,351 36,637 81 62 30 15 11. Sangli 455,992 439,415 19,422 18,360 23,666 21,950 26 5 24 10 75,567 68,803 5,707 4,884 15,685 14,687 55 57 6 5
83},245 776,517 8,209 7,225 86,860 82,466 81 68 120 148 12. Sholapur 618~536 583,854 4,196 3,895 42,947 40,405 49 51 9 8 212,709 192,663 4,013 3,330 43,913 42,061 32 17 111 140
722,833 701,442 37,947 34,761 39,999 37,026 112 152 15 23 13. Kolhapur 585,105 579,432 30,179 28,090 23,989 22,856 17 85 3 15 137,128 122,()10 7,768 6,671 16,()10 14,170 9S 67 7 '6
590,891 567,514 6,220 5,779 108,884 103,394 719 556 56 58 14. Aurangabad 524,559 509,581 3,817 3,618 70,936 68,263 85 81 3 3 66,332 57,933 2,403 2,161 37,948 35,131 634 475 53 55
477,086 462,386 3,187 2,589 63,936 61,715 209 167 1 17 15. Parbhani 424,181 415,134 1,558 1,508 35,555 33,382 102 93 1 .. 52,905 47,252 ],629 1,081 28,381 28,333 107 74 17
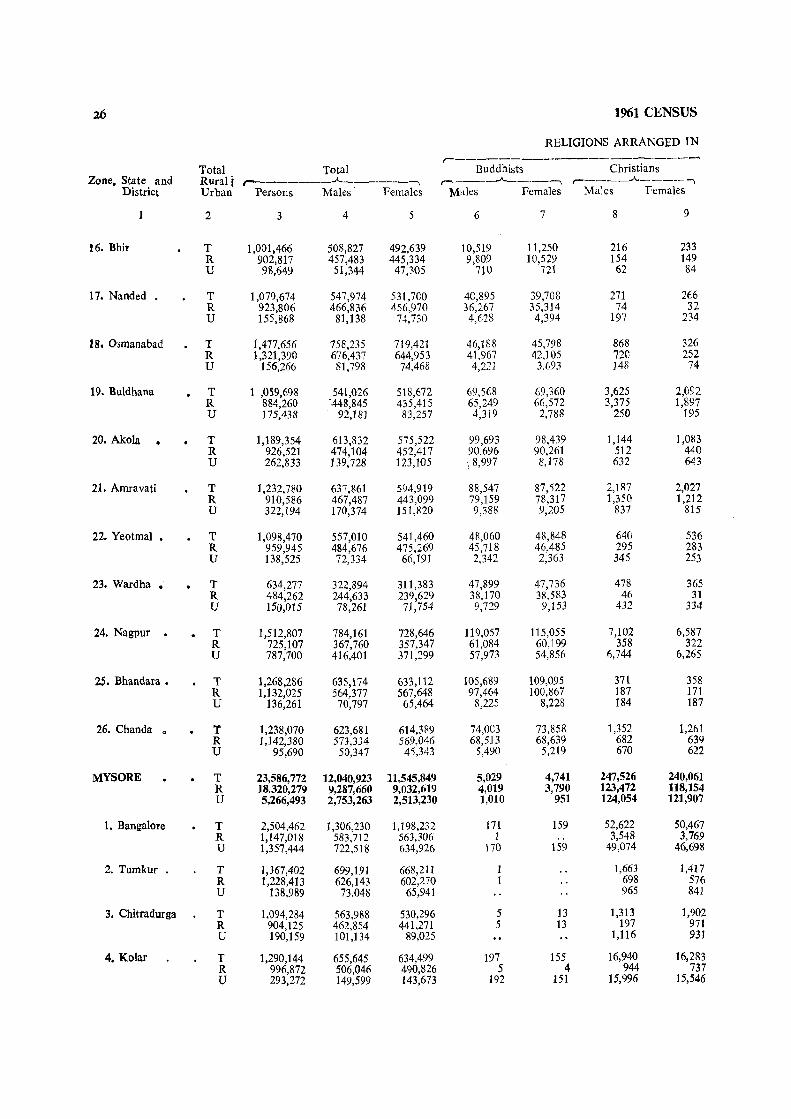
26 1961 CENSUS
RELIGIONS ARRANGED IN
~----------------------Total Total Buddhists Christians
Zone, State and Rural { r-------~------~ ,----~-----~ ,-----"------., District Urban Persons Males Females Males Females Males Females
2 3 4 5 6 7 8 9
16. Bhir T 1,001,466 508,827 492,639 10,519 11,250 216 233 R 902,817 457,483 445,334 9,809 10,529 154 149 U 98,649 51,344 47,305 710 721 62 84
17. Nanded • T 1,079,674 547,974 531,7GO 40,895 39,708 271 2E6 R 923,806 466,836 456,970 36,267 35,314 74 32 U 155,868 81,138 74,730 4,628 4,394 197 234
18. Osmanabad T 1,477,656 758,235 719,421 46,188 45,798 868 326 R 1,321,390 676,437 644,953 41.967 42,105 72C 252 U 156,266 81,798 74,468 4,221 3,693 148 74
19. Buldhana T 1 ,059,698 541,026 518,672 69,568 69,360 3,625 2,092 R 884,260 -448,845 435,415 65,249 66,572 3,375 1,897 U 175,438 92,181 83,257 4,319 2,788 250 195
20. Akola T 1,189,354 613,832 575,522 99,693 98,439 1,144 1,083 R 926,521 474,104 452,417 90,696 90,261 512 440 U 262,833 139,728 123,105 : 8,997 8,178 632 643
21. Amravati T 1,232,780 637,861 594,919 88,547 87,522 2,187 2,027 R 910,586 467,487 443,099 79,159 78,317 1,350 1,212 U 322,194 170,374 151,820 9,388 9,205 837 815
22. Yeotmal • T 1,098,470 557,010 541,460 48,060 48,848 640 536 R 959,945 484,676 475,269 45,718 46,485 295 283 U 138,525 72,334 66,191 2,342 2,363 345 253
23. Wardha • T 634,277 322,894 311,383 47,899 47,736 478 365 R 484,262 244,633 239,629 38,170 38,583 46 31 U 150,015 78,261 71,754 9,729 9,153 432 334
24. Nagpur . T 1,512,807 784,161 728,646 119,057 115,055 7,102 6,587 R 725,107 367,760 357,347 61,084 60,199 358 322 U 787,700 416,401 371,299 57,973 54,856 6,744 6,265
25. Bhandara • T 1,268,286 635,174 633,112 105,689 109,095 371 358 R 1,132,025 564,377 567,648 97,464 100,867 187 171 U 136,261 70,797 65,464 8,225 8,228 184 187
26. Chanda 0 T 1,238,070 623,681 614,389 74,003 73,858 1,352 1,261 R 1,142,380 573,334 569,046 68,513 68,639 682 639 U 95,690 50,347 45,343 5,490 5,219 670 622
MYSORE T 23,586,772 12,040,923 11,545,849 5,029 4,741 247,526 240,061 R 18,320,279 9,287,660 9,032,619 4,019 3,790 123,472 118,154 U 5,266,493 2,753,263 2,513,230 1,010 951 124,054 121,907
1. Bangalore T 2,504,462 1,306,230 1,198,232 171 159 52,622 50,467 R 1,147,018 583,712 563,306 1 -- 3,548 3,769 U 1,357,444 722,518 634,926 170 159 49,074 46,698
2. Tumkur . T 1,367,402 699,191 668,211 1,663 1,417 R 1,228,413 626,143 602,270 698 576 U 138,989 73,048 65,941 965 841
3. Chitradurga T 1.094,284 563,988 530,296 5 13 1,313 1,902 R 904,125 462,854 441,271 5 13 197 971 U 190,159 101,134 89,025 1,116 931
4. Kolar T 1,290,144 655,645 634,499 197 155 16,940 16,283 R 996,872 506,046 490,826 5 4 944 737 U 293,272 149,599 143,673 192 151 15,996 15,546
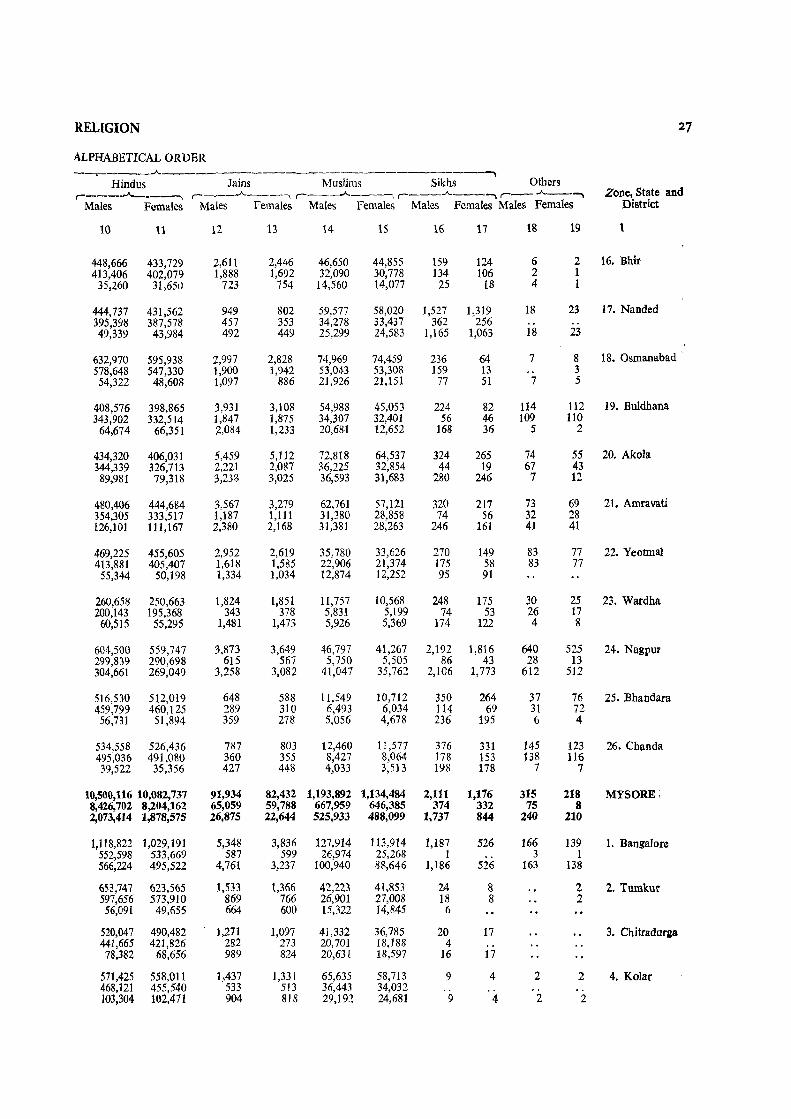
RELIGION 27
ALPHABETICAL ORDER
-~---~------------~---------------l Hindus Jains Muslims Sikhs Others
, ___ . .A._._---., ,_~_.A. __ , , ___ .A. ___ , , ___ .A. ___ ",""\ , __ .A. __ .",""\ Zone, State and Males Females Males Females Males Females Males Females Males Females District
10 11 12 13 14- 15 16 17 18 19 1
448,666 433,729 2,611 2,446 46,650 44,855 159 124 6 2 16. Bhir 413,406 402,079 1,888 1,692 32,090 30,778 134 106 2 1
35,260 3l,65Ll 723 754 14,560 14,077 25 18 4 1
444,737 431,562 949 802 59,577 58,020 1,527 1,319 18 23 17. Nanded 395,398 387,578 457 353 34,278 33,437 362 256 .. .. 49,339 43,984 492 449 25,299 24,583 1,165 1,063 18 23
632,970 595,938 2,997 2,828 74,969 74,459 236 64 7 8 18. Osmanabad 578,648 547,330 1,900 1,942 53,043 53,308 159 13 .. 3
54,322 48,608 1,097 886 21,926 21,151 77 51 7 5
408,576 398,865 3,931 3,108 54,988 45,053 224 82 114 112 19. Euldhana 343,902 332,514 1,847 1,875 34,307 32,401 56 46 109 110
64,674 66,351 2,084 1,233 20,681 12,652 168 36 5 2
434,320 406,031 5,459 5,112 72,818 64,537 324 265 74 55 20. Akola 344,339 326,713 2,221 2,087 36,225 32,854 44 19 67 43 89,981 79,318 3,238 3,025 36,593 31,683 280 246 7 12
480,406 444,684 3,567 3,279 62,761 57,121 320 217 73 69 21. Amravati 354,305 333,517 1,187 1,111 31,380 28,858 74 56 32 28 126,101 111,167 2,380 2,168 31,381 28,263 246 161 41 41
469,225 455,605 2,952 2,619 35,780 33,626 270 149 83 77 22. Yeotmal 413,881 405,407 1,618 1,585 22,906 21,374 175 58 83 77
55,344 50,198 1,334 1,034 12,874 12,252 95 91
260,658 250,663 1,824 1,851 11,757 10,568 248 175 30 25 23. Wardha 200,143 195,368 343 378 5,831 5,199 74 53 26 17 60,515 55,295 1,481 1,473 5,926 5,369 174 122 4 g
604,500 559,747 3,873 3,649 46,797 41,267 2,192 1,816 640 525 24. Nagpur 299,839 290,698 615 567 5,750 5,505 86 43 28 13 304,661 269,049 3,258 3,082 41,047 35,762 2,106 1,773 612 512
516,530 512,019 648 588 11,549 10,712 350 264 37 76 25. Ehandara 459,799 460,125 289 310 6,493 6,034 114 69 31 72 56,731 51,894 359 278 5,056 4,678 236 195 6 4
534,558 526,436 787 803 12,460 11,577 376 331 145 123 26. Chanda 495,036 491,080 360 355 8,427 8,064 178 153 138 116 39,522 35,356 427 448 4,033 3,513 198 178 7 7
10,500,116 10,082,737 91,934 82,432 1,193,892 1,134,484 2,111 1,176 315 218 MYSOREi 8,426,702 8,204,162 65,059 59,788 667,959 646,385 374 332 75 8 2,073,414 1,878,575 26,875 22,644 525,933 488,099 1,737 844 240 210
1,118,822 1,029,191 5,348 3,836 127,914 113,914 1,187 526 166 139 1. Bangalore 552,598 533,669 587 599 26,974 25,268 1 3 1 566,224 495,522 4,761 3,237 100,940 88,646 1,186 526 163 138
653,747 623,565 1,533 1,366 42,223 41,853 24 8 2 2. Tumkur 597,656 573,910 869 766 26,901 27,008 18 8 2 56,091 49,655 664 600 15,322 14,845 6
520,047 490,482 1,271 1,097 41,332 36,785 20 17 3. Chitradurga 441,665 421,826 282 273 20,701 18,188 4 .. 78,382 68,656 989 824 20,631 18,597 16 17
571,425 558,011 1,437 1,331 65,635 58,713 9 4 2 2 4. Kolar 468,121 455,540 533 513 36,443 34,032 .. .. .. 103,304 102,471 904 818 29,192 24,681 9 4 2 2
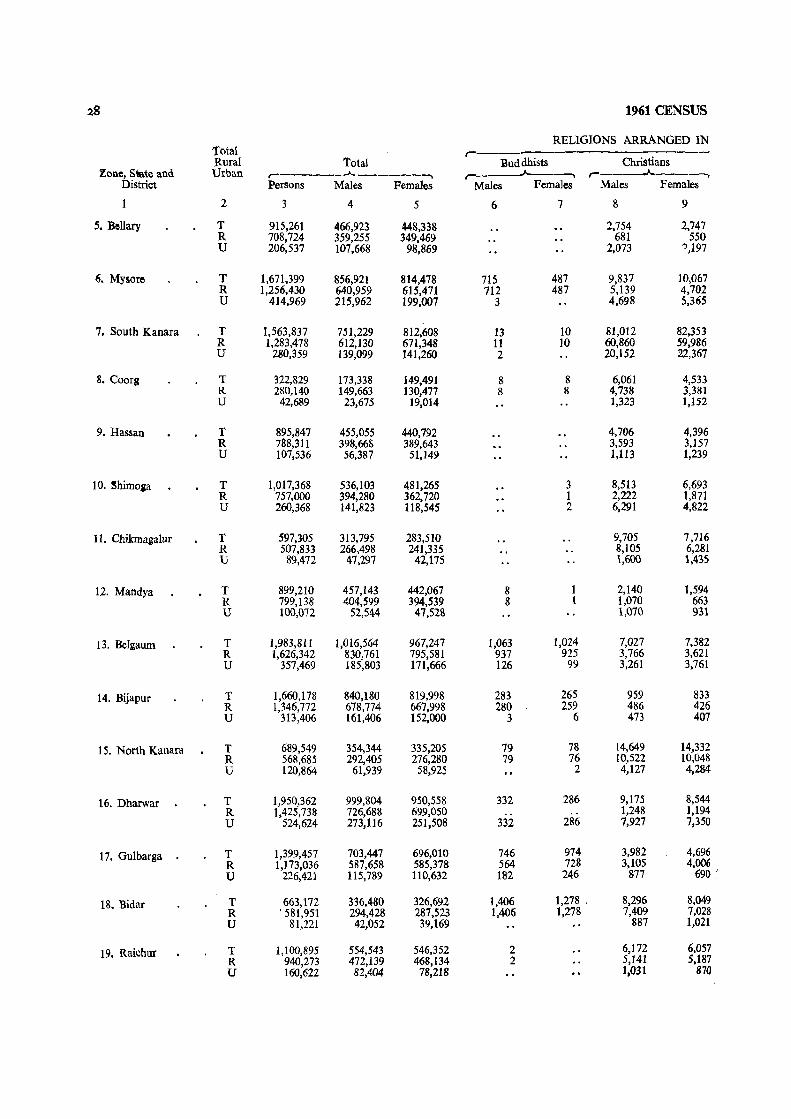
1961 CENSUS
RELIGIONS ARRANGED IN Total r----Rural Total Buddhists Christians
Zone, S1Ia.te and Urban ,--___ --A.. ______ -, ,____.)o....----. r---___"A.------.
District Persons Males Females Males Females Males Females
2 3 4 5 6 7 & 9
5. BeUary T 915,261 466,923 448,338 2,754 2,747 R 708,724 359,255 349,469 681 550 U 206,537 107,668 98,869 2,073 ',197
6. Mysore T 1,671,399 856,921 814,478 715 487 9,837 10,067 R 1,256,430 640,959 615,471 712 487 5,139 4,702 U 414,969 215,962 199,007 3 4,698 5,365
7. South Kanara T 1,563,837 751,229 812,608 13 10 81,012 82,353 R 1,283,478 612,130 671,348 11 10 60,860 59,986 U 280,359 139,099 141,260 2 20,152 22,367
8. Coorg T 322,829 173,338 149,491 8 8 6,061 4,533 R 280,140 149,663 130,477 8 8 4,738 3,381 U 42,689 23,675 19,014 1,323 1,152
9. Hassan T 895,847 455,055 440,792 4,706 4,396 R 788,311 398,66& 389,643 3,593 3,157 U 107,536 56,387 51,149 1,113 1,239
10. ~himoia T 1,017,368 536,103 481,265 3 8,513 6,693 R 757,000 394,280 362,720 1 2,222 1,871 U 260,368 141,823 118,545 2 6,291 4,822
11. Chikmagalur T 597,305 313,795 283,510 9,705 7,716 R 507,833 266,498 241,335 8,105 6,281 U 89,472 47,297 42,175 \,600 1,435
12. Mandya T 899,210 457,143 442,067 8 1 2,140 1,594 R 799,138 404,599 394,539 8 1 1,070 663 U 100,072 52,544 47,52& 1,070 931
13. Beigaum T 1,983,811 1,016,564 967,247 1,063 1,024 7,027 7,382 R 1,626,342 830,761 795,581 937 925 3,766 3,621 U 357,469 185,803 171,666 126 99 3,261 3,761
14. Bijapur T 1,660,178 840,180 819,998 283 265 959 833 R 1,346,772 678,774 667,998 280 259 486 426 U 313,406 161,406 152,000 3 6 473 407
15. North Kanara T 689,549 354,344 335,205 79 78 14,649 14,332 R 568,685 292,405 276,280 79 76 10,522 10,048 U 120,864 61,939 58,925 2 4,127 4,284
16. Dharwar T 1,950,362 999,804 950,558 332 286 9,175 8,544 R 1,425,7315 726,688 699,050 .. .. 1,248 1,194 U 524,624 273,116 251,508 332 286 7,927 7,350
17. Gulbarga T 1,399,457 703,447 696,010 746 974 3,982 4,696 R 1,173,036 587,658 585,378 564 728 3,105 4,006 U 226,421 115,789 110,632 182 246 877 690 .
18. Bidar T 663,172 336,480 326,692 1,406 1,278 . 8,296 8,049 R ' 581,951 294,428 287,523 1,406 1,278 7,409 7,028 U 81,221 42,052 39,169 887 1,021
19. Raichllr T 1,100,895 554,543 546,352 2 6,172 6,057 R 940,273 472,139 468,134 2 5,141 5,187 U 160,622 82,404 78,218 1,031 870
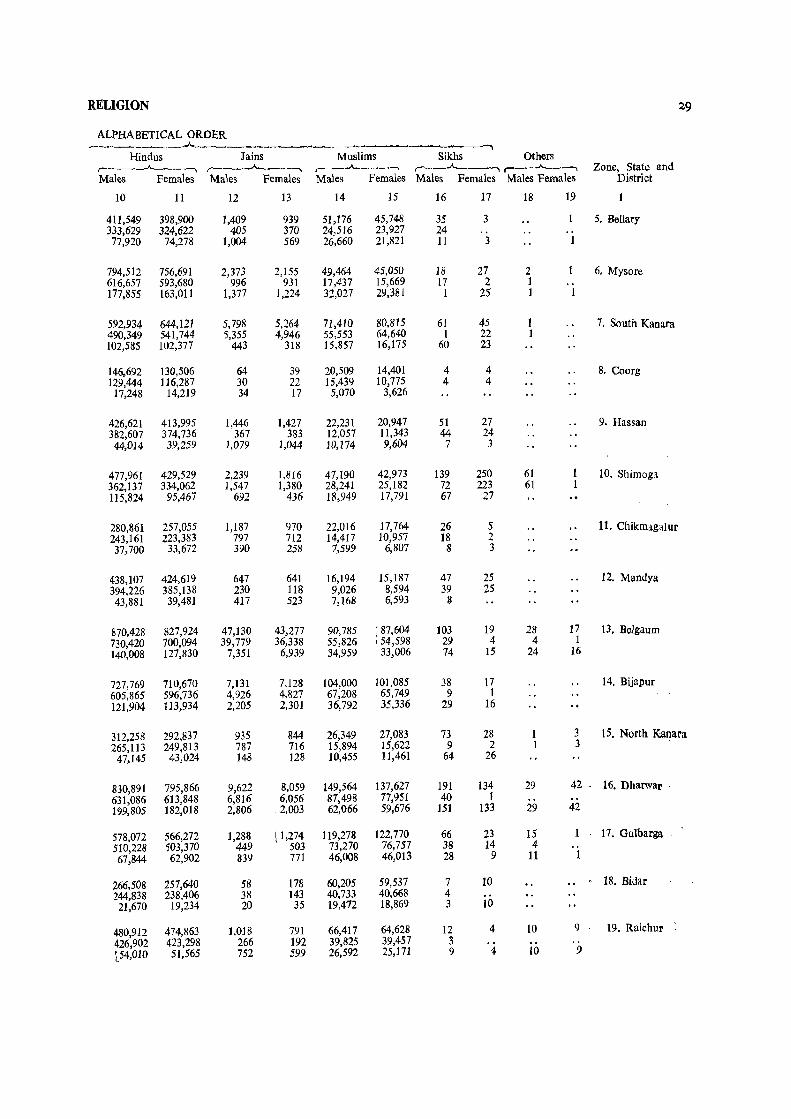
RELIGION 29
ALPHABETICAL ORDER ________ .A.-----"""'1
Hindus Jains Muslims Sikhs Others r-----'--------, r-----"--------, ,______.A. ___ ---,
,---"-------,r--~-, Zone, Stat,~ and Males Females Males Females Males Females Males Females Males Females District
10 11 12 13 14 15 16 17 18 19
411,549 398,900 1,409 939 51,176 45,748 35 3 5. Bellary 333,629 324,622 405 370 24,516 23,927 24 .. .. 77,920 74,278 1,004 569 26,660 21,821 11 3 1
794,512 756,691 2,373 2,155 49,464 45,050 18 27 2 6. Mysore 616,657 593,680 996 931 17,437 15,669 17 2 1 .. 177,855 163,011 1,377 1,224 32,027 29,381 1 25 1 1
592,934 644,121 5,798 5,264 71,410 80,815 61 45 1 7. South Kanara 490,349 541,744 5,355 4,946 55,553 64,640 1 22 1 102,585 102,377 443 318 15,857 16,175 60 23
146.692 130,506 64 39 20,509 14,401 4 4 8. Coorg 129,444 116,287 30 22 15,439 10,775 4 4
17,248 14,219 34 17 5,070 3,626
426,621 413,995 1,446 1,427 22,231 20,947 51 27 9. Hassan 382,607 374,736 367 383 12,057 11,343 44 24 44,014 39,259 1,079 1,044 10,174 9,604 7 3
477,961 429,529 2,239 1,816 47,190 42,973 139 250 61 10. Shimoga 362,137 334,062 1,547 1,380 28,241 25,182 72 223 61 115,824 95,467 692 436 18,949 17,791 67 27
280,861 257,055 1,187 970 22,016 17,764 26 5 11. Chikmagalur 243,161 223,383 797 712 14,417 10,957 18 2 37,700 33,672 390 258 7,599 6,807 8 3
438,107 424,619 647 641 16,194 15,187 47 25 12. Mandya 394,226 385,138 230 118 9,026 8,594 39 25 43,881 39,481 417 523 7,168 6,593 8
870,428 827,924 47,130 43,277 90,785 : 87,604 103 19 28 17 13. Belgaum 730,420 700,094 39,779 36,338 55,826 154,598 29 4 4 1 140,008 127,830 7,351 6,939 34,959 33,006 74 15 24 16
727,769 710,670 7,131 7,128 104,000 101.085 38 17 14. Bijapur 605,865 596,736 4,926 4,827 67,208 65,749 9 1 121,904 113,934 2,205 2,301 36,792 35,336 29 16
312,258 292,837 935 844 26,349 27,083 73 28 1 3 15. North Ka~ara 265,113 249,813 787 716 15,894 15,622 9 2 1 3 47,145 43,024 148 128 10,455 11,461 64 26
830,891 795,866 9,622 8,059 149,564 137,627 191 134 29 42 . 16. Dharwar . 631,086 613,848 6,816 6,056 87,498 77,951 40 I .. .. 199,805 182,018 2,806 :2,003 62,066 59,676 151 133 29 42
578,072 566,272 1,288 [1,274 119,278 122,770 66 23 15 17. Gulbarga 510,228 503,370 449 503 73,270 76,757 38 14 4 67,844 62,902 839 771 46,008 46,013 28 9 11 1
266,508 257,640 58 178 60,205 59,537 7 10 .. 18. BiLlar 244,838 238,406 38 143 40,733 40,668 4 21,670 19,234 20 35 19,472 18,869 3 10
480,912 474,863 1,018 791 66,417 64,628 12 4 10 9 19. Raichur 426,902 423,298 266 192 39,825 39,457 3 t54,010 51,565 752 599 26,592 25,171 9 4 10 9
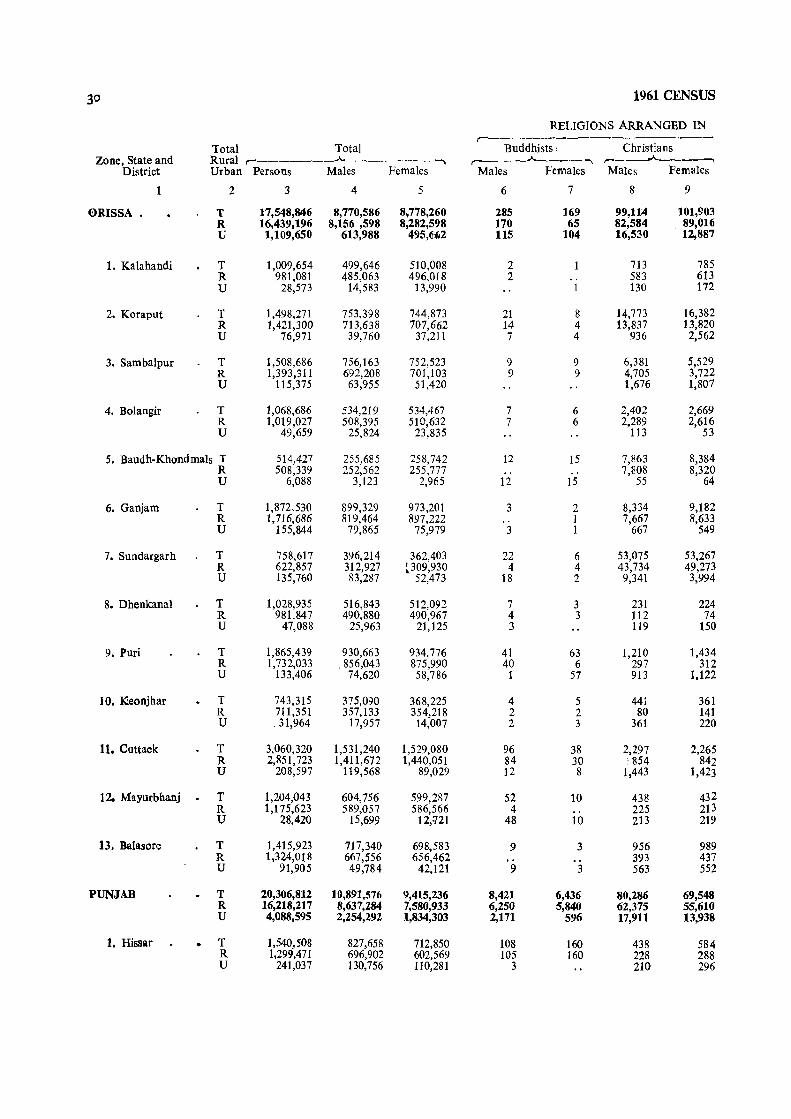
30 1961 CENSUS
RELIGIONS ARRANGED IN ~--------------------
Total Total Buddhists Christians Zone, State and Rural ~ _____ ..A. ________ ...... ,---A----""'I r--____,A.-~----.
District Urban Persons Males Females Males Females Males Females
2 3 4 5 6 7 8 9
0RISSA . T 17,548,846 8,77'0,586 8)778,260 285 169 99,11:4 101,903 R 16,439,196 8,156,598 8,282,598 170 65 82,584 , 89,016 U 1,109,650 613,988 495,6~2 115 104 16,530 12,887
1. Kalahandi T 1,009,654 499,646 510,008 2 713 785 R 981,081 485,063 496,018 2 . , 583 613 U 28,573 14,583 13,990 1 130 172
2. Koraput T 1,498,271 753,398 744,873 21 8 14,773 16,382 R 1,421,300 713,638 707,662 14 4 13,837 13,820 U 76,971 39,760 37,211 7 4 936 2,562
3. Sambalpur T 1,508,686 756,163 752,523 9 9 6,381 5,529 R 1,393,311 692,208 701,103 9 9 4,705 3,722 U 115,375 63,955 51,420 1,676 1,807
4. Bolangir T 1,068,686 534,219 534,467 7 6 2,402 2,669 R 1,019,027 508,395 510,632 7 6 2,289 2,616 U 49,659 25,824 23,835 113 53
5. Baudh-Khondmals T 514,427 255,685 258,742 12 15 7,863 8,384 R 508,339 252,562 255,777 ., 7,808 8,320 U 6,088 3,123 2,965 12 15 55 64
6. Ganjam T 1,872,530 899,329 973,201 3 2 8,334 9,182 R 1,716,686 819,464 897,222 .. 1 7,667 8,633 U 155,844 79,865 75,979 3 1 667 549
7. Sundargarh T 758,617 396,214 362,403 22 6 53,075 53,267 R 622,857 312,927 L309,930 4 4 43,734 49,273 U 135,760 83,287 52,473 18 2 9,341 3,994
8. Dhenkanal T 1,028,935 516,843 512,092 7 3 231 224 R 981,847 490,880 490,967 4 3 112 74 U 47,088 25,963 21,125 3 119 150
9. Puri T 1,865,439 930,663 934,776 41 63 1,210 1,434 R 1,732,033 856,043 875,990 40 6 297 312 U 133,406 74,620 58,786 1 57 913 1,122
10. ~eonjhar T 743,315 375,090 368,225 4 5 441 361 R 711,351 357,133 354,218 2 2 80 141 U ,31,964 17,957 14,007 2 3 361 220
11. Cuttack T 3,060,320 1,531,240 1,529,080 96 38 2,297 2,265 R 2,851,723 1,411,672 1,440,051 84 30 854 842 U 208,597 119,568 89,029 12 8 1,443 1,423
12. Mayurbhanj . T 1,204,043 604,756 599,287 52 10 438 43 2 R 1,175,623 589,057 586,566 4 ,. 225 213 U 28,420 15,699 12,v21 48 10 213 219
13, Baiasore T 1,415,923 717,340 698,583 9 3 956 989 R 1,324,018 667,556 656,462 393 437 U 91,905 49,784 42,121 9 3 563 552
PUNJAB T 20,306,812 10,891,576 9,415,236 8,421 6,436 80,286 69,548 R 16,218,217 8,637,284 7,580,933 6,250 5,840 62,375 55,610 U 4,088,595 2,254,292 1,834,303 2,171 596 17,911 13,938
1. Hissar T 1,540,508 827,658 712,850 108 160 438 584 R 1,299,471 696,902 602,569 105 160 228 288 U 241,037 130,756 110,281 3 210 296
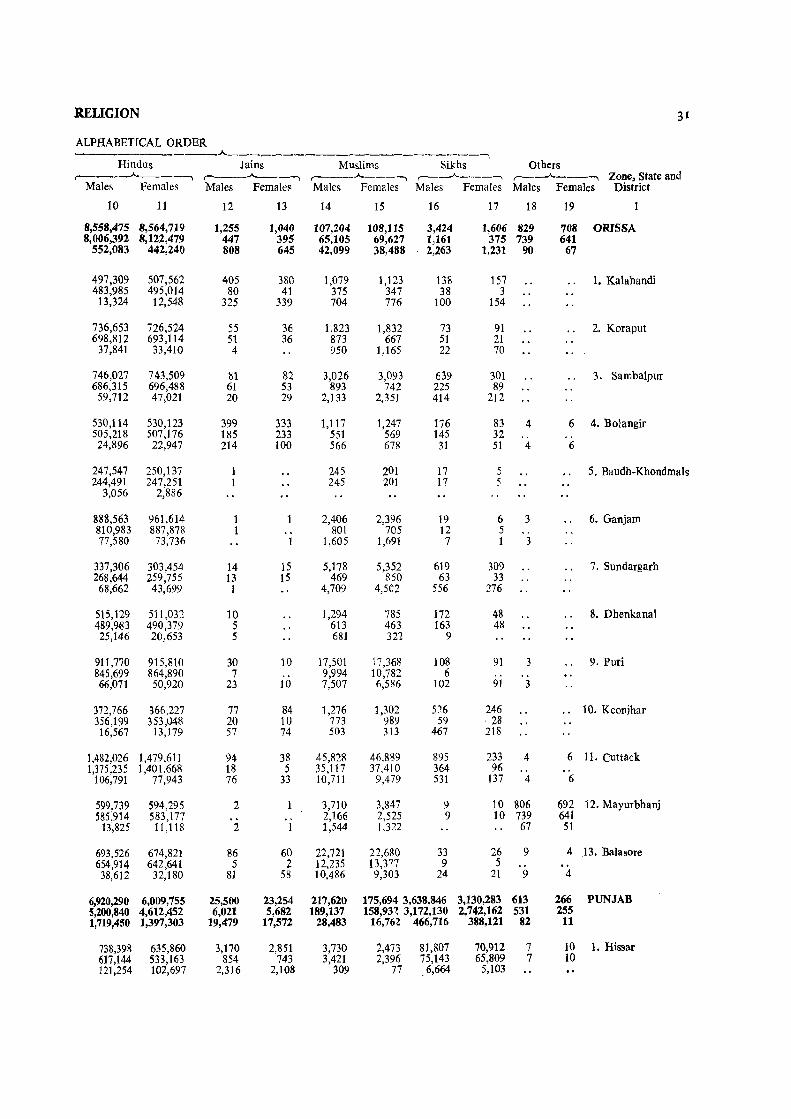
RELIGION 31
ALPHABETICAL ORDER __________ .A. , Hindus Jains Muslims Sikhs Others
.---__ .A. ___ -, ( ____ ..A. __ -, ,-___ ..A... __ ~ ,-----"----, r----A.---, Zone, State and Males Females Males Female~ Males Females Males Females Males Females District
10 11 12 13 14 15 16 17 18 19
8,558,475 8,564,719 1,255 1,040 107,204 108,115 3,424 1,666 829 708 ORISSA 8,006,392 8,122,479 447 395 65,105 69,627 1,161 375 739 641
552,083 442,240 808 645 42,099 38,488 2,263 1,231 90 67
497,309 507,562 405 380 1,079 1,123 138 157 1. Kalahandi 483,985 495,014 80 41 375 347 38 3
13,324 12,548 325 339 704 776 100 154
736,653 726,524 55 36 1,823 1,832 73 91 2. Koraput 698,812 693,114 51 36 873 667 51 21
37,841 33,410 4 950 1,165 22 70
746,027 743,509 81 82 3,026 3,093 639 301 3. Sarnbalpur 686,315 696,488 61 53 893 742 225 89
59,712 47,021 20 29 2,133 2,351 414 212
530,114 530,123 399 333 1,117 1,247 176 83 4 6 4. Bolangir 505,218 507,176 185 233 551 569 145 32 .. 24,896 22,947 214 100 566 G78 31 51 4 6
247,547 250,137 245 201 17 5 5. Baudh-Khondrnals 244,491 247,251 245 201 17 5
3,056 2,886
888,563 961,614 1 1 2,406 2,396 19 6 3 6. Ganjarn 810,983 887,878 1 .. 801 705 12 5 .. 77,5S0 73,736 1 1,605 1,691 7 1 3
337,306 303,454 14 15 5,178 5,352 619 309 7. Sundargarh 268,644 259,755 13 15 469 850 63 33 68,662 43,699 1 4,709 4,51':2 556 276
515,129 511,032 10 1,294 785 172 48 8. Dhenkanal 489,9~3 490,379 5 613 463 163 48 25,146 20,653 5 681 322 9
911,770 915,810 30 10 17,501 17,36R 108 91 3 9. Puri 845,699 864,890 7 9,994 10,782 6 .. .. 66,071 50,920 23 10 7,507 6,586 102 91 3
372,766 366,227 77 84 1,276 1,302 5:16 246 ., 10. Keonjhar 356,199 353,048 20 10 773 989 59 . 28 16,567 13,179 57 74 503 313 467 218
1,482,026 1,479,611 94 38 45,828 46,889 895 233 4 6 11. cuttack 1,375,235 1,401,668 18 5 35,117 37,410 364 96
106,791 77,943 76 33 10,711 9,479 531 137 4 6
599,739 594,295 2 3,710 3,847 9 10 806 692 12. Mayurbbanj 585,914 583,177 2,166 2,525 9 10 739 641
13,825 11,118 2 1 1,544 1,322 67 51
693,526 674,821 86 60 22,721 22,680 33 26 9 4 13. Balasore 654,914 642,641 5 2 12,235 13,377 9 5 38,612 32,180 81 58 10,486 9,303 24 21 9 4
6,920,290 6,009,755 25,500 23,254 217,620 175,694 3,638,846 3,130,283 613 266 PUNJAB 5,200,840 4,612,452 6,021 5,682 189,137 158,93'. 3,172,130 2,742,162 531 255 1,719,450 1,397,303 19,479 17,572 28,483 16,762 466,716 388,121 82 11
738,398 635,860 3,170 2,851 3,730 2,473 81,807 70,912 7 10 1. Hissar 617,144 533,163 854 743 3,421 2,396 75,143 65,809 7 10 121,254 102,697 2,316 2,108 309 77 L 6,664 5,103
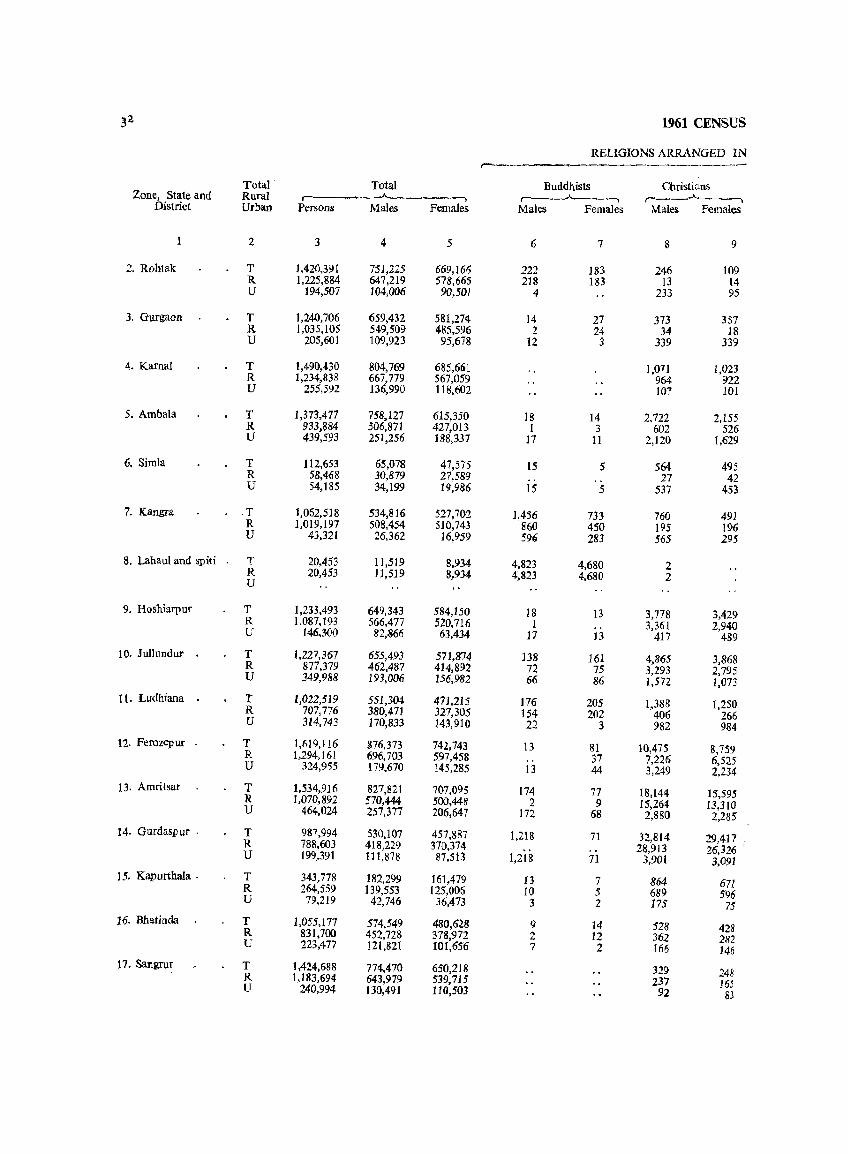
34 1961 CENSUS
RELIGIONS ARRANGED IN r-
Total Total Buddhists Cbristians Zone, State and Rural r~ _ _____...A___.-_---. r------"------_-., r-__ ..A._-------...
District Urban Persons Males Females Males Females Males Females
2 3 4 5 6 7 8 9
2. Rohtak T 1,420,.Hl 751,225 669,166 222 183 246 109 R 1,225,884 647,219 578,665 218 183 13 14 U t94,S07 HJ4,OO6 90,501 4 233 95
3. Gurgaon T 1,240,706 659,432 581,274- 14 27 373 357 R 1,035,105 549,509 485,596 2 24- 34 18 U 205,601 109,923 95,678 12 3 339 339
4. Kamal T 1,490,430 804,769 685,661 1,071 1,023 R 1,234,838 667,779 567,059 964 922 U 255,592 136,990 U8,602 107 101
5. Ambala T 1,373,477 758,127 615,350 18 14 2,722 2,155 R 933,884 506,871 427,013 1 3 602 526 U 439,593 251,256 188,337 17 11 2,120 1,629
6, Simla T 112,653 65,078 47,575 15 5 564 495 R 58,468 30,879 27,589 .. 27 42 U 54,185 34,199 19,986 15 5 537 453
7. Kangra T 1,062,518 534,816 527,702 1,456 733 760 491 R 1,019,197 508,454 510,743 860 450 195 196 U 43,321 26,362 16,959 596 283 565 295
8. Lahau! and spiti T 20,453 11,519 8,934 4,823 4,680 2 R 20,453 J 1,519 8,934 4,823 4,680 2 U
9. Hoshiarpur T 1,233,493 649,343 584,150 18 13 3,778 3,429 R 1,087,193 566,477 520,716 1 .. 3,361 2,940 U 146,300 82,866 63,434 17 13 417 489
10. Jullundur T 1,227,367 655,493 571,874 138 161 4,865 3,868 R 877,379 462,487 414,892 72 75 3,293 2,795 U 349,988 193,006 156,982 66 86 1,572 1,073
II. Ludhiana T 1,022,519 551,304 471,215 176 20S 1,388 1,250 R 707,776 380,471 327,305 154 202 406 266 U 314,743 170,833 143,910 22 3 982 984 12. Ferozepur . T 1,619,116 876,373 74,,743 13 81 10,475 8,759 R 1,294,161 696,703 597,458 37 7,226 6,525 U 324,955 179,670 145,285 13 44 3,249 2,234 13. Amritsat T 1,534,916 827,821 707,095 174 77 18,144 15,595 R 1,070,892 570,444 500,#8 2 9 15,264 13,3 ra U 464,024 257,377 206,647 172 68 2,880 2,285 14. Gurdaspur . T 987,994 530,107 457,887 1,218 71 32,814 29,417 R 788,603 418.229 370,374 28,913 26,326 U 199,391 111;878 87,513 1,21& 71 3,901 3,091 15. Kapurthala . T 343,778 182,299 161,479 13 7 864 671 R 264,559 139,553 125,005 10 5 689 596 U 79,219 42,746 36,473 3 2 175 75 16. Bhatjnda T 1,055,177 574,549 480,628 9 14 528 428 R 831,700 452,728 378,972 2 12 362 282 U 223,477 121,821 101,656 7 2 166 146 17. Sangrur T 1,424,688 774,470 650,218 329 248 R 1,183,694 643,919 539,715 '1.37 165 U 240,994 130,491 110,503 92 83
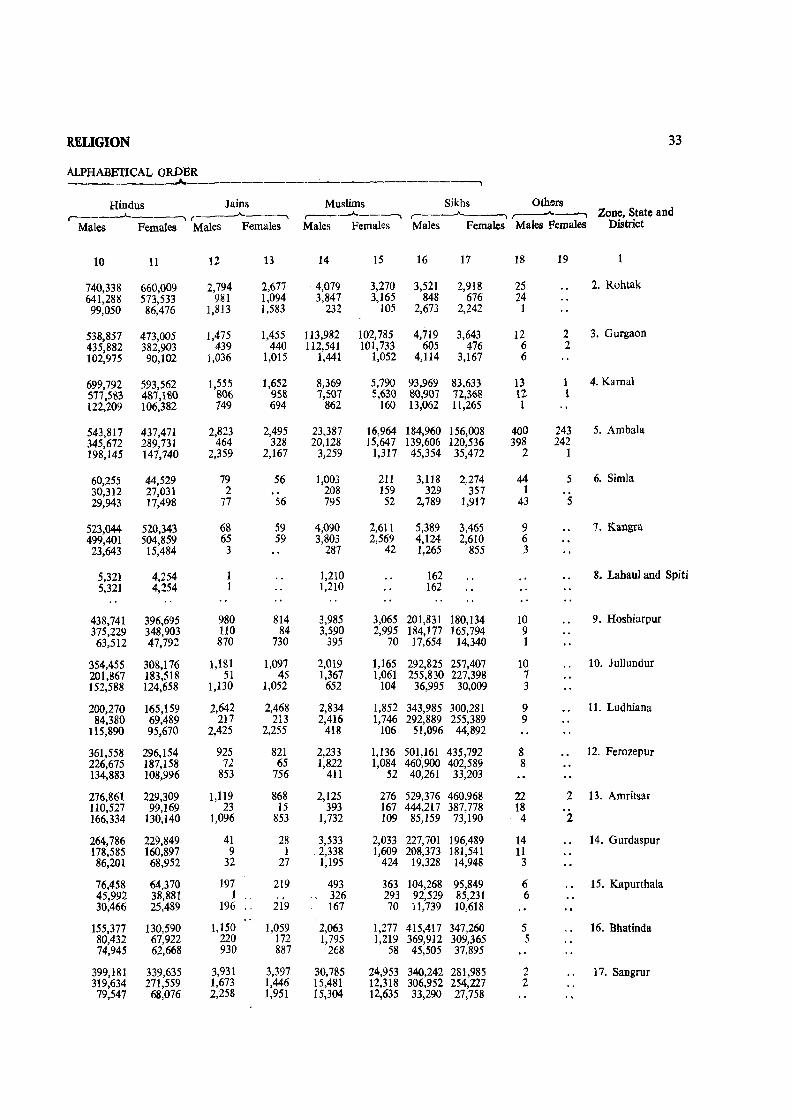
RELIGION 33
ALPHABETICAL ORDER ______ ____.A., ___ --______ ' ____________ ---,
Hindus ]ains Muslims Sikhs Others r----'---------., r-----'----, r---~\..--~ , _ ___.A._-, r----"-~ Zone, State and
Males Females Males Females Males Females Males Females Males Females District
10 11 12 13 14 15 16 17 18 19
740,338 660,009 2,794 2,677 ' 4,079 3,270 3,521 2,918 25 2. Rohtak 641,288 573,533 981 1,094 3,847 3,165 848 676 24 99,050 86,476 1,813 1,583 232 105 2,673 2,242 1
538,857 473,005 1,475 1,455 113,982 102,785 4,719 3,643 12 2 3. Gurgaon 435,882 382,903 439 440 112,541 101,733 605 476 6 2 102,975 90,102 1,036 1,015 1,441 1,052 4,114 3,167 6
699,792 593,562 1,555 1,652 8,369 5,790 93,969 83,633 13 1 4. Kamal 577,583 487,180 8<)6 958 7,507 5,630 80,907 72,368 12 1 122,209 106,382 749 694 862 160 13,062 11,265 1
543,817 437,471 2,823 2,495 23,387 16,964 184,960 156,008 400 243 5. Ambala 345,672 289,731 464 328 20,128 15,647 139,606 120,536 398 242 198,145 147,740 2,359 2,167 3,259 1,317 45,354 35,472 2 1
60,255 44,529 79 56 1,003 211 3,118 2,274 44 5 6. Simla 30,312 27,031 2 208 159 329 357 1 29,943 17,498 77 56 795 52 2,789 1,917 43 5
523,044 520,343 68 59 4,090 2,611 5,389 3,465 9 7. Kangra 499,401 504,859 65 59 3,803 2,569 4,124 2,610 6 23,643 15,484 3 287 42 1,265 855 3
5,321 4,254 1,210 162 8. Lahaul and Spiti 5,321 4,254 1,210 162
438,741 396,695 980 814 3,985 3,065 201,831 180,134 10 9. Hoshiarpur 375,229 348,903 110 84 3,590 2,995 184,177 165,794 9 63,512 47,792 870 730 395 70 17,654 14,340 1
354,455 308,176 1,181 1,097 2,019 1,165 292,825 257,407 10 10. Jullundur 201,867 183,518 51 45 1,367 1,061 255,830 227,398 7 152,588 124,658 1,130 1,052 652 104 36,995 30,009 3
200,270 165,159 2,642 2,468 2,834 1,852 343,985 300,281 9 11. Ludhiana 84,380 69,489 217 213 2,416 1,746 292,889 255,389 9
115,890 95,670 2,425 2,255 418 106 51,096 44,892
361,558 296,154 925 821 2,233 1,136 501,161 435,792 8 12. Ferozepur 226,675 187,158 72 65 1,822 1,084 460,900 402,58!} 8 134,883 108,996 853 756 411 52 40,261 33,203
276,861 229,309 1,119 868 2,125 276 529,376 460,968 22 2 13. Amritsar 110,527 99,169 23 15 393 167 444,217 387,778 18 166,334 130,140 1,096 853 1,732 109 85,159 73,190 4 2
264,786 229,849 41 28 3,533 2,033 227,701 196,489 14 14. Gurdaspur 178,585 160,897 9 I ,2,338 1,609 208,373 181,541 11 86,201 68,952 32 27 1,195 424 19,328 14,948 3
76,458 64,370 197 219 493 363 104,268 95,849 6 15. Kapurthala 45,992 38,881 1 .. 326 293 92,529 85,231 6 30,466 25,489 196 ,. 219 167 70 11,739 10,618
155,377 130,590 1,150 1,059 2,063 1,277 415,417 347,260 5 16. Bhatinda 80,432 67,922 220 172 1,795 1,219 369,912 309,365 5 74,945 62,668 930 887 268 58 45,505 37,895
399,181 339,635 3,931 3,397 30,785 24,953 340,242 281,985 2 17. Sangru! 319,634 271,559 1,673 1,446 15,481 12,318 306,952 254,227 2 79,547 68,076 2,258 1,951 15,304 12,635 33,290 27,758
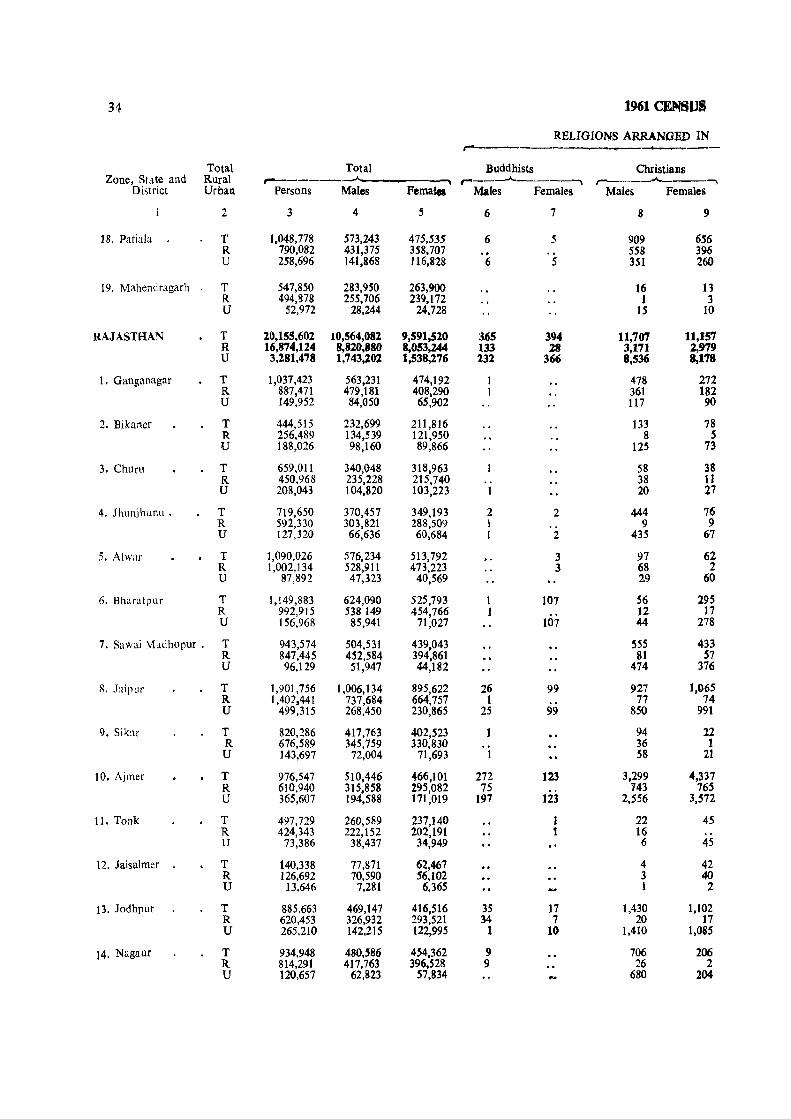
34 1961 CENSUS
RELIGIONS ARRANGED IN r-- -~-.-.--
Total Total Buddhists Christians Zone, St:l.te and Rural ,.. -"""'I
,.. __ ---A. ___ -""'" r----""---,
District Urban Persons Males Females Jl4ales Females Males Females
2 3 4 5 6 7 8 9
18. Patiala T 1,048,778 573,243 475,535 6 5 909 656 R 790,082 431,375 358,707 558 396 U 258,696 141,868 116,828 6 5 351 260
19. Mahendragarh T 547,850 283,950 263,900 16 13 R 494,878 255,706 239,172 1 3 U 52,972 28,244 24,728 15 10
RAJASTHAN T 20,155,602 10,564,082 9,591,520 365 394 11,707 11,157 R 16,874,124 8,820,880 8,053,244 133 28 3,171 2,979 U 3,281,478 1,743,%02 1,538,276 232 366 8,536 8,178
1. Ganganagar T 1,037,423 563,231 474,192 478 272 R 887,471 479,181 408,290 361 182 U 149,952 84,050 65,902 117 90
2. Bikaner T 444,515 232,699 211,816 133 78 R 256,489 134,539 121,950 8 5 U 188,026 98,160 89,866 125 73
3. Churll T 659,011 340,048 318,963 58 38 R 450,968 235,228 215,740 .. 38 11 U 208,043 104,820 103,223 1 20 27
4. Jhunjhunu . T 719,650 370,457 349,193 2 2 444 76 R 592,330 303,821 288,509 I .. 9 9 U t 27,320 66,636 60,684 1 2 435 67
5. Alwar T 1,090,026 576,234 513,792 3 97 62 R 1,002,134 528,911 473,223 3 68 2 U 87,892 47,323 40,569 2.9 60
6. Bharatpur T 1,149,883 624,090 525,793 1 107 S6 29S R 992,915 538 149 454,766 1 12 17 U 156,968 85,941 71,027 107 44 278
7. Sawai Madhopur . T 943,574 504,531 439,043 555 433 R 847,445 452,584 394,861 81 57 U 96,129 51,947 44,182 474 376
8. Jai[1ur T 1,901,756 1,006,134 895,622 26 99 927 1,065 R 1,407,441 737,684 664,757 1 77 74 U 499,315 268,450 230,865 25 99 850 991
9. Sik~lr T 820,286 417,763 402,523 94 22 R 676,589 345,759 330,830 36 1 U 143,697 72,004 71,693 1 58 21
10. Ajmcr T 976,547 510,446 466,101 272 123 3,299 4,337 R 610,940 315,858 295,082 75 743 765 U 365,607 194,588 171,019 197 123 2,556 3,572
11. Tonk T 497,729 260,589 237,140 1 22 45 R 424,343 222,152 202,191 1 16 " U 73,386 38,437 34,949 6 45
12. Jaisalmer T 140,338 77,871 62,467 4 42 R 126,692 70,590 56,102 3 40 U 13,646 7,281 6,365 1 2
13. Jodhpur T 885,663 469,147 416,516 35 17 1,430 1,102 R 620,453 326,932 293,521 34 7 20 17 U 265,210 142,215 122,995 1 10 1,410 l,OS5
14. Nagaur T 934,948 480,586 4.54,362 9 706 206 R 814,291 417,163 396,528 9 26 2 U 120,657 62,823 57,834 680 204
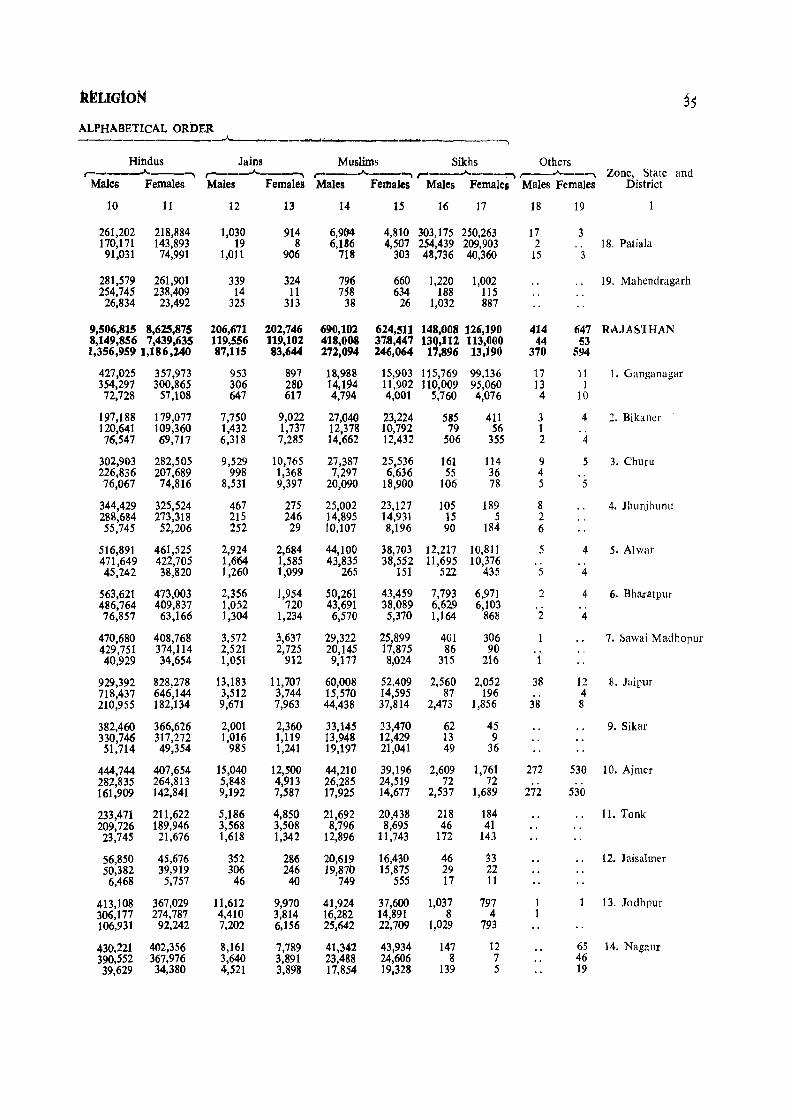
kktmtoN 35 ALPHABBTICAL ORDER. ---------~-----.....--........_ - ~--'"----.......... )
Hindus Jains Muslims Sikhs Others ,-----"----....., , --"---....., r--"""----. ,--_.A._~ ,-_--""'"---., Zone, State and
Males Females Males Femalell Males Females Males Females Males Females District
10 11 12 13 14 15 16 17 18 19
261,202 218,884 1,030 914 6,9<t4 4,810 303,175 250,263 17 3 170,171 143,893 19 8 6,186 4,507 254,439 209,903 2 .. 18. Patiala 91,031 74,991 1,011 906 718 303 48,736 40,360 15 3
281,579 261,901 339 324 796 660 1,220 1,002 19. Mahcndragarh 254,745 238,409 14 11 758 634 188 115
26,834 23,492 325 313 38 26 1,032 887
9,506,815 8,625,875 206,671 202,746 690,102 624,511 148,008 126,190 414 647 RAJAS1HAN 8,149,856 7,439,635 119,556 119,102 418,008 37;8,447 130,lIZ 113,000 44 53 1,356,959 1,186,240 87,115 83,644 272,094 246,064 11,896 13,190 370 594
427,025 357,973 953 897 18,988 15,903 115,769 99,136 17 11 1. Ganganagar 354,297 300,865 306 280 14,194 11,902 110,009 95,060 13 J 72,728 57,108 647 617 4,794 4,001 5,760 4,076 4 10
197,188 179,077 7,750 9,022 27,040 23,224 585 411 3 4 1. Bikaner 120,641 109,360 1,432 1,737 12,378 10,792 79 56 1 .. 76,547 69,717 6,318 7,285 14,662 12,432 506 355 2 4
302,903 282,505 9,529 10,765 27,387 25,536 161 114 9 5 3. Churu 226,836 207,689 998 1,368 7,297 6,636 55 36 4 .. 76,067 74,816 8,531 9,397 20,090 18,900 106 78 5 5
344,429 325,524 467 275 25,002 23,127 105 189 8 4. Jhunjhunu 288,684 273,318 215 246 14,895 14,931 15 5 2 55,745 52,206 252 29 10,107 8,196 90 184 6
516,891 461,525 2,924 2,684 44,100 38,703 12,217 10,811 5 4 5. Alwar 471,649 422,705 1,6'64 1,585 43,835 38,552 11,695 10,376 .. 45,242 38,820 1,260 1,099 265 151 522 435 5 4
563,621 473,003 2,356 1,954 50,261 43,459 7,793 6,971 2 4 6. Bharatpur 486,764 409,837 1,052 720 43,691 38,089 6,629 6,103 .. 76,857 63,166 1,304 1,234 6,570 5,370 1,164 868 2 4
470,680 408,768 3,572 3,637 29,322 25,899 401 306 7. Sawai Madhopur 429,751 374,114 2,521 2,725 20,145 17,875 86 90 40,929 34,654 1,051 912 9,171 8,024 315 216 1
929,392 828,278 13,183 11,707 60,008 52,409 2,560 2,052 38 12 8. Jaipur 718,437 646,144 3,512 3,744 15,570 14,595 87 196 .. 4 210,955 182,134 9,671 7,963 44,438 37,814 2,473 1,856 38 8
382,460 366,626 2,001 2,360 33,145 33,470 62 45 9. Sikar 330,746 317,272 1,016 1,119 13,948 12,429 13 9 51,714 49,354 985 1,241 19,191 21,041 49 36
444,744 407,654 15,040 12,500 44,210 39,196 2,609 1,761 272 530 10. Ajmcr 282,835 264,813 5,848 4,913 26,285 24,519 72 72 .. .. 161,909 142,841 9,192 7,587 17,925 14,677 2,537 1,689 272 530
233,471 211,622 5,186 4,850 21,692 20,438 218 184 11. Tonk 209,726 189,946 3,568 3,508 8,796 8,695 46 41 23,745 21,676 1,618 1,342 12,896 11,743 172 143
56,850 45,676 352 286 20,619 16,430 46 33 12. Jaisalmer 50,382 39,919 306 246 19,870 15,875 29 22 6,468 5,757 46 40 749 555 17 11
413,108 367,029 11,612 9,970 41,924 37,600 1,037 797 13. Jodhpur 306,177 274,787 4,410 3,814 16,282 14,891 8 4 106,931 92,242 7,202 6,156 25,642 22,709 1,029 793
430,221 402,356 8,161 7,789 41,342 43,934 147 12 65 14. Naganr 390,552 367,976 3,640 3,891 23,488 24,606 8 7 46 39,629 34,380 4,521 3,898 17,854 19,328 139 5 19
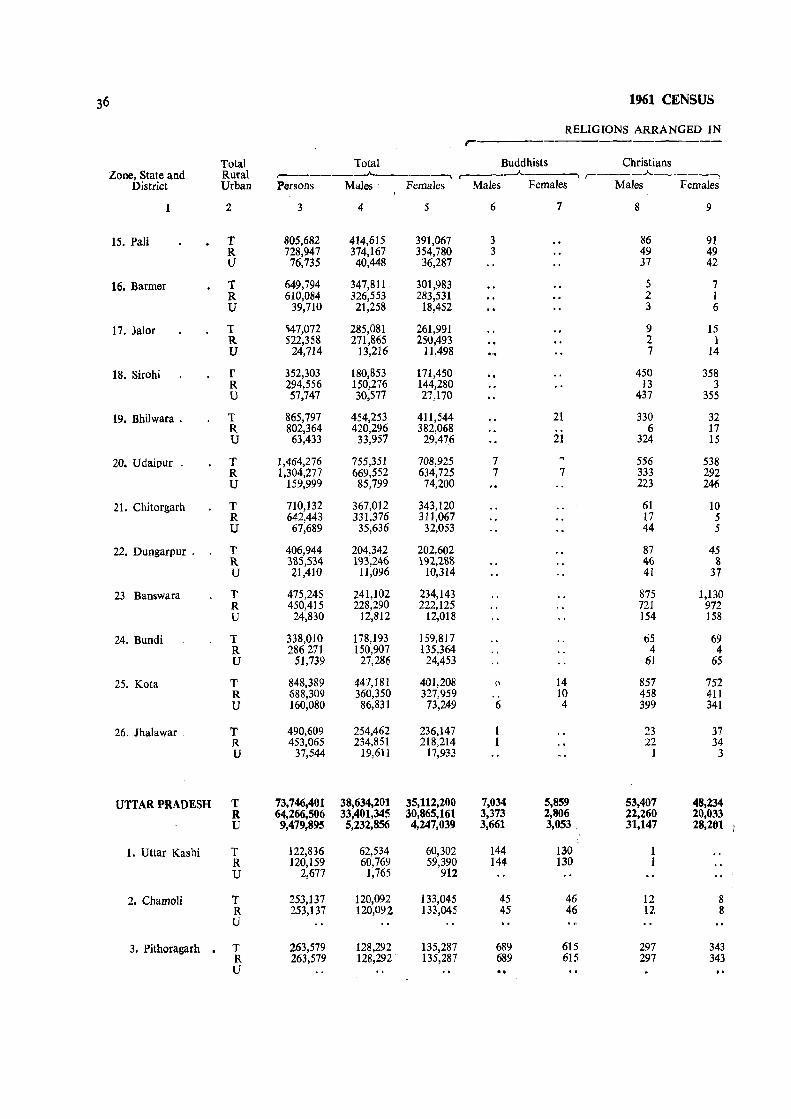
36 1961 CENSUS
RELIGIONS ARRANGED IN ,-
Total Total Buddhists Christians Zone, State and Rural r--------"----------. .-___ ---"-____ -, , ____ A _____ -,
District Urban Persons Males Females Males Females Males Females
2 3 4 5 6 7 8 9
15. Pali T 805,682 414,615 391,067 3 86 91 R 728,947 374,167 354,780 3 49 49 U 76,735 40,448 36,287 37 42
16. Barmer T 649,794 347,811 301,983 5 7 R 610,084 326,553 283,531 2 1 U 39,710 21,258 18,452 3 6
17. Jalor T ~7,072 285,081 261,991 9 15 R 522,358 271,865 25tJ,493 2 1 U 24,714 13,216 11,498 7 14
18. Sirohi r 352,303 180,853 171,450 .~ 450 358 R 294,556 150,276 144,280 13 3 U 57,747 30,571 27,170 437 355
19. Bhilwara . T 865,797 454,253 411,544 21 330 32 R 802,364 420,296 382,068 6 17 U 63,433 33,957 29,476 21 324 15
20. Udaipur . T 1,464,276 755,351 708,925 7 556 538 R 1,304,277 669,552 634,725 7 7 333 292 U 159,999 85,799 74,200 223 246
21. Chitorgarh T 710,132 367,012 343,120 61 10 R 642,443 331,376 311,067 17 5 U 67,689 35,636 32,053 44 5
22. Dungarpur . T 406,944 204,342 202,602 87 45 R 385,534 193,246 192,288 46 8 U 21,410 11,096 10,314 41 37
23. Banswara T 475,245 241,102 234,143 875 1,130 R 450,415 228,290 222,125 721 972 U 24,830 12,812 12,018 154 158
24. Bundi T 338,010 178,193 159,817 tiS 69 R 286271 150,907 135,364 4 4 U 51,739 27,286 24,453 61 65
25. Kota T 848,389 441,181 401.208 {) 14 857 752 R 688,309 360,350 327;959 .. lD 458 411 U 160,080 86,831 73,249 6 4 399 341
26. Jhalawar T 490,609 254,462 236,147 23 37 R 453,065 234,851 218,214 22 34 U 37,544 19,611 17,933 1 3
UTTAR PRADESH T 73,746,401 38,634,201 35,112,200 7,034 5,859 53,407 48,234 R 64,266,506 33,401,345 30,865,161 3,373 2,806 22,260 20,033 U 9,479,895 5,232,856 4,247,039 3,661 3,053. 31,147 28,261
1. Uttar Kashi T 122,836 62,534 60,302 144 130 R 120,159 60,769 59,390 144 130 U 2,677 1,765 912
2. Chamoli T 253,137 120,092 133,045 45 46 12 8 R 253,137 120,092 133,045 45 46 12 8 U
3. Pithoragarh . T 263,579 128,292 135,287 689 615 297 343 R 263,579 128,292 135,287 689 615 297 343 U ..
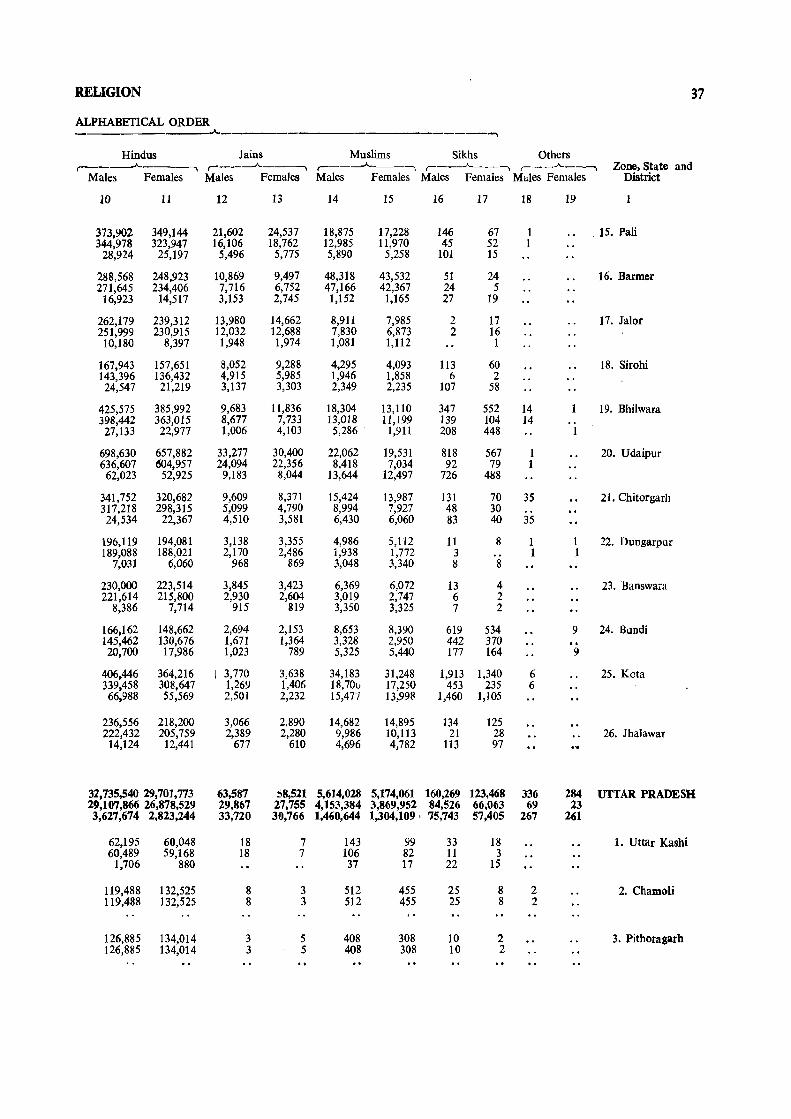
RELIGION 37
ALPHABETICAL ORDER -.
Hindus Jains Muslims Sikhs Others r-------A.--------, ,_--A-__ -----, , __ ---A. __ , ,----'----, ,---'-------. Zone, State and
Males Females Males Females Males Females Males Females Males Females District
10 11 12 13 14 15 16 17 18 19
373,902 349,144 21,602 24,537 18,875 17,228 146 67 1 15. Pall 344,978 323,947 16,106 18,762 12,985 11,970 45 52 I
28,924 25,197 5,496 5,775 5,890 5,258 101 15
288,568 248,923 10,869 9,497 48,318 43,532 51 24 16. Barmer 271,645 234,406 7,716 6,752 47,166 42,367 24 5
16,923 14,517 3,153 2,745 1,152 1,165 27 19
262,179 239,312 13,980 14,662 8,911 7,985 2 17 17. lalor 251,999 230,915 12,032 12,688 7,830 6,873 2 16 10,180 8,397 1,948 1,974 1,081 1,112 1
167,943 157,651 8,052 9,288 4,295 4,093 113 60 18. Sirohi 143,396 136,432 4,915 5,985 1,946 1,858 6 2
24,547 21,219 3,137 3,303 2,349 2,235 107 58
425,575 385,992 9,683 11,836 18,304 13,110 347 552 14 19. Bhilwara 398,442 363,015 8,677 7,733 13,018 11,199 139 104 14 .. 27,133 22,977 1,006 4,103 5,286 1,911 208 448 1
698,630 657,882 33,277 30,400 22,062 19,531 818 567 1 20. Udaipur 636,607 604,957 24,094 22,356 8,418 7,034 92 79 1
62,023 52,925 9,183 8,044 13,644 12,497 726 4H8
341,752 320,682 9,609 8,371 15,424 13,987 131 70 35 21. Chitorgarh 317,218 298,315 5,099 4,790 8,994 7,927 48 30 24,534 22,367 4,510 3,581 6,430 6,060 83 40 35
196,119 194,081 3,138 3,355 4,986 5,112 11 8 1 1 22. Dungarpur 189,088 188,021 2,170 2,486 1,938 1,772 3 .. 1 1
7,031 6,060 968 869 3,048 3,340 8 8
230,000 223,514 3,845 3,423 6,369 6,072 13 4 23. Banswa,a 221,614 215,800 2,930 2,604 3,019 2,747 6 2
8,386 7,714 915 319 3,350 3,325 7 2
166,162 148,662 2,694 2,153 8,653 8,390 619 534 9 24. Bundi 145,462 130,676 1,671 1,364 3,328 2,950 442 370 .. 20,700 17,986 1,023 789 5,325 5,440 177 164 9
406.446 364,216 3,770 3,638 34,183 31,248 1,913 1,340 6 25. Kota 339,458 308,647 1,269 1,406 18,70u 17,250 453 235 6 66,988 55,569 2,501 2,232 15,471 13,998 1,460 1,105
236,556 218,200 3,066 2,890 14,682 14,895 134 125 222,432 205,759 2,389 2,280 9,986 10,113 21 28 26. JhaJawar 14,124 12,441 677 610 4,696 4,782 113 97
32,735,540 29,701,773 63,587 ~8,521 5,614,028 5,174,061 160,269 123,468 336 284 UTTAR PRADESH 29,107,866 26,878,529 29,867 27,755 4,153,384 3,869,952 84,526 66,063 69 23 3,627,674 2,823,244 33,720 30,766 1,460,644 1,304,109, '15,743 57,405 267 261
62,195 60,048 18 7 143 99 33 18 1. Uttar Kashi 60,489 59,168 18 7 106 82 11 3
1,706 880 37 17 22 15
119,488 132,525 8 3 512 455 25 8 2 2. Chamoli 119,488 132,525 8 3 512 455 25 8 2
126,885 134,014 3 5 408 308 10 2 3. Pithoragarh 126,885 134,014 3 5 408 308 10 2
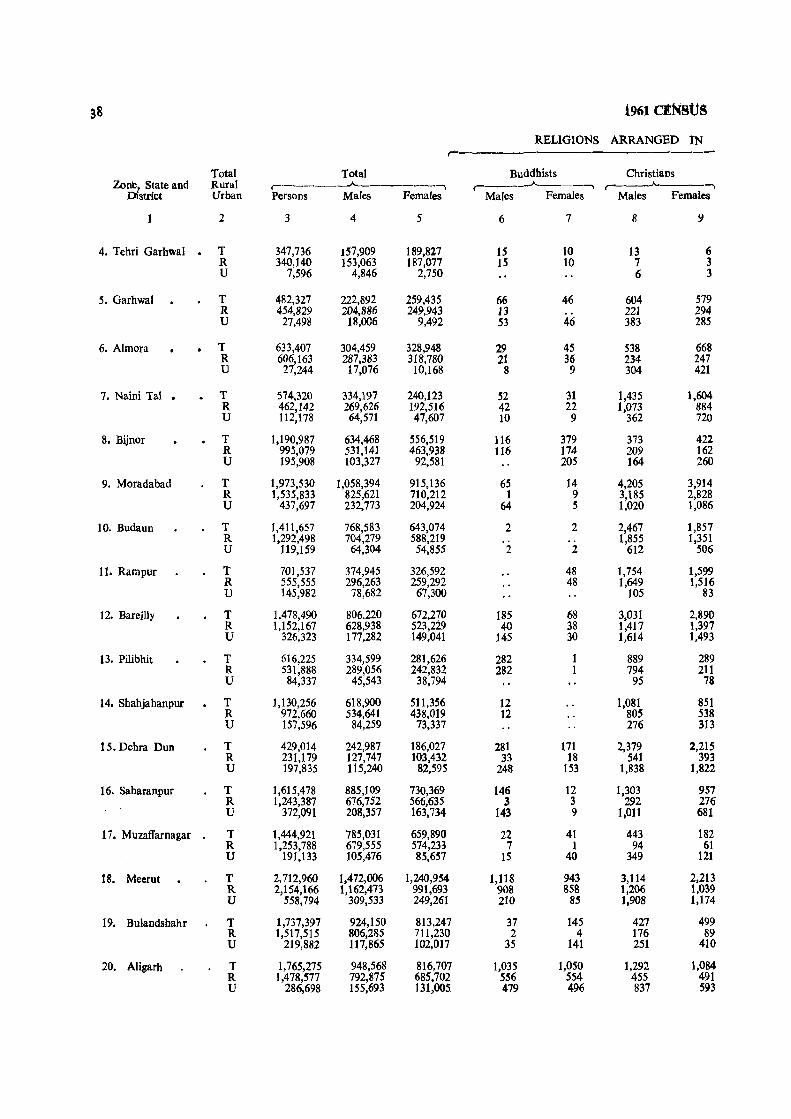
38 1961 CENsUS
RELIGIONS ARRANGED IN ,-----
Total Total Buddhists Christians Zone, State and Rural ,------~-------~
, ___ .A. ___ ~ ,..-__ --A. ____ ,
District Urban Persons Males Females Males Females Males Females
2 3 4 5 6 7 8 9
4. Tehri Garhwal . T 347,736 157,909 189,827 15 10 13 6 R 340,140 153,063 187,077 15 10 7 3 U 7,596 4,846 2,750 6 3
5. Garhwal T 482,327 222,892 259,435 66 46 604 579 R 454,829 204,886 249,943 13 221 294 U 27,498 18,006 9,492 53 46 383 285
6. Almora T 633,407 304,459 328,948 29 45 538 668 R 606,163 287,383 318,780 21 36 234 247 U 27,244 17,076 10,168 8 9 304 421
7. Naini Tal • T 574,320 334,197 240,123 52 31 1,435 1,604 R 462,142 269,626 192,516 42 22 1,073 884 U 112,178 64,571 47,607 10 9 362 720
8. Bijnor T 1,190,987 634,468 556,519 116 379 373 422 R 995,079 531,141 463,938 116 174 209 162 U 195,908 103,327 92,581 205 164 260
9. Moradabad T 1,973,530 1,058,394 915,136 65 14 4,205 3,914 R 1,535,833 825,621 710,212 1 9 3,185 2,828 U 437,697 232,773 204,924 64 5 1,020 1,086
10. Budaun T 1,411,657 768,583 643,074 2 2 2,467 1,857 R 1,292,498 704,279 588,219 .. 1,855 1,351 U 119,159 64,304 54,855 2 2 612 506
11. Rampur T 701,537 374,945 326,592 48 1,754 1,599 R 555,555 296,263 259,292 48 1,649 1,516 U 145,982 78,682 67,300 105 83
12. Bareilly T 1,478,490 806,220 672,270 185 68 3,031 2,890 R 1,152,167 628,938 523,229 40 38 1,417 1,397 U 326,323 177,282 149,041 145 30 1,614 1,493
13. Pilibhit T 616,225 334,599 281,626 282 889 289 R 531,888 289,056 242,832 282 794 211 U 84,337 45,543 38,794 95 78
14. Shahjahanpur T 1,130,256 618,900 511,356 12 1,081 851 R 972,660 534,641 438,019 12 805 538 U 157,596 84,259 73,337 276 313
15. Dehra Dun T 429,014 242,987 186,027 281 171 2,379 2,215 R 231,179 127,747 103,432 33 18 541 393 U 197,835 115,240 82,595 248 153 1,838 1,822
16. Saharanpur T 1,615,478 885,109 730,369 146 12 1,303 957 R 1,243,387 676,752 566,635 3 3 292 276 U 372,091 208,357 163,734 143 9 1,011 681
17. Muzaifarnagar T 1,444,921 785,031 659,890 22 41 443 182 R 1,253,788 679,555 574,233 7 1 94 61 U 191,133 105,476 85,657 15 40 349 121
18. Meerut T 2,712,960 1,472,006 1,240,954 1,118 943 3,114 2,213 R 2,154,166 1,162,473 991,693 908 858 1,206 1,039 U 558,794 309,533 249,261 210 85 1,908 1,174
19. Bulandshahr T 1,737,397 924,150 813,247 37 145 427 499 R 1,517,515 806,285 711,230 2 4 176 89 U 219,882 117,865 102,017 35 141 251 410
20. Aligarh T 1,765,275 948,568 816,707 1,035 1,050 1,292 1,084 R 1,478,577 792,875 685,702 556 554 455 491 U 286,698 155,693 131,005. 479 496 837 593

EllGION 39
A.LPHABETICAL ORDER --------- ""\
Hindus Jains Muslims Sikhs .others r---~-----..
• __ .A.. ___ ~ , _ ___.A----., _ ___.A-__ ~
r--__.A.._""", Zone, State and Males Females Male Females Males Females Males Females Males Females District
10 11 12 13 14 15 16 17 18 19
156,920 188,456 34 34 874 1,277 50 44 3 4. Tehri Garhwal 152,377 185,938 1 1 651 1,118 9 7 3
4,543 2,518 33 33 223 159 41 37
218,600 257,076 44 24 3,354 1,511 223 199 1 5. Garhwal 202,505 248,687 9 2 2,109 846 28 114 1
16,095 8,389 35 22 1,245 665 195 85
302,210 326,912 3 2 1,566 1,272 113 49 6. Almorah 286,539 318,049 3 2 564 438 22 8
15,671 8,863 1,002 834 91 41
261,903 188,956 153 144 43,971 29,505 26,656 19,881 27 2 7. Naini Tal 216,259 157,504 65 67 27,672 15,614 24,488 18,423 27 2 45,644 31,452 88 77 16,299 13,891 2,168 1,458
401,085 341,167 586 651 226,980 208,259 5,328 5,641 8. Bijnor 358,872 305,084 159 147 167,281 153,605 4,504 4,766 42,213 36,083 427 504 59,699 54,654 824 875
666,724 554,831 573 520 382,871 352,345 3,950 3,510 6 2 9. Moradabad 549,461 461,948 131 117 270,040 242,966 2,802 2,344 1 117,263 92,883 442 403 112,831 109,379 1,148 1,166 5 2
634.,943 526,542 66 78 1.30,903 114,40J 202 194 . ' 10. Budavn 601,618 499,871 7 13 100,716 86,875 83 109
33,325 26,671 59 65 30,187 27,526 119 85
190,874 165,679 297 240 167,895 147,906 14,125 11,120 ., 11. Rampur 168,080 142,836 103 64 113,420 104,361 13,011 10,467 22,794 22,843 194 176 54,475 43,545 1,114 653
559,444 460,996 106 88 237.713 204,010 5,725 4,211 16 7 12. Bareilly 452,772 374,505 26 19 171,642 145,026 3,041 2,244 106,672 86,491 80 69 66,071 58,984 2,684 1,967 16 7
253,548 214,220 534 9 69,225 60,597 10,121 6,510 o. 13. PiIibhit 224,857 190,761 519 53,063 45,779 9,541 6,080 28,691 23,459 15 9 16,162 14,818 580 430
522,522 425,573 142 3C 91,590 81,894 3,552 3,008 1 .. t 4. Shahjahanpul' 475,212 385,417 21 17 55,747 49,767 2,843 2,280 1 47,310 40,156 121 13 35,843 32,127 709 728
208,071 160,464 1,050 1,567 20,863 14,036 10,339 7,565 4 9 15. Dehra Dun 112,703 89,085 126 1,076 12,609 11,266 1,734 1,593 1 1 95,368 71,379 924 491 8,254 2,770 8,605 5,912 3 8
606.190 485,776 2,815 3,703 267,014 235,031 7,641 4,889 1 16. Saharanpur 475;503 389,513 612 606 197,768 174,571 2,574 1,665 1 130,687 96,263 2,203 3,097 69,246 60,460 5,067 3,224
562,742 463,343 5,054 4,408 213,871 190,026 2,899 1,890 .. 17. Muzaffarnagar 493,048 413,552 2,471 2,291 182,270 157,094 1,665 1,234 69,694 49,791 2,583 2,117 31,60J 32,932 1,234 656
1,128,797 943,945 22,430 19,649 303,682 265,269 12,863 8,935 2 .. 18. Mee-rut 914,507 774,252 15,792 14,207 226,408 198,283 3,652 3,054 214,290 169,693 6,638 5,442 77,274 66,986 9,211 5,881 2
773,052 673,455 708 1,059 147,962 135,587 1,963 2,502 693,597 608,060 204 207 111,394 102,037 9il 833 .. 19. Bulandshahr 79,455 65,395 504 852 36,568 33,550 1,052 1,669
834,046 714,142 1,482 1,393 108,015 96,379 2,689 2,659 9 ,. 20. Aligarh
721,684 622,541 336 234 68,184 60,097 1,660 1,785 112,362 91,601 1,146 1,159 39,831 36,282 1,029 874 9

40 1961 CENSUS
RELIGIONS ARRANGED IN
Total Total ,--
Buddhists Christians Zoneb~ta!e and Rural
,... ____ _____..A._ __ ~
r------"---~ r----.......,.A.---~ lstrlct Urban Persons Males Females Males QFemales Males Females
2 3 4 5 6 7 8 9
21. Mathura . T 1,071,279 582,894 488,385 4 6 416 452 R 891,652 484,650 407,002 " 104 105 U 179,627 98,244 81,383 4 6 312 347
22. Agra T 1,862,142 1,012,0.56 850,086 1,117 1,189 2,987 2,304 R 1,194,158 645,163 548,995 19 25 366 163 U 667,984 366,893 301,091 1,098 1,164 2,621 2,141
23. Etah T 1,299,674 696,924 602,750 148 26 2,408 2,414 R 1,174,560 629,863 544,697 142 26 2,121 2,018 U 125,114 67,061 58,053 6 287 396
24. Mainpuri • T 1,180,894 634,951 545,943 740 671 R 1,093,735 587,091 506,644 543 511 U 87,159 47,860 39,299 1 197 160
25. Farrukhabad T 1,295,071 704,387 590,684 47 12 761 1,142 R 1,151,990 627,309 524,681 22 4 624 1,056 U 143,081 77,078 66,003 25 8 137 86
26. Etawah T 1,182,202 639,974 542,228 37 224 200 R 1,074,931 581,6S6 493,245 35 145 129 U 107,271 58,288 48,983 2 79 71
27. Kanpur T 2,381,353 1,314,673 1,066,680 420 225 4,074 3,607 R 1,405,062 753,233 651,829 26 9 22 14 U 976,291 561,440 414,851 394 216 4,052 3,593
28. Fatehpur • T 1,072,940 560,474 512,466 35 34 R 1,030,183 537,454 492,729 13 25 U 42,757 23,020 19,737 22 9
29. Allahabad T 2,438,376 1,263,981 1,174,395 60 59 3,543 2,718 R 1,994,412 1,014,957 979,455 32 43 128 148 U 443,964 249,024 194,940 28 16 3,415 2,570
30. Jhansi T 1,087,479 573,703 513,776 84 41 2,363 1,968 R 828,312 432,656 395,656 1 1 139 368 U 259,167 141,047 118,120 83 40 2,224 1,600
31. JaJaun T 663,168 351,704 311,464 3 42 65 69 R 578,494 305,706 272,788 3 1 6 21 U 84,674 45,998 38,676 41 59 48
32. Hamirpur T 794,449 412,917 381,532 15 284 228 R 727,896 377,467 350,429 14 180 159 U 66,553 35,4.50 31,103 1 104 69
33. Banda T 953,731 500,573 453,158 3 141 98 R 890,270 466,307 423,963 1 36 15 U 63,461 34,266 29,195 2 105 83
34. Kheri T 1,258,433 679,011 579,422 58 56 411 425 R 1,188,836 640,550 548,286 55 54 361 366 U 69,597 38,461 31,136 3 2 50 59
35. Sitapur T 1,608,057 365,242 742,815 8 2 294 334 R 1,485,306 796,471 688,835 7 2 23 103 U 122,751 68,771 53,980 1 271 231
36. Hardoi T 1,573,171 847,161 726,010 3 2 267 227 R 1,458,885 785,103 673,782 I .. 171 154 U 114,286 [62,058 52,228 2 2 96 73
37. Unnao T 1,226,923 648,560 578,363 1 1 112 93 R 1,197,143 631,867 565,276 1 1 53 51 U 29,780 16.693 13,087 59 42
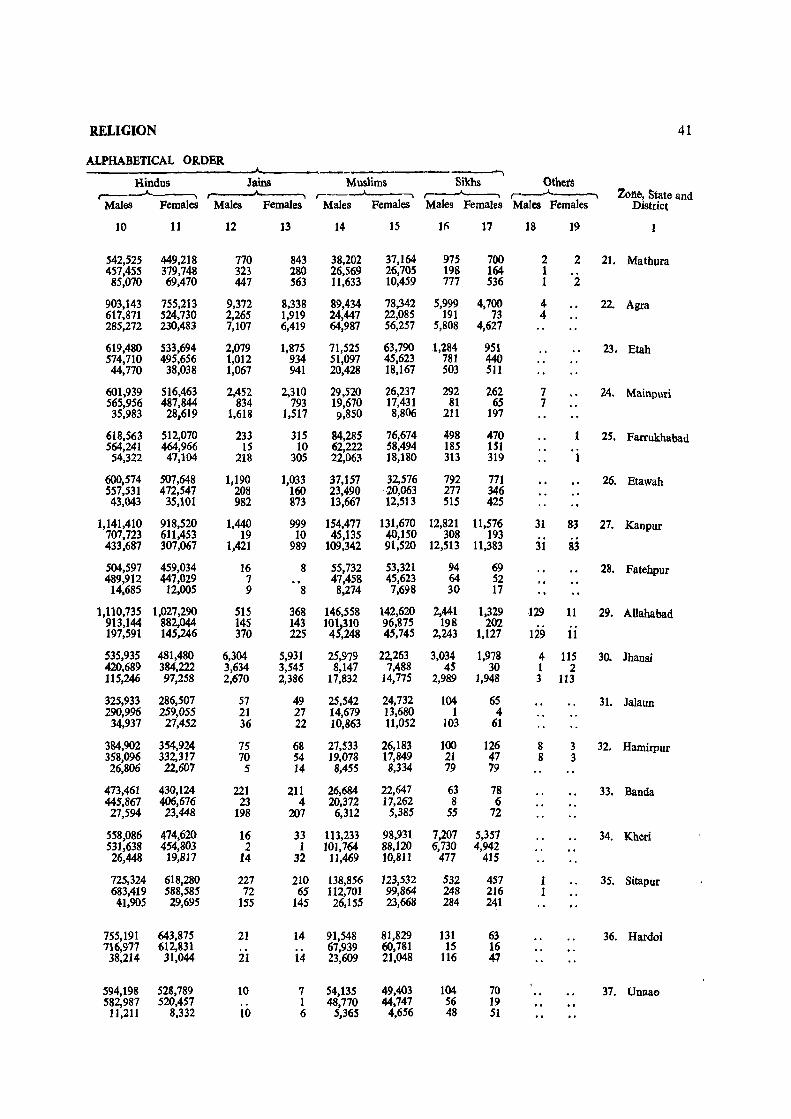
RELIGION 41
ALPHABETICAL ORDER
Hindus Jains Muslims Sikhs Othets ...... , r-____"___' ,----A-----. r__,.A. Zone, State and
Males Females Males Females Males Females Males Females Males Females District
10 11 12 13 14 IS II) 17 18 19
542,525 449,218 770 843 38,202 37,164 975 700 2 2 21. Matbura 457,455 379,748 323 280 26,569 26,705 198 164 1 85,070 69,470 447 563 11,633 10,459 777 536 1 2
903,143 755,213 9,372 8,338 89,434 78,342 5,999 4,700 4 22. Agea 617,871 524,730 2,265 1,919 24,447 22,085 191 73 4 285,272 230,483 7,107 6,419 64,987 56,257 5,808 4,627
619,480 533,694 2,079 1,875 71,525 63,790 l,l84 951 23. Btah 574,710 495,656 1,012 934 51,097 45,623 781 440 44,770 38,038 1,067 941 20,428 18,167 503 511
601,939 516,463 2,452 2,310 29,520 26,237 292 262 7 24. Mainpuri 565,956 487,844 834 793 19,670 17,431 81 65 7 35,983 28,619 1,618 1,517 9,850 8,806 211 197
618,563 512,070 233 315 84,285 76,674 498 470 1 25. Farrukhabad 564,241 464,966 15 10 62,222 58,494 185 151 54,322 47,104 218 305 22,063 18,180 313 319 1
600,574 507,648 1,190 1,033 37,157 32,576 792 771 26. Etawah 557,531 472,547 208 160 23,490 20,063 277 346 43,043 35,101 982 873 13,667 12,513 SIS 425
1,141,410 918,520 1,440 999 154,477 131,670 12,821 11,576 31 83 27. Kanpur 707,723 611,453 19 10 45,135 40,150 308 193 433,687 307,067 1,421 989 109,342 91,520 12,513 11,383 31 83
504,597 459,034 16 8 55,732 53,321 94 69 28. Fatehpur 489,912 447,029 7 47,458 45,623 64 52 14,685 12,005 9 8 8,274 7,698 30 17
1,110,735 1,027,290 515 368 146,558 142,620 2,441 1,329 129 11 29. Allahabad 913,144 882,044 145 143 10?,310 96,875 198 202 197,591 145,246 370 225 4 ,248 45,745 2,243 1,127 129 11
535,935 481,480 6,304 5,931 25,979 22,263 3,034 1,978 4 115 30. Jhansi 420,689 384,222 3,634 3,545 8,147 7,488 45 30 1 2 115,246 97,258 2,670 2,386 17,832 14,775 2,989 1,948 3 113
325,933 286,507 57 49 25,542 24,732 104 65 31. Jalaun 290,996 259,055 21 27 14,679 13,680 1 4
34,937 27,452 36 22 10,863 11,052 103 61
384,902 354,924 75 68 27,533 26,183 100 126 8 3 32. Hamirpur 358,096 332,317 70 54 19,078 11,849 21 41 8 3 26,806 22,601 5 14 8,455 8,334 79 19
473,461 430,124 221 211 26,684 22,647 63 78 33. Banda 445,867 406,676 23 4 20,372 11,262 8 6 27,594 23,448 198 207 6,312 5,385 55 72
558.086 474,620 16 33 113,233 98,931 7,207 5,357 34. Kheri 531,638 454,803 2 1 10],764 88,120 6,730 4,942 26,448 19,817 14 32 11,469 10,811 477 415
725,324 618,280 227 210 138,856 123,532 532 457 35. Sitapur 683,419 588,585 72 65 112,701 99,864 248 216 41,905 29,695 155 145 26,155 23,668 284 241
755,191 643,875 21 14 91,548 81,829 131 63 36. Hardoi 716,977 612,831 67,939 60,781 15 16 38,214 31,044 21 14 23,609 21,048 116 47
594,198 528,789 10 7 54,13S 49,403 104 70 37. UDlaao 582,987 520,457 1 48,770 44,747 56 19
11,211 8,332 10 6 5,365 4,656 48 51
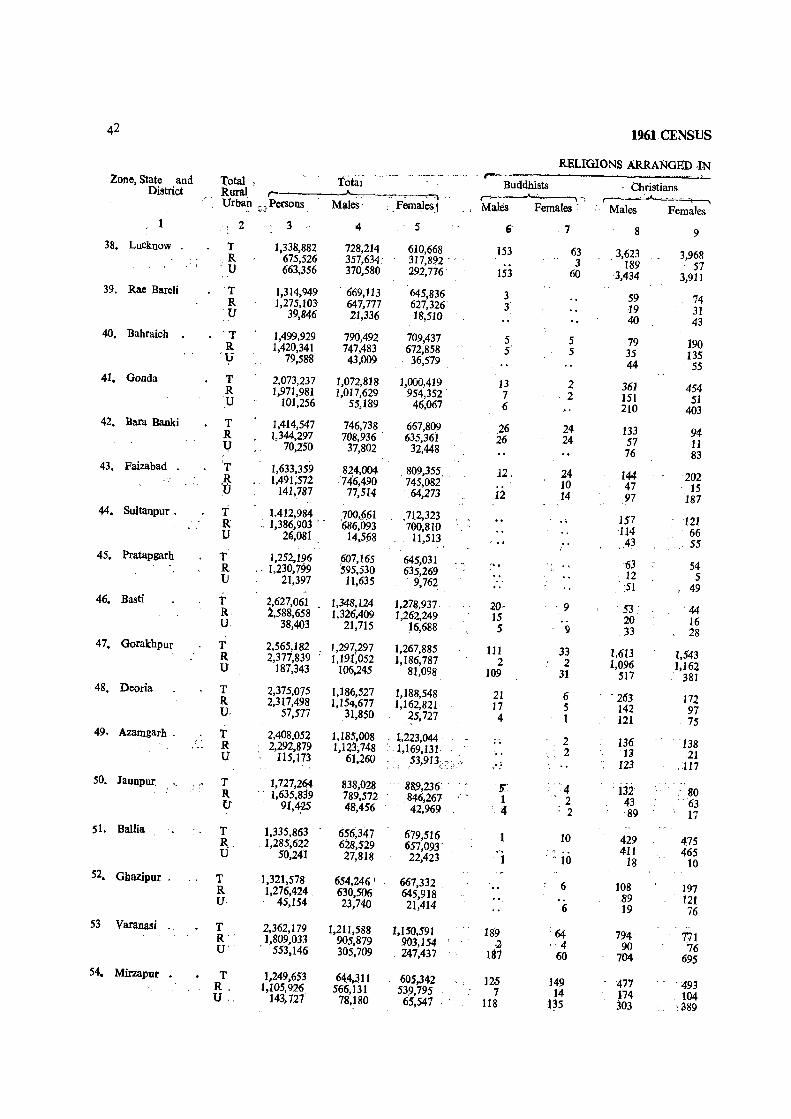
42 1961', CENSUS
RELIGIONS ARRANGED IN
Total' ~ "-,.,-~-.-.~., -.~--.. _ . ....... '.r-' Zone, State and total : Buddhists . Christians District Rural r . .., '-~~" ,--~--'~~...:..:.....:r-~
Urban r .. , Persons· Males' ; . Females j Males Females . Males Females - ..,'" , . 2 3 4 5 , 7 8 9
38. Lucknow T 1,338,882 728,214 610,668 153 63 3,623 3,968 ,R 675,526 . 357,634' 317,891 . .. 3 · 189 57 'U 663.356 370,580 292,776 153 60 3,434 3,911 39. Rae Bareli T 1,314,949 . 669,113 645,836 3 59 74 R 1,275,103 647,777 627,326' l 19 31 'U 39,846 21,336 18,5W 40 43 40. Bahraich T 1,499,929 790,492 709,437 5 5 79 190 R 1,420,341 747,483 672,858 5' 5 35 135 '\j 79,588 43,009 36,579 44 . 55 41. Gonda T 2,073,237 1,072,818 1,000,419 13 2 361 454 R 1,971,981 1,017,629 954,352 7 , 2 151 51 U 101,256 55,189 46,067 6 210 403 42. Bara Banld T 1,414,547 746,738 667,809 26 24 133 94 R 1,344,297 708,936 ' 635,361 . 26 24 57 11 II . 70,250 37,802 32,448 76 83 43. Faizabad 'T 1,633,359 824,004 .809,355, , 12. 24 144 202 R 1,491;572 746,490 745,082 10 47 15 :iJ 141,787 77,514 64,273 12 .14 97 187 44. Sultanpur. T 1.412,984 ,~~:ggl .712,323 . . 157 121 R '., 1,386,903 .• ~ 700,810 114 66 U 26,081 . 14,568 11,513 43 55 45. Pratapgarh T 1,252,196 ,607,165 .645,031 ,. 63 54 R .' 1,230,799 595,530 635,269
" , 12 5 U 21,397 11,635 9,762 ., 51 49
46. Basti T 2,627,061 1,348,U4 1,278,937, 20- ·9 53 : '44 R 2,588,658 1,326,409 1,262,249 15 .. 20 16 U, 38,403 21,715 16,688 S <) 33 28 47. Gorakhpur T 2,565,182 1,297,297 1,267,885 111 33 1,613 1,543 a 2,377,839 1,191;052 1,186,787 2 2 1,096 1,162 U 187,343 106,245 81,098 109 31 517 381 48. Deoria T 2,375,075 1,186,527 1,188,548 21 6 · 263 172 R 2,317,498 1,154,677 1,162,821 17 5 142 97 u- 57,577 31,850 25,727 4 1 121 75 49. Azamgarh . T 2,408,052. 1,185,008 - t,223,044 .. 2 136. 138 R 2,292,879 1,123,748 ' 1,169,131, 2 11 21 U 115,173 61,260 53,913;: ,: \ ~ -/," 123 .:t17 so. Jaunpur. 1,727,2~ 838,028 " '4 · iii ·c /<:' T . 889,236: . -!r
: 80 R 1,635,8 9 789,572 846,267 I 2 43 '. 63 U 91,~S 48,456 42,969 ' 4 f 2 89 17 51. BalHa T 1,335,863 656,347 679,516. 10 429 475 R" 1,285,622 628,529 657,093 .'. 411 465 U 50,241 27,818 22,423 1 -10 18 10 52. Ghazipur . T 1,321,578 654,246 ' 667,332' 6 108 197 R 1,276,424 630,506 645,918 89 121 U· 45,154 23,740 21,414 6 19 76 53 Varanasi T 2,362,179 1,211,588 1,150,591 189 ;64 794 771 R" 1,809,033 905,879 903,154 I
·2 .. 4 90 76 U' 553,146 305,709 . 247,437 ' " 181 60 704 695 54. Mirzapur T 1,249,653 64,4,311 60$,342 12.) J49 477 493 R. J,105,926 566,131 539,795 7 14 174 104 U .. 143.727 78,180 65,547 118 -135 303 '.389
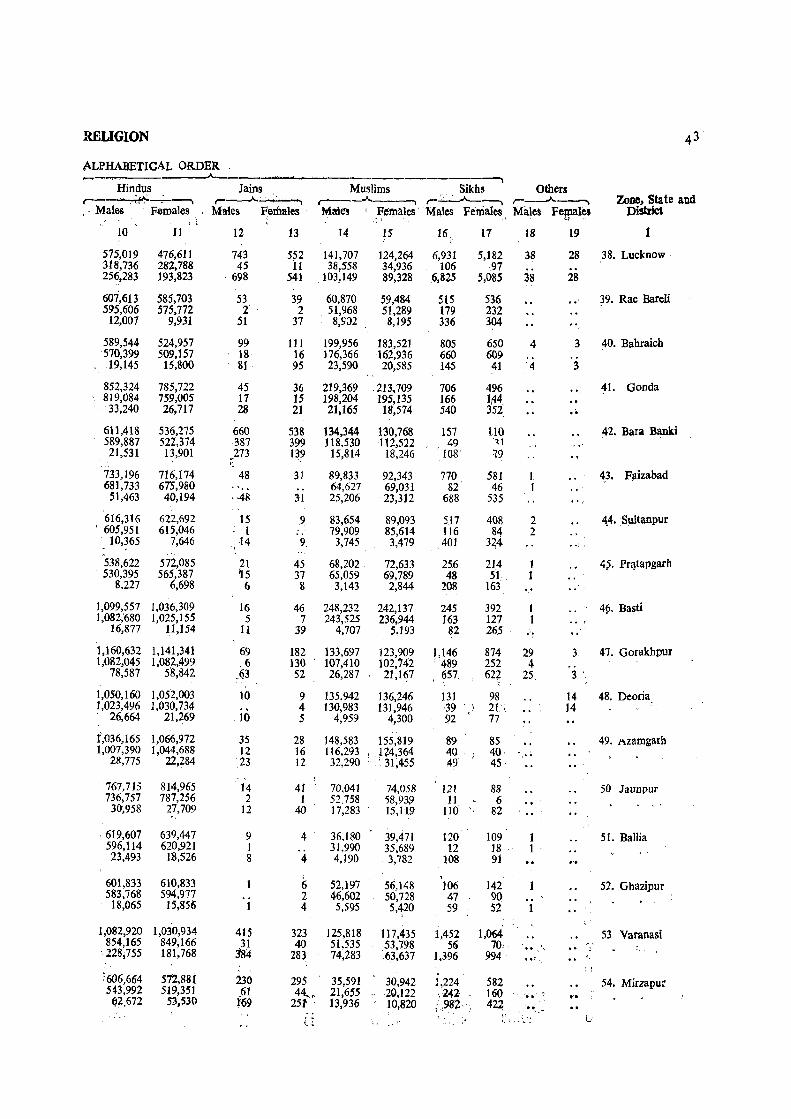
RELIGION 43
ALPHABETICAL ORDER ~~ ----_---------------~ Hindus Jains Muslims Sikhs Others r--~-: ---, r-__"_~--, r---A-----, r-~--.... r---.A.-----, Zone, State and ,_ Males F~males Mlries Females' Males ' F~rnales' Males Females Males FeP,lalea District . ~
10 1l 12 13 14 15 16 17 18 19 1
575,019 476,611 743 552 141,707 124,264 6,931 5,182 38 28 38. Lucknow ' 318,736 282,788 45 11 38,558 34,936 106 97 .. 256,283 193,823 ,698 541 103,149 89,328 6,825 5,085 38 28
607,613 585,703 53 39 60,870 59,484 515 536 .. 39. Rae Barell 595,606 575,772 2" 2 51,968 51,289 179 432 12,007 9,931 51 37 8,9:>2 8,195 336 3p4
589,544 524,957 99 111 199,956 183,,521 805 650 4 3 40. Bahraich 570,399 509,157 18 16 176,366 162,936 660 609 19,145 15,800 81 95 23,590 20,585 145 41 " ~
852,324 785,722 45 36 219,369 213,709 706 496 .. 41. Gonda 819,084 759,005 17 15 198,204 195,135 166 1,44 • 33,240 26,717 28 21 21.165 18,574 540 352 •• 611,418 536,275 660 538 134,344 130,768 157 110 42. Bara Banki 589,887 522,374 387 399 118.530 112,522 49 ~1
21,531 13,901 .273 139 15,814 18,246 108 19 ".
733,196 716,174 48 31 89,833 92,343 770 581 I 4,3. Faizabad 681,733 673,980 .. .. 64,627 69,031 82 46 I .. 51,463 40,194 . ·48 31 25,206 23,312 688 535 ",
616,316 622,692 15 .9 83,654 89,093 5.17 408 2 +t. _SultanpuI , 605,951 615,046 1 ., 79,909 85,614 116 84 2 .,
10,365 7,646 .J4 9 3,745 3,479 401 3~4 .. : "
538,622 572,085 21 45 68,202 72,633 25.6 214 1 t,~. Pqtapgarh 530,395 565,387 'Is 37 65,059 69,789 48 5f 1
8.227 6,698 6 8 3,143 2,844 208 163
1,099,557 1,036,309 16 46 248,232 242,137 245 392 I 4§. Basti 1,082,'680 1,025,155 5 7 243,525 236,944 163 127 1
16,877 11,154 11 3? 4,707 5,193 82 26,5 ."'. 1,160,632 1,141,341 69 182 133,697 123,909 lcl~~ 874 29 3 47. Gorakhpur 1,'()82,045 1,082,499 ,6 130 107,410 102,742 252 4
78,587 5'8,842 "Q3 52 26,287 21,1~7 , 657. 62t 25, 3 '
1,050,160 1,052,003 10 9 135.942 136,246 131 98 14 48. Deoria 1,023,496 1,030,734- 4 130,983 131,946 '39 . " 21., 14 \ 26,664 21,269 10 5 4,959 4,300 92 77
1,036,165 1,066,972 35 28 148,583 155,819 89 85 49. 1\zamgarh 1,007,390 1,044,688 12 16 116,293 124,364 40, 40·
28,775 22,284 23 12 32,290 •. _ \ 31,455 49 45 . "
814,965 767,715 14 41 70,041 74,058 121 88 50 Jaunpur 736,757 787,256 2 1 52,758 S8,93$1 11 6 ..
30',958 27,709 12 40 17,283 ' 15,119 110' 82 .. "
_ 619,607 639,447 9 4 36.180 39,471 120 109 1 51. BaJlia 596,114 620,921 I 31,990 35.689 12 18 1 ' 23,493 18,526 8 4 4,190 3,782 108 91
(; " 601,833 610,833 52,197 56,148 106 142 52. Ghazipur 583,768 594,977 2 46,602 50,728 47 90 18,065 15,&56 1 4 5,595 5,~0 59 52 1
1,082,920 1,030,934 415 323 125,818 117,435 1,452 1,064 53 Varanasi 854,165 849,166 31 40 51,535 53,'1.98 56 70,· , .. , '. .,
. 228.755 181,768 jS4 283 74,283 6.3;637 1,396 994 .. ,', ~606,664 512,881 230 295 35,591 30,942 J,224 582 54. Mirzapu: 543,992 519,351 61 44~. 21,655 20,122 ,,242 _ 160 \ 'ill' ." (;j2,672 53,530 i69 25t . 13,936 _ ,10,820 i98~, 42~ • 4I:.~";'
'.- p : ;1 U ~ ~ .. '.'\,
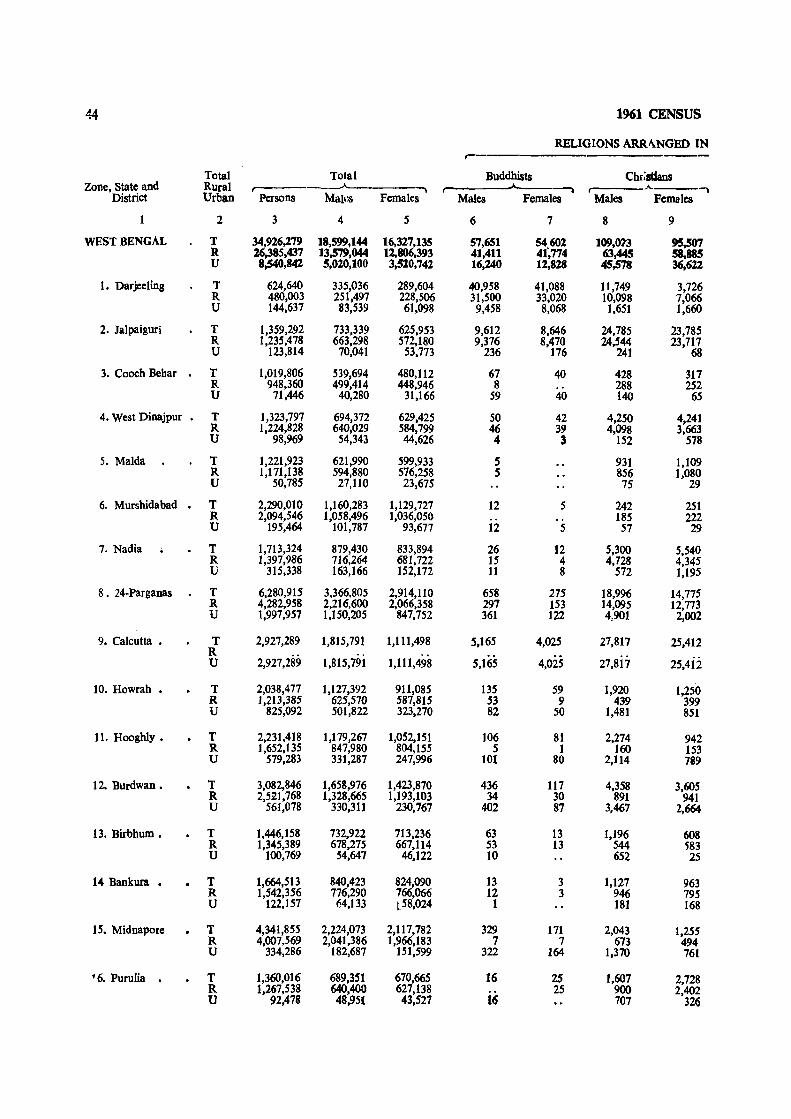
44 1961 CENSUS
RELIGIONS ARRANGED IN ,--
Total Total Buddhists Chr;atlans Zone, State and RUral ~--"""'I ~---"\ .A. l
District Urban Persons Mallis Females Males Females Males Females
2 3 4 5 6 7 8 9
WEST BENGAL T 34,926,279 18,599,144 16,327,135 57,651 54602 109,013 95,507 R 26,385,437 13,579,044 11,806,393 41,411 41',774 63,445 58,885 U 8,540,842 5,020,100 3,520,741 16,240 11,818 45,578 36,612
1. Darjeeling T 624,640 335,036 289,604 40,958 41,088 11,749 3,726 R 480,003 251,497 228,506 31,500 33,020 10,098 7,066 U 144,637 83,539 61,098 9,458 8,068 1,651 1,660
2. Jalpaiguri T 1,359,292 733,339 625,953 9,612 8,646 24,785 23,785 R 1,235,478 663,298 572,180 9,376 8,470 24,544 23,717 U 123,814 70,041 53,773 236 176 241 68
3. Cooch Behar T 1,019,806 539,694 480,112 67 40 428 317 R 948,360 499,414 448,946 8 .. 288 252 U 71,446 40,280 31,166 59 40 140 65
4. West Dinajpur • T 1,323,797 694,372 629,425 50 42 4,250 4,241 R 1,224,828 640,029 584,799 46 39 4,098 3,663 U 98,969 54,343 44,626 4 3 152 578
5. MaIda T 1,221,923 621,990 599,933 S 931 1,109 R 1,171,138 594,880 576,258 5 856 1,080 U 50,785 27,110 23,675 75 29
6. Murshidabad • T 2,290,010 1,160,283 1,129,727 12 5 242 251 R 2,094,546 1,058,496 1,036,050 .. .. 185 222 U 195,464 101,787 93,677 12 5 57 29
7. Nadia T 1,713,324 879,430 833,894 26 12 5,300 5,540 R 1,397,986 716,264 681,722 ]5 4 4,728 4,345 U 315,338 163,166 152,172 11 8 572 1,195
8. 24-Parganas T 6,280,915 3,366,805 2,914,110 658 275 18,996 14,775 R 4,282,958 2,216,600 2,066,358 297 153 14,095 12,773 U 1,997,957 1,150,205 847,752 361 122 4,901 2,002
9. Calcutta • T 2,927,289 1,815,791 1,111,498 5,165 4,025 27,817 25,412 R
2,927,289 27,8i 7 25,4ii u 1,815,791 1,111,498 5,165 4,025
10. Howrah • T 2,038,477 1,127,392 911,085 135 59 1,920 1,250 R 1,213,385 625,570 587,8]5 53 9 439 399 U 825,092 501,822 323,270 82 50 1,481 851
11. Hooghly • T 2,231,418 1,179,267 1,052,151 106 81 2,274 942 R 1,652,135 847,980 804,155 5 1 160 153 U 579,283 331,287 247,996 101 80 2,114 7119
12. Burdwan. T 3,082,846 1,658,976 1,423,870 436 117 4,358 3,605 R 2,521,768 1,328,665 1,193,103 34 30 891 941 U 561,078 330,311 230,767 402 87 3,467 2,664
13. Birbhum • T 1,446,158 732,922 713,236 63 13 1,196 608 R 1,345,389 678,275 667,1I4 53 13 544 583 U 100,769 54,647 46,122 10 652 25
14 Bankura • T 1,664,513 840,423 824,090 13 3 1,127 963 R 1,542,356 776,290 766,066 12 3 946 795 U 122,157 64,133 l58,024 1 181 168
15. Midnapore T 4,341,855 2,224,073 2,117,782 329 171 2,043 1,255 R 4,007,569 2,041,386 1,966,183 7 7 673 494 U 334,286 182,687 151,599 322 164 1,370 761
f6. Purulia . T 1,360,016 689,351 670,665 16 25. 1,607 2,728 R 1,267,538 640,400 627,138 25 900 2,402 U 92,478 48,9S{ 43,527 16 707 326
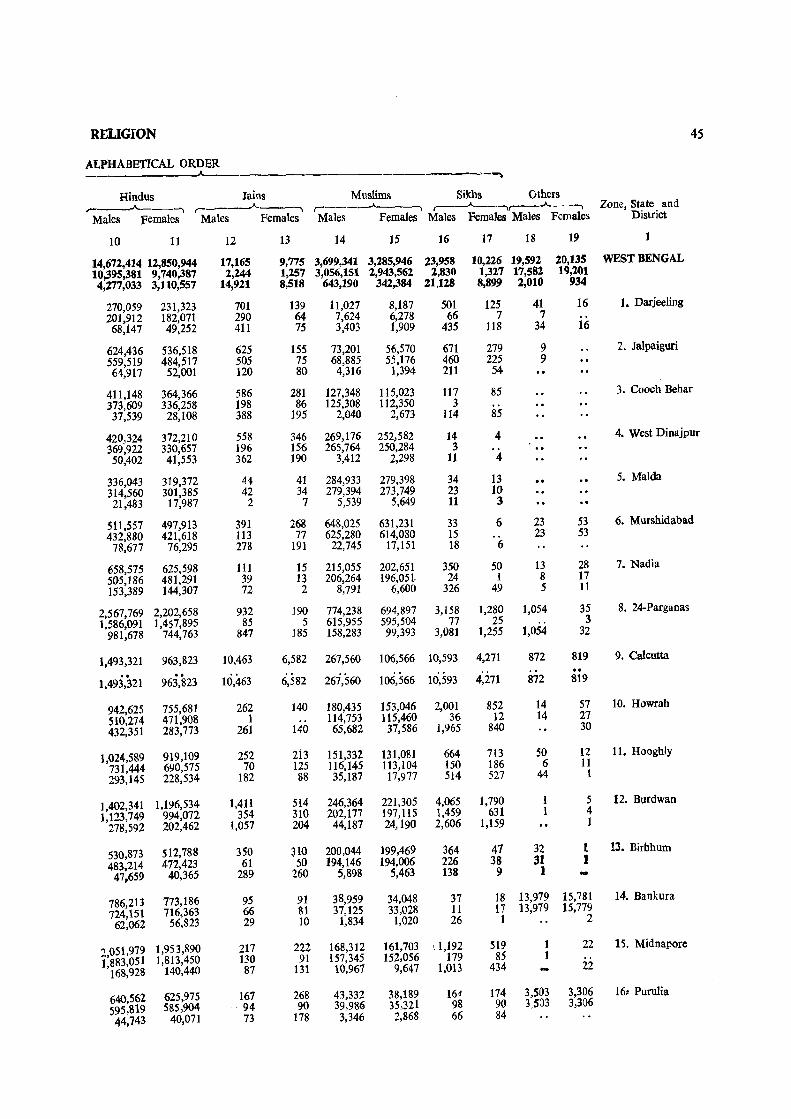
RELIGION 45
ALPHABETICAL ORDER "-- '-""'
Hindus Jains Muslims Sikhs Others .-_ ____..J...__-. r~----"----, , ___ .--A-___ , ,--.--A----v----A.--, Zone, State and
Males females Males Females Males Females Males Females Males Females District
10 11 12 13 14 15 16 17 18 19
14,672,414 12,850,944 17,165 9,775 3,699,341 3,285,946 23,958 10,226 19,592 20,135 WEST BENGAL 10,395,381 9,740,387 2,244 1,257 3,056,151 2,943,562 2,830 1,327 17,582 19,201 4,277,033 3,110,557 14,921 8,518 643,190 342,384 21,128 8,899 2,010 934
270,059 231,323 701 139 11,027 8,187 501 125 41 16 1. Darjeeling 201,912 182,071 290 64 7,624 6,278 66 7 7 68,147 49,252 411 75 3,403 1,909 435 118 34 16
624,436 536,518 625 155 73,201 56,570 671 279 9 2. Jalpaiguri 559,519 484,517 505 75 68,885 55,176 460 225 9 61,917 52,001 120 80 4,316 1,394 211 54
411,148 364,366 586 281 127,348 115,023 117 85 3. Cooch Behar 373,609 336,258 198 86 125,308 112,350 3 37,539 28,108 388 195 2,040 2,673 114 85
420,324 372,210 558 346 269,176 252,582 14 4 4. West Dinajpur
369,922 330,657 196 156 265,764 250,284 3 50,402 41,553 362 190 3,412 2,298 11 4
336,043 319,372 44 41 284,933 279,398 34 13 5. MaIda 314,560 301,385 42 34 279,394 273,749 23 10 21,483 17,987 2 7 5,539 5,649 11 3
511,557 497,913 391 268 648,025 631,231 33 6 23 53 6. Murshidabad 432,880 421,618 113 77 625,280 614,030 15 23 53
78,677 76,295 278 191 22,745 17,151 18 6
658,575 625,598 III 15 215,055 202,651 350 50 13 28 7. Nadia
505,186 481,291 39 13 206,264 196,051. 24 1 8 17 153,389 144,307 72 2 8,791 6,600 326 49 5 11
2,567,769 2,202,658 932 190 774,238 694,897 3,158 1,280 1,054 35 8. 24-Parganas
1,586,091 1,457,895 85 5 615,955 595,504 77 25 .. 3 981,678 744,763 847 185 158,283 99,393 3,081 1,255 1,054 32
1,493,321 963,823 10,463 6,582 267,560 106,566 10,593 4,271 872 819 9. calcutta
.. 96:3,823 10,463 6,582 267,560 4;271
.. 1,493,321 106,566 10,593 872 819
942,625 755,681 262 140 180,435 153,046 2,001 852 14 57 10. Howrah
510,274 471,908 1 114,753 115,460 36 12 14 27
432,351 283,773 261 140 65,682 37,586 1,965 840 30
1,024,589 919,109 252 213 151,332 131,081 664 713 50 12 11. Hooghly
731,444 690,575 70 125 116,145 113,104 150 186 6 11
293,145 228,534 182 88 35,187 17,977 514 527 44 1
1,402,341 1,196,534 1,411 514 246,364 221,305 4,065 1,790 1 5 12. Burdwan
1,123,749 994,072 354 310 202,177 197,115 1,459 631 1 4
278,592 202,462 1,057 204 44,187 24,190 2,606 1,159 1
530,873 512,788 350 310 200,044 199,469 364 47 32 1 13. Birbhum
483,214 472,423 61 50 194,146 194,006 226 38 31 I 47,659 40,365 289 260 5,898 5,463 138 9 1
786,213 773,186 95 91 38,959 34,048 37 18 13,979 15,781 14. Bankura
724,151 716,363 66 81 37,125 33,028 11 17 13,979 15,779
62,062 ,56,823 29 10 1,834 1,020 26 1 2
2,051,979 1,953,890 217 222 168,312 161,703 \ 1,192 519 1 22 15. Midnapore
1,883,051 1,813,450 130 91 157,345 152,056 179 85 1
168,928 140,440 87 131 10,967 9,647 1,013 434 22
640,562 625,975 167 268 43,332 38,189 16d 174 3,503 3,306 16p Purulia
595,819 585,904 94 90 39,986 35,321 98 90 3_S~3 3,306
44,743 40,071 73 178 3,346 2,868 66 84
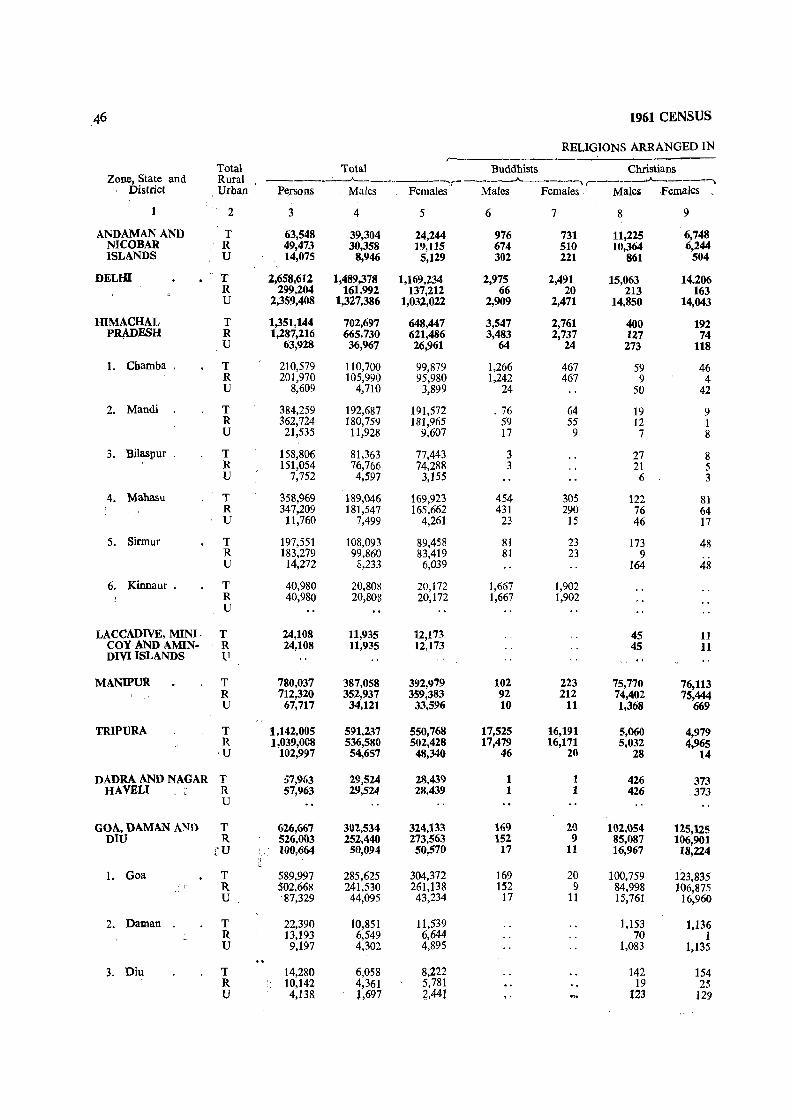
A6 1961 CENSUS
RELIGIONS ARRANGED IN r-
Total Total Buddhists Christians Zone, State and Rural ------'-'----"---... -",1 ------"--.---, , ___ ---A. ____ ,
District Urban Persons , Males Females Males Females Males ,Females,
2 3 4 5 6 7 8 9
AN DAMAN AND T 63,548 39,304 24,244 976 731 11,225 6,748 NlCOBAR R 49,473 30,358 19,115 674 510 10,364 6,244 ISLANDS U 14,075 8,946 5,129 302 221 861 504
DELIfi T 2,658,612 1,489,378 1,169,234 2,975 2,491 15,063 14.206 R 299,204 161,992 137,212 66 20 213 163 U 2,359,408 1,327,386 1,032,022 2,909 2,471 14,850 14,043
IDMACHAL T 1,351,144 702,697 648,447 3,547 2,761 400 192 PRADESH R 1,287,216 665.730 621,486 3,483 2,737 127 74
U 63,928 36,967 26,961 64 24 273 118
l. Chamba . T 210,579 110,700 99,879 1,266 467 59 46 R 201,970 105,990 95,980 1,242 467 9 4 U 8,609 4,710 3,899 24 50 42
2. Mandi T 384,259 192,687 191,572 .76 64 19 9 R 362,724 180,759 181,965 59 55 12 1 U 21,535 11,928 9,607 17 9 7 8
3. Bilaspur . T 158,806 81,363 77,443 3 27 8 R 151,054 76,766 74,288 3 21 5 U 7,752 4,597 3,155 6 3
4. Mahasu T 358,()69 189,046 169,923 454 305 122 81 R 347,209 181,547 165,662 431 290 76 64 U 11,760 7,499 4,261 23 15 46 17
5. Sirmur T 197,551 108,093 89,458 81 23 173 48 R 183,279 99,860 83,419 81 23 9 U 14,272 8,233 6,039 164 48
6. Kinnaur • T 40,980 20,808 20,172 1,667 1,902 R 40,980 20,808 20,172 1,667 1,902 U
LACCADIVE, MINI· T 24,108 11,935 12,173 45 11 COY AND AMIN- R 24,108 11,935 12,173 45 11 DIVI ISLANDS {.I
MANIPUR T 780,037 387,058 392,979 102 223 75,770 76,113 R 712,320 352,937 359,383 92 212 74,402 75,444 U 67,717 34,121 33,596 10 11 1,368 669
TRIPURA T 1,142,005 591,237 550,768 17,525 16,191 5,060 4,979 R 1,039,OC8 536,580 502,428 17,479 16,171 5,032 4,965 U 102,997 54,657 48,340 46 20 28 14
DADRA AND NAGAR T :57,953 29,524 28,439 1 1 426 373 HAVELI " c R 57,963 29,524 28,439 1 1 426 373
U
GOA, DAMAN ANI) T 626,667 302,534 324,133 169 20 102,054 125,125 DIU R 526,003 252,440 273,563 152 9 85,087 106,901
tV 100,664 50,094 50,570 17 11 16,967 18,224
1. Goa T 589.997 285,625 304,372 169 20 100,759 123,835 R 502;668 241,530 261,138 152 9 84,998 106,875 U ' 87,329 44,095 43,234 17 11 15,761 16,960
2. Daman T 22,390 10,851 11,539 1,153 1,136 R 13,193 6,549 6,644 70 1 U 9,197 4,302 4,895 1,083 1,135
3. Diu T 14,280 6,058 8,222 142 154 R ~ ., 10,142 4,361 5,781 19 25 U 4,138 t,697 2,44l 123 129
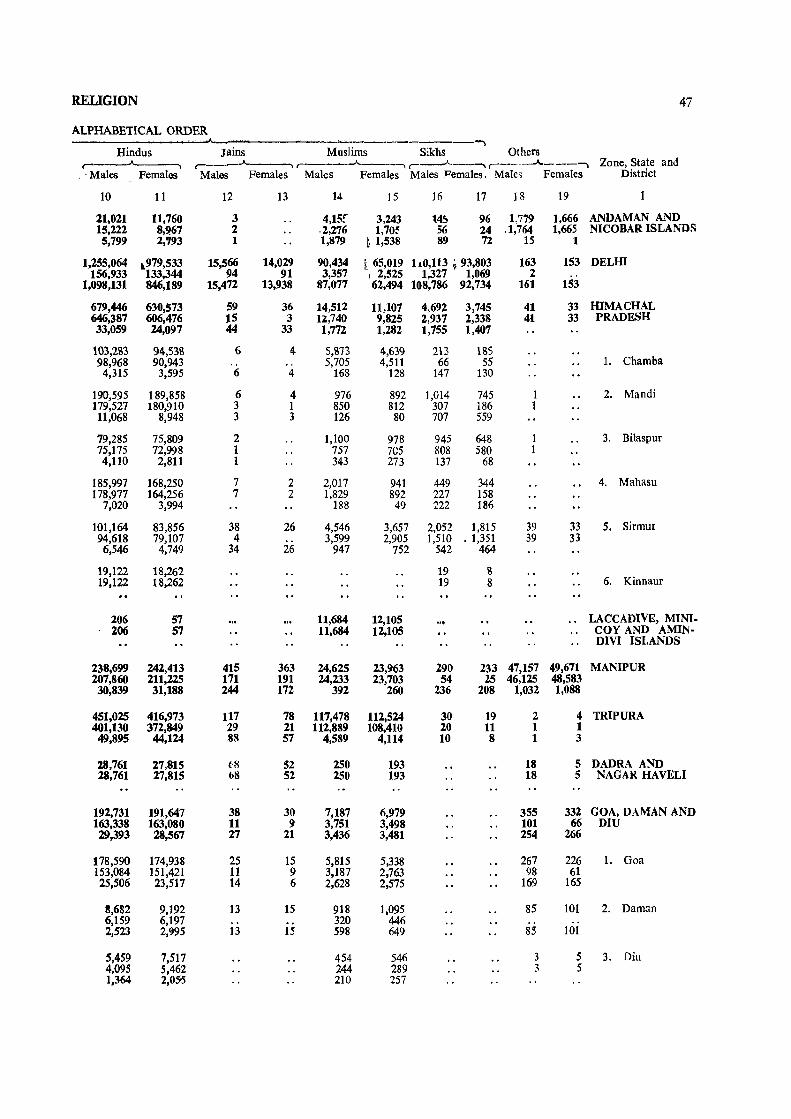
REUGION 47
ALPHABETICAL ORDER ~
Hindus Jains Muslims Sikhs Others ,..------"---, ,..- ,..-----"----, r-----"----, r-----A.----., Zone, State and
. 'Males Females Males Females Males Females Males l=1emales. Males Females District
10 11 12 13 14 15 16 17 18 19
21,021 11,760 3 4,15[ 3,243 14:' 96 l,779 1,666 ANDAMAN AND 15,222 8,967 2 .2,276 1,70: 56 24 .1,764 1,665 NICOBAR ISLANDS 5,799 2,'93 1 1,879 ~ 1,538 89 72 15 1
1,255,064 .. 979,533 15,566 14,029 90,434 ~ 65,019 110,113 193,803 163 153 DELffi 156,933 133,344 94 91 3,357 I 2,525 1,327 1,069 2
1,098,131 846,189 15,472 13,938 87,077 62,494 108,786 92,734 161 153
679,446 630,573 59 36 14,512 11,107 4,692 3,745 41 33 mMACHAL 646,387 606,476 15 3 U,740 9,825 ~,937 2,338 41 33 PRADESH 33,059 24,097 44 33 1,772 1,282 1,755 1,407
103,2113 94,538 6 4 5,1173 4,639 213 185 98,968 90,943 .. 5,705 4,511 66 55 1. Chamba 4,315 3,595 6 4 168 128 147 130
190,595 189,858 6 4 976 892 1,014 745 1 2. Mandi 179,527 180,910 3 I 850 812 307 186 1 11,068 8,948 3 3 126 80 707 559
79,285 75,809 2 1,100 978 945 648 1 3. Bilaspur 75,175 72,998 1 757 7C5 808 580 1 4,110 2,811 1 343 273 137 68
185,997 168,250 7 2 2,017 941 449 344 4. Mahasu 178,977 164,256 7 2 1,829 892 227 158
7,020 3,994 188 49 222 186
101,164 83,856 38 26 4,546 3,657 2,052 1,815 39 33 5. Sirmur 94,618 79,107 4 3,599 2,905 1,510 . 1,351 39 33
6,546 4,749 34 26 947 752 542 464
19,122 18,262 19 8 19,122 18,262 19 8 6. Kinnaur
206 57 11,684 12,105 .. LACCADIVE, MINI. 206 57 11,684 12,105 COY AND AMIN·
DlVI ISLANDS
238,699 242,413 415 363 24,625 23,963 290 233 47,157 49,671 MANIPUR 207,860 211,225 171 191 24,233 23,703 54 25 46,125 48,583 30,839 31,188 244 172 392 260 236 208 1,032 1,088
451,025 416,973 117 78 117,478 112,524 30 19 2 4 TRIPURA 401,130 372,849 29 21 112,889 108,410 20 11 1 1 49,895 44,124 88 57 4,589 4,114 10 8 1 3
28,761 27,815 01 52 250 193 18 5 DADRA AND 28,761 27,815 b8 52 250 193 18 5 NAGAR HAVELI
192,731 191,647 38 30 7,187 6,979 355 332 GOA, DAMAN AND 163,338 163,080 11 9 3,751 3,498 101 66 DIU 29,393 28,567 27 21 3,436 3,481 254 266
178,590 174,938 25 15 5,815 5,338 267 226 1. Goa 153,084 151,421 11 9 3,187 2,763 98 61 25,506 23,517 14 6 2,628 2,575 169 165
8,682 9,192 13 15 918 1,095 85 101 2. Daman 6,159 6,197 320 446 2,523 2,~95 13 15 598 649 85 101
5,459 7,517 454 546 3 5 3. Diu 4,095 5,462 244 289 3 5 1,364 2,0505 210 257

48 1961 CENSUS
RELIGIONS ARRANGED IN ,--------- --------Total
Zone, State and Rural Total Buddhists Christians District Uuban r-----~--A_-__ --, r----.--A.--~-"""I r-----"----""'I
Persons Males Females Males Females Males Females
2 3 4 5 6 7 8 9
ONDICHERRY T 369,879 183,347 185,732 12 13 15,999 17,947 R 280,082 139,989 140,093 6 6 11,834 9,335 U 88,997 43,358 45,639 6 7 7,165 8,612
NORTH EAST T 336,558 177,680 158,878 Not Available FRONTIER R 336,558 177,680 158,878 AGENCY U
NAGALAND T 369,200 191,027 178,173 27 15 97,003 98,585 R 350,043 179,261 170,782 17 12 92,198 94,915 U 19,157 11,766 7,391 10 3 4,805 3,'70
1. Kohima T 108,924 57,704 51,220 10 3 21,557 20,130 R 95,925 49,678 46,247 19,836 18,703 U 12,999 8,026 4,973 10 3 1,721 1,430
2. Mokokchung T 126,001 64,366 61,635 52,634 55,'38 R 119,843 60,626 59,217 49,550 53,398 U 6,158 3,740 2,418 ~,084 2,240
3. Tuensang T 134,275 68,957 65,318 17 12 22,812 22,814 R 134,275 68,957 65,318 17 12 22,812 22,814 U
SIKKIM. T 162,189 85,193 76,996 25,781 24,113 1,363 1,450 R 155,341 81,285 74,056 23,084 21,886 1,199 1,385 U 6,848 3,908 2,940 2,697 2,227 164 65
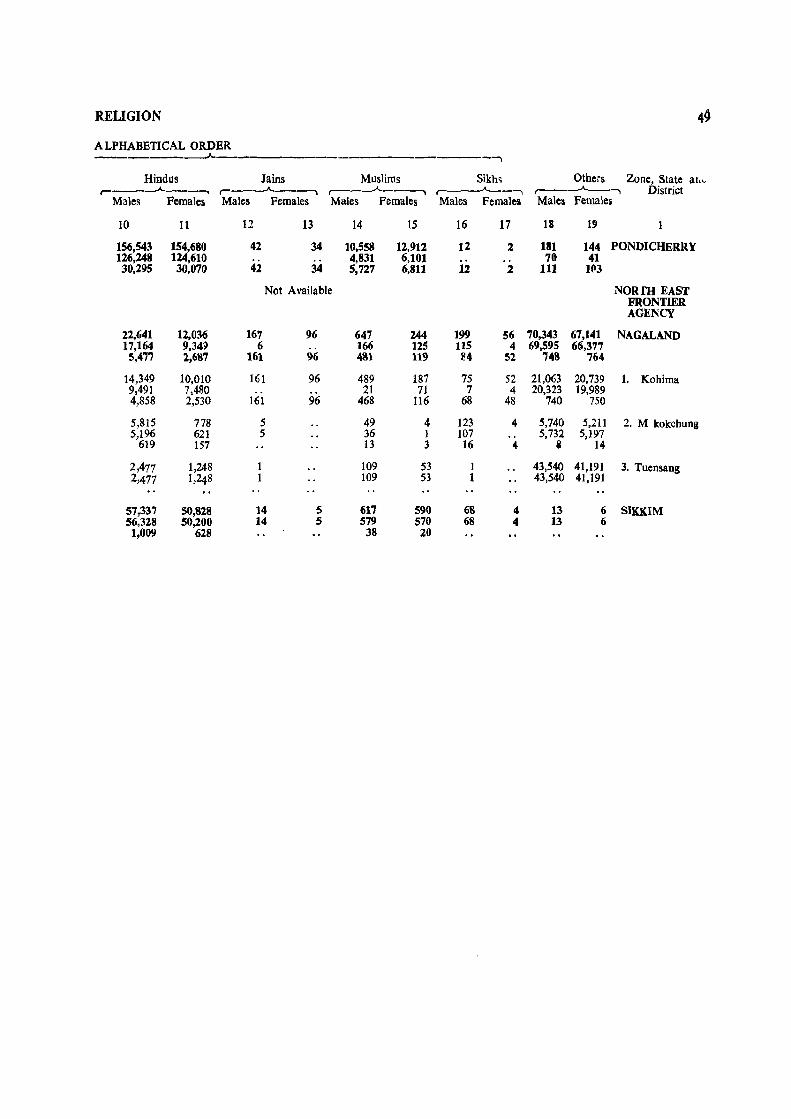
RELIGION 4~
A LPHABETICAL ORDER ---A. -,
Hindus Jains Muslims Sikhs Others Zone. State al, ... r------A.-__. r-----A.----, ,--__ A-_--, r----A.--, ,--_----A._, District
Males Females Males Females Males Females Males Females Males Females
10 11 12 13 14 15 16 17 IS 19
156,543 154,680 42 34 10,558 12,912 12 2 181 144 PONDICHERRY 126,248 124,610 4,831 6,101 .. 70 41 30,295 30,070 42 34 5,727 6,811 12 2 111 Ifl3
Not Available NORm EAST FRONTIER AGENcY
22,641 12,036 16'1 96 647 244 199 S6 70,343 67,141 NAGALAND 17,164 9,349 6 .. 166 125 115 4 69,595 66,3'17
5,4'7'7 1,6~'7 161 96 431 119 ~4 52 '748 '764
14,349 10,010 161 96 489 187 75 52 21,063 20,739 1. Kohima 9,491 7,480 .. 21 71 7 4 20,323 19,989 4,858 2,530 161 96 468 116 68 48 740 750
5,815 778 5 49 4 123 4 5,740 5,211 2. M kokchung 5,196 621 5 36 1 107 5,732 5,197
619 157 13 3 16 4 i 14
2,477 1,248 109 53 1 43,540 41,191 3. Tuensang 2>477 1,248 109 53 1 43,540 41,191
57,337 50,828 14 5 617 590 68 4 13 6 SIKKIM 56,328 50,200 14 5 579 570 68 4 13 6
1,009 628 38 20