palomar/las campanas imaging atlas of blue compact dwarf galaxies. ii. surface photometry and the...
TRANSCRIPT

arX
iv:a
stro
-ph/
0410
535v
1 2
2 O
ct 2
004
Palomar/Las Campanas Imaging Atlas of Blue Compact Dwarf
Galaxies: II. Surface Photometry and the Properties of the
Underlying Stellar Population
A. Gil de Paz1, and B. F. Madore1,2
ABSTRACT
We present the results from an analysis of surface photometry of B, R, and
Hα images of a total of 114 nearby galaxies (vhelio<4000 km s−1) drawn from the
Palomar/Las Campanas Imaging Atlas of Blue Compact Dwarf galaxies. Surface
brightness and color profiles for the complete sample have been obtained. We
determine the exponential and Sersic profiles that best fit the surface brightness
distribution of the underlying stellar population detected in these galaxies. We
also compute the (B − R) color and total absolute magnitude of the underly-
ing stellar population and compared them to the integrated properties of the
galaxies in the sample. Our analysis shows that the (B − R) color of the un-
derlying population is systematically redder than the integrated color, except in
those galaxies where the integrated colors are strongly contaminated by line and
nebular-continuum emission. We also find that galaxies with relatively red un-
derlying stellar populations (typically (B−R)≥1mag) show structural properties
compatible with those of dwarf elliptical galaxies (i.e. a smooth light distribu-
tion, fainter extrapolated central surface brightness and larger scale lengths than
BCD galaxies with blue underlying stellar populations). At least ∼15% of the
galaxies in the sample are compatible with being dwarf elliptical (dE) galaxies
experiencing a burst of star formation. For the remaining BCD galaxies in the
sample we do not find any correlation between the recent star formation activity
and their structural differences with respect to other types of dwarf galaxies.
Subject headings: galaxies: evolution — galaxies: starburst — galaxies: dwarf
— galaxies: fundamental parameters — galaxies: photometry — atlases
1The Observatories, Carnegie Institution of Washington, 813 Santa Barbara Street, Pasadena, CA 91101;
2NASA/IPAC Extragalactic Database, California Institute of Technology, MS 100-22, Pasadena, CA
91125; [email protected]

– 2 –
1. Introduction
The vast majority of the Blue Compact Dwarf (BCD) galaxies are currently forming
stars at a very high rate, as suggested by the large fraction of them (>93%; Gil de Paz,
Madore, & Pevunova 2003) showing significant Hα emission (EW>20 A). The star formation
rate (SFR) derived for these galaxies ranges up ∼10M⊙ yr−1 (Fanelli et al. 1988; Gil de Paz
et al. 2003). This relatively high SFR, combined with a moderate gas content, implies gas-
consumption time-scales of ∼109 yr, which are much shorter than the age of the Universe.
This high SFR, combined with the low present-day metal abundances (see e.g. Hunter &
Hoffman 1999), led Searle et al. (1973) to suggest that either these objects are intrinsically
young galaxies or that they have had an episodic star formation history involving very
short bursts of star formation followed by long quiescent periods. It is now widely accepted
that most of these objects possess a relatively evolved underlying stellar population (USP
hereafter) associated with their low-surface-brightness (LSB) envelopes, i.e. they are not
exclusively young galaxies (Schulte-Ladbeck et al. 1999, 2001; Drozdovsky et al. 2001; Crone
et al. 2000, 2002; Gil de Paz et al. 2000a,b; Papaderos et al. 1996a,b). Despite considerable
recent progress, the properties of this USP are still poorly known. Although the presence
of an evolved population supports a relatively episodic star formation history it has been
recently shown that these episodes of star formation may, in fact, last as long as 108 yr (Crone
et al. 2002; Papaderos et al. 2002). However, it is still necessary that the SFR in BCDs had
been much lower in the past (and for extended periods of time) as compared to today. It has
been suggested that, even during the so-called quiescent phases, star formation could have
taken place at a very low level, at a rather continuous rate (Legrand 2000).
The following questions naturally arise: What did BCD galaxies look like during these
long periods of time of low (or null) star-formation activity? Were they similar to local
dwarf elliptical galaxies today? and, is there a single evolutionary model that can include
all phases and types of dwarf galaxies?
Current knowledge bearing on these questions comes mainly from the analysis of the
surface brightness profiles of the USP in BCDs and a comparison of the profiles of dwarf
irregular and dwarf elliptical galaxies (Papaderos et al. 1996; Noeske et al. 2000; Cairos et
al. 2003). These results seem to suggest that the LSB envelopes associated with the USP
of BCD galaxies are more compact and have a higher central surface brightness than those
seen in dI and dE galaxies. Some additional clues have been recently provided by the study
of the dynamics of BCD neutral hydrogen halos (van Zee, Salzer, & Skillman 2001; Tajiri
& Kamaya 2002). These authors have shown that the suggested evolution between BCDs
and dE is difficult because of the relatively low efficiency of stellar feedback in potentially
removing the HI envelopes from these galaxies. It is worth emphasizing here that in all of

– 3 –
these previous studies the number of objects under consideration was quite limited and no
definitive conclusions could be drawn concerning existence or not of a unified evolutionary
model for dwarf galaxies.
In Paper I (Gil de Paz et al. 2003) we described the integrated properties of a sample of
114 nearby galaxies in the Palomar/Las Campanas Imaging Atlas of Blue Compact Dwarfs
(BCD hereafter). In this, the second paper of the series, we analyze the surface brightness
profiles of the sample in B and R bands and in the light of Hα. The morphological in-
formation derived, along with the properties of the USP detected in these galaxies, is now
compared with the integrated properties measured in Paper I.
In Section 2 we briefly describe the sample and the observations carried out within
the Atlas. The procedures used to derive the surface brightness and color profiles and the
corresponding best-fitting exponential and Sersic laws are described in Sections 3.1 and
3.2, respectively. The analysis of the surface brightness profiles is presented in Section 4.1.
We describe the structural properties, color, and luminosity of the USP of these galaxies
in Section 4.2. Finally, we discuss the implications of this study regarding the existence
of possible evolutionary links between BCDs and dwarf elliptical galaxies (Section 4.3),
and the possible impact of the recent star formation on the structural properties of BCDs
(Section 4.4). Our conclusions are summarized in Section 5.
2. Sample and observations
The original sample described in Paper I consisted of 114 galaxies. Of these, 105 galaxies
were finally classified as Blue Compact Dwarf galaxies according to the set of quantitative
criteria set out in that paper. The criteria include considerations about the galaxy’s peak
surface brightness, and the color at the position of this peak, along with an upper limit
in the galaxy integrated absolute K-band luminosity (i.e., stellar mass). In this paper we
have removed IC 10 from the sample of BCDs because of its very high Galactic extinction,
which makes the intrinsic luminosity and colors of the USP highly uncertain. Although we
computed the surface brightness profiles for all the 114 galaxies, our conclusions are based
exclusively on the analysis of the properties of the final 104 BCD galaxies in the Atlas.
In Paper I we also presented an extensive description of the observations. Briefly, we
observed 86 of the 114 Atlas galaxies at the Palomar 60-inch telescope using a 2048×2048
CCD in B, R, and the appropriately redshifted Hα narrow-band filter (∆λ∼20A; see Paper I
for a description of the filters used). Typical exposure times were 900 s in B, 2700 s in R, and
5400 s in Hα. The remaining 28 galaxies were observed at the Las Campanas Observatory

– 4 –
100-inch (du Pont) telescope using a similar 2048×2048 CCD. In this case the exposure times
were 900 s in B and R, and 1800 s in narrow-band Hα (∆λ∼65A).
3. Analysis
3.1. Surface brightness and color profiles
We used the flux-calibrated images of our Atlas to derive the surface brightness profiles
of the sample. We first interactively eliminated foreground and background sources by
interpolation using the same criteria as in Paper I (see also Gil de Paz et al. 2000a). Then,
we fitted the galaxy isophotes using the iterative method described by Jedrzejewski (1987)
within the IRAF task ellipse. The output of this task provides the equivalent radius
(R∗ =√a× b) and mean intensity of the isophote, its rms uncertainty, ellipticity, position
angle, etc.
The isophotes were fitted using our R-band images (which were typically deeper than
the B-band exposures). Then, we computed the mean flux and rms in the B-band and Hα
images using the isophotes fitted in the R-band. In this way the colors were measured in
exactly the same regions. We started the fitting procedure at the approximate position of the
half-light radius, then we moved outward from that position; and finally, we moved inward
using constant linear steps of between 1 and 5 pixels. The step size was determined by the
depth and quality (spatial resolution) of the image.
In order to compute the error in the surface brightness and color profiles we start from
the expression that relates the intensity in counts per pixel with the surface brightness,
µλ = Cλ − 2.5 log(Iλ − Isky,λ) + 5 log(arcsec/pixel) (1)
Thus, to a first approximation we can write the uncertainty in µλ as,
∆µλ =
√
∆C2λ +
(
2.5 log(e)
Iλ − Isky,λ∆(Iλ − Isky,λ)
)2
(2)
That can be expressed in terms of the rms uncertainty along the isophote and the error on
the sky level as,
∆µλ =
√
√
√
√
√∆C2λ +
(
2.5 log(e)
Iλ − Isky,λ
)2
(
rmsisophote√
Nisophote
)2
+ ∆I2sky,λ
(3)

– 5 –
The term ∆I2sky,λ is actually composed of two terms: one is due to a combination of Poisson
noise in the sky values and high-frequency (pixel-to-pixel) flat-fielding errors, and the other
is due to low-frequency flat-fielding errors and the presence of reflections or gradients in the
image background. This latter component may be dominant in the outermost part of the
galaxy profiles as shown by Noeske et al. (2003). In order to determine these numbers we
measured the value of the sky and its standard deviation in a total of 15-20 regions of Nregion
pixels each around the position of the galaxy. If we now define < σsky > and σ2<sky> as the
mean standard deviation and variance of the sky values measured in these individual regions,
respectively, we obtain,
∆I2sky,λ =
< σsky >2
Nisophote
+ max
(
σ2<sky> −
< σsky >2
Nregion
, 0
)
(4)
The second term of the sum can be neglected if the low-frequency flat-fielding errors are
negligible compared with the combined effect of the sky photon noise and the high-frequency
flat-fielding errors.
In Figure 1 we plot the surface brightness and color profiles for each of the 114 galaxies
in the original Atlas sample. The 1-σ error bars plotted combine in quadrature the standard
deviation of the isophote mean and the error in the sky subtraction. The calibration errors
for each of the bands are indicated by vertical bars in the lower-left corner of the plot.
Horizontal tick marks on the left vertical axis indicate the value of the HWHM of the PSF.
Figure 1 shows that all the galaxies in the sample are clearly resolved, so these light profiles
can be adequately used to study the distribution of the stellar populations in these galaxies.
Even in the case of the very compact galaxy UM 404, which was observed with a very poor
seeing (almost 4 arcsec in the B-band), its profile extends radially more than three times the
PSF HWHM. The surface brightnesses and colors have been corrected for Galactic extinction
but not for internal extinction. Despite the very low metallicity and, therefore, low expected
dust content, internal extinction may be important in the innermost regions, where most
of the current star formation activity is taking place (see Noeske et al. 2003; Cannon et al.
2002). However, the effect of the dust on the structural properties and colors of the USP
derived in this paper, which are measured at a considerable distance from the sites of current
star formation, is probably negligible.
The surface brightness profiles obtained show a very high central surface brightness
that decreases very rapidly with the galactocentric radius. For many of the galaxies in our
sample a radius can be identified outside which the surface brightness starts to decrease
at a much slower rate following an approxiate exponential or de Vaucoleurs r1/4 law, de-
pending on the galaxy. We interpret this behavior as being due to the existence of two
well-differentiated stellar populations, a young population that would be responsible for the
– 6 –
high-surface-brighness (HSB) nuclear emission and a more evolved (fainter and redder) un-
derlying stellar population (USP) with a smooth, low-surface-brightness profile dominating
the outermost parts of the galaxy’s surface brightness profile. This idea, which had been
proposed in the past by different authors (see Papaderos et al. 1996 and references therein),
is supported by the fact than in many of the galaxies in our sample this radius coincides with
a flattening in the color profile, also called the transition radius (Papaderos et al. 1996).
However, there are many cases where the analysis of the surface brigthness profile alone
does not allow identifying the radius from which the USP starts to dominate the galaxy’s
light distribution. This can be due to (1) the USP dominating the profile all the way to the
center of the galaxy, (2) the relative contribution in luminosity of the two stellar populations
changing gradually but in a very smooth way across the galaxy, (3) the transition taking place
at a surface-brightness very close or below our detection limit (i.e. the USP is undetected),
or (4) the USP is not present, like it could the case of those galaxies suspect of forming stars
for the first time (e.g. I Zw 18; Tol 65). In Section 3.2 we will describe the procedure used to
determine (in a homogeneous way) the radius outside which the galaxy’s surface brightness
profile is dominated by the emission from its USP.
3.2. Profile fitting
We did not find any simple function or combination of functions that adequately re-
produces the surface brightness profile of the galaxies all the way from the nucleus to the
outermost regions.
In order to compare the structural properties of the USP in our BCD sample with those
observed in other dwarf galaxies we fitted the surface brightness of the USP using both an
exponential and a Sersic law. The free parameters for this fitting procedure where those of the
exponential and Sersic laws plus the position of the radius from where the surface brightness
profile is assumed to be dominated by the USP. In those cases where there was an obvious
flattening of the color profile we only considered points external to the transition radius.
The best-fitting set of parameters was obtained by minimizing the reduced χ2 (normalized
to the degrees of freedom) of the fit. No less than 5 points were used for each fit.
The position of the best-fitting innermost point of the fit (i.e. the radius outside which
the USP dominates the profile) is shown in the Figure 1 by vertical tick marks at the
bottom axis of the surface-brightness plot. In most cases this radius is similar for both the
exponential and Sersic-law fits, which suggests the presence of a clear change in the surface
brightness profile at this radius. In those cases where a significant difference is seen between
– 7 –
the two fits, the best-fitting innermost point for the exponential law is usually placed at a
larger galactocentric distance than the corresponding for the Sersic law. In this plot we also
show the resulting best-fitting exponential and Sersic laws in the range of the fit (solid lines)
and the corresponding extrapolation toward the galaxy center (dashed lines).
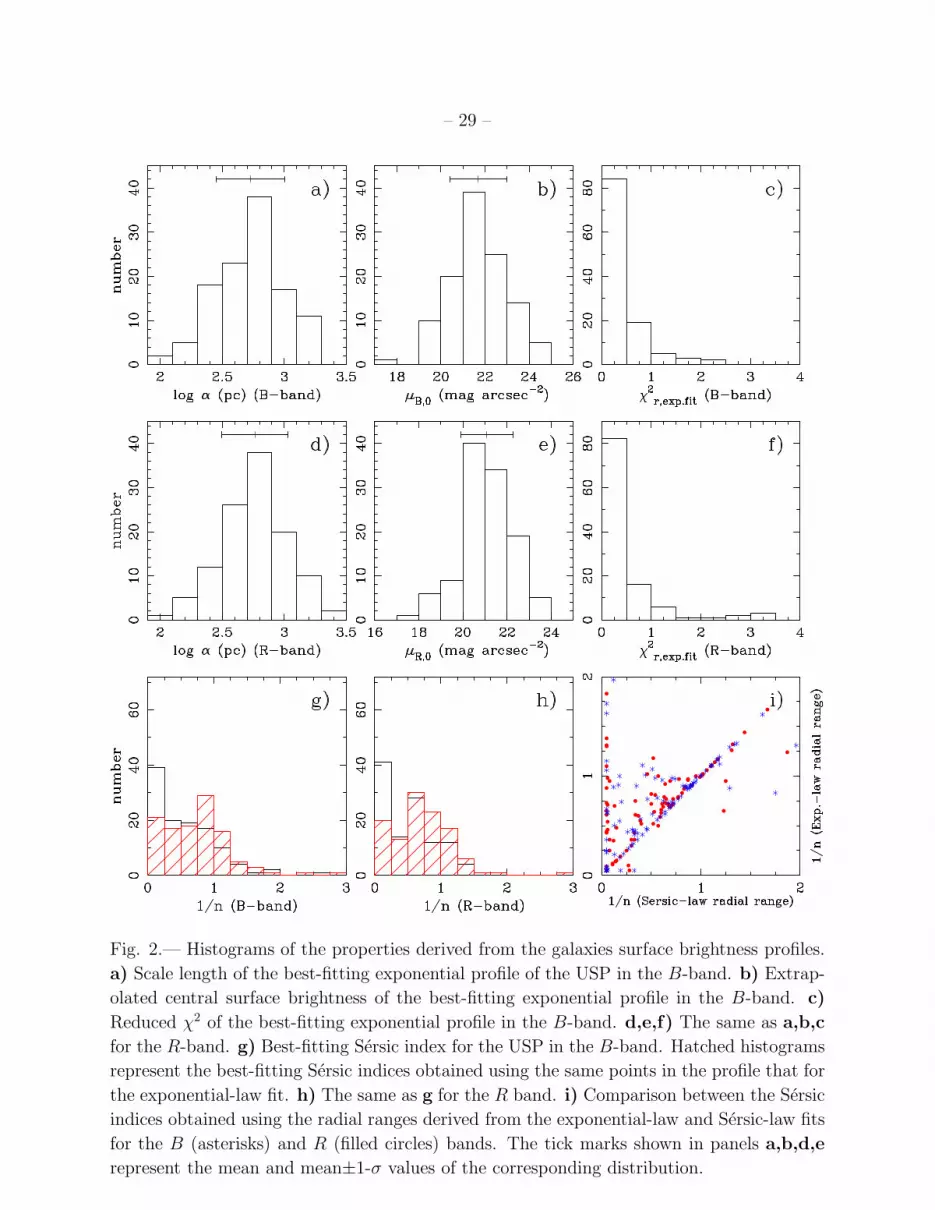
In Tables 1 and 2 the parameters of the best-fitting exponential and Sersic laws are
given. In Figures 2a to 2f we show the parameters and χ2r from the fit of an exponential law
to the B-band (2a-2c) and R-band (2d-2f) profiles. The distributions of best-fitting Sersic
indices for the B and R profiles are shown in panels 2g and 2h, respectively.
Tables 1 and 2 show that the application of either of these laws to the broad-band
surface brightness profiles of the USP yields comparable low values of χ2r. At very low values
of χ2r (<0.1) the exponential law seems to provide a slightly better fit, while at very high
values of χ2r the Sersic law is the one that more often yields a lower value for the reduced
χ2r . In this sense, for the 21 exponential fits with χ2
r > 1 the χ2r of the corresponding Sersic
fit is better than that given by the exponential fit. However, this only represents 10% of the
sample. For only 5 of the profiles is χ2r>3.
In some cases although the best fit yielded relatively low χ2r values, inspection of the
profile showed that fit was obtained using only a few points (never less than 5) with their
errors strongly dominated by the uncertainty in the background subtraction. In this situa-
tion, the errors of the different points used for the fit are largely correlated and the value of
χ2r may be underestimated (see Tables 1 & 2). An example of this behavior is seen at the
B-band profile of HS 0029+1748.
The use of a Sersic law has the advantage of encompassing the exponential law as a
particular case. It also allows us to consider for BCD galaxies a relationship between the
Sersic-law index and luminosity found for dwarf elliptical galaxies (see Graham & Guzman
2003). However, in the case of the USP of BCD galaxies, the region available to us for
the fitting is relatively small and it is located at large distances from the galaxy center.
Under these circumstances, the uncertainties and degeneracies between the parameters of
the Sersic law become extremely large and highly dependent on the particular region of the
profile considered (Cairos et al. 2003; Noeske et al. 2003; see also Section 4.2.1).
– 8 –
4. Results and discussion
4.1. Surface brightness and color profiles
The surface brightness profiles shown in Figure 1 are typically characterized by a high
surface brightness component (HSB) near the center of the galaxy superimposed on a nearly
exponential low-surface-brightness component (LSB) associated with its USP. These char-
acteristics in the profiles of BCD galaxies have been previously observed by various authors
(Loose & Thuan 1986; Papaderos et al. 1996a,b; Cairos et al. 2001a,b). Small departures
of the surface brightness profile of the USP from an exponential law have been proposed.
Doublier et al. (1997, 1999) argued that in approximately one fourth of the BCD galaxies
considered by them the profiles were better described by a de Vaucoleurs r1/4 law. On the
other hand, Noeske et al. (2003), using deep near-infrared imaging, have recently proposed
that a large fraction of BCD galaxies may have USP with surface brightness profiles showing
a central flattening similar to the type-V profiles found by Binggeli & Cameron (1991) in
some dwarf elliptical galaxies. In Section 4.2 we analyze in detail the morphology of the
USP in our BCD sample of galaxies.
The color profiles obtained indicate that the HSB component commonly shows very blue
colors, especially once the colors are corrected for line and nebular-continuum contamination.
At larger radii, where the relative contribution of the HSB component becomes smaller, the
colors tend to get redder. In most of the galaxies the color profile flattens at the radial
position where the USP begins to dominate the galaxy’s global surface brightness profile.
This behavior was first observed by Papaderos et al. (1996a,b) and more recently by Doublier
et al. (1997, 1999) and Cairos et al. (2001a,b). Papaderos et al. (1996a,b) called the position
where the color profile flattens the transition radius. Note that the much larger sample
used in the present work compared with previous studies allows us to obtain, for the first
time, statistically meaningful conclusions about the structural properties of BCDs as a class
of objects. Of the 104 BCD galaxies in our sample, 70% (72 objects) show this kind of
flattening (some examples are ISZ 399, Tol 2, Haro 2). About 17% (18 galaxies) show a
progressive reddening of the color profile in the outer parts of the galaxy. In some of the
objects in this group the contamination from the HSB component may still be important at
faintest surface brightness levels detected by our observations. Examples of these objects are
NGC 4861 and Haro 9. Six objects (5%) show a bluing of the color profile in the outermost
parts of the galaxy. An example of this type of behavior is seen in the profile of Tol 1345−420.
Finally, for a total of 9 galaxies the large errors in the outermost (B − R) colors measured
prevent us from determining the degree of flattening of the color profile beyond the transition
radius.

– 9 –
4.2. Underlying stellar population
4.2.1. Sersic vs. exponential law
The Sersic indices found by fitting both the B and R-band profiles suggest that the
USP tends to have a surface brightness profile somewhat steeper than an exponential law.
Moreover, about 40 of the galaxies show indices steeper than the de Vaucoleurs profile (n=4).
However, it is worth noting that (as we commented in Section 3.2) the values derived for the
Sersic-law parameters are highly uncertain and strongly dependent on the region considered
for the fit. In particular, they strongly depend on the surface brightness of the few innermost
points considered during the fit. At radial distances close to, but beyond the position of the
transition radius, some profiles show surface brightnesses in excess of what is expected from
our best-fitting exponential law. Since these are the innermost points considered in our
Sersic-law fit, their value has a critical impact on the best-fitting index derived. We believe
these intermediate-radial-distance regions may well be contaminated by the emission from
the HSB component. This contamination would affect substantially the shape of total surface
brightness profile, but would have a smaller impact on the color profile. Some examples are
NGC 1705, NGC 2915, Mrk 1423, NGC 3125, ESO 572-G025.
In order to understand the effect of the particular region considered for the fit on the
indices derived we have also computed the best-fitting Sersic index within the region used
for the fit to an exponential law. Figure 2g-i show the comparison between the distributions
of Sersic indices obtained in this way and those obtained using different regions for the
Sersic and exponential-law fits. Although the number of objects with profiles steeper than
exponential is still significant, the number of objects with Sersic indices n>4 is significantly
lower when the fit is performed within the same region used for the exponential fit.
The large differences obtained by the two methods demonstrate the strong dependence
of the best-fitting Sersic-law parameters on the chosen set of points considered during the
fitting procedure (see Section 3.2; see also Cairos et al. 2003). Therefore, in the rest of the
paper we will use the best-fitting exponential-law parameters derived in order to characterize
the structural properties of the USP in BCDs. The use of very deep images at near-infrared
wavelengths should improve significantly our knowledge about the detailed morphology of the
USP in BCD galaxies given the smaller contamination associated with the HSB component
at these wavelengths (see Noeske et al. 2003 for a pilot study using a sample of 12 BCDs).

– 10 –
4.2.2. Structural properties, colors, and luminosity
The best-fit exponential and Sersic-law parameters for the galaxies in the sample (in-
cluding the χ2r of the best fit) are given in Tables 1 & 2, respectively. Table 3 shows the
total, extrapolated B and R magnitudes of the best-fitting exponential USP. We also pro-
vide the color (observed and corrected for line and nebular-continuum contamination) of the
USP weight averaged over the region where the best-fitting exponential and Sersic laws were
obtained.
The scale-length distributions obtained for the B and R bands are very similar, which
confirms that the color gradients in the USP, although present (see Section 4.1), are not
very large. The mean values derived for the scale length of the USP are log(α)=2.7±0.3 and
2.8±0.3, respectively for the B and R-band profiles. With regard to the extrapolated central
surface brightness, the mean values obtained are µB,0=21.7±1.3 and µR,0=21.1±1.2mag arcsec−2.
For comparison, Papaderos et al. (1996b) obtained a slightly brighter average value of
µB,0=21.3mag arcsec−2 for their sample of 12 BCD galaxies.
Figure 3 compares the integrated color of the galaxies in the sample (see Paper I) with
the color of the USP (measured in the region where the best-fitting exponential law was
derived). In most of the objects the (B − R) color of the envelope is redder by about
0.3mag than the integrated color, which has contributions from the recent star formation.
Only in those objects where the line and nebular-continuum contamination is significant
(e.g., UM 404, UM 417, HS 0822+3542, I Zw 18) is the integrated color redder than the
color of the USP (see Papaderos et al. 2002 for a detailed study of the impact of line and
nebular-continuum contamination on the observed broad-band properties of BCDs).
In Figure 4a we compare the distribution of the galaxies in our sample in the (B −R)-
MB,LSB diagram. The (B−R) colors in this figure have been corrected for line and nebular-
continuum contamination, and the absolute magnitude plotted (MB,LSB) refers to that of the
best-fitting exponential low-surface-brightness component associated with the USP. This
plot constitutes a direct means of comparing the properties of the USP of BCD galaxies
with those of other types of dwarf galaxies.
Since local dwarf elliptical galaxies (dE) show no significant star formation and very
shallow color gradients (e.g., Vader et al. 1988) we can directly compare this plot with the
(integrated) color-magnitude diagram of dE galaxies (circles in Figure 4a). Field dE galaxies
(Parodi et al. 2002), dE in the Sculptor and Cen-A groups (Jerjen et al. 2000) and cluster
dE in Virgo (Barazza, Binggeli, & Jerjen 2003) and Perseus (Conselice, Gallagher, & Wyse
2003) are plotted. We also show the fiducial color-magnitude relationship for the Coma
cluster (solid line; Secker, Harris, & Plummer 1997). Finally, we have also included in this
– 11 –
plot a small sample of dwarf irregular galaxies for which colors and luminosities of their USP
are available (outlined stars; Parodi et al. 2002).
Figure 4a shows that there are many BCD galaxies in our sample which show colors and
luminosities of their USP that are comparable to those of elliptical galaxies. In Figure 4b
the frequency histograms of the (B − R) color of dE galaxies (outline histogram) and BCD
galaxies (solid and hatched histograms) are plotted. While there is significant overlap the
USP of BCDs is (on average) bluer than that of dE galaxies. However, Figure 4b also shows
that the distribution of the color of the USP of BCD galaxies with smooth envelopes (“E”-
type; nE and iE types according to Loose & Thuan 1986) (solid histogram) is more similar
to that of dE galaxies than the one for BCD galaxies with irregular envelopes (iI-type BCDs;
hatched histogram).
These results suggest that a measurable fraction of the BCD galaxies show USP with
colors, luminosities, and apparently also morphologies similar to those of dwarf ellipticals.
In order to quantitatively analyze the morphological differences between BCD galaxies
with red and blue USP we also compare the extrapolated central surface brightness and
scale lengths of the galaxies in our sample (see Table 1) with those of BCD, dI, and dE
galaxies taken from the literature (P. Papaderos, private communication; see also Papaderos
et al. 1996b). In Figure 5a we plot the extrapolated central surface brightness against the
luminosity (both in the B-band) of the best-fitting exponential USP for the galaxies in our
sample, and compare them with those of dE (small dots), dI (stars), LSB (open crosses) and
other BCD galaxies from the literature (open diamonds). Those BCDs in our sample offset
by less than ±0.4mag from the color-magnitude relationship of dE galaxies are represented
by large dots. BCDs offset by more than this amount are shown as filled diamonds. This
allows us to separate BCD galaxies with red envelopes from those with blue envelopes. The
horizontal dotted line at µB,0=22mag arcsec−2 marks the separation between BCDs and
other types of dwarf galaxies, as proposed by Papaderos et al. (1996b). This figure shows
that there are many BCD galaxies with a central surface brightness of the USP fainter than
22mag arcsec−2 and that in most of those galaxies this component is as red as dE galaxies.
Figure 5b shows the exponential scale length plotted against luminosity for the same
objects as in Figure 5a. Again, BCD galaxies with red envelopes show (on average) scale
lengths comparable to those seen in dE galaxies, and larger than those of BCDs with blue
envelopes. The dashed line shows the least-squares fit to the distribution of dwarf elliptical
galaxies in this plot.
By analyzing the properties of the USP of the galaxies individually we find that a total
of 17 BCDs in our sample show envelopes with (1) smooth elliptical morphologies (nE or

– 12 –
iE types), (2) dE-like colors, and (3) faint extrapolated central surface brightnesses. This
makes up slightly over 15% of the whole sample.
4.3. Implications on the unified evolutionary model of dwarf galaxies
The fraction of BCDs with properties of their USP similar to those of dwarf ellipticals
may be even larger if, as proposed by Papaderos et al. (1996b), the structural properties of
the USP of BCDs may vary with time in response to changes in the gravitational potential
driven by the collective effect of stellar winds from massive stars and supernova explosions
(see next section for a discussion on this topic).
The results presented above allow us to conclude that a significant fraction of the BCDs
in the nearby Universe (at least 15%) are consistent with being dwarf elliptical galaxies
that are now experiencing, or have recently experienced, an episode of active star forma-
tion. These objects can be easily identified with the “slowly-moving”, gas-accreting dE
galaxies proposed by Silk, Wyse, Shields (1987). According to this scenario, these galaxies
are expected to subsequently evolve into nucleated dwarf ellipticals, following the sequence
dE→BCD→dE,N. Note that the possible evolution from BCDs to (nucleated) dE galaxies
has been recently questioned by Tajiri & Kamaya (2002; see also van Zee et al. 2001) because
of the difficulty in having these galaxies blow away their HI envelopes.
4.4. Impact of the recent star formation on the evolution of BCDs
In this section we study the effect of the current star formation on the structural proper-
ties of the USP of BCDs. According to Papaderos et al. (1996b) the offset between the scale
length of dE and the USP of some BCDs may be due to expansion of the USP in response
to changes in the gravitational field produced by collective supernova-driven winds. Here we
define the degree of expansion as the difference (in logarithmic scale) between the scale length
of the galaxy and the average scale length of dwarf ellipticals of the same luminosity. The
latter quantity is obtained from the least-squares fit to the dE’s scale length and luminosity
shown by the dashed line in Figure 5b. In Figure 6 the degree of expansion is compared with
the observed equivalent width of Hα (panel a) and with the difference between the galaxy
color with that of its USP (panel b). Note that the errors in the degree of expansion include
the scatter in the least-squares fit used to derive the average scale length of dwarf ellipticals
at a given luminosity.
Despite the strong dependence of the equivalent width of Hα on the age of the young
– 13 –
stellar population for the case of instantaneous star formation, if the expansion of the USP
in BCDs is related to the strength of the recent star-forming event we would expect to
find a correlation between EW(Hα) and the degree of expansion (as defined above). This
correlation should be even more evident if, as it is thought, the recent star formation in
BCDs takes place in episodes of approximately constant star formation that last as long as
108 yr (see Papaderos et al. 2002 and references therein). However, Figure 6a does not show
any obvious correlation between EW(Hα) and the degree of expansion, which suggests that
the current episode of star formation probably has had little impact, if any, on the structural
properties of the USP.
The (B−R) color is even more sensitive to the strength of the most recent star formation
episode than is the equivalent width of Hα (see Figure 6a of Paper I). Thus, for a relatively
evolved USP, a recent episode of star formation with even a small burst strength may have
a strong impact on the observed (B − R) color of the galaxy for a relatively long period
of time. However, in the case of BCD galaxies with blue envelopes the difference in color
between the galaxy and its USP may be small even for relatively massive bursts.
Figure 6b seems to shows a slight tendency for galaxies with more negative degree of
expansion to have slightly smaller differences in color between the galaxy and its USP. This
is opposite to what we would expect if both the degree of expansion and the difference in
color measured would only depend on the burst strength of the most recent star formation
event.
In order to quantify the impact of this recent star formation on the structural properties
of the USP of BCDs we will use the formalism of Papaderos et al. (1996b). According to
these authors we can write the degree of expansion as
log(α)− < log(αdE) >= log
(
1 −F0
1 + ψRH0
)
(5)
where F0 is the fraction of the visible mass ejected from the galaxy as a consequence of the
collective effect of supernova-driven winds, and ψRH0is the dark-to-visible mass ratio inside
the galaxy’s Holmberg radius (RH0). Note that in our case F0 is defined to be positive.
The simulations of the evolution of the ISM around dwarf starburst galaxies carried out by
MacLow & Ferrara (1999) indicate that F0 is a strong function of the total visible mass of the
galaxy (Mvis) and the kinetic energy injection rate (Lkin). We have used the F0 values given by
these authors for visible masses between 106 and 109 M⊙ and kinetic luminosities in the range
1037-1039 erg s−1. The fraction of mass ejected in the case of kinetic luminosities >1039 erg s−1
has been determined using the following relationship, which adequately reproduces (with an
– 14 –
error <±0.12 dex) the F0 values given by MacLow & Ferrara (1999),
F0 ≈ 10−10.84 ×(
Mvis
M⊙
)−1.7
×(
Lkin
erg s−1
)0.55
(6)
At very high values of Lkin and/or low values of Mvis, where this expression yields F0>1,
the value of F0 was set to 1. For the sake of simplicity we assume the visible mass to
be dominated by the galaxy’s stellar component. The kinetic luminosity per unit mass of
a starburst remains approximately constant for the first few 107 yr and equal to ∼1035.5
erg s−1 M−1⊙ for a Salpeter IMF and Mlow=1M⊙ and Mup=100M⊙ (Leitherer & Heckman
1995). Thus, Equation 5 can be written as
log(α)− < log(αdE) >= log
1 −min
(
1, 4.84 × 10⁸ × b0.55 ×(
M∗
M⊙
)−1.15)
1 + ψRH0
(7)
where the burst strength b, is the ratio of the stellar mass of the most recent episode of star
formation to the galaxy’s total stellar mass. Finally, in order to derive the dependence of
the color difference [(B − R)−(B − R)LSB] on the burst strength we used the predictions
of evolutionary synthesis models (e.g. Bruzual & Charlot 2003). We adopted a 9-Gyr-old
USP with Z⊙/5 metallicity and a burst of star formation with different burst strengths in
the range b=10−4-1. For each value of the burst strength we computed the color difference
[(B − R)−(B −R)LSB] averaged over the first 10Myr of evolution of the burst.
Figure 6b shows that in order for the BCD galaxies to show the large degree of expansion
measured, their stellar mass should be smaller than 107 M⊙ and they should have small dark-
to-visible mass ratios. Even if the color of the USP were to be much bluer than that of a
9-Gyr-old stellar population the vast majority of the galaxies in our sample would be less
massive than 108 M⊙ and the dark matter contribution within the Holmberg radius would
be negligible. This is required if the large differences in scale length between BCDs and dE
galaxies are to be explained as due exclusively to the expansion of the underlying stellar
mass distribution of BCDs. These conditions are certainly not fulfilled by the galaxies in our
sample, where the stellar masses can be much larger than this number (MK for our sample
can be as high as −21mag ; Paper I) and where significant amounts of dark matter are
thought to be present (Ferrara & Tolstoy 2000). This result again argues against the current
star formation having a strong impact on the structural properties of the USP of BCDs.
However, detailed studies of individual objects are required to confirm this in all cases.
– 15 –
5. Conclusions
In summary,
• We have presented the surface brightness profiles in B, R, and Hα, for a total of
114 galaxies taken from the Palomar/Las Campanas Imaging Atlas of BCD galaxies.
A total 104 of the galaxies are classified as BCDs (see Paper I). The profiles in the
continuum bands are characterized by the presence of a HSB component on top of
the nearly exponential low-surface-brightness component associated with the galaxy’s
underlying stellar population (USP). At large galactocentric radii the color profiles of
70% of the galaxies flatten. This flattening occurs approximately at the position where
the USP starts to dominate the galaxy surface brightness profile.
• The color of the USP (corrected for line and nebular-continuum emission) is systemati-
cally redder than the observed integrated color. The color of the USP is bluer than the
integrated one only in those objects with the highest equivalent widths of Hα (where
the line and nebular-continuum emission is significant; i.e. EW(Hα) larger that a few
hundred angstroms).
• We find that galaxies with relatively red USP ((B−R)≥1mag) show structural prop-
erties compatible with those of dwarf elliptical galaxies. They show smoother (con-
tinuum) light distributions, fainter extrapolated central surface brightness, and larger
scale lengths than BCD galaxies with blue envelopes. This result indicates that a non-
negligible fraction of the BCD galaxies (∼15%) could be dwarf ellipticals that are now
experiencing (or have recently experienced) an episode of star formation.
• We do not find any correlation between the equivalent width of Hα and the degree of
expansion of the USP, the latter being defined as the difference in scale length between
BCD and dE galaxies of identical luminosity. The difference measured between the
scale length of BCDs and dE galaxies is much larger than that expected from changes
in the gravitational potential due to the collective effect of supernova-driven winds,
especially considering the relatively small differences in (B − R) color between the
galaxies and their USP. This suggests that the level of recent star formation in BCDs
does not have a significant impact on the structural properties of these galaxies. A
detailed study of a large number of individual objects is needed to confirm this.
We are grateful to the Palomar and Las Campanas Observatories staff for their support
and hospitality, and to the Caltech/Palomar and OCIW/Las Campanas Time Allocation
– 16 –
Committees for the generous allocation of time to this project. AGdP acknowledges financial
support from the GALEX mission. AGdP is also partially supported by the CONACYT
(Mexico) grant 36132-E, the Spanish Programa Nacional de Astronomıa y Astrofısica under
grant AYA2000-1790, and by NASA through grant HST-AR-10321 from STScI. This research
has made use of the NASA/IPAC Extragalactic Database (NED) which is operated by the Jet
Propulsion Laboratory, California Institute of Technology, under contract with the National
Aeronautics and Space Administration. We would like also to thank K. G. Noeske, C.
Sanchez Contreras, and S. Boissier for valuable discussions and to P. Papaderos for providing
his compilation of structural properties of dwarf galaxies. We are grateful to the anonymous
referee for her/his helpful comments and suggestions.

– 17 –
Table 1. Exponential-law fitting parameters
Object Name αB µB,0 χ2r αR µR,0 χ2
r Notes
(arcsec) (mag/⊓⊔) (arcsec) (mag/⊓⊔)
(1) (2) (3) (4) (5) (6) (7) (8)
IC 10 100.8±3.8 17.48±0.06 0.17 112.1±1.8 17.48±0.09 0.00
HS 0029+1748 5.5±0.4 23.09±0.18 0.02 3.8±0.2 21.14±0.17 0.06 (a)
Haro 14 6.1±0.1 19.36±0.10 0.49 6.7±0.1 18.98±0.15 0.05
UM 285 2.6±0.2 21.86±0.24 0.32 3.7±0.4 22.85±0.29 0.36 (a)
UCM 0049-0045 8.7±0.7 22.46±0.16 0.81 10.6±0.4 21.53±0.27 0.09
UM 323 2.3±0.1 19.58±0.17 0.30 2.4±0.1 19.11±0.14 0.86
Mrk 996 4.2±0.1 20.56±0.08 0.30 4.5±0.1 19.75±0.15 1.06
UM 133 9.9±0.4 23.03±0.13 0.29 12.0±0.6 22.37±0.18 0.15
UM 382 1.8±0.1 21.45±0.08 0.45 1.9±0.1 21.42±0.27 0.26
UM 404 2.1±0.1 21.91±0.15 0.68 2.1±0.2 22.46±0.30 0.51
KUG 0207-016A 6.3±0.2 21.49±0.12 0.37 7.1±0.2 21.39±0.14 0.11
UM 408 1.4±0.1 20.23±0.22 0.38 1.6±0.1 19.63±0.13 0.92
UM 417 1.5±0.1 20.24±0.20 0.05 2.0±0.1 21.14±0.15 0.20
Mrk 370 12.4±0.2 21.38±0.04 0.16 13.1±0.1 20.19±0.12 0.68
Mrk 600 4.6±0.1 20.78±0.06 0.07 4.8±0.1 20.59±0.16 0.26
NGC 1522 9.8±0.1 21.78±0.02 0.29 9.6±0.1 20.56±0.06 0.57
NGC 1705 17.8±0.1 22.33±0.03 0.05 17.4±0.1 21.09±0.06 0.05
II Zw 33 4.4±0.1 19.61±0.05 1.69 5.0±0.2 19.25±0.16 2.54
II Zw 33B 6.5±0.6 22.98±0.21 0.19 9.1±2.0 22.48±0.50 0.14
II Zw 40 15.2±3.9 19.76±0.62 0.01 15.5±0.6 18.97±0.10 6.28
Tol 0610-387 6.7±0.2 22.91±0.10 0.23 7.4±0.1 21.96±0.06 0.03
Mrk 5 4.3±0.2 20.59±0.11 0.37 5.2±0.1 20.24±0.13 0.29
Mrk 7 4.5±0.1 19.41±0.04 1.48 5.0±0.1 19.00±0.19 3.33
Mrk 86 14.4±0.4 20.57±0.09 0.06 21.8±0.4 20.88±0.12 0.01
HS 0822+3542 1.9±0.1 21.20±0.07 0.35 1.8±0.1 21.50±0.17 0.35
UGC 4483 14.9±0.9 23.12±0.14 0.19 16.1±1.1 22.33±0.18 0.33 (a)
UGC 4703 N1 6.1±0.3 23.07±0.13 0.25 5.9±0.3 22.21±0.16 0.25
UGC 4703 N2 4.6±0.2 22.92±0.14 0.40 4.3±0.2 21.87±0.17 0.65
Mrk 1416 2.6±0.1 20.49±0.07 0.50 3.0±0.1 20.28±0.10 0.96
Mrk 108 7.5±0.3 22.10±0.09 0.53 8.3±0.4 21.64±0.11 0.13 (a)
Mrk 400 8.9±0.5 22.31±0.17 0.90 12.2±0.6 22.35±0.16 0.25
– 18 –
Table 1—Continued
Object Name αB µB,0 χ2r αR µR,0 χ2
r Notes
(arcsec) (mag/⊓⊔) (arcsec) (mag/⊓⊔)
(1) (2) (3) (4) (5) (6) (7) (8)
NGC 2915 45.0±2.0 23.11±0.10 0.01 39.1±5.4 21.48±0.36 0.01 (a)
I Zw 18 4.2±0.2 22.60±0.16 0.19 7.0±1.0 24.00±0.28 0.36 (b)
Mrk 1418 12.6±0.3 22.79±0.09 0.21 13.7±0.3 21.35±0.20 0.11
Mrk 1423 18.9±8.2 24.00±1.28 0.01 22.2±1.1 22.97±0.16 0.04 (a)
SBS 0940+544C 2.8±0.1 21.15±0.08 0.28 3.2±0.1 21.40±0.11 0.21
Mrk 709 2.4±0.1 20.75±0.12 0.10 2.4±0.1 19.86±0.10 0.32
Mrk 1426 4.0±0.1 21.65±0.11 1.26 5.8±0.2 22.36±0.16 0.25 (a)
UGCA 184 7.0±0.3 23.08±0.11 0.16 7.5±0.2 22.95±0.13 0.11
Mrk 409 5.0±0.2 19.75±0.16 0.46 5.1±0.1 18.84±0.13 0.64
Tol 1 2.8±0.1 20.30±0.11 2.08 3.0±0.1 20.17±0.11 1.01
Tol 2 12.9±0.2 22.91±0.05 0.09 13.3±0.2 21.95±0.07 0.09
NGC 3125 15.2±0.6 22.92±0.13 0.02 15.7±0.4 21.86±0.11 0.01 (a)
SBS 1006+578 2.9±0.1 20.99±0.12 0.88 3.0±0.1 20.32±0.14 0.44
Haro 2 15.4±0.2 22.69±0.06 0.29 16.7±0.3 22.02±0.11 0.47
Mrk 1434 2.1±0.2 21.20±0.24 0.82 2.6±0.2 21.31±0.25 0.80 (a)
Haro 3 9.5±0.2 21.11±0.08 0.22 9.8±0.2 20.10±0.14 0.13
SBS 1054+504 3.8±0.1 21.56±0.12 0.28 4.0±0.1 20.93±0.17 0.17
Haro 4 4.0±0.4 21.42±0.28 0.16 3.8±0.2 20.87±0.22 0.07 (a)
VII Zw 403 25.8±2.4 23.75±0.17 0.08 24.6±1.1 22.88±0.14 0.01 (a)
Mrk 178 14.1±0.3 22.71±0.07 0.14 15.0±0.2 21.99±0.10 0.16
UM 439 9.9±0.4 22.60±0.11 0.33 9.3±0.3 21.62±0.10 1.62
Mrk 1450 9.0±1.9 24.39±0.39 0.40 8.6±1.4 23.25±0.37 0.05 (b)
UM 452 8.0±0.4 22.58±0.15 0.20 8.1±0.2 21.30±0.14 0.16
SBS 1147+520 4.9±0.6 24.22±0.34 0.02 5.1±0.6 22.65±0.28 0.11 (a)
Tol 17 4.9±0.2 22.08±0.11 0.37 5.1±0.1 21.02±0.09 0.34
UM 455 3.9±0.4 23.54±0.30 0.41 3.8±0.2 22.23±0.14 0.32 (a)
UM 456 4.8±0.1 20.71±0.12 0.13 6.1±0.2 20.75±0.07 1.10
UM 456A 3.0±0.2 21.57±0.25 0.50 5.4±0.5 22.90±0.26 0.23 (b)
Pox 4 3.0±0.1 19.73±0.19 0.54 3.3±0.1 19.81±0.16 0.30
ES O572-G025 13.6±0.2 23.84±0.05 0.22 13.8±0.2 22.80±0.05 0.17
VCC 0001 3.1±0.1 20.12±0.05 0.16 3.1±0.1 18.99±0.04 0.27

– 19 –
Table 1—Continued
Object Name αB µB,0 χ2r αR µR,0 χ2
r Notes
(arcsec) (mag/⊓⊔) (arcsec) (mag/⊓⊔)
(1) (2) (3) (4) (5) (6) (7) (8)
Mrk 1313 3.1±0.2 21.36±0.24 0.22 3.3±0.1 20.92±0.15 0.24 (a)
VCC 0130 2.5±0.1 21.00±0.06 0.92 2.5±0.1 20.21±0.03 0.94
Haro 8 8.7±0.2 21.23±0.06 1.09 9.5±0.3 20.33±0.12 2.45
UM 491 3.9±0.3 21.52±0.26 0.27 4.1±0.2 20.83±0.16 0.40
ISZ 399 8.8±0.1 21.85±0.02 0.32 8.7±0.1 20.50±0.06 0.48
VCC 0459 4.6±0.1 20.95±0.10 0.61 4.8±0.1 20.03±0.09 1.32
VCC 0655 14.1±0.2 21.45±0.06 0.47 14.0±0.2 20.14±0.04 0.60
Tol 65 1.8±0.1 21.09±0.21 5.61 2.0±0.1 20.83±0.17 5.64
VCC 0848 10.4±0.2 22.54±0.06 0.35 11.4±0.2 21.75±0.03 0.30
Mrk 209 25.1±1.0 24.12±0.07 0.13 27.4±2.9 23.66±0.24 0.04
Mrk 1329 10.9±0.3 21.70±0.06 0.63 11.2±0.2 20.84±0.10 2.91
UGCA 290 4.4±0.1 20.59±0.05 0.08 5.3±0.1 20.49±0.14 0.10
VCC 1750 3.8±0.1 22.40±0.09 0.26 4.0±0.1 21.45±0.07 0.67
Haro 9 9.5±0.1 20.52±0.05 0.25 10.2±0.1 19.75±0.10 0.07
NGC 4861 21.1±0.2 21.51±0.04 0.61 24.2±0.2 20.95±0.09 0.71
UM 533 13.8±0.4 22.75±0.08 0.24 14.2±0.2 21.69±0.11 0.12
Mrk 450 14.1±0.4 22.95±0.09 0.07 15.7±0.3 22.29±0.11 0.05
NGC 5058 8.3±0.2 21.18±0.10 0.37 8.8±0.2 20.59±0.09 0.47
PGC 046448 4.4±0.1 21.82±0.12 0.30 4.9±0.2 21.00±0.15 1.35 (a)
Pox 186 1.7±0.1 22.24±0.17 0.05 2.1±0.3 22.31±0.37 0.08
Tol 35 4.5±0.1 19.44±0.08 0.29 4.6±0.1 18.58±0.06 0.34
SBS 1331+493 5.4±0.1 20.42±0.07 0.74 6.1±0.1 20.14±0.18 0.02
Tol 85 2.2±0.1 19.69±0.19 0.54 2.7±0.1 20.17±0.19 0.59
Mrk 67 7.3±0.4 23.76±0.14 0.52 9.4±0.6 23.08±0.16 0.44
Mrk 1480 4.1±0.3 22.61±0.21 0.40 3.9±0.2 21.45±0.20 0.27 (a)
Mrk 1481 12.0±0.6 24.40±0.09 0.34 12.5±0.4 23.48±0.08 0.06
Tol 1345-420 4.2±0.5 21.90±0.26 2.23 5.5±0.4 21.98±0.19 0.22 (b)
HS 1400+3927 2.6±0.1 21.83±0.09 0.23 2.4±0.1 20.39±0.12 0.38
SBS 1415+437 4.7±0.1 21.02±0.08 1.02 5.1±0.1 20.52±0.14 0.12
SBS 1428+457 4.1±0.2 21.42±0.24 0.62 4.4±0.3 20.67±0.30 3.19
Tol 1434+032 5.7±0.2 22.06±0.09 0.37 6.6±0.1 21.98±0.08 0.08
– 20 –
Table 1—Continued
Object Name αB µB,0 χ2r αR µR,0 χ2
r Notes
(arcsec) (mag/⊓⊔) (arcsec) (mag/⊓⊔)
(1) (2) (3) (4) (5) (6) (7) (8)
Mrk 475 3.6±0.1 21.70±0.09 0.28 4.5±0.1 21.49±0.11 0.25
HS 1440+4302 3.3±0.2 23.06±0.15 0.43 3.5±0.1 21.87±0.14 0.32
HS 1442+4250 4.4±0.1 20.63±0.07 0.16 4.8±0.1 20.26±0.08 0.26
UCM 1446+2312 4.8±0.2 21.19±0.11 1.56 5.4±0.2 20.35±0.13 3.28
Tol 1448+116 2.7±0.3 21.49±0.31 0.20 3.2±0.2 21.02±0.17 1.22 (a)
II Zw 70 10.1±0.8 23.59±0.22 0.37 8.8±0.3 22.25±0.17 0.11 (a)
II Zw 71 6.8±0.1 20.70±0.16 0.04 7.9±0.1 20.26±0.12 0.09
I Zw 115 6.3±0.1 21.02±0.10 0.34 6.9±0.1 20.27±0.09 0.24
SBS 1533+574 2.8±0.2 21.23±0.20 0.22 3.2±0.1 20.55±0.13 0.29
I Zw 123 3.9±0.2 21.70±0.19 0.40 4.5±0.1 21.13±0.13 0.55
HS 1609+4827 2.7±0.1 19.66±0.15 1.23 2.9±0.1 19.00±0.12 7.98
UCM 1612+1308 1.1±0.2 20.14±0.64 1.81 1.4±0.1 20.37±0.10 0.09
UGCA 412 5.6±0.2 22.55±0.13 0.24 5.5±0.3 21.25±0.17 0.48
HS 1704+4332 1.3±0.1 21.34±0.35 0.65 1.6±0.1 21.86±0.24 0.02
NGC 6789 12.9±0.1 21.49±0.04 0.11 13.4±0.2 20.49±0.08 0.25
Tol 1924-416 9.3±0.7 23.04±0.24 0.05 6.6±0.2 20.79±0.12 0.40 (a)
Tol 1937-423 8.6±1.7 23.63±0.58 0.01 6.1±0.4 21.30±0.22 0.11 (b)
Mrk 900 9.2±0.2 21.74±0.06 0.09 9.1±0.3 20.76±0.14 0.58
Mrk 314 12.0±0.4 22.11±0.09 0.08 12.2±0.7 21.48±0.27 0.01 (a)
Mrk 324 3.6±0.2 20.92±0.20 0.93 3.4±0.1 19.97±0.21 0.27
Mrk 328 4.7±0.1 21.21±0.12 0.02 4.6±0.1 20.19±0.12 0.27
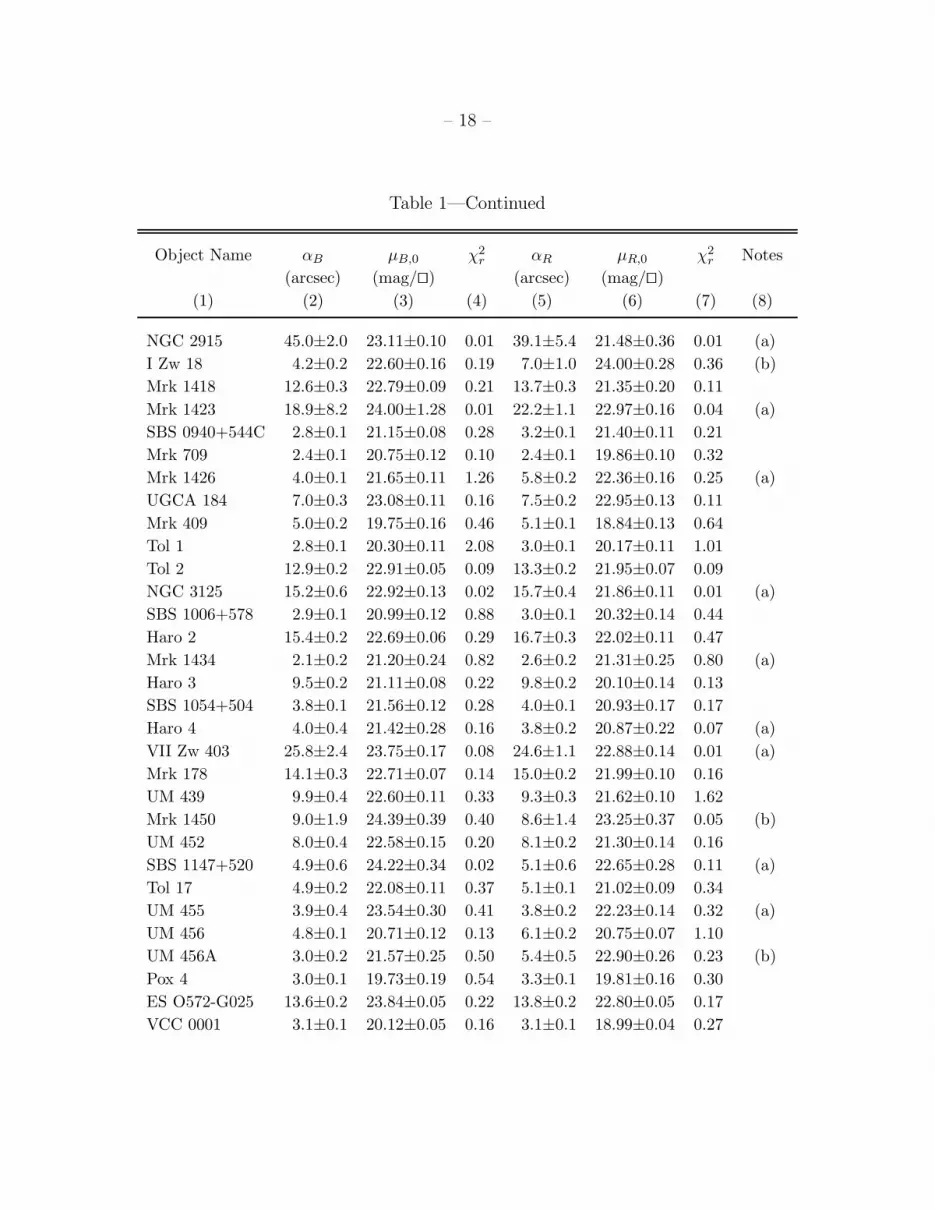
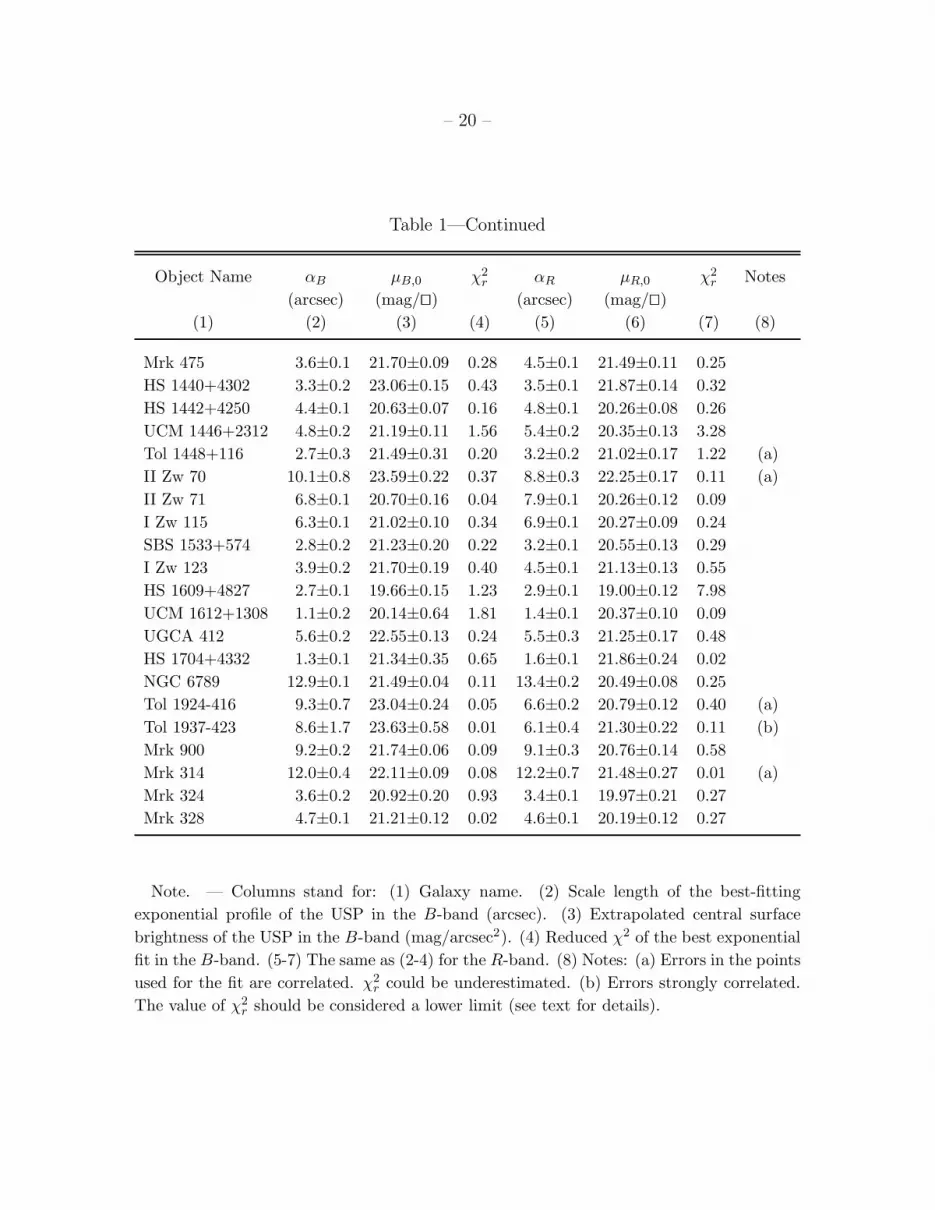
Note. — Columns stand for: (1) Galaxy name. (2) Scale length of the best-fitting
exponential profile of the USP in the B-band (arcsec). (3) Extrapolated central surface
brightness of the USP in the B-band (mag/arcsec2). (4) Reduced χ2 of the best exponential
fit in the B-band. (5-7) The same as (2-4) for the R-band. (8) Notes: (a) Errors in the points
used for the fit are correlated. χ2r could be underestimated. (b) Errors strongly correlated.
The value of χ2r should be considered a lower limit (see text for details).

–21
–
Table 2. Sersic-law fitting parameters
Object Name 1/nB rB,0 µB,0 χ2
r 1/nR rR,0 µR,0 χ2
r 1/nHα rHα,0 log fHα,0 χ2
r Notes
(arcsec) (mag/⊓⊔) (arcsec) (mag/⊓⊔) (arcsec) (cgs/⊓⊔)
IC 10 1.11±0.53 115±60 17.64±5.67 0.17 0.70±1.43 50±100 16.55c 0.00 0.41±0.10 7.02± 8.95 -11.31±1.01 5.97
HS 0029+1748 0.33±0.12 0.01±0.15 15.48±7.66 0.21 0.37±0.29 0.06±1.02 17.01c 0.05 0.05±0.01 <0.01 · · · 1.29
Haro 14 0.18±0.22 <0.01 · · · 0.13 0.50±0.23 0.33±1.63 13.48c 0.07 1.19±0.01 10.45±0.04 -14.55c >100 (a)
UM 285 0.05±0.05 <0.01 · · · 0.56 0.05±0.00 <0.01 · · · 0.77 1.14±0.69 4.28±2.55 -14.60c 0.32
UCM 0049-0045 0.05±0.00 <0.01 · · · 0.59 0.06±0.03 <0.01 · · · 0.40 2.91±0.21 9.95±0.26 -14.83±0.08 0.21
UM 323 0.45±0.27 0.07±0.63 14.06c 0.12 0.52±0.19 0.21±0.49 15.45±8.78 0.23 0.05±0.17 <0.01 · · · 0.80
Mrk 996 0.67±0.11 1.31±0.76 18.91±0.89 0.17 0.66±0.05 1.36±0.38 18.12±0.38 0.35 0.05±0.00 <0.01 · · · 1.22
UM 133 0.56±0.66 1.66±8.06 20.84c 0.28 0.05±0.41 <0.01 · · · 0.13 0.60±0.08 4.02±1.25 -14.03±0.24 2.71
UM 382 1.19±0.18 2.35±0.47 21.78±0.30 0.38 0.25±0.69 <0.01 11.16c 0.18 0.05±0.00 <0.01 · · · 2.10 (a)
UM 404 0.32±0.55 <0.01 16.15c 0.58 0.05±0.75 <0.01 · · · 0.40 0.19±0.05 <0.01 · · · 6.37
KUG 0207-016A 0.30±0.24 <0.01 12.19c 0.17 0.72±0.39 2.84±4.37 20.02c 0.10 0.05±0.10 <0.01 · · · 1.16 (a)
UM 408 0.27±0.63 <0.01 11.82c 0.31 1.10±0.20 1.85±0.57 19.89±0.60 0.88 0.38±0.21 0.23±0.83 -12.50±5.71 0.57 (a)
UM 417 2.60±0.46 5.13±0.57 22.97±0.27 0.12 1.17±0.42 2.60±1.32 21.58±3.42 0.18 1.78±0.06 5.23±0.08 -15.02±0.03 1.61 (a)
Mrk 370 1.05±0.16 13.50±3.40 21.50±0.39 0.16 0.81±0.04 8.34±0.94 19.63±0.18 0.35 0.05±0.00 <0.01 · · · 20.30
Mrk 600 0.82±0.26 2.90±2.04 20.11±3.66 0.07 0.71±0.19 2.04±1.51 19.49±1.68 0.16 0.05±0.08 <0.01 · · · 1.26
NGC 1522 1.19±0.02 13.64±0.37 22.31±0.04 0.34 1.31±0.02 15.87±0.22 21.45±0.06 0.44 0.32±0.10 0.02±0.15 · · · 1.10
NGC 1705 0.51±0.11 1.35±1.80 18.48±2.21 0.05 0.50±0.02 1.26±0.28 17.35±0.25 0.24 0.22±0.12 0.02±1.82 · · · 0.30
II Zw 33 0.91±0.04 3.60±0.32 19.35±0.12 1.49 0.68±0.02 1.59±0.14 17.55±0.14 2.83 0.05±0.00 <0.01 · · · 1.50
II Zw 33B 0.05±0.32 <0.01 · · · 0.21 0.05±0.88 <0.01 · · · 0.23 1.35±1.04 8.14±5.25 -14.93c 0.52
II Zw 40 0.06±1.47 <0.01 · · · 0.01 0.11±0.07 <0.01 · · · 3.34 0.11±0.00 <0.01 · · · >100 (b)
Tol 0610-387 0.31±0.10 0.01±0.16 16.07±6.63 0.20 0.84±0.22 4.91±2.88 21.38±1.24 0.06 0.05±0.00 <0.01 · · · 4.41
Mrk 5 0.59±0.20 0.80±1.17 18.29±6.57 0.26 0.72±0.11 2.28±1.08 19.16±0.72 0.14 0.71±0.03 3.55±0.30 -13.70±0.07 4.61
Mrk 7 0.95±0.03 4.00±0.27 19.24±0.10 1.37 0.67±0.03 1.59±0.27 17.40±0.27 2.02 0.05±0.00 <0.01 · · · 2.32
Mrk 86 0.88±0.82 10.6±15.4 20.11c 0.06 0.15±0.95 <0.01 · · · 0.01 0.05±0.00 <0.01 · · · 1.24
HS 0822+3542 1.10±0.22 2.25±0.73 21.43±0.61 0.32 0.65±0.20 0.55±0.53 19.95±3.59 0.28 0.35±0.30 0.10±1.18 -12.02c 0.83
UGC 4483 0.36±1.24 0.24±15.76 19.13c 0.19 1.67±1.12 28.01±14.55 23.12c 0.32 0.05±0.99 <0.01 · · · 0.05 (b)
UGC 4703 N1 0.05±0.51 <0.01 · · · 0.18 0.05±0.11 <0.01 · · · 0.43 0.05±0.00 <0.01 · · · 3.15
UGC 4703 N2 0.18±0.52 <0.01 10.03c 0.32 0.15±0.45 <0.01 · · · 0.55 · · · · · · · · · · · ·
Mrk 1416 0.93±0.10 2.19±0.54 20.24±0.39 0.48 0.69±0.10 1.11±0.55 18.98±0.67 0.50 0.59±0.07 1.46±0.52 -13.06±0.31 1.23
Mrk 108 0.05±0.01 <0.01 · · · 0.98 0.05±0.04 <0.01 · · · 0.34 0.05±0.00 <0.01 · · · >100
Mrk 400 0.05±0.08 <0.01 · · · 0.61 0.05±0.18 <0.01 · · · 0.21 0.05±0.00 <0.01 · · · 1.29
NGC 2915 0.19±0.11 <0.01 10.46c 0.05 0.05±0.04 <0.01 · · · 0.08 0.07±0.01 <0.01 · · · 32.40
I Zw 18 3.00±1.14 13.29±5.28 24.92c 0.10 3.00±1.33 13.28±0.01 24.83c 0.07 0.05±0.00 <0.01 · · · 5.85 (b)
Mrk 1418 0.13±0.04 <0.01 · · · 0.23 0.13±0.04 <0.01 · · · 0.18 0.05±0.00 <0.01 · · · 7.83
Mrk 1423 0.53±0.03 1.82±0.41 20.64±0.20 0.54 0.05±0.04 <0.01 · · · 0.15 0.05±0.00 <0.01 · · · 2.40
SBS 0940+544C 1.29±0.10 4.53±0.46 22.00±0.17 0.47 1.06±0.14 3.53±0.76 21.53±0.33 0.20 1.52±0.05 7.24±0.14 -14.93±0.03 6.46
Mrk 709 0.20±0.15 <0.01 · · · 0.11 0.34±0.13 <0.01 12.68±9.70 0.19 2.18±1.00 8.28±3.33 -16.32±2.92 0.38
Mrk 1426 0.05±0.06 <0.01 · · · 0.47 0.05±0.03 <0.01 · · · 0.54 0.05±0.03 <0.01 · · · 0.55
UGCA 184 0.05±0.11 <0.01 · · · 0.14 0.05±0.13 <0.01 · · · 0.19 3.00±1.17 16.73±6.71 -16.53c 0.35
Mrk 409 0.77±0.27 2.25±2.49 18.27±7.20 0.42 0.05±0.15 <0.01 · · · 0.19 0.05±1.41 <0.01 · · · 0.12 (a)
Tol 1 0.17±0.13 <0.01 · · · 0.26 0.57±0.11 0.40±0.40 17.03±1.67 0.22 0.80±0.06 3.40±0.37 -14.13±0.09 3.89
Tol 2 0.93±0.48 11.14±8.88 22.71c 0.09 1.14±0.32 16.60±6.76 22.28±2.07 0.09 0.05±0.00 <0.01 · · · 31.00
NGC 3125 0.32±0.06 0.02±0.10 13.02±2.66 0.11 0.28±0.07 <0.01 10.68±4.42 0.07 0.85±0.18 22.08±6.86 -14.78±0.38 0.29
SBS 1006+578 0.74±0.09 1.26±0.48 19.78±0.55 1.25 0.78±0.12 1.57±0.66 19.39±0.66 0.59 0.77±0.66 3.52±4.11 -13.85c 0.92
Haro 2 0.18±0.05 <0.01 · · · 0.25 0.12±0.04 <0.01 · · · 0.25 0.09±0.16 <0.01 · · · 0.02
Mrk 1434 0.46±0.28 0.09±0.66 16.95c 0.46 0.11±0.19 <0.01 · · · 0.21 0.17±0.05 <0.01 · · · 1.66 (a)
Haro 3 0.34±0.09 0.03±0.19 12.70±4.64 0.13 0.06±0.29 <0.01 · · · 0.02 0.05±0.12 <0.01 · · · 0.56 (a)
SBS 1054+504 0.51±0.07 0.33±0.24 18.23±0.86 0.37 0.53±0.05 0.42±0.18 17.85±0.50 0.11 0.05±0.27 <0.01 · · · 0.56
Haro 4 0.05±0.36 <0.01 · · · 0.20 1.01±1.34 3.91±5.94 20.91c 0.07 0.42±0.01 0.36±0.05 -11.28±0.09 31.97 (a)
VII Zw 403 0.05±0.18 <0.01 · · · 0.16 0.05±0.17 <0.01 · · · 0.03 0.05±0.00 <0.01 · · · 0.52

–22
–
Table 2—Continued
Object Name 1/nB rB,0 µB,0 χ2
r 1/nR rR,0 µR,0 χ2
r 1/nHα rHα,0 log fHα,0 χ2
r Notes
(arcsec) (mag/⊓⊔) (arcsec) (mag/⊓⊔) (arcsec) (cgs/⊓⊔)
Mrk 178 1.29±0.29 21.84±6.88 23.41±2.08 0.13 1.02±0.17 15.61±5.05 22.05±0.62 0.16 0.05±0.00 <0.01 · · · 0.82
UM 439 0.05±0.11 <0.01 · · · 0.40 0.39±0.12 0.22±0.73 17.66±4.14 1.32 0.05±0.13 <0.01 · · · 0.43
Mrk 1450 0.05±0.00 <0.01 · · · 1.39 0.05±0.00 <0.01 · · · 1.42 0.05±0.00 <0.01 · · · 5.30 (a)
UM 452 0.05±0.16 <0.01 · · · 0.21 0.08±0.20 <0.01 · · · 0.13 3.00±0.01 6.48±0.02 -15.19c 30.03
SBS 1147+520 0.05±1.43 <0.01 · · · 0.02 0.05±1.14 <0.01 · · · 0.08 3.00±0.32 4.57±0.18 -15.52±0.08 0.21 (a)
Tol 17 0.56±0.08 0.71±0.44 19.42±0.83 0.36 0.63±0.06 1.27±0.46 19.08±0.43 0.38 0.29±0.15 0.01±0.26 · · · 1.01
UM 455 0.05±0.41 <0.01 · · · 0.45 1.17±0.97 4.99±4.06 22.64c 0.32 0.84±0.01 1.74±0.03 -13.62±0.01 2.77 (a)
UM 456 1.75±1.02 13.08±7.56 22.94c 0.08 1.87±0.23 14.30±1.43 22.25±0.22 0.42 0.05±0.09 <0.01 · · · 0.21
UM 456A 0.05±0.03 <0.01 · · · 0.35 0.05±0.01 <0.01 · · · 0.73 2.77±0.31 8.73±0.13 -15.46±0.05 0.22
Pox 4 0.05±0.09 <0.01 · · · 0.78 1.11±0.47 4.26±3.11 20.31c 0.30 0.05±0.01 <0.01 · · · 0.71 (a)
ESO 572-G025 0.26±0.01 <0.01 15.56±0.45 0.90 0.05±0.00 <0.01 · · · 0.48 0.05±0.00 <0.01 · · · 1.13
VCC 0001 0.90±0.18 2.45±1.11 19.78±0.84 0.14 0.54±0.31 0.37±1.26 16.00c 0.02 0.87±0.10 2.70±0.40 -14.88±0.14 1.33
Mrk 1313 1.62±1.01 6.70±3.97 22.77c 0.20 1.44±0.84 6.06±3.60 21.98c 0.22 0.56±0.14 1.47±1.11 -13.56±1.20 1.93 (a)
VCC 0130 1.01±0.04 2.55±0.17 21.03±0.10 0.92 0.95±0.03 2.28±0.17 20.06±0.10 0.79 0.05±0.30 <0.01 · · · 0.84
Haro 8 0.87±0.06 6.44±1.01 20.84±0.21 0.95 0.60±0.04 2.24±0.55 18.62±0.28 0.80 1.34±0.02 9.35±0.07 -14.37±0.01 7.51
UM 491 0.22±0.53 <0.01 · · · 0.21 0.19±0.33 <0.01 · · · 0.16 0.59±0.08 1.27±0.55 -13.24±0.42 1.85
ISZ 399 0.89±0.03 6.87±0.60 21.50±0.12 0.23 1.01±0.02 8.88±0.41 20.52±0.09 0.47 0.75±0.01 2.03±0.04 -13.00±0.01 19.16
VCC 0459 0.71±0.11 1.70±0.90 19.41±0.91 0.45 0.59±0.08 0.84±0.52 17.50±0.87 0.69 0.05±0.00 <0.01 · · · 3.86
VCC 0655 0.62±0.02 3.36±0.44 19.52±0.15 0.52 0.77±0.04 7.18±1.16 19.18±0.22 0.20 0.05±0.00 <0.01 · · · 1.58
Tol 65 1.17±0.06 2.41±0.21 21.49±0.14 5.21 1.02±0.05 2.03±0.20 20.88±0.14 5.63 0.07±0.04 <0.01 · · · 6.93
VCC 0848 0.91±0.15 8.67±2.86 22.31±0.49 0.33 0.83±0.13 7.78±2.57 21.29±0.43 0.28 0.05±0.01 <0.01 · · · 0.59
Mrk 209 0.05±0.26 <0.01 · · · 0.11 0.05±0.01 <0.01 · · · 0.22 0.05±0.25 <0.01 · · · 1.09
Mrk 1329 0.46±0.04 0.70±0.38 18.63±0.50 0.68 0.72±0.02 5.04±0.51 19.86±0.14 1.97 0.05±0.01 <0.01 · · · 5.47
UGCA 290 0.84±0.21 2.84±1.82 19.87±1.54 0.08 0.69±0.40 1.90±3.06 19.08c 0.07 3.00±0.01 27.36±0.79 -16.31±0.02 1.81
VCC 1750 1.00±0.35 3.79±2.19 22.40±4.09 0.26 1.25±0.17 5.94±1.13 22.09±0.33 0.46 0.61±0.04 0.96±0.20 -13.13±0.17 1.77
Haro 9 0.95±0.04 8.48±0.83 20.35±0.15 0.27 0.99±0.05 9.99±1.02 19.73±0.17 0.07 0.09±0.01 <0.01 · · · 9.48
NGC 4861 0.86±0.03 14.79±1.48 20.98±0.14 0.52 0.91±0.02 20.30±0.98 20.73±0.10 0.60 0.05±0.00 <0.01 · · · 4.95
UM 533 0.61±0.19 3.14±3.48 20.80±3.83 0.31 0.62±0.18 3.71±3.55 20.04±2.78 0.06 0.85±0.01 5.12±0.09 -13.86±0.01 3.08
Mrk 450 0.12±0.11 <0.01 · · · 0.22 0.05±0.05 <0.01 · · · 0.12 0.05±0.01 <0.01 · · · 0.88
NGC 5058 0.64±0.08 2.24±1.01 19.43±0.60 1.06 0.61±0.10 1.99±1.34 18.62±0.90 0.37 0.05±0.61 <0.01 · · · 1.54
PGC 046448 0.36±0.10 0.02±0.12 14.57±4.66 0.28 0.05±0.04 <0.01 · · · 0.99 0.60±0.01 1.00±0.03 -13.26±0.02 65.51
Pox 186 0.12±0.42 <0.01 · · · 0.24 0.35±0.28 0.02±0.56 17.92c 0.45 0.05±0.00 <0.01 · · · 2.23 (a)
Tol 35 1.96±0.07 13.17±0.36 21.79±0.07 0.66 0.87±0.10 3.14±1.02 17.83±0.63 0.39 1.68±0.09 18.91±0.33 -15.09±0.03 1.04
SBS 1331+493 1.34±0.08 8.68±0.69 21.19±0.14 0.46 1.23±0.07 8.24±0.63 20.38±0.20 0.54 0.99±0.02 9.47±0.27 -14.29±0.03 28.48
Tol 85 0.68±0.36 0.56±1.26 16.97c 0.50 0.05±0.24 <0.01 · · · 0.24 0.05±0.09 <0.01 · · · 0.87 (a)
Mrk 67 0.05±0.17 <0.01 · · · 0.26 0.05±0.00 <0.01 · · · 0.62 0.05±0.00 <0.01 · · · 1.81
Mrk 1480 0.13±0.09 <0.01 · · · 0.36 0.30±0.11 <0.01 12.57c 0.19 0.05±0.00 <0.01 · · · 0.85
Mrk 1481 0.05±0.10 <0.01 · · · 0.35 0.06±0.29 <0.01 · · · 0.05 1.20±0.08 7.44±0.34 -15.17±0.06 25.29 (a)
Tol 1345-420 0.05±0.02 <0.01 · · · 0.41 0.05±0.05 <0.01 · · · 0.24 0.05±0.00 <0.01 · · · 23.37
HS 1400+3927 0.54±0.16 0.37±0.47 19.45±3.55 0.34 0.46±0.09 0.15±0.18 17.22±1.19 1.06 0.15±0.36 <0.01 · · · 0.09
SBS 1415+437 1.16±0.14 6.12±1.19 21.42±0.32 0.98 0.34±0.40 0.03±2.38 14.77c 0.04 0.19±0.03 <0.01 · · · 9.76
SBS 1428+457 0.05±0.19 <0.01 · · · 0.21 0.05±0.00 <0.01 · · · 0.69 0.05±0.00 <0.01 · · · 4.99
Tol 1434+032 0.44±0.06 0.27±0.24 18.57±0.76 0.61 0.87±0.25 4.96±2.72 21.59±1.90 0.09 2.83±0.26 20.98±0.33 -16.17±0.04 0.59 (a)
Mrk 475 0.71±0.15 1.41±0.90 20.36±2.19 0.19 0.60±0.11 0.91±0.64 19.32±0.93 0.16 0.05±0.00 <0.01 · · · 3.10
HS 1440+4302 0.73±0.41 1.52±1.90 22.10c 0.40 0.52±0.18 0.40±0.64 19.24±4.44 0.46 0.05±0.03 <0.01 · · · 2.59
HS 1442+4250 0.71±0.22 1.58±1.67 18.98±3.84 0.06 0.64±0.18 1.21±1.33 18.21±2.62 0.09 1.17±0.03 11.45±0.21 -15.05±0.02 3.72
UCM 1446+2312 1.36±0.09 7.93±0.62 21.95±0.13 1.28 1.32±0.06 8.21±0.44 20.94±0.12 2.28 · · · · · · · · · · · ·
Tol 1448+116 1.11±0.81 3.38±3.02 21.82c 0.20 0.08±0.19 <0.01 · · · 0.31 0.05±0.19 <0.01 · · · 0.16 (a)
II Zw 70 0.20±0.03 <0.01 · · · 1.23 0.27±0.02 <0.01 12.45±0.93 1.01 0.14±0.01 <0.01 · · · 17.43
II Zw 71 0.90±0.56 5.22±6.24 20.23c 0.04 1.01±0.08 8.02±1.15 20.28±0.23 0.09 1.82±0.03 22.91±0.10 -15.29±0.01 32.37

–23
–
Table 2—Continued
Object Name 1/nB rB,0 µB,0 χ2
r 1/nR rR,0 µR,0 χ2
r 1/nHα rHα,0 log fHα,0 χ2
r Notes
(arcsec) (mag/⊓⊔) (arcsec) (mag/⊓⊔) (arcsec) (cgs/⊓⊔)
I Zw 115 0.35±0.24 0.02±1.17 13.12c 0.15 0.08±0.24 <0.01 · · · 0.04 · · · · · · · · · · · ·
SBS 1533+574 0.80±0.50 1.59±2.17 20.35c 0.21 0.64±0.26 0.85±1.21 18.67±8.34 0.23 0.05±0.08 <0.01 · · · 0.98
I Zw 123 0.33±0.17 0.01±0.32 14.81c 0.19 0.33±0.05 0.01±0.03 14.05±1.84 0.15 0.05±0.00 <0.01 · · · 1.02
HS 1609+4827 0.69±0.09 0.99±0.42 18.33±0.58 0.37 0.69±0.03 1.05±0.17 17.68±0.22 1.48 1.05±0.03 6.35±0.13 -14.39±0.02 28.17
UCM 1612+1308 0.05±0.04 <0.01 · · · 0.75 0.57±0.10 0.22±0.16 17.64±1.02 0.03 1.07±0.02 2.99±0.07 -14.09±0.03 6.99 (a)
UGCA 412 0.64±0.39 1.57±3.07 20.86c 0.20 0.14±0.22 <0.01 · · · 0.11 0.54±1.30 2.07±6.00 -13.82c 0.21
HS 1704+4332 0.05±0.25 <0.01 · · · 0.21 0.05±0.44 <0.01 · · · 0.05 0.45±0.03 0.21±0.07 -12.10±0.23 4.69
NGC 6789 0.85±0.08 8.93±1.92 20.98±0.29 0.08 0.77±0.09 7.26±2.18 19.69±0.39 0.10 0.05±0.00 <0.01 · · · 5.39
Tol 1924-416 0.35±0.08 0.03±0.09 13.91±2.67 0.22 0.30±0.06 <0.01 12.47±2.48 0.30 0.05±0.00 <0.01 · · · 7.14
Tol 1937-423 0.05±0.47 <0.01 · · · 0.11 0.06±0.40 <0.01 · · · 0.24 0.05±1.02 <0.01 · · · 0.08
Mrk 900 0.39±0.09 0.17±0.37 17.02±2.78 0.07 0.33±0.15 0.06±0.71 15.85±9.70 0.03 0.05±0.00 <0.01 · · · 0.92
Mrk 314 0.06±0.10 <0.01 · · · 0.19 0.05±0.22 <0.01 · · · 0.02 2.13±0.72 25.87±5.30 -16.02±2.31 0.17
Mrk 324 0.41±0.21 0.06±0.63 14.89c 0.54 0.90±0.30 2.59±2.02 19.48±5.95 0.26 0.05±0.00 <0.01 · · · 1.08
Mrk 328 0.41±0.18 0.11±0.59 16.61±8.60 0.07 0.40±0.15 0.10±0.45 15.58±7.63 0.07 0.05±0.00 <0.01 · · · 3.46
Note. — Columns stand for: (1) Galaxy name. (2) Index of the best-fitting Sersic profile for the USP in the B-band. (3) Scale length of the best-fitting Sersic profile in the B-band
(arcsec). (4) Extrapolated central surface brightness of the best-fitting Sersic profile in the B-band (mag/arcsec2). (5) Reduced χ2 of the best Sersic profile fit in the B-band. (10-13)
The same as (6-9) for the R-band. (14) Notes: (a) Errors in the points used for the fit are correlated. χ2
r could be underestimated. (b) Errors strongly correlated. The value of χ2
r
should be considered a lower limit (see text for details). (c) These quantities have uncertainties larger than 10 mag arcsec−2 (10 dex) in µB,0 or µR,0 (log fHα,0). In those cases where
the best Sersic fit yielded (unrealistic) negative values for the B and R-bands extrapolated central surface brightness no data are given.

– 24 –
Table 3. Properties of the Underlying Stellar Population
Object Name BELSB,∞ RE
LSB,∞ (B-R)ELSB (B-R)E,cLSB (B-R)SLSB (B-R)S,c
LSB
(mag) (mag) (mag) (mag) (mag) (mag)
IC 10 5.47±0.10 5.24±0.09 0.23±0.14 0.22±0.12 0.23±0.14 0.22±0.12
HS 0029+1748 17.38±0.24 16.27±0.19 0.66±0.16 0.65±0.15 0.56±0.15 0.49±0.15
Haro 14 13.44±0.11 12.87±0.15 0.90±0.15 0.89±0.15 0.85±0.15 0.85±0.15
UM 285 17.77±0.28 18.04±0.36 0.12±0.11 0.14±0.08 0.09±0.08 0.14±0.08
UCM 0049-0045 15.76±0.23 14.42±0.28 1.47±0.27 1.40±0.25 1.77±0.25 1.78±0.25
UM 323 15.81±0.19 15.17±0.16 0.73±0.09 0.70±0.09 0.73±0.09 0.70±0.09
Mrk 996 15.46±0.09 14.51±0.16 1.00±0.14 1.00±0.14 0.98±0.14 0.98±0.14
UM 133 16.06±0.16 14.97±0.20 1.17±0.15 1.40±0.14 1.16±0.15 1.40±0.14
UM 382 18.17±0.12 18.08±0.30 0.19±0.23 0.14±0.22 0.19±0.23 0.14±0.22
UM 404 18.32±0.19 18.85±0.37 -0.52±0.14 -0.80±0.13 -0.52±0.14 -0.80±0.13
KUG 0207-016A 15.50±0.14 15.14±0.14 0.51±0.13 0.54±0.13 0.51±0.13 0.54±0.13
UM 408 17.50±0.27 16.68±0.14 0.89±0.12 0.87±0.12 0.89±0.12 0.87±0.12
UM 417 17.39±0.22 17.69±0.15 0.14±0.14 0.05±0.14 0.14±0.14 0.05±0.14
Mrk 370 13.93±0.05 12.61±0.13 1.31±0.13 1.31±0.13 1.30±0.13 1.31±0.13
Mrk 600 15.45±0.08 15.17±0.17 0.28±0.15 0.26±0.15 0.28±0.15 0.26±0.15
NGC 1522 14.82±0.03 13.66±0.07 1.13±0.06 1.12±0.06 1.09±0.06 1.07±0.06
NGC 1705 14.08±0.04 12.89±0.07 1.15±0.06 1.17±0.06 1.09±0.06 1.11±0.06
II Zw 33 14.40±0.06 13.77±0.18 0.81±0.11 0.79±0.11 0.82±0.11 0.81±0.11
II Zw 33B 16.91±0.28 15.70±0.69 1.35±0.28 1.33±0.15 1.13±0.14 1.09±0.12
II Zw 40 11.86±0.83 11.02±0.14 0.61±0.10 0.54±0.09 0.61±0.10 0.54±0.09
Tol 0610-387 16.77±0.12 15.63±0.07 1.27±0.09 1.28±0.08 1.20±0.08 1.20±0.08
Mrk 5 15.44±0.13 14.65±0.14 0.88±0.13 0.86±0.13 0.88±0.13 0.86±0.13
Mrk 7 14.15±0.04 13.50±0.19 0.76±0.18 0.73±0.18 0.75±0.18 0.73±0.18
Mrk 86 12.79±0.11 12.19±0.12 1.01±0.14 0.99±0.12 0.96±0.13 0.95±0.12
HS 0822+3542 17.81±0.09 18.19±0.18 -0.38±0.14 -0.51±0.14 -0.36±0.14 -0.50±0.14
UGC 4483 15.26±0.19 14.30±0.23 0.89±0.13 1.00±0.13 0.89±0.13 1.00±0.13
UGC 4703 N1 17.15±0.16 16.37±0.20 0.76±0.06 0.67±0.05 0.80±0.06 0.67±0.05
UGC 4703 N2 17.62±0.17 16.69±0.21 0.91±0.06 0.88±0.05 0.91±0.06 0.88±0.05
Mrk 1416 16.44±0.08 15.90±0.13 0.61±0.04 0.53±0.04 0.61±0.04 0.53±0.04
Mrk 108 15.73±0.13 15.04±0.15 0.68±0.09 0.66±0.08 0.59±0.08 0.48±0.08
Mrk 400 15.57±0.21 14.91±0.19 0.89±0.12 1.07±0.12 0.87±0.12 1.07±0.12
NGC 2915 12.85±0.14 11.53±0.47 1.29±0.15 1.30±0.09 1.20±0.06 1.21±0.06

– 25 –
Table 3—Continued
Object Name BELSB,∞ RE
LSB,∞ (B-R)ELSB (B-R)E,cLSB (B-R)SLSB (B-R)S,c
LSB
(mag) (mag) (mag) (mag) (mag) (mag)
I Zw 18 17.49±0.19 17.79±0.41 -0.15±0.10 -0.76±0.12 0.08±0.14 -0.53±0.14
Mrk 1418 15.29±0.10 13.66±0.21 1.69±0.20 1.78±0.20 1.56±0.20 1.58±0.20
Mrk 1423 15.63±1.59 14.24±0.19 1.45±0.12 1.42±0.11 1.41±0.11 1.41±0.11
SBS 0940+544C 16.92±0.09 16.89±0.12 0.14±0.11 0.03±0.11 0.14±0.11 0.03±0.11
Mrk 709 16.89±0.14 16.02±0.12 0.83±0.05 0.82±0.04 0.80±0.05 0.77±0.04
Mrk 1426 16.62±0.13 16.55±0.19 0.45±0.13 0.46±0.12 0.48±0.12 0.48±0.12
UGCA 184 16.85±0.15 16.58±0.14 0.28±0.12 0.12±0.11 0.21±0.11 0.14±0.11
Mrk 409 14.26±0.18 13.31±0.14 0.99±0.06 0.99±0.06 1.01±0.07 1.00±0.06
Tol 1 16.07±0.12 15.79±0.13 0.36±0.09 0.30±0.09 0.38±0.09 0.30±0.09
Tol 2 15.36±0.06 14.35±0.07 1.03±0.06 1.03±0.06 1.03±0.06 1.03±0.06
NGC 3125 15.00±0.15 13.89±0.12 1.15±0.10 1.09±0.06 1.06±0.06 1.05±0.06
SBS 1006+578 16.71±0.15 15.97±0.16 0.76±0.12 0.75±0.12 0.74±0.12 0.75±0.12
Haro 2 14.76±0.07 13.91±0.12 0.88±0.11 0.87±0.11 0.85±0.11 0.85±0.11
Mrk 1434 17.62±0.28 17.22±0.29 0.66±0.14 0.54±0.14 0.62±0.14 0.48±0.14
Haro 3 14.22±0.09 13.15±0.15 0.91±0.14 0.90±0.14 1.05±0.14 1.06±0.14
SBS 1054+504 16.65±0.14 15.93±0.18 0.76±0.16 0.74±0.15 0.73±0.15 0.73±0.15
Haro 4 16.41±0.34 15.97±0.24 0.35±0.20 0.23±0.19 0.35±0.20 0.23±0.19
VII Zw 403 14.69±0.26 13.93±0.17 0.80±0.18 0.72±0.12 0.79±0.12 0.76±0.11
Mrk 178 14.97±0.08 14.11±0.10 0.89±0.10 0.88±0.10 0.89±0.10 0.88±0.10
UM 439 15.64±0.14 14.78±0.12 0.82±0.07 0.81±0.07 0.79±0.07 0.78±0.07
Mrk 1450 17.62±0.61 16.57±0.51 1.09±0.17 0.99±0.11 1.02±0.10 1.02±0.10
UM 452 16.07±0.18 14.76±0.15 1.32±0.12 1.32±0.12 1.28±0.12 1.28±0.12
SBS 1147+520 18.76±0.43 17.10±0.38 1.34±0.19 1.28±0.10 1.34±0.19 1.28±0.10
Tol 17 16.62±0.13 15.47±0.11 1.18±0.08 1.17±0.08 1.15±0.08 1.12±0.08
UM 455 18.57±0.38 17.34±0.17 1.17±0.05 1.07±0.03 1.17±0.05 1.07±0.03
UM 456 15.29±0.13 14.83±0.09 0.86±0.03 0.84±0.03 0.88±0.04 0.84±0.03
UM 456A 17.20±0.28 17.24±0.34 0.83±0.08 0.75±0.04 0.74±0.04 0.69±0.03
Pox 4 15.38±0.20 15.20±0.16 0.53±0.11 0.52±0.11 0.53±0.11 0.52±0.11
ESO 572-G025 16.17±0.06 15.11±0.05 1.09±0.05 1.08±0.05 1.13±0.05 1.13±0.05
VCC 0001 15.67±0.06 14.51±0.05 1.16±0.03 1.16±0.03 1.17±0.04 1.16±0.03
Mrk 1313 16.91±0.28 16.34±0.17 0.65±0.08 0.62±0.06 0.65±0.08 0.62±0.06
VCC 0130 17.01±0.06 16.19±0.03 0.82±0.05 0.77±0.05 0.82±0.05 0.77±0.05
– 26 –
Table 3—Continued
Object Name BELSB,∞ RE
LSB,∞ (B-R)ELSB (B-R)E,cLSB (B-R)SLSB (B-R)S,c
LSB
(mag) (mag) (mag) (mag) (mag) (mag)
Haro 8 14.54±0.08 13.45±0.14 1.09±0.11 1.09±0.11 1.09±0.11 1.09±0.11
UM 491 16.59±0.30 15.76±0.19 0.91±0.09 0.89±0.08 0.91±0.09 0.89±0.08
ISZ 399 15.12±0.02 13.80±0.06 1.32±0.06 1.32±0.06 1.32±0.06 1.32±0.06
VCC 0459 15.63±0.11 14.61±0.11 1.06±0.05 1.05±0.05 1.06±0.05 1.05±0.05
VCC 0655 13.71±0.07 12.41±0.05 1.29±0.05 1.30±0.05 1.30±0.05 1.30±0.05
Tol 65 17.79±0.27 17.38±0.22 0.44±0.05 0.50±0.05 0.44±0.05 0.50±0.05
VCC 0848 15.46±0.08 14.48±0.05 0.95±0.05 0.94±0.05 0.95±0.05 0.94±0.05
Mrk 209 15.13±0.12 14.47±0.33 0.59±0.15 0.54±0.13 0.56±0.13 0.53±0.13
Mrk 1329 14.52±0.08 13.60±0.10 0.90±0.09 0.90±0.09 0.89±0.09 0.88±0.09
UGCA 290 15.36±0.06 14.88±0.15 0.60±0.14 0.57±0.13 0.62±0.14 0.59±0.13
VCC 1750 17.51±0.12 16.45±0.08 1.08±0.06 1.07±0.06 1.08±0.06 1.08±0.06
Haro 9 13.64±0.05 12.72±0.10 0.95±0.11 0.98±0.11 0.95±0.11 0.98±0.11
NGC 4861 12.89±0.04 12.03±0.09 0.84±0.09 0.76±0.09 0.84±0.09 0.76±0.09
UM 533 15.06±0.10 13.94±0.12 1.10±0.11 1.06±0.11 1.09±0.11 1.06±0.11
Mrk 450 15.21±0.10 14.31±0.12 0.96±0.12 0.95±0.11 0.87±0.11 0.86±0.11
NGC 5058 14.59±0.12 13.87±0.10 0.79±0.08 0.79±0.08 0.78±0.08 0.77±0.08
PGC 046448 16.58±0.13 15.54±0.18 1.18±0.04 1.16±0.03 1.18±0.03 1.18±0.03
Pox 186 19.14±0.20 18.67±0.46 0.79±0.14 0.75±0.09 0.60±0.05 0.49±0.03
Tol 35 14.19±0.09 13.25±0.07 1.03±0.06 1.04±0.06 1.03±0.06 1.03±0.06
SBS 1331+493 14.78±0.09 14.22±0.19 0.95±0.18 0.91±0.17 0.77±0.17 0.78±0.17
Tol 85 16.03±0.21 16.03±0.22 0.56±0.04 0.49±0.03 0.58±0.05 0.50±0.03
Mrk 67 17.44±0.19 16.21±0.22 1.28±0.10 1.21±0.09 1.20±0.09 1.19±0.09
Mrk 1480 17.56±0.25 16.52±0.23 0.99±0.09 0.94±0.08 0.95±0.08 0.94±0.08
Mrk 1481 17.00±0.14 16.00±0.10 1.00±0.08 1.17±0.07 0.97±0.08 1.14±0.07
Tol 1345-420 16.77±0.36 16.29±0.24 0.59±0.10 0.50±0.06 1.02±0.05 0.95±0.05
HS 1400+3927 17.77±0.10 16.48±0.14 1.26±0.12 1.17±0.12 1.23±0.12 1.18±0.12
SBS 1415+437 15.68±0.09 14.99±0.15 0.70±0.13 0.66±0.13 0.72±0.13 0.69±0.13
SBS 1428+457 16.34±0.28 15.45±0.34 0.98±0.11 0.98±0.10 0.98±0.11 0.98±0.10
Tol 1434+032 16.27±0.11 15.87±0.09 0.42±0.08 0.53±0.07 0.41±0.08 0.51±0.07
Mrk 475 16.92±0.10 16.24±0.12 0.91±0.08 0.88±0.08 0.81±0.08 0.79±0.08
HS 1440+4302 18.50±0.20 17.15±0.17 1.38±0.13 1.32±0.12 1.37±0.12 1.34±0.12
HS 1442+4250 15.42±0.07 14.84±0.08 0.66±0.09 0.64±0.09 0.69±0.09 0.67±0.09
– 27 –
Table 3—Continued
Object Name BELSB,∞ RE
LSB,∞ (B-R)ELSB (B-R)E,cLSB (B-R)SLSB (B-R)S,c
LSB
(mag) (mag) (mag) (mag) (mag) (mag)
UCM 1446+2312 15.77±0.14 14.70±0.16 1.10±0.09 1.19±0.09 1.10±0.09 1.19±0.09
Tol 1448+116 17.30±0.38 16.52±0.20 0.87±0.13 0.86±0.12 0.89±0.14 0.88±0.13
II Zw 70 16.57±0.27 15.53±0.19 0.99±0.18 0.94±0.18 0.89±0.18 0.93±0.18
II Zw 71 14.53±0.16 13.78±0.12 0.94±0.19 0.94±0.19 0.94±0.19 0.94±0.19
I Zw 115 15.02±0.11 14.08±0.09 1.04±0.12 1.06±0.12 1.13±0.12 1.13±0.12
SBS 1533+574 16.98±0.23 16.02±0.14 1.09±0.15 1.10±0.14 1.09±0.14 1.10±0.14
I Zw 123 16.75±0.22 15.85±0.15 1.11±0.14 1.11±0.13 1.07±0.13 1.07±0.13
HS 1609+4827 15.50±0.16 14.73±0.13 0.80±0.14 0.79±0.14 0.80±0.14 0.79±0.14
UCM 1612+1308 17.99±0.80 17.58±0.10 0.68±0.23 0.56±0.24 0.79±0.16 0.72±0.16
UGCA 412 16.80±0.16 15.55±0.21 1.24±0.11 1.09±0.10 1.24±0.11 1.09±0.10
HS 1704+4332 18.80±0.42 18.82±0.28 0.40±0.20 0.57±0.09 0.41±0.11 0.40±0.09
NGC 6789 13.94±0.05 12.85±0.09 1.09±0.08 1.13±0.08 1.09±0.08 1.12±0.08
Tol 1924-416 16.20±0.29 14.68±0.14 0.91±0.06 0.89±0.05 0.79±0.05 0.75±0.05
Tol 1937-423 16.97±0.72 15.39±0.25 1.21±0.11 1.21±0.06 1.19±0.07 1.19±0.05
Mrk 900 14.91±0.08 13.97±0.16 0.77±0.13 1.08±0.13 0.81±0.13 1.08±0.13
Mrk 314 14.73±0.12 14.06±0.30 0.64±0.27 0.64±0.26 0.63±0.24 0.62±0.24
Mrk 324 16.12±0.23 15.31±0.23 0.71±0.14 0.71±0.14 0.71±0.14 0.71±0.14
Mrk 328 15.83±0.14 14.87±0.13 0.93±0.11 0.92±0.10 0.92±0.10 0.92±0.10
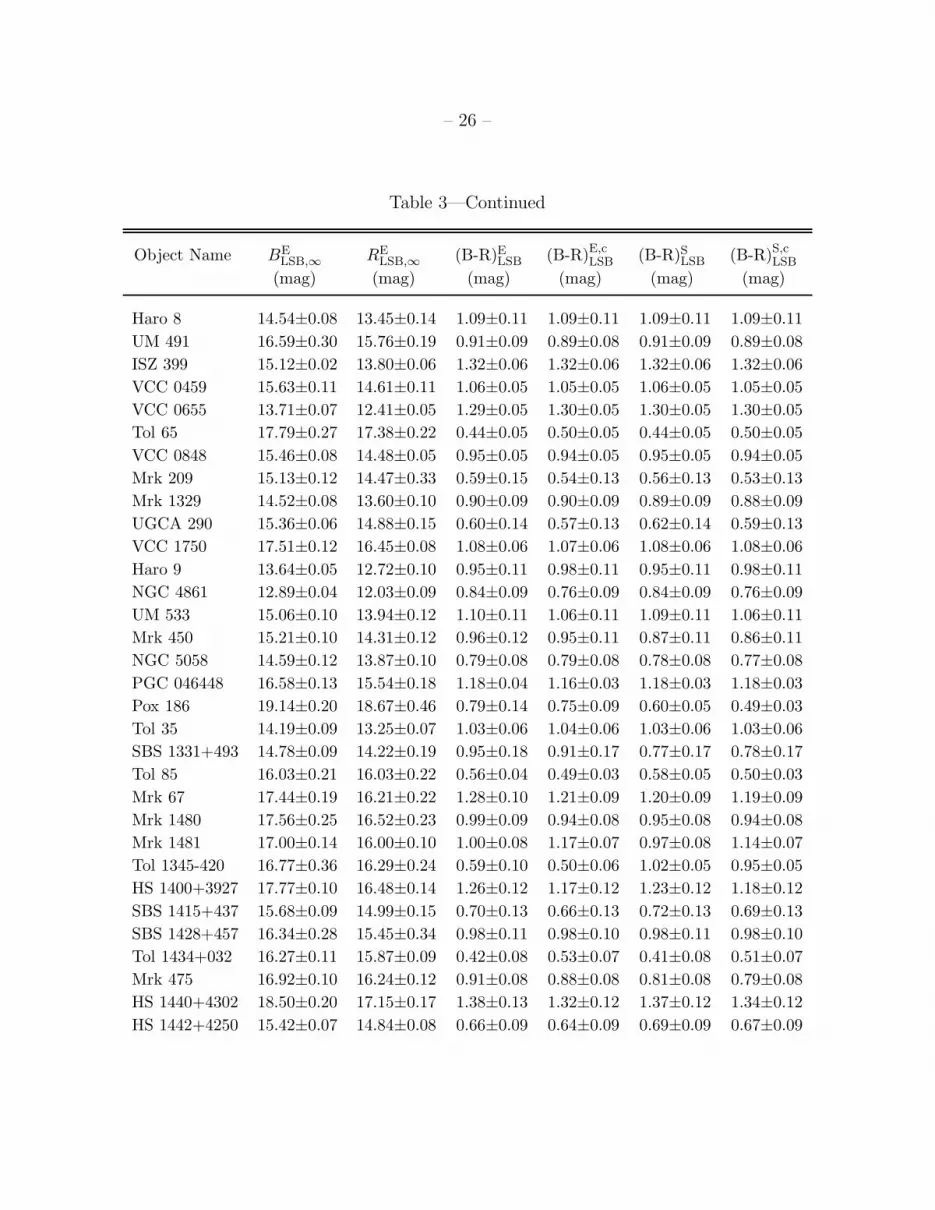
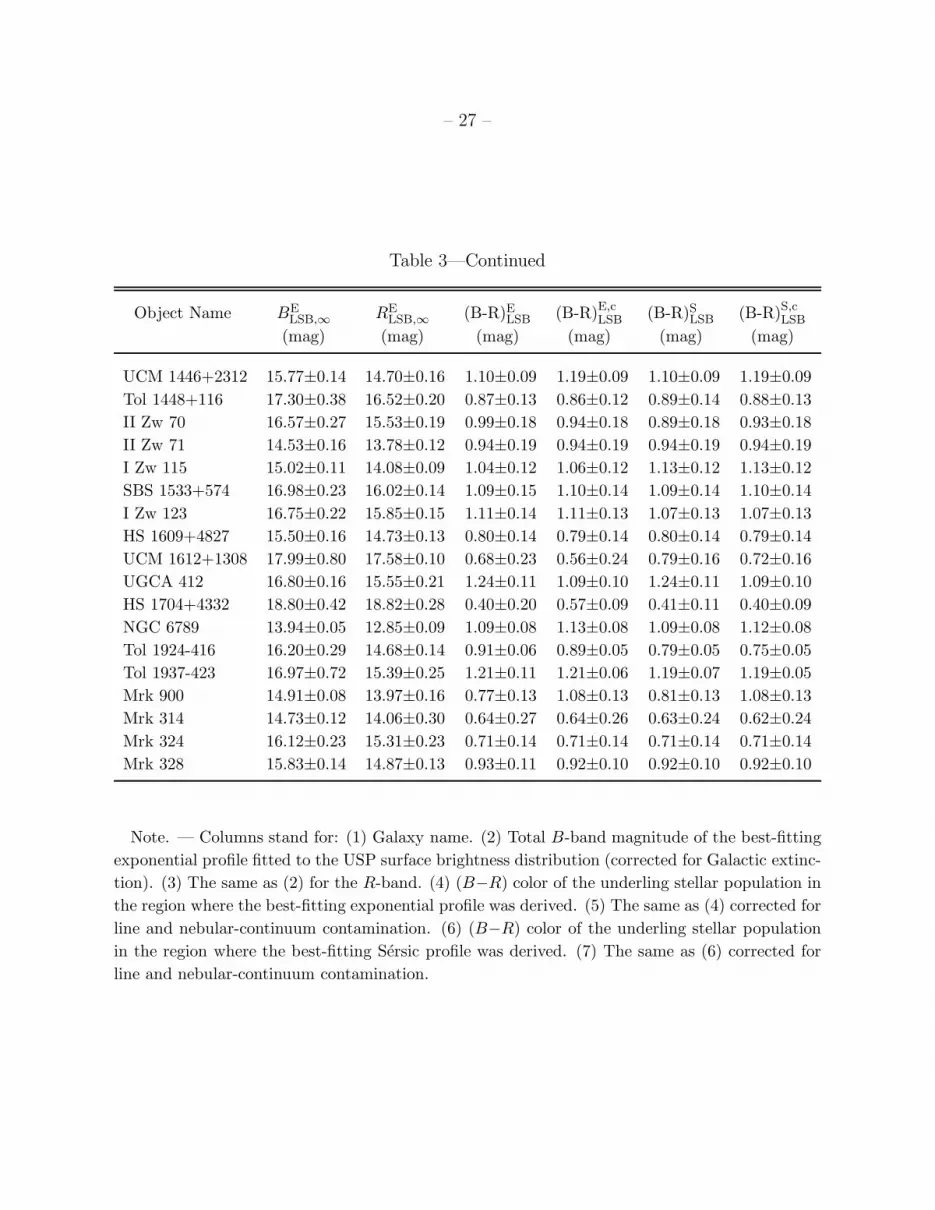
Note. — Columns stand for: (1) Galaxy name. (2) Total B-band magnitude of the best-fitting
exponential profile fitted to the USP surface brightness distribution (corrected for Galactic extinc-
tion). (3) The same as (2) for the R-band. (4) (B−R) color of the underling stellar population in
the region where the best-fitting exponential profile was derived. (5) The same as (4) corrected for
line and nebular-continuum contamination. (6) (B−R) color of the underling stellar population
in the region where the best-fitting Sersic profile was derived. (7) The same as (6) corrected for
line and nebular-continuum contamination.

– 28 –
postscript files of panels f1a-f1o of figure 1 are available online at
http://www.ociw.edu/˜agpaz/astro-ph/apjs2004/
Fig. 1.— Surface brightness and color profiles of the galaxies in the BCD sample. Left
panel: For each galaxy we plot the two surface brightness profiles (along with the 1-σ
errors), one each for the B (asterisks) and R band (filled circles) data. The error bars at
the bottom-left corner of the diagram show the error associated with the flux calibration
of the B (blue) and R-band (red) images. We also plot the best-fitting exponential (solid
blue for the B-band and solid red lines for R) and Sersic (magenta lines for B and orange
for R) profiles of the USP, and the corresponding extrapolation to the center (dashed lines).
The vertical ticks at the bottom of the plot indicate the position outward from which the
surface brightness profile of the USP was fitted. In those galaxies where the inner radius
plotted is smaller than the image HWHM, horizontal ticks at the left side of the plot show
the extension of the B (blue) and R-bands (red) PSF HWHM. Top-right panel: We show
the (B − R) observed (black points) and ionized-gas contamination-corrected (gray points)
color profiles with their corresponding 1-σ errors. The horizontal red (orange) line marks
the average (B − R) color of the USP and the region where the best-fitting exponential
(Sersic) profile was derived. The error bar at the bottom-right corner of this diagram shows
the error in the (B − R) color due to flux calibration uncertainties. Bottom-right panel:
Hα surface brightness profile in cgs units (erg s−1 cm−2 arcsec−2) and their corresponding 1-σ
errors. The green line shows the best-fitting Sersic profile.
– 29 –
Fig. 2.— Histograms of the properties derived from the galaxies surface brightness profiles.
a) Scale length of the best-fitting exponential profile of the USP in the B-band. b) Extrap-
olated central surface brightness of the best-fitting exponential profile in the B-band. c)
Reduced χ2 of the best-fitting exponential profile in the B-band. d,e,f) The same as a,b,c
for the R-band. g) Best-fitting Sersic index for the USP in the B-band. Hatched histograms
represent the best-fitting Sersic indices obtained using the same points in the profile that for
the exponential-law fit. h) The same as g for the R band. i) Comparison between the Sersic
indices obtained using the radial ranges derived from the exponential-law and Sersic-law fits
for the B (asterisks) and R (filled circles) bands. The tick marks shown in panels a,b,d,e
represent the mean and mean±1-σ values of the corresponding distribution.

– 30 –
Fig. 3.— Comparison between the integrated (B − R) color (from Paper I) of the galaxies
and the color of their USP.

– 31 –
Fig. 4.— a) Comparison between the (B −R) color of the USP and its absolute magnitude
computed from the best exponential fit to the surface-brightness profile of the USP. BCD
galaxies in our sample having blue (red) envelopes are represented by filled diamonds (dots)
(see text for more details). Dwarf elliptical (open circles and squares) and dwarf irregular
galaxies (stars) from the literature are also plotted. The solid line represents the color-
magnitude relationship of dwarf elliptical galaxies in the Coma cluster (Secker et al. 1997).
Note that the galaxies from Conselice et al. (2003) (open squares) were classified as dwarf
ellipticals based exclusively on their structural properties. b) Histogram of the (B−R) color
of the USP for “E”-type (filled histogram) and “I”-type (cross-hatched histogram) BCDs in
our sample and the reference sample of dwarf ellipticals (outlined histogram).
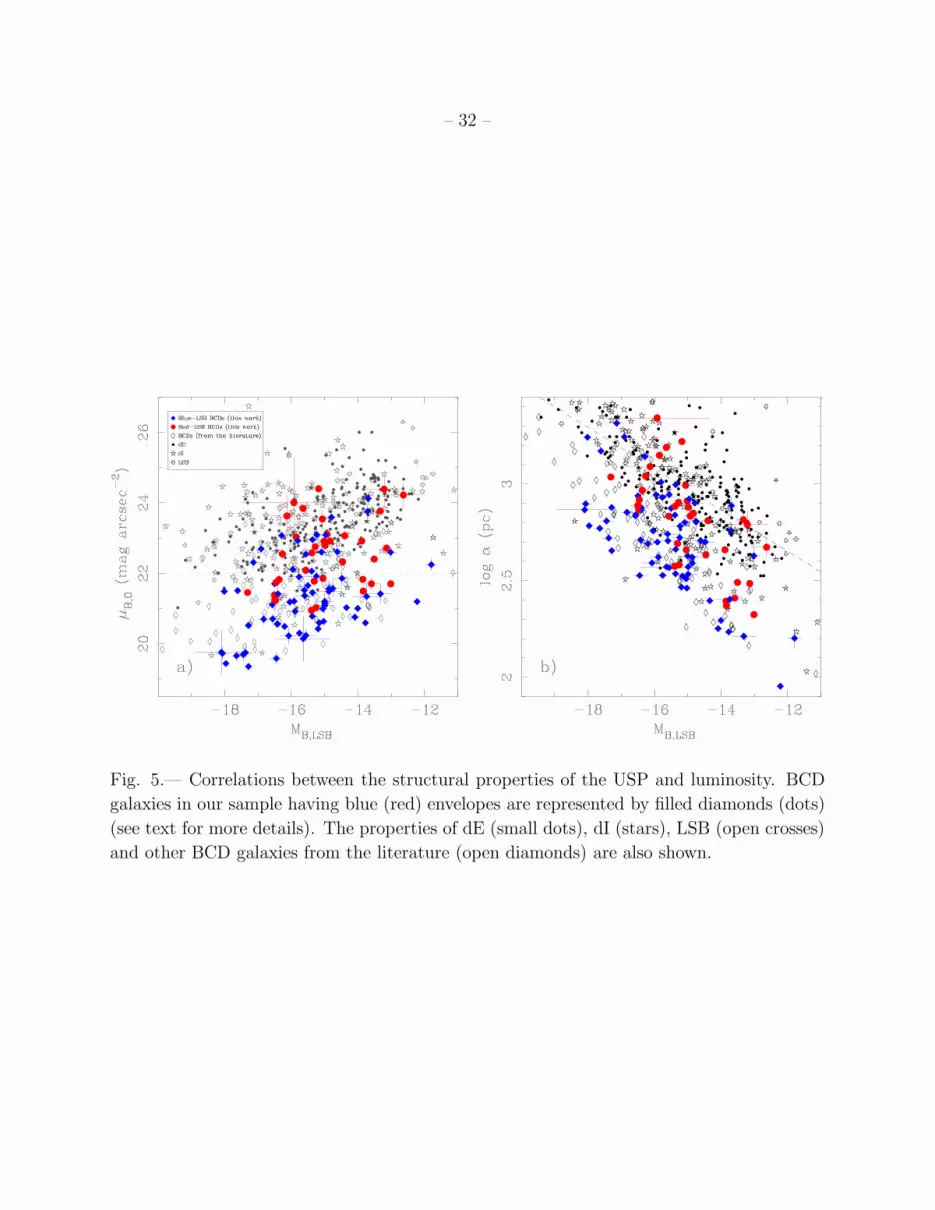
– 32 –
Fig. 5.— Correlations between the structural properties of the USP and luminosity. BCD
galaxies in our sample having blue (red) envelopes are represented by filled diamonds (dots)
(see text for more details). The properties of dE (small dots), dI (stars), LSB (open crosses)
and other BCD galaxies from the literature (open diamonds) are also shown.
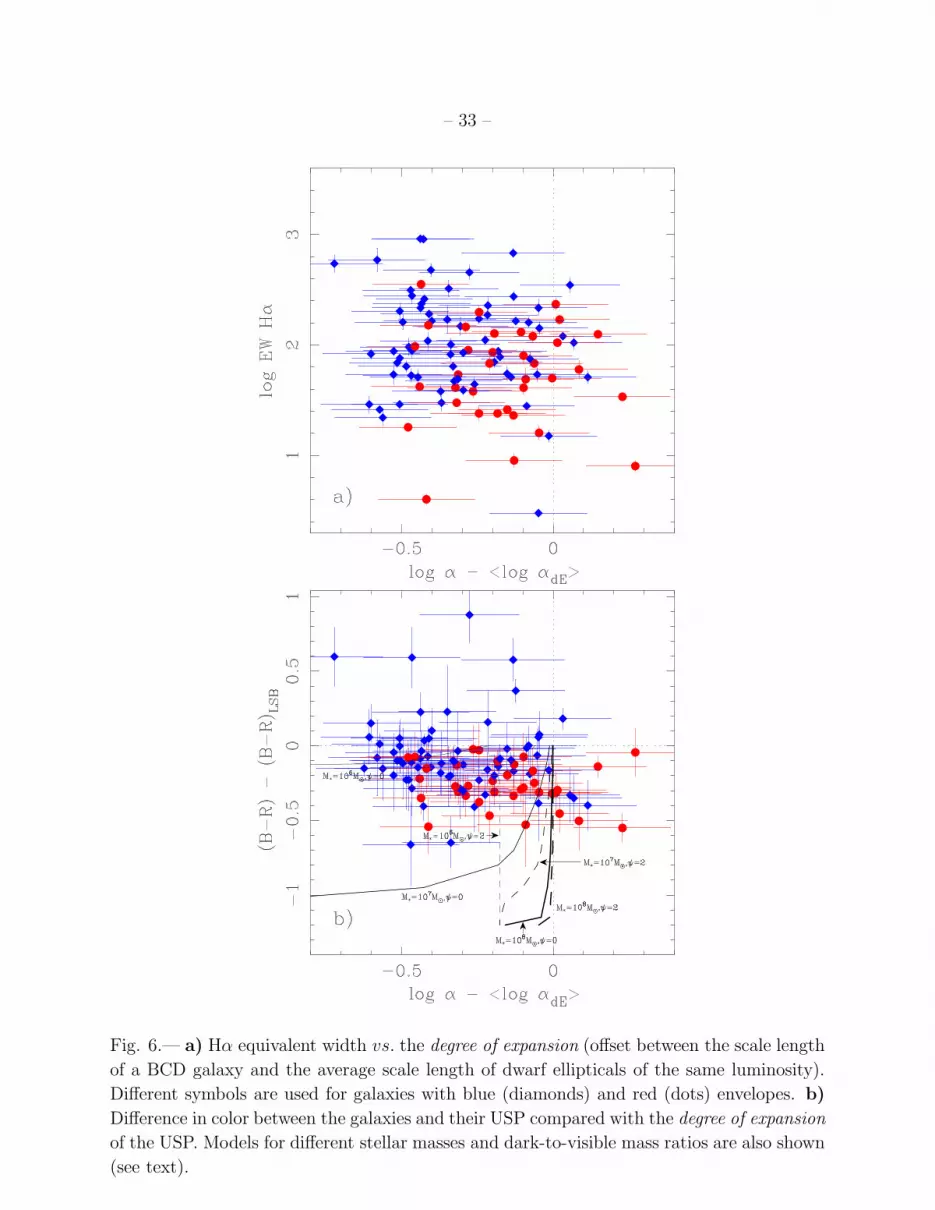
– 33 –
Fig. 6.— a) Hα equivalent width vs. the degree of expansion (offset between the scale length
of a BCD galaxy and the average scale length of dwarf ellipticals of the same luminosity).
Different symbols are used for galaxies with blue (diamonds) and red (dots) envelopes. b)
Difference in color between the galaxies and their USP compared with the degree of expansion
of the USP. Models for different stellar masses and dark-to-visible mass ratios are also shown
(see text).
– 34 –
REFERENCES
Barazza, F.D., Binggeli, B., & Jerjen, H., 2003, A&A 407, 121
Binggeli, B., & Cameron, L.M., 1991, A&A 252, 27
Bruzual, A.G., & Charlot, S., 2003, MNRAS, 344, 1000
Cairos, L.M., Vılchez, J.M., Gonzalez-Perez, J.N., Iglesias-Paramo, J., & Caon, N., 2001a,
ApJS 133, 321
Cairos, L.M., Caon, N., Vılchez, J.M., Gonzalez-Perez, & Munoz-Tunon, C. 2001b, ApJS
136, 393
Cairos, L.M., Caon, N., Papaderos, P., Noeske, K.G., Vılchez, J.M., Garcıa-Lorenzo, B. &
Munoz-Tunon, C., 2003, ApJ 593, 312
Cannon, J.M., Skillman, E.D., Garnett, D.R., Dufour, R.J., 2002, ApJ 565, 931
Conselice, C.J., Gallagher, J.S. III, & Wyse, R.F.G., 2003, AJ 125, 66
Crone, M.M., Schulte-Ladbeck, R.E., Hopp, U., & Greggio, L., 2000, ApJ 545, L31
Crone, M.M., Schulte-Ladbeck, R.E., Greggio, L., & Hopp, U., 2002, ApJ 567, 258
Doublier, V., Comte, G., Petrosian, A., Surace, C., & Turatto, M., 1997, A&AS 124, 405
Doublier, V., Caulet, A., & Comte, G., 1999, A&AS, 138, 213
Drozdovsky, I.O., Schulte-Ladbeck, R.E., Hopp, U., Crone, M.M., & Greggio, L., 2001, ApJ
551, L135
Fanelli, M., O’Connell, R.W., & Thuan, T.X., 1988, ApJ 334, 665
Ferrara, A., & Tolstoy, E., 2000, MNRAS 313, 291
Gil de Paz, A., Zamorano, J., Gallego, J., & Domınguez, F. de B., 2000a, A&AS 145, 377
Gil de Paz, A., Zamorano, J., & Gallego, J., 2000b, A&A 361, 465
Gil de Paz, A., Madore, B.F., & Pevunova, O., 2003, ApJS 147, 29 (Paper I)
Graham, A., & Guzman, R., AJ 125, 2936
Hunter, D.A., & Hoffman, L., 1999, AJ 117, 2789

– 35 –
Jedrzejewski, R.I., 1987, MNRAS 226, 747
Jerjen, H., Binggeli, B., & Freeman, K.C., 2000, AJ 119, 593
Legrand, F., 2000, A&A 354, 504
Leitherer, C., & Heckman, T.M., 1995, ApJS 96, 9
Loose, H.-H., & Thuan, 1986, in Star Forming Dwarf Galaxies and Related Objects, ed. D.
Kunth, T.X. Thuan, & J.T.T. Van (Gif-sur-Yvette: Editions Frontieres), 73
Mac Low, M.-M., & Ferrara, A., 1999, ApJ 513, 142
Noeske, K.G., Guseva, N.G., Fricke, K.J., Izotov, Y.I., Papaderos, P., & Thuan, T.X., 2000,
A&A 361, 33
Noeske, K.G., Papaderos, P., Cairos, L.M., & Fricke, K.J., 2003, A&A 410, 481
Papaderos, P., Loose, H.-H., Thuan, T.X, & Fricke, K.J., 1996a, A&AS 120, 207
Papaderos, P., Loose, H.-H., Fricke, K.J., & Thuan, T.X., 1996b, A&A 314, 59
Papaderos, P., Izotov, Y.I., Frick, K.J., Thuan, T.X., & Guseva, N.G., 1998, A&A 338, 43
Papaderos, P., Izotov, Y.I., Thuan, T.X., Noeske, K.G., Fricke, K.J., Guseva, N.G., & Green,
R.F., 2002, A&A 393, 461
Parodi, B.R., Barazza, F.D., & Binggeli, B., 2002, A&A 388, 29
Schulte-Ladbeck, R.E., Hopp, U., Crone, M.M., & Greggio, L., 1999, ApJ 525, 709
Schulte-Ladbeck, R.E., Hopp, U., Greggio, L., Crone, M.M., & Drozdovsky, I.O., 2001, AJ
121, 3007
Searle, L., Sargent, W.L.W., & Bagnuolo, W.G., 1973, ApJ 179, 427
Secker, J., Harris, W.E., & Plummer, J.D., 1997, PASP 109, 1377
Silk, J., Wyse, R. F. G., & Shields, G. A., 1987, ApJ 322, L59
Tajiri, Y.Y., & Kamaya, H., 2002, A&A 389, 367
Vader, J.P., Vigroux, L., Lachieze-Rey, M., & Souviron, J., 1988, A&A 203, 217
van Zee, L., Salzer, J.J., & Skillman, E.D., 2001, AJ 122, 121
This preprint was prepared with the AAS LATEX macros v5.2.