paleoenvironments, origin, and relative maturity of organic
TRANSCRIPT
Florida International University Florida International University
FIU Digital Commons FIU Digital Commons
FIU Electronic Theses and Dissertations University Graduate School
11-16-2017
Paleoenvironments, origin, and relative maturity of organic matter Paleoenvironments, origin, and relative maturity of organic matter
in Barremian-Aptian limestones of the eastern Prada Quarry, in Barremian-Aptian limestones of the eastern Prada Quarry,
Organyà Basin, NE Spain Organyà Basin, NE Spain
Jose R. Llaguno Florida International University, [email protected]
Follow this and additional works at: https://digitalcommons.fiu.edu/etd
Part of the Physical Sciences and Mathematics Commons
Recommended Citation Recommended Citation Llaguno, Jose R., "Paleoenvironments, origin, and relative maturity of organic matter in Barremian-Aptian limestones of the eastern Prada Quarry, Organyà Basin, NE Spain" (2017). FIU Electronic Theses and Dissertations. 3510. https://digitalcommons.fiu.edu/etd/3510
This work is brought to you for free and open access by the University Graduate School at FIU Digital Commons. It has been accepted for inclusion in FIU Electronic Theses and Dissertations by an authorized administrator of FIU Digital Commons. For more information, please contact [email protected].
FLORIDA INTERNATIONAL UNIVERSITY
Miami, Florida
PALEOENVIRONMENTS, ORIGIN, AND RELATIVE MATURITY OF ORGANIC
MATTER IN BARREMIAN-APTIAN LIMESTONES OF THE EASTERN PRADA
QUARRY, ORGANYÀ BASIN, NE SPAIN
A thesis submitted in partial fulfillment of
the requirements for the degree of
MASTER OF SCIENCE
in
GEOSCIENCES
by
Jose Raul Llaguno
2017
ii
To: Dean Michael R. Heithaus College of Arts, Sciences, and Education
This thesis, written by Jose Raul Llaguno, and entitled Paleoenvironments,Origin, and Relative Maturity of Organic Matter in Barremian-AptianLimestones of the Eastern Prada Quarry, Organyà Basin, NE Spain,having been approved in respect to style and intellectual content, is referredto you for judgment.
We have read this thesis and recommend that it be approved.
_______________________________________ Laurel Collins
_______________________________________ Grenville Draper
_______________________________________ Florentin Maurrasse, Major Professor
Date of Defense: November 16, 2017
The thesis of Jose Raul Llaguno is approved.
_______________________________________ Dean Michael R. Heithaus
College of Arts, Sciences and Education
_______________________________________
Andrés G. Gil Vice President for Research and Economic Development
and Dean of the University Graduate School
Florida International University, 2017
iii
DEDICATION
To Yarina, my dear wife, whose dedication for me and our children made it possible for
me to complete this work, and to our three children, Kevin, Kirsten, and Karen, who are
the most precious gifts from above. To Mimi, for being my rock, and for always
believing in me.
iv
ACKNOWLEDGEMENTS
I would like to express my heartfelt gratitude to my advisor Dr. Florentin J-M. R.
Maurrasse for his unwavering intellectual, moral, and financial support through these past
years. Not only did I benefit immensely from his teachings in geosciences and
recommended readings with his contagious scientific enthusiasm, but his forthright
approach to life has indelibly made an everlasting positive impact in many areas of my life.
It is privilege to be associated with you Dr. Maurrasse.
I am very thankful to Dr. Laurel Collins and Dr. Grenville Draper, my committee
members, for their invaluable observations, corrections, and suggestions whilst developing
this work and for allowing me to use their laboratories. I am very grateful to Dr. Tatiana
Trejos and Dr. Sarah Jantzi for their training in LA-ICPMS processes and data integration
for trace element analyses. My kind thanks to Dr. Cesar Ramirez for his contribution on
producing chromatographs for biomarker analyses. Many thanks to Dr. Peter Swart from
the Rosenstiel School of Marine and Atmospheric Science (RSMAS), University of Miami
laboratory for stable isotope analyses. In addition, I would like to recognize my fellow
student Jander Socorro for his genuine and unconditional support both as a friend and as
colleague. My special thanks to Diane Pirie for her help and efficiency in keeping the
laboratory facilities in working order; to Thomas Beasley for always making himself
available for SEM with EDS microscopy analysis for us.
v
ABSTRACT OF THE THESIS
PALEOENVIRONMENTS, ORIGIN, AND RELATIVE MATURITY OF ORGANIC
MATTER IN BARREMIAN-APTIAN LIMESTONES OF THE EASTERN PRADA
QUARRY, ORGANYÀ BASIN, NE SPAIN
by
Jose Raul Llaguno
Florida International University, 2017
Miami, Florida
Professor Florentin Maurrasse, Major Professor
This study is a multi-proxy analysis of a 30-m section of a Barremian-Aptian
succession of interbedded, grayish black (N2) and black (N1) limestones from a quarry of
the Sierra de Prada. Index taxa include planktic foraminifera Globigerinelloides blowi and
Hedbergella sigali, which combined with δ13C data from Cresmina and Gorgo a Cerbara
sections indicate a late Barremian to early Aptian age. The rocks are organic-rich with 0.67
- 3.10 wt% total organic carbon (TOC). A marlstone interval (~1m) at 2.24 m has a low
bioturbation index (1), TOC ~6.66 wt%, framboidal pyrite, and enrichment spikes of major,
biolimiting, and redox-sensitive trace elements (Al, Si, Ti, P, Fe, and Mo, Cr, Cu, V, Th),
indicating an anoxic episode. Biomarker analyses show a predominance of n-alkanes
(≤nC20) at this level, suggesting an in situ origin of organic matter from phytoplankton.
Pr/Phy ratios below 2 imply that organic matter did not reach overmaturity.
vi
TABLE OF CONTENTS CHAPTER PAGE
I. INTRODUCTION .............................................................................................1 Mid-Cretaceous Global Conditions .......................................................1 Project Objectives and Hypothesis ........................................................2
II. STUDY AREA ..................................................................................................4 Geographic Location ..............................................................................4 Prada Formation .....................................................................................4 Regional Lithostratigraphy ....................................................................5 Outcrop Description ...............................................................................6
III. METHODOLOGY ............................................................................................8 Field Work .............................................................................................8 Petrographic Analysis ............................................................................8 SEM and EDS Analyses ........................................................................8 Total Carbon/Carbonate-TC, TOC, TIC ................................................9 Biomarker Analysis .............................................................................11 Redox Sensitive Trace Elements .........................................................12 Stable Isotopes of δ13Corg and δ15Norg .................................................13
IV. RESULTS ........................................................................................................16 Petrographic Analysis ..........................................................................16 SEM and EDS Analyses ......................................................................17 Total Carbon/Carbonate-TC, TOC, TIC ..............................................18 Biomarker Analysis .............................................................................18 Redox Sensitive Trace Elements .........................................................19 Stable Isotopes of δ13Corg and δ15Norg .................................................20
V. DISCUSSION ..................................................................................................22 Relative Chronology ............................................................................22 Paleoenvironments / Lithofacies ..........................................................24 Chemostratigraphy / Elemental Content ..............................................25 Biomarkers ...........................................................................................26
VI. CONCLUSIONS..............................................................................................28
Recommendations for Future Research ..............................................29 LIST OF REFERENCES ...................................................................................................31 FIGURES ...........................................................................................................................39

vii
PLATES .............................................................................................................................53 APPENDICES ...................................................................................................................73
viii
LIST OF FIGURES
FIGURE PAGE Figure 1. Paleogeographic reconstruction of the Tethyan realm during the mid-Cretaceous at ∼115 Ma. Asterisks mark location of Cresmina, Gorgo a Cerbara, and Prada Quarry sections. Map taken from Burla et al. (2008), originally from Masse et al. (2000).... .........................................................................................................39
Figure 2. Geological map of the Pyrenees including location of Organyà Basin. Modified after Vissers et al., (2016). .................................................................................40
Figure 3. Sierra de Prada: south flank showing position of Prada Quarry. Quarry accessible off the road leading to the municipal skydiving platform (Envol Organyá) on the south flank of the Sierra de Prada overlooking the Cabó River valley. Google Earth images dated 31 Dec. 2008...........................................41
Figure 4. A) Field view of the upper 15 m of the eastern Prada Quarry section showing the beds dipping southward which allowed to easily follow the superposition of the succession along the quarry cut. B) View of sampling interval marked by orange tape shows nature of beds within lower 1m (sediment thickness) ...........................................................................................................................42
Figure 5. A) Stratigraphic column of the lower Cretaceous of the Organyà Basin (modified from García-Senz, 2002), as proposed by Sanchez-Hernandez and Maurrasse, (2014). B) Chronostratigraphic column of the 30 m studied at the Prada Quarry with lithologic characterization. Facies studied in the Prada Quarry section correspond to the mudstone classification of Dunham (1962).. ................43
Figure 6. Image of a silicified lens observed at the 16.45 m level stratigraphic level of the Prada Quarry section (CC-15-45). Hammer for scale (blue handle length 15 cm). ...................................................................................................................44
Figure 7. SEM images of two different specimens of Hedbergella sigali Moullade 1966 obtained from sample CC-15-18. Scale bar 100 microns where not specified.. ..........................................................................................................45
Figure 8. SEM images obtained from thin section of sample CC-15-05 illustrate a significant contribution of disaggregated nannoconids fragments to the matrix. ..............46
ix
Figure 9. SEM/EDS elemental diagrams of analyses performed on thin sections of the Prada Quarry section showing qualitative composition of red square areas of samples: (A) Sample CC-15-04. (B) Sample CC-15-05. (C) Sample CC-15-12 (D) Sample CC-15-18. The texture of the fine matrix and the isotropic distribution of grains are seen in micrographs on backscattered electron mode (BSE)... .....................................................................................................................47
Figure 10. Chemostratigraphy of the Prada Quarry section showing temporal variations in: TIC, TOC, Carbon and Nitrogen isotope values. Light grey bands indicate positive correlation between TOC, Carbon and Nitrogen isotopes versus TIC. Red dashed lines representing background values are plotted for reference .............48 Figure 11. Lithostratigraphy of the Prada Quarry section and chromatographs of molecular biomarkers n-alkane distribution measured in 3 samples corresponding to different levels. Compounds exhibiting carbon chain lengths >20 indicate OM from terrestrial origin incorporated to the basin. Compounds with lengths <20 indicate in situ origin of OM from phytoplankton. ............................................................49
Figure 12. Chemostratigraphic diagram including, major and biolimiting Elements of the Prada Quarry section and their concentrations in ppm (Si in parts per thousand). Red dashed lines included show background levels... ...............................50
Figure 13. Chemostratigraphic diagram including, redox-sensitive trace elements of the Prada Quarry section and their concentrations in ppm. Red dashed lines are plotted to indicate background levels. .....................................................51
Figure 14. Carbon isotope correlation based on data for three sections. From left to right Cresmina section from the North Atlantic (Burla et al., 2003); Prada Quarry section from the Organyà Basin (Tethys) (this study); and, Gorgo a Cerbara section (Tethys) (Stein et al., 2011). Asterisks (3) show common data points at positive shifts in the δ13C curves used for correlation. Segment boundaries (red dashed lines) are established by inflection patterns and/or changing gradients of the carbon isotope curve that show distinct trends allowing approximate correlation ...............................................................52
x
LIST OF PLATES
PLATE PAGE Plate 1. Microphotographs of facies of the Prada Quarry section corresponding to different stratigraphic levels. .........................................................................................53
Plate 2. Microphotographs of slides CC-15-09 and CC-15-38 ..........................................55
Plate 3. SEM images of benthic and planktic foraminifera obtained from sample CC-15-18 ...............................................................................................................57
Plate 4. SEM images of foraminifera obtained from sample CC-15-18 ............................59
Plate 5. SEM images of organisms and biogenic fragments obtained from sample CC-15-18, CC-15-50, and CC-15-63 ....................................................................61
Plate 6. Microphotographs of slides CC-15-49, CC-15-63, CC-15-64, and CC-15-65 .....................................................................................................................63
Plate 7. Microphotographs of slide CC-15-64 ..................................................................65
Plate 8. Microphotographs of slides CC-15-12, CC-15-33, CC-15-39, CC-15-43, and CC-15-50 ...................................................................................................67
Plate 9. SEM images of specimens, biogenic and non-biogenic fragments CC-15-18, CC-15-42, CC-15-58, and CC-15-63 ...............................................................69
Plate 10. Microphotographs of slides CC-15-03, CC-15-05, and CC-15-50 .....................71
1
I. INTRODUCTION
Mid-Cretaceous Global Conditions
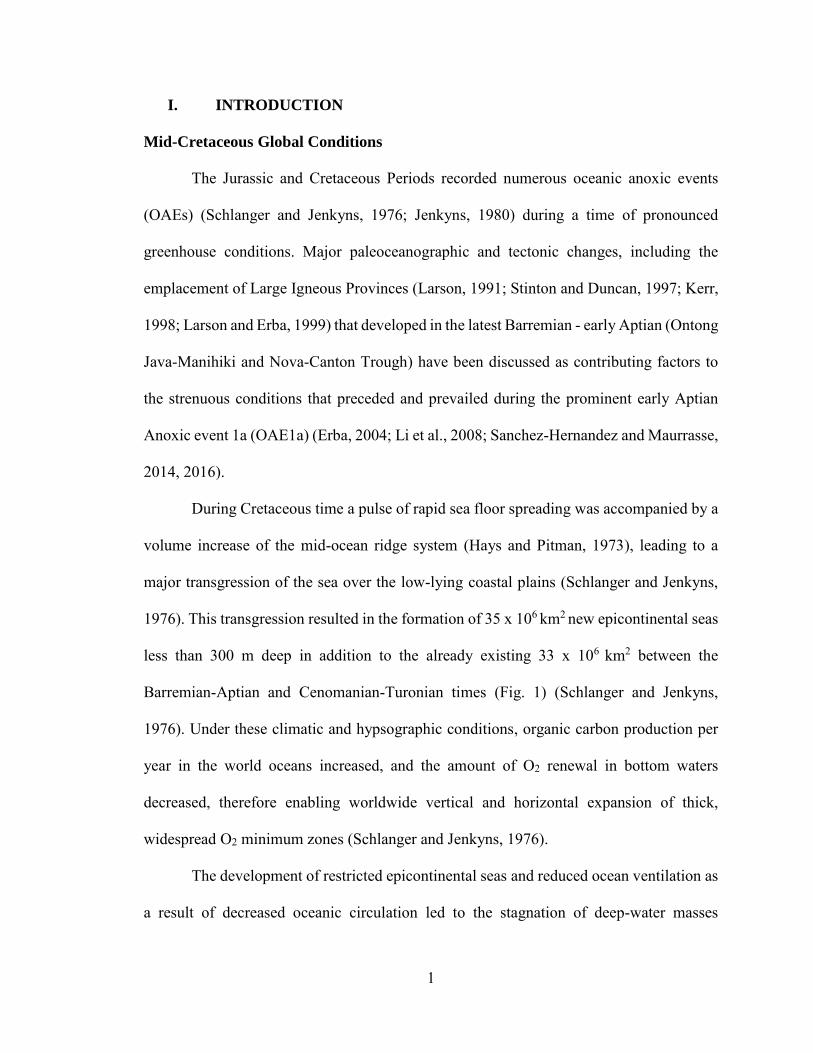
The Jurassic and Cretaceous Periods recorded numerous oceanic anoxic events
(OAEs) (Schlanger and Jenkyns, 1976; Jenkyns, 1980) during a time of pronounced
greenhouse conditions. Major paleoceanographic and tectonic changes, including the
emplacement of Large Igneous Provinces (Larson, 1991; Stinton and Duncan, 1997; Kerr,
1998; Larson and Erba, 1999) that developed in the latest Barremian - early Aptian (Ontong
Java-Manihiki and Nova-Canton Trough) have been discussed as contributing factors to
the strenuous conditions that preceded and prevailed during the prominent early Aptian
Anoxic event 1a (OAE1a) (Erba, 2004; Li et al., 2008; Sanchez-Hernandez and Maurrasse,
2014, 2016).
During Cretaceous time a pulse of rapid sea floor spreading was accompanied by a
volume increase of the mid-ocean ridge system (Hays and Pitman, 1973), leading to a
major transgression of the sea over the low-lying coastal plains (Schlanger and Jenkyns,
1976). This transgression resulted in the formation of 35 x 106 km2 new epicontinental seas
less than 300 m deep in addition to the already existing 33 x 106 km2 between the
Barremian-Aptian and Cenomanian-Turonian times (Fig. 1) (Schlanger and Jenkyns,
1976). Under these climatic and hypsographic conditions, organic carbon production per
year in the world oceans increased, and the amount of O2 renewal in bottom waters
decreased, therefore enabling worldwide vertical and horizontal expansion of thick,
widespread O2 minimum zones (Schlanger and Jenkyns, 1976).
The development of restricted epicontinental seas and reduced ocean ventilation as
a result of decreased oceanic circulation led to the stagnation of deep-water masses
2
(Bralower et al., 1994; Sanchez-Hernandez and Maurrasse, 2014) thus resulting in unique
oxygen-depleted conditions that produced widespread distribution of organic-rich
sediments.
An extensive literature exists on the early Aptian Anoxic event 1a (OAE1a) event,
but the paleoenvironmental transition between prevailing conditions in the latest Barremian
to the early Aptian (Mutterlose and Böckel, 1998; Godet et al., 2008; Mutterlose et al.,
2009; Stein et al., 2011, 2012; Pauly et al., 2013, Sanchez-Hernandez and Maurrasse, 2014)
remain to be further investigated. Hence, the mechanisms associated with this transition,
including environmental and biological responses to changing conditions preceding
OAE1a, are the subject of the present study.
Project Objectives and Hypothesis
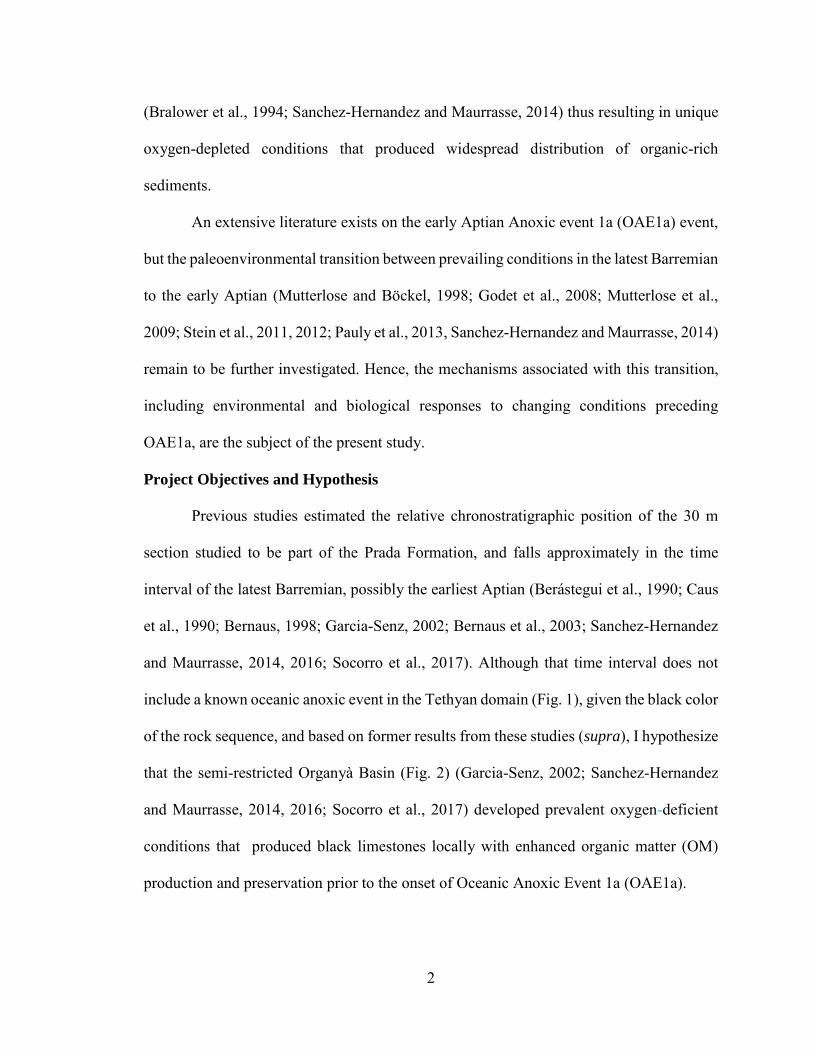
Previous studies estimated the relative chronostratigraphic position of the 30 m
section studied to be part of the Prada Formation, and falls approximately in the time
interval of the latest Barremian, possibly the earliest Aptian (Berástegui et al., 1990; Caus
et al., 1990; Bernaus, 1998; Garcia-Senz, 2002; Bernaus et al., 2003; Sanchez-Hernandez
and Maurrasse, 2014, 2016; Socorro et al., 2017). Although that time interval does not
include a known oceanic anoxic event in the Tethyan domain (Fig. 1), given the black color
of the rock sequence, and based on former results from these studies (supra), I hypothesize
that the semi-restricted Organyà Basin (Fig. 2) (Garcia-Senz, 2002; Sanchez-Hernandez
and Maurrasse, 2014, 2016; Socorro et al., 2017) developed prevalent oxygen-deficient
conditions that produced black limestones locally with enhanced organic matter (OM)
production and preservation prior to the onset of Oceanic Anoxic Event 1a (OAE1a).
3
The objective of this study is to use multiple proxies, including detailed
petrographic analysis, total inorganic carbon (TIC), total organic carbon (TOC), stable
isotopes, redox sensitive trace elements (RSTEs), and biomarkers to provide supporting
evidence to characterize the sedimentological and geochemical record in the sequence at
that time. The results will permit a better understanding of the temporal depositional
evolution of this interval of the Organyà Basin deposits, and further shed light on the
conditions preceding the Aptian Anoxic event 1a (OAE1a) in the basin.
4
II. STUDY AREA
Geographic Location
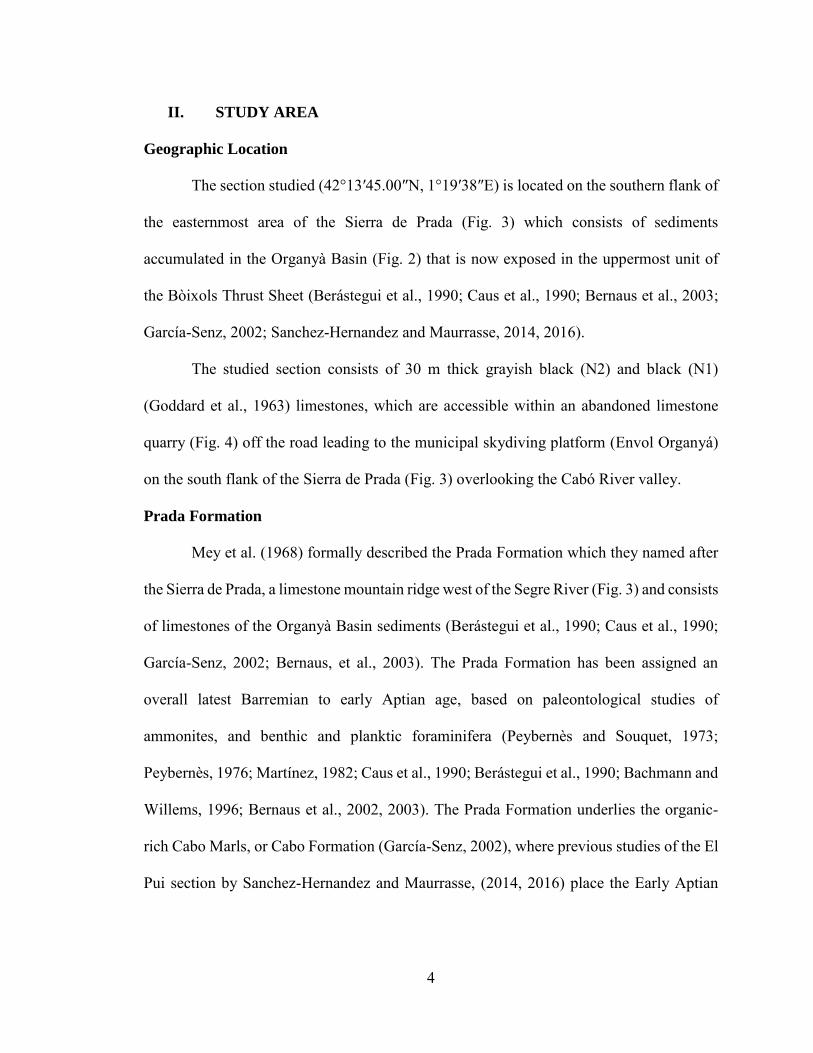
The section studied (42°13′45.00″N, 1°19′38″E) is located on the southern flank of
the easternmost area of the Sierra de Prada (Fig. 3) which consists of sediments
accumulated in the Organyà Basin (Fig. 2) that is now exposed in the uppermost unit of
the Bòixols Thrust Sheet (Berástegui et al., 1990; Caus et al., 1990; Bernaus et al., 2003;
García-Senz, 2002; Sanchez-Hernandez and Maurrasse, 2014, 2016).
The studied section consists of 30 m thick grayish black (N2) and black (N1)
(Goddard et al., 1963) limestones, which are accessible within an abandoned limestone
quarry (Fig. 4) off the road leading to the municipal skydiving platform (Envol Organyá)
on the south flank of the Sierra de Prada (Fig. 3) overlooking the Cabó River valley.
Prada Formation
Mey et al. (1968) formally described the Prada Formation which they named after
the Sierra de Prada, a limestone mountain ridge west of the Segre River (Fig. 3) and consists
of limestones of the Organyà Basin sediments (Berástegui et al., 1990; Caus et al., 1990;
García-Senz, 2002; Bernaus, et al., 2003). The Prada Formation has been assigned an
overall latest Barremian to early Aptian age, based on paleontological studies of
ammonites, and benthic and planktic foraminifera (Peybernès and Souquet, 1973;
Peybernès, 1976; Martínez, 1982; Caus et al., 1990; Berástegui et al., 1990; Bachmann and
Willems, 1996; Bernaus et al., 2002, 2003). The Prada Formation underlies the organic-
rich Cabo Marls, or Cabo Formation (García-Senz, 2002), where previous studies of the El
Pui section by Sanchez-Hernandez and Maurrasse, (2014, 2016) place the Early Aptian
5
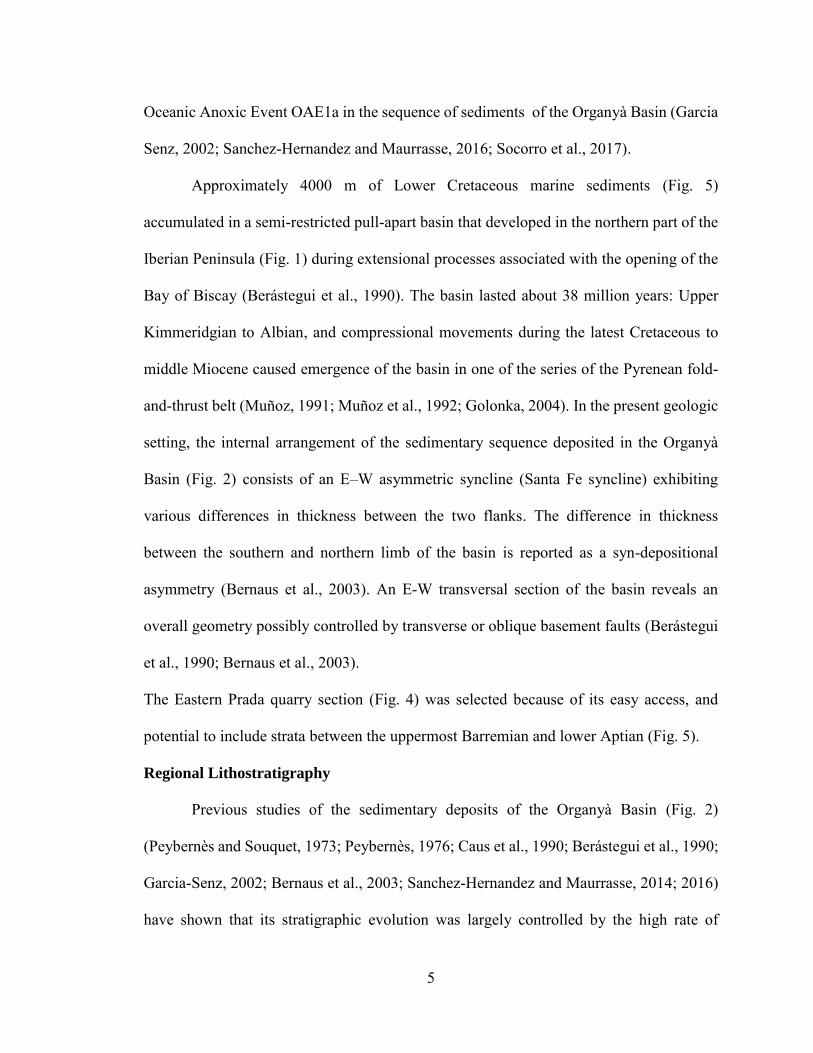
Oceanic Anoxic Event OAE1a in the sequence of sediments of the Organyà Basin (Garcia
Senz, 2002; Sanchez-Hernandez and Maurrasse, 2016; Socorro et al., 2017).
Approximately 4000 m of Lower Cretaceous marine sediments (Fig. 5)
accumulated in a semi-restricted pull-apart basin that developed in the northern part of the
Iberian Peninsula (Fig. 1) during extensional processes associated with the opening of the
Bay of Biscay (Berástegui et al., 1990). The basin lasted about 38 million years: Upper
Kimmeridgian to Albian, and compressional movements during the latest Cretaceous to
middle Miocene caused emergence of the basin in one of the series of the Pyrenean fold-
and-thrust belt (Muñoz, 1991; Muñoz et al., 1992; Golonka, 2004). In the present geologic
setting, the internal arrangement of the sedimentary sequence deposited in the Organyà
Basin (Fig. 2) consists of an E–W asymmetric syncline (Santa Fe syncline) exhibiting
various differences in thickness between the two flanks. The difference in thickness
between the southern and northern limb of the basin is reported as a syn-depositional
asymmetry (Bernaus et al., 2003). An E-W transversal section of the basin reveals an
overall geometry possibly controlled by transverse or oblique basement faults (Berástegui
et al., 1990; Bernaus et al., 2003).
The Eastern Prada quarry section (Fig. 4) was selected because of its easy access, and
potential to include strata between the uppermost Barremian and lower Aptian (Fig. 5).
Regional Lithostratigraphy
Previous studies of the sedimentary deposits of the Organyà Basin (Fig. 2)
(Peybernès and Souquet, 1973; Peybernès, 1976; Caus et al., 1990; Berástegui et al., 1990;
Garcia-Senz, 2002; Bernaus et al., 2003; Sanchez-Hernandez and Maurrasse, 2014; 2016)
have shown that its stratigraphic evolution was largely controlled by the high rate of
6
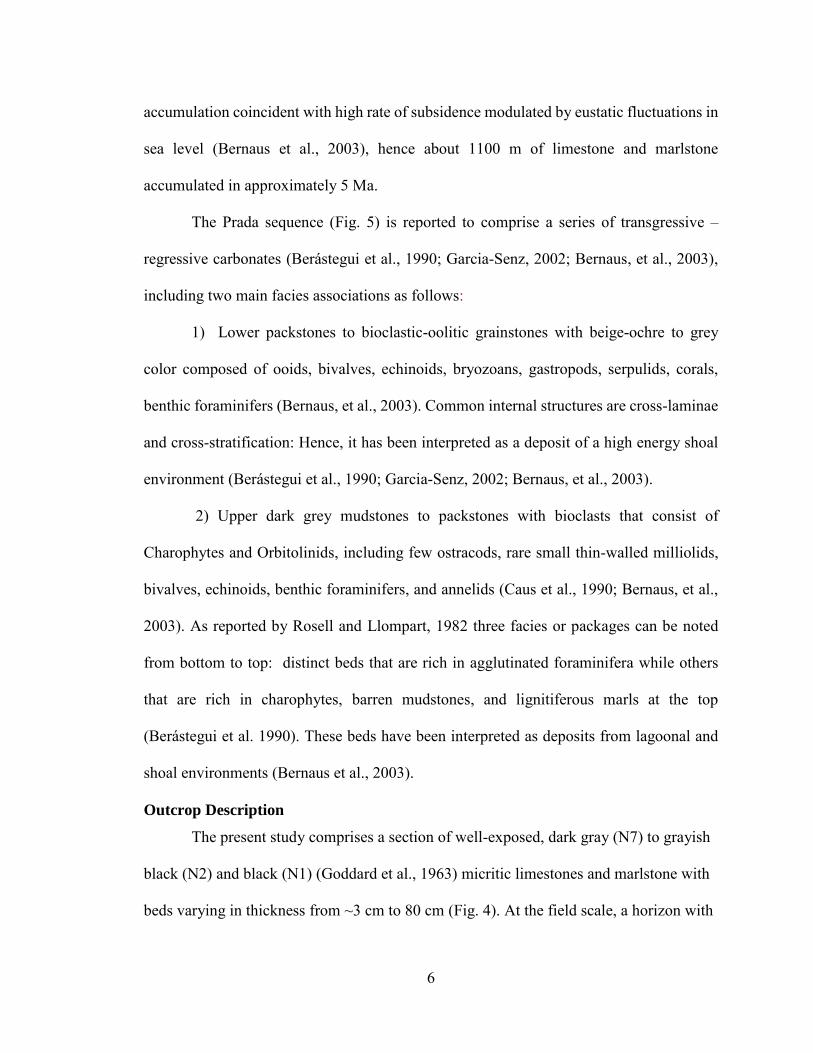
accumulation coincident with high rate of subsidence modulated by eustatic fluctuations in
sea level (Bernaus et al., 2003), hence about 1100 m of limestone and marlstone
accumulated in approximately 5 Ma.
The Prada sequence (Fig. 5) is reported to comprise a series of transgressive –
regressive carbonates (Berástegui et al., 1990; Garcia-Senz, 2002; Bernaus, et al., 2003),
including two main facies associations as follows:
1) Lower packstones to bioclastic-oolitic grainstones with beige-ochre to grey
color composed of ooids, bivalves, echinoids, bryozoans, gastropods, serpulids, corals,
benthic foraminifers (Bernaus, et al., 2003). Common internal structures are cross-laminae
and cross-stratification: Hence, it has been interpreted as a deposit of a high energy shoal
environment (Berástegui et al., 1990; Garcia-Senz, 2002; Bernaus, et al., 2003).
2) Upper dark grey mudstones to packstones with bioclasts that consist of
Charophytes and Orbitolinids, including few ostracods, rare small thin-walled milliolids,
bivalves, echinoids, benthic foraminifers, and annelids (Caus et al., 1990; Bernaus, et al.,
2003). As reported by Rosell and Llompart, 1982 three facies or packages can be noted
from bottom to top: distinct beds that are rich in agglutinated foraminifera while others
that are rich in charophytes, barren mudstones, and lignitiferous marls at the top
(Berástegui et al. 1990). These beds have been interpreted as deposits from lagoonal and
shoal environments (Bernaus et al., 2003).
Outcrop Description
The present study comprises a section of well-exposed, dark gray (N7) to grayish
black (N2) and black (N1) (Goddard et al., 1963) micritic limestones and marlstone with
beds varying in thickness from ~3 cm to 80 cm (Fig. 4). At the field scale, a horizon with

7
silicified lenses is observed at the 16.45 m level (Fig. 6). The homoclinal structure
showing the beds dipping southward allowed to easily follow the superposition of the
succession along the quarry cut approximately perpendicular to the fold axis.
8
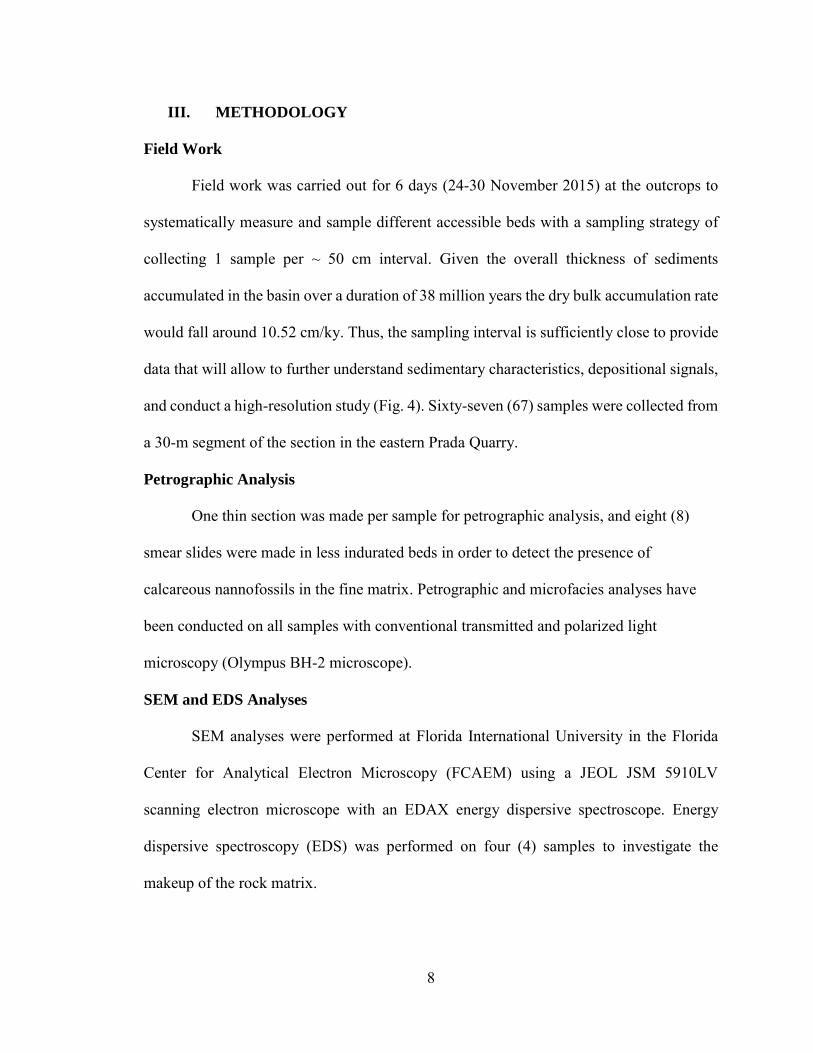
III. METHODOLOGY
Field Work
Field work was carried out for 6 days (24-30 November 2015) at the outcrops to
systematically measure and sample different accessible beds with a sampling strategy of
collecting 1 sample per ~ 50 cm interval. Given the overall thickness of sediments
accumulated in the basin over a duration of 38 million years the dry bulk accumulation rate
would fall around 10.52 cm/ky. Thus, the sampling interval is sufficiently close to provide
data that will allow to further understand sedimentary characteristics, depositional signals,
and conduct a high-resolution study (Fig. 4). Sixty-seven (67) samples were collected from
a 30-m segment of the section in the eastern Prada Quarry.
Petrographic Analysis
One thin section was made per sample for petrographic analysis, and eight (8)
smear slides were made in less indurated beds in order to detect the presence of
calcareous nannofossils in the fine matrix. Petrographic and microfacies analyses have
been conducted on all samples with conventional transmitted and polarized light
microscopy (Olympus BH-2 microscope).
SEM and EDS Analyses
SEM analyses were performed at Florida International University in the Florida
Center for Analytical Electron Microscopy (FCAEM) using a JEOL JSM 5910LV
scanning electron microscope with an EDAX energy dispersive spectroscope. Energy
dispersive spectroscopy (EDS) was performed on four (4) samples to investigate the
makeup of the rock matrix.
9
Sample preparation for the analyses included carbon coating to (150 Å) thickness,
and processing in Compo mode under backscattered electron imaging detection (BSE).
Areas of the slide targeted for investigation were first determined and inspected in
secondary electron imaging (SEI), and later switched to backscatter (BSE) mode for
qualitative elemental analysis. Specimens and bioclasts for SEM examination and imaging
were coated using a Gold/Palladium target with purpose of reducing surface charging while
improving conductivity.
Total Carbon/Carbonate - TC, TOC, TIC
Weight percent total inorganic and organic carbon contents (percentages) were
measured in 67 samples at Florida International University (FIU) by means of loss on
ignition (LOI). All LOI analyses were carried out in a Barnstead Thermolyne® muffle
furnace F62700 with digital temperature display and controlled by a microprocessor with
a type K Chromel/Alumel Thermocouple®. Care was taken that no particles and humidity
persisted in samples before weighing. Therefore, before any measurement was made empty
crucibles were washed with Alconox® and rinsed with tap water, then submerged overnight
in a 10% HCL solution and rinsed 4 times with deionized water. Afterwards, the empty
crucibles were heated in the muffle oven for 1h at 560 °C and placed in a desiccator
overnight. Wet sediment was oven-dried at 105 °C overnight and all samples were cooled
to room temperature and immediately placed in a desiccator.
The LOI method is based on sequential heating of the samples in a muffle furnace as
proposed by Heiri et al., 1999. The powdered sediment sample (0.3g) was first oven-dried
for ~18h to constant weight at around 105 °C; then organic matter was combusted in an
10
initial step to ash and carbon dioxide at a temperature of 550 °C for 2 hours. The LOI was
then calculated using the following equation (1):
(1) LOI550 = ((DW105–DW550)/DW105)*100
LOI550 represents LOI at 550 °C (as %), DW105 represents the dry weight (g) of the
sample before combustion and DW550 the dry weight (g) of the sample after heating to 550
°C. The weight loss should then be proportional to the amount of organic carbon contained
in the sample (Dean, 1974).
The second step entailed exposure at 950 °C for 2 hours, where carbon dioxide diffuses
from calcium carbonate, leaving calcium oxide. The LOI was calculated using equation (2)
as:
(2) LOI950 = ((DW550–DW950)/DW105)*100
where LOI950 is the LOI at 950 °C (as a percentage), DW550 is the dry weight of the sample
after combustion of organic matter at 550 °C, DW950 represents the dry weight of the
sample after heating to 950 °C, and DW105 is the initial dry weight of the sample before the
organic carbon combustion (all in grams).
Assuming a weight of 44 g mol–1 for carbon dioxide and 100 g mol–1 for calcium
carbonate (CaCO3) ratio (100/44 = 2.27), the weight loss by LOI at 950 °C multiplied by
2.27 should then theoretically equal the weight of the calcium carbonate in the original
sample (Bengtsson & Enell, 1986).
For this study, LOI temperatures implemented were close to those proposed by
Dean (1974) and Bengtsson & Enell (1986), i.e. 550 °C for organic matter and 950 °C for
calcium carbonate as proposed by Heiri et al., 1999.
11
TIC/TOC are expressed as CaCO3 and C-wt% respectively of bulk sediment. TIC
values are used to assign a lithologic classification based on the nomenclature adopted in
our sedimentary laboratory (Gaona-Narvaez et al., 2013a, 2013b; Sanchez-Hernandez and
Maurrasse, 2014, 2016, Socorro et al., 2017). Hence, the relative percentage of total
measured CaCO3 (TIC) indicates: limestone, ≤65% CaCO3; marlstone, 30–60% (Sanchez-
Hernandez and Maurrasse, 2014).
Biomarker Analysis
Biomarkers (n-alkanes) were analyzed from 28 samples following the analytical
technique of our laboratory facility (Socorro et al., 2017), which is a modified version of
the method used mainly onboard research drilling vessels of the International Ocean
Discovery Program (IODP). Based on personal communications with Socorro (March
2015) great care was taken to follow strict protocol of the modified procedures. The steps
involved in lipid extraction and separation included first washing all glassware with tap
water and soap, and then they were washed three times with deionized water. Lastly, they
were placed in a Barnstead Thermolyne® muffle furnace F62700 for 2 h at 560 °C to ensure
that all organic matter was removed.
For the analysis, approximately one cubic centimeter of sample was oven dried
overnight at 50oC, then grounded with a Bell-Art micromill to powder and homogenized
later with a mortar and pestle. Five grams of homogenized powdered sample was used in
a 12 dram vial that was sonicated twice for 30 min after including a 10 ml mixture of (1:9)
methanol (MeOH)/dichloromethane (DCM). After the supernatant was removed it was
allowed to rest in a 4 dram vial with activated copper that was used to remove undesired
elemental sulfur. Continued step by step protocol as per Socorro et al., (2017) ensured that
12
the fraction containing the hydrocarbons (n-alkanes) was made available for GC/MS
analysis At FIU’s Chemistry Department Laboratory by a GC (Agilent 6890) employing
method 1506GE02.M. An Agilent 5973 single-quadrupole mass spectrometer was
operated in positive mode for detection in a scan range from m/z 42 to m/z 500.
Redox Sensitive Trace Elements
Laser Ablation-Inductively Coupled Plasma Mass Spectrometry (LA-ICP-MS) was
used to determine concentrations of major and trace elements. ICP-MS analyses were
performed at the Florida International University Forensic Center using an ELAN DRC II
quadrupole (Perkin Elmer LAS, Shelton CT USA), in standard mode.
Best ablation results, previously evaluated as the best precision and accuracy for
reference standards were obtained using a depth profile ablation mode with a 200 μm spot
size and 10 Hz with a 266 nm Nd–YAG laser (LSX 500, CETAC, USA) (Sanchez-
Hernandez and Maurrasse, 2014). As reported by these authors, for control samples, two
sand blanks of previously known makeup were prepared using the same methodology and
conditions as for the 31 samples. Blanks and standards were included at the beginning and
end of the sample queue. Glitter software was used for data processing.
Thirty-one (31) samples were analyzed for major and redox sensitive trace elements
(RSTEs) using the methodology of Arroyo et al. (2009), and the procedures described in
Sanchez-Hernandez and Maurrasse (2014). The samples analyzed were selected from areas
of the beds with no visible evidence of weathering, and processed as described for TC
preparation for this study. The present study used powdered samples weighted 1.0 g,
included with a scandium solution (1000 ppm in 3% HNO3) as an internal standard. They
13
were dried overnight at 80 °C, homogenized with a ball-mill for 15 min, and a manual press
was used to convert the samples into pellets.
The study reports the concentrations of trace elements Ni, V, Cr, Cu, Mo, U, Th,
and Co, major elements such as Al, Si and Ti, and biolimiting elements P, and Fe.
Concentrations of these major, biolimiting and trace elements assist in the estimation of
nutrient availability, intensity of terrestrial fluxes, and the extent of authigenic enrichment
as a proxy for redox conditions (Wignall and Myers, 1988; Calvert and Pedersen, 1993;
Morford and Emerson, 1999; Algeo and Maynard, 2004; Rimmer, 2004; Tribovillard et
al., 2005). Relative temporal changes are compared to a background level taken as the
average of all values in the studied section following the methodology of Stein et al.,
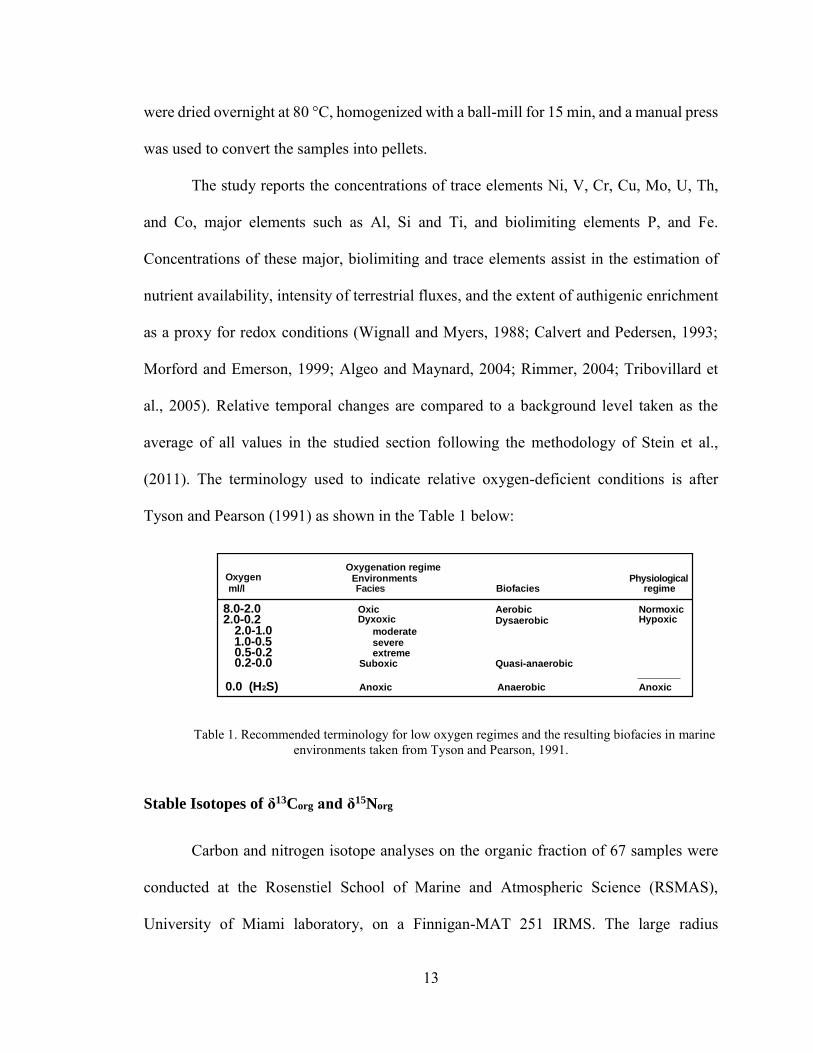
(2011). The terminology used to indicate relative oxygen-deficient conditions is after
Tyson and Pearson (1991) as shown in the Table 1 below:
Table 1. Recommended terminology for low oxygen regimes and the resulting biofacies in marine environments taken from Tyson and Pearson, 1991.
Stable Isotopes of δ13Corg and δ15Norg
Carbon and nitrogen isotope analyses on the organic fraction of 67 samples were
conducted at the Rosenstiel School of Marine and Atmospheric Science (RSMAS),
University of Miami laboratory, on a Finnigan-MAT 251 IRMS. The large radius
Oxygenml/l Facies Biofacies
Physiologicalregime
Oxygenation regimeEnvironments
8.0-2.02.0-0.2
2.0-1.01.0-0.50.5-0.20.2-0.0
0.0 (H2S)
OxicDyxoxic
moderatesevereextreme
Suboxic
Anoxic
AerobicDysaerobic
Quasi-anaerobic
Anaerobic
NormoxicHypoxic
Anoxic
14
instrument is equipped with microsample inlet, 5 fixed collectors, and an automated sample
inlet and multi-port with a Fairbanks automatic carbonate device with an upgraded Apple
IIE computer system.
The analytical technique uses 0.1-1.0 mg samples of powdered dry rock. The
homogenized rock samples required initial dissolution of the inorganic carbon (CaCO3) in
a 1M HCl solution. Isotopic data are corrected using the procedures of Craig (1957)
modified for a triple collector mass spectrometer. Data are quoted relative to Vienna Pee
Dee Belemnite (VPDB) according to the conventional notation. The analytical error is
approximately 0.1‰.
Carbon and nitrogen are essential elements for marine primary production
(Marchitto, 2007), and during photosynthesis phytoplankton preferentially incorporates the
lighter isotopes C12 and N14 by means of kinetic fractionation. Thus, increased productivity
leads to δ13C and δ15N enrichments of their original pools (either regional or local
depending on whether or not the basin is restricted or open). Hence, higher values of these
isotopes provide useful insight into major biogeochemical processes in the
paleoenvironments of the sedimentary basin that can be correlated on a regional scale (Hou
et al., 2013).
Differential fractionation between diverse photosynthesizers thus leave δ13C
records that yield valuable understanding of temporal changes in paleoenvironmental
conditions (e.g. Godet et al., 2006), the origin of organic matter (OM), the degree of
primary productivity, and extent of organic carbon maturity. Because nitrogen is one of the
limiting nutrients in the open ocean, δ15N records are used in determining the degree of
15
nitrate (NO3) utilization, which is employed as a paleoproductivity indicator (Altabet and
Francois, 1994; Marchitto, 2007).
In the present study, the chemostratigraphic record of stable carbon isotopes aids in
establishing an approximate chronological position for my section by correlating with other
Tethyan sections where the chemostratigraphic data is generally accepted (e.g., Godet et
al., 2006; Menegatti et al., 1998).
16
IV. RESULTS
Petrographic Analysis
Thin section study of sixty-seven (67) samples of the 30-m section (Fig. 5) shows
facies changes (Pl. 1) as follows: in the lower 4.16 m the sequence of organic-rich (<6.66%
TOC) limestones reveals millimeter-scale laminated micrite with low bioturbation index
(0-3) (Taylor and Goldring, 1993) and less than 20% allochems (Folk, 1962) that consist
of minute, skeletal fragments from various organisms (Pl. 2. A, B, C, D, E). They consist
of echinoderms, sponge spicules, ostracods, small bivalves, textularids (~200 µm) and
miliolids benthic foraminifers (~100 µm), ammonite fragments, radiolarian (~100 µm),
gastropods (~800 µm) and planktic foraminifers (~ 100 µm) (Pl. 3)
The lower part of the section includes a black marlstone bed (~1m thick) with low
bioturbation index (1), and allochems include planktic foraminifers of the G.blowi Zone
(Figs. 5.B, 7) (Pl. 3. A, Pl. 4. F). Superjacent beds include allochems types and abundance
that coarsen gradually up to 7.02 m of the section. From the 11.18 m level upward facies
change into a grayish black (N2) biomicritic limestone where calcified sponge spicules (Pl.
5. F, Pl. 6. B, C) gradually become an important component of the bioclasts. This upper
part of the studied section also includes radiolarian, small benthic foraminifers, planktic
foraminifers, and echinoderm fragments (Pl. 3. B, Pl. 7. A, B, Pl. 8).
Serpulid clusters (~ 500 µm - 1mm) (Pl. 8. C) are found intermittently within that
interval at levels corresponding to the following samples: CC-15-43 (15.40 m); CC-15-46
(16.96 m); CC-15-50 (18.68 m); CC-15-59 (23.69 m); CC-15-63 (27.08 m); CC-15-65
(27.99 m).
17
Larger fragments of carbonized plant remains (~ 100µm -1mm) (Pl. 1. D, Pl. 6. A,
Pl. 9. A, B, D) occur from the 16.45 m level where a zone of remarkable dispersive
silicification also develops (Fig. 6). The carbonized plant materials persist among the
biogenic constituents together with calcified sponge spicules throughout the upper 13.54
m of the studied section (Pl. 5. F, Pl. 6. B, C).
Starting at the 19.44 m level the uppermost part of the studied outcrop consists of
a dark gray (N7) biomicritic limestone, moderately bioturbated (index 2-3), showing
gradual upward coarsening (Pl. 1). Allochems include radiolarian, planktic foraminifers,
sponge spicules, ostracods (~ 100µm), serpulids, and benthic foraminifers of the miliolid
and textularid groups, and nondescript skeletal fragments (Pl. 6, Pl. 7, Pl. 8. A, B, C, D, E.
Pl. 10. F).
SEM and EDS Analyses
SEM imaging and smear slides (8) revealed predominance of mainly disaggregated
nannoconid fragments and calcareous nannofossils as the main micro-carb (Fig. 8).
Qualitative EDS analyses of four (4) samples of the Prada Quarry section CC-15-02, CC-
15-05, CC-15-12, and CC-15-18, indicate CaCO3 as predominant in the rock matrix with
little contribution of siliciclastic material as shown in the elemental diagrams (Fig. 9).
Photomicrographs of the areas where EDS was performed show fine micritic texture and
isotropic distribution of grains (Fig. 9). SEM secondary imaging revealed the presence of
framboidal pyrite in sample CC-15-18, level 2.24 m (Pl. 9. F) and abundant quartz crystals
in sample CC-15-42, level 14.60 m (Pl. 9. C). SEM imaging of samples CC-15-58, level
23.29 m and CC-15-63, level 27.08 m, illustrates higher plant material in the uppermost 13
m of the Prada Quarry section (Pl. 9. A, B, D).
18
Total Carbon/Carbonate - TC, TOC, TIC
Total carbon (TC) content averages 92.48% throughout the whole sequence as seen
in Appendix I, except in the interval between 1.75 m and 4.16 m in the black marlstone
layer where it drops to 60.45% at 2.24 m. This value is in sharp contrast to the infrajacent
level with 92.50% and the succeeding level with 94.01%. Likewise, total organic carbon
(TOC) averages around 1.70 wt% throughout the whole sequence showing minor
fluctuations, except at 2.24 m where it reaches a high of 6.66 wt% in the black marlstone
layer (Fig. 10) compared to an average of 2.13 wt% below this level and 1.43 wt% above
it. TIC fluctuates between 99.13 wt% and 86.12 wt% with an average of 90.79 wt%, and
it negatively correlates with TOC (R2 ~ -.83), generally following an inverse fluctuating
correlation with TOC. As shown in Figure 10 and Appendix I, the highest TOC values
occur within the lower 4.16 m of the section that includes the black marlstone layer.
Noticeably there are two other smaller scale increases in the TOC, one reaching a
high of 2.18 wt% at 17.98 m (sample CC-15-48) between the 16.96 m and 18.68 m interval
where the average TOC is 1.24 wt% (Fig. 10). The second fluctuation occurs at 27.08 m
with maximum value of 2.55 wt% coincident also with an increase in plant fragments. This
TOC peak lies within the interval 26.42 m and 27.99 m where the average TOC is 1.39
wt% (Fig. 10). These two TOC peaks are inversely correlated with TIC with R2 ~ -.47 in
the first, and R2 ~ -.89 in the second occurrence, respectively.
Biomarkers Analysis
Lipid biomarkers (n-alkanes) are used to determine provenance of organic matter
(Giger et al., 1980; Meyers, 1997; Dumitrescu and Brassell, 2005; Peters et al., 2005,
19
Sanchez-Hernandez and Maurrasse, 2016). The analyses of 28 samples show a
predominance of short chain n-alkanes (<nC20) in the lower part of the sequence (Fig. 11).
The n-alkane chain lengths increase to ~ nC26 and higher above the black marlstone layer.
At the 16.45 m-level contribution of nC20-nC30 coincides with the presence of
carbonized plant remains which persist throughout the upper part of the studied Prada
Quarry section (Fig. 11) (Pl. 1. D, Pl. 6. A, Pl. 9. A, B, D).
Pristane/Phytane ratios show low values between 0.29 and 1.28, which are
comparable to previously recorded results in the Organyà Basin (Sanchez-Hernandez &
Maurrasse 2014; Socorro et al., 2017) (Fig. 2) (Appx. II).
Redox Sensitive Trace Elements
Concentrations of major, and trace elements are reported in parts per million (ppm)
(Figs. 12-13) (Appx. III). A spike in values obtained for major, biolimiting, and RSTEs
(Al, Si, Ti), (P, Fe), and (V, Cr, Cu, Mo, Th) occurs at 2.24 m in the black marlstone layer,
within the interval between 1.75 m and 4.16 m (Figs. 12-13). That interval also shows
prominent spikes for lithophile elements Al (maximum 57512 ppm) and Ti (maximum
2561 ppm) which positively correlate (R2 ~ .99), and Si with a value of 126366 ppm or
~126.3 ppt, (Fig. 12). However, silicon has its highest value at the 16.45 m level of the
succession with 156805 ppm (Fig. 12) that coincides with the stratigraphic level of
silicified lenses observed at the outcrop scale (Fig. 6).
Maximum elemental values versus their background equivalent in the section
yielded the following relationships: 12 times the background values for Al and Ti, and 6
times the background values for Si. Iron also shows a strong correlation with Al, Ti, and
Si which is R2 ~ 0.99, R2 ~ 1, and R2 ~ 0.64 respectively. At 2.24 m Fe also peaks with a
20
value of 26652 ppm, which is 11 times its background values. Although phosphorus does
not correlate as well with Fe and the lithophile elements at the exact data point of 2.24 m,
its second highest recorded value in the section is 126366 ppm at 2.65 m on top of the black
marlstone layer (Fig. 12). The following elements: V, Cr, Ni, Cu, and Th also reach their
highest values at the 2.24 m level (Fig. 13) (Appx. III), where they show good correlation
with the lithophile elements and Fe. Similarly, at the same level V maximum value is 87.1
ppm being 5 times more than the background value, Ni reaches 61.2, Cr 71.5, Cu 21.4, and
Th 4.6 ppm respectively. Uranium highest values occur at two intervals: 4.5 ppm at the
17.98 m level, and a maximum of 5.25 ppm at the 27.08 m level (Fig. 13). These peak
values also correlate with all other trace elements as shown in Figures 12 and 13.
Lower U values within the first 4.88 m of the section show poor correlation (R2 ~
0.34) with bulk P, which can be used as a proxy for authigenic phosphate (Hoffman et al.,
1998; Algeo and Maynard, 2004), whilst in the last 15.64 m this correlation improves by
approximately 64% between the two elements with a value of R2 ~ 0.53 (Fig. 14).
Stable Isotopes of δ13Corg and δ15Norg
Organic δ13C (Fig. 10) fluctuates throughout the 30 m-section studied, with an
overall positive trend up section. The lowest value of -26.24‰ is recorded at 0.66 m to a
high of -23.78‰, (~ 2.46‰ maximum increase) at 18.05 m. As shown in Figure 10, higher
amplitude fluctuations occur towards the top of the section. There is a 1.44‰ δ13Corg shift
between the 14.19 m and 19.29 m interval peaking at 18.05 m (Fig. 10). Another δ13Corg
small positive inflection from -24.40‰ to -23.91 (0.50‰) occurs at the interval between
25.53 m and 27.99 m peaking at 27.08 m.
21
The δ15Norg isotopic curve displays the same general positive trend toward the top
of the section as does the carbon isotope curve. Its values range from 1.82‰ to 5.95‰
averaging 4.50‰. The lowest 3 m of the section show a range of low amplitude high-
frequency fluctuations non-concurrent with the high frequency oscillations of the δ13C
(<1‰) and δ15Norg (<1.50‰) within the same interval (Fig. 10). From this interval, upward
δ15Norg values approximately correlate positively (Fig. 10) with the δ13Corg profile. A sharp
3.72‰ δ15Norg positive excursion develops from the 16.96 m level to the 18.68 m peaking
at 17.98 m (Fig. 10) and 18.05 m concurrent with a positive shift of 1.44‰ δ13Corg. The
highest δ15Norg value of 5.95‰ is found at the 27.08 m level, which also defines a sharp
2.57‰ positive excursion correlative with a δ13Corg shift to -23.91‰ (Fig. 10).
22
V. DISCUSSION
Relative Chronology
The identification of Globigerinelloides blowi (Bolli, 1959), Hedbergella sigali
(Moullade 1966) (Fig. 7) (Pl. 3. A, Pl. 4. F, Pl. 8. B), characteristic of the G. blowi Biozone
in the studied section (Fig. 5) implies a biochronology between the latest Barremian and
the early Aptian. However, because of the long range of the nominate taxon, and problems
associated with the lack of the index species found elsewhere in sediments of the Organyà
Basin (Sanchez-Hernandez et al., 2014), perhaps, a more definite approach to determine
the relative geochronological position of the studied section can be done with the use of
the δ13C data. In fact, as discussed in Sanchez-Hernandez and Maurrasse (2016) C-isotope
signatures show a consistency and dependability despite modulation related to local or
regional factors. Hence, the C-isotope patterns allow their use for chronologic correlation
(e.g. Kuhnt et al., 2011; Li et al., 2016). Based on similar characteristic, the C-isotope curve
of the studied section is here compared with sites elsewhere such as the shallow-water
Cresmina section from the North Atlantic (Burla et al., 2008), and the pelagic Gorgo a
Cerbara section (Stein et al., 2011) (Fig. 14).
Three δ13Corg positive peaks can be correlated with peaks from these two sections
in the Tethys and North Atlantic. The Cresmina section is chosen for this δ13C correlation
as its carbon isotope curve exhibits a similar trend evident in the studied Prada Quarry
section. Also, Burla et al., (2008) successfully correlated the coastal δ13C records of the
Cresmina section to other Tethyan reference sections namely Cismon (Menegatti et al.,
23
1998). Based on the correlation, they concluded that the upper part of the Cresmina section
was deposited close in time and before the Early Aptian Oceanic Anoxic Event (OAE1A).
The second site is the pelagic Gorgo a Cerbara section in central Italy (Stein et al.,
2011), in the Umbria Marche Basin, which is regarded as the OAE1a type locality (Pancost
et al., 2004) and is proposed as a possible GSSP (Global Stratotype Section and Point) for
the Barremian–Aptian boundary (Erba, 1996). This section also displays a δ13C trend that
has been correlated (Stein et al., 2011) with the same Cismon reference section (Menegatti
et al., 1998).
Similarities in the patterns of the C-isotope curve of the studied Prada quarry
section with these sections (Fig. 14) in the North Atlantic and Tethyan realm further
permits to infer a relative chronological position between the late Barremian and the early
Aptian. Segment boundaries are established by inflection patterns and/or changing
gradients of the carbon isotope curve and have been determined in those parts of the curves
that show distinct trends allowing approximate correlation (Fig. 14).
The correlation strategy allowed for the identification of at least three positive
peaks shared by the three sections. The Prada Quarry correlative inflections are found at
the 18.05 m, 21.49 m, and 27.08 m levels with -23.78‰, -24.50‰, and -24.91‰ δ13Corg
values respectively. The Gorgo a Cerbara counterparts relative stratigraphic positions are
found at the 17.98 m, 19.62 m, and 21.61m levels with isotopic values of -25.64‰, -24.9‰,
and -24.8‰ respectively.
The isotopic data within the stratigraphic intervals of the Prada Quarry section that
include these positive inflections show moderate correlation (R2 ~ 0.5) with Gorgo a
Cerbara’s values for the same proposed levels. Although there is a slight positive
24
divergence of ~ 1‰ δ13Corg from mean values of the Prada Quarry section (-24.61‰) as
compared to (-25.88‰) of the Gorgo a Cerbara’s subsection, nonetheless both isotope
curves display a similar pattern. Such differences may be explained by contribution of the
organic matter from different origins (e.g. Sanchez-Hernandez and Maurrasse, 2016;
Socorro and Maurrasse, 2017; and others herein).
The length of the stratigraphic interval used for carbon isotope chronological
correlation in the Prada Quarry is 9.43 m as compared to an equivalent 3.97 m in the Gorgo
a Cerbara section. The difference stems from a sharp decrease in accumulation rate to 0.28
cm.kyr-1 in the upper part of the Maiolica limestones at the onset of the Fucoidi marls (Fig.
14) in the latter area (Speranza et al., 2005). In contrast, recent studies of the Organyà Basin
at the El Pui section propose minimum accumulation rates of 5 to 7.5 cm.ky-1 (Sanchez-
Hernandez and Maurrasse, 2014).
Based on these proposed rates, comparison of the correlated intervals for the C-
isotope curves chronology would imply that the 9.43 m Prada Quarry subsection represents
~ 125 kyr, while the Gorgo a Cerbara section ~ 140 kyr. These values closely approximate
coeval time of deposition compatible with the proposed chronological correlation based on
δ13Corg values for these sections.
Paleoenvironments / Lithofacies
Microfacies showing low to moderate bioturbation (0-3 index) in biomicritic
limestones with a mix of planktic foraminifers, abundant miliolids, textularids, serpulids,
radiolarian and ammonite fragments, bivalves, and gastropods (Pl. 2, Pl. 5. B, C, D, Pl. 8,
Pl. 9. E, Pl. 10. F) are interpreted as deep-platform facies in open marine setting below
25
storm-weather wave base. The presence of radiolarians (Pl. 5. B, D, Pl. 9. E) suggests some
degree of upwelling developed in the basin.
Facies change at the 11.18 m level (Pl. 1. C) where biomicritic limestones include
calcified sponge spicules which become gradually more abundant together with small
benthic foraminifers (Pl. 3. B, Pl. 7. A, Pl. 10. B), echinoderm fragments, and serpulids
may also represent deep-platform facies under apparent low energy subsurface currents
that sustained abundance of the filter feeders, and possibly upwelling as radiolarians are
also found at this level.
The 16.45 m interval (Pl. 1. D) is characterized by increased carbonized plant
materials together with calcified sponge spicules throughout the rest of the sequence. The
abundance of the sponge spicules provides an explanation for the provenance of
remobilized silica in the horizon with silicified lenses (Fig. 6), which is also confirmed by
major element data analysis, and low TIC (51.33 wt%) of sample CC-15-45 (Fig. 10, 12).
The uppermost part of the studied section starting at the 19.44 m level with
coarsening bioclasts (Pl. 1. E, F) and moderate bioturbation index (2-3), biomicritic
limestone is interpreted also as a deep-platform environment of deposition with a faunal
association including planktic foraminifers, small benthic foraminifers (textularids,
miliolids), serpulids, radiolarians, and ammonite fragments (Pl. 6. E, F, Pl. 7. D, Pl. 8. C).
Chemostratigraphy / Elemental Content
Redox sensitive trace elements (RSTEs) in general are prone to be more soluble
under oxidizing environments (Algeo and Maynard, 2004; Tribovillard et al. 2004, 2006;
Stein et al., 2011). The mechanism of elemental uptake into the sediments in reducing
conditions of oxygen deficiency between 2.0 to 0.2 ml/ l O2 and lower (see Table 1) is
26
partial to the formation of organo-metallic ligands in humic acids, by surface adsorption
(Tribovillard et al., 2004). Enrichment spikes of RSTEs (Mo, Cr, Cu, V, Th, U) shown in
Figure 13 indicate recurrence of oxygen-deficient conditions, which is more pronounced
between 1.75 m and 4.16 m (Fig. 12-13) (Appx. III) at the level of the black marlstone
layer as compared to superjacent levels. RSTEs enrichment combined with the absence of
benthic foraminifers at that level suggest an episode of stronger oxygen-deficient
conditions surmised to be suboxic corroborated by the presence of pyrite framboids (Pl. 9.
F). Furthermore, TOC content (<6.66 wt%), and higher Ni/Co value of ~2 1/2 times its
background compared to the rest of the sequence lend credence to this assumption.
Biomarkers
The predominance of short chain n-alkanes (<nC20) in the studied section (Fig. 11)
(Appx. IV) implies in situ origin of the OM from phytoplankton, and the increase of nC20-
nC26 before and after the onset of the black marlstone layer with diagnostic dysoxic/anoxic
characteristics suggests a contribution from aquatic macrophytes (Ficken et al., 2000).
Further contribution of nC20-nC30 from the 16.45 m level coincident with increased
carbonized plant remains (Fig. 11) (Pl. 6. A, Pl. 9. A, B, D) indicates an increased origin
of higher plant organic matter in the basin at that time.
The Pristane/Phytane ratios (Pr/Phy) (Appx. II) vary between 0.29 and 1.28, thus
below the threshold level (>2.5), and since the n-alkanes are primarily from the basin, these
values thus imply that OM did not reach an overmature state, confirming previous n-alkane
results in the Organyà Basin (Sanchez-Hernandez & Maurrasse 2014; Socorro et al., 2017).
The Pr/Phy values also bring additional evidence to severe oxygen-deficient conditions of
deposition (Didyk et al., 1978), because such environments tend to preserve the C20

27
isoprenoid skeleton yielding low Pr/Phy ratios (Appx. II). Oxic conditions, on the other
hand, cause greater degradation so that the C20 isoprenoid skeleton is less likely to remain
intact in the sediment (Didyk et al., 1978).
28
VI. CONCLUSIONS
The high resolution, multiproxy study of the 30-m section of the Sierra de Prada
Quarry provides further detailed lithostratigraphic and geochemical data to improve our
knowledge of the paleoecological conditions in the sedimentary sequence of the Organyà
Basin exposed in the eastern Sierra de Prada Quarry. The results provide additional data to
previous studies (Berástegui et al., 1990; Caus et al., 1990; García-Senz, 2002; Bernaus, et
al., 2003; Sanchez-Hernandez and Maurrasse, 2014, 2015, 2016; Socorro et al., 2017.
Index taxa include planktic foraminifera G.blowi, Hedbergella sigali, which
combined with the δ13C data in comparison with two other sections (Cresmina and Gorgo
a Cerbara) suggest a relative chronological level between the late Barremian and the early
Aptian. The rocks are organic-rich (0.67 - 3.10 wt% TOC), and a single black marlstone
layer (~1m thick) at 2.24 m which shows low bioturbation index (1), TOC up to 6.66 wt%
coeval with framboidal pyrite, and enrichment spikes of RSTEs indicate a distinct
dysoxic/anoxic episode within overall sustained oxygen-deficient conditions.
Biomarker analyses show a predominance of n-alkanes (≤nC20) in the lower 4.16
m of the section which suggest in situ origin of the OM from phytoplankton. The
occurrence of ≤nC26 before and after the black marlstone layer reveals added contribution
from aquatic macrophytes coincident with the onset of the anoxic/dysoxic episode.
Contribution of ≤nC30 observed at the 16.45 m level coincides with higher concentration
of carbonized higher plant remains. Pr/Phy ratios below 2 (0.29 - 1.28), imply that OM
did not reach overmaturity.
29
Sediments of the Eastern Prada Quarry section may be interpreted as hemipelagic
marine deposits of the outer shelf environment during widespread development and
accumulation of organic-rich sediments under greenhouse conditions.
Recommendations for Future Research
In order to further elucidate the overall paleoenvironmental conditions recorded in
sediments of the Organyà Basin in the Eastern Sierra de Prada Quarry, a suite of three
different proxies is proposed:
1. - Bulk and clay mineral analyses by means of X-ray diffraction (XRD), to
evaluate the mineralogical makeup of the rock matrix, and characterization of the detrital
fraction. X-ray diffraction (XRD).
2. - Rock Eval Pyrolysis can be employed to further evaluate the organic matter
type, quantity and maturity and, the potential generation of hydrocarbon. The method will
provide data on free hydrocarbons contained in the sample and the hydrocarbon- and
oxygen-containing compounds (CO2) (Tissot and Welte, 1984).
3. - Investigate the hopanoids biomarker group to evaluate the biotic sources of the
organic matter, maturity, measures of its depositional environment, and mechanism of
preservation (Forster et al., 2004). Hopanes are pentacyclic triterpenoids derived from cell
membranes of prokaryotes (phototrophic cyanobacteria and also heterotrophic bacteria)
(e.g., Ourisson et al., 1987; Ourisson and Rohmer, 1992).
This biomarker group is distinguished by maturity-sensitive stereoisomers (Seifert
and Moldowan, 1980; Forster et al., 2004). Thermal maturity results obtained from
hopane’s maturity-sensitive isomers could then be correlated and corroborated with Tmax

30
results from Rock Eval Pyrolysis to confirm interpretation of the origin of organic matter
in the Prada Quarry section.
31
LIST OF REFERENCES
Algeo, T.J., Maynard J. B., 2004. Trace element behavior and redox facies in core shales of Upper Pennsylvanian Kansas-type cyclothems, Chemical Geology 206, 289–318. Altabet, M. A., and Francois, R., 1994. Sedimentary nitrogen isotopic ratio as a recorder for surface ocean nitrate utilization. Global Biogeochemical Cycles 8, 103–116. Arroyo, L., Trejos, T., Gardinalli, P.R., Almirall, J.R., 2009. Optimization and validation of a Laser Ablation Inductively Coupled Plasma Mass Spectrometry method for the routine analysis of soils and sediments. Spectrochimica Acta Part B 64, 16–25. Bachmann, M., Willems, H., 1996. High-frequency cycles in the upper Aptian carbonates of the Organyà basin, NE Spain. Geologische Rundschau 85(3), 586–605. Bengtsson, L. & M. Enell, 1986. Chemical analysis. In Berglund, B. E. (ed.), Handbook of Holocene Palaeoecology and Palaeohydrology, 423–451. Berástegui, X., García-Senz, J.M., Losantos, M., 1990. Tectonosedimentary evolution of the Organyà extensional basin (Central South Pyrenean Unit, Spain) during the Lower Cretaceous. Bulletin de la Société Géologique de France 8, VI, 2, 251–264. Bernaus, Josep-Maria., 1998. L'Urgonien du bassin d'Organya (NE Espagne) :micropaleontologie, sedimentologie et stratigraphie sequentielle. Stratigraphie. Universite Joseph-Fourier - Grenoble I. Bernaus, J.M., Arnaud-Vanneau, A., Caus, E., 2002. Stratigraphic distribution of Valanginian Early Aptian shallow-water benthic foraminifera and algae, and depositional sequences of a carbonate platform in a tectonically-controlled basin: the Organyà Basin, Pyrenees, Spain. Cretaceous Research 23, 25–36. Bernaus, J.M., Arnaud-Vanneau, A., Caus, E., 2003. Carbonate platform sequence stratigraphy in a rapidly subsiding area: the Late Barremian–Early Aptian of the Organyà Basin, Spanish Pyrenees. Sedimentary Geology 159 (3–4), 177–201. Bolli, H., 1959. Planktonic foraminifera from the Cretaceous of Trinidad, B.W.I. Bulletins of American Paleontology 39, 257–277. Burla, S., Heimhofer, U., Hochuli, P.A., Weissert, H., Skelton, P., 2008. Changes in sedimentary patterns of coastal and deep-sea successions from the North Atlantic (Portugal) linked to Early Cretaceous environmental change. Palaeogeography, Palaeoclimatology, Palaeoecology 257, 38–57.
32
Bralower, T. J., Arthur, M. A., Leckie, R. M., Sliter, W. V., Allard, D. J., Schlanger, S.O., 1994. Timing and paleoceanography of oceanic dysoxia/anoxia in the LateBarremian to Early Aptian (Early Cretaceous). Palaios, 9(4), 335–369. Calvert, S.E., Pedersen, T.F., 1993. Geochemistry of recent oxic and anoxic marine sediments: implications for the geological record. Marine Geology 113, 67–88. Caus, E., García-Senz, J. M., Rodés, D., Simó, A. 1990. Stratigraphy of the Lower Cretaceous (Berriasian–Barremian) sediments in the Organyà Basin, Pyrenees, Spain. Cretaceous Research 11, 313–320. Craig, Harmon, 1957. Isotopic standards for carbon and oxygen and correction factors for mass-spectrometric analysis of carbon dioxide. Geochimica et Cosmochimica Acta. Volume 12, Issues 1–2, Pages 133-149. Dean, W. E. Jr., 1974. Determination of carbonate and organic matter in calcareous sediments and sedimentary rocks by loss on ignition: Comparison with other methods. J. Sed. Petrol. 44: 242–248. Dumitrescu, M., Brassell, S.C., 2005. Biogeochemical assessment of sources of organic matter and paleoproductivity during the early Aptian Oceanic Anoxic Event at Shatsky Rise, ODP Leg 198, Organic Geochemistry 36 (7), 1002–1022. Dunham, R. J., 1962. Classification of carbonate rocks according to depositional textures, in Ham, W, E. (ed.), Classification of carbonate rocks: American Association of Petroleum Geologists Mem. 1, p. 108–121. Didyk, B.M., Simoneit, B.R.T., Brassell, S.C., Eglington, G., 1978. Organic geochemical indicators of palaeoenvironmental conditions of sedimentation. Nature 272, 216– 222. Erba, E., 1996. The Aptian Stage. Bulletin de l'Institut Royal des Sciences Naturelles de Belgique, Sciences de la Terre (66-Supp.), 31–43. Erba, E., Channell, J.E.T., Claps, M., Jones, C., Larson, R., Opdyke, B., Premoli Silva, I., Riva, A., Salvini, G., Torricelli, S., 1999. Integrated stratigraphy of the Cismon APTICORE (Southern Alps, Italy): a “reference section” for the Barremian–Aptian interval at low latitudes. Journal of Foraminiferal Research 29, 371–392. Erba, E., 2004. Calcareous nannofossils and Mesozoic oceanic events. Marine micropaleontology 52, 85-106. Ficken, K.J., Li, B., Swain, D.L., Eglinton, G., 2000. An n-alkane proxy for the sedimentary input of submerged/floating freshwater aquatic macrophytes. Organic Geochemistry 31, 745-749.
33
Folk RL (1962) Spectral subdivision of limestone types. In: Ham WE (ed) Classification of carbonate rocks: AAPG Memoir 1:62–84. Forster, A., Sturt, H., Meyers, P.A., and the Leg 207 Shipboard Scientific Party, 2004. Molecular biogeochemistry of Cretaceous black shales from the Demerara Rise; preliminary shipboard results from Sites 1257 and 1258, ODP Leg 207, In: Erbacher, J., Mosher, D.C., Malone, M.J., et al. (eds.), Proceedings of the Ocean Drilling Program, Initial Results 207, 1–22. Gaona-Narvaez, T., Maurrasse, F.J-M.R., Moreno-Bedmar, J. A., 2013a. Stable Carbon Isotope Stratigraphy and Ammonite Biochronology at Madotz (Navarra, N Spain): Implications for the Timing and Duration of Oxygen Depletion during OAE-1a. Cretaceous Research 40,143–157. Gaona-Narvaez, T., Maurrasse, F.J-M.R., Etayo-Serna, F., 2013b. Geochemistry, paleoenvironments and timing of Aptian organic-rich beds of Paja Formation (Curití, Eastern Cordillera, Colombia). In: Bojar, A.V., Melinte-Dobrinescu, M.C., and Smit, J. (Eds.), Isotopic Studies in Cretaceous Research. Geological Society of London, Special Publications 382, 31–48. García-Senz, J., 2002. Cuencas extensivas del Cretácico Inferior en los Pirineos Centrales: formación y subsecuente inversión. PhD Thesis, University of Barcelona, Barcelona, 310 pp. Giger, W., Schaffner, C., Wakeham, S. G., 1980. Aliphatic and olefinic hydrocarbons in recent sediments of Greifensee, Switzerland. Geochimica et Cosmochimica Acta 44, 119–129. Goddard, E.N., Trask, P. D., De Ford, R. K., Rove, O.N., Singewald, J.T., Overbeck, R.M., 1963, Rock-Color Chart. Distributed by the Geological Society of America, New York, N.Y. 16 p. Godet, A., Bodin, S., Föllmi, K., Vermeulen, J., Gardin, S., Fiet, N., Adatte, T., Berner, Z., Stüben, D., van de Schootbrugge, B., 2006. Evolution of the marine stable carbonisotope record during the Early Cretaceous: a focus on the late Hauterivian and Barremian in the Tethyan realm. Earth and Planetary Sciences Letters 242, 254 –271. Godet, A., Bodin, S., Adatte, T., Föllmi, K.B., 2008. Platform-induced clay-mineral fractionation along a northern Tethyan basin-platform transect: implications for the interpretation of Early Cretaceous climate change (Late Hauterivian-Early Aptian). Cretaceous Research 29, 830–847. Golonka, J., 2004. Plate tectonic evolution of the southern margin of Eurasia in the Mesozoic and Cenozoic. Tectonophysics 381, 235–273.
34
Hays, J.D. and Pitman, W.C., 1973. Lithospheric plate motion, sea level changes and climatic and ecological consequences. Nature, 246, 18-22. Heiri, Oliver., Lotter, Andre F., Lemcke, Gerry., 1999. Loss on ignition as a method for estimating organic and carbonate content in sediments: reproducibility and comparability of results. Journal of Paleolimnology 25, 101–110. Hou, W., Gu, B., Zhang, H., Gu, J., Han, B., 2013. The relationship between carbon and nitrogen stable isotopes of zooplankton and select environmental variables in low-latitude reservoirs. Limnology, 14, 97-104. Hoffman, D.L., Algeo, T.J., Maynard, J.B., Joachimski, M.M., Hower, J.C., Jaminski, J., 1998. Regional and stratigraphic variation in bottomwater anoxia in offshore core shales of Upper Pennsylvanian cyclothems from the Eastern Midcontinent Shelf (Kansas), USA. In: Schieber, J., Zimmerle, W., Sethi, P.S.(Eds.), Shales and Mudstones, vol. 1, 243–269. Jenkyns, H. C., 1980. Cretaceous anoxic events: from continents to oceans. Journal of the Geological Society, London 137, 171-188. Kerr, A.C., 1998, Oceanic plateau formation: a cause of mass extinction and black shale deposition around the Cenomanian-Turonian boundary? Journal of the Geological Society, London, 155, 619-626. Kuhnt, W., Holbourn, A., Moullade, M., 2011. Transient global cooling at the onset of early Aptian oceanic anoxic event (OAE) 1a. Geology 39(4), 323–326. Larson, R. L., 1991a. Geological consequences of superplumes, Geology 19, 963–966. Larson, R.L., Erba, E., 1999. Onset of the mid-Cretaceous greenhouse in the Barremian - Aptian: igneous events and the biological, sedimentary, and geochemical responses. Paleoceanography 14, 663-678. Li, Y.X., Bralower, T.J., Montanez, I.P., Osleger, D.A., Arthur, M.A., Bice, D.M., Herbert, T.D., Erba, E., Premoli Silva, I., 2008. Toward an orbital chronology for the early Aptian Oceanic Anoxic Event (OAE1a, similar to 120 Ma). Earth and Planetary Science Letters 271, 88–100. Li, J., Hu, X., Zhao, K., Cai, Y., Sun, T., 2016. Paleoceanographic evolution and chronostratigraphy of the Aptian Oceanic Anoxic Event 1a (OAE1a) to oceanic red bed 1 (ORB1) in the Gorgo a Cerbara section (central Italy). Cretaceous Research 66, 115-128. Marchitto, T.M., 2007. Nutrient Proxies. Paleoceanography, Physical and Chemical Proxies/nutrient proxies. Encyclopedia of Quaternary Science (Second Edition), 2013, 899-906.
35
Martínez, R., 1982. Ammonoideos cretácicos del Prepirineo de la provincia de Lleida. PhD thesis, publicaciones de la Universitat Autónoma de Barcelona, 17, pp. 197. Menegatti, A. P., Weissert, H., Brown, R. S., Tyson, R. V., Farrimond, P., Strasser, A. &
through the Early Aptian “Livello Selli” of the Alpine Tethys. Paleoceanography 13 (5), 530–545. Meyers, P.A., 1997. Organic geochemical proxies of paleoceanographic, paleolimnologic, and paleoclimatic processes, Organic Geochemistry 27, 213–250. Mey, P.H.W. Nagtegaal, P.J.C, Roberti, K.J., Hartevelt, J.J.A., 1968. Lithostratigraphic Subdivision of Post-Hercynian Deposits in the South-Central Pyrenees, Spain. Leidse Geologische Mededelingen, 41, 221-228. Morford, J.L., Emerson, S., 1999. The geochemistry of redox sensitive trace metals in sediments. Geochimica et Cosmochimica Acta 63, 1735–1750. Moullade, M., 1966. Etude stratigraphique et micropaleontologique du Crétacé inférieur de la "fosse vocontienne". Documents des Laboratoires de Géologie de la Faculté des Sciences de Lyon, 15: 1-369. Muñoz, J.A., 1991. Evolution of a continental collision belt: ECORS-Pyrenees crustal balanced cross-section, In Thrust Tectonics Ed. K.R. McClay. Chapman and Hall, New York, pp.235-247. Muñoz, J.A., Pardo, G., Villena, J., 1992. Evolucion paleogeografica de los conglomerados miocenos adosados al borde norte de la Sierra de Cameros (La Rioja). Acta Geologica Hispanica 27, 3–14. Mutterlose, J., Böckel, B. 1998. The Barremian–Aptian interval in NW Germany: a review. Cretaceous Research 19(5), 539–568. Mutterlose, J., Pauly, S., Steuber, T., 2009. Temperature controlled deposition of early Cretaceous (Barremian–early Aptian) black shales in an epicontinental sea. Palaeogeography, Palaeoclimatology, Palaeoecology 273(3), 330–345. Ourisson, G., Rohmer, M., and Poralla, K., 1987. Prokaryotic hopanoids and other polyterpenoid sterol surrogates. Annual Review of Microbiology 41, 301–333. Ourisson, G., and Rohmer, M., 1992. Hopanoids. 2. Biohopanoids: a novel class of bacterial lipids. Accounts of Chemical Research 25, 403–408. Pauly, S., Mutterlose, J., Wray, D.S., 2013. Palaeoceanography of Lower Cretaceous (Barremian-Lower Aptian) black shales from northwest Germany evidenced by calcareous nannofossils and geochemistry. Cretaceous Research 42, 28–43.
36
Pancost, R.D., Crawford, N.,Magness, S., Turner, A., Jenkyns, H.C.,Maxwell, J.R., 2004. Further evidence for the development of photic-zone euxinic conditions during Mesozoic oceanic anoxic events. Journal of the Geological Society, London 161, 353–364. Peybernès, B., 1976. Le Jurassique et le Crétacé infèrieur des Pyrénées francoespagnoles. Thèse de doctorat, Laboratoire de Géologie, Université Paul Sabatier, Toulouse, 459 pp. Peybernès, B. and Souquet, P., 1973. Biostratigraphie des marnes noires de l ‘Aptien– Albien de la zone sud-pyrénéenne. Comptes Rendus de l'Académie des Sciences Paris 276 (2 Mai 1976), Séries D, 2501–2504. Peters, K.E., Walters, C.C., Moldowan, J.M., 2005. The biomarker guide: II, Biomarkers and isotopes in petroleum systems and Earth history, Cambridge, UK, Cambridge University Press, pp. 475–1155. Rimmer, S.M., 2004. Geochemical paleoredox indicators in Devonian-Mississippian black shales, central Appalachian Basin (U.S.A.). Chemical Geology 206, 373- 391. Rosell, J., Llompart, C., 1982. El Pirineo, in El Cretacico de Espana, Universidad Complutense de Madrid 4, 161-176. Sanchez-Hernandez, Y., Maurrasse, F.J-M.R., 2014. Geochemical characterization and redox signals from the latest Barremian to the earliest Aptian in a restricted marine basin: El Pui section, Organyà Basin, south-central Pyrenees. Chemical Geology 372, 12–31. Sanchez-Hernandez, Yosmel., 2014. Paleoenvironments and geochemical signals from the late Barremian to the middle Aptian in a Tethyan marginal basin, northeast Spain: Implications for carbon sequestration in restricted basins. Dissertation. ProQuest ETD
Collection for FIU. Sanchez-Hernandez, Y., Maurrasse, F.J.-M.R., 2016. The influence of regional factors in the expression of oceanic anoxic event 1a (OAE1a) in the semi-restricted Organyà Basin, south-central Pyrenees, Spain. Palaeogeography, Palaeoclimatology, Palaeoecology, 441, Part 3, 582–598. Schlanger, S. O., and Jenkyns, H.C., 1976. Cretaceous Oceanic Anoxic Events: Causes and Consequences. Geologie en Mijnbouw, 55 (3-4), 179-184. Seifert, W.K., and Moldowan, J.M., 1980. The effect of thermal stress on source-rock quality as measured by hopane stereochemistry. Physics and Chemistry of the Earth 12, 229–237.
37
Socorro, Jander, Florentin J-M. R. Maurrasse, Yosmel Sanchez-Hernandez. 2017. Characterization of the negative carbon isotope shift in segment C2, its global implications as a harbinger of OAE 1a. Science China Earth Sciences, 60 (1), 30 – 43. Speranza, F., Satolli, S., Mattioli, E., Calamita, F., 2005. Magnetic stratigraphy ofKimmeridgian-Aptian sections from Umbria-Marche (Italy): new details on theM polarity sequence. Journal of Geophysical Research: Solid Earth 110, 1e26. Stein, M., Föllmi, K.B.,Westermann, S., Godet, A., Adatte, T., Matera, V., Fleitmann, D., Berner, Z., 2011. Progressive palaeoenvironmental change during the Late BarremianeEarly Aptian as prelude to Oceanic Anoxic Event 1a: evidence from the Gorgo a Cerbara section (Umbria-Marche Basin, central Italy). Palaeogeography, Palaeoclimatology, Palaeoecology 302, 396–406. Stein, M.,Westermann, S., Adatte, T., Matera, V., Fleitmann, D., Spangenberg, J.E. and Föllmi, K.B., 2012. Late Barremian–Early Aptian palaeoenvironmental change: the Cassis-La Bédoule section, southeast France. Cretaceous Research 37, 209––222. Stinton, C.W. and Duncan, R.A., 1997. Potential links between ocean plateau volcanism and global ocean anoxia at the Cenomanian-Turonian boundary: Economical Geology 92, 836–842. Taylor, A. M., Goldring, R. 1993. Description and analysis of bioturbation and ichnofabric. Journal of the Geological Society of London 150, 141–148. Tissot, B. P., & Welte, D. H. (1984). Petroleum formation and occurrence, 2nd ed. Berlin, Springer-Verlag, 699 p. Tribovillard, N., Riboulleau, A., Lyons, T., Baudin, F., 2004. Enhanced trapping of molybdenum by sulfurized marine organic matter of marine origin in Mesozoic limestones and shales. Chemical Geology 213, 385–401. Tribovillard, N., Ramdani, A., Trentesaux, A., 2005. Controls in organic accumulation in upper Jurassic shales of northwestern Europe as inferred from trace-metals geochemistry. In: Harris, N. (Ed.), The deposition of Organic-Carbon-Rich sedimenst: Model, Mechanisms, and Consequences.SEPM Special Publication 82, 145-164. Tribovillard, N., Algeo, T.J., Lyons, T., Riboulleau, A., 2006. Trace metals as paleoredox and paleoproductivity proxies: An update. Chemical Geology 232(1-2), 12-32.
Tyson, R.V., Pearson, T.H., 1991. Modern and ancient continental shelf anoxia: an over-
view. In: Tyson, R.V., Pearson, T.H. (Eds.), Modern and Ancient Continental Shelf An-
oxia: Geological Society of London. Special Publication 58, pp. 1–24.
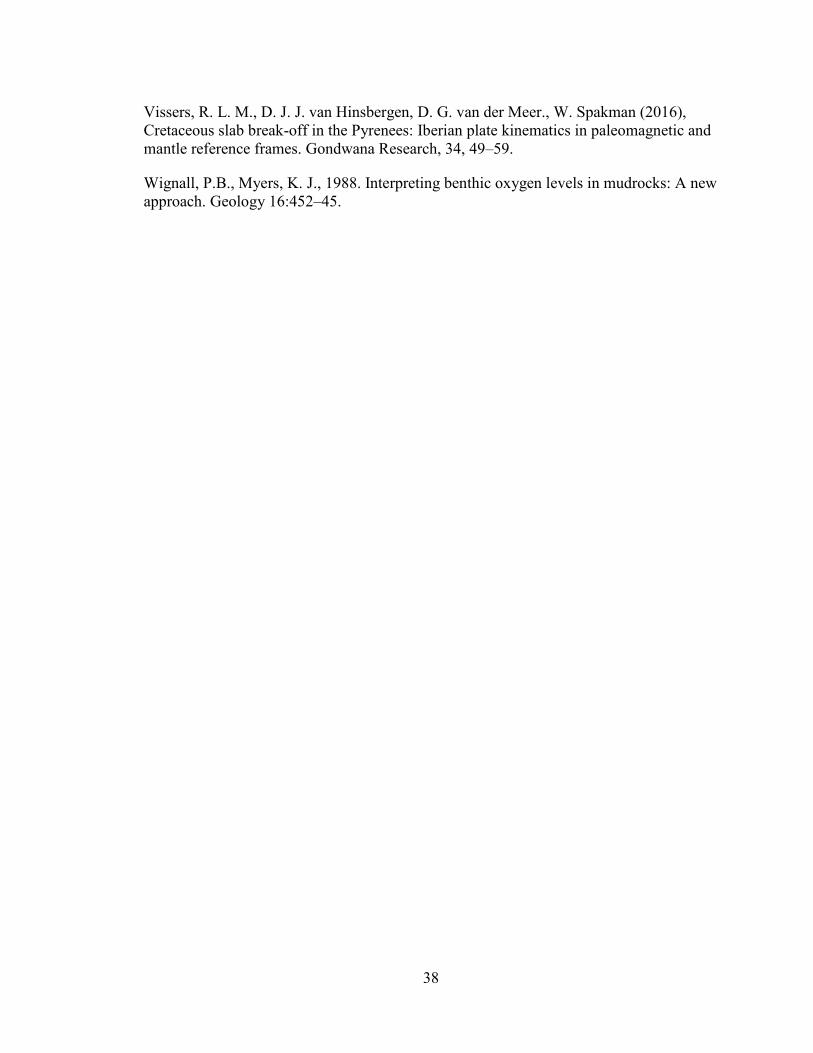
38
Vissers, R. L. M., D. J. J. van Hinsbergen, D. G. van der Meer., W. Spakman (2016), Cretaceous slab break-off in the Pyrenees: Iberian plate kinematics in paleomagnetic and mantle reference frames. Gondwana Research, 34, 49–59.
Wignall, P.B., Myers, K. J., 1988. Interpreting benthic oxygen levels in mudrocks: A new approach. Geology 16:452–45.
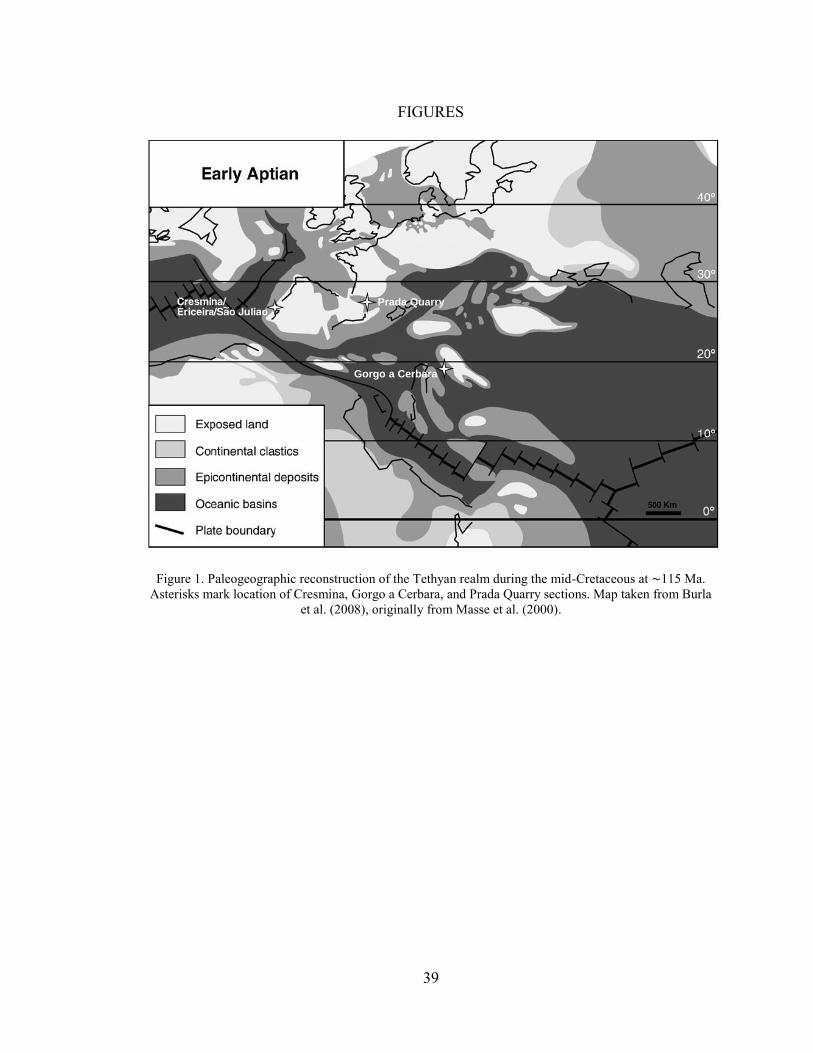
39
FIGURES
Figure 1. Paleogeographic reconstruction of the Tethyan realm during the mid-Cretaceous at ∼115 Ma. Asterisks mark location of Cresmina, Gorgo a Cerbara, and Prada Quarry sections. Map taken from Burla
et al. (2008), originally from Masse et al. (2000).
Prada Quarry
Gorgo a Cerbara
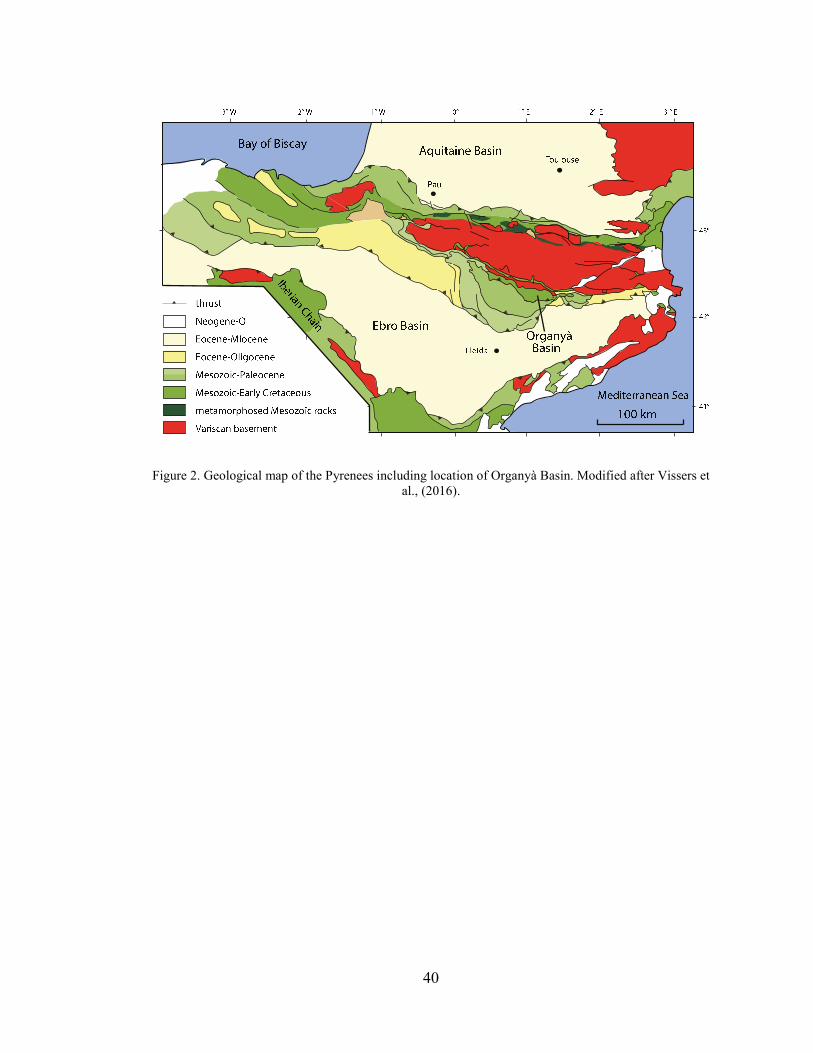
40
Figure 2. Geological map of the Pyrenees including location of Organyà Basin. Modified after Vissers et al., (2016).
41
Figure 3. Sierra de Prada: south flank showing position of Prada Quarry. Quarry accessible off the road leading to the municipal skydiving platform (Envol Organyá) on the south flank of the Sierra de Prada
overlooking the Cabó River valley. Google Earth images dated 31 Dec. 2008.
Organyà
Sierra de Prada
Se
gre
Riv
er
Prada QuarryN
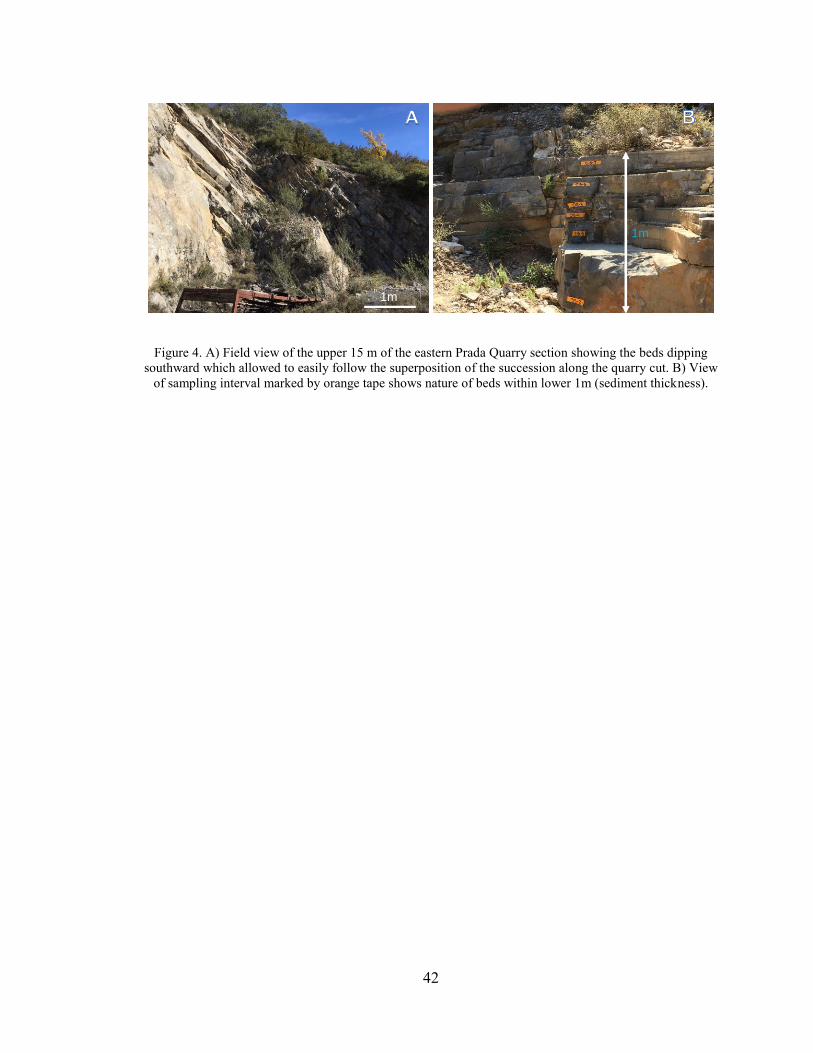
42
Figure 4. A) Field view of the upper 15 m of the eastern Prada Quarry section showing the beds dipping southward which allowed to easily follow the superposition of the succession along the quarry cut. B) View
of sampling interval marked by orange tape shows nature of beds within lower 1m (sediment thickness).
1m
1m
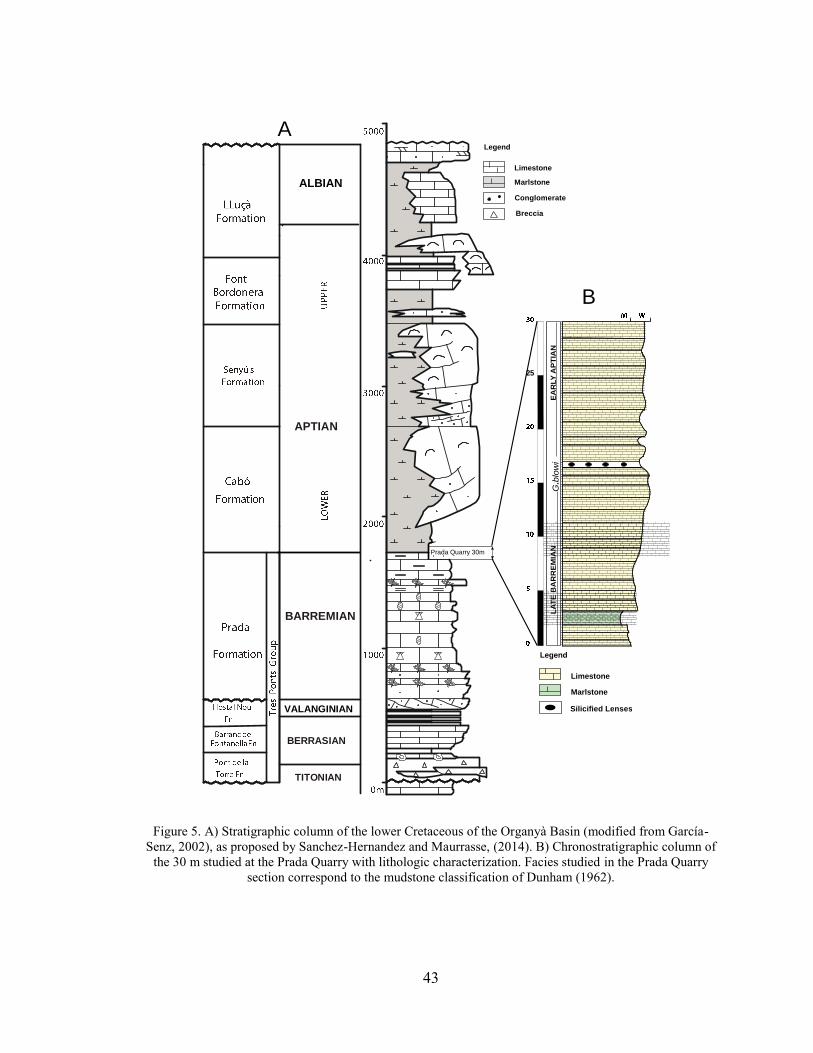
43
Figure 5. A) Stratigraphic column of the lower Cretaceous of the Organyà Basin (modified from García-Senz, 2002), as proposed by Sanchez-Hernandez and Maurrasse, (2014). B) Chronostratigraphic column of
the 30 m studied at the Prada Quarry with lithologic characterization. Facies studied in the Prada Quarry section correspond to the mudstone classification of Dunham (1962).
ALBIAN
VALANGINIAN
Prada Quarry 30m
ALBIAN
BARREMIAN
BERRASIAN
TITONIAN
APTIAN
VALANGINIAN
25
Limestone
Marlstone
Silicified Lenses
LA
TE
BA
RR
EM
IAN
EA
RLY
AP
TIA
NG
.blo
wi
A
B
Limestone
Marlstone
Conglomerate
Breccia
Legend
Legend
Limestone
Marlstone
Silicified Lenses
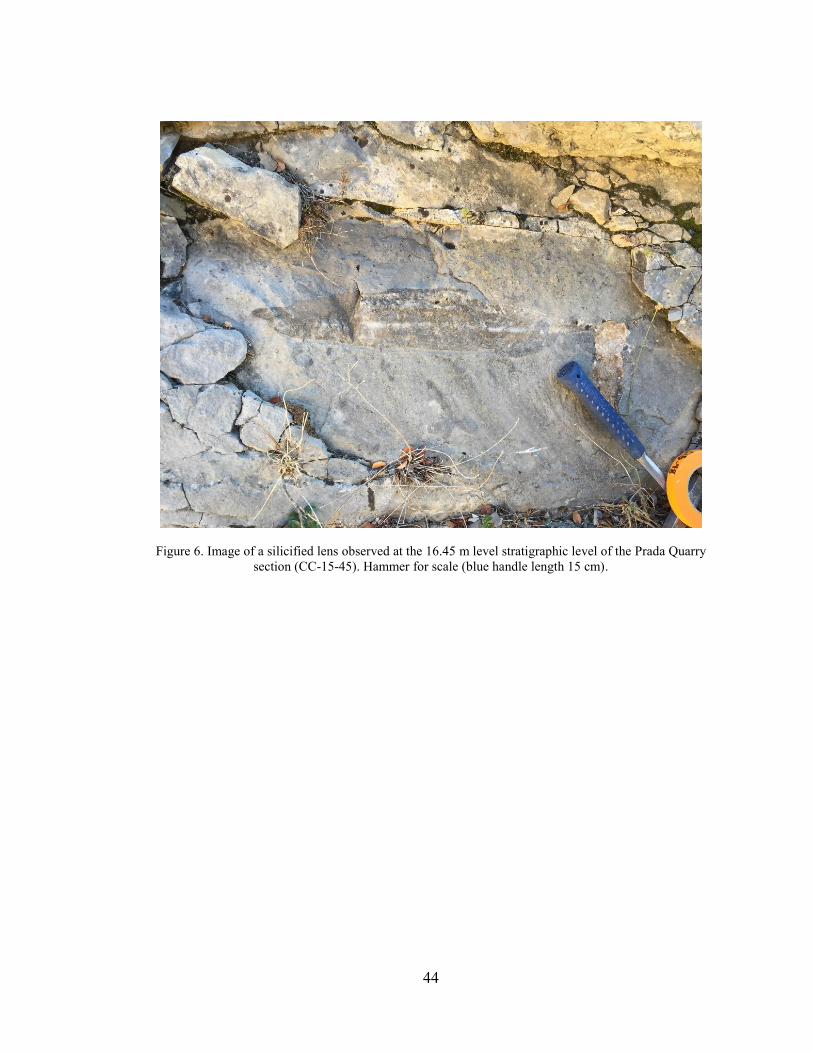
44
Figure 6. Image of a silicified lens observed at the 16.45 m level stratigraphic level of the Prada Quarry section (CC-15-45). Hammer for scale (blue handle length 15 cm).
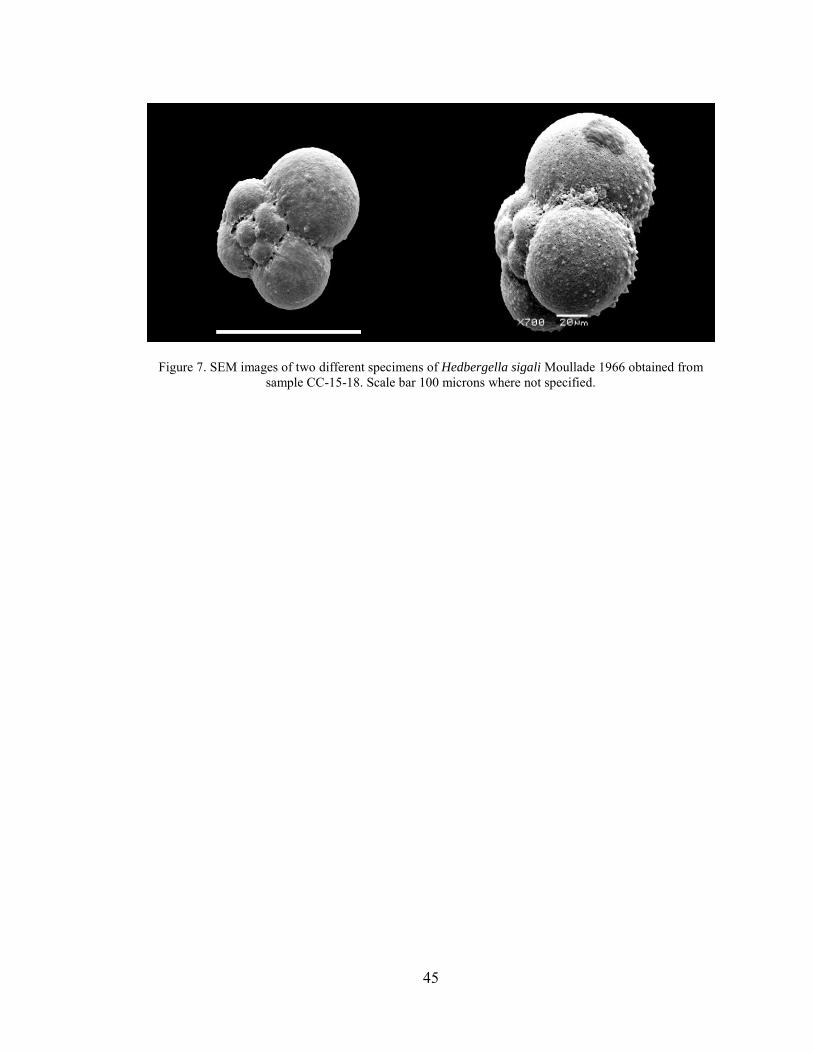
45
Figure 7. SEM images of two different specimens of Hedbergella sigali Moullade 1966 obtained from sample CC-15-18. Scale bar 100 microns where not specified.
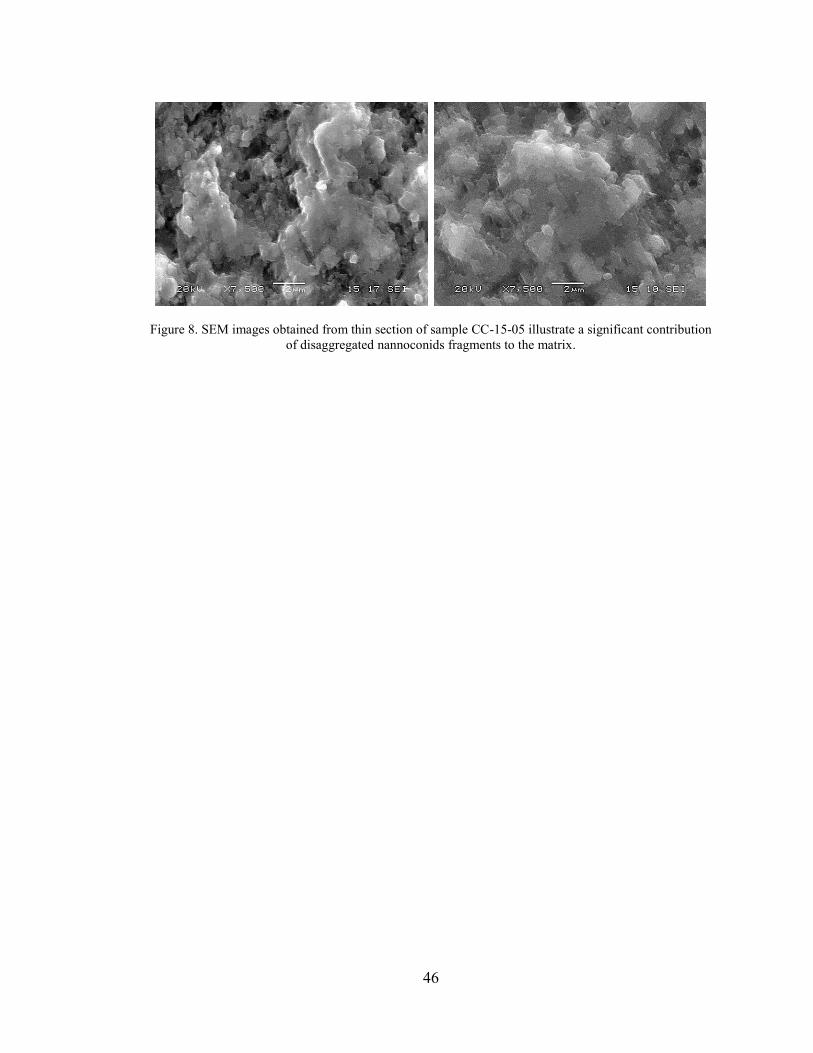
46
Figure 8. SEM images obtained from thin section of sample CC-15-05 illustrate a significant contribution of disaggregated nannoconids fragments to the matrix.
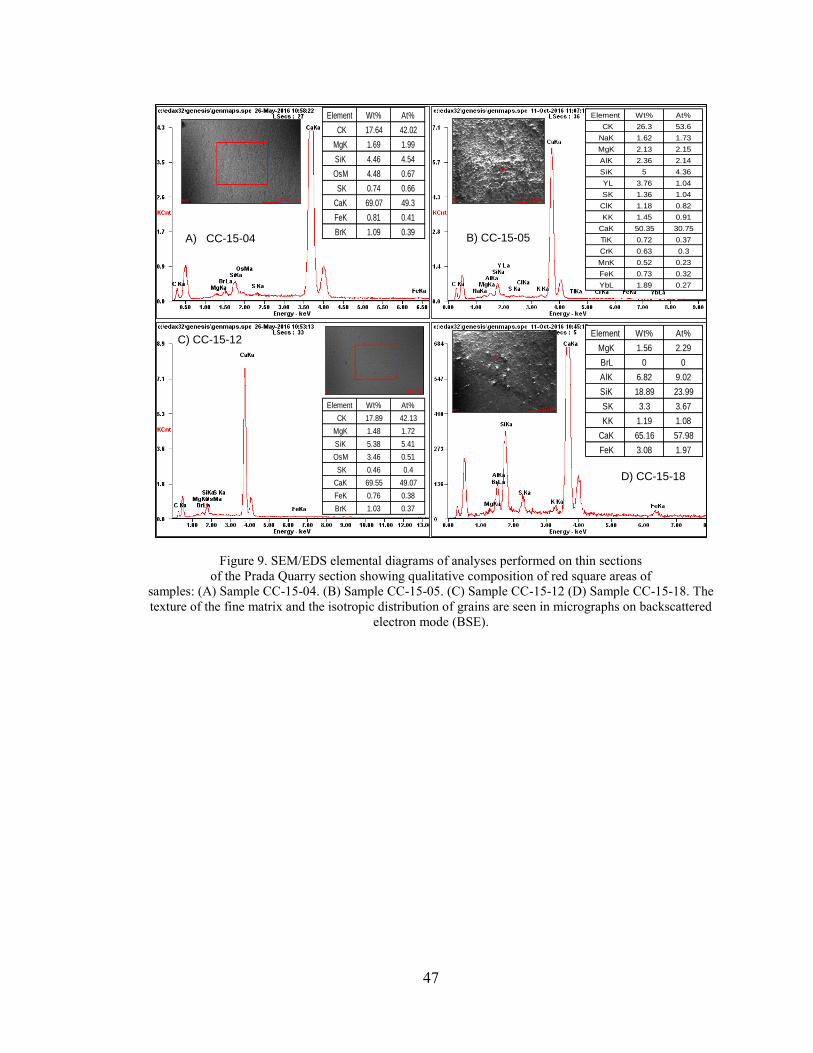
47
Figure 9. SEM/EDS elemental diagrams of analyses performed on thin sections of the Prada Quarry section showing qualitative composition of red square areas of
samples: (A) Sample CC-15-04. (B) Sample CC-15-05. (C) Sample CC-15-12 (D) Sample CC-15-18. The texture of the fine matrix and the isotropic distribution of grains are seen in micrographs on backscattered
electron mode (BSE).
A) CC-15-04 B) CC-15-05
C) CC-15-12
D) CC-15-18
Element Wt% At%
CK 17.64 42.02
MgK 1.69 1.99
SiK 4.46 4.54
OsM 4.48 0.67
SK 0.74 0.66
CaK 69.07 49.3
FeK 0.81 0.41
BrK 1.09 0.39
Element Wt% At%
CK 17.89 42.13
MgK 1.48 1.72
SiK 5.38 5.41
OsM 3.46 0.51
SK 0.46 0.4
CaK 69.55 49.07
FeK 0.76 0.38
BrK 1.03 0.37
Element Wt% At%
CK 26.3 53.6
NaK 1.62 1.73
MgK 2.13 2.15
AlK 2.36 2.14
SiK 5 4.36
YL 3.76 1.04
SK 1.36 1.04
ClK 1.18 0.82
KK 1.45 0.91
CaK 50.35 30.75
TiK 0.72 0.37
CrK 0.63 0.3
MnK 0.52 0.23
FeK 0.73 0.32
YbL 1.89 0.27
Element Wt% At%
MgK 1.56 2.29
BrL 0 0
AlK 6.82 9.02
SiK 18.89 23.99
SK 3.3 3.67
KK 1.19 1.08
CaK 65.16 57.98
FeK 3.08 1.97
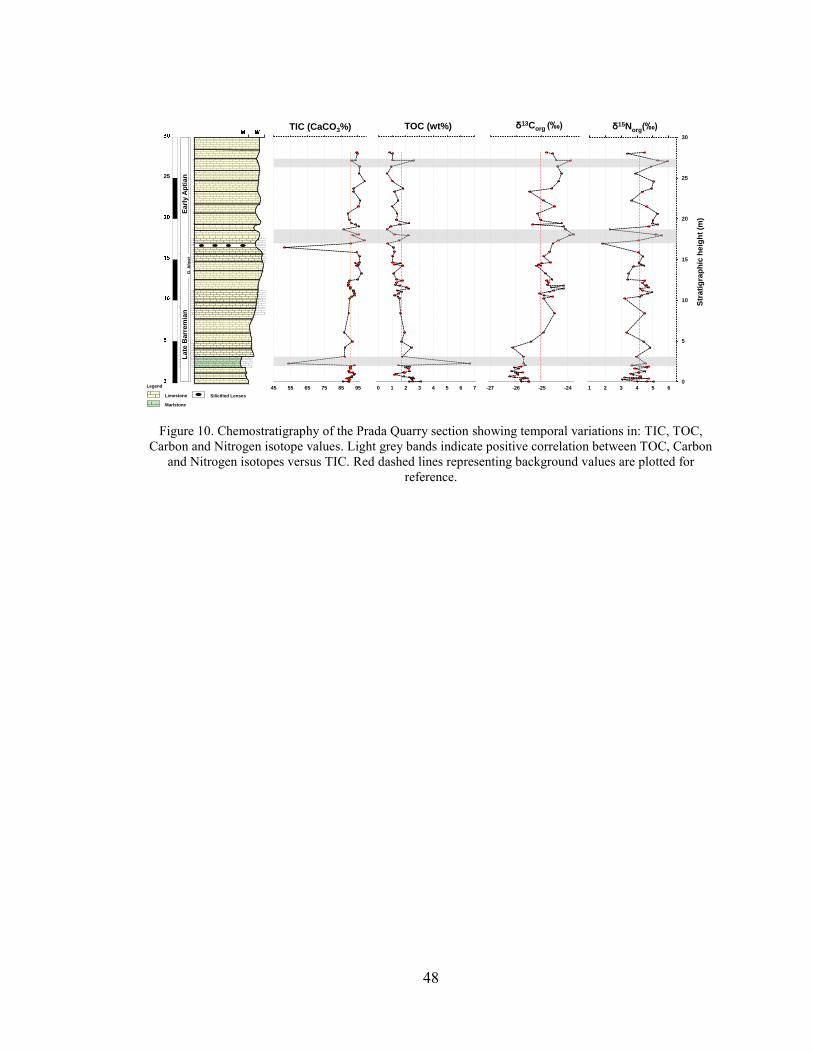
48
Figure 10. Chemostratigraphy of the Prada Quarry section showing temporal variations in: TIC, TOC, Carbon and Nitrogen isotope values. Light grey bands indicate positive correlation between TOC, Carbon
and Nitrogen isotopes versus TIC. Red dashed lines representing background values are plotted for reference.
25
Str
ati
gra
ph
ic h
eig
ht
(m)
La
te B
arr
em
ian
Ea
rly A
pti
an
G. b
low
i
-27 -26 -25 -24
δ13Corg (‰)
0
5
10
15
20
25
30
1 2 3 4 5 6
δ15Norg(‰)
0 1 2 3 4 5 6 7
TOC (wt%)
45 55 65 75 85 95
TIC (CaCO3%)
Legend
Limestone
Marlstone
Silicified Lenses
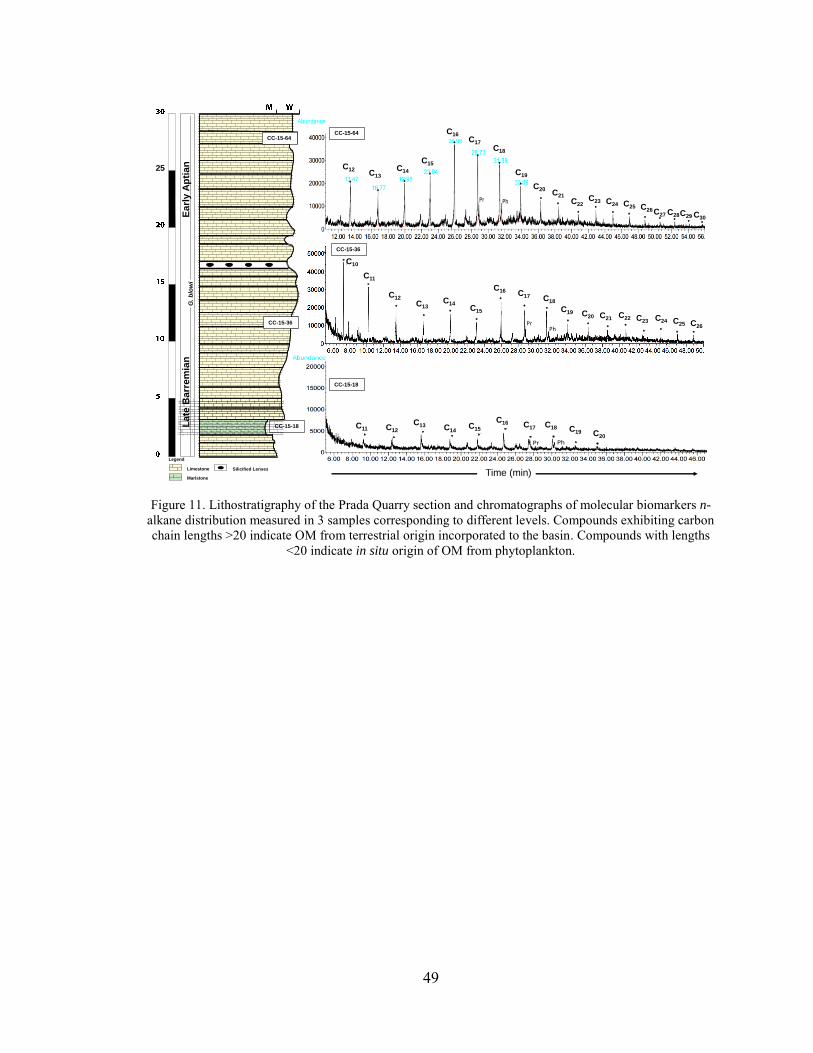
49
Figure 11. Lithostratigraphy of the Prada Quarry section and chromatographs of molecular biomarkers n-
alkane distribution measured in 3 samples corresponding to different levels. Compounds exhibiting carbon chain lengths >20 indicate OM from terrestrial origin incorporated to the basin. Compounds with lengths
<20 indicate in situ origin of OM from phytoplankton.
CC-15-64
C20
C19
C18
C17
C16
C15
C14C13
C12
Pr PhC21
C22C23 C24 C25 C26 C27 C28 C29 C30
C10
CC-15-36
C20C19
C18C17
C16
C15
C14C13
C12
C11
PrPh
C21 C22C23 C24 C25
C26
Late
Ba
rre
mia
n
Earl
y A
pti
an
G.
blo
wi
C16C15C14
C13C11
CC-15-18
C17 C18 C19C12 C20
Pr Ph
Time (min)
CC-15-36
CC-15-18
CC-15-64
C25
C20
C12C13
C14
C15
C16C17
C18
C19
C20C21
C22C23 C24 C25 C26
C23 C24C22C21
C20C19
C18
C17
C15
C16
C14C13
C12
C11
C26
C19C18C17
C16C15C14
C13C12C11
C27 C28C29 C30
C10
CC-15-64
CC-15-36
CC-15-18
25
CC-15-64
CC-15-36
Legend
Limestone
Marlstone
Silicified Lenses
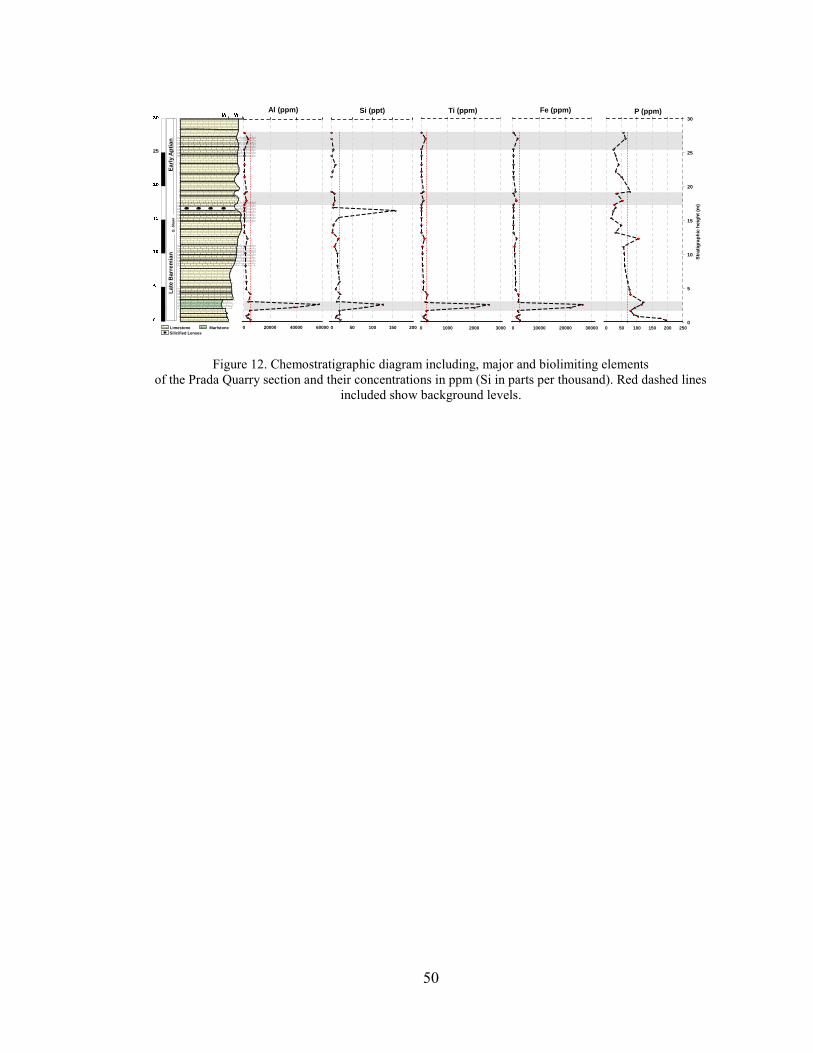
50
Figure 12. Chemostratigraphic diagram including, major and biolimiting elements of the Prada Quarry section and their concentrations in ppm (Si in parts per thousand). Red dashed lines
included show background levels.
0
5
10
15
20
25
30
0 50 100 150 200 250
P (ppm)
0 10000 20000 30000
Fe (ppm)
0 1000 2000 3000
Ti (ppm)
0 50 100 150 200
Si (ppt)
0 20000 40000 60000
Al (ppm)
25
Str
ati
gra
ph
ic h
eig
ht
(m)
Late
Barr
em
ian
E
arl
y A
pti
an
G.
blo
wi
- -Limestone Marlstone
- Silicified Lenses
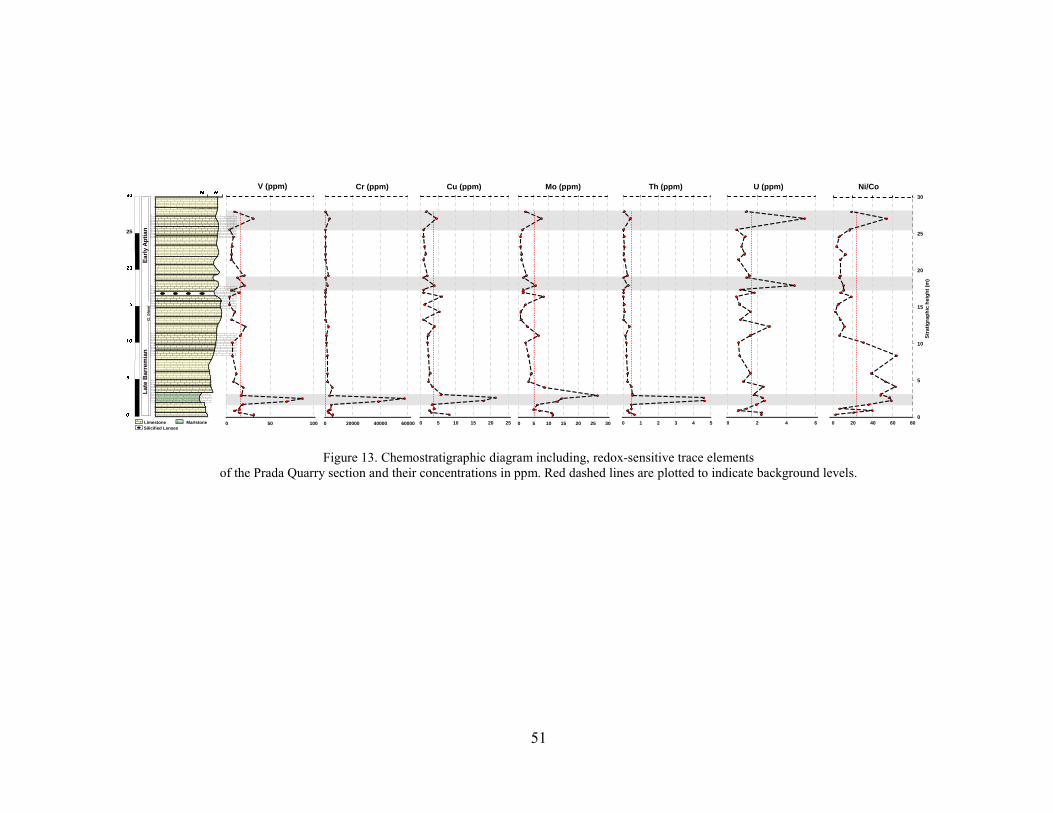
51
Figure 13. Chemostratigraphic diagram including, redox-sensitive trace elements of the Prada Quarry section and their concentrations in ppm. Red dashed lines are plotted to indicate background levels.
0 2 4 6
U (ppm)
25
0
5
10
15
20
25
30
0 20 40 60 80
Ni/Co
0 50 100
V (ppm)
0 5 10 15 20 25 30
Mo (ppm)
0 5 10 15 20 25
Cu (ppm)
0 20000 40000 60000
Cr (ppm)
Str
ati
gra
ph
ic h
eig
ht
(m)
Late
Barr
em
ian
E
arl
y A
pti
an
G.
blo
wi
- -Limestone Marlstone
- Silicified Lenses0 1 2 3 4 5
Th (ppm)
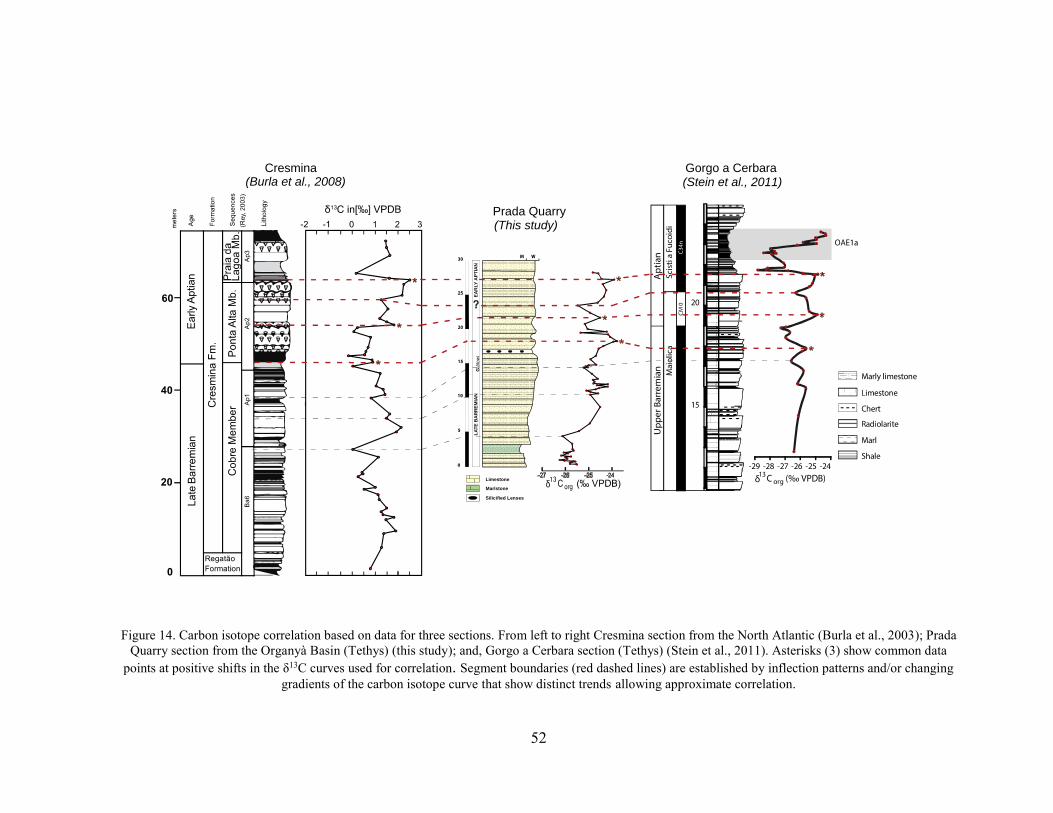
52
Figure 14. Carbon isotope correlation based on data for three sections. From left to right Cresmina section from the North Atlantic (Burla et al., 2003); Prada
Quarry section from the Organyà Basin (Tethys) (this study); and, Gorgo a Cerbara section (Tethys) (Stein et al., 2011). Asterisks (3) show common data points at positive shifts in the δ13C curves used for correlation. Segment boundaries (red dashed lines) are established by inflection patterns and/or changing
gradients of the carbon isotope curve that show distinct trends allowing approximate correlation.
Limestone
Marlstone
Cresmina
Prada Quarry
LA
TE
BA
RR
EM
IAN
EA
RLY
AP
TIA
N
Gorgo a Cerbara
(This study)
(Stein et al., 2011)(Burla et al., 2008)
Silicified Lenses
G.b
low
i
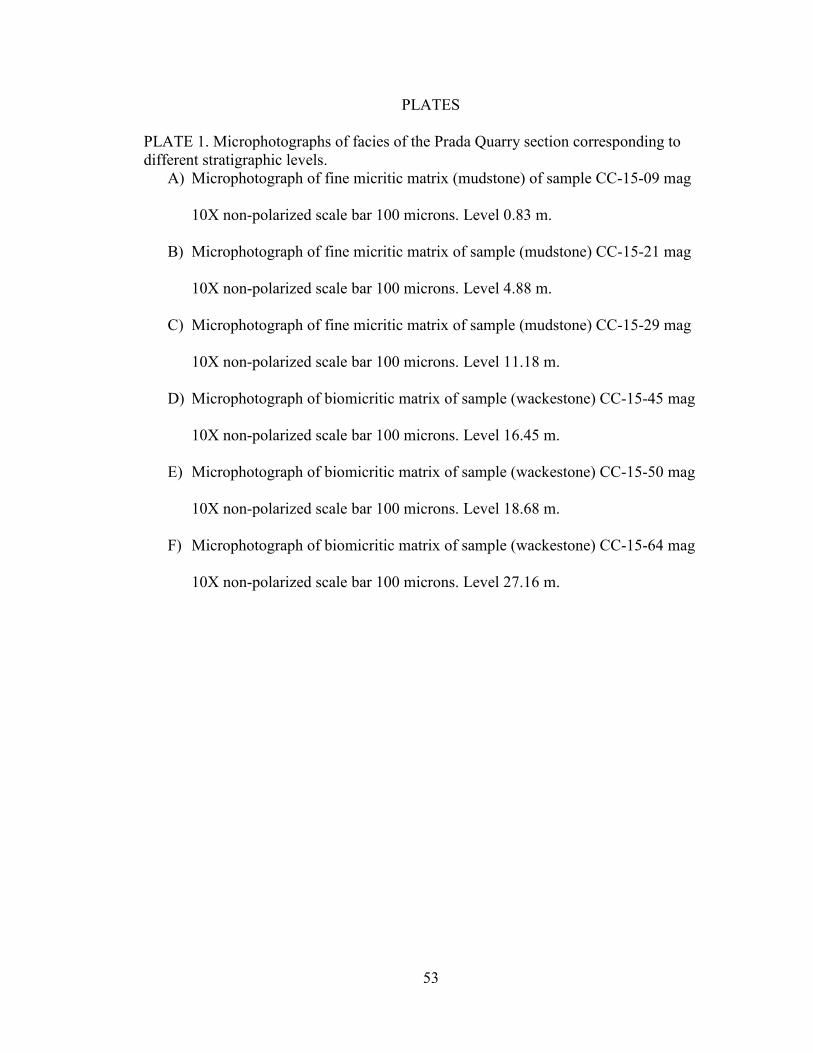
53
PLATES PLATE 1. Microphotographs of facies of the Prada Quarry section corresponding to different stratigraphic levels.
A) Microphotograph of fine micritic matrix (mudstone) of sample CC-15-09 mag
10X non-polarized scale bar 100 microns. Level 0.83 m.
B) Microphotograph of fine micritic matrix of sample (mudstone) CC-15-21 mag
10X non-polarized scale bar 100 microns. Level 4.88 m.
C) Microphotograph of fine micritic matrix of sample (mudstone) CC-15-29 mag
10X non-polarized scale bar 100 microns. Level 11.18 m.
D) Microphotograph of biomicritic matrix of sample (wackestone) CC-15-45 mag
10X non-polarized scale bar 100 microns. Level 16.45 m.
E) Microphotograph of biomicritic matrix of sample (wackestone) CC-15-50 mag
10X non-polarized scale bar 100 microns. Level 18.68 m.
F) Microphotograph of biomicritic matrix of sample (wackestone) CC-15-64 mag
10X non-polarized scale bar 100 microns. Level 27.16 m.
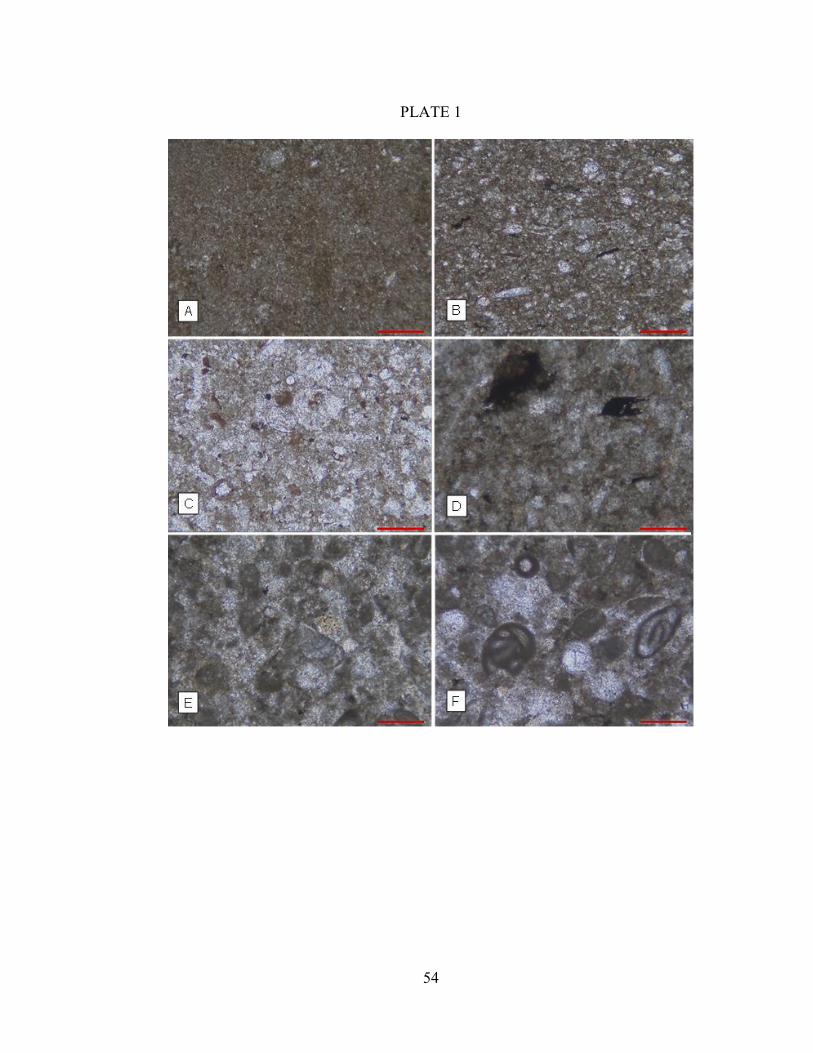
54
PLATE 1
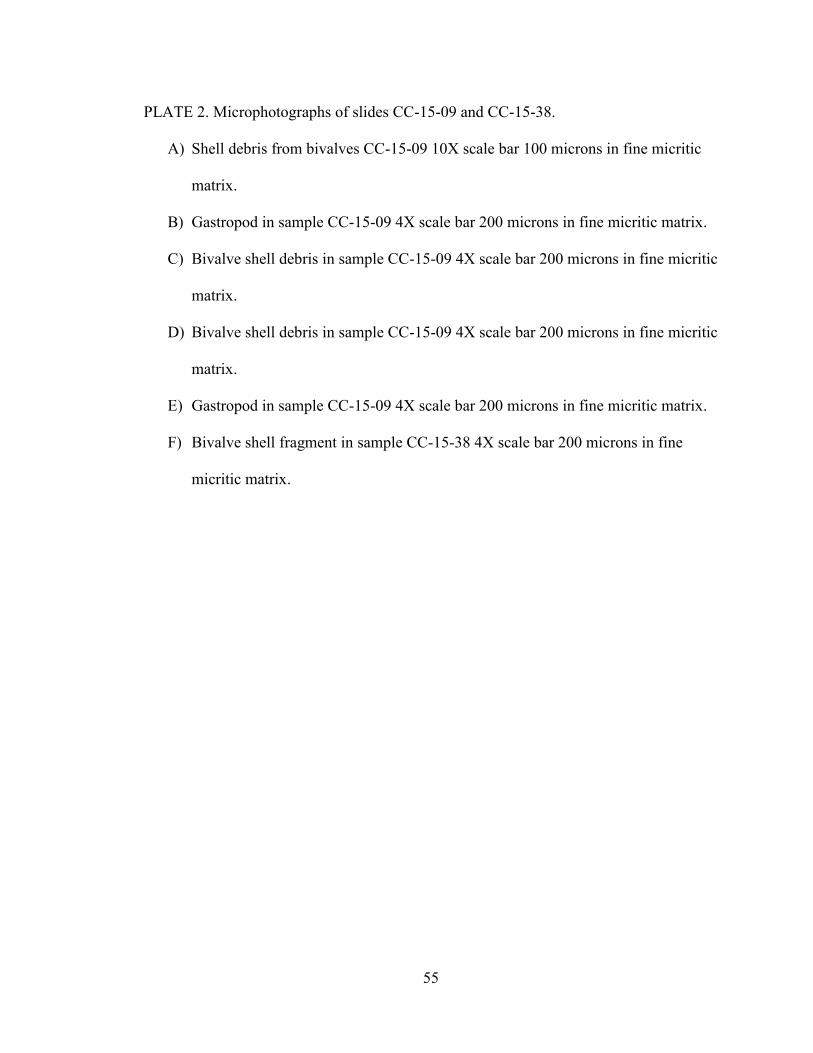
55
PLATE 2. Microphotographs of slides CC-15-09 and CC-15-38.
A) Shell debris from bivalves CC-15-09 10X scale bar 100 microns in fine micritic
matrix.
B) Gastropod in sample CC-15-09 4X scale bar 200 microns in fine micritic matrix.
C) Bivalve shell debris in sample CC-15-09 4X scale bar 200 microns in fine micritic
matrix.
D) Bivalve shell debris in sample CC-15-09 4X scale bar 200 microns in fine micritic
matrix.
E) Gastropod in sample CC-15-09 4X scale bar 200 microns in fine micritic matrix.
F) Bivalve shell fragment in sample CC-15-38 4X scale bar 200 microns in fine
micritic matrix.
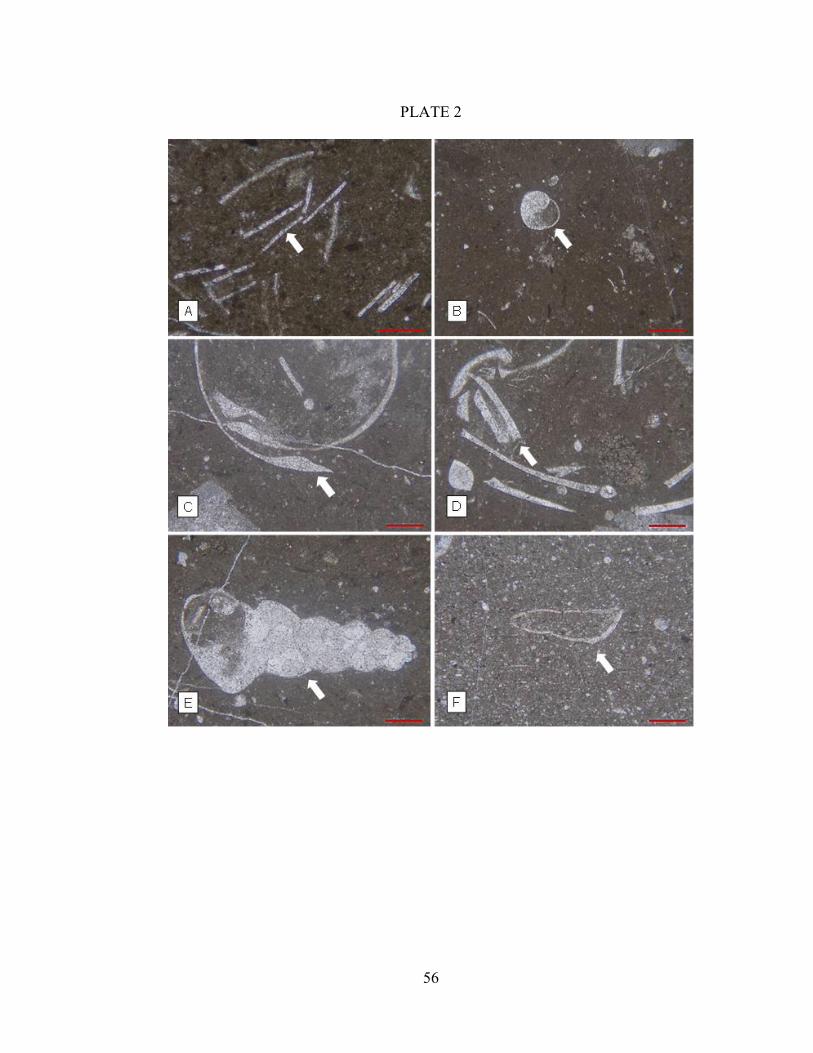
56
PLATE 2
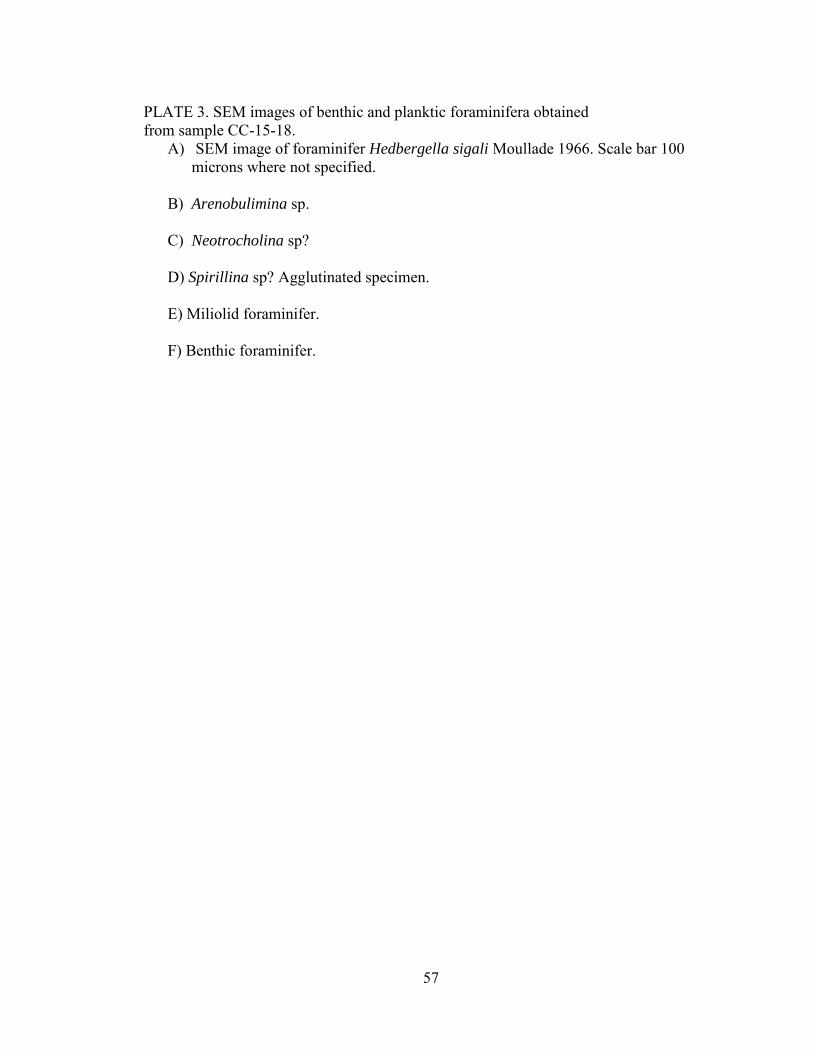
57
PLATE 3. SEM images of benthic and planktic foraminifera obtained from sample CC-15-18.
A) SEM image of foraminifer Hedbergella sigali Moullade 1966. Scale bar 100 microns where not specified.
B) Arenobulimina sp.
C) Neotrocholina sp?
D) Spirillina sp? Agglutinated specimen.
E) Miliolid foraminifer.
F) Benthic foraminifer.
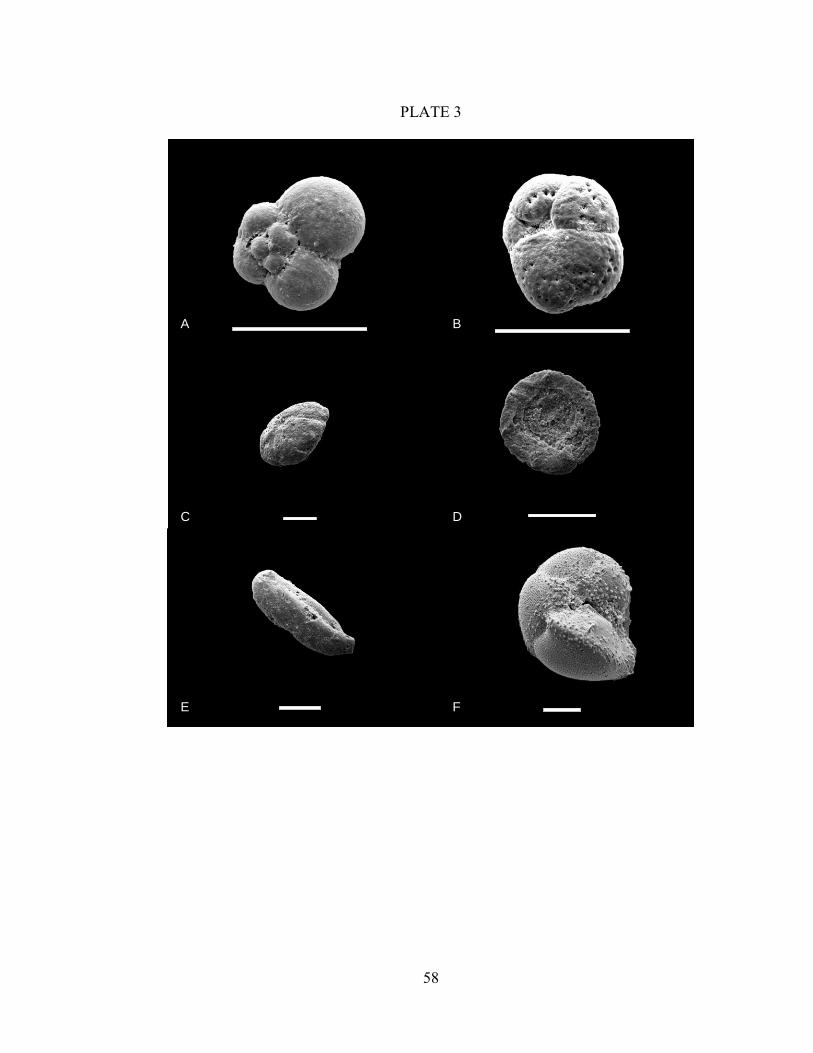
58
PLATE 3
A B
C D
E F
59
PLATE 4. SEM images of foraminifera obtained from sample CC-15-18. A) Miliolid.
B) Neotrocholina sp.
C) Nezzazatinella sp
D) Lagenid.
E) Hedbergella sigali Moullade.
F) Hedbergella sigali Moullade.
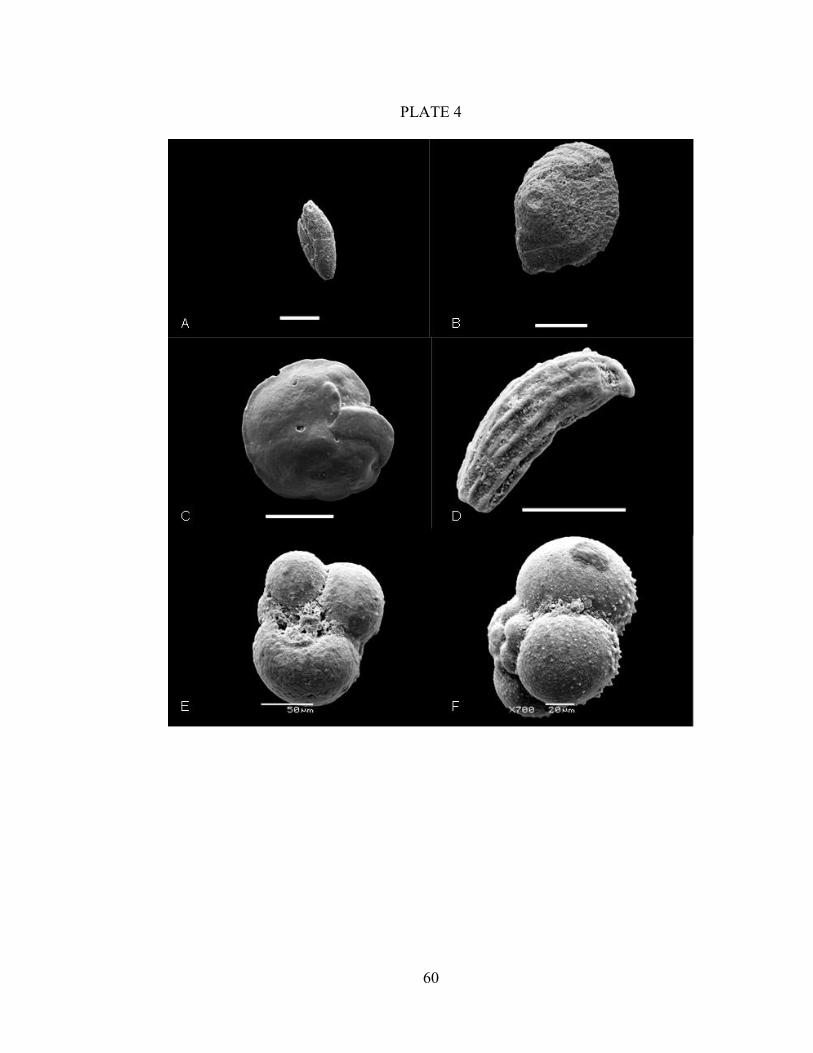
60
PLATE 4
61
PLATE 5. SEM images of organisms and biogenic fragments obtained from sample CC-15-18, CC-15-50, and CC-15-63.
A) Uniserial benthic foraminifer. Specimen from sample CC-15-18
B) Orbiculiforma sp? Radiolarian specimen from sample CC-15-63.
C) Gastropod skeletal fragment sample CC-15-50
D) Orbiculiforma sp? Radiolarian specimen from sample CC-15-63.
E) Bioclast from sample CC-15-50.
F) Calcified sponge spicule from sample CC-15-50.
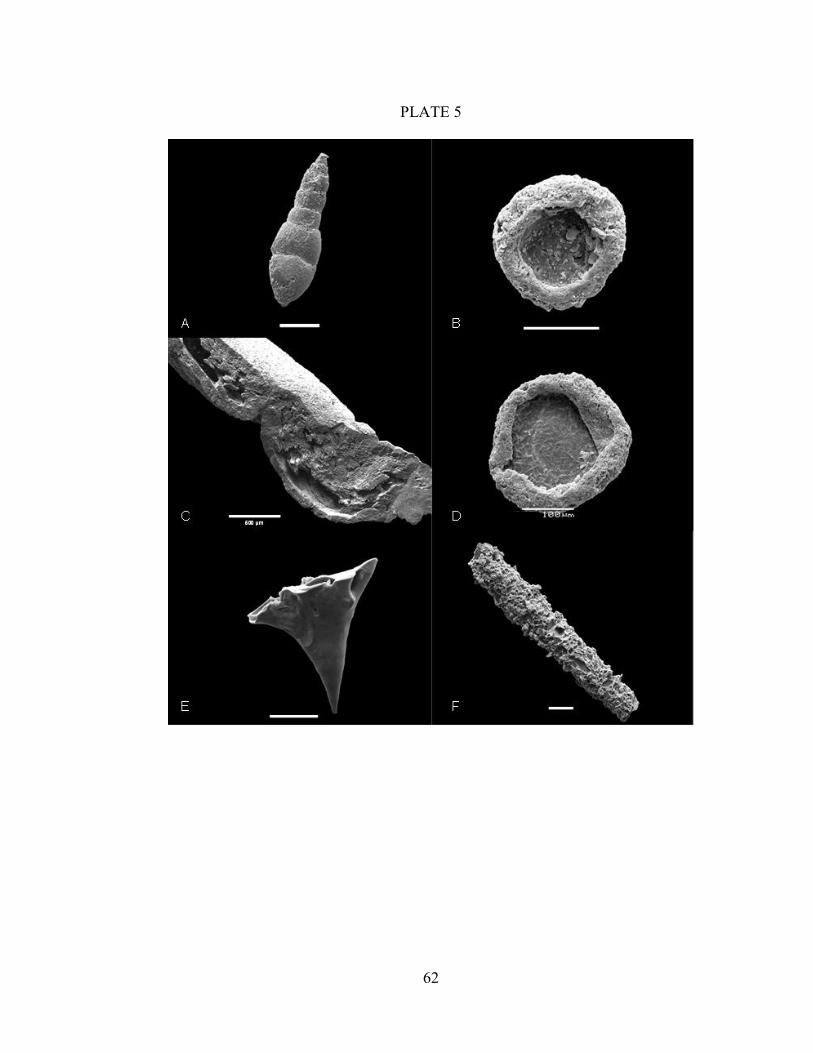
62
PLATE 5
63
PLATE 6. Microphotographs of slides CC-15-49, CC-15-63, CC-15-64, and CC-15-65.
A) Organic matter in the form of higher plant remains in sample CC-15-63 10X scale bar 100 microns.
B) Calcified sponge spicule in sample CC-15-49 4X scale bar 200 microns.
C) Calcified sponge spicules in sample CC-15-64 scale bar 200 microns.
D) Ostracod in sample CC-15-65 10X scale bar 100 microns.
E) Miliolid foraminifer. Sample CC-15-64 10X scale bar 100 microns.
F) Miliolid foraminifer. Sample CC-15-64 10X scale bar 100 microns.
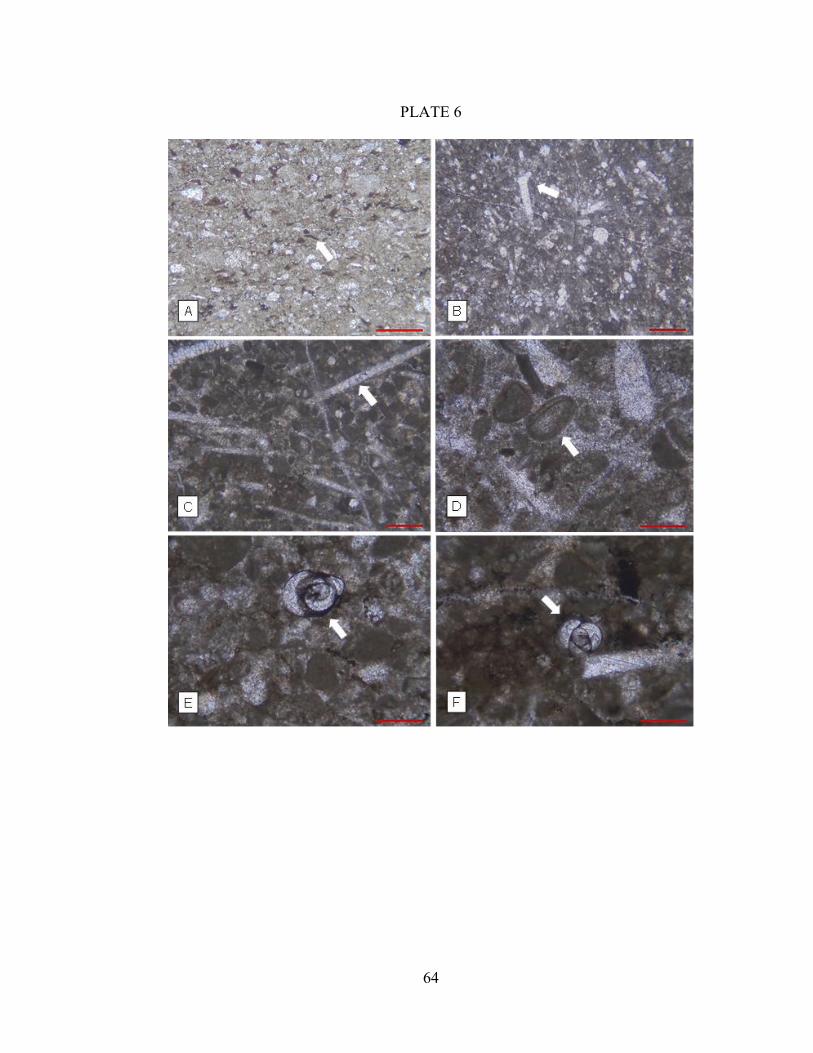
64
PLATE 6
65
PLATE 7. Microphotographs of slide CC-15-64.
A) Glomospira sp Sample CC-15-64 10X scale bar 100 microns.
B) Arenobulimina sp? Sample CC-15-64 10X scale bar 100 microns.
C) Skeletal fragment of benthic organism in sample CC-15-64 10X scale bar 100
microns.
D) Triloculina sp? Sample CC-15-64 10X scale bar 100 microns.
E) Spiroloculina sp? Sample CC-15-64 10X scale bar 100 microns.
F) Benthic foraminifer. Sample CC-15-64 10X scale bar 100 microns.
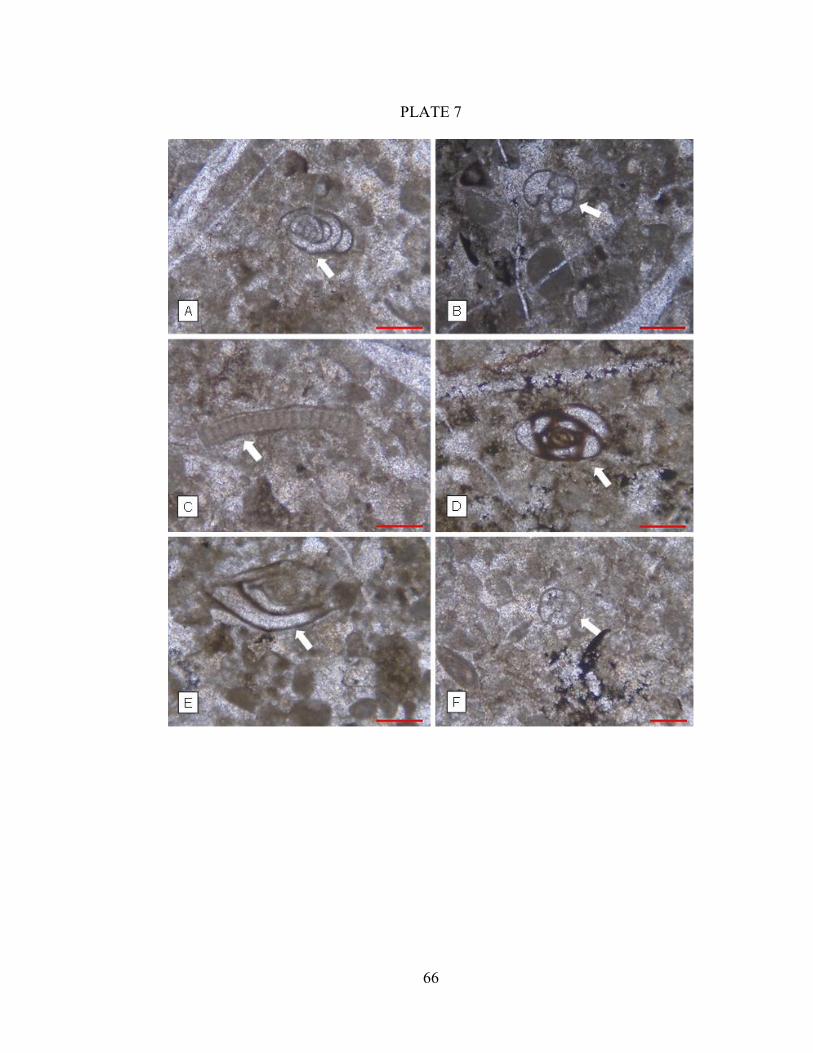
66
PLATE 7
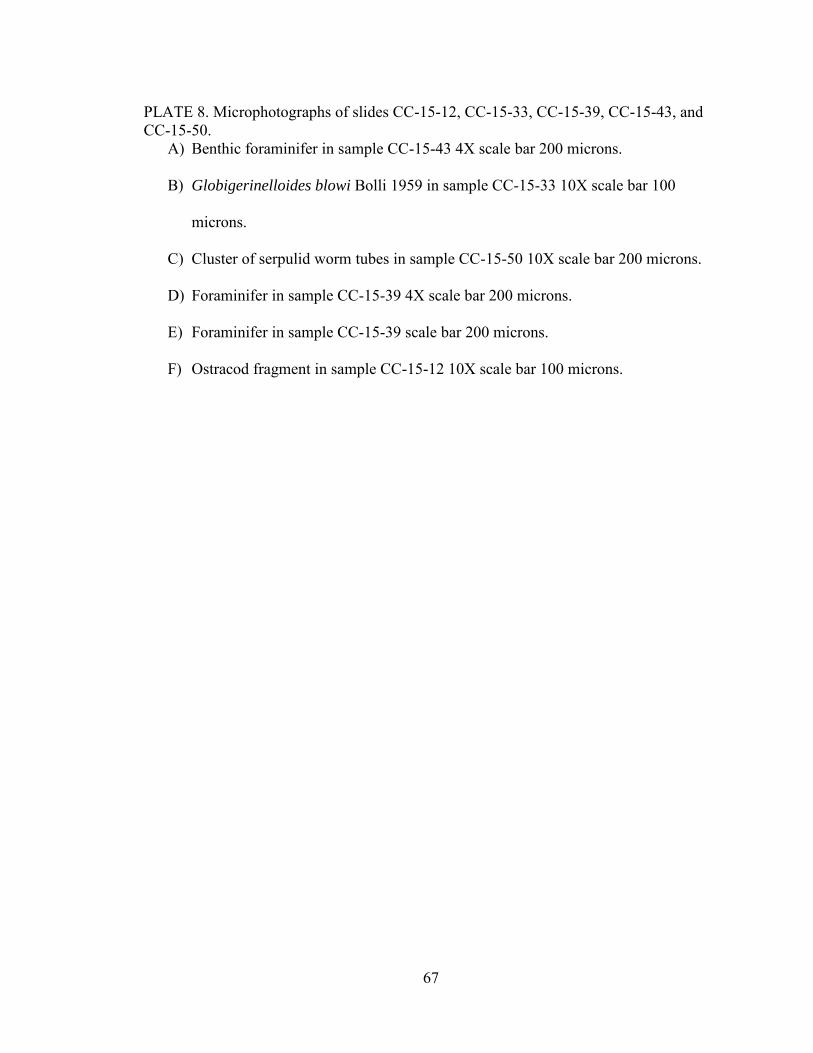
67
PLATE 8. Microphotographs of slides CC-15-12, CC-15-33, CC-15-39, CC-15-43, and CC-15-50.
A) Benthic foraminifer in sample CC-15-43 4X scale bar 200 microns.
B) Globigerinelloides blowi Bolli 1959 in sample CC-15-33 10X scale bar 100
microns.
C) Cluster of serpulid worm tubes in sample CC-15-50 10X scale bar 200 microns.
D) Foraminifer in sample CC-15-39 4X scale bar 200 microns.
E) Foraminifer in sample CC-15-39 scale bar 200 microns.
F) Ostracod fragment in sample CC-15-12 10X scale bar 100 microns.
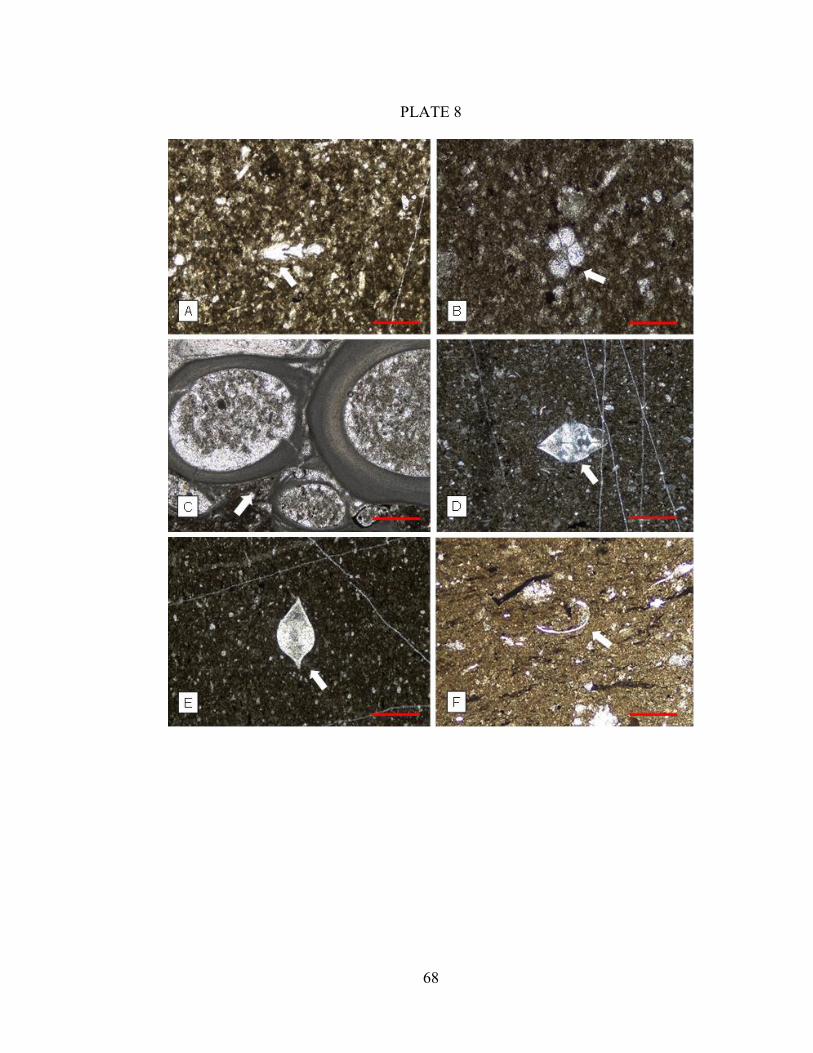
68
PLATE 8
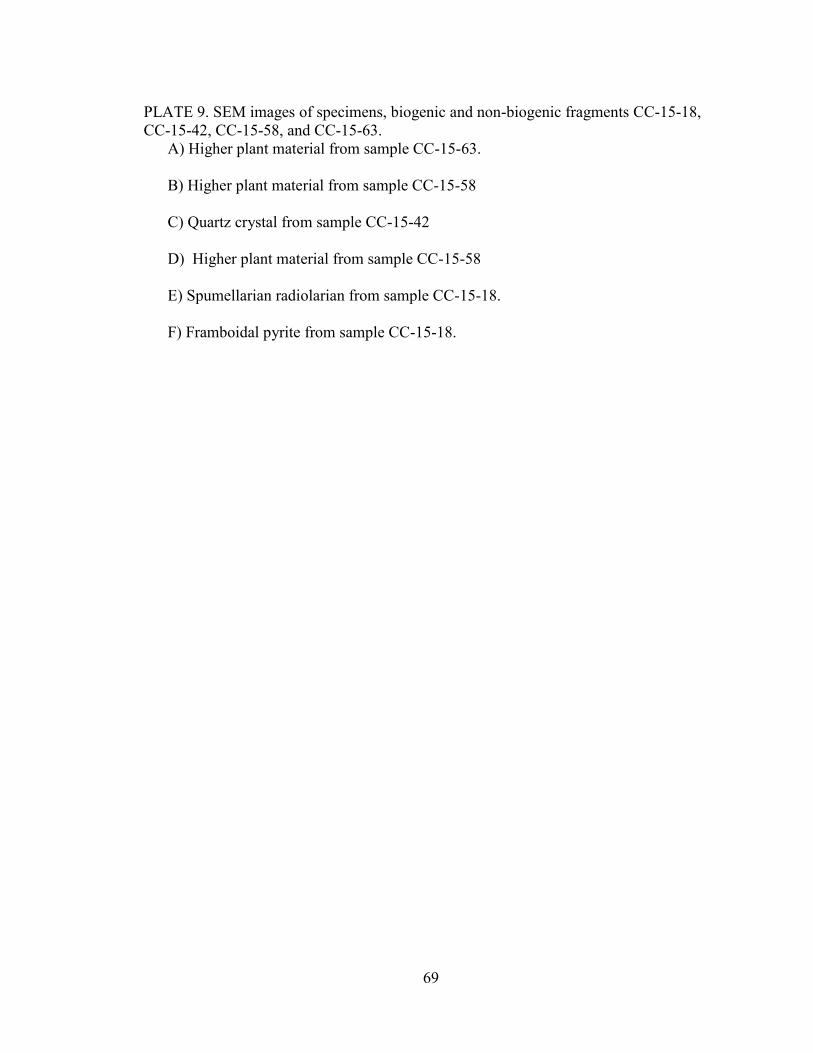
69
PLATE 9. SEM images of specimens, biogenic and non-biogenic fragments CC-15-18, CC-15-42, CC-15-58, and CC-15-63. A) Higher plant material from sample CC-15-63.
B) Higher plant material from sample CC-15-58
C) Quartz crystal from sample CC-15-42
D) Higher plant material from sample CC-15-58
E) Spumellarian radiolarian from sample CC-15-18.
F) Framboidal pyrite from sample CC-15-18.
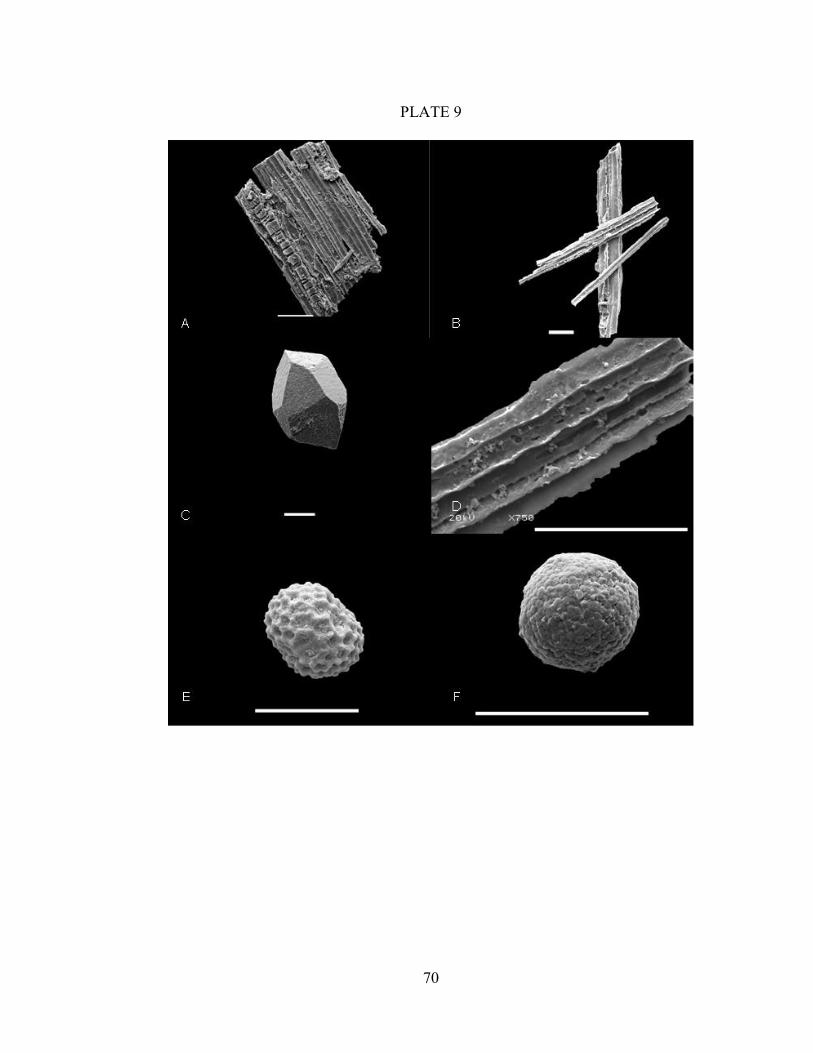
70
PLATE 9
71
PLATE 10. Microphotographs of slides CC-15-03, CC-15-05, and CC-15-50.
A) Benthic foraminifer in sample CC-15-03 10X scale bar 100 microns.
B) Glomospira sp? Sample CC-15-05 10X scale bar 100 microns.
C) Bitumen filled vug in sample CC-15-05 10X scale bar 100 microns.
D) Unidentified fragments (roveacrinid?) in sample CC-15-05 scale bar 100 microns.
E) Bioclast (microbial accumulation?) in sample CC-15-05 scale bar 100 microns.
F) Ammonite fragment in sample CC-15-50 4X scale bar 200 microns.
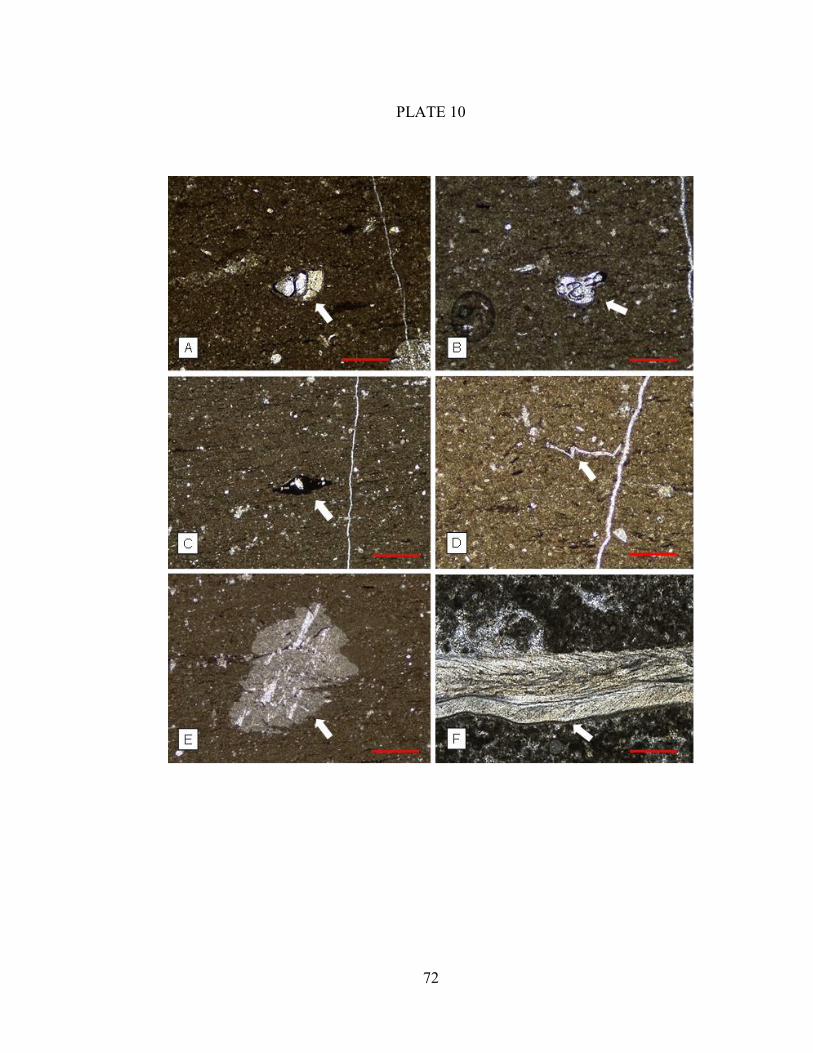
72
PLATE 10
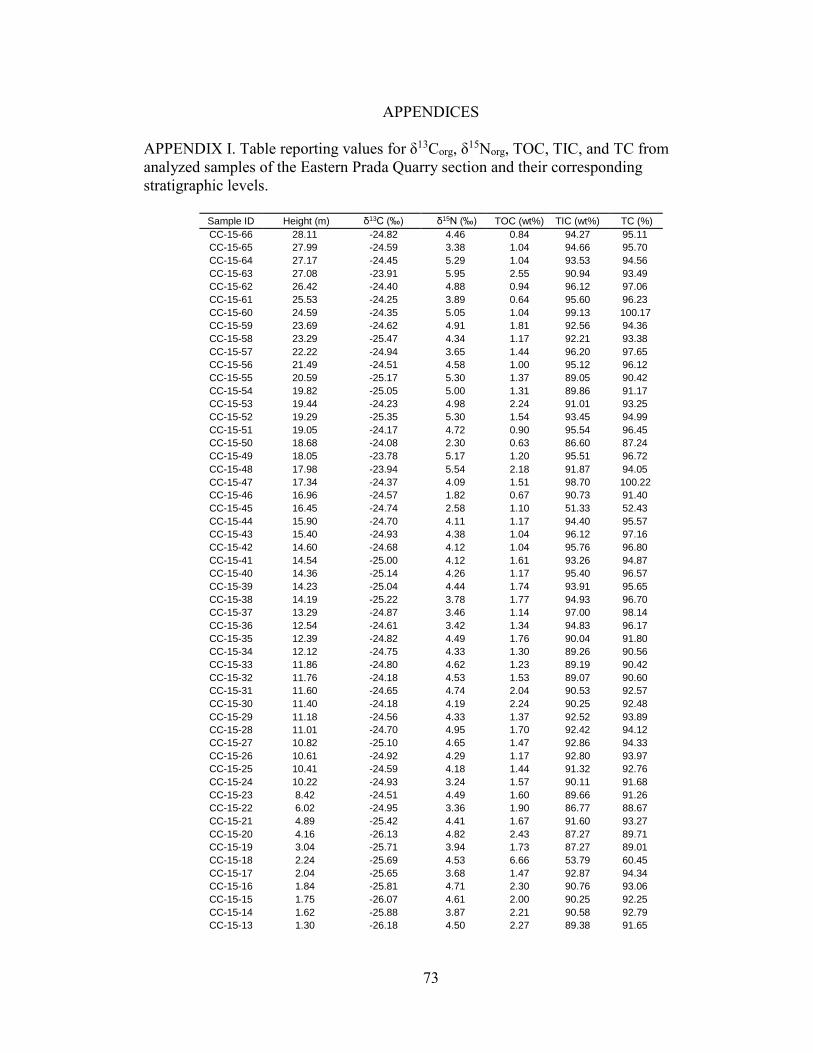
73
APPENDICES
APPENDIX I. Table reporting values for δ13Corg, δ15Norg, TOC, TIC, and TC from analyzed samples of the Eastern Prada Quarry section and their corresponding stratigraphic levels.
Sample ID Height (m) δ13C (‰) δ15N (‰) TOC (wt%) TIC (wt%) TC (%)
CC-15-66 28.11 -24.82 4.46 0.84 94.27 95.11
CC-15-65 27.99 -24.59 3.38 1.04 94.66 95.70
CC-15-64 27.17 -24.45 5.29 1.04 93.53 94.56
CC-15-63 27.08 -23.91 5.95 2.55 90.94 93.49
CC-15-62 26.42 -24.40 4.88 0.94 96.12 97.06
CC-15-61 25.53 -24.25 3.89 0.64 95.60 96.23
CC-15-60 24.59 -24.35 5.05 1.04 99.13 100.17
CC-15-59 23.69 -24.62 4.91 1.81 92.56 94.36
CC-15-58 23.29 -25.47 4.34 1.17 92.21 93.38
CC-15-57 22.22 -24.94 3.65 1.44 96.20 97.65
CC-15-56 21.49 -24.51 4.58 1.00 95.12 96.12
CC-15-55 20.59 -25.17 5.30 1.37 89.05 90.42
CC-15-54 19.82 -25.05 5.00 1.31 89.86 91.17
CC-15-53 19.44 -24.23 4.98 2.24 91.01 93.25
CC-15-52 19.29 -25.35 5.30 1.54 93.45 94.99
CC-15-51 19.05 -24.17 4.72 0.90 95.54 96.45
CC-15-50 18.68 -24.08 2.30 0.63 86.60 87.24
CC-15-49 18.05 -23.78 5.17 1.20 95.51 96.72
CC-15-48 17.98 -23.94 5.54 2.18 91.87 94.05
CC-15-47 17.34 -24.37 4.09 1.51 98.70 100.22
CC-15-46 16.96 -24.57 1.82 0.67 90.73 91.40
CC-15-45 16.45 -24.74 2.58 1.10 51.33 52.43
CC-15-44 15.90 -24.70 4.11 1.17 94.40 95.57
CC-15-43 15.40 -24.93 4.38 1.04 96.12 97.16
CC-15-42 14.60 -24.68 4.12 1.04 95.76 96.80
CC-15-41 14.54 -25.00 4.12 1.61 93.26 94.87
CC-15-40 14.36 -25.14 4.26 1.17 95.40 96.57
CC-15-39 14.23 -25.04 4.44 1.74 93.91 95.65
CC-15-38 14.19 -25.22 3.78 1.77 94.93 96.70
CC-15-37 13.29 -24.87 3.46 1.14 97.00 98.14
CC-15-36 12.54 -24.61 3.42 1.34 94.83 96.17
CC-15-35 12.39 -24.82 4.49 1.76 90.04 91.80
CC-15-34 12.12 -24.75 4.33 1.30 89.26 90.56
CC-15-33 11.86 -24.80 4.62 1.23 89.19 90.42
CC-15-32 11.76 -24.18 4.53 1.53 89.07 90.60
CC-15-31 11.60 -24.65 4.74 2.04 90.53 92.57
CC-15-30 11.40 -24.18 4.19 2.24 90.25 92.48
CC-15-29 11.18 -24.56 4.33 1.37 92.52 93.89
CC-15-28 11.01 -24.70 4.95 1.70 92.42 94.12
CC-15-27 10.82 -25.10 4.65 1.47 92.86 94.33
CC-15-26 10.61 -24.92 4.29 1.17 92.80 93.97
CC-15-25 10.41 -24.59 4.18 1.44 91.32 92.76
CC-15-24 10.22 -24.93 3.24 1.57 90.11 91.68
CC-15-23 8.42 -24.51 4.49 1.60 89.66 91.26
CC-15-22 6.02 -24.95 3.36 1.90 86.77 88.67
CC-15-21 4.89 -25.42 4.41 1.67 91.60 93.27
CC-15-20 4.16 -26.13 4.82 2.43 87.27 89.71
CC-15-19 3.04 -25.71 3.94 1.73 87.27 89.01
CC-15-18 2.24 -25.69 4.53 6.66 53.79 60.45
CC-15-17 2.04 -25.65 3.68 1.47 92.87 94.34
CC-15-16 1.84 -25.81 4.71 2.30 90.76 93.06
CC-15-15 1.75 -26.07 4.61 2.00 90.25 92.25
CC-15-14 1.62 -25.88 3.87 2.21 90.58 92.79
CC-15-13 1.30 -26.18 4.50 2.27 89.38 91.65
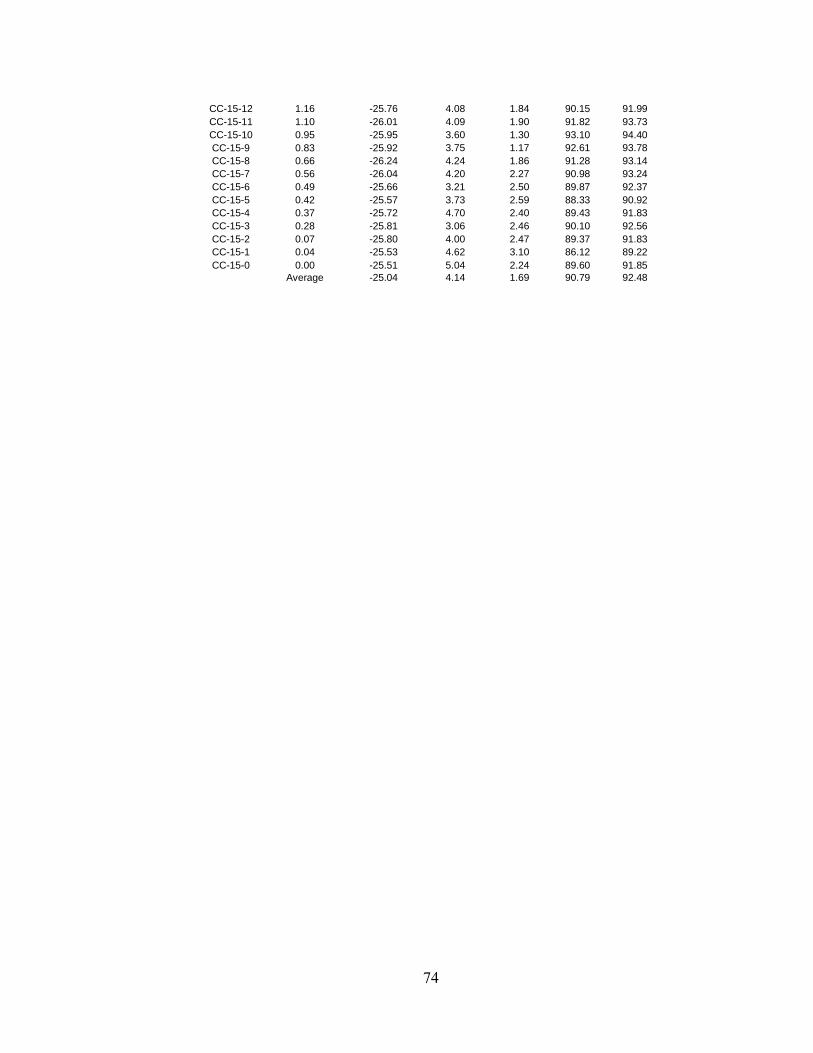
74
CC-15-12 1.16 -25.76 4.08 1.84 90.15 91.99
CC-15-11 1.10 -26.01 4.09 1.90 91.82 93.73
CC-15-10 0.95 -25.95 3.60 1.30 93.10 94.40
CC-15-9 0.83 -25.92 3.75 1.17 92.61 93.78
CC-15-8 0.66 -26.24 4.24 1.86 91.28 93.14
CC-15-7 0.56 -26.04 4.20 2.27 90.98 93.24
CC-15-6 0.49 -25.66 3.21 2.50 89.87 92.37
CC-15-5 0.42 -25.57 3.73 2.59 88.33 90.92
CC-15-4 0.37 -25.72 4.70 2.40 89.43 91.83
CC-15-3 0.28 -25.81 3.06 2.46 90.10 92.56
CC-15-2 0.07 -25.80 4.00 2.47 89.37 91.83
CC-15-1 0.04 -25.53 4.62 3.10 86.12 89.22
CC-15-0 0.00 -25.51 5.04 2.24 89.60 91.85 Average -25.04 4.14 1.69 90.79 92.48
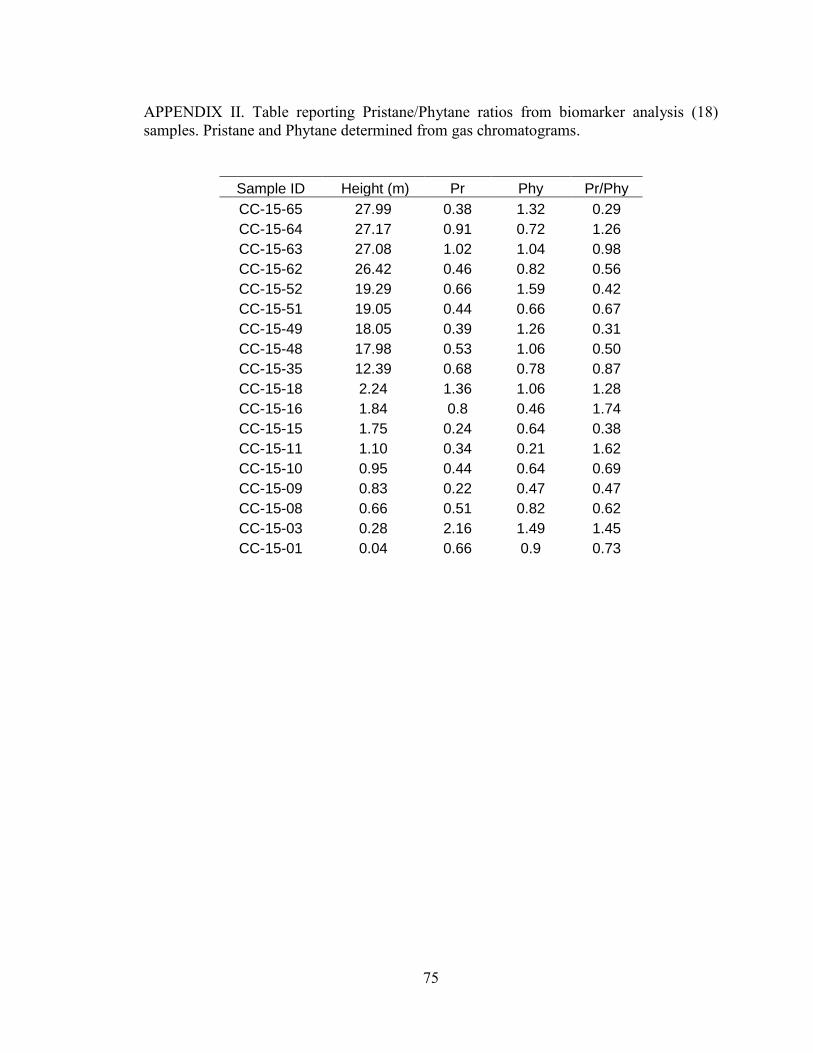
75
APPENDIX II. Table reporting Pristane/Phytane ratios from biomarker analysis (18) samples. Pristane and Phytane determined from gas chromatograms.
Sample ID Height (m) Pr Phy Pr/Phy
CC-15-65 27.99 0.38 1.32 0.29
CC-15-64 27.17 0.91 0.72 1.26
CC-15-63 27.08 1.02 1.04 0.98
CC-15-62 26.42 0.46 0.82 0.56
CC-15-52 19.29 0.66 1.59 0.42
CC-15-51 19.05 0.44 0.66 0.67
CC-15-49 18.05 0.39 1.26 0.31
CC-15-48 17.98 0.53 1.06 0.50
CC-15-35 12.39 0.68 0.78 0.87
CC-15-18 2.24 1.36 1.06 1.28
CC-15-16 1.84 0.8 0.46 1.74
CC-15-15 1.75 0.24 0.64 0.38
CC-15-11 1.10 0.34 0.21 1.62
CC-15-10 0.95 0.44 0.64 0.69
CC-15-09 0.83 0.22 0.47 0.47
CC-15-08 0.66 0.51 0.82 0.62
CC-15-03 0.28 2.16 1.49 1.45
CC-15-01 0.04 0.66 0.9 0.73
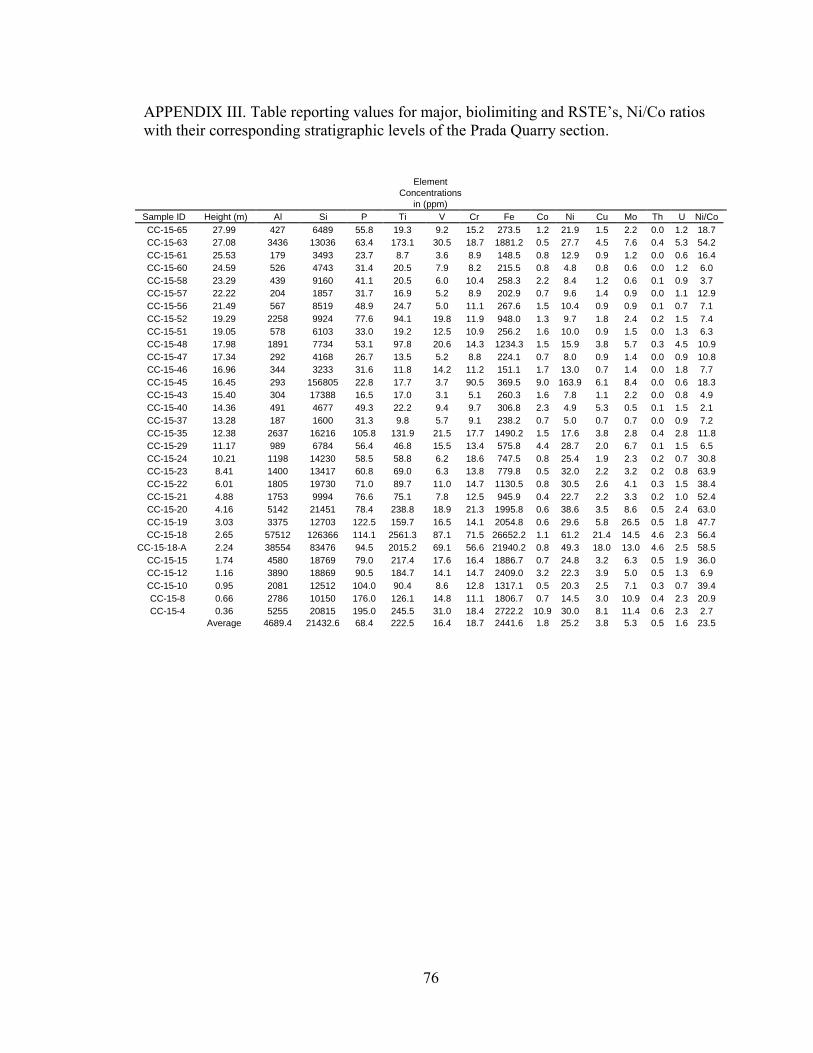
76
APPENDIX III. Table reporting values for major, biolimiting and RSTE’s, Ni/Co ratios with their corresponding stratigraphic levels of the Prada Quarry section.
Element
Concentrations
in (ppm)
Sample ID Height (m) Al Si P Ti V Cr Fe Co Ni Cu Mo Th U Ni/Co
CC-15-65 27.99 427 6489 55.8 19.3 9.2 15.2 273.5 1.2 21.9 1.5 2.2 0.0 1.2 18.7
CC-15-63 27.08 3436 13036 63.4 173.1 30.5 18.7 1881.2 0.5 27.7 4.5 7.6 0.4 5.3 54.2
CC-15-61 25.53 179 3493 23.7 8.7 3.6 8.9 148.5 0.8 12.9 0.9 1.2 0.0 0.6 16.4
CC-15-60 24.59 526 4743 31.4 20.5 7.9 8.2 215.5 0.8 4.8 0.8 0.6 0.0 1.2 6.0
CC-15-58 23.29 439 9160 41.1 20.5 6.0 10.4 258.3 2.2 8.4 1.2 0.6 0.1 0.9 3.7
CC-15-57 22.22 204 1857 31.7 16.9 5.2 8.9 202.9 0.7 9.6 1.4 0.9 0.0 1.1 12.9
CC-15-56 21.49 567 8519 48.9 24.7 5.0 11.1 267.6 1.5 10.4 0.9 0.9 0.1 0.7 7.1
CC-15-52 19.29 2258 9924 77.6 94.1 19.8 11.9 948.0 1.3 9.7 1.8 2.4 0.2 1.5 7.4
CC-15-51 19.05 578 6103 33.0 19.2 12.5 10.9 256.2 1.6 10.0 0.9 1.5 0.0 1.3 6.3
CC-15-48 17.98 1891 7734 53.1 97.8 20.6 14.3 1234.3 1.5 15.9 3.8 5.7 0.3 4.5 10.9
CC-15-47 17.34 292 4168 26.7 13.5 5.2 8.8 224.1 0.7 8.0 0.9 1.4 0.0 0.9 10.8
CC-15-46 16.96 344 3233 31.6 11.8 14.2 11.2 151.1 1.7 13.0 0.7 1.4 0.0 1.8 7.7
CC-15-45 16.45 293 156805 22.8 17.7 3.7 90.5 369.5 9.0 163.9 6.1 8.4 0.0 0.6 18.3
CC-15-43 15.40 304 17388 16.5 17.0 3.1 5.1 260.3 1.6 7.8 1.1 2.2 0.0 0.8 4.9
CC-15-40 14.36 491 4677 49.3 22.2 9.4 9.7 306.8 2.3 4.9 5.3 0.5 0.1 1.5 2.1
CC-15-37 13.28 187 1600 31.3 9.8 5.7 9.1 238.2 0.7 5.0 0.7 0.7 0.0 0.9 7.2
CC-15-35 12.38 2637 16216 105.8 131.9 21.5 17.7 1490.2 1.5 17.6 3.8 2.8 0.4 2.8 11.8
CC-15-29 11.17 989 6784 56.4 46.8 15.5 13.4 575.8 4.4 28.7 2.0 6.7 0.1 1.5 6.5
CC-15-24 10.21 1198 14230 58.5 58.8 6.2 18.6 747.5 0.8 25.4 1.9 2.3 0.2 0.7 30.8
CC-15-23 8.41 1400 13417 60.8 69.0 6.3 13.8 779.8 0.5 32.0 2.2 3.2 0.2 0.8 63.9
CC-15-22 6.01 1805 19730 71.0 89.7 11.0 14.7 1130.5 0.8 30.5 2.6 4.1 0.3 1.5 38.4
CC-15-21 4.88 1753 9994 76.6 75.1 7.8 12.5 945.9 0.4 22.7 2.2 3.3 0.2 1.0 52.4
CC-15-20 4.16 5142 21451 78.4 238.8 18.9 21.3 1995.8 0.6 38.6 3.5 8.6 0.5 2.4 63.0
CC-15-19 3.03 3375 12703 122.5 159.7 16.5 14.1 2054.8 0.6 29.6 5.8 26.5 0.5 1.8 47.7
CC-15-18 2.65 57512 126366 114.1 2561.3 87.1 71.5 26652.2 1.1 61.2 21.4 14.5 4.6 2.3 56.4
CC-15-18-A 2.24 38554 83476 94.5 2015.2 69.1 56.6 21940.2 0.8 49.3 18.0 13.0 4.6 2.5 58.5
CC-15-15 1.74 4580 18769 79.0 217.4 17.6 16.4 1886.7 0.7 24.8 3.2 6.3 0.5 1.9 36.0
CC-15-12 1.16 3890 18869 90.5 184.7 14.1 14.7 2409.0 3.2 22.3 3.9 5.0 0.5 1.3 6.9
CC-15-10 0.95 2081 12512 104.0 90.4 8.6 12.8 1317.1 0.5 20.3 2.5 7.1 0.3 0.7 39.4
CC-15-8 0.66 2786 10150 176.0 126.1 14.8 11.1 1806.7 0.7 14.5 3.0 10.9 0.4 2.3 20.9
CC-15-4 0.36 5255 20815 195.0 245.5 31.0 18.4 2722.2 10.9 30.0 8.1 11.4 0.6 2.3 2.7
Average 4689.4 21432.6 68.4 222.5 16.4 18.7 2441.6 1.8 25.2 3.8 5.3 0.5 1.6 23.5
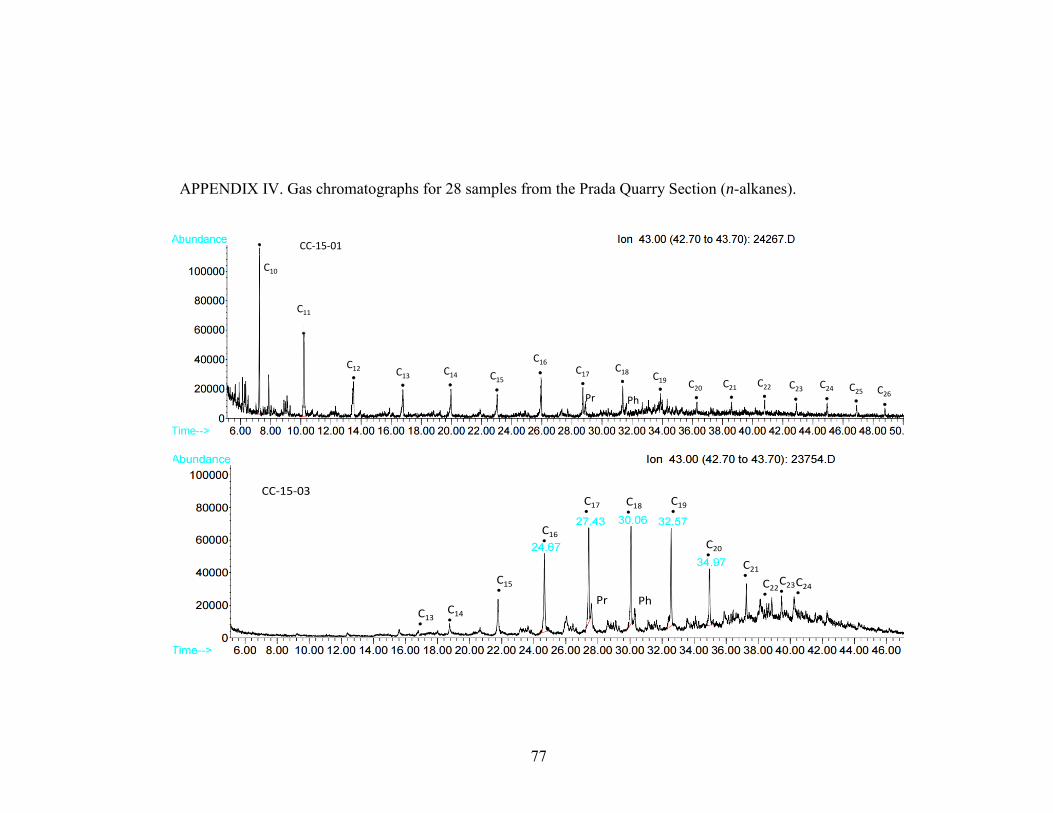
77
APPENDIX IV. Gas chromatographs for 28 samples from the Prada Quarry Section (n-alkanes).
C10
CC-15-01
C20
C19
C18C17
C16
C15C14C13
C12
C11
Pr Ph
C21 C22 C23 C24 C25 C26
CC-15-03
C16•
C17•
C18•
C19•
C20•
C21•
C22•
C15•
C14•
C13•
C23•
C24•
Pr Ph
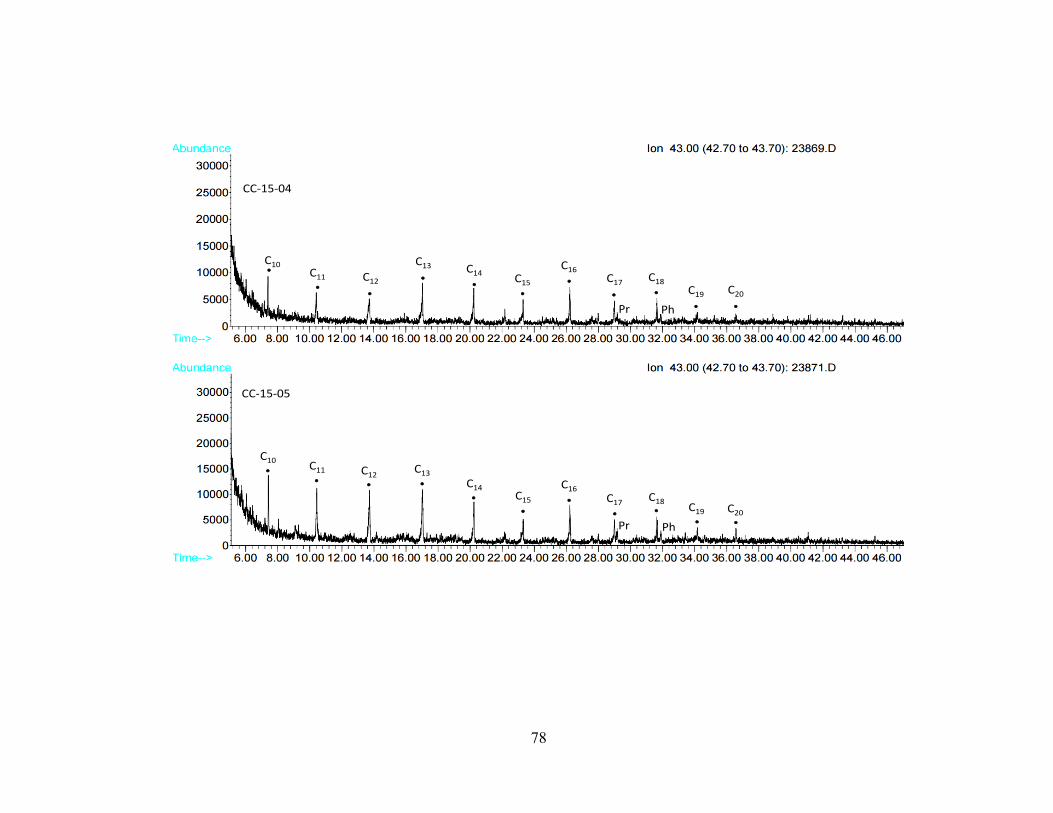
78
CC-15-04
C17 C18C19
C16C15
C14
C13
C12C11
C10
C20
Pr Ph
CC-15-05
C10
C20C19
C18C17
C16C15
C14
C13C12C11
Pr Ph
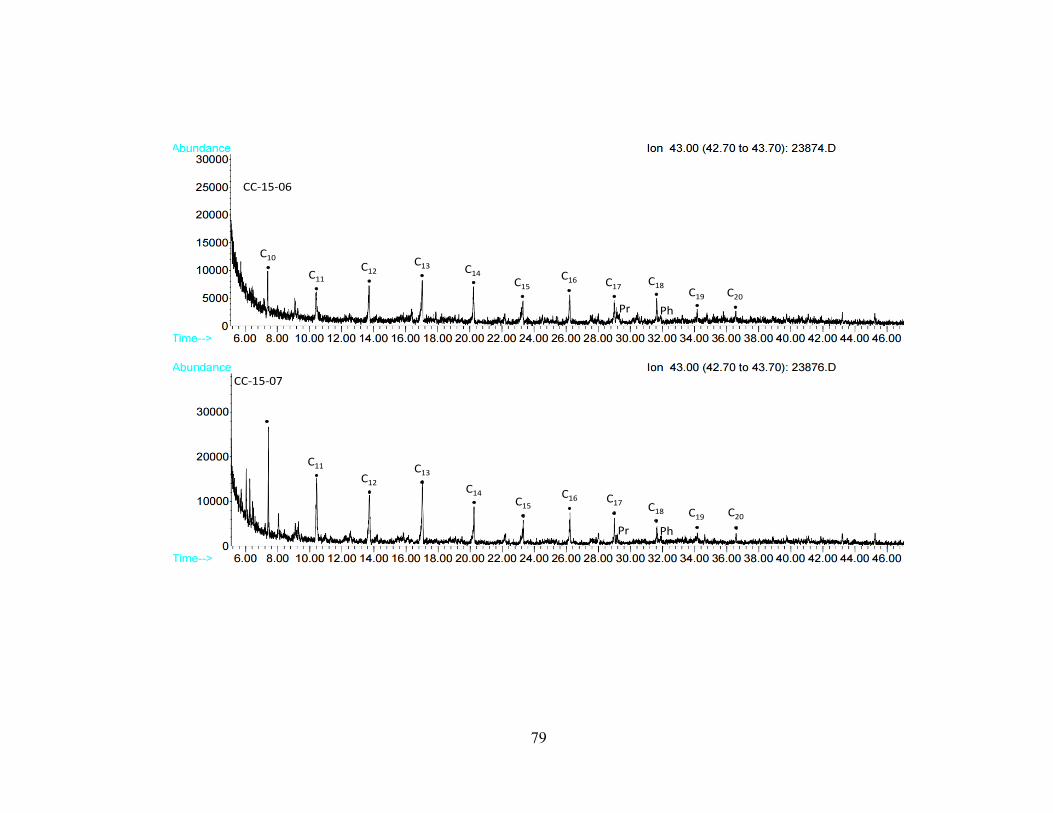
79
CC-15-06
C10
C20C19
C18C17C16C15
C14
C13C12C11
Pr Ph
C10
CC-15-07
C20C19C18
C17C16C15
C14
C13C12
C11
Pr Ph
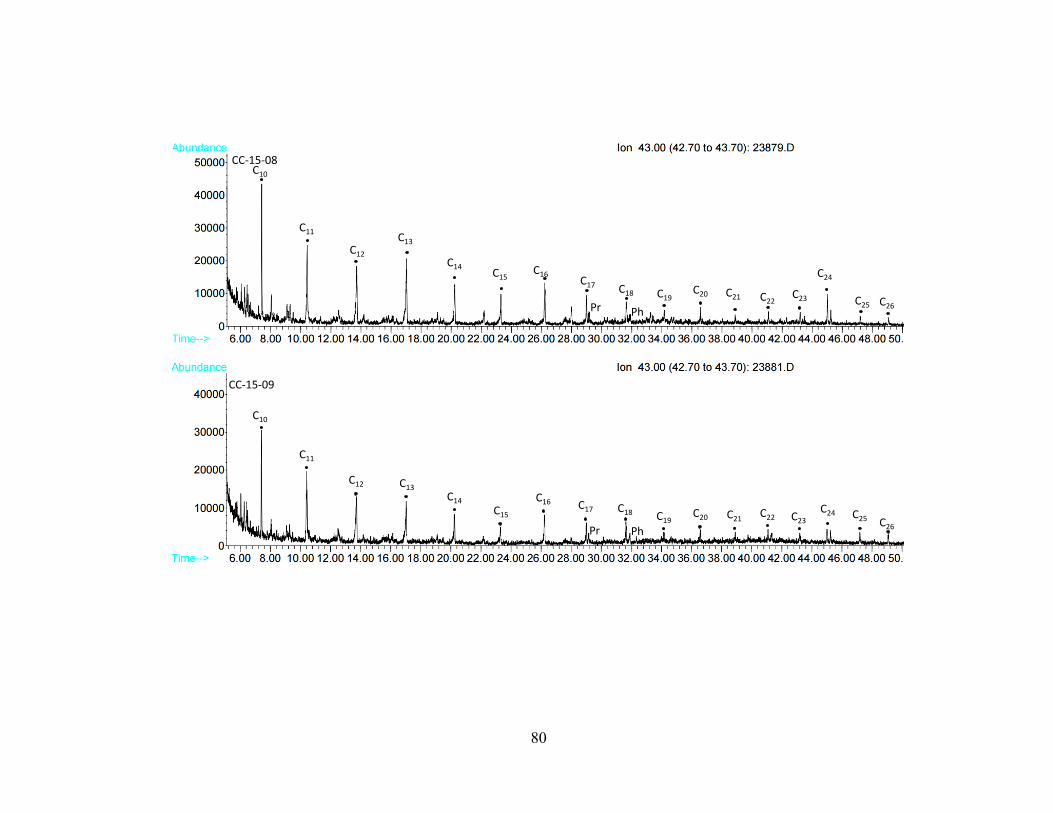
80
C10
CC-15-08
C20C19C18
C17
C16C15
C14
C13C12
C11
Pr Ph
C21 C22C23
C24
C25 C26
C10
CC-15-09
C20C19
C18C17
C16C15
C14
C13C12
C11
Pr Ph
C21C22 C23
C24 C25 C26
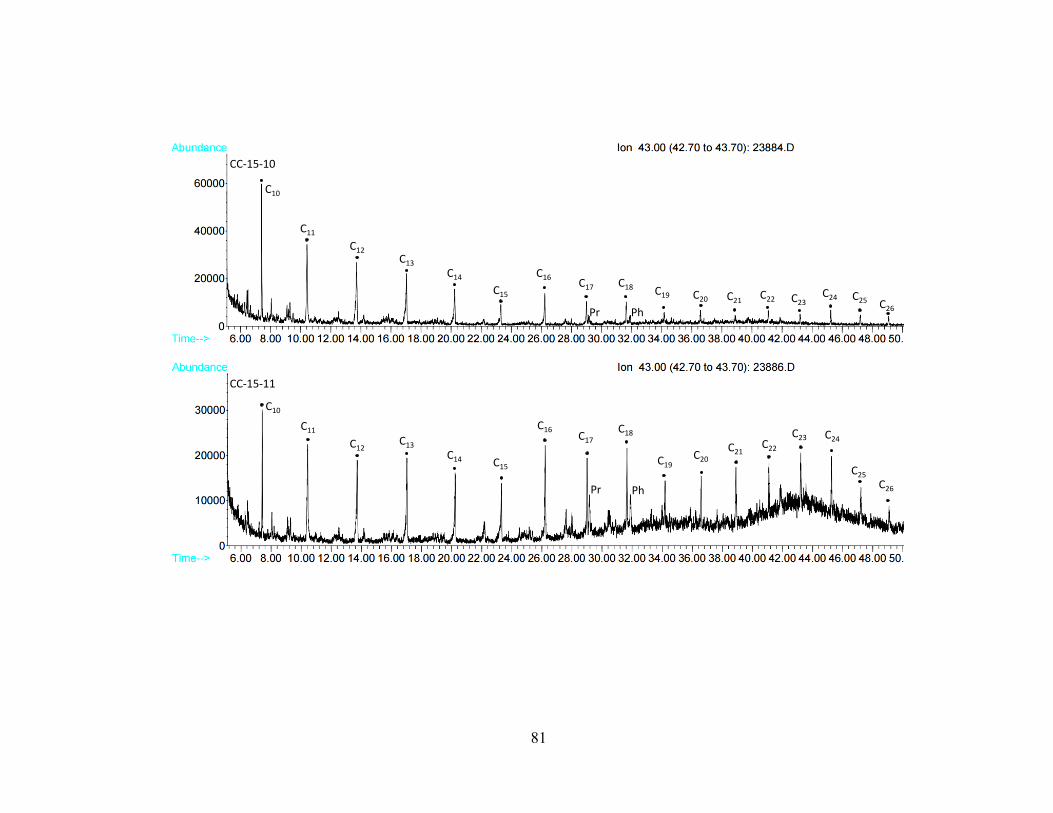
81
C10
CC-15-10
C20C19
C18C17
C16
C15
C14
C13
C12
C11
Pr Ph
C21C22 C23
C24 C25 C26
C10
CC-15-11
C20C19
C18C17
C16
C15
C14
C13C12
C11
Pr Ph
C21C22
C23 C24
C25
C26
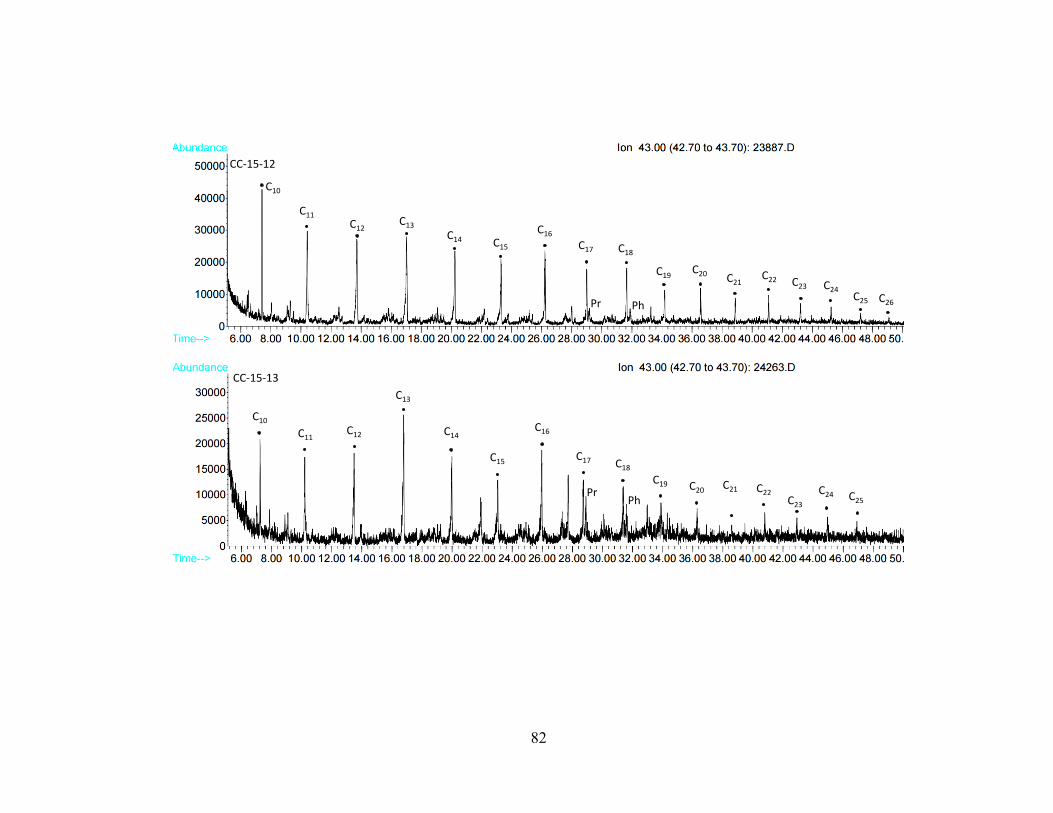
82
C10
CC-15-12
C20C19
C18C17
C16
C15
C14
C13C12
C11
Pr Ph
C21C22 C23 C24
C25 C26
C10
CC-15-13
C20C19
C18
C17
C16
C15
C14
C13
C12C11
PrPh
C21 C22C23
C24 C25
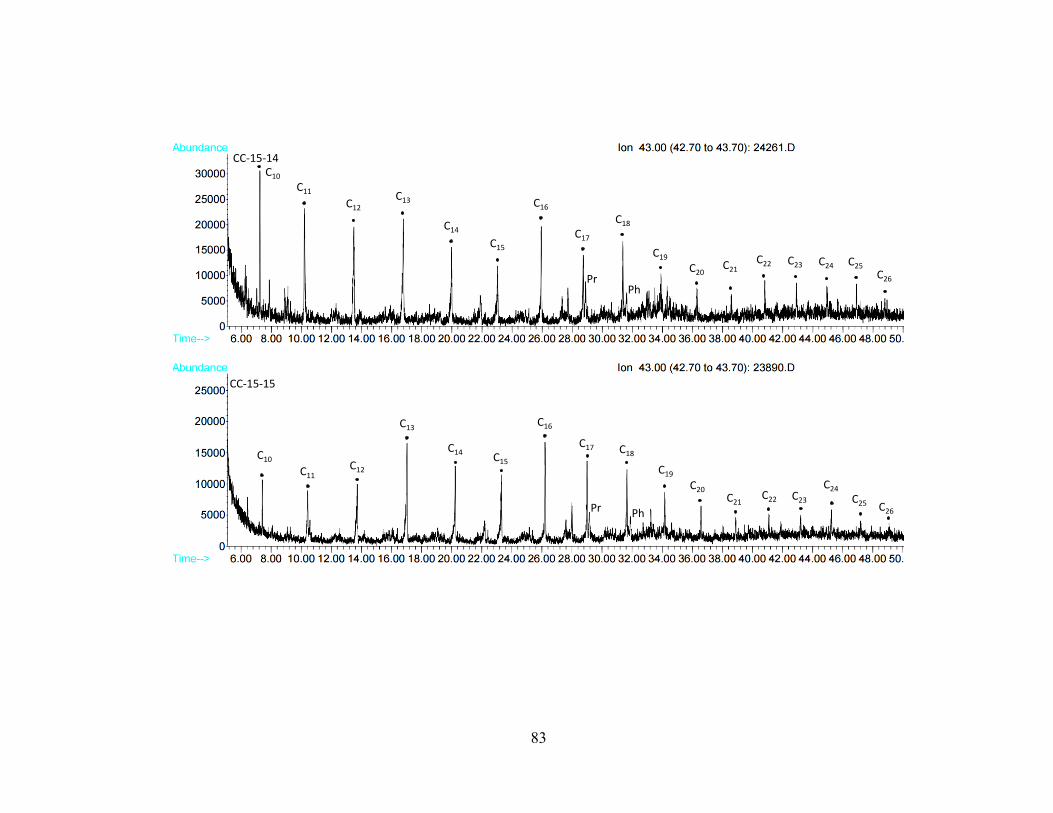
83
C10
CC-15-14
C20
C19
C18
C17
C16
C15
C14
C13C12
C11
PrPh
C21C22 C23 C24 C25
C26
C10
CC-15-15
C20
C19
C18C17
C16
C15
C14
C13
C12C11
Pr Ph
C21C22 C23
C24
C25 C26
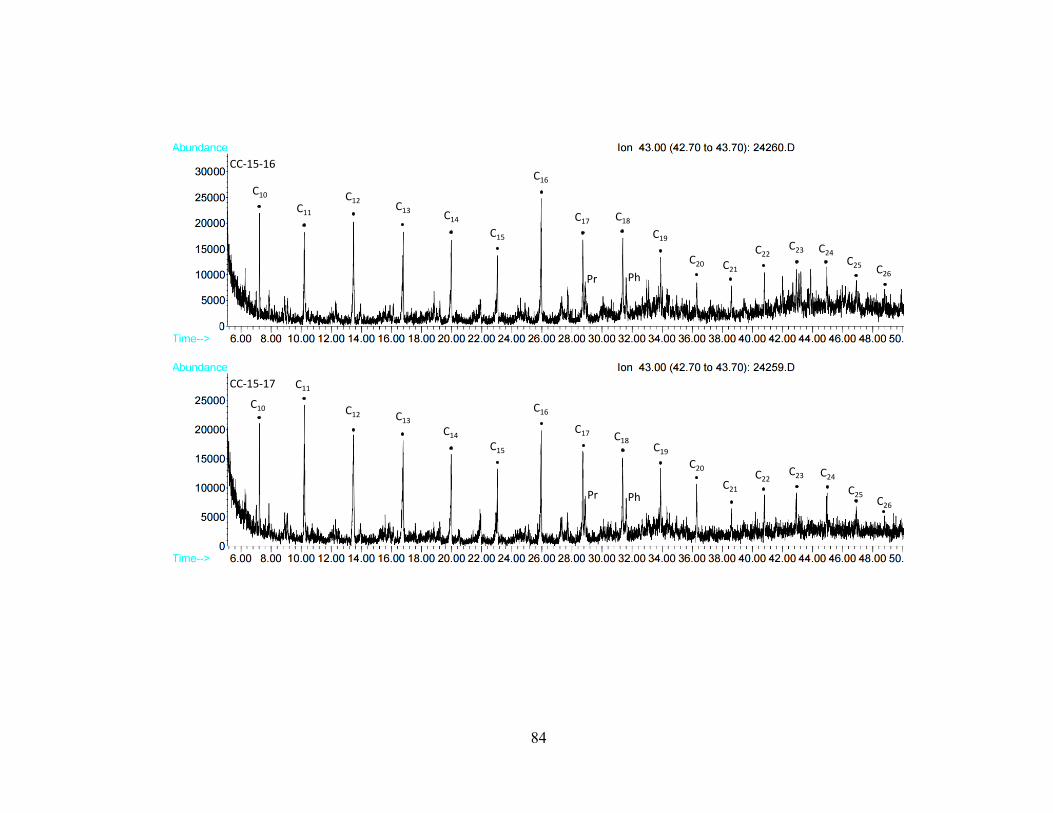
84
C10
CC-15-16
C20
C19
C18C17
C16
C15
C14
C13
C12C11
Pr PhC21
C22C23 C24
C25 C26
C10
CC-15-17
C20
C19
C18
C17
C16
C15
C14
C13C12
C11
Pr PhC21
C22C23 C24
C25C26
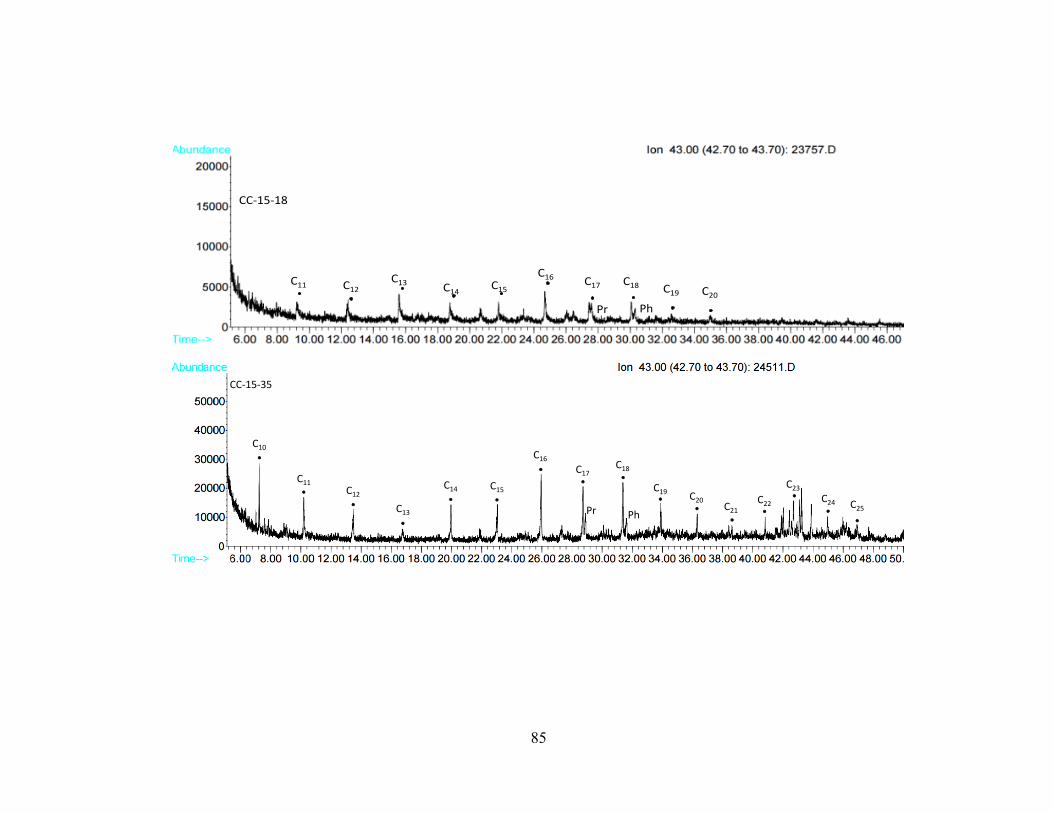
85
C16C15C14
C13C11
CC-15-18
C17 C18 C19C12 C20
Pr Ph
C10
CC-15-35
C20
C19
C18C17
C16
C15C14
C13
C12
C11
Pr PhC21
C22
C23
C24 C25
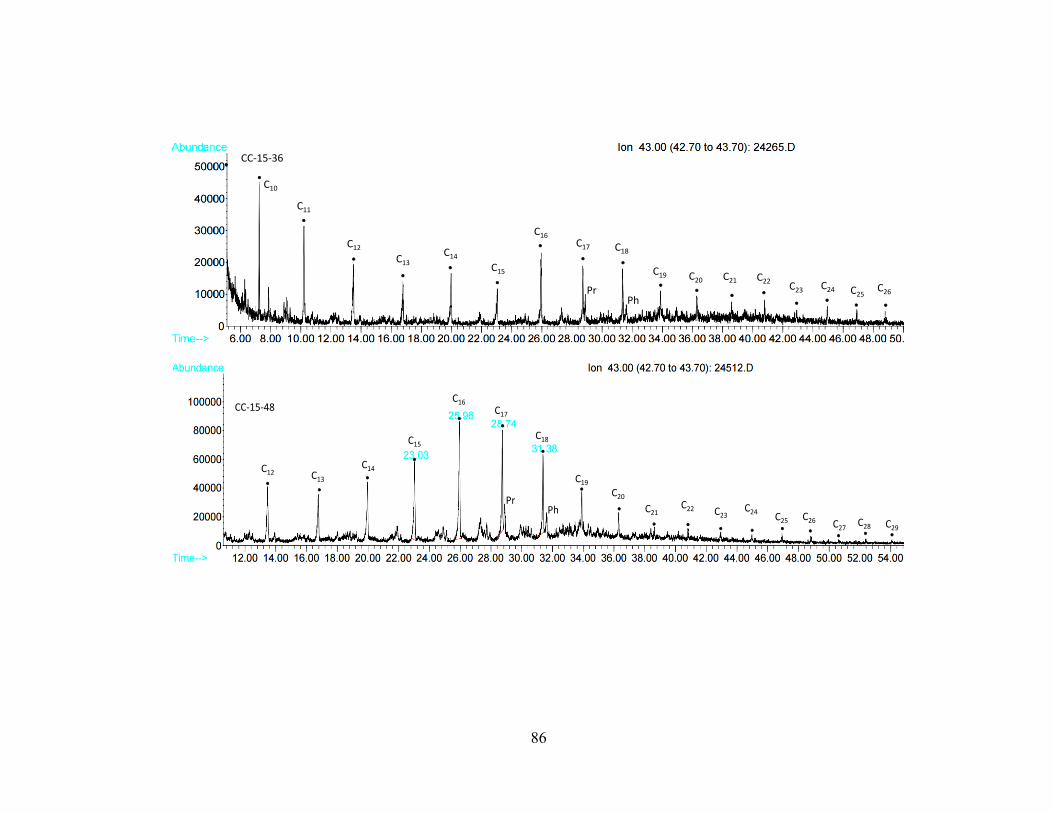
86
C10
CC-15-36
C20C19
C18C17
C16
C15
C14C13
C12
C11
PrPh
C21 C22C23 C24 C25
C26
CC-15-48
C20
C19
C18
C17
C16
C15
C14C13
C12
PrPh C21
C22 C23C24
C25 C26 C27C28 C29
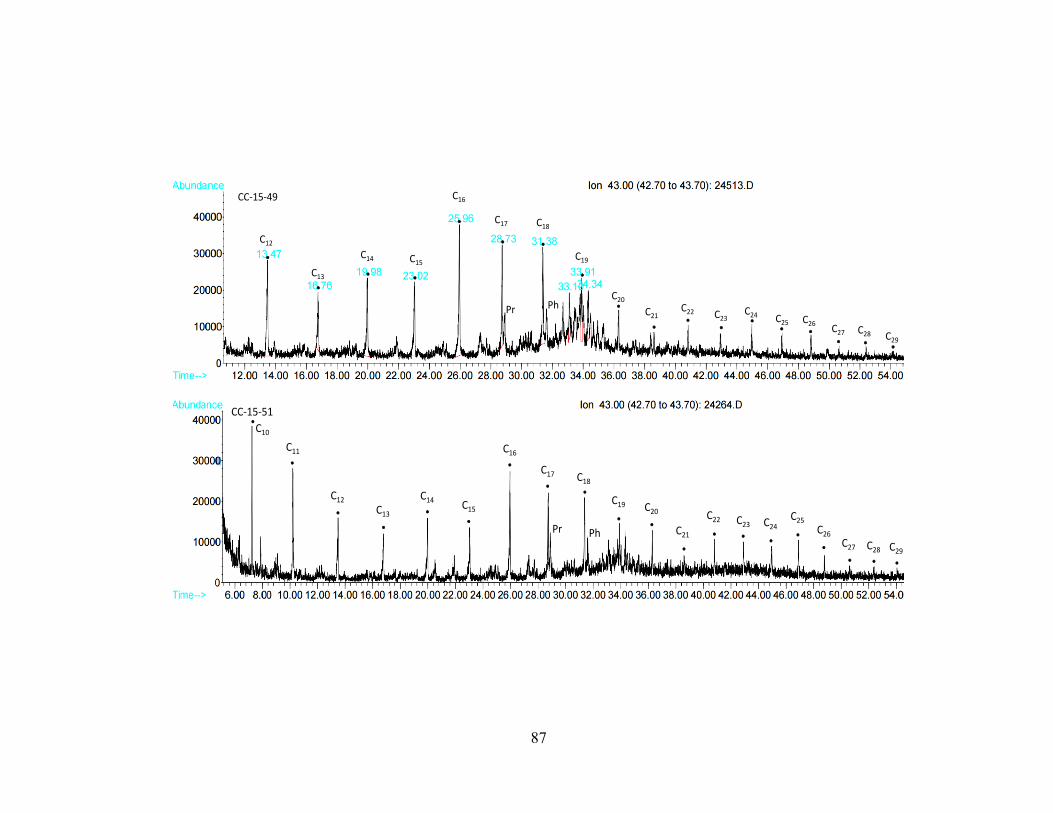
87
CC-15-49
C20
C19
C18C17
C16
C15C14
C13
C12
Pr PhC21
C22 C23C24 C25 C26
C27 C28 C29
C10
CC-15-51
C20C19
C18
C17
C16
C15
C14
C13
C12
C11
Pr Ph C21
C22 C23 C24C25
C26
C27 C28 C29
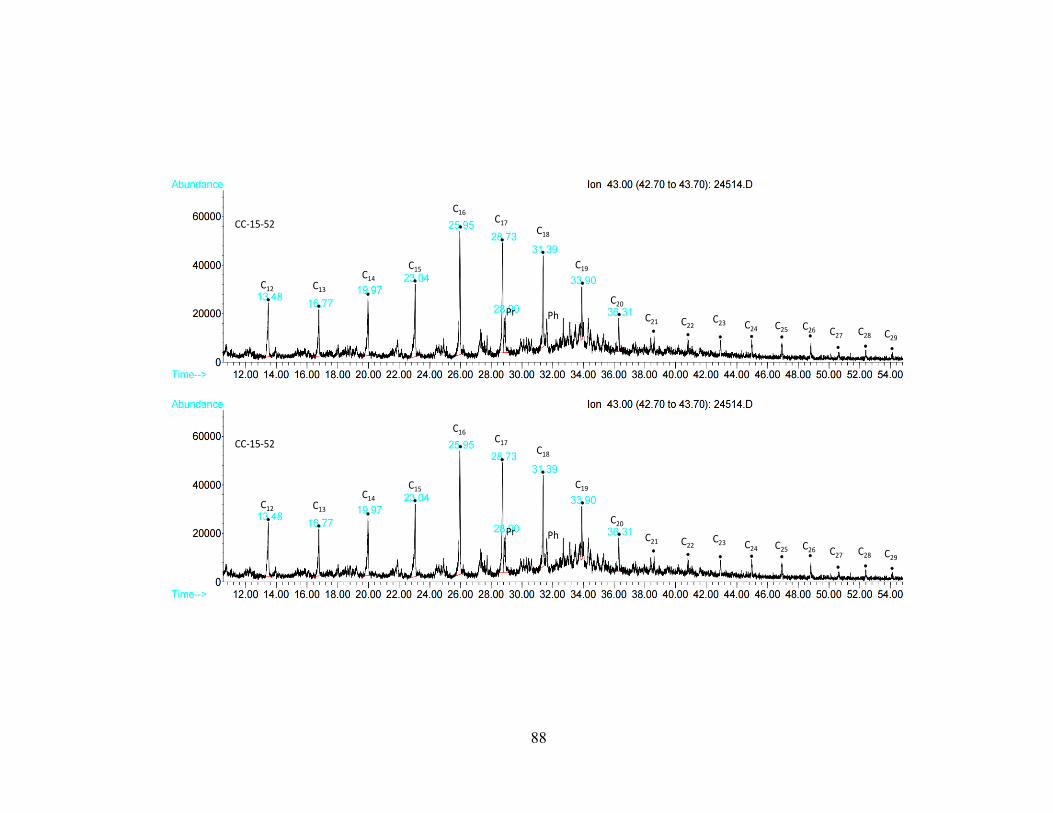
88
CC-15-52
C20
C19
C18
C17
C16
C15C14
C13C12
Pr Ph C21 C22C23 C24 C25 C26 C27 C28 C29
CC-15-52
C20
C19
C18
C17
C16
C15C14
C13C12
Pr Ph C21 C22C23 C24 C25 C26 C27 C28 C29
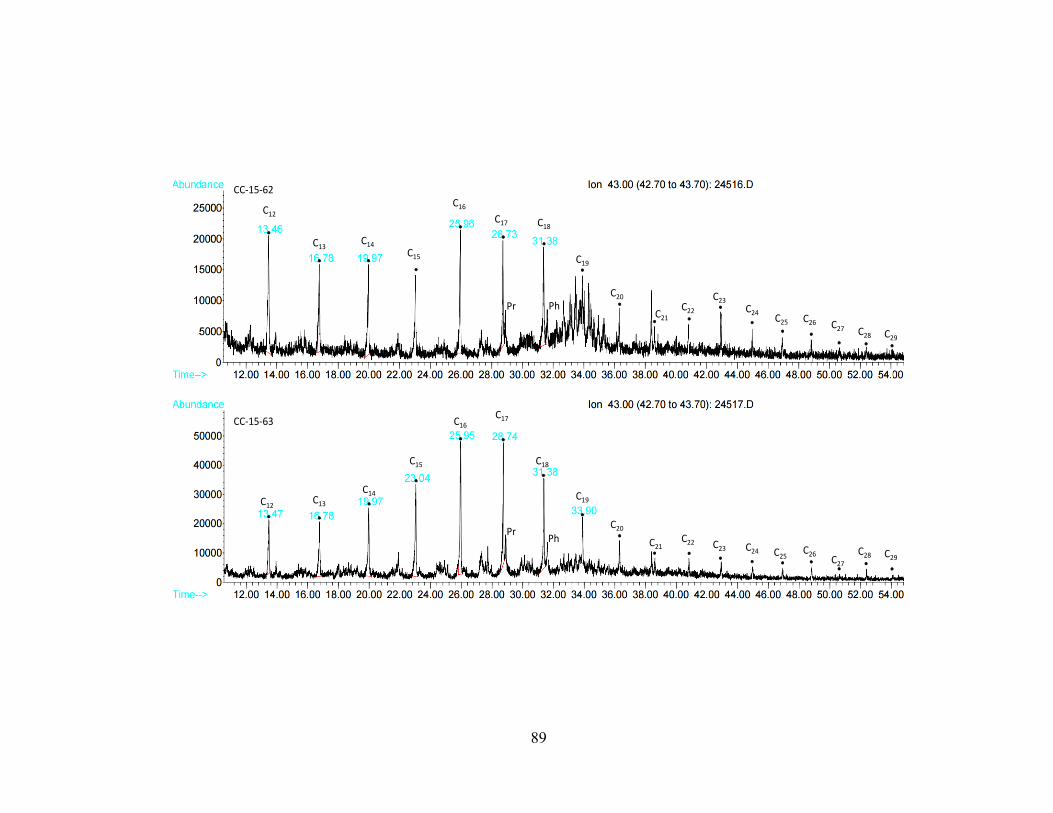
89
CC-15-62
C20
C19
C18C17
C16
C15
C14C13
C12
Pr PhC21
C22
C23
C24C25 C26 C27 C28 C29
CC-15-63
C20
C19
C18
C17C16
C15
C14C13C12
PrPh C21
C22 C23 C24 C25C26
C27
C28 C29
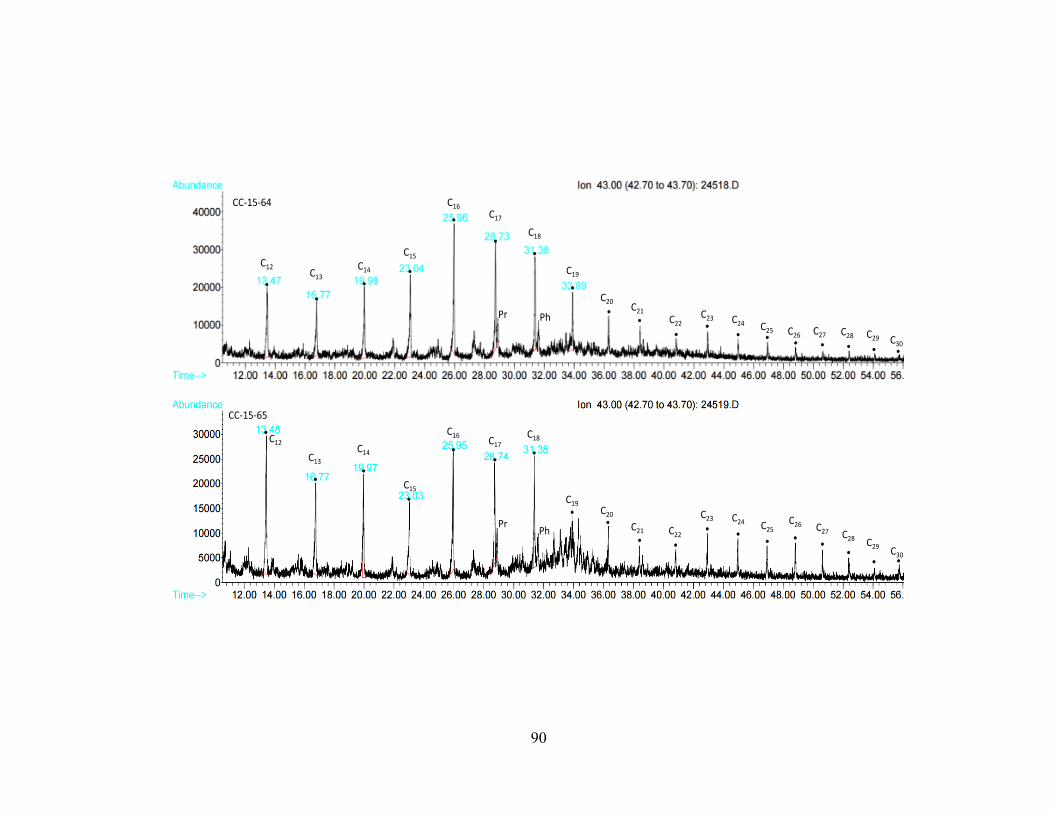
90
CC-15-64
C20
C19
C18
C17
C16
C15
C14C13
C12
Pr PhC21
C22C23 C24 C25 C26 C27 C28 C29 C30
CC-15-65
C20
C19
C18C17
C16
C15
C14C13
C12
PrPh C21 C22
C23 C24 C25C26 C27 C28 C29
C30