palaeomagnetic constraints on the age of deformation of the sierras australes thrust and fold belt,...
TRANSCRIPT
Geophys. J. Int. (1999) 138, 857–870
Palaeomagnetic constraints on the age of deformation of theSierras Australes thrust and fold belt, Argentina
Renata Nela Tomezzoli and Juan Francisco VilasConsejo Nacional de Investigaciones Cientıficas y T ecnicas (CONICET), Universidad de Buenos Aires, L aboratorio de Paleomagnetismo
‘Daniel Valencio’, Departamento de Ciencias Geologicas, Facultad de Ciencias Exactas y Naturales, Ciudad Universitaria, 1428, Buenos Aires,
Argentina
Accepted 1999 May 10. Received 1999 April 15; in original form 1998 October 27
SUMMARYA palaeomagnetic study has been carried out on late Palaeozoic rocks exposed inthe Sierras Australes thrust and fold belt of Buenos Aires province (Argentina), in theearly Permian red sandstones and clay siltstones of the Tunas Formation. Thesections sampled are exposed in the eastern parts of the belt, in Sierra de las Tunas(north) and Sierra de Pillahuinco (south). More than 300 specimens were collectedfrom 25 sites, in three localities with different structural attitudes. Demagnetization athigh temperatures isolated a characteristic remanence at 20 sites. All the localities havea reverse characteristic remanence, suggesting that the magnetization was acquiredduring the Kiaman interval. Stepwise tectonic tilt correction suggests that the TunasFormation in these localities acquired its magnetization during folding in early Permiantimes. Palaeomagnetic poles were computed for each locality based on partial tilt-corrected remanence directions. Taking into account the fact that these localities areclose to one another and that the rocks are all of reverse polarity, a group syntectonicpalaeomagnetic pole called Tunas was calculated: longitude: 13.9°E, latitude: 63.0°S;A95=5.4°, K=39.7, N=19. This pole is consistent with previously calculated polesfrom South America assigned to the early Permian. In age it corresponds to the earlyPermian San Rafaelic tectonic phase of the Sierras Australes. Independent geologicalevidence indicates that the Tunas Formation underwent syndepositional deformation.We conclude that the Tunas Formation was deposited, deformed and remagnetized, allduring the early Permian.
Key words: Argentina, Gondwana, palaeomagnetism, Palaeozoic, Sierras Australes,South America, tectonics.
early phase of deformation is thought to have occurred inINTRODUCTION
the late Devonian–early Carboniferous interval, related to the
Chanica phase (Massabie & Rossello 1984; Ramos 1984, 1988;The Sierras Australes are considered to be the South American
counterpart of the Cape Fold Belt of South Africa. They trend Lopez Gamundi & Rossello 1993; Tomezzoli 1997). Our inter-
pretation of the Permo–Triassic phase is that it occurred in theapproximately NW–SE (Fig. 1) in the southwest part of Buenos
Aires province, between 37° and 39°S, and 61° and 63°W. early Permian. The area may also have been gently deformed
during the formation and evolution of the Colorado basin (inThe geological features of the Sierras Australes have attracted
the attention of many geologists since the first decades of this the Late Mesozoic), which lies to the south, and during the
Andean orogeny in the late Cenozoic (Quattrocchio et al. 1995;century. Traditionally, the deformation in the area (Fig. 1)
has been explained with only one tectonic phase, assigned to Pereyra 1996; Tomezzoli 1997), as suggested by evidence of
uplift and reactivation of pre-existing faults. However thethe late Permian–Triassic interval, according to stratigraphic
evidence and correlation with the Cape basin in South Africa degree of this younger deformation is slight.
According to Ramos (1984, 1988), along the mutual northern(Harrington 1947; Varela 1978; Japas 1989; Von Gosen et al.1990; and Rossello et al. 1997). Until now, however, there has boundary of Patagonia and southern margin of Gondwana, an
ocean was consumed by subduction beneath Patagonia endingbeen no direct evidence for the age of deformation. According
to some investigators, there may have been tectonic phases in with collision of the continental block in the mid-Palaeozoic.
As a consequence of this collision process, deformation in theaddition to the Permo–Triassic phase mentioned above. An
857© 1999 RAS
858 R. N. T omezzoli and J. F. V ilas
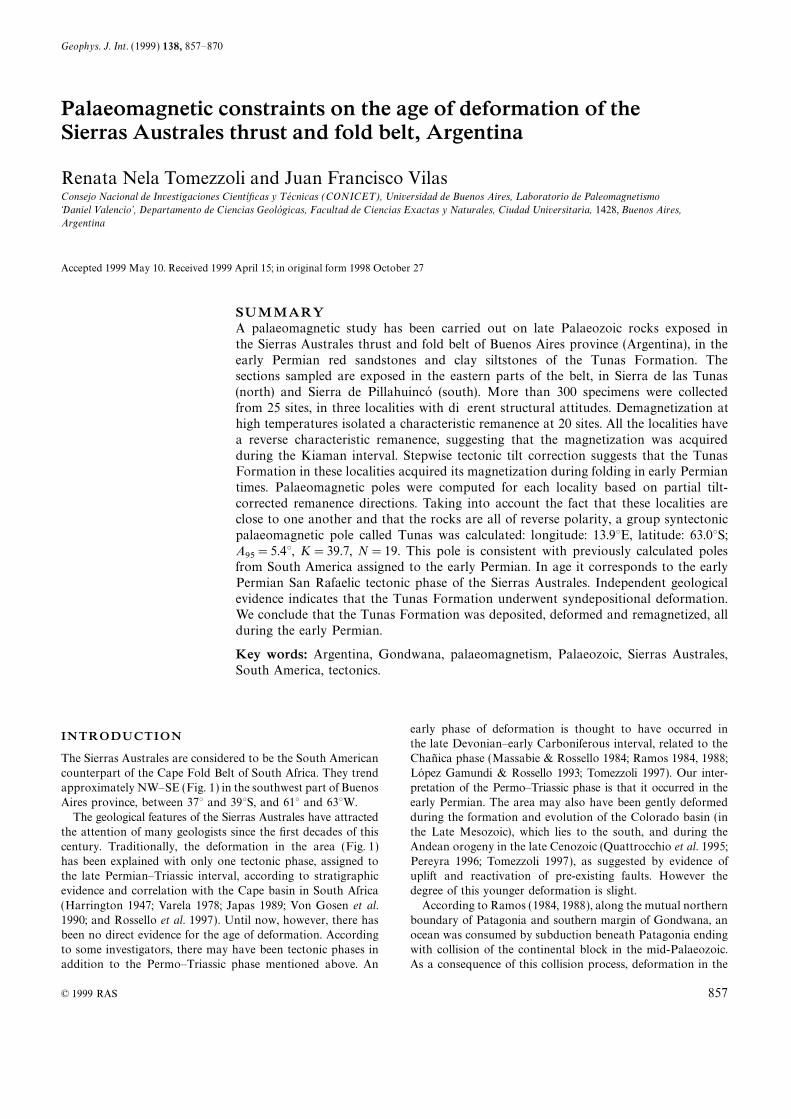
Figure 1. Geological map of the Sierras Australes exposed in the southwest of Buenos Aires province, Argentina. Squares indicate palaeomagnetic
sampling localities.
Sierras Australes may have started in the mid-Palaeozoic,LOCAL GEOLOGY AND SAMPLING
continuing to the early Permian (this work). Palaeomagnetic
data that are available for Patagonia (Sierra Grande and Tepuel The Sierras Australes is a fold belt of NW trend and with NE
vergence. The range can be divided into two main orographicpalaeomagnetic poles, Rapalini & Vilas 1991 and Rapalini
et al. 1994, respectively) yield palaeolatitudes consistent with units (Fig. 1), with an important difference in the style of the
deformation. In the western sector are the Curamalal, Bravardthose expected from the South America poles from Devonian
times onwards. The lack of significant latitudinal displacements and Ventana ranges (Fig. 1), highly deformed, with up to
eight levels of folding (Harrington 1947) and important thrustsof Patagonia with respect to Gondwana implies that accretion
of Patagonia to Gondwana must have occurred during or (Tomezzoli & Cristallini 1998). In the eastern sector are the
Tunas and Pillahuinco ranges (Fig. 1), with much gentlerbefore Devonian time.
Palaeomagnetism can help in the evaluation of the palaeo- folding. These folds continue to the east in the subsurface, into
the Interserrana or Claromeco basin (Llambıas & Prozzi 1975;geographic and geodynamic evolution of the area. The only
previous palaeomagnetic study in this area was undertaken by Tomezzoli & Vilas 1997).
The Tunas Formation (Harrington 1947) is widely exposed inCreer et al. (1970), who obtained a palaeomagnetic pole for the
Tunas and Bonete formations from the analysis of 10 samples the eastern sector. It is the youngest unit of the Carboniferous–
Permian Pillahuinco Group (Furque 1973), which from base(26 specimens). The results were interpreted as representing
reverse pretectonic magnetization. The data, however, do not to top is made up of the Sauce Grande, Piedra Azul, Bonete
and Tunas formations. The palaeoflora and palaeofaunameet modern reliability requirements. The main objective of
the present palaeomagnetic study is to obtain detailed palaeo- associations of the Bonete and Tunas formations indicate a
Permian age for these rocks. The Eurydesma fauna in themagnetic evidence to constrain the palaeogeographic and tectonic
evolution of the Sierras Australes of Buenos Aires province. underlying Bonete Formation suggests a late Asselian to early
© 1999 RAS, GJI 138, 857–870
Age of deformation of the Sierras Australes thrust and fold belt 859
Sakmarian age (early Permian, Harrington 1947) and the Golpe de Agua (formerly estancia Penaflor, 37°55∞S, 61°48.8∞W),
located in the Sierra de las Tunas, and arroyo Toro NegroGlossopteris zone according to Archangelsky & Cuneo (1984)suggests a Sakmarian to Artinskian age. (38°3.5∞S, 61°42∞W), between the Sierra de las Tunas and the
Sierra de Pillahuinco (Fig. 1).Sampling was restricted to the Tunas Formation, which is
composed of over 1200 m of silicified fine pale green sandstonesand lithic feldsarenites (Harrington 1947; Andreis et al. 1979;
ESTANCIA SAN CARLOSAndreis & Cladera 1992; Lopez Gamundi 1996) interbedded
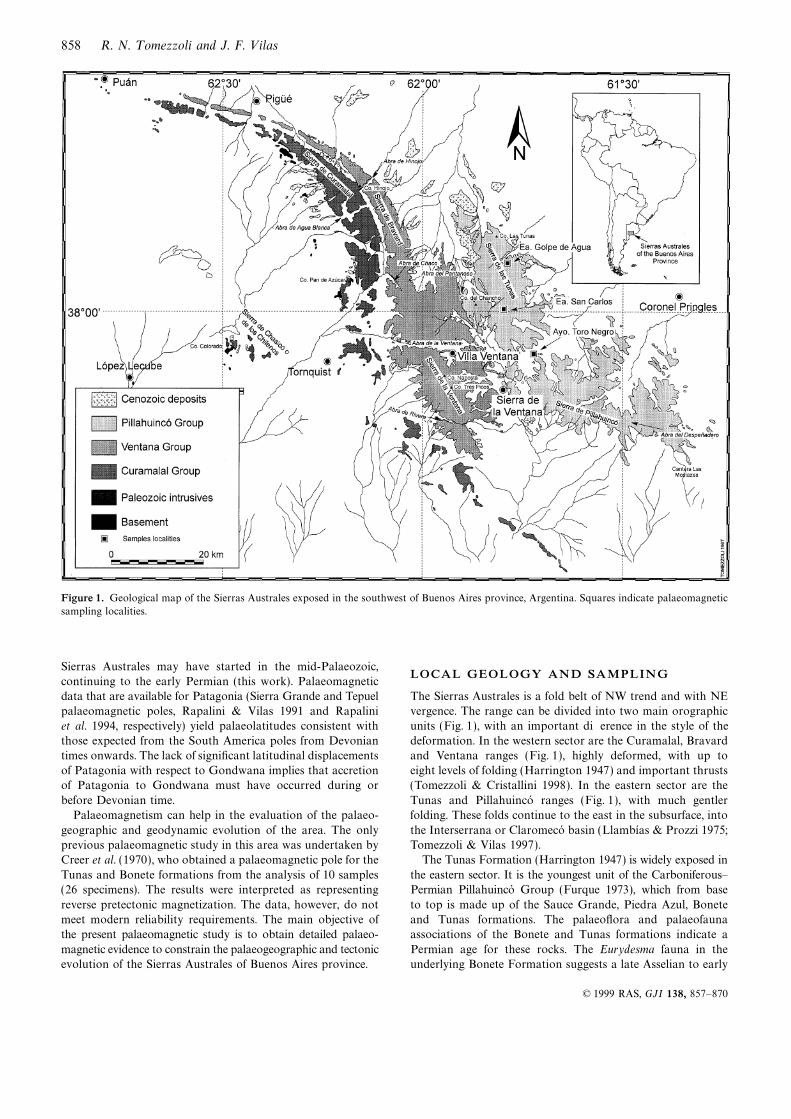
with red clay siltstones and shale. Some beds have red spots Oriented block samples were collected at 12 sites locatedon several limbs of a folded sequence (Fig. 2), with each sitewhich are interpreted as haematitic spots of diagenetic origin.
According to Andreis et al. (1979), the red tones are character- representing a different chronostratigraphic level. Two or more
specimens were obtained from each block (146 specimens inistic of the Tunas Formation shale and fine sandstones (Fig. 1).These authors identified haematite by X-ray diffractometry total ) and subjected to stepwise thermal demagnetization
(Fig. 3). NRM intensities range between 1 and 10 mA m−1. Alland in thin sections. Some vitric tuff interbeds have been
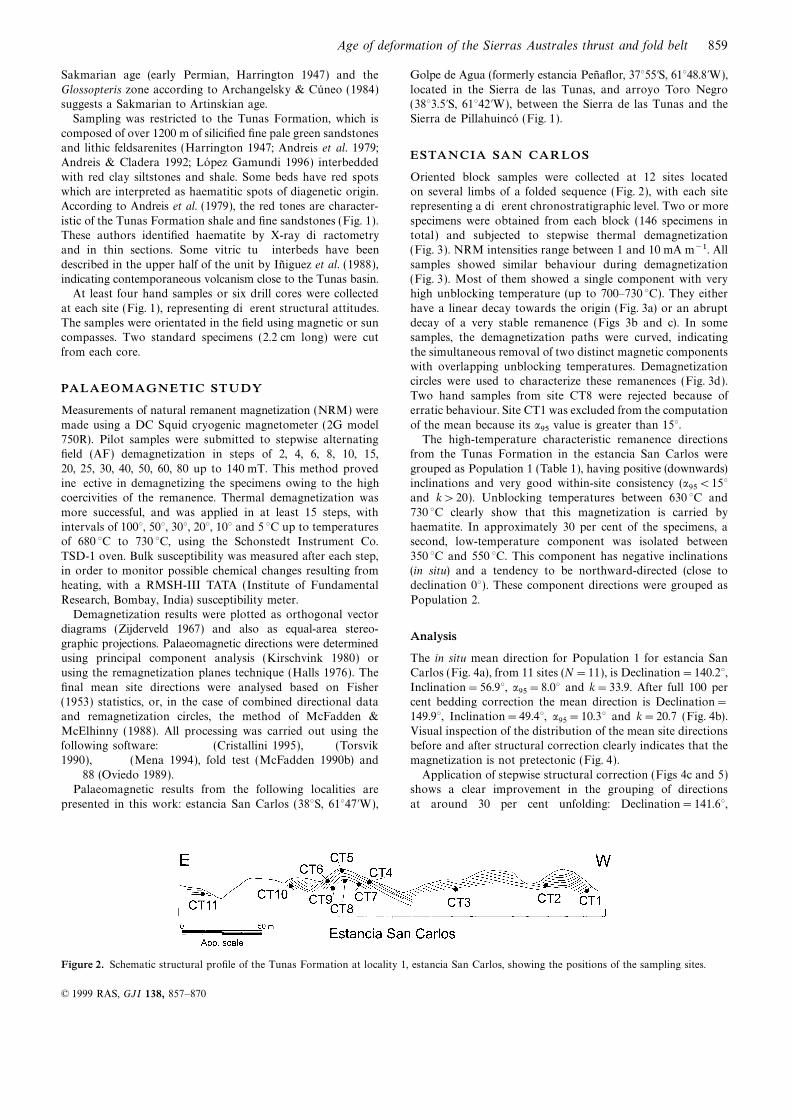
described in the upper half of the unit by Iniguez et al. (1988), samples showed similar behaviour during demagnetization(Fig. 3). Most of them showed a single component with veryindicating contemporaneous volcanism close to the Tunas basin.
At least four hand samples or six drill cores were collected high unblocking temperature (up to 700–730 °C). They either
have a linear decay towards the origin (Fig. 3a) or an abruptat each site (Fig. 1), representing different structural attitudes.The samples were orientated in the field using magnetic or sun decay of a very stable remanence (Figs 3b and c). In some
samples, the demagnetization paths were curved, indicatingcompasses. Two standard specimens (2.2 cm long) were cut
from each core. the simultaneous removal of two distinct magnetic componentswith overlapping unblocking temperatures. Demagnetizationcircles were used to characterize these remanences (Fig. 3d).
PALAEOMAGNETIC STUDYTwo hand samples from site CT8 were rejected because oferratic behaviour. Site CT1 was excluded from the computationMeasurements of natural remanent magnetization (NRM) were
made using a DC Squid cryogenic magnetometer (2G model of the mean because its a95 value is greater than 15°.The high-temperature characteristic remanence directions750R). Pilot samples were submitted to stepwise alternating
field (AF) demagnetization in steps of 2, 4, 6, 8, 10, 15, from the Tunas Formation in the estancia San Carlos were
grouped as Population 1 (Table 1), having positive (downwards)20, 25, 30, 40, 50, 60, 80 up to 140 mT. This method provedineffective in demagnetizing the specimens owing to the high inclinations and very good within-site consistency (a95<15°
and k>20). Unblocking temperatures between 630 °C andcoercivities of the remanence. Thermal demagnetization was
more successful, and was applied in at least 15 steps, with 730 °C clearly show that this magnetization is carried byhaematite. In approximately 30 per cent of the specimens, aintervals of 100°, 50°, 30°, 20°, 10° and 5 °C up to temperatures
of 680 °C to 730 °C, using the Schonstedt Instrument Co. second, low-temperature component was isolated between
350 °C and 550 °C. This component has negative inclinationsTSD-1 oven. Bulk susceptibility was measured after each step,in order to monitor possible chemical changes resulting from (in situ) and a tendency to be northward-directed (close to
declination 0°). These component directions were grouped asheating, with a RMSH-III TATA (Institute of Fundamental
Research, Bombay, India) susceptibility meter. Population 2.Demagnetization results were plotted as orthogonal vector
diagrams (Zijderveld 1967) and also as equal-area stereo-Analysis
graphic projections. Palaeomagnetic directions were determinedusing principal component analysis (Kirschvink 1980) or The in situ mean direction for Population 1 for estancia San
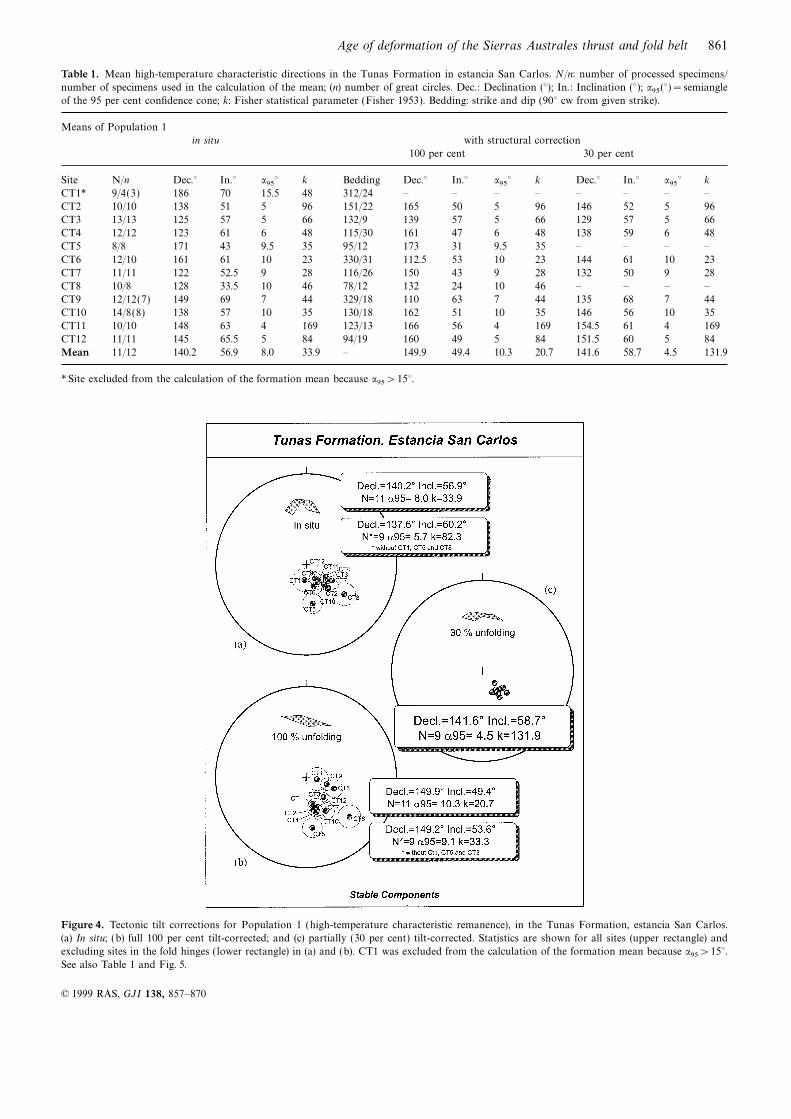
Carlos (Fig. 4a), from 11 sites (N=11), is Declination=140.2°,using the remagnetization planes technique (Halls 1976). The
final mean site directions were analysed based on Fisher Inclination=56.9°, a95=8.0° and k=33.9. After full 100 percent bedding correction the mean direction is Declination=(1953) statistics, or, in the case of combined directional data
and remagnetization circles, the method of McFadden & 149.9°, Inclination=49.4°, a95=10.3° and k=20.7 (Fig. 4b).
Visual inspection of the distribution of the mean site directionsMcElhinny (1988). All processing was carried out using thefollowing software: (Cristallini 1995), (Torsvik before and after structural correction clearly indicates that the
magnetization is not pretectonic (Fig. 4).1990), (Mena 1994), fold test (McFadden 1990b) and
88 (Oviedo 1989). Application of stepwise structural correction (Figs 4c and 5)shows a clear improvement in the grouping of directionsPalaeomagnetic results from the following localities are
presented in this work: estancia San Carlos (38°S, 61°47∞W), at around 30 per cent unfolding: Declination=141.6°,
Figure 2. Schematic structural profile of the Tunas Formation at locality 1, estancia San Carlos, showing the positions of the sampling sites.
© 1999 RAS, GJI 138, 857–870
860 R. N. T omezzoli and J. F. V ilas
Figure 3. Representative thermal demagnetization results of some specimens from the Tunas Formation, in the estancia San Carlos (location
shown in Fig. 1). I: Zijderveld diagrams. Open (filled) squares indicate representation in the vertical (horizontal) plane, in geographical coordinates.
II: Demagnetization curves. III: Projection of an equal-area net. For (d), remagnetization circles are shown. The shaded area indicates the location
of the mean direction.
Inclination=58.7°, a95=4.5°; k=131.9, N=9 and a minimumESTANCIA GOLPE DE AGUA
correlation (jMinimum=0.048) at 32 per cent according to
definition 1 of McFadden’s (1990b) fold test. This result suggests This locality (formerly called estancia Penaflor) is located
northeast of estancia San Carlos (Fig. 1). Orientated blockthat the magnetization of the Tunas Formation in the estancia
San Carlos was acquired during the folding of the sequence. samples were collected at eight sites, with at least four hand
samples at each one. Each site represents a different chrono-Statistically, however, it is not possible to reject an in situ
(post-tectonic) magnetization at the 99 per cent confidence stratigraphic level and has a different structural position
(Fig. 6). In this locality, well-preserved plant fossils (Lycophytes)level. As suggested by McFadden (1990a), CT5 and CT8 were
not included in the calculations because they are located in are common.
Three specimens from each block (a total of 103 specimens)the fold hinge. However, inclusion of these sites does not
significantly alter the mean direction. were subjected to stepwise thermal demagnetization. NRM
intensities range from 1 to 60 mA m−1. Similar demagnetizationThe lower-temperature Population 2 in situ mean direction
is similar to the present geomagnetic field direction and is behaviour was observed in all sites, as in estancia San Carlos.
Most of the samples showed high-stability components upinterpreted as a secondary magnetization acquired during
recent times. to 680 °C, with discrete unblocking temperatures between
© 1999 RAS, GJI 138, 857–870
Age of deformation of the Sierras Australes thrust and fold belt 861
Table 1. Mean high-temperature characteristic directions in the Tunas Formation in estancia San Carlos. N/n: number of processed specimens/
number of specimens used in the calculation of the mean; (n) number of great circles. Dec.: Declination (°); In.: Inclination (°); a95 (°)=semiangle
of the 95 per cent confidence cone; k: Fisher statistical parameter (Fisher 1953). Bedding: strike and dip (90° cw from given strike).
Means of Population 1
in situ with structural correction
100 per cent 30 per cent
Site N/n Dec.° In.° a95° k Bedding Dec.° In.° a95° k Dec.° In.° a95° k
CT1* 9/4(3) 186 70 15.5 48 312/24 – – – – – – – –
CT2 10/10 138 51 5 96 151/22 165 50 5 96 146 52 5 96
CT3 13/13 125 57 5 66 132/9 139 57 5 66 129 57 5 66
CT4 12/12 123 61 6 48 115/30 161 47 6 48 138 59 6 48
CT5 8/8 171 43 9.5 35 95/12 173 31 9.5 35 – – – –
CT6 12/10 161 61 10 23 330/31 112.5 53 10 23 144 61 10 23
CT7 11/11 122 52.5 9 28 116/26 150 43 9 28 132 50 9 28
CT8 10/8 128 33.5 10 46 78/12 132 24 10 46 – – – –
CT9 12/12(7) 149 69 7 44 329/18 110 63 7 44 135 68 7 44
CT10 14/8(8) 138 57 10 35 130/18 162 51 10 35 146 56 10 35
CT11 10/10 148 63 4 169 123/13 166 56 4 169 154.5 61 4 169
CT12 11/11 145 65.5 5 84 94/19 160 49 5 84 151.5 60 5 84
Mean 11/12 140.2 56.9 8.0 33.9 – 149.9 49.4 10.3 20.7 141.6 58.7 4.5 131.9
* Site excluded from the calculation of the formation mean because a95>15°.
Figure 4. Tectonic tilt corrections for Population 1 (high-temperature characteristic remanence), in the Tunas Formation, estancia San Carlos.
(a) In situ; (b) full 100 per cent tilt-corrected; and (c) partially (30 per cent) tilt-corrected. Statistics are shown for all sites (upper rectangle) and
excluding sites in the fold hinges ( lower rectangle) in (a) and (b). CT1 was excluded from the calculation of the formation mean because a95>15°.See also Table 1 and Fig. 5.
© 1999 RAS, GJI 138, 857–870
862 R. N. T omezzoli and J. F. V ilas
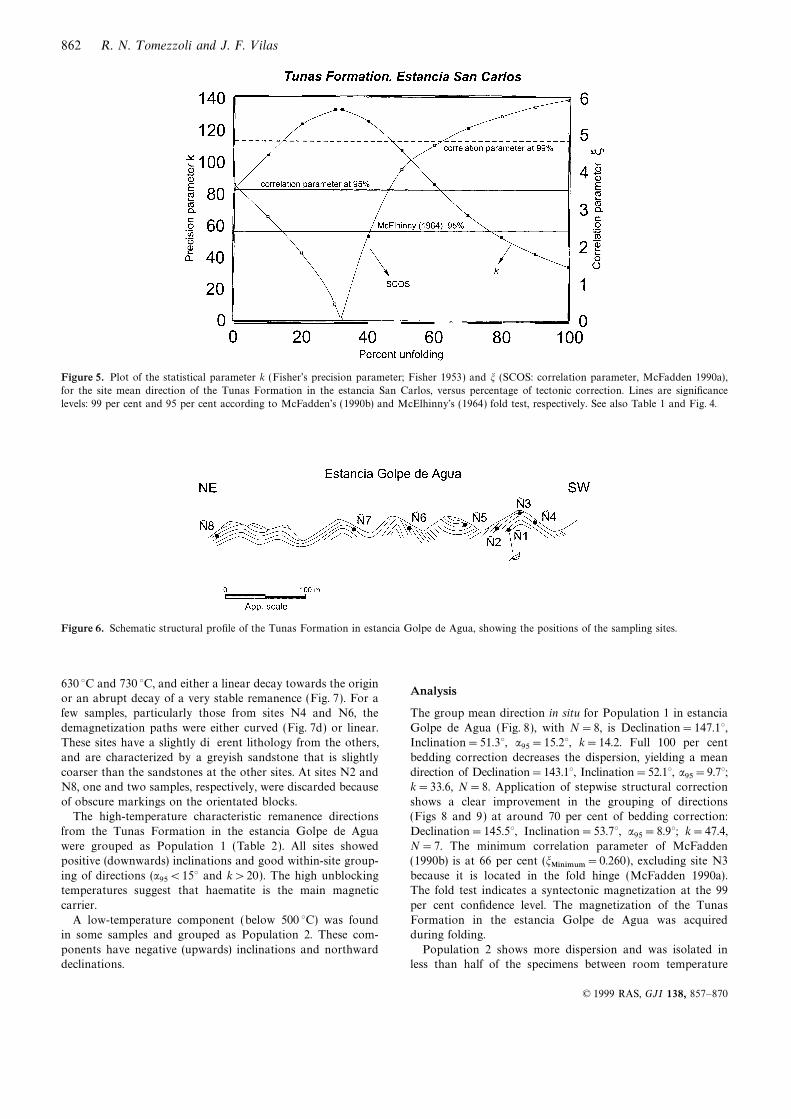
Figure 5. Plot of the statistical parameter k (Fisher’s precision parameter; Fisher 1953) and j (SCOS: correlation parameter, McFadden 1990a),
for the site mean direction of the Tunas Formation in the estancia San Carlos, versus percentage of tectonic correction. Lines are significance
levels: 99 per cent and 95 per cent according to McFadden’s (1990b) and McElhinny’s (1964) fold test, respectively. See also Table 1 and Fig. 4.
Figure 6. Schematic structural profile of the Tunas Formation in estancia Golpe de Agua, showing the positions of the sampling sites.
630 °C and 730 °C, and either a linear decay towards the originAnalysis
or an abrupt decay of a very stable remanence (Fig. 7). For a
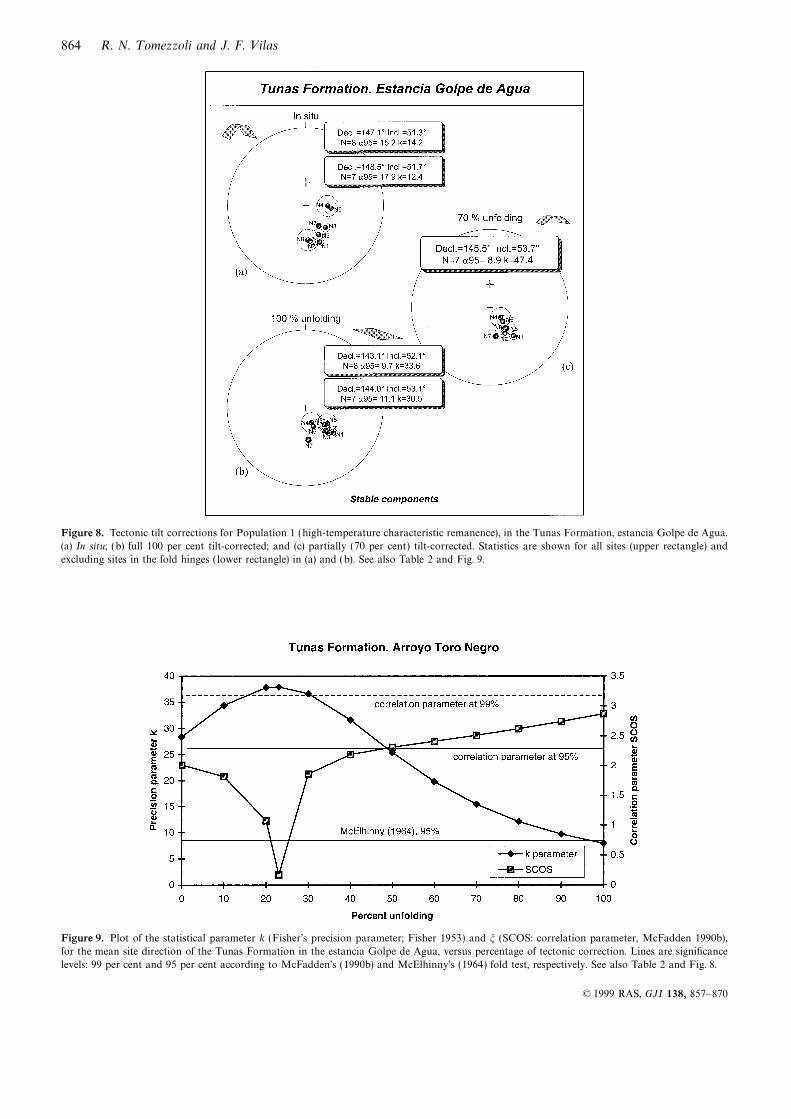
few samples, particularly those from sites N4 and N6, the The group mean direction in situ for Population 1 in estancia
Golpe de Agua (Fig. 8), with N=8, is Declination=147.1°,demagnetization paths were either curved (Fig. 7d) or linear.
These sites have a slightly different lithology from the others, Inclination=51.3°, a95=15.2°, k=14.2. Full 100 per cent
bedding correction decreases the dispersion, yielding a meanand are characterized by a greyish sandstone that is slightly
coarser than the sandstones at the other sites. At sites N2 and direction of Declination=143.1°, Inclination=52.1°, a95=9.7°;k=33.6, N=8. Application of stepwise structural correctionN8, one and two samples, respectively, were discarded because
of obscure markings on the orientated blocks. shows a clear improvement in the grouping of directions
(Figs 8 and 9) at around 70 per cent of bedding correction:The high-temperature characteristic remanence directions
from the Tunas Formation in the estancia Golpe de Agua Declination=145.5°, Inclination=53.7°, a95=8.9°; k=47.4,
N=7. The minimum correlation parameter of McFaddenwere grouped as Population 1 (Table 2). All sites showed
positive (downwards) inclinations and good within-site group- (1990b) is at 66 per cent (jMinimum=0.260), excluding site N3
because it is located in the fold hinge (McFadden 1990a).ing of directions (a95<15° and k>20). The high unblocking
temperatures suggest that haematite is the main magnetic The fold test indicates a syntectonic magnetization at the 99
per cent confidence level. The magnetization of the Tunascarrier.
A low-temperature component (below 500 °C) was found Formation in the estancia Golpe de Agua was acquired
during folding.in some samples and grouped as Population 2. These com-
ponents have negative (upwards) inclinations and northward Population 2 shows more dispersion and was isolated in
less than half of the specimens between room temperaturedeclinations.
© 1999 RAS, GJI 138, 857–870
Age of deformation of the Sierras Australes thrust and fold belt 863
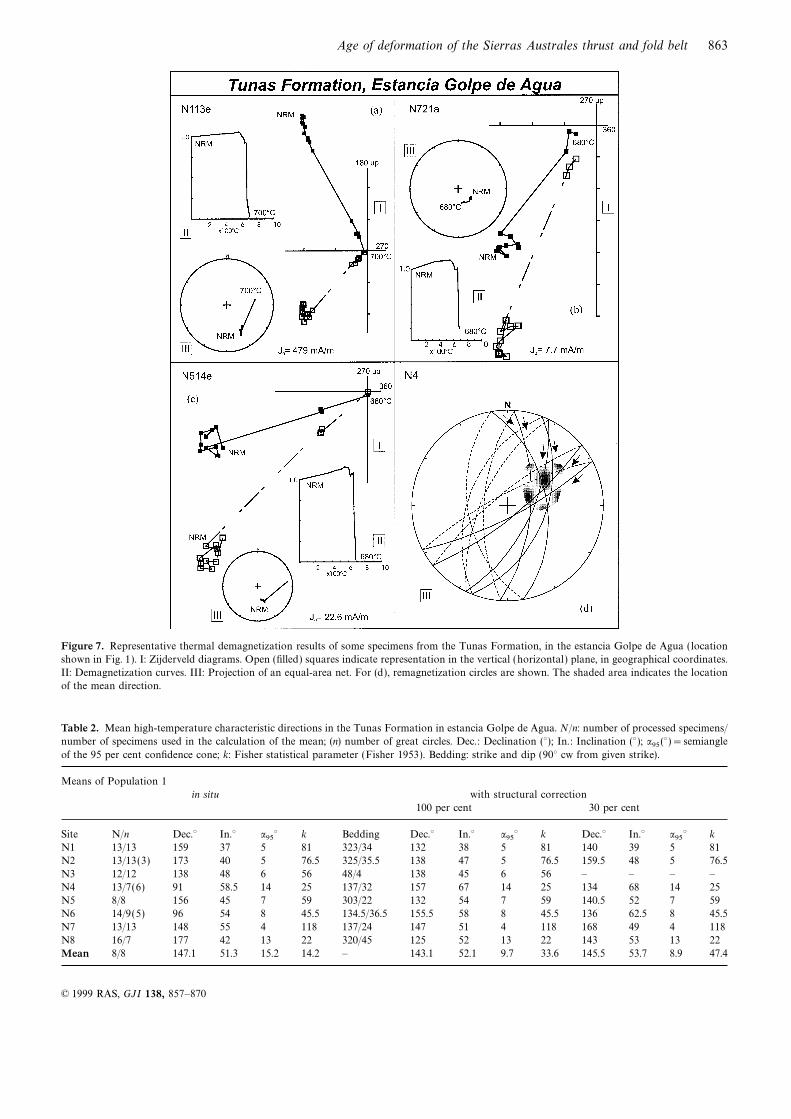
Figure 7. Representative thermal demagnetization results of some specimens from the Tunas Formation, in the estancia Golpe de Agua (location
shown in Fig. 1). I: Zijderveld diagrams. Open (filled) squares indicate representation in the vertical (horizontal) plane, in geographical coordinates.
II: Demagnetization curves. III: Projection of an equal-area net. For (d), remagnetization circles are shown. The shaded area indicates the location
of the mean direction.
Table 2. Mean high-temperature characteristic directions in the Tunas Formation in estancia Golpe de Agua. N/n: number of processed specimens/
number of specimens used in the calculation of the mean; (n) number of great circles. Dec.: Declination (°); In.: Inclination (°); a95 (°)=semiangle
of the 95 per cent confidence cone; k: Fisher statistical parameter (Fisher 1953). Bedding: strike and dip (90° cw from given strike).
Means of Population 1
in situ with structural correction
100 per cent 30 per cent
Site N/n Dec.° In.° a95° k Bedding Dec.° In.° a95° k Dec.° In.° a95° k
N1 13/13 159 37 5 81 323/34 132 38 5 81 140 39 5 81
N2 13/13(3) 173 40 5 76.5 325/35.5 138 47 5 76.5 159.5 48 5 76.5
N3 12/12 138 48 6 56 48/4 138 45 6 56 – – – –
N4 13/7(6) 91 58.5 14 25 137/32 157 67 14 25 134 68 14 25
N5 8/8 156 45 7 59 303/22 132 54 7 59 140.5 52 7 59
N6 14/9(5) 96 54 8 45.5 134.5/36.5 155.5 58 8 45.5 136 62.5 8 45.5
N7 13/13 148 55 4 118 137/24 147 51 4 118 168 49 4 118
N8 16/7 177 42 13 22 320/45 125 52 13 22 143 53 13 22
Mean 8/8 147.1 51.3 15.2 14.2 – 143.1 52.1 9.7 33.6 145.5 53.7 8.9 47.4
© 1999 RAS, GJI 138, 857–870
864 R. N. T omezzoli and J. F. V ilas
Figure 8. Tectonic tilt corrections for Population 1 (high-temperature characteristic remanence), in the Tunas Formation, estancia Golpe de Agua.
(a) In situ; (b) full 100 per cent tilt-corrected; and (c) partially (70 per cent) tilt-corrected. Statistics are shown for all sites (upper rectangle) and
excluding sites in the fold hinges ( lower rectangle) in (a) and (b). See also Table 2 and Fig. 9.
Figure 9. Plot of the statistical parameter k (Fisher’s precision parameter; Fisher 1953) and j (SCOS: correlation parameter, McFadden 1990b),
for the mean site direction of the Tunas Formation in the estancia Golpe de Agua, versus percentage of tectonic correction. Lines are significance
levels: 99 per cent and 95 per cent according to McFadden’s (1990b) and McElhinny’s (1964) fold test, respectively. See also Table 2 and Fig. 8.
© 1999 RAS, GJI 138, 857–870
Age of deformation of the Sierras Australes thrust and fold belt 865
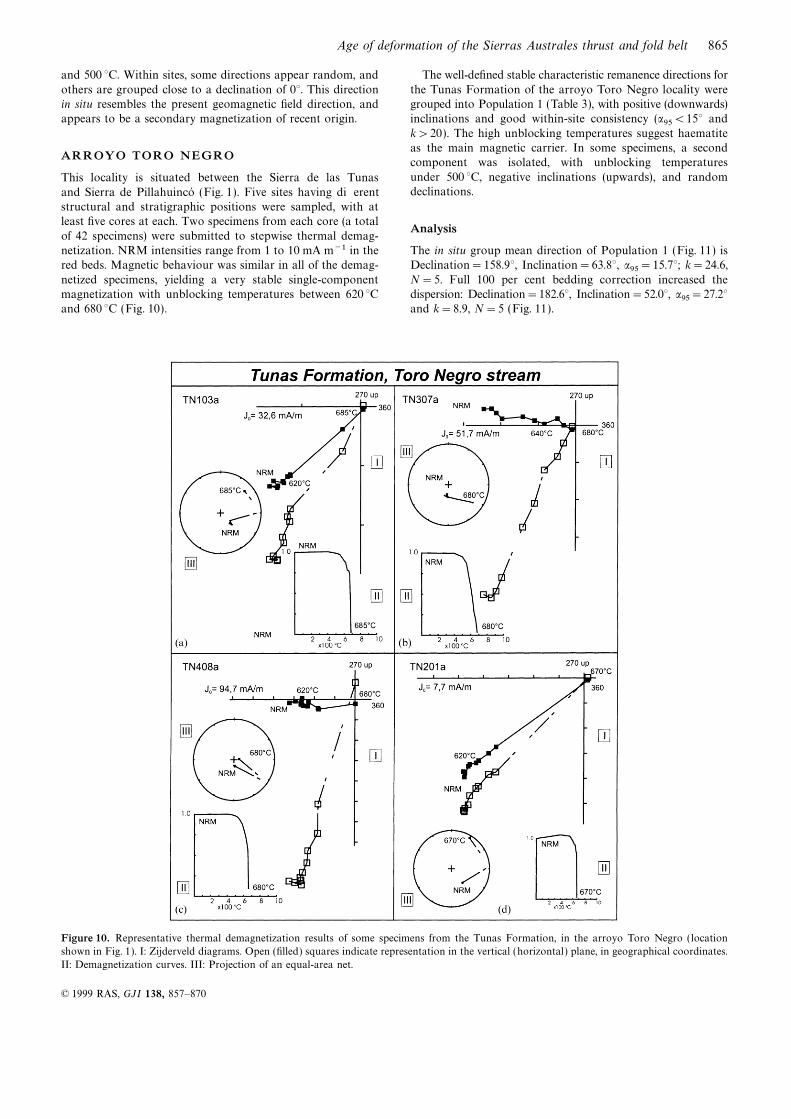
and 500 °C. Within sites, some directions appear random, and The well-defined stable characteristic remanence directions for
the Tunas Formation of the arroyo Toro Negro locality wereothers are grouped close to a declination of 0°. This directionin situ resembles the present geomagnetic field direction, and grouped into Population 1 (Table 3), with positive (downwards)
inclinations and good within-site consistency (a95<15° andappears to be a secondary magnetization of recent origin.
k>20). The high unblocking temperatures suggest haematiteas the main magnetic carrier. In some specimens, a second
ARROYO TORO NEGROcomponent was isolated, with unblocking temperatures
under 500 °C, negative inclinations (upwards), and randomThis locality is situated between the Sierra de las Tunasdeclinations.and Sierra de Pillahuinco (Fig. 1). Five sites having different
structural and stratigraphic positions were sampled, with atleast five cores at each. Two specimens from each core (a total
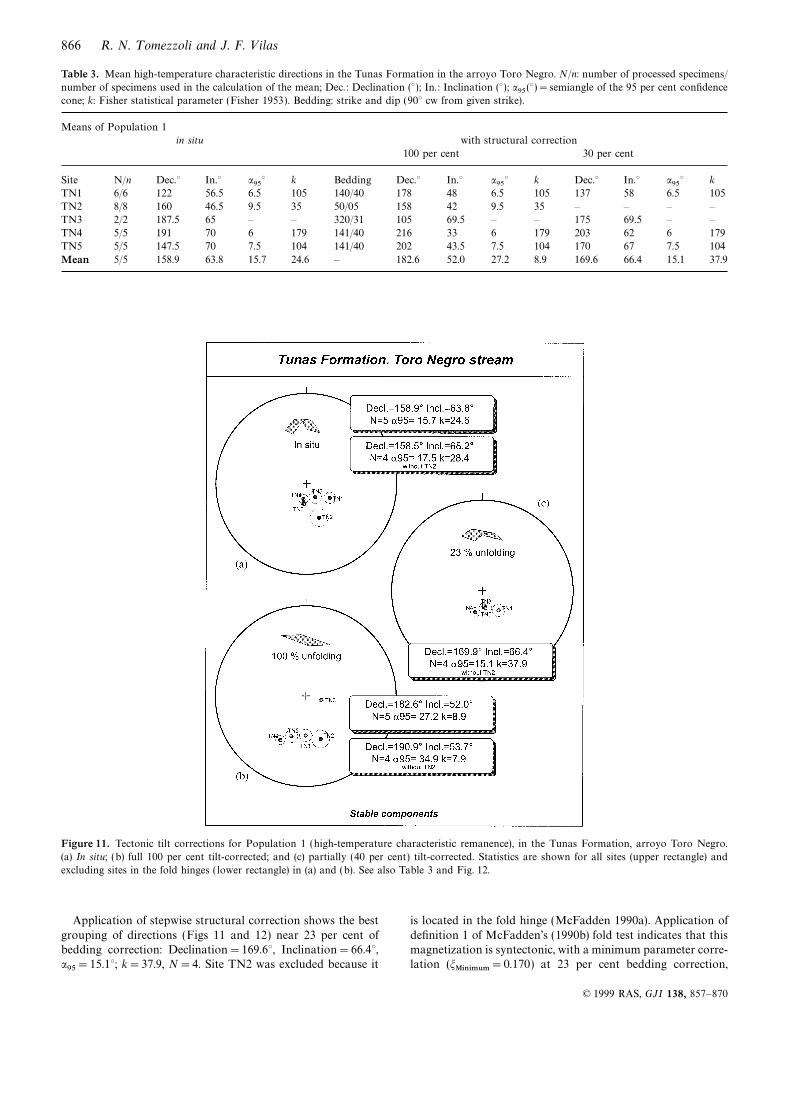
Analysisof 42 specimens) were submitted to stepwise thermal demag-netization. NRM intensities range from 1 to 10 mA m−1 in the The in situ group mean direction of Population 1 (Fig. 11) is
Declination=158.9°, Inclination=63.8°, a95=15.7°; k=24.6,red beds. Magnetic behaviour was similar in all of the demag-
netized specimens, yielding a very stable single-component N=5. Full 100 per cent bedding correction increased thedispersion: Declination=182.6°, Inclination=52.0°, a95=27.2°magnetization with unblocking temperatures between 620 °C
and 680 °C (Fig. 10). and k=8.9, N=5 (Fig. 11).
Figure 10. Representative thermal demagnetization results of some specimens from the Tunas Formation, in the arroyo Toro Negro (location
shown in Fig. 1). I: Zijderveld diagrams. Open (filled) squares indicate representation in the vertical (horizontal) plane, in geographical coordinates.
II: Demagnetization curves. III: Projection of an equal-area net.
© 1999 RAS, GJI 138, 857–870
866 R. N. T omezzoli and J. F. V ilas
Table 3. Mean high-temperature characteristic directions in the Tunas Formation in the arroyo Toro Negro. N/n: number of processed specimens/
number of specimens used in the calculation of the mean; Dec. : Declination (°); In.: Inclination (°); a95 (°)=semiangle of the 95 per cent confidence
cone; k: Fisher statistical parameter (Fisher 1953). Bedding: strike and dip (90° cw from given strike).
Means of Population 1
in situ with structural correction
100 per cent 30 per cent
Site N/n Dec.° In.° a95° k Bedding Dec.° In.° a95° k Dec.° In.° a95° k
TN1 6/6 122 56.5 6.5 105 140/40 178 48 6.5 105 137 58 6.5 105
TN2 8/8 160 46.5 9.5 35 50/05 158 42 9.5 35 – – – –
TN3 2/2 187.5 65 – – 320/31 105 69.5 – – 175 69.5 – –
TN4 5/5 191 70 6 179 141/40 216 33 6 179 203 62 6 179
TN5 5/5 147.5 70 7.5 104 141/40 202 43.5 7.5 104 170 67 7.5 104
Mean 5/5 158.9 63.8 15.7 24.6 – 182.6 52.0 27.2 8.9 169.6 66.4 15.1 37.9
Figure 11. Tectonic tilt corrections for Population 1 (high-temperature characteristic remanence), in the Tunas Formation, arroyo Toro Negro.
(a) In situ; (b) full 100 per cent tilt-corrected; and (c) partially (40 per cent) tilt-corrected. Statistics are shown for all sites (upper rectangle) and
excluding sites in the fold hinges ( lower rectangle) in (a) and (b). See also Table 3 and Fig. 12.
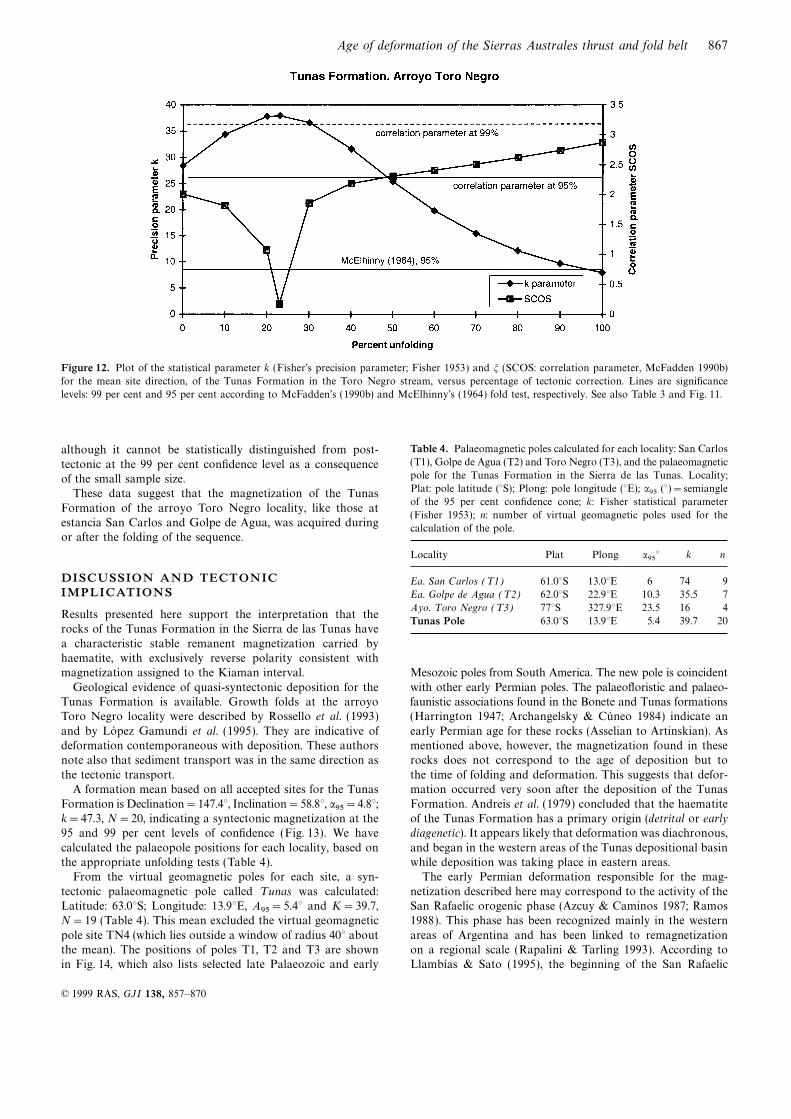
Application of stepwise structural correction shows the best is located in the fold hinge (McFadden 1990a). Application of
definition 1 of McFadden’s (1990b) fold test indicates that thisgrouping of directions (Figs 11 and 12) near 23 per cent ofbedding correction: Declination=169.6°, Inclination=66.4°, magnetization is syntectonic, with a minimum parameter corre-
lation (jMinimum=0.170) at 23 per cent bedding correction,a95=15.1°; k=37.9, N=4. Site TN2 was excluded because it
© 1999 RAS, GJI 138, 857–870
Age of deformation of the Sierras Australes thrust and fold belt 867
Figure 12. Plot of the statistical parameter k (Fisher’s precision parameter; Fisher 1953) and j (SCOS: correlation parameter, McFadden 1990b)
for the mean site direction, of the Tunas Formation in the Toro Negro stream, versus percentage of tectonic correction. Lines are significance
levels: 99 per cent and 95 per cent according to McFadden’s (1990b) and McElhinny’s (1964) fold test, respectively. See also Table 3 and Fig. 11.
Table 4. Palaeomagnetic poles calculated for each locality: San Carlosalthough it cannot be statistically distinguished from post-(T1), Golpe de Agua (T2) and Toro Negro (T3), and the palaeomagnetictectonic at the 99 per cent confidence level as a consequencepole for the Tunas Formation in the Sierra de las Tunas. Locality;of the small sample size.Plat: pole latitude (°S); Plong: pole longitude (°E); a95 (°)=semiangleThese data suggest that the magnetization of the Tunasof the 95 per cent confidence cone; k: Fisher statistical parameter
Formation of the arroyo Toro Negro locality, like those at(Fisher 1953); n: number of virtual geomagnetic poles used for the
estancia San Carlos and Golpe de Agua, was acquired duringcalculation of the pole.
or after the folding of the sequence.
Locality Plat Plong a95° k n
DISCUSSION AND TECTONIC Ea. San Carlos (T 1) 61.0°S 13.0°E 6 74 9IMPLICATIONS Ea. Golpe de Agua (T 2) 62.0°S 22.9°E 10.3 35.5 7
Ayo. T oro Negro (T 3) 77°S 327.9°E 23.5 16 4Results presented here support the interpretation that the
Tunas Pole 63.0°S 13.9°E 5.4 39.7 20rocks of the Tunas Formation in the Sierra de las Tunas have
a characteristic stable remanent magnetization carried byhaematite, with exclusively reverse polarity consistent withmagnetization assigned to the Kiaman interval. Mesozoic poles from South America. The new pole is coincident
with other early Permian poles. The palaeofloristic and palaeo-Geological evidence of quasi-syntectonic deposition for theTunas Formation is available. Growth folds at the arroyo faunistic associations found in the Bonete and Tunas formations
(Harrington 1947; Archangelsky & Cuneo 1984) indicate anToro Negro locality were described by Rossello et al. (1993)
and by Lopez Gamundi et al. (1995). They are indicative of early Permian age for these rocks (Asselian to Artinskian). Asmentioned above, however, the magnetization found in thesedeformation contemporaneous with deposition. These authors
note also that sediment transport was in the same direction as rocks does not correspond to the age of deposition but to
the time of folding and deformation. This suggests that defor-the tectonic transport.A formation mean based on all accepted sites for the Tunas mation occurred very soon after the deposition of the Tunas
Formation. Andreis et al. (1979) concluded that the haematiteFormation is Declination=147.4°, Inclination=58.8°, a95=4.8°;k=47.3, N=20, indicating a syntectonic magnetization at the of the Tunas Formation has a primary origin (detrital or early
diagenetic). It appears likely that deformation was diachronous,95 and 99 per cent levels of confidence (Fig. 13). We have
calculated the palaeopole positions for each locality, based on and began in the western areas of the Tunas depositional basinwhile deposition was taking place in eastern areas.the appropriate unfolding tests (Table 4).
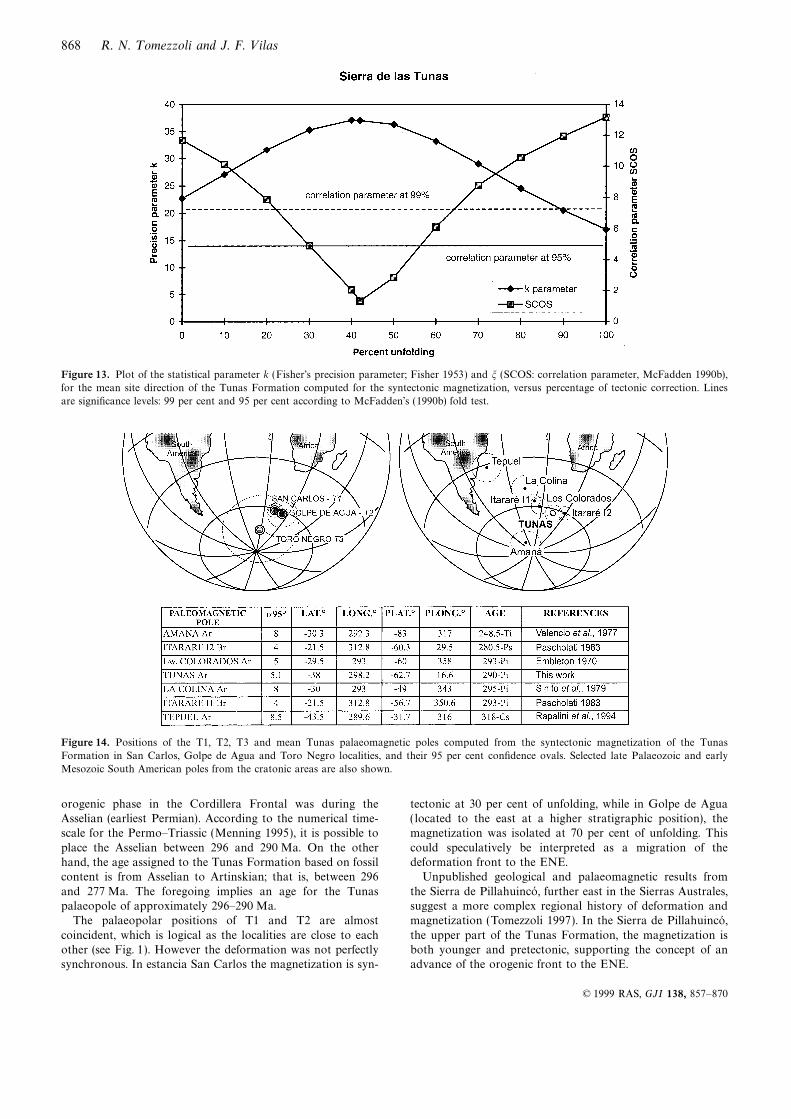
From the virtual geomagnetic poles for each site, a syn- The early Permian deformation responsible for the mag-
netization described here may correspond to the activity of thetectonic palaeomagnetic pole called T unas was calculated:Latitude: 63.0°S; Longitude: 13.9°E, A95=5.4° and K=39.7, San Rafaelic orogenic phase (Azcuy & Caminos 1987; Ramos
1988). This phase has been recognized mainly in the westernN=19 (Table 4). This mean excluded the virtual geomagnetic
pole site TN4 (which lies outside a window of radius 40° about areas of Argentina and has been linked to remagnetizationon a regional scale (Rapalini & Tarling 1993). According tothe mean). The positions of poles T1, T2 and T3 are shown
in Fig. 14, which also lists selected late Palaeozoic and early Llambıas & Sato (1995), the beginning of the San Rafaelic
© 1999 RAS, GJI 138, 857–870
868 R. N. T omezzoli and J. F. V ilas
Figure 13. Plot of the statistical parameter k (Fisher’s precision parameter; Fisher 1953) and j (SCOS: correlation parameter, McFadden 1990b),
for the mean site direction of the Tunas Formation computed for the syntectonic magnetization, versus percentage of tectonic correction. Lines
are significance levels: 99 per cent and 95 per cent according to McFadden’s (1990b) fold test.
Figure 14. Positions of the T1, T2, T3 and mean Tunas palaeomagnetic poles computed from the syntectonic magnetization of the Tunas
Formation in San Carlos, Golpe de Agua and Toro Negro localities, and their 95 per cent confidence ovals. Selected late Palaeozoic and early
Mesozoic South American poles from the cratonic areas are also shown.
orogenic phase in the Cordillera Frontal was during the tectonic at 30 per cent of unfolding, while in Golpe de Agua( located to the east at a higher stratigraphic position), theAsselian (earliest Permian). According to the numerical time-
scale for the Permo–Triassic (Menning 1995), it is possible to magnetization was isolated at 70 per cent of unfolding. This
could speculatively be interpreted as a migration of theplace the Asselian between 296 and 290 Ma. On the otherhand, the age assigned to the Tunas Formation based on fossil deformation front to the ENE.
Unpublished geological and palaeomagnetic results fromcontent is from Asselian to Artinskian; that is, between 296
and 277 Ma. The foregoing implies an age for the Tunas the Sierra de Pillahuinco, further east in the Sierras Australes,suggest a more complex regional history of deformation andpalaeopole of approximately 296–290 Ma.
The palaeopolar positions of T1 and T2 are almost magnetization (Tomezzoli 1997). In the Sierra de Pillahuinco,
the upper part of the Tunas Formation, the magnetization iscoincident, which is logical as the localities are close to eachother (see Fig. 1). However the deformation was not perfectly both younger and pretectonic, supporting the concept of an
advance of the orogenic front to the ENE.synchronous. In estancia San Carlos the magnetization is syn-
© 1999 RAS, GJI 138, 857–870
Age of deformation of the Sierras Australes thrust and fold belt 869
Cristallini, E.O., 1995. CrioIapd, Programa de computacion deCONCLUSIONS transferencia de datos del Criogenico 2G Interprises, al IAPD,
Universidad de Buenos (unpublished).A palaeomagnetic study of the Tunas Formation in the SierrasEmbleton, B.J.J., 1970. Paleomagnetic results for the Permian of SouthAustrales of Buenos Aires province shows that rocks from the
America and a comparison with the African and Australian data,San Carlos, Golpe de Agua and arroyo Toro Negro (situatedGeophys. J. R. astr. Soc., 21, 105–118.
in the Sierra de las Tunas) localities are carriers of a syntectonicFisher, R.A., 1953. Dispersion on a sphere, Proc. R. Soc. L ond., A,
magnetization acquired during the folding of the sequence.217, 295–305.
This is thought to correspond in time to the San RafaelicFurque, G., 1973. Descripcion Geologica de la Hoja 34 n, Sierra de
orogenic phase of the Early Permian. It is possible to constrain Pillahuinco, Provincia de Buenos Aires, Servicio Nacional Minerothe age of the Tunas magnetization, and thus of its palaeo- Geologico, Bol. 141, Buenos Aires.magnetic pole, by biostratigraphic control, regional correlation Halls, H.C., 1976. A least squares method to find a remanence directionand position in the APWP, to the early Permian, within the from converging remagnetization circles, Geophys. J. R. astr. Soc.,approximate range of 296–290 Ma. Deformation in the late 45, 297–304.
Palaeozoic occurred very soon after the deposition of the lower Harrington, H.J., 1947. Explicacion de las Hojas Geologicas 33m
y 34m, Sierras de Curamalal y de la Ventana, Provincia depart of the Tunas sequence. It seems likely that deformationBuenos Aires, Servicio Nacional de Minerıa y Geologıa, Bol. 61,began earlier in the western areas of the Tunas depositionalBuenos Aires.basin, and was contemporaneous with deposition in the eastern
Iniguez, A.M., Andreis, R.R. & Zalba, P.A., 1988. Eventos piroclasticosareas, consistent with the ENE advance of the orogenic front.en la Formacion Tunas (Permico), Sierras Australes, provincia deConsidering that the collision between Patagonia and theBuenos Aires, Actas II, Jornadas Geologicas Bonaerenses, 383–395,South American craton began during Devonian times, this earlyBahıa Blanca.Permian deformation may represent the final consolidation
Japas, M.S., 1989. La deformacion de la cadena plegada de las Sierrasbetween these continental blocks.
Australes de la Provincia de Buenos Aires, An. Acad. Nacional de
Ciencias Exactas Fısicas y Naturales, Cordoba, 40, 193–215.
Kirschvink, J.L., 1980. The least squares line and plane and theACKNOWLEDGMENTS analysis of paleomagnetic data, Geophys. J. R. astr. Soc., 62,
699–718.This palaeomagnetic study is part of the doctoral dissertation
Llambıas, J.E. & Prozzi, C.R., 1975. Ventania, in Geologıa de laof RNT, supported by the Consejo Nacional de Investigaciones
Provincia de Buenos Aires, VI Cong. Geol. Argentino, pp. 79–102,Cientıficas y Tecnicas (CONICET-Argentina) and the Universidad Relatorio, Buenos Aires.de Buenos Aires (Proyecto UBACYT-EX135), Laboratorio de Llambıas, J.E. & Sato, A.M., 1995. El batolito de Colanguil: transicionPalaeomagnetismo ‘D.A. Valencio’, Departamento de Ciencias entre orogenesis y anorogenesis, Revista Asoc. Geol. Argentina,Geologicas. We recognize special debts of gratitude to Dr 50 (1–4), 111–131.E. Cristallini, for his invaluable collaboration during all Lopez Gamundi, O.R., 1996. Modas detrıticas del Grupo Pillahuinco
phases of this work, and to Drs A. Rapalini and H. Vizan (Carbonıfero tardıo-Permico), Sierras Australes de la Provincia
de Buenos Aires: su significado geotectonico, Asoc. Argentinafor continuous help and critical comment. Drs S. Japas, J. SellesSedimentologıa, Revista, 3 (1), 1–10.Martınez and J. Pares collaborated with the field studies.
Lopez Gamundi, O.R., Conaghan, P.J., Rossello, E.A. & Cobbold, P.R.,Drs C. Mac Niocaill and W.D. MacDonald offered helpful1995. The Tunas Formation (Permian) in the Sierras Australessuggestions which greatly improved this contribution. TwoFoldbelt, east central Argentina: evidence for syntectonic sedi-anonymous reviewers gave constructive suggestions on thementation in a foreland basin, J. South Am. Earth Sci., 8 (2), 129–142.original manuscript. The administrators at estancias San
Lopez Gamundi, O.R. & Rossello, E.A., 1993. Devonian-CarboniferousCarlos and Golpe de Agua kindly facilitated access to theirunconformity in Argentina and its relation to the Eo-Hercynian
properties for sampling.orogeny in southern South America, Geol. Rundsch., 82, 136–147.
Massabie, A.C. & Rossello, E.A., 1984. La discordancia pre-Formacion
Sauce Grande y su entorno estratigrafico Sierras Australes deREFERENCES Buenos Aires, Argentina, 9th Congreso Geologico Argentino, Actas
I, 337–352.Andreis, R.R. & Cladera, G., 1992. Las epiclastitas permicas de la
McElhinny, M.W., 1964. Statistical significance of the fold test inCuenca Sauce Grande (Sierras Australes, Buenos Aires, Argentina),
palaeomagnetism, Geophys. J. R. astr. Soc., 8, 338–340.Parte 1: Composicion y procedencia de los detritos, Cuarta Reunion
McFadden, P.L., 1990a. A new fold test for paleomagnetic studies,de Sedimentologıa, Actas, 1, 127–134. La Plata, Buenos Aires.
Geophys. J. Int., 103, 163–169.Andreis, R.R., Lluch, J.J. & Iniguez Rodriguez, A.M., 1979.
McFadden, P.L., 1990b. A Fold T est Using Directional Correlation,Paleocorrientes y Paleoambientes de las Formaciones Bonete yDivision of Geophysics, Bureau of Mineral Resources, Canberra,Tunas, Sierras Australes de la Provincia de Buenos Aires, Argentina,Australia.Sexto Congreso Geologico Argentino, Actas II, 207–224, Bahıa
McFadden, P.L. & McElhinny, N.W., 1988. The combined analysis ofBlanca.remagnetization circles and the direct observations in paleomagnetism,Archangelsky, S. & Cuneo, R., 1984. Zonacion del Permico continentalEarth planet. Sci. L ett., 87, 161–172.de Argentina sobre la base de sus plantas fosiles III Congreso
Mena, M., 1994. Cirdi, Programa de computacion para el calculo deLatinoamericano Paleontologico, pp. 143–153, Memoria, Mexico.direcciones mediante analisis de cırculos maximos, Universidad deAzcuy, C.L. & Caminos, R., 1987. Diastrofismo, in El Sistema CarbonıferoBuenos Aires, Laboratorio de Paleomagnetismo (unpublished).En la Republica Argentina, pp. 239–251, ed. Archangelsky, S.,
Menning, M., 1995. A numerical time scale for the Permian andAcademia Nacional de Ciencias, Cordoba.Triassic Periods: An integrated time analysis, in The Permian ofCreer, K.M., Embleton, B.J.J. & Valencio, D.A., 1970. Triassic andNorthern Pangea, pp. 77–97, eds Scholle, P.A., Peryt, T.M. &Permo-Triassic paleomagnetic data for South America, Earth planet.
Sci. L ett., 8, 173–178. Ulmer-Scholle, D.S., Springer-Verlag, Berlin.
© 1999 RAS, GJI 138, 857–870
870 R. N. T omezzoli and J. F. V ilas
Oviedo, E., 1989. Mag88, Un sistema de computacion para analisis de Rossello, E.A., Massabie, A.C., Lopez Gamundi, O.R., Cobbold, P.R.
& Gapais, D., 1997. Late Paleozoic transpression in Buenos Airesdatos paleomagneticos, PhD thesis, Universidad de Buenos Aires.
Pascholati, E.M., 1983. Possibilidade de interferencias termais do and northeast Patagonia ranges, Argentina, J. South Am. Earth Sci.,
10(5–6), 389–402.magnetismo Juro-cretacico na analise paleomagnetica do Grupo
Itarare, Atlas do 4 Simposio Regional de Geologia, SBG, Sinito, A.M., Valencio, D.A. & Vilas, J.F., 1979. Paleomagnetism of a
sequence of Upper Palaeozoic–Lower Mesozoic red beds frompp. 211–222, Sao Paulo, Brazil.
Pereyra, F.X., 1996. Caracterizacion geomorfica y evolucion del paisaje Argentina, Geophys J. R. astr. Soc., 58, 237–247.
Tomezzoli, R.N., 1997. Geologıa y paleomagnetismo en el ambito dede un sector de las Sierras Australes de la Provincia de Buenos
Aires, Revista Asoc. Geol. Argentina, 51(3), 248–260. las Sierras Australes de la provincia de Buenos Aires, PhD thesis,
Universidad de Buenos Aires.Quattrocchio, M., Kostadinoff, J., Martinez, G. & Prieto, A., 1995.
Evidencias de neotectonica en el rıo Sauce Chico, Provincia de Tomezzoli, R.N. & Cristallini, E.O., 1998. Nuevas evidencias sobre la
importancia del fallamiento en la estructura de las Sierras AustralesBuenos Aires, Revista Asoc. Geol. Argentina, 49(3–4), 297–305.
Ramos, V.A., 1984. Patagonia: un continente paleozoico a la deriva?, de la Provincia de Buenos Aires, Revista Asoc. Geol. Argentina.,
53(1), 117–129.Noveno Congreso Geologico Argentino, Actas II, S. C. Bariloche,
pp. 311–325, Buenos Aires. Tomezzoli, R.N. & Vilas, J.F., 1997. Paleomagnetismo y fabrica
magnetica en afloramientos cercanos a las Sierras Australes de laRamos, V.A., 1988. Tectonics of the Late Proterozoic–Early Paleozoic:
a collisional history of Southern South America, Episodes, 11(3), Provincia de Buenos Aires (Lopez Lecube y Gonzalez Chaves),
Revista Asoc. Geol. Argentina., 52(4), 419–432.168–174.
Rapalini, A.E. & Tarling, D.H., 1993. Multiple magnetizations in Torsvik, T.H., 1990. IAPD: Interactive Analysis of Paleomagnetic Data,
Oxford University.the Cambrian-Ordovician carbonate platform of the Argentine
Precordillera and their tectonic implications, T ectonophysics, 227, Valencio, D.A., Vilas, J.F. & Mendia, J.E., 1977. Paleomagnetism of
a sequence of red beds of the middle and the upper sections49–62.
Rapalini, A.E., Tarling, D.H., Turner, P., Flint, S. & Vilas, J.F., 1994. of Paganzo Group (Argentina) and the correlation of upper
Paleozoic–lower Mesozoic rocks, Geophys. J. R. astr. Soc., 51, 59–74.Paleomagnetism of the Carboniferous Tepuel Group, Central
Patagonia, Argentina, T ectonics, 13(5), 1277–1294. Varela, R., 1978. Sierras Australes de la Provincia de Buenos Aires:
Hipotesis de trabajo sobre su composicion geologica y rasgosRapalini, A.E. & Vilas, J.F., 1991. Preliminary paleomagnetic data
from the Sierra Grande Formation: Tectonic consequences of the geotectonicos salientes, Revista Asoc. Geol. Argentina, 33(1), 52–62.
Von Gosen, W., Buggisch, W. & Dimieri, L., 1990. Structural andfirst mid-Paleozoic paleopoles from Patagonia, J. South Am. Earth
Sci., 4 (1–2), 25–41. metamorphic evolution of Sierras Australes (Buenos Aires Province,
Argentina), Geol. Rundsch., 79/3, 797–821.Rossello, E.A., Cobbold, P.R. & Lopez Gamundi, O.R., 1993. Pliegues
de crecimiento en la Formacion Tunas (Zoilo Peralta), Sierras Zijderveld, A.C., 1967. Demagnetization of rocks: Analysis of results,
in Methods in Palaeomagnetism, pp. 254–286, eds Collinson, D.W.,Australes de la Provincia de Buenos, Argentina, Proyecto Pangea y
Glopals (San Juan), Comunicaciones, pp. 52–55. Creer, K.M. & Runcorn, S.K., Elsevier, Amsterdam.
© 1999 RAS, GJI 138, 857–870