pakistan market assessment - wfp remote access secure
TRANSCRIPT
1
PPAAKKIISSTTAANN
MMaarrkkeett AAsssseessssmmeenntt EEaarrtthhqquuaakkee AAffffeecctteedd AArreeaass
WFP Regional Bureau Middle East, Central Asia and Eastern Europe
December 2005
2
Market assessment and trader survey of earthquake affected areas of Pakistan Administered Kashmir Prepared by Jennifer Nyberg United Nations World Food Programme Regional Bureau for Middle East, Central Asia and Eastern Europe Cairo, Egypt Acknowledgements The author wishes to thank all those WFP colleagues who supported the market assessment and trader survey, particularly the Pakistan Country Office and WFP ODC VAM Unit, plus the enumerator team, local market operators, government officials, NGO and IGO representatives, and others who gave their time and insights to provide useful information for this report. Contact: Jennifer Nyberg WFP ODC Regional Assessment Officer Gardenia Nile Building, Roads 108 and 16, Hadaek El Maadi P.O. Box 1265, Cairo, Egypt Tel: +20 (0) 2 528 1730, ext 2440 E-mail: [email protected]
3
CONTENTS Summary Findings and Recommendations I. Introduction 8 II. Relevant Country Background 9 Pakistan wheat policy and market 9 Rice, livestock and dairy sub-sectors 10 Trade 11 III. Food, Agriculture and Markets in Affected Areas 12 General market characteristics 13 IV. Findings from the Trader Surveys 14 Qualitative survey results 17 Trader Perceptions 19 Quantitative survey results 19 V. Conclusions and Recommendations 22
Market considerations relevant to targeting and 23 programming
Annex 1 – Terms of Reference Annex 2 – Pakistan Food Deficit Map for Cereals Annex 3 – Pakistan Food Deficit Map for Livestock Annex 4 – Rural and Urban Earthquake Affected Populations Annex 5 - Trader Survey for market and price monitoring
4
SUMMARY FINDINGS
Food is readily available in Pakistan, particularly food grains, wheat and rice, for which domestic production meets market demand in most years. Access to food remains a significant problem, however, particularly for the poorest populations in rural areas that are usually subsistence farmers in the most food deficit regions. Wheat is the most important dietary component, comprising nearly 50 percent of daily food consumption. Pakistan is also a major producer and net exporter of rice, produces oilseeds and pulses and has a sizeable livestock and dairy complex. Markets are for the most part well integrated, and recent economic growth has been fairly robust.
Wheat production is estimated at 21.6 million metric tons for 2004/05,
eight percent higher than the crop year target, after several years of crop shortfalls. Recent statements by the Government of Pakistan announced that the country had achieved self-sufficiency in wheat production in the current crop year. Wheat ending stocks are estimated at 2.5 million tons for 2005, with Government procured stocks at slightly more than one million tons. Recent trade policy changes liberalized commercial imports of wheat, as well as domestic procurement and marketing policies. This new trade policy resulted in commercial imports, signaling that domestic prices have fluctuated near import parity levels since mid-2005. The Ministry of Food, Agriculture and Livestock (MINFAL) also announced a higher wheat procurement price in mid-November that should act as further incentive to increase wheat production in 2005/06 and beyond.
The earthquake affected areas of Azad Jammu Kashmir (AJK) and the
Northwest Frontier Province (NWFP), in terms of agricultural production, food availability and food access, are in sharp contrast to most of the rest of Pakistan. Considered some of the most highly food insecure regions of the country, estimated foodgrains (wheat and rice) deficit in 2003/04 was 2.5 million metric tons1. Agricultural systems are largely based on subsistence farming by smallholders and tenant farmers, with nearly 50 percent cultivating areas of less than five acres2. The Government of Pakistan typically allocates an annualized ‘quota’ of wheat for redistribution and milling to both provinces to bridge the food gap between harvests. Given the food balance in the earthquake affected areas, as well as the relatively small proportion of the national population and total food demand in Pakistan that AJK and NWFP represent, the potential for widespread adverse effects on market prices and price disincentives on future wheat production are minimal.
Significant differences exist between the rural and urban populations of
earthquake affected populations in terms of food access and seasonal food gaps or ‘localized’ food availability problems. Small subsistence farmers, landless rural families and unskilled urban workers, prior to the crisis, often did not have access to food at prevailing market prices3. The earthquake caused substantial grain stock losses, as well as significant loss of standing crops left not harvested, and has resulted in significant ‘localized’ food gaps in rural areas, particularly remote rural highlands with blocked or heavily damaged transport corridors. Restoration of agricultural output and livestock productivity to pre-earthquake levels may take two full crop cycles, particularly in rural highlands.
1 WFP Pakistan, VAM Unit and Food Departments, NWFP and AJK, based on 2003/04 data for estimated net wheat and rice production and consumption by province. 2 Food Department of AJK Statistics for 2002/2003 3 Food Insecurity in Rural Pakistan 2003, WFP Pakistan and Sustainable Development Policy Institute, Islamabad, Pakistan.
5
The trader survey undertaken for this market assessment affirmed many of the conclusions of the emergency food security and nutrition assessment, although it found that relief food in urban areas was a much less appropriate response than non-food (income transfers), except for displaced persons. The survey affirmed the need for food relief in more remote rural areas at least until the next local harvest (rice and maize) in October 2006 and possibly beyond, dependent on when roads are re-opened and commercial markets are recovered and functional.
Market recovery in the earthquake affected areas varied significantly at
the time of the trader survey (mid-November 2005). More rapid market recovery was observed in urban areas with less earthquake damage and those on primary transport routes, such as Mansehra, Shenkiari, Battagram and Besham, situated the main Karakarum Highway, which reopened immediately after the earthquake. There was evidence of early and slower market recovery (at least at the time of the survey) in the more seriously damaged areas, such as Bagh and Muzaffarabad. Very little evidence of market recovery or capacity to resume normal market function was observed in Balakot, one of the most severely damaged areas.
Generally, however, the large wholesale markets in Rawalpindi and
Islamabad seem to have remained fairly well integrated with the secondary and tertiary (retail) markets in most of the less affected urban and semi-urban areas. As such, while ‘localized’ food availability and food access are the primary concern for remote rural populations, the major issue confronting affected urban populations is food access and lack of cash reserves. The most appropriate response for the populations in urban areas with functional and rapidly recovering markets is a non-food response. Replacement of in-kind relief for cash in rural areas after the next harvest, when transport corridors reopen, market infrastructure and supply chain linkages are restored should be considered.
The Government announced cash compensation schemes in mid-
November to support restoration of consumer purchasing power in urban areas where food items were readily available and market linkages were recovering rapidly4. This supported targeting relief food to displaced persons, as well as affected rural populations in remote areas where market recovery is much slower, remain inaccessible due to the onset of winter or have transport corridors that remain blocked.
The results of the trader survey found that prices of basic staple foods
were higher in rural areas than urban, mainly attributable to increased transport costs, although in some cases also attributable to ‘temporary’ shortages due to road conditions and lack of cash reserves. Rural traders cited the greatest increase in transport costs, 52 percent, compared to 17 percent in urban areas. Many traders cited increased demand for local transport (trucks) by national and international relief groups as the primary reason. Nearly 60 percent of the traders had access to credit from wholesalers to purchase supplies prior to the crisis, but only 32 percent cited access to credit post-earthquake – and in turn, had stopped offering credit. This is significant in that many of the poorest rural populations rely on credit to purchase food stocks to over winter.
4 The initial Government compensation package was Rs25,000 per damaged or destroyed household (shelter), but was increased to Rs150,000, plus an additional Rs25,000 if reconstruction meets earthquake-resistant standards; Rs100,000 for death in the family and Rs50,000 for serious injuries and Rs 25,000 for per affected household. Plans were also underway (late November) to start monthly disbursements of cash grants (Rs 3,000) in early 2006 based on Pakistan Census data for families at poverty level.
6
Prices had not increased for major food crops in areas outside of the
earthquake-affected provinces. Price response in Rawalpindi, the primary wholesale market for traders in the earthquake-affected areas, was mixed. The crisis, loss of cash reserves and blocked transport corridors, plus the sharp decline in purchasing power at the retail trader and consumer levels had resulted in less demand pull than the Rawalpindi wholesalers anticipated. The effects of the crisis, however, on national food markets, with the exception of early increases in transport costs for northbound freight from Karachi, have been minimal. However, the possible adverse effects of sustained distribution of relief food on market recovery in rural areas (particularly if agricultural output and markets recovery more rapidly than anticipated), and potential downstream effects on wholesale markets in Rawalpindi and Lahore should be monitored.
Full or partial market recovery in the more inaccessible mountainous
regions will depend on restoration of agricultural output to pre-crisis levels, restoration of purchasing power through income transfers or resumption of livelihood activities. Most link roads between more urban areas and rural tehsils may take two to three years to be fully rehabilitated, while the agricultural sector may require two full seasons (18 to 24 months) to recover to previous output and yield levels.
SUMMARY RECOMMENDATIONS
The programming implications for food aid are significant. The trader survey and market assessment affirmed that food access was the primary issue in urban areas, not food availability. However, every consideration should be made to understand the extent of domestic wheat and rice supplies that will be made available to the earthquake affected areas by the Government of Pakistan, either as part of the annual wheat quota allocation or some other special relief programme. The risks of commercial import displacement of wheat are minimal.
Given the overall damage to the agricultural sector, food assistance is
necessary in rural areas that have both food availability and food access problems through the next harvest (Oct 2006) and potentially beyond5. This affirms food aid programming in the most inaccessible and difficult to reach rural, northern highland areas. For the vulnerable populations (non-encamped) in urban areas, the cash compensation scheme and recovery efforts of Government and other relief and recovery actors should alleviate food access problems, as food is available to urban markets.
If cereals are included in food aid programming beyond the next harvest,
local purchase of Pakistani origin should be a priority, particularly rice. Given the overall food balance sheet situation in Pakistan, there is sufficient national production and stocks of wheat and rice to essentially fulfill the cereal food needs of the affected populations in urban and rural areas. The recent announcement of a higher support price for wheat should act as incentive for growers and result in further production increases in the 2006/07crop year. Local purchase of both wheat and rice, if included in food aid programming, could provide some additional market support.
Market and price monitoring in urban and rural areas will be necessary to help
gauge whether or not vulnerable populations are able to access food and/or traders are able to ‘access’ their own food supplies for resale. The VAM Unit in
5 Please see Annex 4 – Earthquake affected population (rural and urban) in need of food
7
the Pakistan Country Office is best suited to manage this monitoring, administer and supervise the monthly questionnaire. Furthermore, monitoring criteria that will help determine if early phase-out is appropriate or necessary should be developed.
An in-depth follow-up needs assessment will be necessary in
March/April 2006 to determined whether or not food availability and access problems have been addressed by relief, as well as review the necessary duration of programmed aid. The follow-up assessment would need to incorporate the findings of any assessment(s) of the agriculture, livestock and nutritional situation prior to the next local harvest of maize and rice (October 2006), as well as review the effects of income transfers on market recovery and whether or not market function has fully recovered.
8
I. INTRODUCTION
1. The Joint WFP/UNICEF Rapid Emergency Food Security and Nutrition Assessment (EFSNA) assumed that markets would recover more rapidly in urban areas of the earthquake-affected areas of Azad Jammu Kashmir (AJK) and Northwest Frontier Province (NWFP) of Pakistan6. At the time of the joint EFSNA (October 2005), many of the damaged retail and wholesale markets in the affected areas had not reopened, and in some areas marketing activities had for all essential purposes ceased7. Reports indicated that food prices increased rapidly in rural and urban areas in most affected locations.
2. The specific objectives of the market assessment were to (i) to better understand local market structures in the earthquake affected areas; (ii) undertake a trader survey in the affected areas to analyze price changes and market issues, such as transport costs, credit availability and marketing margins; (iii) validate the preliminary findings related to markets in the assessment, particularly for urban areas, describe probable market recovery over the near term and the potential effects of food aid on local markets; and (iv) provide a markets related analysis to support programming decisions and recommend ways to monitor markets/prices in the earthquake affected areas.
3. The methodology of the trader survey was based on purposive sampling, stratified by trader type (primary, secondary and tertiary/consumer) in 12 tehsils in seven districts in AJK and NWFP. Additional trader surveys and secondary research were undertaken in Rawalpindi, Peshawar, Quetta and Karachi to determine the effect of the earthquake on prices and markets in other districts and urban centers of Pakistan8. The questionnaire was pre-tested in Rawalpindi, modified prior to the six days of fieldwork and used to interview 213 traders (196 in the earthquake affected areas). At the time of the trader survey (mid-November 2005), most of the urban (and some rural) markets in the affected areas in the Muzaffarabad, Bagh, Batagram and Mansehra districts had very recently reopened - in some cases less than three to four days prior to the start date of the survey. Markets in Mansehra and Shangla sustained much less damage, and markets remained open immediately post-earthquake. However, at the time of the survey, the serious decline in consumer purchasing power, not to mention loss of life, had led many of surveyed shopkeepers to consider closing down and migrating to larger urban areas, such as Rawalpindi or Islamabad.
4. This report briefly presents relevant country background information on the agricultural sector in Pakistan and food, agriculture and markets in the earthquake affected areas. Food availability and food access issues related to the crisis in the affected areas are discussed, as well as findings from the trader survey, possible effects of food aid on markets, price and market monitoring and summary conclusions and recommendations.
6 Please refer to http://www.wfp.org/operations/emergency_needs/assessment. 7 The definition of urban areas in the earthquake affected areas varies significantly, making comparative analysis between rural and urban areas (markets) difficult. Some census data define urban areas by type of local government institutions, such as municipal corporations, municipal committees, cantonment boards and town committees. Other sources define urban areas as zones with populations of at least 5000 persons living in contiguous housing with community-maintained public utilities (roads, street lighting, water supply, sanitation). Urban areas in the earthquake-affected areas are largely characterized by higher levels of commerce, predominantly non-agricultural populations and comparatively higher literacy rates. For the purposes of this assessment, markets were determined to be rural or urban based on a review of the various classifications and an analysis by VAM Unit in the WFP-Pakistan Country Office and Regional Assessment Officer (ODC). 8 No surveys were undertaken in Lahore due to staff redeployment to WFP sub-office in Bagh, but secondary reports indicated no change in market prices or market disruptions at time of assessment.
9
II. RELEVANT COUNTRY BACKGROUND
5. Pakistan economic performance improved significantly in fiscal year 2005, achieving the highest annual growth rates of the past twenty years. Agriculture is the dominant sector of the economy, typically accounting for 23 percent of national income (GDP) and employing 42 percent of the workforce9. Cultivation of traditional food staples, such as wheat and rice, and industrial crops, such as cotton and sugarcane, dominate agricultural production. Annual growth in the agricultural sector averaged close to 4.5 percent in the 1990s, with provisional estimates for 2004/05 at 7.5 percent for agriculture, and 17.3 percent for major crops.
6. Growth in major crops is estimated at 7.5 percent for 2004/05, the highest rate since the mid-1990s, largely attributable to record cotton production. Wheat production increased slightly more than 8 percent, and rice by 3 percent. Estimated growth in the agricultural sector may decline to 3 percent in the 2006 fiscal year, as heavy monsoon rains may curtail cotton output. Tighter monetary policies and increased imports of essential food items, such as meat, live animals and vegetables from India may help curb some food price inflation in the near to medium term. Pakistan, however, remains a net food insecure country, and nationally, households spend on average 50 percent of monthly income on food purchases. Food insecurity is even higher in rural areas, due to low incomes and insufficient local production, with rural populations spending 55 percent of total consumption expenditures on food10.
7. The Government of Pakistan has taken steps in recent years to end certain agricultural market interventions, such as guaranteed support prices, retail price controls and import barriers. Procurement prices (or announced intervention support prices) for basmati and irri-6 rice varieties ended with the 1996/97 crop year, and sugarcane in 2003/2004. Given the importance of wheat in the daily diet, Government continues to intervene in the wheat sub-sector through procurement (or support) prices for growers, reallocating wheat to food deficit provinces through internal ‘quotas’ and maintaining price controls on wheat flour ex-mill and retail level. Pakistan Wheat Policy and Markets
8. Nearly 50 percent of the estimated total caloric needs in Pakistan are met through wheat and significant Government interventions in national and provincial wheat markets continue. An estimated 30 percent of national wheat production is retained for own-consumption at the household level11. Prices for government procurement of wheat are established annually, and wheat supplies are reallocated to food deficit provinces based on seasonal patterns. Several years of drought led to crop shortfalls in 2002-03 and 2003-04 and resulted in a Government policy response that increased the wheat procurement price, restricted market movements in Punjab (the main wheat production area) and led to Government tenders for imports (Dorosh 2005).
9. Wheat production in Pakistan for the 2004/05 crop year is estimated at 21.6 million metric tons, eight percent more than the crop year target. Ending stocks are estimated at 2.5 million metric tons12. In an effort to support continued expansions in wheat production, the Government of Pakistan announced a 3.75 percent increase (from Rs400 to Rs415 per 40 Kg) in the official procurement price and allocated Rs50
9 Ministry of Food, Agriculture and Livestock and Federal Bureau of Statistics, Islamabad, Pakistan, November 2005. 10 Household Integrated Economic Survey, 2001/02, Federal Bureau of Statistics, Islamabad, Pakistan. 11 Paul Dorosh, World Bank and Abdul Salam, Former Chairman, Pakistan Agricultural Prices Commission, Wheat Markets and Pricing in Pakistan, June 2005. 12 Food Situation and Outlook, December 2005, FAO Commodities and Trade Division, Rome.
million (about $ 833,333) for a national ‘grow more wheat’ campaign. The national target for 2005/06 is 22 million tons.
10. The Government redistributes national wheat production to food deficit provinces through an annual ‘quota’ allocation the provincial governments in turn reallocate to flour mills. The enforcement of price controls for wheat flour ex-mill and at the retail level is not consistent. The Government periodically intervenes in response to grower, miller or refiner concerns in regard to price increases for other commodities, such as sugar or rice, but there is no systematic price setting, procurement price or stocks reallocation other than for wheat. Dorosh notes that there are major fiscal subsidies and economic rents involved in the sales of Government procured wheat to flour mills at below-market rates. The official wheat sales price to flour mills does not cover full procurement (domestic or imported), storage and handling costs. Profits from sales of wheat flour milled from subsidized Government wheat are ‘thus substantial and there are many wheat mills that operate only in the November to April period and mill only government-supplied wheat.’ The subsidized low market prices for wheat and wheat flour benefit net consumers.
11. Restrictions on commercial imports of wheat as well as controls on domestic purchases were lifted in mid-2005 as part of an initial attempt to liberalize the wheat sub-sector. The Government policy experiment to allow commercial imports of wheat has proven effective13. As of early November 2005, the Ministry of Food, Agriculture and Livestock (MINFAL) reported delivery of 180,000 metric tons of wheat, with an additional 200,000 tons for entry by January 2006; roughly 100,000 tons is reported to be US origin. A significant proportion of the annual wheat quota allocated to NWFP used to be milled for direct export trade, with a shift in recent years to direct wheat flour trade from Lahore (informal and formal) to Afghanistan. Rice, livestock and dairy sub-sectors
Government Wheat Policy
Government wheat policy in Pakistan attempts to balance competing interests of producers and consumers. On the production side, policy is aimed at increasing wheat productivity (yields) and output, as well as supporting farmer incomes. Increased wheat production has also been seen as part of an overall national food security strategy of reducing dependence on food imports for national food supplies. On the consumption side, the government has attempted to enhance household food security, particularly through ensuring availability of wheat flour at affordable prices and maintaining price stability. Food policy options are constrained, however, by overall fiscal constraints, as well as a desire to minimize fiscal subsidies on food. Moreover, the wheat procurement price has been seen as a major determinant of overall inflation because of its role as a wage good and an indicator of overall government price policy. Thus, wheat policy is to some degree constrained by inflation targets and inflation policy. Source: Dorosh and Salam, Wheat Markets Pakistan, June 2005.
12. Rice production in 2004/05 was estimated at 4.9 million metric tons, with forecast 2005/06 output expected to increase to 5.4 million metric tons. Increased output is largely attributable to expanded cultivation of higher-yielding IRRI varieties, favorable rainfall and reduced pest activity. Export volume is expected to increase to 2.4 million tons, based on estimates of 800,000 tons of basmati and 1.6 million tons IRRI rice varieties14. The Government agreed to facilitate the export of IRRI-6 rice to help stabilize low domestic prices in early December 2005, after much higher prices earlier in the year resulted in loss of export volume to suppliers from India and Vietnam. Rice exports for 2005/06 are estimated at 2.5 million tons.
10
13 Press Release, Ministry of Food, Agriculture and Livestock (MINFAL), Islamabad, Pakistan, 24 Nov 2005. 14 USDA Foreign Agricultural Service, Pakistan Wheat and Rice Update Quarterly Report 2005
1970
= 1
00
13. Rice producers and
per Kg price controlmaintain that they wGovernment. Pakistlow prices to the cuagricultural commorelationship betweeof average wheat, fincreased in recent the wheat sub-secto
14. The livestock sub-semore than 6 percenpercent to gross dothe world, with outphas increased betweAnnual per capita coexpected to increasconsumption trendsslaughterhouses, anpercent by 2020, w Trade
15. Pakistan has significWorld Trade Organipromote regional trthe South Asian AssPreferential Trade Atrade selected prodearly 2006 (tariff reNegotiations for a FPakistan have also ilicenses, closure of tariff barriers to imp
15 Report and RecommenIslamic Republic of PakisDevelopment Bank, Islam16 SAARC members inclu
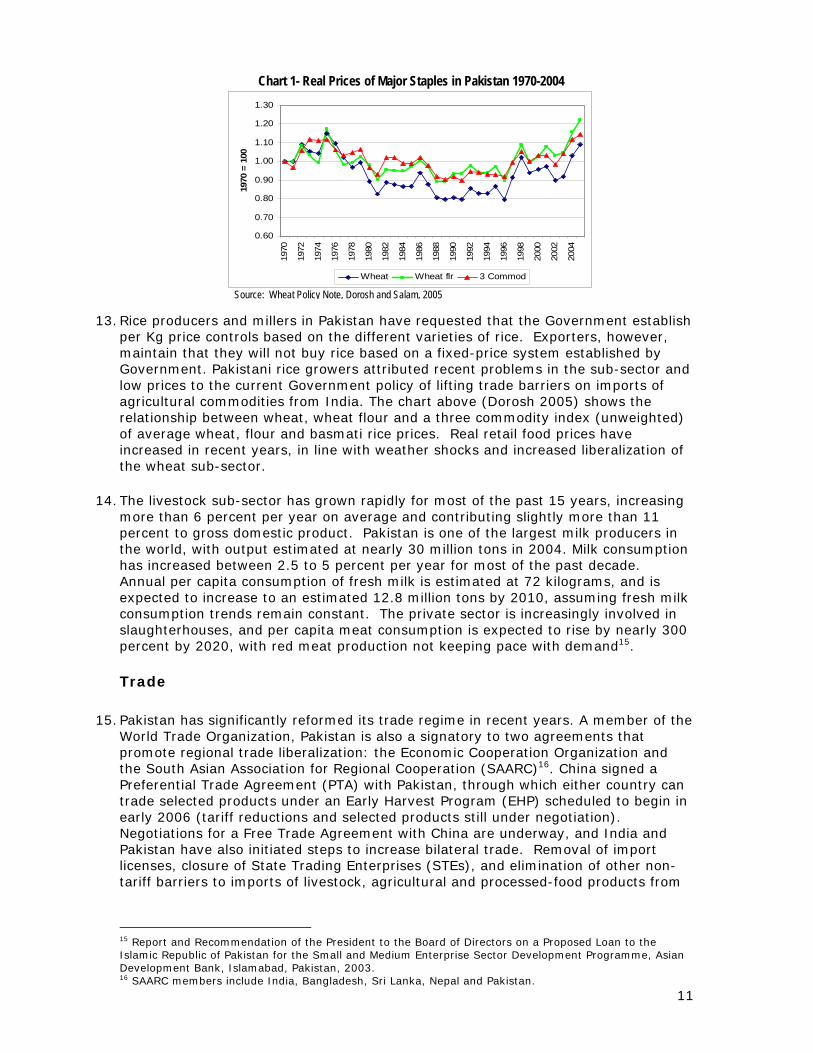
Chart 1- Real Prices of Major Staples in Pakistan 1970-2004
0.60
0.70
0.80
0.90
1.00
1.10
1.20
1.30
1970
1972
1974
1976
1978
1980
1982
1984
1986
1988
1990
1992
1994
1996
1998
2000
2002
2004
flr 3 Commod
Wheat WheatSource: Wheat Policy Note, Dorosh and Salam, 2005
millers in Pakistan have requested that the Government establish s based on the different varieties of rice. Exporters, however, ill not buy rice based on a fixed-price system established by
ani rice growers attributed recent problems in the sub-sector and rrent Government policy of lifting trade barriers on imports of dities from India. The chart above (Dorosh 2005) shows the n wheat, wheat flour and a three commodity index (unweighted) lour and basmati rice prices. Real retail food prices have years, in line with weather shocks and increased liberalization of r.
ctor has grown rapidly for most of the past 15 years, increasing t per year on average and contributing slightly more than 11 mestic product. Pakistan is one of the largest milk producers in ut estimated at nearly 30 million tons in 2004. Milk consumption en 2.5 to 5 percent per year for most of the past decade. nsumption of fresh milk is estimated at 72 kilograms, and is
e to an estimated 12.8 million tons by 2010, assuming fresh milk remain constant. The private sector is increasingly involved in d per capita meat consumption is expected to rise by nearly 300
ith red meat production not keeping pace with demand15.
antly reformed its trade regime in recent years. A member of the zation, Pakistan is also a signatory to two agreements that ade liberalization: the Economic Cooperation Organization and ociation for Regional Cooperation (SAARC)16. China signed a greement (PTA) with Pakistan, through which either country can ucts under an Early Harvest Program (EHP) scheduled to begin in ductions and selected products still under negotiation). ree Trade Agreement with China are underway, and India and nitiated steps to increase bilateral trade. Removal of import State Trading Enterprises (STEs), and elimination of other non-orts of livestock, agricultural and processed-food products from
11
dation of the President to the Board of Directors on a Proposed Loan to the tan for the Small and Medium Enterprise Sector Development Programme, Asian abad, Pakistan, 2003.
de India, Bangladesh, Sri Lanka, Nepal and Pakistan.
Most-Favoured Nation (MFN) origins was completed in 200117. India has accorded MFN status to Pakistan, but reciprocal status, to date, has not been granted to India.
16. The Government recently requested that visa restrictions be lifted for entry of traders from Pakistan to India, and removed import duties on onions, meat products and live animals, potatoes, garlic and tomatoes of Indian origin. Pakistan further requested that quarantine stations be established on the Indian side of the Wagah Attari border crossing, close to Lahore (Punjab) and the major northern transport corridors to Pakistan-controlled Kashmir. The quarantine facilities would expedite the import of live animals and waive import duties on livestock. Pakistan also lifted the ban on sugar imports from India in October 2005. These actions should also be considered attempts to mitigate potential future price increases for the listed food products and live animals.
III. FOOD, AGRICULTURE AND MARKETS IN AZAD JAMMU KASHMIR AND NORTHWEST FRONTIER PROVINCE
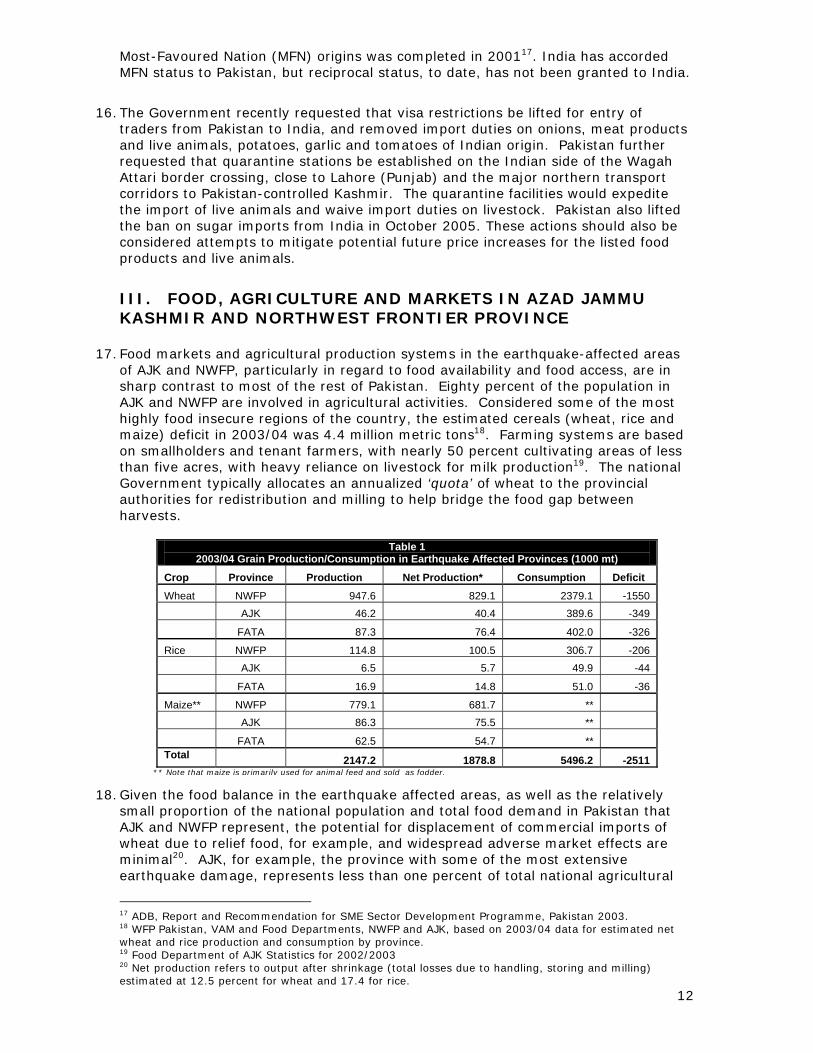
17. Food markets and agricultural production systems in the earthquake-affected areas of AJK and NWFP, particularly in regard to food availability and food access, are in sharp contrast to most of the rest of Pakistan. Eighty percent of the population in AJK and NWFP are involved in agricultural activities. Considered some of the most highly food insecure regions of the country, the estimated cereals (wheat, rice and maize) deficit in 2003/04 was 4.4 million metric tons18. Farming systems are based on smallholders and tenant farmers, with nearly 50 percent cultivating areas of less than five acres, with heavy reliance on livestock for milk production19. The national Government typically allocates an annualized ‘quota’ of wheat to the provincial authorities for redistribution and milling to help bridge the food gap between harvests.
Table 1 2003/04 Grain Production/Consumption in Earthquake Affected Provinces (1000 mt)
Crop Province Production Net Production* Consumption Deficit Wheat NWFP 947.6 829.1 2379.1 -1550 AJK 46.2 40.4 389.6 -349
FATA 87.3 76.4 402.0 -326
Rice NWFP 114.8 100.5 306.7 -206 AJK 6.5 5.7 49.9 -44
FATA 16.9 14.8 51.0 -36
Maize** NWFP 779.1 681.7 ** AJK 86.3 75.5 **
FATA 62.5 54.7 ** Total 2147.2 1878.8 5496.2 -2511
** Note that maize is primarily used for animal feed and sold as fodder. 18. Given the food balance in the earthquake affected areas, as well as the relatively
small proportion of the national population and total food demand in Pakistan that AJK and NWFP represent, the potential for displacement of commercial imports of wheat due to relief food, for example, and widespread adverse market effects are minimal20. AJK, for example, the province with some of the most extensive earthquake damage, represents less than one percent of total national agricultural
17 ADB, Report and Recommendation for SME Sector Development Programme, Pakistan 2003. 18 WFP Pakistan, VAM and Food Departments, NWFP and AJK, based on 2003/04 data for estimated net wheat and rice production and consumption by province. 19 Food Department of AJK Statistics for 2002/2003
12
20 Net production refers to output after shrinkage (total losses due to handling, storing and milling) estimated at 12.5 percent for wheat and 17.4 for rice.
13
production and less than one percent of agricultural GDP. For some of the most vulnerable populations at higher elevations, maize and rice are usually planted in April and harvested in September/October, with maize used primarily for animal fodder and sold into local markets. Winter wheat is planted in November/December for harvest in June/July. Most of the poorer households would purchase food stocks and rely on credit from traders and any sales of own production to supplement own grain stocks. Typically households at the higher elevations would start moving into the valleys to over winter with the cash received. The earthquake disrupted this cycle, resulted in significant loss of cash and grain reserves, and furthermore, affected populations were reluctant to move to the lower elevations and valleys due to fear of further loss of remaining assets and land use.
19. The earthquake caused significant destabilization of land and soil structures in AJK and NWFP. Natural springs have been disrupted, and up to 60 percent of the irrigation channels have been broken, misaligned or blocked by landslides in NWFP. There was also substantial damage to terraces used for crop production. Major loss of livestock and fodder occurred, as well as loss of grain stocks. Assets such as seeds, fertilizers, tools were lost and critical infrastructure, such as farm-to-market roads and agro-processing facilities, was largely destroyed21.
20. Some 80% of the affected households are dependent on agriculture (own production for household use) and livestock would usually provide cash income from once per year sales during Eid-ul-Adha, and more periodic sales of milk. Livestock and/or milk were a primary source of household income, sold year round as families migrate to over winter with their livestock. Meat sold in urban centers, such as Mansehra, Islamabad or Rawalpindi, tends to originate in the rural areas of AJK and NWFP as there is no meat industry, with the exception of some limited poultry farming. Rapid destocking was taking place through ad hoc assembly markets due to the serious lack of animal fodder available in the affected areas, with animals being sold at seriously discounted prices. Significant levels of animal mortality and productivity further hinder the ability of the affected populations to generate cash income. General Market Characteristics
21. Traders in AJK and NWFP typically purchase food items for resale in the primary wholesale markets of Rawalpindi, Islamabad, Lahore and Peshawar. Secondary and tertiary (retail) traders, for example, in Abbottabad, Mansehra, Muzaffarabad and Mingora, have suppliers in the nearest urban center, as well as the larger primary markets. Markets pre-earthquake were well integrated, and there were significant numbers of traders selling grains/oils, fruits/vegetables, general supplies (mixed food items), although with fewer subsidized wheat traders. Transport costs are the most significant component of price structures in rural markets.
22. Most shopkeepers do not own their shop or structure, tend to rent and very few have
separate storage facilities for supplies. Credit plays an important role in the entire supply chain, with those traders receiving credit tending in turn to offer credit, which plays a significant role in helping poorer households bridge the seasonal food gap during the winter months. The main cereals purchased are wheat flour and rice (IRRI varieties or broken basmati rice), supplemented by dhal, oil/ghee and potato, onion and other vegetables/fruits, tea and sugar. Meat is typically very limited component in the diets of the poor, who rely on milk production from livestock as a dietary supplement. Dietary diversity tends to increase with higher income levels,
21 Agriculture and Livestock Damage Assessment, Food and Agriculture Organization, Investment Center, Rome, November 2005.
14
signifying increased purchases of sugar, better quality dhal, brand name ghee, meat and vegetables22.
23. Save the Children summarized the importance of the local shopkeeper (Bagh and
Muzaffarabad) as playing a crucial role in the village economy as the source of food, particularly during winter and in relation to the poor and very poor. The shopkeeper also plays a critical role by providing credit to purchase food for the most vulnerable poor populations during the winter, as these groups cannot afford to build cereals stocks. The shopkeeper usually purchases usually from wholesalers (from Bagh or Muzaffarabad, Islamabad and/or Rawalpindi), relying on local transporters or own transport. Supply chain disruptions have a direct effect on the poorest sections of the population, particularly affecting their ability to overwinter23. IV. FINDINGS FROM THE TRADER SURVEY
24. The market assessment team surveyed 213 traders (196 in the earthquake affected areas) and the remainder in several of the largest wholesale markets in Pakistan. In regard to methodology, the trader survey was based on purposive sampling, stratified by trader type (primary, secondary and tertiary/consumer) and undertaken in 12 tehsils in seven districts24. Additional trader surveys, key informant interviews and secondary research were undertaken in Islamabad, Rawalpindi, Peshawar, Quetta and Karachi to determine the effect of the earthquake on prices and markets in other districts and urban centers of Pakistan25. The questionnaire was pre-tested in Rawalpindi and modified prior to the six days of fieldwork.
25. The objective of the survey was to assess ‘localized’ food availability, collect basic price information and determine whether any early market recovery would have validated or altered food assistance needs, particularly in urban/semi-urban areas. The early findings from the survey (and discussions in Islamabad) helped support a redefinition of targeting for relief food assistance to the more remote rural areas, as food was readily available in many urban markets and cash disbursement schemes were planned to help restore consumer purchasing power. The survey also capture some qualitative aspects related to markets in terms of price discovery, trader perceptions of necessary actions to support market recovery, and how the earthquake may have affected credit availability.
26. Pakistan has very useful data and statistics on national, regional and local production, consumption, prices and trade. However, AJK and NWFP are largely autonomous provinces with separate governance structures and statistical information sources. As such, while time series price data for basic staples and many other food products was readily available throughout greater Pakistan, price data collected by the Bureau of Statistics of both provinces of the earthquake affected areas was not available to the market assessment team as the respective government structures were completely destroyed26. Monitoring food prices,
22 Joint WFP/UNICEF Emergency Food Security Assessment and Impact of the Earthquake on Livelihoods in Muzaffarabad and Bagh Districts, Azad,Jammu Kashmir, Save the Children, Pakistan, November 2005. 23 Impact of the Earthquake on Livelihoods in Muzaffarabad and Bagh Districts, Azad,Jammu Kashmir, Save the Children, Pakistan, November 2005. 24 Tehsils covered by the survey were Bagh, Dheer Kot, Athmuqam, Hattian, Muzaffarabad, Rawalkot, Allai, Batagram, Balakot, Mansehra, Alpuri, Besham in the Bagh, Muzaffarabad, Poonch, Batagram, Mansehra and Shangla districts. 25 No surveys were undertaken in Lahore due to staff redeployment to WFP sub-office in Bagh, but secondary reports indicated no change in market prices or market disruptions at time of assessment. 26 VAM Unit, WFP Country Office Pakistan, collects national price data from the Ministry of Food, Agriculture and Livestock, but did collect price data for the earthquake affected areas. The questionnaire presented in Annex 6 would be a useful tool to collect basic price and market information for food staples (plus meat and livestock) that may support food aid targeting decisions, vulnerability analysis and mapping and the need for more information for the in-depth food security and nutrition assessment. The
15
however, particularly post-crisis in AJK and NWFP will be very important as ‘increased food prices can often push the rural poor into extreme food insecurity’27.
27. Nearly 52 percent of the traders were considered ‘retail or consumer’, with 34 percent considered ‘secondary or more urban’ markets. Some 38 percent were classified as general stores (selling a combination of food and non-food items), 34 percent as grain/oil traders and 14 percent as fruits/vegetable traders. Slightly more than 95 percent considered themselves as ‘local dealers’, while three percent considered themselves as ‘provincial’ dealers. Access to many rural markets was for all essential purposes blocked to the assessment teams due to landslides or other transport corridor breakdowns, thus 64 percent of the traders surveyed were in urban areas, 36 percent rural areas.
28. At the time of the trader survey (mid-November 2005), most of the urban (and some rural) markets in the affected areas in the Muzaffarabad, Bagh, Batagram and Mansehra districts had very recently reopened - in some cases less than three to four days prior to the start date of the survey. Markets in Mansehra and Shangla sustained much less damage, and markets remained open immediately post-earthquake. However, at the time of the survey, the serious decline in consumer purchasing power, not to mention loss of life, had led many of surveyed shopkeepers to consider closing down and migrating to larger urban areas, such as Rawalpindi or Islamabad.
29. Generally, observed market recovery in both provinces varied significantly. The graph on the following page depicts volumes sold as per traders surveyed pre and post earthquake. More rapid recovery was observed for locations on primary transport routes, such as Mansehra, Shenkiari, Battagram and Besham – situated on a primary transport corridor, the Karakuram Highway, which reopened immediately after the earthquake. Little to no recovery (expressed as volumes sold) was noted for the more severely affected areas, such as Balakot, Muzaffarabad and Bagh. Many link roads between more urban areas and rural tehsils may take two to three years to be rehabilitated, while the agricultural sector may require two full seasons (18 to 24 months) to fully recover to previous output and yield levels. Full or partial market recovery in the more inaccessible mountainous regions will depend on agricultural production, restoration of purchasing power through cash inflows or resumption of livelihood activities and household access to food.
WFP VAM Unit, Pakistan Country Office, would manage the data collection and monitoring activities, plus analyze data with support of ODC. 27 Food Insecurity in Rural Pakistan 2003, WFP Pakistan and Sustainable Development Policy Institute, Islamabad, Pakistan
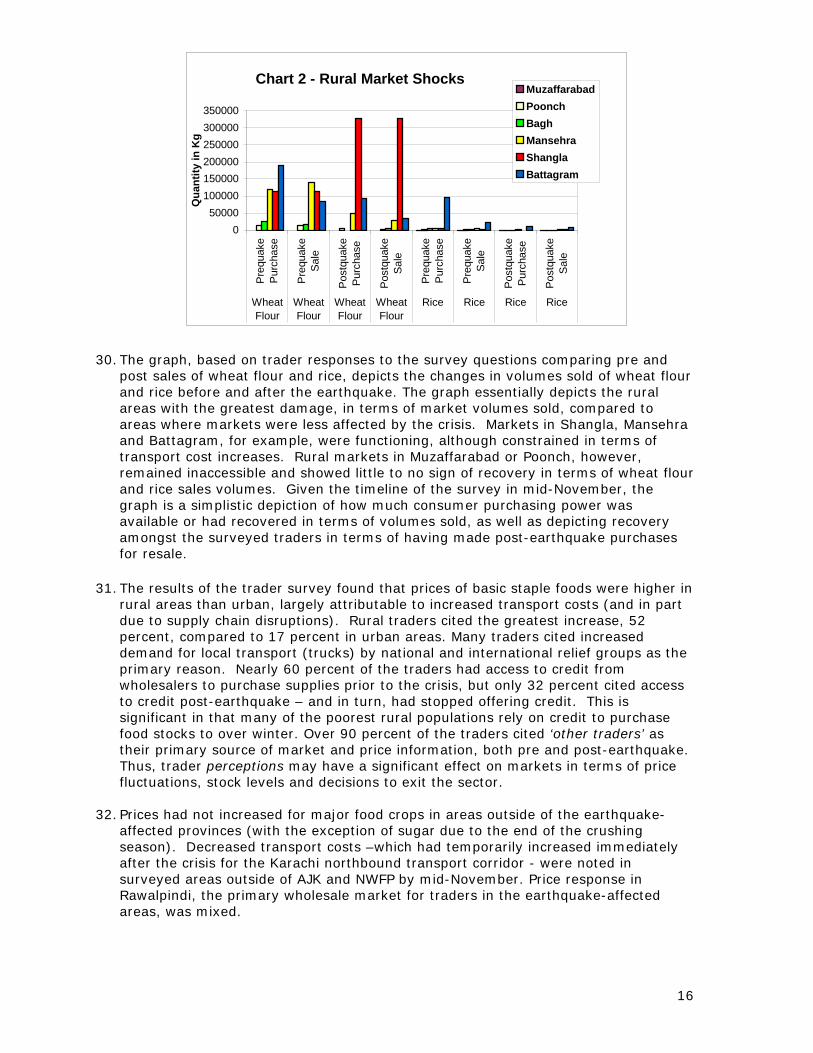
Chart 2 - Rural Market Shocks
050000
100000150000200000250000300000350000
Pre
quak
eP
urch
ase
Pre
quak
eS
ale
Pos
tqua
keP
urch
ase
Pos
tqua
keS
ale
Pre
quak
eP
urch
ase
Pre
quak
eS
ale
Pos
tqua
keP
urch
ase
Pos
tqua
keS
ale
WheatFlour
WheatFlour
WheatFlour
WheatFlour
Rice Rice Rice Rice
Qua
ntity
in K
g
MuzaffarabadPoonchBaghMansehraShanglaBattagram
30. The graph, based on trader responses to the survey questions comparing pre and post sales of wheat flour and rice, depicts the changes in volumes sold of wheat flour and rice before and after the earthquake. The graph essentially depicts the rural areas with the greatest damage, in terms of market volumes sold, compared to areas where markets were less affected by the crisis. Markets in Shangla, Mansehra and Battagram, for example, were functioning, although constrained in terms of transport cost increases. Rural markets in Muzaffarabad or Poonch, however, remained inaccessible and showed little to no sign of recovery in terms of wheat flour and rice sales volumes. Given the timeline of the survey in mid-November, the graph is a simplistic depiction of how much consumer purchasing power was available or had recovered in terms of volumes sold, as well as depicting recovery amongst the surveyed traders in terms of having made post-earthquake purchases for resale.
31. The results of the trader survey found that prices of basic staple foods were higher in rural areas than urban, largely attributable to increased transport costs (and in part due to supply chain disruptions). Rural traders cited the greatest increase, 52 percent, compared to 17 percent in urban areas. Many traders cited increased demand for local transport (trucks) by national and international relief groups as the primary reason. Nearly 60 percent of the traders had access to credit from wholesalers to purchase supplies prior to the crisis, but only 32 percent cited access to credit post-earthquake – and in turn, had stopped offering credit. This is significant in that many of the poorest rural populations rely on credit to purchase food stocks to over winter. Over 90 percent of the traders cited ‘other traders’ as their primary source of market and price information, both pre and post-earthquake. Thus, trader perceptions may have a significant effect on markets in terms of price fluctuations, stock levels and decisions to exit the sector.
32. Prices had not increased for major food crops in areas outside of the earthquake-
affected provinces (with the exception of sugar due to the end of the crushing season). Decreased transport costs –which had temporarily increased immediately after the crisis for the Karachi northbound transport corridor - were noted in surveyed areas outside of AJK and NWFP by mid-November. Price response in Rawalpindi, the primary wholesale market for traders in the earthquake-affected areas, was mixed.
16
17
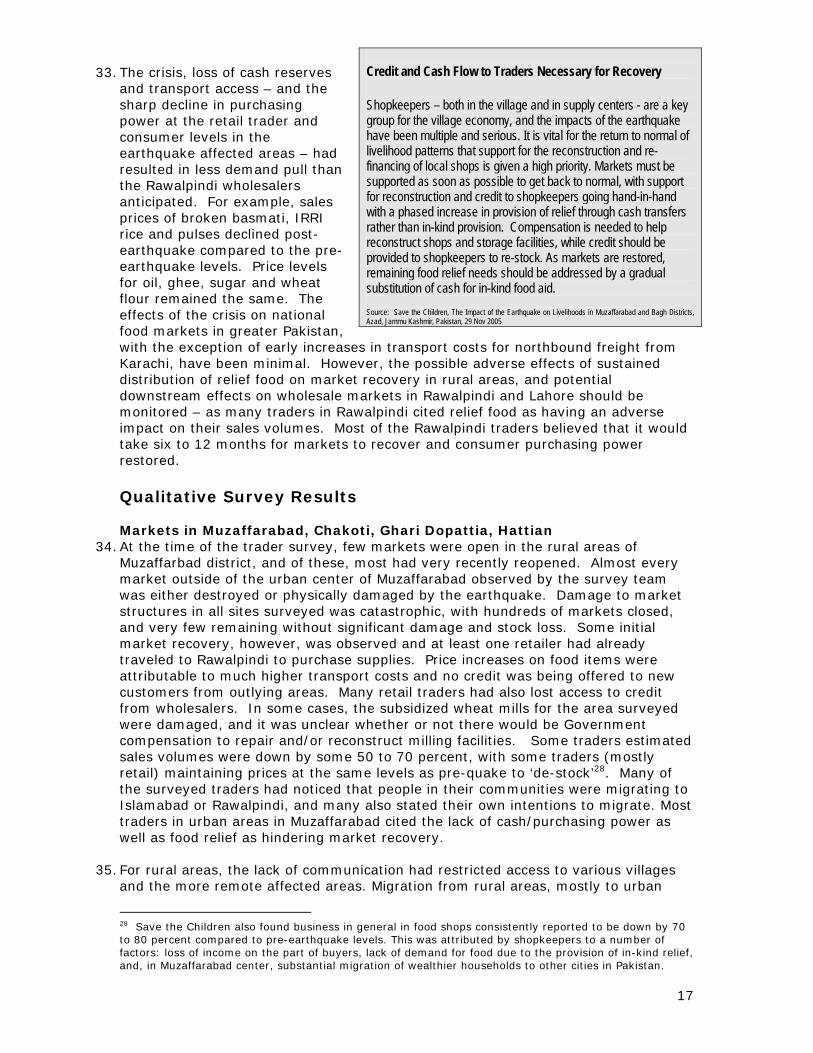
33. The crisis, loss of cash reserves
and transport access – and the sharp decline in purchasing power at the retail trader and consumer levels in the earthquake affected areas – had resulted in less demand pull than the Rawalpindi wholesalers anticipated. For example, sales prices of broken basmati, IRRI rice and pulses declined post-earthquake compared to the pre-earthquake levels. Price levels for oil, ghee, sugar and wheat flour remained the same. The effects of the crisis on national food markets in greater Pakistan, with the exception of early increases in transport costs for northbound freight from Karachi, have been minimal. However, the possible adverse effects of sustained distribution of relief food on market recovery in rural areas, and potential downstream effects on wholesale markets in Rawalpindi and Lahore should be monitored – as many traders in Rawalpindi cited relief food as having an adverse impact on their sales volumes. Most of the Rawalpindi traders believed that it would take six to 12 months for markets to recover and consumer purchasing power restored. Qualitative Survey Results Markets in Muzaffarabad, Chakoti, Ghari Dopattia, Hattian
Credit and Cash Flow to Traders Necessary for Recovery Shopkeepers – both in the village and in supply centers - are a key group for the village economy, and the impacts of the earthquake have been multiple and serious. It is vital for the return to normal of livelihood patterns that support for the reconstruction and re-financing of local shops is given a high priority. Markets must be supported as soon as possible to get back to normal, with support for reconstruction and credit to shopkeepers going hand-in-hand with a phased increase in provision of relief through cash transfers rather than in-kind provision. Compensation is needed to help reconstruct shops and storage facilities, while credit should be provided to shopkeepers to re-stock. As markets are restored, remaining food relief needs should be addressed by a gradual substitution of cash for in-kind food aid. Source: Save the Children, The Impact of the Earthquake on Livelihoods in Muzaffarabad and Bagh Districts, Azad, Jammu Kashmir, Pakistan, 29 Nov 2005
34. At the time of the trader survey, few markets were open in the rural areas of Muzaffarbad district, and of these, most had very recently reopened. Almost every market outside of the urban center of Muzaffarabad observed by the survey team was either destroyed or physically damaged by the earthquake. Damage to market structures in all sites surveyed was catastrophic, with hundreds of markets closed, and very few remaining without significant damage and stock loss. Some initial market recovery, however, was observed and at least one retailer had already traveled to Rawalpindi to purchase supplies. Price increases on food items were attributable to much higher transport costs and no credit was being offered to new customers from outlying areas. Many retail traders had also lost access to credit from wholesalers. In some cases, the subsidized wheat mills for the area surveyed were damaged, and it was unclear whether or not there would be Government compensation to repair and/or reconstruct milling facilities. Some traders estimated sales volumes were down by some 50 to 70 percent, with some traders (mostly retail) maintaining prices at the same levels as pre-quake to ‘de-stock’28. Many of the surveyed traders had noticed that people in their communities were migrating to Islamabad or Rawalpindi, and many also stated their own intentions to migrate. Most traders in urban areas in Muzaffarabad cited the lack of cash/purchasing power as well as food relief as hindering market recovery.
35. For rural areas, the lack of communication had restricted access to various villages
and the more remote affected areas. Migration from rural areas, mostly to urban
28 Save the Children also found business in general in food shops consistently reported to be down by 70 to 80 percent compared to pre-earthquake levels. This was attributed by shopkeepers to a number of factors: loss of income on the part of buyers, lack of demand for food due to the provision of in-kind relief, and, in Muzaffarabad center, substantial migration of wealthier households to other cities in Pakistan.
18
centers or Rawalpindi and Islamabad, was occurring – also amongst the surveyed traders – and overall trade activity has decreased. The majority of traders was dependent on credit availability prior to the earthquake, particularly wholesalers, who had serious debt pre-earthquake, were left unable to repay this debt due to the loss of cash, assets and sales volumes - and were planning to exit the sector and migrate. Those remaining in rural areas were not able to purchase usual food supplies in Rawalpindi due to a serious lack of cash reserves. Generally, prices had not increased significantly, mostly due to reduced sales volumes and lack of customers. Markets in Mansehra, Shinkiari, Balakot and Khagan Valley
36. Markets in Balakot and the Khagan Valley were completely destroyed, and little to no recovery was observed. Preliminary findings indicated that sales volumes of food had declined sharply in those areas with functional markets (Mansehra and Shinkiari), with a 50 to 60 percent decline in Mansehra district and 70 to 80 percent decline in Shinkiari. Although these areas did not suffer extensive damage and in some cases, normal market function was observed, food relief was cited by traders as hindering market recovery. Prices of basic food items had not changed significantly, but labor and transportation costs had increased. In these areas, the survey revealed that wholesalers were the most adversely affected by the earthquake, as many had extended both forward and backward credit, and now lacked cash reserves to either purchase food supplies or offer credit. Purchasing power of consumers had decreased significantly and transport costs increased. In some cases, primary stocks of the traders had been destroyed or looted. People had migrated from one area to another, mostly to Rawalpindi and other urban areas outside of AJK and NWFP – with the migration cited as a major reason that small retailers were not able to sell food at pre-earthquake levels. Markets in Bagh, Poonch, Dheerkot
37. About 70 percent of shops were seriously damaged in Bagh urban center, with the remaining 30 percent completely destroyed. Reported damage to markets in the rural areas of Bagh and Poonch was severe, although in Dheerkot tehsil, the market areas were less affected, with cracked building/market structures and 10 percent serious damage. The survey found purchases by customers and traders to be at the pre-earthquake levels in Dheerkot. In Rawlakot tehsil (urban center), there was also much less destruction, with an estimated 80 percent of markets not damaged, rural markets were more severely affected. The lack of customers and logistical problems were hindering market recovery, as food supplies were available - many traders cited relief food and lack of purchasing power as hindering recovery. Dheerkot market, for example, was noted to have significant available food stocks, but no customers due to lack of cash and availability of food aid. Prices had not increased in Dheerkot or Rawalkot, comparing pre to post earthquake.
Markets in Battagram, Allai Valley, Besham, Alpuri
38. The survey teamed observed large scale physical destruction of markets and buildings, particularly in Battagram, Besham and Allai Valley – however, the damage varied significantly between locations. Some areas were completely destroyed while others were only partially damaged. For example, the Alpuri area (Shangla district) experienced less damage than other areas. The shops and market structures were severely damaged in Battagram and Besham, while in the Allai Valley the majority of markets were destroyed. Traders with stock to sell, for example, in Battagram, noted that sales volumes were low due to relief food, as well as reduced purchasing power of consumers.
19
Trader Perceptions 39. The survey included a series of questions to establish trader perceptions in regard to
recovery timelines, reasons for slow market recovery post-shock and possible mechanisms that would help support traders and markets recover in the near to medium term. Slightly more than 24 percent of the traders cited ‘food relief’ and 18 percent cited ‘lack of customers’ as the primary reasons as to why their purchases to restock food supplies had declined. An even higher percentage, 33 percent, cited ‘food relief’, 18 percent cited ‘lack of customers’ and 14 percent cited ‘ migration to other cities’ as the primary reasons that their food sales had declined. Slightly more than 41 percent believed that food sales would normalize or increase based on consumer rehabilitation and purchasing power, while 21 percent believed sales would improve within the next four to six months. Nearly 35 percent of traders believed that the timeline for market recovery was dependent upon ‘consumer rehabilitation’ – while 29 percent believed it would take one to six months to recover, and nearly 15 percent believed it would take at least one year.
40. Nearly 55 percent believed that transport costs would normalize or decline in line
with fuel costs, while 15 percent cited cost declines would occur based on less food relief. Nearly 62 percent of traders believed that ‘cash’ would help their recovery the most, while some 20 percent cited ‘bank loans’ as possibly supporting recovery. When asked what wholesalers, retailers and consumers needed most to recovery, ‘cash’ and ‘bank loans’ were cited in very similar percentages. Nearly 47 percent again cited ‘bank loans’ as the main support Government could offer, with 20 percent citing ‘consumer and shopkeeper rehabilitation’, and 17 percent citing ‘cash’. When asked what aid agencies should do to help with market recovery, the responses were more or less evenly split, with 24 percent citing ‘helping consumer rehabilitation’, 22 percent citing ‘provide food and medicine to affected areas’ and 20 percent citing ‘provide bank loans’. When traders were asked what actions consumers could take to support market recovery, 35 percent cited ‘do not rely on food relief’ and 22 percent cited ‘obtain bank loans’. Quantitative Survey Results
41. Prices of basic staple foods were found to be higher in rural areas than urban (with the exception of basmati rice), largely attributable to substantial increases in transport costs for those traders purchasing in wholesale markets for resale post-earthquake. Rural traders, as expected, have experienced the greatest increase in transport costs, with survey findings noting a 52 percent increase in transport costs in rural areas compared to 17 percent noted by urban traders. Many traders in urban and rural markets noted the increase in transport costs, and cited increased demand for local transport (trucks) by national and international relief groups as the primary reason. Nearly 60 percent of the traders had access to credit from wholesalers to purchase food items prior to the crisis, but only 32 percent cited access to credit post-earthquake. The largest decline was noted for AJK, where only 18 percent of traders reported access to credit post-quake. Sales on credit dropped similarly, from 52 to 32 percent on average post-quake.
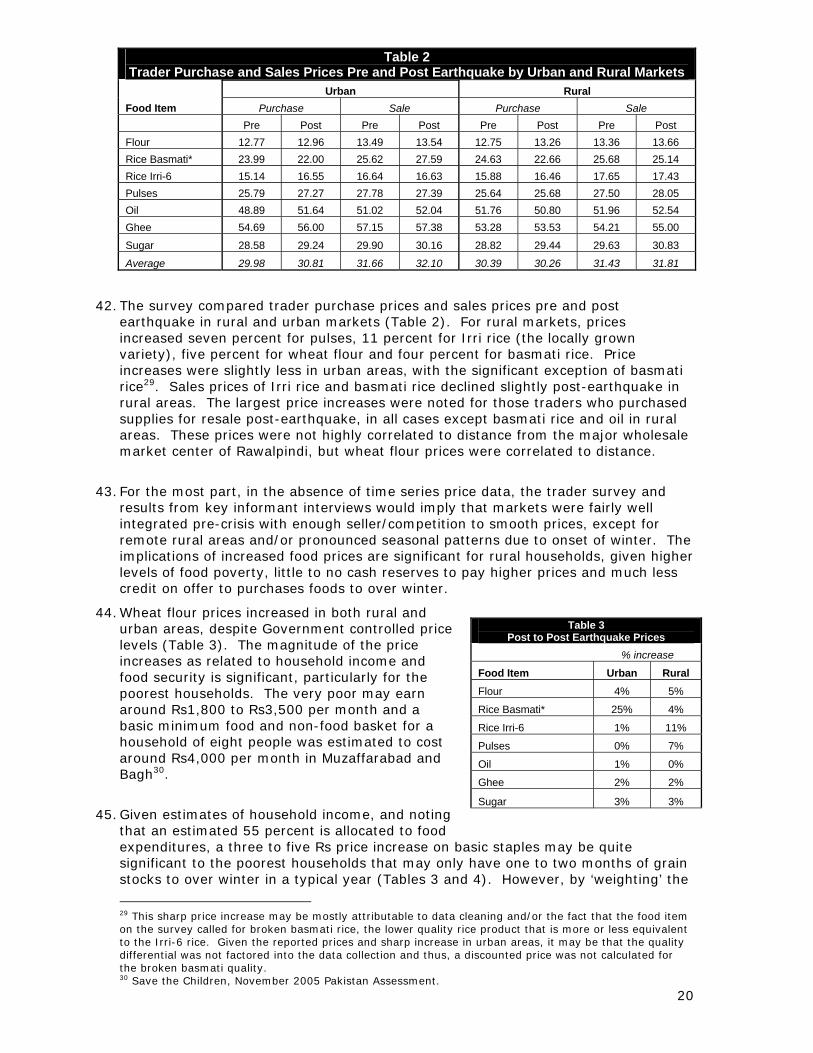
Table 2 Trader Purchase and Sales Prices Pre and Post Earthquake by Urban and Rural Markets Urban Rural Food Item Purchase Sale Purchase Sale Pre Post Pre Post Pre Post Pre Post Flour 12.77 12.96 13.49 13.54 12.75 13.26 13.36 13.66 Rice Basmati* 23.99 22.00 25.62 27.59 24.63 22.66 25.68 25.14 Rice Irri-6 15.14 16.55 16.64 16.63 15.88 16.46 17.65 17.43 Pulses 25.79 27.27 27.78 27.39 25.64 25.68 27.50 28.05 Oil 48.89 51.64 51.02 52.04 51.76 50.80 51.96 52.54 Ghee 54.69 56.00 57.15 57.38 53.28 53.53 54.21 55.00
Sugar 28.58 29.24 29.90 30.16 28.82 29.44 29.63 30.83
Average 29.98 30.81 31.66 32.10 30.39 30.26 31.43 31.81
42. The survey compared trader purchase prices and sales prices pre and post
earthquake in rural and urban markets (Table 2). For rural markets, prices increased seven percent for pulses, 11 percent for Irri rice (the locally grown variety), five percent for wheat flour and four percent for basmati rice. Price increases were slightly less in urban areas, with the significant exception of basmati rice29. Sales prices of Irri rice and basmati rice declined slightly post-earthquake in rural areas. The largest price increases were noted for those traders who purchased supplies for resale post-earthquake, in all cases except basmati rice and oil in rural areas. These prices were not highly correlated to distance from the major wholesale market center of Rawalpindi, but wheat flour prices were correlated to distance.
43. For the most part, in the absence of time series price data, the trader survey and results from key informant interviews would imply that markets were fairly well integrated pre-crisis with enough seller/competition to smooth prices, except for remote rural areas and/or pronounced seasonal patterns due to onset of winter. The implications of increased food prices are significant for rural households, given higher levels of food poverty, little to no cash reserves to pay higher prices and much less credit on offer to purchases foods to over winter.
44. Wheat flour prices increased in both rural and urban areas, despite Government controlled price levels (Table 3). The magnitude of the price increases as related to household income and food security is significant, particularly for the poorest households. The very poor may earn around Rs1,800 to Rs3,500 per month and a basic minimum food and non-food basket for a household of eight people was estimated to cost around Rs4,000 per month in Muzaffarabad and Bagh30.
45. Given estimates of household income, and noting that an estimated 55 percent is allocated to food expenditures, a three to five Rs price increase on basic staples may be quite significant to the poorest households that may only have one to two months of grain stocks to over winter in a typical year (Tables 3 and 4). However, by ‘weighting’ the
Table 3
Post to Post Earthquake Prices % increase
Food Item Urban Rural Flour 4% 5%
Rice Basmati* 25% 4%
Rice Irri-6 1% 11%
Pulses 0% 7%
Oil 1% 0%
Ghee 2% 2%
Sugar 3% 3%
20
29 This sharp price increase may be mostly attributable to data cleaning and/or the fact that the food item on the survey called for broken basmati rice, the lower quality rice product that is more or less equivalent to the Irri-6 rice. Given the reported prices and sharp increase in urban areas, it may be that the quality differential was not factored into the data collection and thus, a discounted price was not calculated for the broken basmati quality. 30 Save the Children, November 2005 Pakistan Assessment.
food price increases by the notional food aid basket (given a 50 percent weighting on wheat flour and the ‘controlled’ local retail prices), the overall price increases for basic foods was three percent in urban areas, and close to two percent in rural areas. Thus, the effects on the poorest households may also be less than anticipated. It may also be the case that food relief could be helping ‘curtail’ potentially sharp price increases in AJK and NWFP; and monitoring the effects of cash compensation payments in those areas with fully functional markets may be important. However, as overall demand is likely to remain inelastic, additional market supplies (due to speculation on the part of traders that consumer purchasing power will recover or due to ‘leakage’ of food relief) could also result in price declines.
21
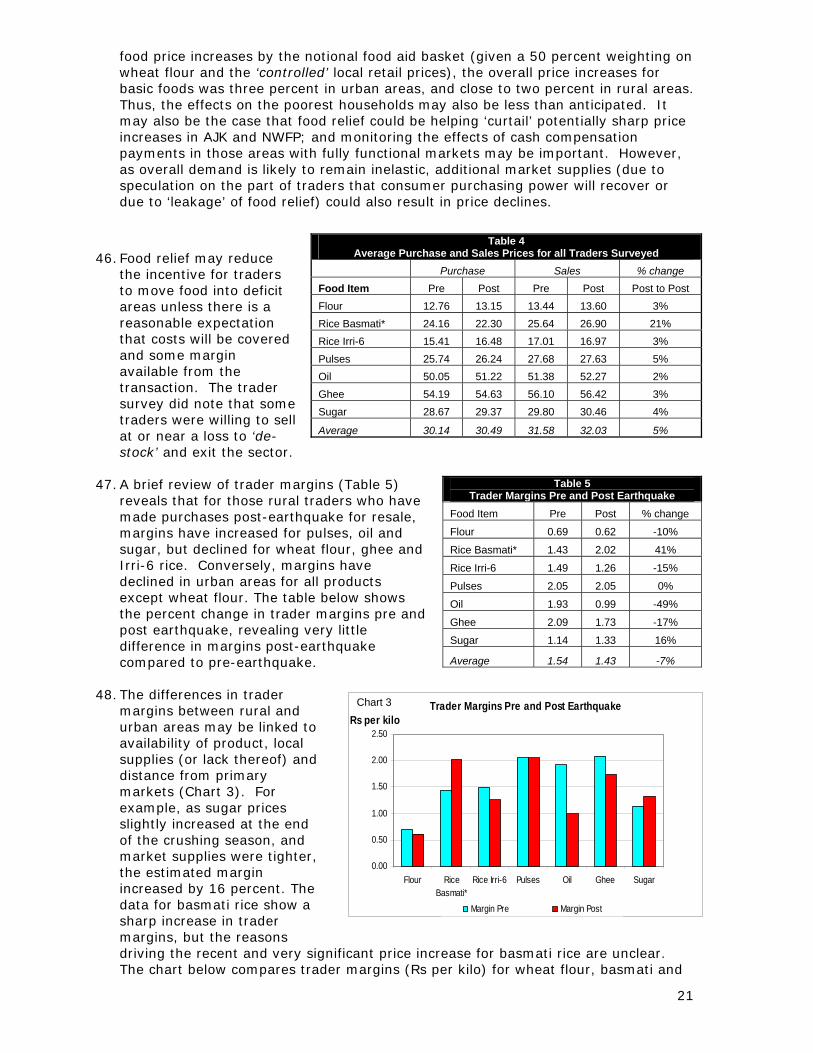
46. Food relief may reduce the incentive for traders to move food into deficit areas unless there is a reasonable expectation that costs will be covered and some margin available from the transaction. The trader survey did note that some traders were willing to sell at or near a loss to ‘de-stock’ and exit the sector.
47. A brief review of trader margins (Table 5) reveals that for those rural traders who have made purchases post-earthquake for resale, margins have increased for pulses, oil and sugar, but declined for wheat flour, ghee and Irri-6 rice. Conversely, margins have declined in urban areas for all products except wheat flour. The table below shows the percent change in trader margins pre and post earthquake, revealing very little difference in margins post-earthquake compared to pre-earthquake.
48. The differences in trader margins between rural and urban areas may be linked to availability of product, local supplies (or lack thereof) and distance from primary markets (Chart 3). For example, as sugar prices slightly increased at the end of the crushing season, and market supplies were tighter, the estimated margin increased by 16 percent. The data for basmati rice show a sharp increase in trader margins, but the reasons driving the recent and very significant price increase for basmati rice are unclear. The chart below compares trader margins (Rs per kilo) for wheat flour, basmati and
Table 4 Average Purchase and Sales Prices for all Traders Surveyed
Purchase Sales % change
Food Item Pre Post Pre Post Post to Post Flour 12.76 13.15 13.44 13.60 3% Rice Basmati* 24.16 22.30 25.64 26.90 21% Rice Irri-6 15.41 16.48 17.01 16.97 3% Pulses 25.74 26.24 27.68 27.63 5% Oil 50.05 51.22 51.38 52.27 2% Ghee 54.19 54.63 56.10 56.42 3% Sugar 28.67 29.37 29.80 30.46 4%
Average 30.14 30.49 31.58 32.03 5%
Table 5 Trader Margins Pre and Post Earthquake
Food Item Pre Post % change
Flour 0.69 0.62 -10%
Rice Basmati* 1.43 2.02 41%
Rice Irri-6 1.49 1.26 -15%
Pulses 2.05 2.05 0%
Oil 1.93 0.99 -49%
Ghee 2.09 1.73 -17%
Sugar 1.14 1.33 16%
Average 1.54 1.43 -7%
Trader Margins Pre and Post Earthquake
0.00
0.50
1.00
1.50
2.00
2.50
Flour RiceBasmati*
Rice Irri-6 Pulses Oil Ghee Sugar
Rs per kilo
Margin Pre Margin Post
Chart 3
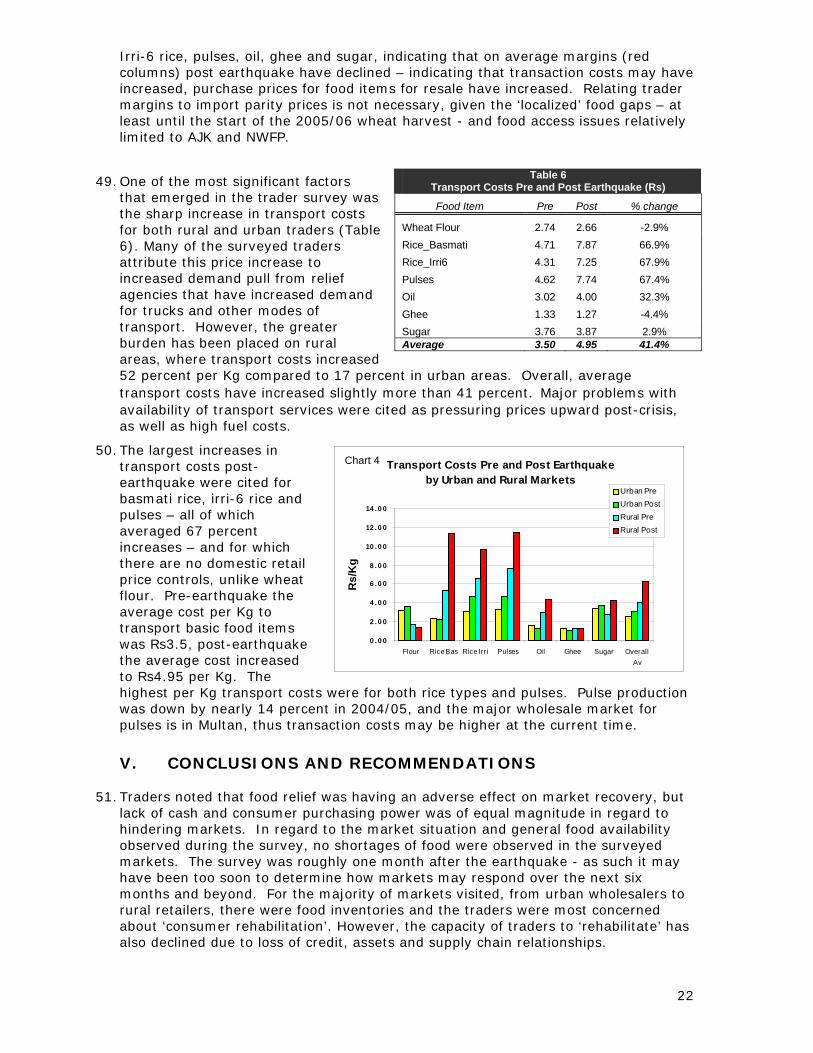
Irri-6 rice, pulses, oil, ghee and sugar, indicating that on average margins (red columns) post earthquake have declined – indicating that transaction costs may have increased, purchase prices for food items for resale have increased. Relating trader margins to import parity prices is not necessary, given the ‘localized’ food gaps – at least until the start of the 2005/06 wheat harvest - and food access issues relatively limited to AJK and NWFP.
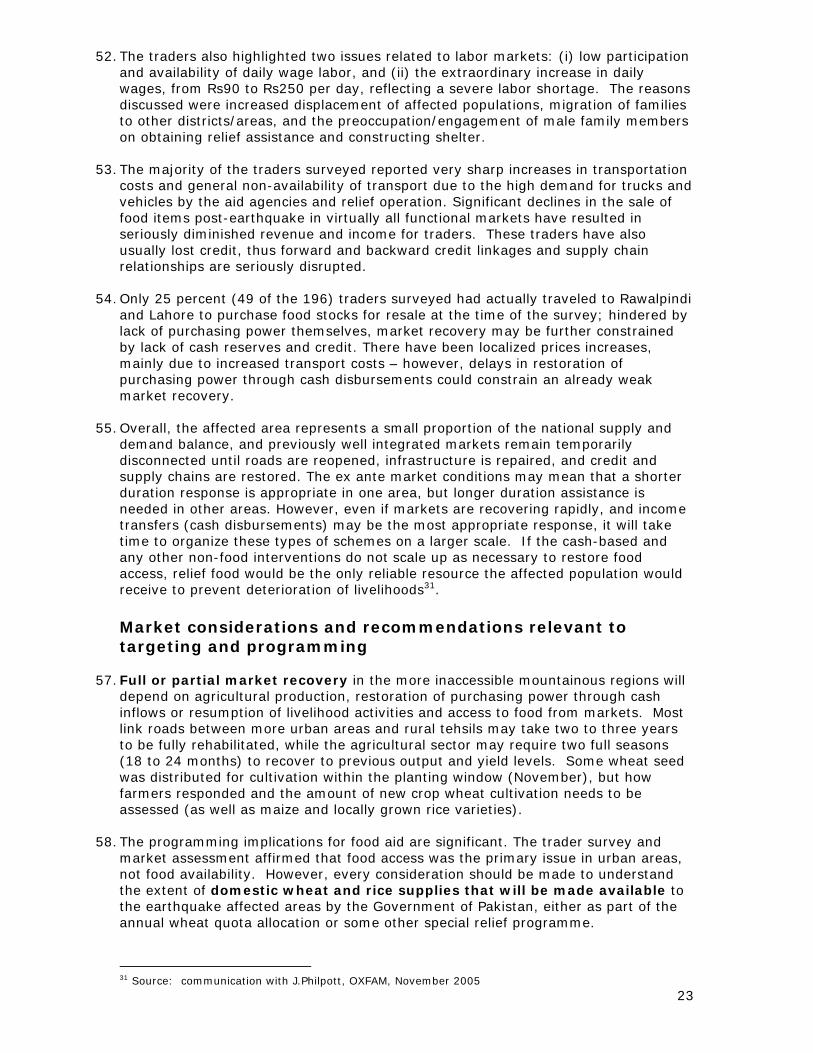
49. One of the most significant factors that emerged in the trader survey was the sharp increase in transport costs for both rural and urban traders (Table 6). Many of the surveyed traders attribute this price increase to increased demand pull from relief agencies that have increased demand for trucks and other modes of transport. However, the greater burden has been placed on rural areas, where transport costs increased 52 percent per Kg compared to 17 percent in urban areas. Overall, average transport costs have increased slightly more than 41 percent. Major problems with availability of transport services were cited as pressuring prices upward post-crisis, as well as high fuel costs.
Table 6 Transport Costs Pre and Post Earthquake (Rs)
Food Item Pre Post % change
Wheat Flour 2.74 2.66 -2.9% Rice_Basmati 4.71 7.87 66.9% Rice_Irri6 4.31 7.25 67.9% Pulses 4.62 7.74 67.4% Oil 3.02 4.00 32.3% Ghee 1.33 1.27 -4.4% Sugar 3.76 3.87 2.9% Average 3.50 4.95 41.4%
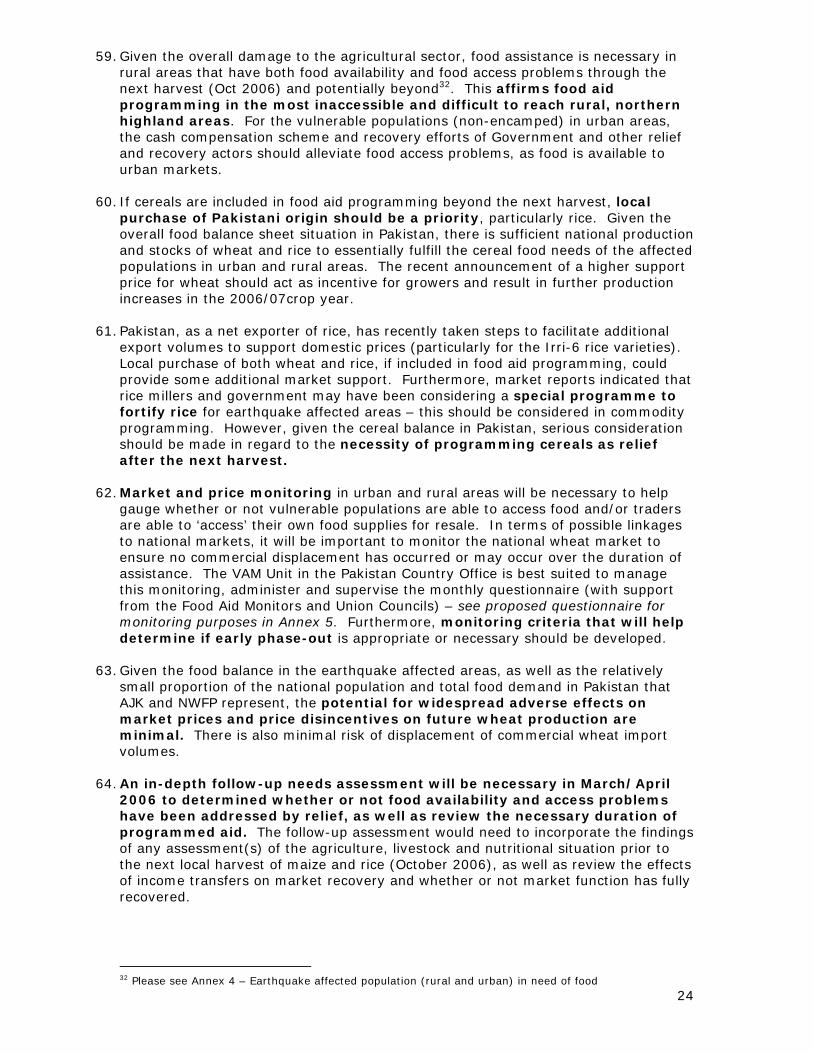
50. The largest increases in transport costs post-earthquake were cited for basmati rice, irri-6 rice and pulses – all of which averaged 67 percent increases – and for which there are no domestic retail price controls, unlike wheat flour. Pre-earthquake the average cost per Kg to transport basic food items was Rs3.5, post-earthquake the average cost increased to Rs4.95 per Kg. The highest per Kg transport costs were for both rice types and pulses. Pulse production was down by nearly 14 percent in 2004/05, and the major wholesale market for pulses is in Multan, thus transaction costs may be higher at the current time. V. CONCLUSIONS AND RECOMMENDATIONS
Transport Costs Pre and Post Earthquake by Urban and Rural Markets
0 . 0 0
2 . 0 0
4 . 0 0
6 . 0 0
8 . 0 0
10 . 0 0
12 . 0 0
14 . 0 0
Flour Rice Bas Rice Irr i Pulses Oil Ghee Sugar OverallAv
Rs/
Kg
Urban PreUrban PostRural PreRural Post
Chart 4
51. Traders noted that food relief was having an adverse effect on market recovery, but lack of cash and consumer purchasing power was of equal magnitude in regard to hindering markets. In regard to the market situation and general food availability observed during the survey, no shortages of food were observed in the surveyed markets. The survey was roughly one month after the earthquake - as such it may have been too soon to determine how markets may respond over the next six months and beyond. For the majority of markets visited, from urban wholesalers to rural retailers, there were food inventories and the traders were most concerned about ‘consumer rehabilitation’. However, the capacity of traders to ‘rehabilitate’ has also declined due to loss of credit, assets and supply chain relationships.
22
23
52. The traders also highlighted two issues related to labor markets: (i) low participation and availability of daily wage labor, and (ii) the extraordinary increase in daily wages, from Rs90 to Rs250 per day, reflecting a severe labor shortage. The reasons discussed were increased displacement of affected populations, migration of families to other districts/areas, and the preoccupation/engagement of male family members on obtaining relief assistance and constructing shelter.
53. The majority of the traders surveyed reported very sharp increases in transportation costs and general non-availability of transport due to the high demand for trucks and vehicles by the aid agencies and relief operation. Significant declines in the sale of food items post-earthquake in virtually all functional markets have resulted in seriously diminished revenue and income for traders. These traders have also usually lost credit, thus forward and backward credit linkages and supply chain relationships are seriously disrupted.
54. Only 25 percent (49 of the 196) traders surveyed had actually traveled to Rawalpindi and Lahore to purchase food stocks for resale at the time of the survey; hindered by lack of purchasing power themselves, market recovery may be further constrained by lack of cash reserves and credit. There have been localized prices increases, mainly due to increased transport costs – however, delays in restoration of purchasing power through cash disbursements could constrain an already weak market recovery.
55. Overall, the affected area represents a small proportion of the national supply and demand balance, and previously well integrated markets remain temporarily disconnected until roads are reopened, infrastructure is repaired, and credit and supply chains are restored. The ex ante market conditions may mean that a shorter duration response is appropriate in one area, but longer duration assistance is needed in other areas. However, even if markets are recovering rapidly, and income transfers (cash disbursements) may be the most appropriate response, it will take time to organize these types of schemes on a larger scale. If the cash-based and any other non-food interventions do not scale up as necessary to restore food access, relief food would be the only reliable resource the affected population would receive to prevent deterioration of livelihoods31. Market considerations and recommendations relevant to targeting and programming
57. Full or partial market recovery in the more inaccessible mountainous regions will depend on agricultural production, restoration of purchasing power through cash inflows or resumption of livelihood activities and access to food from markets. Most link roads between more urban areas and rural tehsils may take two to three years to be fully rehabilitated, while the agricultural sector may require two full seasons (18 to 24 months) to recover to previous output and yield levels. Some wheat seed was distributed for cultivation within the planting window (November), but how farmers responded and the amount of new crop wheat cultivation needs to be assessed (as well as maize and locally grown rice varieties).
58. The programming implications for food aid are significant. The trader survey and market assessment affirmed that food access was the primary issue in urban areas, not food availability. However, every consideration should be made to understand the extent of domestic wheat and rice supplies that will be made available to the earthquake affected areas by the Government of Pakistan, either as part of the annual wheat quota allocation or some other special relief programme.
31 Source: communication with J.Philpott, OXFAM, November 2005
24
59. Given the overall damage to the agricultural sector, food assistance is necessary in rural areas that have both food availability and food access problems through the next harvest (Oct 2006) and potentially beyond32. This affirms food aid programming in the most inaccessible and difficult to reach rural, northern highland areas. For the vulnerable populations (non-encamped) in urban areas, the cash compensation scheme and recovery efforts of Government and other relief and recovery actors should alleviate food access problems, as food is available to urban markets.
60. If cereals are included in food aid programming beyond the next harvest, local purchase of Pakistani origin should be a priority, particularly rice. Given the overall food balance sheet situation in Pakistan, there is sufficient national production and stocks of wheat and rice to essentially fulfill the cereal food needs of the affected populations in urban and rural areas. The recent announcement of a higher support price for wheat should act as incentive for growers and result in further production increases in the 2006/07crop year.
61. Pakistan, as a net exporter of rice, has recently taken steps to facilitate additional export volumes to support domestic prices (particularly for the Irri-6 rice varieties). Local purchase of both wheat and rice, if included in food aid programming, could provide some additional market support. Furthermore, market reports indicated that rice millers and government may have been considering a special programme to fortify rice for earthquake affected areas – this should be considered in commodity programming. However, given the cereal balance in Pakistan, serious consideration should be made in regard to the necessity of programming cereals as relief after the next harvest.
62. Market and price monitoring in urban and rural areas will be necessary to help gauge whether or not vulnerable populations are able to access food and/or traders are able to ‘access’ their own food supplies for resale. In terms of possible linkages to national markets, it will be important to monitor the national wheat market to ensure no commercial displacement has occurred or may occur over the duration of assistance. The VAM Unit in the Pakistan Country Office is best suited to manage this monitoring, administer and supervise the monthly questionnaire (with support from the Food Aid Monitors and Union Councils) – see proposed questionnaire for monitoring purposes in Annex 5. Furthermore, monitoring criteria that will help determine if early phase-out is appropriate or necessary should be developed.
63. Given the food balance in the earthquake affected areas, as well as the relatively small proportion of the national population and total food demand in Pakistan that AJK and NWFP represent, the potential for widespread adverse effects on market prices and price disincentives on future wheat production are minimal. There is also minimal risk of displacement of commercial wheat import volumes.
64. An in-depth follow-up needs assessment will be necessary in March/April
2006 to determined whether or not food availability and access problems have been addressed by relief, as well as review the necessary duration of programmed aid. The follow-up assessment would need to incorporate the findings of any assessment(s) of the agriculture, livestock and nutritional situation prior to the next local harvest of maize and rice (October 2006), as well as review the effects of income transfers on market recovery and whether or not market function has fully recovered.
32 Please see Annex 4 – Earthquake affected population (rural and urban) in need of food
25
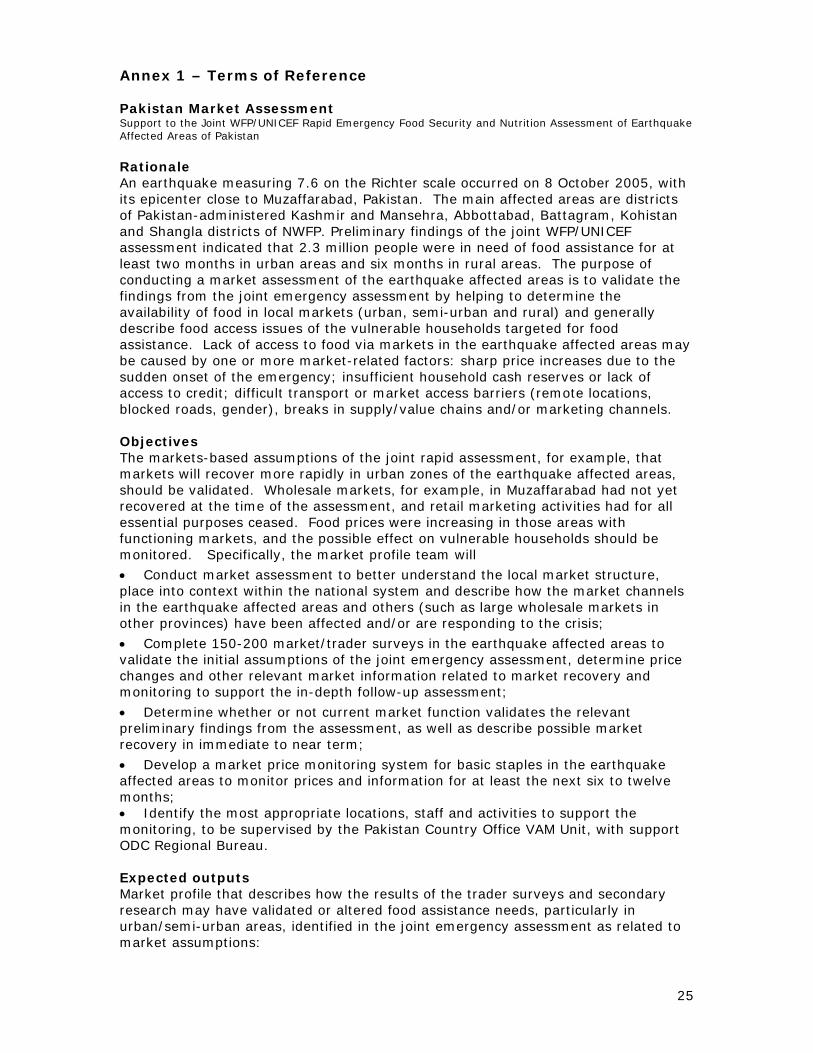
Annex 1 – Terms of Reference Pakistan Market Assessment Support to the Joint WFP/UNICEF Rapid Emergency Food Security and Nutrition Assessment of Earthquake Affected Areas of Pakistan Rationale An earthquake measuring 7.6 on the Richter scale occurred on 8 October 2005, with its epicenter close to Muzaffarabad, Pakistan. The main affected areas are districts of Pakistan-administered Kashmir and Mansehra, Abbottabad, Battagram, Kohistan and Shangla districts of NWFP. Preliminary findings of the joint WFP/UNICEF assessment indicated that 2.3 million people were in need of food assistance for at least two months in urban areas and six months in rural areas. The purpose of conducting a market assessment of the earthquake affected areas is to validate the findings from the joint emergency assessment by helping to determine the availability of food in local markets (urban, semi-urban and rural) and generally describe food access issues of the vulnerable households targeted for food assistance. Lack of access to food via markets in the earthquake affected areas may be caused by one or more market-related factors: sharp price increases due to the sudden onset of the emergency; insufficient household cash reserves or lack of access to credit; difficult transport or market access barriers (remote locations, blocked roads, gender), breaks in supply/value chains and/or marketing channels. Objectives The markets-based assumptions of the joint rapid assessment, for example, that markets will recover more rapidly in urban zones of the earthquake affected areas, should be validated. Wholesale markets, for example, in Muzaffarabad had not yet recovered at the time of the assessment, and retail marketing activities had for all essential purposes ceased. Food prices were increasing in those areas with functioning markets, and the possible effect on vulnerable households should be monitored. Specifically, the market profile team will
• Conduct market assessment to better understand the local market structure, place into context within the national system and describe how the market channels in the earthquake affected areas and others (such as large wholesale markets in other provinces) have been affected and/or are responding to the crisis;
• Complete 150-200 market/trader surveys in the earthquake affected areas to validate the initial assumptions of the joint emergency assessment, determine price changes and other relevant market information related to market recovery and monitoring to support the in-depth follow-up assessment;
• Determine whether or not current market function validates the relevant preliminary findings from the assessment, as well as describe possible market recovery in immediate to near term;
• Develop a market price monitoring system for basic staples in the earthquake affected areas to monitor prices and information for at least the next six to twelve months; • Identify the most appropriate locations, staff and activities to support the monitoring, to be supervised by the Pakistan Country Office VAM Unit, with support ODC Regional Bureau. Expected outputs Market profile that describes how the results of the trader surveys and secondary research may have validated or altered food assistance needs, particularly in urban/semi-urban areas, identified in the joint emergency assessment as related to market assumptions:
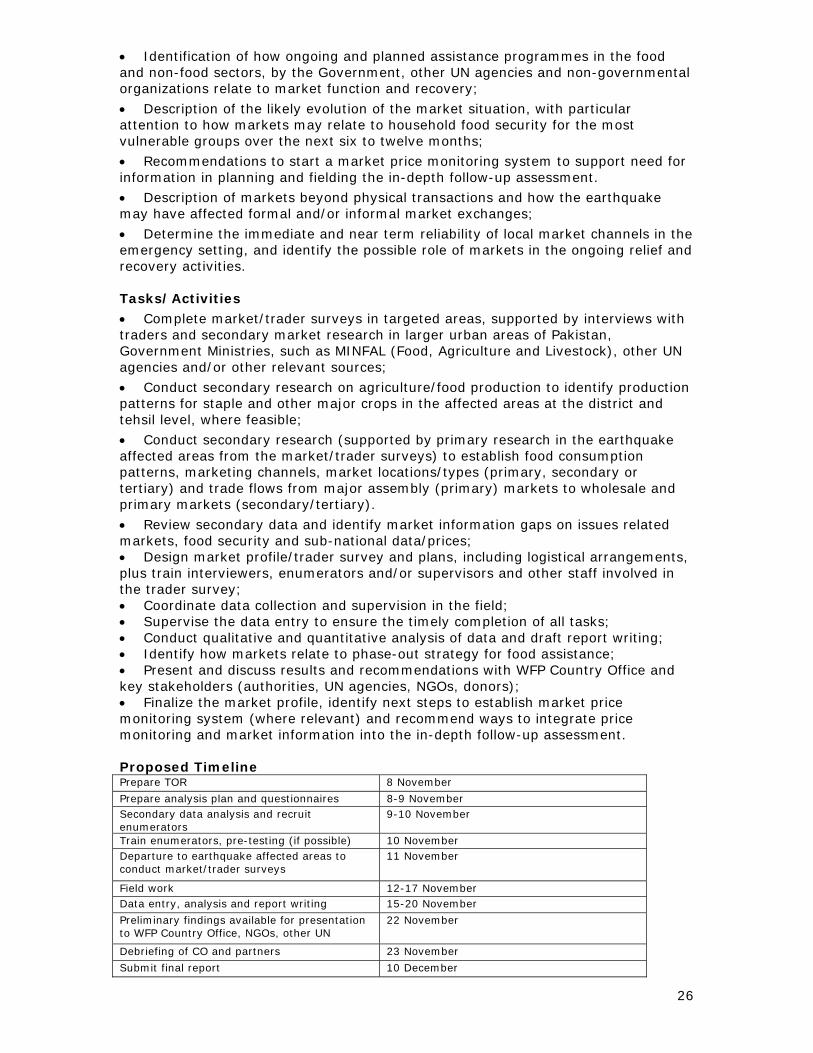
26
• Identification of how ongoing and planned assistance programmes in the food and non-food sectors, by the Government, other UN agencies and non-governmental organizations relate to market function and recovery;
• Description of the likely evolution of the market situation, with particular attention to how markets may relate to household food security for the most vulnerable groups over the next six to twelve months;
• Recommendations to start a market price monitoring system to support need for information in planning and fielding the in-depth follow-up assessment.
• Description of markets beyond physical transactions and how the earthquake may have affected formal and/or informal market exchanges;
• Determine the immediate and near term reliability of local market channels in the emergency setting, and identify the possible role of markets in the ongoing relief and recovery activities. Tasks/Activities • Complete market/trader surveys in targeted areas, supported by interviews with traders and secondary market research in larger urban areas of Pakistan, Government Ministries, such as MINFAL (Food, Agriculture and Livestock), other UN agencies and/or other relevant sources;
• Conduct secondary research on agriculture/food production to identify production patterns for staple and other major crops in the affected areas at the district and tehsil level, where feasible;
• Conduct secondary research (supported by primary research in the earthquake affected areas from the market/trader surveys) to establish food consumption patterns, marketing channels, market locations/types (primary, secondary or tertiary) and trade flows from major assembly (primary) markets to wholesale and primary markets (secondary/tertiary).
• Review secondary data and identify market information gaps on issues related markets, food security and sub-national data/prices; • Design market profile/trader survey and plans, including logistical arrangements, plus train interviewers, enumerators and/or supervisors and other staff involved in the trader survey; • Coordinate data collection and supervision in the field; • Supervise the data entry to ensure the timely completion of all tasks; • Conduct qualitative and quantitative analysis of data and draft report writing; • Identify how markets relate to phase-out strategy for food assistance; • Present and discuss results and recommendations with WFP Country Office and key stakeholders (authorities, UN agencies, NGOs, donors); • Finalize the market profile, identify next steps to establish market price monitoring system (where relevant) and recommend ways to integrate price monitoring and market information into the in-depth follow-up assessment. Proposed Timeline Prepare TOR 8 November
Prepare analysis plan and questionnaires 8-9 November Secondary data analysis and recruit enumerators
9-10 November
Train enumerators, pre-testing (if possible) 10 November Departure to earthquake affected areas to conduct market/trader surveys
11 November
Field work 12-17 November Data entry, analysis and report writing 15-20 November
Preliminary findings available for presentation to WFP Country Office, NGOs, other UN
22 November
Debriefing of CO and partners 23 November
Submit final report 10 December
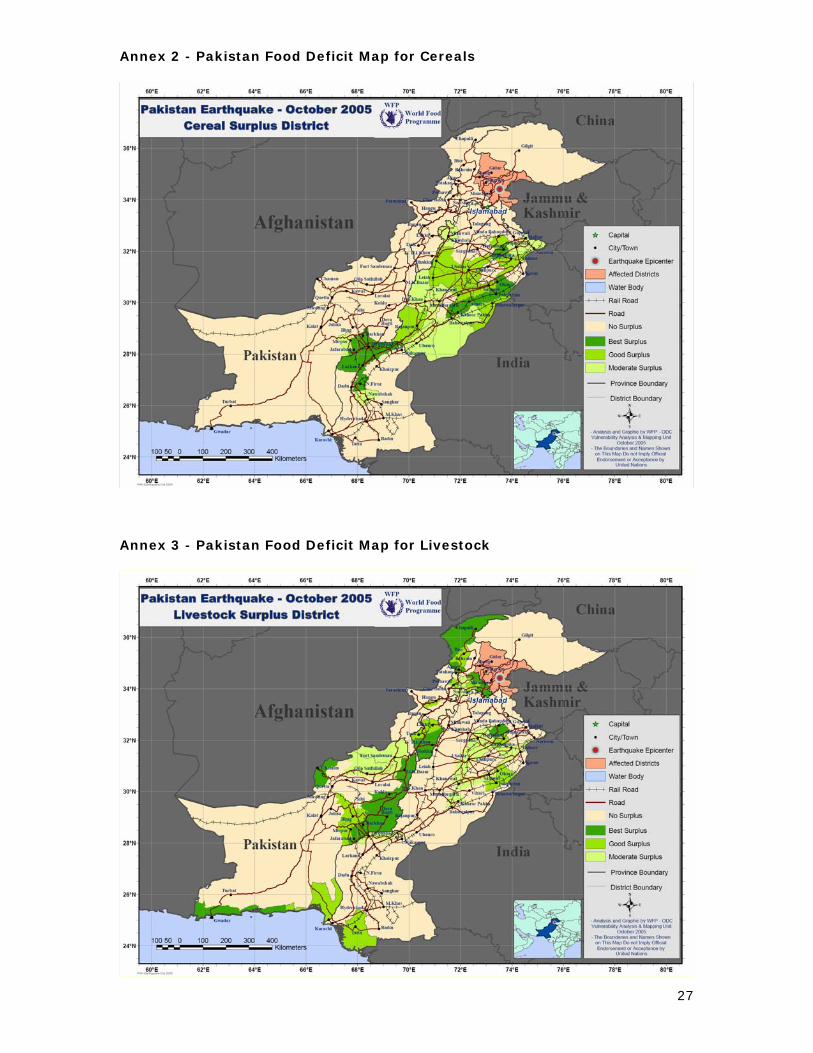
Annex 2 - Pakistan Food Deficit Map for Cereals
Annex 3 - Pakistan Food Deficit Map for Livestock
27
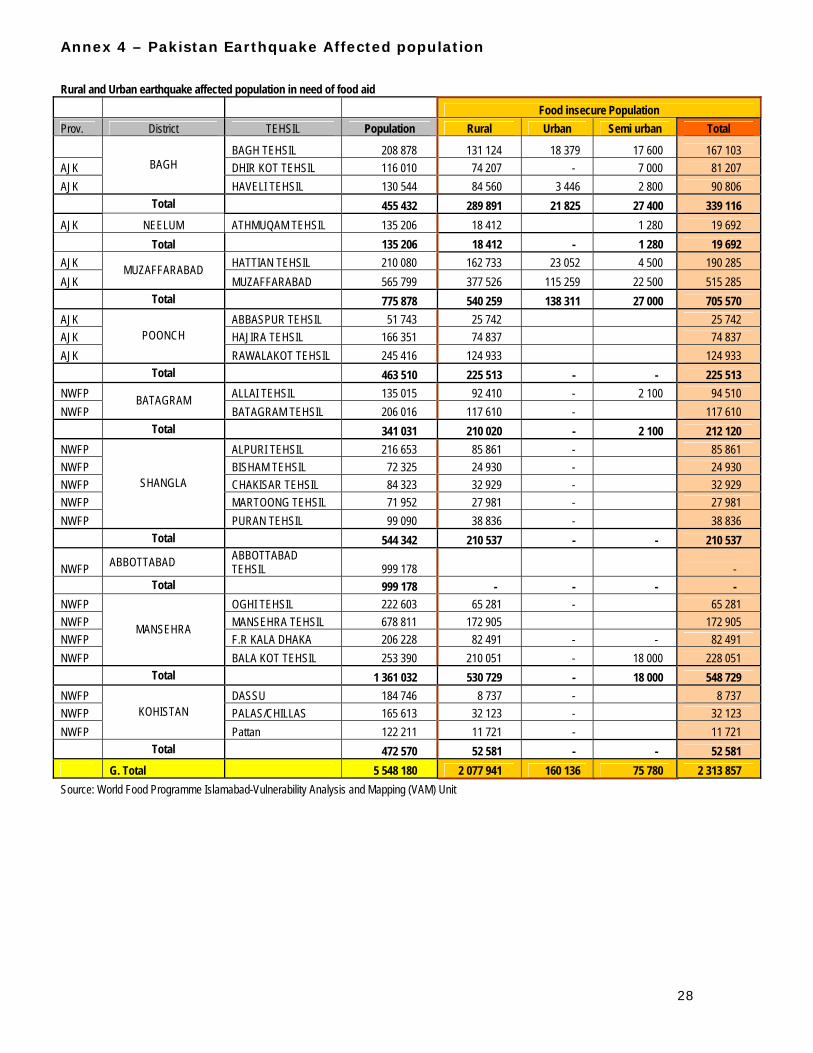
28
Annex 4 – Pakistan Earthquake Affected population Rural and Urban earthquake affected population in need of food aid
Food insecure Population Prov. District TEHSIL Population Rural Urban Semi urban Total
BAGH TEHSIL 208 878 131 124 18 379 17 600 167 103 AJK DHIR KOT TEHSIL 116 010 74 207 - 7 000 81 207 AJK
BAGH
HAVELI TEHSIL 130 544 84 560 3 446 2 800 90 806 Total 455 432 289 891 21 825 27 400 339 116 AJK NEELUM ATHMUQAM TEHSIL 135 206 18 412 1 280 19 692 Total 135 206 18 412 - 1 280 19 692 AJK HATTIAN TEHSIL 210 080 162 733 23 052 4 500 190 285 AJK
MUZAFFARABAD MUZAFFARABAD 565 799 377 526 115 259 22 500 515 285
Total 775 878 540 259 138 311 27 000 705 570 AJK ABBASPUR TEHSIL 51 743 25 742 25 742 AJK HAJIRA TEHSIL 166 351 74 837 74 837 AJK
POONCH RAWALAKOT TEHSIL 245 416 124 933 124 933
Total 463 510 225 513 - - 225 513 NWFP ALLAI TEHSIL 135 015 92 410 - 2 100 94 510 NWFP
BATAGRAM BATAGRAM TEHSIL 206 016 117 610 - 117 610
Total 341 031 210 020 - 2 100 212 120 NWFP ALPURI TEHSIL 216 653 85 861 - 85 861 NWFP BISHAM TEHSIL 72 325 24 930 - 24 930 NWFP CHAKISAR TEHSIL 84 323 32 929 - 32 929 NWFP MARTOONG TEHSIL 71 952 27 981 - 27 981 NWFP
SHANGLA
PURAN TEHSIL 99 090 38 836 - 38 836 Total 544 342 210 537 - - 210 537
NWFP ABBOTTABAD ABBOTTABAD TEHSIL 999 178 -
Total 999 178 - - - - NWFP OGHI TEHSIL 222 603 65 281 - 65 281 NWFP MANSEHRA TEHSIL 678 811 172 905 172 905 NWFP F.R KALA DHAKA 206 228 82 491 - - 82 491 NWFP
MANSEHRA
BALA KOT TEHSIL 253 390 210 051 - 18 000 228 051 Total 1 361 032 530 729 - 18 000 548 729 NWFP DASSU 184 746 8 737 - 8 737 NWFP PALAS/CHILLAS 165 613 32 123 - 32 123 NWFP
KOHISTAN Pattan 122 211 11 721 - 11 721
Total 472 570 52 581 - - 52 581 G. Total 5 548 180 2 077 941 160 136 75 780 2 313 857 Source: World Food Programme Islamabad-Vulnerability Analysis and Mapping (VAM) Unit
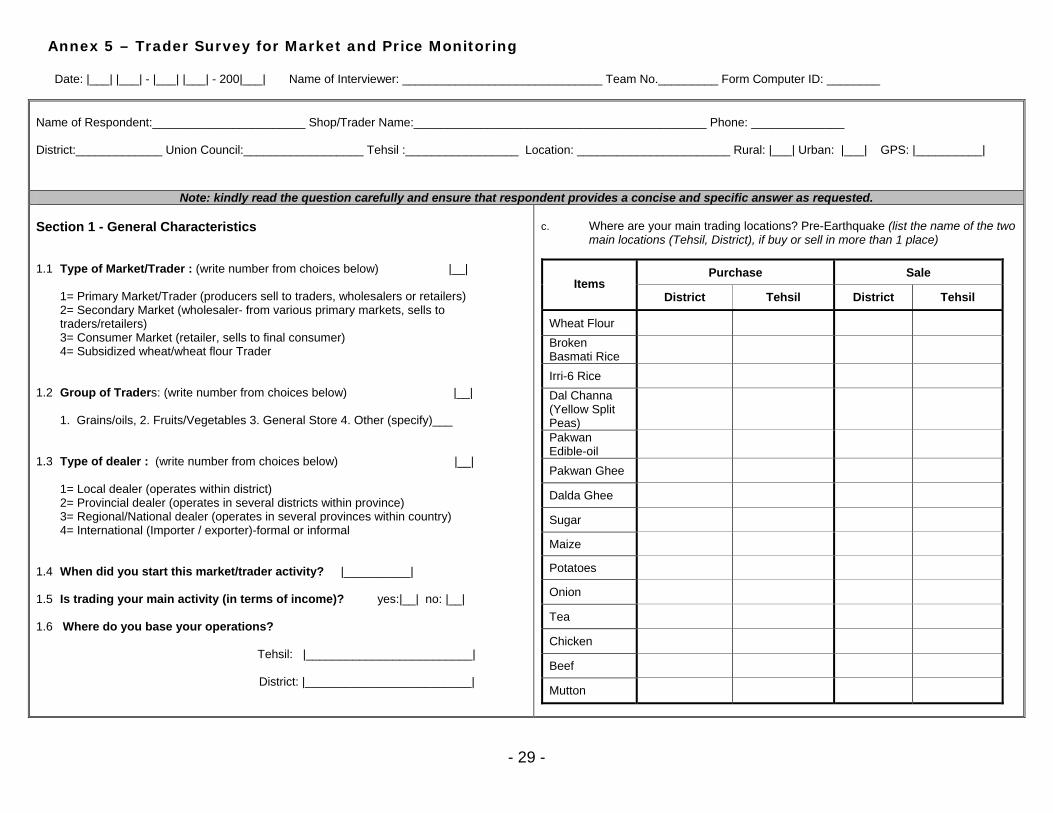
- 29 -
Annex 5 – Trader Survey for Market and Price Monitoring Date: |___| |___| - |___| |___| - 200|___| Name of Interviewer: ______________________________ Team No._________ Form Computer ID: ________
Name of Respondent:_______________________ Shop/Trader Name:____________________________________________ Phone: ______________ District:_____________ Union Council:__________________ Tehsil :_________________ Location: _______________________ Rural: |___| Urban: |___| GPS: |__________|
Note: kindly read the question carefully and ensure that respondent provides a concise and specific answer as requested. Section 1 - General Characteristics 1.1 Type of Market/Trader : (write number from choices below) |__|
1= Primary Market/Trader (producers sell to traders, wholesalers or retailers) 2= Secondary Market (wholesaler- from various primary markets, sells to traders/retailers) 3= Consumer Market (retailer, sells to final consumer) 4= Subsidized wheat/wheat flour Trader
1.2 Group of Traders: (write number from choices below) |__| 1. Grains/oils, 2. Fruits/Vegetables 3. General Store 4. Other (specify)___
1.3 Type of dealer : (write number from choices below) |__|
1= Local dealer (operates within district) 2= Provincial dealer (operates in several districts within province) 3= Regional/National dealer (operates in several provinces within country) 4= International (Importer / exporter)-formal or informal
1.4 When did you start this market/trader activity? |__________| 1.5 Is trading your main activity (in terms of income)? yes:|__| no: |__| 1.6 Where do you base your operations?
Tehsil: |_________________________|
District: |_________________________|
c. Where are your main trading locations? Pre-Earthquake (list the name of the two
main locations (Tehsil, District), if buy or sell in more than 1 place)
Purchase SaleItems
District Tehsil District Tehsil
Wheat Flour
Broken Basmati Rice
Irri-6 Rice
Dal Channa (Yellow Split Peas)
Pakwan Edible-oil
Pakwan Ghee
Dalda Ghee
Sugar
Maize
Potatoes
Onion
Tea
Chicken
Beef
Mutton
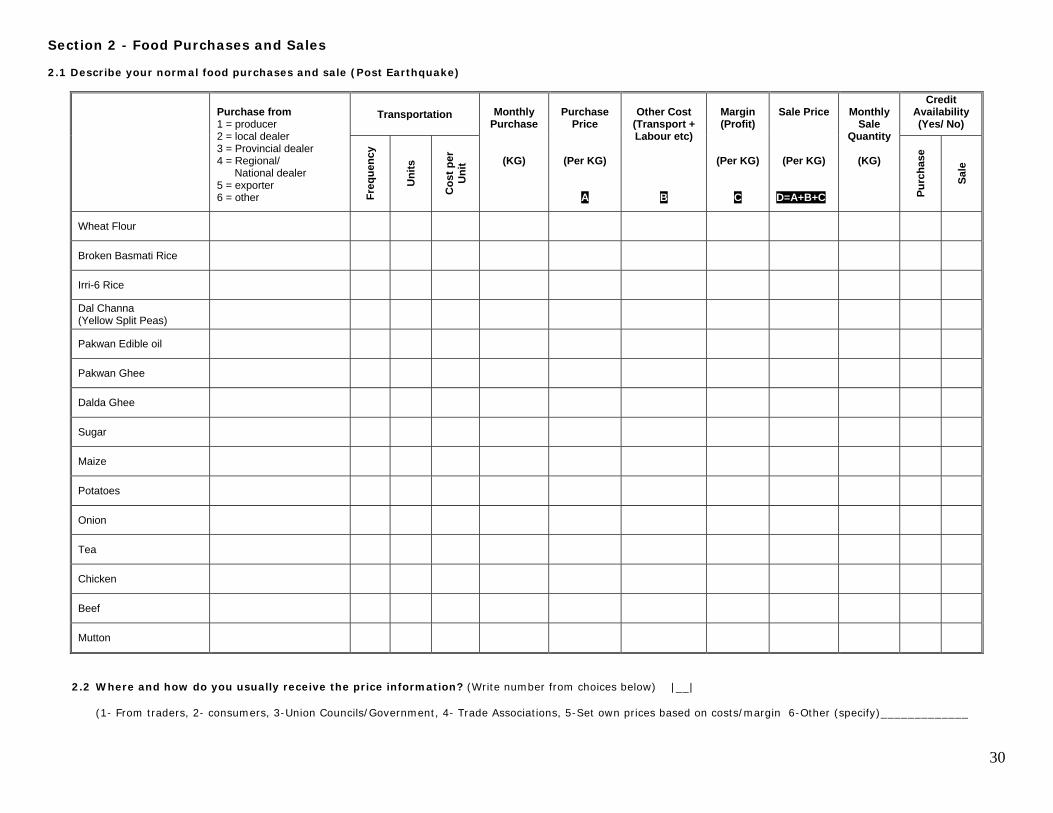
30
Section 2 - Food Purchases and Sales 2.1 Describe your normal food purchases and sale (Post Earthquake)
Transportation Credit
Availability (Yes/ No)
Purchase from 1 = producer 2 = local dealer 3 = Provincial dealer 4 = Regional/ National dealer 5 = exporter 6 = other Fr
eque
ncy
Uni
ts
Cos
t per
U
nit
Monthly
Purchase
(KG)
Purchase
Price
(Per KG)
A
Other Cost
(Transport + Labour etc)
B
Margin (Profit)
(Per KG)
C
Sale Price
(Per KG)
D=A+B+C
Monthly
Sale Quantity
(KG)
Purc
hase
Sale
Wheat Flour
Broken Basmati Rice
Irri-6 Rice
Dal Channa (Yellow Split Peas)
Pakwan Edible oil
Pakwan Ghee
Dalda Ghee
Sugar
Maize
Potatoes
Onion
Tea
Chicken
Beef
Mutton
2.2 Where and how do you usually receive the price information? (Write number from choices below) |__|
(1- From traders, 2- consumers, 3-Union Councils/Government, 4- Trade Associations, 5-Set own prices based on costs/margin 6-Other (specify)_____________
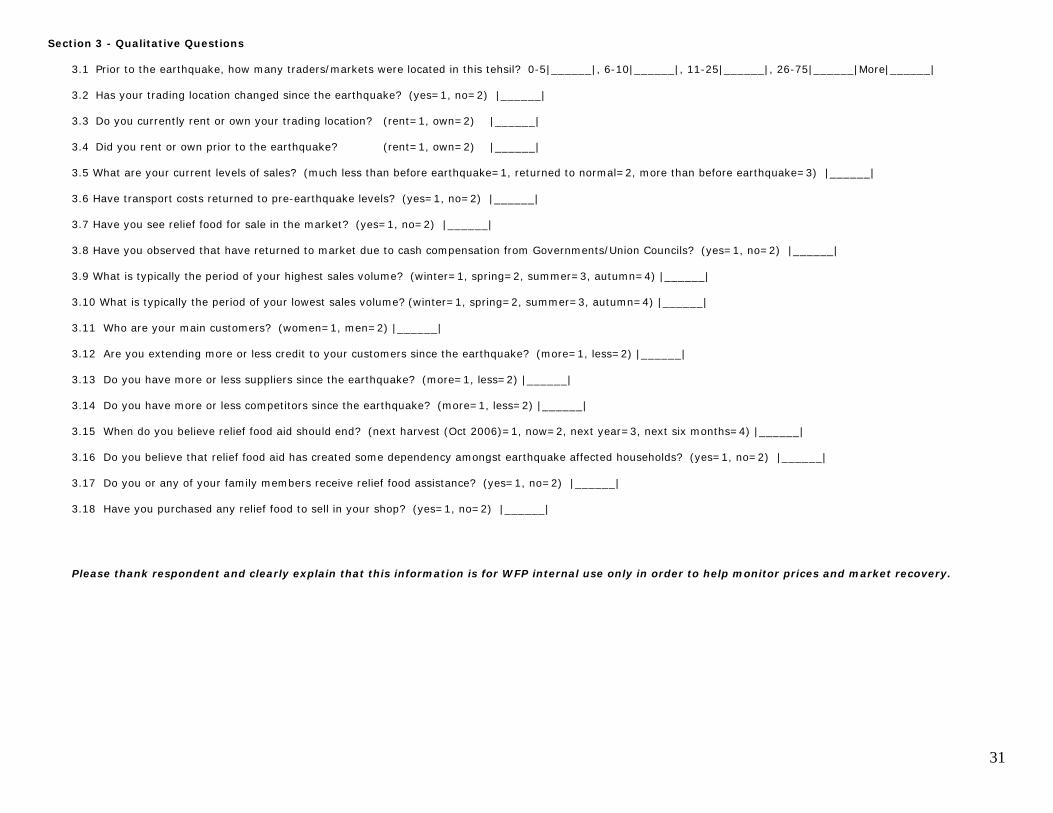
31
Section 3 - Qualitative Questions
3.1 Prior to the earthquake, how many traders/markets were located in this tehsil? 0-5|______|, 6-10|______|, 11-25|______|, 26-75|______|More|______| 3.2 Has your trading location changed since the earthquake? (yes=1, no=2) |______| 3.3 Do you currently rent or own your trading location? (rent=1, own=2) |______| 3.4 Did you rent or own prior to the earthquake? (rent=1, own=2) |______| 3.5 What are your current levels of sales? (much less than before earthquake=1, returned to normal=2, more than before earthquake=3) |______| 3.6 Have transport costs returned to pre-earthquake levels? (yes=1, no=2) |______| 3.7 Have you see relief food for sale in the market? (yes=1, no=2) |______| 3.8 Have you observed that have returned to market due to cash compensation from Governments/Union Councils? (yes=1, no=2) |______| 3.9 What is typically the period of your highest sales volume? (winter=1, spring=2, summer=3, autumn=4) |______| 3.10 What is typically the period of your lowest sales volume? (winter=1, spring=2, summer=3, autumn=4) |______| 3.11 Who are your main customers? (women=1, men=2) |______| 3.12 Are you extending more or less credit to your customers since the earthquake? (more=1, less=2) |______| 3.13 Do you have more or less suppliers since the earthquake? (more=1, less=2) |______| 3.14 Do you have more or less competitors since the earthquake? (more=1, less=2) |______| 3.15 When do you believe relief food aid should end? (next harvest (Oct 2006)=1, now=2, next year=3, next six months=4) |______| 3.16 Do you believe that relief food aid has created some dependency amongst earthquake affected households? (yes=1, no=2) |______| 3.17 Do you or any of your family members receive relief food assistance? (yes=1, no=2) |______| 3.18 Have you purchased any relief food to sell in your shop? (yes=1, no=2) |______| Please thank respondent and clearly explain that this information is for WFP internal use only in order to help monitor prices and market recovery.