pacs evolutionary probe (pep)���a herschel key program
TRANSCRIPT
arX
iv:1
106.
3285
v1 [
astr
o-ph
.CO
] 16
Jun
201
1Astronomy & Astrophysicsmanuscript no. 17107accepted c© ESO 2011June 17, 2011
PACS Evolutionary Probe (PEP) - A Herschel Key Program ⋆
D. Lutz1, A. Poglitsch1, B. Altieri2, P. Andreani3,4, H. Aussel5, S. Berta1, A. Bongiovanni6,7, D. Brisbin8, A. Cava6,7,J. Cepa6,7, A. Cimatti9, E. Daddi5, H. Dominguez-Sanchez9, D. Elbaz5, N.M. Forster Schreiber1, R. Genzel1,
A. Grazian10, C. Gruppioni9, M. Harwit8, E. Le Floc’h5, G. Magdis5, B. Magnelli1, R. Maiolino10, R. Nordon1,A.M. Perez Garcıa6,7, P. Popesso1, F. Pozzi9, L. Riguccini5, G. Rodighiero11, A. Saintonge1, M. Sanchez Portal2,
P. Santini10,1, L. Shao1, E. Sturm1, L.J. Tacconi1, I. Valtchanov2, M. Wetzstein1, and E. Wieprecht1
1 MPE, Postfach 1312, 85741 Garching, Germany, e-mail:[email protected] European Space Astronomy Centre, Villafranca del Castillo, Spain3 European Southern Observatory, Karl-Schwarzschild-Straße 2, 85748 Garching, Germany4 INAF - Osservatorio Astronomico di Trieste, via Tiepolo 11,34143 Trieste, Italy5 IRFU/Service d’Astrophysique, Bat.709, CEA-Saclay, 91191 Gif-sur-Yvette Cedex, France6 Instituto de Astrofısica de Canarias, 38205 La Laguna, Spain7 Departamento de Astrofısica, Universidad de La Laguna, Spain8 Space Science Building, Cornell University, Ithaca, NY 14853-6801, USA9 Istituto Nazionale di Astronomia, Osservatorio Astronomico di Bologna, Via Ranzani 1, I-40127 Bologna, Italy
10 INAF - Osservatorio Astronomico di Roma, via di Frascati 33,00040 Monte Porzio Catone, Italy11 Dipartimento di Astronomia, Universita di Padova, 35122 Padova, Italy
received 19 April 2011 ; accepted 9 June 2011
ABSTRACT
Deep far-infrared photometric surveys studying galaxy evolution and the nature of the cosmic infrared background are akey strengthof theHerschel mission. We describe the scientific motivation for the PACS Evolutionary Probe (PEP) guaranteed time key programand its role in the complement of Herschel surveys, and the field selection which includes popular multiwavelength fieldssuch asGOODS, COSMOS, Lockman Hole, ECDFS, EGS. We provide an account of the observing strategies and data reduction methodsused. An overview of first science results illustrates the potential of PEP in providing calorimetric star formation rates for highredshift galaxy populations, thus testing and superseeding previous extrapolations from other wavelengths, and enabling a wide rangeof galaxy evolution studies.
Key words. Surveys – Galaxies: evolution – Galaxies: active – Infrared: galaxies
1. Motivation
Over the last two decades, it has become increasingly clear thatno understanding of galaxy evolution can be obtained withoutaccounting for the energy that is absorbed by dust and re-emittedat mid- and far-infrared wavelengths. For example, early at-tempts to reconstruct the cosmic star formation history sufferedfrom uncertainties in the obscuration corrections that have to beapplied to the rest frame ultraviolet measurements (e.g. Madau1996, Lilly et al. 1996). Soon, the importance of luminousdusty high redshift galaxies was highlighted by the detectionof infrared-luminous populations both in the mid-infrared(e.g.Aussel et al. 1999, Genzel & Cesarsky 2000) and the submm(e.g. Hughes et al. 1998). Mainly due to the large mid-infraredlegacy that theSpitzer mission provided for extragalactic stud-ies (Soifer et al. 2008), a global consistency between thesetwoperspectives from the rest frame ultraviolet and from the restframe mid-IR side could be achieved (e.g. Hopkins and Beacom2006). This is because the rest frame ultraviolet obscuration onaverage can be constrained by comparing the observed ultravi-olet emission to the sum of ultraviolet and infrared emission.Extrapolation from the mid-infrared to the rest far-infrared was
⋆ Herschel is an ESA space observatory with science instruments pro-vided by European-led Principal Investigator consortia and with impor-tant participation from NASA.
still necessary, however, on the basis of SED assumptions thatwere untested at the redshifts to which they had to be applied.
At the same time, the detection of the cosmic far-infraredbackground (CIB) with total energy content similar to theoptical/near-infrared one (Puget et al. 1996, Hauser et al. 1998)highlighted the importance of dust emission in the cosmic en-ergy budget. An increase with redshift in the energy output ofdusty galaxies relative to others was inferred both from theshapeof the CIB and from the more rapid increase with redshift of IRenergy density compared to ultraviolet energy density in the re-solved observations (e.g., Le Floc’h 2005). All these linesof ev-idence strongly suggest that our picture of high redshift galaxyevolution is substantially incomplete and emphasize the need fordirect rest frame ‘calorimetric’ far-infrared measurements of in-dividual high-z galaxies, in order to avoid SED extrapolation andto increasingly replace population averages with individual mea-surements. While small cryogenic space telescopes likeISO andSpitzer were already equipped with sensitive far-infrared detec-tors, they were for these wavelengths rapidly limited by sourceconfusion, and thus focussed on the study of local objects, or atz&0.5 on study of only the most luminous galaxies. They alsowere able to resolve only a small fraction of the cosmic infraredbackground.
With ESA’s Herschel space observatory (Pilbratt 2010) andits PACS (Poglitsch et al. 2010) and SPIRE (Griffin et al. 2010)
1
Lutz et al.: PACS evolutionary probe
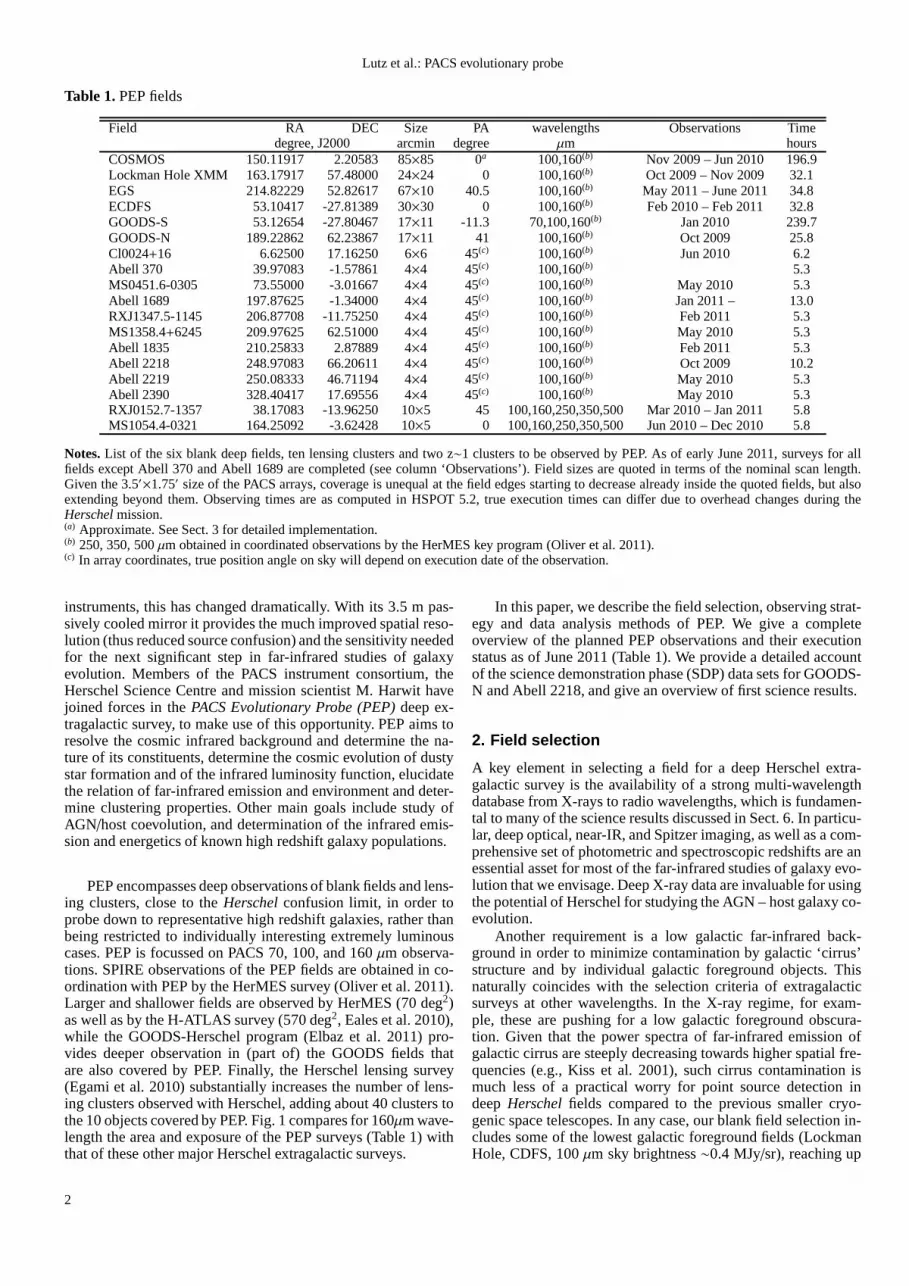
Table 1.PEP fields
Field RA DEC Size PA wavelengths Observations Timedegree, J2000 arcmin degree µm hours
COSMOS 150.11917 2.20583 85×85 0a 100,160(b) Nov 2009 – Jun 2010 196.9Lockman Hole XMM 163.17917 57.48000 24×24 0 100,160(b) Oct 2009 – Nov 2009 32.1EGS 214.82229 52.82617 67×10 40.5 100,160(b) May 2011 – June 2011 34.8ECDFS 53.10417 -27.81389 30×30 0 100,160(b) Feb 2010 – Feb 2011 32.8GOODS-S 53.12654 -27.80467 17×11 -11.3 70,100,160(b) Jan 2010 239.7GOODS-N 189.22862 62.23867 17×11 41 100,160(b) Oct 2009 25.8Cl0024+16 6.62500 17.16250 6×6 45(c) 100,160(b) Jun 2010 6.2Abell 370 39.97083 -1.57861 4×4 45(c) 100,160(b) 5.3MS0451.6-0305 73.55000 -3.01667 4×4 45(c) 100,160(b) May 2010 5.3Abell 1689 197.87625 -1.34000 4×4 45(c) 100,160(b) Jan 2011 – 13.0RXJ1347.5-1145 206.87708 -11.75250 4×4 45(c) 100,160(b) Feb 2011 5.3MS1358.4+6245 209.97625 62.51000 4×4 45(c) 100,160(b) May 2010 5.3Abell 1835 210.25833 2.87889 4×4 45(c) 100,160(b) Feb 2011 5.3Abell 2218 248.97083 66.20611 4×4 45(c) 100,160(b) Oct 2009 10.2Abell 2219 250.08333 46.71194 4×4 45(c) 100,160(b) May 2010 5.3Abell 2390 328.40417 17.69556 4×4 45(c) 100,160(b) May 2010 5.3RXJ0152.7-1357 38.17083 -13.96250 10×5 45 100,160,250,350,500 Mar 2010 – Jan 2011 5.8MS1054.4-0321 164.25092 -3.62428 10×5 0 100,160,250,350,500 Jun 2010 – Dec 2010 5.8
Notes.List of the six blank deep fields, ten lensing clusters and twoz∼1 clusters to be observed by PEP. As of early June 2011, surveys for allfields except Abell 370 and Abell 1689 are completed (see column ‘Observations’). Field sizes are quoted in terms of the nominal scan length.Given the 3.5′×1.75′ size of the PACS arrays, coverage is unequal at the field edgesstarting to decrease already inside the quoted fields, but alsoextending beyond them. Observing times are as computed in HSPOT 5.2, true execution times can differ due to overhead changes during theHerschel mission.(a) Approximate. See Sect. 3 for detailed implementation.(b) 250, 350, 500µm obtained in coordinated observations by the HerMES key program (Oliver et al. 2011).(c) In array coordinates, true position angle on sky will dependon execution date of the observation.
instruments, this has changed dramatically. With its 3.5 m pas-sively cooled mirror it provides the much improved spatial reso-lution (thus reduced source confusion) and the sensitivityneededfor the next significant step in far-infrared studies of galaxyevolution. Members of the PACS instrument consortium, theHerschel Science Centre and mission scientist M. Harwit havejoined forces in thePACS Evolutionary Probe (PEP) deep ex-tragalactic survey, to make use of this opportunity. PEP aims toresolve the cosmic infrared background and determine the na-ture of its constituents, determine the cosmic evolution ofdustystar formation and of the infrared luminosity function, elucidatethe relation of far-infrared emission and environment and deter-mine clustering properties. Other main goals include studyofAGN/host coevolution, and determination of the infrared emis-sion and energetics of known high redshift galaxy populations.
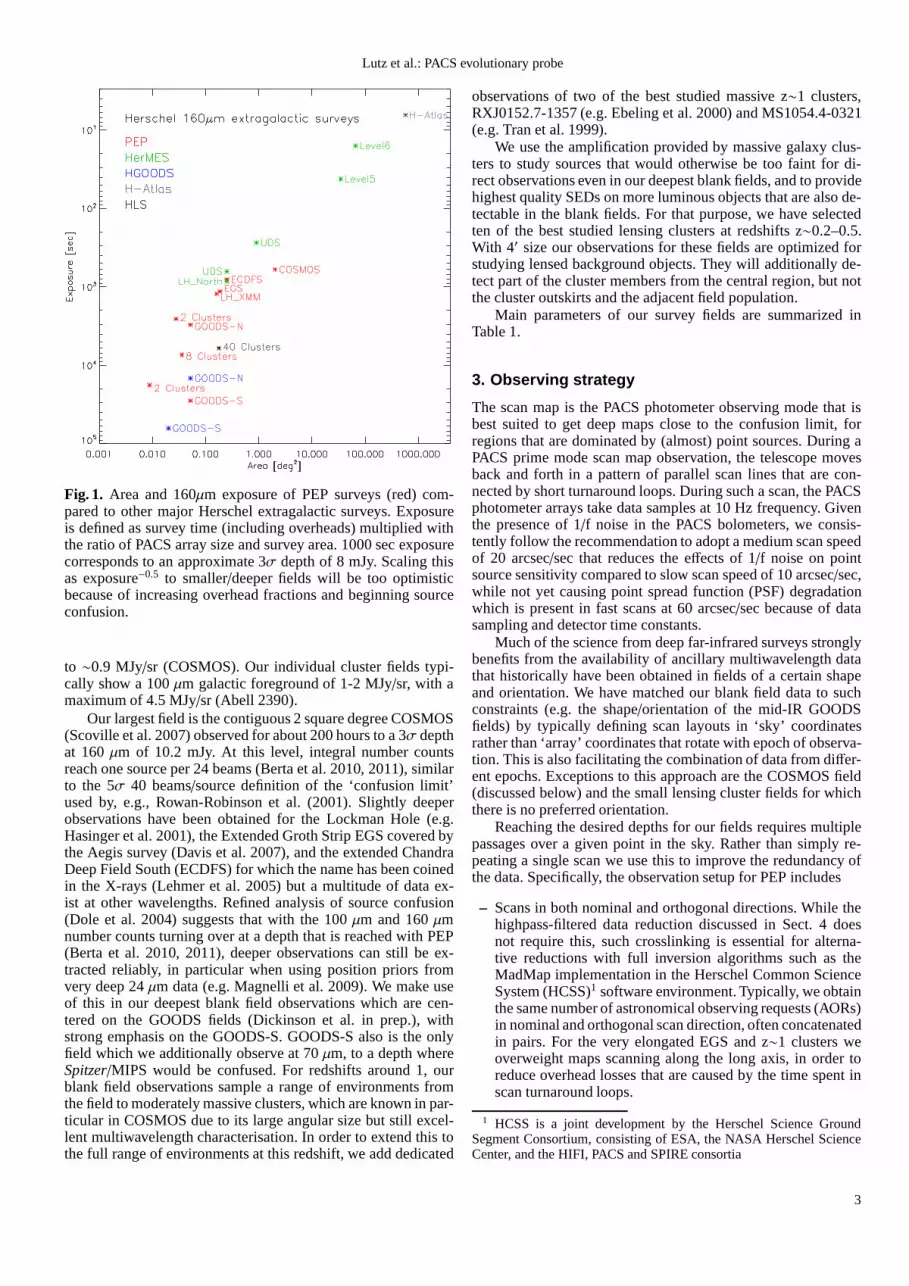
PEP encompasses deep observations of blank fields and lens-ing clusters, close to theHerschel confusion limit, in order toprobe down to representative high redshift galaxies, rather thanbeing restricted to individually interesting extremely luminouscases. PEP is focussed on PACS 70, 100, and 160µm observa-tions. SPIRE observations of the PEP fields are obtained in co-ordination with PEP by the HerMES survey (Oliver et al. 2011).Larger and shallower fields are observed by HerMES (70 deg2)as well as by the H-ATLAS survey (570 deg2, Eales et al. 2010),while the GOODS-Herschel program (Elbaz et al. 2011) pro-vides deeper observation in (part of) the GOODS fields thatare also covered by PEP. Finally, the Herschel lensing survey(Egami et al. 2010) substantially increases the number of lens-ing clusters observed with Herschel, adding about 40 clusters tothe 10 objects covered by PEP. Fig. 1 compares for 160µm wave-length the area and exposure of the PEP surveys (Table 1) withthat of these other major Herschel extragalactic surveys.
In this paper, we describe the field selection, observing strat-egy and data analysis methods of PEP. We give a completeoverview of the planned PEP observations and their executionstatus as of June 2011 (Table 1). We provide a detailed accountof the science demonstration phase (SDP) data sets for GOODS-N and Abell 2218, and give an overview of first science results.
2. Field selection
A key element in selecting a field for a deep Herschel extra-galactic survey is the availability of a strong multi-wavelengthdatabase from X-rays to radio wavelengths, which is fundamen-tal to many of the science results discussed in Sect. 6. In particu-lar, deep optical, near-IR, and Spitzer imaging, as well as acom-prehensive set of photometric and spectroscopic redshiftsare anessential asset for most of the far-infrared studies of galaxy evo-lution that we envisage. Deep X-ray data are invaluable for usingthe potential of Herschel for studying the AGN – host galaxy co-evolution.
Another requirement is a low galactic far-infrared back-ground in order to minimize contamination by galactic ‘cirrus’structure and by individual galactic foreground objects. Thisnaturally coincides with the selection criteria of extragalacticsurveys at other wavelengths. In the X-ray regime, for exam-ple, these are pushing for a low galactic foreground obscura-tion. Given that the power spectra of far-infrared emissionofgalactic cirrus are steeply decreasing towards higher spatial fre-quencies (e.g., Kiss et al. 2001), such cirrus contamination ismuch less of a practical worry for point source detection indeepHerschel fields compared to the previous smaller cryo-genic space telescopes. In any case, our blank field selection in-cludes some of the lowest galactic foreground fields (LockmanHole, CDFS, 100µm sky brightness∼0.4 MJy/sr), reaching up
2
Lutz et al.: PACS evolutionary probe
Fig. 1. Area and 160µm exposure of PEP surveys (red) com-pared to other major Herschel extragalactic surveys. Exposureis defined as survey time (including overheads) multiplied withthe ratio of PACS array size and survey area. 1000 sec exposurecorresponds to an approximate 3σ depth of 8 mJy. Scaling thisas exposure−0.5 to smaller/deeper fields will be too optimisticbecause of increasing overhead fractions and beginning sourceconfusion.
to ∼0.9 MJy/sr (COSMOS). Our individual cluster fields typi-cally show a 100µm galactic foreground of 1-2 MJy/sr, with amaximum of 4.5 MJy/sr (Abell 2390).
Our largest field is the contiguous 2 square degree COSMOS(Scoville et al. 2007) observed for about 200 hours to a 3σ depthat 160µm of 10.2 mJy. At this level, integral number countsreach one source per 24 beams (Berta et al. 2010, 2011), similarto the 5σ 40 beams/source definition of the ‘confusion limit’used by, e.g., Rowan-Robinson et al. (2001). Slightly deeperobservations have been obtained for the Lockman Hole (e.g.Hasinger et al. 2001), the Extended Groth Strip EGS covered bythe Aegis survey (Davis et al. 2007), and the extended ChandraDeep Field South (ECDFS) for which the name has been coinedin the X-rays (Lehmer et al. 2005) but a multitude of data ex-ist at other wavelengths. Refined analysis of source confusion(Dole et al. 2004) suggests that with the 100µm and 160µmnumber counts turning over at a depth that is reached with PEP(Berta et al. 2010, 2011), deeper observations can still be ex-tracted reliably, in particular when using position priorsfromvery deep 24µm data (e.g. Magnelli et al. 2009). We make useof this in our deepest blank field observations which are cen-tered on the GOODS fields (Dickinson et al. in prep.), withstrong emphasis on the GOODS-S. GOODS-S also is the onlyfield which we additionally observe at 70µm, to a depth whereSpitzer/MIPS would be confused. For redshifts around 1, ourblank field observations sample a range of environments fromthe field to moderately massive clusters, which are known in par-ticular in COSMOS due to its large angular size but still excel-lent multiwavelength characterisation. In order to extendthis tothe full range of environments at this redshift, we add dedicated
observations of two of the best studied massive z∼1 clusters,RXJ0152.7-1357 (e.g. Ebeling et al. 2000) and MS1054.4-0321(e.g. Tran et al. 1999).
We use the amplification provided by massive galaxy clus-ters to study sources that would otherwise be too faint for di-rect observations even in our deepest blank fields, and to providehighest quality SEDs on more luminous objects that are also de-tectable in the blank fields. For that purpose, we have selectedten of the best studied lensing clusters at redshifts z∼0.2–0.5.With 4′ size our observations for these fields are optimized forstudying lensed background objects. They will additionally de-tect part of the cluster members from the central region, butnotthe cluster outskirts and the adjacent field population.
Main parameters of our survey fields are summarized inTable 1.
3. Observing strategy
The scan map is the PACS photometer observing mode that isbest suited to get deep maps close to the confusion limit, forregions that are dominated by (almost) point sources. During aPACS prime mode scan map observation, the telescope movesback and forth in a pattern of parallel scan lines that are con-nected by short turnaround loops. During such a scan, the PACSphotometer arrays take data samples at 10 Hz frequency. Giventhe presence of 1/f noise in the PACS bolometers, we consis-tently follow the recommendation to adopt a medium scan speedof 20 arcsec/sec that reduces the effects of 1/f noise on pointsource sensitivity compared to slow scan speed of 10 arcsec/sec,while not yet causing point spread function (PSF) degradationwhich is present in fast scans at 60 arcsec/sec because of datasampling and detector time constants.
Much of the science from deep far-infrared surveys stronglybenefits from the availability of ancillary multiwavelength datathat historically have been obtained in fields of a certain shapeand orientation. We have matched our blank field data to suchconstraints (e.g. the shape/orientation of the mid-IR GOODSfields) by typically defining scan layouts in ‘sky’ coordinatesrather than ‘array’ coordinates that rotate with epoch of observa-tion. This is also facilitating the combination of data fromdiffer-ent epochs. Exceptions to this approach are the COSMOS field(discussed below) and the small lensing cluster fields for whichthere is no preferred orientation.
Reaching the desired depths for our fields requires multiplepassages over a given point in the sky. Rather than simply re-peating a single scan we use this to improve the redundancy ofthe data. Specifically, the observation setup for PEP includes
– Scans in both nominal and orthogonal directions. While thehighpass-filtered data reduction discussed in Sect. 4 doesnot require this, such crosslinking is essential for alterna-tive reductions with full inversion algorithms such as theMadMap implementation in the Herschel Common ScienceSystem (HCSS)1 software environment. Typically, we obtainthe same number of astronomical observing requests (AORs)in nominal and orthogonal scan direction, often concatenatedin pairs. For the very elongated EGS and z∼1 clusters weoverweight maps scanning along the long axis, in order toreduce overhead losses that are caused by the time spent inscan turnaround loops.
1 HCSS is a joint development by the Herschel Science GroundSegment Consortium, consisting of ESA, the NASA Herschel ScienceCenter, and the HIFI, PACS and SPIRE consortia
3
Lutz et al.: PACS evolutionary probe
Table 2.AOR parameters used for the PEP fields
Field Nominal scan direction Orthogonal scan directionLeg Step NL Angle NRep NAOR Leg Step NL Angle NRep NAOR′ ′′ ◦ ′ ′′ ◦
COSMOS 85 Hom Sq 70 Arr 1 24 85 Hom Sq 160 Arr 2 25Lockman Hole XMM 24 50 30 0 Sky 2 10 24 50 30 90 Sky 2 10EGS 67 50 13 4 0.5 Sky 2 13 10 50 81 130.5 Sky 2 8ECDFS 30 50 37 0 Sky 2 8 30 50 37 90 Sky 2 8GOODS-S 70/160 17 25 27 348.7 Sky 2 48 11 25 41 78.7 Sky 2 48GOODS-S 100/160 17 25 27 348.7 Sky 2 54 11 25 41 78.7 Sky 2 54GOODS-N 17 25 27 41 Sky 2 11 11 25 41 131 Sky 2 11Cl0024+16 6 20 19 45 Arr 15 1 6 20 19 315 Arr 15 1Abell 370 4 20 13 45 Arr 22 1 4 20 13 315 Arr 22 1MS0451.6-0305 4 20 13 45 Arr 22 1 4 20 13 315 Arr 22 1Abell 1689 4 20 13 45 Arr 18 3 4 20 13 315 Arr 18 3RXJ1347.5-1145 4 20 13 45 Arr 22 1 4 20 13 315 Arr 22 1MS1358.4+6245 4 20 13 45 Arr 22 1 4 20 13 315 Arr 22 1Abell 1835 4 20 13 45 Arr 22 1 4 20 13 315 Arr 22 1Abell 2218 4 20 13 45 Arr 14 3 4 20 13 315 Arr 14 3Abell 2219 4 20 13 45 Arr 22 1 4 20 13 315 Arr 22 1Abell 2390 4 20 13 45 Arr 22 1 4 20 13 315 Arr 22 1RXJ0152.7-1357 10 25 13 45 Sky 6 3 5 25 25 135 Sky 2 3MS1054.4-0321 10 25 13 0 Sky 6 3 5 25 25 90 Sky 2 3
Notes.For both the nominal and the orthogonal scan direction, the table lists the scan leg length, the cross-scan separation step, the number ofscan legs, the scan angle and its reference system (Sky or Array), the number of scan repetitions within an AOR and the number of independentAORs obtained with those settings. ’Hom Sq’ indicates that the cross-scan separation and number of scan legs are defined automatically by theAOT logic to produce a square map with ‘homogeneous’ coverage.
– Small cross-scan separations, specifically the size of one ofthe eight PACS ‘blue’ detector array matrices (∼50′′) or frac-tions 1/2 or 1/2.5 of it. Simple models demonstrate that forsuch a scan pattern homogeneous coverage maps are pro-duced already from a single detector matrix, for any relativeorientation of the scan direction and the inter-matrix gaps.By definition, this pattern also averages out sensitivity varia-tions between detector matrices over most of the final map. Ifthis redundant mapping scheme led to short execution timesof a single scanmap over the field but deeper observationswere needed, the scanmap was repeated within an AOR toreach a total execution time between one and a few hours.
– Often, many AOR pairs with a plausible execution time thatis not exceeding a few hours each, are still needed to achievethe required depth. Then, AOR positions may be ditheredby a fraction of the cross-scan separation to further improvespatial redundancy, and the corner of the map where the scanis started may be varied.
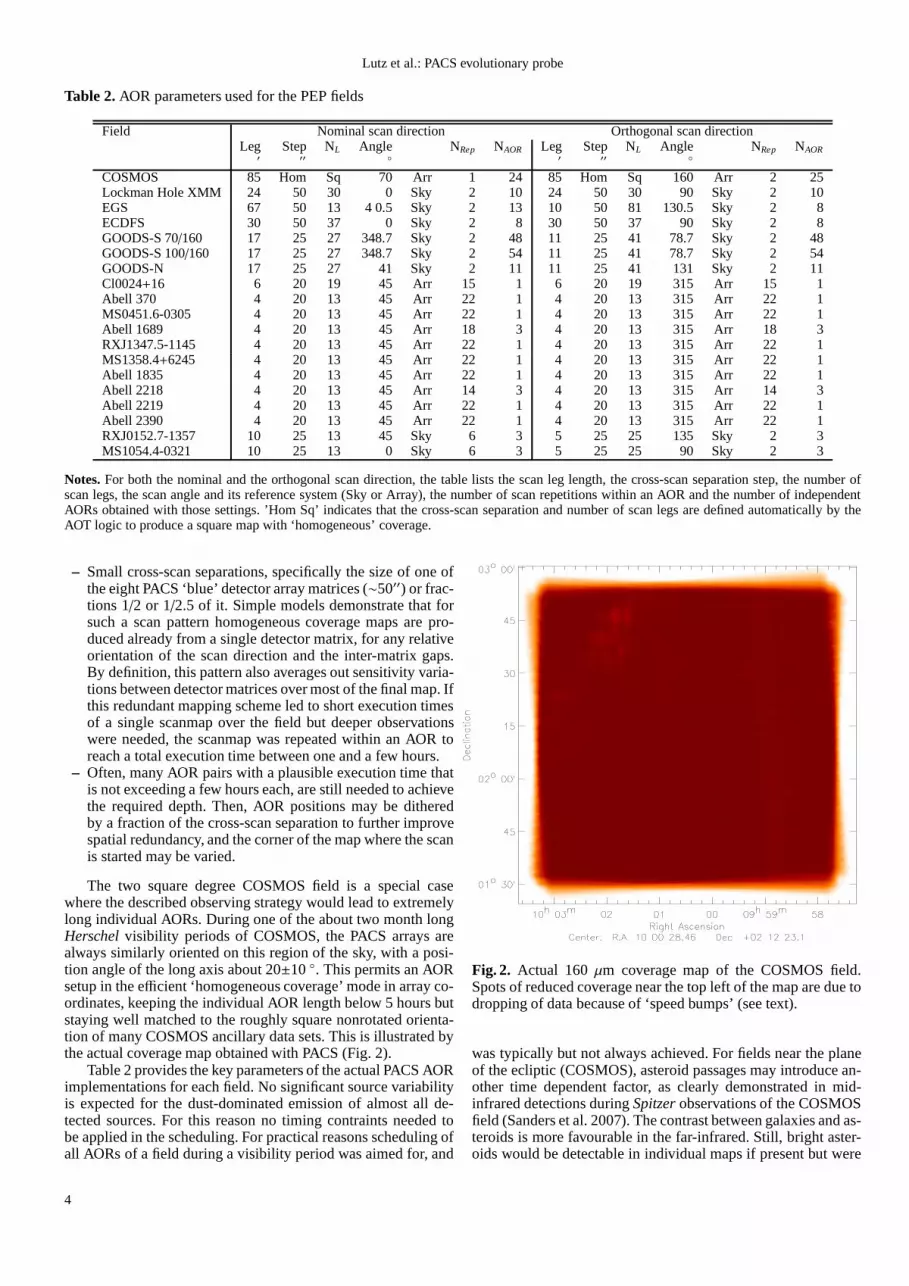
The two square degree COSMOS field is a special casewhere the described observing strategy would lead to extremelylong individual AORs. During one of the about two month longHerschel visibility periods of COSMOS, the PACS arrays arealways similarly oriented on this region of the sky, with a posi-tion angle of the long axis about 20±10 ◦. This permits an AORsetup in the efficient ‘homogeneous coverage’ mode in array co-ordinates, keeping the individual AOR length below 5 hours butstaying well matched to the roughly square nonrotated orienta-tion of many COSMOS ancillary data sets. This is illustratedbythe actual coverage map obtained with PACS (Fig. 2).
Table 2 provides the key parameters of the actual PACS AORimplementations for each field. No significant source variabilityis expected for the dust-dominated emission of almost all de-tected sources. For this reason no timing contraints neededtobe applied in the scheduling. For practical reasons scheduling ofall AORs of a field during a visibility period was aimed for, and
Fig. 2. Actual 160µm coverage map of the COSMOS field.Spots of reduced coverage near the top left of the map are due todropping of data because of ‘speed bumps’ (see text).
was typically but not always achieved. For fields near the planeof the ecliptic (COSMOS), asteroid passages may introduce an-other time dependent factor, as clearly demonstrated in mid-infrared detections duringSpitzer observations of the COSMOSfield (Sanders et al. 2007). The contrast between galaxies and as-teroids is more favourable in the far-infrared. Still, bright aster-oids would be detectable in individual maps if present but were
4
Lutz et al.: PACS evolutionary probe
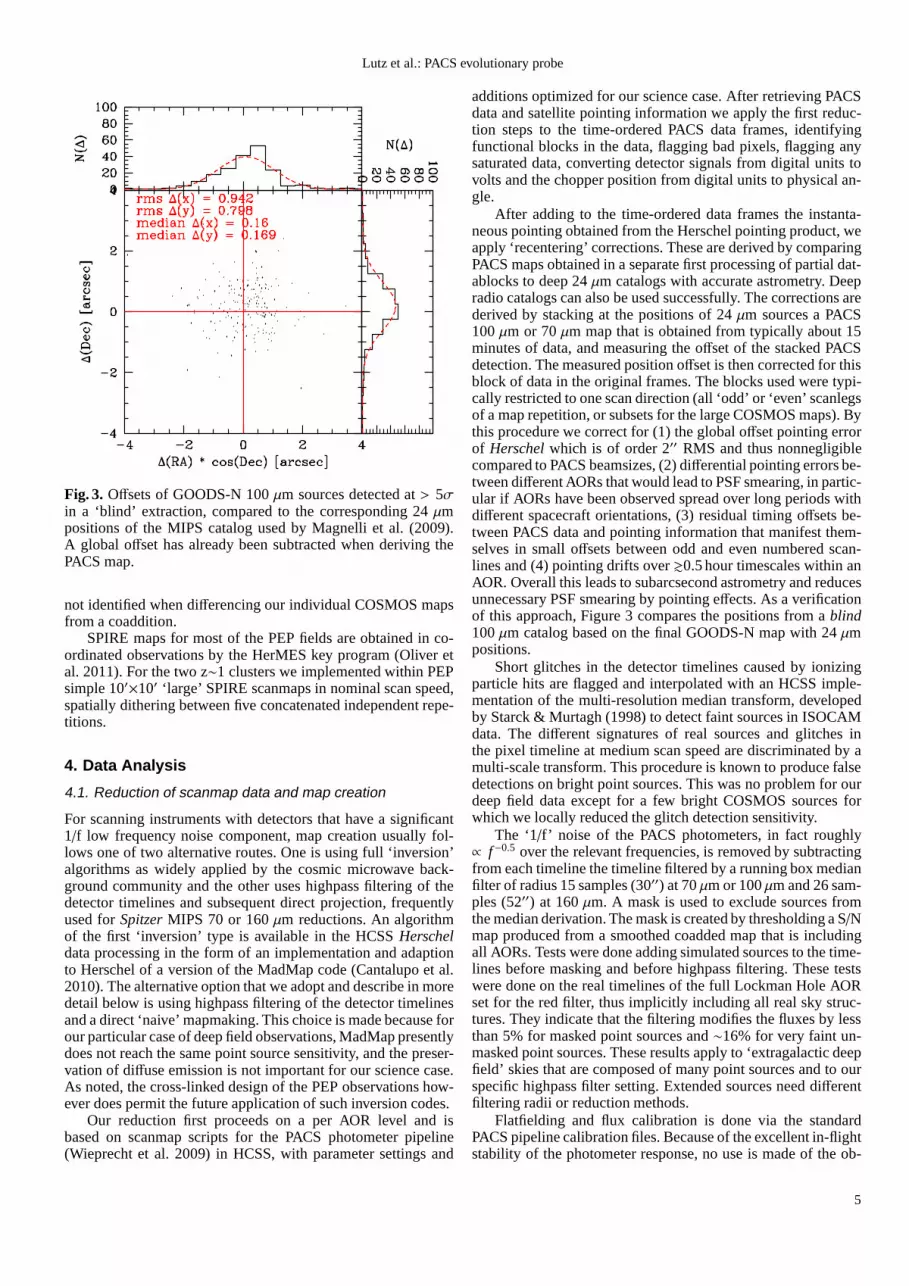
Fig. 3. Offsets of GOODS-N 100µm sources detected at> 5σin a ‘blind’ extraction, compared to the corresponding 24µmpositions of the MIPS catalog used by Magnelli et al. (2009).A global offset has already been subtracted when deriving thePACS map.
not identified when differencing our individual COSMOS mapsfrom a coaddition.
SPIRE maps for most of the PEP fields are obtained in co-ordinated observations by the HerMES key program (Oliver etal. 2011). For the two z∼1 clusters we implemented within PEPsimple 10′×10′ ‘large’ SPIRE scanmaps in nominal scan speed,spatially dithering between five concatenated independentrepe-titions.
4. Data Analysis
4.1. Reduction of scanmap data and map creation
For scanning instruments with detectors that have a significant1/f low frequency noise component, map creation usually fol-lows one of two alternative routes. One is using full ‘inversion’algorithms as widely applied by the cosmic microwave back-ground community and the other uses highpass filtering of thedetector timelines and subsequent direct projection, frequentlyused forSpitzer MIPS 70 or 160µm reductions. An algorithmof the first ‘inversion’ type is available in the HCSSHerscheldata processing in the form of an implementation and adaptionto Herschel of a version of the MadMap code (Cantalupo et al.2010). The alternative option that we adopt and describe in moredetail below is using highpass filtering of the detector timelinesand a direct ‘naive’ mapmaking. This choice is made because forour particular case of deep field observations, MadMap presentlydoes not reach the same point source sensitivity, and the preser-vation of diffuse emission is not important for our science case.As noted, the cross-linked design of the PEP observations how-ever does permit the future application of such inversion codes.
Our reduction first proceeds on a per AOR level and isbased on scanmap scripts for the PACS photometer pipeline(Wieprecht et al. 2009) in HCSS, with parameter settings and
additions optimized for our science case. After retrievingPACSdata and satellite pointing information we apply the first reduc-tion steps to the time-ordered PACS data frames, identifyingfunctional blocks in the data, flagging bad pixels, flagging anysaturated data, converting detector signals from digital units tovolts and the chopper position from digital units to physical an-gle.
After adding to the time-ordered data frames the instanta-neous pointing obtained from the Herschel pointing product, weapply ‘recentering’ corrections. These are derived by comparingPACS maps obtained in a separate first processing of partial dat-ablocks to deep 24µm catalogs with accurate astrometry. Deepradio catalogs can also be used successfully. The corrections arederived by stacking at the positions of 24µm sources a PACS100µm or 70µm map that is obtained from typically about 15minutes of data, and measuring the offset of the stacked PACSdetection. The measured position offset is then corrected for thisblock of data in the original frames. The blocks used were typi-cally restricted to one scan direction (all ‘odd’ or ‘even’ scanlegsof a map repetition, or subsets for the large COSMOS maps). Bythis procedure we correct for (1) the global offset pointing errorof Herschel which is of order 2′′ RMS and thus nonnegligiblecompared to PACS beamsizes, (2) differential pointing errors be-tween different AORs that would lead to PSF smearing, in partic-ular if AORs have been observed spread over long periods withdifferent spacecraft orientations, (3) residual timing offsets be-tween PACS data and pointing information that manifest them-selves in small offsets between odd and even numbered scan-lines and (4) pointing drifts over&0.5 hour timescales within anAOR. Overall this leads to subarcsecond astrometry and reducesunnecessary PSF smearing by pointing effects. As a verificationof this approach, Figure 3 compares the positions from ablind100µm catalog based on the final GOODS-N map with 24µmpositions.
Short glitches in the detector timelines caused by ionizingparticle hits are flagged and interpolated with an HCSS imple-mentation of the multi-resolution median transform, developedby Starck & Murtagh (1998) to detect faint sources in ISOCAMdata. The different signatures of real sources and glitches inthe pixel timeline at medium scan speed are discriminated byamulti-scale transform. This procedure is known to produce falsedetections on bright point sources. This was no problem for ourdeep field data except for a few bright COSMOS sources forwhich we locally reduced the glitch detection sensitivity.
The ‘1/f’ noise of the PACS photometers, in fact roughly∝ f −0.5 over the relevant frequencies, is removed by subtractingfrom each timeline the timeline filtered by a running box medianfilter of radius 15 samples (30′′) at 70µm or 100µm and 26 sam-ples (52′′) at 160µm. A mask is used to exclude sources fromthe median derivation. The mask is created by thresholding aS/Nmap produced from a smoothed coadded map that is includingall AORs. Tests were done adding simulated sources to the time-lines before masking and before highpass filtering. These testswere done on the real timelines of the full Lockman Hole AORset for the red filter, thus implicitly including all real skystruc-tures. They indicate that the filtering modifies the fluxes by lessthan 5% for masked point sources and∼16% for very faint un-masked point sources. These results apply to ‘extragalactic deepfield’ skies that are composed of many point sources and to ourspecific highpass filter setting. Extended sources need differentfiltering radii or reduction methods.
Flatfielding and flux calibration is done via the standardPACS pipeline calibration files. Because of the excellent in-flightstability of the photometer response, no use is made of the ob-
5
Lutz et al.: PACS evolutionary probe
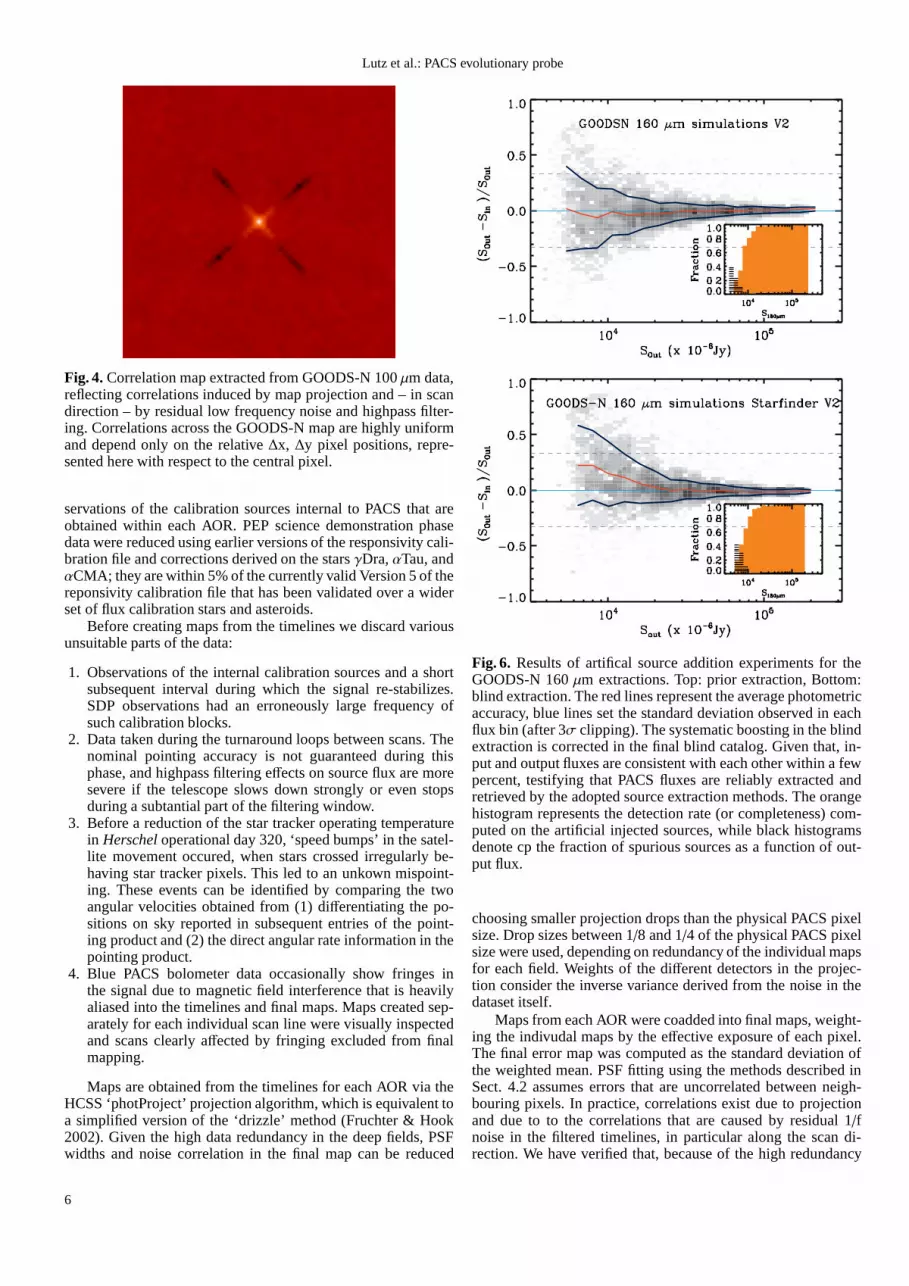
Fig. 4.Correlation map extracted from GOODS-N 100µm data,reflecting correlations induced by map projection and – in scandirection – by residual low frequency noise and highpass filter-ing. Correlations across the GOODS-N map are highly uniformand depend only on the relative∆x, ∆y pixel positions, repre-sented here with respect to the central pixel.
servations of the calibration sources internal to PACS thatareobtained within each AOR. PEP science demonstration phasedata were reduced using earlier versions of the responsivity cali-bration file and corrections derived on the starsγDra,αTau, andαCMA; they are within 5% of the currently valid Version 5 of thereponsivity calibration file that has been validated over a widerset of flux calibration stars and asteroids.
Before creating maps from the timelines we discard variousunsuitable parts of the data:
1. Observations of the internal calibration sources and a shortsubsequent interval during which the signal re-stabilizes.SDP observations had an erroneously large frequency ofsuch calibration blocks.
2. Data taken during the turnaround loops between scans. Thenominal pointing accuracy is not guaranteed during thisphase, and highpass filtering effects on source flux are moresevere if the telescope slows down strongly or even stopsduring a subtantial part of the filtering window.
3. Before a reduction of the star tracker operating temperaturein Herschel operational day 320, ‘speed bumps’ in the satel-lite movement occured, when stars crossed irregularly be-having star tracker pixels. This led to an unkown mispoint-ing. These events can be identified by comparing the twoangular velocities obtained from (1) differentiating the po-sitions on sky reported in subsequent entries of the point-ing product and (2) the direct angular rate information in thepointing product.
4. Blue PACS bolometer data occasionally show fringes inthe signal due to magnetic field interference that is heavilyaliased into the timelines and final maps. Maps created sep-arately for each individual scan line were visually inspectedand scans clearly affected by fringing excluded from finalmapping.
Maps are obtained from the timelines for each AOR via theHCSS ‘photProject’ projection algorithm, which is equivalent toa simplified version of the ‘drizzle’ method (Fruchter & Hook2002). Given the high data redundancy in the deep fields, PSFwidths and noise correlation in the final map can be reduced
Fig. 6. Results of artifical source addition experiments for theGOODS-N 160µm extractions. Top: prior extraction, Bottom:blind extraction. The red lines represent the average photometricaccuracy, blue lines set the standard deviation observed ineachflux bin (after 3σ clipping). The systematic boosting in the blindextraction is corrected in the final blind catalog. Given that, in-put and output fluxes are consistent with each other within a fewpercent, testifying that PACS fluxes are reliably extractedandretrieved by the adopted source extraction methods. The orangehistogram represents the detection rate (or completeness)com-puted on the artificial injected sources, while black histogramsdenote cp the fraction of spurious sources as a function of out-put flux.
choosing smaller projection drops than the physical PACS pixelsize. Drop sizes between 1/8 and 1/4 of the physical PACS pixelsize were used, depending on redundancy of the individual mapsfor each field. Weights of the different detectors in the projec-tion consider the inverse variance derived from the noise inthedataset itself.
Maps from each AOR were coadded into final maps, weight-ing the indivudal maps by the effective exposure of each pixel.The final error map was computed as the standard deviation ofthe weighted mean. PSF fitting using the methods described inSect. 4.2 assumes errors that are uncorrelated between neigh-bouring pixels. In practice, correlations exist due to projectionand due to to the correlations that are caused by residual 1/fnoise in the filtered timelines, in particular along the scandi-rection. We have verified that, because of the high redundancy
6

Lutz et al.: PACS evolutionary probe
Fig. 5. (Left) PACS 100µm to MIPS 24µm flux density ratio as a function of the PACS 100µm prior catalog flux density. Shaded grey regionsshow the space density distribution of galaxies observed inthe GOODS-S field. In that field, the MIPS 24µm and PACS 100µm catalogs reach at3-σ limit of 20 µJy and 1.2 mJy, respectively. Red dots and orange triangles present the evolution with redshift of the PACS-to-MIPS flux densityratio of ultra-luminous (ULIRGs) and luminous (LIRGs) infrared galaxies, respectively, predicted using the Chary & Elbaz (2001) library. Eachsymbol corresponds to a given redshift, in intervals of∆z = 0.5. On each track, we indicate on one point its corresponding redshift as well as as thepath followed for increasing redshifts. The dashed black line represents the limit of the parameter space reachable using the MIPS 24µm catalogavailable in this field; all the PACS 100µm sources below this line would have a MIPS 24µm counterpart in this catalog.(Right) PACS 160µm toMIPS 24µm flux density ratio as function of the PACS 160µm flux density. Symbols and lines are the same as in theleft panel.
Fig. 7. Noise estimate from randomly placing apertures on theGOODS-N 160µm residual map.
of the data, these correlations are close to uniform across the fi-nal map, with less than 2% variation on the correction factorthatis derived below. Thus we derived from PSF shape and correla-tion information a mean correlation correction factor which wasthen accounted for in the errors on the extracted fluxes. A corre-lation map is constructed, starting by collecting series ofpairedpixel values with same relative pixel coordinate offsets i,j. Wetake values∆f defined as the deviation in flux of a pixel in anindividual AOR map from the corresponding pixel in the finalmap. This is a deviation from the mean with expectation value0. Such values are taken for a large number of pairs in differentpositions in each AOR map and from different AORs. For eachpixel-pairs series∆f1,2, which corresponds to a specific i,j pixeloffset, a correlation coefficient is calculated:
ρ(i, j) =∑
∆ f1∆ f2√
∑
(∆ f1)2√
∑
(∆ f2)2(1)
The correlation coefficients are stored as a map and written to thei,j position relative to the central pixel. Figure 4 shows anexam-ple correlation map. Normal error propagation for a weightedsumg(x1..xn) =
∑nk=1 ak · xk, where the error areσk and correla-
tion coefficientsρ(k, l) is:
σ2g =
n∑
k,l=1
akσk · alσl · ρ(k, l) (2)
Given a PSF stamp with pixel valuesPk and a correlation be-tween every two pixelsρ(i, j) known from their relative position,the correlation correction factor to the derived errors is:
f 2 =
∑
k
P2k
∑
i, j
PiP jρ(i, j)(3)
f is the ratio of the propagated error without correlations and theerror calculated with the correlation terms. This assumes anearuniform error map on a scale of a PSF. For the typical pixel sizes(2′′ and 3′′ at 100µm and 160µm) and projection parametersused in the PEP SDP reductions, the corrections are aboutf ≈1.4 for the 70µm and 100µm maps andf ≈ 1.6 for the 160µmmaps.
Before availability of version 6 of the ArrayInstrument cal-file that is containing the spatial transformation from PACSfo-cal plane to sky, 160µm data showed a≈ 1′′ spatial offset from70µm or 100µm data. We corrected for this ad hoc in the 160µmmap fits headers, using offsets derived from a comparison of pre-liminary catalogs in the two bands.
4.2. Catalog creation
We extract source catalogs using point source fitting routinesoutside HCSS. We have used both blind extraction via theStarfinder PSF-fitting code (Diolaiti et al. 2000) and a guided
7
Lutz et al.: PACS evolutionary probe
extraction using 24µm source priors, following the method de-scribed in Magnelli et al. (2009). We fitted with point spreadfunctions extracted from the maps. Since these observed PSFsare limited in radius, we used for aperture corrections pointspread functions obtained on Vesta2. In order to match the obser-vations, these were rotated to match the satellite positionanglefor each observation of a field, coadded and slightly convolvedwith a gaussian to match the actual FWHM of the combinedmap. For our reduction methods and projection into 2′′ map pix-els at 70 and 100µm and 3′′ at 160µm, we have PSF FWHMfor the 70, 100, and 160µm maps of 6.46′′, 7.39±0.10′′, and11.29±0.1′′. The FWHM values are from gaussian fits to thecore of the observed PSF. For the 100 and 160µm widths wequote the error of the mean of measurements from five differentfields.
All PEP blank fields benefit from extensive multi-wavelength coverage that is allowing guided extraction basedon source positions at shorter wavelengths, where the depthandresolution of the observations are higher. This approach resolvesmost of the blending issues encountered in dense fields and al-lows straightforward multi-wavelength association (Magnelli etal. 2009, 2011; Roseboom et al. 2010). However, to use thispowerful method, prior source catalogs have to contain all thesources in the PACS images. Deep MIPS 24µm observations,available for all our blank fields, should fulfill this criterionsince they have higher resolution and are deeper than our cur-rent PACS observations. Moreover, since the 24µm emission isstrongly correlated with the far-infrared emission, thosecatalogswill not contain a large excess of sources without far-infraredcounterparts. This largely avoids deblending far-infrared sourcesinto several unrealistic counterparts, as could happen when usingan optical prior catalog with very high source density. Figure 5illustrates the validity of the MIPS 24µm observations as PACSprior source positions.
At 100 µm, models and observations predict typical PACS-to-MIPS flux ratios in the range 5-50. A MIPS 24µm catalog 50times deeper than the PACS observations is thus suited to per-form guided source extraction. This is illustrated, for GOODS-S,in the left panel of Figure 5, where the observed PACS popula-tion lies well-below the boundary of the parameter space reach-able by the MIPS 24µm catalog. In all our blank fields, deepMIPS 24 µm catalogs fulfill this criterion (i.e., GOODS-S/N,COSMOS, LH, ECDFS, EGS. . . ).
At 160µm, models and observations have typical PACS-to-MIPS flux ratios in the range 15-150. In all but one field, the deepMIPS 24µm observations are at least 150 times deeper than ourPACS observations; thus, they can be used as prior source posi-tions. In GOODS-S, the deepest MIPS 24µm observations areonly 100 times deeper than our PACS observations. This limita-tion can be observed, in theright panel of Figure 5, as a slighttruncation, at faint 160µm flux density, of the high-end of thedispersion of the PACS-to-MIPS flux ratio. This truncation willintroduce, at faint flux density, incompleteness in our prior cata-log. However, we also observe that even at this faint 160µm fluxdensity, the bulk of the population has a PACS-to-MIPS flux ra-tio of ∼ 60. The incompleteness introduced by the lack of MIPS24 µm priors should thus be low or at least lower than the in-completeness introduced by source extraction methods at suchlow S/N. This was checked by comparing the GOODS-S 160µm catalog obtained using blind source extraction with that ob-tained using guided source extraction: we find no significantdif-ference, at faint 160µm flux densities, in the number of sources
2 accompanying PACS ICC document PICC-ME-TN-033 version 0.3
in those two catalogs. In line with these finding, Magdis et al.(in prep) find very low fractions of 24µm undetected sources invery deep data from the GOODS-Herschel key program,< 2%for ratios of detection limits S(100)/S(24)>43 and< 1% forS(160)/S(24)>130.
Therefore, for all fields with deep MIPS 24µm observations,we also extract source catalogs with a PSF-fitting method using24 µm source positions as priors and following the method de-scribed in Magnelli et al. (2009). We used the same PSFs andaperture corrections as for the blind source extraction. Blind andprior catalogs were compared to verify the consistency betweenthose two methods.
Completeness, fraction of spurious sources and flux relia-bility were estimated by running Monte Carlo simulations. Upto 10000 artificial sources were added to PACS science maps,and then extracted with the same techniques and configurationsadopted for real source extraction. In order to avoid crowding,many such frames were created, each including a limited num-ber of artificial sources. The number of frames and the numberof sources added in each one depend on the size of the field un-der analysis and range between 20 and 500 sources (GOODSfields or COSMOS) per frame, repeated up to reaching the totalof 10000. These synthetic sources cover a large range in flux,extending down to 0.5σ (σ being the measured rms noise in thePACS maps). The flux distribution follows the detected num-ber counts, extrapolated to fainter level by means of the mostsuccessful fitting backward evolutionary model predictions (seeBerta et al. 2011). Sources are modelled using the Vesta PSF,manipulated as described above.
Figure 6 shows an example of results in the GOODS-Nfield at 160µm. Completeness is defined here as the fractionof sources that have been detected with a photometric accuracyof at least 50% (Papovich et al. 2004). Spurious sources are de-fined as those extracted above 3σ with an input flux lower than3σ(Image). The systematic flux boosting in the blind extractionis corrected in the final blind catalog on the basis of these simu-lations.
Noise was estimated by extracting fluxes through 10000apertures randomly positioned on residual maps. Figure 7 showsthe distribution of the extracted fluxes, peaking around zero,as expected for a well subtracted background, and showing aGaussian profile.
5. Science demonstration phase data
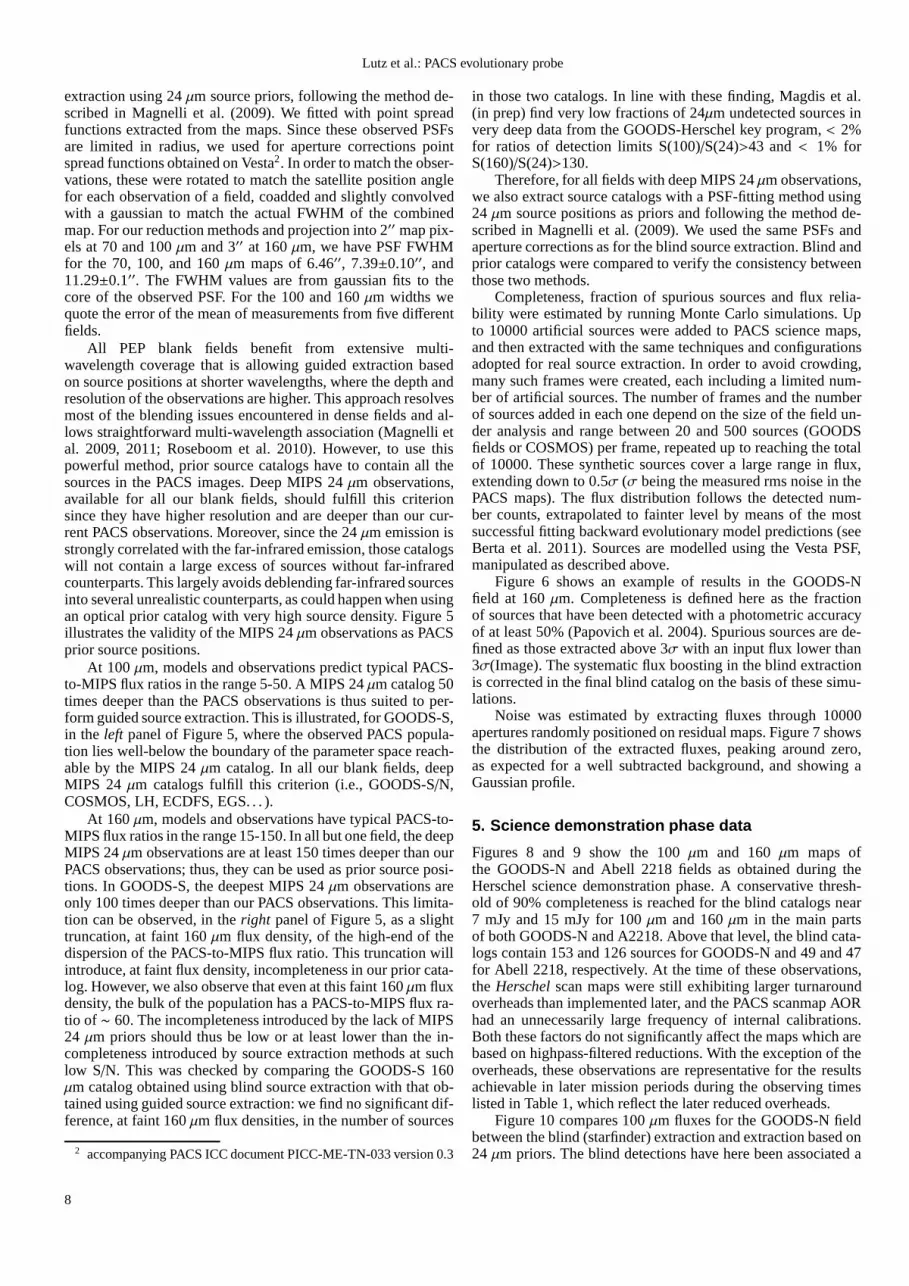
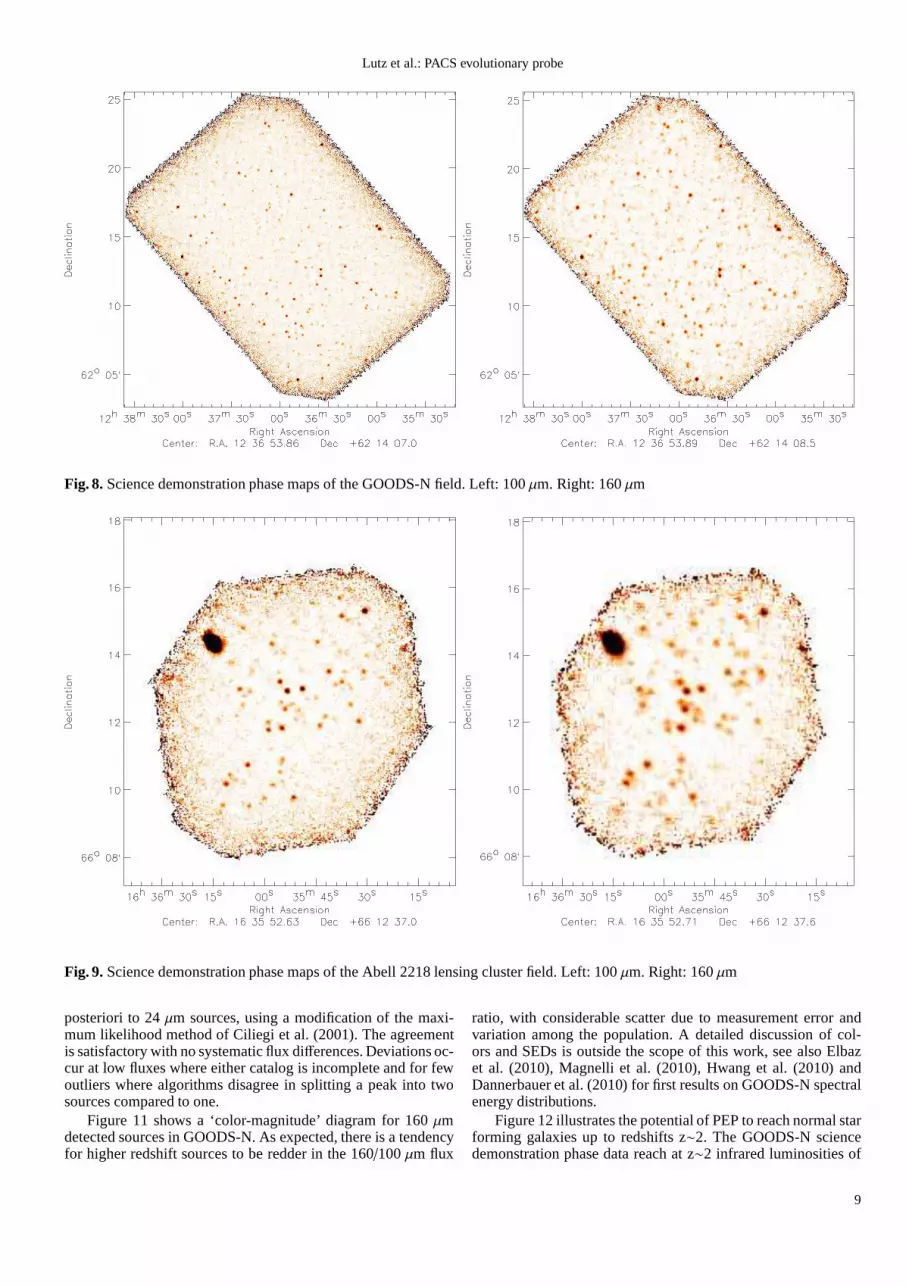
Figures 8 and 9 show the 100µm and 160µm maps ofthe GOODS-N and Abell 2218 fields as obtained during theHerschel science demonstration phase. A conservative thresh-old of 90% completeness is reached for the blind catalogs near7 mJy and 15 mJy for 100µm and 160µm in the main partsof both GOODS-N and A2218. Above that level, the blind cata-logs contain 153 and 126 sources for GOODS-N and 49 and 47for Abell 2218, respectively. At the time of these observations,the Herschel scan maps were still exhibiting larger turnaroundoverheads than implemented later, and the PACS scanmap AORhad an unnecessarily large frequency of internal calibrations.Both these factors do not significantly affect the maps which arebased on highpass-filtered reductions. With the exception of theoverheads, these observations are representative for the resultsachievable in later mission periods during the observing timeslisted in Table 1, which reflect the later reduced overheads.
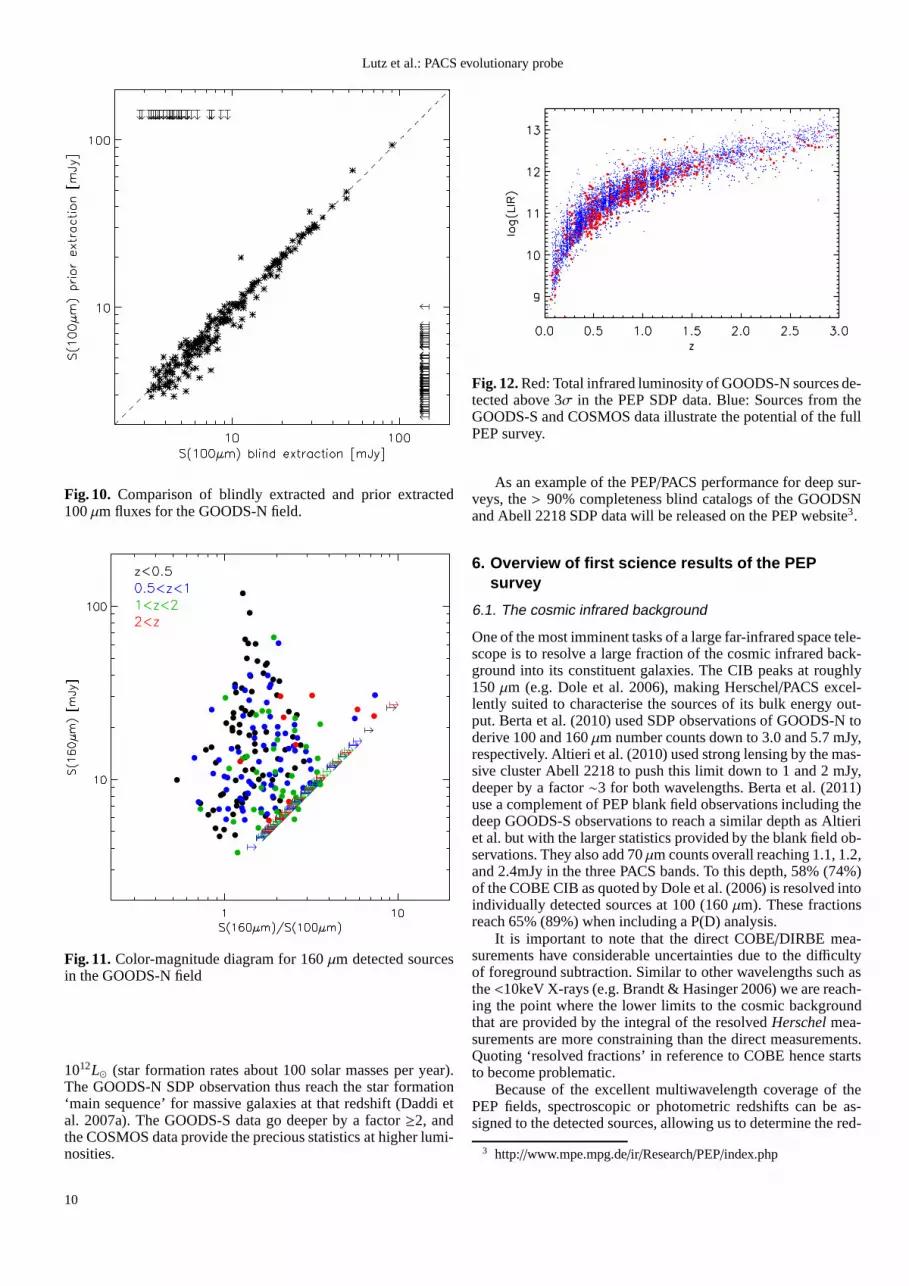
Figure 10 compares 100µm fluxes for the GOODS-N fieldbetween the blind (starfinder) extraction and extraction based on24 µm priors. The blind detections have here been associated a
8
Lutz et al.: PACS evolutionary probe
Fig. 8.Science demonstration phase maps of the GOODS-N field. Left:100µm. Right: 160µm
Fig. 9.Science demonstration phase maps of the Abell 2218 lensing cluster field. Left: 100µm. Right: 160µm
posteriori to 24µm sources, using a modification of the maxi-mum likelihood method of Ciliegi et al. (2001). The agreementis satisfactory with no systematic flux differences. Deviations oc-cur at low fluxes where either catalog is incomplete and for fewoutliers where algorithms disagree in splitting a peak intotwosources compared to one.
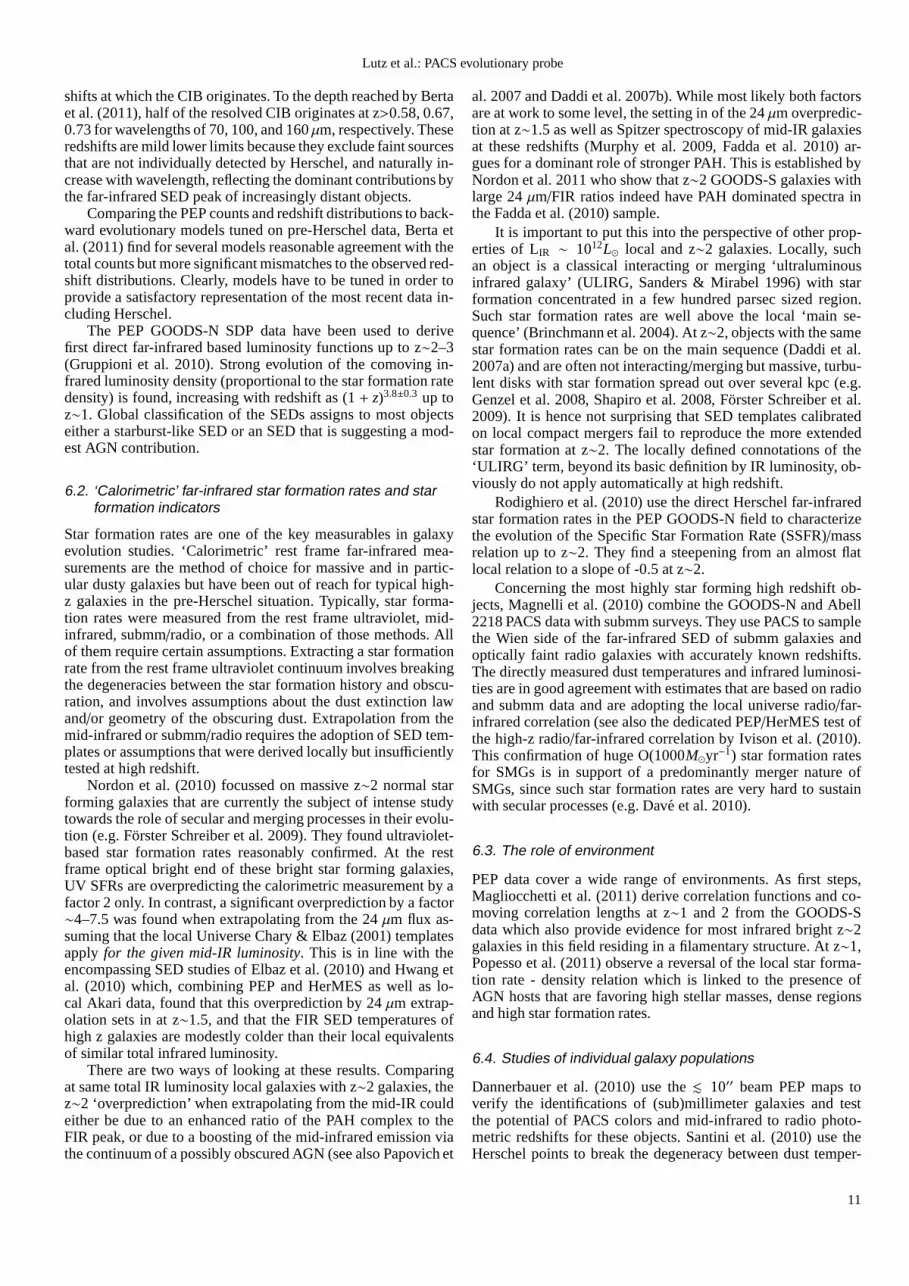
Figure 11 shows a ‘color-magnitude’ diagram for 160µmdetected sources in GOODS-N. As expected, there is a tendencyfor higher redshift sources to be redder in the 160/100µm flux
ratio, with considerable scatter due to measurement error andvariation among the population. A detailed discussion of col-ors and SEDs is outside the scope of this work, see also Elbazet al. (2010), Magnelli et al. (2010), Hwang et al. (2010) andDannerbauer et al. (2010) for first results on GOODS-N spectralenergy distributions.
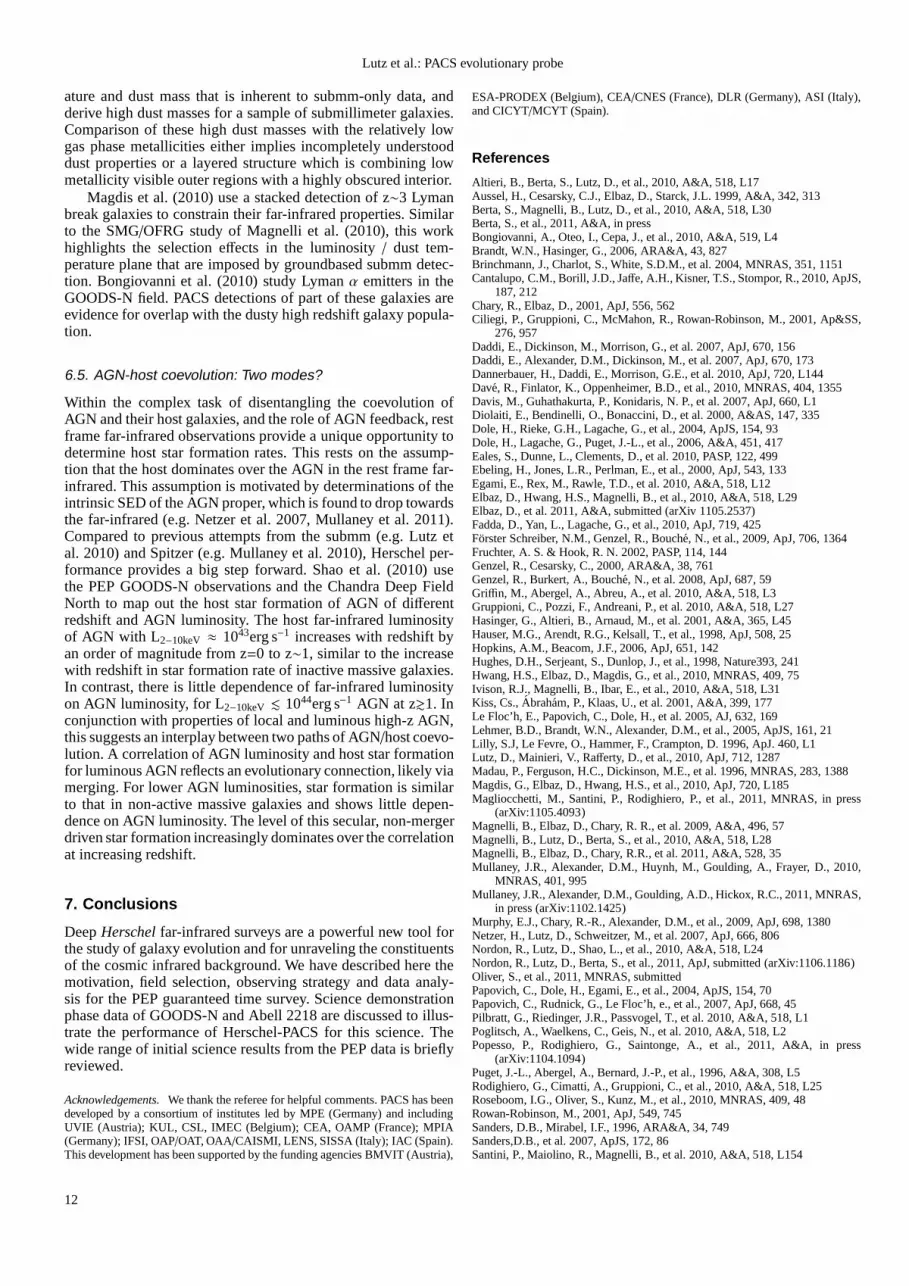
Figure 12 illustrates the potential of PEP to reach normal starforming galaxies up to redshifts z∼2. The GOODS-N sciencedemonstration phase data reach at z∼2 infrared luminosities of
9
Lutz et al.: PACS evolutionary probe
Fig. 10. Comparison of blindly extracted and prior extracted100µm fluxes for the GOODS-N field.
Fig. 11.Color-magnitude diagram for 160µm detected sourcesin the GOODS-N field
1012L⊙ (star formation rates about 100 solar masses per year).The GOODS-N SDP observation thus reach the star formation‘main sequence’ for massive galaxies at that redshift (Daddi etal. 2007a). The GOODS-S data go deeper by a factor≥2, andthe COSMOS data provide the precious statistics at higher lumi-nosities.
Fig. 12.Red: Total infrared luminosity of GOODS-N sources de-tected above 3σ in the PEP SDP data. Blue: Sources from theGOODS-S and COSMOS data illustrate the potential of the fullPEP survey.
As an example of the PEP/PACS performance for deep sur-veys, the> 90% completeness blind catalogs of the GOODSNand Abell 2218 SDP data will be released on the PEP website3.
6. Overview of first science results of the PEPsurvey
6.1. The cosmic infrared background
One of the most imminent tasks of a large far-infrared space tele-scope is to resolve a large fraction of the cosmic infrared back-ground into its constituent galaxies. The CIB peaks at roughly150 µm (e.g. Dole et al. 2006), making Herschel/PACS excel-lently suited to characterise the sources of its bulk energyout-put. Berta et al. (2010) used SDP observations of GOODS-N toderive 100 and 160µm number counts down to 3.0 and 5.7 mJy,respectively. Altieri et al. (2010) used strong lensing by the mas-sive cluster Abell 2218 to push this limit down to 1 and 2 mJy,deeper by a factor∼3 for both wavelengths. Berta et al. (2011)use a complement of PEP blank field observations including thedeep GOODS-S observations to reach a similar depth as Altieriet al. but with the larger statistics provided by the blank field ob-servations. They also add 70µm counts overall reaching 1.1, 1.2,and 2.4mJy in the three PACS bands. To this depth, 58% (74%)of the COBE CIB as quoted by Dole et al. (2006) is resolved intoindividually detected sources at 100 (160µm). These fractionsreach 65% (89%) when including a P(D) analysis.
It is important to note that the direct COBE/DIRBE mea-surements have considerable uncertainties due to the difficultyof foreground subtraction. Similar to other wavelengths such asthe<10keV X-rays (e.g. Brandt & Hasinger 2006) we are reach-ing the point where the lower limits to the cosmic backgroundthat are provided by the integral of the resolvedHerschel mea-surements are more constraining than the direct measurements.Quoting ‘resolved fractions’ in reference to COBE hence startsto become problematic.
Because of the excellent multiwavelength coverage of thePEP fields, spectroscopic or photometric redshifts can be as-signed to the detected sources, allowing us to determine thered-
3 http://www.mpe.mpg.de/ir/Research/PEP/index.php
10
Lutz et al.: PACS evolutionary probe
shifts at which the CIB originates. To the depth reached by Bertaet al. (2011), half of the resolved CIB originates at z>0.58, 0.67,0.73 for wavelengths of 70, 100, and 160µm, respectively. Theseredshifts are mild lower limits because they exclude faint sourcesthat are not individually detected by Herschel, and naturally in-crease with wavelength, reflecting the dominant contributions bythe far-infrared SED peak of increasingly distant objects.
Comparing the PEP counts and redshift distributions to back-ward evolutionary models tuned on pre-Herschel data, Bertaetal. (2011) find for several models reasonable agreement withthetotal counts but more significant mismatches to the observedred-shift distributions. Clearly, models have to be tuned in order toprovide a satisfactory representation of the most recent data in-cluding Herschel.
The PEP GOODS-N SDP data have been used to derivefirst direct far-infrared based luminosity functions up to z∼2–3(Gruppioni et al. 2010). Strong evolution of the comoving in-frared luminosity density (proportional to the star formation ratedensity) is found, increasing with redshift as (1+ z)3.8±0.3 up toz∼1. Global classification of the SEDs assigns to most objectseither a starburst-like SED or an SED that is suggesting a mod-est AGN contribution.
6.2. ‘Calorimetric’ far-infrared star formation rates and starformation indicators
Star formation rates are one of the key measurables in galaxyevolution studies. ‘Calorimetric’ rest frame far-infrared mea-surements are the method of choice for massive and in partic-ular dusty galaxies but have been out of reach for typical high-z galaxies in the pre-Herschel situation. Typically, star forma-tion rates were measured from the rest frame ultraviolet, mid-infrared, submm/radio, or a combination of those methods. Allof them require certain assumptions. Extracting a star formationrate from the rest frame ultraviolet continuum involves breakingthe degeneracies between the star formation history and obscu-ration, and involves assumptions about the dust extinctionlawand/or geometry of the obscuring dust. Extrapolation from themid-infrared or submm/radio requires the adoption of SED tem-plates or assumptions that were derived locally but insufficientlytested at high redshift.
Nordon et al. (2010) focussed on massive z∼2 normal starforming galaxies that are currently the subject of intense studytowards the role of secular and merging processes in their evolu-tion (e.g. Forster Schreiber et al. 2009). They found ultraviolet-based star formation rates reasonably confirmed. At the restframe optical bright end of these bright star forming galaxies,UV SFRs are overpredicting the calorimetric measurement byafactor 2 only. In contrast, a significant overprediction by afactor∼4–7.5 was found when extrapolating from the 24µm flux as-suming that the local Universe Chary & Elbaz (2001) templatesapply for the given mid-IR luminosity. This is in line with theencompassing SED studies of Elbaz et al. (2010) and Hwang etal. (2010) which, combining PEP and HerMES as well as lo-cal Akari data, found that this overprediction by 24µm extrap-olation sets in at z∼1.5, and that the FIR SED temperatures ofhigh z galaxies are modestly colder than their local equivalentsof similar total infrared luminosity.
There are two ways of looking at these results. Comparingat same total IR luminosity local galaxies with z∼2 galaxies, thez∼2 ‘overprediction’ when extrapolating from the mid-IR couldeither be due to an enhanced ratio of the PAH complex to theFIR peak, or due to a boosting of the mid-infrared emission viathe continuum of a possibly obscured AGN (see also Papovich et
al. 2007 and Daddi et al. 2007b). While most likely both factorsare at work to some level, the setting in of the 24µm overpredic-tion at z∼1.5 as well as Spitzer spectroscopy of mid-IR galaxiesat these redshifts (Murphy et al. 2009, Fadda et al. 2010) ar-gues for a dominant role of stronger PAH. This is establishedbyNordon et al. 2011 who show that z∼2 GOODS-S galaxies withlarge 24µm/FIR ratios indeed have PAH dominated spectra inthe Fadda et al. (2010) sample.
It is important to put this into the perspective of other prop-erties of LIR ∼ 1012L⊙ local and z∼2 galaxies. Locally, suchan object is a classical interacting or merging ‘ultraluminousinfrared galaxy’ (ULIRG, Sanders & Mirabel 1996) with starformation concentrated in a few hundred parsec sized region.Such star formation rates are well above the local ‘main se-quence’ (Brinchmann et al. 2004). At z∼2, objects with the samestar formation rates can be on the main sequence (Daddi et al.2007a) and are often not interacting/merging but massive, turbu-lent disks with star formation spread out over several kpc (e.g.Genzel et al. 2008, Shapiro et al. 2008, Forster Schreiber et al.2009). It is hence not surprising that SED templates calibratedon local compact mergers fail to reproduce the more extendedstar formation at z∼2. The locally defined connotations of the‘ULIRG’ term, beyond its basic definition by IR luminosity, ob-viously do not apply automatically at high redshift.
Rodighiero et al. (2010) use the direct Herschel far-infraredstar formation rates in the PEP GOODS-N field to characterizethe evolution of the Specific Star Formation Rate (SSFR)/massrelation up to z∼2. They find a steepening from an almost flatlocal relation to a slope of -0.5 at z∼2.
Concerning the most highly star forming high redshift ob-jects, Magnelli et al. (2010) combine the GOODS-N and Abell2218 PACS data with submm surveys. They use PACS to samplethe Wien side of the far-infrared SED of submm galaxies andoptically faint radio galaxies with accurately known redshifts.The directly measured dust temperatures and infrared luminosi-ties are in good agreement with estimates that are based on radioand submm data and are adopting the local universe radio/far-infrared correlation (see also the dedicated PEP/HerMES test ofthe high-z radio/far-infrared correlation by Ivison et al. (2010).This confirmation of huge O(1000M⊙yr−1) star formation ratesfor SMGs is in support of a predominantly merger nature ofSMGs, since such star formation rates are very hard to sustainwith secular processes (e.g. Dave et al. 2010).
6.3. The role of environment
PEP data cover a wide range of environments. As first steps,Magliocchetti et al. (2011) derive correlation functions and co-moving correlation lengths at z∼1 and 2 from the GOODS-Sdata which also provide evidence for most infrared bright z∼2galaxies in this field residing in a filamentary structure. Atz∼1,Popesso et al. (2011) observe a reversal of the local star forma-tion rate - density relation which is linked to the presence ofAGN hosts that are favoring high stellar masses, dense regionsand high star formation rates.
6.4. Studies of individual galaxy populations
Dannerbauer et al. (2010) use the. 10′′ beam PEP maps toverify the identifications of (sub)millimeter galaxies andtestthe potential of PACS colors and mid-infrared to radio photo-metric redshifts for these objects. Santini et al. (2010) use theHerschel points to break the degeneracy between dust temper-
11
Lutz et al.: PACS evolutionary probe
ature and dust mass that is inherent to submm-only data, andderive high dust masses for a sample of submillimeter galaxies.Comparison of these high dust masses with the relatively lowgas phase metallicities either implies incompletely understooddust properties or a layered structure which is combining lowmetallicity visible outer regions with a highly obscured interior.
Magdis et al. (2010) use a stacked detection of z∼3 Lymanbreak galaxies to constrain their far-infrared properties. Similarto the SMG/OFRG study of Magnelli et al. (2010), this workhighlights the selection effects in the luminosity/ dust tem-perature plane that are imposed by groundbased submm detec-tion. Bongiovanni et al. (2010) study Lymanα emitters in theGOODS-N field. PACS detections of part of these galaxies areevidence for overlap with the dusty high redshift galaxy popula-tion.
6.5. AGN-host coevolution: Two modes?
Within the complex task of disentangling the coevolution ofAGN and their host galaxies, and the role of AGN feedback, restframe far-infrared observations provide a unique opportunity todetermine host star formation rates. This rests on the assump-tion that the host dominates over the AGN in the rest frame far-infrared. This assumption is motivated by determinations of theintrinsic SED of the AGN proper, which is found to drop towardsthe far-infrared (e.g. Netzer et al. 2007, Mullaney et al. 2011).Compared to previous attempts from the submm (e.g. Lutz etal. 2010) and Spitzer (e.g. Mullaney et al. 2010), Herschel per-formance provides a big step forward. Shao et al. (2010) usethe PEP GOODS-N observations and the Chandra Deep FieldNorth to map out the host star formation of AGN of differentredshift and AGN luminosity. The host far-infrared luminosityof AGN with L2−10keV ≈ 1043erg s−1 increases with redshift byan order of magnitude from z=0 to z∼1, similar to the increasewith redshift in star formation rate of inactive massive galaxies.In contrast, there is little dependence of far-infrared luminosityon AGN luminosity, for L2−10keV . 1044erg s−1 AGN at z&1. Inconjunction with properties of local and luminous high-z AGN,this suggests an interplay between two paths of AGN/host coevo-lution. A correlation of AGN luminosity and host star formationfor luminous AGN reflects an evolutionary connection, likely viamerging. For lower AGN luminosities, star formation is similarto that in non-active massive galaxies and shows little depen-dence on AGN luminosity. The level of this secular, non-mergerdriven star formation increasingly dominates over the correlationat increasing redshift.
7. Conclusions
DeepHerschel far-infrared surveys are a powerful new tool forthe study of galaxy evolution and for unraveling the constituentsof the cosmic infrared background. We have described here themotivation, field selection, observing strategy and data analy-sis for the PEP guaranteed time survey. Science demonstrationphase data of GOODS-N and Abell 2218 are discussed to illus-trate the performance of Herschel-PACS for this science. Thewide range of initial science results from the PEP data is brieflyreviewed.
Acknowledgements. We thank the referee for helpful comments. PACS has beendeveloped by a consortium of institutes led by MPE (Germany)and includingUVIE (Austria); KUL, CSL, IMEC (Belgium); CEA, OAMP (France); MPIA(Germany); IFSI, OAP/OAT, OAA/CAISMI, LENS, SISSA (Italy); IAC (Spain).This development has been supported by the funding agenciesBMVIT (Austria),
ESA-PRODEX (Belgium), CEA/CNES (France), DLR (Germany), ASI (Italy),and CICYT/MCYT (Spain).
References
Altieri, B., Berta, S., Lutz, D., et al., 2010, A&A, 518, L17Aussel, H., Cesarsky, C.J., Elbaz, D., Starck, J.L. 1999, A&A, 342, 313Berta, S., Magnelli, B., Lutz, D., et al., 2010, A&A, 518, L30Berta, S., et al., 2011, A&A, in pressBongiovanni, A., Oteo, I., Cepa, J., et al., 2010, A&A, 519, L4Brandt, W.N., Hasinger, G., 2006, ARA&A, 43, 827Brinchmann, J., Charlot, S., White, S.D.M., et al. 2004, MNRAS, 351, 1151Cantalupo, C.M., Borill, J.D., Jaffe, A.H., Kisner, T.S., Stompor, R., 2010, ApJS,
187, 212Chary, R., Elbaz, D., 2001, ApJ, 556, 562Ciliegi, P., Gruppioni, C., McMahon, R., Rowan-Robinson, M., 2001, Ap&SS,
276, 957Daddi, E., Dickinson, M., Morrison, G., et al. 2007, ApJ, 670, 156Daddi, E., Alexander, D.M., Dickinson, M., et al. 2007, ApJ,670, 173Dannerbauer, H., Daddi, E., Morrison, G.E., et al. 2010, ApJ, 720, L144Dave, R., Finlator, K., Oppenheimer, B.D., et al., 2010, MNRAS, 404, 1355Davis, M., Guhathakurta, P., Konidaris, N. P., et al. 2007, ApJ, 660, L1Diolaiti, E., Bendinelli, O., Bonaccini, D., et al. 2000, A&AS, 147, 335Dole, H., Rieke, G.H., Lagache, G., et al., 2004, ApJS, 154, 93Dole, H., Lagache, G., Puget, J.-L., et al., 2006, A&A, 451, 417Eales, S., Dunne, L., Clements, D., et al. 2010, PASP, 122, 499Ebeling, H., Jones, L.R., Perlman, E., et al., 2000, ApJ, 543, 133Egami, E., Rex, M., Rawle, T.D., et al. 2010, A&A, 518, L12Elbaz, D., Hwang, H.S., Magnelli, B., et al., 2010, A&A, 518,L29Elbaz, D., et al. 2011, A&A, submitted (arXiv 1105.2537)Fadda, D., Yan, L., Lagache, G., et al., 2010, ApJ, 719, 425Forster Schreiber, N.M., Genzel, R., Bouche, N., et al., 2009, ApJ, 706, 1364Fruchter, A. S. & Hook, R. N. 2002, PASP, 114, 144Genzel, R., Cesarsky, C., 2000, ARA&A, 38, 761Genzel, R., Burkert, A., Bouche, N., et al. 2008, ApJ, 687, 59Griffin, M., Abergel, A., Abreu, A., et al. 2010, A&A, 518, L3Gruppioni, C., Pozzi, F., Andreani, P., et al. 2010, A&A, 518, L27Hasinger, G., Altieri, B., Arnaud, M., et al. 2001, A&A, 365,L45Hauser, M.G., Arendt, R.G., Kelsall, T., et al., 1998, ApJ, 508, 25Hopkins, A.M., Beacom, J.F., 2006, ApJ, 651, 142Hughes, D.H., Serjeant, S., Dunlop, J., et al., 1998, Nature393, 241Hwang, H.S., Elbaz, D., Magdis, G., et al., 2010, MNRAS, 409,75Ivison, R.J., Magnelli, B., Ibar, E., et al., 2010, A&A, 518,L31Kiss, Cs.,Abraham, P., Klaas, U., et al. 2001, A&A, 399, 177Le Floc’h, E., Papovich, C., Dole, H., et al. 2005, AJ, 632, 169Lehmer, B.D., Brandt, W.N., Alexander, D.M., et al., 2005, ApJS, 161, 21Lilly, S.J, Le Fevre, O., Hammer, F., Crampton, D. 1996, ApJ.460, L1Lutz, D., Mainieri, V., Rafferty, D., et al., 2010, ApJ, 712, 1287Madau, P., Ferguson, H.C., Dickinson, M.E., et al. 1996, MNRAS, 283, 1388Magdis, G., Elbaz, D., Hwang, H.S., et al., 2010, ApJ, 720, L185Magliocchetti, M., Santini, P., Rodighiero, P., et al., 2011, MNRAS, in press
(arXiv:1105.4093)Magnelli, B., Elbaz, D., Chary, R. R., et al. 2009, A&A, 496, 57Magnelli, B., Lutz, D., Berta, S., et al., 2010, A&A, 518, L28Magnelli, B., Elbaz, D., Chary, R.R., et al. 2011, A&A, 528, 35Mullaney, J.R., Alexander, D.M., Huynh, M., Goulding, A., Frayer, D., 2010,
MNRAS, 401, 995Mullaney, J.R., Alexander, D.M., Goulding, A.D., Hickox, R.C., 2011, MNRAS,
in press (arXiv:1102.1425)Murphy, E.J., Chary, R.-R., Alexander, D.M., et al., 2009, ApJ, 698, 1380Netzer, H., Lutz, D., Schweitzer, M., et al. 2007, ApJ, 666, 806Nordon, R., Lutz, D., Shao, L., et al., 2010, A&A, 518, L24Nordon, R., Lutz, D., Berta, S., et al., 2011, ApJ, submitted(arXiv:1106.1186)Oliver, S., et al., 2011, MNRAS, submittedPapovich, C., Dole, H., Egami, E., et al., 2004, ApJS, 154, 70Papovich, C., Rudnick, G., Le Floc’h, e., et al., 2007, ApJ, 668, 45Pilbratt, G., Riedinger, J.R., Passvogel, T., et al. 2010, A&A, 518, L1Poglitsch, A., Waelkens, C., Geis, N., et al. 2010, A&A, 518,L2Popesso, P., Rodighiero, G., Saintonge, A., et al., 2011, A&A, in press
(arXiv:1104.1094)Puget, J.-L., Abergel, A., Bernard, J.-P., et al., 1996, A&A, 308, L5Rodighiero, G., Cimatti, A., Gruppioni, C., et al., 2010, A&A, 518, L25Roseboom, I.G., Oliver, S., Kunz, M., et al., 2010, MNRAS, 409, 48Rowan-Robinson, M., 2001, ApJ, 549, 745Sanders, D.B., Mirabel, I.F., 1996, ARA&A, 34, 749Sanders,D.B., et al. 2007, ApJS, 172, 86Santini, P., Maiolino, R., Magnelli, B., et al. 2010, A&A, 518, L154
12
Lutz et al.: PACS evolutionary probe
Scoville, N., Aussel, H., Brusa, M., et al. 2007, ApJS, 172, 1Shao, L., Lutz, D., Nordon, R., et al., 2010, A&A, 518, L26Shapiro, K.L., Genzel, R., Forster Schreiber, N.M., et al., 2008, ApJ, 682, 231Soifer, B.T., Helou, G., Werner, M. 2008, ARA&A, 46, 201Starck, J. & Murtagh, F. 1998,PASP, 110, 193Tran, K.H., Kelson, D.D., van Dokkum, P., et al., 1999, ApJ, 522, 39Wieprecht, E., et al. 2009, ADASS XVIII, eds. D. Bohlender, D. Durand and P.
Dowler, ASP Conference Series 411, 531
13