paco: probability-based path confidence prediction
TRANSCRIPT
Reprinted from Intl Symp High Performance Computer Architecture (HPCA-14):999-999, c©2008 IEEE. Personal use of this material is
permitted. However, permission to reprint/republish this material for advertising or promotional purposes or for creating new collective
works for resale or redistribution to servers or lists, or to reuse any copyrighted component of this work in other works must be obtained
from the IEEE.
PaCo: Probability-based Path Confidence Prediction
Kshitiz Malik, Mayank Agarwal, Vikram Dhar and Matthew I. Frank
Coordinated Science Laboratory
University of Illinois at Urbana-Champaign
{kmalik1,magarwa2,vdhar2,mif}@uiuc.edu
Abstract
A path confidence estimate indicates the likelihood that
the processor is currently fetching correct path instruc-
tions. Accurate path confidence prediction is critical for
applications like pipeline gating and confidence-based SMT
fetch prioritization. Previous work in this domain uses a
threshold-and-count predictor, where the number of unre-
solved, low-confidence branches serves as an estimate of
path confidence. This approach is inaccurate since it im-
plicitly assumes that all low-confidence branches have the
same mispredict rate, and that high-confidence branches
never mispredict. We propose an alternative path confi-
dence predictor designed from first principles, called PaCo,
that directly estimates the probability that the processor
is on the goodpath, and considers contributions from all
branches, both high and low confidence. Even though it
uses only modest hardware, PaCo can estimate the proces-
sor’s goodpath likelihood with very high accuracy, with an
RMS error of 3.8%.
We show that PaCo significantly outperforms threshold-
and-count predictors in pipeline gating and SMT fetch pri-
oritization. In pipeline gating, while the best conventional
predictor can reduce badpath instructions executed by 7%
with a small loss in performance, PaCo can reduce bad-
path instructions by 32% without any performance loss.
In SMT fetch prioritization, using PaCo instead of conven-
tional path confidence predictors improves performance by
up to 23%, and 5.5% on average.
1 Introduction
Branch confidence predictors [8, 19, 7] identify branches
that have a relatively high likelihood of misprediction.
Branch confidence prediction can be used to derive a path
confidence estimate, which indicates the likelihood that the
processor is fetching correct path instructions. Path confi-
dence prediction has a number of applications. For exam-
ple, SMT processors can use it to allocate fetch bandwidth
to threads that are more likely to fetch goodpath instruc-
tions [12, 13]. Path confidence estimates can also be used to
reduce power by gating instruction fetch when the processor
is unlikely to be on the correct path [15, 3], and to reduce
cache pollution caused by mispredicted instructions [4]
Conventional path confidence predictors use the count
of unresolved, low-confidence branches as an estimate of
path confidence. In other words, it is implicitly assumed
that all low-confidence branches have the same mispredic-
tion rate, while high-confidence branches never mispredict
at all. We find that because of these two approximations, the
same path confidence can represent vastly different good-
path likelihoods across different benchmarks, and across
different phases of the same benchmark.
The contributions of this paper include, first, the pro-
posal of using misprediction probabilities of branches to
compute path confidence. We show that a path confidence
predictor can directly produce the probability that the pro-
cessor is on goodpath.
Second, we present a simple yet highly accurate hard-
ware implementation of such a path confidence predictor,
called PaCo. PaCo uses logarithms to convert floating point
multiplication and division into integer addition and sub-
traction. It uses less than 60 bytes worth of small counters,
and a 10-bit shift register to produce goodpath likelihood
estimates. We find that for the SPEC2000 integer bench-
marks, the goodpath likelihood provided by PaCo is highly
accurate, with an RMS error of 3.8%.
Third, we evaluate PaCo’s performance in two applica-
tions of path confidence: pipeline gating and SMT fetch pri-
oritization, and compare it with the performance of con-
ventional counter-based predictors. We show that PaCo
performs significantly better than traditional predictors in
both these applications. In pipeline gating, PaCo can re-
duce the number of badpath instructions executed by the
processor by 32%, with only a 0.01% reduction in perfor-
mance. On the other hand, the best conventional path con-
fidence predictor can only reduce the number of badpath
instructions by 7%, with a 0.1% loss in performance. With
respect to SMT fetch prioritization, using PaCo instead of
traditional threshold-and-count predictors improves perfor-
mance by up to 23%, and 5.5% on average.
1
2 Motivation
This section describes the current state of the art in
branch confidence prediction and path confidence predic-
tion. While current branch confidence predictors are good at
qualitatively classifying branches as high or low confidence,
they do not do a good job of estimating the probability that
a particular branch will be predicted correctly. Similarly,
while current path confidence predictors qualitatively clas-
sify the current state of the fetch unit, they do not estimate
the important metric: the probability with which the fetch
unit is fetching instructions that will eventually retire.
2.1 Branch Confidence Prediction
Modern processors use branch prediction to speculate past
control hazards. Branch confidence prediction is the pro-
cess of qualitatively classifying particular dynamic predic-
tions made by a branch predictor as likely correct (high con-
fidence) or likely incorrect (low confidence) [8].
Branch confidence prediction is useful for a number of
purposes. For example, it has been proposed that multi-
path processors [20, 11] fetch instructions from both tar-
gets of a low-confidence branch, to eliminate mispredic-
tion penalties. Additionally, checkpoint-repair based pro-
cessors could create checkpoints of the processor’s register
alias table (RAT) only when low-confidence branches are
renamed [1].
Jacobsen et al [8] proposed the JRS branch confidence
predictor, which leverages the insight that most mispredicts
can be attributed to a relatively small set of branches; a ma-
jority of branches almost never mispredict. In particular, if
a branch was mispredicted in the recent past, it is likely to
be mispredicted again. To identify branches that were mis-
predicted in the recent past, the JRS predictor uses a table
of 4-bit saturating miss-distance counters (MDCs). The ta-
ble entry corresponding to a particular branch is found by
XOR-ing the branch PC with the global branch history. The
table entry (an MDC) is incremented every time the branch
is correctly predicted, and is reset to zero when the branch is
mispredicted. Thus, the MDC stores the number of consec-
utive correct predictions seen by a branch. For example, an
MDC value of 10 indicates that the corresponding branch
has seen 10 correct predictions, which were preceded by a
mispredict.
The MDC value of a branch is indicative of its pre-
dictability. The higher theMDC value, the more predictable
the branch. Branches whoseMDC value is at or above a cer-
tain threshold (say, 3) are classified as high-confidence (un-
likely to mispredict), while branches with a MDC value less
than the threshold are classified as low-confidence (likely to
mispredict). Thus, with a threshold of 3, branches need to
be predicted correctly three consecutive times before they
are considered high-confidence. Among other branch confi-
dence predictors, Grunwald et al [7] proposed the enhanced
JRS predictor, where the global history used to hash into
the MDC table also includes the predicted direction of the
branch in question. This predictor was shown to be superior
to the original JRS predictor.
2.2 Path Confidence Prediction
The applications mentioned previously, like multi-path pro-
cessing and register file checkpointing, use branch confi-
dence predictors directly: they require information about
a particular branch being low-confidence. Other applica-
tions, however, require aggregate information about all the
branches that are outstanding in the machine. In particular,
these applications require the likelihood that the processor
is fetching correct-path instructions. The probability that a
processor is on the goodpath is indicated by a path confi-
dence estimate.
Applications of path confidence include pipeline gat-
ing [15], which conserves power by completely stopping
instruction fetch when the path confidence estimate is very
low (i.e, the processor is very likely to be fetching bad-
path instructions). Selective throttling [3] improves pipeline
gating by slowly reducing instruction fetch bandwidth as
path confidence decreases. In the context of simultaneously
multi-threaded (SMT) processors, Luo et al [12, 13] pro-
posed giving fetch bandwidth to the thread that has higher
path confidence (and thus more likely to be fetching good-
path instructions). Path confidence can also be used to re-
duce cache-pollution caused by wrong-path instructions [4].
While branch confidence prediction is a mature field that
has been researched extensively, path confidence predic-
tion has not been investigated deeply. Applications like
pipeline gating, selective throttling, SMT fetch prioritiza-
tion and cache-pollution reduction have simply used a count
of unresolved low-confidence branches to classify the cur-
rent path as high or low confidence. In the next section,
we explain why this rough estimation of path confidence is
sub-optimal.
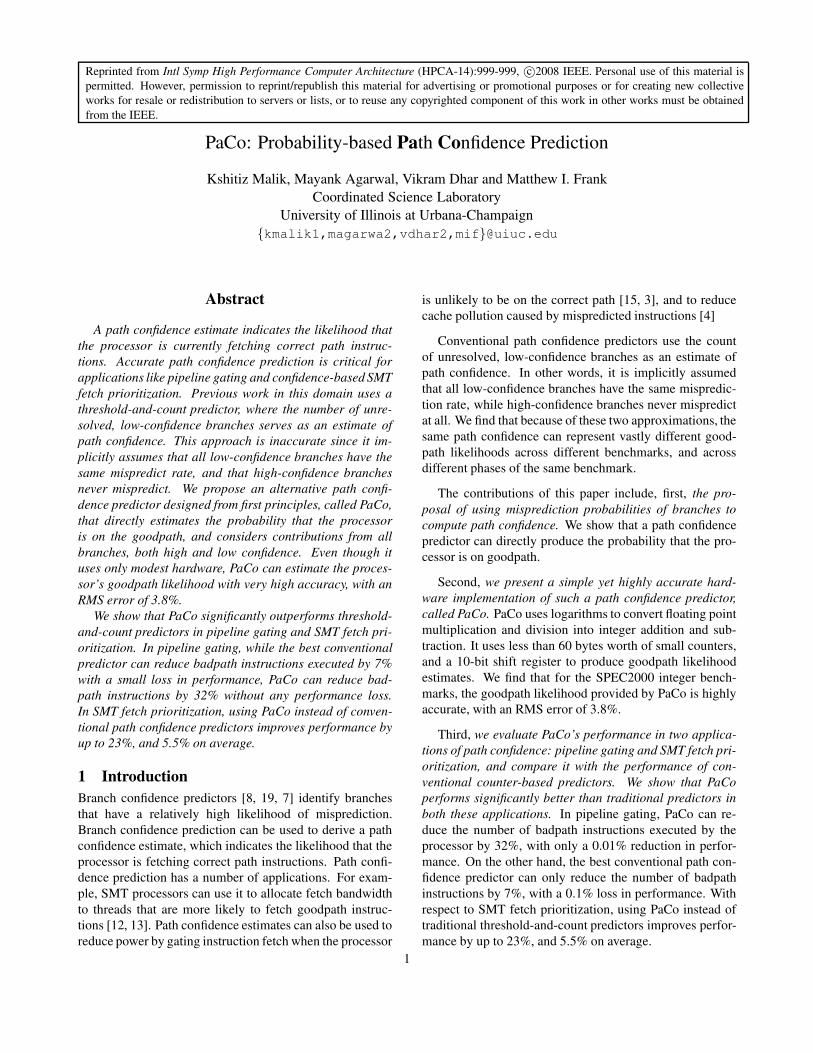
Figure 1 shows a conventional, threshold-and-count path
confidence predictor. When a branch is fetched, the MDC
value corresponding to the branch is read from the JRS ta-
ble. A thresholding function converts this MDC value in a
1 bit high/low-confidence estimate. If the branch is low-
confidence, a counter is incremented. The output of the
counter, which is the number of unresolved, low-confidence
branches is used as a measure of Path Confidence. The
higher the counter value, the lower the likelihood that the
processor is on the goodpath.
2.3 Inefficiencies with threshold-and-count
predictors
Threshold-and-count predictors coarsely map a 4-bit MDC
value to a 1 bit confidence prediction, without considering
the misprediction rate that anMDC value corresponds to. In
the next section, we show that as a result of this coarseness,
Branch
JRS 1-bit branch
confidence predictionJRS
table
Threshold
functionSum
Traditional path
confidence prediction
Miss distance
counter value
Figure 1: Conventional threshold-and-count Path Confidence prediction
Mispredict Rates by JRS Value
0
5
10
15
20
25
30
35
40
45
0 1 2 3 4 5 6 7JRS Value
twolf
vortex
gcc
gzip
Low Conf High Conf
JRS Threshold = 3
Mispredict Rate (percent)
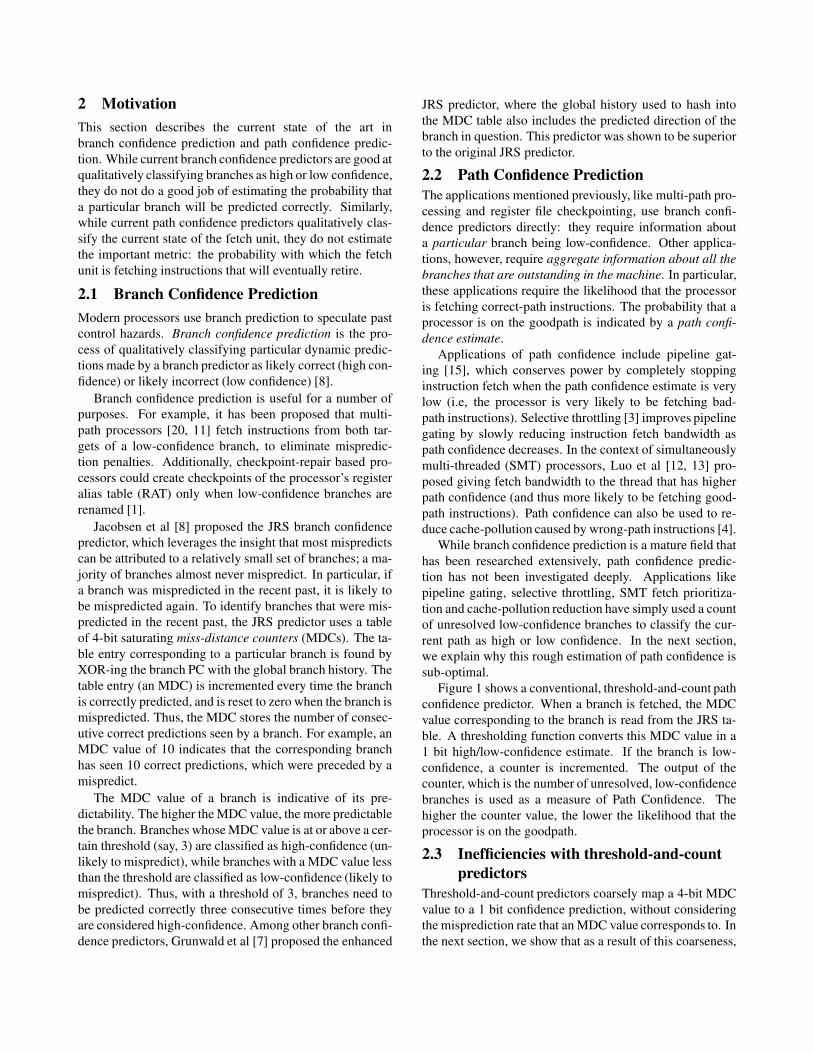
Figure 2: Misprediction Rates of branches with different
MDC values
the number of unresolved low-confidence branches is not an
accurate measure of the probability that the processor is on
the goodpath.
Coarseness
Threshold-and-count predictors make the implicit assump-
tion that all low-confidence branches have the same mispre-
dict rate, while none of the high-confidence branches ever
mispredict. Both of these approximations can lead to inac-
curacies in path confidence estimation.
Treating all low-confidence branches the same can lead
to inaccuracies in path confidence: depending on the MDC
value, different low-confidence branches can have vastly
different misprediction rates, as shown in Figure 2. As-
sume that a confidence threshold of 3 was being used.1 All
branches in the gray area in Figure 2 would be considered
low-confidence. However, the misprediction rates of these
branches vary significantly, both across benchmarks, and
for the same benchmark. For example, the mispredict rate
of a low confidence branch could be as high as 43% (for gcc,
with MDC value 0) or as low as 15%(gcc, with MDC value
2), or 12% (vortex, with MDC value 2). With a fixed thresh-
old based approach to path confidence, these branches with
very different misprediction rates are considered equal.
As an example of how this can be detrimental, consider
SMT fetch prioritization. Assume that gcc and vortex were
being executed together. Further, assume that two branches
in vortex with MDC values of 2 were unresolved, while one
branch with a MDC value of 1 was unresolved in gcc. A
counter-based path confidence estimator would indicate that
gcc has a higher likelihood of being on the goodpath, and
13 is a good threshold to use for for path confidence,as indicated by
our experiments and previous research [2].
thus, more fetch bandwidth should be allocated to gcc. In
reality, however, vortex is much more likely (probability of
goodpath = 0.882 , or 0.78) to fetch goodpath instructions
than gcc (probability of goodpath 0.55)!
Moreover, none of the high-confidence branches affect
path confidence, even though they can have significant mis-
prediction rates. With a threshold of 3, there are high-
confidence branches (twolf and vortex, MDC value 3) that
have a mispredict rate of 21% but don’t affect the proces-
sor’s path confidence.
To summarize, binary branch-confidence mechanisms
classify branches into two categories. Generating path con-
fidence estimates by just using this coarse classification is
not enough.
Counter value does not indicate Goodpath
Probability
As a result of the coarseness introduced by the threshold-
ing mechanism, the count of low-confidence branches is not
a direct measure of the likelihood that the processor is on
the goodpath. This makes it difficult to choose a counter
value for pipeline gating (since the optimal value varies
across benchmarks, and across phases of a single bench-
mark), or to compare counter values of different threads
in an SMT processor to find which one is more likely to
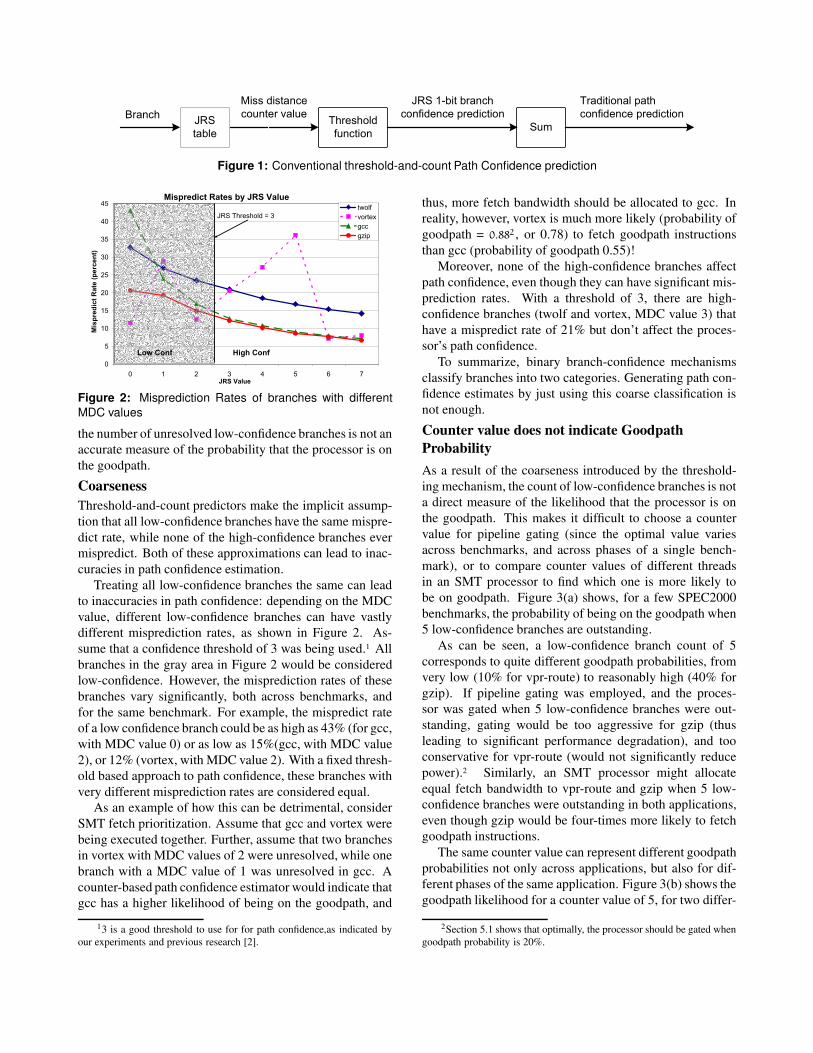
be on goodpath. Figure 3(a) shows, for a few SPEC2000
benchmarks, the probability of being on the goodpath when
5 low-confidence branches are outstanding.
As can be seen, a low-confidence branch count of 5
corresponds to quite different goodpath probabilities, from
very low (10% for vpr-route) to reasonably high (40% for
gzip). If pipeline gating was employed, and the proces-
sor was gated when 5 low-confidence branches were out-
standing, gating would be too aggressive for gzip (thus
leading to significant performance degradation), and too
conservative for vpr-route (would not significantly reduce
power).2 Similarly, an SMT processor might allocate
equal fetch bandwidth to vpr-route and gzip when 5 low-
confidence branches were outstanding in both applications,
even though gzip would be four-times more likely to fetch
goodpath instructions.
The same counter value can represent different goodpath
probabilities not only across applications, but also for dif-
ferent phases of the same application. Figure 3(b) shows the
goodpath likelihood for a counter value of 5, for two differ-
2Section 5.1 shows that optimally, the processor should be gated when
goodpath probability is 20%.
Goodpath Probability for counter_value = 5
0
0.05
0.1
0.15
0.2
0.25
0.3
0.35
0.4
0.45
crafty gzip bzip2 vpr_route
Goodpath Probability
(a) Across different benchmarks
Goodpath Probability for counter_value = 5
0
0.1
0.2
0.3
0.4
0.5
0.6
0.7
0.8
0.9
mcf_phase1 mcf_phase2 gcc_phase1 gcc_phase2
Goodpath Probability
(b) Across phases of the same benchmark
Figure 3: Goodpath Likelihood when 5 low-confidence branches are outstanding.
ent phases of mcf and gcc. This figure indicates that the best
counter-value for pipeline gating (for example) changes not
only across benchmarks, but also between different phases
of the same benchmark.
To summarize, the previous two sections indicate that
using low-confidence branch count as a surrogate for path
confidence is inaccurate because of coarseness in classifica-
tion. As a result of this coarseness, counter values don’t cor-
respond directly to goodpath probabilities. Hence, it is dif-
ficult to accurately compare goodpath probabilities of two
different threads, and to select counter values for pipeline
gating.
2.4 Probability-based Path Confidence
Estimation
In this paper, we propose PaCo, which is a path confidence
predictor that tries to address the shortcomings of conven-
tional predictors. Instead of keeping a count of low confi-
dence branches, PaCo directly outputs the probability that
the processor is on the goodpath. In doing so, PaCo con-
siders contributions from both low-confidence and high-
confidence branches (in fact, there is no concept of a con-
fidence threshold in PaCo). Even though PaCo can predict
goodpath probability with remarkable accuracy, it only adds
a small amount of hardware to the existing JRS predictor.
Since PaCo addresses fundamental shortcomings in con-
ventional path confidence prediction, it significantly outper-
forms counter-based predictors in both Pipeline Gating and
SMT fetch prioritization.
In the next section, we present the design of the PaCo
predictor. We evaluate the accuracy of PaCo’s goodpath
probability prediction in Section 4. Finally, we compare the
performance of PaCo against conventional path confidence
predictors in pipeline gating and SMT fetch prioritization in
Section 5.
3 Designing a Probability-based Path
Confidence Predictor
The probability-based path confidence predictor that we
propose was designed from first principles. We describe the
theory behind PaCo, and then present a realizable hardware
implementation.
3.1 Finding Goodpath Probability
The probability that the processor is on the goodpath is the
same as the probability that every unresolved branch was
correctly predicted. Assuming that branch predictions are
independent,3 this probability is given by Equation 1.
An important practical issue with using Equation 1 is es-
timating the term inside the product, the correct prediction
probability for a particular branch. We use the MDC ta-
ble of the JRS predictor for this purpose. As shown by
Figure 2, the MDC table classifies branches into buckets
by their MDC values, where the buckets have very differ-
ent misprediction rates. PaCo measures the misprediction
rate for each MDC bucket by using hardware counters, and
assigns a correct prediction probability to each branch de-
pending on the MDC bucket that the branch belongs to. In
other words, the branch confidence predictor is used as a
stratifier, which allows us to distinguish between branches
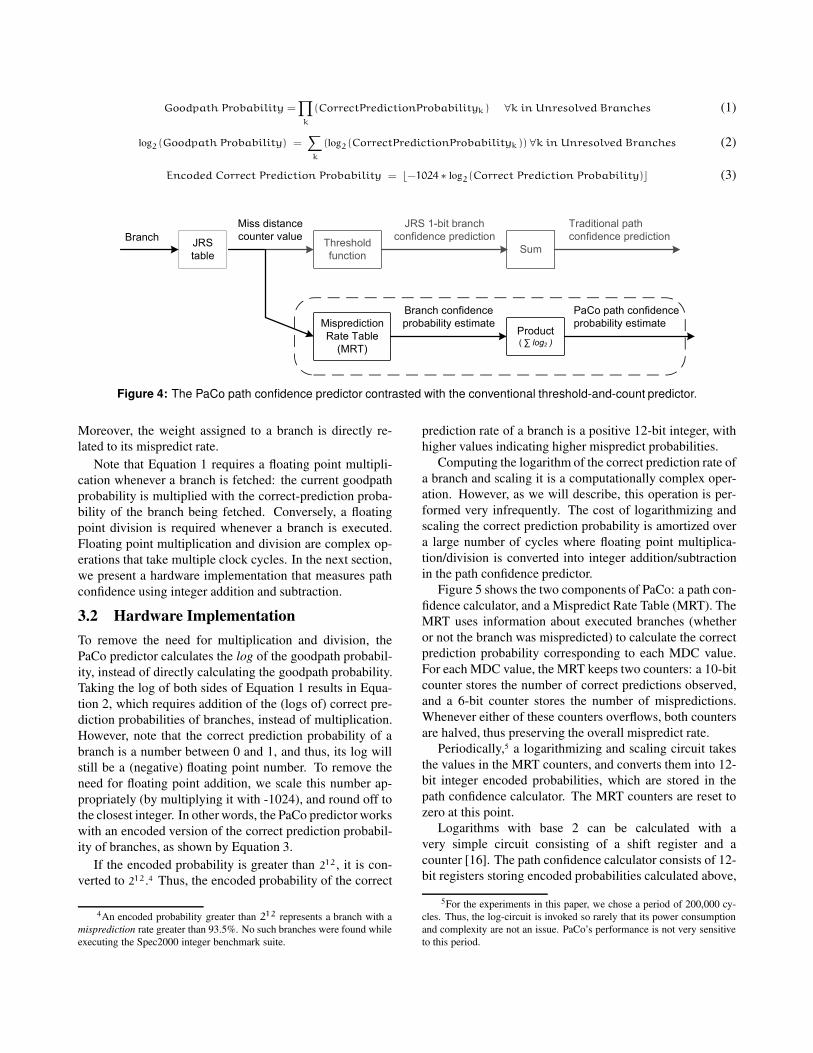
with different probabilities of misprediction. Figure 4 pic-
torially represents the process of arriving at a path confi-
dence estimate, contrasted with the conventional threshold-
and-count technique.
Dynamically calculating the misprediction rate for each
MDC value is not the only way to estimate the correct-
prediction probability for a branch. Other approaches in-
clude both more hardware-intensive (using a per-branch
misprediction rate table, indexed by a hash of the branch PC
and the global history), and simpler (using static, profile-
driven misprediction rates for each MDC value) techniques
to estimate misprediction rates for a branch. We have
found [14] that dynamically measuring the misprediction
rates of each MDC bucket strikes the right balance between
accuracy and hardware complexity.
Unlike conventional path confidence predictors, the
goodpath probability in Equation 1 includes contributions
from all branches, low confidence and high confidence.
3Branches may actually be correlated. We show in Section 4 that this
assumption doesn’t affect the estimation of path confidence appreciably.
Goodpath Probability =∏
k
(CorrectPredictionProbabilityk) ∀k in Unresolved Branches (1)
log2(Goodpath Probability) =∑
k
(log2(CorrectPredictionProbabilityk)) ∀k in Unresolved Branches (2)
Encoded Correct Prediction Probability = ⌊−1024∗ log2(Correct Prediction Probability)⌋ (3)
Branch
JRS 1-bit branch
confidence predictionJRS
table
Threshold
functionSum
Traditional path
confidence prediction
Misprediction
Rate Table
(MRT)
Branch confidence
probability estimate
PaCo path confidence
probability estimate
Miss distance
counter value
Product( ∑ log2 )
Figure 4: The PaCo path confidence predictor contrasted with the conventional threshold-and-count predictor.
Moreover, the weight assigned to a branch is directly re-
lated to its mispredict rate.
Note that Equation 1 requires a floating point multipli-
cation whenever a branch is fetched: the current goodpath
probability is multiplied with the correct-prediction proba-
bility of the branch being fetched. Conversely, a floating
point division is required whenever a branch is executed.
Floating point multiplication and division are complex op-
erations that take multiple clock cycles. In the next section,
we present a hardware implementation that measures path
confidence using integer addition and subtraction.
3.2 Hardware Implementation
To remove the need for multiplication and division, the
PaCo predictor calculates the log of the goodpath probabil-
ity, instead of directly calculating the goodpath probability.
Taking the log of both sides of Equation 1 results in Equa-
tion 2, which requires addition of the (logs of) correct pre-
diction probabilities of branches, instead of multiplication.
However, note that the correct prediction probability of a
branch is a number between 0 and 1, and thus, its log will
still be a (negative) floating point number. To remove the
need for floating point addition, we scale this number ap-
propriately (by multiplying it with -1024), and round off to
the closest integer. In other words, the PaCo predictorworks
with an encoded version of the correct prediction probabil-
ity of branches, as shown by Equation 3.
If the encoded probability is greater than 212, it is con-
verted to 212.4 Thus, the encoded probability of the correct
4An encoded probability greater than 212 represents a branch with a
misprediction rate greater than 93.5%. No such branches were found while
executing the Spec2000 integer benchmark suite.
prediction rate of a branch is a positive 12-bit integer, with
higher values indicating higher mispredict probabilities.
Computing the logarithm of the correct prediction rate of
a branch and scaling it is a computationally complex oper-
ation. However, as we will describe, this operation is per-
formed very infrequently. The cost of logarithmizing and
scaling the correct prediction probability is amortized over
a large number of cycles where floating point multiplica-
tion/division is converted into integer addition/subtraction
in the path confidence predictor.
Figure 5 shows the two components of PaCo: a path con-
fidence calculator, and a Mispredict Rate Table (MRT). The
MRT uses information about executed branches (whether
or not the branch was mispredicted) to calculate the correct
prediction probability corresponding to each MDC value.
For each MDC value, the MRT keeps two counters: a 10-bit
counter stores the number of correct predictions observed,
and a 6-bit counter stores the number of mispredictions.
Whenever either of these counters overflows, both counters
are halved, thus preserving the overall mispredict rate.
Periodically,5 a logarithmizing and scaling circuit takes
the values in the MRT counters, and converts them into 12-
bit integer encoded probabilities, which are stored in the
path confidence calculator. The MRT counters are reset to
zero at this point.
Logarithms with base 2 can be calculated with a
very simple circuit consisting of a shift register and a
counter [16]. The path confidence calculator consists of 12-
bit registers storing encoded probabilities calculated above,
5For the experiments in this paper, we chose a period of 200,000 cy-
cles. Thus, the log-circuit is invoked so rarely that its power consumption
and complexity are not an issue. PaCo’s performance is not very sensitive
to this period.
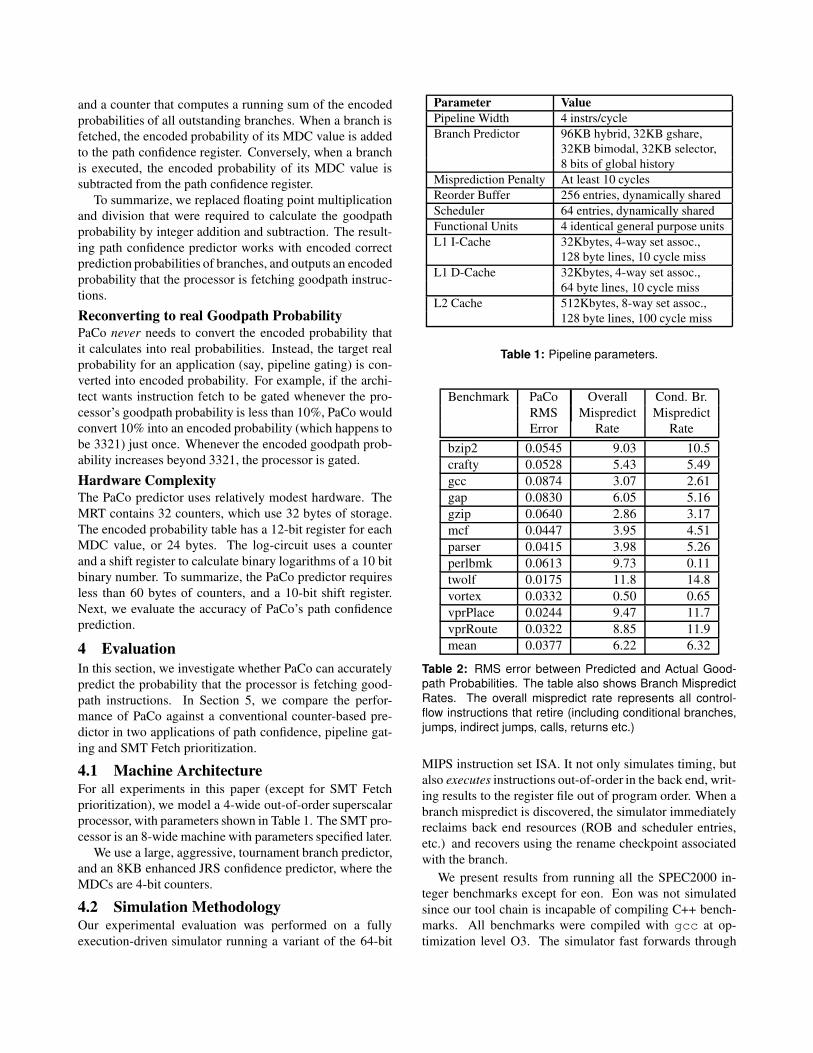
and a counter that computes a running sum of the encoded
probabilities of all outstanding branches. When a branch is
fetched, the encoded probability of its MDC value is added
to the path confidence register. Conversely, when a branch
is executed, the encoded probability of its MDC value is
subtracted from the path confidence register.
To summarize, we replaced floating point multiplication
and division that were required to calculate the goodpath
probability by integer addition and subtraction. The result-
ing path confidence predictor works with encoded correct
prediction probabilities of branches, and outputs an encoded
probability that the processor is fetching goodpath instruc-
tions.
Reconverting to real Goodpath Probability
PaCo never needs to convert the encoded probability that
it calculates into real probabilities. Instead, the target real
probability for an application (say, pipeline gating) is con-
verted into encoded probability. For example, if the archi-
tect wants instruction fetch to be gated whenever the pro-
cessor’s goodpath probability is less than 10%, PaCo would
convert 10% into an encoded probability (which happens to
be 3321) just once. Whenever the encoded goodpath prob-
ability increases beyond 3321, the processor is gated.
Hardware Complexity
The PaCo predictor uses relatively modest hardware. The
MRT contains 32 counters, which use 32 bytes of storage.
The encoded probability table has a 12-bit register for each
MDC value, or 24 bytes. The log-circuit uses a counter
and a shift register to calculate binary logarithms of a 10 bit
binary number. To summarize, the PaCo predictor requires
less than 60 bytes of counters, and a 10-bit shift register.
Next, we evaluate the accuracy of PaCo’s path confidence
prediction.
4 Evaluation
In this section, we investigate whether PaCo can accurately
predict the probability that the processor is fetching good-
path instructions. In Section 5, we compare the perfor-
mance of PaCo against a conventional counter-based pre-
dictor in two applications of path confidence, pipeline gat-
ing and SMT Fetch prioritization.
4.1 Machine ArchitectureFor all experiments in this paper (except for SMT Fetch
prioritization), we model a 4-wide out-of-order superscalar
processor, with parameters shown in Table 1. The SMT pro-
cessor is an 8-wide machine with parameters specified later.
We use a large, aggressive, tournament branch predictor,
and an 8KB enhanced JRS confidence predictor, where the
MDCs are 4-bit counters.
4.2 Simulation MethodologyOur experimental evaluation was performed on a fully
execution-driven simulator running a variant of the 64-bit
Parameter Value
Pipeline Width 4 instrs/cycle
Branch Predictor 96KB hybrid, 32KB gshare,
32KB bimodal, 32KB selector,
8 bits of global history
Misprediction Penalty At least 10 cycles
Reorder Buffer 256 entries, dynamically shared
Scheduler 64 entries, dynamically shared
Functional Units 4 identical general purpose units
L1 I-Cache 32Kbytes, 4-way set assoc.,
128 byte lines, 10 cycle miss
L1 D-Cache 32Kbytes, 4-way set assoc.,
64 byte lines, 10 cycle miss
L2 Cache 512Kbytes, 8-way set assoc.,
128 byte lines, 100 cycle miss
Table 1: Pipeline parameters.
Benchmark PaCo Overall Cond. Br.
RMS Mispredict Mispredict
Error Rate Rate
bzip2 0.0545 9.03 10.5
crafty 0.0528 5.43 5.49
gcc 0.0874 3.07 2.61
gap 0.0830 6.05 5.16
gzip 0.0640 2.86 3.17
mcf 0.0447 3.95 4.51
parser 0.0415 3.98 5.26
perlbmk 0.0613 9.73 0.11
twolf 0.0175 11.8 14.8
vortex 0.0332 0.50 0.65
vprPlace 0.0244 9.47 11.7
vprRoute 0.0322 8.85 11.9
mean 0.0377 6.22 6.32
Table 2: RMS error between Predicted and Actual Good-
path Probabilities. The table also shows Branch Mispredict
Rates. The overall mispredict rate represents all control-
flow instructions that retire (including conditional branches,
jumps, indirect jumps, calls, returns etc.)
MIPS instruction set ISA. It not only simulates timing, but
also executes instructions out-of-order in the back end, writ-
ing results to the register file out of program order. When a
branch mispredict is discovered, the simulator immediately
reclaims back end resources (ROB and scheduler entries,
etc.) and recovers using the rename checkpoint associated
with the branch.
We present results from running all the SPEC2000 in-
teger benchmarks except for eon. Eon was not simulated
since our tool chain is incapable of compiling C++ bench-
marks. All benchmarks were compiled with gcc at op-
timization level O3. The simulator fast forwards through
Correct Preds
Mispreds
Path ConfidenceCorrect Preds
Mispreds
Correct Preds
Mispreds
MDC0
MDC1
MDC15
LOG
CIRCUIT
Encoded
Probabilities
MDC0
MDC1
MDC15
. .
. .
12 bits
6 bits
10 bits
. .
. .
MDC
value of
fetched
branch
MDC
value of
executed
branch
MISPREDICT RATE TABLE
PATH CONFIDENCE
CALCULATOR
Branch Exec Info
(from backend)
Figure 5: Hardware Implementation of the PaCo predictor
the initialization phase of all benchmarks, and executes
100 million instructions. The mispredict rates observed are
shown in Table 2.
4.3 Reliability Diagrams and Correlation
The proposed path confidence predictor falls in the gen-
eral category of Probabilistic Forecast Systems. These sys-
tems are used to predict probabilities in binary experiments.
For example, weather forecasting systems indicate the like-
lihood that it will rain on a certain day. Similarly, PaCo
outputs a predicted probability that the processor is on the
goodpath at any given point in time, given the branches that
are as yet unresolved.
The accuracy of Probabilistic Forecast Systems is mea-
sured using graphs called Reliability Diagrams [17, 10],
which, as the name suggests, are indicative of the relia-
bility of prediction. These diagrams plot predicted proba-
bilities against corresponding observed probabilities. More
formally, Reliability Diagrams for a rain forecasting system
would plot the predicted precipitation probability, x (output
from predictor), against observed probability f, as shown by
Equation 4.
As an example of what Reliability Diagrams aim to
quantify, assume that during the execution of a program, at
1 Million distinct instances, the path confidence predictor
claimed that there was a 0.25 probability of the processor
being on the goodpath. If the path confidence predictor was
accurate, out of these 1 Million instances, 250,000 times the
processor would actually be on the goodpath, and 750,000
times the processor would actually be on badpath. In other
words, if the predicted probability was 0.25 for 1 Million
instances, the observed probability (Equation 5) for these 1
Million instances would also be 0.25.
A Reliability Diagram plots predicted probability on the
x-axis against observed probability on the y-axis. If the
Path Confidence predictor is accurate, the reliability dia-
gram would have a slope of 1, i.e, the predicted and ob-
served probabilities would be perfectly correlated.
0
10
20
30
40
50
60
70
80
90
100
0 10 20 30 40 50 60 70 80 90 100
Predicted Path Confdence in Percent. (x)
Observed Path C
onfidence in Percent (f)
0.0
5.0
10.0
15.0
20.0
25.0
30.0
35.0
40.0
45.0
Number of Occurances (in M
illions)
Number of Occurances
Accuracy of Prediction
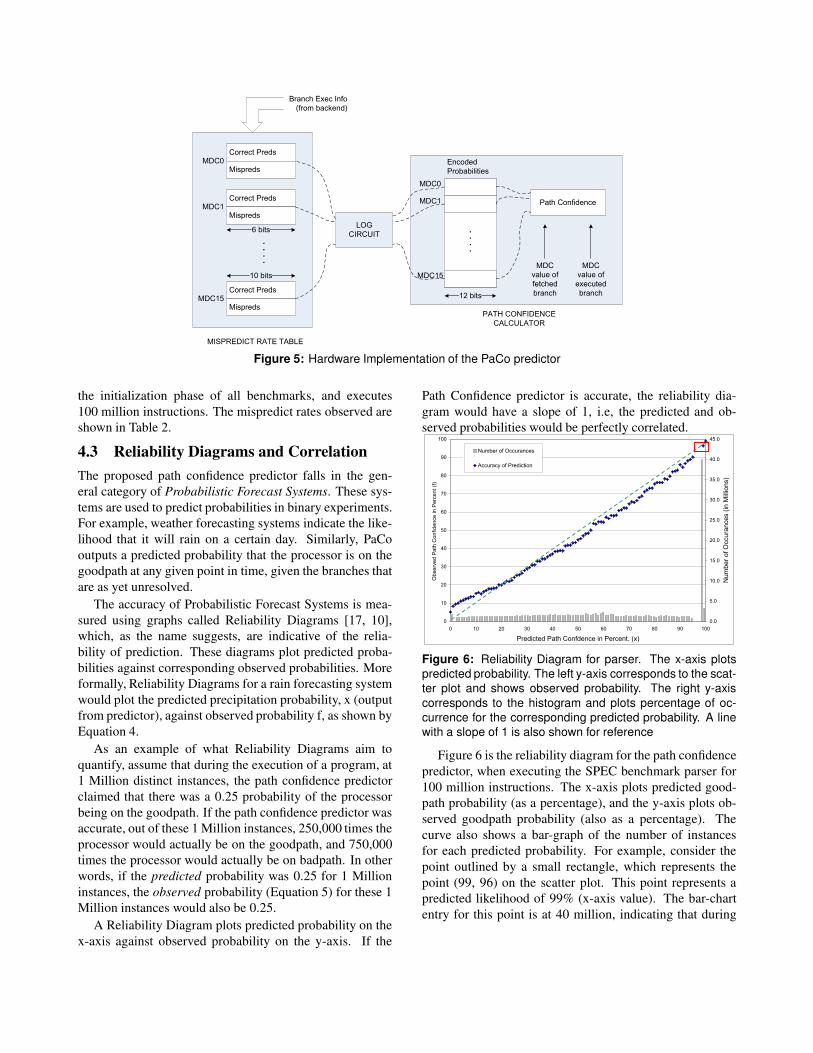
Figure 6: Reliability Diagram for parser. The x-axis plots
predicted probability. The left y-axis corresponds to the scat-
ter plot and shows observed probability. The right y-axis
corresponds to the histogram and plots percentage of oc-
currence for the corresponding predicted probability. A line
with a slope of 1 is also shown for reference
Figure 6 is the reliability diagram for the path confidence
predictor, when executing the SPEC benchmark parser for
100 million instructions. The x-axis plots predicted good-
path probability (as a percentage), and the y-axis plots ob-
served goodpath probability (also as a percentage). The
curve also shows a bar-graph of the number of instances
for each predicted probability. For example, consider the
point outlined by a small rectangle, which represents the
point (99, 96) on the scatter plot. This point represents a
predicted likelihood of 99% (x-axis value). The bar-chart
entry for this point is at 40 million, indicating that during
f(x) = p(it rained | predicted precipitation probability = x) (4)
observedProbability0.25 = p(processor is on goodpath | predicted probability = 0.25) (5)
parser’s execution, for 40 Million instances,6 the predicted
goodpath probability was 99%. Out of these 40 Million in-
stances, 38.5 Million times the processor was actually on
the goodpath,7 and 1.5 Million times, the processor was
on badpath. Hence, the observed goodpath probability was
about 96% (y-axis value on the scatter plot). As can be seen
from the figure, PaCo can predict goodpath likelihood with
remarkable accuracy on parser. Next, we look at PaCo’s
performance on different benchmarks.
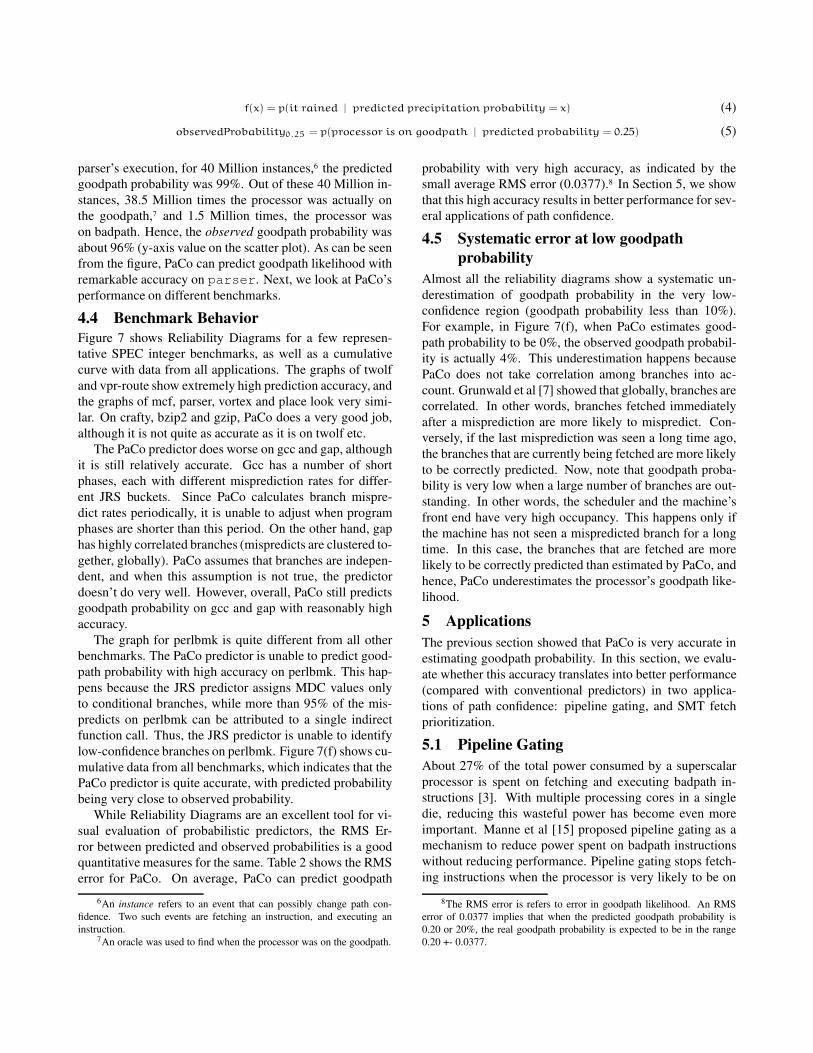
4.4 Benchmark Behavior
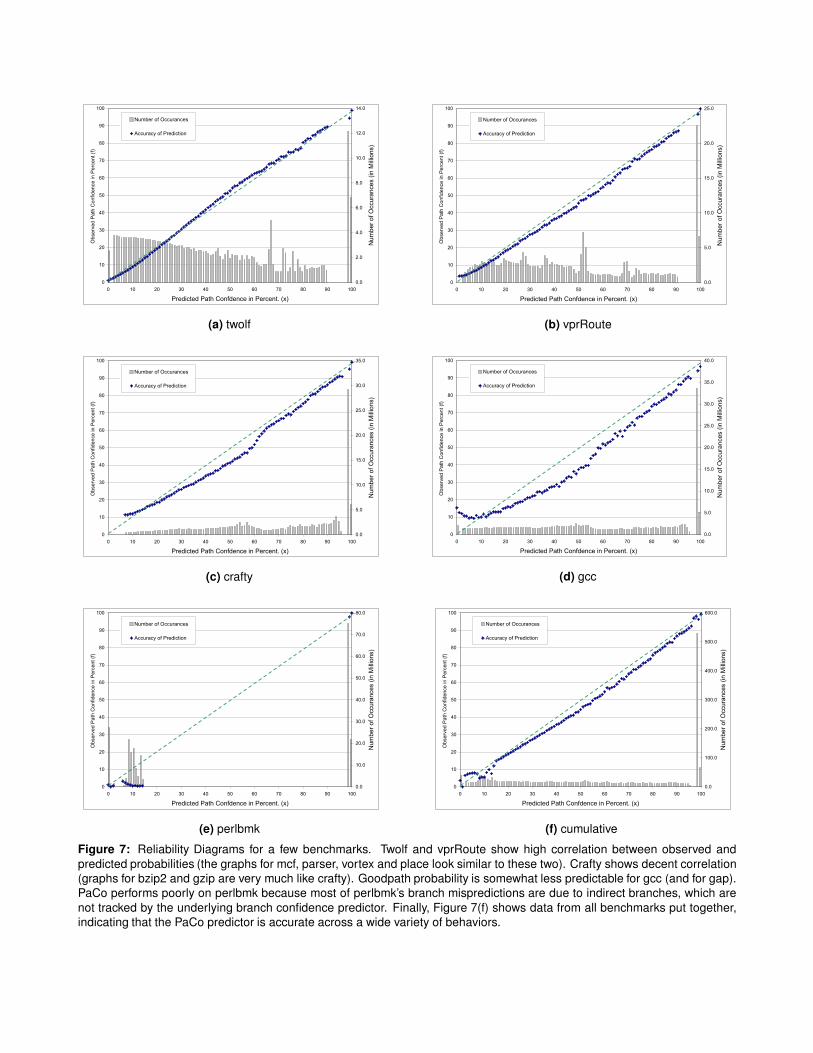
Figure 7 shows Reliability Diagrams for a few represen-
tative SPEC integer benchmarks, as well as a cumulative
curve with data from all applications. The graphs of twolf
and vpr-route show extremely high prediction accuracy, and
the graphs of mcf, parser, vortex and place look very simi-
lar. On crafty, bzip2 and gzip, PaCo does a very good job,
although it is not quite as accurate as it is on twolf etc.
The PaCo predictor does worse on gcc and gap, although
it is still relatively accurate. Gcc has a number of short
phases, each with different misprediction rates for differ-
ent JRS buckets. Since PaCo calculates branch mispre-
dict rates periodically, it is unable to adjust when program
phases are shorter than this period. On the other hand, gap
has highly correlated branches (mispredicts are clustered to-
gether, globally). PaCo assumes that branches are indepen-
dent, and when this assumption is not true, the predictor
doesn’t do very well. However, overall, PaCo still predicts
goodpath probability on gcc and gap with reasonably high
accuracy.
The graph for perlbmk is quite different from all other
benchmarks. The PaCo predictor is unable to predict good-
path probability with high accuracy on perlbmk. This hap-
pens because the JRS predictor assigns MDC values only
to conditional branches, while more than 95% of the mis-
predicts on perlbmk can be attributed to a single indirect
function call. Thus, the JRS predictor is unable to identify
low-confidence branches on perlbmk. Figure 7(f) shows cu-
mulative data from all benchmarks, which indicates that the
PaCo predictor is quite accurate, with predicted probability
being very close to observed probability.
While Reliability Diagrams are an excellent tool for vi-
sual evaluation of probabilistic predictors, the RMS Er-
ror between predicted and observed probabilities is a good
quantitative measures for the same. Table 2 shows the RMS
error for PaCo. On average, PaCo can predict goodpath
6An instance refers to an event that can possibly change path con-
fidence. Two such events are fetching an instruction, and executing an
instruction.7An oracle was used to find when the processor was on the goodpath.
probability with very high accuracy, as indicated by the
small average RMS error (0.0377).8 In Section 5, we show
that this high accuracy results in better performance for sev-
eral applications of path confidence.
4.5 Systematic error at low goodpath
probability
Almost all the reliability diagrams show a systematic un-
derestimation of goodpath probability in the very low-
confidence region (goodpath probability less than 10%).
For example, in Figure 7(f), when PaCo estimates good-
path probability to be 0%, the observed goodpath probabil-
ity is actually 4%. This underestimation happens because
PaCo does not take correlation among branches into ac-
count. Grunwald et al [7] showed that globally, branches are
correlated. In other words, branches fetched immediately
after a misprediction are more likely to mispredict. Con-
versely, if the last misprediction was seen a long time ago,
the branches that are currently being fetched are more likely
to be correctly predicted. Now, note that goodpath proba-
bility is very low when a large number of branches are out-
standing. In other words, the scheduler and the machine’s
front end have very high occupancy. This happens only if
the machine has not seen a mispredicted branch for a long
time. In this case, the branches that are fetched are more
likely to be correctly predicted than estimated by PaCo, and
hence, PaCo underestimates the processor’s goodpath like-
lihood.
5 Applications
The previous section showed that PaCo is very accurate in
estimating goodpath probability. In this section, we evalu-
ate whether this accuracy translates into better performance
(compared with conventional predictors) in two applica-
tions of path confidence: pipeline gating, and SMT fetch
prioritization.
5.1 Pipeline Gating
About 27% of the total power consumed by a superscalar
processor is spent on fetching and executing badpath in-
structions [3]. With multiple processing cores in a single
die, reducing this wasteful power has become even more
important. Manne et al [15] proposed pipeline gating as a
mechanism to reduce power spent on badpath instructions
without reducing performance. Pipeline gating stops fetch-
ing instructions when the processor is very likely to be on
8The RMS error is refers to error in goodpath likelihood. An RMS
error of 0.0377 implies that when the predicted goodpath probability is
0.20 or 20%, the real goodpath probability is expected to be in the range
0.20 +- 0.0377.
0
10
20
30
40
50
60
70
80
90
100
0 10 20 30 40 50 60 70 80 90 100
Predicted Path Confdence in Percent. (x)
Observed Path Confidence in Percent (f)
0.0
2.0
4.0
6.0
8.0
10.0
12.0
14.0
Number of Occurances (in M
illions)
Number of Occurances
Accuracy of Prediction
(a) twolf
0
10
20
30
40
50
60
70
80
90
100
0 10 20 30 40 50 60 70 80 90 100
Predicted Path Confdence in Percent. (x)
Observed Path Confidence in Percent (f)
0.0
5.0
10.0
15.0
20.0
25.0
Number of Occurances (in M
illions)
Number of Occurances
Accuracy of Prediction
(b) vprRoute
0
10
20
30
40
50
60
70
80
90
100
0 10 20 30 40 50 60 70 80 90 100
Predicted Path Confdence in Percent. (x)
Observed Path Confidence in Percent (f)
0.0
5.0
10.0
15.0
20.0
25.0
30.0
35.0
Number of Occurances (in M
illions)
Number of Occurances
Accuracy of Prediction
(c) crafty
0
10
20
30
40
50
60
70
80
90
100
0 10 20 30 40 50 60 70 80 90 100
Predicted Path Confdence in Percent. (x)
Observed Path Confidence in Percent (f)
0.0
5.0
10.0
15.0
20.0
25.0
30.0
35.0
40.0
Number of Occurances (in M
illions)
Number of Occurances
Accuracy of Prediction
(d) gcc
0
10
20
30
40
50
60
70
80
90
100
0 10 20 30 40 50 60 70 80 90 100
Predicted Path Confdence in Percent. (x)
Observed Path Confidence in Percent (f)
0.0
10.0
20.0
30.0
40.0
50.0
60.0
70.0
80.0
Number of Occurances (in M
illions)
Number of Occurances
Accuracy of Prediction
(e) perlbmk
0
10
20
30
40
50
60
70
80
90
100
0 10 20 30 40 50 60 70 80 90 100
Predicted Path Confdence in Percent. (x)
Observed Path Confidence in Percent (f)
0.0
100.0
200.0
300.0
400.0
500.0
600.0
Number of Occurances (in M
illions)
Number of Occurances
Accuracy of Prediction
(f) cumulative
Figure 7: Reliability Diagrams for a few benchmarks. Twolf and vprRoute show high correlation between observed and
predicted probabilities (the graphs for mcf, parser, vortex and place look similar to these two). Crafty shows decent correlation
(graphs for bzip2 and gzip are very much like crafty). Goodpath probability is somewhat less predictable for gcc (and for gap).
PaCo performs poorly on perlbmk because most of perlbmk’s branch mispredictions are due to indirect branches, which are
not tracked by the underlying branch confidence predictor. Finally, Figure 7(f) shows data from all benchmarks put together,
indicating that the PaCo predictor is accurate across a wide variety of behaviors.
0
10
20
30
40
50
60
70
80
90
100
-5 0 5 10 15 20 25 30 35 40 45
Performance Loss (pct)
Redn in Badpath Instructions Exec (pct)
PaCo
JRS 3
JRS 7
JRS 11
JRS 15
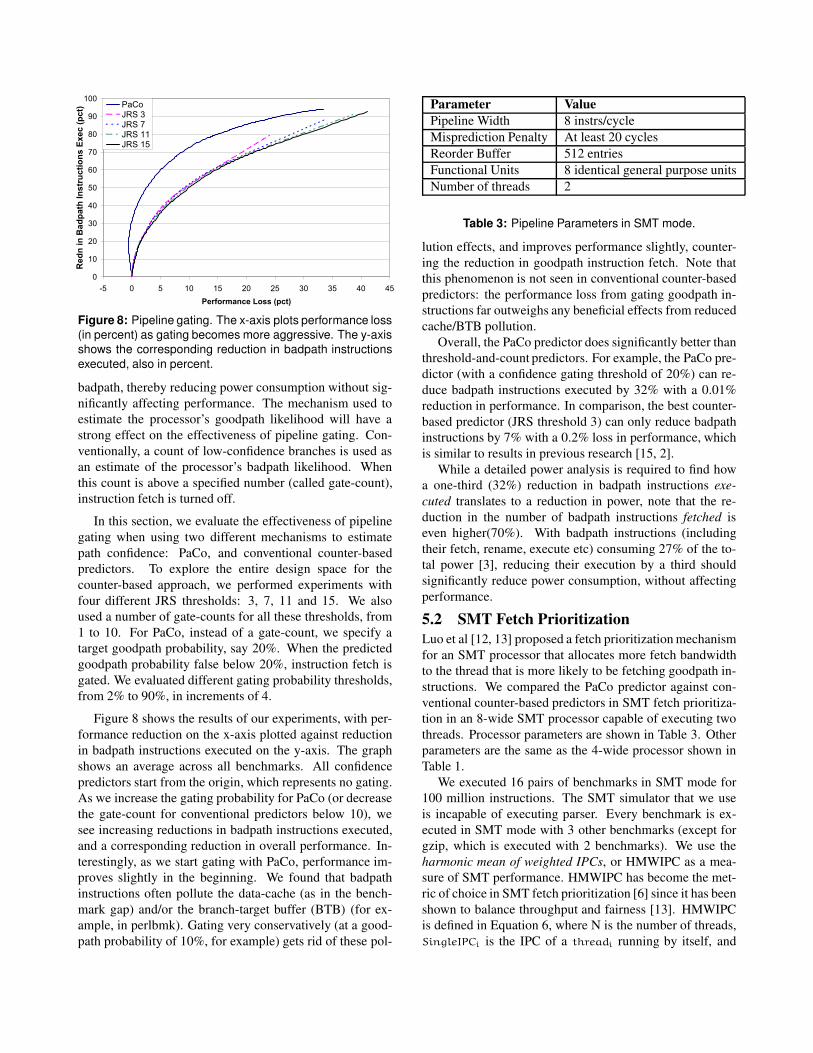
Figure 8: Pipeline gating. The x-axis plots performance loss
(in percent) as gating becomes more aggressive. The y-axis
shows the corresponding reduction in badpath instructions
executed, also in percent.
badpath, thereby reducing power consumption without sig-
nificantly affecting performance. The mechanism used to
estimate the processor’s goodpath likelihood will have a
strong effect on the effectiveness of pipeline gating. Con-
ventionally, a count of low-confidence branches is used as
an estimate of the processor’s badpath likelihood. When
this count is above a specified number (called gate-count),
instruction fetch is turned off.
In this section, we evaluate the effectiveness of pipeline
gating when using two different mechanisms to estimate
path confidence: PaCo, and conventional counter-based
predictors. To explore the entire design space for the
counter-based approach, we performed experiments with
four different JRS thresholds: 3, 7, 11 and 15. We also
used a number of gate-counts for all these thresholds, from
1 to 10. For PaCo, instead of a gate-count, we specify a
target goodpath probability, say 20%. When the predicted
goodpath probability false below 20%, instruction fetch is
gated. We evaluated different gating probability thresholds,
from 2% to 90%, in increments of 4.
Figure 8 shows the results of our experiments, with per-
formance reduction on the x-axis plotted against reduction
in badpath instructions executed on the y-axis. The graph
shows an average across all benchmarks. All confidence
predictors start from the origin, which represents no gating.
As we increase the gating probability for PaCo (or decrease
the gate-count for conventional predictors below 10), we
see increasing reductions in badpath instructions executed,
and a corresponding reduction in overall performance. In-
terestingly, as we start gating with PaCo, performance im-
proves slightly in the beginning. We found that badpath
instructions often pollute the data-cache (as in the bench-
mark gap) and/or the branch-target buffer (BTB) (for ex-
ample, in perlbmk). Gating very conservatively (at a good-
path probability of 10%, for example) gets rid of these pol-
Parameter Value
Pipeline Width 8 instrs/cycle
Misprediction Penalty At least 20 cycles
Reorder Buffer 512 entries
Functional Units 8 identical general purpose units
Number of threads 2
Table 3: Pipeline Parameters in SMT mode.
lution effects, and improves performance slightly, counter-
ing the reduction in goodpath instruction fetch. Note that
this phenomenon is not seen in conventional counter-based
predictors: the performance loss from gating goodpath in-
structions far outweighs any beneficial effects from reduced
cache/BTB pollution.
Overall, the PaCo predictor does significantly better than
threshold-and-count predictors. For example, the PaCo pre-
dictor (with a confidence gating threshold of 20%) can re-
duce badpath instructions executed by 32% with a 0.01%
reduction in performance. In comparison, the best counter-
based predictor (JRS threshold 3) can only reduce badpath
instructions by 7% with a 0.2% loss in performance, which
is similar to results in previous research [15, 2].
While a detailed power analysis is required to find how
a one-third (32%) reduction in badpath instructions exe-
cuted translates to a reduction in power, note that the re-
duction in the number of badpath instructions fetched is
even higher(70%). With badpath instructions (including
their fetch, rename, execute etc) consuming 27% of the to-
tal power [3], reducing their execution by a third should
significantly reduce power consumption, without affecting
performance.
5.2 SMT Fetch Prioritization
Luo et al [12, 13] proposed a fetch prioritizationmechanism
for an SMT processor that allocates more fetch bandwidth
to the thread that is more likely to be fetching goodpath in-
structions. We compared the PaCo predictor against con-
ventional counter-based predictors in SMT fetch prioritiza-
tion in an 8-wide SMT processor capable of executing two
threads. Processor parameters are shown in Table 3. Other
parameters are the same as the 4-wide processor shown in
Table 1.
We executed 16 pairs of benchmarks in SMT mode for
100 million instructions. The SMT simulator that we use
is incapable of executing parser. Every benchmark is ex-
ecuted in SMT mode with 3 other benchmarks (except for
gzip, which is executed with 2 benchmarks). We use the
harmonic mean of weighted IPCs, or HMWIPC as a mea-
sure of SMT performance. HMWIPC has become the met-
ric of choice in SMT fetch prioritization [6] since it has been
shown to balance throughput and fairness [13]. HMWIPC
is defined in Equation 6, where N is the number of threads,
SingleIPCi is the IPC of a threadi running by itself, and
IPCi is the IPC of threadi when the processor is in SMT
mode.
HMWIPC = N/∑
i
(SingleIPCi/IPCi) (6)
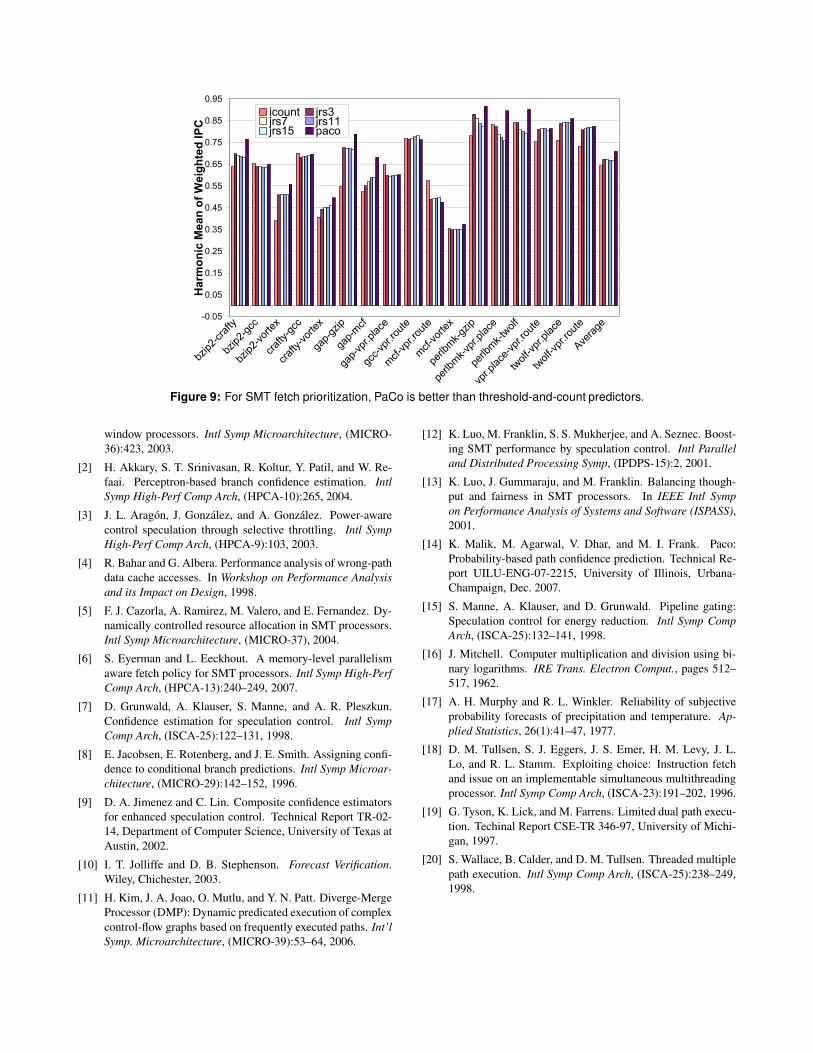
Figure 9 shows the performance of 16 pairs of bench-
marks for a number of different fetch policies. We used 4
different JRS threshold-and-count predictors (with thresh-
olds of 3, 7, 11 and 15). We compare these against a fetch
prioritization scheme that uses PaCo to estimate path confi-
dence. For reference, we also show the performance of the
ICount [18] fetch prioritization scheme.
The figure demonstrates that PaCo does a better job than
counter-based predictors at allocating fetch bandwidth to
the thread that is more likely to fetch goodpath instructions.
On average, PaCo shows a 5.4% performance improvement
compared to the best counter-based predictor (JRS thresh-
old 3). Figure 9 also indicates that among threshold-and-
count predictors, while a threshold of 3 is the best for most
applications, higher confidence thresholds sometimes per-
form better (e.g, gap-mcf). Since PaCo doesn’t use a fixed
threshold, it automatically adjusts to application behavior
and beats the best among the JRS predictors for 14 out of
16 applications.
6 Related Work
All previous work in dynamic path confidence estimation
has used a count of low-confidence branches as an indicator
of goodpath likelihood.
Aragon![3] and Akkary [2] have proposed dividing low-
confidence branches into two buckets, very low confidence,
and just low-confidence. The branch prediction for very
low confidence branches is often inverted [2]. While this
technique somewhat alleviates the issue of treating all low-
confidence branches as the same, it is unclear how a very-
low-confidence branch should affect path confidence (recall
that a low-confidence branch increases path confidence by
1). We show in this paper that the correct weight to add to
the path confidence for any branch is proportional to the log
of its mispredict rate.
There has been recent research on perceptron based
branch-confidence predictors [2], which were shown to be
better than the enhanced JRS predictor. There has also been
some work on “hybrid” branch confidence predictors that
combine branch confidence estimates from more than one
predictor [9]. We consider branch confidence prediction
to be orthogonal to our work: the PaCo predictor uses the
branch-confidence predictor as a stratifier. A better branch
confidence predictor would simply provide a better strati-
fier, hopefully improving PaCo’s accuracy.
In the context of pipeline gating, while the original
mechanism proposed by Manne is an all-or-nothing mech-
anism (instruction fetch is completely turned off when
more than gate-count low-confidence branches are pend-
ing), Aragon et al [3] have proposed a more sophisticated
version that gradually reduces instruction fetch bandwidth
as the number of unresolved low-confidence branches in-
crease. Gradual reduction of fetch bandwidth should work
even better with PaCo, since PaCo gives very fine-grained
information about path confidence (as opposed to a counter
value provided by conventional branch confidence predic-
tors).
With regard to SMT fetch prioritization, there have been
a number of proposals [5, 6] that have been shown to be
better than ICount, specially for applications that suffer a
lot of cache misses (e.g., SPEC floating point benchmarks).
A path confidence based scheme that uses PaCo can com-
plement these mechanisms, particularly when integer appli-
cations are being executed.
7 Conclusion
We showed that conventional threshold-and-countpath con-
fidence predictors do not consider branch misprediction
rates, and thus, can lead to inaccurate path confidence esti-
mates. We proposed PaCo, which directly predicts the prob-
ability that the processor is on the goodpath. To simplify
hardware implementation, PaCo uses logarithms to elimi-
nate the need for floating point multiplication and division,
and instead uses integer addition and subtraction.
We found that the path confidence estimate derived from
PaCo was very accurate, with a low RMS error. Finally,
we showed that PaCo’s high accuracy directly leads to
much better performance than counter-based predictors in
pipeline gating and SMT fetch prioritization.
Acknowledgments
We are grateful to several people for helping make this pa-
per possible. Sam Stone and Kevin Woley were important
contributors to the early formulation of this work. Steve
Lumetta helped us formalize the concepts used in this pa-
per. Sanjay Patel and Pierre Salverda provided valuable
feedback on an early draft of this paper.
The work reported in this paper was supported in part by
the National Science Foundation under grant CCR-0429711
and by the Gigascale Systems Research Center, one of five
research centers funded under the Semiconductor Research
Corporation’s Focus Center Research Program. Computa-
tional resources were provided by the Trusted ILLIAC Cen-
ter at the Information Trust Institute and Coordinated Sci-
ence Laboratory at the University of Illinois. Any opinions,
findings, conclusions or recommendations expressed in this
publication are those of the authors and do not necessarily
reflect the views of the National Science Foundation.
Bibliography
[1] H. Akkary, R. Rajwar, and S. T. Srinivasan. Checkpoint
processing and recovery: Towards scalable large instruction
-0.05
0.05
0.15
0.25
0.35
0.45
0.55
0.65
0.75
0.85
0.95
bzip2-crafty
bzip2-gcc
bzip2-vortex
crafty-gcc
crafty-vortex
gap-gzip
gap-mcf
gap-vpr.place
gcc-vpr.route
mcf-vpr.route
mcf-vortex
perlbmk-gzip
perlbmk-vpr.place
perlbmk-twolf
vpr.place-vpr.route
twolf-vpr.place
twolf-vpr.route
Average
Harmonic Mean of Weighted IPC
icount jrs3jrs7 jrs11jrs15 paco
Figure 9: For SMT fetch prioritization, PaCo is better than threshold-and-count predictors.
window processors. Intl Symp Microarchitecture, (MICRO-
36):423, 2003.
[2] H. Akkary, S. T. Srinivasan, R. Koltur, Y. Patil, and W. Re-
faai. Perceptron-based branch confidence estimation. Intl
Symp High-Perf Comp Arch, (HPCA-10):265, 2004.
[3] J. L. Aragon, J. Gonzalez, and A. Gonzalez. Power-aware
control speculation through selective throttling. Intl Symp
High-Perf Comp Arch, (HPCA-9):103, 2003.
[4] R. Bahar and G. Albera. Performance analysis of wrong-path
data cache accesses. In Workshop on Performance Analysis
and its Impact on Design, 1998.
[5] F. J. Cazorla, A. Ramirez, M. Valero, and E. Fernandez. Dy-
namically controlled resource allocation in SMT processors.
Intl Symp Microarchitecture, (MICRO-37), 2004.
[6] S. Eyerman and L. Eeckhout. A memory-level parallelism
aware fetch policy for SMT processors. Intl Symp High-Perf
Comp Arch, (HPCA-13):240–249, 2007.
[7] D. Grunwald, A. Klauser, S. Manne, and A. R. Pleszkun.
Confidence estimation for speculation control. Intl Symp
Comp Arch, (ISCA-25):122–131, 1998.
[8] E. Jacobsen, E. Rotenberg, and J. E. Smith. Assigning confi-
dence to conditional branch predictions. Intl Symp Microar-
chitecture, (MICRO-29):142–152, 1996.
[9] D. A. Jimenez and C. Lin. Composite confidence estimators
for enhanced speculation control. Technical Report TR-02-
14, Department of Computer Science, University of Texas at
Austin, 2002.
[10] I. T. Jolliffe and D. B. Stephenson. Forecast Verification.
Wiley, Chichester, 2003.
[11] H. Kim, J. A. Joao, O. Mutlu, and Y. N. Patt. Diverge-Merge
Processor (DMP): Dynamic predicated execution of complex
control-flow graphs based on frequently executed paths. Int’l
Symp. Microarchitecture, (MICRO-39):53–64, 2006.
[12] K. Luo, M. Franklin, S. S. Mukherjee, and A. Seznec. Boost-
ing SMT performance by speculation control. Intl Parallel
and Distributed Processing Symp, (IPDPS-15):2, 2001.
[13] K. Luo, J. Gummaraju, and M. Franklin. Balancing though-
put and fairness in SMT processors. In IEEE Intl Symp
on Performance Analysis of Systems and Software (ISPASS),
2001.
[14] K. Malik, M. Agarwal, V. Dhar, and M. I. Frank. Paco:
Probability-based path confidence prediction. Technical Re-
port UILU-ENG-07-2215, University of Illinois, Urbana-
Champaign, Dec. 2007.
[15] S. Manne, A. Klauser, and D. Grunwald. Pipeline gating:
Speculation control for energy reduction. Intl Symp Comp
Arch, (ISCA-25):132–141, 1998.
[16] J. Mitchell. Computer multiplication and division using bi-
nary logarithms. IRE Trans. Electron Comput., pages 512–
517, 1962.
[17] A. H. Murphy and R. L. Winkler. Reliability of subjective
probability forecasts of precipitation and temperature. Ap-
plied Statistics, 26(1):41–47, 1977.
[18] D. M. Tullsen, S. J. Eggers, J. S. Emer, H. M. Levy, J. L.
Lo, and R. L. Stamm. Exploiting choice: Instruction fetch
and issue on an implementable simultaneous multithreading
processor. Intl Symp Comp Arch, (ISCA-23):191–202, 1996.
[19] G. Tyson, K. Lick, and M. Farrens. Limited dual path execu-
tion. Techinal Report CSE-TR 346-97, University of Michi-
gan, 1997.
[20] S. Wallace, B. Calder, and D. M. Tullsen. Threaded multiple
path execution. Intl Symp Comp Arch, (ISCA-25):238–249,
1998.