ownership concentration, intellectual capital, and firm performance: evidence from italy
TRANSCRIPT
China-USA Business Review, ISSN 1537-1514
December 2013, Vol. 12, No. 12, 1157-1174
Ownership Concentration, Intellectual Capital, and Firm
Performance: Evidence From Italy
Domenico Celenza, Fabrizio Rossi
University of Cassino and Southern Lazio, Cassino, Italy
The paper extends previous research on the topic of intellectual capital (IC) and the relationship between ownership
concentration (OC) and firm performance. The ambitious goal of this work is to answer three questions: (1)
Whether there is a relationship between IC and firm performance; (2) Whether there is a relationship between the
efficiency of IC and the ownership structure of the Italian listed companies; and (3) If the performance of Italian
listed companies is influenced by the ownership structure and by the efficiency of IC. The results obtained by
investigating on a sample of Italian listed companies during the period 2002-2011 suggest the lack of relationship
between the efficiency of IC and the performance of the companies examined, but show a significant relationship
among OC, the efficiency of IC, and firm performance.
Keywords: ownership structure, largest blockholder, value added intellectual coefficient (VAICTM), firm
performance, agency costs, Italian listed companies
Introduction
During the last century the theory of the firm has undergone a significant evolution. In the academic
literature the firm has been examined from various perspectives: corporate governance, ownership structure,
financial structure, resource-based view, and knowledge-based view. In recent years, a lot of attention has been
shifted to the relationship between physical assets and intangible assets with particular emphasis on the role
intellectual capital (IC) has played in the determination of performance and in value creation.
The study of IC, in the authors’ opinion, is complementary with respect to the more traditional view on
financial structure (Modigliani & Miller, 1958) and on ownership structures, whose line of study starts with
Berle and Means (1932) and continues with Jensen and Meckling (1976), Fama and Jensen (1983), Jensen
(1989), Morck, Shleifer, and Vishny (1988), and more recently with La Porta, Lopez-de-Silanes, and Shleifer
(1999), Faccio and Lang (2002), and Dick and Zingales (2004).
Indeed, a vast literature has developed around knowledge management and IC disclosure (ICD) as drivers
for the firm’s value creation (Williams, 2001; Bontis, 2003).
The importance of the interaction between physical assets and IC could contribute to two basic
Domenico Celenza, Ph.D. in Business Economics, Researcher in Business Economics, Department of Economics and Law,
University of Cassino and Southern Lazio.
Fabrizio Rossi, Ph.D. in Management Engineering, Adjunct Professor of Economics and Business Organization, Department of
Electrical and Information Engineering, University of Cassino and Southern Lazio.
Correspondence concerning this article should be addressed to Fabrizio Rossi, Department of Electrical and Information
Engineering, University of Cassino and Southern Lazio, Via G. Di Biasio 43, Cassino (FR), 03043, Italy. E-mail: [email protected].
DAVID PUBLISHING
D
OWNERSHIP CONCENTRATION, INTELLECTUAL CAPITAL, AND FIRM PERFORMANCE 1158
explanations: The value of the firm depends not only on tangible and financial capital and the informational
efficiency of stock markets but also on the dissemination of information on IC management.
According to a financial perspective, the study of IC leads inevitably, in the authors’ opinion, to the theory
of the valuation of the firm, to the hypothesis of efficient markets and raises questions about the ownership
structure-intellectual capital relationship.
The shareholder theory and stakeholder theory have bridged the gap that has existed in the past as part of a
multidisciplinary approach with the goal of identifying all the drivers which are critical to the creation of value
in the enterprise: Therefore from an exclusively financial perspective there has been a shift to a broader literary
view that has incorporated corporate governance, the interaction between assets, relational networks, and the
evaluation of human capital (Zanda, Lacchini, & Oricchio, 1993).
More and more frequently, in fact, there has been an emphasis on the importance of human capital, IC in
general, and its interaction with physical assets (Grossman & Hart, 1986; Hart, 1995; Hart & Moore, 1990,
1994), to the point of considering the firm as a summation of interdependent assets (Moore, 1992). This
different approach has led many researchers to investigate the changes occurring in businesses as a result of the
market’s growing demand for innovation, which has increased the importance of human capital (Zingales, 2000)
classifying the firm as a network of specific investments that the market cannot replicate (Rajan & Zingales,
2001).
The goal of this paper is to test the relationship between the efficiency of IC, the ownership concentration,
and the performance of a sample of Italian listed companies.
IC and Firm Performance
Several empirical studies demonstrate the impact of intangible assets on both the company’s financial
performance and stock returns. Aboody and Lev (2000) showed that the impact of generating IC on the current
and future operating earnings was very strong. With reference to the chemical industry, for example, they
showed that the increase in research and development (R&D) investments doubled the operating profits.
Bornemann, Knapp, Schneider, and Sixl (1999) found that firms that manage their IC more effectively
were able to secure a very strong competitive advantage over other companies and to perform better than them.
There is no single definition of IC. Stewart (1997), for example, defined IC as the “packaging of useful
knowledge” (p. 67). Instead, Petty and Guthrie (2000) gave IC a much more incisive meaning. They considered
it instrumental both in determining the value of the company and in improving the economic performance of a
nation. In the literature, there is also a widely-accepted idea of the existence of a strong relationship between IC
and the market value of firms. For example, Lev and Zarowin (1999), Lev (2001), and Lev and Radhakrishnan
(2003) focused on the gap between the market value and the book value of companies, while trying to analyze
the invisible values that did not appear in financial statements. More generally, there have been hypotheses
about the weight that IC can have on the value of the company and on the need to consider not only the
financial variables but also the value of IC.
Edvinsson and Malone (1997), indeed, defined IC as the gap that is observed between a firm’s market
value and book value.
Marr, Schiuma, and Neely (2004) proposed an organizational approach based on the knowledge assets
map and the knowledge assets dashboard. The introduction of the knowledge asset map and knowledge asset
dashboard can help firms to identify their key knowledge assets. In particular, the knowledge asset dashboard
OWNERSHIP CONCENTRATION, INTELLECTUAL CAPITAL, AND FIRM PERFORMANCE 1159
stresses the important actor/infrastructure relationship and the dynamic nature of these assets.
Pulic (2000) offered an additional measure of the value of IC through the VAICTM
, which included both
physical capital and human and structural capital.
Firer and Williams (2003) tested the VAIC. However, they failed to find a strong relationship with the
company’s profitability.
On the contrary, Chen, Cheng, and Hwang (2005) found that IC had a very strong impact on the market
value and the performance of firms. In particular, investments in R&D can provide additional information on
structural capital and generate a positive effect on firm value and profitability.
Cabrita and Vaz (2005) studied a sample of 53 Portuguese banks and found that IC is significantly
correlated with the organizational performance of the banks and that the interaction among the components of
the IC generates greater value.
Tan, Plowman, and Hancock (2007) investigated 150 companies listed on the Singapore Stock Exchange
during the period 2000-2002 and found a positive relationship between the VAIC and financial performance in
several sectors, including manufacturing. The results of the manufacturing sector seem to be statistically more
robust. The authors also divided the sample into three groups according to the values of the VAIC and found
that groups of companies with higher VAIC values correspond to results which are positive and statistically
more robust than the values recorded by the companies with the lowest VAIC.
Huang and Wang (2008) examined 37 companies listed on the Taiwan stock market (17 firms belonging to
traditional industrial sector and 24 to the electronics industry) during the period 2001-2003. The two authors
used Ohlson’s model by including in the model both the EVA® (Economic Value Added) indicator and IC in
order to capture residual information. The two authors found that by including certain variables as proxy of IC,
the explanatory power of the regression model increases. In other words, the IC proxy, together with the EVA,
provides incremental information for the evaluation of companies.
Kamath (2008), however, did not see any relation between IC and the traditional performance measures,
such as profitability and market value. Even Ghosh and Mondal (2009), after studying 80 companies operating
in the pharmaceutical and information sector and testing the relationship between IC and company performance,
found that market value and productivity were not significantly related to IC. However, they pointed out that IC
was a good predictor of productivity.
Puntillo (2009) analyzed a sample of banks listed on the Italian stock market, but he failed to find a strong
relationship among IC, return on investment (ROI), and return on asset (ROA).
Muhammad and Ismail (2009) examined 18 Malaysian financial companies in 2007 and found a positive
and statistically significant relationship between the VAIC and ROA.
Carlucci and Schiuma (2010) addressed the issue from another perspective and dwelt on the need to
identify performance indicators to be placed in the perspective of an analytical network approach, as the
selection of these performance indicators is one of the biggest challenges companies will have to face in order
to develop an efficient system of performance measurement. The authors emphasized the importance of the
interaction of the indicators as a guideline for decision makers.
Clarke, Seng, and Whiting (2010) investigated a sample with Australian listed companies during the
period 2004-2008 and found a direct relationship between IC and the performance (ROA and ROE) of
companies.
OWNERSHIP CONCENTRATION, INTELLECTUAL CAPITAL, AND FIRM PERFORMANCE 1160
Ferraro and Veltri (2011) examined a large sample of companies listed on the Italian stock market through
Ohlson’s model and found that the variables of the IC did not show a significant relationship with the market
value of firms.
Gigante and Previati (2011) studied the Italian banking sector during the period 2003-2007, using stock
returns as the dependent variable. The results obtained indicated a positive but not statistically significant
relationship among equity returns, the VAIC and its components.
Maditinos, Chatzoudes, Tsairidis, and Theriou (2011) analyzed the relationship among IC, market value
and financial performance of a sample of 96 Greek listed companies during the period 2006-2008. The results
are not in line with most of the hypotheses, thus emphasizing the failure of the hypothetical relationship
between IC and M/BV. However, they identify a statistically significant relationship between the efficiency of
human capital and ROE.
W. Rehman, C. A. Rehman, A. Rehman, and Zahid (2011) conducted a study on 12 Pakistani companies
and found a positive and statistically significant relationship between the components of the VAIC and the
ROE.
Venugopal and Subha (2012) examined 41 firms producing software in India during the period 2000-2010
and found that, although the efficiency of capital employed and the efficiency of structural capital were both
significantly and positively related to the financial performance, there was no direct relationship between the
VAIC (served as an indicator for measuring IC) and the financial performance. Venugopal and Subha (2012)
emphasized, however, that “The model which studied the relationship between components of VAIC and
financial performance explained the firm’s value better” (p. 130).
Celenza and Rossi (2012a) investigated a sample of 11 Italian listed companies during the period
2003-2008 and measured the relationship between VAIC and M/BV and between VAIC and the profitability
indicators (ROI and ROE) and did not find a significant relationship between the variables.
Celenza and Rossi (2012b) proposed a methodology consisting in the construction of an adjusted
multiplier based on a simplified version of the VAICTM
. The adjusted multiplier is obtained from the product
between the simplified VAIC and the ratio of the ROE of the firm to the ROE of the sector the firm belongs
to. The algorithm allows a better illustration of the efficiency of the IC in a context of sectoral performances.
Javornik, Tekavcic, and Marc (2012) studied 12,000 Slovenian companies during the period 1995-2008
and found a positive and statistically significant relationship among VAIC, ROA, and ROE and between the
components of the VAIC and financial performance.
Janosevic, Dzenopoljac, and Bontis (2013) examined 100 Serbian companies in 2010 and found a positive
and statistically significant relationship between the ROE and the efficiency of capital employed and between
the ROE and the efficiency of human capital.
Celenza and Rossi (2013a) analyzed 23 Italian listed companies belonging to different sectors, during the
period 2003-2008, and found no relationship between financial performance and the VAIC. However, they
found a positive and statistically significant relationship between the changes in market value and changes in
the VAIC and among changes in performance indicators (ROI, ROE, and return on sales (ROS)) and changes in
the VAIC, concluding that the VAIC improves the explanation of the regression analysis and assuming its
utility as an “additional coefficient” in the analysis of equity performance.
More recently, Celenza and Rossi (2013b) investigated the existence of a relationship between the
OWNERSHIP CONCENTRATION, INTELLECTUAL CAPITAL, AND FIRM PERFORMANCE 1161
efficiency of IC and the financial performance of Italian manufacturing firms in the period 2002-2011. The
analysis was divided into three methodological stages. At the first stage, the relationships between the M/BV
and VAIC and among the financial indicators (ROI, ROE, and ROS) and the VAIC were examined. The results
suggest a positive and statistically significant relationship for both the ROI and the ROE. In the case of the
M/BV, however, there is no relationship with the VAIC. The results obtained from the second stage, by
rearranging the sample according to the values of the VAIC, point out a positive and more robust relationship
between the variables analyzed, with the exception of the M/BV. At the last stage of the analysis the results
suggest that the high VAIC portfolios record a higher average performance compared to low VAIC portfolios
and that IC could be a discriminating variable in returns.
Ownership Structure and Firm Performance
The problem of efficiency in the management of business resources has lead many researchers to study the
phenomenon related to the agency costs stemming from the separation between ownership and control and
therefore arising from the divergence of interests between principal and agent. Agency costs, like other costs,
make businesses less competitive; it is therefore necessary to identify the monitoring mechanisms of managers’
opportunistic behavior (majority shareholders) that may minimize these costs.
Berle and Means (1932) were the first to examine the ownership structures of firms and in particular the
problem of the separation of ownership and control, emphasizing the possible divergence between the interests of
owners (founders of the company) and those of the management that manages the resources.
Jensen and Meckling (1976) examined the agency costs caused by the possible opportunistic behavior of
managers whose utility function may diverge from the interests of the ownership. They could manage the
resources in an inefficient manner in order to maximize their utility function.
Fama (1980) starting with the assumption that markets are fully efficient, emphasizes the importance of
managerial resources as a monitor of mangers’ opportunistic behavior. If there exists a managerial market in
which skills are traded, it is in the manager’s interest not to depreciate his skills in order to avoid reducing his
compensation and incentives. Thus a manager who does not maximize the firm’s economic value undergoes a
depreciation of its capabilities on the market of human resources.
Jensen and Ruback (1983) argued that the market for corporate control represents the largest component of
managerial resources and therefore a manager who implements opportunistic behavior, violating the principle of
the creation and maximization of value, could be replaced by the takeover.
Fama and Jensen (1983), however, point out that there is unnecessarily a monotonically decreasing
relationship between agency costs and the share held by managers. With the increase of the stake they own,
managers could avoid their dismissal, as it becomes difficult for other managers to take over.
Demsetz (1983) does not believe that there is an appropriate ownership structure for all situations if the
value of the firm’s assets is to be maximized. As he writes:
The ownership structure likely to maximize the value of the firm’s assets depends on the technology of the tasks
required of the firm’s labor force, on the desired scale of operation and on the managerial ability of potential owners of the
firm. No single ownership structure is suitable for all situations if the value of the firm’s assets is to be maximized. In
particular, from the viewpoint of the owners(s), the optimal distribution of profits is 100 percent to a single owner-manager
only in special circumstances. (Demsetz, 1983, p. 386)
Demsetz and Lehn (1985), after investigating 511 firms during the period 1976-1980 did not find any
OWNERSHIP CONCENTRATION, INTELLECTUAL CAPITAL, AND FIRM PERFORMANCE 1162
relationship between ownership concentration (OC) and accounting profit rate.
Jensen (1986) believed that by reasoning in terms of free cash flows, the debt may limit any opportunistic
behavior, thus ensuring greater efficiency. He argued that excess cash resources should be distributed to the
shareholders, and removed from the discretion of managers who tend to reinvest them even in the absence of
profitable investment opportunities.
Morck, Shleifer, and Vishny (1988) studied the linear relationship between managerial ownership and
performance on a sample of 371 U.S. companies in 1980, and they found a significant non-monotonic
relationship between the variables.
McConnell and Servaes (1990) analyzed the relationship between Tobin’s Q, insider and blockholder
ownership using two different cross-sectional samples, in 1976 and 1986, respectively, and found a positive but
decreasing relationship with the increase of OC for insider ownerships and a positive but non-significant
relationship for the blockholders.
Cho (1998) examined 326 U.S. companies in 1991 by replicating the work of Morck, Shleifer, and Vishny
(1988) and found a similar non-monotonic relationship between Q and the management shareholding. At the next
stage, however, he found that Q affects the ownership structure but not vice-versa.
Demsetz and Villalonga (2001) investigated the relationship between Tobin’s Q and the managerial
ownership of 223 U.S. firms over the period 1976-1980 and found no statistically significant relationship
between ownership structure and firm performance.
Faccio and Lang (2002) conducted a study on 5,232 companies in 13 countries in Continental Europe and
found that firms are typically widely held for 36.93% and controlled by the family for 44.29%. On average, the
relationship between ownership and control is very high and the pyramid control model is widespread in other
countries as well.
Anderson and Reeb (2003) examined 403 U.S. firms over the 1992-1999 period and found that family firms
represent a widespread pattern and perform better than or as much as non-family firms: the Tobin’s Q for family
firms is higher than in non-family firms.
Caprio and Barontini (2006) studied the relationship between ownership structures and performance of
firms in a sample of 675 listed companies in 11 countries in Continental Europe, and they found that the most
widespread ownership model is the family model and that this model is positive for the operational performance
and the value of the firm.
Earle, Kucsera, and Telegdy (2005) analyzed 168 Hungarian companies listed in the period 1996-2001 and
found that the size of the largest block increases profitability and efficiency strongly and monotonically. They
used two performance measures (ROE and operating efficiency) and found that the second measurement is more
significant than the ROE.
Perrini, Rossi, and Rovetta (2008) investigated a sample of Italian firms during the period 2000-2003 and
found that the OC in the five biggest shareholders is beneficial to firm value. They indeed found a positive
relationship between the top shareholders and Tobin’s Q.
IC, Ownership Structure, and Firm Performance
The relationship between IC and ownership structure except for in emerging countries has been, to the
authors’ knowledge, little investigated. Among the studies that examine the relationship between IC and
ownership structures are Firer and Williams (2005), Saleh, Rahman, and Hassan (2009), Tsai, Yu, and Wen
OWNERSHIP CONCENTRATION, INTELLECTUAL CAPITAL, AND FIRM PERFORMANCE 1163
(2013), Kalyta (2013), and more recently Bohdanowicz and Urbanek (2013).
For example, Firer and Williams (2005) analyzed the relationship between ownership structure and IC
disclosure (ICD) on a sample of 390 listed companies in Singapore in the year 2000. Their results show a
negative and statistically significant relationship between ICD and OC, a positive and significant relationship
between ICD and size and a positive but non-significant relationship with leverage.
Saleh et al. (2009) studied 264 listed companies in Malaysia during the period 2005-2007 in order to
determine whether there is a relationship between the VAIC, the different forms of ownership structures and
profitability. They found a negative but non-statistically significant relationship between the VAIC and leverage
and between the components of VAIC and leverage, while the relationship is positive and statistically significant
between the VAIC and profitability as measured both by ROA and by the market to book value. Lastly, they
found a negative and almost always statistically significant relationship between the VAIC, its components and
family ownership. They concluded that the negative relationship would increase the likelihood of the
opportunistic behavior of family members to the detriment of minority shareholders.
Tsai et al. (2013) examined a sample with firms listed on the Taiwan stock market during the period
2004-2008 using performance measures, such as Tobin’s Q and equity returns on a quarterly basis. As a measure
of IC they used the ratio of spending on human resources and sales, and as an ownership index they used the ratio
of shares held by board directors and the total equity. However, their study did not show any significant
relationship neither between the performance and cost of human resources nor between the performance and
ownership share of the board directors. They found, instead, a negative and statistically significant relationship
between the debt ratio and Tobin’s Q. By dividing instead the ownership structure between family firms and
manager controlling, they found a negative and statistically significant relationship between Tobin’s Q and
spending on human resources in both cases and a positive and significant relationship between equity returns and
spending on human resources. They concluded that Tobin’s Q is an important performance indicator to measure
IC and the high degree of leverage worsens the performance.
Bohdanowicz and Urbanek (2013) investigated a sample of 354 Polish companies listed during the period
2006-2011 for a total of 1,505 firm-year observations. They used a linear regression model to study the
relationship between the VAIC, its components and the various ownership structures. As control variables they
used the debt ratio, firm size, growth opportunities, and free float. The results show a negative and significant
relationship between the VAIC and manager ownership and an almost always positive and statistically significant
relationship between size and VAIC and its components (VAHC and STVA). In addition, there is a negative and
statistically significant relationship among the VAIC, its components and floating funds; instead they found a
positive and statistically significant relationship among the VAIC, its components and the growth opportunities
measured by the M/BV. Finally, they divided the sample into two sub-samples made up of high-tech and non
high-tech, but the results seem to follow the same trend. The authors concluded that the results are inconsistent
with other studies on the relationship between managerial ownership and performance and also in contrast with
the assumptions postulated in the agency theory.
Kalyta (2013) instead used a more original approach to examine whether there is a relationship between the
board where in which there is a higher presence of human capital with greater skills, a higher level of collective
knowledge, and the value of the firm. In particular he focused on two alternative measures based on human
capital and the level of education in the board, on a sample of 1,000 U.S.-listed companies for the period
OWNERSHIP CONCENTRATION, INTELLECTUAL CAPITAL, AND FIRM PERFORMANCE 1164
2007-2010 in order to determine whether there is a relationship between Tobin’s Q and the board’s skills. In the
regression analysis he considered the following as control variables: size, ROA, leverage, the ratio of R&D, and
total assets, the ratio of advertising expenses and total assets, and the market share of the four largest firms in the
reference sector. Except for the size variable which is negative and statistically significant, for all the other
variables (ROA, leverage, R&D, and market share of the four largest firms) he found positive and statistically
significant values.
He continued with a second analysis based on the study of the events and measured the market reaction to
the announcement of the appointment of the board within 10 days of the announcement date. The results obtained
show that the stock market reacts positively to the announcement of the board in the knowledge-intensive sector.
The cumulative abnormal return (CAR) ranges from 1.24% to 1.04% within three days of the announcement date.
The author concludes that the contribution made by human capital to the board for the purpose of value creation
depends on the board’s importance in achieving strategic objectives and therefore the knowledge-intensive firms
require a qualified board with additional skills compared to traditional boards.
Sample, Data, and Survey Methodology
The objective of this research is to help to reduce the gap in the line of study that examines the relationship
between the efficiency of IC and ownership structures. In this regard, 43 Italian listed companies were
investigated during the period 2002-2011. The initial number of companies however is subject to a reduction
due to the incompleteness of the data for six of them: The final number of companies surveyed is therefore 37.
The weight of the initial sample, measured as the ratio between the sum of the market value of the companies
and the total market value is equal to 47.33% (43 companies) and then decreases to 45.34% (37 companies).
The final choice of the sample was carried out by considering the following requisites:
Only companies with ordinary listed shares;
Only companies whose data were complete for all variables in the period 2002-2011;
Companies whose data were available at Datastream, Mediobanca, and Borsa Italiana.
The methodology used in this study is based on the linear regression analysis which has the task of testing
a series of hypotheses in the various stages of investigation.
The first stage analyzes the relationship between the performance of firms, the VAIC and its components
with the following assumptions:
H1: There is a positive and statistically significant relationship between Tobin’s Q (or ROA) and VAIC (or
its components).
H1 is tested using the following equation:
0 1Firm Performance CEit it it (1)
where:
Firm performance = Tobin’s Q or ROA;
CE = Capital Efficiency = VAIC (or its components: STVA; VAHC; and VACA).
H2: There is a relationship between the VAIC (or its components) and the OC.
0 1 2CE OC Control Variablesit it it it (2)
where:
OWNERSHIP CONCENTRATION, INTELLECTUAL CAPITAL, AND FIRM PERFORMANCE 1165
Control variables = debt ratio and log size.
The second stage investigates the relationship between the VAIC (or its components), the ownership
structure, and the control variables with the following assumptions:
H3: There is a relationship between the VAIC (or its components), the OC and firm performance.
H3 is tested using the following equation:
1,2 0 1 2CE OC Control Variablesit it it it (3)
where:
CE1,2 = VAIC1,2, STVA1,2, VAHC1,2, and VACA1,2;
Control variables = debt ratio, log size, and ROA (or Tobin’s Q).
The third stage examines the relationship between performance and ownership structure using Tobin’s Q
and ROA alternately as dependent variables and the OC as an independent variable.
The formulated assumptions are the following:
H4: The OC has a positive effect on firm performance.
H5: The OC and the VAIC have a positive impact on firm performance.
H4 and H5 are tested using the following equations:
0 1 2Firm Performance OC Control Variablesit it it it (4)
0 1 2 3Firm Performance OC VAIC Control Variablesit it it it it (5)
where:
Control variables = debt ratio and Log size.
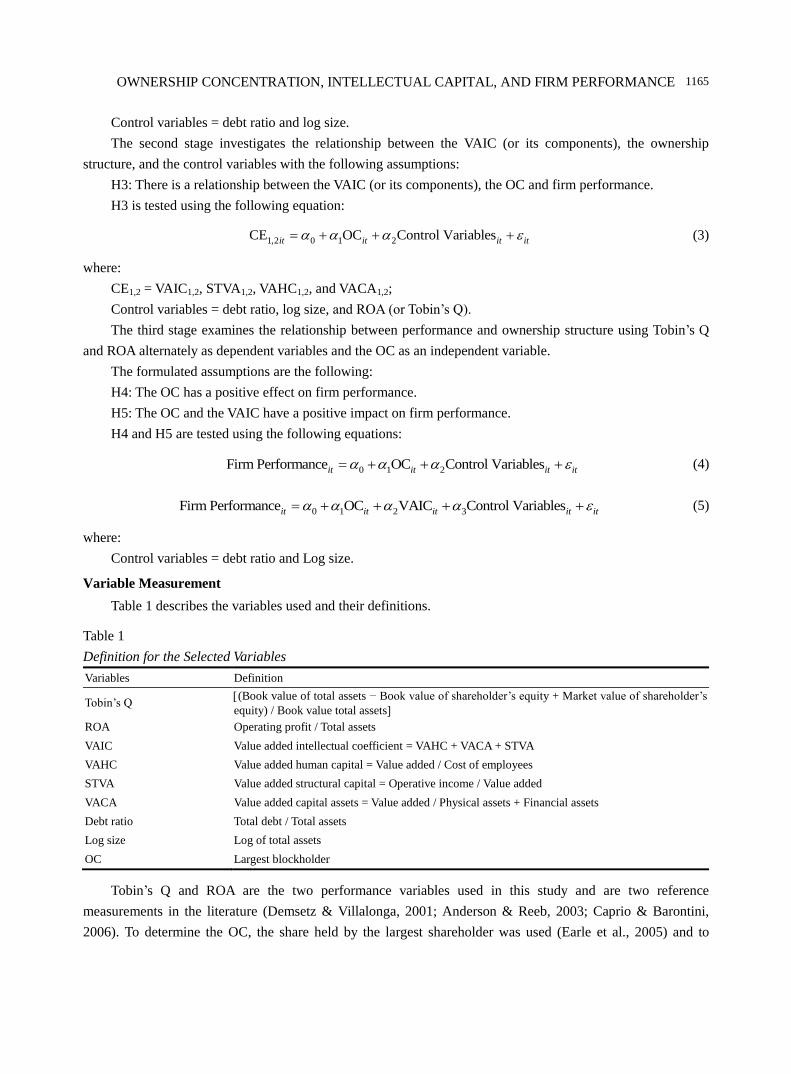
Variable Measurement
Table 1 describes the variables used and their definitions.
Table 1
Definition for the Selected Variables
Variables Definition
Tobin’s Q (Book value of total assets − Book value of shareholder’s equity + Market value of shareholder’s
equity) / Book value total assets
ROA Operating profit / Total assets
VAIC Value added intellectual coefficient = VAHC + VACA + STVA
VAHC Value added human capital = Value added / Cost of employees
STVA Value added structural capital = Operative income / Value added
VACA Value added capital assets = Value added / Physical assets + Financial assets
Debt ratio Total debt / Total assets
Log size Log of total assets
OC Largest blockholder
Tobin’s Q and ROA are the two performance variables used in this study and are two reference
measurements in the literature (Demsetz & Villalonga, 2001; Anderson & Reeb, 2003; Caprio & Barontini,
2006). To determine the OC, the share held by the largest shareholder was used (Earle et al., 2005) and to
OWNERSHIP CONCENTRATION, INTELLECTUAL CAPITAL, AND FIRM PERFORMANCE 1166
measure the efficiency of IC the VAICTM
was used (Pulic, 2004).
As in other studies, two control variables were used in this one as well, in particular debt ratio and log size
(Anderson & Reeb, 2003; Kalyta, 2013).
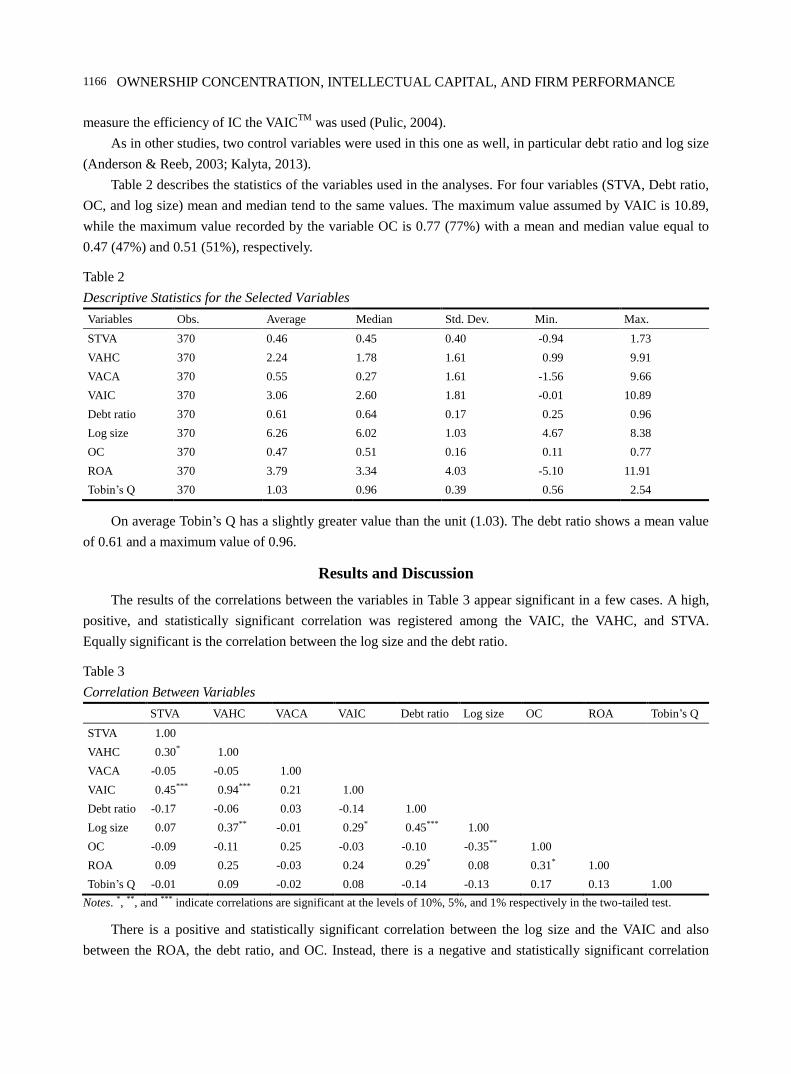
Table 2 describes the statistics of the variables used in the analyses. For four variables (STVA, Debt ratio,
OC, and log size) mean and median tend to the same values. The maximum value assumed by VAIC is 10.89,
while the maximum value recorded by the variable OC is 0.77 (77%) with a mean and median value equal to
0.47 (47%) and 0.51 (51%), respectively.
Table 2
Descriptive Statistics for the Selected Variables
Variables Obs. Average Median Std. Dev. Min. Max.
STVA 370 0.46 0.45 0.40 -0.94 1.73
VAHC 370 2.24 1.78 1.61 0.99 9.91
VACA 370 0.55 0.27 1.61 -1.56 9.66
VAIC 370 3.06 2.60 1.81 -0.01 10.89
Debt ratio 370 0.61 0.64 0.17 0.25 0.96
Log size 370 6.26 6.02 1.03 4.67 8.38
OC 370 0.47 0.51 0.16 0.11 0.77
ROA 370 3.79 3.34 4.03 -5.10 11.91
Tobin’s Q 370 1.03 0.96 0.39 0.56 2.54
On average Tobin’s Q has a slightly greater value than the unit (1.03). The debt ratio shows a mean value
of 0.61 and a maximum value of 0.96.
Results and Discussion
The results of the correlations between the variables in Table 3 appear significant in a few cases. A high,
positive, and statistically significant correlation was registered among the VAIC, the VAHC, and STVA.
Equally significant is the correlation between the log size and the debt ratio.
Table 3
Correlation Between Variables
STVA VAHC VACA VAIC Debt ratio Log size OC ROA Tobin’s Q
STVA 1.00
VAHC 0.30* 1.00
VACA -0.05 -0.05 1.00
VAIC 0.45*** 0.94*** 0.21 1.00
Debt ratio -0.17 -0.06 0.03 -0.14 1.00
Log size 0.07 0.37** -0.01 0.29* 0.45*** 1.00
OC -0.09 -0.11 0.25 -0.03 -0.10 -0.35** 1.00
ROA 0.09 0.25 -0.03 0.24 0.29* 0.08 0.31* 1.00
Tobin’s Q -0.01 0.09 -0.02 0.08 -0.14 -0.13 0.17 0.13 1.00
Notes. *, **, and *** indicate correlations are significant at the levels of 10%, 5%, and 1% respectively in the two-tailed test.
There is a positive and statistically significant correlation between the log size and the VAIC and also
between the ROA, the debt ratio, and OC. Instead, there is a negative and statistically significant correlation
OWNERSHIP CONCENTRATION, INTELLECTUAL CAPITAL, AND FIRM PERFORMANCE 1167
between OC and log size.
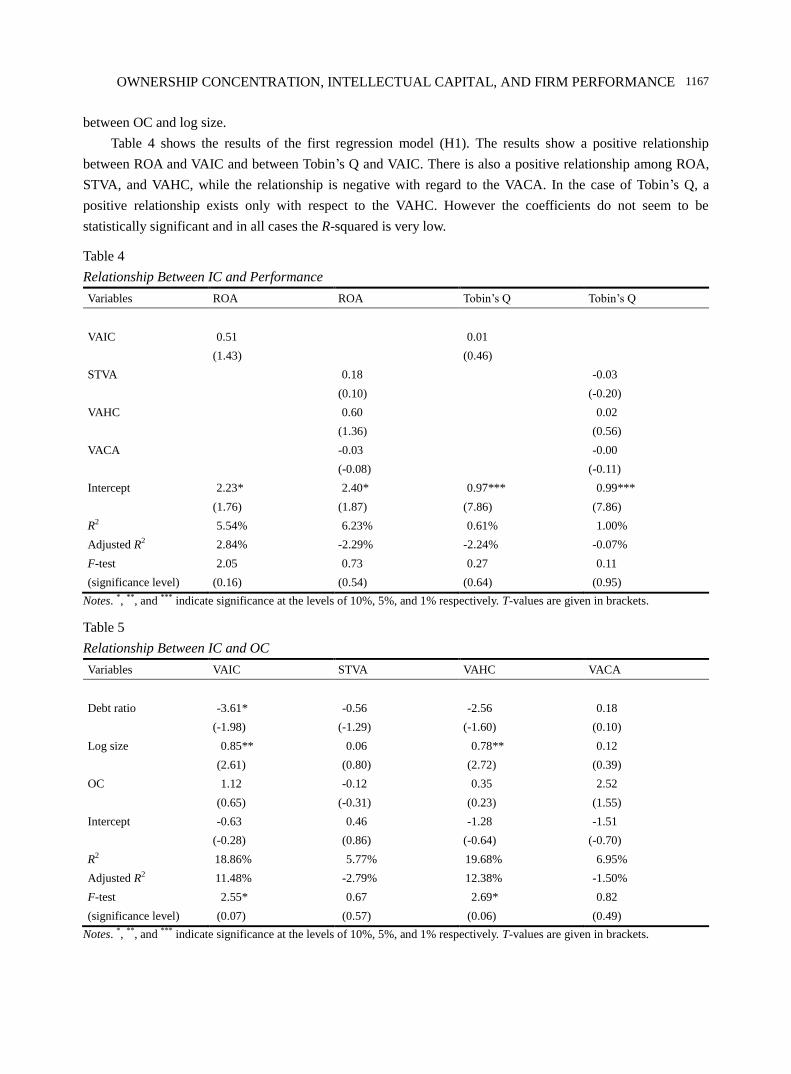
Table 4 shows the results of the first regression model (H1). The results show a positive relationship
between ROA and VAIC and between Tobin’s Q and VAIC. There is also a positive relationship among ROA,
STVA, and VAHC, while the relationship is negative with regard to the VACA. In the case of Tobin’s Q, a
positive relationship exists only with respect to the VAHC. However the coefficients do not seem to be
statistically significant and in all cases the R-squared is very low.
Table 4
Relationship Between IC and Performance
Variables ROA ROA Tobin’s Q Tobin’s Q
VAIC 0.51 0.01
(1.43) (0.46)
STVA 0.18 -0.03
(0.10) (-0.20)
VAHC 0.60 0.02
(1.36) (0.56)
VACA -0.03 -0.00
(-0.08) (-0.11)
Intercept 2.23* 2.40* 0.97*** 0.99***
(1.76) (1.87) (7.86) (7.86)
R2 5.54% 6.23% 0.61% 1.00%
Adjusted R2 2.84% -2.29% -2.24% -0.07%
F-test 2.05 0.73 0.27 0.11
(significance level) (0.16) (0.54) (0.64) (0.95)
Notes. *, **, and *** indicate significance at the levels of 10%, 5%, and 1% respectively. T-values are given in brackets.
Table 5
Relationship Between IC and OC
Variables VAIC STVA VAHC VACA
Debt ratio -3.61* -0.56 -2.56 0.18
(-1.98) (-1.29) (-1.60) (0.10)
Log size 0.85** 0.06 0.78** 0.12
(2.61) (0.80) (2.72) (0.39)
OC 1.12 -0.12 0.35 2.52
(0.65) (-0.31) (0.23) (1.55)
Intercept -0.63 0.46 -1.28 -1.51
(-0.28) (0.86) (-0.64) (-0.70)
R2 18.86% 5.77% 19.68% 6.95%
Adjusted R2 11.48% -2.79% 12.38% -1.50%
F-test 2.55* 0.67 2.69* 0.82
(significance level) (0.07) (0.57) (0.06) (0.49)
Notes. *, **, and *** indicate significance at the levels of 10%, 5%, and 1% respectively. T-values are given in brackets.
OWNERSHIP CONCENTRATION, INTELLECTUAL CAPITAL, AND FIRM PERFORMANCE 1168
With regard to the assumptions made in this phase, they must all be rejected because the VAIC and its
components do not affect the performance of the sample. The results are in line with those of Firer and
Williams (2003), Maditinos et al. (2011) and the previous work of Celenza and Rossi (2012a, 2013a), who did
not find any statistically significant relationship among the VAIC, its components and the performance
variables used (ROI, ROE, ROS, and M/BV).
Table 5 shows the values of the coefficients for hypothesis H2. The relationships between VAIC and OC
and among OC and VAHC and VACA are positive but not statistically significant. As regards the relationship
between the VAIC and the debt ratio, it appears to be negative and statistically significant, while in other cases
it is not significant.
In other words, companies that make excessive use of debt tend to reduce the efficiency of IC. The
variable log size is always positive but it is statistically significant only with respect to the VAIC and VAHC.
The explanation may be due to the fact that larger firms are more attentive to the management of IC and utilize
human resources more efficiently.
Both in the relationship between VAIC and OC and between VAHC and OC, R-squared assumes high
values, ranging from 18.86% (Adjusted R-squared 11.48%) to 19.68% (Adjusted R-squared 12.38%). In both
cases, moreover, the regression is statistically significant. From the results obtained, therefore, hypothesis H2
cannot be totally rejected. There is a relationship between the VAIC and OC, but especially among the VAIC,
log size, and debt ratio. Regarding the variable size, the results are similar to those of Bohdanowicz and
Urbanek (2013), while with regard to debt ratio, the value of the coefficient appears to be in line with the
results of Saleh et al. (2009).
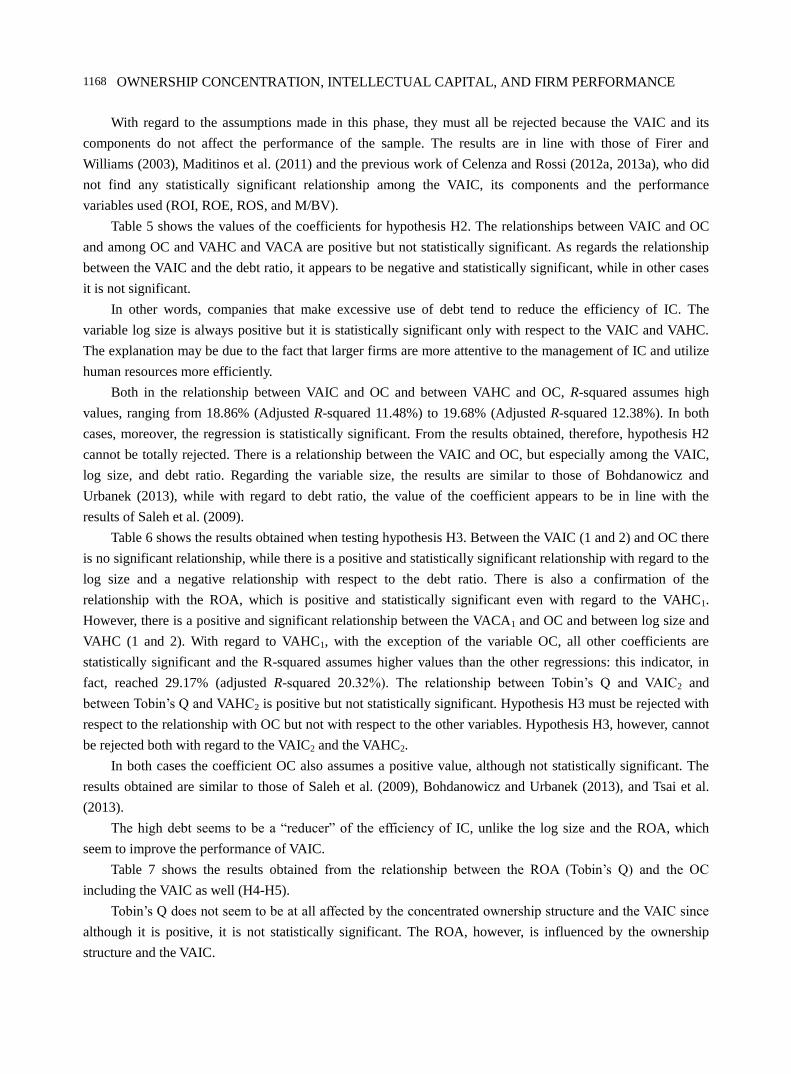
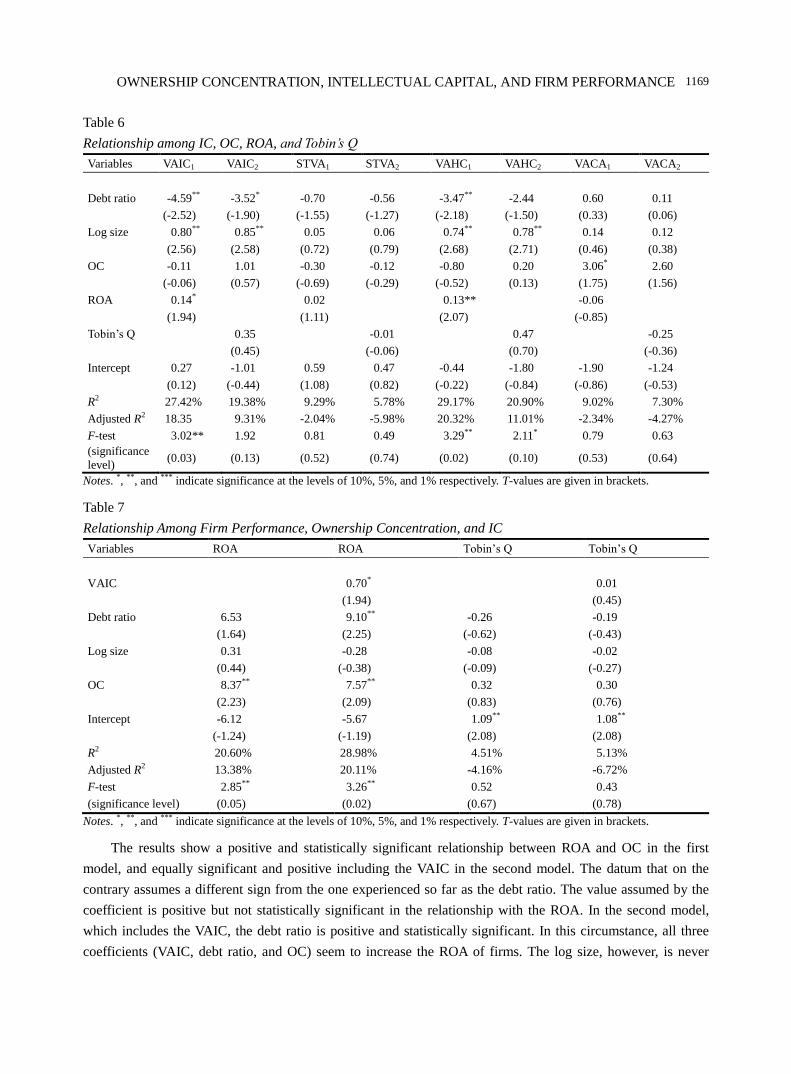
Table 6 shows the results obtained when testing hypothesis H3. Between the VAIC (1 and 2) and OC there
is no significant relationship, while there is a positive and statistically significant relationship with regard to the
log size and a negative relationship with respect to the debt ratio. There is also a confirmation of the
relationship with the ROA, which is positive and statistically significant even with regard to the VAHC1.
However, there is a positive and significant relationship between the VACA1 and OC and between log size and
VAHC (1 and 2). With regard to VAHC1, with the exception of the variable OC, all other coefficients are
statistically significant and the R-squared assumes higher values than the other regressions: this indicator, in
fact, reached 29.17% (adjusted R-squared 20.32%). The relationship between Tobin’s Q and VAIC2 and
between Tobin’s Q and VAHC2 is positive but not statistically significant. Hypothesis H3 must be rejected with
respect to the relationship with OC but not with respect to the other variables. Hypothesis H3, however, cannot
be rejected both with regard to the VAIC2 and the VAHC2.
In both cases the coefficient OC also assumes a positive value, although not statistically significant. The
results obtained are similar to those of Saleh et al. (2009), Bohdanowicz and Urbanek (2013), and Tsai et al.
(2013).
The high debt seems to be a “reducer” of the efficiency of IC, unlike the log size and the ROA, which
seem to improve the performance of VAIC.
Table 7 shows the results obtained from the relationship between the ROA (Tobin’s Q) and the OC
including the VAIC as well (H4-H5).
Tobin’s Q does not seem to be at all affected by the concentrated ownership structure and the VAIC since
although it is positive, it is not statistically significant. The ROA, however, is influenced by the ownership
structure and the VAIC.
OWNERSHIP CONCENTRATION, INTELLECTUAL CAPITAL, AND FIRM PERFORMANCE 1169
Table 6
Relationship among IC, OC, ROA, and Tobin’s Q
Variables VAIC1 VAIC2 STVA1 STVA2 VAHC1 VAHC2 VACA1 VACA2
Debt ratio -4.59** -3.52* -0.70 -0.56 -3.47** -2.44 0.60 0.11
(-2.52) (-1.90) (-1.55) (-1.27) (-2.18) (-1.50) (0.33) (0.06)
Log size 0.80** 0.85** 0.05 0.06 0.74** 0.78** 0.14 0.12
(2.56) (2.58) (0.72) (0.79) (2.68) (2.71) (0.46) (0.38)
OC -0.11 1.01 -0.30 -0.12 -0.80 0.20 3.06* 2.60
(-0.06) (0.57) (-0.69) (-0.29) (-0.52) (0.13) (1.75) (1.56)
ROA 0.14* 0.02 0.13** -0.06
(1.94) (1.11) (2.07) (-0.85)
Tobin’s Q 0.35 -0.01 0.47 -0.25
(0.45) (-0.06) (0.70) (-0.36)
Intercept 0.27 -1.01 0.59 0.47 -0.44 -1.80 -1.90 -1.24
(0.12) (-0.44) (1.08) (0.82) (-0.22) (-0.84) (-0.86) (-0.53)
R2 27.42% 19.38% 9.29% 5.78% 29.17% 20.90% 9.02% 7.30%
Adjusted R2 18.35 9.31% -2.04% -5.98% 20.32% 11.01% -2.34% -4.27%
F-test 3.02** 1.92 0.81 0.49 3.29** 2.11* 0.79 0.63
(significance
level) (0.03) (0.13) (0.52) (0.74) (0.02) (0.10) (0.53) (0.64)
Notes. *, **, and *** indicate significance at the levels of 10%, 5%, and 1% respectively. T-values are given in brackets.
Table 7
Relationship Among Firm Performance, Ownership Concentration, and IC
Variables ROA ROA Tobin’s Q Tobin’s Q
VAIC 0.70* 0.01
(1.94) (0.45)
Debt ratio 6.53 9.10** -0.26 -0.19
(1.64) (2.25) (-0.62) (-0.43)
Log size 0.31 -0.28 -0.08 -0.02
(0.44) (-0.38) (-0.09) (-0.27)
OC 8.37** 7.57** 0.32 0.30
(2.23) (2.09) (0.83) (0.76)
Intercept -6.12 -5.67 1.09** 1.08**
(-1.24) (-1.19) (2.08) (2.08)
R2 20.60% 28.98% 4.51% 5.13%
Adjusted R2 13.38% 20.11% -4.16% -6.72%
F-test 2.85** 3.26** 0.52 0.43
(significance level) (0.05) (0.02) (0.67) (0.78)
Notes. *, **, and *** indicate significance at the levels of 10%, 5%, and 1% respectively. T-values are given in brackets.
The results show a positive and statistically significant relationship between ROA and OC in the first
model, and equally significant and positive including the VAIC in the second model. The datum that on the
contrary assumes a different sign from the one experienced so far as the debt ratio. The value assumed by the
coefficient is positive but not statistically significant in the relationship with the ROA. In the second model,
which includes the VAIC, the debt ratio is positive and statistically significant. In this circumstance, all three
coefficients (VAIC, debt ratio, and OC) seem to increase the ROA of firms. The log size, however, is never
OWNERSHIP CONCENTRATION, INTELLECTUAL CAPITAL, AND FIRM PERFORMANCE 1170
statistically significant. R-squared assumes high values for the first two models: it varies between 20.60%
(Adjusted R-squared 13.38%) and 28.98% (Adjusted R-squared 20.11%). In both the models which assume the
ROA as the dependent variable, the value of F-test is also statistically significant. However, by inserting the
VAIC, the regression is statistically more robust. Therefore, while H4 and H5 must be rejected for Tobin’s Q,
they must be accepted with regard to ROA. There is a positive and statistically significant relationship between
the ROA and OC both by including and excluding VAIC.
The data obtained seem to be consistent with the postulates of Jensen and Meckling (1976) where they
hypothesize that OC would reduce agency costs through a realignment of the utility functions between
managers and ownership, pushing the control capital towards a more efficient management of resources. The
empirical analysis illustrated here, therefore, leads to the conclusion that the increase in debt, the OC and the
efficiency of IC increase the ROA of the company.
Moreover, without getting into the debate of optimal financial structure, which is beyond the scope of this
work, the debt could reduce opportunistic behavior by majority shareholders to the detriment of minority
shareholders. Higher debt shares deprive the ownership of additional free cash flows to be allocated to
investment projects which are not necessarily profitable and it thus becomes a tool for monitoring management,
which in Italian ownership structures is identified, directly or indirectly, with the majority shareholders.
The results obtained may be consistent with the “control hypothesis” proposed in the theory of the agency
costs of free cash flows (Jensen, 1986).
The results of this study are similar to those of Earle et al. (2005) who, while emphasizing the presence of
a non-monotonic relationship, argue that the OC in the hands of a single blockholder improves corporate
performance, especially in terms of operational efficiency.
Summary, Conclusions, and Suggestions
The ambitious goal of this work is to answer three questions: (1) Whether there is a relationship between
IC and the firm’s performance; (2) Whether there is a relationship between the efficiency of IC and the
ownership structure of Italian listed companies; and (3) If the performance of Italian listed companies is
influenced by the ownership structure and efficiency of IC.
During the period 2002-2011, a sample of Italian listed companies was investigated, whose weight in
terms of market capitalization is equal to 45.34%, in order to verify the existence of any significant relationship,
thus providing an answer to the three questions asked.
Regarding the first question, the analysis of the results does not show any statistically significant
relationship between the efficiency of IC, as measured by the VAIC as a proxy, the ROA and Tobin’s Q. The
values of the coefficients, except for the VACA, are always positive but never statically significant. The results
are consistent with other studies in the literature (Firer & Williams, 2003; Puntillo, 2009; Celenza & Rossi,
2012a; Celenza & Rossi, 2013a). The existence of a positive and significant relationship between measures of
performance and the efficiency of IC may depend on both the country in which the analysis is carried out and
the economic sectors observed. In Italy, for example, Celenza and Rossi (2013b) found a positive and
statistically significant relationship in the manufacturing sector.
Regarding the second question, the relationship between the efficiency of IC and OC is often positive but
almost never statistically significant: With regard to the VACA, instead, it is positive and statistically significant
considering the ROA as an added control variable. There was a negative and significant relationship among the
OWNERSHIP CONCENTRATION, INTELLECTUAL CAPITAL, AND FIRM PERFORMANCE 1171
debt ratio and the VAIC and a positive relationship with respect to the size of the firms. The relationships
between size and VAHC and between debt ratio and VAHC have the same sign. The size of the firms, therefore,
could positively influence the efficiency of IC: The larger companies probably pay more attention to the
management of IC. Contrary to size, debt ratio could curb the efficiency of IC. The results appear to be similar
to those of Bohdanowicz and Urbanek (2013) with regard to the variable size, and to those of Saleh et al. (2009)
with reference to the debt ratio.
However, the existence of a relationship between ownership structure and the efficiency of IC cannot be
excluded.
With regard to the third and final question, the matter appears to be more complex. The results obtained in
this study show a relationship between the performance of the companies investigated and the ownership
structure of the reference shareholder. The relationship is statistically significant with both the OC and debt,
while the variable size alternates its sign but is not significant. However, the results need further study in the
future to better understand the nature of this relationship.
Firstly, it is necessary to extend the number of observations to verify if the OC really is a business model
that can positively influence performance without any expropriation of the benefits of minority shareholders.
The presence of a form of family and pyramid capitalism could drive the largest blockholder to implement
opportunistic behavior towards minority shareholders and expropriate them of their benefits.
Secondly, the variable debt ratio should be examined in more detail. In this study it is positive and
statistically significant: at a first glance this would lead one to think that the high debt, together with the effect
produced by OC, improves the performance of enterprises. The debt could therefore represent a tool for
monitoring the opportunistic behavior of managers and be consistent with the “control hypothesis” formulated
by Jensen (1986).
Further research in the future may be useful to investigate both the relationship between the ownership
structure and the efficiency of IC, perhaps using other proxies instead of VAIC, and the nature of the
relationship among performance, debt, and OC. Regarding the latter aspect, it might be interesting to correlate
the various ownership forms with the performance and efficiency of IC. In the authors’ opinion, it could be of
equal interest to study the relationship among the efficiency of IC, board size, and the board’s compensation
and, in particular, to verify the reaction of stock returns at the announcement of a highly qualified board.
The relationship between the performance and the efficiency of IC, in spite of the vast literature, still
shows some “dark sides” and divergent results. The question is whether and how, IC can really affect
investment decisions.
References
Aboody, D., & Lev, B. (2000). Information asymmetry, R&D, and insider gains. Journal of Finance, 55(6), 2747-2766.
Anderson, R. C., & Reeb, D. M. (2003). Founding-family ownership and firm performance: Evidence from the S&P 500. Journal
of Finance, 58(3), 1301-1328.
Berle, A. A., & Means, G. C. (1932). The modern corporation and private property. New York: Macmillan Publishing Co..
Bohdanowicz, L., & Urbanek, G. (2013). The impact of ownership structure on intellectual capital efficiency: Evidence from the
polish emerging market. Retrieved from http://papers.ssrn.com/sol3/papers.cfm?abstract_id=2372412
Bontis, N. (2003). Intellectual capital disclosure in Canadian corporations. Journal of Human Resource Cost and Accounting,
7(1-2), 9-20.
Bornemann, M., Knapp, A., Schneider, U., & Sixl, K. I. (1999). Holistic measurement of intellectual capital. Proceedings from
International Symposium: Measuring and Reporting Intellectual Capital: Experiences, Issues, and Prospects. OECD,
OWNERSHIP CONCENTRATION, INTELLECTUAL CAPITAL, AND FIRM PERFORMANCE 1172
Amsterdam.
Cabrita, M., & Vaz, J. L. (2005). Intellectual capital and value creation: Evidence from the Portuguese banking industry.
Electronic Journal of Knowledge Management, 4(1), 11-20.
Caprio, L., & Barontini, R. (2006). The effect of family control on firm value and performance: Evidence from continental Europe.
European Financial Management, 12(5), 689-723.
Carlucci, D., & Schiuma, G. (2010). Determining key performance indicators: An analytical network approach. In A.
Gunasekaran, & M. Sandhu (Eds.), Handbook on business information systems (pp. 515-536). Singapore: World Scientific
Publishing Company.
Celenza, D., & Rossi, F. (2012a). The relationship between intellectual capital (IC) and stock market performance: Empirical
evidence from Italy. Journal of Modern Accounting and Auditing, 8(11), 1729-1741.
Celenza, D., & Rossi, F. (2012b). The human capital valuation in IC Paradigm: An empirical proposal. China-USA Business
Review, 11(11), 525-1541.
Celenza, D., & Rossi, F. (2013a). Intellectual capital (IC) and performance of listed companies: Empirical evidence from Italy.
Proceedings from 8th International Forum on Knowledge Asset Dynamics (IFKAD 2013) (pp. 515-531). Zagreb, Croatia.
Celenza, D., & Rossi, F. (2013b). Value added intellectual coefficient (VAICTM) and financial performance: Empirical evidence
from the Italian manufacturing sector. Proceedings from 6th European Conference on Intellectual Capital ECIC 2014.
Slovak University of Technology (STU), Trnava (Slovak Republic).
Chen, M. C., Cheng, S. J., & Hwang, Y. (2005). An empirical investigation of the relationship between intellectual capital and
firms’ market value and financial performance. Journal of Intellectual Capital, 6(2), 159-176.
Cho, M. H. (1998). Ownership structure, investment, and the corporate value: An empirical analysis. Journal of Financial
Economics, 47(1), 103-121.
Clarke, M., Seng, D., & Whiting, R. H. (2010). Intellectual capital and firm performance in Australia. Retrieved from
http://otago.ourarchive.ac.nz/bitstream/handle/10523/1585/Working_paper_Clarke-Seng-Whiting-revised.pdf
Demsetz, H. (1983). The structure of ownership and the theory of the firm. Journal of Law and Economics, 26(2), 375-390.
Demsetz, H., & Lehn, K. (1985). The structure of corporate ownership: Causes and consequences. Journal of Political Economy,
93(6), 1155-1177.
Demsetz, H., & Villalonga, B. (2001). Ownership structure and corporate performance. Journal of Corporate Finance, 7(3),
209-233.
Dick, A., & Zingales, L. (2004). Private benefits of control: An international comparison. Journal of Finance, 59(2), 537-600.
Earle, J. S., Kucsera, C., & Telegdy, A. (2005). Ownership concentration and corporate performance on the Budapest stock
exchange: Do too many cooks spoil the goulash? Corporate Governance: An International Review, 13(2), 254-264.
Edvinsson, L., & Malone, M. S. (1997). Intellectual capital: Realizing your company’s true value by finding its hidden
brainpower. New York: Harper Business.
Faccio, M., & Lang, L. H. P. (2002). The ultimate ownership of western European corporations. Journal of Financial Economics,
65(3), 365-395.
Fama, E. F. (1980). Agency problems and the theory of the firm. Journal of Political Economy, 88(2), 288-307.
Fama, E. F., & Jensen, M. C. (1983). Separation of ownership and control. Journal of Law and Economics, 26(2), 301-325.
Ferraro, O., & Veltri, S. (2011). The value relevance of intellectual capital on the firm’s market value: An empirical survey on the
Italian listed firms. International Journal of Knowledge-Based Development, 2(1), 66-84.
Firer, S., & Williams, S. M. (2003). Intellectual capital and traditional measures of corporate performance. Journal of Intellectual
Capital, 4(3), 348-360.
Firer, S., & Williams, S. M. (2005). Firm ownership structure and intellectual capital disclosures. SA Journal of Accounting
Research, 19(1), 1-18.
Ghosh, S., & Mondal, A. (2009). Indian software and pharmaceutical sector IC and financial performance. Journal of Intellectual
Capital, 10(3), 369-388.
Gigante, G., & Previati, D. (2011). A knowledge oriented approach to the investigation of italian banks performances.
International Journal of Economics and Finance, 3(5), 12-23.
Grossman, S., & Hart, O. (1986). The costs and benefits of ownership: A theory of vertical and lateral integration. Journal of
Political Economy, 94(4), 691-719.
Hall, R. (1992). The strategic analysis of intangible resources. Strategic Management Journal, 13(2), 135-144.
Hart, O. (1995). Firms, contracts, and financial structures. Oxford: Oxford University Press.
OWNERSHIP CONCENTRATION, INTELLECTUAL CAPITAL, AND FIRM PERFORMANCE 1173
Hart, O., & Moore, J. (1990). Property right and nature of the firm. Journal of Political Economy, 98(6), 1119-1158.
Hart, O., & Moore, J. (1994). A theory of debt-based on the inalienability of human capital. The Quarterly Journal of Economics,
109(4), 841-879.
Huang, C., & Wang, M. C. (2008). The effects of economic value added and intellectual capital on the market value of firms: An
empirical study. International Journal of Management, 25(4), 722-731.
Janosevic, S., Dzenopoljac, V., & Bontis, N. (2013). Intellectual capital and financial performance in Serbia. Knowledge and
Process Management, 20(1), 1-11.
Javornik, S., Tekavcic, M., & Marc, M. (2012). The efficiency of intellectual capital investments as a potential leading indicator.
International Business & Economic Research Journal, 11(5), 535-558.
Jensen, M. C. (1986). Agency costs of free cash flow, corporate finance and takeovers. American Economic Review, 76(2),
323-329.
Jensen, M. C. (1989). Eclipse of public corporation. Harvard Business Review, 67(5), 61-74.
Jensen, M. C., & Meckling, W. H. (1976). Theory of the firm: Managerial behavior, agency costs, and ownership structure.
Journal of Financial Economics, 3(4), 305-360.
Jensen, M. C., & Ruback, R. S. (1983). The market for corporate control: The scientific evidence. Journal of Financial Economics,
11(1-4), 5-50.
Kalyta, P. (2013). Corporate governance, human capital and firm value. Retrieved from
http://papers.ssrn.com/sol3/papers.cfm?abstract_id=2271223
Kamath, G. B. (2008). Intellectual capital and corporate performance in Indian pharmaceutical industry. Journal of Intellectual
Capital, 9(4), 684-784.
La Porta, R., Lopez-De-Silanes, F., & Shleifer, A. (1999). Corporate ownership around the world. Journal of Finance, 54(2),
471-517.
Lev, B. (2001). Intangibles: Management and reporting. Washington, D.C.: Brookings Institution Press.
Lev, B., & Radhakrishnan, S. (2003). The measurement of firm-specific organization capital. NBER Working Paper, No. 9581,
National Bureau of Economic Research, Cambridge.
Lev, B., & Zarowin, P. (1999). The boundaries of financial reporting and how to extend them. Journal of Accounting Research,
37(2), 353-385.
Maditinos, D., Chatzoudes, D., Tsairidis, C., & Theriou, G. (2011). The impact of intellectual capital on firm’s market value and
financial performance. MIBES Transactions, 5(1), 58-72.
Marr, B., Schiuma, G., & Neely, A. (2004). Intellectual capital—Defining key performance indicators for organizational
knowledge assets. Journal of Intellectual Capital, 10(5), 551-569.
McConnell, J., & Servaes, H. (1990). Additional evidence on equity ownership and corporate value. Journal of Financial
Economics, 27(2), 595-612.
Mediobanca. (2012). Indices and data on investments in listed securities. Milan: Mediobanca Research.
Modigliani, F., & Miller, M. H. (1958). The cost of capital, corporation finance and the theory of investment. American Economic
Review, 48(3), 261-297.
Moore, J. (1992). The firm as a collection of assets. European Economic Review, 36(2-3), 493-507.
Morck, R., Shleifer, A., & Vishny, R. W. (1988). Management ownership and market valuation: An empirical analysis. Journal of
Financial Economics, 20(1-2), 293-315.
Muhammad, N., & Ismail, A. (2009). Intellectual capital efficiency and firm’s performance: Study on Malaysian financial sectors.
International Journal of Economics and Finance, 1(2), 206-212.
Perrini, F., Rossi, G., & Rovetta, B. (2008). Does ownership structure affect performance? Evidence from the Italian market.
Corporate Governance: An International Review, 16(4), 312-325.
Petty, P., & Guthrie, J. (2000). Intellectual capital literature review: Measurement, reporting, and management. Journal of
Intellectual Capital, 1(2), 155-175.
Pulic, A. (2000). MVA and VAIC™ analysis on randomly-selected companies from FTSE 250. Retrieved July 12, 2011, from
http://www.vaic-on.net
Pulic, A. (2004). Intellectual capital—Does it create or destroy value?. Measuring Business Excellence, 8(1), 62-68.
Puntillo, P. (2009). Intellectual capital and business performance. Evidence from Italian banking industry. Electronic Journal of
Corporate Finance, 4(12), 96-115.
Rajan, R. G., & Zingales, L. (2001). The firm as a dedicated hierarchy: A theory of the origins and growth of firms. The Quarterly
OWNERSHIP CONCENTRATION, INTELLECTUAL CAPITAL, AND FIRM PERFORMANCE 1174
Journal of Economics, 116(3), 805-851.
Rehman, W., Rehman, C. A., Rehman, A., & Zahid, A. (2011). Intellectual capital performance and its impact on corporate
performance: Empirical evidence from modaraba sector of Pakistan. Australian Journal of Business and Management
Research, 1(16), 8-16.
Saleh, N. M., Rahman, M. R. C. A., & Hassan, M. S. (2009). Ownership structure and intellectual capital performance in
Malaysia. Asian Academy of Management Journal of Accounting and Finance, 5(1), 1-29.
Stewart, T. A. (1997). Intellectual capital: The wealth of new organizations. London: Nicholas Brealey Publishing.
Tan, H. P., Plowman, D., & Hancock, P. (2007). Intellectual capital and financial returns of companies. Journal of Intellectual
Capital, 8(1), 76-95.
Tsai, J. H., Yu, J., & Wen, S. J. (2013). Intellectual capital, corporate governance and firm performance. Information Management
and Business Review, 5(10), 482-491.
Venugopal, D., & Subha, M. V. (2012). Intellectual capital and value creation efficiency—An empirical investigation into the
intellectual capital and financial performance of Indian software industry. European Journal of Social Sciences, 33(1),
119-132.
Williams, S. M. (2001). Are intellectual capital performance and disclosure practices related?. Journal of Intellectual Capital, 2(3),
192-203.
Zanda, G., Lacchini, M., & Oricchio, G. (1993). La valutazione del capitale umano dell’impresa. Turin: Giappichelli Editor.
Zingales, L. (2000). In search of new foundations. Journal of Finance, 55(4), 1623-1653.