corporate governance, pyramid ownership, and firm value
TRANSCRIPT
Journal of Asian Business and Economic Studies
Volume 25, Special Issue 01 (2018), 85-102
www.jabes.ueh.edu.vn
Journal of Asian Business and Economic Studies
Corporate governance, pyramid ownership,
and firm value: Evidence from Vietnam
TRAN THI HAI LYa, NGUYEN KIM DUCb
a, b University of Economics HCMC
A R T I C L E I N F O A B S T R A C T
Received 15 Mar. 2016
Revised 30 Aug. 2016
Accepted 1 Jan. 2018
Available online
12 January 2018
JEL classifications:
C24; D22; G32
KEYWORDS
Corporate governance
index
Corporate governance
Pyramid ownership
This paper examines the relation among corporate governance
practices, pyramid ownership structure, and firm value by using a
sample of Vietnamese listed firms. Using a sample of 103 non-financial
firms listed on HOSE for the period from 2012 to 2014, and employing
two-stage least square regression (2SLS) to deal with potential
endogeneity, we find that some indicators, commonly adopted as a key
components of corporate governance, such as size or independence of
board of directors, are imperfect proxies for corporate governance
practices. Our results indicate that it is better to employ a corporate
governance index (CGI), including 117 criteria developed by Connelly,
Limpaphayom, and Nagarajan (2012) since it allows for more
comprehensive estimation of corporate governance. More
interestingly, our results show that the pyramid ownership plays an
important role in the effect of corporate governance on firm value. The
results are consistent regardless of whether companies have high or
low family ownership.
a Email: [email protected]*, correspondence author b Email: [email protected]
86 Tran Thi Hai Ly & Nguyen Kim Duc, JABES Vol. 25(Special 01), Feb. 2018, 85-102
1. Introduction
Maximizing firm value is the most vital goal of any enterprises. In the modern
corporations, shareholders and their representatives (board of directors) do not manage
company directly. Instead, management teams are authorized to make decisions on behalf
of shareholders. The separation between the ownership and management rights causes the
agency problem (Jensen & Meckling, 1976). Therefore, shareholders need a procedure,
which is known as corporate governance, to control the management board and to ensure
their decisions are to maximize the shareholders’ value.
There are several empirical studies investigating the relation between corporate
governance and firm value in other countries as well as in Vietnam. Based on these studies,
the proxies for corporate governance can be divided into two groups: (i) conventional
individual governance indicators, such as the board independence (Hermalin & Weisbach,
1991), CEO duality (Chen, Lin, & Yi, 2008), board size (Yermack, 1996); and (ii) a set of
separate criteria to evaluate the overall quality of corporate governance practices, called the
corporate governance index (CGI). Conventional individual indicators are not good proxies
for corporate governance practices, while previous CGIs for US companies (Gompers, Ishii,
& Metrick, 2003; Brown & Caylor, 2006; Bebchuk, Cohen, & Ferrell, 2009) and German firms
(Drobetz, Schillhofer, & Zimmerman, 2003) are difficult to apply to ASEAN markets
(Connelly, Limpaphayom, & Nagarajan, 2012) because these indexes are developed to assess
the extent of takeover defences.
A corporate governance index that is gauged from 117 separate criteria developed by
Connelly, Limpaphayom, and Nagarajan (2012) is known as the most comprehensive index
of the quality of corporate governance practices (we call it a new corporate governance index
or CGI in short form). This paper will examine the validity of this corporate governance
index using a sample of Vietnamese listed firms. We ask whether CGI a good proxy of
corporate governance practices in Vietnam in determining firm value. To do so, we compare
this CGI with conventional indicators of corporate governance. In fact, benefits resulting
from a good corporate governance practices might be cancelled out by the presence of
pyramid structures (Connelly, Limpaphayom, & Nagarajan, 2012). To take this point into
account, we further investigate whether the relation between corporate governance and firm
value is moderated by pyramid structures.
Our study contributes to the literature on corporate governance and firm performance.
It provides an understanding about the role of corporate governance in explaining firm
value under the moderation of pyramid ownership and family ownership that is common
in Vietnam.
The rest of the paper is structured as follows. Section 2 presents the literature review.
Section 3 describes the model, estimation method and data. Section 4 presents and discusses
Tran Thi Hai Ly & Nguyen Kim Duc, JABES Vol. 25(Special 01), Feb. 2018, 85-102 87
the results. Section 5 concludes the paper.
2. Literature review
2.1. Theoritical framework
The new CGI is an index that measures corporate governance. Based on Organization for
Economic Cooperation and Development (OECD, 1999, 2004), Connelly, Limpaphayom and
Nagarajan (2012) developed this index which included 117 criterias and applied it for
Thailand market. CGI is a set of indicators including a number of mandatory and voluntary
information that reflect the quality of corporate governance practices. Therefore, CGI might
be accepted as the fully corporate governance index.
The first version of CGI included 57 criterias. After being applied in 2000, 2002, and 2004,
some questions in the first version were modified, while some others questions were added,
resulting in a current (new) version of CGI with 117 separate criteria. Although the number
and format of questions have been changed, the structure of CGI still remains in line with
OECD's corporate governance principles (OECD, 1999). These criterias are classified into
five groups: (i) Shareholders' rights (total of 22 criterias with maximum score of 42); (ii)
Equitable treatment of shareholders (total of 13 criterias, maximum score of 24); (iii) Role of
stakeholders (total of 9 criterias with maximum score of 14); (iv) Disclosure and
transparency (total of 32 criterias with maximum score of 40); (v) Board responsibilities (total
of 41 criterias with maximum score of 50) (see Connelly, Limpaphayom, & Nagarajan (2012)
for more details).
Ownership and controlling rights can be shown by cash flow rights and voting rights
respectively. In most cases, it follows the one share, one vote rule. However, this may not be
a case when there are indirect shareholdings stemming from the differences in measuring
the cash flow and voting rights. Pyramid ownership exists if a firm has indirect ownership
structure. In other words, pyramid structure is a top-down chain of control by affiliated
firms (La Porta, Lopez-de-Silanes, & Shleifer, 1999), in which, final shareholders are located
at the top of the pyramid, while intermediary firms are located underneath. This structure
leads to the separation between ownership and voting rights in companies located in the
lower part of the pyramid (Claessens, Djankov, & Lang, 2000). Therefore, pyramid structure
allows shareholders to hold fewer shares but possess greater voting rights (Connelly,
Limpaphayom, & Nagarajan, 2012).
In the literature, information asymmetry is a key hypothesis explaining the relationship
between shareholders and managers. According to the agency theory introduced by Jensen
& Meckling (1976), agency problem will appear when one or more persons (principals)
employs other person (agents) to perform certain tasks on principals’ behalf. The principals
delegate decision-making rights to agents with a desire that the agent will act to maximize
their interests. However, due to information asymmetry the agent might has different
88 Tran Thi Hai Ly & Nguyen Kim Duc, JABES Vol. 25(Special 01), Feb. 2018, 85-102
interests (Eisenhardt, 1989). This means that managers can make decisions that maximize
their personal benefits or they try to avoid bearing risk, instead of maximizing firm’s value.
Therefore, shareholders have to control the activities of management teams to ensure that
the teams serves their interests. There are some ways for shareholders to limit the agency
problem such as establishing incentive schemes and appropriate compensations. Among
them, corporate governance with the supervision of the board of directors is a popular
practice that is expected to mitigate the divergences of management from shareholders’
interest. Besides, there are agency conflicts between majority shareholders and
outside/minority shareholders in family firms that are common in developing countries,
stemming from the lack of legal rights and investor protection. Therefore, corporate
governance is expected to handle these conflicts in these companies.
2.2. Corporate governance and firm value
Previous empirical studies usually employ conventional proxies for corporate
governance such as board composition (Agrawal & Knoeber, 1996; Hermalin & Weisbach,
2003), the ratio of independent directors (Hermalin & Weisbach, 1991; Daraghma &
Alsinawi, 2010; Rouf, 2011; Turki & Sedrine, 2012), CEO duality (Chen, Lin, & Yi, 2008; Rouf,
2011), board size (Yermack, 1996; Eisenberg, Sundgren, & Wells, 1998; Andres, Azofra, &
Lopez, 2005; Rouf, 2011), ownership concentration (Himmelberg et al., 1999; Morck et al.,
1988; Barontini & Caprio 2006). The fact is that, findings from these studies are inconsistent.
One could not conclude the benefits coming from good corporate governance practices
(Cheung et al., 2014). Because of inconclusive results, a composite corporate governance
index seems attractive. A composite index of corporate governance will mitigate the conflict
across individual corporate indicators.
There are several studies examining the impact of corporate governance on firm value.
In developed countries, Gompers, Ishii, and Metrick (2003), Drobetz, Schillhofer, and
Zimmerman (2003), Bebchuk, Cohen and Ferrell (2009) and Brown and Caylor (2006) are
four outstanding studies in this field. These studies attempt to construct composite
corporate governance indexes and then empirically test the relation between constructed
CGIs and firm value. However, their indexes are difficult to apply to ASEAN markets
because they are primarily focus on takeover defenses that is very rare in ASEAN countries.
Therefore, researchers still construct CGIs for emerging countries in Asia, such as Korea
(Black et al., 2006), HongKong (Cheung et al., 2007), Thailand (Connelly, Limpaphayom, &
Nagarajan, 2012). Interestingly, when using the same CGI as a proxy for corporate
governance, all of the studies report a significantly and consistently positive correlation
between corporate governance and firm value. This implies that to evaluate the impact of
corporate governance on firm performance, one needs an appropriate measure for corporate
governance.
Although corporate governance is found as a determinant of firm value, one may ask if
the relationship between corporate governance remains unchanged when existing a
Tran Thi Hai Ly & Nguyen Kim Duc, JABES Vol. 25(Special 01), Feb. 2018, 85-102 89
complex ownership structure, such as pyramid ownership. In the pyramid ownership
structure, final shareholders can benefit for themselves but cost non-controlling
shareholders. This exploitation might be even stronger in countries where legal regulations
to protect non-controlling shareholders are weak (Xia, 2008). Claessens et al. (2002) support
this argument. They document the evidence in eight countries in East Asia that firm value
increases with an increase in ownership of final control shareholders, but decreases with an
increase in their voting rights. Subsequent studies in India (Bertrand, Mehta, &
Mullainathan, 2002), emerging markets (Lins, 2003), and countries in East Asia (Lemmon &
Lins, 2003) also report similar results. Connelly, Limpaphayom, and Nagarajan (2012)
investigates the impact of pyramid ownership on the relation between corporate governance
and firm value and find that there is a positive relation between CGI and firm value for their
full sample. However, this relation is significance only for firms those do not have pyramid
structure. These findings indicate that there is an important role of pyramid structures
moderating in the relation between corporate governance and firm value.
3. Data and Methodology
3.1. Empirical model
CGI developed by Connelly, Limpaphayom, and Nagarajan (2012) have three
advantages making it more effective than conventional measures and previous indexes.
Firstly, CGI is a set of separate criteria so it might captures many dimensions of the quality
of corporate governance. Secondly, CGI reveals the actually implemented practices since it
reflects the corporate governance related activities and firm disclosures. In particular, CGI
can reflect the missing indicators, match requirements by law, or achieve the international
best practices. Finally, the index is developed based on the previous reliable foundations,
including OECD's corporate governance principles, economic and financial theories, and
empirical research findings. Because of these advantages of CGI, it will be employed as a
composite corporate governance index in this study.
Following Connelly, Limpaphayom, and Nagarajan (2012) and Cheung et al. (2014), we
first use conventional proxies for corporate governance such as board size and board
independence (Model 1). Then, CGI will be included to evaluate the relation between
corporate governance and firm value (Model 2).
TOBINQit = β0 + β1 BOD_SIZEit + β2 BOD_INDit + β3 SIZEit + β4FIRM_AGEit + β5 ROAit + β6
CAP_EXPit + β7 LEVERit + εit (1)
TOBINQit = β0 + β1 CGIit + β2 BOD_SIZEit + β3 BOD_INDit + β4 SIZEit + β5 FIRM_AGEit + β6
ROAit + β7 CAP_EXPit + β8 LEVERit + εit (2)
where TOBINQit is a measure of firm value of firm i at year t, all independent variables are presented
in the Table 1. εit is the random error term.
Pooled OLS, Fixed Effects Model (FE) and Random Effects Model (RE) will be applied for the
90 Tran Thi Hai Ly & Nguyen Kim Duc, JABES Vol. 25(Special 01), Feb. 2018, 85-102
Model (1) to (4). F-test, LM-test (Breusch-Pagan Lagrange Multiplier), and Hausman-test will be
used to select the most appropriate regression model.
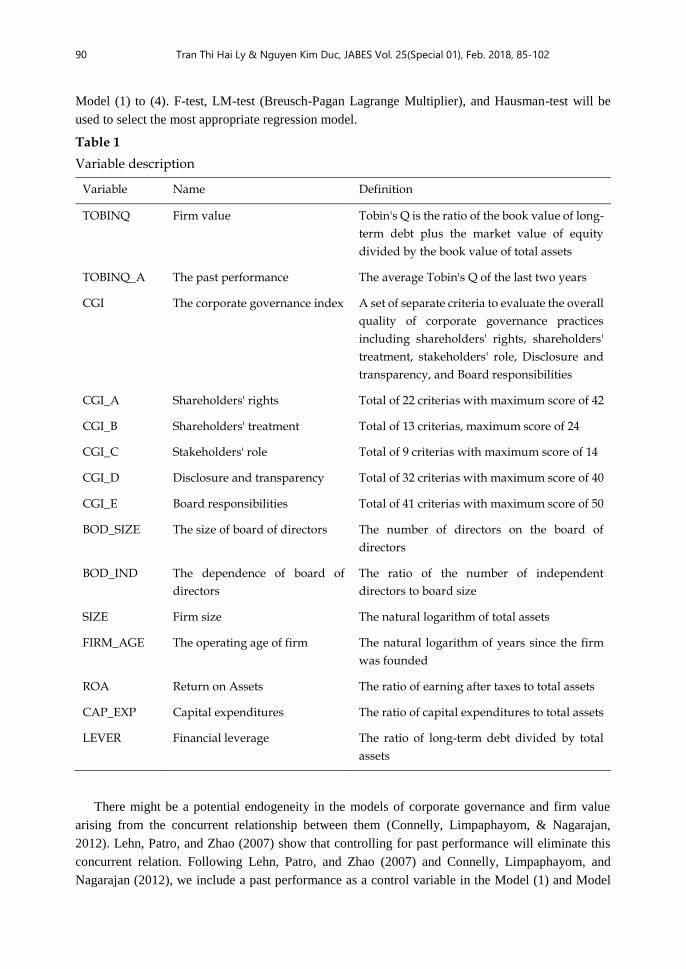
Table 1
Variable description
Variable Name Definition
TOBINQ Firm value Tobin's Q is the ratio of the book value of long-
term debt plus the market value of equity
divided by the book value of total assets
TOBINQ_A The past performance The average Tobin's Q of the last two years
CGI The corporate governance index A set of separate criteria to evaluate the overall
quality of corporate governance practices
including shareholders' rights, shareholders'
treatment, stakeholders' role, Disclosure and
transparency, and Board responsibilities
CGI_A Shareholders' rights Total of 22 criterias with maximum score of 42
CGI_B Shareholders' treatment Total of 13 criterias, maximum score of 24
CGI_C Stakeholders' role Total of 9 criterias with maximum score of 14
CGI_D Disclosure and transparency Total of 32 criterias with maximum score of 40
CGI_E Board responsibilities Total of 41 criterias with maximum score of 50
BOD_SIZE The size of board of directors The number of directors on the board of
directors
BOD_IND The dependence of board of
directors
The ratio of the number of independent
directors to board size
SIZE Firm size The natural logarithm of total assets
FIRM_AGE The operating age of firm The natural logarithm of years since the firm
was founded
ROA Return on Assets The ratio of earning after taxes to total assets
CAP_EXP Capital expenditures The ratio of capital expenditures to total assets
LEVER Financial leverage The ratio of long-term debt divided by total
assets
There might be a potential endogeneity in the models of corporate governance and firm value
arising from the concurrent relationship between them (Connelly, Limpaphayom, & Nagarajan,
2012). Lehn, Patro, and Zhao (2007) show that controlling for past performance will eliminate this
concurrent relation. Following Lehn, Patro, and Zhao (2007) and Connelly, Limpaphayom, and
Nagarajan (2012), we include a past performance as a control variable in the Model (1) and Model
Tran Thi Hai Ly & Nguyen Kim Duc, JABES Vol. 25(Special 01), Feb. 2018, 85-102 91
(2), leading to Eq. (3) and (4). The past performance is defined as average Tobin's Q of the last two
years. Then, these models will be estimated by two-stage least squares (2SLS) regression to obtain
unbiased and consistent estimates.
TOBINQit= β0 + β1 CGIit + β2 TOBINQ_Ait + β3 BOD_SIZEit + β4 BOD_INDit + β5 SIZEit + β6
FIRM_AGEit + β7 ROAit + β8 CAP_EXPit + β9 LEVERit + εit (3)
CGIit= β0 + β1 TOBINQ_Ait + β2BOD_SIZEit + β3 BOD_INDit + β4 SIZEit + β5 FIRM_AGEit + β6
ROAit + β7 CAP_EXPit + β8 LEVERit + εit (4)
3.2. Data
The sample in this study includes 103 non-financial firms listed on Ho Chi Minh Stock Exchange
(HoSE) during the period from 2012 to 2014. We collect data from financial statements, annual
reports, enterprises' regulations, corporate governance regulations, the notice of invitation to the
general meeting of shareholders, attached documents in the notice of invitation, minutes and
resolution of the general meeting, reports of board of directors, auditing reports, reports of the
management board, board of directors resolution, and firms' websites.
We follow some criterias to construct our sample. Some items of CGI is not only marked at time
t but also at time t-1, t-2. The number of maximum years in the past is two (year t-2, and year t-1).
Thus, to mark CGI during the period from 2012 to 2014, the data is collected from 2010 to 2014.
Therefore, delisted firms, non-operating firms, restructured firms during this period will be excluded
from the sample.
As stated before, pyramid ownership may drive the corporate governance-firm value relationship,
we thus divide the full sample into two sub-samples, one with the existence of pyramid structure and
another without the existence of pyramid structure. A firm is classified as existing pyramid ownership
if cash flow rights are not equal to voting rights. In other words, a company with a pyramid structure
will have at least a shareholder who is a subsidiary of another company.
We further classify firms with pyramid ownership into two groups, one has low family ownership
and other has high family ownership. From information on anual reports and other public disclosures,
we list the top ten shareholders of each company. Next, we identify total family ownership by
counting the number of shares held by shareholders with the same last name as the family or
shareholders who have familial relationships (relatives) even if the last names are different. Family
relationships are identified from corporate governance reports. Companies are classified as "high
family ownership" if the total of family ownership exceeds the median ownership for all family firms
in the sample (Connelly, Limpaphayom, & Nagarajan, 2012).
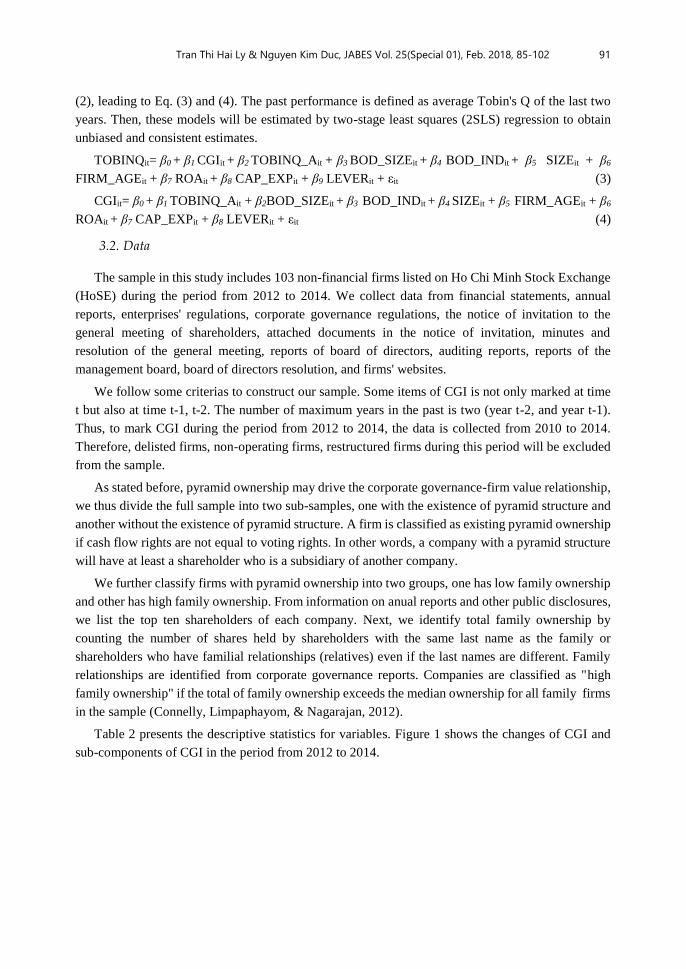
Table 2 presents the descriptive statistics for variables. Figure 1 shows the changes of CGI and
sub-components of CGI in the period from 2012 to 2014.
92 Tran Thi Hai Ly & Nguyen Kim Duc, JABES Vol. 25(Special 01), Feb. 2018, 85-102
Table 2
Descriptive statistics
All firms
Pyramid structure
Non-Existence
(1)
Existence
(2)
t – Statistic
(1 - 2)
TOBINQ 0.689
(0.446)
0.664
(0.392)
0.771
(0.586)
-1.785*
(0.598)
BOD_SIZE 5.880
(1.378)
5.873
(1.441)
5.903
(1.153)
-0.158
(0.186)
BOD_IND 0.527
(0.253)
0.538
(0.246)
0.491
(0.274)
1.391
(0.034)
SIZE 27.741
(1.162)
27.648
(1.154)
28.048
(1.143)
-2.581**
(0.155)
FIRM_AGE 3.075
(0.536)
3.118
(0.529)
2.933
(0.540)
2.596***
(0.072)
ROA 0.068
(0.079)
0.069
(0.083)
0.064
(0.062)
0.473
(0.011)
CAP_EXP 0.054
(0.063)
0.052
(0.062)
0.059
(0.068)
-0.844
(0.009)
LEVER 0.103
(0.135)
0.103
(0.137)
0.104
(0.129)
-0.068
(0.182)
CGI 45.375
(5.078)
45.771
(5.167)
44.074
(4.567)
2.504**
(0.678)
CGI_A 33.981
(11.785)
34.890
(12.126)
30.986
(10.097)
2.482**
(1.573)
CGI_B 59.870
(8.514)
61.656
(7.787)
53.992
(8.200)
7.224***
(1.061)
CGI_C 41.320
(15.823)
39.633
(15.212)
46.875
(16.615)
-3.461***
(2.092)
CGI_D 64.029
(7.928)
64.516
(7.802)
62.425
(8.181)
1.970**
(1.062)
CGI_E 34.202
(6.786)
34.007
(6.833)
34.844
(6.630)
-0.917
(0.913)
Notes: Standard errors are shown in parentheses (.); t-Statistics are estimated for differences between for existence and non-existence pyramid structure; *** p<0.01, ** p<0.05, and * p<0.1
Tran Thi Hai Ly & Nguyen Kim Duc, JABES Vol. 25(Special 01), Feb. 2018, 85-102 93
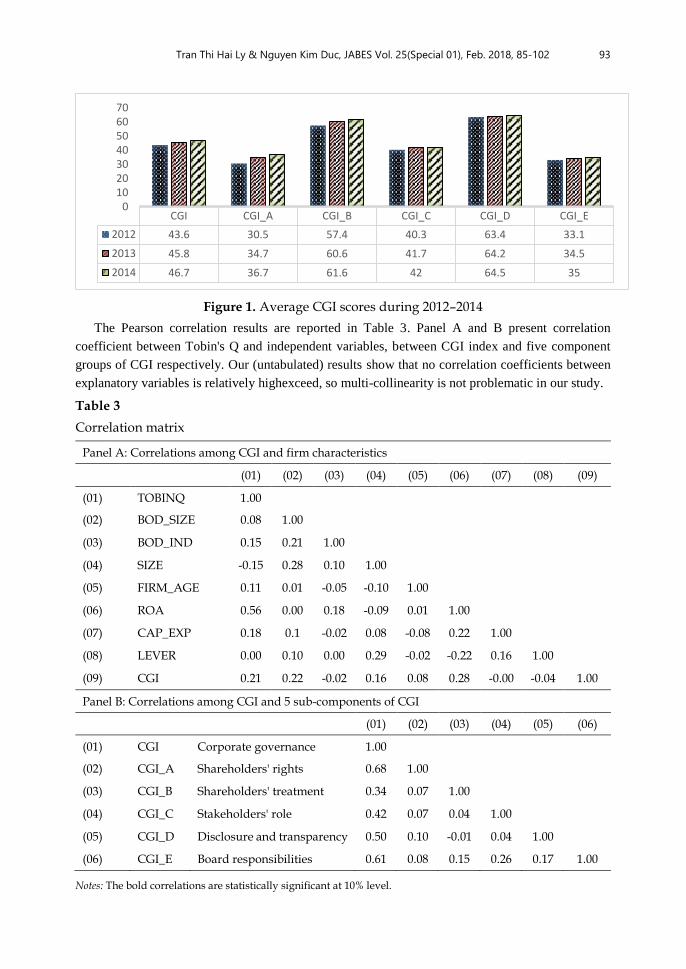
Figure 1. Average CGI scores during 2012–2014
The Pearson correlation results are reported in Table 3. Panel A and B present correlation
coefficient between Tobin's Q and independent variables, between CGI index and five component
groups of CGI respectively. Our (untabulated) results show that no correlation coefficients between
explanatory variables is relatively highexceed, so multi-collinearity is not problematic in our study.
Table 3
Correlation matrix
Panel A: Correlations among CGI and firm characteristics
(01) (02) (03) (04) (05) (06) (07) (08) (09)
(01) TOBINQ 1.00
(02) BOD_SIZE 0.08 1.00
(03) BOD_IND 0.15 0.21 1.00
(04) SIZE -0.15 0.28 0.10 1.00
(05) FIRM_AGE 0.11 0.01 -0.05 -0.10 1.00
(06) ROA 0.56 0.00 0.18 -0.09 0.01 1.00
(07) CAP_EXP 0.18 0.1 -0.02 0.08 -0.08 0.22 1.00
(08) LEVER 0.00 0.10 0.00 0.29 -0.02 -0.22 0.16 1.00
(09) CGI 0.21 0.22 -0.02 0.16 0.08 0.28 -0.00 -0.04 1.00
Panel B: Correlations among CGI and 5 sub-components of CGI
(01) (02) (03) (04) (05) (06)
(01) CGI Corporate governance 1.00
(02) CGI_A Shareholders' rights 0.68 1.00
(03) CGI_B Shareholders' treatment 0.34 0.07 1.00
(04) CGI_C Stakeholders' role 0.42 0.07 0.04 1.00
(05) CGI_D Disclosure and transparency 0.50 0.10 -0.01 0.04 1.00
(06) CGI_E Board responsibilities 0.61 0.08 0.15 0.26 0.17 1.00
Notes: The bold correlations are statistically significant at 10% level.
CGI CGI_A CGI_B CGI_C CGI_D CGI_E
2012 43.6 30.5 57.4 40.3 63.4 33.1
2013 45.8 34.7 60.6 41.7 64.2 34.5
2014 46.7 36.7 61.6 42 64.5 35
010203040506070
94 Tran Thi Hai Ly & Nguyen Kim Duc, JABES Vol. 25(Special 01), Feb. 2018, 85-102
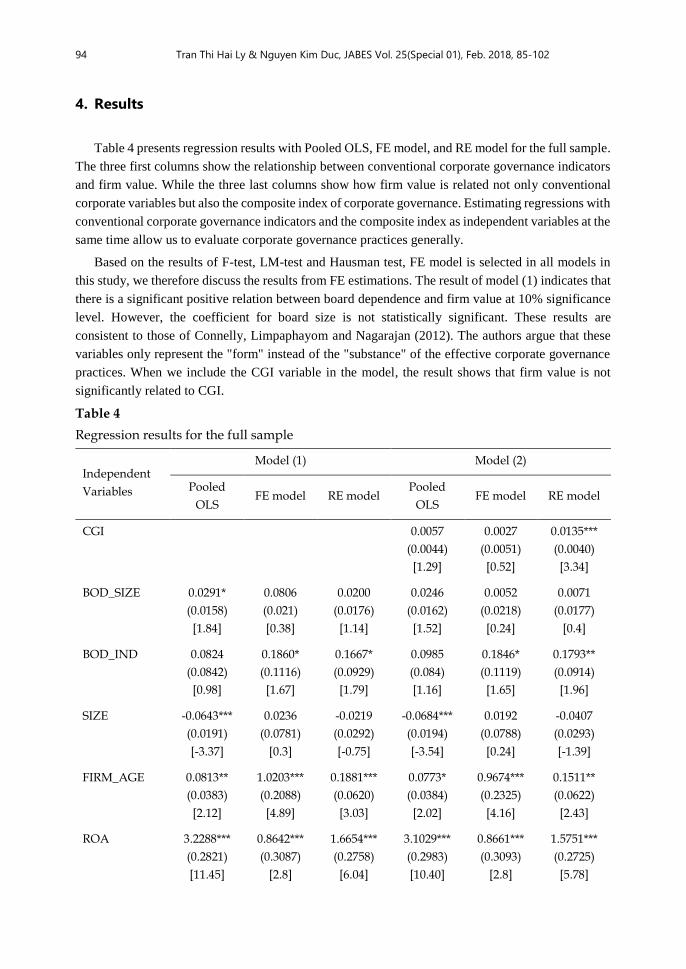
4. Results
Table 4 presents regression results with Pooled OLS, FE model, and RE model for the full sample.
The three first columns show the relationship between conventional corporate governance indicators
and firm value. While the three last columns show how firm value is related not only conventional
corporate variables but also the composite index of corporate governance. Estimating regressions with
conventional corporate governance indicators and the composite index as independent variables at the
same time allow us to evaluate corporate governance practices generally.
Based on the results of F-test, LM-test and Hausman test, FE model is selected in all models in
this study, we therefore discuss the results from FE estimations. The result of model (1) indicates that
there is a significant positive relation between board dependence and firm value at 10% significance
level. However, the coefficient for board size is not statistically significant. These results are
consistent to those of Connelly, Limpaphayom and Nagarajan (2012). The authors argue that these
variables only represent the "form" instead of the "substance" of the effective corporate governance
practices. When we include the CGI variable in the model, the result shows that firm value is not
significantly related to CGI.
Table 4
Regression results for the full sample
Independent
Variables
Model (1) Model (2)
Pooled
OLS FE model RE model
Pooled
OLS FE model RE model
CGI
0.0057
(0.0044)
[1.29]
0.0027
(0.0051)
[0.52]
0.0135***
(0.0040)
[3.34]
BOD_SIZE 0.0291*
(0.0158)
[1.84]
0.0806
(0.021)
[0.38]
0.0200
(0.0176)
[1.14]
0.0246
(0.0162)
[1.52]
0.0052
(0.0218)
[0.24]
0.0071
(0.0177)
[0.4]
BOD_IND 0.0824
(0.0842)
[0.98]
0.1860*
(0.1116)
[1.67]
0.1667*
(0.0929)
[1.79]
0.0985
(0.084)
[1.16]
0.1846*
(0.1119)
[1.65]
0.1793**
(0.0914)
[1.96]
SIZE -0.0643***
(0.0191)
[-3.37]
0.0236
(0.0781)
[0.3]
-0.0219
(0.0292)
[-0.75]
-0.0684***
(0.0194)
[-3.54]
0.0192
(0.0788)
[0.24]
-0.0407
(0.0293)
[-1.39]
FIRM_AGE 0.0813**
(0.0383)
[2.12]
1.0203***
(0.2088)
[4.89]
0.1881***
(0.0620)
[3.03]
0.0773*
(0.0384)
[2.02]
0.9674***
(0.2325)
[4.16]
0.1511**
(0.0622)
[2.43]
ROA 3.2288***
(0.2821)
[11.45]
0.8642***
(0.3087)
[2.8]
1.6654***
(0.2758)
[6.04]
3.1029***
(0.2983)
[10.40]
0.8661***
(0.3093)
[2.8]
1.5751***
(0.2725)
[5.78]
Tran Thi Hai Ly & Nguyen Kim Duc, JABES Vol. 25(Special 01), Feb. 2018, 85-102 95
Independent
Variables
Model (1) Model (2)
Pooled
OLS FE model RE model
Pooled
OLS FE model RE model
CAP_EXP 0.2404
(0.3433)
[0.7]
0.3918*
(0.2316)
[1.69]
0.3395
(0.2334)
[1.45]
0.2936
(0.3454)
[0.85]
0.3895*
(0.2321)
[1.68]
0.3752
(0.2296)
[1.63]
LEVER 0.5609***
(0.1643)
[3.41]
0.2480
(0.2735)
[0.91]
0.3011
(0.2048)
[1.47]
0.5628***
(0.1642)
[3.43]
0.2694
(0.2770)
[0.97]
0.3747*
(0.2028)
[1.85]
Constant 1.720***
(0.5340)
[3.22]
-3.3545*
(1.9077)
[-1.76]
0.3499
(0.8190)
[0.43]
1.6119***
(0.5410)
[2.99]
-3.1728
(1.9426)
[-1.63]
0.4388
(0.8073)
[0.54]
Obs. 309 309 309 309 309 309
N. 103 103 103 103 103 103
F statistic 25.91*** 6.73*** 22.93*** 5.90***
Wald ( χ2) 57.21*** 70.10***
F Test 13.28*** 13.15***
LM ( χ2) 155.85*** 161.25***
Hausman ( χ2) 75.16*** 59.61***
Notes: F-test, LM-test, Hausman Test used to select suitable regression models; Standard errors are shown in parentheses (.); t-statistic are shown in brackets [.]; *** p<0.01, ** p<0.05, and * p<0.1
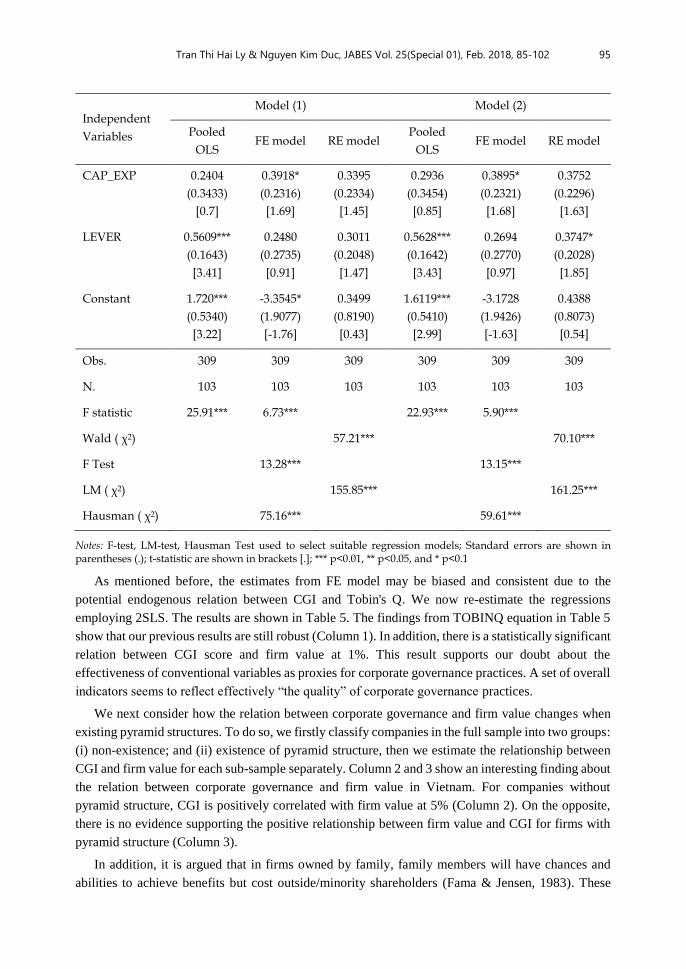
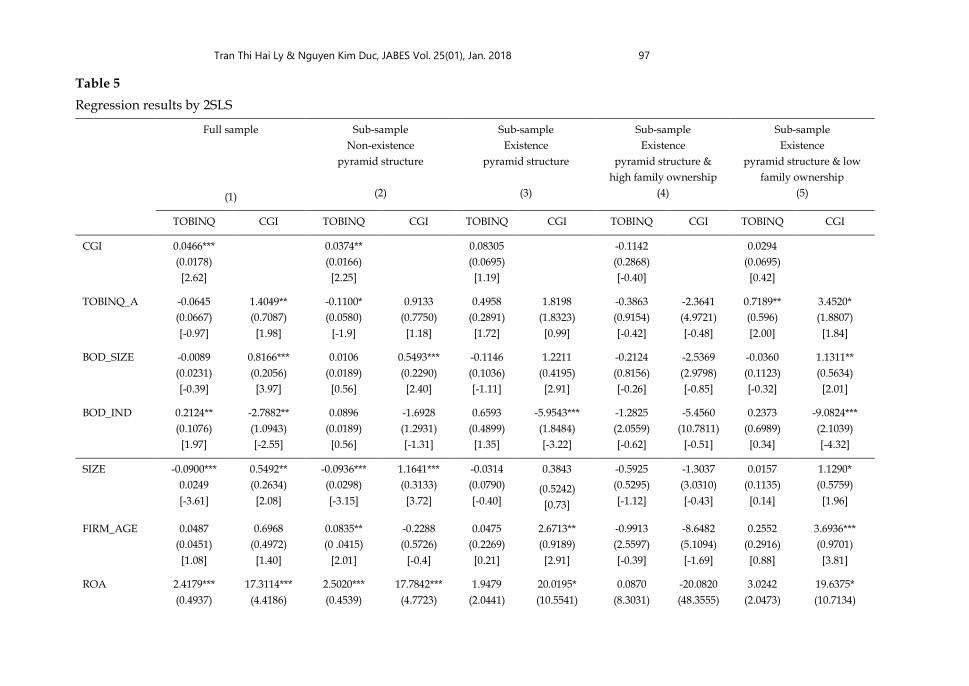
As mentioned before, the estimates from FE model may be biased and consistent due to the
potential endogenous relation between CGI and Tobin's Q. We now re-estimate the regressions
employing 2SLS. The results are shown in Table 5. The findings from TOBINQ equation in Table 5
show that our previous results are still robust (Column 1). In addition, there is a statistically significant
relation between CGI score and firm value at 1%. This result supports our doubt about the
effectiveness of conventional variables as proxies for corporate governance practices. A set of overall
indicators seems to reflect effectively “the quality” of corporate governance practices.
We next consider how the relation between corporate governance and firm value changes when
existing pyramid structures. To do so, we firstly classify companies in the full sample into two groups:
(i) non-existence; and (ii) existence of pyramid structure, then we estimate the relationship between
CGI and firm value for each sub-sample separately. Column 2 and 3 show an interesting finding about
the relation between corporate governance and firm value in Vietnam. For companies without
pyramid structure, CGI is positively correlated with firm value at 5% (Column 2). On the opposite,
there is no evidence supporting the positive relationship between firm value and CGI for firms with
pyramid structure (Column 3).
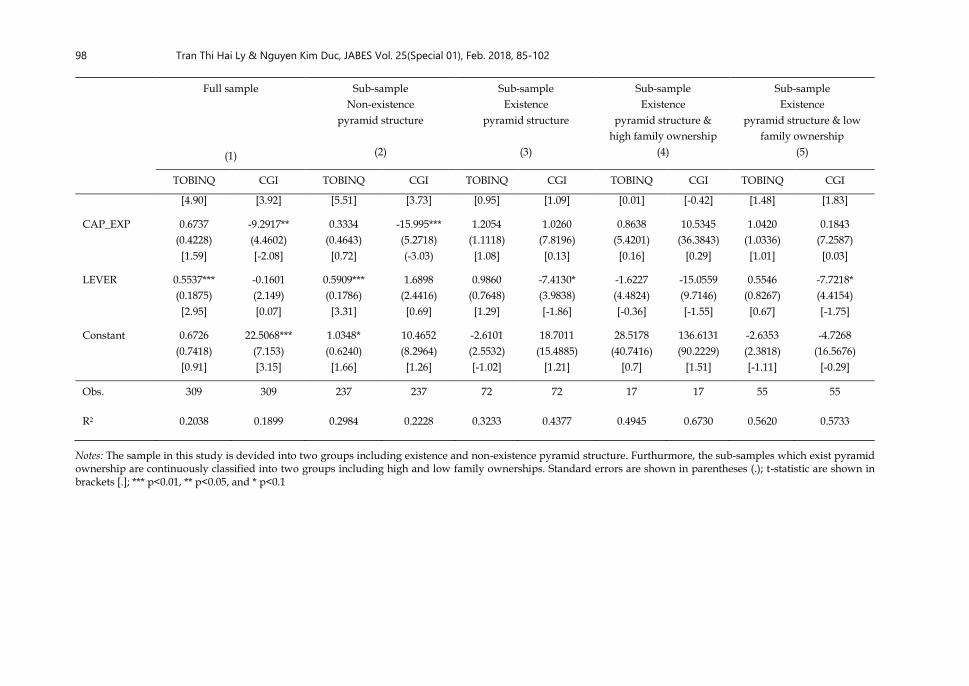
In addition, it is argued that in firms owned by family, family members will have chances and
abilities to achieve benefits but cost outside/minority shareholders (Fama & Jensen, 1983). These
96 Tran Thi Hai Ly & Nguyen Kim Duc, JABES Vol. 25(Special 01), Feb. 2018, 85-102
chances and abilities will increase when these members maintain pyramid ownership (Connelly,
Limpaphayom, & Nagarajan, 2012). Therefore, we take this consideration into account by further
classifying companies which have pyramid ownership into high and low family ownership. The
regression results for these two groups are shown in Column 4 and 5 of Table 5. It seems that when
existing pyramid structure, there is no significant relation between corporate governance and firm
value even companies belong to high or low family ownership.
Tran Thi Hai Ly & Nguyen Kim Duc, JABES Vol. 25(01), Jan. 2018 97
Table 5
Regression results by 2SLS
Full sample
(1)
Sub-sample
Non-existence
pyramid structure
(2)
Sub-sample
Existence
pyramid structure
(3)
Sub-sample
Existence
pyramid structure &
high family ownership
(4)
Sub-sample
Existence
pyramid structure & low
family ownership
(5)
TOBINQ CGI TOBINQ CGI TOBINQ CGI TOBINQ CGI TOBINQ CGI
CGI 0.0466***
(0.0178)
[2.62]
0.0374**
(0.0166)
[2.25]
0.08305
(0.0695)
[1.19]
-0.1142
(0.2868)
[-0.40]
0.0294
(0.0695)
[0.42]
TOBINQ_A -0.0645
(0.0667)
[-0.97]
1.4049**
(0.7087)
[1.98]
-0.1100*
(0.0580)
[-1.9]
0.9133
(0.7750)
[1.18]
0.4958
(0.2891)
[1.72]
1.8198
(1.8323)
[0.99]
-0.3863
(0.9154)
[-0.42]
-2.3641
(4.9721)
[-0.48]
0.7189**
(0.596)
[2.00]
3.4520*
(1.8807)
[1.84]
BOD_SIZE -0.0089
(0.0231)
[-0.39]
0.8166***
(0.2056)
[3.97]
0.0106
(0.0189)
[0.56]
0.5493***
(0.2290)
[2.40]
-0.1146
(0.1036)
[-1.11]
1.2211
(0.4195)
[2.91]
-0.2124
(0.8156)
[-0.26]
-2.5369
(2.9798)
[-0.85]
-0.0360
(0.1123)
[-0.32]
1.1311**
(0.5634)
[2.01]
BOD_IND 0.2124**
(0.1076)
[1.97]
-2.7882**
(1.0943)
[-2.55]
0.0896
(0.0189)
[0.56]
-1.6928
(1.2931)
[-1.31]
0.6593
(0.4899)
[1.35]
-5.9543***
(1.8484)
[-3.22]
-1.2825
(2.0559)
[-0.62]
-5.4560
(10.7811)
[-0.51]
0.2373
(0.6989)
[0.34]
-9.0824***
(2.1039)
[-4.32]
SIZE -0.0900***
0.0249
[-3.61]
0.5492**
(0.2634)
[2.08]
-0.0936***
(0.0298)
[-3.15]
1.1641***
(0.3133)
[3.72]
-0.0314
(0.0790)
[-0.40]
0.3843
(0.5242)
[0.73]
-0.5925
(0.5295)
[-1.12]
-1.3037
(3.0310)
[-0.43]
0.0157
(0.1135)
[0.14]
1.1290*
(0.5759)
[1.96]
FIRM_AGE 0.0487
(0.0451)
[1.08]
0.6968
(0.4972)
[1.40]
0.0835**
(0 .0415)
[2.01]
-0.2288
(0.5726)
[-0.4]
0.0475
(0.2269)
[0.21]
2.6713**
(0.9189)
[2.91]
-0.9913
(2.5597)
[-0.39]
-8.6482
(5.1094)
[-1.69]
0.2552
(0.2916)
[0.88]
3.6936***
(0.9701)
[3.81]
ROA 2.4179***
(0.4937)
17.3114***
(4.4186)
2.5020***
(0.4539)
17.7842***
(4.7723)
1.9479
(2.0441)
20.0195*
(10.5541)
0.0870
(8.3031)
-20.0820
(48.3555)
3.0242
(2.0473)
19.6375*
(10.7134)
98 Tran Thi Hai Ly & Nguyen Kim Duc, JABES Vol. 25(Special 01), Feb. 2018, 85-102
Full sample
(1)
Sub-sample
Non-existence
pyramid structure
(2)
Sub-sample
Existence
pyramid structure
(3)
Sub-sample
Existence
pyramid structure &
high family ownership
(4)
Sub-sample
Existence
pyramid structure & low
family ownership
(5)
TOBINQ CGI TOBINQ CGI TOBINQ CGI TOBINQ CGI TOBINQ CGI
[4.90] [3.92] [5.51] [3.73] [0.95] [1.09] [0.01] [-0.42] [1.48] [1.83]
CAP_EXP 0.6737
(0.4228)
[1.59]
-9.2917**
(4.4602)
[-2.08]
0.3334
(0.4643)
[0.72]
-15.995***
(5.2718)
(-3.03)
1.2054
(1.1118)
[1.08]
1.0260
(7.8196)
[0.13]
0.8638
(5.4201)
[0.16]
10.5345
(36.3843)
[0.29]
1.0420
(1.0336)
[1.01]
0.1843
(7.2587)
[0.03]
LEVER 0.5537***
(0.1875)
[2.95]
-0.1601
(2.149)
[0.07]
0.5909***
(0.1786)
[3.31]
1.6898
(2.4416)
[0.69]
0.9860
(0.7648)
[1.29]
-7.4130*
(3.9838)
[-1.86]
-1.6227
(4.4824)
[-0.36]
-15.0559
(9.7146)
[-1.55]
0.5546
(0.8267)
[0.67]
-7.7218*
(4.4154)
[-1.75]
Constant 0.6726
(0.7418)
[0.91]
22.5068***
(7.153)
[3.15]
1.0348*
(0.6240)
[1.66]
10.4652
(8.2964)
[1.26]
-2.6101
(2.5532)
[-1.02]
18.7011
(15.4885)
[1.21]
28.5178
(40.7416)
[0.7]
136.6131
(90.2229)
[1.51]
-2.6353
(2.3818)
[-1.11]
-4.7268
(16.5676)
[-0.29]
Obs. 309 309 237 237 72 72 17 17 55 55
R2 0.2038 0.1899 0.2984 0.2228 0.3233 0.4377 0.4945 0.6730 0.5620 0.5733
Notes: The sample in this study is devided into two groups including existence and non-existence pyramid structure. Furthurmore, the sub-samples which exist pyramid ownership are continuously classified into two groups including high and low family ownerships. Standard errors are shown in parentheses (.); t-statistic are shown in brackets [.]; *** p<0.01, ** p<0.05, and * p<0.1
Tran Thi Hai Ly & Nguyen Kim Duc, JABES Vol. 25(01), Jan. 2018 99
5. Conclusion
This study analyzes the relation between corporate governance and firm value under the existence
or non-existence of pyramid structure. The sample consists of 103 Vietnam's non-financial firms listed
on HoSE during the period from 2012 to 2014. The finding of this study shows that CGI is a better
proxy for corporate governance practices than conventional indicators, especially when existing
pyramid ownership. The most interesting finding of this study is that good corporate governance
practices will not have statistically significant in the relation to firm value if companies have pyramid
structures. Even when we classify these companies into high and low family ownership, the results
are unchanged. This implies that although CGI is a comprehensive proxy, using this index to evaluate
corporate governance practices or make conclusions about the effect of corporate governance on firm
value may be misleading if there is a presence of pyramid structures. Therefore, identifying the
existence of pyramid structures is the fist essential step before cosidering the relation between
corporate governance and firm value.
This research has some implications for policy makers and practitioners. In construction of
corporate governance indicators, policy makers can concretize items, adjust items to make them
suitable for Vietnamese context, as well as introduce more specific regulations on corporate
governance practices.
For companies, board of directors and board of managements need to develop corporate
governance regulations in detail and suit the industrial characteristics. In addition, if enterprises only
focus on some prominent problems of corporate governance in the past, today CGI seems to be a
benchmark for companies to identify fully interesting items.
For investors, effective corporate governance practices will contribute to increase firm value.
Investors should be careful when evaluating the effectiveness of corporate governance. Our results
imply that investors should be better to use CGI, instead of individual corporate governance
indicators. Investors also need to identify whether pyramid structures exis
100 Tran Thi Hai Ly & Nguyen Kim Duc, JABES Vol. 25(Special 01), Feb. 2018, 85-102
References
Agrawal, A., & Knoeber, C. R. (1996). Firm performance and mechanisms to control agency
problems between managers and shareholders. Journal of Financial and Quantitative
Analysis, 31, 377–397.
Andres, P. D., Azofra, V., & Lopez, F. (2005). Corporate boards in OECD countries: Size,
composition, functioning and effectiveness. Corporate Governance, 13(2), 197–210.
Barontini, R., & Caprio, L. (2006). The effect of family control on firm value and performance:
Evidence from continental Europe. European Financial Management, 12(5), 689–723.
Bebchuk, L., Cohen, A., & Ferrell, A. (2009). What matters in corporate governance? Review
of Financial Studies, 22(2), 783–827.
Bertrand, M., Mehta, P., & Mullainathan, S. (2002). Ferreting out tunneling: An application
to Indian business groups. The Quarterly Journal of Economics, 117(1), 121–148.
Black, B., Jang, H., & Kim, W. (2006). Does corporate governance predict firms’ market
values? Evidence from Korea. Journal of Law, Economics, and Organization, 22, 366–413.
Brown, L., & Caylor, M. (2006). Corporate governance and firm operating performance.
Journal of Accounting and Public Policy, 25(4), 409–434.
Chen, C. W., Lin, J. B., & Yi, B. (2008). CEO duality and firm performance: An endogenous
issue. Corporate Ownership and Control, 6(1), 58–65.
Cheung, Y. L., Connelly, J. T., Limpaphayom, P., & Zhou, L. (2007). Do investors really value
corporate governance? Evidence from the Hong Kong market. Journal of International
Financial Management and Accounting, 18, 86–122.
Cheung, Y.–L., Connelly, J. T., Estanislao, J. P., Limpaphayom, P., Lu, T., & Utama, S. (2014).
The corporate governance and firm valuation in Asian emerging markets. In S. Boubaker
& D. K. Nguyen (Eds.), Corporate governance in emerging markets: Theories, practices and
cases (pp. 27–53). Springer, New York.
Claessens, S., Djankov, S., & Lang, L. (2000). The separation of ownership and control in East
Asian corporations. Journal of Financial Economics, 58(1–2), 81–112.
Claessens, S., Djankov, S., Fan, J. P., & Lang, L. (2002). Disentangling the incentive and
entrenchment effects of large shareholding. Journal of Finance, 57(6), 2741–2771.
Connelly, J. T., Limpaphayom, P., & Nagarajan, N. J. (2012). Form versus substance: The
effect of ownership structure and corporate governance on firm value in Thailand.
Journal of Banking & Finance, 36, 1722–1743. doi:10.1016/j.jbankfin.2012.01.017
Daraghma, Z., & Alsinawi, A. (2010). Board of directors, management ownership, and
capital structure and its effect on performance: The case of palestine securities exchange.
International Journal of Business and Management, 5(11), 118–127.
Drobetz, W., Schillhofer, A., & Zimmerman, H. (2003). Corporate governance and expected
Tran Thi Hai Ly & Nguyen Kim Duc, JABES Vol. 25(Special 01), Feb. 2018, 85-102 101
stock returns: Evide nce from Germany. European Financial Management, 10(2), 267–293.
Eisenberg, T., Sundgren, S., & Wells, M. T. (1998). Larger board size and decreasing firm
value in small firms. Journal of Financial Economics, 48(1). 35–54.
Eisenhardt, K. M. (1989). Agency theory: An assessment and review. Academy of Management
Review, 14(1), 57–74.
Fama, E. F., & Jensen, M. E. (1983). Separation of ownership and control. The Journal of Law
and Economics, 26, 301–325.
Gompers, P., Ishii, J., & Metrick, A. (2003). Corporate governance and equity prices.
Quarterly Journal of Economics, 118(1), 107–155.
Hermalin, B. E., & Weisbach, M. S. (1991). The effects of board composition and direct
incentives on firm performance. Financial Management, 20(04), 101–112.
Hermalin, B. E., & Weisbach, M. S. (2003). Boards of directors as an endogenously determined
institution: A survey of the economic literature. Economic Policy Review, 9, 7–26.
Himmelberg, C. P., Hubbard, R. G., & Palia, D. (1999). Understanding the determinants of
managerial ownership and the link between ownership and performance. Journal of
Financial Economics, 53, 353–384.
Jensen, M. C., & Meckling, W. H. (1976). Theory of the firm: Managerial behavior, agency
costs and ownership structure. Journal of Financial Economics, 3(4), 305–360.
La Porta, R., Lopez–de–Silanes, F., & Shleifer, A. (1999). Corporate ownership around the
world. Journal of Finance, 54(2), 471–517.
Lehn, K., Patro, S., & Zhao, M. (2007). Governance indexes and valuation: Which causes
which? Journal of Corporate Finance, 13(5), 907–928.
Lemmon, M., & Lins, K. (2003). Ownership structure, corporate governance, and firm value:
Evidence from the East Asian financial crisis. The Journal of Finance, 58(4), 1445–1468.
Lins, K. V. (2003). Equity ownership and firm value in emerging markets. Journal of Financial
and Quantitative Analysis, 38, 159–184.
Morck, R., Shleifer, A., & Vishny, R. W. (1988). Management ownership and market
valuation: An empirical analysis. Journal of Financial Economics, 20, 293–315.
OECD. (1999). Principles of corporate governance. Paris.
OECD. (2004). Principles of corporate governance. Paris.
Rouf, A. (2011). The relationship between corporate governance and value of the firm in
developing countries: Evidence from Bangladesh. The International Journal of Applied
Economics and Finance, 5(3), 237–244.
Turki, A., & Sedrine, N. (2012). Ownership structure, board characteristics and corporate
performance in Tunisia. International Journal of Business and Management, 7(4), 121–132.
Villalonga, B., & Amit, R. (2006). How do family ownership control and management affect
102 Tran Thi Hai Ly & Nguyen Kim Duc, JABES Vol. 25(Special 01), Feb. 2018, 85-102
firm value? Journal of Financial Economics, 80, 385–417.
Xia, L. (2008). Founder control, ownership structure and firm value: Evidence from
entrepreneurial listed firms in China. China Journal of Accounting Research, 1, 31–49.
Yermack, D. (1996). Higher market values of companies with a small board of directors.
Journal of Financial Economics, 40(2), 185–211.