overview of the instructional quality assessment
TRANSCRIPT
Overview of the Instructional Quality Assessment
CSE Technical Report 671
Brian Junker and Yanna Weisberg Carnegie Mellon University
Lindsay Clare Matsumura, Amy Crosson, Mikyung Kim Wolf,
Allison Levison, and Lauren Resnick LRDC/University of Pittsburgh
January 2006
Correction in Authorship: Versions of this report prior to September 30, 2006 contained a cover page listing Lauren Resnick and Brian Junker as authors, with a full list of correct authors on a subsequent page. This error was corrected on September 29th. The complete list of contributing authors is: Brian Junker, Yanna Weisberg, Lindsay Clare Matsumura, Amy Crosson, Mikyung Kim Wolf, Allison Levison, and Lauren Resnick.
Center for the Study of Evaluation National Center for Research on Evaluation,
Standards, and Student Testing (CRESST) Graduate School of Education & Information Studies
University of California, Los Angeles GSE&IS Bldg., Box 951522
Los Angeles, Ca 90095-1522 (310) 206-1532

Project 2.3 Indicators of Classroom Practice and Alignment Lauren Resnick and Brian Junker, Project Directors Copyright © 2005 The Regents of the University of California The work reported herein was supported under the Educational Research and Development Centers Program, PR/Award Number R305B960002, as administered by the Institute of Education Sciences (IES), U.S. Department of Education. The findings and opinions expressed in this report are those of the author(s) and do not necessarily reflect the positions or policies of the National Center for Education Research, the Institute of Education Sciences (IES), or the U.S. Department of Education.

1
OVERVIEW OF THE INSTRUCTIONAL QUALITY ASSESSMENT
Brian Junker and Yanna Weisberg
Carnegie Mellon University
Lindsay Clare Matsumura, Amy Crosson, Mikyung Kim Wolf,
Allison Levison, and Lauren Resnick
LRDC/University of Pittsburgh
Abstract
Educators, policy-makers, and researchers need to be able to assess the efficacy of specific interventions in schools and school Districts. While student achievement is unquestionably the bottom line, it is essential to open up the educational process so that each major factor influencing student achievement can be examined; indeed as a proverb often quoted in industrial quality control goes, “That which cannot be measured, cannot be improved”. Instructional practice is certainly a central factor: if student achievement is not improving, is it because instructional practice is not changing, or because changes in instructional practice are not affecting achievement? A tool is needed to provide snapshots of instructional practice itself, before and after implementing new professional development or other interventions, and at other regular intervals to help monitor and focus efforts to improve instructional practice. In this paper we review our research program building and piloting the Instructional Quality Assessment (IQA), a formal toolkit for rating instructional quality based primarily on classroom observation and student assignments. In the first part of the paper we review the need for, and some other efforts to provide, direct assessments of instructional practice. In the second part of this paper we briefly summarize the development of the IQA in reading comprehension and in mathematics at the elementary school level. In the third part of the paper we report on a large pilot study of the IQA, conducted in Spring 2003 in two moderately large urban school Districts. We conclude with some ideas about future work and future directions for the IQA.
Background
The Need to Measure Instructional Quality
Although its roots go much farther back, standards-based educational reform and accountability came to the fore of American educational policy in the early 1980s, with the National Committee on Excellence in Education’s (NCEE) open letter to the American people, A Nation at Risk (NCEE, 1983), which laid out a forceful set

2
of recommendations including rigorous definitions of content standards in English, Mathematics, Science, Social Studies, and other basic subjects, as well as rigorous and measurable standards for student achievement and instructional quality. These ideas were codified 10 years later into eight national goals in the Federal “Goals 2000: Educate America” Act of 1994 (National Education Goals Panel, 2000), which emphasized student achievement in both basic and challenging subjects, and specifically mentioned teacher education and professional development.
While student achievement is unquestionably the bottom line in state assessments (Doherty, 2003; Fuhrman, 1999)—and the focus of the recent Federal "No Child Left Behind" Act of 2001 (NCLB)—it is essential to open up the educational process so that each major factor influencing student achievement can be examined; indeed as a proverb often quoted in industrial and software quality control goes, “That which cannot be measured, cannot be improved.” In a climate of high-stakes achievement-oriented accountability, inasmuch as it is unacceptable to deny students the instruction they need to meet achievement standards, it is also unacceptable to deny educators the tools they need to measure, reflect upon, and improve their own practices, in order to help students reach those standards. Yet, insufficient emphasis has been placed on monitoring instructional quality, arguably the most important school factor influencing student achievement (Darling-Hammond, 2000).
Quality of instruction has not been directly measured in many accountability systems because few assessment tools exist that have the potential to directly measure the quality of classroom practice on a large-scale basis. Two common data sources—teacher and student self-reports—are relatively cheap and do contain some signal about instructional quality, but if they are not done carefully, self-image biases (Mayer, 1999a; Spillane & Zuelli, 1999), recall biases (Lohr, 1999, p. 8), and competency and self-interest issues (e.g. related issues in Sproule, 2000) undermine the validity of the results. Two other relevant data sources—rating teachers’ assignments/student work, and rating based on direct classroom observation—offer more scope for valid measurement of classroom instruction (Clare and Aschbacher, 2001; (Clare) Matsumura, 2000), but they are also much more expensive. They are more expensive for two reasons: first, raters must usually be compensated for their time (ranging from a bare minimum of 10-15 minutes per assignment portfolio to hours or days per classroom observation); and second, there are expenses involved in training raters to draw appropriate inferences from the raw data for rating.
3
This last point brings up a more subtle difficulty: it is really only possible for a rater to distill and draw inferences from complex, real-time data, in the context of a specific theory of instructional practice. Without an observation protocol to help the rater determine what is important in the observation and what can be filtered out, the rater will be overwhelmed and no useful rating can occur. Different theories of instructional practice—Direct Instruction (e.g. Kameenui & Carnine, 1998) vs. Constructivist teaching (e.g. Fosnot, 1996), to name two extremes—suggest rather different observation protocols, as well as different ways of judging the evidence obtained. Our own view is that the recent National Research Council report How
People Learn: Brain, Mind, Experience, and School (Bransford, Brown, & Cocking, 2000) provides an important outline of current scientific understanding of learning and its implications for teaching. For our purposes, the essential message of this report is that powerful teaching and learning environments are:
• Learner-Centered: Teachers must be able to recognize predictable misconceptions of students that make the mastery of particular subject matter challenging; draw out preconceptions that aren't predictable; and work with preconceptions so that students can build on them, challenge them, and, when appropriate, replace them. Teachers must also consciously incorporate metacognitive instruction into curricula, so that students can learn to self-monitor and make decisions about their own learning.
• Knowledge-Centered: Teachers must teach some subject matter in depth, providing enough examples in which the same concept is at work, so that students can grasp the core concepts in an area, deepen their understanding, and engage in complex problem solving. Teachers must combine in-depth knowledge and organization of the subject area with pedagogical tools that include an understanding of how students' thinking about concepts in the subject develops.
• Assessment-Centered: Teachers must help students develop a clear understanding of what they should know and be able to do, setting learning goals and monitoring progress together. Students should produce quality work, showing evidence of understanding, not just recall; and assessment tasks should allow students to exhibit high-order thinking.
• Community-Centered: Teachers must arrange classroom activities and help students organize their work in ways that promote the kind of intellectual camaraderie and attitudes toward learning that build academic community. The community norms established in the classroom have strong effects on students' achievement.
4
Some Other Efforts to Measure Instructional Quality
Although much has been written about the quality of measures of instructional practice—going back to at least Hiller, Fisher, and Kaess (1969)—until recently efforts to develop broad-based, technically sound measurement instruments have been somewhat limited. As Mayer (1999b) puts it, this is due to the fact that, historically, education reforms have tinkered at the edges of the educational process (Marshall, Furmann, & O’Day, 1994); and even during the extensive reform efforts of the 1970’s and 1980’s policymakers focused on improving schools by adjusting resource allocations (racial balance, financial equity and the like) and focusing on outcome goals (e.g. minimum competency testing). The push for routine collection of instructional practice data came only in the late 1980’s (e.g. Porter, 1991; Shavelson, McDonnell, Oakes, Carey, & Picus, 1987).
In the 1990’s, the 1994-95 School and Staff Survey Teacher Follow-up Study involved survey data from 3,844 teachers (Henke, Chen and Goldman, 1999), but the reliability of the 22-item self-report instrument measuring instructional practice was problematic (e.g., Mayer, 1999b) since the items did not come from a single, coherent theoretical/pedagogical framework. As part of RAND’s evaluation of the Federal Systemic Initiatives program of the 1990’s, Klein, Hamilton, McCaffrey, Stecher, Robyn, and Burroughs (2000) studied instructional practice and student achievement with 627 teachers distributed over three elementary/middle grade levels and six sites. They found substantial variation in educational practice within schools, and, after controlling for background variables, a generally weak but positive relationship between frequency of “reform” teaching behaviors and student achievement; the relationship was somewhat stronger when achievement was measured with open-response tests than with multiple-choice tests. In a state-level effort, Fouts, Brown and Thieman (2002) found positive correlations between constructivist teaching behaviors and achievement in 669 classrooms distributed among 34 elementary, middle, high, and technical schools, and negative correlations between each of these variables and family income. After controlling for family income, constructivist behaviors still accounted for a small but significant portion of the variation in student achievement. The Study of Instructional Improvement program (SII, Regents of the University of Michigan, 2001) has developed a carefully constructed instrument to measure teachers’ pedagogical content knowledge (Rowan, Schilling, Ball & Miller, 2001), scaled using the Rasch (1980) model from Item Response Theory. SII has also developed a set of “Instructional Logs” (Ball,
5
Camburn, Correnti, Phelps & Wallace, 1999; SII, 2001) which are more highly formalized and detailed teacher self-report forms, to be completed two times a day over a period of 120 teaching days by each teacher, and is using these instruments in its intensive study of instructional practices in three leading school improvement programs.
There is, however, still a need for a technically sound tool that can be used for a variety of research and monitoring purposes more modest that SII’s wholesale program evaluation, but still essential to maintaining and improving instructional practice. Such a tool might provide snapshots of instructional practice—instructional quality—at baseline measure before engaging in new professional development, as a post-measure to evaluate the effects of professional development, and at other regular intervals to help monitor and focus professional development efforts.
Development of the Instructional Quality Assessment
Overview
The Instructional Quality Assessment (IQA) has been under active development at the Learning Research and Development Center (LRDC) at the University of Pittsburgh since the beginning of 2002. The IQA consists of approximately 20 rubrics or rating items, organized into three clusters, together with training materials and observation protocols for raters who administer it. Separate versions of the IQA are needed for different subject areas and grade-bands. So far, pilot versions of the IQA have been developed for Mathematics and Reading Comprehension at the primary and upper elementary levels.
The IQA was conceptualized around a specific set of guidelines for instructional practice which integrates strong pedagogical knowledge with deeply rigorous subject matter knowledge called the Principles of Learning (Resnick & Hall, 2001; Institute for Learning, 2002). This set of statements about highly effective, effort-based learning and instructional practices is used to guide consulting and collaboration with client Districts within LRDC’s Institute for Learning (IFL). The Principles of Learning grew out of the study of teaching and learning in the High Performance Learning Communities (HPLC) project at LRDC, and its study of District Two in New York City in the 1990’s (Resnick, Glennan, & Lesgold, 2001). More broadly, the Principles of Learning arise from the same larger body of research that underlies the How People Learn (NRC 1999a, b) reports. Four of the Principles of
6
Learning capture characteristics of expert instruction that can be observed in the classroom and by looking at the way an instructor constructs assignments for his or her students:
• Academic Rigor insists that lessons be built around specific important concepts in the subject area, and that students regularly engage in active reasoning about challenging content and core concepts in that subject; this necessarily entails subject matter expertise on the part of the teacher. Indeed, the principle of Academic Rigor encompasses the notions of active inquiry and in-depth learning of important content that is at the heart of the NRC’s (1999a, b) notion of Knowledge-Centered teaching.
• Clear Expectations guides teachers to make standards-based expectations for performance clear to students, and encourages teachers and students to set learning goals and monitor progress together. This addresses basic opportunity-to-learn and alignment issues between instruction and assessment, and helps students (and teachers) benefit most from the kind of ongoing formative assessment environment that is the key idea of Assessment-Centered teaching (NRC, 1999a, b).
• Self-Management of Learning emphasizes the importance of incorporating metacognitive skills into instruction in all areas so that students can develop self-monitoring and self-management strategies to regulate their own learning. These skills that are necessary for effective active-inquiry based learning, and encompass an important part of Learner-Centered teaching (NRC, 1999a, b).
• Accountable Talk identifies the characteristics of classroom discussions that support coherent, sustained social interaction in which students—and the teacher—build on each others' ideas and hold each other accountable to accurate knowledge and rigorous thinking. In this way, social norms are created in the classroom that support active inquiry, deep learning, and clear expectations, and build a collegial academic atmosphere in the classroom as outlined in the NRC’s (1999a, b) notion of Community-Centered teaching.
Development
Initial development of the IQA was strongly influenced by (Clare) Matsumura’s (2000) efforts to assess collections of assignments and student work as indicators of overall instructional quality at the classroom level, and by Newmann, Lopez, and Bryk’s (1998) work with the Consortium on Chicago School Research to measure the efficacy of reform efforts at the school-level. The TIMSS Videotape
7
Classroom Study (Stigler, Gonzales, Kawanaka, Knoll, & Serrano, 1999) and the QUASAR Project (Silver, 1996; Stein, Smith, Henningson, & Silver, 2000) influenced our development of observation protocols as well. Four sources of evidence were chosen for the IQA, because they are available through relatively brief classroom visits, short structured interviews, and limited post-visitation analysis of classroom artifacts, in order to keep the assessment as efficient and affordable as possible. They are:
• Classroom observation. Each rater observes one full lesson, approximately 45 minutes, per classroom/teacher. The teacher briefly describes the goals and activities of the lesson in a pre-visit questionnaire which raters review before observing the lesson. The rater dedicates much of the visit to recording and scoring evidence of Accountable Talk since this is the only source of evidence for that Principle of Learning. The rater also scores evidence of Academic Rigor by examining the texts, tasks, and implementation of tasks, that are part of the lesson.
• Student interviews. During the lesson, the rater also scores evidence of Clear Expectations and Self Management of Learning by conducting 3–5 minute structured interviews with students (asking questions such as “If I were a new student in this class, how would I know what to do to do a good job on this assignment?” and “Will you have a chance to make your work better after you hand it in?”).
• Teacher interviews. Following the lesson, the rater conducts a brief, structured interview with the teacher. This interview is intended to gain any additional contextual information to help interpret the teacher’s goals for the lesson, and how the observed lesson fits into instruction over time.
• Teacher-generated assignments. Each teacher provides a small portfolio of written assignments he or she has generated for the class (typically four assignments have been used, two of which are considered to be “especially challenging” and two of which students have very recently completed). For each assignment, the teacher completes a cover sheet describing the goals and grading criteria for the task, providing contextual information about how the task fits into instruction over time, and describing what kinds of scoring guides and self-evaluation opportunities students were given while working on the assignment. The teacher also provides examples of student work exemplifying low, medium, and high performance levels on the assignment; student work is not rated directly, but instead is used to help interpret the assignment as “enacted” for students. These assignments are rated for aspects of Academic Rigor, Clear Expectations, and Self-Management of Learning.
8
To develop rubrics for the IQA, the Principles of Learning above were analyzed for specific themes or conceptual dimensions that capture the essential features of each Principle. For example, in the case of Clear Expectations and Self-Management of Learning, six such themes were identified: students’ understanding of expectations; students’ use of criteria to judge work; students’ use of criteria to revise work; clarity of assignment directions; clarity and detail of grading criteria; and alignment of grading criteria and task. For each theme, one or more rubrics was created that clearly defined manifestation of that theme in classroom instruction and artifacts on a four point scale (1=poor and 4=excellent).
Rating with IQA rubrics is designed to be as low-inference as possible. Each scale point of each rubric is given a precise and explicit descriptor of instructional performance at that level, and the rating process is scaffolded by having the rater record focused field notes and checklist items during observation before scoring rubrics (see Appendix D for the 2003 IQA rubrics). This effort to create relatively low-inference rating stands in contrast to many existing instruments designed to measure teaching effectiveness, which often contain general descriptors and tend to rely on extensive rater training coupled with the inferential capabilities and background knowledge of the raters. For example, the Queensland School Reform Longitudinal Study's (2002) instructional quality instrument, which built directly off of Newmann et al.'s work (1998), contains rubrics that require extensive rater expertise. A specific illustration of this is seen in the Queensland School Reform Longitudinal Study's rubric that requires raters to make a judgment about whether the observed lesson was based on content that is considered central to learning. Because the tool does not precisely define how to judge what qualifies as central to learning in different content areas and at various grade levels, high levels of rater expertise and training would be necessary to achieve reliability and to use the tool for teaching about quality instruction. As a second example, since the Horizon Protocol provides descriptors for only the first and last points on a five-point scale, rater training is required to learn what kind of evidence would lead to ratings along the different intermediate points. The IQA differs from these studies in that it provides two scaffolds for the rating process: focused field notes and/or checklists to help distill the raw observational data, and explicit descriptors of levels of quality instruction for each rubric.
The advantages of mapping out the attributes of quality instruction, scale point by scale point on each rubric, are two-fold. First, it makes the IQA more feasible to
9
administer, and more reliable in practice. Raters’ backgrounds do not have to be as extensive as with less-elaborated rating instruments, and rater training can be more efficient. Using relatively low-inference rubrics, raters who have been through rater training can achieve higher reliability of ratings, which is essential for maximizing information from each rated sample of classrooms.
Second, the IQA is a kind of “performance assessment” for teachers, just as achievement tests are assessments for students. Inasmuch as teachers—as well as students—are learners who need to develop clear expectations about their performance in order to manage their own learning, it is essential to specify what is being assessed by the IQA. Detailed and precise descriptors of IQA rubrics do this. Eventually we expect the IQA to function not only as an “external” summative tool but also as the basis of an “internal” learning instrument (Sheppard, 2000). District professionals and teachers who use IQA rubrics and materials based on them for self-study will learn specifically what we mean by “instructional quality,” and can use the rubric descriptors to bolster instructional practice. General high-inference descriptors, on the other hand, would require a trained, “expert” rater to interpret and unpack the meaning of the descriptors.
Work to Date
Our work so far has focused on developing IQA rubrics, observation protocols, and scoring guidelines for mathematics and reading comprehension in the primary and upper elementary grades. We have found that some variation in the IQA is needed for different subject areas and grade levels. Broadly speaking, rubrics for Clear Expectations/Self-Management of Learning and Accountable Talk seem to work quite well across subject areas and grade levels, with relatively minor modification of observation protocols and benchmark examples of various scale points required.1 On the other hand, Academic Rigor cannot be separated from subject area, and somewhat different rubrics and descriptors, as well as variations in observation protocols and rater training materials, are needed.2 In the content area
1 As an example, since younger students are not able to talk abstractly about “what good work is,” interview scripts for younger students are somewhat different from interview scripts for older students. 2 For example, we have found the same level of specificity in assignment directions needed to maintain Academic Rigor in reading comprehension, perhaps by limiting students’ scope to substitute superficially relevant personal history for substantial interpretation of a text, is likely to provide too much specificity to maintain Academic Rigor in mathematics, transforming the enacted task from mathematics problem solving to routine computation.

10
of mathematics, we have borrowed, with few modifications, from the QUASAR framework (Stein, et al., 2000). In English Language Arts, we have expanded on the previous rubrics designed by Matsumura (2000).
The IQA is administered in three phases. First, after classrooms are selected for study, teachers in selected classrooms fill out the pre-visit questionnaire for classroom observation and assemble assignment portfolios. Second, raters visit classrooms. During classroom visits, raters record the presence or absence of specific kinds of evidence, take limited field notes, and conduct short student interviews, according to specific observation protocols. Teacher interviews are conducted as soon after the lesson as possible; then, IQA rubrics relating to Academic Rigor, Clear Expectations/Self Management of Learning, and Accountable Talk in the classroom are scored. In the third phase, teachers’ assignment portfolios are rated offsite, using IQA rubrics relating to Academic Rigor and Clear Expectations/Self Management of Learning.
An earlier version of the IQA for mathematics and reading comprehension was field tested in a feasibility study in May 2002 (Crosson, Junker, Matsumura & Resnick, 2003), in three K-8 schools in a large urban school District in the northeastern United States. IQA developers acted as raters, visiting five mathematics lessons and seven reading comprehension lessons in pairs. Rubrics were scored twice by each rater, once before and once after a consensus-building session within each rater pair. Audio recordings of all classroom observations, student interviews, and consensus-building sessions were made to assist in post-hoc evaluations of the rubrics. Although the small sample precluded full analysis, exploratory analyses were conducted including both summary/graphical methods and variance components analyses (e.g. McCulloch & Searle, 2001) where possible, using individual raters’ scores before consensus-building sessions. Composite scores (total scores) for Academic Rigor, Accountable Talk, and Clear Expectations showed larger effects for teachers than for schools or raters. Inter-rater reliability was generally high and did not differ substantially for math and reading comprehension. Based on these quantitative analyses, on qualitative analysis of audiotapes and raters’ notes, and on informal review by LRDC/IFL staff, the IQA was revised to streamline observation and interview protocols, to strengthen the link between the content of the rubrics to research and theory in math and literacy instruction, and to more systematically define how student work samples could be used as a window on instructional quality.
11
A Pilot Study of the IQA
A larger trial of the revised IQA was conducted in Spring 2003, using 16 mathematics lessons and 14 reading comprehension lessons from randomly-sampled elementary schools in two similar-sized urban school Districts, in different eastern states. The Districts, to which we shall refer as District C and District D, had 26–28 elementary schools each, were selected for this study to be similar demographically3 but differ in professional development and related efforts. Both Districts were IFL-affiliated Districts, but District C had been involved for a longer period of time than District D in activities related to the Principles of Learning, and a major purpose of this study was to determine whether the IQA was sensitive to this difference. A second major purpose of the study was to design and evaluate a full rater training program; in particular we wanted to know if professionals not associated with the IQA could be trained to be reliable IQA raters. Finally we wanted to learn about individual behavior of the rubrics and relationships among them, and whether differences could be detected on a per-rubric basis.
Method
With the help of the principle IFL staff person working with each school District, a District administrator in each District was approached with a proposal for the study. After negotiation in each District, a study design was agreed to, envisioning six randomly-sampled elementary schools in each District, targeting four lessons/classrooms per school (mathematics at grades 2 and 4; and reading comprehension at grades 2 and 4), for a total of 24 classrooms per District. Schools were randomly selected by IQA staff, reviewed by the District administrator, and their principals were invited by letter from the District administrator to participate in the study. All six schools selected in District C participated in the study. In District D, one of the six randomly selected schools was withdrawn by the District for administrative reasons and replaced with another randomly-sampled school. IQA staff visited each school to recruit teachers. Participating teachers received a $100 bookstore gift certificate; the two Districts and the participating schools received brief reports of preliminary results of the study.
3 Students in the two Districts were 26% African American, 6% Asian, 47% Latino, 15% white, 6% other; 20% of these students were identified as English language learners. Teachers who participated in the study had been teaching for an average of 14 years, and had been at their school an average of 4 years.
12
In both Districts, teacher recruitment varied greatly from building to building. To achieve full sample size in District C, a seventh randomly selected school was added, and one teacher each in grades 3 and 5, in different schools, were added to the study; in the end, seven schools and 17 classrooms/teachers participated from District C. Initially a full sample of teachers/classrooms was obtained in District D, but some teachers and schools dropped out during data collection so that in the end four schools and 13 classrooms/teachers participated from District D. In these 30 classrooms, 16 mathematics lessons were observed and 14 reading comprehension lessons were observed. The complete design for classroom/lesson observation is shown in Tables A1 and A2 in Appendix A.
Six raters were recruited from graduate schools of education in universities near the two Districts, and underwent a 2.5 day training program designed and administered by IQA developers. Raters visited classrooms in pairs, accompanied by an IQA staff member, observing lessons and interviewing up to four students per rater per classroom, depending on availability. Student interviews were guided by a standard script. Visits were scheduled in consultation with the teacher, so that the lesson included a group discussion (reading comprehension) or group problem solving (mathematics), as well as individual or small-group tasks.
All three observers (two raters and the IQA staff member) produced independent ratings of Academic Rigor (AR), Clear Expectations (CE) and Accountable Talk (AT), based on lesson observation and a short, scripted teacher interview; after this, the three observers produced and recorded consensus ratings for the classroom just observed. All four sets of ratings were recorded for each classroom. Raters were assigned to classrooms so that, within each District each rater saw approximately the same number of classrooms, and across Districts each rater rated approximately the same number of times with each of three other raters.
Each participating teacher was also asked to prepare an assignment portfolio, consisting of four assignments he or she had prepared for the class: two challenging assignments and two recent assignments. For each assignment, the teacher filled out a short questionnaire describing the content, grading criteria, and other aspects of the assignment, and supplied graded examples of student work at low, medium, and high levels of performance. These portfolios were analyzed offline approximately three weeks after classroom rating. Two raters, recruited from the six classroom raters, examined all assignments and produced independent and
13
consensus ratings for Academic Rigor (AR) and clear Expectations (CE), for each assignment in each teacher’s portfolio.
The raters were not told why the Districts were selected for the study, and were unfamiliar with the IQA prior to training; the IQA staff members who accompanied the raters to the classrooms also did not discuss these issues with the raters, nor did they discuss raters’ individual ratings until the consensus-building sessions for each classroom. A similar procedure was used for rating assignments.
All classroom and assignment ratings were recorded on 4-point Likert scale rubrics, in which, broadly speaking, “1” denotes non-proficient performance, “2” denotes approaching proficient performance, “3” denotes proficient performance and “4” denotes exemplary performance. Missing data (rater unable to observe, lesson did not contain activity relevant to this rubric, etc., was marked “NA” (not applicable) for each rubric. The rating forms that raters used also contained observation checklists, stylized forms for field notes, and descriptions and examples of behavior characterizing each point on each rubric, to scaffold the rating process. Raters filled out checklists and field notes in real time during lesson observation, and generated individual ratings immediately after lesson observation; consensus-building sessions followed thereafter. All lessons were also audiotaped and transcribed for post-mortem analysis of the rating process and for qualitative analyses of the processes being rated (see, e.g., Wolf et al., 2004).
Except where noted, individual raters’ ratings before consensus-building sessions within each rater pair were used in subsequent analyses. For AT, only “consensus” scores were recorded because the raters found they didn’t have time to both interview students and observe classroom activity, so they split up these two activities and combined them to produce single consensus ratings after the lesson. In some analyses, classrooms at Grades 2 and 3 are grouped together and called “primary” grades and Grades 4 and 5 are grouped together and called “upper” elementary grades. Schools were also identified as low-, middle- or high-achieving, based on whether they were ranked in the lower, middle, or upper third of all elementary schools in their District, by a recent fourth grade standardized achievement test scores in that District.

14
Results
Separate analyses were performed for lesson observation and assignment ratings in each of the following areas. All analyses were conducted using SPSS 11.0 (2001).
• Reliability: Reliability was calculated between the two trained raters overall, as well as by principles and rubrics. Both exact agreement and one point agreement were calculated for overall lesson observation scores. We also explored which adjacent rating categories were most difficult for raters to distinguish by comparing exact agreement on the 4-point rubrics with exact agreement on 3-point rubrics created by merging each pair of adjacent rating categories. Reliability over time was also investigated, to see if rater training effects wore off or if there were practice effects from experience.
• Score Distribution: Means, standard deviations, and histograms were calculated for each score distribution, overall and by rubrics. Separate analyses of some score distributions were also performed by District, grade, or subject.
• Relationship: Spearman correlations were calculated between all pairs of rubrics, between principles, and between rubrics measuring the same Principle of Learning from different sources. Logistic regression analyses were also completed on the overall Lesson Observation data.
For Academic Rigor it is also necessary to break out the analyses according to whether the lesson or assignment covers Reading Comprehension or Mathematics. This is because the wording of the rubrics, and the observational protocols, are somewhat different in these two subject areas.
Lesson Observation Ratings. Tables 1A and 1B gives percent agreement, percent agreement within one scale point, Kappa and Spearman correlations, and intraclass correlation, for various aggregations of the lesson observation rubrics. Table 1A gives aggregate reliability indices for all rubrics, for rubrics scored just in Reading Comprehension or just in Mathematics lessons, and for rubrics scored within each District. Percent exact agreement hovers around 50%, which is not very high, but percent agreement within one scale point is quite good indeed, at 95% or better. The Kappa and Spearman correlations are both moderate. Despite these moderately low results, the overall intraclass correlation is moderate to good, suggesting that total scores may offer a reliable index of instructional quality.

15
Table 1B presents the same reliability indices, for all classrooms, within each Principle of Learning. Percent exact agreement and Kappa were similar across Principles, and similar to the values in Table 1A. Spearman’s r also ranges over the same values as in Table 1A, but are somewhat more variable than percent agreement or Kappa. Within each Principle of Learning except for AR in Mathematics, the intraclass correlations again suggest that total scores may provide reliable indices of instructional quality within each Principle.
To examine the increase in percent agreement when we move from exact agreement to agreement within one point, we also explored changes in reliability of rating when each two adjacent rating categories were merged. Table 1C gives the result and suggests that the greatest gain could be had by merging the “proficient” (category 3) and “exemplary” (category 4) score points; however apparently there is confusion about other categories as well since this operation only brings the exact agreement up into the range of 60% or so, rather than the 95% seen in Table 1A.
We also examined the stability of rater agreement over time (see Figure 1). The first four time points represent days that the raters spent in District C, the last four represent days in District D. Within each District, percent exact agreement increased moderately as the data collection continued. Although there was a drop, as might be expected, in the transition from District C to District D, overall the percent agreement increased across Districts. This suggests both that the raters continue to learn as they do “live” rating, and suggests that perhaps the rater training program should be extended by having the raters rate some “live” but out-of-sample classrooms before rating “live” classrooms that will contribute to an IQA score.
Table 1A
Inter-rater reliability of lesson observation ratings.
% exact agreement
1-point agreement
Kappa Spearman’s R
Intraclass correlation
Overall 51.0 96.0 .33 .58 .74
Reading 53.9 95.8 .36 .64 .80
Math 47.6 95.2 .29 .51 .68
District C 50.0 95.7 .27 .47 .68
District D 51.4 95.2 .34 .58 .74

16
Table 1B
Inter-rater reliability of lesson observation ratings, by Principle of Learning.
Principle of Learning
% exact agreement
Kappa Spearman’s R
Intraclass correlation
AT 51.0 .31 .63 .79
CE/SML 51.7 .30 .39 .60
AR: RC 50.0 .31 .61 .76
AR: Math 48.1 .27 .43 .47
Table 1C
Inter-rater reliability of lesson observation ratings, after merging rubric categories.
% of exact agreement Kappa
4 point scale (1-4) 51.0 .33
3 point scale (1, 2, 3 &4) 68.3 .40
3 point scale (1, 2 & 3, 4) 62.4 .41
3 point scale (1 & 2, 3, 4) 59.4 .38
Exact agreement over the time
0
10
20
30
40
50
60
70
80
90
100
5/5 5/6 5/7 5/8 5/12 5/13 5/14 5/15
Date
% o
f exa
ct a
gree
men
t
Figure 1. Percent exact agreement over time.
17
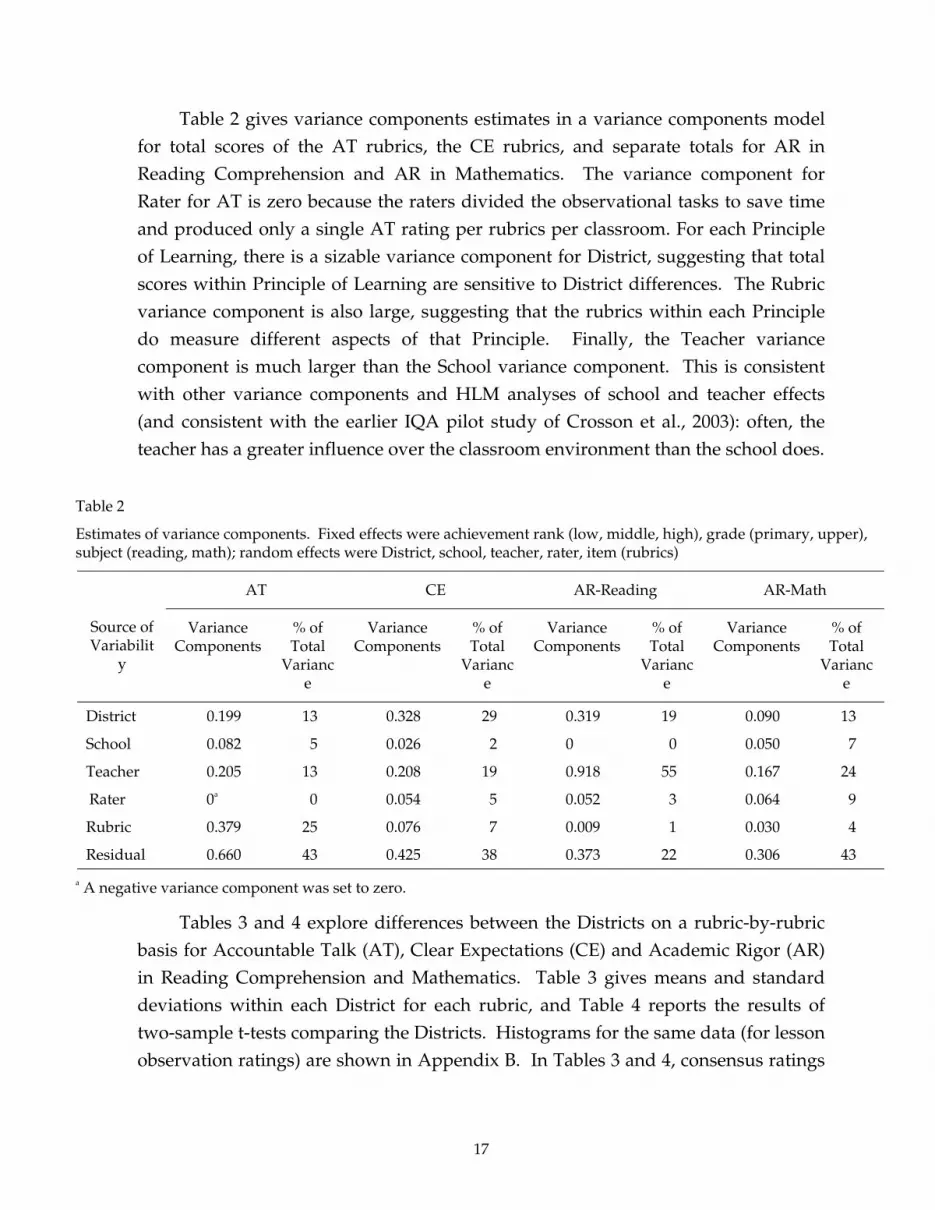
Table 2 gives variance components estimates in a variance components model for total scores of the AT rubrics, the CE rubrics, and separate totals for AR in Reading Comprehension and AR in Mathematics. The variance component for Rater for AT is zero because the raters divided the observational tasks to save time and produced only a single AT rating per rubrics per classroom. For each Principle of Learning, there is a sizable variance component for District, suggesting that total scores within Principle of Learning are sensitive to District differences. The Rubric variance component is also large, suggesting that the rubrics within each Principle do measure different aspects of that Principle. Finally, the Teacher variance component is much larger than the School variance component. This is consistent with other variance components and HLM analyses of school and teacher effects (and consistent with the earlier IQA pilot study of Crosson et al., 2003): often, the teacher has a greater influence over the classroom environment than the school does.
Table 2
Estimates of variance components. Fixed effects were achievement rank (low, middle, high), grade (primary, upper), subject (reading, math); random effects were District, school, teacher, rater, item (rubrics)
AT CE AR-Reading AR-Math
Source of Variabilit
y
Variance Components
% of Total
Variance
Variance Components
% of Total
Variance
Variance Components
% of Total
Variance
Variance Components
% of Total
Variance
District 0.199 13 0.328 29 0.319 19 0.090 13
School 0.082 5 0.026 2 0 0 0.050 7
Teacher 0.205 13 0.208 19 0.918 55 0.167 24
Rater 0a 0 0.054 5 0.052 3 0.064 9
Rubric 0.379 25 0.076 7 0.009 1 0.030 4
Residual 0.660 43 0.425 38 0.373 22 0.306 43
a A negative variance component was set to zero.
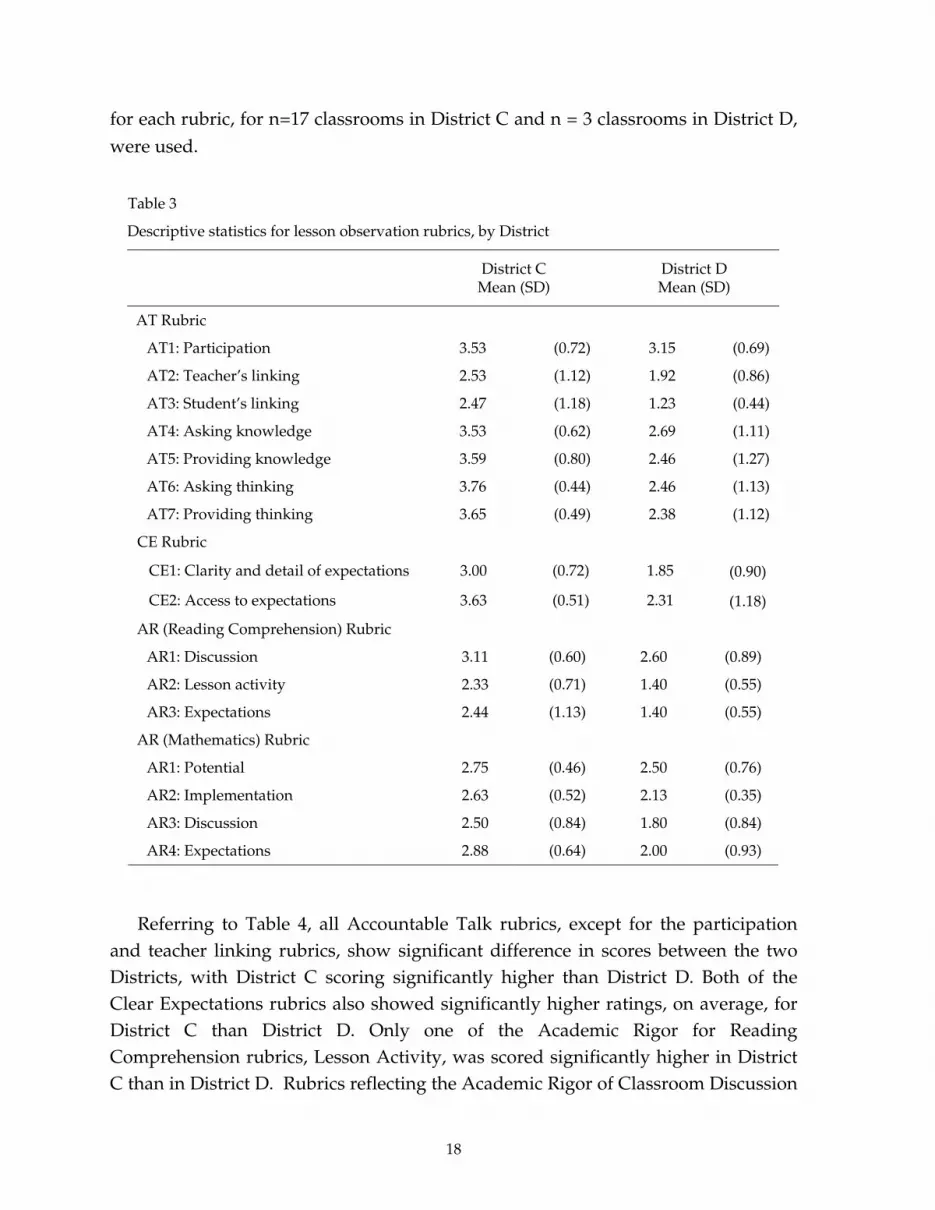
Tables 3 and 4 explore differences between the Districts on a rubric-by-rubric basis for Accountable Talk (AT), Clear Expectations (CE) and Academic Rigor (AR) in Reading Comprehension and Mathematics. Table 3 gives means and standard deviations within each District for each rubric, and Table 4 reports the results of two-sample t-tests comparing the Districts. Histograms for the same data (for lesson observation ratings) are shown in Appendix B. In Tables 3 and 4, consensus ratings
18
for each rubric, for n=17 classrooms in District C and n = 3 classrooms in District D, were used.
Table 3
Descriptive statistics for lesson observation rubrics, by District
District C Mean (SD)
District D Mean (SD)
AT Rubric
AT1: Participation 3.53 (0.72) 3.15 (0.69)
AT2: Teacher’s linking 2.53 (1.12) 1.92 (0.86)
AT3: Student’s linking 2.47 (1.18) 1.23 (0.44)
AT4: Asking knowledge 3.53 (0.62) 2.69 (1.11)
AT5: Providing knowledge 3.59 (0.80) 2.46 (1.27)
AT6: Asking thinking 3.76 (0.44) 2.46 (1.13)
AT7: Providing thinking 3.65 (0.49) 2.38 (1.12)
CE Rubric
CE1: Clarity and detail of expectations 3.00 (0.72) 1.85 (0.90)
CE2: Access to expectations 3.63 (0.51) 2.31 (1.18)
AR (Reading Comprehension) Rubric
AR1: Discussion 3.11 (0.60) 2.60 (0.89)
AR2: Lesson activity 2.33 (0.71) 1.40 (0.55)
AR3: Expectations 2.44 (1.13) 1.40 (0.55)
AR (Mathematics) Rubric
AR1: Potential 2.75 (0.46) 2.50 (0.76)
AR2: Implementation 2.63 (0.52) 2.13 (0.35)
AR3: Discussion 2.50 (0.84) 1.80 (0.84)
AR4: Expectations 2.88 (0.64) 2.00 (0.93)
Referring to Table 4, all Accountable Talk rubrics, except for the participation and teacher linking rubrics, show significant difference in scores between the two Districts, with District C scoring significantly higher than District D. Both of the Clear Expectations rubrics also showed significantly higher ratings, on average, for District C than District D. Only one of the Academic Rigor for Reading Comprehension rubrics, Lesson Activity, was scored significantly higher in District C than in District D. Rubrics reflecting the Academic Rigor of Classroom Discussion

19
and of Expectations (of student performance) were not significantly different. We believe this may be due to a confound with curriculum: anecdotal evidence suggests that District C’s reading comprehension curriculum was not sufficiently well-defined to support high-quality instruction. Two of the four Academic Rigor for Mathematics rubric differed significantly between the Districts (again favoring District C), the rubrics relating to Lesson Implementation and Expectations of student performance. Lesson Potential and Classroom Discussion rubrics did not show significant differences.
Table 4
Between-District two-sample t-tests for lesson observation rubrics
Mean Difference T df Sig. (2-tailed)
AT1 0.38 1.445 28 .159
AT2 0.61 1.613 28 .118
AT3 1.24 3.594 28 .001
AT4 0.84 2.623 28 .014
AT5 1.13 2.987 28 .006
AT6 1.30 4.376 28 .000
AT7 1.26 4.164 28 .000
CE1 1.15 3.940 28 .000
CE2 1.22 3.829 28 .001
Reading Comprehension
AR1 0.51 1.286 12 .223
AR2 0.93 2.542 12 .026
AR3 1.04 1.919 12 .079
Mathematics
AR1 0.25 0.798 14 .438
AR2 0.50 2.256 14 .041
AR3 0.70 1.382 9 .200
AR4 0.88 2.198 14 .045
In Tables 5A, 5B, 6A, and 6B we explore relationships among the rubrics by computing their correlations across classrooms and Districts. Tables 5A and 5B consider correlations of total scores within each Principle of Learning, separately for
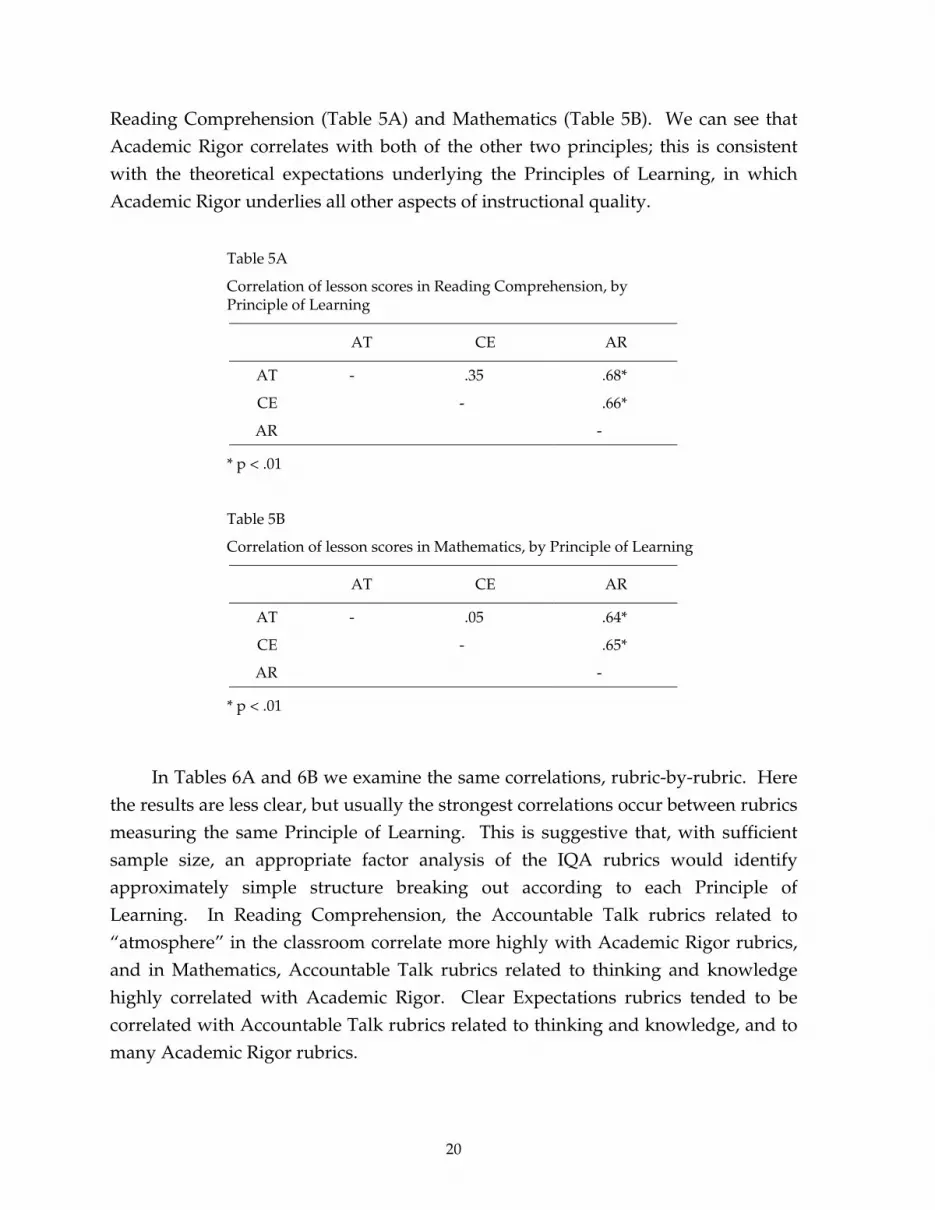
20
Reading Comprehension (Table 5A) and Mathematics (Table 5B). We can see that Academic Rigor correlates with both of the other two principles; this is consistent with the theoretical expectations underlying the Principles of Learning, in which Academic Rigor underlies all other aspects of instructional quality.
Table 5A
Correlation of lesson scores in Reading Comprehension, by Principle of Learning
AT CE AR
AT - .35 .68*
CE - .66*
AR -
* p < .01
Table 5B
Correlation of lesson scores in Mathematics, by Principle of Learning
AT CE AR
AT - .05 .64*
CE - .65*
AR -
* p < .01
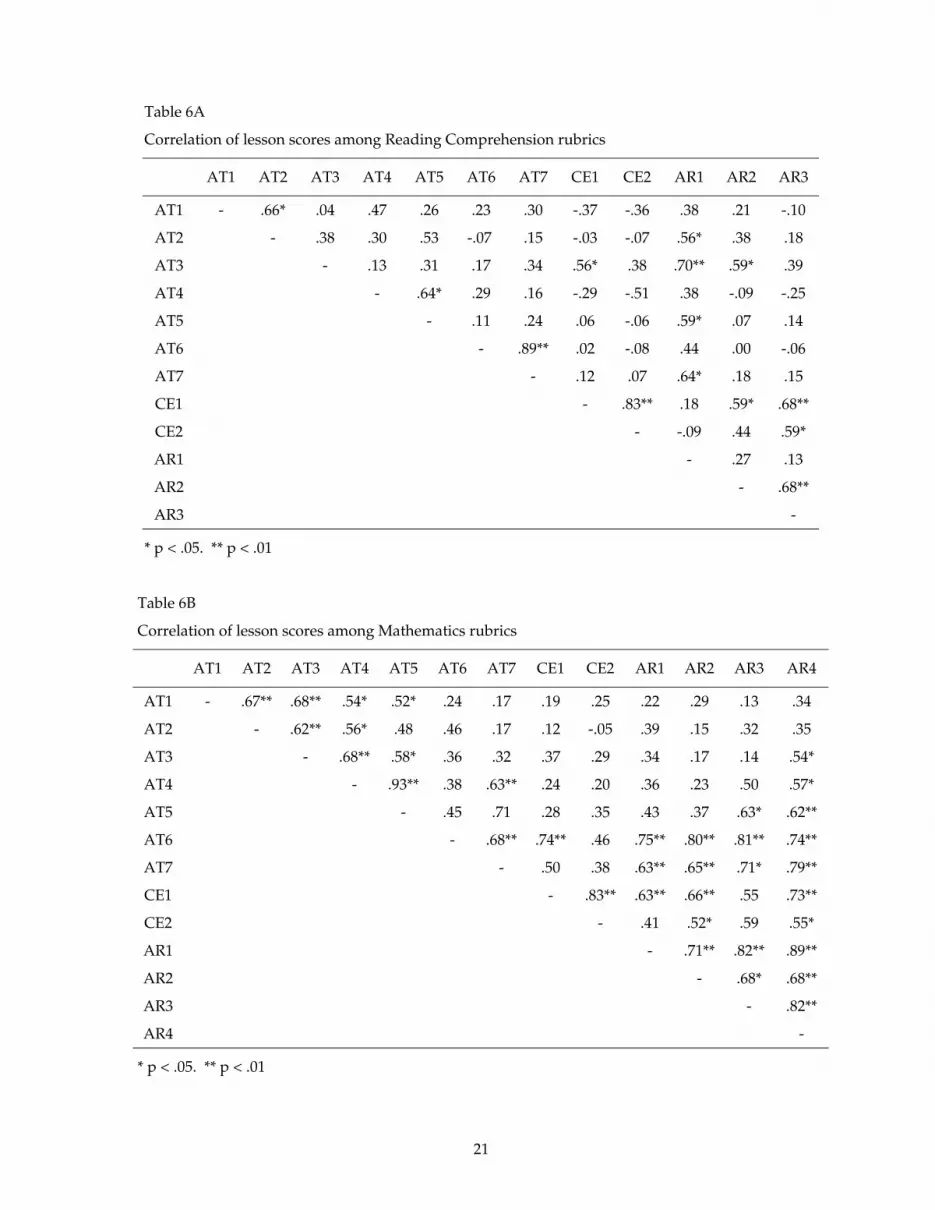
In Tables 6A and 6B we examine the same correlations, rubric-by-rubric. Here the results are less clear, but usually the strongest correlations occur between rubrics measuring the same Principle of Learning. This is suggestive that, with sufficient sample size, an appropriate factor analysis of the IQA rubrics would identify approximately simple structure breaking out according to each Principle of Learning. In Reading Comprehension, the Accountable Talk rubrics related to “atmosphere” in the classroom correlate more highly with Academic Rigor rubrics, and in Mathematics, Accountable Talk rubrics related to thinking and knowledge highly correlated with Academic Rigor. Clear Expectations rubrics tended to be correlated with Accountable Talk rubrics related to thinking and knowledge, and to many Academic Rigor rubrics.
21
Table 6A
Correlation of lesson scores among Reading Comprehension rubrics
AT1 AT2 AT3 AT4 AT5 AT6 AT7 CE1 CE2 AR1 AR2 AR3
AT1 - .66* .04 .47 .26 .23 .30 -.37 -.36 .38 .21 -.10
AT2 - .38 .30 .53 -.07 .15 -.03 -.07 .56* .38 .18
AT3 - .13 .31 .17 .34 .56* .38 .70** .59* .39
AT4 - .64* .29 .16 -.29 -.51 .38 -.09 -.25
AT5 - .11 .24 .06 -.06 .59* .07 .14
AT6 - .89** .02 -.08 .44 .00 -.06
AT7 - .12 .07 .64* .18 .15
CE1 - .83** .18 .59* .68**
CE2 - -.09 .44 .59*
AR1 - .27 .13
AR2 - .68**
AR3 -
* p < .05. ** p < .01
Table 6B
Correlation of lesson scores among Mathematics rubrics
AT1 AT2 AT3 AT4 AT5 AT6 AT7 CE1 CE2 AR1 AR2 AR3 AR4
AT1 - .67** .68** .54* .52* .24 .17 .19 .25 .22 .29 .13 .34
AT2 - .62** .56* .48 .46 .17 .12 -.05 .39 .15 .32 .35
AT3 - .68** .58* .36 .32 .37 .29 .34 .17 .14 .54*
AT4 - .93** .38 .63** .24 .20 .36 .23 .50 .57*
AT5 - .45 .71 .28 .35 .43 .37 .63* .62**
AT6 - .68** .74** .46 .75** .80** .81** .74**
AT7 - .50 .38 .63** .65** .71* .79**
CE1 - .83** .63** .66** .55 .73**
CE2 - .41 .52* .59 .55*
AR1 - .71** .82** .89**
AR2 - .68* .68**
AR3 - .82**
AR4 -
* p < .05. ** p < .01
22
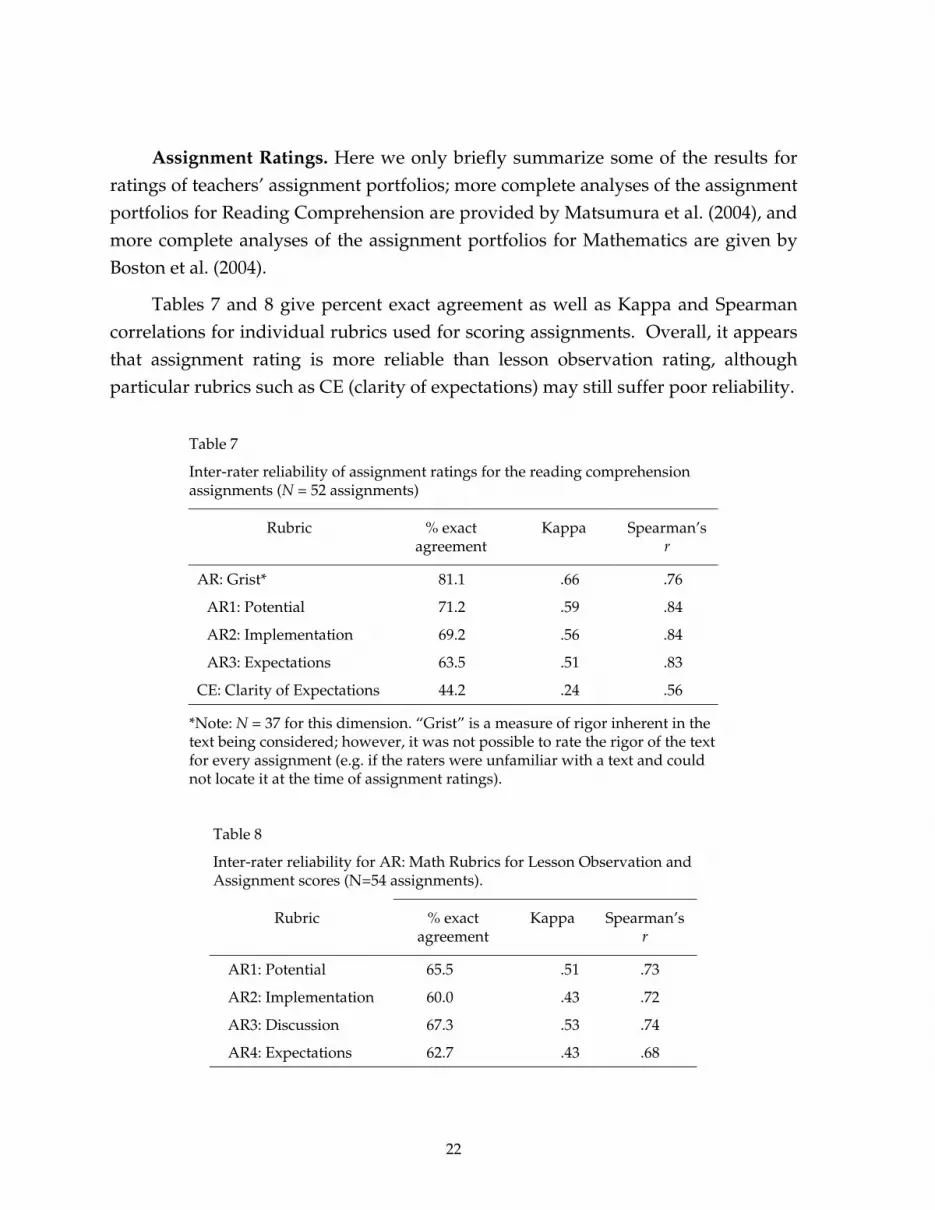
Assignment Ratings. Here we only briefly summarize some of the results for ratings of teachers’ assignment portfolios; more complete analyses of the assignment portfolios for Reading Comprehension are provided by Matsumura et al. (2004), and more complete analyses of the assignment portfolios for Mathematics are given by Boston et al. (2004).
Tables 7 and 8 give percent exact agreement as well as Kappa and Spearman correlations for individual rubrics used for scoring assignments. Overall, it appears that assignment rating is more reliable than lesson observation rating, although particular rubrics such as CE (clarity of expectations) may still suffer poor reliability.
Table 7
Inter-rater reliability of assignment ratings for the reading comprehension assignments (N = 52 assignments)
Rubric % exact agreement
Kappa Spearman’s r
AR: Grist* 81.1 .66 .76
AR1: Potential 71.2 .59 .84
AR2: Implementation 69.2 .56 .84
AR3: Expectations 63.5 .51 .83
CE: Clarity of Expectations 44.2 .24 .56
*Note: N = 37 for this dimension. “Grist” is a measure of rigor inherent in the text being considered; however, it was not possible to rate the rigor of the text for every assignment (e.g. if the raters were unfamiliar with a text and could not locate it at the time of assignment ratings).
Table 8
Inter-rater reliability for AR: Math Rubrics for Lesson Observation and Assignment scores (N=54 assignments).
Rubric % exact agreement
Kappa Spearman’s r
AR1: Potential 65.5 .51 .73
AR2: Implementation 60.0 .43 .72
AR3: Discussion 67.3 .53 .74
AR4: Expectations 62.7 .43 .68

23
Table 9 gives a brief variance components analysis for the assignment ratings, totaled within the AR and CE rubrics (AT depends on social interaction, so that is very similar to the variance components analysis of Table 2 above). It is interesting to note that Rater has a negligible variance component in this analysis. School again contributes almost nothing to the variance components model, when District, Teacher, and Assignment are considered. District consistently contributes the largest variance component, again suggesting that the IQA rubrics can reliably make such distinctions. Finally, the variance component for Assignments is consistently second-largest, after District. This surprised us; past work by Matsumura (2003) suggests that collecting four assignments ought to produce fairly stable estimates of the quality of assignment. In retrospect, however, we think that our instructions to teachers, to include two challenging and two recent assignments, acted to artificially increase this variance component (since Challenge and Academic Rigor, for example, are often related). Better might be to have the teachers simply include four recent assignments.
Table 9
Estimates of variance components, reading comprehension assignments. Fixed effects were achievement rank (low, middle, high), grade (primary, upper), subject (reading, math); random effects were District, school, teacher, rater, item (rubrics), and assignment.
AR CE Source of
Variability Variance Components
% of Total Variance
Variance Components
% of Total Variance
District 0.378 31 0.864 57
School 0a 0 0 0
Teacher 0.214 18 0.172 11
Rater 0 0 0 0
Assignment 0.351 29 0.171 11
Rubric 0.019 2 -* -
Residual 0.246 20 0.318 21
a A negative variance component was set to zero.
* CE only has one rubric.

24
Tables 10 and 11 provide between-District comparisons on a rubric-by-rubric basis, for assignment ratings, that is entirely analogous to Tables 3 and 4. Histograms for the same data are provided in Appendix C. Once again, there are significant differences between Districts, favoring District C, except for two AR rubrics in Reading Comprehension classrooms. Once again we suspect a confound with curriculum here; with the curriculum in District C apparently unable to support fully academically rigorous work for students.
Table 10
Descriptive statistics for assignment ratings, by District
Rubrics (Reading Comprehension) District C
Mean (SD)
District D
Mean (SD)
Reading Comprehension
AR1: potential 2.44 (1.05) 2.10 (0.85)
AR2: implementation 1.91 (1.00) 1.60 (0.68)
AR3: expectations 2.63 (1.07) 1.75 (0.85)
CE: clarity of expectations 2.97 (0.80) 1.50 (0.61)
Mathematics
AR1: Potential 3.15 (0.53) 1.93 (0.72)
AR2: Implementation 2.63 (0.79) 1.61 (0.69)
AR3: Rigor in response 2.67 (0.78) 1.50 (0.79)
AR4: Expectations 3.07 (0.39) 1.96 (0.58)
CE: clarity of expectations 3.19 (0.62) 1.71 (0.76)
25
Table 11
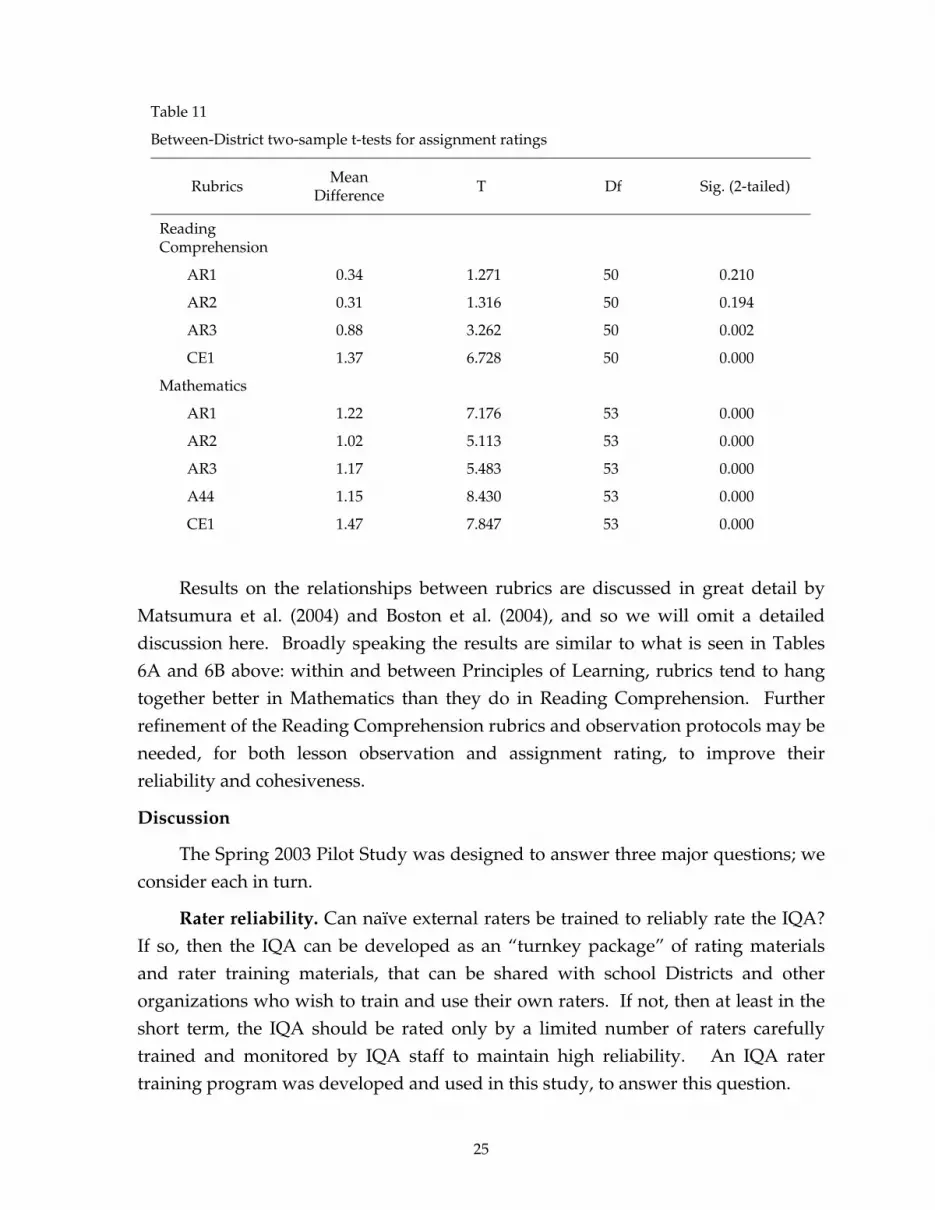
Between-District two-sample t-tests for assignment ratings
Rubrics Mean Difference T Df Sig. (2-tailed)
Reading Comprehension
AR1 0.34 1.271 50 0.210
AR2 0.31 1.316 50 0.194
AR3 0.88 3.262 50 0.002
CE1 1.37 6.728 50 0.000
Mathematics
AR1 1.22 7.176 53 0.000
AR2 1.02 5.113 53 0.000
AR3 1.17 5.483 53 0.000
A44 1.15 8.430 53 0.000
CE1 1.47 7.847 53 0.000
Results on the relationships between rubrics are discussed in great detail by Matsumura et al. (2004) and Boston et al. (2004), and so we will omit a detailed discussion here. Broadly speaking the results are similar to what is seen in Tables 6A and 6B above: within and between Principles of Learning, rubrics tend to hang together better in Mathematics than they do in Reading Comprehension. Further refinement of the Reading Comprehension rubrics and observation protocols may be needed, for both lesson observation and assignment rating, to improve their reliability and cohesiveness.
Discussion
The Spring 2003 Pilot Study was designed to answer three major questions; we consider each in turn.
Rater reliability. Can naïve external raters be trained to reliably rate the IQA? If so, then the IQA can be developed as an “turnkey package” of rating materials and rater training materials, that can be shared with school Districts and other organizations who wish to train and use their own raters. If not, then at least in the short term, the IQA should be rated only by a limited number of raters carefully trained and monitored by IQA staff to maintain high reliability. An IQA rater training program was developed and used in this study, to answer this question.

26
Exact agreement between trained raters was only moderate (47.6-51.0%), but agreement to within one scale point was quite good (95.2-96%); moreover exact agreement increased markedly over the time course of the study. If naïve raters are to be trained for rating the IQA, then a longer training period involving some “live,” out of sample, rating, seems to be required. Variance components analysis using various total scores showed small effects for raters, and larger effects for teachers and rubrics than schools, within each District. These results tend to support the notion that the IQA could be scored by trained external raters, if only total scores per Principle of Learning, or total scores at some higher level of aggregation, are desired. For reliable scoring of individual rubrics, however, it seems likely that both the rubrics themselves, as well as the rater training program, will have to be further refined. Until then, a limited number of raters carefully trained and monitored by the IQA team should be used, when high reliability of rating individual rubrics is desired.
Differentiation between Districts. The study of Crosson et al. (2003) established that the IQA was sensitive to variation in teachers’ practice. However, that study was not designed to establish a relationship between IQA score variation and degree of effort or success in implementing instructional practices consistent with the Principles of Learning. Two Districts with differing levels of involvement in activites related to the Principles of Learning were compared in this study to try to answer this question.
Variance components analysis in the present study displayed a strong variance component for District, suggesting that total IQA scores could well-differentiate between Districts with different levels of instructional quality related to the Principles of Learning. Between-District comparisons of consensus scores show that most individual rubrics on the IQA are sensitive to these differences. Indeed, most rubrics showed significant differences between the Districts, favoring District C, which had a longer involvement in efforts to implement instructional practices consistent with the Principles of Learning, with typical average raw score differences of one scale point or more per rubric between Districts; even rubrics that did not show significant differences showed trend effects favoring District C. The least sensitive rubrics were for Academic Rigor in reading comprehension, but this may be due to a confound with curriculum: anecdotal evidence suggests that District C’s reading comprehension curriculum was not sufficiently well-defined to support high-quality instruction.

27
Relationship among rubrics. How are the various rubrics in the IQA related to one another? Do they appear to be functioning independently of one another? Are they so closely connected that some can be dropped without loss of reliability? Although full answers to this question require psychometric methods such as multidimensional item response theory and factor analysis, that demand much larger sample sizes than were available in the present study, we did explore this question with correlational analyses.
Here the findings were mixed, but somewhat encouraging. Broadly speaking, we found that AR rubrics tend to be more highly correlated with one another than rubrics for AT or CE. Moreover, AR rubrics tend to be correlated with rubrics from AT and CE, supporting the notion embedded in the Principles of Learning that Academic Rigor underlies Accountable Talk and Clear Expectations (and indeed, all of the Principles), at least when these are observed according to the observational protocols taught in the IQA rater training program. We also found that rubrics used for observing and scoring Mathematics lessons and assignments tended to cohere as a scale more (i.e. higher intercorrelations) than when used for observing and scoring Reading Comprehension lessons and assignments, and rubrics for scoring lesson observations were somewhat more coherent than those used for assignment scoring. This latter phenomenon may be partly due to our request for “two challenging and two recent assignments” in each teacher’s assignment portfolio, which induced more assignment variability (for example, as measured in a variance components analysis) than past research (e.g., Matsumura, 2003) lead us to expect. Overall, it is encouraging that in some cases we do have fairly coherent sets of rubrics, and studying what makes these rubrics work well may help us to improve the others; it is also encouraging that in the case of assignment rating, a simpler request of teachers may significantly improve the rubric score data.
Conclusions and Future Work
Educators, policy-makers, and researchers need to be able to assess the efficacy of specific interventions in schools and school Districts. Despite a plethora of reform programs in place across the nation to improve the quality of teaching, the success of these ventures generally has been assessed in one way—through student outcome scores on standardized tests of achievement. This approach has limitations: If a new professional development intervention is improving achievement scores, what feature of instruction has changed? If professional development is not improving

28
student scores, is it because the intervention is not changing instructional practice, or because the changes in instructional practice did not affect achievement? A tool is needed to provide snapshots of instructional practice itself, before and after implementing new professional development or other interventions, and at other regular intervals to help monitor and focus efforts to improve instructional practice.
The Instructional Quality Assessment (IQA) has been developed to provide an essential tool in determining what works in professional development and instructional practice. In addition to the results shown here, Matsumura et al. (2004) explore the use of the IQA to assess the quality of reading comprehension assignments, Boston et al. (2004) explore the IQA as an instrument to assess instructional quality in mathematics lessons, and Wolf et al. (2004) explores the use of the IQA as a measure of high quality classroom talk. Of course there is much more to do, but these results taken together suggest that the IQA is developing into a useful tool to assess many aspects of instructional practice.
Given the measure of success that we have had so far, it is now possible to consider several technical questions that must be answered before the IQA can be broadly used: (1) Is the IQA useful as a measure of instructional quality, as broadly defined in current scientific thinking (e.g., NRC, 1999a, b)? We are planning to conduct at least one study of the IQA involving a District that has been successful as measured by student achievement, and employs professional development that is consistent with NRC (1999a, b) guidelines but is not organized around the Principles of Learning, to try to answer this question. (2) Is the IQA equally predictive of achievement gains on all types of state achievement tests, or does the IQA measure instructional quality that is only relevant to certain kinds of student achievement tests (high cognitive demand, open ended response)? By comparing IQA scores (based on richer ratings of classroom practice and teachers’ assignments) with student achievement in states using student assessments of varying degrees of richness, we hope to be able to address this question rigorously. In addition we will look at which rubrics and sources of evidence for the IQA are most closely tied to student learning across different content areas. Finally, (3) What are the sample size and data collection (sampling design) needs for reliable inference from the IQA in practice? We plan to develop sampling design guidelines for various IQA applications. We will also explore whether, through training or experience, raters can become reliable enough that only one rater per classroom (instead of pairs of raters as in all preliminary work to date) can be used.
29
In addition to developing the IQA as a rigorous “external” or summative evaluation of program interventions, it is important to leverage the development effort for IQA in two ways: to provide a system of feedback for schools and Districts about which professional development resources should be targeted most effectively; and to provide descriptors of good instructional practice—clear expectations for teachers’ performance—that can themselves be the basis of professional development efforts. Determining just what faculties’ learning needs are and where to focus professional development can be extremely challenging for instructional leaders, especially if they are in the initial stages of learning about expert instruction themselves. Likewise, teachers who are just beginning to develop a vision of highly effective instructional practices can hardly be expected to identify their own learning needs. Crosson et al. (2004) discuss some ways in which the IQA may be useful as the basis for a broader set of formative professional development tools. We anticipate work on this “formative” variant of the IQA to continue in parallel with our development of the IQA as a useful external assessment tool.
30
References
Abbott, M. L., & Fouts, J. T. (2003). Constructivist teaching and student achievement: The results of a school-level classroom observation study in Washington (Tech. Rep. No. 5). Lynnewood, Washington: Washington School Research Center, Seattle Pacific University. Retrieved December 2003, from http://www.spu.edu/wsrc/ currentresearch.html.
Applebee, A. N. (1984). Contexts for learning to write: Studies of secondary school instruction. Norwood, NJ: Ablex.
Ball, D. L, Camburn, E., Correnti, R., Phelps, G., & Wallace, R. (1999). New tools for research on instruction: A web-based teacher log. Working paper. Center for Teaching Policy. Seattle: University of Washington.
Ball, D. L., & Cohen, D. K. (1999). Developing practice, developing practitioners: Toward a practice-based theory of professional education. In L. Darling-Hammond & G. Sykes (Eds.), Teaching as a learning profession (pp. 3-31). San Francisco, CA: Jossey-Bass Publishers.
Beck, I. L., & McKeown, M. G. (2002). Text talk: Capturing the benefits of read-aloud experiences for young children. The Reading Teacher, 55(1), 10-20.
Beck, I. L., McKeown, M. G, Hamilton, R. L., & Kucan, L. (1997). Questioning the author. Newark, Delaware: International Reading Association.
Brown, A. L, Palinscar, A. S. & Armbruster, BB (1994). Instructing comprehension fostering activities in interactive learning situations. In R. B. Ruddell, M. R. Ruddell, & H. Singer, (Eds.), Theoretical models and processes of reading (4th ed.). Chapter 36. Newark: Delaware: International Reading Association.
Boston, M., and Wolf, M.-K. (2004, April). Using the Instructional Quality Assessment (IQA) toolkit to assess academic rigor in mathematics lessons and assignments. Paper presented at the Annual Meeting of the American Educational Research Association, San Diego, CA.
Bransford, J. D., Brown L., & Cocking, R. R., (Eds). (2000). How people learn: Brain, mind, experience, and school. Washington, DC: Department of Education.
Clare, L., & Aschbacher, P. (2001). Exploring the technical quality of using assignments and student work as indicators of classroom practice. Educational Assessment, 7(1).

31
Clare, L. (2000). Using teacher's assignments as an indicator of classroom practice. (CSE Tech. Rep. No. 532). Los Angeles: University of California, National Center for Research on Evaluation, Standards, and Student Testing (CRESST).
Carr, M. S., Braunger, J., & Hagans, R. (1998). A regional depiction: Standards-based curriculum reform in the Northwest. Portland OR: Northwest Regional Education Laboratory. Retrieved December 2003, from http://www.nwrel.org/ scpd/ci/regdepiction/.
Cohen, D. K., & Ball, D. L. (1994). Relations between policy and practice: A commentary. Educational Evaluation and Policy Analysis, 12, 249-256.
Cohen, D. K, McLaughlin, M. W., & Talbert, J. E. (Eds). (1993). Teaching for understanding: Challenges for policy and practice. San Francisco: Jossey-Bass.
Crosson, A., Junker, B. W., Clare Matsumura, L., & Resnick, L. B. (April, 2003). Developing an Instructional Quality Assessment. Paper presented at the Annual Meeting of the American Educational Research Association, Chicago, IL.
Crosson, A., Junker, B. W., Clare Matsumura, L., & Resnick, L. B. (April, 2004). The Instructional Quality Assessment as a professional development tool. Paper presented at the Annual Meeting of the American Educational Research Association, San Diego, CA.
Cuban, L. (1990). Reforming again, and again, and again. Educational Researcher, 19, 3-13.
Darling-Hammond, L. (2000, January). Teacher quality and student achievement: A review of state policy evidence. Educational Policy Analysis Archives, 8(1). Retrieved February 28, 2001, from http://olam.ed.asu.edu/epaa/v8n1
Doherty, K. M. (2003). Education Issues: Standards. Education Week on the Web. Retrieved December 2003, from http://www.edweek.org/context/topics/ issuespage.cfm?id=55
Fink, E., & Resnick, L. B. (2001). Developing principals as instructional leaders. Phi Delta Kappan, 82(8), 598-606.
Finn, J. D., & Achilles, C. M. (1999). Tennessee’s class size study: Findings, implications, and misconceptions. Educational Evaluation and Policy Analysis, 20(2), 97-109.
Fosnot, C. T. (1996). Constructivism theory, perspectives, and practice. New York: Teachers College Press.

32
Fouts, J. T., Brown, C., & Thieman, G. (2002). Classroom instruction in Gates Grantee Schools: A baseline report prepared for the Bill & Melinda Gates Foundation. Seattle, WA: The Bill & Melinda Gates Foundation. Retrieved December 2003, from http://www.gatesfoundation.org/Education/ResearchandEvaluation/
Fuhrman, S. H. (1993). Designing coherent education policy: Improving the system. San Francisco: Jossey-Bass.
Fuhrman, S. H. (1999). The New Accountability, Consortium for Policy Research in Education, Policy Briefs. Retrieved December 2003, from http://www.cpre.org/ Publications/rb27.pdf
Henke, R. R., Chen, X., and Goldman, G. (1999). What happens in classrooms? Instructional practices in elementary and secondary schools: 1994-95 (NCES Rep. No. 1999-348). U.S. Department of Education. Washington, DC: U.S. Government Printing Office. Retrieved December 2003, from http://nces.ed.gov/pubsearch/ pubsinfo.asp?pubid=1999348
Hiller J. H., Fisher G. A., & Kaess, W. (1969). Computer investigation of verbal characteristics of effective classroom lecturing. American Educational Research Journal, 6(4): 661-675.
Institute for Learning (IFL, 2002). Principles of Learning. Overview available at http://www.instituteforlearning.org/pol3.html. University of Pittsburgh, Pittsburgh PA: Author.
Kameenui, E. J., & Carnine, D. W. (1998). Effective teaching strategies that accomodate diverse learners. Upper Saddle River, NJ: Merrill.
Klein, S., Hamilton, L., McCaffrey, D., Stecher, B., Robyn, A., & Burroughs, D. (2000). Teaching practices and student achievement: Report of the first-year findings from the “mosaic” study of systematic initiatives in mathematics and science. Santa Monica, CA: RAND.
Lieberman, A. (1994). Teacher development: Commitment and challenge. In P. Grimmett & J. Neufield (Eds.), Teacher development and the struggle for authenticity (pp. 15-30). New York: Teachers College Press.
Linn, R. L., & Baker, E. L. (1998, Fall). School quality: Some missing pieces. CRESST Line. Los Angeles: University of California, National Center for Research on Evaluation, Standards and Student Testing.
Lohr, S.L. (1999). Sampling: Design and analysis. Pacific Grove, CA: Brooks-Cole.
Marshall, S., Fuhrman, S., and O'Day, J. (1994). National curriculum standards: Are they desirable and feasible? In R. Elmore and S. Fuhrman (Eds.), The governance
33
of curriculum: 1994 yearbook of the Association for Supervision and Curriculum Development. Alexandria, VA: Association for Supervision and Curriculum Development.
Matsumura, L., Wolf, M.-K., Crosson A., Levison, A. Peterson, M., Resnick, L., and Junker, B. (2004, April). Assessing the quality of reading comprehension assignments and student work. Paper presented at the Annual Meeting of the American Educational Research Association, San Diego, CA.
Mayer, D. P. (1999a). Measuring instructional practice: Can policymakers trust survey data? Educational Evaluation and Policy Analysis, 21, 29-45.
Mayer, D. P. (1999b). Invited commentary: Moving toward better instructional practice data. Education Statistics Quarterly [online]. Washington, DC: National Center for Educational Statistics. Retrieved December 2003, from http://nces.ed.gov/pubs99/quarterly/summer/2-feature/2-esq12-c.html
McCulloch, C. E. & Searle, S. R. (2001). Generalized, linear, and mixed models. New York: John Wiley and Sons.
National Center for Educational Progress (2003). NAEP – background questionnaires. Retrieved December 2003, from http://nces.ed.gov/nationsreportcard/ bgquest.asp
National Center on Education and the Economy and the University of Pittsburgh (1999). Reading and writing grade-by-grade: Primary literacy standards for kindergarten through third grade. Washington, DC: Author.
National Commission on Excellence in Education (1983). A nation at risk: The imperative for educational reform. Washington, DC: Author. Retrieved December 2003, from http://www.ed.gov/pubs/NatAtRisk/
National Commission on Teaching and America’s Future (1996). What matters most: Report of the National Commission on Teaching and America’s Future. Kutztown, PA: Author.
National Education Goals Panel (2000). History, 1989-present. Washington, DC: Author. Retrieved December 2003, from http://www.negp.gov/page1-7.htm
National Reading Panel (2000). Teaching children to read: Reports of the subgroups. Washington, DC: National Institute of Health and Human Development.
Newmann, F. M., Lopez, G. & Bryk, A. (1998). The quality of intellectual work in Chicago schools: A baseline report. Chicago, IL: Consortium on Chicago School Research.

34
Pearson, P. D. & Fielding, L.(1991). Comprehension instruction. In R. Barr, M. L. Kamil, P. Mosenthal, & P. D. Pearson (Eds.), Handbook of reading research: Vol. 2. New York: Longman.
Porter, A. (1991). Creating a system of school process indicators. Educational Evaluation and Policy Analysis 13(1), 13-29.
Pressley, M. (1998). Reading instruction that works: The case for balanced teaching. New York: Guilford Publications.
Rasch, G. (1980). Probabilistic models for some intelligence and attainment tests (expanded ed.). Chicago, IL: The University of Chicago Press. (Original work published 1960).
Regents of the University of Michigan. (2001). Study of instructional improvement [Homepage]. Retrieved December 2003, from http://www.sii.soe.umich.edu/
Resnick, L. B. (1995). From aptitude to effort: A new foundation for our schools. Daedalus, 124, 55-62.
Resnick, L. B. (1999, June 16). Making America smarter. Education Week, pp. 38-40.
Resnick, L. B., Glennan, T. K., and Lesgold, A. (2001). Taking powerful teaching to scale. Analytic Essay Prepared for the Spencer Foundation.
Resnick, L. B., & Hall, M. W. (1998). Learning organizations for sustainable education reform. Daedalus, 127, 89-118.
Resnick, L. B., & Hall, M. W. (2001). The principles of learning: Study tools for educators. [CD-ROM, version 2.0]. Available at www.instituteforlearning.org
Resnick, L. B., & Harwell, M. (2000, August). Instructional variation and student achievement in a standards-based education District (CSE Tech. Rep. No. 522). Los Angeles: University of California, National Center for Research on Evaluation, Standards, and Student Testing (CRESST).
Resnick, L. B., & Nelson-Le Gall, S. (1997). Socializing intelligence. In L. Smith, J. Dockrell, & P. Tomlinson (Eds.), Piaget, Vygotsky and beyond (pp. 145-158). London/New York: Routledge.
Rowan, B., Schilling, S. G., Ball, D. L., & Miller, R. (2001) Measuring teachers' pedagogical content knowledge in surveys: An exploratory study. Consortium for Policy Research in Education, Study of Instructional Improvement, Research Note S-2. Ann Arbor, MI: University of Michigan.
35
Saunders, W., Goldenberg, C., & Hamann, J. (1992). Instructional conversations beget instructional conversations. Teaching and Teacher Education, 8, 199-218.
Shavelson, R., McDonnell, L., Oakes, J., Carey, N., & Picus, L. (1987). Indicator systems for monitoring mathematics and science education. Santa Monica, CA: The RAND Corporation.
Sheppard, L. (2000). The role of assessment in a learning culture. Educational Researcher, 29(7), 4-14.
Silver, E. A. & Stein, M. K. (1996). The QUASAR project: The “revolution of the possible” in mathematics Instructional reform in middle schools. Urban Education, 30(4), 478-521.
Snow, C. E., Burns, & Griffin, P. (1998). Preventing reading difficulties in young children. Washington DC: National Academy Press.
Snow, C. E. (2002). Reading for understanding: Toward an R&D program in reading comprehension. Washington, DC: OERI.
Spillane, J. P., & Zeuli, J. S. (1999). Reform and teaching: Exploring patterns of practice in the context of national and state mathematics reforms. Educational Evaluation and Policy Analysis, 21(1), 1-27.
Sproule, R. (2000). Student evaluation of teaching: A methodological critique of conventional practices. Education Policy Analysis Archives, 8(2). Retrieved December 2003, from http://epaa.asu.edu/epaa/v8n50.html
SPSS Incorporated (2001). SPSS 11.0. Chicago, IL: SPSS, Inc.
Stein, M. K., Smith, M. S., Henningson, M. A., & Silver, E. A. (2000). Implementing standards-based mathematics instruction. New York: Teachers College Press.
Stigler, J. W., Gonzales, P., Kawanaka, T., Knoll, S., & Serrano, A. (1999). The TIMSS videotape classroom study.
Study of Instructional Improvement (2001). Overview of SII survey instruments: Consortium for policy research in education: Study of instructional improvement. Ann Arbor, MI: University of Michigan.
Tharp, R. G., & Gallimore, R. (1988). Rousing minds to life: Teaching, learning, and schooling in social context. New York: Cambridge University Press.
Tyack, D., & Tobin, W. (1994). The “grammar” of schooling: Why has it been so hard to change? American Educational Research Journal, 31(3), 453-479.
36
United States Department of Education (2002). No Child Left Behind: A Desktop Reference. Retrieved December 2003, from http://www.ed.gov/admins/lead/ account/nclbreference/index.html
Wolf, M.-K., Crosson, A. and Resnick, L. (2004, April). Classroom talk for rigorous reading comprehension instruction. Paper presented at the Annual Meeting of the American Educational Research Association, San Diego, CA.
Wright, S. P., Horn, S. P. & Sanders, W. L. (1997). Teacher and classroom context effects on student achievement: Implications for teacher evaluation. Journal of Personnel Evaluation in Education 11, 57-67.
37
Appendix A: Summary of the Spring 2003 IQA Pilot Study Design
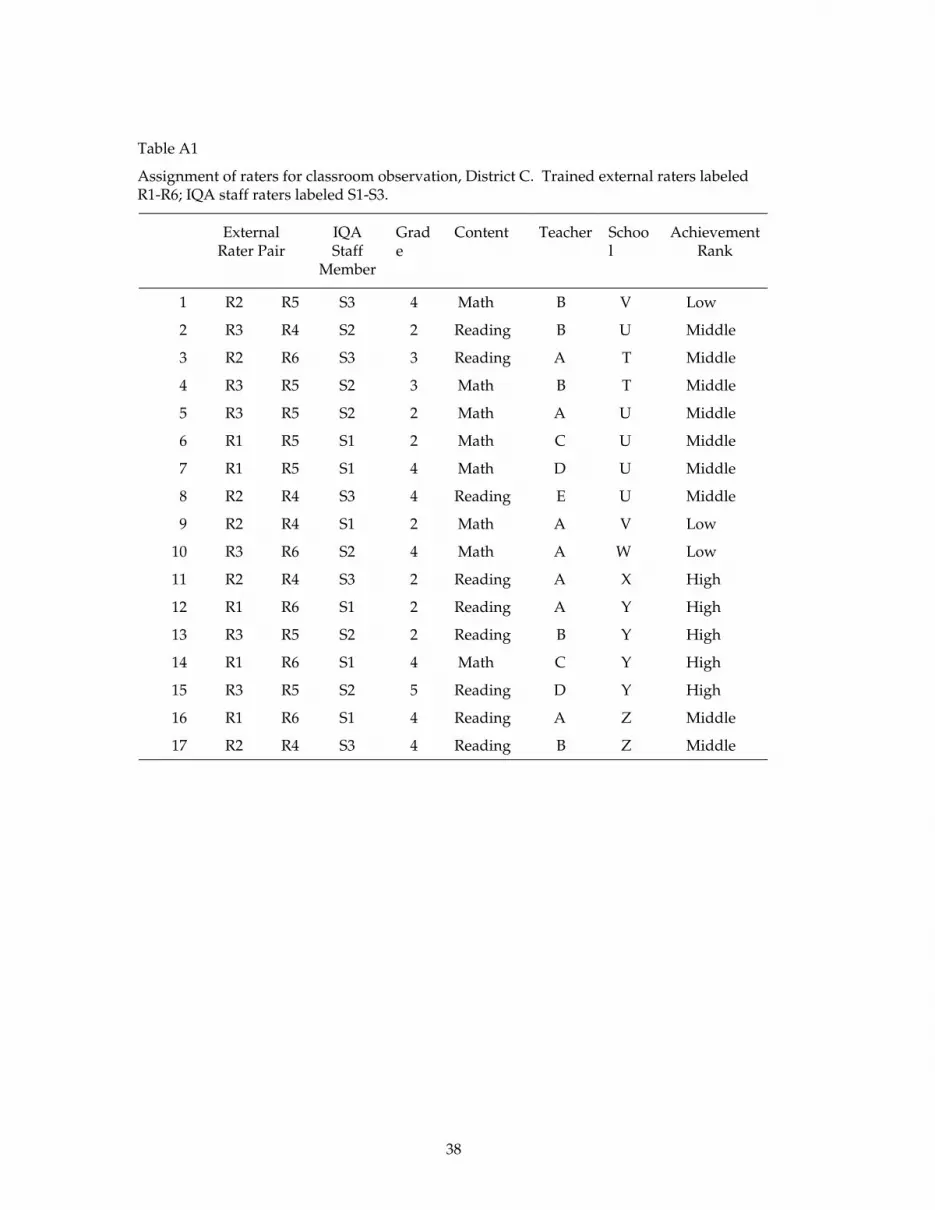
38
Table A1
Assignment of raters for classroom observation, District C. Trained external raters labeled R1-R6; IQA staff raters labeled S1-S3.
External Rater Pair
IQA Staff
Member
Grade
Content Teacher School
AchievementRank
1 R2 R5 S3 4 Math B V Low
2 R3 R4 S2 2 Reading B U Middle
3 R2 R6 S3 3 Reading A T Middle
4 R3 R5 S2 3 Math B T Middle
5 R3 R5 S2 2 Math A U Middle
6 R1 R5 S1 2 Math C U Middle
7 R1 R5 S1 4 Math D U Middle
8 R2 R4 S3 4 Reading E U Middle
9 R2 R4 S1 2 Math A V Low
10 R3 R6 S2 4 Math A W Low
11 R2 R4 S3 2 Reading A X High
12 R1 R6 S1 2 Reading A Y High
13 R3 R5 S2 2 Reading B Y High
14 R1 R6 S1 4 Math C Y High
15 R3 R5 S2 5 Reading D Y High
16 R1 R6 S1 4 Reading A Z Middle
17 R2 R4 S3 4 Reading B Z Middle

39
Table A2
Assignment of raters for classroom observation, District D. Trained external raters labeled R1-R6; IQA staff raters labeled S1-S3.
External Rater Pair
IQA Staff
Member
Grade
Content Teacher School
AchievementRank
18 R1 R4 S1 2 Reading
A A High
19 R1 R4 S1 2 Math B A High
20 R2 R4 S3 2 Math C A High
21 R3 R6 S2 2 Reading
A B High
22 R3 R6 S2 4 Reading
B B High
23 R2 R5 S3 4 Math D B High
24 R1 R4 S1 2 Math E B High
25 R3 R5 S2 4 Math F B High
26 R3 R4 S2 2 Reading
A D Low
27 R2 R6 S3 2 Math B D Low
28 R2 R6 S3 4 Reading
C D Low
29 R1 R6 S1 4 Math D D Low
30 R6 -- S3 4 Math A E Middle

40
Appendix B: Histograms for Lesson Observation Ratings

41
AT3: Student’s linking (Lesson Observation)
student linking
4.03.02.01.0
DISTRICT: c6
5
4
3
2
1
0
Std. Dev = 1.18 Mean = 2.5
N = 17.00
student linking
4.003.002.001.00
DISTRICT: d12
10
8
6
4
2
0
Std. Dev = .44 Mean = 1.23
N = 13.00
AT4: Asking Knowledge (Lesson Observation)
asking knowledge
4.003.002.001.00
DISTRICT: c12
10
8
6
4
2
0
Std. Dev = .62 Mean = 3.53
N = 17.00
asking knowledge
4.03.02.01.0
DISTRICT: d5
4
3
2
1
0
Std. Dev = 1.11 Mean = 2.7
N = 13.00

42
AT5: Providing Knowledge (Lesson Observation)
providing knowledge
4.03.02.01.0
DISTRICT: c14
12
10
8
6
4
2
0
Std. Dev = .80 Mean = 3.6
N = 17.00
providing knowledge
4.03.02.01.0
DISTRICT: d5
4
3
2
1
0
Std. Dev = 1.27 Mean = 2.5
N = 13.00
AT6: Asking Thinking (Lesson Observation)
asking thinking
4.003.002.001.00
DISTRICT: c14
12
10
8
6
4
2
0
Std. Dev = .44 Mean = 3.76
N = 17.00
asking thinking
4.03.02.01.0
DISTRICT: d5
4
3
2
1
0
Std. Dev = 1.13 Mean = 2.5
N = 13.00
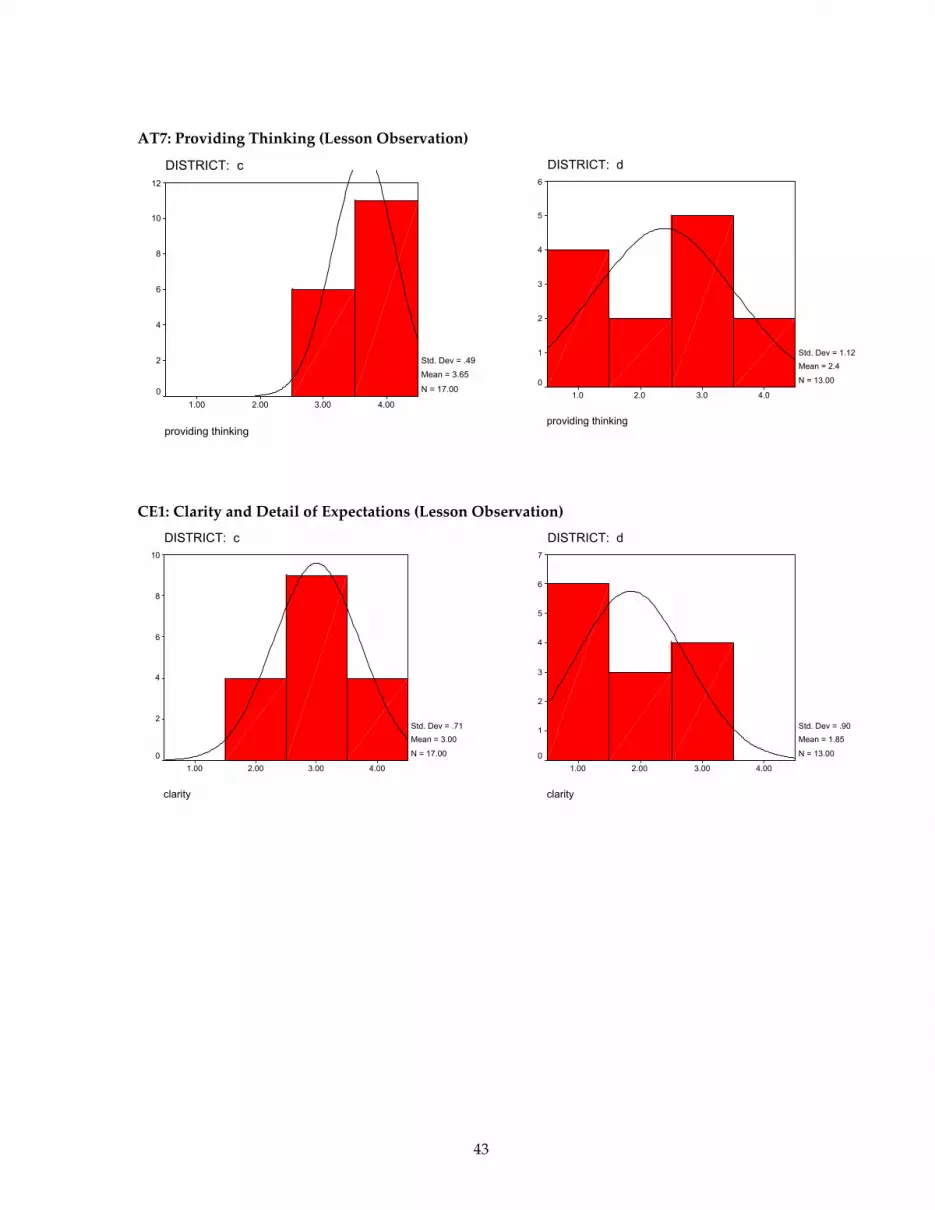
43
AT7: Providing Thinking (Lesson Observation)
providing thinking
4.003.002.001.00
DISTRICT: c12
10
8
6
4
2
0
Std. Dev = .49 Mean = 3.65
N = 17.00
providing thinking
4.03.02.01.0
DISTRICT: d6
5
4
3
2
1
0
Std. Dev = 1.12 Mean = 2.4
N = 13.00
CE1: Clarity and Detail of Expectations (Lesson Observation)
clarity
4.003.002.001.00
DISTRICT: c10
8
6
4
2
0
Std. Dev = .71 Mean = 3.00
N = 17.00
clarity
4.003.002.001.00
DISTRICT: d7
6
5
4
3
2
1
0
Std. Dev = .90 Mean = 1.85
N = 13.00

44
CE2: Access to Expectations (Lesson Observation)
access
4.003.002.001.00
DISTRICT: c10
8
6
4
2
0
Std. Dev = .51 Mean = 3.53
N = 17.00
access
4.03.02.01.0
DISTRICT: d6
5
4
3
2
1
0
Std. Dev = 1.18 Mean = 2.3
N = 13.00
AR1: Rigor of Activities, Reading Comprehension (Lesson Observation)
activities
4.003.002.001.00
DISTRICT: c5
4
3
2
1
0
Std. Dev = .71 Mean = 2.33
N = 9.00
activities
4.003.002.001.00
DISTRICT: d3.5
3.0
2.5
2.0
1.5
1.0
.5
0.0
Std. Dev = .55 Mean = 1.40
N = 5.00
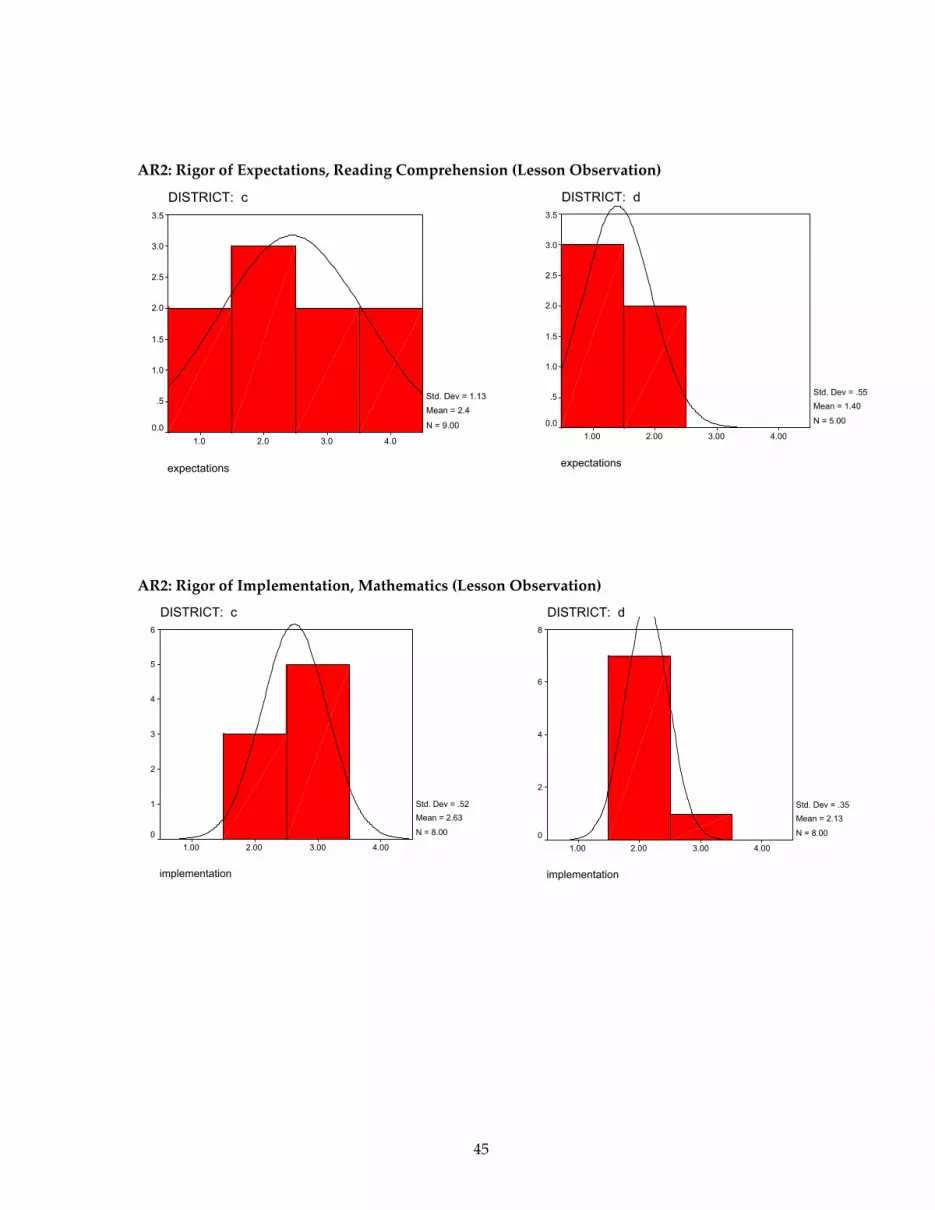
45
AR2: Rigor of Expectations, Reading Comprehension (Lesson Observation)
expectations
4.03.02.01.0
DISTRICT: c3.5
3.0
2.5
2.0
1.5
1.0
.5
0.0
Std. Dev = 1.13 Mean = 2.4
N = 9.00
expectations
4.003.002.001.00
DISTRICT: d3.5
3.0
2.5
2.0
1.5
1.0
.5
0.0
Std. Dev = .55 Mean = 1.40
N = 5.00
AR2: Rigor of Implementation, Mathematics (Lesson Observation)
implementation
4.003.002.001.00
DISTRICT: c6
5
4
3
2
1
0
Std. Dev = .52 Mean = 2.63
N = 8.00
implementation
4.003.002.001.00
DISTRICT: d8
6
4
2
0
Std. Dev = .35 Mean = 2.13
N = 8.00

46
AR4: Rigor of Expectations, Mathematics (Lesson Observation)
expectations
4.003.002.001.00
DISTRICT: c6
5
4
3
2
1
0
Std. Dev = .64 Mean = 2.88
N = 8.00
expectations
4.003.002.001.00
DISTRICT: d3.5
3.0
2.5
2.0
1.5
1.0
.5
0.0
Std. Dev = .93 Mean = 2.00
N = 8.00

47
Appendix C: Histograms for Assignment Ratings
AR3: Rigor of Expectations, Reading Comprehension (Assignments)
expectations
4.03.02.01.0
DISTRICT: c14
12
10
8
6
4
2
0
Std. Dev = 1.07 Mean = 2.6
N = 32.00
expectations
4.003.002.001.00
DISTRICT: d14
12
10
8
6
4
2
0
Std. Dev = .85 Mean = 1.75
N = 20.00
CE: Clarity of Expectations, Reading Comprehension (Assignments)
clarity of expectations
4.03.02.01.0
DISTRICT: c16
14
12
10
8
6
4
2
0
Std. Dev = .85 Mean = 2.9
N = 31.00
clarity of expectations
4.003.002.001.00
DISTRICT: d16
14
12
10
8
6
4
2
0
Std. Dev = .61 Mean = 1.50
N = 20.00

48
AR1: Rigor of Assignment Potential, Mathematics (Assignments)
potential
4.003.002.001.00
DISTRICT: c20
10
0
Std. Dev = .53 Mean = 3.15
N = 27.00
potential
4.003.002.001.00
DISTRICT: d20
18
16
14
12
10
8
6
4
2
0
Std. Dev = .72 Mean = 1.93
N = 28.00
AR2: Rigor of Assignment Implementation, Mathematics (Assignments)
expectations
4.003.002.001.00
DISTRICT: c30
20
10
0
Std. Dev = .42 Mean = 3.11
N = 27.00
expectations
4.003.002.001.00
DISTRICT: d30
20
10
0
Std. Dev = .58 Mean = 1.96
N = 28.00
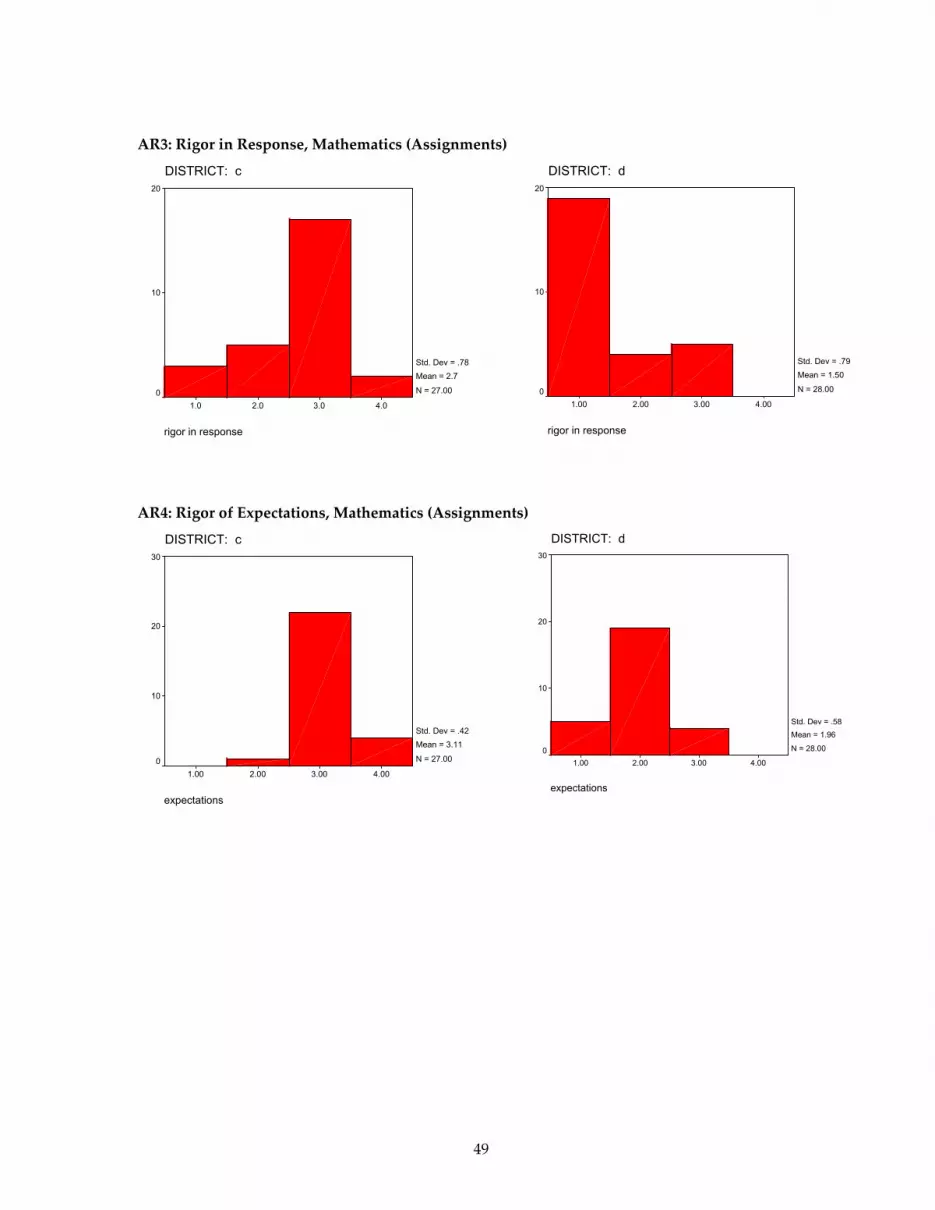
49
AR3: Rigor in Response, Mathematics (Assignments)
rigor in response
4.03.02.01.0
DISTRICT: c20
10
0
Std. Dev = .78 Mean = 2.7
N = 27.00
rigor in response
4.003.002.001.00
DISTRICT: d20
10
0
Std. Dev = .79 Mean = 1.50
N = 28.00
AR4: Rigor of Expectations, Mathematics (Assignments)
expectations
4.003.002.001.00
DISTRICT: c30
20
10
0
Std. Dev = .42 Mean = 3.11
N = 27.00
expectations
4.003.002.001.00
DISTRICT: d30
20
10
0
Std. Dev = .58 Mean = 1.96
N = 28.00
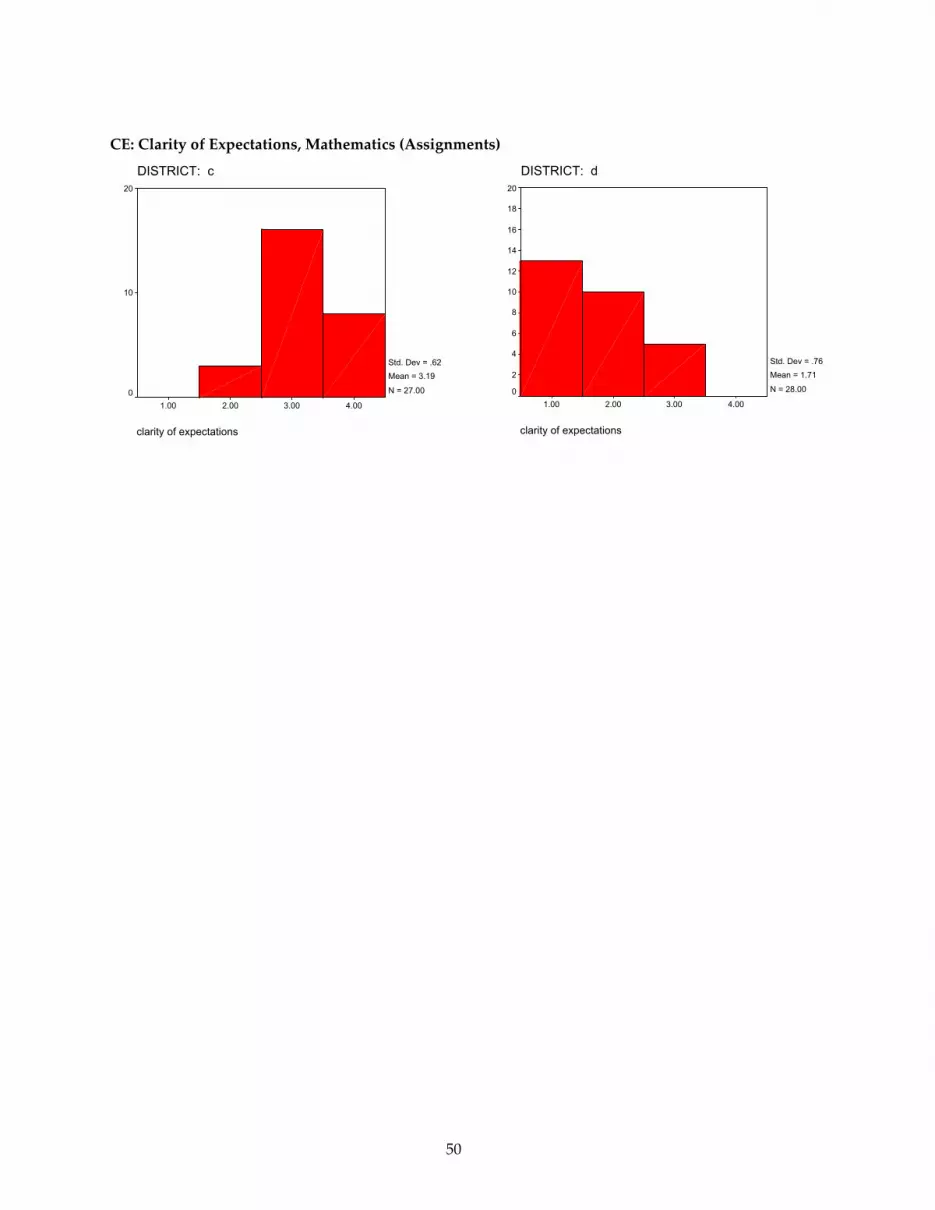
50
CE: Clarity of Expectations, Mathematics (Assignments)
clarity of expectations
4.003.002.001.00
DISTRICT: c20
10
0
Std. Dev = .62 Mean = 3.19
N = 27.00
clarity of expectations
4.003.002.001.00
DISTRICT: d20
18
16
14
12
10
8
6
4
2
0
Std. Dev = .76 Mean = 1.71
N = 28.00

51
Appendix D: 2003 IQA Rubrics for Rating Class Discussions,
Lesson Activities and Assignments
For revised 2005 version of the rubrics, please contact:
Dr. Lindsay Clare Matsumura, [email protected]
Dr. Brian Junker, [email protected]
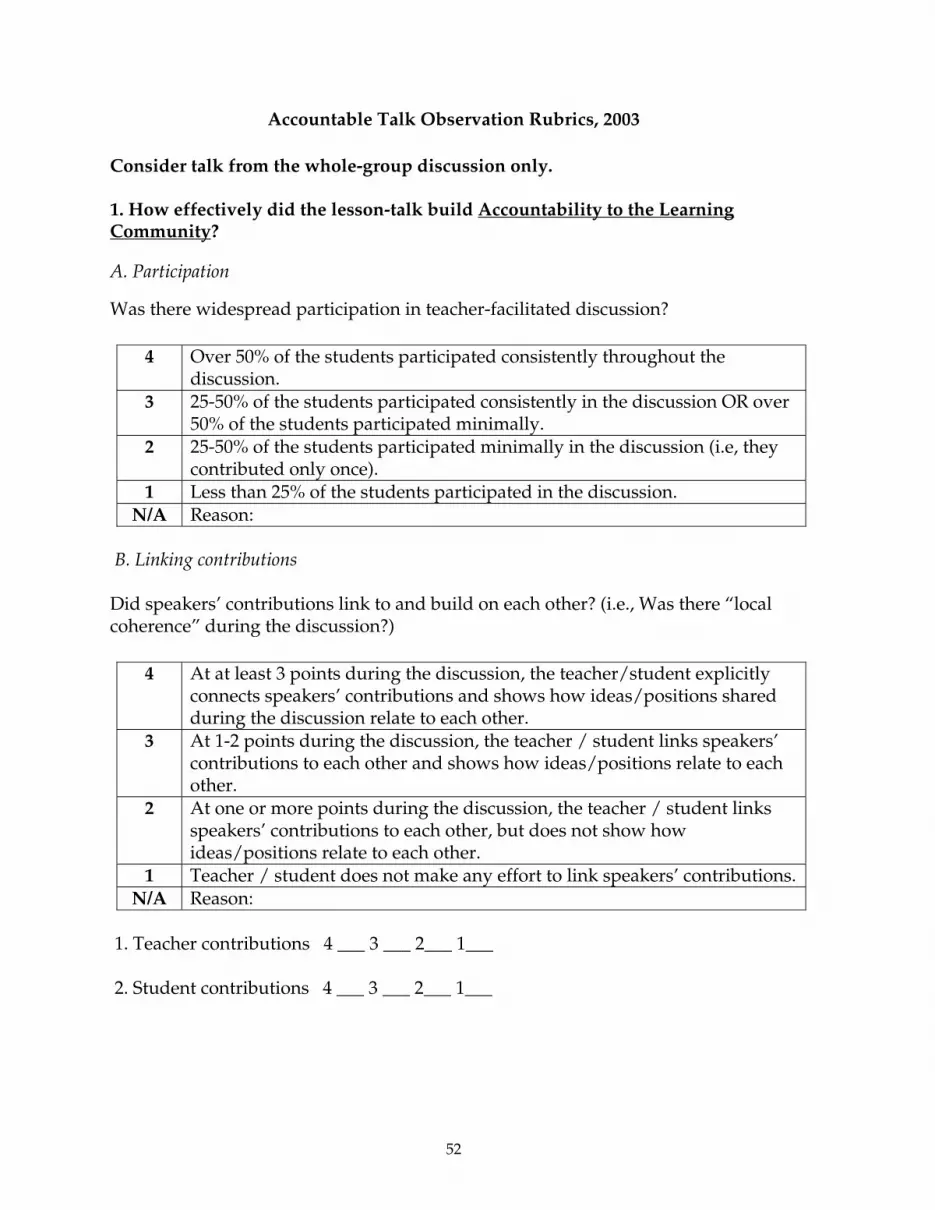
52
Accountable Talk Observation Rubrics, 2003
Consider talk from the whole-group discussion only. 1. How effectively did the lesson-talk build Accountability to the Learning Community?
A. Participation
Was there widespread participation in teacher-facilitated discussion?
4 Over 50% of the students participated consistently throughout the discussion.
3 25-50% of the students participated consistently in the discussion OR over 50% of the students participated minimally.
2 25-50% of the students participated minimally in the discussion (i.e, they contributed only once).
1 Less than 25% of the students participated in the discussion. N/A Reason:
B. Linking contributions Did speakers’ contributions link to and build on each other? (i.e., Was there “local coherence” during the discussion?)
4 At at least 3 points during the discussion, the teacher/student explicitly connects speakers’ contributions and shows how ideas/positions shared during the discussion relate to each other.
3 At 1-2 points during the discussion, the teacher / student links speakers’ contributions to each other and shows how ideas/positions relate to each other.
2 At one or more points during the discussion, the teacher / student links speakers’ contributions to each other, but does not show how ideas/positions relate to each other.
1 Teacher / student does not make any effort to link speakers’ contributions. N/A Reason:
1. Teacher contributions 4 ___ 3 ___ 2___ 1___ 2. Student contributions 4 ___ 3 ___ 2___ 1___

53
2. How effectively did the lesson-talk build Accountability to Knowledge? Asking: Were contributors asked to support their contributions with evidence?
4 There are 3 or more efforts to ask students to provide evidence for their contributions, including questions that seemed academically relevant.
3 There are 1-2 efforts to ask students to provide evidence for their contributions that seemed academically relevant.
2 There are one or more superficial, trivial efforts, or formulaic efforts to ask students to provide evidence for their contributions.
1 There are no efforts to ask students to provide evidence for their contributions.
N/A Reason: Providing: Did contributors support their contributions with evidence? (This evidence must be appropriate to the content area—i.e., evidence from the text; citing an example, referring to prior classroom experience.)
4 At at least 3 points, speakers provide accurate and appropriate evidence for their claims, including frequent references to the text or prior classroom experience.
3 At 1-2 points, speakers provide accurate and appropriate evidence for their claims, including references to the text or prior classroom experience.
2 In general, what little evidence is offered to back up claims is inaccurate, incomplete, or vague.
1 Speakers do not back up their claims. N/A Reason:
3. How effectively did the lesson-talk build Accountability to Rigorous Thinking?
Asking: Were speakers asked to explain their thinking during the lesson?
4 There are 3 or more efforts to ask students to explain their reasoning, including questions that seemed academically relevant.
3 There are 1-2 efforts to ask students to explain their reasoning that seemed academically relevant.
2 There is at least one superficial, trivial, or formulaic efforts to ask students to explain their reasoning.
1 There were no efforts to ask students to explain their thinking. N/A Reason:
Providing: Did contributors explain their thinking during the lesson?
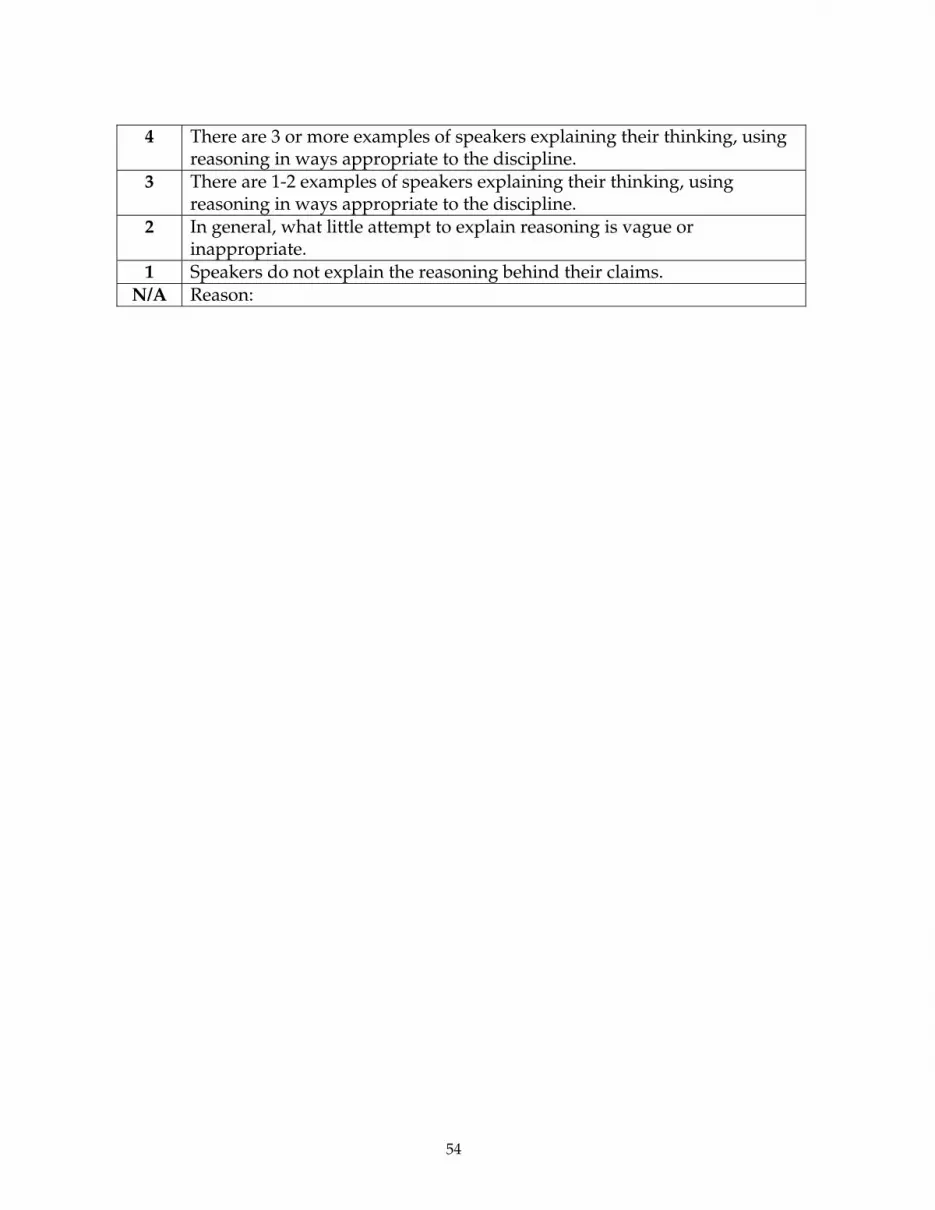
54
4 There are 3 or more examples of speakers explaining their thinking, using
reasoning in ways appropriate to the discipline. 3 There are 1-2 examples of speakers explaining their thinking, using
reasoning in ways appropriate to the discipline. 2 In general, what little attempt to explain reasoning is vague or
inappropriate. 1 Speakers do not explain the reasoning behind their claims.
N/A Reason:

55
Academic Rigor: Reading Comprehension Observation Rubrics, 2003
I. Discussion
A. Active Use of Knowledge: Analyzing and Interpreting the Text 4 The teacher guides students to engage with the underlying meanings or
literary characteristics of a text. Students interpret or analyze a text and use specific examples from the text and/or cite examples from the text to support their ideas or opinions.
3 The teacher guides students to construct an enriched and elaborated understanding of the text including analysis of the causes and effects of events and/or character actions. The students may engage with some underlying meanings or literary characteristics of a text, but they provide limited evidence from the text to support their ideas or opinions.
2 The teacher guides students to construct a surface-level summary of the text based on straightforward information. Students use little evidence from the text to support their ideas or opinions.
1 The teacher guides students to recall fragmented, isolated facts from a text, OR the teacher guides students to discuss a topic that does not directly reference information from the text.
N/A Reason:
II. Lesson Activities B. Active Use of Knowledge: Analyzing and Interpreting the Text (Grades 3-5)
4 During the lesson activity, students engage with the underlying meanings or nuances of a text. Students interpret or analyze a text AND use extensive and detailed evidence from the text to support their ideas or opinions.
3 During the lesson activity, students engage with some underlying meanings or nuances of a text. Students may interpret or analyze a text, BUT use limited evidence from the text to support their ideas or opinions.
2 During the lesson activity, students construct a literal summary of the text based on straightforward (surface-level) information OR students engage with surface-level information about the text only. Students use little or no evidence from the text to support their ideas or opinions.
1 During the lesson activity, students recall isolated, straightforward (surface-level) facts about a text OR write on a topic that does not directly reference information from the text.
N/A Reason:
III. Expectations–(Only consider expectations for the task as they were explained to students during initial set-up of lesson activities.) C. Rigor of Expectations (Grades 3-5)

56
4 At one of the teacher’s expectations focuses on analyzing and interpreting the text (e.g., inferring major themes, analyzing character motives, comparing and contrasting two texts or characters, etc.) AND at one expectation focuses on including evidence or examples to support a position.
3 At one of the teacher’s expectations focuses on analyzing and interpreting the text (e.g., inferring major themes, analyzing character motives, comparing and contrasting two texts or characters, etc.).
2 The teacher’s expectations focus on building a basic understanding of the text (e.g. summarizing).
1 The teacher’s expectations do not focus on reading comprehension. The expectations may focus solely on procedures (e.g. how well students follow directions, producing neat work, or behavioral norms) or content not directly related to reading comprehension (e.g., writing conventions).
N/A Reason:
II. Lesson Activities
B. Active Use of Knowledge: Analyzing and Interpreting the Text (Grades 1-2)
4 During the lesson activity, students interpret or evaluate a text AND make explicit references to the text.
3
During the lesson activity, students interpret or evaluate a text. Students to make general references to the text. OR During the lesson activity, students demonstrate a comprehensive understanding of the text through a detailed summary.
2 During the lesson activity, students demonstrate a superficial understanding of the text. Students summarize basic information about a text.
1
During the lesson activity, students do not engage with a text. Students write on a topic (or draw a picture) that does not directly reference information from the text (in other words, the assignment could have been completed without ever having heard or read a specific text).
N/A Reason:

57
III. Expectations (Only consider expectations for the task as they were explained to students during initial set-up of lesson activities.) C. Rigor of Expectations (Grades 1-2)
4 At least one of the teacher’s expectations focuses on analyzing and interpreting the text (e.g., inferring major themes, analyzing character motives, comparing and contrasting two texts or characters, etc.) AND at one expectation focuses on including evidence or examples to support a position.
3 At least one of the teacher’s expectations focuses on analyzing and interpreting the text (e.g., inferring major themes, analyzing character motives, comparing and contrasting two texts or characters, etc.).
2 The teacher’s expectations focus on building a basic understanding of the text (e.g. summarizing).
1 The teacher’s expectations do not focus on reading comprehension. The expectations may focus solely on procedures (e.g. how well students follow directions, producing neat work, or behavioral norms) or content not directly related to reading comprehension (e.g., writing conventions).
N/A Reason:
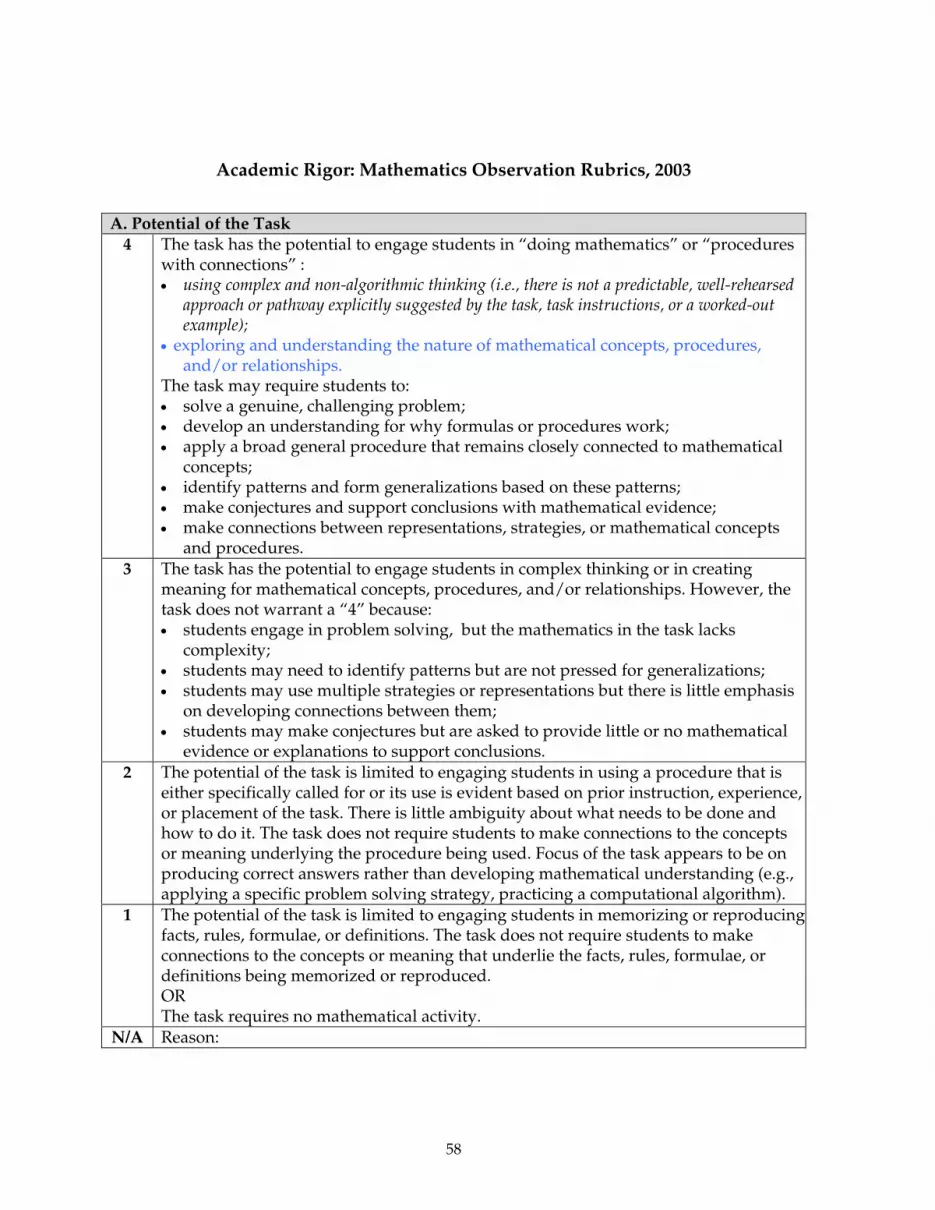
58
Academic Rigor: Mathematics Observation Rubrics, 2003
A. Potential of the Task 4 The task has the potential to engage students in “doing mathematics” or “procedures
with connections” : • using complex and non-algorithmic thinking (i.e., there is not a predictable, well-rehearsed
approach or pathway explicitly suggested by the task, task instructions, or a worked-out example);
• exploring and understanding the nature of mathematical concepts, procedures, and/or relationships.
The task may require students to: • solve a genuine, challenging problem; • develop an understanding for why formulas or procedures work; • apply a broad general procedure that remains closely connected to mathematical
concepts; • identify patterns and form generalizations based on these patterns; • make conjectures and support conclusions with mathematical evidence; • make connections between representations, strategies, or mathematical concepts
and procedures. 3 The task has the potential to engage students in complex thinking or in creating
meaning for mathematical concepts, procedures, and/or relationships. However, the task does not warrant a “4” because: • students engage in problem solving, but the mathematics in the task lacks
complexity; • students may need to identify patterns but are not pressed for generalizations; • students may use multiple strategies or representations but there is little emphasis
on developing connections between them; • students may make conjectures but are asked to provide little or no mathematical
evidence or explanations to support conclusions. 2 The potential of the task is limited to engaging students in using a procedure that is
either specifically called for or its use is evident based on prior instruction, experience, or placement of the task. There is little ambiguity about what needs to be done and how to do it. The task does not require students to make connections to the concepts or meaning underlying the procedure being used. Focus of the task appears to be on producing correct answers rather than developing mathematical understanding (e.g., applying a specific problem solving strategy, practicing a computational algorithm).
1 The potential of the task is limited to engaging students in memorizing or reproducing facts, rules, formulae, or definitions. The task does not require students to make connections to the concepts or meaning that underlie the facts, rules, formulae, or definitions being memorized or reproduced. OR The task requires no mathematical activity.
N/A Reason:
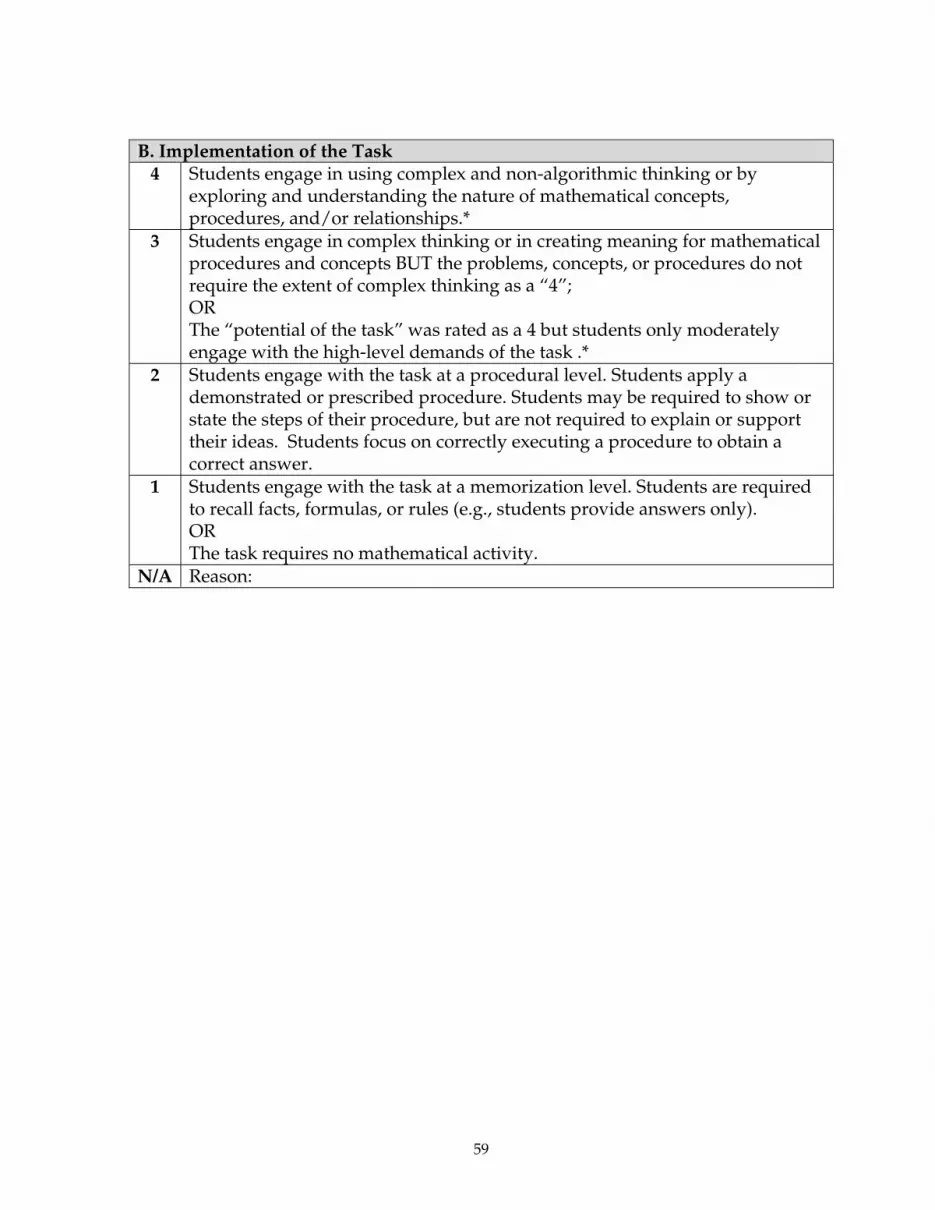
59
B. Implementation of the Task 4 Students engage in using complex and non-algorithmic thinking or by
exploring and understanding the nature of mathematical concepts, procedures, and/or relationships.*
3 Students engage in complex thinking or in creating meaning for mathematical procedures and concepts BUT the problems, concepts, or procedures do not require the extent of complex thinking as a “4”; OR The “potential of the task” was rated as a 4 but students only moderately engage with the high-level demands of the task .*
2 Students engage with the task at a procedural level. Students apply a demonstrated or prescribed procedure. Students may be required to show or state the steps of their procedure, but are not required to explain or support their ideas. Students focus on correctly executing a procedure to obtain a correct answer.
1 Students engage with the task at a memorization level. Students are required to recall facts, formulas, or rules (e.g., students provide answers only). OR The task requires no mathematical activity.
N/A Reason:

60
C. Student Discussion Following the Task 4 Students show/describe written work and provide complete and thorough
explanations of why their strategy, idea, or procedure is valid. Students explain why their strategy works and/or is appropriate for the problem by making connections to the underlying mathematical ideas (e.g., “I divided because we needed equal groups”). OR Students show/discuss more than one strategy or representation* for solving the task, and provides explanations of how/why the different strategies/representations / mathematical ideas were used to solve the task and/or make connections between strategies / representations / mathematical ideas.
3 Students show/describe written work and attempt to provide explanations of why their strategy, idea, or procedure is valid. BUT the explanations are incomplete, incoherent, or lack precision (e.g., student responses often require extended press from the teacher). OR Students show/discuss more than one strategy or representation* for solving the task . Students may provide explanations of how the different strategies/representations were used to solve the task, but do not show connections nor explain why the strategy/representation was valid.
2 Students show/describe written work for solving the task (e.g., the steps for a multiplication problem, finding an average, or solving an equation; what they did first, second, etc) but do not explain why their strategy or procedure works and/or was appropriate for the problem; OR Students show/discuss only one strategy or representation* for solving the task.
1 Students provide brief or one-word answers (e.g., fill in blanks); OR Student’s responses are non-mathematical.
N/A Reason: *Representations include numbers and/or symbols, diagrams/pictures, use of written/verbal language , graphs, tables/charts, concrete materials.]
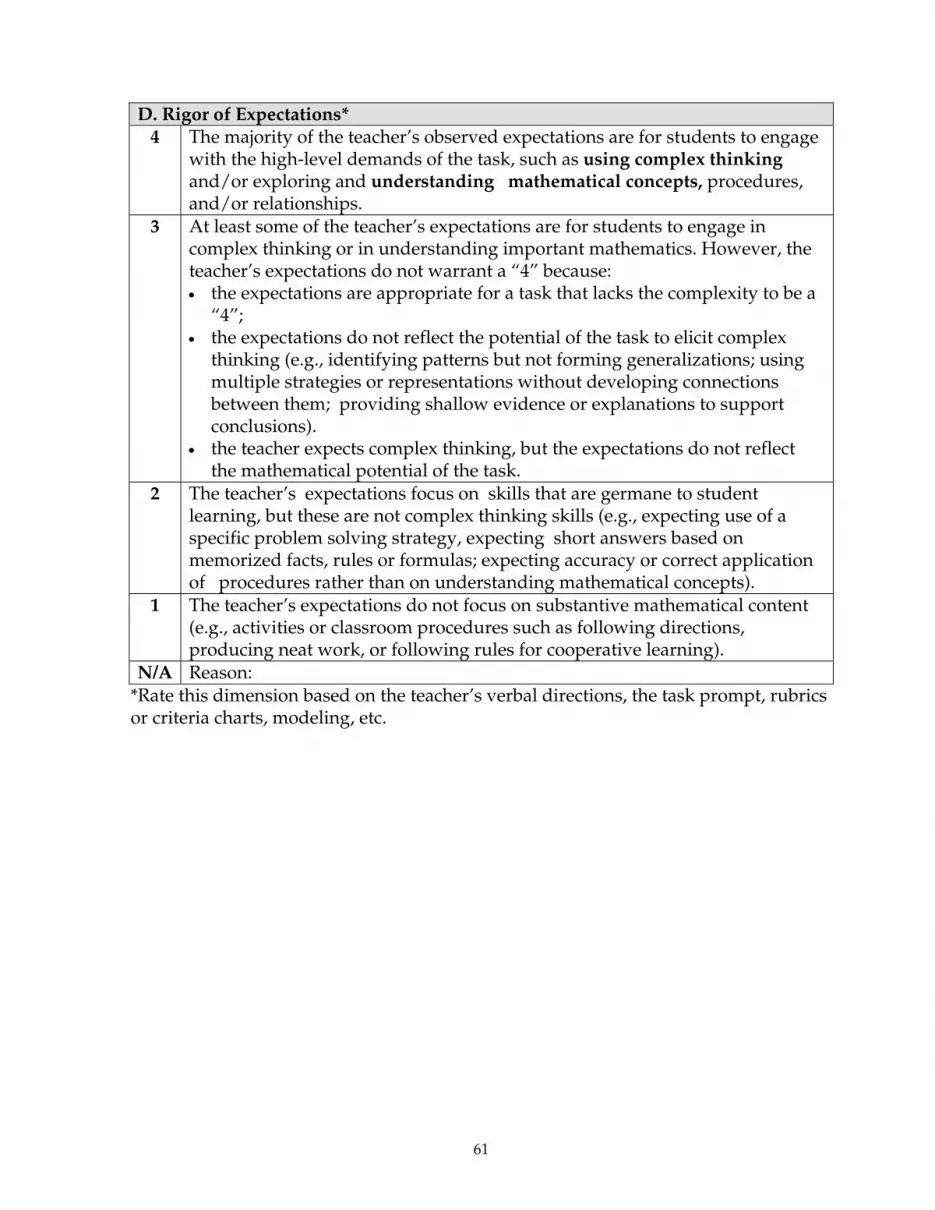
61
D. Rigor of Expectations* 4 The majority of the teacher’s observed expectations are for students to engage
with the high-level demands of the task, such as using complex thinking and/or exploring and understanding mathematical concepts, procedures, and/or relationships.
3 At least some of the teacher’s expectations are for students to engage in complex thinking or in understanding important mathematics. However, the teacher’s expectations do not warrant a “4” because: • the expectations are appropriate for a task that lacks the complexity to be a
“4”; • the expectations do not reflect the potential of the task to elicit complex
thinking (e.g., identifying patterns but not forming generalizations; using multiple strategies or representations without developing connections between them; providing shallow evidence or explanations to support conclusions).
• the teacher expects complex thinking, but the expectations do not reflect the mathematical potential of the task.
2 The teacher’s expectations focus on skills that are germane to student learning, but these are not complex thinking skills (e.g., expecting use of a specific problem solving strategy, expecting short answers based on memorized facts, rules or formulas; expecting accuracy or correct application of procedures rather than on understanding mathematical concepts).
1 The teacher’s expectations do not focus on substantive mathematical content (e.g., activities or classroom procedures such as following directions, producing neat work, or following rules for cooperative learning).
N/A Reason: *Rate this dimension based on the teacher’s verbal directions, the task prompt, rubrics or criteria charts, modeling, etc.
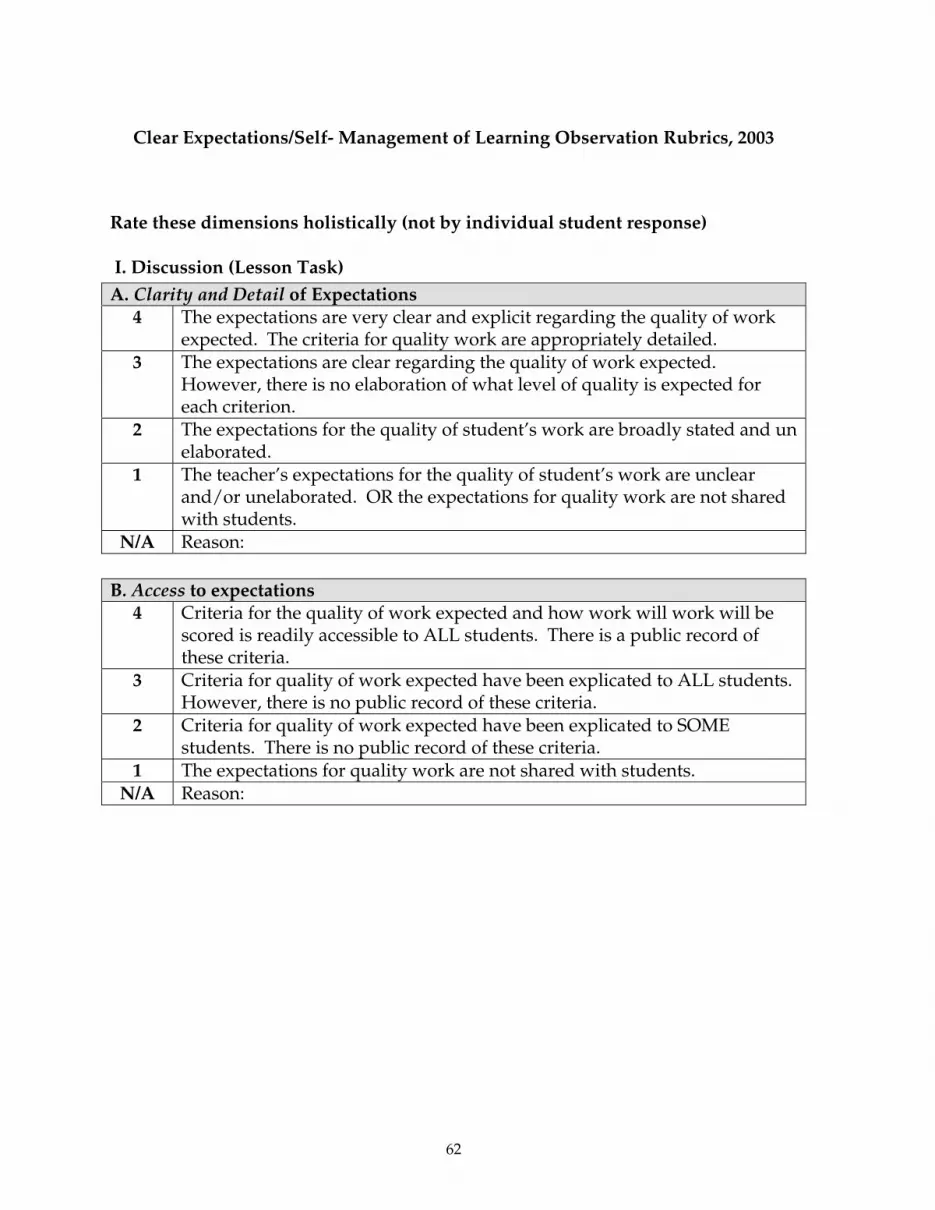
62
Clear Expectations/Self- Management of Learning Observation Rubrics, 2003
Rate these dimensions holistically (not by individual student response)
I. Discussion (Lesson Task) A. Clarity and Detail of Expectations
4 The expectations are very clear and explicit regarding the quality of work expected. The criteria for quality work are appropriately detailed.
3 The expectations are clear regarding the quality of work expected. However, there is no elaboration of what level of quality is expected for each criterion.
2 The expectations for the quality of student’s work are broadly stated and un elaborated.
1 The teacher’s expectations for the quality of student’s work are unclear and/or unelaborated. OR the expectations for quality work are not shared with students.
N/A Reason: B. Access to expectations
4 Criteria for the quality of work expected and how work will work will be scored is readily accessible to ALL students. There is a public record of these criteria.
3 Criteria for quality of work expected have been explicated to ALL students. However, there is no public record of these criteria.
2 Criteria for quality of work expected have been explicated to SOME students. There is no public record of these criteria.
1 The expectations for quality work are not shared with students. N/A Reason:
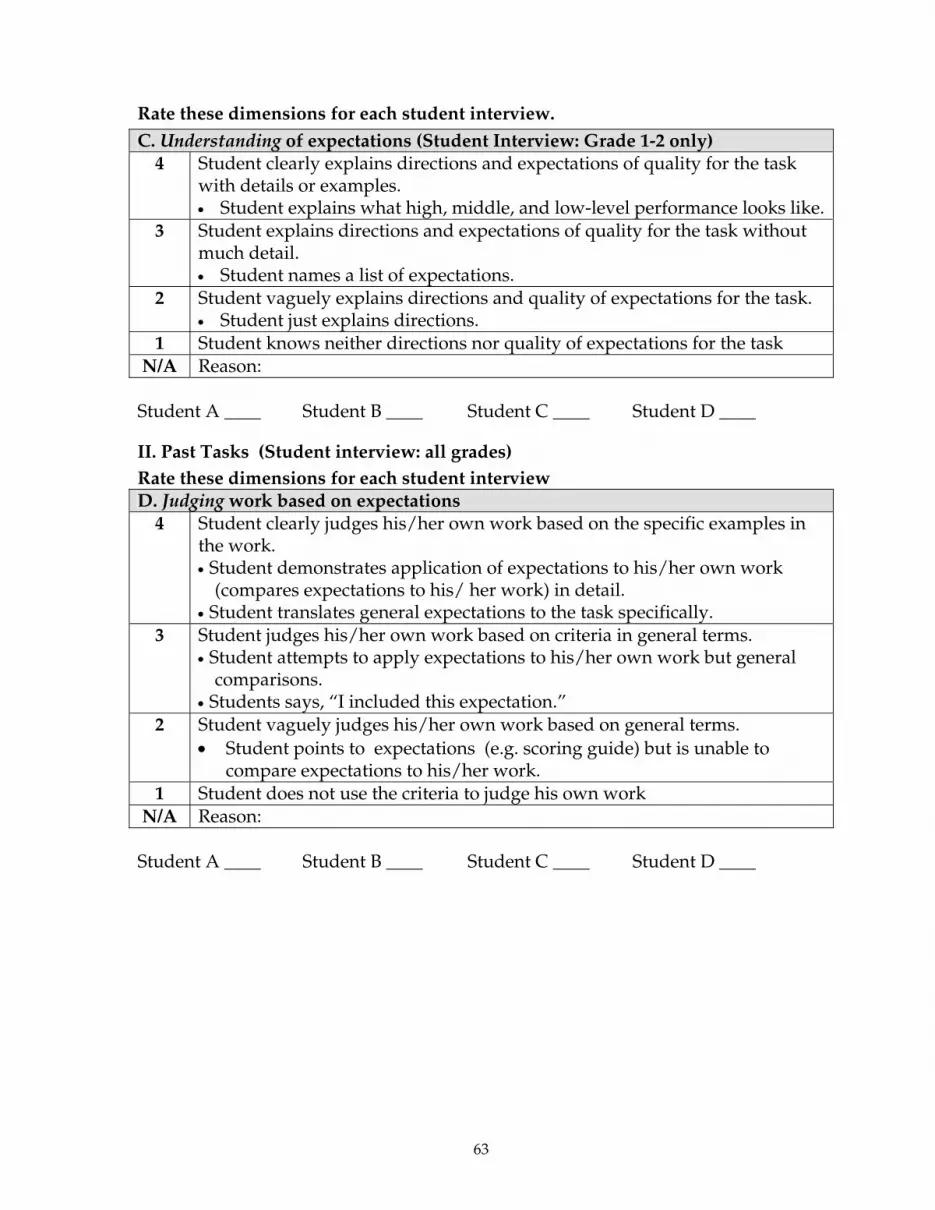
63
Rate these dimensions for each student interview. C. Understanding of expectations (Student Interview: Grade 1-2 only)
4 Student clearly explains directions and expectations of quality for the task with details or examples. • Student explains what high, middle, and low-level performance looks like.
3 Student explains directions and expectations of quality for the task without much detail. • Student names a list of expectations.
2 Student vaguely explains directions and quality of expectations for the task. • Student just explains directions.
1 Student knows neither directions nor quality of expectations for the task N/A Reason: Student A ____ Student B ____ Student C ____ Student D ____
II. Past Tasks (Student interview: all grades) Rate these dimensions for each student interview D. Judging work based on expectations
4 Student clearly judges his/her own work based on the specific examples in the work. • Student demonstrates application of expectations to his/her own work
(compares expectations to his/ her work) in detail. • Student translates general expectations to the task specifically.
3 Student judges his/her own work based on criteria in general terms. • Student attempts to apply expectations to his/her own work but general
comparisons. • Students says, “I included this expectation.”
2 Student vaguely judges his/her own work based on general terms. • Student points to expectations (e.g. scoring guide) but is unable to
compare expectations to his/her work. 1 Student does not use the criteria to judge his own work
N/A Reason: Student A ____ Student B ____ Student C ____ Student D ____
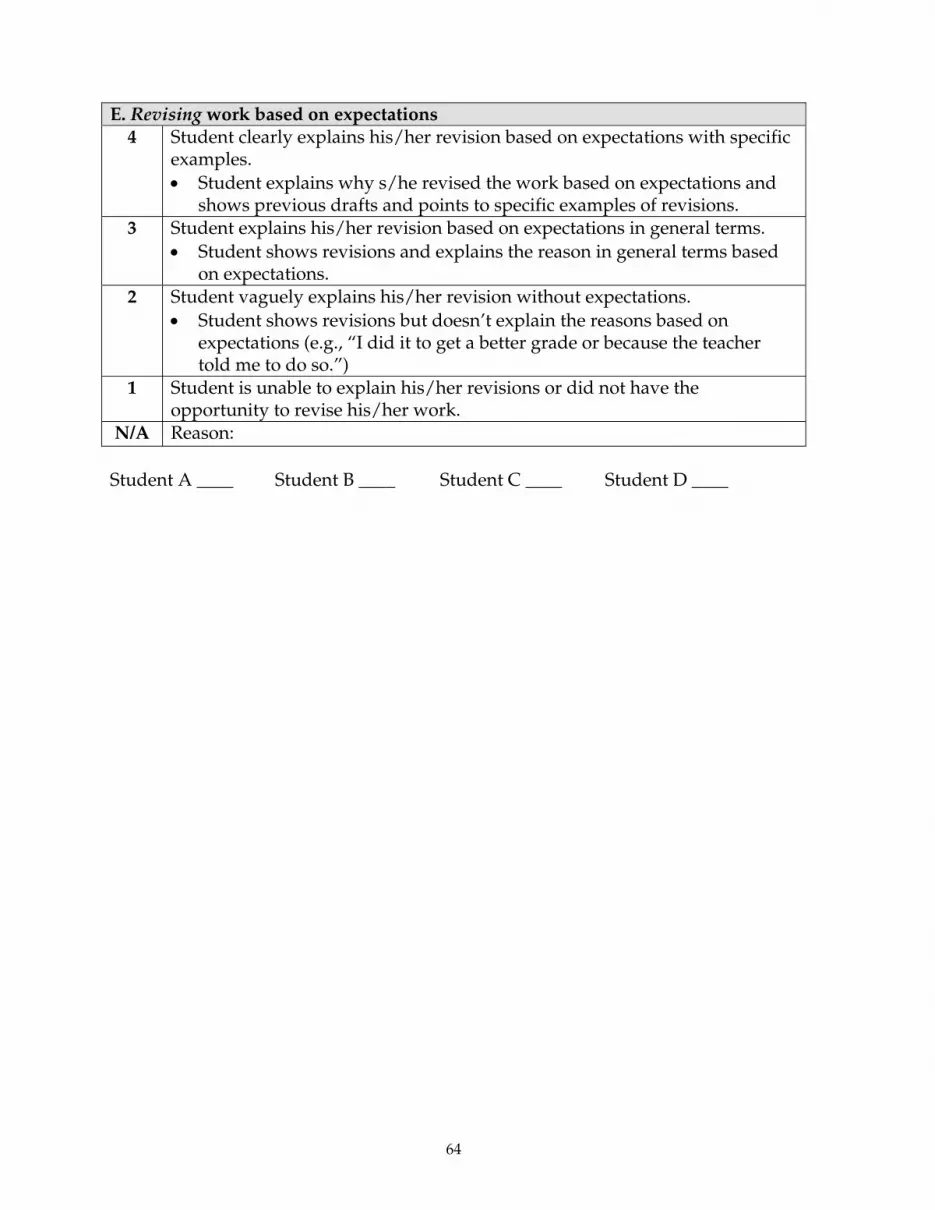
64
E. Revising work based on expectations 4 Student clearly explains his/her revision based on expectations with specific
examples. • Student explains why s/he revised the work based on expectations and
shows previous drafts and points to specific examples of revisions. 3 Student explains his/her revision based on expectations in general terms.
• Student shows revisions and explains the reason in general terms based on expectations.
2 Student vaguely explains his/her revision without expectations. • Student shows revisions but doesn’t explain the reasons based on
expectations (e.g., “I did it to get a better grade or because the teacher told me to do so.”)
1 Student is unable to explain his/her revisions or did not have the opportunity to revise his/her work.
N/A Reason: Student A ____ Student B ____ Student C ____ Student D ____

65
Rigor of Expectations: Mathematics F. Rigor of Expectations: 4 The majority of the expectations described by the student are to engage with
the high-level demands of the task, such as using complex thinking and/or exploring and understanding mathematical concepts, procedures, and/or relationships.
3 At least some of the expectations described by the student are to engage in complex thinking or in understanding important mathematics. However, the expectations do not warrant a “4” because: • the expectations are appropriate for a task that lacks the complexity to be a
“4”; • the expectations do not reflect the potential of the task to elicit complex
thinking (e.g., identifying patterns but not forming generalizations; using multiple strategies or representations without developing connections between them; providing shallow evidence or explanations to support conclusions).
the teacher expects complex thinking, but the expectations do not reflect the mathematical potential of the task.
2 The expectations focus on skills that are germane to student learning, but these are not complex thinking skills (e.g., expecting use of a specific problem solving strategy, expecting short answers based on memorized facts, rules or formulas; expecting accuracy or correct application of procedures rather than on understanding mathematical concepts).
1 The expectations do not focus on substantive mathematical content (e.g., activities or classroom procedures such as following directions, producing neat work, or following rules for cooperative learning).
N/A Reason:
Current Lesson Task (Grade 1-2 only): Student A ____ Student B ____ Student C ____ Student D ____ Past Task: Student A ____ Student B ____ Student C ____ Student D ____

66
Rigor of Expectations: Reading Comprehension F. Rigor of Expectations (Grades 3-5)
4 At one of the expectations described by the student focuses on analyzing and interpreting the text (e.g., inferring major themes, analyzing character motives, comparing and contrasting two texts or characters, etc.) AND at one expectation focuses on including evidence or examples to support a position.
3 At one of the expectations focuses on analyzing and interpreting the text (e.g., inferring major themes, analyzing character motives, comparing and contrasting two texts or characters, etc.).
2 The expectations focus on building a basic understanding of the text (e.g. summarizing).
1 The expectations do not focus on reading comprehension. The expectations may focus solely on procedures (e.g. how well students follow directions, producing neat work, or behavioral norms) or content not directly related to reading comprehension (e.g., writing conventions).
N/A Reason: Past Task: Student A ____ Student B ____ Student C ____ Student D ____ F. Rigor of Expectations (Grades 1-2)
4 At least one of the expectations described by the student focuses on analyzing and interpreting the text (e.g., inferring major themes, analyzing character motives, comparing and contrasting two texts or characters, etc.) AND at one expectation focuses on including evidence or examples to support a position.
3 At least one of the expectations focuses on analyzing and interpreting the text (e.g., inferring major themes, analyzing character motives, comparing and contrasting two texts or characters, etc.).
2 The expectations focus on building a basic understanding of the text (e.g. summarizing).
1 The expectations do not focus on reading comprehension. The expectations may focus solely on procedures (e.g. how well students follow directions, producing neat work, or behavioral norms) or content not directly related to reading comprehension (e.g., writing conventions).
N/A Reason: Current Lesson Task: Student A ____ Student B ____ Student C ____ Student D ____ Past Task: Student A ____ Student B ____ Student C ____ Student D ____

67
Observation Checklists, 2003
Accountable Talk Function Checklist, 2003: Check all that apply and script relevant contributions. Most of these moves will be made by the teacher, but in some cases, students might make them. In recording the actual moves, note T for Teacher move, S for Student move. (script here)
1. Linking contributions
Getting students to relate to one another’s ideas “Jay just said…and Susan, you’re saying…” “Who wants to add on to what Ana just said?” “Who agrees and who disagrees with what Ana just said?” “How does what you’re saying relate to what Juan just said?”
“I agree with Sue, but I disagree with you, because…” S- “I agree with Fulano because…” 2. Accountability to knowledge
Pressing for accuracy “Where could we find more information about that?”
“Are we sure about that? How can we know for sure?” “Where do you see that in the text?”
“What evidence is there?” T revoices S contribution and checks for accuracy
Building on prior knowledge / recalling prior knowledge T or S links present work to past work
“How does this connect with what we did last week?” “Do you remember when we read another book by this author?””
3. Accountability to rigorous thinking
Pressing for reasoning “What made you say that?”
“Why do you think that?” “Can you explain that?”
“Why do you disagree? “Say more about that.” “Let’s let Fulano think.”
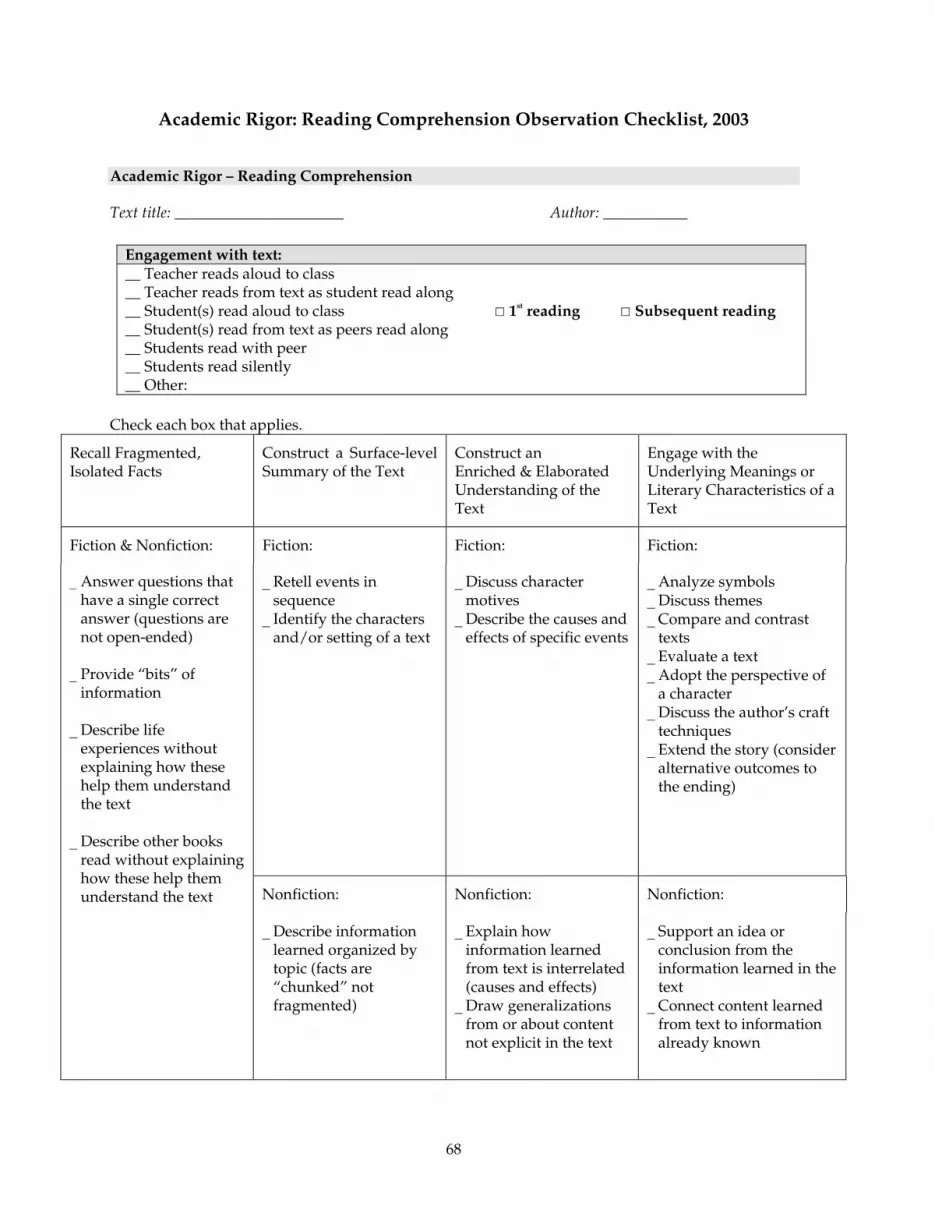
68
Academic Rigor: Reading Comprehension Observation Checklist, 2003 Academic Rigor – Reading Comprehension
Text title: ______________________ Author: ___________
Engagement with text: __ Teacher reads aloud to class __ Teacher reads from text as student read along __ Student(s) read aloud to class 1st reading Subsequent reading __ Student(s) read from text as peers read along __ Students read with peer __ Students read silently __ Other:
Check each box that applies.
Recall Fragmented, Isolated Facts
Construct a Surface-level Summary of the Text
Construct an Enriched & Elaborated Understanding of the Text
Engage with the Underlying Meanings or Literary Characteristics of a Text
Fiction & Nonfiction: Fiction: Fiction: Fiction:
_ Retell events in sequence
_ Identify the characters and/or setting of a text
_ Discuss character motives
_ Describe the causes and effects of specific events
_ Analyze symbols _ Discuss themes _ Compare and contrast
texts _ Evaluate a text _ Adopt the perspective of
a character _ Discuss the author’s craft
techniques _ Extend the story (consider
alternative outcomes to the ending)
Nonfiction: Nonfiction: Nonfiction:
_ Answer questions that have a single correct answer (questions are not open-ended)
_ Provide “bits” of
information _ Describe life
experiences without explaining how these help them understand the text
_ Describe other books
read without explaining how these help them understand the text
_ Describe information learned organized by topic (facts are “chunked” not fragmented)
_ Explain how information learned from text is interrelated (causes and effects)
_ Draw generalizations from or about content not explicit in the text
_ Support an idea or conclusion from the information learned in the text
_ Connect content learned from text to information already known
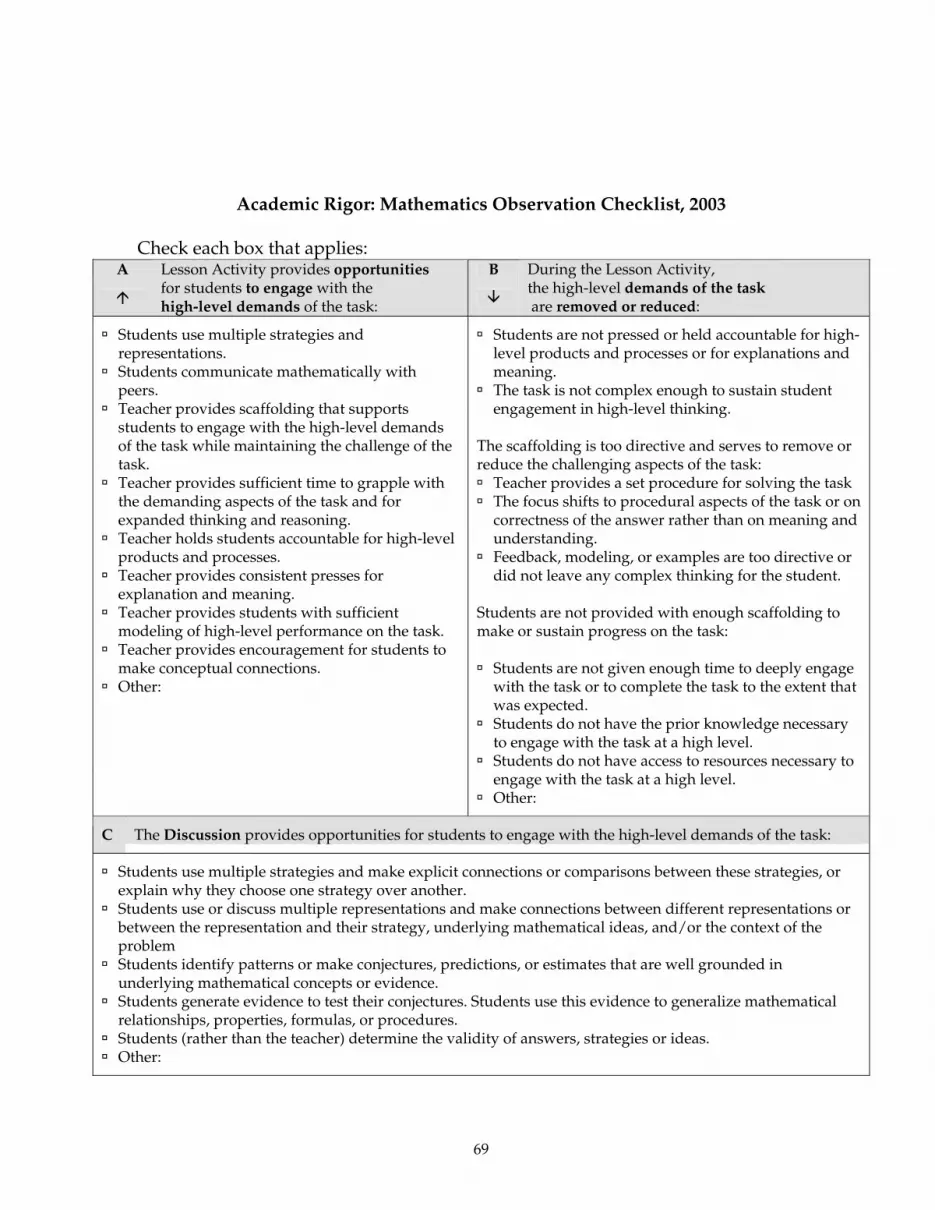
69
Academic Rigor: Mathematics Observation Checklist, 2003 Check each box that applies:
A B
Lesson Activity provides opportunities for students to engage with the high-level demands of the task:
During the Lesson Activity, the high-level demands of the task are removed or reduced:
Students use multiple strategies and representations. Students communicate mathematically with
peers. Teacher provides scaffolding that supports
students to engage with the high-level demands of the task while maintaining the challenge of the task. Teacher provides sufficient time to grapple with
the demanding aspects of the task and for expanded thinking and reasoning. Teacher holds students accountable for high-level
products and processes. Teacher provides consistent presses for
explanation and meaning. Teacher provides students with sufficient
modeling of high-level performance on the task. Teacher provides encouragement for students to
make conceptual connections. Other:
Students are not pressed or held accountable for high-level products and processes or for explanations and meaning. The task is not complex enough to sustain student
engagement in high-level thinking. The scaffolding is too directive and serves to remove or reduce the challenging aspects of the task: Teacher provides a set procedure for solving the task The focus shifts to procedural aspects of the task or on
correctness of the answer rather than on meaning and understanding. Feedback, modeling, or examples are too directive or
did not leave any complex thinking for the student. Students are not provided with enough scaffolding to make or sustain progress on the task: Students are not given enough time to deeply engage
with the task or to complete the task to the extent that was expected. Students do not have the prior knowledge necessary
to engage with the task at a high level. Students do not have access to resources necessary to
engage with the task at a high level. Other:
C The Discussion provides opportunities for students to engage with the high-level demands of the task:
Students use multiple strategies and make explicit connections or comparisons between these strategies, or explain why they choose one strategy over another. Students use or discuss multiple representations and make connections between different representations or
between the representation and their strategy, underlying mathematical ideas, and/or the context of the problem Students identify patterns or make conjectures, predictions, or estimates that are well grounded in
underlying mathematical concepts or evidence. Students generate evidence to test their conjectures. Students use this evidence to generalize mathematical
relationships, properties, formulas, or procedures. Students (rather than the teacher) determine the validity of answers, strategies or ideas. Other:
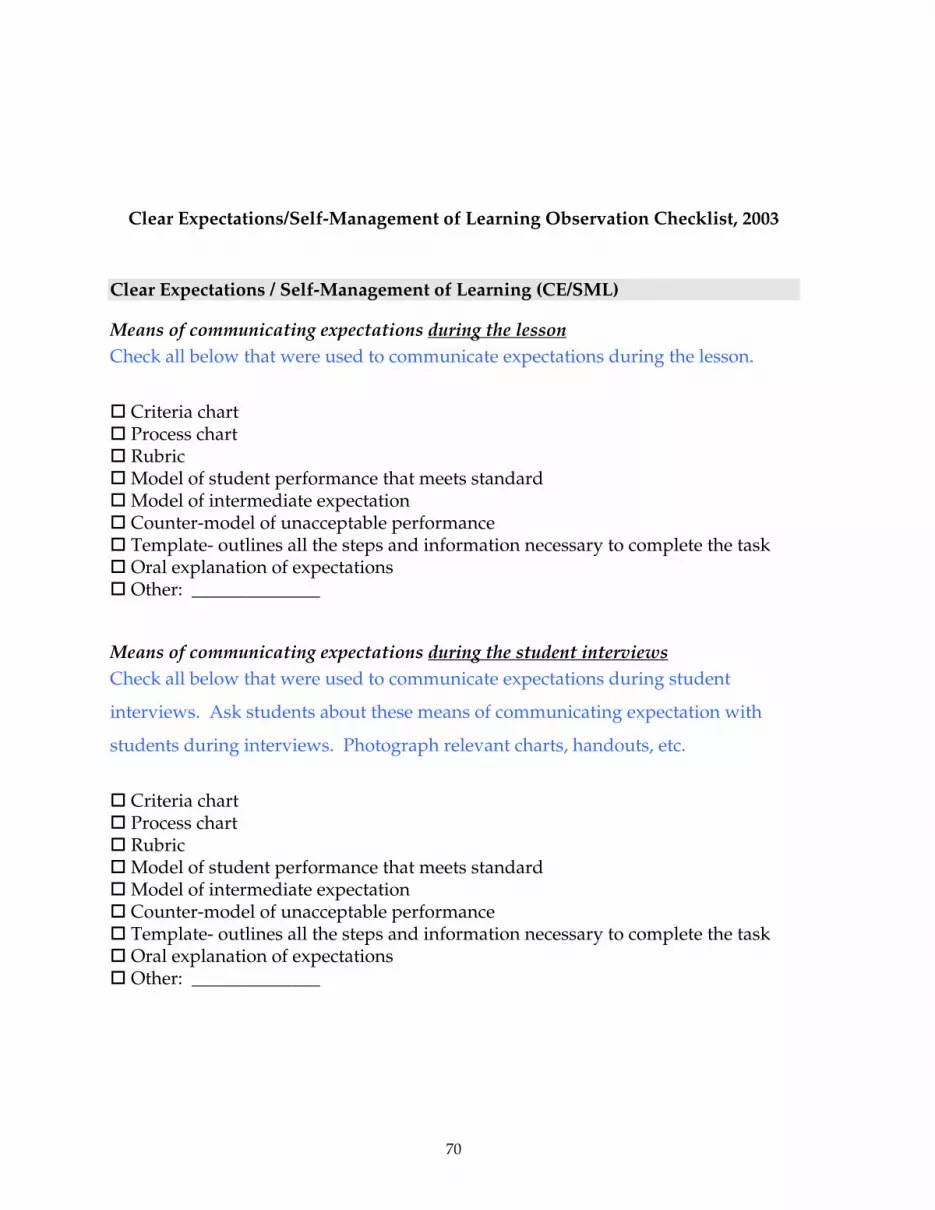
70
Clear Expectations/Self-Management of Learning Observation Checklist, 2003 Clear Expectations / Self-Management of Learning (CE/SML)
Means of communicating expectations during the lesson Check all below that were used to communicate expectations during the lesson.
Criteria chart Process chart Rubric Model of student performance that meets standard Model of intermediate expectation Counter-model of unacceptable performance Template- outlines all the steps and information necessary to complete the task Oral explanation of expectations Other: ______________
Means of communicating expectations during the student interviews Check all below that were used to communicate expectations during student
interviews. Ask students about these means of communicating expectation with
students during interviews. Photograph relevant charts, handouts, etc.
Criteria chart Process chart Rubric Model of student performance that meets standard Model of intermediate expectation Counter-model of unacceptable performance Template- outlines all the steps and information necessary to complete the task Oral explanation of expectations Other: ______________
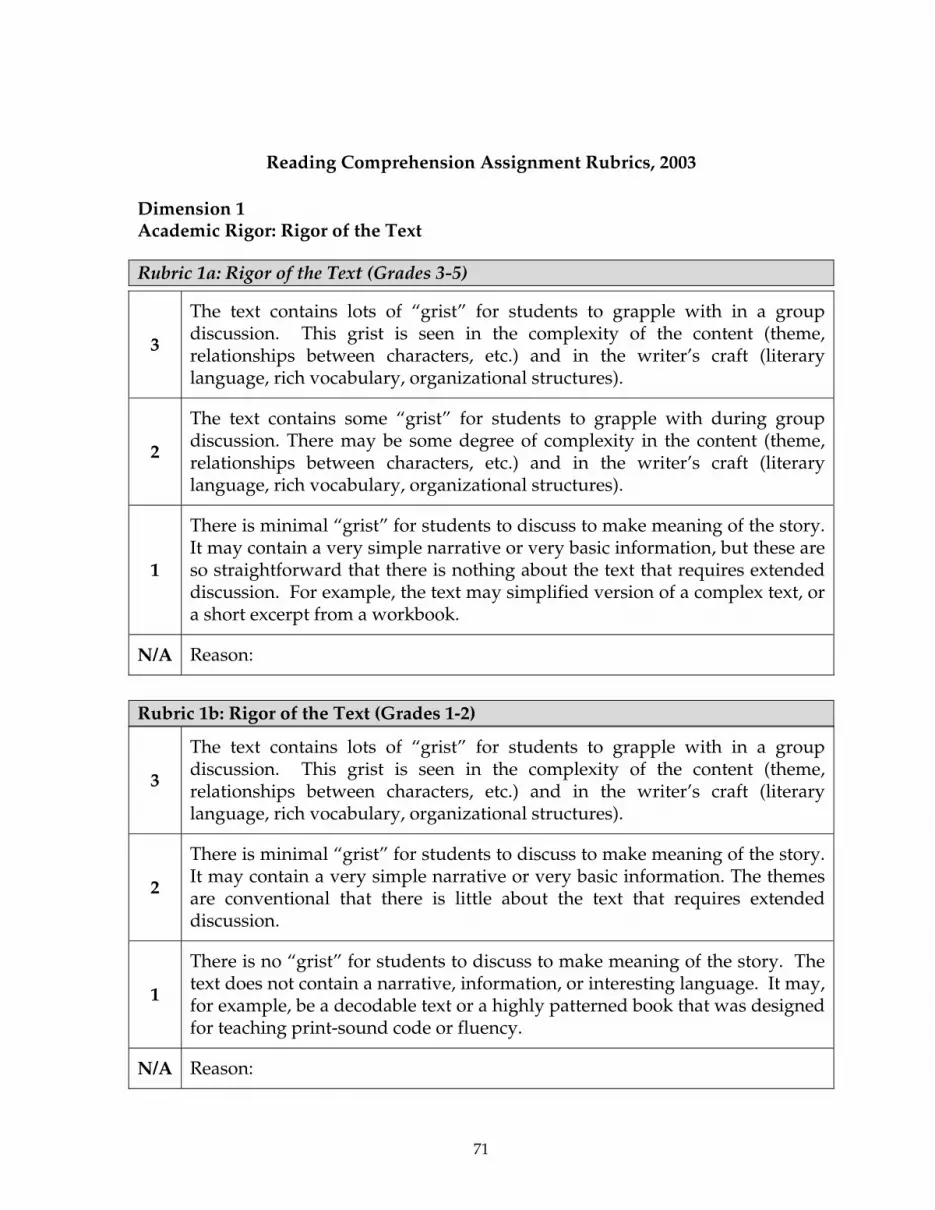
71
Reading Comprehension Assignment Rubrics, 2003 Dimension 1 Academic Rigor: Rigor of the Text
Rubric 1a: Rigor of the Text (Grades 3-5)
3
The text contains lots of “grist” for students to grapple with in a group discussion. This grist is seen in the complexity of the content (theme, relationships between characters, etc.) and in the writer’s craft (literary language, rich vocabulary, organizational structures).
2
The text contains some “grist” for students to grapple with during group discussion. There may be some degree of complexity in the content (theme, relationships between characters, etc.) and in the writer’s craft (literary language, rich vocabulary, organizational structures).
1
There is minimal “grist” for students to discuss to make meaning of the story. It may contain a very simple narrative or very basic information, but these are so straightforward that there is nothing about the text that requires extended discussion. For example, the text may simplified version of a complex text, or a short excerpt from a workbook.
N/A Reason:
Rubric 1b: Rigor of the Text (Grades 1-2)
3
The text contains lots of “grist” for students to grapple with in a group discussion. This grist is seen in the complexity of the content (theme, relationships between characters, etc.) and in the writer’s craft (literary language, rich vocabulary, organizational structures).
2
There is minimal “grist” for students to discuss to make meaning of the story. It may contain a very simple narrative or very basic information. The themes are conventional that there is little about the text that requires extended discussion.
1
There is no “grist” for students to discuss to make meaning of the story. The text does not contain a narrative, information, or interesting language. It may, for example, be a decodable text or a highly patterned book that was designed for teaching print-sound code or fluency.
N/A Reason:

72
Dimension 2 Academic Rigor: Potential
Rubric 2b: Analyzing and Interpreting the Text: (Grades 3-5)
4
The task guides students to engage with the underlying meanings or nuances of a text. Students interpret or analyze a text AND use extensive and detailed evidence from the text to support their ideas or opinions. AND the task provides students with an opportunity to fully develop their thinking (e.g. challenging questions, extended responses, and analytical and interpretive responses).
3
The task guides students to engage with some underlying meanings or nuances of a text. Students may interpret or analyze a text, BUT they use limited evidence from the text to support their ideas or opinions. There is some opportunity for students to develop their thinking (e.g. challenging questions but structured responses).
2
The task guides students to construct a literal summary of the text based on straightforward (surface-level) information OR engage with surface-level information about the text only. The task guides students to use little or no evidence from the text to support their ideas or opinions.
1
The task guides students to recall isolated, straightforward (surface-level) facts about a text OR write on a topic that does not directly reference information from the text. OR The task guides students in recalling fragmented information about the text.
N/A Reason:

73
Rubric 2a: Analyzing and Interpreting the Text: (Grades 1-2)
4 The task guides students to interpret or evaluate a text AND make explicit references to the text. AND students have ample opportunity to develop their thinking (e.g. challenging questions, extended responses, and analytical and interpretive responses).
3
The task guides students to interpret or evaluate a text. The lesson task requires students to make general references to the text. OR The task requires students to demonstrate a comprehensive understanding of the text through a detailed summary. There is some opportunity for students to develop their thinking (e.g. challenging questions but structured responses).
2 The task guides students to demonstrate a superficial understanding of the text. Students summarize basic information about a text. OR students engage in perfunctory responses and have no opportunity to develop higher level thinking skills.
1
The task does not require students to engage with a text. Students write on a topic (or draw a picture) that does not directly reference information from the text (in other words, the assignment could have been completed without ever having heard or read a specific text). OR The task guides students in recalling fragmented information about the text.
N/A Reason:
Dimension 3 Academic Rigor: Implementation Rubric 3a: Implementation of the Task: (Grades 3-5)
4 Students engaged with the underlying meanings or nuances of a text. Students interpreted or analyzed a text AND used extensive and detailed evidence from the text to support their ideas or opinions.
3 Students engaged with some underlying meanings or nuances of a text. Students interpreted or analyzed a text BUT used limited evidence from the text to support their ideas or opinions.
2 Students constructed a literal summary of the text based on straightforward (surface-level) information OR students engaged with surface-level information about the text only. Students used little or no evidence from the text to support their ideas or opinions. OR the task guides students to engage with interpreting or analyzing a text but provides limited opportunity to develop their thinking.
1 Students recalled isolated, straightforward (surface-level) facts about a text OR wrote on a topic that does not directly reference information from the text.
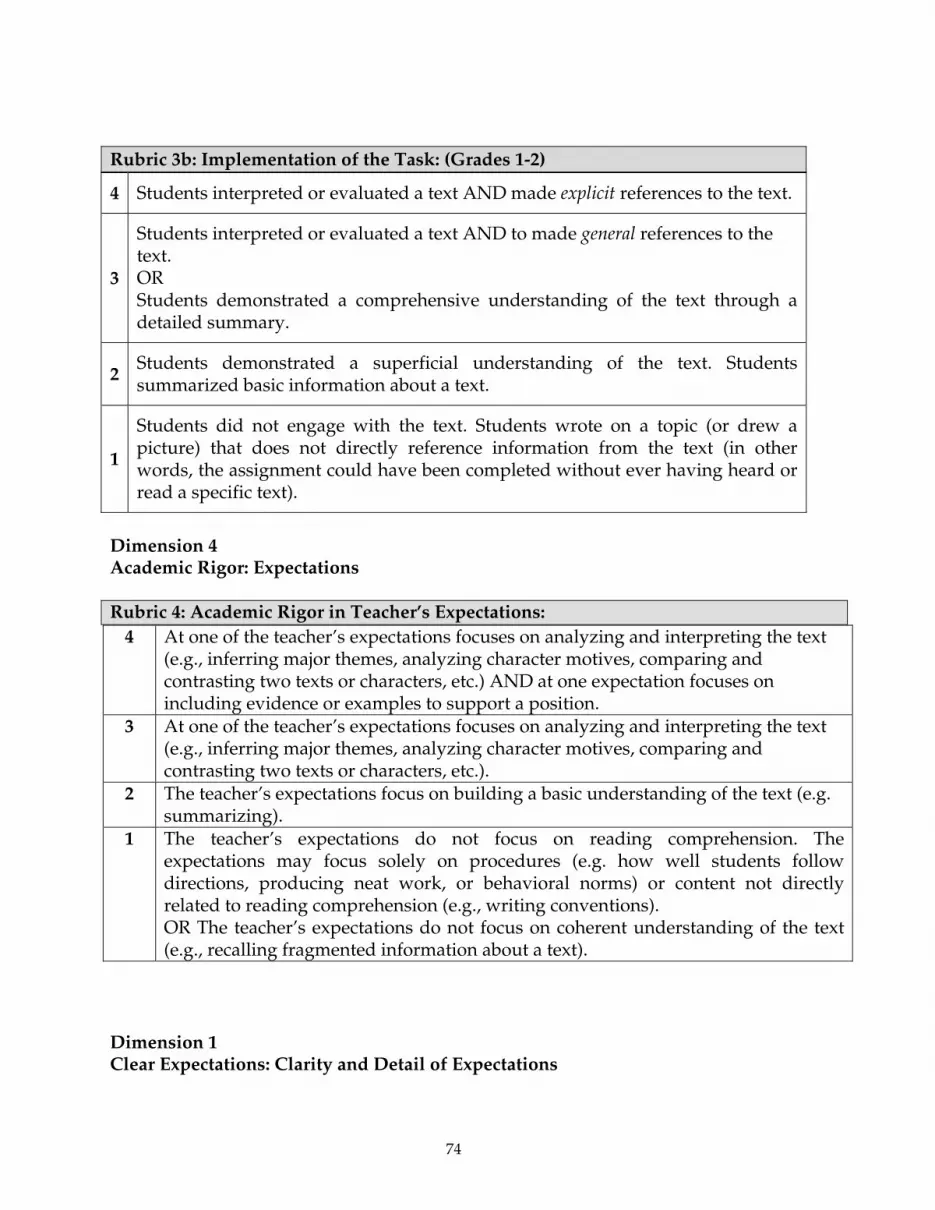
74
Rubric 3b: Implementation of the Task: (Grades 1-2)
4 Students interpreted or evaluated a text AND made explicit references to the text.
3
Students interpreted or evaluated a text AND to made general references to the text. OR Students demonstrated a comprehensive understanding of the text through a detailed summary.
2 Students demonstrated a superficial understanding of the text. Students summarized basic information about a text.
1
Students did not engage with the text. Students wrote on a topic (or drew a picture) that does not directly reference information from the text (in other words, the assignment could have been completed without ever having heard or read a specific text).
Dimension 4 Academic Rigor: Expectations Rubric 4: Academic Rigor in Teacher’s Expectations:
4 At one of the teacher’s expectations focuses on analyzing and interpreting the text (e.g., inferring major themes, analyzing character motives, comparing and contrasting two texts or characters, etc.) AND at one expectation focuses on including evidence or examples to support a position.
3 At one of the teacher’s expectations focuses on analyzing and interpreting the text (e.g., inferring major themes, analyzing character motives, comparing and contrasting two texts or characters, etc.).
2 The teacher’s expectations focus on building a basic understanding of the text (e.g. summarizing).
1 The teacher’s expectations do not focus on reading comprehension. The expectations may focus solely on procedures (e.g. how well students follow directions, producing neat work, or behavioral norms) or content not directly related to reading comprehension (e.g., writing conventions). OR The teacher’s expectations do not focus on coherent understanding of the text (e.g., recalling fragmented information about a text).
Dimension 1 Clear Expectations: Clarity and Detail of Expectations
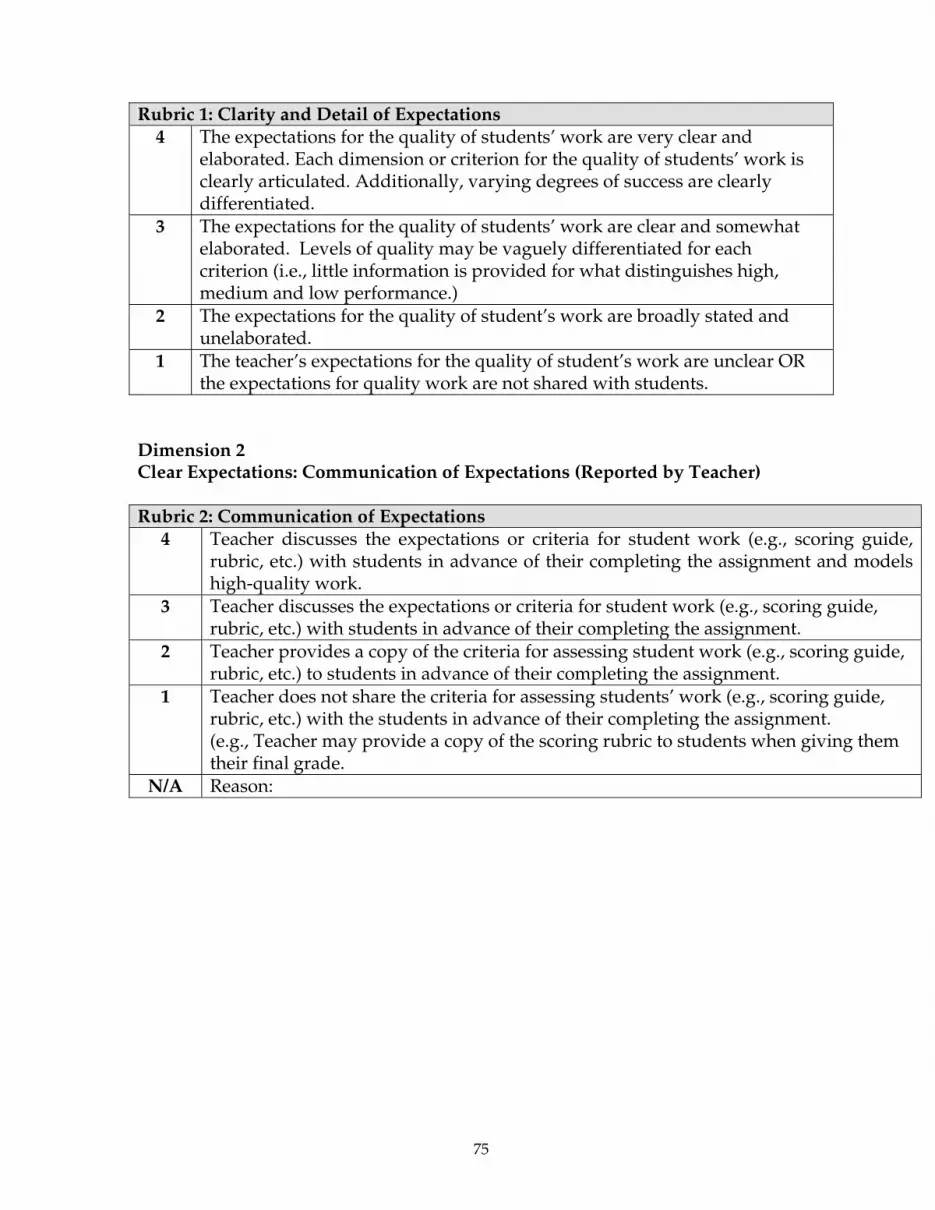
75
Rubric 1: Clarity and Detail of Expectations 4 The expectations for the quality of students’ work are very clear and
elaborated. Each dimension or criterion for the quality of students’ work is clearly articulated. Additionally, varying degrees of success are clearly differentiated.
3 The expectations for the quality of students’ work are clear and somewhat elaborated. Levels of quality may be vaguely differentiated for each criterion (i.e., little information is provided for what distinguishes high, medium and low performance.)
2 The expectations for the quality of student’s work are broadly stated and unelaborated.
1 The teacher’s expectations for the quality of student’s work are unclear OR the expectations for quality work are not shared with students.
Dimension 2 Clear Expectations: Communication of Expectations (Reported by Teacher)
Rubric 2: Communication of Expectations
4 Teacher discusses the expectations or criteria for student work (e.g., scoring guide, rubric, etc.) with students in advance of their completing the assignment and models high-quality work.
3 Teacher discusses the expectations or criteria for student work (e.g., scoring guide, rubric, etc.) with students in advance of their completing the assignment.
2 Teacher provides a copy of the criteria for assessing student work (e.g., scoring guide, rubric, etc.) to students in advance of their completing the assignment.
1 Teacher does not share the criteria for assessing students’ work (e.g., scoring guide, rubric, etc.) with the students in advance of their completing the assignment. (e.g., Teacher may provide a copy of the scoring rubric to students when giving them their final grade.
N/A Reason:
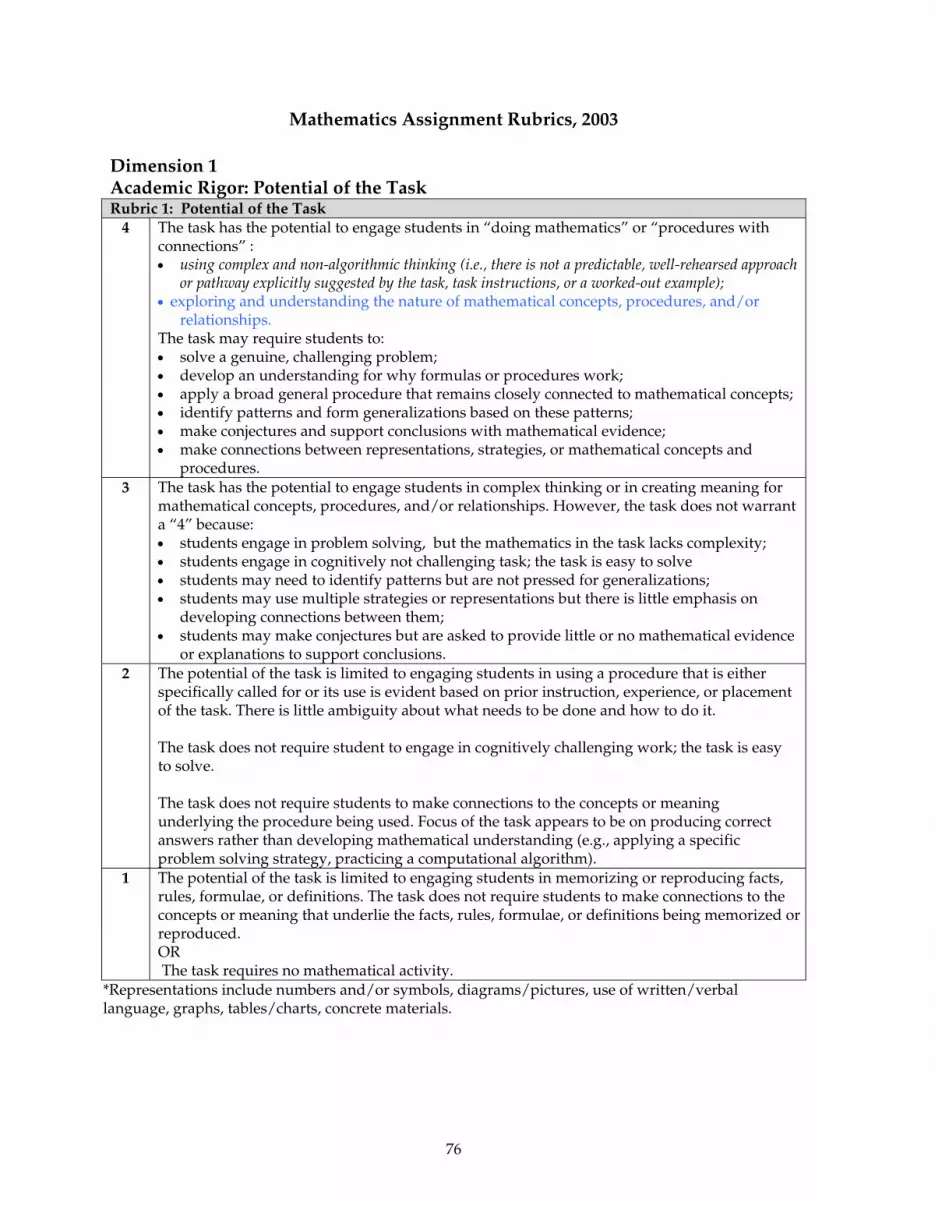
76
Mathematics Assignment Rubrics, 2003
Dimension 1 Academic Rigor: Potential of the Task Rubric 1: Potential of the Task
4 The task has the potential to engage students in “doing mathematics” or “procedures with connections” : • using complex and non-algorithmic thinking (i.e., there is not a predictable, well-rehearsed approach
or pathway explicitly suggested by the task, task instructions, or a worked-out example); • exploring and understanding the nature of mathematical concepts, procedures, and/or
relationships. The task may require students to: • solve a genuine, challenging problem; • develop an understanding for why formulas or procedures work; • apply a broad general procedure that remains closely connected to mathematical concepts; • identify patterns and form generalizations based on these patterns; • make conjectures and support conclusions with mathematical evidence; • make connections between representations, strategies, or mathematical concepts and
procedures. 3 The task has the potential to engage students in complex thinking or in creating meaning for
mathematical concepts, procedures, and/or relationships. However, the task does not warrant a “4” because: • students engage in problem solving, but the mathematics in the task lacks complexity; • students engage in cognitively not challenging task; the task is easy to solve • students may need to identify patterns but are not pressed for generalizations; • students may use multiple strategies or representations but there is little emphasis on
developing connections between them; • students may make conjectures but are asked to provide little or no mathematical evidence
or explanations to support conclusions. 2 The potential of the task is limited to engaging students in using a procedure that is either
specifically called for or its use is evident based on prior instruction, experience, or placement of the task. There is little ambiguity about what needs to be done and how to do it. The task does not require student to engage in cognitively challenging work; the task is easy to solve. The task does not require students to make connections to the concepts or meaning underlying the procedure being used. Focus of the task appears to be on producing correct answers rather than developing mathematical understanding (e.g., applying a specific problem solving strategy, practicing a computational algorithm).
1 The potential of the task is limited to engaging students in memorizing or reproducing facts, rules, formulae, or definitions. The task does not require students to make connections to the concepts or meaning that underlie the facts, rules, formulae, or definitions being memorized or reproduced. OR The task requires no mathematical activity.
*Representations include numbers and/or symbols, diagrams/pictures, use of written/verbal language, graphs, tables/charts, concrete materials.

77
Dimension 2: Academic Rigor: Implementation
Rubric 2: Implementation of the Task 4 Student-work indicates use of complex and non-algorithmic thinking, problem
solving, or exploring and understanding the nature of mathematical concepts, procedures, and/or relationships.*
3 Students engage in problem-solving or in creating meaning for mathematical procedures and concepts BUT the problems, concepts, or procedures do not require the extent of complex thinking as a “4”; OR The “potential of the task” on page 1 was rated as a 4 but Ss only moderately engage with the high-level demands of the task.*
2 Students engage with the task at a procedural level. Students apply a demonstrated or prescribed procedure. Students may be required to show or state the steps of their procedure, but are not required to explain or support their ideas. Students focus on correctly executing a procedure to obtain a correct answer.*
1 Students engage with the task at a memorization level. Students are required to recall facts, formulas, or rules (e.g., students provide answers only). OR Students do not engage in mathematical activity.

78
Dimension 3 Academic Rigor: Discussion
Rubric 3: Student Discussion Following Task 4 Students show written work and provide complete and thorough explanations
of why their strategy, idea, or procedure is valid. Students explain why their strategy works and/or is appropriate for the problem by making connections to the underlying mathematical ideas (e.g., “I divided because we needed equal groups”). OR Student work displays use of more than one strategy or representation* for solving the task, and provides a written explanation of how the different strategies/representations were used to solve the task.
3 Students show written work and provide explanations BUT the explanations are incomplete or are procedural in nature. Students explain the steps of their work (e.g., what they did first, second, etc.) but do not explain why their strategy or procedure works and/or was appropriate for the problem; OR Student work displays use of more than one strategy or representation* for solving the task.
2 Students show written work for solving the task (e.g., the steps for a multiplication problem, finding an average, or solving an equation) with no written explanation; OR Student work displays use of only one strategy or representation* for solving the task.
1 Students provide brief or one-word answers (e.g., fill in blanks); OR Student’s responses are non-mathematical.
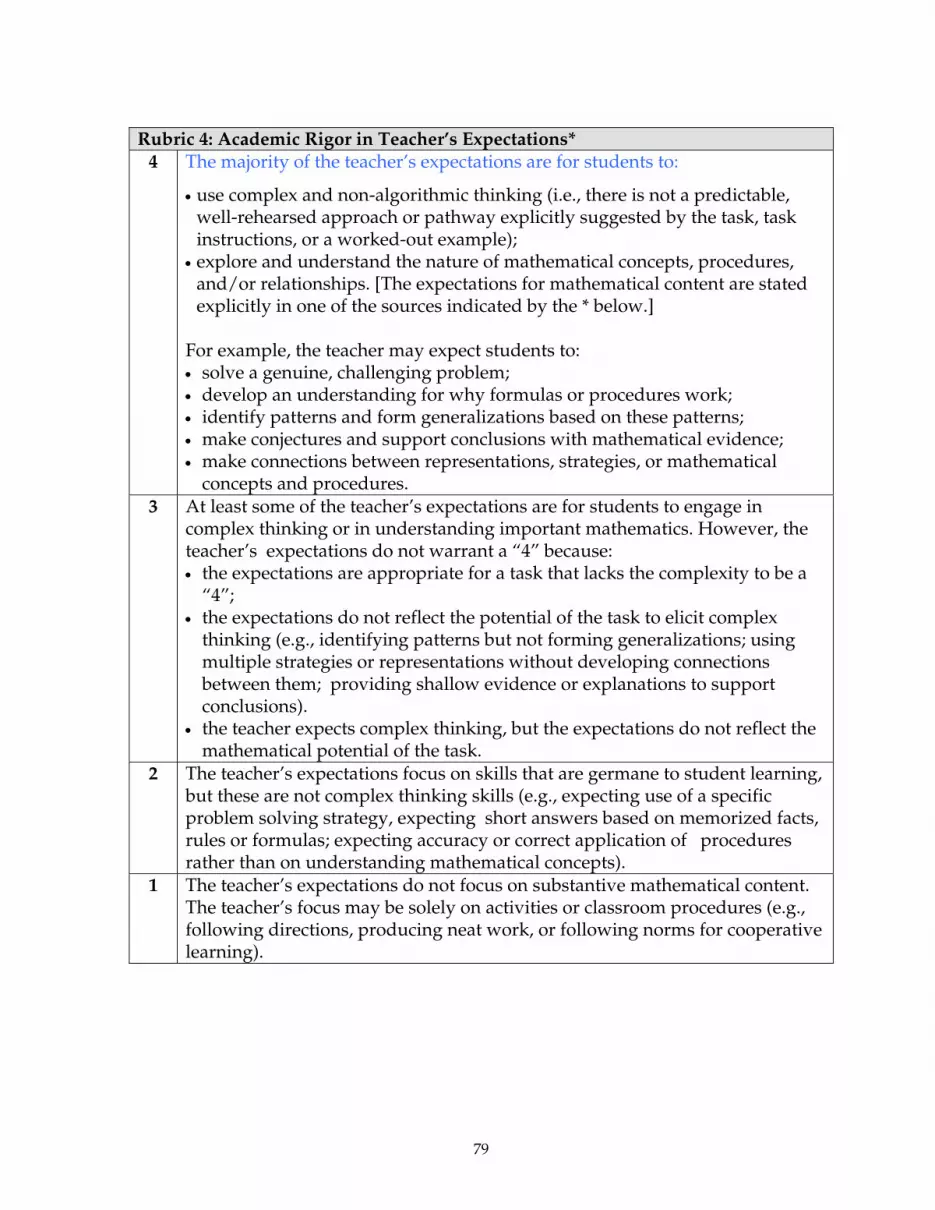
79
Rubric 4: Academic Rigor in Teacher’s Expectations*
4 The majority of the teacher’s expectations are for students to:
• use complex and non-algorithmic thinking (i.e., there is not a predictable, well-rehearsed approach or pathway explicitly suggested by the task, task instructions, or a worked-out example);
• explore and understand the nature of mathematical concepts, procedures, and/or relationships. [The expectations for mathematical content are stated explicitly in one of the sources indicated by the * below.]
For example, the teacher may expect students to: • solve a genuine, challenging problem; • develop an understanding for why formulas or procedures work; • identify patterns and form generalizations based on these patterns; • make conjectures and support conclusions with mathematical evidence; • make connections between representations, strategies, or mathematical
concepts and procedures. 3 At least some of the teacher’s expectations are for students to engage in
complex thinking or in understanding important mathematics. However, the teacher’s expectations do not warrant a “4” because: • the expectations are appropriate for a task that lacks the complexity to be a
“4”; • the expectations do not reflect the potential of the task to elicit complex
thinking (e.g., identifying patterns but not forming generalizations; using multiple strategies or representations without developing connections between them; providing shallow evidence or explanations to support conclusions).
• the teacher expects complex thinking, but the expectations do not reflect the mathematical potential of the task.
2 The teacher’s expectations focus on skills that are germane to student learning, but these are not complex thinking skills (e.g., expecting use of a specific problem solving strategy, expecting short answers based on memorized facts, rules or formulas; expecting accuracy or correct application of procedures rather than on understanding mathematical concepts).
1 The teacher’s expectations do not focus on substantive mathematical content. The teacher’s focus may be solely on activities or classroom procedures (e.g., following directions, producing neat work, or following norms for cooperative learning).

80
Dimension 1 Clear Expectations: Clarity and Detail of Expectations Rubric 1: Clarity and Detail of Expectations
4 The expectations for the quality of students’ work are very clear and elaborated. Each dimension or criterion for the quality of students’ work is clearly articulated. Additionally, varying degrees of success are clearly differentiated.
3 The expectations for the quality of students’ work are clear and somewhat elaborated. Levels of quality may be vaguely differentiated for each criterion (i.e., little information is provided for what distinguishes high, medium and low performance.)
2 The expectations for the quality of student’s work are broadly stated and unelaborated.
1 The teacher’s expectations for the quality of student’s work are unclear OR the expectations for quality work are not shared with students.
Dimension 2
Clear Expectations: Communication of Expectations (Reported by Teacher) Rubric 2: Communications of Expectations
4 Teacher discusses the expectations or criteria for student work (e.g., scoring guide, rubric, etc.) with students in advance of their completing the assignment and models high-quality work.
3 Teacher discusses the expectations or criteria for student work (e.g., scoring guide, rubric, etc.) with students in advance of their completing the assignment.
2 Teacher provides a copy of the criteria for assessing student work (e.g., scoring guide, rubric, etc.) to students in advance of their completing the assignment.
1 Teacher does not share the criteria for assessing students’ work (e.g., scoring guide, rubric, etc.) with the students in advance of their completing the assignment. (e.g., Teacher may provide a copy of the scoring rubric to students when giving them their final grade.
N/A Reason: