overall brain connectivity maps show cortico-subcortical abnormalities in schizophrenia
TRANSCRIPT
r Human Brain Mapping 000:000–000 (2010) r
Overall Brain Connectivity Maps ShowCortico-Subcortical Abnormalities
in Schizophrenia
Raymond Salvador,1* Salvador Sarro,1 Jesus J. Gomar,1 Jordi Ortiz-Gil,1
Fidel Vila,2 Antoni Capdevila,2,4 Ed Bullmore,3 Peter J. McKenna,1
and Edith Pomarol-Clotet1
1Benito Menni C.A.S.M.-CIBERSAM, Sant Boi de Llobregat, Barcelona, Spain2Fundacio Sant Joan de Deu, Esplugues del Llobregat, Barcelona, Spain
3Brain Mapping Unit, University of Cambridge, Cambridge, United Kingdom4CIBER-BBN, Spain
r r
Abstract: Abnormal interactions between areas of the brain have been pointed as possible causes forschizophrenia. However, the nature of these disturbances and the anatomical location of the regionsinvolved are still unclear. Here, we describe a method to estimate maps of net levels of connectivity inthe resting brain, and we apply it to look for differential patterns of connectivity in schizophrenia. Thismethod uses partial coherences as a basic measure of covariability, and it minimises the effect of majorphysiological noise. When overall (net) connectivity maps of a sample of 40 patients with schizophre-nia were compared with the maps from a matched sample of 40 controls, a single area of abnormalitywas found. It is an area of patient hyper-connectivity and is located frontally, in medial and orbitalstructures, clearly overlapping the anterior node of the default mode network (DMN). When this areais used as a region of interest in a second-level analysis, it shows functional hyper-connections withseveral cortical and subcortical structures. Interestingly, the most significant abnormality is found withthe caudate, which has a bilateral pattern of abnormality, pointing to a possible DMN–striatum deviantrelation in schizophrenia. However, hyper-connectivity observed with other regions (right hippocam-pus and amygdala, and other cortical structures) suggests a more pervasive alteration of brain connec-tivity in this disease. Hum Brain Mapp 00:000–000, 2010. VC 2010 Wiley-Liss, Inc.
Keywords: magnetic resonance imaging; resting state; functional connectivity; default mode network;caudate nucleus; basal ganglia; cerebral cortex
r r
INTRODUCTION
The psychotic disorder schizophrenia is widely believedto be due to a disturbance of brain function, but the nature
of this disturbance and which anatomical regions are
affected still remains uncertain. Since the early 90s, differ-
ent authors have argued for dysfunction in different areas
Contract grant sponsor: Spanish Ministry of Health; Contractgrant numbers: PI05/1874, CP07/00048, FI05/00322; Contractgrant sponsor: Instituto de Salud Carlos III, Centro deInvestigacion en Red de Salud Mental, CIBERSAM.
*Correspondence to: Raymond Salvador, Benito Menni-C.A.S.M.Germanes Hospitalaries del Sagrat Cor de Jesus, C/Dr AntoniPujadas 38-C, Sant Boi de Llobregat, Barcelona 08830, Spain.
E-mail: [email protected]
Received for publication 8 June 2009; Revised 27 November 2009;Accepted 17 December 2009
DOI: 10.1002/hbm.20993Published online in Wiley InterScience (www.interscience.wiley.com).
VC 2010 Wiley-Liss, Inc.
and sets of regions, including frontal [Frith, 1992], fronto-
temporal [Friston and Frith, 1995; Liddle, 2001], fronto-hip-
pocampal [Gray et al., 1991; Weinberger and Lipska, 1995],
fronto-temporal-striatal [Robbins, 1990] and fronto-striato-
cerebellar [Andreasen, 1999] systems.More recently, attention has also been focused on poten-
tial disturbances in a set of regions known as the defaultmode network (DMN) [e.g., Bluhm et al., 2007; Garrityet al., 2007; Pomarol-Clotet et al., 2008]. This network isknown to be active when the brain is not engaged in anyspecific task [Greicius et al., 2003; Mazoyer et al., 2001;Raichle et al., 2001], and it includes areas of the medialprefrontal cortex, the posterior cingulate and the inferiorparietal lobule as main components. Implicit in this andall the previous hypotheses is the idea that the connectiv-ity between brain regions is abnormal in patients withschizophrenia [Bullmore et al., 1997], echoing Bleuler[1911], who originally coined the term schizophrenia torefer to a putative fragmentation and discoordination ofcerebral function.
Functional magnetic resonance imaging (fMRI) has beenapplied to explore connectivity anomalies in schizophreniausing different methodological approaches. Early studiesselected, a priori, a set of regions of interest (ROI) basedon previous results or models, and looked for differencesin correlation coefficients or other multivariate associationmeasures [e.g., Lawrie, 2002; Menon et al., 2001; Salvadoret al., 2007; Schlosser et al., 2003]. Similarly, differences incorrelations between a ROI and the remaining voxels ofthe brain have been reported. Although these methods canbe very useful and they are still widely used, they onlyrelate to connections involving the selected ROI.
Alternatively, less directed and more open analyseshave been carried out either by making extensive connec-tivity analyses based on complete parcellations of the brain[Foucher et al., 2005; Liang et al., 2006; Liu et al., 2008] orby performing studies based on components extracted bynon-supervised methods [Demirci et al., 2009; Jafri et al.,2008; Kim et al., 2009]. In general, though, results reportedby these and other studies are not entirely consistent.While in some cases major findings point to disconnection[e.g. Bluhm et al., 2007; Liang et al., 2006], other studiessuggest the opposite [e.g., Jafri et al., 2008; Salvador et al.,2007], and in some instances, both disconnection andhyper-connectivity are similarly related to the disease [e.g.,Schlosser et al., 2003; Wolf et al., 2007]. To some extent,this heterogeneity in results is due to the usage of differentcognitive tasks, involving different dynamics in differentregions of the brain. In that sense, the increasingly com-mon use of resting-state fMRI may lead to more homoge-neous connectivity results.
Here, we propose a new methodology, based on an ex-haustive parcellation of the brain, which delivers general(overall) connectivity maps in a similar way to Salvadoret al. [2008] but at the voxel level. The method is appliedto explore differences in net levels of connectivity betweena sample of patients with schizophrenia and a matched
sample of controls scanned while being at rest. Themethod uses partial coherences as a main connectivitymeasure [Salvador et al., 2005a; Sun et al., 2004] and itcontrols for gross physiological noise.
METHODS
Subjects
Chronic patients with a diagnosis of schizophreniaaccording to DSM-IV criteria were recruited from BenitoMenni Hospital (Sant Boi, Barcelona, Spain). Inclusion cri-teria included right-handedness, being intellectually pre-served (WAIS III IQ > 85) and without reported alcohol/substance abuse within 12 months prior to participation.After rejection for excess of movement in the MRI scanner,a final sample of 40 patients (14 females and 26 males)with a mean age of 41.45 � 12.9 (SD) years was used inthe study.
All patients, but one, were taking antipsychotic medica-tion (23 individuals had atypical neuroleptics, 3 subjectshad typical neuroleptics and 13 had both). Doses rangedfrom 100 to 2,740 equiv of mg/day of chlorpromazine (me-dian ¼ 578, first and third quartiles ¼ 300, 808). The dura-tion of illness in the sample of patients ranged from 3 to31 years (median ¼ 20 years, first and third quartiles ¼ 11,24 years).
Healthy volunteers with no previous history of neuro-logical or psychiatric illness were recruited by advertise-ment within the local community. Using the sameinclusion/rejection criteria as in patients, a matched sam-ple of 40 controls was finally available for the study[14 females and 26 males, with a mean age of 41.33 �13.08 (SD) years]. All participants gave written informedconsent prior to involvement in accordance to the Declara-tion of Helsinki, and the research protocol was approvedby the local ethics committee of the Benito MenniHospital.
Image Acquisition and Pre-processing
Each individual in the study underwent a single scan-ning session in which 266 volumes were acquired from a1.5-T GE Signa scanner, using a gradient echo echo-planar(EPI) sequence depicting the blood-oxygenation-level-de-pendent (BOLD) contrast. Each volume contained 16 axialplanes acquired with the following parameters: TR ¼ 2,000ms, TE ¼ 40 ms, flip angle ¼ 70�, section thickness ¼ 7mm, section skip ¼ 0.7 mm, in-plane resolution ¼ 3 mm �3 mm. The first 10 volumes were discarded to avoid T1saturation effects. Individuals were scanned while lyingquietly (in a ‘‘resting state’’ condition). However, theywere instructed to keep their eyes open to avoid highinter-individual variability in self-generated drowsiness orwakefulness states.
r Salvador et al. r
r 2 r
Several pre-processing steps were carried out on theoriginal images. Most of them used functions of the FSLsoftware (reviewed in Smith et al. [2004]). The bet andmcflirt functions were applied for skull extraction andrigid-body coregistration. To minimise movement arte-facts, all individuals with an estimated maximum absolutemovement over 3.0 mm, or an average absolute movementhigher than 0.3 mm, were discarded from the study. In theremaining individuals, movement effects were reduced byfitting linear models to the time series of coregisteredimages. These models included the six movement parame-ters and their temporal differences (12 independent varia-bles). Next, images were directly normalised to a referencestandard brain image (flirt function) without any interme-diate fitting to a structural high-resolution image and werespatially smoothed with a Gaussian filter (SD ¼ 3 mm[FWHM ¼ 7 mm]). Finally, a binary mask based on thesame standard brain was applied to the images. In thenormalisation step, we used the T1 MNI template re-sampled to 2 mm to perform an affine transformation with12 degrees of freedom applying a correlation ratio costfunction.
Characterisation of Gross Physiological Noise
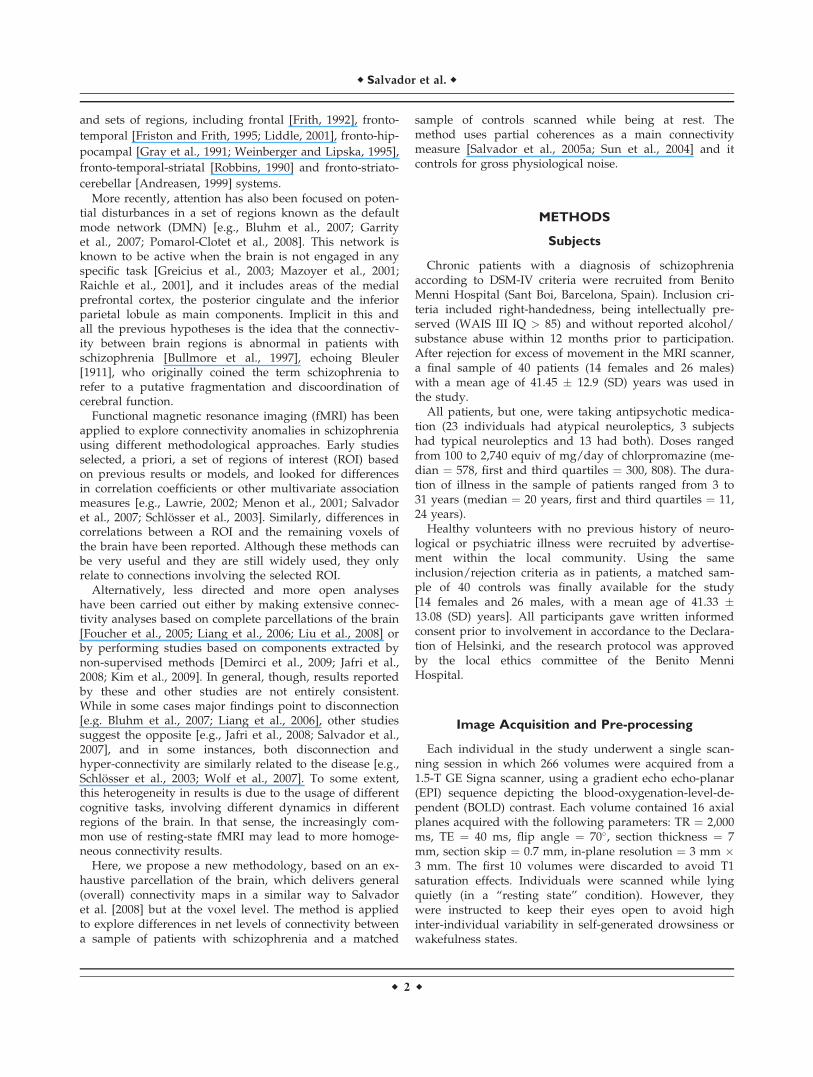
MRI-related artefacts and physiological noise accountfor a large part of the variance observed in fMRI timeseries [Huettel et al., 2004]. As shown through an examplein Figure 1A, voxels with highest standard deviations arelocated in the edges of the brain, areas with large bloodvessels and areas with CSF. Noise related to cardiac andrespiratory processes induce cyclic patterns in differentpoints of the brain, and its presence is usually analysed inthe frequency domain. A frequency-based principal com-ponent analysis [Brillinger, 1981] on the 6% of voxels withhighest variances in the image of Figure 1A reveals veryhigh levels of redundancy (Fig. 1B,C), suggesting strongcoherence of gross noise in fMRI sequences, with possiblynon-synchronous dynamics.
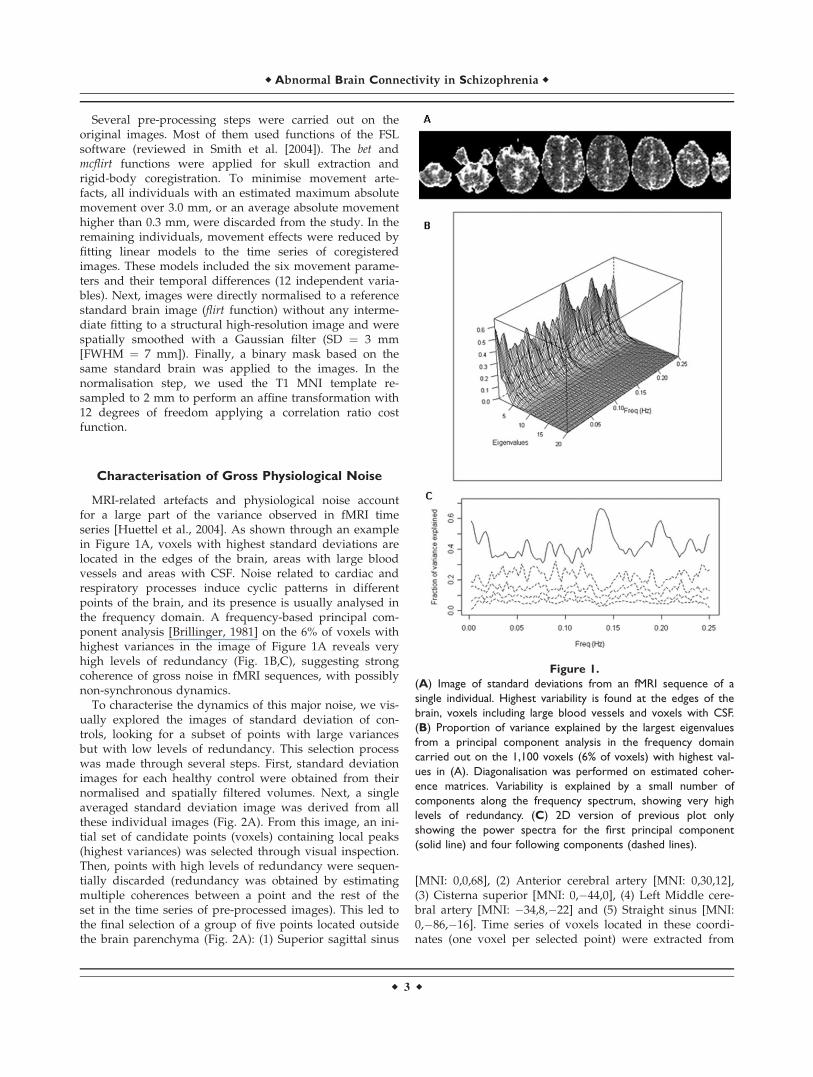
To characterise the dynamics of this major noise, we vis-ually explored the images of standard deviation of con-trols, looking for a subset of points with large variancesbut with low levels of redundancy. This selection processwas made through several steps. First, standard deviationimages for each healthy control were obtained from theirnormalised and spatially filtered volumes. Next, a singleaveraged standard deviation image was derived from allthese individual images (Fig. 2A). From this image, an ini-tial set of candidate points (voxels) containing local peaks(highest variances) was selected through visual inspection.Then, points with high levels of redundancy were sequen-tially discarded (redundancy was obtained by estimatingmultiple coherences between a point and the rest of theset in the time series of pre-processed images). This led tothe final selection of a group of five points located outsidethe brain parenchyma (Fig. 2A): (1) Superior sagittal sinus
[MNI: 0,0,68], (2) Anterior cerebral artery [MNI: 0,30,12],(3) Cisterna superior [MNI: 0,�44,0], (4) Left Middle cere-bral artery [MNI: �34,8,�22] and (5) Straight sinus [MNI:0,�86,�16]. Time series of voxels located in these coordi-nates (one voxel per selected point) were extracted from
Figure 1.
(A) Image of standard deviations from an fMRI sequence of a
single individual. Highest variability is found at the edges of the
brain, voxels including large blood vessels and voxels with CSF.
(B) Proportion of variance explained by the largest eigenvalues
from a principal component analysis in the frequency domain
carried out on the 1,100 voxels (6% of voxels) with highest val-
ues in (A). Diagonalisation was performed on estimated coher-
ence matrices. Variability is explained by a small number of
components along the frequency spectrum, showing very high
levels of redundancy. (C) 2D version of previous plot only
showing the power spectra for the first principal component
(solid line) and four following components (dashed lines).
r Abnormal Brain Connectivity in Schizophrenia r
r 3 r
Figure 2.
(A) Anatomical location of the five points finally chosen to char-
acterise major physiological noise. The background image is an
average of the individual standard deviation images taken from
the normalised and filtered fMRI sequences from the healthy
subjects. Left side of image is left side of brain. (B) Averages of
power spectra for the five selected points and the global brain
time series taken from the sample of healthy controls. (C) Aver-
ages of coherence functions between the time series of the five
selected points and the global mean taken from the sample of
controls. In both (B) and (C), frequencies are given in Hertz.
[Color figure can be viewed in the online issue, which is avail-
able at www.interscience.wiley.com.]
r Salvador et al. r
r 4 r
the normalised and filtered fMRI volumes, and they werelater used to reduce the contribution of gross noise in thecovariability between brain areas (see next subsection).Averaged power spectra and coherence functions for thefive selected points and the global brain time series areshown in Figure 2B,C.
ROI-Based Partial Coherence Maps
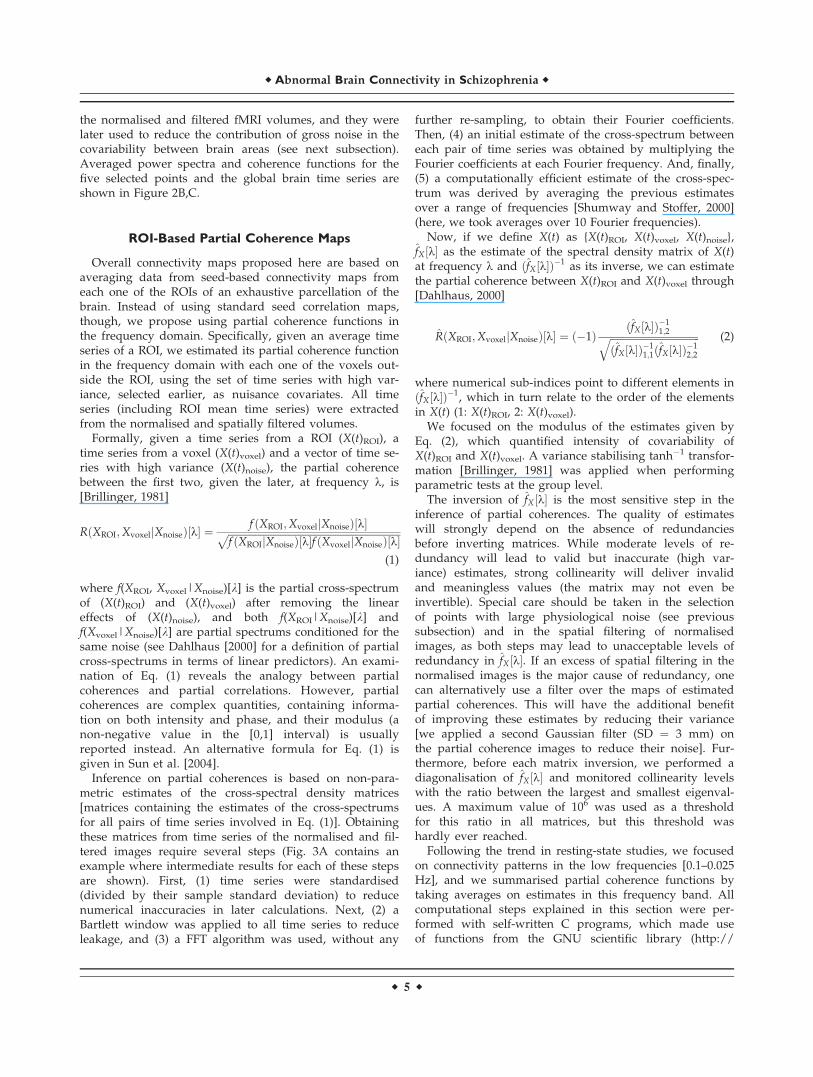
Overall connectivity maps proposed here are based onaveraging data from seed-based connectivity maps fromeach one of the ROIs of an exhaustive parcellation of thebrain. Instead of using standard seed correlation maps,though, we propose using partial coherence functions inthe frequency domain. Specifically, given an average timeseries of a ROI, we estimated its partial coherence functionin the frequency domain with each one of the voxels out-side the ROI, using the set of time series with high var-iance, selected earlier, as nuisance covariates. All timeseries (including ROI mean time series) were extractedfrom the normalised and spatially filtered volumes.
Formally, given a time series from a ROI (X(t)ROI), atime series from a voxel (X(t)voxel) and a vector of time se-ries with high variance (X(t)noise), the partial coherencebetween the first two, given the later, at frequency k, is[Brillinger, 1981]
RðXROI;XvoxeljXnoiseÞ½k� ¼ f ðXROI;XvoxeljXnoiseÞ½k�ffiffiffiffiffiffiffiffiffiffiffiffiffiffiffiffiffiffiffiffiffiffiffiffiffiffiffiffiffiffiffiffiffiffiffiffiffiffiffiffiffiffiffiffiffiffiffiffiffiffiffiffiffiffiffiffiffiffiffiffiffiffiffiffiffiffiffiffiffif ðXROIjXnoiseÞ½k�f ðXvoxeljXnoiseÞ½k�
p
(1)
where f(XROI, Xvoxel|Xnoise)[k] is the partial cross-spectrumof (X(t)ROI) and (X(t)voxel) after removing the lineareffects of (X(t)noise), and both f(XROI|Xnoise)[k] andf(Xvoxel|Xnoise)[k] are partial spectrums conditioned for thesame noise (see Dahlhaus [2000] for a definition of partialcross-spectrums in terms of linear predictors). An exami-nation of Eq. (1) reveals the analogy between partialcoherences and partial correlations. However, partialcoherences are complex quantities, containing informa-tion on both intensity and phase, and their modulus (anon-negative value in the [0,1] interval) is usuallyreported instead. An alternative formula for Eq. (1) isgiven in Sun et al. [2004].
Inference on partial coherences is based on non-para-metric estimates of the cross-spectral density matrices[matrices containing the estimates of the cross-spectrumsfor all pairs of time series involved in Eq. (1)]. Obtainingthese matrices from time series of the normalised and fil-tered images require several steps (Fig. 3A contains anexample where intermediate results for each of these stepsare shown). First, (1) time series were standardised(divided by their sample standard deviation) to reducenumerical inaccuracies in later calculations. Next, (2) aBartlett window was applied to all time series to reduceleakage, and (3) a FFT algorithm was used, without any
further re-sampling, to obtain their Fourier coefficients.Then, (4) an initial estimate of the cross-spectrum betweeneach pair of time series was obtained by multiplying theFourier coefficients at each Fourier frequency. And, finally,(5) a computationally efficient estimate of the cross-spec-trum was derived by averaging the previous estimatesover a range of frequencies [Shumway and Stoffer, 2000](here, we took averages over 10 Fourier frequencies).
Now, if we define X(t) as {X(t)ROI, X(t)voxel, X(t)noise},fX½k� as the estimate of the spectral density matrix of X(t)at frequency k and ðfX½k�Þ�1 as its inverse, we can estimatethe partial coherence between X(t)ROI and X(t)voxel through[Dahlhaus, 2000]
RðXROI;XvoxeljXnoiseÞ½k� ¼ ð�1Þ ðfX½k�Þ�11;2ffiffiffiffiffiffiffiffiffiffiffiffiffiffiffiffiffiffiffiffiffiffiffiffiffiffiffiffiffiffiffiffiffiffiffiffi
ðfX½k�Þ�11;1ðfX½k�Þ�1
2;2
q (2)
where numerical sub-indices point to different elements inðfX½k�Þ�1, which in turn relate to the order of the elementsin X(t) (1: X(t)ROI, 2: X(t)voxel).
We focused on the modulus of the estimates given byEq. (2), which quantified intensity of covariability ofX(t)ROI and X(t)voxel. A variance stabilising tanh�1 transfor-mation [Brillinger, 1981] was applied when performingparametric tests at the group level.
The inversion of fX½k� is the most sensitive step in theinference of partial coherences. The quality of estimateswill strongly depend on the absence of redundanciesbefore inverting matrices. While moderate levels of re-dundancy will lead to valid but inaccurate (high var-iance) estimates, strong collinearity will deliver invalidand meaningless values (the matrix may not even beinvertible). Special care should be taken in the selectionof points with large physiological noise (see previoussubsection) and in the spatial filtering of normalisedimages, as both steps may lead to unacceptable levels ofredundancy in fX½k�. If an excess of spatial filtering in thenormalised images is the major cause of redundancy, onecan alternatively use a filter over the maps of estimatedpartial coherences. This will have the additional benefitof improving these estimates by reducing their variance[we applied a second Gaussian filter (SD ¼ 3 mm) onthe partial coherence images to reduce their noise]. Fur-thermore, before each matrix inversion, we performed adiagonalisation of fX½k� and monitored collinearity levelswith the ratio between the largest and smallest eigenval-ues. A maximum value of 106 was used as a thresholdfor this ratio in all matrices, but this threshold washardly ever reached.
Following the trend in resting-state studies, we focusedon connectivity patterns in the low frequencies [0.1–0.025Hz], and we summarised partial coherence functions bytaking averages on estimates in this frequency band. Allcomputational steps explained in this section were per-formed with self-written C programs, which made useof functions from the GNU scientific library (http://
r Abnormal Brain Connectivity in Schizophrenia r
r 5 r
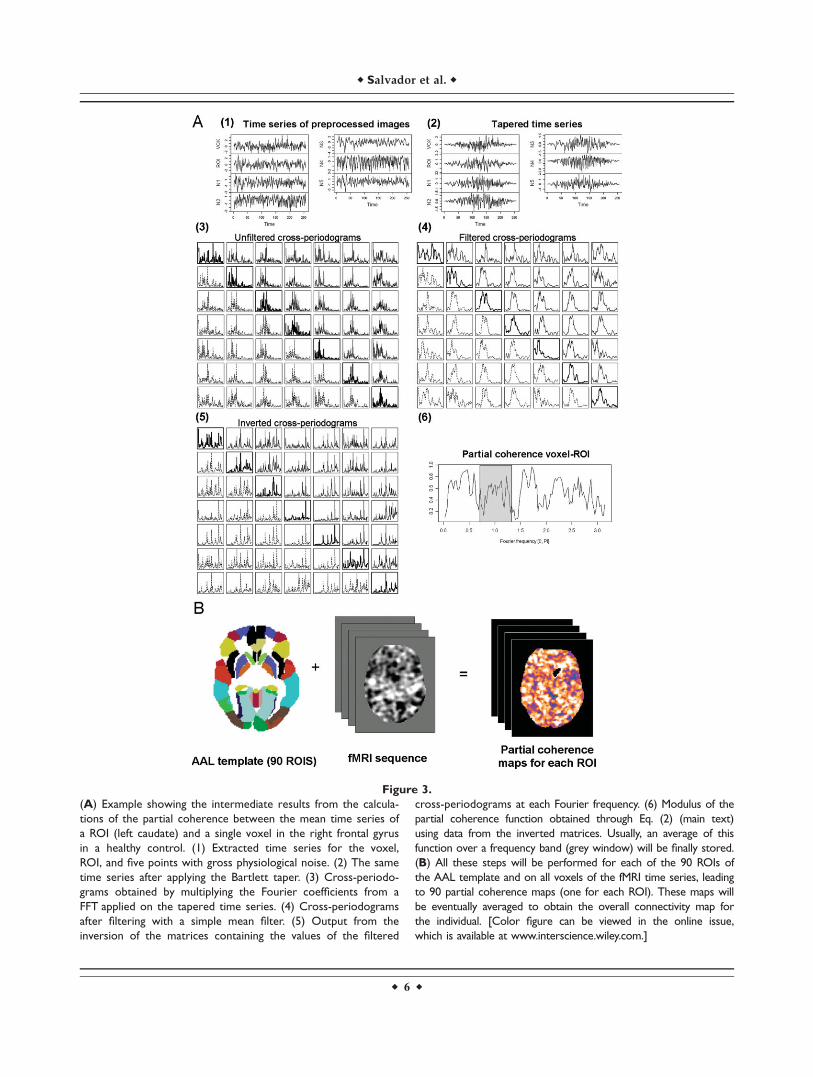
Figure 3.
(A) Example showing the intermediate results from the calcula-
tions of the partial coherence between the mean time series of
a ROI (left caudate) and a single voxel in the right frontal gyrus
in a healthy control. (1) Extracted time series for the voxel,
ROI, and five points with gross physiological noise. (2) The same
time series after applying the Bartlett taper. (3) Cross-periodo-
grams obtained by multiplying the Fourier coefficients from a
FFT applied on the tapered time series. (4) Cross-periodograms
after filtering with a simple mean filter. (5) Output from the
inversion of the matrices containing the values of the filtered
cross-periodograms at each Fourier frequency. (6) Modulus of the
partial coherence function obtained through Eq. (2) (main text)
using data from the inverted matrices. Usually, an average of this
function over a frequency band (grey window) will be finally stored.
(B) All these steps will be performed for each of the 90 ROIs of
the AAL template and on all voxels of the fMRI time series, leading
to 90 partial coherence maps (one for each ROI). These maps will
be eventually averaged to obtain the overall connectivity map for
the individual. [Color figure can be viewed in the online issue,
which is available at www.interscience.wiley.com.]
r Salvador et al. r
r 6 r
www.gnu.org/software/gsl/) for the diagonalisation andinversion of complex matrices.
Overall Connectivity Maps
Using the procedures described earlier, we obtainedROI-based partial coherence images, at the individuallevel, for the 90 regions included in the AAL template(Fig. 3B). The AAL template divides each cerebral hemi-sphere into 45 anatomical regions of different sizes,including both grey mater cortical areas and subcorticalnuclei, in a way that each region in one hemisphere hasits homologous region in the other hemisphere (seeTzourio-Mazoyer et al. [2002] for a detailed descriptionof this template and the regions involved).
Next, we averaged these images for all the ROIs, producingwhole brain net (overall) connectivity maps for every individ-ual. Each voxel in these maps contained mean values of con-nectivity with the remaining 89 regions (i.e., excluding theregion where the voxel was located, as we did not considerconnectivity values between a ROI and each voxel within it).Voxels not located inside any ROI (e.g., white matter voxels)reported averages of connectivity from all 90 regions.
Group Analysis on Overall Maps and
Second-Level ROI Analyses
Overall connectivity maps for the 40 patients with schizo-phrenia were compared with overall maps from the matchedsample of controls by means of standard linear models. Clus-ter-based Gaussian random field methods available as part ofthe FSL software (smoothest and cluster tools) were applied todeliver maps of significant differences with a threshold of P¼ 0.05 corrected and a z of 2.5 to create the initial clusters.
These maps showed areas where patients had abnormal lev-els of net connectivity (either disconnection or hyper-connec-tivity). Clusters found to be significantly different betweenboth groups were used as ROIs in a second-level comparison(using the same P ¼ 0.05 threshold but a more restrictive z of3.8). This comparison reported on more specific abnormal-ities in connectivity patterns.
Finally, to evaluate the possible effects of medication orduration of illness on the overall connectivity maps, we fit-ted two regression models on the sample of 40 patients.One of them used chlorpromazine equivalents as the inde-pendent variable, and the other model used years of ill-ness. Here, we applied the same threshold value of z ¼ 2.5but a less conservative P-value of 0.1 to generate mapswith brain areas showing significant correlations with bothconfounding variables.
RESULTS
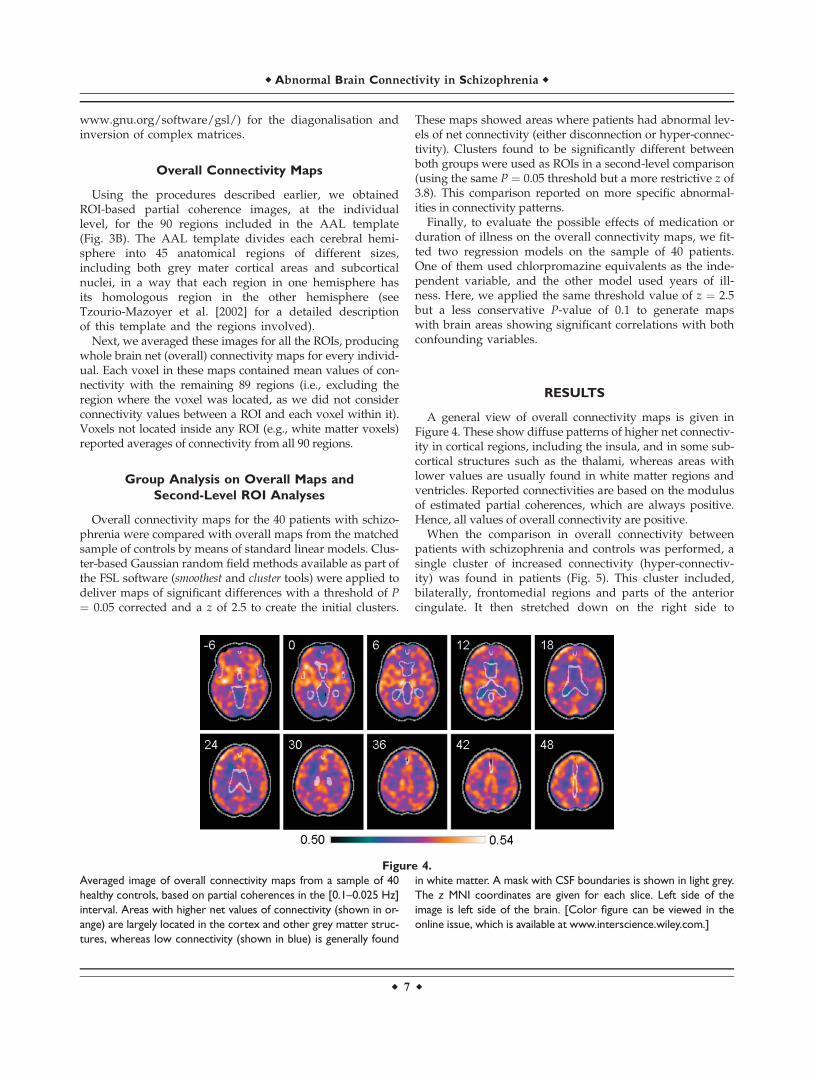
A general view of overall connectivity maps is given inFigure 4. These show diffuse patterns of higher net connectiv-ity in cortical regions, including the insula, and in some sub-cortical structures such as the thalami, whereas areas withlower values are usually found in white matter regions andventricles. Reported connectivities are based on the modulusof estimated partial coherences, which are always positive.Hence, all values of overall connectivity are positive.
When the comparison in overall connectivity betweenpatients with schizophrenia and controls was performed, asingle cluster of increased connectivity (hyper-connectiv-ity) was found in patients (Fig. 5). This cluster included,bilaterally, frontomedial regions and parts of the anteriorcingulate. It then stretched down on the right side to
Figure 4.
Averaged image of overall connectivity maps from a sample of 40
healthy controls, based on partial coherences in the [0.1–0.025 Hz]
interval. Areas with higher net values of connectivity (shown in or-
ange) are largely located in the cortex and other grey matter struc-
tures, whereas low connectivity (shown in blue) is generally found
in white matter. A mask with CSF boundaries is shown in light grey.
The z MNI coordinates are given for each slice. Left side of the
image is left side of the brain. [Color figure can be viewed in the
online issue, which is available at www.interscience.wiley.com.]
r Abnormal Brain Connectivity in Schizophrenia r
r 7 r
orbitofrontal areas, the anterior insula and ventral amyg-dala. Cluster peak differences in net connectivity werefound in MNI coordinates (20, 18, �16; max z ¼ 3.54)inside Brodmann area (BA) 11, with a probability of0.00485 for the whole cluster. At these coordinates, theobserved mean difference in overall connectivity betweenpatients and controls was 0.0281.
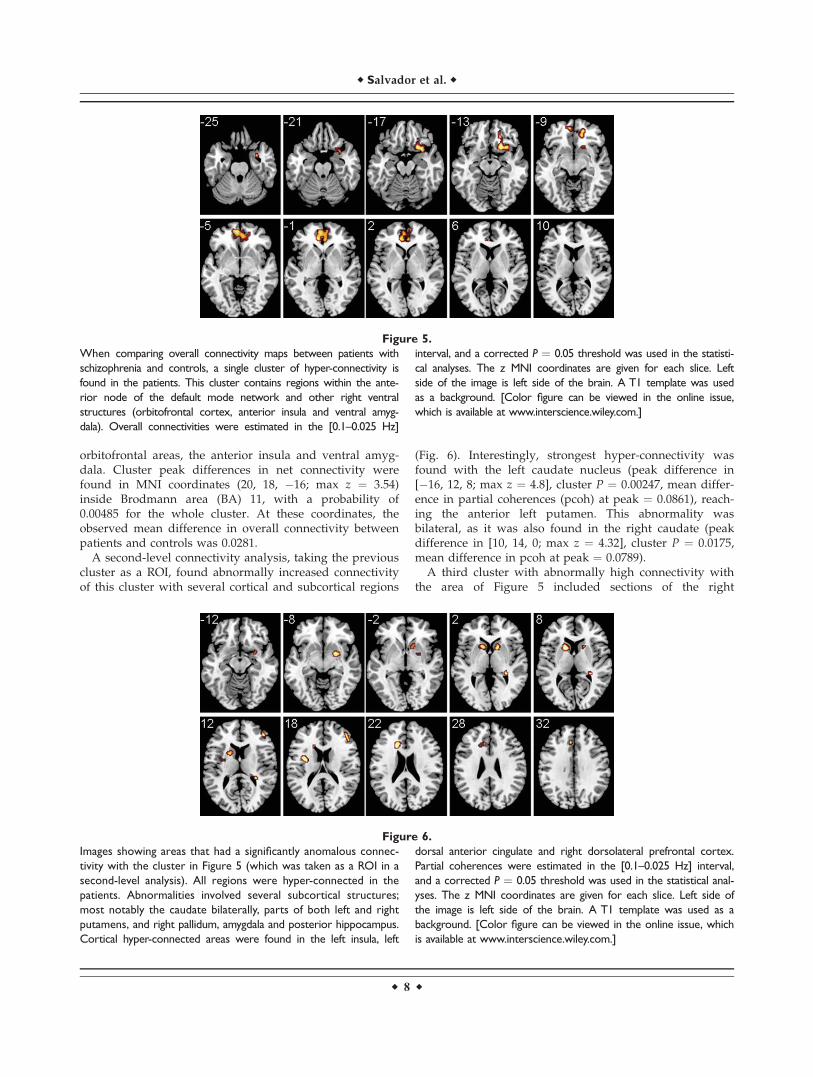
A second-level connectivity analysis, taking the previouscluster as a ROI, found abnormally increased connectivityof this cluster with several cortical and subcortical regions
(Fig. 6). Interestingly, strongest hyper-connectivity wasfound with the left caudate nucleus (peak difference in[�16, 12, 8; max z ¼ 4.8], cluster P ¼ 0.00247, mean differ-ence in partial coherences (pcoh) at peak ¼ 0.0861), reach-ing the anterior left putamen. This abnormality wasbilateral, as it was also found in the right caudate (peakdifference in [10, 14, 0; max z ¼ 4.32], cluster P ¼ 0.0175,mean difference in pcoh at peak ¼ 0.0789).
A third cluster with abnormally high connectivity withthe area of Figure 5 included sections of the right
Figure 5.
When comparing overall connectivity maps between patients with
schizophrenia and controls, a single cluster of hyper-connectivity is
found in the patients. This cluster contains regions within the ante-
rior node of the default mode network and other right ventral
structures (orbitofrontal cortex, anterior insula and ventral amyg-
dala). Overall connectivities were estimated in the [0.1–0.025 Hz]
interval, and a corrected P ¼ 0.05 threshold was used in the statisti-
cal analyses. The z MNI coordinates are given for each slice. Left
side of the image is left side of the brain. A T1 template was used
as a background. [Color figure can be viewed in the online issue,
which is available at www.interscience.wiley.com.]
Figure 6.
Images showing areas that had a significantly anomalous connec-
tivity with the cluster in Figure 5 (which was taken as a ROI in a
second-level analysis). All regions were hyper-connected in the
patients. Abnormalities involved several subcortical structures;
most notably the caudate bilaterally, parts of both left and right
putamens, and right pallidum, amygdala and posterior hippocampus.
Cortical hyper-connected areas were found in the left insula, left
dorsal anterior cingulate and right dorsolateral prefrontal cortex.
Partial coherences were estimated in the [0.1–0.025 Hz] interval,
and a corrected P ¼ 0.05 threshold was used in the statistical anal-
yses. The z MNI coordinates are given for each slice. Left side of
the image is left side of the brain. A T1 template was used as a
background. [Color figure can be viewed in the online issue, which
is available at www.interscience.wiley.com.]
r Salvador et al. r
r 8 r
putamen, pallidum and dorsal amygdala (coordinates ofpeak [22, 2, �8; max z ¼ 4.58], cluster P ¼ 0.0193, meandifference in pcoh at peak ¼ 0.0793), and another one waslocated in the right posterior hippocampus (coordinates ofpeak [30, �34, 2; max z ¼ 4.59], cluster P ¼ 0.0327, meandifference in pcoh at peak ¼ 0.0594).
Finally, three other hyper-connected clusters includedcortical areas. One small cluster was found in the rightdorsolateral prefrontal cortex (peak difference in [44, 44,14; max z ¼ 4.6], BA45, cluster P ¼ 0.0295, mean differencein pcoh at peak ¼ 0.0804), another in the left dorsal ante-rior cingulate and neighbouring white matter (coordinatesof peak [�16, 24, 22; max z ¼ 4.61], cluster P ¼ 0.0064,mean difference in pcoh at peak ¼ 0.0816) and yet anotherin the left insula, reaching parts of the left putamen (coor-dinates of peak [�34, �2, 18; max z ¼ 4.86], BA48, clusterP ¼ 0.0205, mean difference in pcoh at peak ¼ 0.0664).
The two regression analyses performed on the overallconnectivity maps of patients, assessing the potential effectof medication dose and of duration of illness, did notreport any significant cluster.
DISCUSSION
Overall connectivity maps for the whole brain havebeen derived through a new method that combines con-nectivity values of ROIs from a comprehensive parcella-tion of the brain. Although the method shares the sameobjective and has some similarities with the technique pre-viously proposed in Salvador et al. [2008], it deliversglobal maps at the voxel level and it minimises the effectof gross physiological fluctuations.
When the method was applied to explore differences innet levels of connectivity between patients with schizo-phrenia and healthy controls scanned while being at rest,a single area of anomalous hyper-connectivity was foundin medial and orbital parts of the frontal cortex. Strikingly,this area overlaps with the anterior node of the DMN,bringing new evidence of the implication of this networkin schizophrenia. Although other studies have foundabnormal functional connectivity in this anatomical area[e.g., Bluhm et al., 2007; Garrity et al., 2007; Whitfield-Gabrieli et al., 2009], many of them were set to look forspecific differences in the DMN. In that sense, the strengthof our work relies on the global, non-directed nature offindings through the overall connectivity maps.
A second-level analysis using this abnormal area as aROI found anomalous hyper-connectivity with severalcortical and subcortical structures. Most remarkably, bothcaudate nuclei showed substantial hyper-connection withthe medial orbital prefrontal cortex in patients. This resultgives further support to previous hypotheses of schizo-phrenia including the striatum [e.g., Robbins, 1990;Andreasen, 1999], but it would mainly suggest a DMN–ba-sal ganglia hyper-connection as a major disturbance in thedisease. In that sense, an abnormal functioning of the cor-
tico-striato-thalamic loop involving medial and ventralfrontal regions could explain, non-motor, cognitive deficitsobserved in patients. In relation to this, our reportedfronto-striatal alteration could be underlying the previ-ously described ‘failure to deactivate’ of the anterior nodeof the DMN in working memory tasks [Pomarol-Clotetet al., 2008; Whitfield-Gabrieli et al., 2009]. However,beyond this central basal ganglia–DMN abnormality,hyper-connectivity found with right hippocampus, amyg-dala and other cortical regions would point to a more per-vasive alteration of brain connectivity in schizophrenia.
On the other hand, though, the coarse temporal and spa-tial resolutions of fMRI sequences do not bring muchinformation on the direct mechanistic processes underly-ing the observed abnormalities, and we can only makesuggestions, on this subject, based on other data. Possibly,structural alteration on any of the components of thefronto-striatal circuit might have triggered these differen-ces in connectivity. In that sense, converging evidence ongrey matter volume changes in medial frontal regions [seereviews by Glahn et al., 2008; Honea et al., 2005; Ellison-Wright et al., 2008] would point to these areas as potentialprimary loci of alteration. Still, structural anomalies inother regions of the brain, including white matter tracts,could also lay behind the reported findings. Alternatively,our results may be the consequence of dysregulation inrelated brain systems such as the dopaminergic pathways,which involve small midbrain nuclei and have connectionsto the basal ganglia and cortical structures. Dysfunction inthese dopamine synaptic connections has long been pro-posed as one possible primary cause of the disease (see,for instance, the recent review by Howes and Kapur[2009]).
While the resting-state condition analysed here may beseen as too ambiguous [Morcom and Fletcher, 2007], find-ing consistent patterns of abnormality in schizophrenia atrest may lead to a more straightforward characterisation ofthis pathology, avoiding problems related to task specifica-tion and differential performance. We should acknowledge,however, that proving the neural nature of connectivity pat-terns found in resting-state studies is a complex task,requiring supplementary work from other modalities andtechniques. Yet, this is a weakness shared as well withmore standard fMRI studies [Sirotin and Das, 2009].
Results found in the comparison between patients andcontrols may have been influenced by other clinical factorsthan illness itself. Some previous studies point to changesin volume of brain structures with antipsychotic medica-tion, specially the basal ganglia [e.g., Chakos et al., 1994;Corson et al., 1999; Lieberman et al., 2005] possibly leadingto changes in connectivity patterns as well. Other studies,though, find that if present, structural changes are of aless extent than those linked to the evolution of disease(see review of Hulshoff and Kahn [2008]). Indeed, dura-tion of illness and chronicity are other aspects that havebeen related to brain changes in schizophrenia [e.g., Lap-pin et al., 2006; Takahashi et al., 2007].
r Abnormal Brain Connectivity in Schizophrenia r
r 9 r
Here, we failed to find any significant relation betweenneuroleptic dose (given in chlorpromazine equivalents), ill-ness duration and the proposed overall connectivity mea-sure. Both confounding variables were analysed on areasonably big sample (40 patients), having a significantamount of variability (with a range of 100 to 2,740 mg/day for medication and 3 to 31 years for illness duration)and using a rather permissive P-value of 0.1. Hence, nega-tive results found here would not suggest a primary roleof these two confounding variables on shaping overallconnectivity levels. However, future studies on unmedi-cated patients and on first-episode cases may be needed toratify our current results.
The connectivity methods described here are based onassociation measures in the frequency domain (mainlycoherences and partial coherences). Such measures may beseen as extensions of the more usual correlations or partialcorrelations [e.g., Biswal et al., 1995, Fox et al., 2006; Salva-dor et al., 2005b], and they are natural alternatives forthese standard methods when applied with predefinedseeds or ROIs. Conversely, instead of using partial coher-ences, in this study we could have averaged standard cor-relation or partial correlation maps of all regions of theparcellation to obtain a simplified version of the overallconnectivity maps.
Yet, we have chosen to use frequency domain measuresfor several reasons. On one hand, the dynamics of differ-ent sources of physiological noise (mainly respiration andheart pulses) are better characterised in this domain. Fur-thermore, apart from the possibility of describing time dy-namics at different scales (i.e., at various frequencybands), frequency based measures of association allowquantifying non-instantaneous relations. Most crucially,what in standard analyses are described as positive ornegative correlations appear as just two specific cases in acontinuum of possibly non-synchronous dynamics. In thatsense, although the information relating to the phase maybe relevant to understand the nature of the relations stud-ied, the primary interest of a connectivity analysis per-formed in the frequency domain will be on the modulusof (partial) coherences. The modulus quantifies the levelsof covariability between time series regardless of theirphase.
As shown by recent research on the spatiotemporal dy-namics of the BOLD signal in rodents [Majeed et al., 2009],both low-frequency cortical propagating waves and physi-ological noise lead to dephased time signals in differentareas of the brain. While such non-synchronous relationswill be hardly detected or just plainly missed by standardassociation measures like correlations, frequency-basedassociation measures may describe them adequately.
Values reported in overall connectivity maps, though,will depend in some degree on the parcellation used. Theboundaries of each region in the template and its relativesize will condition its weight on the connectivity measure.In previous works [Salvador et al., 2007, 2008], we alreadydescribed biases in connectivity due to size and number of
regions considered. However, the fact that results are nowreported at the voxel level and that calculations for eachvoxel are based on the same ROIs will avoid the spatialinconsistencies described previously. Further analysescomparing outcomes from different whole brain parcella-tions (in a similar way to Wang et al. [2009]) may help inevaluating the sensitivity of the method. Additional workmay explore, as well, connectivity levels in frequencybands other than the 0.1–0.025 Hz interval, or the selectionof new points of high variance for a better characterisationof physiological noise.
Finally, it should be recalled that, in essence, the over-all measure proposed here is an arithmetic mean. Hence,it only reports on net or averaged levels of connectivity,being non-informative on the specific connectionsinvolved (a second-level analysis as the one carried outin this study will be required to obtain such information).In that sense, it is possible to find similar values of over-all connectivity concealing significant differences inregional connectivity patterns, just because on averagethey level off. However, devising an alternative scalarmeasure, which could both summarise mean levels ofconnectivity and disambiguate these differences, seemschallenging.
CONCLUSIONS
In summary, we have derived overall connectivity mapsfor the whole brain through a new method that combinesconnectivity values of ROIs from an exhaustive parcella-tion of the brain. The main results obtained from applyingthis new methodology on a sample of patients with schizo-phrenia suggest a model for the disease where malfunc-tion in the anterior node of the DMN would be linked to asubcortical abnormality. More specifically, the outcome ofthis study would give further support for a fronto-striatalhypothesis of schizophrenia. However, significant resultsfound in other areas would indicate a more pervasivealteration of brain connectivity in this pathology. Newstudies with first episode and drug free patients will beneeded to consolidate the findings.
REFERENCES
Andreasen NC (1999): A unitary model of schizophrenia: Bleuler’s‘‘fragmented phrene’’ as schizencephaly. Arch Gen Psychiatry56:781–787.
Biswal B, Yetkin FZ, Haughton VM, Hyde JS (1995): Functionalconnectivity in the motor cortex of resting human brain usingecho-planar MRI. Magn Reson Med 34:537–541.
Bluhm RL, Miller J, Lanius RA, Osuch EA, Boksman K, NeufeldRW, Theberge J, Schaefer B, Williamson P (2007): Spontaneouslow-frequency fluctuations in the BOLD signal in schizo-phrenic patients: Anomalies in the default network. SchizophrBull 33:1004–1012.
Bleuler E (1911): Dementia praecox oder Gruppe der Schizophre-nien. Leipzig und Wien: F. Deuticke.
r Salvador et al. r
r 10 r
Brillinger DR (1981): Time Series. Data Analysis and Theory. SanFrancisco: Holden Day. 540 p.
Bullmore ET, Frangou S, Murray RM (1997): The dysplastic nethypothesis: An integration of developmental and dysconnec-tivity models of schizophrenia. Schizophr Res 28:143–156.
Chakos MH, Lieberman JA, Bilder RM, Borenstein M, Lerner G,Bogerts B, Wu H, Kinon B, Ashtari M (1994): Increase in cau-date nuclei volumes of first-episode schizophrenic patients tak-ing antipsychotic drugs. Am J Psychiatry 151:1430–1436.
Corson PW, Nopoulos P, Miller DD, Arndt S, Andreasen NC(1999): Change in basal ganglia volume over 2 years in patientswith schizophrenia: Typical versus atypical neuroleptics. Am JPsychiatry 156:1200–1204.
Dahlhaus R (2000): Graphical interaction models for multivariatetime series. Metrika 51:157–172.
Demirci O, Stevens MC, Andreasen NC, Michael A, Liu J, WhiteT, Pearlson GD, Clark VP, Calhoun VD (2009): Investigation ofrelationships between fMRI brain networks in the spectral do-main using ICA and Granger causality reveals distinct differ-ences between schizophrenia patients and healthy controls.Neuroimage 46:419–431.
Ellison-Wright I, Glahn DC, Laird AR, Thelen SM, Bullmore E(2008): The anatomy of first-episode and chronic schizophre-nia: An anatomical likelihood estimation meta-analysis. Am JPsychiatry 165:1015–1023.
Foucher JR, Vidailhet P, Chanraud S, Gounot D, Grucker D, PinsD, Damsa C, Danion JM (2005): Functional integration in schiz-ophrenia: Too little or too much? Preliminary results on fMRIdata. Neuroimage 26:374–388.
Fox MD, Corbetta M, Snyder AZ, Vincent JL, Raichle ME (2006):Spontaneous neuronal activity distinguishes human dorsal andventral attention systems. Proc Natl Acad Sci USA 103:10046–10051.
Friston KJ, Frith CD (1995): Schizophrenia: A disconnection syn-drome? Clin Neurosci 3:89–97.
Frith CD (1992): The Cognitive Neuropsychology of Schizophre-nia. Hove, Erlbaum (UK): Taylor & Francis. 163 p.
Garrity AG, Pearlson GD, McKiernan K, Lloyd D, Kiehl KA, Cal-houn VD (2007): Aberrant ‘‘default mode’’ functional connec-tivity in schizophrenia. Am J Psychiatry 164:450–457.
Glahn DC, Laird AR, Ellison-Wright I, Thelen SM, Robinson JL,Lancaster JL, Bullmore E, Fox PT (2008): Meta-analysis of graymatter anomalies in schizophrenia: Application of anatomiclikelihood estimation and network analysis. Biol Psychiatry64:774–781.
Gray JA, Feldon J, Rawlins JNP, Hemsley DR, Smith AD (1991):The neuropsychology of schizophrenia. Behav Brain Sci 14:1–20.
Greicius MD, Krasnow B, Reiss AL, Menon V (2003): Functionalconnectivity in the resting brain: A network analysis of thedefault mode hypothesis. Proc Natl Acad Sci USA 100:253–258.
Honea R, Crow TJ, Passingham D, Mackay CE (2005): Regional defi-cits in brain volume in schizophrenia: A meta-analysis of voxel-based morphometry studies. Am J Psychiatry 162:2233–2245.
Howes OD, Kapur S (2009): The dopamine hypothesis of schizo-phrenia: Version III—The final common pathway. SchizophrBull 35:549–562.
Huettel SA, Song AW, McCarthy G (2004): Functional MagneticResonance Imaging. Sunderland, Massachusetts: Sinauer. 492 p.
Hulshoff Pol HE, Kahn RS (2008): What happens after the firstepisode? A review of progressive brain changes in chronicallyill patients with schizophrenia. Schizophr Bull 34:354–366.
Jafri MJ, Pearlson GD, Stevens M, Calhoun VD (2008): A methodfor functional network connectivity among spatially independ-ent resting-state components in schizophrenia. Neuroimage39:1666–1681.
Kim DI, Mathalon DH, Ford JM, Mannell M, Turner JA, BrownGG, Belger A, Gollub R, Lauriello J, Wible C, O’Leary D, LimK, Toga A, Potkin SG, Birn F, Calhoun VD (2009): Auditoryoddball deficits in schizophrenia: An independent componentanalysis of the fMRI multisite function BIRN study. SchizophrBull 35:67–81.
Lappin JM, Morgan K, Morgan C, Hutchison G, Chitnis X, Suck-ling J, Fearon P, McGuire PK, Jones PB, Leff J, Murray RM,Dazzan P (2006): Gray matter abnormalities associated withduration of untreated psychosis. Schizophr Res 83:145–153.
Lawrie SM, Buechel C, Whalley HC, Frith CD, Friston KJ, John-stone EC (2002): Reduced frontotemporal functional connectiv-ity in schizophrenia associated with auditory hallucinations.Biol Psychiatry 51:1008–1011.
Liang M, Zhou Y, Jiang T, Liu Z, Tian L, Liu H, Hao Y (2006):Widespread functional disconnectivity in schizophrenia withresting-state functional magnetic resonance imaging. Neurore-port 17:209–213.
Liddle PF (2001): Disordered Mind and Brain. London: Gaskell. 301 p.
Lieberman JA, Tollefson GD, Charles C, Zipursky R, Sharma T,Kahn RS, Keefe RS, Green AI, Gur RE, McEvoy J, Perkins D,Hamer RM, Gu H, Tohen M (2005): Antipsychotic drug effectson brain morphology in first-episode psychosis. Arch Gen Psy-chiatry 62:361–370.
Liu Y, Liang M, Zhou Y, He Y, Hao Y, Song M, Yu C, Liu H, LiuZ, Jiang T (2008): Disrupted small-world networks in schizo-phrenia. Brain 131:945–961.
Majeed W, Magnuson M, Keilholz SD (2009): Spatiotemporal dy-namics of low frequency fluctuations in BOLD fMRI of the rat.J Magn Reson Imaging 30:384–393.
Mazoyer B, Zago L, Mellet E, Bricogne S, Etard O, Houde O, CrivelloF, Joliot M, Petit L, Tzourio-Mazoyer N (2001): Cortical networksfor working memory and executive functions sustain the con-scious resting state in man. Brain Res Bull 54:287–298.
Menon V, Anagnoson RT, Glover GH, Pfefferbaum A (2001):Functional magnetic resonance imaging evidence for disruptedbasal ganglia function in schizophrenia. Am J Psychiatry158:646–649.
Morcom AM, Fletcher PC (2007): Does the brain have a baseline?Why we should be resisting a rest. Neuroimage 37:1073–1082.
Pomarol-Clotet E, Salvador R, Sarro S, Gomar J, Vila F, MartınezA, Guerrero A, Ortiz-Gil J, Sans-Sansa B, Capdevila A, Ceba-manos JM, McKenna PJ (2008): Failure to deactivate in the pre-frontal cortex in schizophrenia: Dysfunction of the defaultmode network? Psychol Med 38:1185–1193.
Raichle ME, MacLeod AM, Snyder AZ, Powers WJ, Gusnard DA,Shulman GL (2001): A default mode of brain function. ProcNatl Acad Sci USA 98:676–682.
Robbins TW (1990): The case of frontostriatal dysfunction in schiz-ophrenia. Schizophr Bull 16:391–402.
Salvador R, Suckling J, Schwarzbauer C, Bullmore E (2005a)Undirected graphs of frequency-dependent functional connec-tivity in whole brain networks. Philos Trans R Soc Lond B BiolSci 360:937–946.
Salvador R, Suckling J, Coleman MR, Pickard JD, Menon D, Bull-more E (2005b) Neurophysiological architecture of functionalmagnetic resonance images of human brain. Cereb Cortex15:1332–1342.
r Abnormal Brain Connectivity in Schizophrenia r
r 11 r
Salvador R, Martınez A, Pomarol-Clotet E, Sarro S, Suckling J,Bullmore E (2007): Frequency based mutual information meas-ures between clusters of brain regions in functional magneticresonance imaging. Neuroimage 35:83–88.
Salvador R, Martınez A, Pomarol-Clotet E, Gomar J, Vila F, SarroS, Capdevila A, Bullmore E (2008): A simple view of the brainthrough a frequency-specific functional connectivity measure.Neuroimage 39:279–289.
Schlosser R, Gesierich T, Kaufmann B, Vucurevic G, Hunsche S,Gawehn J, Stoeter P (2003): Altered effective connectivity dur-ing working memory performance in schizophrenia: A studywith fMRI and structural equation modeling. Neuroimage19:751–763.
Shumway H, Stoffer DS (2000): Time Series Analysis and ItsApplications. New York: Springer. 549 p.
Sirotin YB, Das A (2009): Anticipatory haemodynamic signals insensory cortex not predicted by local neuronal activity. Nature457:475–479.
Smith SM, Jenkinson M, Woolrich MW, Beckmann CF, BehrensTE, Johansen-Berg H, Bannister PR, De Luca M, Drobnjak I,Flitney DE, Niazy R, Saunders J, Vickers J, Zhang Y, De Ste-fano N, Brady JM, Matthews PM (2004): Advances in func-tional and structural MR image analysis and implementationas FSL. Neuroimage 23 (Suppl 1):208–219.
Sun FT, Miller LM, D’Esposito M (2004): Measuring interregionalfunctional connectivity using coherence and partial coherenceanalyses of fMRI data. Neuroimage 21:647–658.
Takahashi T, Suzuki M, Tanino R, Zhou SY, Hagino H, NiuL, Kawasaki Y, Seto H, Kurachi M (2007): Volume reduc-tion of the left planum temporale gray matter associatedwith long duration of untreated psychosis in schizophre-nia: A preliminary report. Psychiatry Res 154:209–219.
Tzourio-Mazoyer N, Landeau B, Papathanassiou D, Crivello F,Etard O, Delcroix N, Mazoyer B, Joliot M (2002): Automatedanatomical labeling of activations in SPM using a macroscopicanatomical parcellation of the MNI MRI single-subject brain.Neuroimage 15:273–289.
Wang J, Wang L, Zang Y, Yang H, Tang H, Gong Q, Chen Z, ZhuC, He Y (2009): Parcellation-dependent small-world brain func-tional networks: A resting-state fMRI study. Hum Brain Mapp30:1511–1523.
Weinberger DR, Lipska BK (1995): Cortical maldevelopment, anti-psychotic drugs, and schizophrenia: A search for commonground. Schizophr Res 16:87–110.
Whitfield-Gabrieli S, Thermenos HW, Milanovic S, Tsuang MT,Faraone SV, McCarley RW, Shenton ME, Green AI, Nieto-Cas-tanon A, LaViolette P, Wojcik J, Gabrieli JD, Seidman LJ(2009): Hyperactivity and hyperconnectivity of the default net-work in schizophrenia and in first-degree relatives of personswith schizophrenia. Proc Natl Acad Sci USA 106:1279–1284.
Wolf DH, Gur RC, Valdez JN, Loughead J, Elliott MA, Gur RE,Ragland JD (2007): Alterations of fronto-temporal connectivityduring word encoding in schizophrenia. Psychiatry Res154:221–232.
r Salvador et al. r
r 12 r