ot j075418.7+381225 and ot j230425.8+062546: promising candidates for the period bouncer
TRANSCRIPT

arX
iv:1
409.
0237
v1 [
astr
o-ph
.SR
] 3
1 A
ug 2
014
OT J075418.7+381225 and OT J230425.8+062546:
Promising Candidates for the Period Bouncer
Chikako Nakata,1* Taichi Kato,1 DaisakuNogami,1 Elena Pavlenko,2,1
Tomohito Ohshima,1 Enrique de Miguel,3,4 William Stein,5 Kazuhiko Siokawa,7
Etienne Morelle,6 Hiroshi Itoh,8 Pavol A. Dubovsky,9 Igor Kudzej,9
Hiroyuki Maehara,10 Arne Henden,11 William N. Goff,12 Shawn Dvorak,13
Oksana Antonyuk,2 Eddy Muyllaert,14
1 Department of Astronomy, Kyoto University, Kyoto 606-8502∗[email protected]
2 Crimean Astrophysical Observatory, 98409, Nauchny, Crimea, Ukraine3 Departamento de Fısica Aplicada, Facultad de Ciencias Experimentales, Universidad de Huelva,
21071 Huelva, Spain4 Center for Backyard Astrophysics, Observatorio del CIECEM, Parque Dunar, Matalascanas, 21760
Almonte, Huelva, Spain5 6025 Calle Paraiso, Las Cruces, New Mexico 88012, USA6 9 rue Vasco de GAMA, 59553 Lauwin Planque, France
7 Moriyama 810, Komoro, Nagano 384-00858 VSOLJ, 1001-105 Nishiterakata, Hachioji, Tokyo 192-0153
9 Vihorlat Observatory, Mierova 4, Humenne, Slovakia10Kiso Observatory, Institute of Astronomy, School of Science, The University of Tokyo, 10762-30,
Mitake, Kiso-machi, Kiso-gun, Nagano 397-0101, Japan11 American Association of Variable Star Observers, 49 Bay State Rd., Cambridge, MA 02138, USA
12 13508 Monitor Ln., Sutter Creek, California 95685, USA13 Rolling Hills Observatory, 1643 Nightfall Drive, Clermont, Florida 34711, USA14 Vereniging Voor Sterrenkunde (VVS), Moffelstraat 13 3370 Boutersem, Belgium
(Received 201 0; accepted 201 0)
Abstract
We report on photometric observations of two dwarf novae, OT J075418.7+381225
and OT J230425.8+062546, which underwent superoutburst in 2013 (OT J075418)
and in 2011 (OT J230425). Their mean period of the superhump was 0.0722403(26)
d (OT J074518) and 0.067317(35) d (OT J230425). These objects showed a very
long growing stage of the superhump (stage A) and a large period decrease in stage
A-B transition. The long stage A suggests slow evolution of the superhump due
to very small mass ratios of these objects. The decline rates during the plateau
1

phase in the superoutburst of these objects were lower than those of SU UMa-type
DNe with a similar superhump period. These properties were similar to those of
SSS J122221.7−311523, the best candidate for the period bouncer. Therefore, these
two DNe are regarded as good candidates for the period bouncer. We estimated
the number density of period bouncers roughly from our observations in the recent
five years. There is a possibility that these WZ Sge-type dwarf novae with unusual
outburst properties can account for the missing population of the period bouncer
expected from the evolutionary scenario.
Key words: accretion, accretion disks — stars: novae, cataclysmic variables —
stars: dwarf novae — stars: individual (OT J075418.7+381225) — stars: individual
(OT J230425.8+062546)
1. Introduction
Cataclysmic variables (CVs) are binary star systems composed of a white dwarf (pri-
mary) and a secondary which is typically a late-type main sequence star. The secondary fills its
Roche lobe and matter falls down toward the primary spilling over from the inner lagrangian
point (L1 point).
Dwarf novae (DNe) are one of subtypes of CVs. DNe undergo recurring outbursts. The
outburst lasts for an order of days to weeks, during which their brightness increases by 2 to 5
mag. The outburst results from a release of gravitational energy which is caused by a sudden
increase of the mass accretion rate by the thermal instability in the disk.
SU UMa-type dwarf novae are a subclass of DNe. They have relatively short orbital pe-
riods (1–2 hrs, near to the period minimum) and occasional “superoutbursts” that are brighter
and have longer durations than the normal outbursts. The superhumps are believed to result
from the tidal instability that is triggered when the disk radius reaches the critical radius for
the 3 : 1 resonance (Osaki 1989). WZ Sge-type DNe are a subgroup of SU UMa-type DNe. They
have particularly short orbital periods and show infrequent large-amplitude superoutbursts [for
general properties of WZ Sge-type DNe, see e.g. Bailey (1979); Downes (1990); Kato et al.
(2001)]. During the superoutbursts, superhumps, periodic light variations whose period is a
few percent shorter than the orbital period, are seen. The superhump periods vary through a
course of three stages: the first is the stage A with a longer superhump period, the middle is
the stage B with a systematically varying period, and the final is the stage C with a shorter
superhump period (Kato et al. 2009).
According to the standard evolutionary theory of CVs, the mass transfer from the sec-
ondary starts when the secondary fills its Roche lobe. The orbital period Porb is longer when
a CV is formed and the system evolves with Porb becoming shorter. Once its Porb reaches
2

the period minimum, the secondary becomes oversized for its mass as a result of deviation
from thermal equilibrium or becomes a brown dwarf which cannot maintain in hydrogen burn-
ing. After this point, the system evolves toward longer period and it is usually called “period
bouncer” [see e.g. Knigge et al. (2011) and references there in, for standard evolutionary theory
of CVs].
The study about the period bouncers ought to play a vital role in resolving the problems
about the terminal evolution of CVs, since it is said that Kolb (1993) estimated that 70% of
CVs should have passed the period bounce. The candidates for the period bouncer, however,
have hardly been discovered. One of the reasons is that CVs become much fainter as they
approach the period minimum (Patterson 2011). Littlefair et al. (2006) also gave a great impact
on the problem about the missing population in the CVs. They confirmed the secondary in
the eclipsing short-period CV SDSS 103533.03+055158.4 was a brown dwarf, which suggests
that the system is the period bouncer. Recently, Littlefair et al. (2008) discovered more three
systems which have a brown dwarf secondary with high-speed three-color photometry. In
photometric research in the period bouncers, until recently, WZ Sge-type DNe with multiple
rebrightenings such as EG Cnc have been considered to be a good candidate for the period
bouncer (Patterson et al. 1998). Recently, Kato, Osaki (2013) succeeded in interpreting the
variation of the superhump period around the stage A and developed a new dynamical method
to estimate the binary mass ratios (q≡M2/M1) only from the stage A superhump observations
and the orbital period. Using this new method, it become evident that many of WZ Sge-
type DNe with multiple rebrightenings do not likely have low mass ratios as estimated in EG
Cnc (Nakata et al. 2013). After this suggestion, a new candidate for the period bouncer was
discovered; Kato et al. (2013b) reported SSS J122221.7−311523 (hereafter SSS J122221), a
transient discovered by Catalina Real-time Transient Survey (CRTS, Drake et al. 2009) Siding
Spring Survey (SSS), had a very small mass ratio q = 0.045 and long orbital period [possible
period of 0.075879(1) d]. They also revealed a characteristic property of SSS J122221 that stage
A superhumps lasted for long time.
In this paper, we present two DNe which are similar in some properties to SSS J122221.
OT J075418.7+381225 (hereafter OT J075418) was detected by CRTS as CSS 130131 on 2013
January 31. The quiescent counterpart was g=22.8 mag SDSS J075418.72+381225.2. The
observed superhumps with a period of 0.07 d were suggestive of an SU UMa-type dwarf nova
(vsnet-alert 15355). OT J230425.8+062546 (hereafter OT J230425) was originally reported as
a possible nova discovered by Hideo Nishimura on 2010 December 29 at 13.7 mag (Nakano et al.
2011). The quiescent counterpart was g=21.1 mag SDSS J230425.88+062545.6. After this, it
was suggested to be a dwarf nova on the basis of the color of the SDSS counterpart (vsnet-alert
12548). Subsequent observations detected the presence of superhumps with an amplitude of
0.06 mag (A. Arai, vsnet-alert 12563). Although observations and analysis of OT J230425 were
already reported as a summary form in Kato et al. (2012), we present a new interpretation of
3

this object in this paper.
This paper is structured as follows. Section 2 briefly shows a log of observations and our
analysis method. Sections 3 and 4 deal with the results of the observations of OT J075418 and
OT J230425, respectively. Section 5 discusses the results.
2. Observation and Analysis
Tables 2 and 3 show the logs of photometric observations. All the observation times were
written in barycentric Julian days (BJDs). To correct zero-point of data differences between
different observers, we added a constant to each observer’s data.
The phase dispersion minimization (PDM) method (Stellingwerf 1978) was used in a
period analysis. In subtracting the global trend of the light curve, we subtracted smoothed
light curve obtained by locally-weighted polynomial regression (LOWESS, Cleveland 1979)
before making the PDM analysis. The 1-σ error of the best estimated period by the PDM
analysis was determined by the methods in Fernie (1989), Kato et al. (2010).
A variety of bootstrapping was used to estimating the robustness of the result of PDM.
We analyzed about 100 samples which randomly contain 50% of observations, and performed
PDM analysis for these samples. The result of bootstrap is displayed as a form of 90% confidence
intervals in the resultant θ statistics.
3. OT J075418.7+381225
3.1. Overall Light Curve
Figure 1 shows the overall light curve of OT J075418. After a precursor outburst (marked
with an arrow in figure 1), the superoutburst started on BJD 2456326. The early rise was well
observed during BJD 2456326–2456327. The superoutburst lasted with a slow decline for at
least 30 d. In the middle part of the superoutburst (BJD 2456341–2456345), there were no
observations. On BJD 2456346, observations were resumed and they showed a small rise of
brightness. On BJD 2456352, there was a rapid brightening. This phenomenon was confirmed
by using different comparison stars. It may have been an interesting phenomenon that we could
not explain theoretically. It, however, may have been an artifact, since the observing condition
was very bad due to clouds and the moon.
3.2. Superhumps
Figure 2 shows that a period analysis using the Phase Dispersion Minimization (PDM)
method (Stellingwerf 1978) indicated the presence of a period of 0.072218(3) d during stage
A (BJD 2456328–2456341) and 0.070758(6) d during stage B (BJD 2456345–2456355). The
mean profile of stage A and stage B superhumps are also shown in lower part of figure 2. The
amplitude of the superhumps during stage B is larger than that during stage A.
4

56325 56330 56335 56340 56345 56350 5635516.5
16.0
15.5
15.0
Fig. 1. Overall light curve of OT J075418. The data were binned to 0.01 d. The arrow indicates the
precursor.
0.070 0.071 0.072 0.073 0.074
0.7
0.8
0.9
1.0
θ
P=0.07222
−0.5 0.0 0.5 1.0 1.50.04
0.02
0.00
−0.02
−0.04
0.070 0.071 0.072 0.073 0.074
0.7
0.8
0.9
1.0
θ
P=0.07076
−0.5 0.0 0.5 1.0 1.50.04
0.02
0.00
−0.02
−0.04
Fig. 2. Superhumps in OT J075418 (BJD 2456328–2456358). (Left upper): θ diagram of our PDM analy-
sis of stage A superhumps (BJD 2456328–2456341). (Left lower): Phase-averaged profile of stage A super-
humps. (Right upper): θ diagram of our PDM analysis of stage B superhumps (BJD 2456345–2456355).
(Right lower): Phase-averaged profile of stage B superhumps.
5

−0.5 0.0 0.5 1.0 1.50.8
0.6
0.4
0.2
0.0
28
29
30
31
32
33
34
37
38
(BJD−2456300)
−0.5 0.0 0.5 1.0 1.5
1.0
0.5
0.0
39
40
41
46
47
48
49
50
(BJD−2456300)
−0.5 0.0 0.5 1.0 1.5
1.5
1.0
0.5
0.0
51
52
53
54
55
56
57
58
(BJD−2456300)
Fig. 3. Nightly variation of the profile of superhumps in OT J075418.
Figure 3 shows the nightly variation of the profile of superhumps. The amplitude of
superhumps was 0.03–0.06 mag, smaller than in typical SU UMa-type DNe.
We determined the times of maxima of ordinary superhumps as in the way described in
Kato et al. (2009). The resultant times are listed in table 4.
The O−C curve of OT J075418 is shown in figure 4. The very long stage A (30≤E≤220)
and stage B (E ≥ 280) are seen. Although the data when the stage A-B transition took place
cannot be estimated precisely because of lack of observations, it occurred between BJD 2456342
and 2456346. In the stage A, superhumps with a mean period of Psh =0.0722179(32) d and the
time derivative of the superhump period Pdot (= P /P ) =+3.6(0.7)×10−5 s/s were recorded. In
the stage B, superhumps with a mean period of 0.0707581(58) d and Pdot of −2.4(0.5)× 10−5
s/s were recorded.
3.3. Two-dimensional Lasso Analysis
The least absolute shrinkage and selection operator (Lasso) method was introduced by
Kato, Uemura (2012). This method has been proven to be very effective in separating closely
spaced periods and has extended to two-dimentional power spectra (Osaki, Kato 2013; Kato,
Maehara 2013).
A two-dimensional Lasso analysis of OT J075418 data is shown in figure 5. A major
change of frequency from ∼ 13.85 c/d to ∼ 14.1 c/d can be seen between BJD 2456341 and
2456345. It suggests that change coincided with the timing when the stage A-B transition
occurred. During the stage A (BJD 2456328–2456341), the frequency become lower. In contrast,
it shows a tendency to become higher in the stage B (BJD 2456345–2456355).
6

0 50 100 150 200 250 300 350 400 450
−0.05
0.00
0.05
56325 56330 56335 56340 56345 56350 56355
16.5
16.0
15.5
15.0
14.5
Fig. 4. (Upper:) The O−C curve of OT J075418. A ephemeris of BJD 2456325.4414 + 0.0716368E was
used to draw this figure. (Lower:) Overall light curve, the same as in figure 1. The horizontal axis in units
of BJD and the cycle number is common in both of upper and lower panels.
4. OT J230425.8+062546
4.1. Overall light curve
Figure 6 shows the overall light curve of OT J230425. This object was discovered
on December 29 in 2011 (BJD 2455559) with the recorded possible maximum brightness of
V = 13.72. The early rise was missed. The superoutburst lasted for about 25 d. The light
curve showed a slow decline until BJD 2455575. After BJD 2455578, it declined faster.
4.2. Superhumps
During BJD 2455563–2455585, superhumps with amplitudes of 0.03–0.07 mag were
present. A period analysis using all the data indicated that the mean superhump period was
0.067317(35) d. The PDM analysis of all superhumps was shown in Kato et al. (2012).
A period analysis indicated a change of the period from 0.067245(17) d during stage
A (BJD 2455563–2455572) to 0.066351(12) d during stage B (BJD 2455571–2455585) (figure
7). The mean profile of stage A and stage B superhumps are also shown in the lower panels
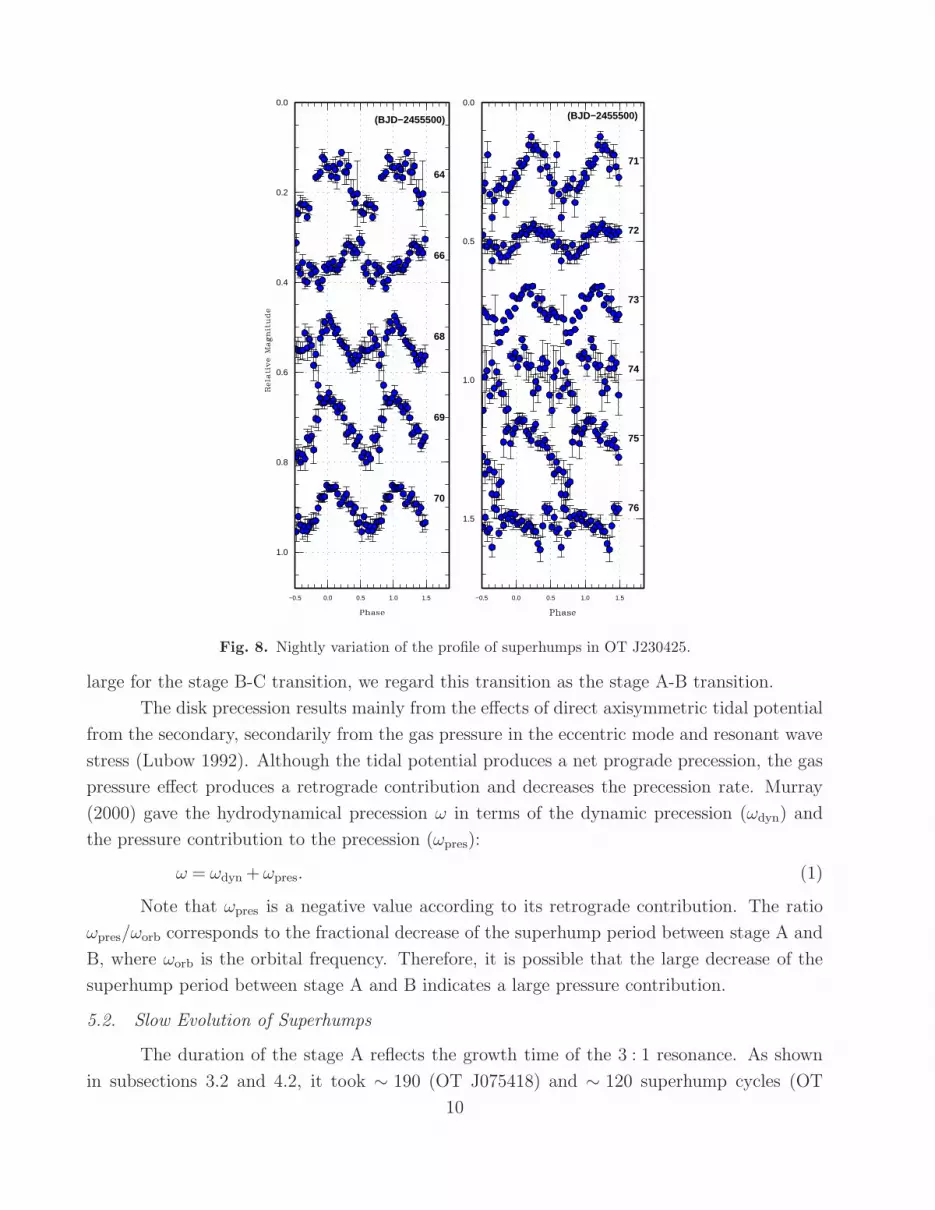
of figure 7. Figure 8 shows the nightly variation of the profile of superhumps. The maximum
amplitude of superhumps was seen around BJD 2455571.
Displayed in top right panel of figure 7, there was a possible period which is shorter than
the indicated period 0.066351(12) d. It was suggested that the period was a possible orbital
period of 0.06589(1) d. Assuming 0.06589(1) d to be the orbital period, the new method using
7

Fig. 5. Two-dimensional Lasso period analysis of OT J075418. (Upper:) Overall light curve binned to
0.01 d, the same as figure 1. (Lower:) Result of two-dimensional Lasso analysis (5 d window, 0.5 d shift
and logλ=−8.5). The appearance of the stage A and stage B frequency is boxed.
55560 55565 55570 55575 55580 5558516
15
14
13
Fig. 6. Overall light curve of OT J230425. The data were binned to 0.01 d. The arrow indicates the
discovery of the superoutburst (Nakano et al. 2011).
8

0.064 0.065 0.066 0.067 0.068 0.069 0.070
0.85
0.90
0.95
1.00
θ
P=0.06725
−0.5 0.0 0.5 1.0 1.5
0.05
0.00
−0.05
0.064 0.065 0.066 0.067 0.068 0.069 0.070
0.96
0.98
1.00
θ
P=0.06635
−0.5 0.0 0.5 1.0 1.5
0.05
0.00
−0.05
Fig. 7. Superhumps in OT J230425 (BJD 2455563–2455585). (Left upper): θ diagram of our PDM analy-
sis of stage A superhumps (BJD 2455563–2455572). (Left lower): Phase-averaged profile of stage A super-
humps. (Right upper): θ diagram of our PDM analysis of stage B superhumps (BJD 2455571–2455585).
(Right lower): Phase-averaged profile of stage B superhumps.
stage A superhumps (Kato, Osaki 2013) implies q = 0.053(1). It suggests that OT J230425 is
a good candidate for the period bouncer.
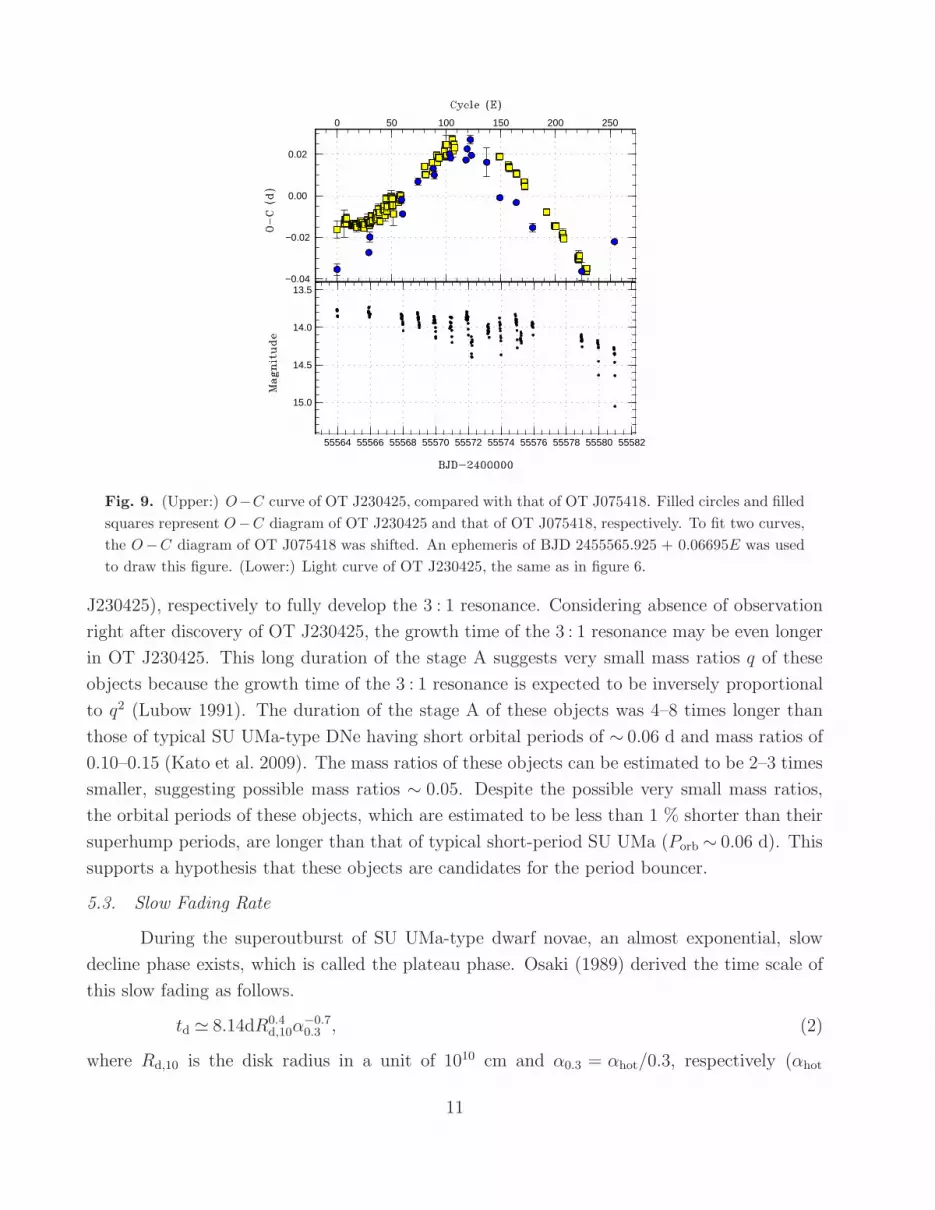
Figure 9 exhibits an O−C curve of OT J230425 (filled circles), compared with O−C
curve of OT J075418 exhibited in figure 4 (filled squares). The resultant times of OT J230425
are listed in table 5. The O−C curve of OT J230425 is very similar to that of OT J075418.
The very long stage A (E≤ 123) and the subsequent stage B (E≥ 118) are seen. The stage A-B
transition occurred around BJD 2455572. The periods of superhumps in stage A and stage B
were 0.067194(30) d and 0.066281(63) d, respectively. The Pdot in stage B was −3.9(2.4)×10−5
s/s.
5. Discussion
5.1. Decrease of Superhump Period between Stage A and B
The O−C curves of OT J075418 and OT J230425 (figures 4 and 9) suggest a very long
stage of increasing O−C values (or a long period) and certain stage transition in the middle of
the superoutbursts. Kato et al. (2009) argued that the superhump period usually decreases by
1.0–1.5% at the stage A-B transition and by ∼ 0.5% at the stage B-C transition. The fractional
period decrease at the transition was ∼ 2.0% in OT J075418 and ∼ 1.4% in OT J230425. This
large variation in frequency of OT J075418 can be clearly seen in figure 5. Since they were too
9
−0.5 0.0 0.5 1.0 1.5
1.0
0.8
0.6
0.4
0.2
0.0
64
66
68
69
70
(BJD−2455500)
−0.5 0.0 0.5 1.0 1.5
1.5
1.0
0.5
0.0
71
72
73
74
75
76
(BJD−2455500)
Fig. 8. Nightly variation of the profile of superhumps in OT J230425.
large for the stage B-C transition, we regard this transition as the stage A-B transition.
The disk precession results mainly from the effects of direct axisymmetric tidal potential
from the secondary, secondarily from the gas pressure in the eccentric mode and resonant wave
stress (Lubow 1992). Although the tidal potential produces a net prograde precession, the gas
pressure effect produces a retrograde contribution and decreases the precession rate. Murray
(2000) gave the hydrodynamical precession ω in terms of the dynamic precession (ωdyn) and
the pressure contribution to the precession (ωpres):
ω = ωdyn +ωpres. (1)
Note that ωpres is a negative value according to its retrograde contribution. The ratio
ωpres/ωorb corresponds to the fractional decrease of the superhump period between stage A and
B, where ωorb is the orbital frequency. Therefore, it is possible that the large decrease of the
superhump period between stage A and B indicates a large pressure contribution.
5.2. Slow Evolution of Superhumps
The duration of the stage A reflects the growth time of the 3 : 1 resonance. As shown
in subsections 3.2 and 4.2, it took ∼ 190 (OT J075418) and ∼ 120 superhump cycles (OT
10
0 50 100 150 200 250
−0.04
−0.02
0.00
0.02
55564 55566 55568 55570 55572 55574 55576 55578 55580 55582
15.0
14.5
14.0
13.5
Fig. 9. (Upper:) O−C curve of OT J230425, compared with that of OT J075418. Filled circles and filled
squares represent O−C diagram of OT J230425 and that of OT J075418, respectively. To fit two curves,
the O−C diagram of OT J075418 was shifted. An ephemeris of BJD 2455565.925 + 0.06695E was used
to draw this figure. (Lower:) Light curve of OT J230425, the same as in figure 6.
J230425), respectively to fully develop the 3 : 1 resonance. Considering absence of observation
right after discovery of OT J230425, the growth time of the 3 : 1 resonance may be even longer
in OT J230425. This long duration of the stage A suggests very small mass ratios q of these
objects because the growth time of the 3 : 1 resonance is expected to be inversely proportional
to q2 (Lubow 1991). The duration of the stage A of these objects was 4–8 times longer than
those of typical SU UMa-type DNe having short orbital periods of ∼ 0.06 d and mass ratios of
0.10–0.15 (Kato et al. 2009). The mass ratios of these objects can be estimated to be 2–3 times
smaller, suggesting possible mass ratios ∼ 0.05. Despite the possible very small mass ratios,
the orbital periods of these objects, which are estimated to be less than 1 % shorter than their
superhump periods, are longer than that of typical short-period SU UMa (Porb ∼ 0.06 d). This
supports a hypothesis that these objects are candidates for the period bouncer.
5.3. Slow Fading Rate
During the superoutburst of SU UMa-type dwarf novae, an almost exponential, slow
decline phase exists, which is called the plateau phase. Osaki (1989) derived the time scale of
this slow fading as follows.
td ≃ 8.14dR0.4d,10α
−0.70.3 , (2)
where Rd,10 is the disk radius in a unit of 1010 cm and α0.3 = αhot/0.3, respectively (αhot
11

represents the disk viscosity in the hot state). Kato et al. (2014a) suggested that αhot in
candidates for the period bouncer that show slow fading rate is probably smaller than in
higher-q systems. In addition to this, the radius of the 3 : 1 resonance can be formulated in
terms of q:
r3:1 = 3(−2/3)(1+ q)−1/3. (3)
A small q, thus, produces a large radius of the 3 : 1 resonance and a large disk radius.
But the contribution by a small q is smaller than that by a small αhot, since equation 2 shows
the dependence of td to q is larger than that of α.
The fading rates of OT J075418 and OT J230425 were 0.0189(3) mag d−1 and 0.0340(4)
mag d−1, respectively. Figure 10 shows the relation between the superhump period in the stage
B (Porb) and the fading rate of SU UMa-type DNe (filled circles), WZ Sge-type DNe (filled tri-
angles) and possible candidates for the period bouncer including OT J075418 and OT J230425
(filled stars). SSS J122221 (J122221 in figure 10) was reported as a perfect candidate for the pe-
riod bouncer (Kato et al. 2013b). Kato et al. (2013b) also suggests that OT J184228.1+483742
(J184228 in figure 10) showing double superoutburst is a good candidate for the period bouncer.
According to figure 10, the fading rates of OT J075418 and OT J230418 are lower than those
of SU UMa-type DNe with similar periods. Furthermore, the location of these objects is close
to that of the good candidates for previously suggested the period bouncer. This strengthens
the interpretation that these objects are good candidates for the period bouncer.
There are two objects near these candidates for the period bouncer in figure 10. One of
them is BC Dor, which went through superoutburst in 2003, and another is PV Per detected
its superoutburst in 2008. Their last superoutbursts were reported in Kato et al. (2009). Since
they had relatively frequent outbursts, we considered them not to be candidates for the period
bouncer. They were inside a range of the period bouncer in error in figure 10 due to the data
of poor quality.
5.4. Absence of Early Superhumps
OT J184228, a likely candidate for the period bouncer, showed double superoutburst
consisting of the first one with early superhumps and another one with ordinary superhumps
(Kato et al. 2013b). SSS J122221 also showed the similar pattern of the superoutburst.
OT J075418 and OT J230425, however, showed no early superhumps. Early superhumps,
as mentioned in section 1, arise when the disk radius reaches the 2:1 resonance radius due to its
low q. And they cannot be detected in a system with a low inclination (e.g. GW Lib reported
by Hiroi et al. 2009), since the origin of early superhumps is the emission of a disk surface
that has a non-axisymmetric vertical structure (Nogami et al. 1997; Kato 2002). The absence
of the stage of early superhumps may indicate that the radius of the 2:1 resonance was not
reached in these objects. Although this generally does not support their low q, we expect OT
J075418 and OT J230425 to have low q because of other strong evidence that we discussed
12

0.05 0.06 0.07 0.08 0.09 0.10
0.05
0.10
0.15
J230425
J075418
J122221
J184228
Fig. 10. Fading rate versus superhump period in the stage B. The data are from Kato et al. (2014a).
The filled circles and the filled triangles represent SU UMa-type DNe and WZ Sge-type DNe, respectively.
The filled stars represent the candidates for the period bouncer, including OT J075418 and OT J230425.
above. Furthermore, it has been reported that a system with corroborated low q did not show
early superhumps (Kato et al. 2014b). It was considered that its superoutburst triggered by
an inside-out (slowly rising) outburst made it impossible to establish the 2 : 1 resonance.
5.5. Existence of a Precursor in OT J075418
In OT J075418, a precursor preceding the superoutburst was detected (BJD 2456325).
This is rare in WZ Sge-type DNe, which hardly show a normal outburst.
Osaki, Meyer (2003) suggested that, in a superoutburst with a precursor the disk radius
does not reach the tidal truncation radius, which is the maximum radius larger than the 3 : 1
resonance, while the disk radius reaches the tidal truncation radius in a superoutburst without
a precursor. It is thought that the system in a precursor fades rapidly as in a normal outburst,
since its accretion disk does not reach the tidal truncation radius and the disk allows the cooling
wave to propagate inward. During this fading, if the disk becomes sufficient eccentric, the tidal
dissipation from the secondary brings the disk to the hot state. Then, it is observed as a
superoutburst with a precursor. As mentioned in subsection 5.3, however, OT J075418 faded
very slowly. Similarly, 1RXS J053234+624755 has a very small mass ratio 0.074(19) and showed
a superoutburst with a precursor (Kapusta, Thorstensen 2006; Imada et al. 2009). Following
Imada et al. (2009), we suggest that the radius of the accretion disk of OT J075418 should be
far beyond the 3 : 1 resonance, but not reach the tidal truncation radius, if a mass ratio of a
system is small enough to make a sufficient space between the 3 : 1 resonance and the tidal
truncation radius.
As can be seen in the lightcurve, it took relatively a long time from fading of a precursor
outburst to appearance of a superoutburst. It may be due to a long growth time of the 3 : 1
13

resonance because of its small mass ratio.
5.6. Number Density Problem of Period Bouncers
Now, we know four candidates for the period bouncer (J075418, SSS J122221, OT
J230425 and OT J184228). To investigate whether our observation is able to account for
the missing population of period bouncers expected in the evolutionary theory, we counted
how many superoutbursts of SU UMa stars were observed. In the recent five years, when the
current project to observe SU UMa-type stars was undertaken in the same way as now, we
have observed about 291 superoutbursts in 248 SU UMa-type stars (Kato et al. 2010; Kato
et al. 2012; Kato et al. 2013a; Kato et al. 2014a). The number of detected superoutbursts is
unknown1.
The recurrence time of the superoutbursts Ts is inversely proportional to mass-transfer
rate M (Osaki 1995) and M is approximately proportional to q2 in a short-period system
evolving by gravitational radiation (Patterson 1998). We can estimate the parent population
of the period bouncers from the statistics of recorded outbursts. Since many of SU UMa-type
DNe have Ts ∼ 1 yr, we can assume many of them have been detected in a superoutburst in the
last five years. If the period bouncers have recurrence time of Ts(PB), the detection probability
of period bouncers can be estimated to be 5/Ts(PB)× f , where f stands for fraction of time
covered by surveys. If we conservatively assume f ∼ 0.1–0.5, we can thus estimate the ratio of
parent populations of N(PB)/N(ordinary SU UMa-type)∼ 4/248× 1/f ×Ts(PB)/5.
There is large uncertainly in Ts(PB). We can, however, estimate Ts(PB) > 5 yr, since
these objects were hardly detected in outbursts in the past CRTS and other surveys.2 As to
OT J230425, two outbursts have been detected by CRTS. One outburst was in 2006 December
and the other was in 2011 January. It suggests that the recurrence time of the outbursts of
OT J230425 is not as long as that of WZ Sge-type DNe. Therefore, it is possible that some
candidates for the period bouncer have higher mass-transfer rate than we expected and go
through outbursts more frequent than WZ Sge-type DNe. Three of the four candidates for the
period bouncer are, however, WZ Sge-like stars. We assume that majority of the candidates for
the period bouncer are WZ Sge-like stars and discuss the number density of period bouncers
excluding the systems like OT J230425. We regard N(PB)=3 hereafter, excluding OT J230425.
If we assume that the mass-transfer is purely driven by the gravitational wave radiation,
M(PB)∼ 10−2M(ordinary SU UMa-type) and Ts(PB) is expected to be ∼ 102 yr. If we assume
Ts(PB) is ∼ 101 and ∼ 102 yr and conservatively assume f ∼ 0.1–0.5, we can obtain roughly
N(PB)/N(SU UMa) ∼ 0.24–12. Considering the possibility of the period bouncers like OT
1 There were systems that were detected its superoutburst but were not made time-series observations.
2 Although typical intervals of observations in CRTS is 10 d, and there is a seasonal gap when the object is near
the solar conjunction, we consider many (fraction f) of superoutburst should have been recorded since WZ
Sge-type DNe usually show long-fading tails lasting several months. No previous outbursts in four systems
suggest that Ts for these systems are efficiently long.
14

J230425, the population of the period bouncers can be estimated to be larger. As mentioned
in section 1, it was predicted that the majority of CVs (∼ 70% by Kolb 1993) have passed the
period bounce. On the contrary, few candidate for the period bouncer has been discovered by
observations. We call theoretically predicted population of the period bouncer “the missing
population” of the period bouncer. Although the true recurrence time of candidates for the
period bouncer should be confirmed by future observations, this ratio suggests a possibility that
the period bouncers we have identified can account for the missing population of the period
bouncers expected from the evolutionary scenario. We thus identify these WZ Sge-type objects
with unusual outburst properties are the good candidates for the hidden population of the
terminal evolution of CVs.
Although we discussed photometric properties of the candidates for the period bouncer,
Gansicke et al. (2009) suggested their spectroscopic properties. They argued that SDSS CVs
in the 80–86 min period spike showed spectra dominated by emission from the WD with no
spectroscopic signature from the companion star at optical wavelengths. These characteristics
suggest that these systems have very low accretion rates, and they are most likely DNe with
extremely long recurrence time. It takes long time to detect many candidates for the period
bouncer in photometric observations on account of their long recurrence time. Spectroscopic
studies of the newly identified four candidates are desired.
6. Summary
We report on photometric observations of two dwarf novae, OT J075418.7+381225 and
OT J230425.8+062546, which underwent superoutbursts in 2013 (OT J075418) and in 2011
(OT J230425). The results of the analysis of our data are summarized in table 1.
In OT J075418 and OT J230425, some peculiar properties that were similar to those of
a good candidate for the period bouncer (SSS J122221.7−311523) could be seen. These two
DNe are good candidates for the period bouncer. We then propose the general properties of
candidates for the period bouncer as below:
• They show a very long growing stage of superhumps (stage A) and a large period decrease
of the stage A-B transition (∼ 1.5%). The long stage A, which reflects the slow evolution
of the superhump, is due to the very small mass ratios of these objects.
• The decline rates in the plateau phase in the superoutburst of these objects are lower than
those of SU UMa-type DNe with the similar superhump period to these objects.
To investigate whether our observation is able to account for the missing population
of the period bouncers expected in the evolutionary theory, we counted how many SU UMa
stars went through superoutbursts. In the recent five years, we have observed about 291
superoutbursts in 248 SU UMa-type stars and four good candidates for the period bouncer have
been suggested, including OT J075418 and OT J230425. Three of four candidates were WZ Sge-
15

Table 1. The result of the analysis of OT J075418 and OT J230425.
OT J075418 OT J230425
mean period∗ 0.0722403(26) 0.067317(35)
stage A† 0.072218(3) 0.067245(17)
(56328–56341) (55563–55572)
stage B‡ 0.070758(6) 0.066351(12)
(56345–56355) (55571–55585)
fading rate§ 0.0189(3) 0.0340(4)
∗Mean period of the all superhumps. Unit d.
†Stage A superhump period. Unit d.
The intervals used to determine the periods are given
in the parentheses. BJD−2400000.
‡Stage B superhump period. Unit d.
The intervals used to determine the periods are given
in the parentheses. BJD−2400000.
§Unit mag d−1.
like stars, and OT J230425 may have shorter recurrence time than the others. We estimated the
number density of the period bouncers, excluding the systems like OT J230425. Although there
is large uncertainty in the recurrence time of the period bouncers, we assumed superoutbursts
of the period bouncers were 101–102 times more infrequent than those of ordinary SU UMa-type
DNe, according to the theoretical prediction. Under this assumption, we can obtain roughly
N(PB)/N(SU UMa)∼ 0.24–12. This ratio suggests a probability that the period bouncers we
have identified can account for the missing population of the period bouncers expected from
the evolutionary scenario.
This work was supported by the Grant-in-Aid Initiative for High-Dimensional Data-
Driven Science through Deepening of Sparse Modeling from the Ministry of Education, Culture,
Sports, Science and Technology (MEXT) of Japan. We are grateful to many amateur observers
for providing a lot of data used in this research.
References
Bailey, J. 1979, MNRAS, 189, 41P
Cleveland, W. S. 1979, J. Amer. Statist. Assoc., 74, 829
Downes, R. A. 1990, AJ, 99, 339
Drake, A. J., et al. 2009, ApJ, 696, 870
Fernie, J. D. 1989, PASP, 101, 225
Gansicke, B. T., et al. 2009, MNRAS, 397, 2170
16

Table 2. Log of observations of OT J075418.
Start∗ End∗ mag† error‡ N § obs‖ sys#
25.2913 25.4934 15.947 0.003 229 deM C
26.2986 26.6882 16.191 0.010 489 deM C
27.2431 27.6752 15.120 0.003 433 MEV C
27.2980 27.6668 14.983 0.003 460 deM C
27.6840 27.9237 14.944 0.003 286 GFB C
28.2990 28.6527 14.923 0.001 441 deM C
28.5383 28.7812 14.988 0.002 290 DKS C
28.7016 28.9420 14.884 0.001 585 SWI V
29.2968 29.6605 14.969 0.001 514 deM C
29.6677 29.8488 15.019 0.002 200 GFB C
29.7057 29.9564 14.881 0.001 609 SWI V
30.2980 30.6371 15.005 0.001 500 deM C
30.7285 30.9638 14.909 0.001 572 SWI V
31.3028 31.6423 15.050 0.001 502 deM C
31.7016 31.9142 14.968 0.001 364 SWI V
32.3015 32.6886 15.105 0.001 608 deM C
32.3054 32.6595 15.138 0.001 355 MEV C
33.3011 33.6583 15.175 0.001 354 MEV C
36.5681 36.5681 15.180 – 1 MUY C
36.6996 36.9058 1.169 0.001 353 SWI C
36.6996 36.9058 15.198 0.001 353 SWI V
37.6966 37.8978 1.166 0.001 345 SWI C
38.3036 38.6830 15.270 0.001 468 CDZ C
39.3021 39.5805 15.299 0.002 308 CDZ C
39.3564 39.6420 15.347 0.001 256 MEV C
∗BJD−2456300.
†Mean magnitude.
‡1-σ of the mean magnitude.
§Number of observations.
‖Observer’s code. deM (E. de Miguel), MEV (E. Morelle),
GFB (W. Goff), DKS (S. Dvorak), SWI (W. Stein),
MUY (E. Muyllaert), CDZ (AAVSO data),
DPV (P. Dubovsky)
#Filter. “C” means no filter (clear).
17

Table 2. Log of observations of OT J075418 (continued).
Start∗ End∗ mag† error‡ N § obs‖ sys#
40.3004 40.6396 15.386 0.002 251 MEV C
40.3940 40.6534 15.346 0.002 293 CDZ C
46.3199 46.4654 15.350 0.003 148 MEV C
47.4372 47.6331 15.362 0.002 207 deM C
48.4312 48.6151 15.415 0.002 232 deM C
49.4269 49.6170 15.449 0.003 212 deM C
50.4413 50.5910 15.499 0.002 182 deM C
52.2781 52.5203 2.233 0.005 281 DPV C
53.3085 53.5875 15.658 0.002 354 deM C
54.2581 54.4964 2.554 0.003 300 DPV C
54.3650 54.6011 15.740 0.002 184 MEV C
56.2530 56.5597 2.655 0.002 386 DPV C
57.2314 57.5306 2.781 0.002 360 DPV C
∗BJD−2456300.
†Mean magnitude.
‡1-σ of the mean magnitude.
§Number of observations.
‖Observer’s code. deM (E. de Miguel), MEV (E. Morelle),
GFB (W. Goff), DKS (S. Dvorak), SWI (W. Stein),
MUY (E. Muyllaert), CDZ (AAVSO data),
DPV (P. Dubovsky)
#Filter. “C” means no filter (clear).
Hiroi, K., et al. 2009, PASJ, 61, 697
Imada, A., et al. 2009, PASJ, 61, L17
Kapusta, A. B., & Thorstensen, J. R. 2006, PASP, 118, 1119
Kato, T. 2002, PASJ, 54, L11
Kato, T., et al. 2013a, PASJ, 65, 23
Kato, T., et al. 2014a, PASJ, 66, 30
Kato, T., et al. 2009, PASJ, 61, S395
Kato, T., & Maehara, H. 2013, PASJ, 65, 76
Kato, T., et al. 2012, PASJ, 64, 21
Kato, T., et al. 2010, PASJ, 62, 1525
Kato, T., Monard, B., Hambsch, F.-J., Kiyota, S., & Maehara, H. 2013b, PASJ, 65, L11
Kato, T., et al. 2014b, PASJ, in press (arXiv/1407.4196)
Kato, T., & Osaki, Y. 2013, PASJ, 65, 115
Kato, T., Sekine, Y., & Hirata, R. 2001, PASJ, 53, 1191
18

Table 3. Log of observations of OT J230425.
Start∗ End∗ mag† error‡ N § obs‖ sys#
63.9532 64.0147 13.775 0.005 130 Siz C
65.8770 65.9577 14.149 0.004 146 Mhh C
65.8827 65.9319 13.683 0.005 107 Ioh C
65.8902 66.0023 13.783 0.002 224 Siz C
67.8853 68.0198 13.871 0.005 264 Siz C
68.8860 69.0162 13.876 0.004 259 Siz C
68.9449 69.0041 13.887 0.008 132 Ioh C
68.9769 68.9841 14.259 0.019 16 Mhh C
69.8702 70.0000 13.879 0.006 280 Ioh C
69.8802 69.9934 14.217 0.004 424 Mhh C
69.8892 70.0194 13.918 0.007 231 Siz C
70.8707 71.0046 13.908 0.007 268 Ioh C
71.8613 71.9994 13.851 0.005 292 Ioh C
71.8624 72.0124 13.848 0.006 299 Siz C
72.1643 72.2480 14.044 0.022 29 CRI C
73.1712 73.2678 13.813 0.008 47 CRI C
73.9053 73.9859 14.018 0.016 132 Ioh C
73.9302 74.0088 14.028 0.016 120 Siz C
74.8823 74.9998 13.951 0.009 236 Siz C
75.1832 75.2627 13.920 0.012 26 CRI C
75.8838 75.9353 14.272 0.009 182 Mhh C
75.9042 75.9720 13.962 0.006 134 Siz C
78.8920 78.9520 14.094 0.007 122 Siz C
78.9242 78.9722 14.508 0.008 182 Mhh C
79.9057 79.9786 14.275 0.015 120 Siz C
80.8940 80.9777 14.449 0.022 166 Siz C
80.9083 80.9452 14.588 0.009 136 Mhh C
83.8728 83.9645 14.549 0.016 158 Ioh C
86.9111 86.9111 17.401 – 1 Siz C
∗BJD−2455500.
†Mean magnitude.
‡1-σ of the mean magnitude.
§Number of observations.
‖Observer’s code. Siz (K. Shiokawa), Mhh (H. Maehara),
Ioh (H. Itoh), CRI (Crimean Astrophys. Obs.)
#Filter. “C” means no filter (clear).19

Table 4. Times of superhump maxima in OT J075418.
E max∗ error O−C† N ‡
0 56325.4119 0.0040 −0.0295 65
13 56326.3502 0.0065 −0.0224 72
14 56326.4264 0.0018 −0.0179 73
15 56326.4975 0.0013 −0.0184 71
16 56326.5656 0.0019 −0.0219 72
17 56326.6432 0.0020 −0.0160 74
26 56327.2791 0.0005 −0.0249 64
27 56327.3527 0.0005 −0.0229 136
28 56327.4234 0.0004 −0.0238 138
29 56327.4965 0.0008 −0.0224 125
30 56327.5678 0.0004 −0.0227 106
31 56327.6370 0.0005 −0.0251 139
32 56327.7092 0.0004 −0.0246 62
33 56327.7832 0.0010 −0.0222 64
34 56327.8537 0.0007 −0.0233 71
35 56327.9219 0.0023 −0.0268 44
41 56328.3564 0.0007 −0.0221 73
42 56328.4308 0.0007 −0.0193 73
43 56328.4955 0.0009 −0.0263 71
44 56328.5700 0.0008 −0.0234 138
45 56328.6443 0.0011 −0.0208 123
46 56328.7130 0.0010 −0.0236 157
47 56328.7840 0.0005 −0.0243 178
48 56328.8524 0.0006 −0.0275 141
49 56328.9284 0.0010 −0.0232 115
55 56329.3637 0.0029 −0.0177 87
56 56329.4315 0.0012 −0.0216 83
57 56329.5031 0.0023 −0.0215 82
58 56329.5719 0.0013 −0.0244 83
59 56329.6463 0.0016 −0.0216 61
60 56329.7189 0.0007 −0.0207 158
∗BJD−2400000.
†C = 2456325.4414 + 0.0716368E.
‡Number of points used to determine the maximum.
20

Table 4. Times of superhump maxima in OT J075418 (continued).
E max∗ error O−C† N ‡
61 56329.7986 0.0014 −0.0126 198
62 56329.8692 0.0013 −0.0137 157
63 56329.9355 0.0017 −0.0190 133
69 56330.3692 0.0015 −0.0151 85
70 56330.4385 0.0011 −0.0174 84
71 56330.5183 0.0014 −0.0092 86
72 56330.5836 0.0010 −0.0156 89
74 56330.7380 0.0024 −0.0045 78
75 56330.8028 0.0009 −0.0113 140
76 56330.8767 0.0007 −0.0091 141
77 56330.9376 0.0011 −0.0198 141
83 56331.3822 0.0019 −0.0050 80
84 56331.4572 0.0011 −0.0017 77
85 56331.5234 0.0014 −0.0071 95
86 56331.5895 0.0028 −0.0126 94
88 56331.7528 0.0020 0.0074 99
89 56331.8094 0.0018 −0.0077 99
90 56331.8869 0.0022 −0.0018 99
97 56332.4002 0.0027 0.0100 158
98 56332.4612 0.0018 −0.0006 145
99 56332.5408 0.0021 0.0074 154
100 56332.6046 0.0018 −0.0004 152
101 56332.6660 0.0058 −0.0107 127
110 56333.3244 0.0012 0.0030 45
111 56333.3999 0.0008 0.0068 59
112 56333.4755 0.0022 0.0108 61
113 56333.5443 0.0027 0.0080 54
114 56333.6192 0.0008 0.0112 61
157 56336.7342 0.0008 0.0459 188
158 56336.7965 0.0006 0.0365 198
159 56336.8676 0.0013 0.0359 196
171 56337.7416 0.0011 0.0504 99
172 56337.8029 0.0012 0.0400 99
∗BJD−2400000.
†C = 2456325.4414 + 0.0716368E.
‡Number of points used to determine the maximum.
21
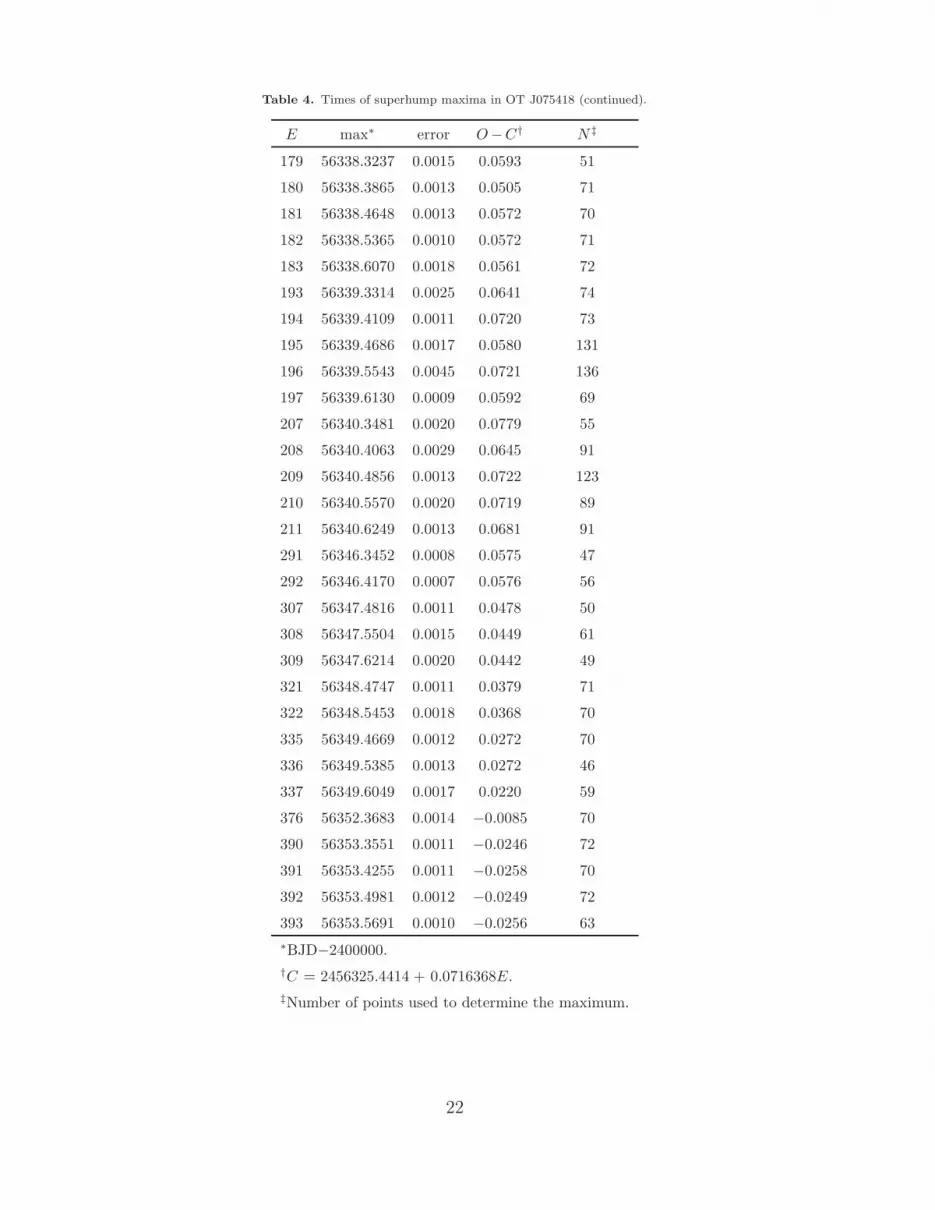
Table 4. Times of superhump maxima in OT J075418 (continued).
E max∗ error O−C† N ‡
179 56338.3237 0.0015 0.0593 51
180 56338.3865 0.0013 0.0505 71
181 56338.4648 0.0013 0.0572 70
182 56338.5365 0.0010 0.0572 71
183 56338.6070 0.0018 0.0561 72
193 56339.3314 0.0025 0.0641 74
194 56339.4109 0.0011 0.0720 73
195 56339.4686 0.0017 0.0580 131
196 56339.5543 0.0045 0.0721 136
197 56339.6130 0.0009 0.0592 69
207 56340.3481 0.0020 0.0779 55
208 56340.4063 0.0029 0.0645 91
209 56340.4856 0.0013 0.0722 123
210 56340.5570 0.0020 0.0719 89
211 56340.6249 0.0013 0.0681 91
291 56346.3452 0.0008 0.0575 47
292 56346.4170 0.0007 0.0576 56
307 56347.4816 0.0011 0.0478 50
308 56347.5504 0.0015 0.0449 61
309 56347.6214 0.0020 0.0442 49
321 56348.4747 0.0011 0.0379 71
322 56348.5453 0.0018 0.0368 70
335 56349.4669 0.0012 0.0272 70
336 56349.5385 0.0013 0.0272 46
337 56349.6049 0.0017 0.0220 59
376 56352.3683 0.0014 −0.0085 70
390 56353.3551 0.0011 −0.0246 72
391 56353.4255 0.0011 −0.0258 70
392 56353.4981 0.0012 −0.0249 72
393 56353.5691 0.0010 −0.0256 63
∗BJD−2400000.
†C = 2456325.4414 + 0.0716368E.
‡Number of points used to determine the maximum.
22
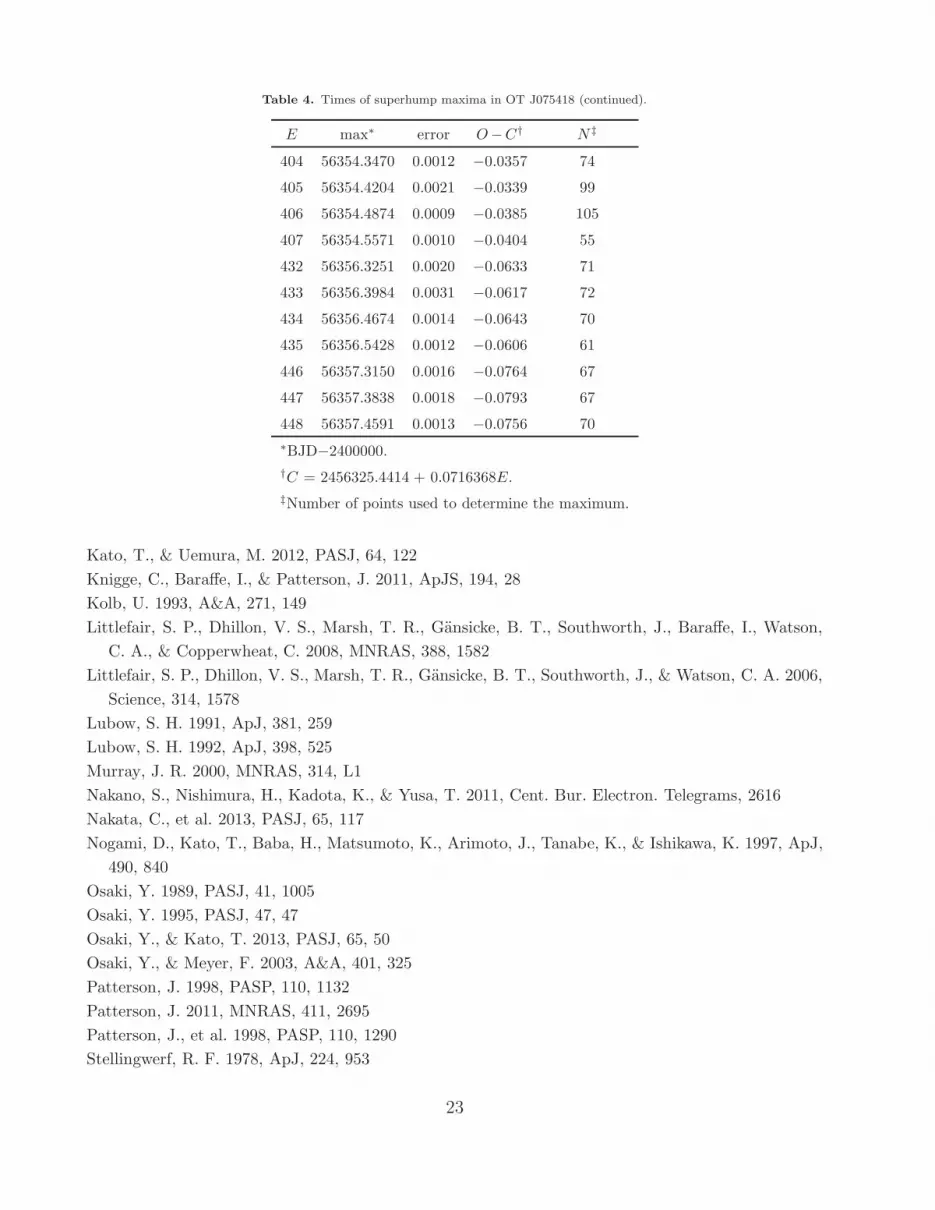
Table 4. Times of superhump maxima in OT J075418 (continued).
E max∗ error O−C† N ‡
404 56354.3470 0.0012 −0.0357 74
405 56354.4204 0.0021 −0.0339 99
406 56354.4874 0.0009 −0.0385 105
407 56354.5571 0.0010 −0.0404 55
432 56356.3251 0.0020 −0.0633 71
433 56356.3984 0.0031 −0.0617 72
434 56356.4674 0.0014 −0.0643 70
435 56356.5428 0.0012 −0.0606 61
446 56357.3150 0.0016 −0.0764 67
447 56357.3838 0.0018 −0.0793 67
448 56357.4591 0.0013 −0.0756 70
∗BJD−2400000.
†C = 2456325.4414 + 0.0716368E.
‡Number of points used to determine the maximum.
Kato, T., & Uemura, M. 2012, PASJ, 64, 122
Knigge, C., Baraffe, I., & Patterson, J. 2011, ApJS, 194, 28
Kolb, U. 1993, A&A, 271, 149
Littlefair, S. P., Dhillon, V. S., Marsh, T. R., Gansicke, B. T., Southworth, J., Baraffe, I., Watson,
C. A., & Copperwheat, C. 2008, MNRAS, 388, 1582
Littlefair, S. P., Dhillon, V. S., Marsh, T. R., Gansicke, B. T., Southworth, J., & Watson, C. A. 2006,
Science, 314, 1578
Lubow, S. H. 1991, ApJ, 381, 259
Lubow, S. H. 1992, ApJ, 398, 525
Murray, J. R. 2000, MNRAS, 314, L1
Nakano, S., Nishimura, H., Kadota, K., & Yusa, T. 2011, Cent. Bur. Electron. Telegrams, 2616
Nakata, C., et al. 2013, PASJ, 65, 117
Nogami, D., Kato, T., Baba, H., Matsumoto, K., Arimoto, J., Tanabe, K., & Ishikawa, K. 1997, ApJ,
490, 840
Osaki, Y. 1989, PASJ, 41, 1005
Osaki, Y. 1995, PASJ, 47, 47
Osaki, Y., & Kato, T. 2013, PASJ, 65, 50
Osaki, Y., & Meyer, F. 2003, A&A, 401, 325
Patterson, J. 1998, PASP, 110, 1132
Patterson, J. 2011, MNRAS, 411, 2695
Patterson, J., et al. 1998, PASP, 110, 1290
Stellingwerf, R. F. 1978, ApJ, 224, 953
23
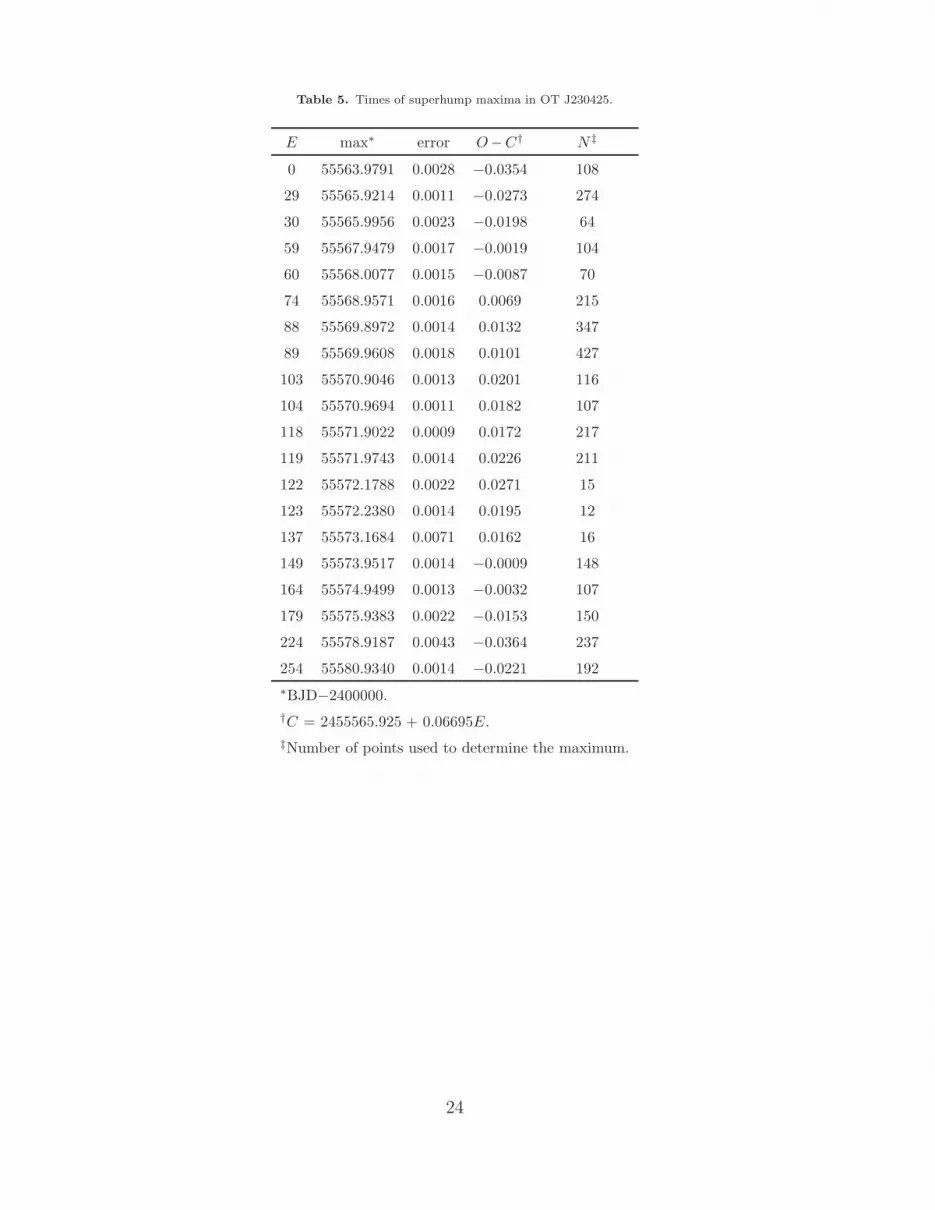
Table 5. Times of superhump maxima in OT J230425.
E max∗ error O−C† N ‡
0 55563.9791 0.0028 −0.0354 108
29 55565.9214 0.0011 −0.0273 274
30 55565.9956 0.0023 −0.0198 64
59 55567.9479 0.0017 −0.0019 104
60 55568.0077 0.0015 −0.0087 70
74 55568.9571 0.0016 0.0069 215
88 55569.8972 0.0014 0.0132 347
89 55569.9608 0.0018 0.0101 427
103 55570.9046 0.0013 0.0201 116
104 55570.9694 0.0011 0.0182 107
118 55571.9022 0.0009 0.0172 217
119 55571.9743 0.0014 0.0226 211
122 55572.1788 0.0022 0.0271 15
123 55572.2380 0.0014 0.0195 12
137 55573.1684 0.0071 0.0162 16
149 55573.9517 0.0014 −0.0009 148
164 55574.9499 0.0013 −0.0032 107
179 55575.9383 0.0022 −0.0153 150
224 55578.9187 0.0043 −0.0364 237
254 55580.9340 0.0014 −0.0221 192
∗BJD−2400000.
†C = 2455565.925 + 0.06695E.
‡Number of points used to determine the maximum.
24