operations management in automotive industries
TRANSCRIPT
Marco Gobetto
Operations Management in Automotive Industries
Springer Series in Advanced Manufacturing
From Industrial Strategies to Production Resources Management, Through the Industrialization Process and Supply Chain to Pursue Value Creation

Springer Series in Advanced Manufacturing
Series Editor
Duc Truong Pham
For further volumes:http://www.springer.com/series/7113
Marco Gobetto
Operations Managementin Automotive Industries
From Industrial Strategies toProduction Resources Management,Through the Industrialization Processand Supply Chain toPursue Value Creation
123
Marco GobettoAutomotive Engineering FacultyFIAT Sepin S.cp.A. and Politecnico of TurinTurinItaly
ISSN 1860-5168 ISSN 2196-1735 (electronic)ISBN 978-94-007-7592-3 ISBN 978-94-007-7593-0 (eBook)DOI 10.1007/978-94-007-7593-0Springer Dordrecht Heidelberg New York London
Library of Congress Control Number: 2013947779
� Springer Science+Business Media Dordrecht 2014This work is subject to copyright. All rights are reserved by the Publisher, whether the whole or part ofthe material is concerned, specifically the rights of translation, reprinting, reuse of illustrations,recitation, broadcasting, reproduction on microfilms or in any other physical way, and transmission orinformation storage and retrieval, electronic adaptation, computer software, or by similar or dissimilarmethodology now known or hereafter developed. Exempted from this legal reservation are briefexcerpts in connection with reviews or scholarly analysis or material supplied specifically for thepurpose of being entered and executed on a computer system, for exclusive use by the purchaser of thework. Duplication of this publication or parts thereof is permitted only under the provisions ofthe Copyright Law of the Publisher’s location, in its current version, and permission for use mustalways be obtained from Springer. Permissions for use may be obtained through RightsLink at theCopyright Clearance Center. Violations are liable to prosecution under the respective Copyright Law.The use of general descriptive names, registered names, trademarks, service marks, etc. in thispublication does not imply, even in the absence of a specific statement, that such names are exemptfrom the relevant protective laws and regulations and therefore free for general use.While the advice and information in this book are believed to be true and accurate at the date ofpublication, neither the authors nor the editors nor the publisher can accept any legal responsibility forany errors or omissions that may be made. The publisher makes no warranty, express or implied, withrespect to the material contained herein.
Printed on acid-free paper
Springer is part of Springer Science+Business Media (www.springer.com)

If you think of standardization as the bestthat you know today, but which is to beimproved tomorrow; you get somewhere
Henry Ford
Foreword
With more than 30 years of experience in the automotive industry, eight of thoseinvolved in the development and implementation of World Class Manufacturing,and having, over the years, experienced almost all the operation sectors through alleconomic scenarios, I can state, without a doubt, that a wise Management ofOperations is the key to company success.
For this reason, the technical background of a person who works in, or aims tojoin, the automotive sector, should include Operations Management (OM). Wetherefore offer this book as an answer to the need for a repository of detailedknowledge of this topic.
Writing a book on OM is as ambitious as it is critical, since it is required to dealwith all processes and aspects of the automobile lifecycle management MarcoGobetto was the perfect candidate for this task. Strengthened by working expe-rience in different operation sectors of the Fiat Group and a teaching background atPolitecnico of Turin, he succeeded in embracing all aspects of OM in great detail.
It is for these reasons that I encouraged and sustained him in this enterprise andam proud to write this Foreword.
Today, companies are competing in a much more complex environment than itwas the case only a few years ago. Survival rather than growth is the immediategoal. They must focus on quality, time-based competition, efficiency, internationalperspectives, and customer satisfaction. Competition driven by a global market,e-business, the Internet, and advances in technology all require flexibility andresponsiveness. This new focus has placed OM in the limelight of business,because it is the function through which companies can achieve a necessary levelof competitiveness.
The automotive industry is and will remain to be one of the key industries of theworld. If auto manufacturing were a country, it would be the sixth largest econ-omy, with over 66 million cars, vans, trucks, and buses manufactured (data fromOICA, in 2005). These vehicles are essential to the working of the global economyand to the wellbeing of the world’s citizens. This level of output is equivalent to aglobal turnover (gross revenue) of almost €2 trillion.
Traditionally, the automotive industry was organized by rigid labor division andpaced assembly lines were employed to realize low-cost mass production. Now-adays, flexible mixed model assembly lines make it possible to produce a largevariety of customized products. As an example, Mass Customization is one of the
vii

answers to flexibility challenge: the ability of a firm to highly customize its goodsand services to different customers. Mass customization requires designing flexibleoperations and using delayed product differentiation, also called postponement.This means keeping the product in generic form as long as possible and postponingradical change.
This is not for free. Increasing flexibility in design and manufacturing imposesnew challenges not only for development of the product and manufacturing sys-tem, but also for the logistics coordination within global supply chains, purchas-ing, and marketing operations. In addition, novel planning and schedulingapproaches are needed in order to manage the mismatch between increasedproduct variety and the need to improve utilization of capital-intensive resources.
In other words an Operations Management, to be successful, has to focus onadding value during the transformation process. By value added in this context wemean the net increase between the final value of a product and the value of all theinputs. The greater the value added, the more productive a business is.
An obvious way to add value is to reduce the cost of activities in the trans-formation process by finding and eliminating waste and losses. In addition to valueadded, operations must be efficient, that is, being able to perform activities well,and at the lowest possible cost. All activities must be analyzed to eliminate thosethat do not add value, and restructure processes and jobs to achieve greaterefficiency.
In this way, Operations Management has become the focal point of efforts toincrease competitiveness by improving value added and efficiency for the wholecompany.
Achieving these targets requires both strategic and tactical management. Stra-tegic management involves making decisions about what business the organizationwill be in and what its overall objectives will be. Strategic management’s planningis long term and considers where the business wants to be in 2–3 years, or longerin some cases. Tactical management involves making decisions about how anorganization should go about achieving the overall objectives determined bystrategic management. Tactical management decides what needs to be done withinthat year to implement the plan of strategic management. Tactical decisions mustbe aligned with strategic decisions, because they are the key to the company’seffectiveness in the long run. Tactical decisions provide feedback to strategicdecisions, which can be modified accordingly.
Having a well-coordinated management system focused on adding value andimproving efficiency could be enough. Today, businesses must think in terms ofcompetition based on timing and a global marketplace.
This includes developing new products and services faster than the competition,reaching the market first, fulfilling customer orders most quickly, meeting cus-tomer needs, and getting the right product to markets as diverse as the Far East,Europe, and Africa.
Operations Management is responsible for most of these decisions. OM decideswhether to tailor products to different customer needs, where to locate facilities,how to manage suppliers, and how to meet local government standards.
viii Foreword
This book copes with all aspects of Operation Management, reflecting the idealof Mutually Exclusive, Collectively Exhaustive (MECE), which I consider as thebasic requirement to be World Class.
In Chap. 1, after an enjoyable overview on automotive history, the reader willdiscover information on all processes and technologies involved in an automotiveenterprise and learn why decision making is a key factor of success. The chapterhighlights method, tools, criteria, and knowledge which support a decision-makingprocess guaranteeing a high level of success.
Chapters 2 and 3 deal, in a wealth of details, with the development process ofproduct and manufacturing technologies and methods. Flexibility premises aregenerated in this phase. The theme of producing a large variety of customizedproducts by maintaining a high level of product and process standardization iscovered by explaining all the meaningful methodologies, requirements, andparameters managed by Engineering Departments. A special highlight emphasizesInformation Technology which, nowadays, allows effective application of Con-current Engineering to coordinate different departments in different parts of theworld.
From Chaps. 4–8, the reader will find a detailed analysis of the new method-ologies to improve productivity and to sustain continuous improvement. More thanother chapters, this part has my personal appreciation. Marco has demonstrated hiscapability in having successfully dealt with all the aspects that an OperationsManager should know and easily manage: the four pillars of a Production System,Workplace Organization, Logistics, Professional Maintenance, and Quality.I personally urge you to ponder carefully all the aspects contained in these fourchapters, since they contain the essential knowledge of a company needed tosurvive in the future.
The last chapter is about value and how it is generated. As said above, Oper-ations Management plays the most important role in increasing competitiveness byimproving value and efficiency for the whole company, since all activities orinitiatives should be in the direction of creating value.
For all people who want to participate in or deeply understand the automotiveindustry, I would foster reading this book to deeply catch the complexity and thecontinuous challenges of the automotive enterprise. To all Automotive Engi-neering students, my wish is that you will be guided by this book and will keep itin your personal library as a knowledge reference for the future.
Luciano Massone
Foreword ix
Acknowledgments
The list of people I would like to thank is quite long because of the extendedperiod required to complete, and finally release, this book with coverage ofpractically a decade of blended working experiences, a mix of teaching at theUniversity and professional worldwide working in Manufacturing through manydifferent Industrial Businesses in a continuously changing scenario.
So I would like first of all to thank Carlo Mangiarino, experienced Managerthrough most of the companies in FIAT; without him it would not have beenpossible for me to have the chance to start this exciting experience at the Uni-versity; experience in which I strongly believed from the beginning, while com-bined with my actual professional assignment in FIAT. From Carlo I learned notonly the professional side but also a unique human style.
A special thanks goes to Domenico Maisano and Luca Mastrogiacomo, bothbrilliant young engineers and doctors in research at DISPEA Department inPolitecnico of Turin; Domenico started the collaboration with Production Man-agement from the beginning and specifically dedicated himself to writing theAppendix for the basics of production management; Luca continued brilliantly toassist me during the growth of the international course and has been invaluable inrefining this part of the text and improving it during these last 3 years; to them mybest wishes for brilliant international careers at the University of Turin.
I would like to thank Giancarlo Genta, Professor at Politecnico of Turin andResponsible of Automotive Engineering Course, for his commitment to theinternationalization of the courses in this Faculty.
A great thank you goes to Luciano Massone, Vice President of World ClassManufacturing in FIAT Group Automobiles and a Member of the SteeringCommittee for Automotive Engineering, a committee shared between FIAT andPolitecnico of Turin. I met Luciano for the first time in 2005 and he was a ‘‘standalone’’ man at that time in his new department; he asked me and another fewcolleagues of mine to help him with a special initiative that aimed to build the NewFIAT Production System. This initiative, only a few years later, contributed sig-nificantly to a great turnaround in FIAT at worldwide level and to the JointVenture between FIAT and Chrysler. World Class Manufacturing is currentlymore than simply a new production system for FIAT sectors and plants, but almosta common language to share best practices and give new opportunities to thecompanies that want to join this way of business life. Now Luciano leads a
xi

strategic group of people that possesses a body of knowledge considered as one ofthe main assets of our company: thank you for offering me this ‘‘fast pass’’ tolearning, experiencing, and growing up professionally in such a very short time.
Another special thank you goes to Elena Sacerdote, before FIAT CorporateLearning Officer and now FIAT Brand Customer Care Manager. From thebeginning of her assignment she gave the right relevance to her ManufacturingTraining Role and, with her commitment, contributed significantly in keeping itclose to the Manufacturing Central Department in FIAT, ensuring always the rightlink with central training logics as well. Dealing with training daily, I have learnedhow difficult it is to make other people understand how strategic it is; Elena’s worklives in the pages of this book.
Last, but not the least, a devoted ‘‘thank you’’ to all my Family, for supportingme in all these intense working years and giving me the opportunity to nourish thisknowledge: my wife Arianna for being patient and for her continuous support yearafter year, my daughter Gaia for the motivation she is able to induce in me, myfather and my mother for having given me the chance to be here at this point.
A final thank you goes to all those readers who will use this knowledge as astarting point, will apply it to their professional life, and will increase theircuriosity to learn more on some of the chapters treated in this book.
Marco Gobetto
xii Acknowledgments
Contents
1 Historical Outlines and Industrial Strategiesfor Automotive Industries . . . . . . . . . . . . . . . . . . . . . . . . . . . . . . 11.1 Historical Outlines in the Automotive Industry . . . . . . . . . . . . . 11.2 Strategic Planning of Production Activities . . . . . . . . . . . . . . . . 131.3 Process Integration and ‘‘Make or Buy’’ Decision-Making . . . . . 16
1.3.1 Items (m) for the Decision to ‘‘Make’’ . . . . . . . . . . . . . 171.3.2 Items (b) for the Decision to ‘‘Buy’’ . . . . . . . . . . . . . . . 181.3.3 Items (c) for the Decision for ‘‘Co-Makership’’ . . . . . . . 18
1.4 Manufacturing Systems Set-Up and Location Criteria . . . . . . . . 191.4.1 Equipment Level and the Defining
of Technological Solutions . . . . . . . . . . . . . . . . . . . . . . 201.5 Overview of Technologies for Materials Applied
to the Construction of Vehicles . . . . . . . . . . . . . . . . . . . . . . . . 231.6 Sketches for Manufacturing Systems Adopted
in Car Manufacturing . . . . . . . . . . . . . . . . . . . . . . . . . . . . . . . 271.7 Systems’ Strategic Prerogatives . . . . . . . . . . . . . . . . . . . . . . . . 42
2 From Project to Product . . . . . . . . . . . . . . . . . . . . . . . . . . . . . . . 452.1 Standardization Logic and Project Set-Up. . . . . . . . . . . . . . . . . 452.2 Industrialization Process Description . . . . . . . . . . . . . . . . . . . . 482.3 Product/Process Information Technology System. . . . . . . . . . . . 522.4 Product Composition Analysis . . . . . . . . . . . . . . . . . . . . . . . . 612.5 Management of Technical Changes . . . . . . . . . . . . . . . . . . . . . 63
3 Manufacturing Engineering and EquipmentEfficiency Evaluation . . . . . . . . . . . . . . . . . . . . . . . . . . . . . . . . . . 673.1 Manufacturing Engineering Planning and Executive Project . . . . 67
3.1.1 Manufacturing Engineering Plan Studyand ‘‘System’’ Preliminary Project . . . . . . . . . . . . . . . . 67
3.1.2 Executive Project . . . . . . . . . . . . . . . . . . . . . . . . . . . . 683.2 Production Capacity Setting . . . . . . . . . . . . . . . . . . . . . . . . . . 703.3 Working Time Analysis Methodologies . . . . . . . . . . . . . . . . . . 733.4 Man–Machine Interaction and Standard Working
Time Definition. . . . . . . . . . . . . . . . . . . . . . . . . . . . . . . . . . . 76
xiii
3.5 Equipment Utilization Analysis . . . . . . . . . . . . . . . . . . . . . . . . 783.6 Introduction of Integrated Production Systems . . . . . . . . . . . . . 803.7 Operative Productivity and Flexibility . . . . . . . . . . . . . . . . . . . 813.8 Equipment and Machine Loading . . . . . . . . . . . . . . . . . . . . . . 823.9 Defining Installed Productive Capacity. . . . . . . . . . . . . . . . . . . 84
4 Work Analysis and Labour Productivity Evaluation Criteria. . . . . 874.1 Activity Level and Labour Efficiency . . . . . . . . . . . . . . . . . . . 87
4.1.1 Labour Efficiency Analysis . . . . . . . . . . . . . . . . . . . . . 884.2 Manpower Planning . . . . . . . . . . . . . . . . . . . . . . . . . . . . . . . . 89
4.2.1 Indirect Labour Requirement . . . . . . . . . . . . . . . . . . . . 904.2.2 Operative Plan and Staff Balancing: Requirements . . . . . 91
4.3 Working Time Length and Flexibility . . . . . . . . . . . . . . . . . . . 924.4 Labour Productivity and Improvement Plans. . . . . . . . . . . . . . . 944.5 Input Data for Operative Control . . . . . . . . . . . . . . . . . . . . . . . 994.6 Assignment of Tasks and Workload Balance . . . . . . . . . . . . . . 104
4.6.1 Considerations on Work Organization for AssemblyLines or Parallel Workstations . . . . . . . . . . . . . . . . . . . 108
4.7 Motivation and Rewarding of Employees . . . . . . . . . . . . . . . . . 110
5 Manufacturing System Management and Maintenance Criteria . . . 1155.1 Plant Manufacturing System . . . . . . . . . . . . . . . . . . . . . . . . . . 1155.2 Reliability and Maintainability of Equipment . . . . . . . . . . . . . . 1175.3 Maintenance Management . . . . . . . . . . . . . . . . . . . . . . . . . . . 122
5.3.1 Autonomous Maintenance Activities(Simple and Recurrent Interventions: Type A) . . . . . . . . 123
5.3.2 Professional Maintenance Activites(Type B, C and D) . . . . . . . . . . . . . . . . . . . . . . . . . . . 125
5.4 Correlation Between Cost and Maintenance Effectiveness . . . . . 1285.4.1 Breakdown Maintenance Activity Volume . . . . . . . . . . . 1305.4.2 Preventive Professional Maintenance
Activity Volume . . . . . . . . . . . . . . . . . . . . . . . . . . . . . 1305.4.3 Individual Activity Achievable . . . . . . . . . . . . . . . . . . . 131
5.5 General and Complementary Equipment for Production . . . . . . . 1315.5.1 General Services Equipment and Energy
Consumption Optimization. . . . . . . . . . . . . . . . . . . . . . 1315.5.2 Co-generation Equipment and Electric Energy
Consumption Control Systems . . . . . . . . . . . . . . . . . . . 1325.5.3 Auxiliary Equipment and Exhaust
Material Management . . . . . . . . . . . . . . . . . . . . . . . . . 1335.6 Tools and Consumables Management. . . . . . . . . . . . . . . . . . . . 134
5.6.1 General Criteria . . . . . . . . . . . . . . . . . . . . . . . . . . . . . 1345.6.2 Tools and Tooling Subject to Quick Usury . . . . . . . . . . 135
5.7 ‘‘Total Productive Maintenance’’ Approach . . . . . . . . . . . . . . . 138
xiv Contents
6 Logistics and Supply Chain Basics for Automotive Application . . . 1416.1 Historical Evolution of Logistics and Actual Strategies . . . . . . . 141
6.1.1 1925–1975: Logistics as ‘‘Material Management’’Support . . . . . . . . . . . . . . . . . . . . . . . . . . . . . . . . . . . 142
6.1.2 1975–1990: Logistics Oriented to ‘‘Time-to-Market’’and ‘‘Commercial Network Service’’ . . . . . . . . . . . . . . . 143
6.1.3 Actual period: Logistics as an ‘‘Integrated Process’’to Support ‘‘Supply Chain Management’’ . . . . . . . . . . . . 143
6.2 Logistic Flow in the Supply Chain . . . . . . . . . . . . . . . . . . . . . 1446.3 Material Handling and Inventory Management
Methodologies. . . . . . . . . . . . . . . . . . . . . . . . . . . . . . . . . . . . 1486.4 Production and Delivery Planning . . . . . . . . . . . . . . . . . . . . . . 1556.5 Logistics Information Technology Systems . . . . . . . . . . . . . . . . 1606.6 Key Performance Indicators of Logistics . . . . . . . . . . . . . . . . . 163
6.6.1 Finished Product Inventory Indicatorsand Work in Process . . . . . . . . . . . . . . . . . . . . . . . . . . 163
6.6.2 Process Lead Time and Flow Index . . . . . . . . . . . . . . . 1646.6.3 Risk Indicators of Inventory Obsolescence . . . . . . . . . . . 1656.6.4 Order Execution Lead Time . . . . . . . . . . . . . . . . . . . . . 1656.6.5 Service Level . . . . . . . . . . . . . . . . . . . . . . . . . . . . . . . 166
6.7 Just in Time Approach . . . . . . . . . . . . . . . . . . . . . . . . . . . . . . 167
7 Global Purchasing Operations . . . . . . . . . . . . . . . . . . . . . . . . . . . 1697.1 Role of the Purchasing Department . . . . . . . . . . . . . . . . . . . . . 1697.2 Evolution of Purchasing Policies . . . . . . . . . . . . . . . . . . . . . . . 1717.3 Purchasing, Marketing and Global Sourcing Policies . . . . . . . . . 1747.4 Management of Suppliers Network . . . . . . . . . . . . . . . . . . . . . 1767.5 Order Procedure and Cooperation Agreements . . . . . . . . . . . . . 1787.6 Supplying Cost and Purchasing Effectiveness Indicators. . . . . . . 1797.7 ‘‘E-procurement’’ Techniques . . . . . . . . . . . . . . . . . . . . . . . . . 181
8 Quality Management and Continuous Improvement . . . . . . . . . . . 1838.1 The ‘‘Learning Curve’’ Concept . . . . . . . . . . . . . . . . . . . . . . . 1838.2 Production Ramp up and Maximum Rate Achievement . . . . . . . 1848.3 Quality Management in Industrial Processes . . . . . . . . . . . . . . . 1878.4 Quality and Reliability Assurance Techniques
in Product Design Phase. . . . . . . . . . . . . . . . . . . . . . . . . . . . . 1908.5 Total Quality Management and Continuous
Improvement Approach . . . . . . . . . . . . . . . . . . . . . . . . . . . . . 191
Contents xv

9 Value Creation and Final Considerations . . . . . . . . . . . . . . . . . . . 201
Appendix: Production Management Basics . . . . . . . . . . . . . . . . . . . . . 205
About the Author . . . . . . . . . . . . . . . . . . . . . . . . . . . . . . . . . . . . . . . 245
xvi Contents
Abbreviations
A Technical AvailabilityAFC Annual Fixed CostAM Autonomous MaintenanceAPC Available Productive CapacityAPP Aggregated Production PlanningAT Active Timeats Average technical saturationAUT Available Up TimeAWT Available Working TimeBM Breakdown MaintenanceBOM Bill Of MaterialBUT Breakdown Unavailable TimeCAD Computer Aided DesignCAE Computer Aided EngineeringCAPE Computer Aided Process EngineeringCBM Condition-Based MaintenanceCOS Cost Of SaleDAV Developed Activity VolumeDLR Direct Labour RequirementDR Design ReviewECUT External Causes Unavailable TimeEOQ Economic Order QuantityFI Flow IndexFIFO First In First OutFMEA Failure Mood Effect AnalysisFMECA Failure Mood Effect and Causes AnalysisFOQ Fixed Order QuantityHDM Hours of Direct ManpowerHIM Hours of Indirect ManpowerHVP Hourly Virtual Production or ProductivityIAA Individual Activity AchievableILP Individual (annual) Labour ProductivityIT Idle TimeIWH Individual Working Hours
xvii
JIS Just In SequenceJIT Just In TimeKAI Key Activity IndicatorKMI Key Management IndicatorKPIs Key Performance IndicatorsLCA Low Cost AutomationLCV Light Commercial VehicleLIFO Last In First OutLT Lead TimeLTP Lot Turnover PeriodMMUT Manpower Management Unavailable TimeMP Monthly ProductionMPS Master Production SchedulingMPV Multi-Purpose VehicleMRP Material Requirement PlanningMTBF Mean Time Between FailuresMTTR Mean Time To Repair (and Restart)NAFTA North America Free Trade AreaNVAA Non Value Added ActivitiesOEE Overall Equipment Efficiency (or Effectiveness)OELT Order Execution Lead TimeOP Operative PlanOPF One Piece FlowPAV Planned Activity VolumePBS Product Breakdown StructurePDCA Plan Do Check ActPDM Product Data ManagementPFD Product Function DeploymentPLT Process Lead TimePMS Product Macro StructurePMUT Preventive Maintenance Unavailable Timepu Process unavailability indexPWT Planned Working TimeQR Quality RequirementsR Technical ReliabilitySC Supply ChainSCM Supply Chain ManagementSFC Shift Fixed CostSL Service LevelSPC Standard Productive CapacityST Standard TimeSOT Standard Operation TimeSUUT Set-Up Unavailability TimeSUV Sport Utility VehicleTBM Time-Based Maintenance
xviii Abbreviations
TPM Total Productive MaintenanceTQM Total Quality ManagementTT Takt TimeTTC Total Transformation CostTTM Time To MarketTUC Transformation Unitary CostU Utilization (degree)UST Unitary Set-Up TimeUVC Unitary Variable CostVAA Value Added ActivitiesVTC Variable Transformation CostWBS Work Breakdown StructureWCT Working Cycle TimeWIP Work In ProgressWTE Working Time Employed
Abbreviations xix
Introduction
This book is the outcome of a very long and intensive project begun in 2002, whenCarlo Mangiarino, longstanding Manager for all the major companies of FIAT andthen head of the course of Production Management for the Faculty of AutomotiveEngineering at the Politecnico of Turin, asked me to collaborate with him in thedevelopment of this course, both for the content and for the lectures at theuniversity.
We began designing this textbook in Italian, since that was the language that thecourse was in, and then, year after year, updated and integrated it with freshmaterial according to the evolution of the techniques and scenarios in theautomotive industry.
In 2007, when I took over stewardship of Production Management from Carlo,the course expanded into other languages. Based additionally on my experienceworldwide as Manager of a training unit for manufacturing disciplines for FIAT, Ibegan developing the English language version, revisiting the entire book in orderto integrate all the information to come out of the automotive industry in recentyears.
So far, this book serves mainly as a text reference for the course of ProductionProcesses, Safety, Organization, and Management I run at the Faculty ofAutomotive Engineering, but at the same time it represents a good compendium ofbasics on Industrial Management, since it covers all major chapters: from productdevelopment and ‘‘make or buy’’ decision strategies to the setting of manufac-turing systems and management, through analysis of the main resources needed forproduction, and finally, exploring management of the supply chain and procure-ment techniques. The very last chapter is dedicated to summing up all topicsthrough analysis of key management indicators for pursuing the value creation atthe heart of every industrial business.
A portion of the Appendix is dedicated to the basics of production managementwhere all main relevant definitions, techniques, and criteria are addressed throughthe inclusion of numerical examples, for the purpose of providing the knowledgeneeded to approach all other chapters.
xxi

It is my hope that this book will lead both Automotive Engineering students andalso a wider range of readers to a better understanding of the automotive world andits industrial aspects.
Marco Gobetto
xxii Introduction
Chapter 1Historical Outlines and IndustrialStrategies for Automotive Industries
1.1 Historical Outlines in the Automotive Industry
We will briefly examine the evolution of industrial strategies for the developmentof cars and commercial vehicles during the entire historical period from the birthof the car to the present day. We will deal particularly with manufacturing engi-neering, work analysis and international development plans adopted by differentcompanies throughout this time.
The key changes in industrial strategies are, from one side, the evolution ofmarket and vehicle usage conditions and, from the other, the availability ofnew technologies, and safety and environmental restrictions. Competitionbetween competitors leads to different speeds of development at differenttimes.
Considering social, economic, technological and managerial developments, wecan break down the assorted historical periods as follows:
A. 1885/1905—Pioneers and the birth of big brandsHistorically, the birth of the car began in Europe and it would characterize theentire 19th century from the point of view of innovation. The first cars were‘‘motorized coaches’’ and they were produced with craft methods, the opera-tive instructions for assembling the car transforming engineers directly intocraftsmen. These vehicles were plagued by many functional defects that couldonly be fixed after long sessions of trial and error on the road conducted byexpert mechanics.In this ‘‘pioneer’’ phase. several techniques and schools of craft were affirmedin Europe; the best engine solutions came from Austria and Germany, whilespace frame and body solutions came from France and Italy; the English stylewould be distinguished for its luxury and would even end up influencing publictransportation solutions.By the introduction of the first automatic machine tools, the method of pro-duction had improved; furthermore, new tools for geometrical measurementallowed for better measuring of mechanical and body in white elements. It is inthis period that the first research centre began to operate in collaboration with
M. Gobetto, Operations Management in Automotive Industries,Springer Series in Advanced Manufacturing, DOI: 10.1007/978-94-007-7593-0_1,� Springer Science+Business Media Dordrecht 2014
1
Technical and Scientific Universities with the aim of producing with a highlevel of consistency: this was the transformation of automotive productionfrom an artisanal method to an industrial one, leading to the concept of stan-dard and serial production.It was in the first decade of the last century that the first touring cars were built;for these vehicles, a stylish shape and high quality materials became veryimportant.In Europe, during the so-called ‘‘bell’ époque’’ period, a lot of small andmedium carmakers began work; many of their products were selected by verydemanding customers (almost exclusively the nobility and middle class) whocontinued to be interested in technical innovation and original solutions. Someof these cars also proved successful in competitions.Conversely, in the United States of America, likely due to the necessity oftraveling long distances on rough territory, cars were considered to be more forpractical and functional purposes; there were fewer carmakers than in Europe,and yet more opportunity for finding capital resources for investment.
B. 1905/1925—Mass production: Ford strategic modelHenry Ford understood that the car could become a mass product with theassumption of certain fundamental features such as reliable functionality andhigh versatility. The real key to success lay in creating a rapid productioncapacity to satisfy increasing demand and thus win the market competition.To do that, Ford combined his idea with F.W. Taylor’s model for the scientificorganization of work:
– re-playable and interchangeable elements of the product;– production organized by method and predefined working times;– simplification of job tasks by specialization;– blue collar motivation to speed-up production in a short period of time.
The real advantage of this model was the ease with which it could be intro-duced into the production process, lowering the cost of manpower in theworkforce and proving easy to establish anywhere. While processes such assteel printing and metal forging required capital intensive solutions such asthe introduction of big machinery, in the final assembling area, the productcould be conveyed by a continuous flow line, progressively adding materialsand components at different stations at which workers followed standardoperating procedures. It was the beginning of the assembly line.Metal cutting and machining were organized in a special unit, by using highcadence equipment and production organized in batches. As a consequence ofthese solutions, big warehousing areas became necessary, the management ofwhich demanded the establishment of a material management department.The logistic management was aided by data processing systems available atthat time.To overcome the logistic difficulties and the change of management with thesuppliers, Ford primarily concentrated the production process at its ownDetroit-Rive Rouge plant, reaching the production rate of 1 million vehicles a
2 1 Historical Outlines and Industrial Strategies
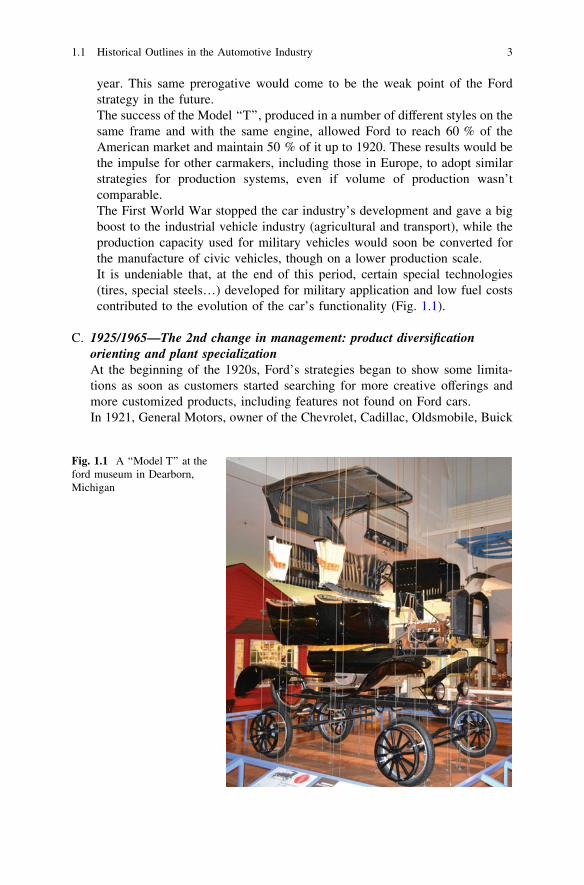
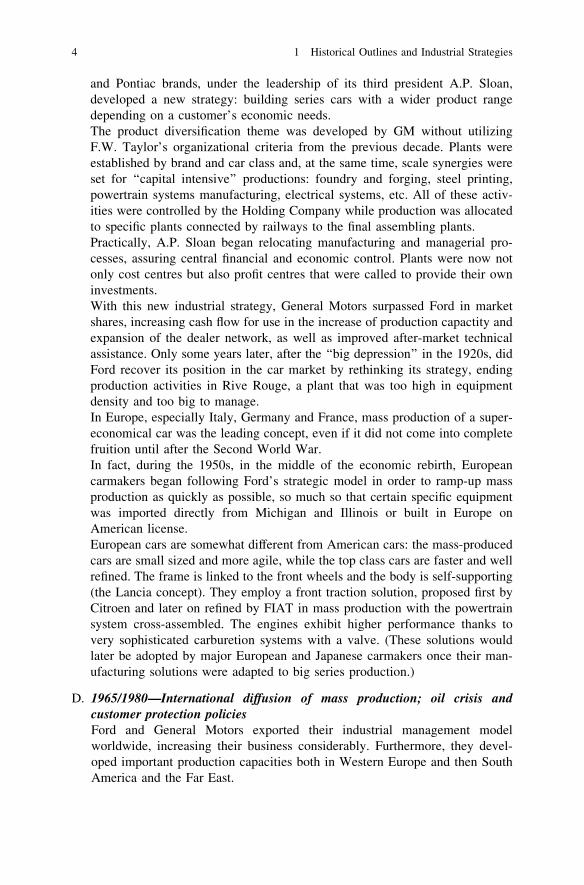
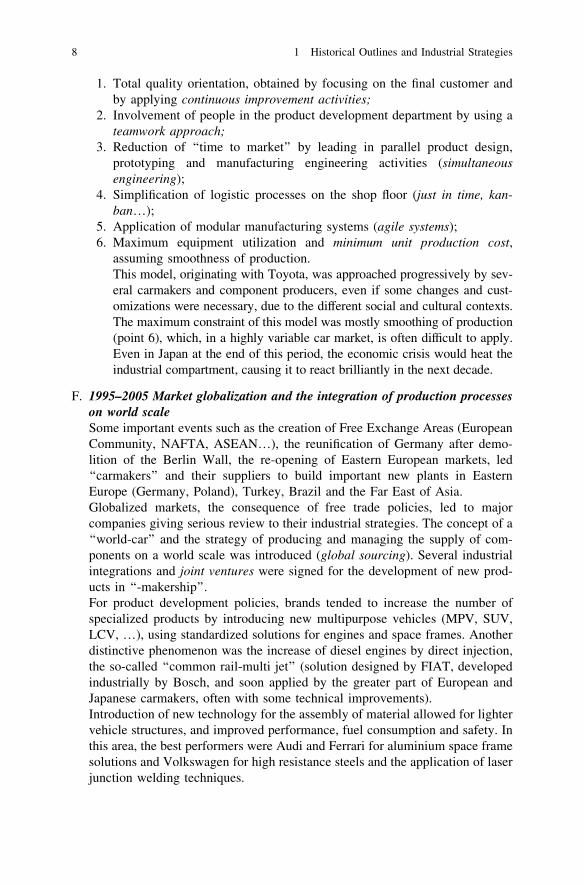
year. This same prerogative would come to be the weak point of the Fordstrategy in the future.The success of the Model ‘‘T’’, produced in a number of different styles on thesame frame and with the same engine, allowed Ford to reach 60 % of theAmerican market and maintain 50 % of it up to 1920. These results would bethe impulse for other carmakers, including those in Europe, to adopt similarstrategies for production systems, even if volume of production wasn’tcomparable.The First World War stopped the car industry’s development and gave a bigboost to the industrial vehicle industry (agricultural and transport), while theproduction capacity used for military vehicles would soon be converted forthe manufacture of civic vehicles, though on a lower production scale.It is undeniable that, at the end of this period, certain special technologies(tires, special steels…) developed for military application and low fuel costscontributed to the evolution of the car’s functionality (Fig. 1.1).
C. 1925/1965—The 2nd change in management: product diversificationorienting and plant specializationAt the beginning of the 1920s, Ford’s strategies began to show some limita-tions as soon as customers started searching for more creative offerings andmore customized products, including features not found on Ford cars.In 1921, General Motors, owner of the Chevrolet, Cadillac, Oldsmobile, Buick
Fig. 1.1 A ‘‘Model T’’ at theford museum in Dearborn,Michigan
1.1 Historical Outlines in the Automotive Industry 3
and Pontiac brands, under the leadership of its third president A.P. Sloan,developed a new strategy: building series cars with a wider product rangedepending on a customer’s economic needs.The product diversification theme was developed by GM without utilizingF.W. Taylor’s organizational criteria from the previous decade. Plants wereestablished by brand and car class and, at the same time, scale synergies wereset for ‘‘capital intensive’’ productions: foundry and forging, steel printing,powertrain systems manufacturing, electrical systems, etc. All of these activ-ities were controlled by the Holding Company while production was allocatedto specific plants connected by railways to the final assembling plants.Practically, A.P. Sloan began relocating manufacturing and managerial pro-cesses, assuring central financial and economic control. Plants were now notonly cost centres but also profit centres that were called to provide their owninvestments.With this new industrial strategy, General Motors surpassed Ford in marketshares, increasing cash flow for use in the increase of production capactity andexpansion of the dealer network, as well as improved after-market technicalassistance. Only some years later, after the ‘‘big depression’’ in the 1920s, didFord recover its position in the car market by rethinking its strategy, endingproduction activities in Rive Rouge, a plant that was too high in equipmentdensity and too big to manage.In Europe, especially Italy, Germany and France, mass production of a super-economical car was the leading concept, even if it did not come into completefruition until after the Second World War.In fact, during the 1950s, in the middle of the economic rebirth, Europeancarmakers began following Ford’s strategic model in order to ramp-up massproduction as quickly as possible, so much so that certain specific equipmentwas imported directly from Michigan and Illinois or built in Europe onAmerican license.European cars are somewhat different from American cars: the mass-producedcars are small sized and more agile, while the top class cars are faster and wellrefined. The frame is linked to the front wheels and the body is self-supporting(the Lancia concept). They employ a front traction solution, proposed first byCitroen and later on refined by FIAT in mass production with the powertrainsystem cross-assembled. The engines exhibit higher performance thanks tovery sophisticated carburetion systems with a valve. (These solutions wouldlater be adopted by major European and Japanese carmakers once their man-ufacturing solutions were adapted to big series production.)
D. 1965/1980—International diffusion of mass production; oil crisis andcustomer protection policiesFord and General Motors exported their industrial management modelworldwide, increasing their business considerably. Furthermore, they devel-oped important production capacities both in Western Europe and then SouthAmerica and the Far East.
4 1 Historical Outlines and Industrial Strategies
Even European carmakers followed the strategies of international marketdevelopment: they tried to export a large quantity of cars to North America andbuilt new plants in emerging countries by CKD (Completely Knocked Down)systems. Fiat and Renault were particularly involved in URSS and COMECONcountries in supplying specific know-how and equipment for mass seriesproduction.In the meantime, Japanese carmakers had begun using solutions for productionsystems similar to the ones proving successful in the Western countries,increasing their production capacities year by year, beginning with internal andSouth-East Pacific markets. Throughout the 1970s, they were able to improvetheir standard such that exportation to Europe and North America corre-spondingly improved.To achieve these targets, they instituted a system of strenuous labor far beyondanything found in North America and Europe, both of which had workers whobelieved they were entitled to a life outside of work.In the same period, some important centres of engineering and style modeldesign were established in Italy, many dedicated to special designs for sportsand luxury cars (Pininfarina, Bertone, Ghia… and later Italdesign). Styledesign and functional features, such as vehicle aerodynamics, were developedwith scientific methodology and experimental techniques that allowed forsignificant results on both the technical and style sides.These solutions would later be used for mass series production by even thebiggest carmakers worldwide.By the early 1970s, after a decade of growth, the bigger carmakers reached themaximum level of employment in their historical plants and their influence onsocio-economic development in industrial countries was very high. In Europeat the end of the 1960s, the unions and general social upheaval limited theincrease of production volumes (especially in England, France and Italy). Toovercome the problem of ‘‘job disaffection’’, the Tayloristic model needed tobe revisited, while in Germany and Japan the industrial relationship modelremained constant in accordance with productivity and industrial growth.During 1973/1974, after a long period of continuous improvement, the auto-motive industry, particularly in Europe, felt the shock of the big oil crisis.Furthermore, the ‘‘customer protection’’ and ‘‘emission and energy saving’’policies approved in the USA became a big constraint on the ability to revisitproduct development criteria and solutions, especially for powertrain andexhaust systems, so that different solutions were needed for North America’scar market than those being developed in Europe.After the second oil crisis in 1979, some of the major names in the automotiveindustry (Daimler-Benz, Fiat, Saab-Scania) began to differentiate their indus-trial activities to minimize the effects of the car market on economic results.Regarding the evolution of ‘‘manufacturing systems’’, up to the mid-70’s,equipment was mostly based on hard automation and work on fixed cycles. Foreach model changeover, big investment and long periods of production stop-page were needed, leading to a delay in the launch of new products. The life
1.1 Historical Outlines in the Automotive Industry 5
cycle of the product was up to 12/15 years for American carmakers: thus, theyused the ‘‘model year’’ policy only to indicate certain external redesigns.In the subsequent years, the introduction of ‘‘programmable production sys-tems’’ became strategic (Numeric Control Machines, Multi-operationalMachine Centres, Robot Equipment) together with computer systems based ondigital technologies—developed in the USA—with the ability to improve themanagement of logistic systems.During the same period, the European machine tool industry not onlyimproved, but did so enough to overcome its American counterpart, as it didagain a few years later to the Japanese. The first generation of flexible pro-duction systems, so-called CIM (computer integrated manufacturing system),was born in this period, but, due to a complex level of technology, thesesystems proved difficult to manage.In Japan, Toyota followed a completely new industrial strategy, the principalaim being product quality, lean production processes and personal involve-ment. Kiichiro Toyoda (Toyota founder) gave to Taiichi Ohno the task ofdeveloping effective methodologies for preventing design and manufacturingerrors. Professional skills were developed through a rigorous ‘‘companyschool’’. All operative employees were involved in continuous improvement(kaizen) through teamwork.This organizational model was successful and quickly spread throughout theJapanese industry. Before long Japanese carmakers had become highly com-petitive, obtaining more and more shares of the American car market by theday and challenging the three ‘‘big companies’’ (GM, FORD and CHRYSLER)during the final part of this historical period.
E. 1980/1995—New strategies for cooperation between Final and Middle Pro-ducers. Japanese organizational model diffusion: ‘‘total quality’’ and ‘‘leanproduction’’With the ‘80s began a new age of progress in the automotive industry. The finalproduct became more complex from a technological point of view, thanks, inpart, to ecological and safety restrictions and also to customer requestsregarding functionality and comfort. The ability to integrate the electronicsystems for engine control, safety and air conditioning represented a key factorfor success.For the transportation of goods, a new generation of high capacity vehicles withmore severe safety restrictions and availability was developed.For this purpose, component industries assumed a progressively more impor-tant role than in the past, transforming from the producers of simple ‘‘ondesign’’ parts into the developers of functional product sub-systems, based onthe carmakers’ guidelines.The model of cooperation between the final and middle producers was struc-tured in different strategic profiles, based on a macro-industry of necessity:
6 1 Historical Outlines and Industrial Strategies
(a) The German model promoted local suppliers into leaders of R&Dactivities, reserving priority application of the innovations for Germancarmakers (for example, the strategic alliance of innovation betweenBosch and Mercedes);
(b) The Japanese model led carmakers to support the supply chain as thefirst level of R&D capacity, linking them through company capitalinvestment participation (for example, Toyota controlling Denso) ratherthan promoting funds without any rate of interest;
(c) The American model, commercially more open and oriented towardobtaining maximum economical results in a short period, led carmakers toselect a supply chain concentrating on independent suppliers with marketleadership; these were then engaged in developing a worldwide produc-tion system, decentralizing labour intensive processes into countries withlow manufacturing costs.
For other industrial compartments, relationships between carmakers and theirsuppliers tended mostly towards the American model.Due to a greater complexity of product, most carmakers used specific suppliersfor the manufacturing of specific parts and the engineering and installation ofspecific equipment. This strategy is called ‘‘outsourcing’’ and helped plants toreduce complexity of management in internal processes. Production of hightechnological components was concentrated within a few leading marketsuppliers.During the 1980s, the major carmakers, in particular, Volkswagen, Fiat andVolvo, would use hard automation, with major investments into the increase ofproductivity and improvement of the working environment. Flexible andmulti-purpose manufacturing systems were used in moderation to effect aquick changeover of the product range with less specific investments. EvenICT systems were used.Numerically controlled machine tools, equipped with auto compensationsystems, helped in achieving very high precision: 5000 mm for the joining ofkinematic parts and 1/500 of an mm for the joining of structural vehicle parts.Furthermore, high resistance steel zinc-coated and anticorrosion coating letengines and vehicles greatly extend their technical life.New, more interesting and safer car models generated new needs in the carmarket. So a new market was born: the second-hand car market. Governmentfacilitation in Western Europe, oriented towards reducing environmentalpollution, helped customers in buying a new car. As a consequence, the sec-ond-hand used market became more important.At the beginning of the 1990s, the most relevant industrial event would be theso-called ‘‘transplant strategy’’, in which final assembly plants were estab-lished by Japanese carmakers in North America and Western Europe,increasing market shares in these markets.During this historical period, even in western companies, the Japanese man-ufacturing model began to spread. The main features of the so-called TotalQuality Management and Lean Production are:
1.1 Historical Outlines in the Automotive Industry 7
1. Total quality orientation, obtained by focusing on the final customer andby applying continuous improvement activities;
2. Involvement of people in the product development department by using ateamwork approach;
3. Reduction of ‘‘time to market’’ by leading in parallel product design,prototyping and manufacturing engineering activities (simultaneousengineering);
4. Simplification of logistic processes on the shop floor (just in time, kan-ban…);
5. Application of modular manufacturing systems (agile systems);6. Maximum equipment utilization and minimum unit production cost,
assuming smoothness of production.This model, originating with Toyota, was approached progressively by sev-eral carmakers and component producers, even if some changes and cust-omizations were necessary, due to the different social and cultural contexts.The maximum constraint of this model was mostly smoothing of production(point 6), which, in a highly variable car market, is often difficult to apply.Even in Japan at the end of this period, the economic crisis would heat theindustrial compartment, causing it to react brilliantly in the next decade.
F. 1995–2005 Market globalization and the integration of production processeson world scaleSome important events such as the creation of Free Exchange Areas (EuropeanCommunity, NAFTA, ASEAN…), the reunification of Germany after demo-lition of the Berlin Wall, the re-opening of Eastern European markets, led‘‘carmakers’’ and their suppliers to build important new plants in EasternEurope (Germany, Poland), Turkey, Brazil and the Far East of Asia.Globalized markets, the consequence of free trade policies, led to majorcompanies giving serious review to their industrial strategies. The concept of a‘‘world-car’’ and the strategy of producing and managing the supply of com-ponents on a world scale was introduced (global sourcing). Several industrialintegrations and joint ventures were signed for the development of new prod-ucts in ‘‘-makership’’.For product development policies, brands tended to increase the number ofspecialized products by introducing new multipurpose vehicles (MPV, SUV,LCV, …), using standardized solutions for engines and space frames. Anotherdistinctive phenomenon was the increase of diesel engines by direct injection,the so-called ‘‘common rail-multi jet’’ (solution designed by FIAT, developedindustrially by Bosch, and soon applied by the greater part of European andJapanese carmakers, often with some technical improvements).Introduction of new technology for the assembly of material allowed for lightervehicle structures, and improved performance, fuel consumption and safety. Inthis area, the best performers were Audi and Ferrari for aluminium space framesolutions and Volkswagen for high resistance steels and the application of laserjunction welding techniques.
8 1 Historical Outlines and Industrial Strategies
Innovations in vehicle structure, and new generation diesel engine develop-ment, together with research for alternative energy supply solutions, led to asignificant increase in economic expenses in R&D, as compared to the previousdecade.In the meantime, production capacities in the major industrial areas (NorthAmerica and Japan, Western Europe and South Korea) were so large, themarket was flooded. As a consequence, in the latter half of the ‘90s, thecompetitive scenario became critical, and most carmakers without a stronglyestablished presence in every market found themselves in a financial crisis andwere obliged to aggregate to bigger industrial groups.Several concentrations and alliances between companies formed in this periodwould last into the next generation of important industrial assets. The principleones were Renault-Nissan, Daewoo’s acquisition by GM, Seat and Skoda’sacquisition by Wolkswagen, the co-makership alliance between Fiat and PSAfor light commercial vehicles and that between PSA and Ford for a new gen-eration of diesel engines.Conversely, other important ‘‘liaisons’’ between companies would be recon-sidered as a consequence of unsuccessful results: the GM-Fiat alliance waschanged from a total automotive collaboration to the single production ofDiesel-Multijet engines, while the Daimler-Chrysler joint effort was simplifiedto the selling of Chrysler on the Daimler Benz side.For other industrial compartments, such as heavy and medium commercialvehicles, or agricultural and construction equipment, similar alliances hadalready taken place in the past. For instance, IVECO, with the acquisition of theFiat/OM, Magirus, Unique, and Pegasus brands, was one of the most importantexamples. At the same time, CNH, which joined Fiat New Holland and Case,also became a worldwide company with its own industrial compartment.Strategic goals of these industrial integrations were:
• to reach important synergies from an economic point of view by using R&Don common platform and new investment;
• to increase contractual power in material, component and equipmentacquisition;
• to increase market shares on worldwide markets by widening the number ofmodels offered and leaving exclusive missions to single brands.
To reach these targets, the big carmakers followed the strategy of empoweringR&D capacities and the distinctive features of single brands, at the same timeassuring effectiveness in cooperation between the participant companies.Modern digital technologies for communication made data exchange andlogistic flows easier on a world scale.Even component and equipment suppliers followed the same strategies,assuming that ‘‘lean production’’ and total quality policies were the only way tobe competitive in the challenge determined by the carmakers.By the last period, Toyota and BMW had achieved major success, with marketshares increasing and economic results constantly in the positive, without the
1.1 Historical Outlines in the Automotive Industry 9
integration of any other company and solely through investment in productinnovation.In spite of a scaling down in economies, interest in special vehicles for elitecustomers did not decrease. Some important brands used new technologies todevelop original styles on a small scale and prestigious content for special cars:Porsche and Ferrari were the best brands for super cars, while other interestingsports cars were launched by BMW and Alfa Romeo.
G. 2005–Today International Crises and New Worldwide Scenarios in theAutomotive IndustryThe overall scenario in the automotive industry at this time was directly relatedto a big economic crisis involving all carmakers at a worldwide level. Over-production came head to head with a contraction in the car market. Thissituation led some carmakers to the edge of bankruptcy, all over the world butespecially in North America. In 2009, the US Government had to intervene tosave jobs and offered the chance of a controlled administration, providingtemporary funding to encourage new investments. The big three Americancarmakers, GM, Ford and Chrysler, were put under controlled administrationuntil a new industrial scenario could be conceived.Ford and General Motors, the two bigger of the three sisters, could count onmore robust industrial organizations, and so, through a deep review of theirindustrial and commercial strategies, were able to refresh their positions andensure the US government of a solid recovery plan.Chrysler was coming out of a failed joint venture with Daimler and wasincapable of reorganizing by itself. The American Government, after analysisof assorted possibilities, sponsored an alliance with FIAT that, in terms ofproduct range and powertrain technologies, could offer the right guaranteesof success. In only two years, industrial cooperation between the companies ledto a complete repayment of the government debt, and by the end of the summerof 2011, FIAT owned the majority of the stakeholders, taking Chrysler out ofbankruptcy.In this scenario, new joint ventures, like FIAT and Chrysler, give new structureto the role of the carmaker, while solutions for a more environmentally sus-tainable vehicle are required to solve the car market crisis definitively and givenew opportunities for refreshing the entire automotive industry, a scenario inwhich all remaining major carmakers attempt to move forward as fast as theycan, looking also to the evolution of social and political situations in the bigindustrial areas. In such an industrial world, the survival of a carmaker islinked more than ever to the possibility of sharing costs through alliances,gaining the right economy of scale, and trying to minimize all cost factorslinked to industrialization.
At the end of this historical overview, we must point out that the classificationof different periods has been used only for didactics, while, in practice, each periodis linked to the next by a continuous line and without a net separation.
10 1 Historical Outlines and Industrial Strategies
Actual individual periods are still difficult to determine from the point of viewof the automotive industry. In particular, European and North American carmakershave been reduced and have optimized their production sites. It is quite probablethat the ratio between offering and market request will smooth out among themajor producers in Europe, North America and Japan.
In the medium-long term period, carmakers and component producers who aresuccessful in overcoming these difficulties will then have to deal with a newscenario of deep change, as foreseen by that most esteemed international agency asoccurring between 2015 and 2020, due to certain macro-phenomena alreadyhappening:
– growth in the worldwide market in certain specific areas characterized by lowmanpower cost and a big potential market (China, India…)
– increase in the cost of petrol and natural gas (always critical resources in theglobal geopolitical situation);
– adoption of new energy-saving and anti-pollution policies (particularly severe),even in North America, beginning in the state of California and then spreadingout to the other states;
– vehicle access to urban centres and commercial vehicle limitation on highwaysof high traffic density in Europe.
To be less tied to petrol, engines must be adapted to alternative fuels, derivedfrom natural gas or from agricultural resources. Recently introduced hybridpowertrain systems, especially those by the Toyota Group, are very interestingfrom a performance and consumption standpoint in urban traffic, even if produc-tion costs are much too high to allow diffusion on a large scale. It has beenestimated that, from 2020 on, electric powertrain systems equipped with fuel cellswill be diffused, especially in urban centres in which anti-pollution restrictions areadopted.
On the other side, up to now major carmakers have made investments todevelop engines fueled by diesel, methane and petrol: multijet systems are appliedby using filters on exhaust. In this way, performance is improved and dangerousemissions are reduced at the same time. This will lead to some additional costs, butless so than for other new innovative solutions mentioned above.
Another strategy will be one for reducing the weight of vehicles, maintainingthe same features in loading capacity, internal comfort and ergonomics, but at thesame time improving active and passive safety.
Production systems will be progressively changed in relation to product inno-vations and the reduction of energy consumption on a CO2 plant emission level.
For all these reasons, to satisfy the demand for constant worldwide mobility,major vehicle producers and their suppliers (component and production systemsproducers) must cooperate with each other and with institutions to establishindustrially feasible restrictions. Only if the afore-mentioned technological pro-gress occurs will it be possible for an intensification of car traffic and commercialtransport of vehicles. At the same time, public services dedicated to mobility mustchange in parallel, becoming systems of active information for vehicles.
1.1 Historical Outlines in the Automotive Industry 11
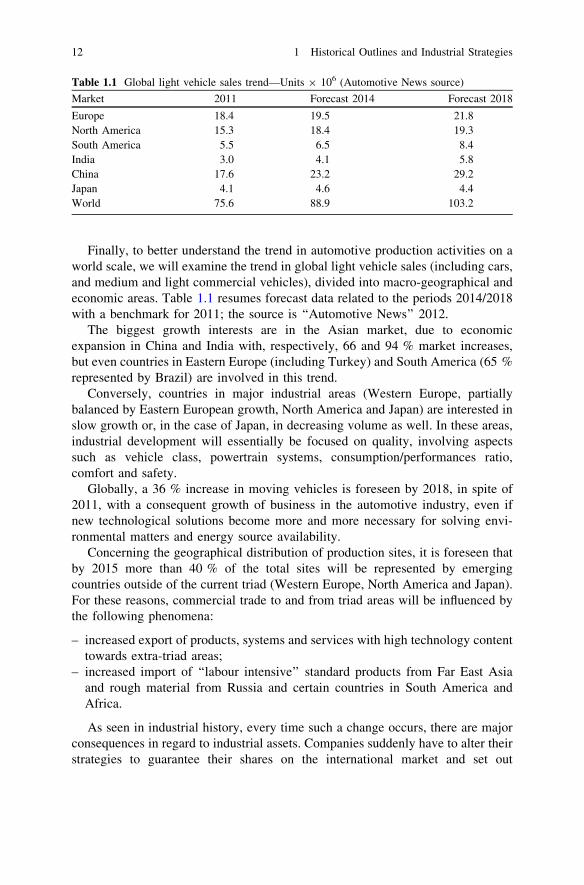
Finally, to better understand the trend in automotive production activities on aworld scale, we will examine the trend in global light vehicle sales (including cars,and medium and light commercial vehicles), divided into macro-geographical andeconomic areas. Table 1.1 resumes forecast data related to the periods 2014/2018with a benchmark for 2011; the source is ‘‘Automotive News’’ 2012.
The biggest growth interests are in the Asian market, due to economicexpansion in China and India with, respectively, 66 and 94 % market increases,but even countries in Eastern Europe (including Turkey) and South America (65 %represented by Brazil) are involved in this trend.
Conversely, countries in major industrial areas (Western Europe, partiallybalanced by Eastern European growth, North America and Japan) are interested inslow growth or, in the case of Japan, in decreasing volume as well. In these areas,industrial development will essentially be focused on quality, involving aspectssuch as vehicle class, powertrain systems, consumption/performances ratio,comfort and safety.
Globally, a 36 % increase in moving vehicles is foreseen by 2018, in spite of2011, with a consequent growth of business in the automotive industry, even ifnew technological solutions become more and more necessary for solving envi-ronmental matters and energy source availability.
Concerning the geographical distribution of production sites, it is foreseen thatby 2015 more than 40 % of the total sites will be represented by emergingcountries outside of the current triad (Western Europe, North America and Japan).For these reasons, commercial trade to and from triad areas will be influenced bythe following phenomena:
– increased export of products, systems and services with high technology contenttowards extra-triad areas;
– increased import of ‘‘labour intensive’’ standard products from Far East Asiaand rough material from Russia and certain countries in South America andAfrica.
As seen in industrial history, every time such a change occurs, there are majorconsequences in regard to industrial assets. Companies suddenly have to alter theirstrategies to guarantee their shares on the international market and set out
Table 1.1 Global light vehicle sales trend—Units 9 106 (Automotive News source)
Market 2011 Forecast 2014 Forecast 2018
Europe 18.4 19.5 21.8North America 15.3 18.4 19.3South America 5.5 6.5 8.4India 3.0 4.1 5.8China 17.6 23.2 29.2Japan 4.1 4.6 4.4World 75.6 88.9 103.2
12 1 Historical Outlines and Industrial Strategies
important financial resources for introducing innovation and finding new oppor-tunity for business.
At the end of this historical evolution, we can consider what follows:
– Change is a slow process that may very well become necessary, so, for acompany’s survival and success, it is important that the signals of imminentchange be recognized so that a company can react quickly.
– Production systems improve gradually, due to the pre-existing industrialsystems and occupational agreements; nevertheless, company strategiesmust constantly be focused on product/market targets, with a frequentassessment of one’s closest competitors.
– Industrial alliances are often a necessary step in approaching a new market,while product innovation and new technologies are necessary as well;cooperation must be considered to maximize benefit and convenience inexpanding product/market areas.
In the following, we will deal with criteria applied for the establishmentand management of production processes much more deeply related to thedevelopment of competitiveness of companies and their environmental andenergy-related sustainability.
As we will see in the next chapters, the most critical factor for the success ofindustrial projects is the ability to develop ‘‘lean’’ systems (easy to convertand to maintain), fully responding to ‘‘quality and innovation targets’’ forproducts.
1.2 Strategic Planning of Production Activities
Industrial strategies for development derive from studies of the evolution ofmarket and customer demand. They have to consider the existing technology tomake it easier to determine opportunities for innovation of the product and pro-duction processes. To identify priorities for research and investment plans, it isfundamental to evaluate the existing and potential industrial capacity of thecompany realistically, having in mind its weak and strong points, to direct effortstoward key success factors.
Figure 1.2 shows the three typical aspects involved in strategic planning. Thefinal target to be followed in cooperation with the different departments of acompany is the ‘‘value generation’’.
Company resources involved in the production process and productivity keymanagement indicators
Our focus is now on production processes, for which the major part of manu-facturing company resources (manpower, investments on systems and work in
1.1 Historical Outlines in the Automotive Industry 13

process, materials and energy) are normally employed. The typical key manage-ment indicators used to evaluate the effectiveness of the employment of resources,in terms of output/input ratio, are as follows:
Increasing these productivity factors helps to reduce the cost of productionand get the gross profit margin in positive numbers considering the same salesvalue/price of the products.
For this reason, in the following chapters we will be dealing with meth-odologies for analysis and improvement of such productivity indexes. Weshould also say that improvement plans must extend to the entire ‘‘supplychain’’, in consideration of an integrated production process.
mission
strategies
resources
plans
Industrial development
Technological and Normative scenario
Customers demandevolution
World-wide Markets
Competitorsand shares
Internal capacities Acquired capacities andpartnership
VALUE CREATION
Fig. 1.2 Activities for strategic planning process
1 Manpower productivity Quantity of transformed product/quantity of manpower orquantity of man-hours dedicated
2 Production systems productivity Quantity of transformed product/nr of days or hours usedfor producing
3 Direct material utilization degree Net direct material requirement based on design elements(final product)/gross requirement based ontransformation process
4 Energy and auxiliary materialsproductivity
Quantity of transformed product/specific energy andauxiliary materials used in transformation processes
5 Investments productivity Production capacity used during product industrial lifecycle/product specific investments
14 1 Historical Outlines and Industrial Strategies
Other strategic key success factorsThe above Key Management Indicators are directly connected to product
competitiveness, while sales success and company results are also dependent onthe following factors:
• Product quality and innovationValue/cost ratio determines product profitability, which depends mostly on theinnovative capacity of the company and on the quality level perceived bycustomers.This argument is considered in Chap. 8, dedicated to ‘‘continuous improve-ment’’ management.
• Customer service levelThis represents the capacity to respond in terms of timing, quality and quantityto the fulfilment of obligations engaged with final and intermediate customers.Methodologies for achieving a level of service towards customers are addressedin Chap. 6, dedicated to Management of Logistic Processes.It is very important to underline that the capacity to fulfil the product range inthe required mixed model, with short process lead time, is strictly related to thestrategies adopted for engineering of ‘‘Production Systems’’, as we will see inSect. 1.4.
• ‘‘Time to market’’This is the period of time necessary for the technical and industrial developmentof a product, starting from the definition of the ‘‘concept’’ or ‘‘style model’’ upto the commercial launch. The capacity to launch a new interesting productfaster than one’s competitors is directly linked to success in sales and thecompany’s resulting economics.This argument is considered in Chap. 2, dealing with new product developmentand engineering.
• Product and company brand imageThis fundamental aspect will be not approached in this text because it is anargument for marketing strategies. What is important to emphasize here is thefact that product and company brand image depend not only on communicationstrategies but especially on the perception by customers of a particular level ofquality. Brand image is sustained by product innovation that does not sacrificethe essential marks of its origins, considered important for brand distinction.
Industrial development and life cycle of a productFigure 1.3 shows the macro phases that feature in the industrial life and
development cycle of a product:The development of a new product requires preliminary research activities for
establishing performance and qualitative targets born out of the stated mission ofthe brand or company. Parallel to this, a qualitative and quantitative analysis ofmarket requests is run to define sales targets, as well as their relation to the best ofone’s competitors. In this way, the level of production required can be planned ona sufficiently wide temporal horizon.
1.2 Strategic Planning of Production Activities 15
After this phase, executive project and manufacturing engineering activitiesfollow. The development cycle of a new product ends with the start of productionand commercial launch in the market.
The industrial life cycle of a product begins with start of production and endswith completed sales in the market, even if the company has to provide technicalassistance and physical maintenance to customers subsequent to the sales. Anotherparameter is the technical life cycle, which depends on the product’s functionalduration (the actual use) and on technical and economic considerations.
In the following chapters, we will take a wide approach to matters related to newproduct industrialization and the management of their production systems, referringfrom a general point of view to their industrial development and life cycle.
1.3 Process Integration and ‘‘Make or Buy’’Decision-Making
A global industrial process includes everything from the final productions manageddirectly by the ‘‘carmakers’’ to the intermediate productions managed by first levelsuppliers and their sub-contractors, in other words, the so-called ‘‘supply chain’’.
In defining strategies for production activities, each of the companies involvedin the global industrial process has to establish which parts and modules must bemanufactured in their own plants, which have to be realized in ‘‘co-makership’’with other companies, by joint ventures and strategic industrial cooperation, and
Marketing Plan
Product Design
Production
Sales and After Sales Technical Assistance
Manufacturing Engineering
Market and Mission
Fig. 1.3 Product industrialcycle life
16 1 Historical Outlines and Industrial Strategies
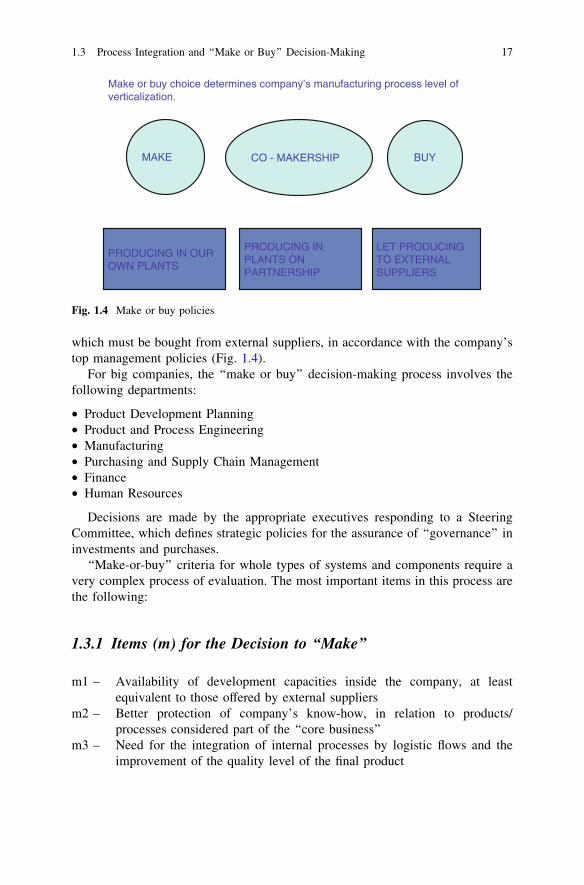
which must be bought from external suppliers, in accordance with the company’stop management policies (Fig. 1.4).
For big companies, the ‘‘make or buy’’ decision-making process involves thefollowing departments:
• Product Development Planning• Product and Process Engineering• Manufacturing• Purchasing and Supply Chain Management• Finance• Human Resources
Decisions are made by the appropriate executives responding to a SteeringCommittee, which defines strategic policies for the assurance of ‘‘governance’’ ininvestments and purchases.
‘‘Make-or-buy’’ criteria for whole types of systems and components require avery complex process of evaluation. The most important items in this process arethe following:
1.3.1 Items (m) for the Decision to ‘‘Make’’
m1 – Availability of development capacities inside the company, at leastequivalent to those offered by external suppliers
m2 – Better protection of company’s know-how, in relation to products/processes considered part of the ‘‘core business’’
m3 – Need for the integration of internal processes by logistic flows and theimprovement of the quality level of the final product
MAKE BUY
PRODUCING IN OUR OWN PLANTS
LET PRODUCING TO EXTERNAL SUPPLIERS
Make or buy choice determines company’s manufacturing process level of verticalization.
PRODUCING IN PLANTS ON PARTNERSHIP
CO - MAKERSHIP
Fig. 1.4 Make or buy policies
1.3 Process Integration and ‘‘Make or Buy’’ Decision-Making 17
m4 – Established invalidity of alternatives for the purchasing of components orservices
m5 – Necessity of utilizing existing productive capacities inside the company
1.3.2 Items (b) for the Decision to ‘‘Buy’’
b1 – No availability of specific ‘‘know’’ for developing the specific componentor service in a competitive way
b2 – Availability of reliable suppliers for the components or services required,in relation to the company’s targets
b3 – Availability of alternative supply sources in the geographical areas ofstrategic interest for the company
b4 – Opportunity to simplify internal production processes and focus productionresources (manpower and financial resources) on ‘‘core-business’’
b5 – Opportunity to reduce company-owned investment by using or increment-ing supplier’s available productive capacities, allowing them to assume therisk of volume dependent on market trends
1.3.3 Items (c) for the Decision for ‘‘Co-Makership’’
c1 – New necessities for the development of production capacities but notenough economic scale to proceed autonomously
c2 – Partners have common or complementary interest in developing the newsolutions required to guarantee the industrial mission in a synergic andcompetitive way
c3 – Partners have complementary or synergic technological capacities at theirdisposal so that product/process innovation can be sped up withoutincurring economic investment
The above decision-making criteria establish the guide line for ‘‘make or buy’’choices and/or industrial cooperation and, as a consequence, operative instructionsare assumed.
At any rate, specific analysis may be required for new industrial initiatives,comparing economic data of alternative solutions by considering:
• Variable production costs (for direct material and for transformation process);• Fixed costs consequent to company’s R&D department;
18 1 Historical Outlines and Industrial Strategies
• Investments for internal manufacturing or external purchasing (suppliers’contribution);
• Other eventual costs derived from fixed costs.
‘‘In-sourcing’’ or ‘‘out-sourcing’’ policies involve not only product componentsbut research and development services, equipment construction, maintenance,logistics, information technologies and other accessory services. The criteria fol-lowed are almost the same as above and must take into consideration economicadvantages obtainable over long periods (from 2 to 4 years), involving specializedcompanies operating on a large market scale (system and service providers).
‘‘Make-or-buy’’ choices influence a company’s structure and assets, capitalinvested and economic profitability. For these reasons, an accurate cost/benefitanalysis for a medium/long term period is needed, making clear that incoherentdecisions could highly compromise the level of quality and competitiveness of thefinal product.
The ‘‘verticalization degree’’ of a company’s production activities is rep-resented by this ratio: total cost of internal manufacturing processes/total costof sale products plant free.
Beginning in the second half of the 1980s, carmaker strategies have beenoriented towards progressively reducing the verticalization degree. Conversely,companies have widened the range of products offered, increasing their presenceon international markets.
Production activities verticalization in plants manufacturing cars and lightcommercial vehicles has a range of a 25 % minimum up to a 30 % maximum,including the manufacturing of powertrain systems (autonomous or in co maker-ship) and excluding components produced by companies that are part of the sameindustrial group but operate independently on the market. Industrial vehicle plantsnormally have a minor verticalization degree.
Actually, in Europe, the more vertical carmaker plants are those of Volkswa-gen, Mercedes, P.S.A. and Auto Vaz, while the less vertical plants belong toBMW, Volvo, Saab, Jaguar and Porsche. North American and Japanese plantsgenerally have a minor verticalization degree in spite of the example of those inEurope.
1.4 Manufacturing Systems Set-Up and Location Criteria
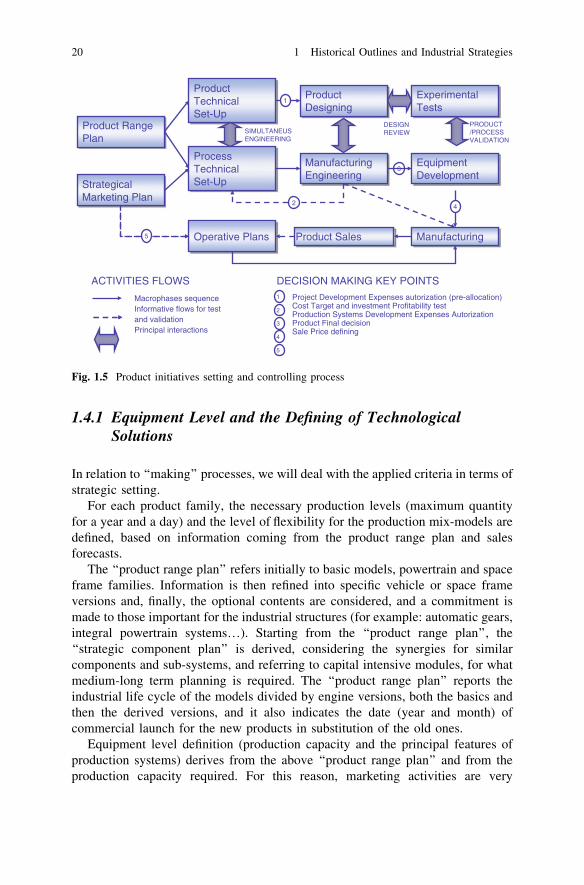
Referring to the carmakers’ and component producers’ ‘‘best practices’’, Fig. 1.5represents how the decision-making and management process of the industrialinitiatives for new product development, or production capacity empowerment,work.
1.3 Process Integration and ‘‘Make or Buy’’ Decision-Making 19
1.4.1 Equipment Level and the Defining of TechnologicalSolutions
In relation to ‘‘making’’ processes, we will deal with the applied criteria in terms ofstrategic setting.
For each product family, the necessary production levels (maximum quantityfor a year and a day) and the level of flexibility for the production mix-models aredefined, based on information coming from the product range plan and salesforecasts.
The ‘‘product range plan’’ refers initially to basic models, powertrain and spaceframe families. Information is then refined into specific vehicle or space frameversions and, finally, the optional contents are considered, and a commitment ismade to those important for the industrial structures (for example: automatic gears,integral powertrain systems…). Starting from the ‘‘product range plan’’, the‘‘strategic component plan’’ is derived, considering the synergies for similarcomponents and sub-systems, and referring to capital intensive modules, for whatmedium-long term planning is required. The ‘‘product range plan’’ reports theindustrial life cycle of the models divided by engine versions, both the basics andthen the derived versions, and it also indicates the date (year and month) ofcommercial launch for the new products in substitution of the old ones.
Equipment level definition (production capacity and the principal features ofproduction systems) derives from the above ‘‘product range plan’’ and from theproduction capacity required. For this reason, marketing activities are very
Product Range Plan
Strategical Marketing Plan
Product Technical Set-Up
Product Designing
Experimental Tests
Process Technical Set-Up
Manufacturing Engineering
Equipment Development
Operative Plans Product Sales Manufacturing
1
3
2 4
5
SIMULTANEUS ENGINEERING
DESIGN REVIEW
PRODUCT /PROCESS VALIDATION
ACTIVITIES FLOWS DECISION MAKING KEY POINTS
Macrophases sequenceInformative flows for test and validationPrincipal interactions
Project Development Expenses autorization (pre-allocation)Cost Target and investment Profitability testProduction Systems Development Expenses AutorizationProduct Final decisionSale Price defining
1
2
3
4
5
Fig. 1.5 Product initiatives setting and controlling process
20 1 Historical Outlines and Industrial Strategies
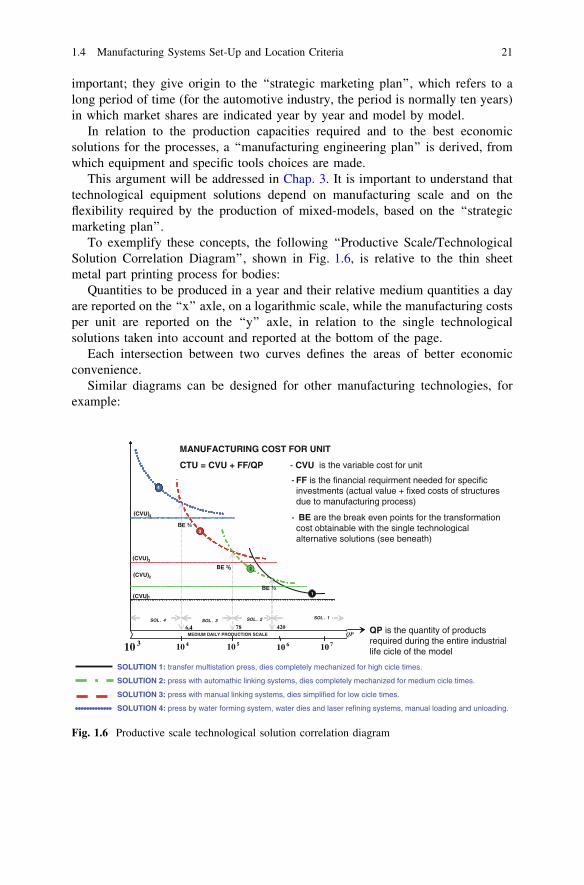
important; they give origin to the ‘‘strategic marketing plan’’, which refers to along period of time (for the automotive industry, the period is normally ten years)in which market shares are indicated year by year and model by model.
In relation to the production capacities required and to the best economicsolutions for the processes, a ‘‘manufacturing engineering plan’’ is derived, fromwhich equipment and specific tools choices are made.
This argument will be addressed in Chap. 3. It is important to understand thattechnological equipment solutions depend on manufacturing scale and on theflexibility required by the production of mixed-models, based on the ‘‘strategicmarketing plan’’.
To exemplify these concepts, the following ‘‘Productive Scale/TechnologicalSolution Correlation Diagram’’, shown in Fig. 1.6, is relative to the thin sheetmetal part printing process for bodies:
Quantities to be produced in a year and their relative medium quantities a dayare reported on the ‘‘x’’ axle, on a logarithmic scale, while the manufacturing costsper unit are reported on the ‘‘y’’ axle, in relation to the single technologicalsolutions taken into account and reported at the bottom of the page.
Each intersection between two curves defines the areas of better economicconvenience.
Similar diagrams can be designed for other manufacturing technologies, forexample:
SOLUTION 1: transfer multistation press, dies completely mechanized for high cicle times.
SOLUTION 2: press with automathic linking systems, dies completely mechanized for medium cicle times.
SOLUTION 3: press with manual linking systems, dies simplified for low cicle times.
SOLUTION 4: press by water forming system, water dies and laser refining systems, manual loading and unloading.
(CVU)1(CVU)1 1
CTU = CVU + FF/QP - CVU
4
BE ²/3
6,4 78 420
(CVU)2
(CVU)3
(CVU)4
BE ½
BE ¾
2
3
4
10 3 10 4 10 5 10 6 10 7
SOL . 3 SOL . 2 SOL . 1
MANUFACTURING COST FOR UNIT
is the variable cost for unit
- FF is the financial requirment needed for specificinvestments (actual value + fixed costs of structuresdue to manufacturing process)
- BE are the break even points for the transformationcost obtainable with the single technologicalalternative solutions (see beneath)
QP is the quantity of productsrequired during the entire industrial life cicle of the model
MEDIUM DAILY PRODUCTION SCALE
SOL . 4
QP
Fig. 1.6 Productive scale technological solution correlation diagram
1.4 Manufacturing Systems Set-Up and Location Criteria 21
– for final assembly operations, completely manual assembly stations for littleseries production are followed by automatic operation cells for medium seriesproduction, and then full automatic systems for big series production;
– for mechanical machining, by increase in production scale, ‘‘stand alone’’machine tools are followed by multi-operational ‘‘machining centres’’ and then‘‘transfer lines’’ for high cycle times;
– for foundry processes, by increase in production scale, casting manual stationsare followed by automatic cells and then completely automatic lines for highcycle times.
In searching for the best technological solutions, in addition to considering theproductive scale, it is also important to analyse specific features for each product,and identify common and distinctive aspects for each part, in relation to thetransformation processes. According to the availability of flexible and convertiblelines, considering also the production volumes and the mix delivered, the best andmost effective solutions for high productivity and flexibility are chosen.
Criteria for choosing a location for manufacturing activitiesIn deciding the most convenient place for the location of production capacities,
alternative solutions should be considered, based on the following questions:
(1) Is it convenient to locate the production activity in an existing production site,with an established level of technological know-how and manpoweravailability?
(2) Are there existing production sites with sufficient area and basic equipment toallow for a significant reduction in the initial investment as compared tostarting from scratch?
(3) In the case of new solutions, where are the best conditions to be found in termsof scouting human resources and a supply of energy and material at the lowestindustrial cost?
(4) Among available geographical locations, which is the more convenient fromthe point of view of material and component supply (also considering customfees)?
(5) Which is the more convenient geographical solution for dispatching the finalproduct to the markets?
(6) In case it is convenient to divide production activities between two or moresites, what solutions make for more effective operative flexibility?
Along with the above, it is also important to consider these other geographicalconsiderations:
• Legal conditions and fiscal policies favourable for industrial development;• Existing infrastructure for the delivery of goods, supply of water and energy,
and process material exhaustion;• Ease in recovering necessary manpower and the possibility of extending
working times, for optimal use of production systems;
22 1 Historical Outlines and Industrial Strategies
• Probability of obtaining quick authorization from the local legal entities forbuilding and general equipment construction;
• Availability of potential funds for employment development in specific areas.
The location of manufacturing activities for the same product and plannedvolumes can also influence the automation level processes. In fact, the higher themanufacturing cost, the more convenient it is to parse out the automation level.Criteria for analysis are the same as shown above in the diagrams correlatingvolumes/technologies, considering the right cost parameters in relation to indus-trial site choice.
Based on the above items, it is clear that decisions concerning equipment leveland manufacturing locations require a complex decision-making process that mustbe supported by specific economic investigations.
Finally, we resume the ultimate purpose for the strategic planning of set-ting technologies and the location of manufacturing activities:
• setting production capacities according to medium/long term marketingplan;
• assuring necessary qualitative and quantitative levels for products, atminimum industrial cost, including direct material, its transformation andassembly, final tests and their dispatching;
• assuring delivering lead times and service levels useful for the commercialand after-market networks;
• restricting the company’s financial resources, considering cooperation for‘‘co-makership’’ and local public fund opportunities.
1.5 Overview of Technologies for Materials Appliedto the Construction of Vehicles
Here is a list of the principal technological processes applied to the production ofspecific mechanical parts and the assembly of powertrain systems, bodies and finalvehicles:
1. Foundry and League Treatments Processes: cast iron and aluminium foundriesby sand or semi-permanent castings. These processes require basic invest-ments and are labour, mining and energy intensive. Furthermore, exhaustionand regeneration costs for the processing of residual materials are required.
2. Massive Steel Parts Printing: forging, hot and cold extrusion, combinedcycles. These processes require great investment, are electric energy con-sumption intensive and use processed materials with high costs (rapid wearmoulding). Their merit is the obtainment of parts that do not require othermachining operations for over metal removal.
1.4 Manufacturing Systems Set-Up and Location Criteria 23
3 Composed Metal Dust Sintering: these processes require a special technologyand significant basic investment. Same considerations as previous point.
4. Metal Removal Machining, Heat Treatments and Super Finishing: by specialmachine tools, machining centres, multi-station and multi-tools systems, andequipment for heat treatment and special antiware metals. These processesrequire initially high basic and then product-dedicated investment.
5. Thin Laminated Steel and Aluminium Parts Printing, by shearing machining,printing, refining, folding and coining under press machine. These processesrequire initially very high basic and then product-dedicated investment. Thedegree of construction specifications for mouldings and raw material usageinfluence economic convenience of the process and quality of the finalproduct.
6. Plastic Parts Printing, by injection printing, injection-compression, extrusionand relative processes for coating and joining parts. These processes requireinitially high basic and then product-dedicated investment. Requirements ofmaterial features and construction highly influence the economic convenienceof the process and quality of the final product.
7. Assembling and Joining of Steel Parts: by resistance welding, laser weldingwith or without metal amount carried over, MIG/TIG welding, cold welding,etc. These processes require initially high basic and then product-dedicatedinvestment and are also labour intensive. The degree of technical features oftooling and equipment utilization influence the economic convenience of theprocess and quality of the final product.
8. Protection Coating and Painting Process for Bodies, Cabins and SpaceFrames: these processes require high basic investment, and are energy, processmaterial and even labour intensive. The degree of the material’s technicalfeatures and utilization for these resources highly influence the economicconvenience of the process and the quality of the final product.
9. Mechanical Groups Assembly and On Vehicle Installation: these processesrequire high basic investments, and are energy, process material and evenlabour intensive. They also involve high logistic complexity and have a highimpact on product availability and quality level from a customer point ofview.
10. Modules and Vehicle Final Assembly: these processes require high basicinvestment and are labour intensive. They also involve high logistic com-plexity and have a high impact on product availability and quality level from acustomer point of view.
Carmakers and mechanical parts producers must exert tight control over theseten technological areas mentioned above, directly, when processes are developedinside the company, and indirectly, when they are the work of external suppliers,but still controlled by the carmakers. These technological areas are strictly relatedto the ‘‘supply chain’’ phases and require specific investment for product design,normally provided by the purchaser.
24 1 Historical Outlines and Industrial Strategies

Furthermore, automotive production also requires other important tech-nological contributions, typically developed autonomously by specializedsuppliers, which are independent from carmakers. These technologies areconnected to the following elements or vehicle sub-systems:
(a) Powertrain Systems
– High Specialization Standard Mechanical Components (pistons, valves, oilpumps, turbo chargers…)
– Engine Supply Functional Modules– Exhaustion and Silencing Functional Systems– Engine Thermal Systems– Powertrain Transmission Functional Modules and Special Components– Fluidic Tight Capacity Plastic Elements– Engine Electrical System Components– Powertrain Electronic Control Systems
(b) Vehicle General Assembling Systems
– On Board Instruments and Info-Systems– Air Conditioning Systems– Lighting and Vision Functional Modules– Seat Modules– Door Opening and Closing Leverages– Safety Systems for Body Cell (air bag, safety belts…)– Fluidic Tight Capacity Plastic Elements
(c) Vehicle General Systems
– Tires and Wheel Rims– Breaking System Functional Modules and Special Components– Suspension Functional Modules and Special Components– Steering Wheel Leverage Functional Modules and Special Components– Fuel Tank and Pump Functional Modules– Electric Power Supply Modules– Electric Wiring and Connections– Oleo Dynamic and Pneumatic Equipment Elements– Acoustic and Thermal Insulation Element– Vehicle Electronic Control Systems
Those elements and systems are based on ‘‘evolved technological solutions’’,the ‘‘know-how’’ of which generally belongs to specialized companies that pro-duce components; these companies are able to supply all carmakers on a largemarket scale, being the owners of autonomous R&D departments. Anyway, astrong cooperation between those companies and the carmakers is necessary incase of the development of technical projects and experimentation and homolo-gation on vehicle phases.
It is relevant to observe that electrical and electronic contents included onvehicles have grown exponentially over the last decade, a trend that will probably
1.5 Overview of Technologies for Materials Applied 25
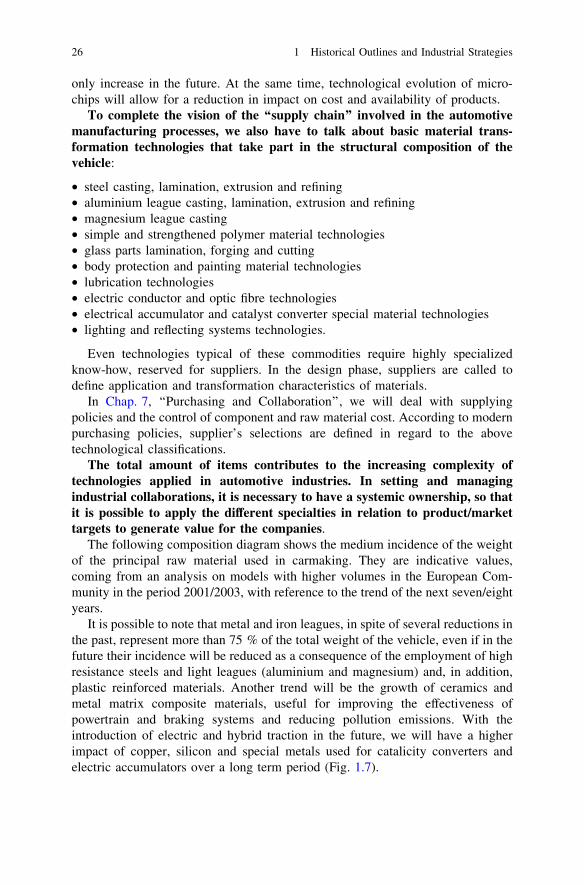
only increase in the future. At the same time, technological evolution of micro-chips will allow for a reduction in impact on cost and availability of products.
To complete the vision of the ‘‘supply chain’’ involved in the automotivemanufacturing processes, we also have to talk about basic material trans-formation technologies that take part in the structural composition of thevehicle:
• steel casting, lamination, extrusion and refining• aluminium league casting, lamination, extrusion and refining• magnesium league casting• simple and strengthened polymer material technologies• glass parts lamination, forging and cutting• body protection and painting material technologies• lubrication technologies• electric conductor and optic fibre technologies• electrical accumulator and catalyst converter special material technologies• lighting and reflecting systems technologies.
Even technologies typical of these commodities require highly specializedknow-how, reserved for suppliers. In the design phase, suppliers are called todefine application and transformation characteristics of materials.
In Chap. 7, ‘‘Purchasing and Collaboration’’, we will deal with supplyingpolicies and the control of component and raw material cost. According to modernpurchasing policies, supplier’s selections are defined in regard to the abovetechnological classifications.
The total amount of items contributes to the increasing complexity oftechnologies applied in automotive industries. In setting and managingindustrial collaborations, it is necessary to have a systemic ownership, so thatit is possible to apply the different specialties in relation to product/markettargets to generate value for the companies.
The following composition diagram shows the medium incidence of the weightof the principal raw material used in carmaking. They are indicative values,coming from an analysis on models with higher volumes in the European Com-munity in the period 2001/2003, with reference to the trend of the next seven/eightyears.
It is possible to note that metal and iron leagues, in spite of several reductions inthe past, represent more than 75 % of the total weight of the vehicle, even if in thefuture their incidence will be reduced as a consequence of the employment of highresistance steels and light leagues (aluminium and magnesium) and, in addition,plastic reinforced materials. Another trend will be the growth of ceramics andmetal matrix composite materials, useful for improving the effectiveness ofpowertrain and braking systems and reducing pollution emissions. With theintroduction of electric and hybrid traction in the future, we will have a higherimpact of copper, silicon and special metals used for catalicity converters andelectric accumulators over a long term period (Fig. 1.7).
26 1 Historical Outlines and Industrial Strategies
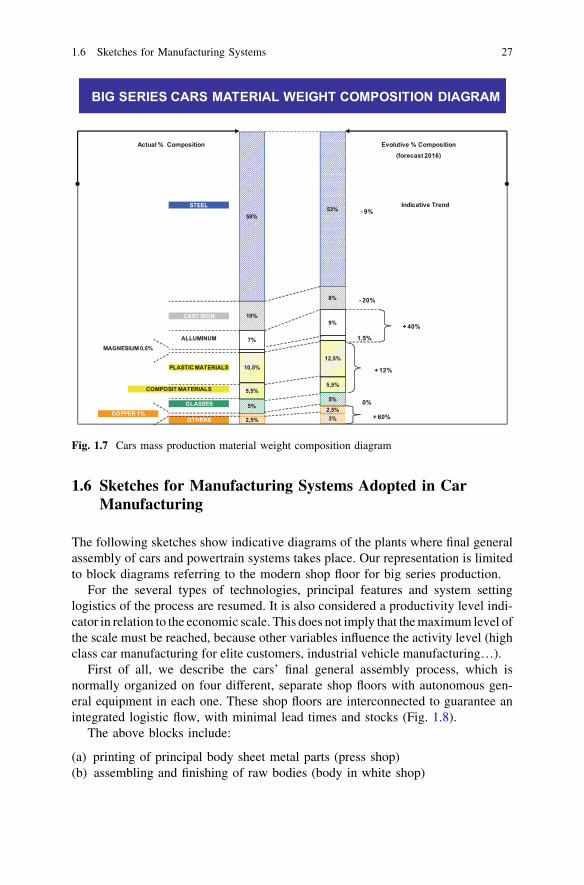
1.6 Sketches for Manufacturing Systems Adopted in CarManufacturing
The following sketches show indicative diagrams of the plants where final generalassembly of cars and powertrain systems takes place. Our representation is limitedto block diagrams referring to the modern shop floor for big series production.
For the several types of technologies, principal features and system settinglogistics of the process are resumed. It is also considered a productivity level indi-cator in relation to the economic scale. This does not imply that the maximum level ofthe scale must be reached, because other variables influence the activity level (highclass car manufacturing for elite customers, industrial vehicle manufacturing…).
First of all, we describe the cars’ final general assembly process, which isnormally organized on four different, separate shop floors with autonomous gen-eral equipment in each one. These shop floors are interconnected to guarantee anintegrated logistic flow, with minimal lead times and stocks (Fig. 1.8).
The above blocks include:
(a) printing of principal body sheet metal parts (press shop)(b) assembling and finishing of raw bodies (body in white shop)
BIG SERIES CARS MATERIAL WEIGHT COMPOSITION DIAGRAM
STEEL
58%
10%
7%
10,5%
5,5%
5%
2,5%
CAST IRON
ALLUMINUMMAGNESIUM 0,5%
PLASTIC MATERIALS
COMPOSIT MATERIALS
GLASSES
OTHERSCOPPER 1%
Actual % Composition
53%
8%
9%
12,5%
5,5%
5%
2,5%3%
Evolutive % Composition(forecast 2016)
1,5%
- 9%
- 20%
+ 40%
+ 12%
0%
+ 60%
Indicative Trend
Fig. 1.7 Cars mass production material weight composition diagram
1.6 Sketches for Manufacturing Systems 27
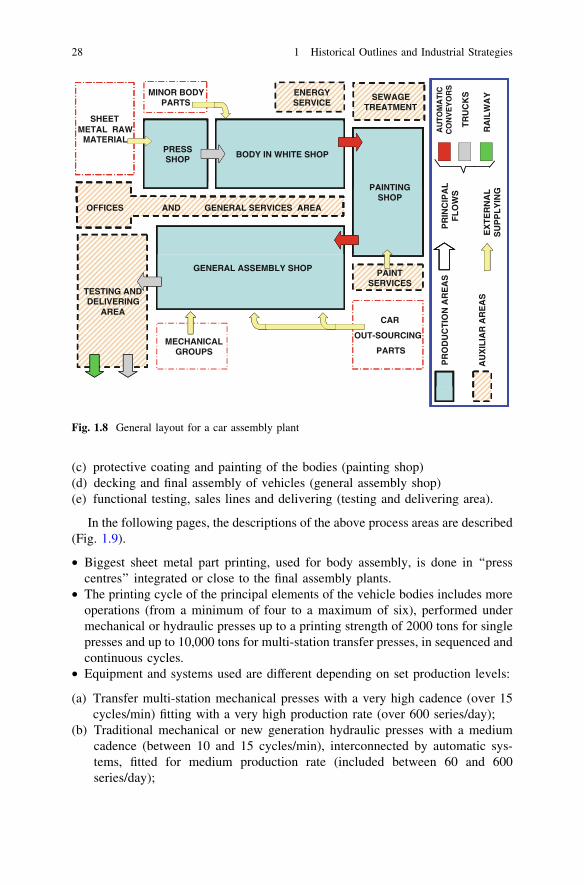
(c) protective coating and painting of the bodies (painting shop)(d) decking and final assembly of vehicles (general assembly shop)(e) functional testing, sales lines and delivering (testing and delivering area).
In the following pages, the descriptions of the above process areas are described(Fig. 1.9).
• Biggest sheet metal part printing, used for body assembly, is done in ‘‘presscentres’’ integrated or close to the final assembly plants.
• The printing cycle of the principal elements of the vehicle bodies includes moreoperations (from a minimum of four to a maximum of six), performed undermechanical or hydraulic presses up to a printing strength of 2000 tons for singlepresses and up to 10,000 tons for multi-station transfer presses, in sequenced andcontinuous cycles.
• Equipment and systems used are different depending on set production levels:
(a) Transfer multi-station mechanical presses with a very high cadence (over 15cycles/min) fitting with a very high production rate (over 600 series/day);
(b) Traditional mechanical or new generation hydraulic presses with a mediumcadence (between 10 and 15 cycles/min), interconnected by automatic sys-tems, fitted for medium production rate (included between 60 and 600series/day);
ENERGYSERVICE
SEWAGE TREATMENT
SHEET
MINOR BODYPARTS
RU
CK
S
ILW
AY
TO
MA
TIC
V
EY
OR
S
PRESSSHOP BODY IN WHITE SHOP
METAL RAW
MATERIAL
L
T RA
AU
CO
N
PAINTINGSHOP
OFFICES AND GENERAL SERVICES AREA
PR
INC
IPA
FL
OW
S
EX
TE
RN
AL
S
UP
PL
YIN
G
GENERAL ASSEMBLY SHOP PAINT SERVICES
TESTING AND DELIVERING
AREA
ON
AR
EA
S
RE
AS
CAR
OUT-SOURCING
PARTSMECHANICAL
GROUPS
PR
OD
UC
TI
AU
XIL
IAR
A
Fig. 1.8 General layout for a car assembly plant
28 1 Historical Outlines and Industrial Strategies
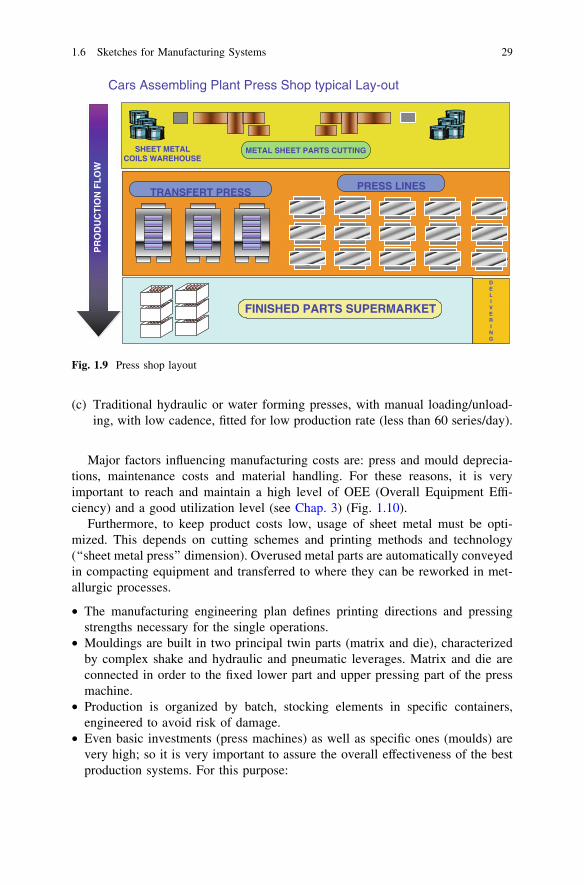
(c) Traditional hydraulic or water forming presses, with manual loading/unload-ing, with low cadence, fitted for low production rate (less than 60 series/day).
Major factors influencing manufacturing costs are: press and mould deprecia-tions, maintenance costs and material handling. For these reasons, it is veryimportant to reach and maintain a high level of OEE (Overall Equipment Effi-ciency) and a good utilization level (see Chap. 3) (Fig. 1.10).
Furthermore, to keep product costs low, usage of sheet metal must be opti-mized. This depends on cutting schemes and printing methods and technology(‘‘sheet metal press’’ dimension). Overused metal parts are automatically conveyedin compacting equipment and transferred to where they can be reworked in met-allurgic processes.
• The manufacturing engineering plan defines printing directions and pressingstrengths necessary for the single operations.
• Mouldings are built in two principal twin parts (matrix and die), characterizedby complex shake and hydraulic and pneumatic leverages. Matrix and die areconnected in order to the fixed lower part and upper pressing part of the pressmachine.
• Production is organized by batch, stocking elements in specific containers,engineered to avoid risk of damage.
• Even basic investments (press machines) as well as specific ones (moulds) arevery high; so it is very important to assure the overall effectiveness of the bestproduction systems. For this purpose:
FINISHED PARTS SUPERMARKET
METAL SHEET PARTS CUTTING
DELIVERING
SHEET METALCOILS WAREHOUSE
PR
OD
UC
TIO
N F
LO
WCars Assembling Plant Press Shop typical Lay-out
PRESS LINESTRANSFERT PRESS
Fig. 1.9 Press shop layout
1.6 Sketches for Manufacturing Systems 29
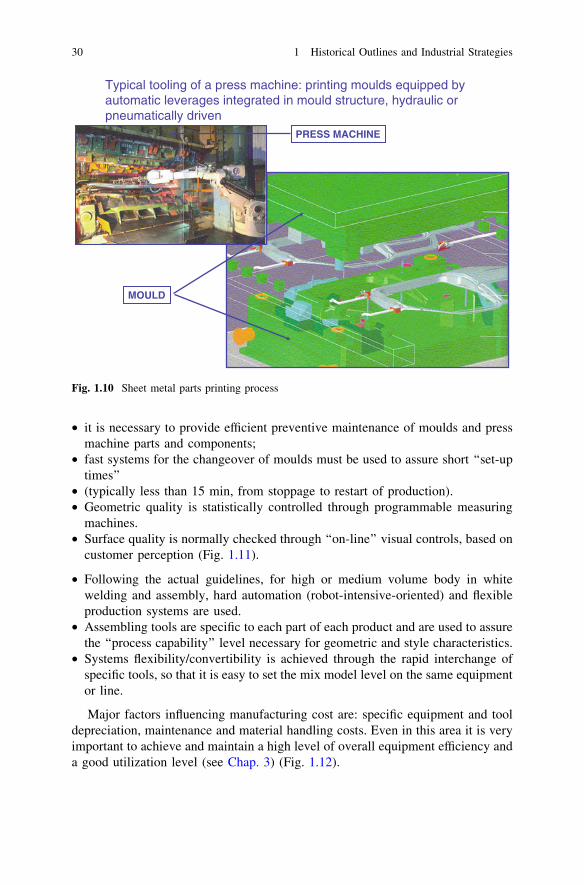
• it is necessary to provide efficient preventive maintenance of moulds and pressmachine parts and components;
• fast systems for the changeover of moulds must be used to assure short ‘‘set-uptimes’’
• (typically less than 15 min, from stoppage to restart of production).• Geometric quality is statistically controlled through programmable measuring
machines.• Surface quality is normally checked through ‘‘on-line’’ visual controls, based on
customer perception (Fig. 1.11).
• Following the actual guidelines, for high or medium volume body in whitewelding and assembly, hard automation (robot-intensive-oriented) and flexibleproduction systems are used.
• Assembling tools are specific to each part of each product and are used to assurethe ‘‘process capability’’ level necessary for geometric and style characteristics.
• Systems flexibility/convertibility is achieved through the rapid interchange ofspecific tools, so that it is easy to set the mix model level on the same equipmentor line.
Major factors influencing manufacturing cost are: specific equipment and tooldepreciation, maintenance and material handling costs. Even in this area it is veryimportant to achieve and maintain a high level of overall equipment efficiency anda good utilization level (see Chap. 3) (Fig. 1.12).
MOULD
Typical tooling of a press machine: printing moulds equipped by automatic leverages integrated in mould structure, hydraulic or pneumatically driven
PRESS MACHINE
Fig. 1.10 Sheet metal parts printing process
30 1 Historical Outlines and Industrial Strategies
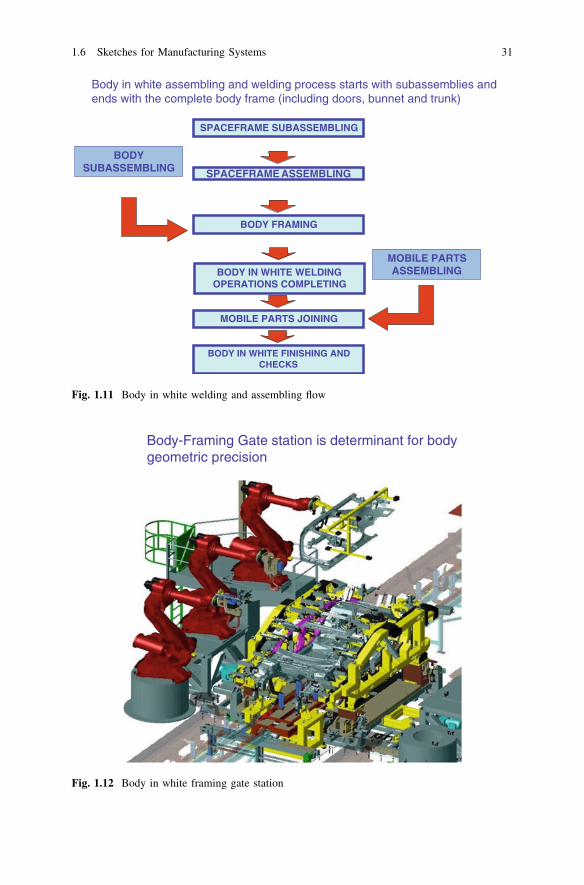
Body-Framing Gate station is determinant for body geometric precision
Fig. 1.12 Body in white framing gate station
SPACEFRAME SUBASSEMBLING
SPACEFRAME ASSEMBLING
BODY FRAMING
MOBILE PARTS JOINING
MOBILE PARTS ASSEMBLING
Body in white assembling and welding process starts with subassemblies and ends with the complete body frame (including doors, bunnet and trunk)
BODY SUBASSEMBLING
BODY IN WHITE FINISHING AND CHECKS
BODY IN WHITE WELDING OPERATIONS COMPLETING
Fig. 1.11 Body in white welding and assembling flow
1.6 Sketches for Manufacturing Systems 31
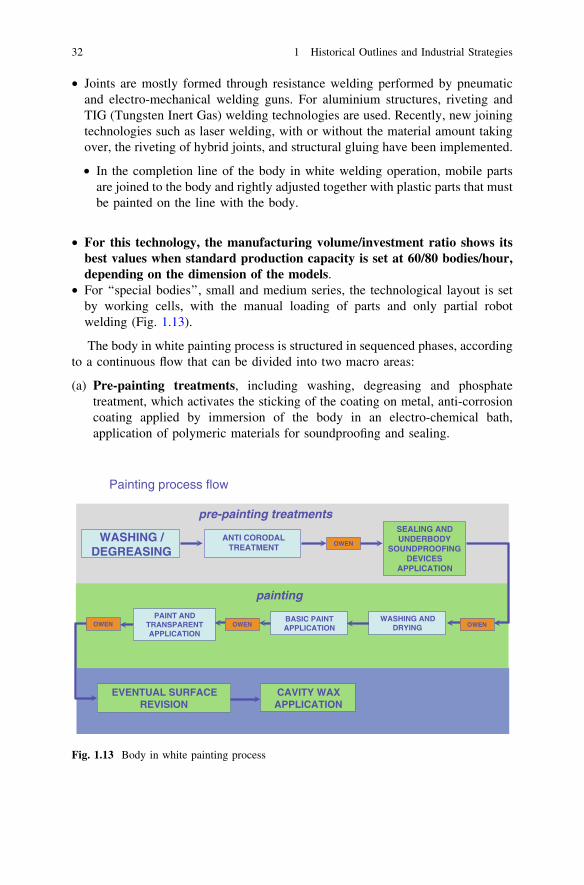
• Joints are mostly formed through resistance welding performed by pneumaticand electro-mechanical welding guns. For aluminium structures, riveting andTIG (Tungsten Inert Gas) welding technologies are used. Recently, new joiningtechnologies such as laser welding, with or without the material amount takingover, the riveting of hybrid joints, and structural gluing have been implemented.
• In the completion line of the body in white welding operation, mobile partsare joined to the body and rightly adjusted together with plastic parts that mustbe painted on the line with the body.
• For this technology, the manufacturing volume/investment ratio shows itsbest values when standard production capacity is set at 60/80 bodies/hour,depending on the dimension of the models.
• For ‘‘special bodies’’, small and medium series, the technological layout is setby working cells, with the manual loading of parts and only partial robotwelding (Fig. 1.13).
The body in white painting process is structured in sequenced phases, accordingto a continuous flow that can be divided into two macro areas:
(a) Pre-painting treatments, including washing, degreasing and phosphatetreatment, which activates the sticking of the coating on metal, anti-corrosioncoating applied by immersion of the body in an electro-chemical bath,application of polymeric materials for soundproofing and sealing.
WASHING / DEGREASING
BASIC PAINT APPLICATION
SEALING AND UNDERBODY
SOUNDPROOFING DEVICES
APPLICATION
CAVITY WAX APPLICATION
ANTI CORODAL TREATMENT
EVENTUAL SURFACE REVISION
OWEN
Painting process flow
pre-painting treatments
painting
OWENOWENPAINT AND
TRANSPARENT APPLICATION
OWENWASHING AND
DRYING
Fig. 1.13 Body in white painting process
32 1 Historical Outlines and Industrial Strategies

(b) Painting, applied by automatic robots with an electrostatic spray, in condi-tioned cabins with a high level of air change, controlled temperature andhumidity, so as to assure the elimination of the ‘‘over spray’’ phenomenon andfast evaporation of solvent or basic water coating.
After each phase, polymerization is completed by layer exsiccation, obtained bycontinuous flow ovens, and followed by an accurate washing with deionised water.
Focal points for the correct management of the above processes are:
– material usage control (high quality and expensive ones);– fluidic and filtering equipment preventive maintenance;– a rigorous clearing of the above equipment;– painting and spray systems logistic management;– quality control by process parameters and quality of manual job leading.– The gaseous, liquid and solid process materials rejected are also relevant, and
must be treated before exhaustion according to strict legal guidelines.
For this technology, the manufacturing volume/investment ratio shows itsbest values when standard production capacity is set at 60/80 bodies/hour forpart a) of the process and at 30/40 bodies/hour for part b). It is thus normalfor the same pre-painting treatment equipment unit to supply enough workfor two painting equipment units.
Major factors influencing manufacturing cost are: specific direct material andenergy consumption, manpower necessary to manage the process and equipmentmaintenance costs (Fig. 1.14).
For continuous flow in the general assembly of cars and commercial vehicles,or stop and go, lines with interconnected stations are used, managing fixedsequences of production. Lines can be divided into the following principalassembly sub-processes:
(a) Pre-Decking AssemblyIt starts with doors disassembled from the painted body. The doors areremoved to facilitate assembly of the operation inside the body and, once thedressing is completed, they are handled by automatic conveyors to the finalassembly area; the subsequent operations are fluidic and electrical installa-tions, cockpit, instruments, steering leverage and fuel tank assembly on thevehicle.The painted body is moved to assembly stations through a double rail chainconveyor or self-moving conveyor, equipped with a hanging hook able torotate across the translation axle to facilitate the best ergonomic condition forunderbody operations.Completed cockpit module and instruments and door modules are prepared indedicated stations to the side of the principal line, and conveyed directly to thepoint of installation on the vehicle, according to the production sequencescheduled through programmed systems.
1.6 Sketches for Manufacturing Systems 33

(b) Mechanical Assembly and DeckingThis important assembly phase of the process is made on line immediatelyafter the previous one and includes the on-body assembly of the followingmechanical groups: powertrain system, transmission groups, suspension sys-tems, and exhaustion pipes. These groups are prepared in the ‘‘mechanicalassembly’’ area and transferred to the ‘‘decking’’ area by synchronic conveyorsystems. The joining to the body is normally performed by multi-head auto-matic screwing systems, with controlled fastening torque.
(c) Final AssemblyThis phase is also connected to the previous one, but the same ‘‘decking’’ linecould feed two parallel ‘‘final assembly’’ lines, in case it is necessary to divideproduction flow for different models with the same space frame. Each ‘‘finalassembly’’ line is divided into three sequential parts.In the first part, preassembled bodies coming from the decking area are put onspecial supports to be transferred by a stop and go system to the next station. Inthe modern plants, the bodies are arranged across the line axle in this phase tofacilitate ‘‘front-end’’ module assembly and to keep electric battery, air filtersand engine connections operations ergonomic. Fixed glasses are also assem-bled by automatic systems in this part. For the subsequent operations, such aswheel assembly, the body is again arranged on the line axle.
HANGING CONVEYOR WITH VARIABLE TRIM
Bodies input
SIDE LINE
OVERHEAD CONVEYOR
SCREWING SYSTEMS
Connessioneal veicolo
Applicazione paraurti
Montaggio ruote
Riempimento fluidi
Installazione sedili
Completamento esterno veicolo
Completamento abitacolo
Completamento vano motore
Spedizione
Applicazionevetri fissi
PRE -DECKING ASSEMBLY DECKING
FINAL ASSEMBLYFINAL TESTING, FINISHING AND
DELIVERY
Wiring harnesses and insulating application
Steering leverages assembling Fuel tank assembling
Mechanical subsystems assembling
Doors disassembling
Cockpit module assmbling Pipes assembling
Cockpit module pre-assembling
Doors module pre-assembling
Doors module assembling
Spaceframe mechanical groups pre-assembling
Powertrain system assembling
Suspension system assembling
Front-end module assembling
Final tests Dynamic tests Steering trims adjustments
Seats assemblingFixed glasses
applicationBumpers
assemblingFront-end module
application
Wheels assembling
Engine space completionFluids filling
Internal dressing completion
External dressing completion
On track statistic testing
Eventual finishing
Shipping
SALES LINE AND DELIVERING
ROLL CABIN UNDERBODY STATIONS
ONFLOOR CONTINUOUS CONVEYORSTOP AND GO CONVEYOR
WITH VARIABLE HEIGHT
Fig. 1.14 General assembly process flow
34 1 Historical Outlines and Industrial Strategies
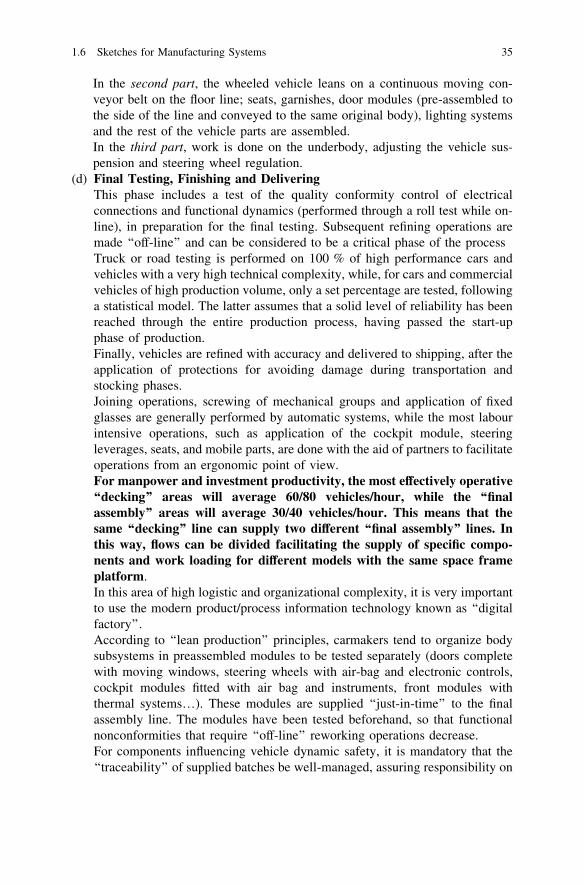
In the second part, the wheeled vehicle leans on a continuous moving con-veyor belt on the floor line; seats, garnishes, door modules (pre-assembled tothe side of the line and conveyed to the same original body), lighting systemsand the rest of the vehicle parts are assembled.In the third part, work is done on the underbody, adjusting the vehicle sus-pension and steering wheel regulation.
(d) Final Testing, Finishing and DeliveringThis phase includes a test of the quality conformity control of electricalconnections and functional dynamics (performed through a roll test while on-line), in preparation for the final testing. Subsequent refining operations aremade ‘‘off-line’’ and can be considered to be a critical phase of the processTruck or road testing is performed on 100 % of high performance cars andvehicles with a very high technical complexity, while, for cars and commercialvehicles of high production volume, only a set percentage are tested, followinga statistical model. The latter assumes that a solid level of reliability has beenreached through the entire production process, having passed the start-upphase of production.Finally, vehicles are refined with accuracy and delivered to shipping, after theapplication of protections for avoiding damage during transportation andstocking phases.Joining operations, screwing of mechanical groups and application of fixedglasses are generally performed by automatic systems, while the most labourintensive operations, such as application of the cockpit module, steeringleverages, seats, and mobile parts, are done with the aid of partners to facilitateoperations from an ergonomic point of view.For manpower and investment productivity, the most effectively operative‘‘decking’’ areas will average 60/80 vehicles/hour, while the ‘‘finalassembly’’ areas will average 30/40 vehicles/hour. This means that thesame ‘‘decking’’ line can supply two different ‘‘final assembly’’ lines. Inthis way, flows can be divided facilitating the supply of specific compo-nents and work loading for different models with the same space frameplatform.In this area of high logistic and organizational complexity, it is very importantto use the modern product/process information technology known as ‘‘digitalfactory’’.According to ‘‘lean production’’ principles, carmakers tend to organize bodysubsystems in preassembled modules to be tested separately (doors completewith moving windows, steering wheels with air-bag and electronic controls,cockpit modules fitted with air bag and instruments, front modules withthermal systems…). These modules are supplied ‘‘just-in-time’’ to the finalassembly line. The modules have been tested beforehand, so that functionalnonconformities that require ‘‘off-line’’ reworking operations decrease.For components influencing vehicle dynamic safety, it is mandatory that the‘‘traceability’’ of supplied batches be well-managed, assuring responsibility on
1.6 Sketches for Manufacturing Systems 35
the part of the producers. Factors that most influence the processes of finalassembly are: direct manpower, material handling, specific logistic informa-tion technology systems applied (Fig. 1.15).
According to modern ‘‘make-or-buy’’ policies, the overall assembly and sub-assemblies are manufactured in engine assembling plants, together with engineblocks, heads and shaft machining.
For big series engines, with a modular structure, block machining is oftenperformed on flexible transfer lines or interconnected machine centres. Particu-larly important for quality level are the boring and super-finishing operations onthe engine shaft pivot location and head binding plane milling.
The machining of the head cylinder is often set-up in machining centresworking at high speed and automatically interconnected to each other, with theability to produce specific versions of engines belonging to the same family in arandom way. Particularly important for quality level are the locations of shaftdistribution and valve boring operations.
For the machining of the engine shaft, specific and precise machine tools,interconnected with each other, are used. For superficial gardening of ground andconnecting rod pivots, on-line induction or carbon-nitrate treatments in heatingovens with a controlled atmosphere are used. Diameter and form ground and rodpivot precision and either dynamic regulation are very influential for the level offunction quality.
Main components are manufacturedby metal removing machining, starting from iron castings andsteel microleagues forgings
Fig. 1.15 Engine finalassembling
36 1 Historical Outlines and Industrial Strategies
Head cylinder and short block (cylinder block with movement parts) subas-sembly is mostly effected by automation and integrated with cold testing opera-tions: fluid leakage test, right rotation of movement parts, right distribution ofvalve opening and closing phases. In this way, it is possible to avoid systematic hottesting in the power speed, which is performed only statistically.
The assembly operations of selected pistons and half-bearing coupling forengine shaft pivot location and even fuel rail and combustion rooms testing arevery influential for the level of function quality, especially for diesel with directinjection ‘‘common-rail’’.
Final assembly of the complete engine includes assembly of auxiliary parts andrelative activation controls, engine power supply and electric module integration;these operations are normally performed manually on stop and go flow lines or onparallel independent modules, supplying component assembly kits by automaticguided vehicles (AGV).
For car engines that cover a generally wide range of models, the produceablevolumes/investment ratio reaches optimal conditions within an interval of 80/120series/hour production capacity. Otherwise, for commercial and industrial vehicleengines, this ratio is included in 40/60, even in relation to their major dimensionsand to consistent diversification of the product. (Also taking agricultural, nauticaland construction machines into consideration.)
Depreciation significantly influences transformation cost, and for this reason itis very important to reach the maximum degree of systems utilization (Fig. 1.16).
BL
OC
K M
AC
HIN
ING
CY
LIN
DE
R H
EA
D M
AC
HIN
ING
EN
GIN
E S
HA
FT
MA
CH
ININ
G
• DISTRIBUTION SHAFTS
• VALVES
• DISTRIBUTION CONTROL PARTS
• INJECTION ORGANS
• IGNITION DEVICES
• PISTONS
• CONNECTING RODS
• HALF BEARINGS
• COOLING AND LUBRICATING PARTS
• TIGHT ELEMENTS
• COLLECTORS
• ELECTRONIC PARTS SENSORS
• TURBOCHARGER
• AUXILIARY ORGANS
• ELECTRICAL INSTALLATION
Production flow sketch for high volumes modern engine plants.
FINAL COLD
TESTING
Fig. 1.16 Engine assembling process flow
1.6 Sketches for Manufacturing Systems 37
The modern plant concept considers the making of parts: structural partscharacterized by architecture and kinematic parts strictly related to the assembly ofsystems and requiring ‘‘on line’’ functional tests. The final producer delegatesportions to specialized suppliers able to supply the total powertrain systemsmarket, with the following parts made by hard automation production systems:
– pistons with tight rings (requiring metallurgic and finishing highly specializedtechnologies);
– connecting rods in micro-leagued or forged steel (requiring forming technolo-gies with high precision);
– cam axles in spheroid cast iron or steel composition;– special metallic league bearings;– valves and related opening and closing control components;– injectors/collector groups and other components for fuel supply;– suction collectors and butterfly parts;– exhaust collectors;
– controlled ignition devices;– turbo compressors;
– flywheels and torsion bumpers;
– ubricating system component;– cooling system components;– air conditioning compressors;– belts, chains and pulley;– composite elements for tight fluidics;– electrical devices;– temperature, pressure and oil level sensors.
Intermediate manufactured parts are farmed out to suppliers specializing inmetallic league transformation:
• aluminium foundries for cylinder heads and blocks (car engines for upperintermediate product range);
– iron cast foundries for blocks (lower intermediate product range cars andindustrial engines);
– special iron cast foundries for engine shaft (car engines of lower intermediateproduct range);
– forging centres specializing in micro-leagued steel engine shafts (car enginesfor upper intermediate product range and industrial engines).
To manage the product’s complexity effectively, and to assure constant controlof the level of quality and overall equipment efficiency of the production systems,it is necessary to have information technology systems for flow management,overall equipment efficiency and quality parameter control and for assuring thetraceability of those components influencing the vehicles’ availability and safetylevel (Fig. 1.17).
38 1 Historical Outlines and Industrial Strategies
According to the organization of the modern process, engine transmission shopfloors machine the following parts:
• gear shafts;• sliding cylindrical gears;• differential shaft;• aluminium or iron cast parts, for shaft/gear support or engine interface.
Shaft and gear machining is organized in flow lines, with an automatic handlingsystem to fulfil high quality levels.
Machine tools are highly specialized (numeric control lathes, precision boringand rectifying machines, gear cutting machines, finishing for shaving or profilerectifying machines…). The thermal treatment (carbon–nitrogen) is done with areformer on pressurized equipment with a controlled atmosphere, organized on-line with the machining operations.
For product quality, it is necessary to exercise constant control over the met-allurgic parameters of forged steels and extrusions (structures homogenized andeasily hardening).
Technical management of forming tools is determined to obtain the necessarylevel of noise reduction in movement transmission (precision of evolving partprofiles).
The preparation of synchro and clutch gears is normally performed in theassembly cell by manual operation, while the assembly of complete subgroups isgenerally automatically performed by robot and automatic screwing systems.
GEARBOX
PRIMARY AND SECONDARY SHAFTDIFFERENTIAL
Fig. 1.17 Forward traction engine transmission final assembling
1.6 Sketches for Manufacturing Systems 39
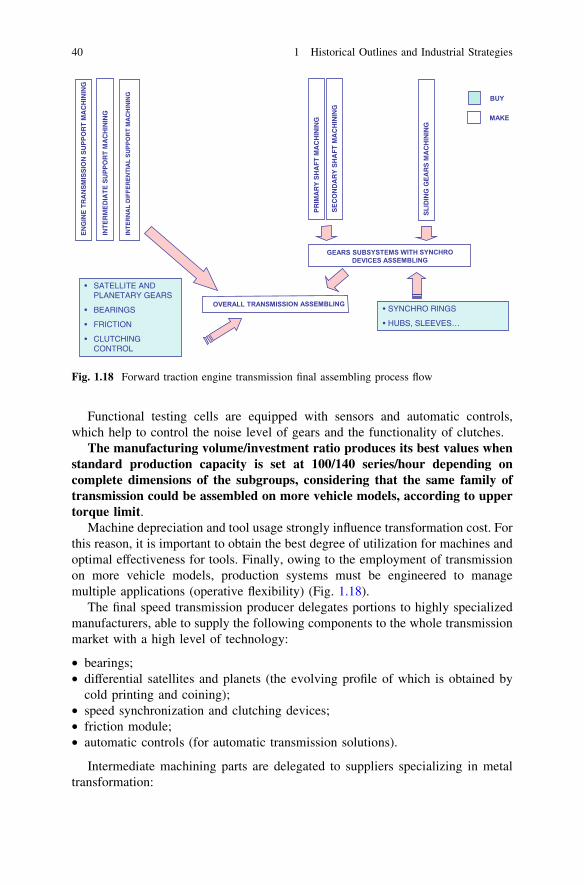
Functional testing cells are equipped with sensors and automatic controls,which help to control the noise level of gears and the functionality of clutches.
The manufacturing volume/investment ratio produces its best values whenstandard production capacity is set at 100/140 series/hour depending oncomplete dimensions of the subgroups, considering that the same family oftransmission could be assembled on more vehicle models, according to uppertorque limit.
Machine depreciation and tool usage strongly influence transformation cost. Forthis reason, it is important to obtain the best degree of utilization for machines andoptimal effectiveness for tools. Finally, owing to the employment of transmissionon more vehicle models, production systems must be engineered to managemultiple applications (operative flexibility) (Fig. 1.18).
The final speed transmission producer delegates portions to highly specializedmanufacturers, able to supply the following components to the whole transmissionmarket with a high level of technology:
• bearings;• differential satellites and planets (the evolving profile of which is obtained by
cold printing and coining);• speed synchronization and clutching devices;• friction module;• automatic controls (for automatic transmission solutions).
Intermediate machining parts are delegated to suppliers specializing in metaltransformation:
SL
IDIN
G G
EA
RS
MA
CH
ININ
G
INT
ER
NA
L D
IFF
ER
EN
TIA
L S
UP
PO
RT
MA
CH
ININ
G
• SYNCHRO RINGS
• HUBS, SLEEVES…
• SATELLITE AND PLANETARY GEARS
• BEARINGS
• FRICTION
• CLUTCHING CONTROL
PR
IMA
RY
SH
AF
T M
AC
HIN
ING
SE
CO
ND
AR
Y S
HA
FT
MA
CH
ININ
G
INT
ER
ME
DIA
TE
SU
PP
OR
T M
AC
HIN
ING
EN
GIN
E T
RA
NS
MIS
SIO
N S
UP
PO
RT
MA
CH
ININ
G
Fig. 1.18 Forward traction engine transmission final assembling process flow
40 1 Historical Outlines and Industrial Strategies
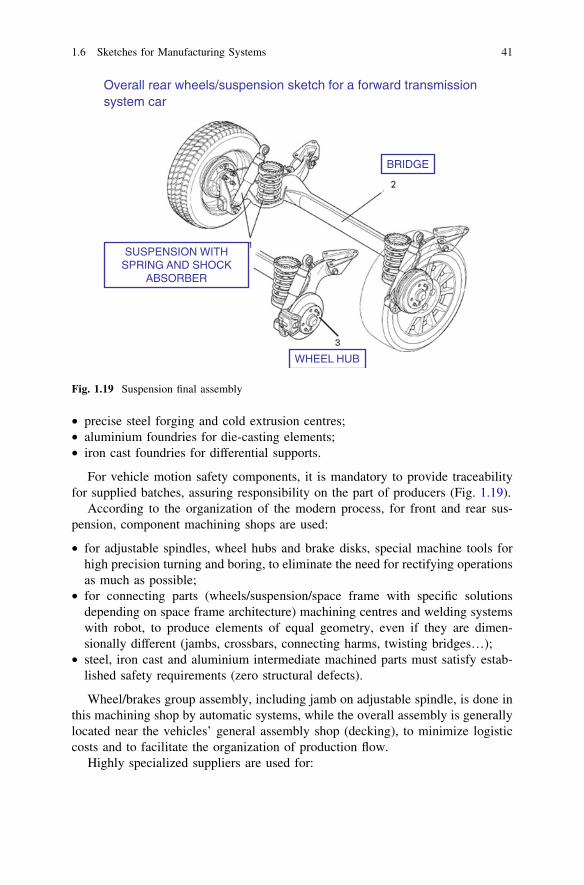
• precise steel forging and cold extrusion centres;• aluminium foundries for die-casting elements;• iron cast foundries for differential supports.
For vehicle motion safety components, it is mandatory to provide traceabilityfor supplied batches, assuring responsibility on the part of producers (Fig. 1.19).
According to the organization of the modern process, for front and rear sus-pension, component machining shops are used:
• for adjustable spindles, wheel hubs and brake disks, special machine tools forhigh precision turning and boring, to eliminate the need for rectifying operationsas much as possible;
• for connecting parts (wheels/suspension/space frame with specific solutionsdepending on space frame architecture) machining centres and welding systemswith robot, to produce elements of equal geometry, even if they are dimen-sionally different (jambs, crossbars, connecting harms, twisting bridges…);
• steel, iron cast and aluminium intermediate machined parts must satisfy estab-lished safety requirements (zero structural defects).
Wheel/brakes group assembly, including jamb on adjustable spindle, is done inthis machining shop by automatic systems, while the overall assembly is generallylocated near the vehicles’ general assembly shop (decking), to minimize logisticcosts and to facilitate the organization of production flow.
Highly specialized suppliers are used for:
Overall rear wheels/suspension sketch for a forward transmission system car
BRIDGE
SUSPENSION WITH SPRING AND SHOCK
ABSORBER
WHEEL HUB
Fig. 1.19 Suspension final assembly
1.6 Sketches for Manufacturing Systems 41
• transmission shafts and joints• steering wheel elements• braking controls• springs and shock absorbers• sensors and software/hardware modules for vehicle braking and stability elec-
tronic control
For vehicle motion safety components, it is mandatory to provide traceabilityfor supplied batches, assuring responsibility on the part of the producers.
The manufacturing volume/investment ratio produces its best values whenstandard production capacity is set at 100/140 series/hour, working on the samefamily of space frames, used for more vehicle models.
Depreciations are the biggest part of transformation cost and for this reason it isimportant to obtain the best degree of utilization for the equipment.
1.7 Systems’ Strategic Prerogatives
We are going to end this chapter by pointing out the strategic prerogatives nec-essary for the ‘‘manufacturing systems’’, according to investment and depreciationplans. To compare possible alternative solutions, during the manufacturing engi-neering planning phase and selection of equipment and specific tools and settingfor the technological layout (for simplicity, herein referred to as ‘‘systems’’), it isnecessary to evaluate the following ‘‘key strategic indicators’’:
1. Investment productivity and utilizationA primary indicator is investment productivity, which is the ratio betweenannual available production capacity and the total amount of expenses neces-sary for the development, acquisition, installation and test runs of the ‘‘sys-tems’’.A secondary indicator is the degree of production capacity utilization, which isthe ratio between the total quantity of product that could potentially be pro-duced and sold and the total amount of expenses necessary for the development,acquisition, installation and test runs of the ‘‘systems’’, during the normal cyclelife of the investment. These analysis criteria will be examined in Chap. 3.In relation to capital intensive productions, degrees of utilization lower than80 % would hardly allow for the obtainment of such operative results forgenerating value for the enterprise.
2. Operative flexibility and investment versatilityOperative flexibility is determined by the producible product range (familygroup), relative to a specific ‘‘system’’. The criteria for evaluating this aredeveloped in Chap. 3. Investment multitasking is represented by the possibilityof using the investment to produce more product models/versions, and to adjustrapidly to the variability of market demand, without additional significantinvestment.
42 1 Historical Outlines and Industrial Strategies
3. Investment convertibility and life increaseThere exists an attitude in a certain ‘‘system’’ that allows for the introduction ofnew products merely by substituting specific tooling and changing processautomation software. Let us define the following indicators of ‘‘system’’changeability:
3.1 the ratio between the amount required for the retooling and the total initialamount spent for development of the entire ‘‘system’’;
3.2 period of production stoppage needed to introduce a new model or product;3.3 capacity to ‘‘phase-out’’ and ‘‘phase-in’’ product simultaneously;
For powertrain and body manufacturing ‘‘systems’’ in which indicator 3.1is less than 25 %, time 3.2 is less than one month and there exists thepossibility of simultaneous action such as in point 3.3, the ‘‘system’’ can beconsidered ‘‘easily convertible’’. By increasing indicators 3.1 and 3.2, theadvantages deriving from this prerogative would obviously be decreased.
4. Investment modularity and gradualityWe can define ‘‘modular’’ as a technological lay-out made by two or morecomponent machines or group assembly units, arranged parallel to each otherand each able to produce a share of the total production required. In thissituation, the ‘‘system’’ can be realized by steps, according to a regulator plan,with the possibility of adjusting the amount of investment in relation to theactual production level necessary while production is taking place. The biggesttwo factors are the modularity of the system and the total investment, con-sidering the same automation level and production capacity required at normalproduction speed; conversely, this can allow for the consideration of moregradual economic obligation, reducing the ‘‘volume risk’’ derived fromuncertainty arising from market trends and the success of products.
The prerogatives of points 2, 3 and 4 directly influence the achievement of theprerogative of point 1.
1.7 Systems’ Strategic Prerogatives 43
Chapter 2From Project to Product
2.1 Standardization Logic and Project Set-Up
In industrial compartment, a ‘‘standard’’ is a product or process technical solutionexactly defined, successfully tested and usefully repeatable by application.
The availability of a certain set of standard solutions helps the enterprise to:
(a) consolidate ‘‘best practices’’, increasing quality and reliability levels, reducingtimes and costs to develop new product and manufacturing systems;
(b) obtain economy scales in the productive process and in the purchasing ofmaterials and working means;
(c) determine the interchangeability of parts, so as to facilitate repair operationson products and manufacturing systems and product maintenance costs;
(d) reduce work in the process of internal and external flows.
Standardization fields could be:
1. Institutional Technical Regulation by International Government Depart-ments, with the participation of producer and user associations (ISO, UNI,ASA, CUNA, ETSI…). In this field: technical languages and measurements aremade uniform, basic material and the characteristics of common parts areunambiguously defined, assuring interchangeability, quality certificationmethodologies and product and working means approval procedures are nor-malized, also considering user/customer and environmental policies.
2. Product Standardization, in the same enterprise or industrial group: designelements are defined, as to what application can be extended to a wide range ofproducts. Furthermore, model standard solutions are defined, so that they can beeasily transferred from project to project.
3. Industrial Process Standardization, even for the same enterprise or industrialgroup, to consolidate and spread out the ‘‘best practices’’ in their own internalprocesses. In this field, we have: design and testing of products and workingmeans, control plans for materials and transformation processes, and determi-nation and assembly of sub-assembled parts usefully transferable from projectto project.
M. Gobetto, Operations Management in Automotive Industries,Springer Series in Advanced Manufacturing, DOI: 10.1007/978-94-007-7593-0_2,� Springer Science+Business Media Dordrecht 2014
45
4. Information Technology Systems, set for an enterprise or an industrial group,considering homogeneous solutions in hardware and software for productdesign (CAD/CAE), manufacturing systems engineering (CAD/CAM/CAPE),and logistics management (PDM, MPS, MRP systems). It is also important toadopt a standard administrative procedure to simplify and speed up theaccounting systems. Application of homogeneous information technologysystems helps to reduce fixed costs of the enterprise, thanks also to the eco-nomic scale effect obtainable by using software and hardware solutions.
In the second and third standardization items in particular, consistent know-howis required, allowing enterprises to grow, both internally and towards partnershipsand joint enterprise.
To promote the standardization process, management must focus on the con-solidation of ‘‘best practices’’ without obstructing the introduction of new tech-nological and organizational solutions that could offer competitive advantages forthe enterprise.
Innovation must be matched by standardization. Standard solutions mustnot be considered ‘‘prohibitive’’, but ‘‘progressive’’, according to the logic ofcontinuous improvement of product and process.
In the strategic setting of new models belonging to more brands of the sameindustrial group, it has to be decided which product modules can be mostconveniently standardized, for reasons of economic scale, and what must bedeveloped specifically, in regard to the distinctiveness of individual brands(style shapes, engine and space-frame solutions…).
For ‘‘mass produced’’ products, there is a prerogative push towards standardi-zation, while for ‘‘premium’’ products, there is a prerogative push towards ‘‘dis-tinctiveness’’, without renouncing standard component solutions that are notperceived by the customer as ‘‘distinguishing brand originality’’ and, for thisreason, are usefully derived from a larger productive scale.
Let us now look at the general guidelines for setting product design for auto-motive products.
First of all, the new product’s performance targets and functional and stylerequirements are set and are carefully compared to similar existing products,including those of the company’s foremost competitors. The best-fitting materialsand best technologies are chosen, starting from the standard solutions availablebased on company know-how. Geometric shapes and structural compositiondescription sketches are prepared. For each module component of the final assem-bled product, specific parts are distinguished with a ‘‘new part number’’, taken fromthose respectively belonging to the ‘‘common component database’’, company-owned, or purchased from specialized suppliers chosen to be co-designers.
These are preliminary studies in a setting phase (pre-engineering) and they endwith the institution of ‘‘technical specifications’’ relative to the product to be soldon market and their components. Documents and input data necessary for thedevelopment of the executive project normally include:
46 2 From Project to Product

(1) Manufacturing characteristics of the final product, relative subassemblies andfunctional modules, through blocks schemes and 3D sketches representative ofthe product’s technical architecture and macro-composition (Product Macro-Structure = PMS).
(2) Performance targets and functional and aesthetic requirements, relative to theproducts destined for market and consequently for each of the functionalmodules/subsystems included in the PMS (Product Function Deploy-ment = PFD; Quality Requirements = QR).
(3) Cost targets, relative to the final product in each of its versions and to eachitem included in the PMS (unitary production costs, foreseen for the running ofnormal production).
(4) Project development expenses, specific investments for industrialization,costs for production ramp-up and commercial launch for new models.
(5) Profit targets, relative to the final product in each of its versions (unit prizeswithout considering distribution cost, sales volume within the industrial lifecycle).
(6) ‘‘Time to market’’ targets.
The decision-making process normally applied for the creation of executiveprojects, verifying coherence with targets, matches the scheme detailed inSect. 1.4.
We should point out that PFD performance targets are set using classic indi-cators for the setting up of powertrains, bodies and vehicle systems. Other targetparameters derive from approved norms for safety, fuel consumption andexhaustion emission minimization.
During the setting up phase of a project, target parameters for customer quality,life cycle, maintainability and consequent warranty costs are always specified. Forthis purpose, carmakers apply evaluation methodologies based on experience andaccording to criteria adopted by institutionalized internationally qualified Tech-nical Departments.
The auditing process for fulfilling the above targets is normally performed bythe Quality Assurance Department, as delegated by top management, for thepurpose of having an objective judgment based on comparison with competitors’products and to be sure that the root causes are correctly identified and that thisinformation is passed on to the right company department or suppliers.
For the technical–economic part of the project, a specific activity of value/costanalysis for each item of the PMS is undertaken. The specific cost is referred toeach module/subsystem. Adding the estimated cost of operation and for directmaterial required to complete the vehicle process (body painting, final assemblyand testing), the cost target of the final product is determined. Value/cost analysisis done preventively (during the setting up phase) and continues during theexecutive phases in an analytical way, through the end of the industrializationprocess. Project Responsible has to search for necessary corrections and put theminto action, collaborating with Manufacturing and Purchasing Responsible.
2.1 Standardization Logic and Project Set-Up 47
Even in the subsequent set-up for the executive phase of the project, it isnecessary to ensure coherence with the above points 2, 3, 4 and 5. It is clear, forinstance, that the sale price of the product depends on its value (i.e., on PFD andQR indicators), just as sales volume (market share) depends on the comparison ofthe prices to those of competitors. Investment requirement and the process ofobtaining capital depend consequently on sales volume.
In modern industrial automotive organizations, these important coherence testsare performed by a specific top management staff, in charge of Product Devel-opment Planning. This department, in collaboration with Marketing and Brand andother industrial departments for powertrain and vehicle development, must designthe Product Range Plan, assuring synergy and defining the appropriate level ofstandard carry-over and specific solutions for modules and components.
Finally, Finance and Administration has to perform an economic and financialanalysis in industrial initiatives and an audit on profit results.
2.2 Industrialization Process Description
Once we have identified the project’s standardization logic and actual organiza-tional criteria applied for technical/economic checks, we have to examine meth-odologies used to decrease the ‘‘time-to-market’’ of the new product, assuringcontemporary PFD and QR targets.
The block diagram of Fig. 2.1 represents all macro phases of activity necessaryto develop and manufacture a new vehicle model. The upper part of the schemedescribes activities for design, development and technical testing, starting from theproduct ‘‘concept’’ up to final project validation. The lower part of the schemedescribes product industrialization, starting from the checks for manufacturingfeasibility on the products, up to qualification of the productive process and seriesproduction start-up.
This scheme is not representative of temporary lead time of the singlemacro-phases, but gives evidence of the priorities between the activities andunderlines possible concurrent activities, useful for reducing the ‘‘developingcritical path’’.
New vehicle model project development and industrialization key pointsare:
(1) concept and style delivery (pre-engineering conclusion);(2) technical validation of project (final design release);(3) qualification of productive processes and ‘‘buy’’ elements (process validation);(4) delivery for production (final product validation);(5) commercial launch (delivery to market).
The ‘‘time-to-market’’ corresponds with the period of time between con-cept and style delivery (key point #1) and commercial launch (key point #4).
48 2 From Project to Product
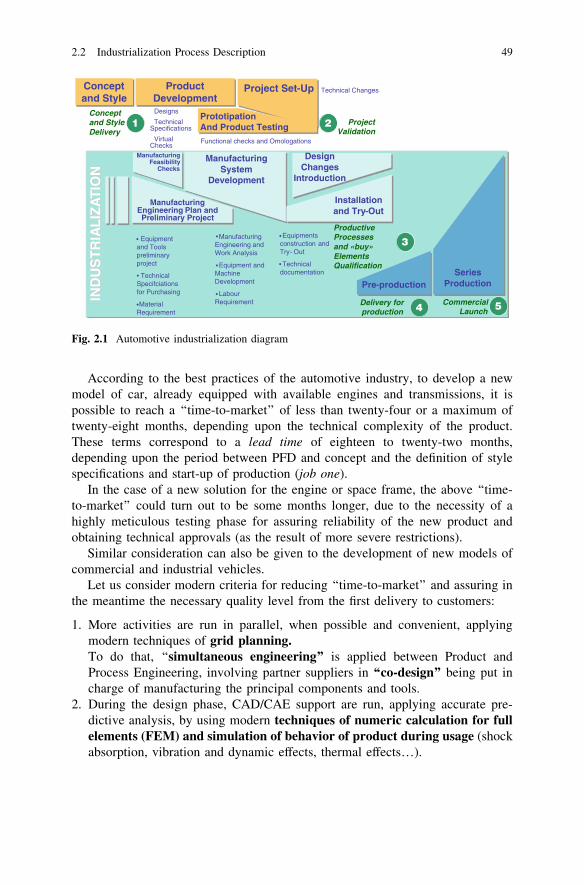
According to the best practices of the automotive industry, to develop a newmodel of car, already equipped with available engines and transmissions, it ispossible to reach a ‘‘time-to-market’’ of less than twenty-four or a maximum oftwenty-eight months, depending upon the technical complexity of the product.These terms correspond to a lead time of eighteen to twenty-two months,depending upon the period between PFD and concept and the definition of stylespecifications and start-up of production (job one).
In the case of a new solution for the engine or space frame, the above ‘‘time-to-market’’ could turn out to be some months longer, due to the necessity of ahighly meticulous testing phase for assuring reliability of the new product andobtaining technical approvals (as the result of more severe restrictions).
Similar consideration can also be given to the development of new models ofcommercial and industrial vehicles.
Let us consider modern criteria for reducing ‘‘time-to-market’’ and assuring inthe meantime the necessary quality level from the first delivery to customers:
1. More activities are run in parallel, when possible and convenient, applyingmodern techniques of grid planning.To do that, ‘‘simultaneous engineering’’ is applied between Product andProcess Engineering, involving partner suppliers in ‘‘co-design’’ being put incharge of manufacturing the principal components and tools.
2. During the design phase, CAD/CAE support are run, applying accurate pre-dictive analysis, by using modern techniques of numeric calculation for fullelements (FEM) and simulation of behavior of product during usage (shockabsorption, vibration and dynamic effects, thermal effects…).
Conceptand Style
Product Development
Project Set-Up
PrototipationAnd Product Testing
Concept and Style Delivery
Project Validation
Manufacturing Engineering Plan and Preliminary Project
Manufacturing System
Development
Installation and Try-Out
Design Changes
Introduction
Productive Processes and «buy» Elements Qualification
Delivery for production
Series ProductionPre-production
IND
US
TR
IAL
IZA
TIO
N
Manufacturing Feasibility
Checks
Designs
Technical Specifications
Virtual Checks
Functional checks and Omologations
Technical Changes
Equipments construction and Try- Out
Technical documentation
Equipment and Tools preliminary project
Technical Specifciations for Purchasing
Material Requirement
Manufacturing Engineering and Work Analysis
Equipment and Machine Development
Labour Requirement
1 2
3
4 Commercial Launch 5
.
.
.
.
.
.
.
.
Fig. 2.1 Automotive industrialization diagram
2.2 Industrialization Process Description 49
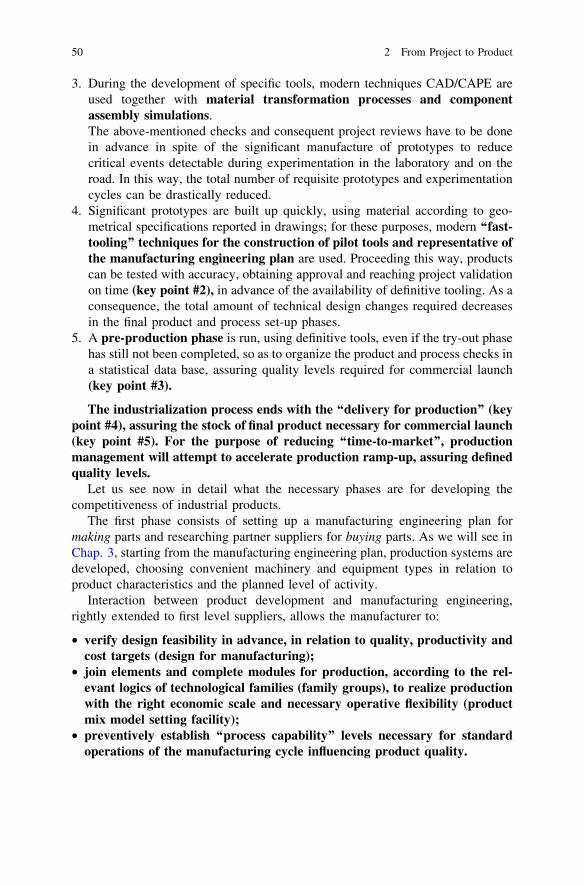
3. During the development of specific tools, modern techniques CAD/CAPE areused together with material transformation processes and componentassembly simulations.The above-mentioned checks and consequent project reviews have to be donein advance in spite of the significant manufacture of prototypes to reducecritical events detectable during experimentation in the laboratory and on theroad. In this way, the total number of requisite prototypes and experimentationcycles can be drastically reduced.
4. Significant prototypes are built up quickly, using material according to geo-metrical specifications reported in drawings; for these purposes, modern ‘‘fast-tooling’’ techniques for the construction of pilot tools and representative ofthe manufacturing engineering plan are used. Proceeding this way, productscan be tested with accuracy, obtaining approval and reaching project validationon time (key point #2), in advance of the availability of definitive tooling. As aconsequence, the total amount of technical design changes required decreasesin the final product and process set-up phases.
5. A pre-production phase is run, using definitive tools, even if the try-out phasehas still not been completed, so as to organize the product and process checks ina statistical data base, assuring quality levels required for commercial launch(key point #3).
The industrialization process ends with the ‘‘delivery for production’’ (keypoint #4), assuring the stock of final product necessary for commercial launch(key point #5). For the purpose of reducing ‘‘time-to-market’’, productionmanagement will attempt to accelerate production ramp-up, assuring definedquality levels.
Let us see now in detail what the necessary phases are for developing thecompetitiveness of industrial products.
The first phase consists of setting up a manufacturing engineering plan formaking parts and researching partner suppliers for buying parts. As we will see inChap. 3, starting from the manufacturing engineering plan, production systems aredeveloped, choosing convenient machinery and equipment types in relation toproduct characteristics and the planned level of activity.
Interaction between product development and manufacturing engineering,rightly extended to first level suppliers, allows the manufacturer to:
• verify design feasibility in advance, in relation to quality, productivity andcost targets (design for manufacturing);
• join elements and complete modules for production, according to the rel-evant logics of technological families (family groups), to realize productionwith the right economic scale and necessary operative flexibility (productmix model setting facility);
• preventively establish ‘‘process capability’’ levels necessary for standardoperations of the manufacturing cycle influencing product quality.
50 2 From Project to Product
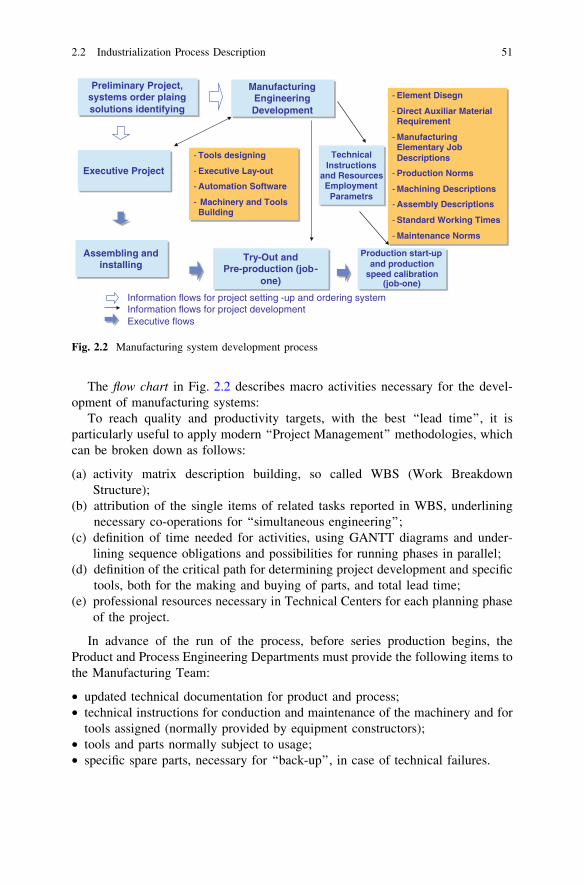
The flow chart in Fig. 2.2 describes macro activities necessary for the devel-opment of manufacturing systems:
To reach quality and productivity targets, with the best ‘‘lead time’’, it isparticularly useful to apply modern ‘‘Project Management’’ methodologies, whichcan be broken down as follows:
(a) activity matrix description building, so called WBS (Work BreakdownStructure);
(b) attribution of the single items of related tasks reported in WBS, underliningnecessary co-operations for ‘‘simultaneous engineering’’;
(c) definition of time needed for activities, using GANTT diagrams and under-lining sequence obligations and possibilities for running phases in parallel;
(d) definition of the critical path for determining project development and specifictools, both for the making and buying of parts, and total lead time;
(e) professional resources necessary in Technical Centers for each planning phaseof the project.
In advance of the run of the process, before series production begins, theProduct and Process Engineering Departments must provide the following items tothe Manufacturing Team:
• updated technical documentation for product and process;• technical instructions for conduction and maintenance of the machinery and for
tools assigned (normally provided by equipment constructors);• tools and parts normally subject to usage;• specific spare parts, necessary for ‘‘back-up’’, in case of technical failures.
Manufacturing Engineering Development
Preliminary Project, systems order plaing solutions identifying
Executive Project
Assembling and installing
Try-Out and Pre-production (job-
one)
Technical Instructions
and Resources Employment
Parametrs
Production start-up and production
speed calibration (job-one)
- Tools designing
- Executive Lay-out
- Automation Software
- Machinery and Tools Building
Information flows for project setting -up and ordering systemInformation flows for project developmentExecutive flows
- Element Disegn
- Direct Auxiliar Material Requirement
- Manufacturing Elementary Job Descriptions
- Production Norms
- Machining Descriptions
- Assembly Descriptions
- Standard Working Times
- Maintenance Norms
Fig. 2.2 Manufacturing system development process
2.2 Industrialization Process Description 51
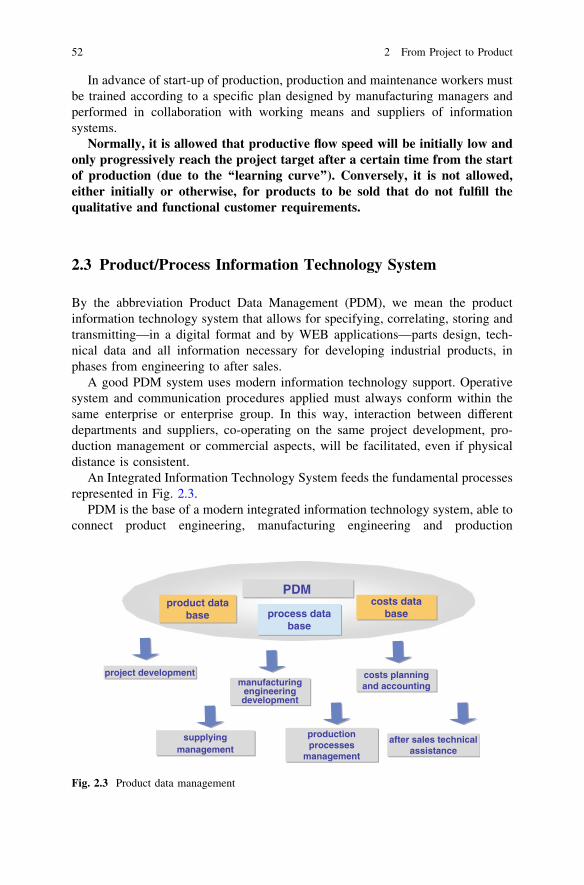
In advance of start-up of production, production and maintenance workers mustbe trained according to a specific plan designed by manufacturing managers andperformed in collaboration with working means and suppliers of informationsystems.
Normally, it is allowed that productive flow speed will be initially low andonly progressively reach the project target after a certain time from the startof production (due to the ‘‘learning curve’’). Conversely, it is not allowed,either initially or otherwise, for products to be sold that do not fulfill thequalitative and functional customer requirements.
2.3 Product/Process Information Technology System
By the abbreviation Product Data Management (PDM), we mean the productinformation technology system that allows for specifying, correlating, storing andtransmitting—in a digital format and by WEB applications—parts design, tech-nical data and all information necessary for developing industrial products, inphases from engineering to after sales.
A good PDM system uses modern information technology support. Operativesystem and communication procedures applied must always conform within thesame enterprise or enterprise group. In this way, interaction between differentdepartments and suppliers, co-operating on the same project development, pro-duction management or commercial aspects, will be facilitated, even if physicaldistance is consistent.
An Integrated Information Technology System feeds the fundamental processesrepresented in Fig. 2.3.
PDM is the base of a modern integrated information technology system, able toconnect product engineering, manufacturing engineering and production
process data base
product data base
production processes
management
supplyingmanagement
manufacturing engineeringdevelopment
PDM costs data
base
project development costs planning and accounting
after sales technicalassistance
Fig. 2.3 Product data management
52 2 From Project to Product
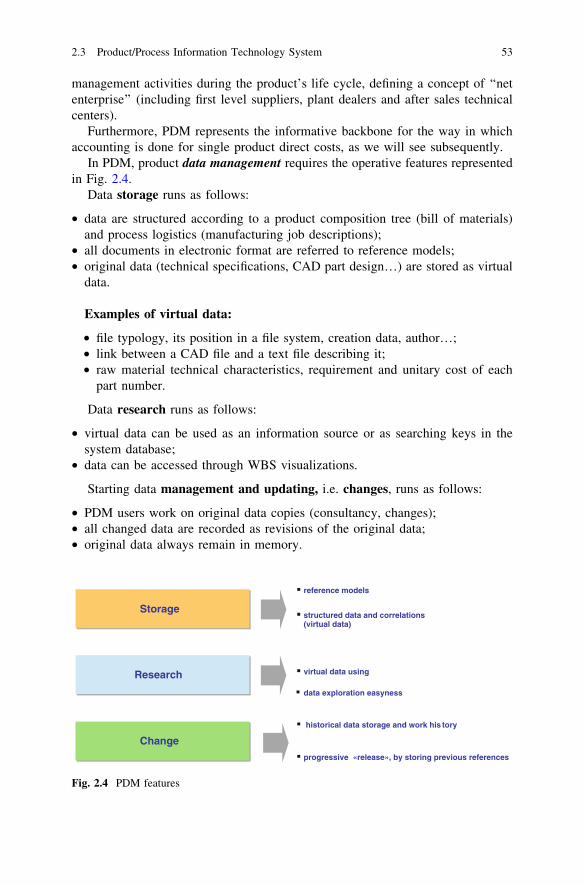
management activities during the product’s life cycle, defining a concept of ‘‘netenterprise’’ (including first level suppliers, plant dealers and after sales technicalcenters).
Furthermore, PDM represents the informative backbone for the way in whichaccounting is done for single product direct costs, as we will see subsequently.
In PDM, product data management requires the operative features representedin Fig. 2.4.
Data storage runs as follows:
• data are structured according to a product composition tree (bill of materials)and process logistics (manufacturing job descriptions);
• all documents in electronic format are referred to reference models;• original data (technical specifications, CAD part design…) are stored as virtual
data.
Examples of virtual data:
• file typology, its position in a file system, creation data, author…;• link between a CAD file and a text file describing it;• raw material technical characteristics, requirement and unitary cost of each
part number.
Data research runs as follows:
• virtual data can be used as an information source or as searching keys in thesystem database;
• data can be accessed through WBS visualizations.
Starting data management and updating, i.e. changes, runs as follows:
• PDM users work on original data copies (consultancy, changes);• all changed data are recorded as revisions of the original data;• original data always remain in memory.
Research
Storage
Change
reference models
structured data and correlations(virtual data)
virtual data using
data exploration easyness
progressive «release», by storing previous references
historical data storage and work his tory
Fig. 2.4 PDM features
2.3 Product/Process Information Technology System 53
PDM allows for managing technical data and the creation of part numberdesigns and the updating process of the product, checking the following operativeaspects:
Work management, which means establishing who can do what:
• system users are classified by role, according to their position in theorganization;
• specific possibilities for accessing and processing data for each role.
Workflow management, which means establishing who must do what andwhen:
• the system considers a ‘‘standard workflow’’ (execution, check and approval),for all the items used in the activity;
• the system automatically sends the updated data to the responsible parties,according to the above-mentioned ‘‘standard workflow’’ and established pro-cedures for delivering the design’s ‘‘release’’.
Work history management, which means establishing who has done what andwhen:
• the system tracks access to data and completed operations (release, changes,approval…);
• at every moment, it is possible to know the work history of all data (model anddocument).
Simultaneous engineering, which means establishing who does what withwhom:
• the system foresees potential for collaboration between individual positions anddepartments;
• in this way, revisions are automatically posted (new releases), keeping theparticipants in the project constantly informed.
Modern PDM systems are integrated with other enterprise information tech-nology systems, on the condition that they have homogeneous environments (sameCAD/CAE/CAPE systems), as shown in Fig. 2.5.
An integrated information technology system allows PDM to deal with theother systems used in the product/process development, for:
• creating input data(design engineering settings);• visualizing designed parts and their position on complete modules;• updating and spreading out of data, allowing electronic research.
The main advantages of a homogeneous information technology environmentare:
• access to same data from different hardware platforms;• same CAD models and structural data available in the same environment;• availability of most up-to-date data.
54 2 From Project to Product
Internet and Intranet connections allow for the elimination of geographicalrestrictions and improve interaction, with the application of necessary protectionsfor technical documents, according to policies established between provider andsupplier.
The heart of PDM is the Product Breakdown Structure (PBS), described inthe following section.
PBS structure is hierarchical and is represented in Fig. 2.6 (tree diagram). Thefinal product is on the top and is deployed, through different levels, down to singlecomponents, subassemblies and raw materials at the base.
Automatic data processing, according to the tree diagram, means assigning acode to each link on the structure; through the code, each part is associated withthe assemblies and subassemblies to which it belongs.
In describing PBS function, we will use the following terms:
• element = design code or part number;• assembly or subassembly = secondary group code• usage coefficient = number of elements necessary to complete a final product• completed elements and final group weight = it corresponds to element designs
and is calculated based on volume and weight of direct materials, including thefluid ones (metal external parts and polymers, paints, lubricating, structuralglues and sealers…).
This data, referred to as the several typologies of basic materials, is necessaryfor statistical control and technical and economic analysis: comparisons betweentheoretical and real data, comparisons between models, benchmarking betweendifferent solutions, cost effect analysis as a consequence of raw material pricevariations…
PDM
CADDigital Mockup
Data structure
Basic model, versions and optional requirements management
Research and interactive consultancy
Elements dimension and related technical dataFunction/Position on modules
Visualization of modules and subassmbling
Matching and assembling checks
.
.
.
.
.
.
.
Fig. 2.5 PDM integratedinformation technologysystem
2.3 Product/Process Information Technology System 55
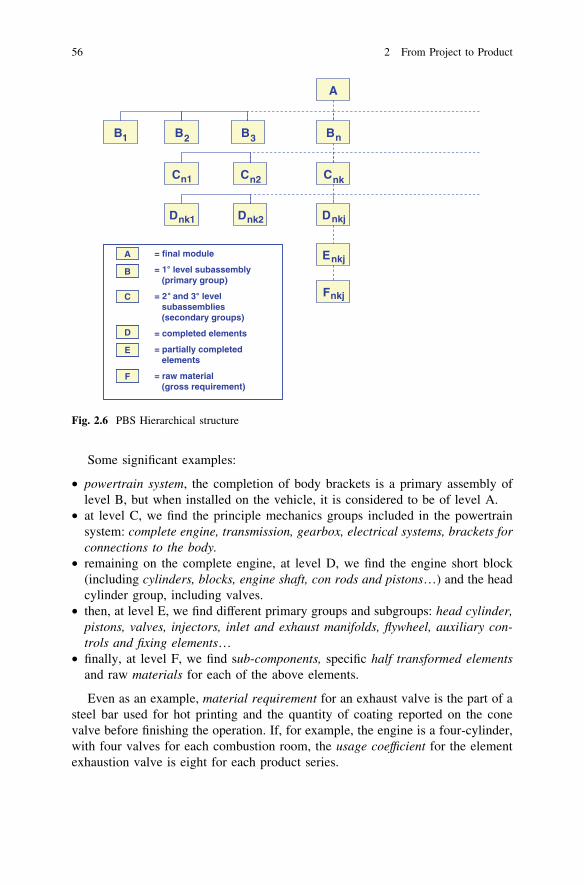
Some significant examples:
• powertrain system, the completion of body brackets is a primary assembly oflevel B, but when installed on the vehicle, it is considered to be of level A.
• at level C, we find the principle mechanics groups included in the powertrainsystem: complete engine, transmission, gearbox, electrical systems, brackets forconnections to the body.
• remaining on the complete engine, at level D, we find the engine short block(including cylinders, blocks, engine shaft, con rods and pistons…) and the headcylinder group, including valves.
• then, at level E, we find different primary groups and subgroups: head cylinder,pistons, valves, injectors, inlet and exhaust manifolds, flywheel, auxiliary con-trols and fixing elements…
• finally, at level F, we find sub-components, specific half transformed elementsand raw materials for each of the above elements.
Even as an example, material requirement for an exhaust valve is the part of asteel bar used for hot printing and the quantity of coating reported on the conevalve before finishing the operation. If, for example, the engine is a four-cylinder,with four valves for each combustion room, the usage coefficient for the elementexhaustion valve is eight for each product series.
A
B1 B2 B3 Bn
Cn1 Cn2 Cnk
Dnk1 Dnk2 Dnkj
Enkj
Fnkj
= final module
= 1 level subassembly(primary group)
= 2 and 3 levelsubassemblies(secondary groups)
= completed elements
= partially completedelements
= raw material (gross requirement)
A
B
C
D
E
F
Fig. 2.6 PBS Hierarchical structure
56 2 From Project to Product
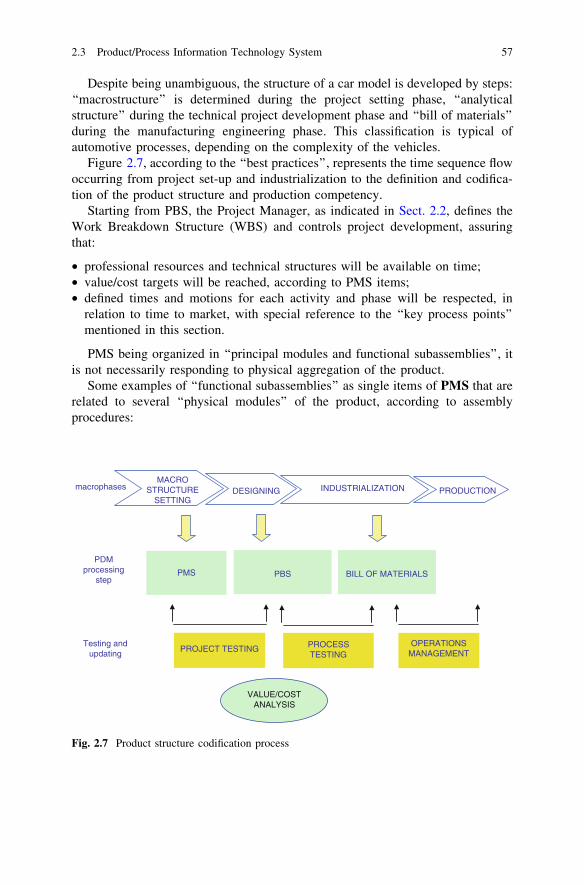
Despite being unambiguous, the structure of a car model is developed by steps:‘‘macrostructure’’ is determined during the project setting phase, ‘‘analyticalstructure’’ during the technical project development phase and ‘‘bill of materials’’during the manufacturing engineering phase. This classification is typical ofautomotive processes, depending on the complexity of the vehicles.
Figure 2.7, according to the ‘‘best practices’’, represents the time sequence flowoccurring from project set-up and industrialization to the definition and codifica-tion of the product structure and production competency.
Starting from PBS, the Project Manager, as indicated in Sect. 2.2, defines theWork Breakdown Structure (WBS) and controls project development, assuringthat:
• professional resources and technical structures will be available on time;• value/cost targets will be reached, according to PMS items;• defined times and motions for each activity and phase will be respected, in
relation to time to market, with special reference to the ‘‘key process points’’mentioned in this section.
PMS being organized in ‘‘principal modules and functional subassemblies’’, itis not necessarily responding to physical aggregation of the product.
Some examples of ‘‘functional subassemblies’’ as single items of PMS that arerelated to several ‘‘physical modules’’ of the product, according to assemblyprocedures:
macrophasesMACRO
STRUCTURE SETTING
DESIGNING INDUSTRIALIZATION PRODUCTION
PMS PBS BILL OF MATERIALS
PROJECT TESTING PROCESS TESTING
OPERATIONS MANAGEMENT
VALUE/COST ANALYSIS
PDM processing
step
Testing and updating
Fig. 2.7 Product structure codification process
2.3 Product/Process Information Technology System 57
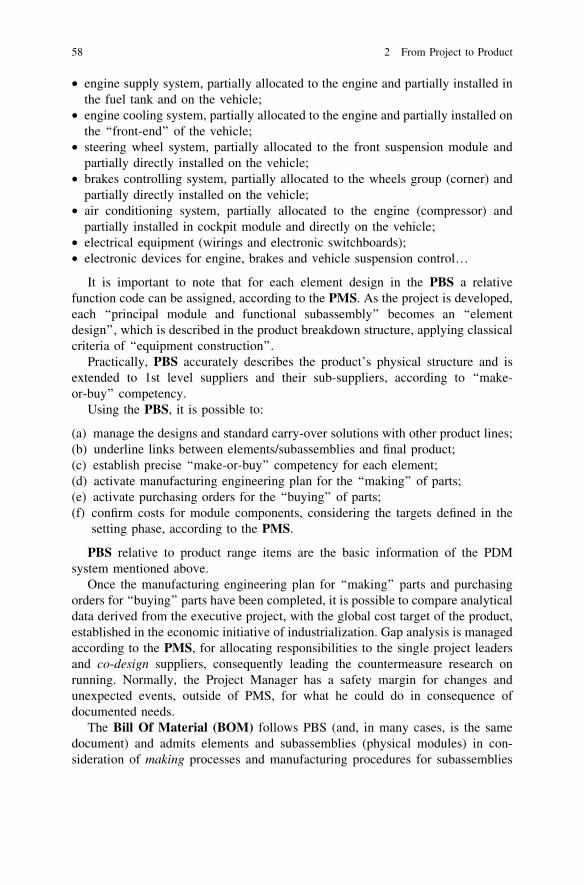
• engine supply system, partially allocated to the engine and partially installed inthe fuel tank and on the vehicle;
• engine cooling system, partially allocated to the engine and partially installed onthe ‘‘front-end’’ of the vehicle;
• steering wheel system, partially allocated to the front suspension module andpartially directly installed on the vehicle;
• brakes controlling system, partially allocated to the wheels group (corner) andpartially directly installed on the vehicle;
• air conditioning system, partially allocated to the engine (compressor) andpartially installed in cockpit module and directly on the vehicle;
• electrical equipment (wirings and electronic switchboards);• electronic devices for engine, brakes and vehicle suspension control…
It is important to note that for each element design in the PBS a relativefunction code can be assigned, according to the PMS. As the project is developed,each ‘‘principal module and functional subassembly’’ becomes an ‘‘elementdesign’’, which is described in the product breakdown structure, applying classicalcriteria of ‘‘equipment construction’’.
Practically, PBS accurately describes the product’s physical structure and isextended to 1st level suppliers and their sub-suppliers, according to ‘‘make-or-buy’’ competency.
Using the PBS, it is possible to:
(a) manage the designs and standard carry-over solutions with other product lines;(b) underline links between elements/subassemblies and final product;(c) establish precise ‘‘make-or-buy’’ competency for each element;(d) activate manufacturing engineering plan for the ‘‘making’’ of parts;(e) activate purchasing orders for the ‘‘buying’’ of parts;(f) confirm costs for module components, considering the targets defined in the
setting phase, according to the PMS.
PBS relative to product range items are the basic information of the PDMsystem mentioned above.
Once the manufacturing engineering plan for ‘‘making’’ parts and purchasingorders for ‘‘buying’’ parts have been completed, it is possible to compare analyticaldata derived from the executive project, with the global cost target of the product,established in the economic initiative of industrialization. Gap analysis is managedaccording to the PMS, for allocating responsibilities to the single project leadersand co-design suppliers, consequently leading the countermeasure research onrunning. Normally, the Project Manager has a safety margin for changes andunexpected events, outside of PMS, for what he could do in consequence ofdocumented needs.
The Bill Of Material (BOM) follows PBS (and, in many cases, is the samedocument) and admits elements and subassemblies (physical modules) in con-sideration of making processes and manufacturing procedures for subassemblies
58 2 From Project to Product
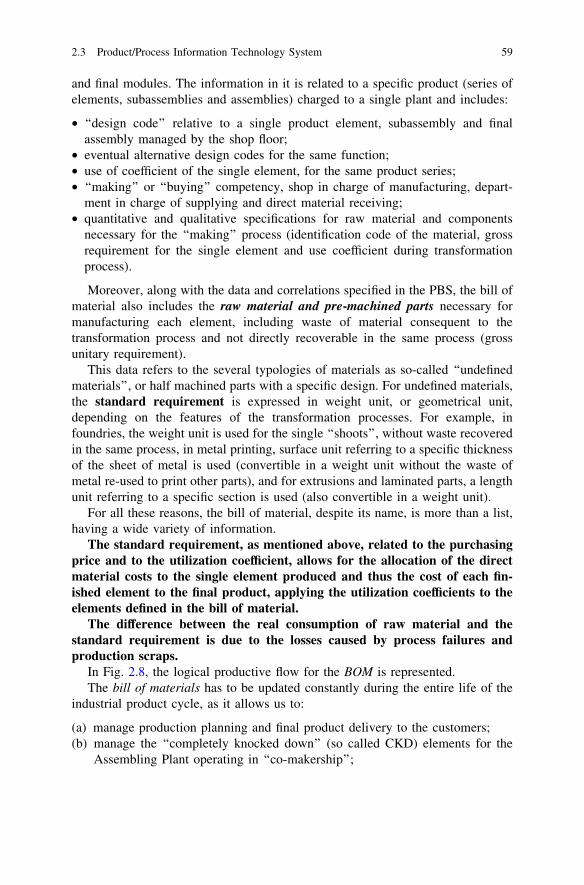
and final modules. The information in it is related to a specific product (series ofelements, subassemblies and assemblies) charged to a single plant and includes:
• ‘‘design code’’ relative to a single product element, subassembly and finalassembly managed by the shop floor;
• eventual alternative design codes for the same function;• use of coefficient of the single element, for the same product series;• ‘‘making’’ or ‘‘buying’’ competency, shop in charge of manufacturing, depart-
ment in charge of supplying and direct material receiving;• quantitative and qualitative specifications for raw material and components
necessary for the ‘‘making’’ process (identification code of the material, grossrequirement for the single element and use coefficient during transformationprocess).
Moreover, along with the data and correlations specified in the PBS, the bill ofmaterial also includes the raw material and pre-machined parts necessary formanufacturing each element, including waste of material consequent to thetransformation process and not directly recoverable in the same process (grossunitary requirement).
This data refers to the several typologies of materials as so-called ‘‘undefinedmaterials’’, or half machined parts with a specific design. For undefined materials,the standard requirement is expressed in weight unit, or geometrical unit,depending on the features of the transformation processes. For example, infoundries, the weight unit is used for the single ‘‘shoots’’, without waste recoveredin the same process, in metal printing, surface unit referring to a specific thicknessof the sheet of metal is used (convertible in a weight unit without the waste ofmetal re-used to print other parts), and for extrusions and laminated parts, a lengthunit referring to a specific section is used (also convertible in a weight unit).
For all these reasons, the bill of material, despite its name, is more than a list,having a wide variety of information.
The standard requirement, as mentioned above, related to the purchasingprice and to the utilization coefficient, allows for the allocation of the directmaterial costs to the single element produced and thus the cost of each fin-ished element to the final product, applying the utilization coefficients to theelements defined in the bill of material.
The difference between the real consumption of raw material and thestandard requirement is due to the losses caused by process failures andproduction scraps.
In Fig. 2.8, the logical productive flow for the BOM is represented.The bill of materials has to be updated constantly during the entire life of the
industrial product cycle, as it allows us to:
(a) manage production planning and final product delivery to the customers;(b) manage the ‘‘completely knocked down’’ (so called CKD) elements for the
Assembling Plant operating in ‘‘co-makership’’;
2.3 Product/Process Information Technology System 59
(c) manage the process of order emission to the suppliers and the direct materialrequirement process (MRP procedures);
(d) manage spare parts and after sales assistance;(e) check the utilization degree of direct materials;(f) identify direct material in input from the final product in output, feeding the
accountability financial system, for the billing as well as for stockmanagement;
(g) assign the ‘‘cost centres’’, the standard working times for each element, sub-assembly and assembly, complying with the standard operative procedures;
(h) aggregate the production costs for each element and consequently assign themto the final product.
Through the PDM system, which normally works on a ‘‘PC-based’’ systemwith a network connection, it is easy to access all the technical documentationof the project (element designs, assembly schemes, material technical speci-fications….) and elaborate documents necessary for product management. Itis possible as well to elaborate the manufacturing engineering documentation(standard operative procedures, control instructions…) necessary for processmanagement.
Let us end this section by showing the chart in Fig. 2.9 as to how the databasecan be connected on a wide band system throughout the company intranet.
PROCESSO DI
PROCESSO DI
FINAL PRODUCTS
RAW MATERIALS
1ST LEVEL GROUPS
FINAL ELEMENTS
MACHINED ELEMENTS
2ND 3RD
LEVEL GROUPS
ASSEMBLY PROCESS
MANUFACTURING PROCESS
-
Fig. 2.8 BOM productive flow
60 2 From Project to Product
2.4 Product Composition Analysis
To give an idea of the complexity of the projects and productive processes, inrelation to the number of parts (element design) and the number of levels ofcomposition (sub-assemblies, final assemblies), we keep in mind what follows:
• the PMS for a car model typically includes a number of 150/300 items,depending on the category and complexity of the product;
• the PBS is made by 2000/4000 items for the final carmaker, while it becomes atleast ten times bigger if we also consider mechanical groups and the number ofcomponents managed by the suppliers along the supply chain;
• the BOM, on which the material requirement planning and the production‘‘scheduling’’ is based, is made on a deployment concept and focuses on a singleplant and production shop included in the supply chain, at the single phases ofthe integrated production process.
The methodological aspects related to the supplying of direct material and thefinal dispatching and delivering of products will be detailed in Chap. 6, dedicatedto the logistic processes.
Without the actual information technology systems, it will be very hard tomanage the amount and the complexity of the element designs applied to theautomotive process.
PDMtechnical data and element designs
STANDARD PART AND SOLUTION DATABASE
BILL OF MATERIAL
SPARE PARTS
DATABASE
STANDARD OPERATIVE
PROCEDURES
CONTROL AND PRODUCTION NORMATIVES
According to the “best practices” these databases are parallel and interactive
SUPPLIERS AND
ASSIGNED SHARES
Fig. 2.9 Product process integrated system
2.4 Product Composition Analysis 61
We now show the deployment and employment analysis, made possible byconsulting the PDM records (Fig. 2.10):
The above composition analysis is important, first of all, for verifying that thedesigns are complete and their aggregation as a whole, also checking the coher-ence between the PBS and the analytical Product Macro Structure.
The other analytical purposes are:
Deployment at a single level to:
• identify the element required for each single level• run the purchasing or warehouse withdrawal orders
Deployment for scaling down to:
• elaborate the manufacturing standard procedures or maintenance manuals• elaborate the spare parts manuals
Deployment for resuming to:
• establish the components requirement based on the employment coefficient andthe production plan
• analyze the component, sub-assembly and final assembly costs
Deployment of raw materials to:
• assign the basic material and component replenishment programs, according tothe supplier shares
• plan the technical changes
Employment for scaling down to:
• analyze the employment of parts referring to subassembly and final assembly• describe the technical changes: what subassemblies and assemblies are
involved? What change of components must be related?
COMPOSITION ANALYSIS (DEPLOYMENT)
allows to answer to the question:
What parts is made thisassembly?
EMPLOYMENT ANALYSIS (EMPLOYMENT)
allows to answer to the question :
In which assembly this part isemployed?
Fig. 2.10 PDM analysis
62 2 From Project to Product
Employment for resuming to:
• establish the total basic materials required for the transformation process,considering the gross and net amount
• evaluate the utilization coefficient for the several typologies of basic materialsanalyze the influence of the variation of the cost of the parts on final productevaluate the consequence of a potential specific missing component of theproduction plan (model, version, optional…) so as to take the necessary coun-termeasures in production management.
2.5 Management of Technical Changes
In the automotive process, it is important to manage the technical changes of aproduct effectively.
In fact, product development and design activities require many changes duringindustrialization. Once designs and assembly schemes are defined, the prototypingphase is run to verify the project’s validity; in this phase, there are many technicalchanges that become necessary for correcting the project and, as a consequence,many project revisions are required: these must be preventively evaluated so as toconsider the cost/benefits and the impact on the development lead time.
This analysis becomes much more important when we are still in the devel-opment phase and the drawings have been used to design tools and equipment. Inthis case, it is also necessary to modify the specific tools already built.
During the development of new products, the Project Manager is respon-sible for assessing the true necessity of the technical changes and verifyingtheir compatibility with the economic targets of the initiative (R&D expenses,investments, product cost) and with the ‘‘time to market’’ targets. Neverthe-less, the decision-making process should be as quick as possible to guaranteeextra additional costs and critical conditions for the ‘‘time-to-market’’.
For existing products, the main reasons for technical changes are asfollows:
1. product content improvement, the consequence of specific requests from‘‘marketing’’;
2. quality level improvement for market alignment (style, functionality, reli-ability), considering the same product’s contents;
3. direct material cost reduction (raw material and ‘‘buying’’ components);4. transformation cost reduction (‘‘making’’ parts);5. ‘‘production non-quality’’ cost reduction (reduction of rejections,
reworks…);6. ‘‘after sales non-quality’’ cost reduction (warranties).
2.4 Product Composition Analysis 63
As a consequence of actions related to point 1, we should have a profit increase(increasing of price or sales).
Actions related to points 3, 4, 5 and 6 must be preventively evaluated from aneconomic point of view so as to guarantee a good cost/benefit return.
Technical changes for solving non-quality problems perceived by customershave to be introduced at all stages, searching for solutions with minimum devel-opment cost and less impact on final product cost. Improvements that reducewarranty costs (ideally more than three years for the main carmakers) whenincreasing product cost or requiring nonspecific investments must be economicallyevaluated to check the cost/benefit return as well.
To finish this chapter, let us describe the criteria used to introduce the technicalchanges for a new product during the industrialization phase or the productionphase. For this purpose, it is important to distinguish the following levels ofcomplexity, progressing from the lowest level to the highest:
1ST LEVEL for a single element or more, without interchangeability con-straints; the design number changes, but not the function code of the element, andit is sufficient to act on the specific tools of the single components.
2ND LEVEL for more elements, with congruence and interchangeabilityconstraints; composition for assembly does not change, nor for the sub-assemblies;design number changes, but not the function code of the element, and it is suffi-cient to act on the specific tools of the single components.
3RD LEVEL in addition to what was referred to in the previous point, thestructure of the assembly and sub-assemblies also changes; in this case, the designnumber changes as well as the function code of the elements. It is also necessary toreview the assembly schemes and the manufacturing engineering plan.
Considering the above three levels of complexity and introducing an emergencylevel, it is possible to introduce a technical change in different ways, as describedby the scheme in Table 2.1.
In planning the introduction of the changes from level 2 and 3, in case ofmodifications in tooling that prevent the production of components before thechanges, it is necessary to evaluate the specific spare parts stock level for aftersales assistance.
Considering what is mentioned above, the necessity of planning the introduc-tion of technical changes, and complying with the requirements of the Product andProcess Engineering Department, Manufacturing Department and Supply ChainDepartment, is clear (considering also, when necessary, the Purchasing Depart-ment, the After Sales Department and the Suppliers).
Once these preventive checks are completed, all instructions are invoiced to alldepartments involved simultaneously by e-mail. The Product Definition Depart-ment is in charge of this task; this department is also in charge of coordinating theother secondary plants for the introduction of changes in other co-producer plants.
If the ‘‘scheduling’’ is inconsistent, the introduction of technical changes cancause delays in the production process and/or economic losses, which can also bedue to the rejection of direct material no longer usable.
64 2 From Project to Product
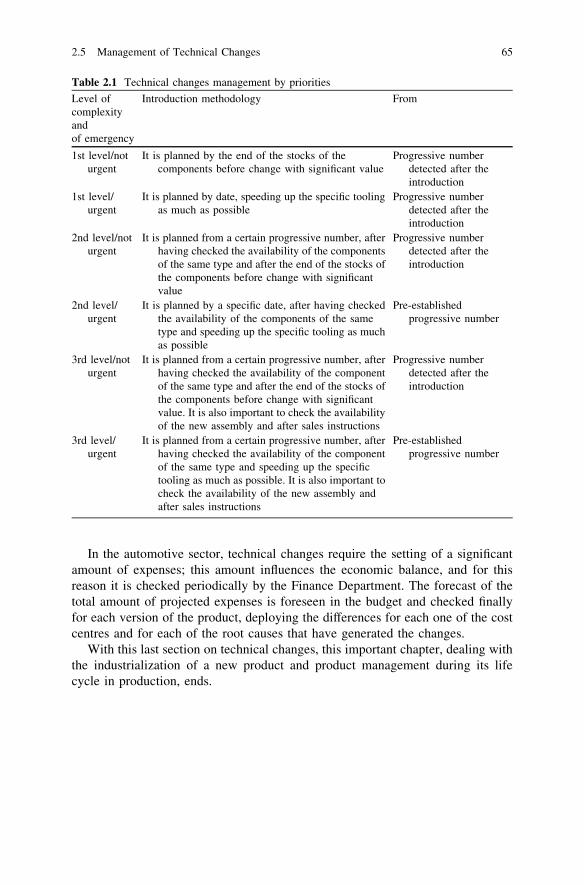
In the automotive sector, technical changes require the setting of a significantamount of expenses; this amount influences the economic balance, and for thisreason it is checked periodically by the Finance Department. The forecast of thetotal amount of projected expenses is foreseen in the budget and checked finallyfor each version of the product, deploying the differences for each one of the costcentres and for each of the root causes that have generated the changes.
With this last section on technical changes, this important chapter, dealing withthe industrialization of a new product and product management during its lifecycle in production, ends.
Table 2.1 Technical changes management by priorities
Level ofcomplexityandof emergency
Introduction methodology From
1st level/noturgent
It is planned by the end of the stocks of thecomponents before change with significant value
Progressive numberdetected after theintroduction
1st level/urgent
It is planned by date, speeding up the specific toolingas much as possible
Progressive numberdetected after theintroduction
2nd level/noturgent
It is planned from a certain progressive number, afterhaving checked the availability of the componentsof the same type and after the end of the stocks ofthe components before change with significantvalue
Progressive numberdetected after theintroduction
2nd level/urgent
It is planned by a specific date, after having checkedthe availability of the components of the sametype and speeding up the specific tooling as muchas possible
Pre-establishedprogressive number
3rd level/noturgent
It is planned from a certain progressive number, afterhaving checked the availability of the componentof the same type and after the end of the stocks ofthe components before change with significantvalue. It is also important to check the availabilityof the new assembly and after sales instructions
Progressive numberdetected after theintroduction
3rd level/urgent
It is planned from a certain progressive number, afterhaving checked the availability of the componentof the same type and speeding up the specifictooling as much as possible. It is also important tocheck the availability of the new assembly andafter sales instructions
Pre-establishedprogressive number
2.5 Management of Technical Changes 65
Chapter 3Manufacturing Engineeringand Equipment Efficiency Evaluation
3.1 Manufacturing Engineering Planning and ExecutiveProject
A study of Manufacturing Engineering starts with the product and the elements tobe manufactured: element designs and geometrical precisions needed, machiningand basic material characteristics, breakdown of work structures for the completesubassembly, etc.
By working cycle, we mean the right sequence of operations needed to trans-form a certain basic material into a partial or full machine, applying specifictransformational technologies. By assembling cycle, we mean the right sequenceof operations for compiling components into subgroups or final product subas-semblies, applying specific technologies for assembling and joining.
Criteria for tooling and automation level decisions were discussed in Sect. 1.4of the previous chapter. It is to be emphasized that the operative speed of a processdepends on its technological characteristics, equipment capacity and the physio-logical limits of manual activity.
3.1.1 Manufacturing Engineering Plan Study and ‘‘System’’Preliminary Project
Manufacturing Systems for series production are developed starting from a pre-liminary manufacturing engineering study (working solutions), which allows fordefining the following process targets:
(1) Operations needed, repetitiveness during the cycle, sequences and totalduration (significant data);
(2) Qualitative and quantitative product output for different phases of the process,in relation to design elements and operation allocation;
(3) Typology and technical specifications of equipment and working means;
M. Gobetto, Operations Management in Automotive Industries,Springer Series in Advanced Manufacturing, DOI: 10.1007/978-94-007-7593-0_3,� Springer Science+Business Media Dordrecht 2014
67
(4) Criteria for project setting of specific tools, in relation to functional needs andchain of tolerances;
(5) Automation level and equipment typology for inter-operational connections.
For quick and efficient implementation of the above described manufacturingengineering plan, it is necessary to prepare a database including basic data andstandard solutions. These documentations are derived from field applications,benchmarking analysis or research projects.
The manufacturing engineering plan then leads to the preliminary project andthe standard solutions delivery (technical specifications book) necessary to pur-chase equipment, machine tools and tooling. Technical documentation for thepreliminary project includes:
• Brief manufacturing cycle, in which data derived from the manufacturingengineering plan are resumed;
• Preliminary technological layout, which features signed operative unit positions,workplaces and material flows;
• Manpower required for a functioning process;• Plant spaces and power supply requirements, evaluation based on specific
parameters;• Investment required, evaluation based on specific parameters.
This information is fundamental for the planning of economic initiatives,elaborate technical data and the specifications book for purchasing equipment andtooling.
3.1.2 Executive Project
Starting from the manufacturing engineering plan and preliminary project, man-ufacturing cycle operations are analysed, and specific tools and automation sys-tems are developed as follows:
(a) After tenders and purchasing negotiations, equipment and tool manufacturersare put in charge by the carmakers, so that it is possible to proceed simulta-neously with the engineering in the subsequent project phases.
(b) Material technical specifications and geometrical shapes of input elements aredeployed for each process phase. Consequently, the degree of utilization ofdirect materials is evaluated, considering the process rejects and over-metalnecessary for the transformation process, in hopes of finding more convenientsolutions. Some of the more significant examples:
• to minimize metal rejects in shearing and shape forming processes, the bestsheet metal shapes and positions are to be determined, assuring materialborder portions strictly necessary to keep sheets during forming operations;
68 3 Manufacturing Engineering and Equipment Efficiency Evaluation
• in the painting process, electrostatic systems driven by programmable robotsare used, with optimized routes to assure uniformity of layers and minimizeover spray;
• to produce differential secondary gears, an evolving conical profile is made bya precise printing process, so that over-metal may be reduced at the same timeas the elements of the finishing operations are drastically reduced.
(c) Diagrams of time-sequences for each operation are analytically definedconsidering obtainable productivity in each process phase, as described inSect. 3.2 below.
(d) Labour standard working time required for the entire working cycle is eval-uated as described in Sects. 3.3 and 3.4.
(e) Electrical power supply and the auxiliary material consumption necessary forexecution of the working cycle are preventively defined, applying criteriadescribed in Chap. 5.
(f) Project ends with tools CAD design and elaboration of executive layout and joboperation descriptions.
Based on the above, project documentations of specific tooling and equipmentare defined and installed, and the manufacturing process is developed. Theexecutive layout represents:
• Positioning of machines, equipment and devices;• Material flow and positioning of manufacturing process input components and
output products;• Position and classification of manpower involved in working cycle;• Buildings and installations necessary for equipment and the connection of
machines to energetic and fluidic nets, including exhaustion of process materials(relative documentations are normally attached to the executive layout so thatequipment delivery can be worked out in advance).
Virtual Factory techniques are used to optimize working cycles and tool theexecutive project: operative units and specific tools are represented in 3D, relatedto CAD design elements; kinematic functioning simulations for automatic devicesare run to prepare for possible temporal or physical interferences during the workcycle, and an ergonomics standard is used to determine the best manpower posi-tion. Following these checks, necessary changes to the project are made to reducetime during the technical system set-up and regulation phase. For managing anexecutive project, it is very useful to apply the methodological criteria described inSect. 2.1 of the previous chapter, in relation to systems WBS. As the executiveproject runs, it is possible to calculate analytically the unitary cost for eachcomponent, subassembly and final assembly of product, applying the methodo-logical criteria featured in Sect. 4.5 of the following chapter. Furthermore, inadvance of the purchase of equipment and tooling, based on WBS, it should bechecked that necessary capital is consistent with the investment plan laid out in theproject initiative.
3.1 Manufacturing Engineering Planning and Executive Project 69
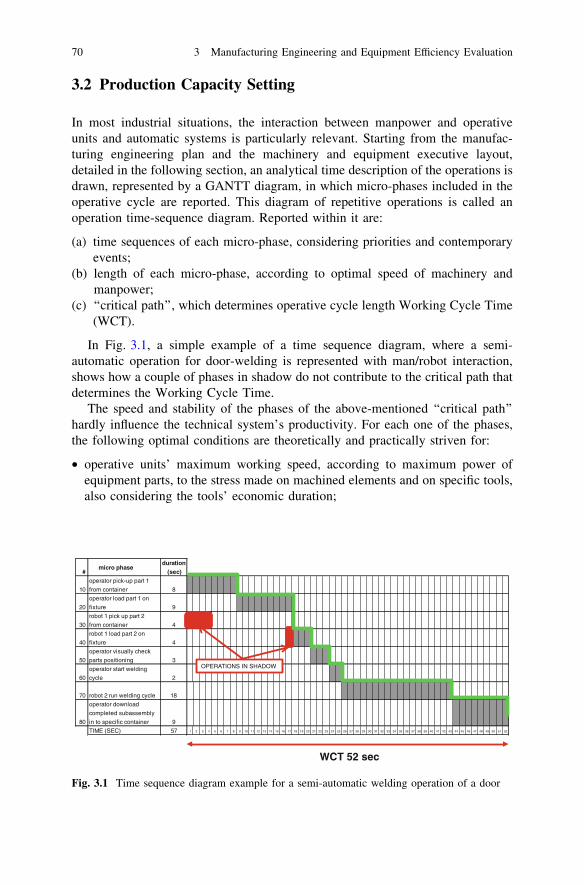
3.2 Production Capacity Setting
In most industrial situations, the interaction between manpower and operativeunits and automatic systems is particularly relevant. Starting from the manufac-turing engineering plan and the machinery and equipment executive layout,detailed in the following section, an analytical time description of the operations isdrawn, represented by a GANTT diagram, in which micro-phases included in theoperative cycle are reported. This diagram of repetitive operations is called anoperation time-sequence diagram. Reported within it are:
(a) time sequences of each micro-phase, considering priorities and contemporaryevents;
(b) length of each micro-phase, according to optimal speed of machinery andmanpower;
(c) ‘‘critical path’’, which determines operative cycle length Working Cycle Time(WCT).
In Fig. 3.1, a simple example of a time sequence diagram, where a semi-automatic operation for door-welding is represented with man/robot interaction,shows how a couple of phases in shadow do not contribute to the critical path thatdetermines the Working Cycle Time.
The speed and stability of the phases of the above-mentioned ‘‘critical path’’hardly influence the technical system’s productivity. For each one of the phases,the following optimal conditions are theoretically and practically striven for:
• operative units’ maximum working speed, according to maximum power ofequipment parts, to the stress made on machined elements and on specific tools,also considering the tools’ economic duration;
#micro phase
duration (sec)
10
operator pick-up part 1
from container 8
20
operator load part 1 on
fixture 9
30
robot 1 pick up part 2
from container 4
40
robot 1 load part 2 on
fixture 4
50
operator visually check
parts positioning 3
60
operator start welding
cycle 2
70 robot 2 run welding cycle 18
80
operator download
completed subassembly
in to specific container 9
TIME (SEC) 57 1 2 3 4 5 6 7 8 9 10 11 12 13 14 15 16 17 18 19 20 21 22 23 24 25 26 27 28 29 30 31 32 33 34 35 36 37 38 39 40 41 42 43 44 45 46 47 48 49 50 51 52
OPERATIONS IN SHADOW
WCT 52 sec
Fig. 3.1 Time sequence diagram example for a semi-automatic welding operation of a door
70 3 Manufacturing Engineering and Equipment Efficiency Evaluation
• minimum time required for transforming operations, according to productspecifications from a quality point of view and also considering necessary‘‘process capability’’ levels (this argument will be addressed in Chap. 8);
• sustainable working speed for manpower, to guarantee consistency of manualoperations included in working cycle, according to criteria laid out in Sect. 3.3below.
In the same operation time-sequence diagram, recurrent manual phases include:
• loading of direct material and unloading of final products, not performed byautomatic handling partners;
• the handling of ‘‘partner’’ tools and the eventual manual control of operativemachines, due to safety reasons;
• Assembling, finishing and controlling operations not performed by automaticsystems.
Let’s call Working Cycle Time (WCT) the result of the operation time-sequencediagram, including both manual and automatic phases. In automotive production,WCT is typically measured in minutes. The frequency of the recurrence ofoperations is called ‘‘pace’’ and it is typically expressed by the number of cyclesper hour, with the exception of very high rhythm machining operations, where it isexpressed by number of cycles per minute (sheet metal printing, metal forging andmetallic component).
With the production process set, WCT is a standard input data. It is preventivelyset during the development phase and then tested and improved during the‘‘systems’’ try-out phase, with the aim of reaching the project’s productivecapacity.
WCT determines productive flow speed, represented by the ‘‘Hourly Vir-tual Production’’: HVP = 60•k/WCT, where k is the number of elementsproduced for each working cycle.
In addition to the recurrent phases included in the ‘‘operation time-sequenceddiagram’’, intervention with machines and tools can be expected with periodicfrequency. Those activities are related to the following process auxiliaryoperations:
• tools with rapid usage calibration and change;• batch production changeover;• direct material supply container substitution;• statistical process control for parameters affecting ‘‘process capability’’ and
consequent set-up;• technical recurrent cleaning;• daily and weekly start-up and shut-down operations.
For each of the above periodic auxiliary operations, necessary for optimalproduction, times and methods of action are carefully analysed, searching foroptimal frequencies to assure ‘‘process capability’’ and to obtain the bestperformance from the equipment.
3.2 Production Capacity Setting 71
Let us define process unavailability index pu as the incidence of interruptionsdue to the above-mentioned operations on working time, considering their lengthand frequency:
pu ¼PN
i¼1ðSUUT
P Þi�
WCT; where:
(SUUT) is the unavailability of the standard time for production, due to thesingle set-up periodical operation (i);
(P) is the required period (number of working cycles required);(N) is the total number of periodical operations set up to perform during a
working shift.
Let us now introduce ‘‘standard productive capacity’’ (SPC), related to a single‘‘operative unit’’ or to a ‘‘multi-operational system’’: it defines the quantity ofproducible elements in a defined available working time (AWT), assuming fullcontinuity and stability, without any technical or managerial failures, but con-sidering the time necessary to run periodic auxiliary operations.
SPC ¼ 60 � k � AWT
WCT � 1þ puð Þ¼ standardproductivecapacityduringavailableworkingtime AWTð Þ;
where:k is the number of elements produced in each working cycle;WCT is the working cycle time measured in m0;pu is the process unavailability index;AWT is the available working time, measured in hours/day or hours/week.
Considering the technical reliability coefficient R of the ‘‘system’’, it is possibleto calculate the Available Productive Capacity: APC = R � SPC.
WCT and pu are typical of the technological process; k is typical of tooling(strictly related to batches dimension); R is typical of machines/equipment andtechnological layouts, but also depends on maintenance management effectiveness.
Reliability coefficient R is determined by statistical data collecting, applyingpredictive analysis techniques (process FMEA) during the system developmentphase; during production, normal running R is ‘‘detected’’ by statistical methods,considering real process failures and related events.
In Chap. 5, which is dedicated to working means technical management, wewill approach equipment reliability and maintainability matters; we will alsodiscuss criteria for minimizing unavailability times that influence real productivecapacity.
72 3 Manufacturing Engineering and Equipment Efficiency Evaluation
3.3 Working Time Analysis Methodologies
Let us describe working time analysis techniques generally applied in manufac-turing industries:
(a) Stop-Watch Study AnalysisThis technique was introduced in early 1900 by F.W. Taylor in the so-called scientificorganizations of works and was later successfully extended to other industrialcompartments for series productions. Starting in 1970, it was strongly criticized froma social and political point of view, effectively lessening its employment. Recently, ithas been newly applied, thanks to some methodological innovations introduced.
For measuring time, it is necessary to proceed as follows:
(1) Workers are trained to apply working standards preventively and are informedabout ways to proceed garnered from stop-watch study analysis;
(2) Through statistical criteria, the number of operative cycles to observe isdetermined, also taking into consideration dispersion phenomena of the ana-lysed process if the dispersion is high, more samples will be needed for aneffective analysis;
(3) For each macro-phase of the operative cycle, the time employed is recorded;(4) Each working speed observed is compared to the ‘‘normal’’ speed, so that
eventual adjustments can be determined;(5) Time adjustments (increasing) for each working phase are applied according
to specific tables, taking fatigue and physical efforts exerted during theworking shift into consideration.
Applying this methodology is possible if the analyst is concerned about tech-nologies of the analysed phases, ensuring in advance that working conditions willfollow the manufacturing engineering plan, and proposes improvements that willbecome necessary. He must also observe movements taking into considerationergonomics, defining normal and sustainable working speed. This evaluation alsoimplies the application of specific rules related to physical effort, fatigue, workingpositions and movement repetition.
As a consequence, for each working phase analysed, a time increasing coeffi-cient is applied, according to a standard table, elaborated on with statistical andscientific considerations by international rules institutions, in association withexperts in ergonomics, physiology and working means.
In case of uncertainty of working speed estimation, the analyst can performobservations on different subjects to reach a ‘‘calibrated’’ evaluation. Furthermore,he can also use an available ‘‘database’’, compiled from previous experiences.
For each group of operations, it is important that the analyst separates activetimes from inactive times resulting from waiting for machine/equipment ormovements between different working stations. Actions to be adopted are relatedto inactive phases that are not added value phases.
3.3 Working Time Analysis Methodologies 73

(b) Time studying with modern technologiesThis technique applies the same criteria as the previous one, the only differencebeing that time observations are performed through video recordings, appropri-ately positioned and remote controlled, allowing for the simultaneous measuringof more operations related each other from different points of view.
Using specific software, by watching these video clips it is also possible toemulate normal working speed and introduce the right adjustments on measuredtimes.
Like the previous example, this technique requires informing the observedworkers, and pointing out the targets of the analysis so as to obtain theircollaboration.
The advantages of the stop-watch study technique are:
• an opportunity to observe simultaneous correlated activities performed by moreworkers;
• an opportunity to watch and discuss the records with the workers, involvingthem in the improvement of manufacturing engineering;
• precision in observing operations deployed in multiple phases, with long times,as process auxiliary operations (changeover, set-up times, preventive mainte-nance interventions…);
• the analyst’s continuous presence is not necessary during video recording;• an opportunity for analysis of the video clips by modern specialists (manufac-
turing engineering technicians, ergonomists, safety and environment experts…).
This technique is widely applied in Japan and has even begun to spread throughother industrial realities.
(c) Analysis with pre-determined standard timesMethods Time Measurement technique (MTM) began in the first half of the lastcentury, spreading out through industrial manufacturing compartments, first in theUnited States and then in Europe. It consists of preventive analysis that allowsquantifying the time necessary for each working micro-phase included in theoperative cycle. Measurements are performed in office and are very precise andobjective, because they are based on a wide range of elementary statistical data(standard micro-phases of manual work). Application requires significant effort interms of analyst technicians, with high cost and long elaboration times. For thisreason, the MTM technique fits with a widespread number of repetitive operations.
Other simplified techniques have been derived from MTM, integrating moreMTM micro-phases, such as MTM-2 (still used in North America), UAS, MEK,TMC and, more recently, WF, developed in Europe and adopted by differentmanufacturing industries. The trend is to uniform all of these techniques throughISO.
Pre-determination of working times requires a detailed analysis of operativemethodologies, defining the operation time-sequence diagrams in the designingphase of the project, while also taking the positions of equipment, machines, toolsand each material handled during production into consideration. So it is necessary
74 3 Manufacturing Engineering and Equipment Efficiency Evaluation
to design the technological layout, defining exact working conditions and actionrange for the workers, according to what was defined in Sect. 3.1.
Pushed by the European Community, recent new criteria for risks resultingfrom working efforts, working positions and movement repetitiveness during theworking shift (OCRA evaluation method) have been defined. To satisfy the rules,and improve productivity at the same time, it is very important to apply virtualanalysis techniques, with particular attention to the most critical operations, so asto optimize workplace ergonomics and choose the best-fitting partner tools.ERGO-UAS and EAWS, recently refined, are the most known standard applica-tions for time measurement that combine ergonomics standards to MTM prede-termination of working times techniques.
The analysis of working means and material handling containers is also veryrelevant for manual picking operations.
It is also important to adopt, during the development phase, product and processsolutions convenient for assembling operations, with the target of reducingphysical effort and avoiding human errors (design for assembly).
(d) Instantaneous Observations AnalysisLet us discuss this analysis technique, taking into consideration that it is onlyfitting for auxiliary operations, including office operations.
It is necessary that the analyst have a thorough understanding of the functionsand roles of the observed employees. He performs periodic inspections in therelevant areas and by a route established by statistical method, so as to cover allworkplaces. During inspections, he must instantaneously evaluate:
• if workers are at their designated workplaces;• if workers are active;• type of operation performed;• type of tools used.
In collaboration with the foremen, the analysts classify activities by:
• types of activity, in relation to operative role assigned;• utilization of technical support (working means, ICT supports…);• time required for meetings, consultations or other activities not strictly neces-
sary for the operative roles.
Processing data observed, by statistical method, it is possible to define roughly:
• medium degree of activity;• activities composed by typology;• time necessary for meetings and consultations;• degree of utilization of technical support.
Consequent to this analysis, foremen have the necessary elements for deciding:
• the refinement of assigned tasks;• improvement of working means and workplace organization;
3.3 Working Time Analysis Methodologies 75
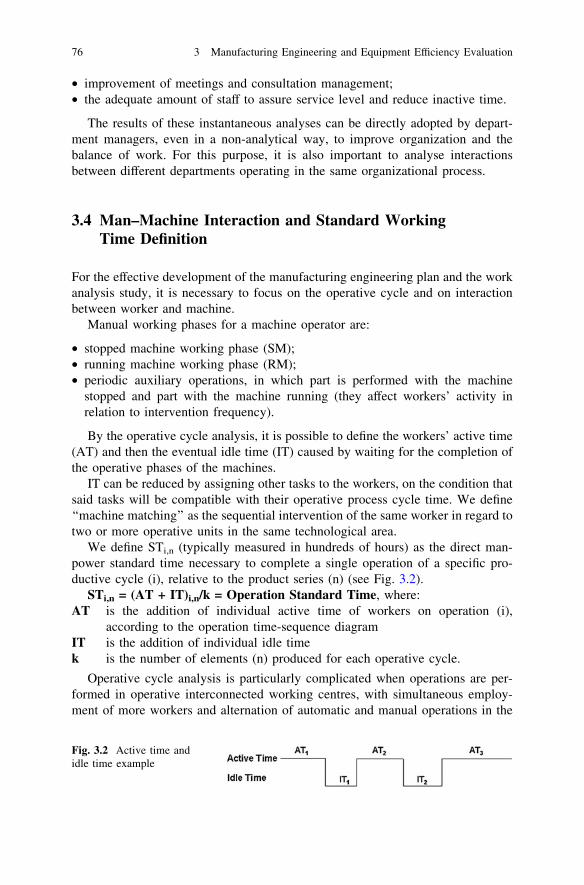
• improvement of meetings and consultation management;• the adequate amount of staff to assure service level and reduce inactive time.
The results of these instantaneous analyses can be directly adopted by depart-ment managers, even in a non-analytical way, to improve organization and thebalance of work. For this purpose, it is also important to analyse interactionsbetween different departments operating in the same organizational process.
3.4 Man–Machine Interaction and Standard WorkingTime Definition
For the effective development of the manufacturing engineering plan and the workanalysis study, it is necessary to focus on the operative cycle and on interactionbetween worker and machine.
Manual working phases for a machine operator are:
• stopped machine working phase (SM);• running machine working phase (RM);• periodic auxiliary operations, in which part is performed with the machine
stopped and part with the machine running (they affect workers’ activity inrelation to intervention frequency).
By the operative cycle analysis, it is possible to define the workers’ active time(AT) and then the eventual idle time (IT) caused by waiting for the completion ofthe operative phases of the machines.
IT can be reduced by assigning other tasks to the workers, on the condition thatsaid tasks will be compatible with their operative process cycle time. We define‘‘machine matching’’ as the sequential intervention of the same worker in regard totwo or more operative units in the same technological area.
We define STi,n (typically measured in hundreds of hours) as the direct man-power standard time necessary to complete a single operation of a specific pro-ductive cycle (i), relative to the product series (n) (see Fig. 3.2).
STi,n = (AT + IT)i,n/k = Operation Standard Time, where:AT is the addition of individual active time of workers on operation (i),
according to the operation time-sequence diagramIT is the addition of individual idle timek is the number of elements (n) produced for each operative cycle.
Operative cycle analysis is particularly complicated when operations are per-formed in operative interconnected working centres, with simultaneous employ-ment of more workers and alternation of automatic and manual operations in the
Fig. 3.2 Active time andidle time example
76 3 Manufacturing Engineering and Equipment Efficiency Evaluation
same ‘‘integrated system’’. For those ‘‘systems’’ with a high automation level, it isimportant to estimate manpower requirements for equipment management, tech-nical checks and periodic auxiliary operations. In these situations, it is defined asthe necessary ‘‘operative garrison’’, by applying work analysis techniques men-tioned in the previous sections. We define STm,n as the working standard timenecessary to manufacture the product unit (n), in the ‘‘system’’ (m):
STm,n = LHm/SPCn = System Standard Time (labour hours for productunit), where:LHm are labour hours necessary for the operative garrison of the ‘‘system’’,
during considered working time;SPCn is standard productive capacity relative to product series n, referring to the
considered working time.
We define ‘‘Standard Time’’ STn as labour hours strictly necessary formanufacturing a specific product series n, based on operative cycles assigned.
STn is calculated adding STI,n and STm,n according to the bill of material, asseen in Chap. 2.
STn is the fundamental input data necessary for:
• planning and assigning direct labour;• checking direct labour efficiency;• accounting direct labour cost for single products.
STn is called standard working time, without technical and managerial losses.In Chap. 4, we will examine this argument again from the organizational point ofview of labour.
Let us close this section by underlining the importance of interaction betweenlabour activities related to the productive process and the ones performed bymachines and equipment, according to modern criteria of labour organization.
Automation can eliminate repetitive and tiresome manual jobs. When notstrictly tied to the cycle time of productive machines, workers can perform othersupervisory tasks such as quality checks, tool changes, process parameter adjust-ments and recurrent preventive maintenance operations (when a specific technicalcompetence is not required). For more complex operations, it is useful to providemodern monitoring techniques for ‘‘guided conduct’’ and for keeping an eye oncritical process parameters even from a distance.
Automation is really an advantage when it improves productivity andprocess quality. Avoiding working conditions that cause fatigue and increasethe risk of human errors, the processes become more available, with betterproduct quality and more stable production flow.
Another intelligent way to improve labour productivity by reducingergonomics’ issues in the workplace is the usage of the so called ‘‘Low CostAutomation’’ (LCA); it consists with the usage of intelligent automatic sys-tems that mostly utilise mechanics/pneumatic solutions combined with gravityforce to reduce the human efforts in loading and unloading parts on the
3.4 Man–Machine Interaction and Standard Working Time Definition 77
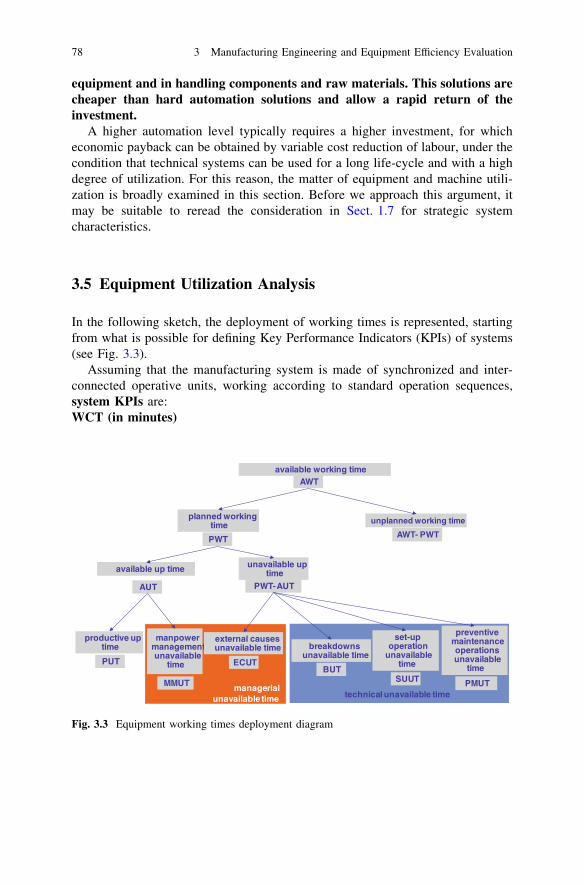
equipment and in handling components and raw materials. This solutions arecheaper than hard automation solutions and allow a rapid return of theinvestment.
A higher automation level typically requires a higher investment, for whicheconomic payback can be obtained by variable cost reduction of labour, under thecondition that technical systems can be used for a long life-cycle and with a highdegree of utilization. For this reason, the matter of equipment and machine utili-zation is broadly examined in this section. Before we approach this argument, itmay be suitable to reread the consideration in Sect. 1.7 for strategic systemcharacteristics.
3.5 Equipment Utilization Analysis
In the following sketch, the deployment of working times is represented, startingfrom what is possible for defining Key Performance Indicators (KPIs) of systems(see Fig. 3.3).
Assuming that the manufacturing system is made of synchronized and inter-connected operative units, working according to standard operation sequences,system KPIs are:WCT (in minutes)
technical unavailable timemanagerial
unavailable time
available working time
planned working time
available up time
unplanned working time
AWT
PWT AWT - PWT
AUT
unavailable up time
PWT -AUT
productive up time
PUT
manpower management unavailable
time
external causes unavailable time breakdowns
unavailable time
set-up operation
unavailable time
preventive maintenance operations unavailable
time
MMUT
ECUTBUT
SUUT PMUT
Fig. 3.3 Equipment working times deployment diagram
78 3 Manufacturing Engineering and Equipment Efficiency Evaluation
= working cycle time, whichdetermines the system’s produc-tive cycle time;
PUT (in hours) = WCT • QP/60• k = productive up time, referringto working time employed forproduction, QP being the quantityof elements produced;
R = PUT/(PUT + BUT) = technical reliability;A = AUT/(AUT + BUT + SUUT + PMUT) = technical availability;OEE = PUT/EWT = overall equipment efficiency
(or global equipment effective-ness), EWT being the employedworking time to produce quantityQP;
U = PWT/AWT = utilization degree of produc-tion capacity available (equip-ment saturation).
In case of N equivalent modules set in parallel, WCT and R are relative to singlemodules, while total system productive capacity is N�APC (Available ProductiveCapacity for the single modules). In case of N modules directly connected in series,R = R1�R2�…RN, Rn being the availability coefficient of a single module.
For an integrated system’’, measurement of Overall Equipment Efficiency, forseries production, can be obtained from the following calculation:
OEE ¼
PN
n¼1
QPnHVPn
WTE = Overall Equipment Efficiency, where:N is the typology of transformed product (element code);QPn is the quantity of element (n) produced during the period WTE, minus
unrecoverable scraps;HVPn is hourly virtual production relative to the single element n;WTE is the working time employed, measured in hours.
The quantity of elements produced QPn is measured from the control system.The difference (A-OEE) is due to inefficiencies in the operative system
management, for the following six potential causes of loss:
(1) lack of parts (materials) in input or (final product) in output in the‘‘system’’;
(2) no availability of auxiliary materials or power supply;(3) changeover out of production plan;(4) no re-workable scraps of production;(5) start-up and shut-down losses, due to learning curve of workers and tech-
nical try-out of the systems;(6) speed reduction for lack of workers, low labour efficiency, lower than stan-
dards tool life…
3.5 Equipment Utilization Analysis 79
3.6 Introduction of Integrated Production Systems
At this point, it is important to examine ‘‘integrated production systems’’, whichare hardly employed in the automotive industry.
An ‘‘integrated system’’ is made of more process stages or sub-processes,directly connected to each other by a one-piece-flow concept, able to run completemanufacturing cycles and governed by automatic control systems interconnectedby internal nets. Each of these sub-processes could also be a single ‘‘module’’ (toolmachine, technological equipment, machining centre, assembling cell or line part),or two or more ‘‘modules’’ working in parallel. We remind you that these‘‘modules’’ also include quality control stations.
In Sect. 3.1, we examined the technological layout study, which defines thelinks between operative units and points out flow and stocking areas for processmaterials. The analysis of the ‘‘time sequence diagram’’ of each operation leads toidentification of the ‘‘leading stage’’, which determines the operative cycle time ofthe integrated productive system (bottle neck concept).
During the setting phase, it is important to balance and size up the differentprocess stages, so that they may have the same productive capacity. Nevertheless,ideal balance is not always possible and it is fairly normal to set ‘‘bottle necks’’.Then, shop floor management must focus its attention on the ‘‘leading stage’’presenting the minor Standard Productive Capacity (SPC), searching for:
• optimization of time-sequence diagrams (minimum WCT maintainable);• auxiliary operations, affecting optimization of idle time (minimum pu possible,
considering the same WCT);• standard application of preventive maintenance, for improving technical avail-
ability (maximum A obtainable).
In searching for optimal conditions in operations between modules of thebalanced integrated system, it is important to use, in the development phase,modern CAPE supports, which allow for the simulation of functioning conditions,with particular reference to production flow and inter-operational buffers. Foreffective analysis, it is necessary to consider the following parameters relative tothe single ‘‘operative unit’’ in the software: WCT, duration and frequency oftechnical stoppages consequent to auxiliary operations and breakdowns (MTBF,MTTR, according to definitions reported in Chap. 5), position and dimension of‘‘buffers’’.
Let us conclude the argument for manufacturing ‘‘integrated systems’’,emphasizing that they are equipped with a 1st level information technology net,which links machine control units and automatic devices (CNC, PLC…) tomicrochips dedicated to data collection and processing.
This 1st level information network works for operative cycle planning, pro-duction flow and monitoring of auxiliary operations (tool change, maintenanceoperations, quality statistic control…). It can be linked to information systems ata superior level, dedicated to the overall management of production planning, to
80 3 Manufacturing Engineering and Equipment Efficiency Evaluation
statistical analysis of quality data, or to the traceability of components and oper-ations related to product quality.
For complex ‘‘systems’’, with a high automation level, it is important that thisinformation technology collect and transmit net data to a dedicated informationtechnology centre, distinguishing events caused by technical failures from thoseresulting from the normal auxiliary operations, rather than caused by machineusers. In this way, data can be processed in time to compliment ‘‘reports’’ of‘‘system’’ efficiency (technical and overall), making operative control easy forresponsible employees.
The concept of an ‘‘integrated productive unit’’ is consequent to theattribution of management responsibility to a single manager, who has thecollaboration of an ‘‘interfunctional team’’ made of experts and the support ofinformation technologies. Work organization applies, as much as possible, to‘‘job enlargement’’ criteria; for example, assembly line workers are assignedquality self-inspection tasks, machine operators given autonomous inspectionand maintenance tasks, and so on.
3.7 Operative Productivity and Flexibility
Productivity of a manufacturing system is evaluated basing on the following‘‘functioning parameters’’, according to the definitions mentioned earlier:HVP = hourly virtual productionA = technical availabilityAPC = available productive capacity, referring to daily available functioning
timeST = standard time referring to the transformed product unit.
Operative flexibility of a manufacturing system is evaluated based on the fol-lowing process and product characteristics:
• element range producible at ‘‘random’’, that is to say without interrupting theprocess continuity;
• element range producible by batches, by tool changes requiring specific ‘‘set-uptime’’;
• product mix re-ordering frequency, respecting available productive capacity andconsidering the above-mentioned ‘‘set-up-times’’, applying the criteria of min-imum sustainable batch (mentioned in the Basic Concept Chapter);
• medium lead time (the meaning of which will be explained in Chap. 6).
When ‘‘benchmarking’’ research is made for manufacturing systems, it isimportant to compare parameters of both productivity and operativeflexibility.
3.6 Introduction of Integrated Production Systems 81
3.8 Equipment and Machine Loading
Let us now discuss the planning of operations and productive capacities, veryimportant for the success of industrial activities, especially when significantinvestments are involved. For automotive applications, we generally have toconsider monthly plans that cover a period of one or more years. Working plannedtime is expressed in hours/day and in working days/month. Necessary input datafor equipment and machine loading are:
• product typologies ‘‘N’’ assigned to the ‘‘system’’;• monthly production plan (MPn), related to the specific product n;• virtual hourly productivity (HVPn);• standard productive capacity (SPCn), intended as a medium data for one hour of
working time;• OEE (overall equipment efficiency);• Available working days in a month (MD).
Planned working time calculation (machine loading time) can be done applyingthe following alternative criteria:
This criterion is applied usefully to multi-operational systems, organized inmultiple phases and interconnected to each other with a one-piece-flow concept.Its application requires periodic statistical utilization analysis for the systems,using the criteria from Sect. 3.5. This mode of work is useful for the followingautomotive productions:
1stCRITERIA
is referred to as standard productive capacity (SPC), without considering any losttime for process failures (breakdowns and speed reductions) and managementinefficiencies.
NPWT ¼PN
n¼1
MPnSPCn
�MD = net planned working time (hours/day).
This criterion considers that the total available working time (AWT) needed torecover eventual production losses, due to conduction or technical failures, willwiden working time when necessary. Alternatively, it is necessary to set safetystocks.This criterion is normally applied to machine loading, when we have autonomousmachines, or multi-operational systems not strictly interconnected, with thepossibility of working in a warehouse.In the case of more than one operative unit, or module, operating parallel to thesame department, NPWT is calculated as medium unitary data.This is the best way to plan machine/equipment loading used for steel printing,polymer printing, mechanical machining centres and electrical and electroniccomponents production.
2ndCRITERIA
is referred to as the virtual productivity (HVP) and considers the OverallEquipment Efficiency (OEE).
PWT ¼PN
n¼1
MPnHVPn
�OEE �MD = planned working time (hours/day).
82 3 Manufacturing Engineering and Equipment Efficiency Evaluation
• body assembly and painting for cars and light commercial vehicles;• space frame assembly and painting for industrial vehicles;• engine and transmission assembly;• electrical device assembly;• foundries for iron cast and aluminium elements;• steel fusion and lamination, with an integrated cycle;• tire manufacturing, with an integrated cycle;• glass parts manufacturing, with an integrated cycle.
Degree of utilization of planned productive capacity, also called ‘‘equipmentsaturation’’, is measured by:
u = PWT/AWT, where:
AWT is the total available working time (hours/day), considering duration of thework shift and the number of shifts available in a week, assuming one hasall necessary labour available.
For automotive production activities, a monthly analysis of machine loading(PWT) is normally performed, considering a horizon period of at least 18 months.
This planning process, through specific temporal diagrams, focuses on thefollowing data:
1. virtual productive capacity evolution (HVP) of the system, which can be var-iable in time depending on structural empowering or re-dimensioning;
2. evolution of overall equipment efficiency (OEE), depending on improvementplans;
3. machine/equipment loading forecast trend (PWT), expressed in hours/day andin weekly working shifts, calculated based on the production plan and con-sidering the above parameters for effective productive capacity;
4. available productive capacity utilization degree forecast (U), in the time periodconsidered.
It is important to note that the above productive capacity planning criteriaallows for the fulfilment of all programs, assuring the most convenient distributionof the working load among the different productive units/plants, in considerationof the available resources. In this way, the daily and weekly working shifts areplanned for the run of the production plan.
Whenever critical situations affecting the degree of utilization arise, it is nec-essary to adopt tactical solutions (temporal re-organization of production sched-uling programs between the plants, longer or shorter working times compared tothe norm) or strategic solutions (structural empowering or re-dimensioning ofavailable productive capacity).
These decisions are made depending on medium/long term commercial plan-ning and considering the risks of over-saturating the productive capacities planned.In case of significant decreasing of the saturation, production costs will worsen,due to a minor absorption of the fixed cost of the structure. In the case of
3.8 Equipment and Machine Loading 83
significant over-saturation, delays in delivery of the final product to the customerswill occur, with probable market share losses and profits decreasing compared totheoretical forecasts.
These considerations underline the importance of correctly setting pro-ductive capacities, in relation to market opportunities.
3.9 Defining Installed Productive Capacity
To conclude this chapter, we are going to connect the manufacturing engineeringplan discussed in Sect. 3.1 and the implementation of the machine loading criteriajust discussed in the previous section.
Let us remember that productive capacity is first planned for each industrial sitein relation to market targets (specific product annual sales plans): During theproduct’s industrial life cycle, it is typical for there to be a peak of sales demand,related to the year of greatest success in the market.
Let us define QYm as the yearly demand forecast during the life cycle and QYp
as the yearly demand in the peak year. If project productive capacity is set inrelation to QYp, the medium utilization degree of productive capacity will be:U = QYm/QYp.
Beneath the threshold value of U = 80 %, for ‘‘capital intensive’’ productions,the incidence of structural fixed costs can cause a critical situation for the enter-prise’s earned income. So, in planning productive capacities, Top Managementmust research a balance between requests from Marketing and investmentsrequired by Production Management, calibrating industrial initiatives in relation toreal market possibilities and profitability targets.
It is clear that a manufacturing system with a bigger operative flexibility andconvertibility for new product insertions has a low risk of being less used due to aspecific product’s life cycle. Additionally, a Component Maker is more likely tohave the right degree of utilization of its productive capacity, when manufacturingsystems are multi-functional and suitable for supplying more industrial customers,reducing market risk.
Considering that, it is possible to use the following two alternative criteria forsetting ‘‘manufacturing systems’’.
Applying the 1st criteria for machine loading calculation, Available ProductiveCapacity (APC) relative to each similar group of machines or autonomous tech-nological modules (machining centre, multi-station or single press, machiningcell…) is set, assuming that solutions implemented will correspond to the technical–economic criteria mentioned in Sect. 1.4. Consequently, machine tools and tech-nologically similar modules operating on parallel requirements are calculated by:MR = machine requirements (number of modules required) = QY/(APC •
AWT), where:(QY) is the quantity of product required yearly, based on the marketing plan
(including spare parts required for after sales);
84 3 Manufacturing Engineering and Equipment Efficiency Evaluation
(APC) is the available productive capacity (medium data related to eachmodule);
(AWT) is the maximum available working time for production in a year,expressed in hours.
MR should theoretically be counted to the next full number, if it is not possibleto use overtime to balance eventual marginal lacks, or partial out-sourcing.
For ‘‘one piece flow integrated productive systems’’, discussed in Sect. 3.6, the2nd criteria to calculate machine load is applied. Productive flow speed neces-sary to satisfy market demand is determined by:
HVP ¼ QYOEE�AWT = Hourly Virtual Productivity required by project, where:
(QY) is the quantity of product required yearly, based on the marketing plan(including spare parts required for after sales);
(OEE) is the overall equipment efficiency foreseen by the project for themanufacturing system;
(AWT) is the maximum available working time for production in a year,expressed in hours.
It is to be considered that, for each technological process, productive flow speedis characterized by a maximum sustainable threshold level. In fact, beneath acertain level of Working Cycle Time (WCT), inactive phases hardly influence thetime sequence diagram. When this occurs, it is good to share productive flowbetween two or more ‘‘parallel systems’’, searching for the best conditions, asmuch from an investment point of view as a transformation cost point of view.
Both criteria for productive capacity dimensioning are based on annual productsales plans, during their industrial cycle life, without considering the effects ofmarket season trends. It is assumed that eventual monthly requirement peaks canbe sustained by longer working shifts and extra working time during the year. It isalso possible to produce in advance, but only if there are guarantees of marketabsorption during the period of peak demand. If all this should not be enough,longer lead time on delivering is to be considered, by managing order reservations.
Value MR and HVP determine productive capacity by project and are theinput data necessary for the manufacturing engineering plan and for theexecutive project for ‘‘manufacturing systems’’, following the methodologydiscussed in Sect. 3.1.
Starting from the definition of Hourly Virtual Productivity (HVP) above, it ispossible to transpose the concept of Takt Time, meaning the ideal pace of aproduction system for satisfying the customer demand:
TT ¼ 1HVP
The Takt Time is not the rhythm at which the customer is asking forproducts but is representative of the ideal pace the production system musthave in relation to the average customer demand in the period considered.
3.9 Defining Installed Productive Capacity 85

Setting the production system to the Takt Time requires some preliminary con-ditions, such as:
• stability of production system (high technical availability and efficiency)• levelling of customer demand in the period considered.
Once the Takt Time has been set, it is more effective to maintain it in as stable acondition as possible to consolidate production system standards and obtain thebest level of performance.
86 3 Manufacturing Engineering and Equipment Efficiency Evaluation
Chapter 4Work Analysis and Labour ProductivityEvaluation Criteria
4.1 Activity Level and Labour Efficiency
By direct labour, we mean the personnel directly involved in the product trans-formation. In mass production, the activity levels are measured in standardworking hours necessary to complete the production plan. In fact, considering thesame cost factors, the added value applied to the product can be consideredproportional to the productive hours performed.
Let us see how to plan and check the operative efficiency of direct manpower inmass productions.
In Chap. 3, we have seen how to determine the standard working time (ST)n. Itcorresponds to the hours of direct labour necessary to transform the product seriesn, complying with the relative manufacturing working cycle. We remember thatthe specific STn are assigned to the single product codes and aggregated accordingto bill of material, depending on the ‘‘make/buy’’ levels (as seen in Sect. 2.3).
Beginning with the assigned program and production progress, the shopfloor information system assigns to each productive unit (corresponding to anindustrial responsibility centre) the Planned Activity Volume (PAV), or theDeveloped Activity Volume (DAV), both measured in production ‘‘standardworking hours’’. The one that generates ‘‘sales’’ is considered the main pro-duction, being assigned to the market of the enterprise and its own ‘‘businessunits’’.
PAV ¼PN
n¼1QAn � STn ¼ Planned Activity Volume,
where:QAn is the quantity of products n assigned to the plant or to the shop unit,
according to the production planning and referring to a specific workingperiod (working days, weeks or years);
STn is the working time determined by the standard operating procedures,measured in working hours for each one of the product series (n);
N are the series of product charged to the productive unit;
M. Gobetto, Operations Management in Automotive Industries,Springer Series in Advanced Manufacturing, DOI: 10.1007/978-94-007-7593-0_4,� Springer Science+Business Media Dordrecht 2014
87
PAV is the number of standard working hours necessary to perform theassigned plan of production This evaluation criteria allow for the mergingof data belonging to different departments and to different manufacturedproducts.
4.1.1 Labour Efficiency Analysis
Let us define HDL as the total amount of direct labour working hours collected bythe information technology system in the productive units.
Let us also refer to DAV, in the considered period of time, measured in standardworking hours and quantified according to evaluation of the progress ofproduction.
The direct labour efficiency is measured by the output/input ratio:DAV=HDL ¼ g.
This statistical indicator represents the level of utilization of direct manpower,from a productive point of view.
The difference (HDL–DAV) corresponds to the time in which labour is on theworking site without contributing to the main production plan. The causes of thisloss can be divided as follows:
(1) inactivity due to excess of available production capacity during the workingshift or to excess workers assigned against actual requirement;
(2) time lost for external causes in the productive unit (lack of necessary incomingmaterials, lack of withdrawal of out-going products, lack of energy…);
(3) time lost for technical breakdowns of the ‘‘systems’’;(4) time necessary for extra-standard operations, such as solving ‘‘non-quality’’
or ‘‘technical failure’’ problems;(5) time lost for rejects or reworking;(6) other causes (operations performed in lengthier time than standard, speed
losses in the process, training of workers…).
To assure the reliability of data related to the above eventualities, it is importantto have a rigourous control systems. For example:
• hours lost to cause (1) must be dealt with by Operation Planning and HumanResources Departments;
• hours loss to causes (2) and (3) can be collected automatically, using theinformation technology systems, and must be dealt with, respectively, by theMaterial Supply and Maintenance Departments;
• rejects and re-workings of cause (5) must be checked by the Quality AssuranceDepartment;
88 4 Work Analysis and Labour Productivity Evaluation Criteria
• extra-standard operations related to cause (4) must be dealt with by the Man-ufacturing Engineering Department;
• the remaining amount of working time not used for production (cause 6) isnormally assigned (as per difference) to inefficiency and also includes the effectof the so-called ‘‘learning curve’’, during new product launches.
To achieve the targets in terms of product quantity and costs, it is necessary tocheck labour efficiency (g) monthly at the very least, analyzing the main causesthat determine the deviations. The plant information technology system is nor-mally set to elaborate this data automatically for each one of the productive unitsand in time to make corrective actions possible.
4.2 Manpower Planning
Estimating the manpower requirement for production means considering locallegal constraints for working times (different from region to region and dependingalso on agreements with local unions), as well as statistical records on labourpresent on the job. The substantial input data are:
• working days available for each worker during the considered period of time,minus collective holidays;
• duration of daily working shifts, minus free time for lunch;• shift organization and rotation;• sick leave, accidents and incidents of permission for individual leave.
Direct Labour Requirement (DLR) can be obtained considering the plannedactivity volume (PAV), compared to the individual amount of activity achievable,both being measured in ‘‘standard working time’’, referring to a specific period ofworking time (day or week).
DLR ¼ PAV=IAA; where:PAV corresponds to the calculation in Sect. 4.1.IAA ¼ g � IWH � ð1� aÞ = Individual Activity Achievable, equal to the
productive hours worked on average by each worker, being:IWH individual working hours, corresponding to the hours of presence on the
job determined by the collective agreement during the working periodconsidered (average data that also considers shift organization);
g direct labour efficiency (measured as indicated in Sect. 4.1);a absenteeism index, estimated on statistical data;DLR direct labour requirement, in other words, the number of workers necessary
to carry out the assigned production plan, complying with the workinghours, with the average labour efficiency and also considering predictableabsenteeism on the job.
4.1 Activity Level and Labour Efficiency 89
Normally PAV and IAA refer to a single working day of planned shifts(according to the PWT calculation reported in Sect. 3.8). Conversely, when thereare rest shifts on rotation during the week to be considered, it is necessary for PAVand IAA to refer to the complete working week.
These criteria can be simplified, assuming the direct labour productivity as astandard value, measured by the ratio QP/DLR, where QP is the produced quantity.This criteria does not consider the variation due to product mix and the evolutionof other productivity factors mentioned above (ST, g; a).
4.2.1 Indirect Labour Requirement
In addition to direct labour, there are other workers necessary to productionmanagement that must be considered in the manpower requirement; these workersare connected to auxiliary activities that are not specifically included in thestandard operative procedures (indirect labour).
The principle auxiliary activities that contribute to the indirect labourrequirement are:
(1) Quality Checks ‘‘off line’’ (metrology rooms, quality labs, statistical control),the requirement of which is established by considering the quality controlplans and checking methodologies; this requirement depends both on the PAVand on the number of planned working shifts, because a minimum fixednumber of workers is required for each shift;
(2) Ordinary Maintenance of Equipment and Tools, the requirement of whichis estimated considering a statistical work load and the required service level;it depends both on PAV and on the number of planned working shifts;
(3) Material Handling on the shop floor (in addition to what is included in thestandard operative procedures), the requirement of which depends on themeans and methodologies of handling, both on PAV and on the number ofplanned working shifts;
(4) Warehouses and Dispatch Management, the requirement of which is prin-cipally related to the number of planned working shifts, the workers beingemployed for fixed garrisons;
(5) General Plant Services, not directly connected to productive processes andthe requirement of which are determined by fixed garrisons during the week,for industrial supervision and general equipment conduction.
In general, functions (2), (3), (4) and (5) are partially ‘‘out-sourced’’ tospecialized providers; nevertheless, the manpower requirements should alwaysconsider the above-mentioned criteria.
In the same productive unit or in an entire plant, considering the samearrangement of services outsourced, the incidence of indirect labour represents anecessary statistical data for evaluating labour efficiency:
90 4 Work Analysis and Labour Productivity Evaluation Criteria

i ¼ HIL=DAV, where:HIL is the total amount of indirect labour working hours;DAV is the developed activity volume, in the considered period of time and in
the same productive unit, measured in standard working hours andquantified according to evaluation of the progress of production.
It is important to consider that a part of the auxiliary activities mentioned above(not included in the standard manufacturing activities) can be assigned to directlabour; in this case, these hours should be included in HIL.
For the same manufacturing system and for the same volume of activity PAV,with some organizational improvements, it is possible to minimize the incidence (i).
Other activities, such as die construction, prototyping, laboratory testing andproduct experiments, are considered R&D activities and, for this reason, notrelated directly to the management of manufacturing.
4.2.2 Operative Plan and Staff Balancing: Requirements
Comparing the available manpower staff (MS) with the labour requirement (LR),including both direct and indirect labour, it is possible to evaluate excesses ordeficiencies in the staff for each productive unit or plant, carefully distinguishingany specialization that could be a constraint. To assess the likely evolution of thestaff during production, without anticipating new hires, it is necessary to considerthe normal ratio of outgoing personnel minus any necessary substitution.
The dynamic difference between the available staff and labour requirement ismeasured by % variation:
D% ¼ ðLS� LRÞ=LS
where:
• LR is the Labour Requiremt, made of direct labour and indirect labour.• LS is the Labour Staff at disposal, counting direct labour and indirect labour.
If the indicator is positive, it means that there is an excess in the staff; if it isnegative, it means that there is a deficiency in the staff. The initial balance betweenstaff and requirement should be worked out at the plant level, moving the workersamong the shop floors to minimize inefficiencies in the working hours and in theproduction flow.
If D % shows low staff deficiency, it is possible to make up for it throughovertime, as per local standards and agreements (different country by country) orthe use of temporary workers.
If D % shows a structural staff deficiency, at a stable or growing trend, the firstcountermeasure is to cover the turn-over and then immediately hire new workers,even if it is not possible to transfer part of the production plan to other plants.
4.2 Manpower Planning 91
If D % shows temporary excess in the staff—according to the medium termoperative plan—it is possible to reduce the monthly working hours proportionally,managing compensations during the whole year. This countermeasure is recom-mended to compensate for the seasonal oscillations in the sales or ‘‘phase-out/phase-in’’ situation related to new product industrialization.
If D % shows structural excess in the staff, at a stable or growing trend—according to the long-medium term operative plan—it is necessary to takeextraordinary action such as:
• assignment of new additional productive programs to the plant, complying withthe general enterprise productive plans and after a feasibility check (making sureproductive capacity is available and looking into the eventual necessity ofadditional investments);
• reduction of working days in a month/year, or temporary staff reduction throughflexibility tools (temporary suspension from the job, example: CIG in Italy;reduction of working shift…);
• definitive reduction of staff through the use of mobility plans toward the external,although only when the above-mentioned countermeasures are insufficient.
Considering the above, it is clear that achieving a balance of productive andsales capacity is the real key, especially because of the uncertain nature of theautomotive industry, with demand from the market being very variable andindividual economic and political scenarios not easily predictable.
An operative planning process, as described in detail in Chap. 6, is an attempt toequilibrate the monthly production plan with sales demand, considering the pro-ductive capacity installed and the working staff available. Safety buffers are thefinal and intermediate product stocks; however, these stocks should be limited tothe most requested models and versions, not determined by specific optionalcontents; in addition, their dimension should be limited as much as possible tophysiological levels, to allow short lead time in delivering to the customers andavoid overstocks that increase the WIP level and influence the sales policies.
Bringing to mind what was discussed in Sect. 3.8, we would also like to remindthe reader that the manpower requirement setting should be calibrated according tothe ‘‘technical system’’ productive capacities, searching for the more convenientworking shift rotation over the course of a week.
4.3 Working Time Length and Flexibility
Referring to Chap. 3, let us first remember that, with the same hourly virtualproduction (HVP), the weekly and annual productive capacity grows depending onthe following parameters:
• hours available for the plant to be functioning (AWT), in regard to local and/ornational laws and working hours for personnel set by union agreements;
92 4 Work Analysis and Labour Productivity Evaluation Criteria
• overall equipment efficiency (OEE), in relation to their technical availability (A)and to management of productive processes.
To answer qualitative variations (model mix) in customer demand quickly, it isfundamental to have the availability of flexible and programmable systems (seealso Sect. 1.7).
To answer quantitative variations (total product volume) in customer demandquickly, it is necessary to have a certain flexibility in the working hour, to adaptand refine the weekly activity levels, complying with the monthly operative plan.
To understand this last concept, we may examine the approach of Japaneseindustries to working hours; they are characterised by a very high cost of work perunit, very high productivity and the promise of stability for the working staff overthe years.
Japanese industries normally do not plan their activity by covering the twenty-four hours available in a day with three shifts per day for 5 days a week, as manywestern enterprises do to utilize their equipment and investments at the maximumlevel; the Japanese tend to set their production with two daily shifts for each of sixdays a week; these two shifts are opportunely spaced, so that they can be extendedor shortened (within a certain amount of time) on demand and by necessity.
A consistent number of breaks between shifts guarantees the possibility ofperformance of the majority of auxiliary operations requiring stoppage of themachine (die changes, time-based maintenance operations…); in this way it ispossible to improve the OEE during the planned working time. The working hoursof maintenance workers are consequently adapted to that of their productioncounterparts.
It is possible to have a daily minimum of 14 h to a maximum of 18 h of fullequipment running (corresponding respectively to seven or nine h of working timeper shift). In this way, with the same staff, the utilization of productive capacitycan be stretched equal to 25 % and thus allow the activity level to fit with themonthly market and sales trend.
In other social contexts (especially in Western Europe), it is practicallyimpossible to apply the ‘‘Japanese way’’, or at least as well as they do. Due to lawsand terms of union contracts, extensive collective overtime is simply not possible.It is, however, important to find different agreements complying with local laws tofit with the concept of flexibility.
In conclusion, for a capital intensive enterprise to stay competitive, having thepossibility of extending the available working time in a week (AWT) to sixworking days is fundamental, utilizing maximum productive capacity when cus-tomer demand requires. At the same time, it is also essential to have a stretcheddaily/weekly working time to adapt the activity level to market needs, even if thisshould imply the following:
• rest times during the week on rotation, to respect the working hour limits set bylaw or union agreement;
• appropriate relaxation spaces facilitating extended shifts;• transfer services for the employees to fit with the extended shifts.
4.3 Working Time Length and Flexibility 93

This argument is relevant not only in the automotive industry but also in otherindustrial compartments, especially for those that are subject to variable customerdemand and occupational restrictions. It is also important to underline that, from asocial point of view, higher flexibility in working time means stability in joboccupation and better success of the enterprise on the market, increasing thechance of further development.
4.4 Labour Productivity and Improvement Plans
Labour productivity is related to individual productive capacity and can becalculated by analyzing the quantity produced in a specific period of time, such asa working year, divided by the dedicated labour workforce, that is, the Individualannual Labour Productivity (ILP):
ILP ¼ QP= DLþ ILð Þ
where:
• QP is the quantity of products produced in the year by plant (number of vehicles,engines, transmission, components…);
• (DL ? IL) is the average value of the staff during the year, including direct andindirect labour.
To increase ILP, it may become necessary to decrease the workforce employedfor manufacturing a specific quantity of product (see earlier direct and indirectlabour requirement calculation), so ILP mostly depends on the following factors:STn standard working time for each product series ng direct labour efficiencyi indirect labour incidence
The reduction of standard working times STn is the first relevant factor for theimprovement of productivity and the reduction of ‘‘transformation variable cost ’’.To reduce STn, it is necessary to analyse it with accuracy; it is mainly given by
STn ¼ ATn + ITn
where AT is the active time assigned to operators and IT is the operator’s idle timedue to technical factors (i.e., machine downtime or other technical requirements)or unbalancing, which keep operators idle. So, the first improvement is thereduction or possible elimination of the idle time IT.
Improvement activity should then be concentrated on looking deeply at activetime, which can be divided into two different categories:
ATn ¼ NVAAn + VAAn
94 4 Work Analysis and Labour Productivity Evaluation Criteria
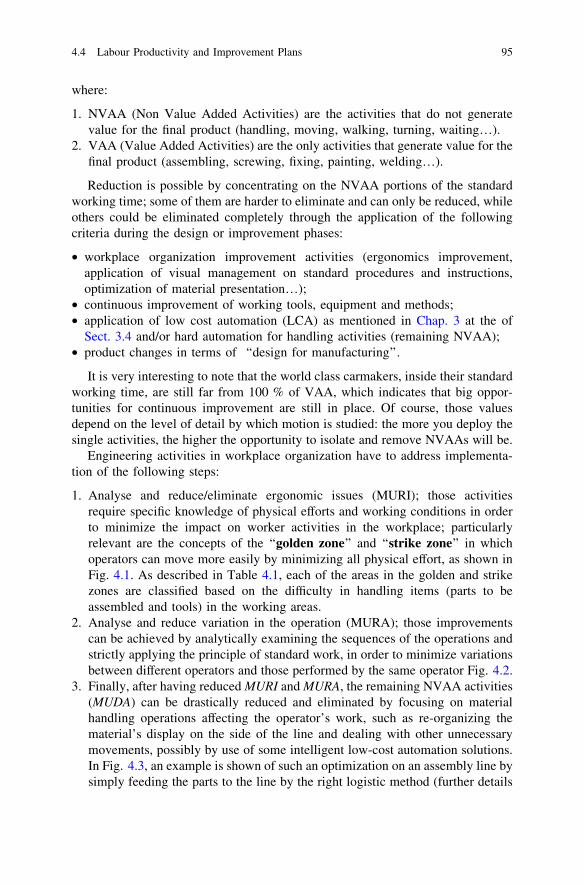
where:
1. NVAA (Non Value Added Activities) are the activities that do not generatevalue for the final product (handling, moving, walking, turning, waiting…).
2. VAA (Value Added Activities) are the only activities that generate value for thefinal product (assembling, screwing, fixing, painting, welding…).
Reduction is possible by concentrating on the NVAA portions of the standardworking time; some of them are harder to eliminate and can only be reduced, whileothers could be eliminated completely through the application of the followingcriteria during the design or improvement phases:
• workplace organization improvement activities (ergonomics improvement,application of visual management on standard procedures and instructions,optimization of material presentation…);
• continuous improvement of working tools, equipment and methods;• application of low cost automation (LCA) as mentioned in Chap. 3 at the of
Sect. 3.4 and/or hard automation for handling activities (remaining NVAA);• product changes in terms of ‘‘design for manufacturing’’.
It is very interesting to note that the world class carmakers, inside their standardworking time, are still far from 100 % of VAA, which indicates that big oppor-tunities for continuous improvement are still in place. Of course, those valuesdepend on the level of detail by which motion is studied: the more you deploy thesingle activities, the higher the opportunity to isolate and remove NVAAs will be.
Engineering activities in workplace organization have to address implementa-tion of the following steps:
1. Analyse and reduce/eliminate ergonomic issues (MURI); those activitiesrequire specific knowledge of physical efforts and working conditions in orderto minimize the impact on worker activities in the workplace; particularlyrelevant are the concepts of the ‘‘golden zone’’ and ‘‘strike zone’’ in whichoperators can move more easily by minimizing all physical effort, as shown inFig. 4.1. As described in Table 4.1, each of the areas in the golden and strikezones are classified based on the difficulty in handling items (parts to beassembled and tools) in the working areas.
2. Analyse and reduce variation in the operation (MURA); those improvementscan be achieved by analytically examining the sequences of the operations andstrictly applying the principle of standard work, in order to minimize variationsbetween different operators and those performed by the same operator Fig. 4.2.
3. Finally, after having reduced MURI and MURA, the remaining NVAA activities(MUDA) can be drastically reduced and eliminated by focusing on materialhandling operations affecting the operator’s work, such as re-organizing thematerial’s display on the side of the line and dealing with other unnecessarymovements, possibly by use of some intelligent low-cost automation solutions.In Fig. 4.3, an example is shown of such an optimization on an assembly line bysimply feeding the parts to the line by the right logistic method (further details
4.4 Labour Productivity and Improvement Plans 95
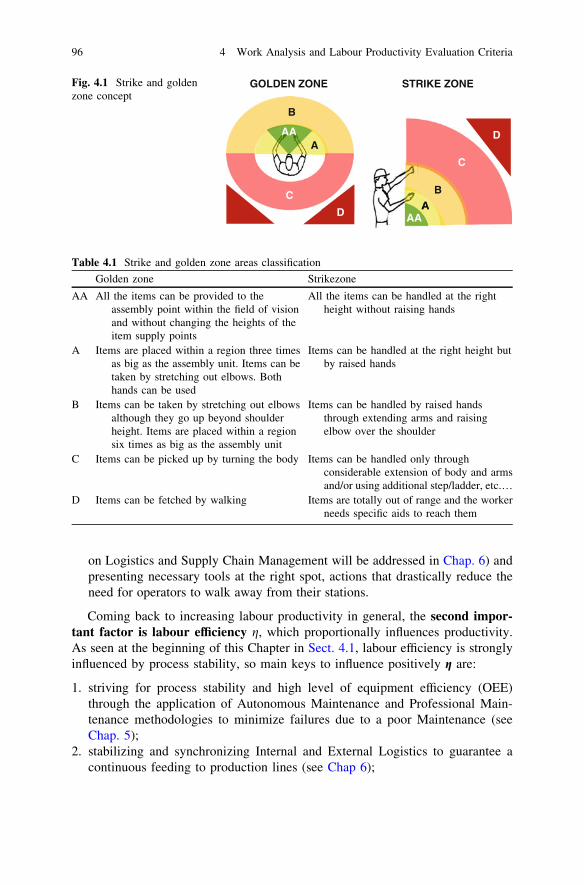
on Logistics and Supply Chain Management will be addressed in Chap. 6) andpresenting necessary tools at the right spot, actions that drastically reduce theneed for operators to walk away from their stations.
Coming back to increasing labour productivity in general, the second impor-tant factor is labour efficiency g, which proportionally influences productivity.As seen at the beginning of this Chapter in Sect. 4.1, labour efficiency is stronglyinfluenced by process stability, so main keys to influence positively g are:
1. striving for process stability and high level of equipment efficiency (OEE)through the application of Autonomous Maintenance and Professional Main-tenance methodologies to minimize failures due to a poor Maintenance (seeChap. 5);
2. stabilizing and synchronizing Internal and External Logistics to guarantee acontinuous feeding to production lines (see Chap 6);
Table 4.1 Strike and golden zone areas classification
Golden zone Strikezone
AA All the items can be provided to theassembly point within the field of visionand without changing the heights of theitem supply points
All the items can be handled at the rightheight without raising hands
A Items are placed within a region three timesas big as the assembly unit. Items can betaken by stretching out elbows. Bothhands can be used
Items can be handled at the right height butby raised hands
B Items can be taken by stretching out elbowsalthough they go up beyond shoulderheight. Items are placed within a regionsix times as big as the assembly unit
Items can be handled by raised handsthrough extending arms and raisingelbow over the shoulder
C Items can be picked up by turning the body Items can be handled only throughconsiderable extension of body and armsand/or using additional step/ladder, etc.…
D Items can be fetched by walking Items are totally out of range and the workerneeds specific aids to reach them
STRIKE ZONE
AB
C
AA
DA
AA
B
D
C
GOLDEN ZONEFig. 4.1 Strike and goldenzone concept
96 4 Work Analysis and Labour Productivity Evaluation Criteria
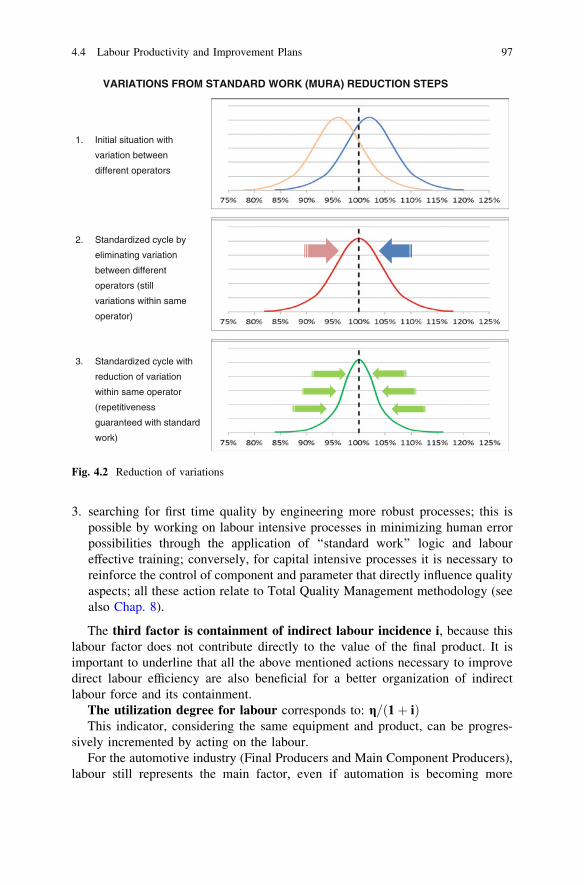
3. searching for first time quality by engineering more robust processes; this ispossible by working on labour intensive processes in minimizing human errorpossibilities through the application of ‘‘standard work’’ logic and laboureffective training; conversely, for capital intensive processes it is necessary toreinforce the control of component and parameter that directly influence qualityaspects; all these action relate to Total Quality Management methodology (seealso Chap. 8).
The third factor is containment of indirect labour incidence i, because thislabour factor does not contribute directly to the value of the final product. It isimportant to underline that all the above mentioned actions necessary to improvedirect labour efficiency are also beneficial for a better organization of indirectlabour force and its containment.
The utilization degree for labour corresponds to: g=ð1þ iÞThis indicator, considering the same equipment and product, can be progres-
sively incremented by acting on the labour.For the automotive industry (Final Producers and Main Component Producers),
labour still represents the main factor, even if automation is becoming more
1. Initial situation with
variation between
different operators
3. Standardized cycle with
reduction of variation
within same operator
(repetitiveness
guaranteed with standard
work)
2. Standardized cycle by
eliminating variation
between different
operators (still
variations within same
operator)
VARIATIONS FROM STANDARD WORK (MURA) REDUCTION STEPS
Fig. 4.2 Reduction of variations
4.4 Labour Productivity and Improvement Plans 97
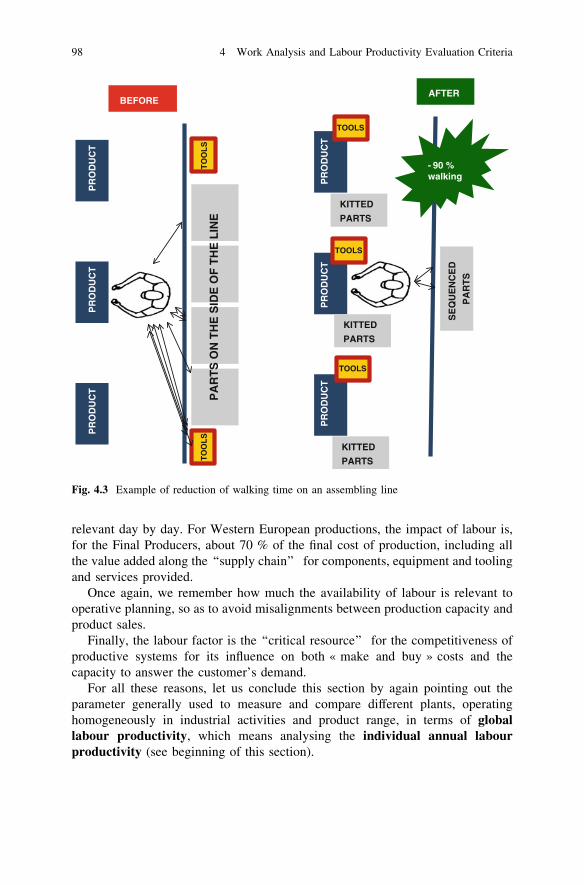
relevant day by day. For Western European productions, the impact of labour is,for the Final Producers, about 70 % of the final cost of production, including allthe value added along the ‘‘supply chain’’ for components, equipment and toolingand services provided.
Once again, we remember how much the availability of labour is relevant tooperative planning, so as to avoid misalignments between production capacity andproduct sales.
Finally, the labour factor is the ‘‘critical resource’’ for the competitiveness ofproductive systems for its influence on both « make and buy » costs and thecapacity to answer the customer’s demand.
For all these reasons, let us conclude this section by again pointing out theparameter generally used to measure and compare different plants, operatinghomogeneously in industrial activities and product range, in terms of globallabour productivity, which means analysing the individual annual labourproductivity (see beginning of this section).
BEFOREAFTER
PA
RT
S O
N T
HE
SID
E O
F T
HE
LIN
ET
OO
LS
SE
QU
EN
CE
D
PA
RT
S
PR
OD
UC
T
TOOLS
PR
OD
UC
TP
RO
DU
CT
PR
OD
UC
TP
RO
DU
CT
PR
OD
UC
T
KITTED
PARTS
KITTED
PARTS
KITTED
PARTS
TOOLS
TOOLS
TO
OL
S
- 90 % walking
Fig. 4.3 Example of reduction of walking time on an assembling line
98 4 Work Analysis and Labour Productivity Evaluation Criteria
This synthetic parameter depends mostly on the standard working times (ST)and consequently also on the automation level of processes. It also depends onlabour efficiency (g) and the indirect labour incidence (i), but also on thenumber of working hours established by the contract (without consideringholidays), as well as absenteeism for accidents and sick legally recognisedpermissions… In ‘‘benchmarking’’ research for manufacturing systems, it isimportant to use this factor when the different realities are comparable. Toobtain an objective analysis, it is important to consider the data based on theproduct characteristics (dimension, complexity) and examination of the verti-calization degrees of the production (‘‘make-or-buy’’ configuration), correctingopportunely if necessary.
The above-mentioned productivity indicators, associated with unitary labourcost (payment and taxes), influences strategic decisions on new and existingsites for production activities, following the criteria discussed in Sect. 1.2.
To conclude this section, it is important to underline that labour produc-tivity is not separate from product quality. In fact, a well-engineered processwith efficient automatic systems contributes to optimization of working con-ditions, even from an ergonomic point of view, and at the same time improvesproduct quality. So, productivity and quality of labour improve together.
4.5 Input Data for Operative Control
The Standard Productive Capacities of the technical systems n (SPCn) and theirStandard working Time STn are the basic input for Transformation Cost, both forthe predictive phase (budget) and the accounting phase. The transformation costand direct material trends are normally checked monthly, comparing the actualprogressive accounting of the month with the budget forecast; this helps to directcorrective actions and makes sure the forecasts are reviewed every 3 months.
For direct material cost, the analyses are run according to the guidelinesspecified in Sect 2.5, in strict co-operation with the Product and Process Engi-neering Departments.
To check the transformation cost and accounting properly with productsold (cost accounting), according to ‘‘best practice’’ , it is possible to use twoalternatives:
1^ MODEThe activities are grouped into cost centres, made by units manufacturing
products that can be considered technically homogeneous. The transforma-tion cost is accounted for single products based on productive hours ofmanpower used, with reference to the standard working time STn. Activitylevels correspond to the standard working hours necessary to develop theproduction plan: PAV during the predictive phase (budget), DAV during theaccounting phase.
4.4 Labour Productivity and Improvement Plans 99
The transformation costs and consequently the hourly cost (labour burden) arecomposed of three parts:
(a) The first part is the so-called variable part, because its annual amount isproportional to the activity volume (PAV, DAV). It includes the followingfactors of the cost per unit:
(a1) direct labour working hours (STn=g), to which apply the average hourlycost for labour (payment and taxes);
(a2) incidence on (a1) of the costs of direct material losses (rejects due todefects in the transformation process, over-usage in spite of standards inthe bill of material);
(a3) incidence on (a1) of the costs of consumables and tools, connected to thetransformation process;
(a4) incidence on (a1) of costs of energy and power supply in general, con-nected to the transformation process.
(b) The second part is the fixed part, because its annual amount is independentfrom the activity volume; it influences the burden, with reverse proportion toPAV (in the predictive phase) or to DAV (in the accounting phase). Thisincidence reaches the minimum point when the production plan fulfils theannual productive capacity and includes the following cost factors:
(b1) depreciations related to the cost centre;(b2) fixed costs necessary for the functioning of the plant, even if charged to
cost centre (overheads, technical and logistic departments, generalequipment conduction, annual technical assistance, insurance…).
(c) The third part is the so-called half-variable part, because it hasa ‘‘step’’ trend in respect to activity volume, in relation to the working shiftsplanned (PWT). Its incidence on the burden is minimal when the productionplan fulfils the productive capacity of each weekly shift and includes thefollowing cost factors:
(c1) indirect labour, partially considered proportional to the activity volumePAV, DAV, partially considered fixed, considering what is specified inSect. 4.2;
(c2) maintenance costs, deployed in fixed and variable costs based on statis-tical analysis, according to criteria that will be specified later in Chap. 6;
(c3) material handling costs, not included in the manufacturing cycle,deployed in fixed and variable costs based on statistical analysis,according to criteria that will be specified later in Chap. 5;
(c4) energy and power supply costs (lighting, environmental air cooling andconditioning…), the amount of which depends on the number of workingdays and shifts.
Comparing the three above-mentioned cost factors (a, b, c) with the budgetforecast and with the previous financial balance, it is first necessary to quantify the
100 4 Work Analysis and Labour Productivity Evaluation Criteria
differences in the activity levels (DAV compared to PAV). This calculationderives from the quantity of product delivered to the final product warehouse(volumes and mix), and shipped out for the standard costs, to which it is necessaryto add or subtract:
• distinctions due to technical differences in the product, introduced as per requestby the Marketing Department and transferable to the profits;
• distinctions due to activity transference (to or from productive units).
Furthermore, for each one of the three cost factors (a, b, c) it is necessary toquantify the variations that have occurred or are foreseen as likely to occur in spiteof the standard cost, due to the purchasing price of materials and services, thelabour costs and the energy service fees. These variations are considered as ‘‘ priceeffect’’ and include the effectiveness of negotiation.
Having separated variation due to, respectively, ‘‘volume-mix effect’’ and‘‘price effect’’, the variation attached to each of the cost factors is determined bydifference (efficiency or inefficiency in management).
For this purpose, it is necessary first to examine the standard working timesSTn, distinguishing the following variation causes:
(1) product/process technical changes necessary to improve/fix the quality level ofthe product (typically these changes worsen the cost);
(2) standard working time and investment reduction specifically approved forreducing the transformation cost (typically they are variable cost reductionsbalanced by higher depreciations);
(3) standard working time reduction for improvement of the process, not requiringspecific relevant investments (they are variable cost reductions).
Then, it is necessary to examine the variations due to other cost factors such as:direct labour losses (1 � g), incidence of indirect labour (i), direct material losses(deviation compared to the standard requirements in the bill of material), utili-zation of specific power supply and consumables, outsourced fees for productionprocess services…
By analysing the nature (positive or negative), the make-up and the causes ofthese variations, both in the predictable phase (budget) and the final balancingphase, it is possible to understand the economic effectiveness of the productionprocesses management.
2^ MODEWhen the manufacturing systems are using hard automation solutions, the
cost centres are organized by ‘‘homogeneous groups of equipment’’ orby ‘‘one-piece-flow integrated systems’’. The transformation cost is assignedto single products based on hours of utilization of the machines/equipment,referring to the specific standard productive capacities SPCn and applying therelative hourly functioning cost (machining burden).Activity levels correspondto Net Planned Working Time NPWT.
4.5 Input Data for Operative Control 101
As we have seen in Sect. 3.2, the standard productive capacity SPCn is relativeto each of the products n in charge and corresponds to what is obtainable ifoperating without breakdowns and managerial failures.
Not using the available productive capacity (1-U) determines the amountof ‘‘unabsorbed fixed costs’’. To evaluate the transformation cost trend, it isnecessary to compare first the machine load (NPWT = net planned working time),foreseen in the budget, to that actually scheduled. The variation of cost due to theactivity levels (utilization degree of the systems U) can be distinguished from thatdue to the overall equipment efficiency (OEE). These parameters are measured asdescribed previously in Chap. 3.
The analysis of the utilization of cost factors, for the products actually inmanufacturing, can also be achieved as described in the previous point, even iftheir incidences change, being activities with a higher impact on depreciations andmaintenance costs.
Just as necessary as the building of the cost centre is that of the ‘‘manufac-turing homogeneous systems’’, to which it is possible to apply the above-men-tioned analysis criteria, although this method is more complex than the previousone. For this reason, it is not used in the Final Assembly Plants, where it ispreferable to assume the standard working time STn as reference for theaccounting of transformation costs to the products (1^ mode).
The 2^ mode is, however, predominantly used for economic control in themanufacturing of ‘‘capital intensive’’ components, which are technically homo-geneous but with different part numbers and destined for more customers. In thisway, the cost of machinery/equipment is properly assigned, clearly demonstratingthe negative economic impact of the non-utilization of productive capacity. As aconsequence, it is possible to decide if it is convenient or not to take other orders,even if with a minor profit margin in spite of normal rates, to make better use ofthe production capacity.
These criteria and methodologies for financial analysis fall under the moduleof ‘‘Finance for the Enterprise’’. The following diagram solely represents thetypical trend of transformation unitary cost versus planned working time (corre-sponding to activity levels). In the given case study, the available working time isequal to three daily working shifts (22 h/day). This amount of working hours istypical of ‘‘capital intensive’’ automotive productions.
TUC ¼ UVC þ AFCðAUÞ þ SFC
ðAUÞ �P3
n¼1
n�SFCðSUÞ where:
AWT available working time (22 h)n number of scheduled daily working shiftsAU degree of utilization of the available annual productive capacitySU degree of utilization of the available productive capacity in each shift nTUC transformation cost per unitUVC variable cost per unitAFC annual fixed cost incidence, with full utilization of productive capacitySFC shift fixed cost incidence, with full utilization of productive capacity.
102 4 Work Analysis and Labour Productivity Evaluation Criteria
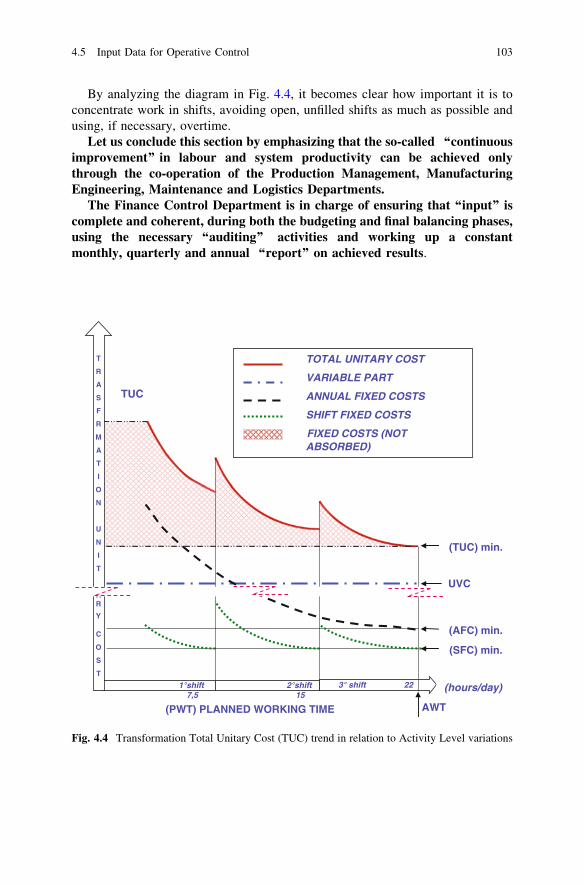
By analyzing the diagram in Fig. 4.4, it becomes clear how important it is toconcentrate work in shifts, avoiding open, unfilled shifts as much as possible andusing, if necessary, overtime.
Let us conclude this section by emphasizing that the so-called ‘‘continuousimprovement’’ in labour and system productivity can be achieved onlythrough the co-operation of the Production Management, ManufacturingEngineering, Maintenance and Logistics Departments.
The Finance Control Department is in charge of ensuring that ‘‘input’’ iscomplete and coherent, during both the budgeting and final balancing phases,using the necessary ‘‘auditing’’ activities and working up a constantmonthly, quarterly and annual ‘‘report’’ on achieved results.
(PWT) PLANNED WORKING TIME
3° shift 22
AWT
(SFC) min.
(AFC) min.
UVC
(TUC) min.
TUC
(hours/day)1°shift 7,5
2°shift 15
TOTAL UNITARY COST
VARIABLE PART
ANNUAL FIXED COSTS
SHIFT FIXED COSTS
FIXED COSTS (NOT ABSORBED)
T
R
A
S
F
R
M
A
T
I
O
N
U
N
I
T
R
C
R
Y
O
S
T
Fig. 4.4 Transformation Total Unitary Cost (TUC) trend in relation to Activity Level variations
4.5 Input Data for Operative Control 103
4.6 Assignment of Tasks and Workload Balance
To better understand the assignment of tasks and workload balance, we have toanalyse real case studies.
So, let us examine the criteria applied to a car’s final and powertrain assembly,these processes being particularly ‘‘labour intensive’’ and very complex from amanagement profile. We will focus first on the issue of the assignment of tasks andworkload distribution for a car’s final assembly line and engine and transmissionassembly lines. To do that, we will need the following technical information:
• elementary operation job descriptions, easily understood by the workers andpossibly supported by a local terminal connected to the central informationtechnology shop floor system;
• operation time required (standard working times STi) and priorities for thesequence to be followed, considering assembling needs and self-control;
• constraints in terms of workstations, due to component supply and tools(technological layout).
First of all, it is necessary to determine the required pace for the line to be ableto comply with the productive operative plan, which corresponds to HVP (see alsoSect. 3.2 for equipment productivity definition) :
HVP ¼ QA=ðAWT � AÞ; where :
QA is the quantity of product assigned to the working shift, according to theproduction plan;
AWT is the available working time (hours per shift duration, without collectivebreaks);
A is the technical availability of the ‘‘system’’, according to the definition inSect 3.5;
HVP is the hourly pace to be set on the line to satisfy the production plan,assuming all manpower required is available and that direct materials willbe supplied regularly to the line, without any interruption
Based on the operative assembly sequence and the pre-determined standardworking times, operations to be assigned to single workstations, interconnectedwith a one piece flow concept or separated by buffers, are determined, specifyingtasks and the number of workers needed.
It is important to ensure that ‘‘finished operations’’ will be assigned at eachworkstation and all along the line, with each stage of the product being easily self-checked during assembly. In this way, each worker or group of workers can beresponsible for quality as well as quantity. And, indeed, quantitative results(individual and through teamwork) can be checked automatically as well, using theactual information technology systems to detect and control (process traceability).
104 4 Work Analysis and Labour Productivity Evaluation Criteria
To optimize labour productivity and ensure the quality level, it is impor-tant to have a continuous and stable workload for each of the shifts. For eachof the workstations or section of the line, it is necessary only to assign thenumber of workers strictly necessary for the operation, based on standardworking times for the operation. The ideal workload can be achieved bycomplete realization of working capacities, which is when the follow-ing ‘‘balance point’’ is reached:
OTi ¼ NWi � WCT
where:OTi is the operative time, related to the workstation/section of line i (min); it is
different from the standard working time actually assigned to the operators,because it does not consider physiological rest breaks, made by individualreplacement or collective line stoppages between the two shifts; to obtain theoperative time for every workstation, it is necessary first to deploy the standardtime for all elementary operations required, and then aggregate them by work-station or line section in order to narrow as much as possible the gap between totaltime determined and a multiple of the Working Cycle Time that sets the pace ofproduction or to a multiple of it being aware that:
STtot ¼XN
i¼1
OTi
whereN is the total number of elementary operations included in the considered
process;
NWi is the number of workers required simultaneously to operate at eachworkstation or section of the assembly line;
WCT 60/HVP is the working cycle time of the line (min).
In real situations, the priority constraints and time sequence of single operationsdo not allow for obtaining such an ideally balanced workload distribution for eachone of the interconnected workstations or sections of the line.
To ensure that workload and working speed will be regular, especially forquality levels, we need to proceed in the following way:
1. Workload balanceFor the different planned activity levels (volume and product mix), activityshould be divided, as much as possible, into the ideal workload for eachworkstation or line sector (i); this is called the ‘‘balance point’’.To do this, possible alternative solutions are analyzed (changes in operationsequence, combinations and rotations). Each solution must be naturally
4.6 Assignment of Tasks and Workload Balance 105
coherent with the manufacturing engineering plan and with ergonomic andlayout constraints.
2. Technical saturation evaluationOnce the above analysis has been completed and the best solution defined, it ispossible to evaluate the effectiveness of this activity by verifying the degree oftechnical saturation for the staff dedicated to production:
ts technical saturation degree = RnðOTn �QAnÞ=ðAWT� NWÞ, where:OTn is the operative time for each product n (measured in standard working
time, without physiological breaks);QAn is the quantity of product n planned in the working shift;AWT is the daily available working time measured in working hours (without
collective breaks);NW is the quantity of workers assigned to the line (without substitutions
needed for individual physiological breaks).We emphasize that:
Ts 1 means that we have ‘‘ideal balance’’ for the workloads;ts 0.9 means that the workload balance, considering the actual staff, admits
an average activity level 10 % lower than the ideal
3. Line staff determinationLet us consider a real case in Italy.As a consequence of union agreements drawn up in 1973, but recentlyre-negotiated according to improved working conditions and still abided by insome Italian plants, there are some constraints for the workload on assemblylines:
• for line speeds within 15–60 cycles/h, the average technical saturation degree(ats) allowed in the working shift is lower than 88 %;
• for line speeds higher than 60 cycles/h, the average technical saturation degreeallowed is lower than 84 %.This agreement also establishes the parameters of permitted breaks, in par-ticular for general assembly lines and, more generally, for all multi-stationproduction systems directly connected. These breaks are forty minutes pershift and can be assigned individually, without stopping production, orcollectively by stopping production.In the absence of specific agreements, it is still necessary to organize theworkload, including physiological breaks, according to the work analysiscriteria mentioned in Sect. 3.3.Considering collective physiological rest breaks (line stoppage) and individualbreaks (worker replacement), the average technical saturation degree for thededicated staff can be evaluated in the following way:
ats ¼ ts � NW
NW þ RW� PWT
PWT þ B;
106 4 Work Analysis and Labour Productivity Evaluation Criteria
where:PWT is the planned working time in the working shift (without collective
breaks)NW is the total number of workers assigned to the line (without replacement
workers)B is the time for line stoppages due to collective breaksRW is the number of workers assigned for replacement (to cover normal
individual physiological breaks).
4. CAPE analysisFor very complex assembly lines (cars, industrial and commercial vehicles finalassembly and powertrain systems assembly), the major difficulties in balancingthe workload are due to:
• sequence of operation constraints;• layout constraints, especially due to specific equipment positioning;• product mix variability and composition;• workload range oscillation allowed in consequence of the spaces available
for ‘‘shifting’’.The technical saturation degree for the working staff (ts) corresponds to theaverage value obtainable during the working shift. During the productionprogram, some products (n) with a higher or lower operative time for theworkstation or section of line can be introduced; in this case, temporaryexcess or lack of saturation, compared to the average value, can occur.
It is important to contain the ‘‘temporary over-saturations’’ within a 10 %limit, by temporarily shifting positions on the line and alternating longer operativephases with shorter ones.
When the assembly cycle is made of several interconnected phases and centredon many different products (more models and versions and many options), it isnecessary to use CAPE methodologies, which allow for the simulation of otherpossible configurations, searching for the best level of technical saturation (ts).
In conclusion, the criteria for workload setting must provide a compositionand sequence of product mix rightly balanced during the same working shift.This composition and sequence must correspond to the average standardworking times measured by worker and workstation and should be coherentwith the standard cycle time set according to the calculation mentioned earlierso as to reach the balancing point (ts 5 1) as much as possible.
In assigning the working staff, it is also necessary to add the required RW ofworkers for the replacement of the workers NW that are operating on the line, forwhen they need individual physiological breaks (RW is generally a number withinthe 4 % of NW).
To summarize what has been described up to this point about the assignment oftasks and workload balance on an assembly line, the macro phases to be followedfor maximal achievement on the job are:
4.6 Assignment of Tasks and Workload Balance 107
1. pursue the ideal workload at every workstation (search for a OTi at everystation as a integer multiple of WCT)
2. obtain the real workload3. check the technical saturation at every station4. calculate the number of workers needed5. balance the workload through possible adjustment between working stations
(considering the sequence of the elementary operations to be respected andtheir length), by linking this activity to NVAA reduction as well
6. decide line break policy to be adopted and estimate average technical saturation
4.6.1 Considerations on Work Organization for AssemblyLines or Parallel Workstations
To improve working conditions and simplify the assignment of working tasks, inview of such restrictions on saturation, many carmakers have been trying to switchfrom an interconnected multi-station system to flexible modular systems. In par-ticular, during the mid-‘1970s (Volvo plants), technological layouts organizedin ‘‘working islands’’, made up of parallel and ‘‘non-synchronic’’ workstations,were conceived.
The above-mentioned isle systems, unfortunately, were not ultimately suc-cessful for final assembly as a result of the tremendous complexity in logisticsmanagement they represented. The most successful experiences have been testedin the manual assembly of mechanical systems and main sub-systems (cockpitmodules, air conditioning module, side doors, front modules…).
Let us try briefly to describe the main figures for the ‘‘working islands system’’:
• more operative phases are grouped together and more equal workstations are setin parallel to build a ‘‘homogeneous island’’ of activity;
• the technological layout is not linear, but divided in more ‘‘parallel sections’’,connected by programmable handling systems;
• within the same ‘‘system’’, more ‘‘homogeneous working islands’’ can exist,interconnected with each other in compliance with the assembly cycle and withthe aid of automatic stations and buffers.
With such a technological layout, applying software programs capable ofmanaging workloads and operative flows, some advantages can be achieved:
• workers can slightly modulate the working speed during the shift, autonomouslyusing the permitted individual physiological breaks, according to standardworking times and activity level assigned;
• during assembly operations, products are not moving, improving operationsfrom an ergonomic point of view;
• repetition of movement and relative muscular fatigue are reduced;
108 4 Work Analysis and Labour Productivity Evaluation Criteria
• by changing the productive programs, the number of workstations used (stabilityof the assigned tasks) can be changed, while assigned operations remain thesame;
• enlargement of the assigned tasks helps to make the workers feel responsibleand reduces the psychological and physical fatigue typical of short operations.
Conversely, some disadvantages have to be taken into account, such as the extraspace that is taken up by more complex handling systems. In fact, it is necessary tomanage the main component supplying system by kitting them through specialautomatic carts.
In conclusion, in choosing between line assembly and homogeneous workingisland systems, it is important to evaluate thoroughly, from a managerial andeconomic point of view, the following advantages and disadvantages:
1. An assembly system with a synchronous one-piece-flow allows for the allo-cation of components very close to the workstations, avoiding double handling.By increasing the operative cycle time, the standard working times tend toreduce through the reduction of movement, up to a limit lower than the oper-ative cycle length (minimum sustainable cycle time); under this limit, it isimpossible to assign any ‘‘complete operation’’ to the worker. In this situa-tion, it is necessary to introduce a second parallel section of the line, notnecessarily operating with the same working cycle time.
2. An assembly system with a non-synchronous modular flow allows for theenlargement of the number of operative phases assigned to the workers,ensuring better self-control, up to the upper limit of the assigned task; abovethis limit, the workstations become much too complex, with too many com-ponents to be assembled and too many different tools to be used. Compared to aone-piece-flow system, this method of organization allows for obtaining abetter degree of technical saturation and avoiding the necessity of havingadditionally required workers for replacement, which is an obstacle for thetraceability of responsibility.
Applying work analysis methodologies, the best and most convenient solutionhas to be clear, also considering the product typology and the required productivevolumes. For this purpose, it is important to trace the correlation between theoperative cycle time and the real working time (operative time with the addition ofreduced workforce and physiological breaks). As an example, Fig. 4.5 comparesassembly line and homogeneous working islands solutions, in the case of the finalassembly of a powertrain system. In conclusion, the analysis shows the mostconvenient areas in relation to the operative cycle time considered.
In the case study above, when the ‘‘island system’’ gives an advantage of11 % on the necessary labour Working Time (WT), we have the payback point forthe major investment needed compared to the ‘‘line system’’.
In conclusion, the choice to set an ‘‘island system’’, instead of a ‘‘linesystem’’, should take into account:
4.6 Assignment of Tasks and Workload Balance 109
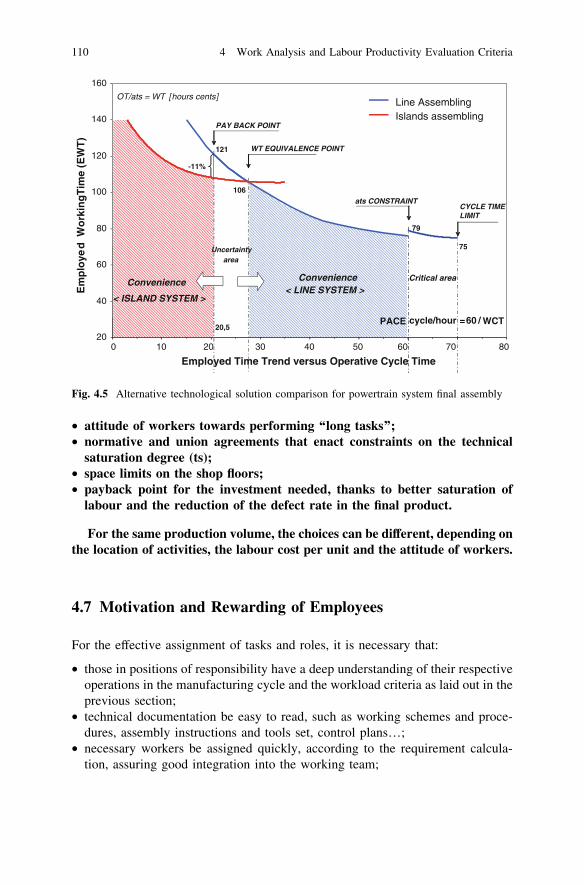
• attitude of workers towards performing ‘‘long tasks’’;• normative and union agreements that enact constraints on the technical
saturation degree (ts);• space limits on the shop floors;• payback point for the investment needed, thanks to better saturation of
labour and the reduction of the defect rate in the final product.
For the same production volume, the choices can be different, depending onthe location of activities, the labour cost per unit and the attitude of workers.
4.7 Motivation and Rewarding of Employees
For the effective assignment of tasks and roles, it is necessary that:
• those in positions of responsibility have a deep understanding of their respectiveoperations in the manufacturing cycle and the workload criteria as laid out in theprevious section;
• technical documentation be easy to read, such as working schemes and proce-dures, assembly instructions and tools set, control plans…;
• necessary workers be assigned quickly, according to the requirement calcula-tion, assuring good integration into the working team;
160
Line AssemblingOT/ats = WT [hours cents]
120
140
EW
T)
PAY BACK POINT
-11%
121
Islands assembling
WT EQUIVALENCE POINT
80
100
dW
ork
ing
Tim
e (
106
79
75
CYCLE TIME LIMIT
ats CONSTRAINT
Em
plo
ye
75Uncertainty area
40
60
Convenience
< ISLAND SYSTEM >
Convenience< LINE SYSTEM >
Critical area
PACE 60 /
200 10 20 30 40 50 60 70 80
Employed Time Trend versus Operative Cycle Time
20,5cycle/hour = WCT
Fig. 4.5 Alternative technological solution comparison for powertrain system final assembly
110 4 Work Analysis and Labour Productivity Evaluation Criteria
• workers be integrated gradually, with opportune training on the job and goodsupport from the expert workers, with specific technical courses in advance ifnecessary.
For this purpose, Manufacturing and Human Resources Departments mustcooperate closely.
Preliminary training, on-the-job training and the correct assignment oftasks and roles will be determinant in speeding up the ‘‘learning curve’’ (seeChap. 8); the speed of the start of production ramp-up, which contributes tothe guarantee of the new products’ ‘‘time to market’’ target, depends on it.
The progressive evolution in the organization of human resources, or so-called‘‘lean organization’’, has determined and will determine in the future a deepchange in the internal relationships and agreements with the unions. In modernenterprise, collaboration of employees is obtained by involving people inimprovement activities and objective evaluation of individual performances,according to attitudes and on-the-job behaviour.
For production employees, it is important to evaluate:
• availability and collaboration in learning technical instructions and helpingcolleagues under training;
• degree of attention in avoiding errors affecting the quality level of the finalproduct (self-control);
• capacity to advance proposals that contribute to the product and continuousimprovement of the process;
• punctuality and diligent continuity.
This criterion of evaluation is simple and clear. Tellingly, it is the same bywhich the ‘‘artisan master’’ evaluates the apprentice!
Even in the biggest enterprises, these evaluations should be done by thosedirectly responsible, supported methodologically by the Human ResourcesDepartment. In addition to the economic incentives, it is important to offeropportunity of professional growth to foster availability and collaboration.
Reprimands for bad behavior or poor work should be done with respect, evenwhen necessarily severe. Those responsible must communicate directly and thusinject a sense of motivation into the disciplinary amends. To be effective, theseamends should be ‘‘exceptions’’. If they become too common, suppositions forcreating a positive climate for internal relationships will no longer exist. In thiscase, it is necessary to intervene from more than one direction:method andworking conditions, internal communication, and involving people in targetachievements and training activities.
If the ‘‘working teams’’ are unstable and there are too many of them, itbecomes harder to evaluate, correct mistakes and foster training activities. For thisreason as well, it is important to deploy production activities, avoiding criticalsituations.
4.7 Motivation and Rewarding of Employees 111

Quality of working environment (spaces, lighting, climate…) helps collabora-tion and the achievement of quality targets. For this reason, modern enterprisesengage in specific studies and investments.
Let us now talk of rewarding workers. Historically, the reward system was usedfor individuals ‘‘doing piecework’’: ‘‘the more you produce, the more you arerewarded’’. Again, this policy has been limited to small manufacturing enterprisesand artisans.
In bigger manufacturing industries, where work is organized through ‘‘taylo-ristic’’ criteria, reward policies have been extended to larger groups of workers,interconnected and involved in the same productive process. The impact of thesereward policies, based on labour efficiency (g), has been progressively reducedduring the last decades. This fact is due not only to the opposition of the unions,but also to organizational changes that have occurred in the factories.
In fact, when resources required for the production plan are assigned andoperations work in a ‘‘one-piece-flow’’, it is clear that the productive output—forthe different stages of the process—is pre-determined and controlled on a standardbasis. It is not allowed for a single worker to work at a lower speed than thatrequired by the working cycle time (WCT), but neither that he work slightly faster,the latter for the purpose of evident regularity and stability of the production flow.
These considerations are relative to all mass production of complex productssuch as cars, commercial and industrial vehicles, motorbikes, agricultural means,domestic appliances….
Considering all of the above, it is important to consider that the rewardpolicies of economic groups are very useful to the enterprise when they arebased on indicators that quantify performances clearly and realistically.Referring to the previous definitions, some group rewarding factors can be:
(a) overall equipment efficiency (OEE);(b) degree of productive labour utilization g / (1+i);(c) quality indicators and cost of non-quality.
Another reward policy could be a collective annual prize, based on eco-nomic results within the same Business Unit or at the corporate level.
This last reward system—generally called a result prize—is applied byvery big enterprises and normally is the object of specific union agreements,based on the logic of involving employees in corporate economic results.
The effect of these rewards on salary depends not only on the enterprise’spolicies, but also on agreements with the unions in accepting that a variable quoteof the salary be linked to the enterprise’s economic results (including the risk ofwithdrawing in case of failure).
Economic rewards are a part of the larger theme of participation and motivationof human resources to achieve a company’s results. This argument is mainly atopic of Company Organization and Human Resources Development. Here, weonly underline how to prevent the risks derived from an insufficient motivation ofthe employees due to repetitive and uninvolving tasks.
112 4 Work Analysis and Labour Productivity Evaluation Criteria
First of all, it must be considered that a single error due to lack of attention orsense of responsibility can generate a serious quality defect or production stop-page, or a delay in delivery. So, the risks for the company as a result of workerdisaffection can be very serious. From this, we can derive the importance ofobtaining collaboration from all employees, fostering a spirit of teamwork to helpprevent critical events.
A good information technology system on the shop floor helps establish a senseof responsibility, involving employees in the presentation and evaluation of resultsachieved month by month, in terms of quantity and quality of the products anddiscussing customer problems (internal and external) due to delays in delivery ormanufacturing failures.
Finally, we map out in seven points the best ways for a good leader to motivatehis charges to engage in performing their tasks in the production process:
1. informing and training workers to perform their assigned tasks properly byapplying the working procedures;
2. determining the right working tools and personal protection devices and initi-ating their use;
3. prompt attention in detecting errors and helping the workers to correct preventthem;
4. assuring that safety and sanitary regulations be respected and preventing risk ofaccidents and damage to workers’ health;
5. establishing consistent attendance and behaviour on the job, adopting disci-plinary amends whenever regulations are repeatedly disrespected;
6. presenting and evaluating results obtained by the working team (quality level,efficiency…);
7. collecting proposals for improvement and responding to them when possible.
To do this properly, managers and those responsible for production shouldhave an attitude towards their relationship with the various levels of workersand overseers that is both sensitive and severe as the situation demands, butalways based on fairness of behaviour.
The paradigm of a ‘‘lean organization’’ includes the concept of a ‘‘leanhierarchical structure’’, to delegate more responsibilities and cultivate a morecompetent approach to solving problems in the organization, avoiding theneed to address them higher up in the hierarchy.
For this purpose, managers and those responsible should be ‘‘team-work’’ oriented, with constant care towards the human resources engaged incompany processes and demonstrating ‘‘leadership’’ based on employeeinvolvement and constant determination in target achievement.
4.7 Motivation and Rewarding of Employees 113
Chapter 5Manufacturing System Managementand Maintenance Criteria
5.1 Plant Manufacturing System
By ‘‘Plant Manufacturing System’’, we mean all the equipment and working meansnecessary for production. Machine, equipment and tool typologies are differentfrom process to process, as mentioned in Sect. 1.5.
In general, for manufacturing industries, Plant Technical Systems are the main‘‘capital assets’’. Accurate technical management of these systems is fundamental.
The information technology support used for planning and controlling invest-ment initiatives is based, according to ‘‘best practice’’, on the PDM logic describedin Sect. 2.3, obviously referring to the components of the Plant Technical Systemand not to the product parts. Each system’s project corresponds to an analyticstructure of the activities (WBS = Work Break-Down Structure), correlated toeach ‘‘module’’ included in the technological layout and referring to the singleoperations of the working cycle.
The above-mentioned WBS also includes the ‘‘responsibility matrix’’, whichdefines the competencies for developing the single items according to the proce-dures applied to project initiatives, distinguishing internal from external activities,the last being charged to external suppliers of equipment and tools.
Based on executive layout, investment items are defined and classified,assigning the proper values derived from the single project initiatives.
The file is a ‘‘working means database’’, including the following informationnecessary for controlling investments and assigning depreciations to the single costcentres:
(a) plant/unit/cost centre to which the working mean is assigned;(b) serial alphanumeric code, including information on the type of mean and the
progressive serial number necessary for the identification tag;(c) initiative’s code or investment project, the purpose for which the investment
has been delivered;(d) manufacturing cycle for which the mean is used, whenever it is specific to the
productive process, otherwise the auxiliary function for which it is used;(e) date of assignment to the productive unit and introduction into the database;
M. Gobetto, Operations Management in Automotive Industries,Springer Series in Advanced Manufacturing, DOI: 10.1007/978-94-007-7593-0_5,� Springer Science+Business Media Dordrecht 2014
115
(f) origin value and depreciation plan, according to the investment initiative;(g) remaining value, without the yearly cumulated progressive depreciation (net
book value);(h) possible re-evaluation due to extraordinary interventions and relative mandate
depreciation plan.
This database also includes the working means given for loan to externalsuppliers, but which is still the property of the enterprise itself.
To define the economic depreciation plan, the plant technical systems areformally divided into the following functional macro-categories:
(1) Product Dedicated EquipmentSpecial Machine Tools and Product Dedicated Equipment for specific productdesign production and not economically transformable. The related depreci-ation plan is generally for the short-medium term, being linked to the indus-trial life cycle of the single products.
(2) Standard Process EquipmentMachine Tools and Standard Process Equipment, usable for a large scale ofproducts and economically transformable for new models, anticipated in theproduct range plan.
(3) Plant Services EquipmentMachine Tools for Equipment Construction and for Working Means Mainte-nance, Complementary Equipment for plant services, Information Technolo-gies Systems, Measuring Machines, etc.For ‘‘plant technical systems’’ in points 2 and 3, the depreciation plan isnormally determined in the medium–long term, within 6–10 years, accordingto the following predictions:
• technical life, without extraordinary maintenance intervention;• probability of technical obsolescence, due to the development of more con-
venient technological solutions.(4) Plant Facilities
These also include buildings and all the facilities; the depreciation plan is forthe long-term (more than 10 years, according to the administrative rules forthe enterprise’s balance).
The above-mentioned economic depreciation criteria stretch to avoid ‘‘residualvalues’’ of the original investment, when the items will no longer be used. Theycorrespond to a prudential logic in drawing up the final economic balances.
For each of the items in the working means database, according to theresponsibility matrix defined by the Steering Committee, the Managers mustassure the following:
• verification that the working mean is complete, functional and safe for use whenfinally delivered from the supplier and put into production (according to tech-nical specifications);
• inclusion of each item in the working means database;
116 5 Manufacturing System Management and Maintenance Criteria
• verification of the availability of warranty from the supplier side;• guarantee of the correct usage, normal trustworthy maintenance and traceability
of the working mean up until the time they are put in charge of the productiveunit;
• advisement of when the working means is out of production, to begin procedureof transfer or disinvestment of the item.
In case of disinvestment of an item that still has a residual value, it is saved as anegative value on the final balance. In case of transfer, with a higher incoming thanthe residual value, it is saved as a positive value on the final balance. Periodically,the Finance Administration Department will verify the situation in collaborationwith Technical Managers to assure the coherence of financial data with physicaldata.
5.2 Reliability and Maintainability of Equipment
Before starting with the concept of maintenance, it is important to define what wemean by machines’ and equipment’s reliability degree and characteristics ofmaintainability.
A certain machine or manufacturing system can be considered fully reli-able when it is able to perform its own function consistently and in a mannercoherent with its established use during the requisite time for a given project.
From a statistical point of view, the reliability degree is the probability that itwill work correctly and without failure during the progressive utilization time (t):
r tð Þ ¼ 1 � f tð Þ; f(t) being the probability of failureThe reliability degree depends on the following factors:
• Intrinsic Functional Reliability, determined by project quality and robustness,components and system quality in assembly. Techniques used for this purposeare: robust design, FMEA analysis, transformation process simulations (duringdesign phase), component and system functional testing techniques (duringconstruction and try out phase).
• Duration Reliability, linked to usage of mechanical and mechatronic parts andfatigue factors. Techniques used to establish and extend the life of componentsare essentially based on the right choice of material and calculation tests,through CAD-CAE methodologies and the application of standard solutions,tested with positive results.
• Utilization and Maintenance Reliability, determined by correct usage of the‘‘systems’’ and effectiveness of maintenance processes. It is important to con-sider that the productive operations lead to a risk of failure; in the followingsections, we will approach maintenance methodologies that help to improve thisfactor of reliability.
5.1 Plant Manufacturing System 117
During the start-up phase, up to the final working speed of a system, the moreinfluential reliability factor is the intrinsic one, while the duration reliability factoris strongly influential on the maintenance cost, if the production process is set, anddetermines the technical life cycle of machines and equipment.
The total reliability degree is the product of the three factors.Let us now introduce the concept of equipment and machine maintainability:
it consists of the easy inspection and substitution of overused parts and the cor-rection of possible failures with simple and reliable operations.
The maintainability degree depends first on the design and development settingof the project and on the application of standard solutions, tested ahead of time in acollaboration between Constructor and User. To establish premium levels oftechnical reliability and availability (A), it is important to evaluate the possiblefailure modes, the associated probabilities, and the subsequent effects (FMEAmethodology) during the project phase. After this analysis, the right ‘‘projectreviews’’ are set, making construction solutions more robust and inspectingactivities on critical components easier, assuring quick intervention for the sub-stitution of damaged or used parts during the normal technical life of theequipment.
So far, in logical order, the main criteria that an engineer must consider for thedesign of easily maintained machines are:
1. Improve detectability of breakdowns by designing easy man–machine inter-faces able to give maximum details about how a particular failure occurred(type, module/component position, instruction on how to access the damagedpart…)
2. Improve accessibility to the machine: once the position of the affected module/component has been identified, access must be easy for the maintenanceoperator; this is possible thanks to two main approaches in design:
• layout optimization (locate critical module/component in easily accessibleareas)
• facilitate the tear down of safety repairs by creating fast, user-friendly solu-tions for dismounting and mounting
3. Design by modularity: machines must be designed such that maintenancecrews can operate solely on the relevant modules during a failure crisis thusspeeding up maintenance operations; once the dysfunctional module has beenreplaced, it can be removed, analysed and subsequently reconditioned to workagain through repair of the damaged component, all done remotely
4. Design by standardization: usage of standard components can improve themaintainability of the machine by:
(a) facilitating the training of the maintenance crew and creating conditions fora quick response (interchangeability of skill trades)
(b) facilitating the management of spare parts (reduction of supply lead timesand inventories).
118 5 Manufacturing System Management and Maintenance Criteria
Even for equipment and machines already under production, it is possible toimprove maintainability by acting as follows:
• improving the interface between man and machine through monitored instruc-tions for driven intervention and time-based maintenance;
• out of machine ‘‘pre-setting’’ techniques applied for tool changes, to shorten set-up-time;
• improving the removal and re-positioning operations on safety barriers andrepairs;
• partner tool adoption to the quick removal and re-positioning of bulky partsunder failure, by operating in safety conditions.
For each module of a ‘‘Plant Technical System’’, the failure modes can bedifferent, random and periodic. The techniques for cause and effect analysis—specifically discussed in Chap. 8—allow for selecting the critical phenomena andadopting specific countermeasures. This method is particularly important duringthe start-up phase: the root causes of the failures are verified, and eventual defi-ciencies in mechanical and electronic control systems are fixed (with particularattention to sensors and automatic system control software). In this way, certaintypes of failure and their frequency are minimized. In between, the intervention forcorrective action is improved, reducing the length of technical breakdowns(maintenance learning curve).
Once the start-up phase is completed, the frequency index Fn, consideredphysiological for a certain typology of failure n, is estimated on a statistical basis.These analyses must be performed on a significant and extended temporal scale,such as: working week or month, or a certain progressive working time used forproduction (ex.: 100 h).
Fn = 100 �/MTBFn is the average frequency for breakdown n referring to100 h of work, where MTBFn (mean time between failures) are the averageworking hours between the failure events n, without considering inactive time forother causes.
The statistical data Fn is significant for the probability of breakdown anddepends on the total reliability of the system.
The second important group of statistical data is the acronym MTTRn (meantime to repair and restart) and corresponds to the average downtime for amachine, expressed in hours, necessary for repairing a breakdown (n) andrestarting production. MTTR includes:
• time necessary to detect the breakdown and maintenance interventionmanagement;
• time necessary for repair with machine stopped;• time necessary to restart production, after necessary test for safety and process
quality.
The MTTRn can also be determined by statistical observation and depends onthe ‘‘degree of maintainability’’ and ‘‘maintenance efficiency’’ (interventionspeed). To perform correct statistical data collection for MTTRn, abnormal waiting
5.2 Reliability and Maintainability of Equipment 119
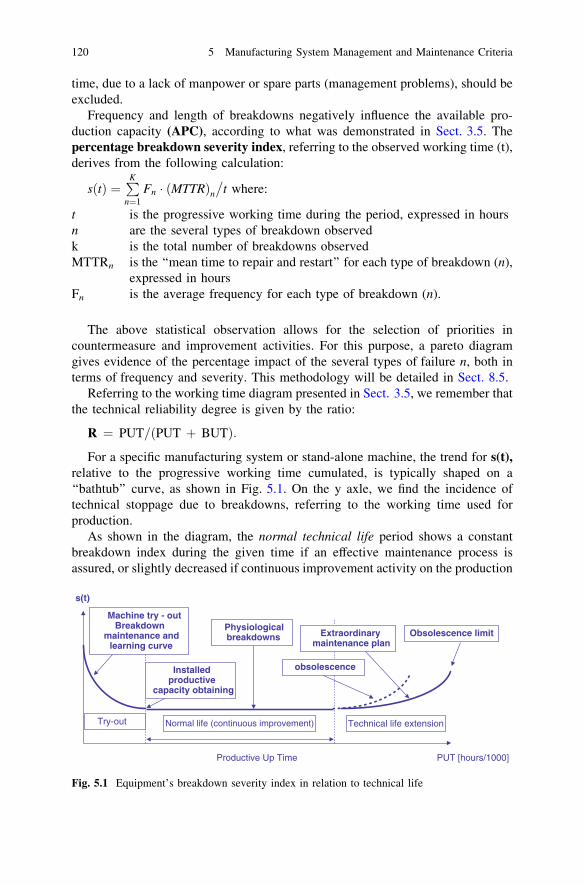
time, due to a lack of manpower or spare parts (management problems), should beexcluded.
Frequency and length of breakdowns negatively influence the available pro-duction capacity (APC), according to what was demonstrated in Sect. 3.5. Thepercentage breakdown severity index, referring to the observed working time (t),derives from the following calculation:
s tð Þ ¼PK
n¼1Fn � MTTRð Þn
�t where:
t is the progressive working time during the period, expressed in hoursn are the several types of breakdown observedk is the total number of breakdowns observedMTTRn is the ‘‘mean time to repair and restart’’ for each type of breakdown (n),
expressed in hoursFn is the average frequency for each type of breakdown (n).
The above statistical observation allows for the selection of priorities incountermeasure and improvement activities. For this purpose, a pareto diagramgives evidence of the percentage impact of the several types of failure n, both interms of frequency and severity. This methodology will be detailed in Sect. 8.5.
Referring to the working time diagram presented in Sect. 3.5, we remember thatthe technical reliability degree is given by the ratio:
R ¼ PUT=ðPUT þ BUTÞ:
For a specific manufacturing system or stand-alone machine, the trend for s(t),relative to the progressive working time cumulated, is typically shaped on a‘‘bathtub’’ curve, as shown in Fig. 5.1. On the y axle, we find the incidence oftechnical stoppage due to breakdowns, referring to the working time used forproduction.
As shown in the diagram, the normal technical life period shows a constantbreakdown index during the given time if an effective maintenance process isassured, or slightly decreased if continuous improvement activity on the production
Machine try - outBreakdown
maintenance and learning curve
Installed productive
capacity obtaining
Technical life extension
Productive Up Time PUT [hours/1000]
Obsolescence limit
Normal life (continuous improvement)
s(t)
Try-out
Physiological breakdowns
obsolescence
Extraordinary maintenance plan
Fig. 5.1 Equipment’s breakdown severity index in relation to technical life
120 5 Manufacturing System Management and Maintenance Criteria
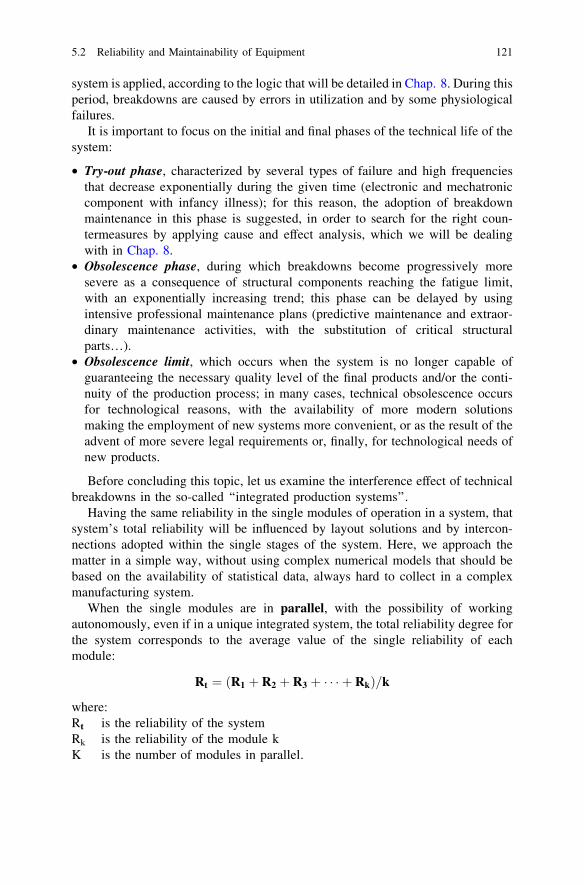
system is applied, according to the logic that will be detailed in Chap. 8. During thisperiod, breakdowns are caused by errors in utilization and by some physiologicalfailures.
It is important to focus on the initial and final phases of the technical life of thesystem:
• Try-out phase, characterized by several types of failure and high frequenciesthat decrease exponentially during the given time (electronic and mechatroniccomponent with infancy illness); for this reason, the adoption of breakdownmaintenance in this phase is suggested, in order to search for the right coun-termeasures by applying cause and effect analysis, which we will be dealingwith in Chap. 8.
• Obsolescence phase, during which breakdowns become progressively moresevere as a consequence of structural components reaching the fatigue limit,with an exponentially increasing trend; this phase can be delayed by usingintensive professional maintenance plans (predictive maintenance and extraor-dinary maintenance activities, with the substitution of critical structuralparts…).
• Obsolescence limit, which occurs when the system is no longer capable ofguaranteeing the necessary quality level of the final products and/or the conti-nuity of the production process; in many cases, technical obsolescence occursfor technological reasons, with the availability of more modern solutionsmaking the employment of new systems more convenient, or as the result of theadvent of more severe legal requirements or, finally, for technological needs ofnew products.
Before concluding this topic, let us examine the interference effect of technicalbreakdowns in the so-called ‘‘integrated production systems’’.
Having the same reliability in the single modules of operation in a system, thatsystem’s total reliability will be influenced by layout solutions and by intercon-nections adopted within the single stages of the system. Here, we approach thematter in a simple way, without using complex numerical models that should bebased on the availability of statistical data, always hard to collect in a complexmanufacturing system.
When the single modules are in parallel, with the possibility of workingautonomously, even if in a unique integrated system, the total reliability degree forthe system corresponds to the average value of the single reliability of eachmodule:
Rt ¼ ðR1 þ R2 þ R3 þ � � � þ RkÞ=k
where:Rt is the reliability of the systemRk is the reliability of the module kK is the number of modules in parallel.
5.2 Reliability and Maintainability of Equipment 121
Conversely, if the layout of the system is set on modules that operate insequence, interconnected one to the other in a synchronous way, the total reli-ability degree is equal to the product of the reliability degree of the single modules:
Rt ¼ R1 � R2 � R3 � � � � Rtk:
Practically, this method of determining the reliability degree is valid if thebreakdown distribution can be considered random and if, in case of concurrentevents on two or more modules, there is no simultaneous repair intervention. Inthis situation, as it normally occurs, the failure of a single module causes thebreakdown of the whole system; in other words, there is full interference of thetechnical failures of the single modules for operative continuity of the integratedsystem.
The above-mentioned interference can be reduced when the modules areinterconnected by ‘‘flexible material handling systems’’, having appropriatedynamic inter-operational buffers. Even if this solution is recommended forincreasing the total reliability degree, it is counterproductive for the continuousone-piece-flow concept that we will discuss in Chap. 6.
To calculate the optimal size of the ‘‘buffers’’, some considerations have to betaken:
(1) MTBF and MTTR for each module of the system should be known;(2) additional investment needed for construction of the buffers, for all the
alternative solutions considered;(3) the obtainable gain in productivity level of the system by introducing the
buffers (higher available productive capacity APC, higher overall equipmentefficiency OEE).
The modern CAPE supports allow for the simulation of continuity conditions ofproductive flows, when the programmed technical stoppages are needed for set-upoperations (pu) and when probable failure events (n) can occur, considering thefrequency index Fn and the duration MTTRn. In this way, during the project settingphase, alternative solutions for layout composition can be compared (modularitylevel and deployment of operations), searching for the best solutions for modulepositioning and for dimension of the buffers. These CAPE systems are also usefulfor defining the convenient situation of simultaneous tool change with the machinestopped.
5.3 Maintenance Management
The goal of maintenance is to maintain the original conditions of operationand safety necessary to fulfil production plans during the entire life cycle of aplant’s technical systems.
122 5 Manufacturing System Management and Maintenance Criteria
Referring to the definitions given in Chap. 3, the technical parameters used toevaluate effective maintenance are:
• technical availability of machines and equipment (A);• stability of process and quality of final product (process capability);• safety of work in terms of utilization and environmental emission, estimated
according to legal requirements.
From an economic-managerial point of view, maintenance activities can bedivided into:
1. Ordinary MaintenanceThis includes necessary intervention for maintaining ‘‘plant technical systems’’at normal functioning levels, according to quality, safety and productivitystandards set by the project and consolidated during production.
2. Extraordinary MaintenanceThis includes all exceptional intervention for mechanical and structural parts ofmachines and equipment, necessary, after a long period of utilization, to avoidcritical working conditions or to re-set equipment standards for modern tech-nologies, consequent to new technical standards; with these interventions, thenormal technical life of the equipment is increased as well as its remainingvalue (original investment without depreciations already accounted for).
Costs related to ordinary maintenance are accounted to the single unit ordepartment in charge of equipment management and are included in the ‘‘standardtransformation cost’’ of products. They are considered in the annual budgetexercise and are updated monthly and yearly.
Conversely, investments necessary for extraordinary maintenance operationsmust be preliminarily evaluated from a cost-benefit point of view and thenapproved on a specific project initiative, to be depreciated in two or more yearlyfinance exercises, in relation to the lengthened life of the equipment involved.
The chart in Fig. 5.2 summarizes the main figures for Ordinary MaintenanceManagement for complex technical systems.
5.3.1 Autonomous Maintenance Activities (Simpleand Recurrent Interventions: Type A)
This includes the interventions that can be performed directly by machine andequipment operators. These activities are simple and recurrent and must be donefollowing specific standard maintenance procedures defined by Technical Depart-ments (Manufacturing Engineering, Maintenance Engineering, Equipment Sup-plier) with the cooperation of operators. Typical examples of such activities are:
• process parameter control and adjustment;• used tool and part calibration and substitution, when easily changed;
5.3 Maintenance Management 123
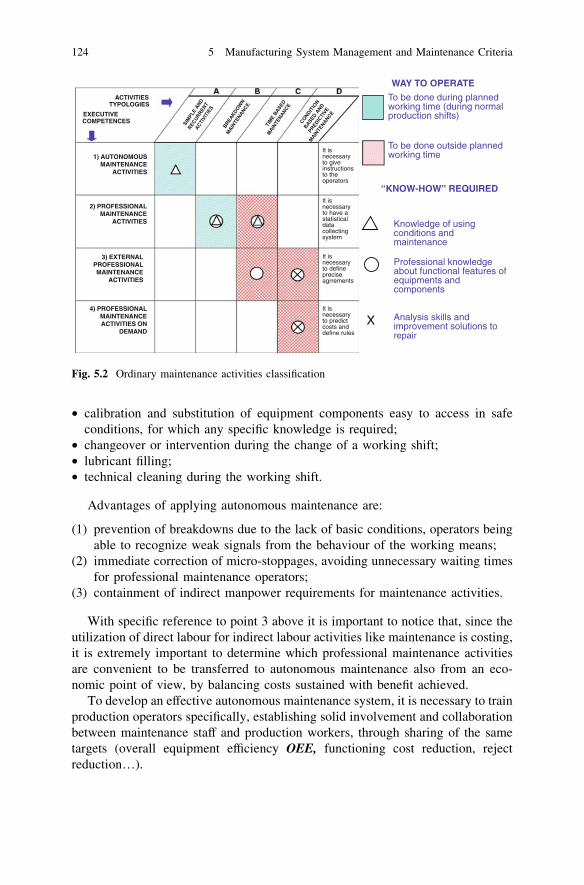
• calibration and substitution of equipment components easy to access in safeconditions, for which any specific knowledge is required;
• changeover or intervention during the change of a working shift;• lubricant filling;• technical cleaning during the working shift.
Advantages of applying autonomous maintenance are:
(1) prevention of breakdowns due to the lack of basic conditions, operators beingable to recognize weak signals from the behaviour of the working means;
(2) immediate correction of micro-stoppages, avoiding unnecessary waiting timesfor professional maintenance operators;
(3) containment of indirect manpower requirements for maintenance activities.
With specific reference to point 3 above it is important to notice that, since theutilization of direct labour for indirect labour activities like maintenance is costing,it is extremely important to determine which professional maintenance activitiesare convenient to be transferred to autonomous maintenance also from an eco-nomic point of view, by balancing costs sustained with benefit achieved.
To develop an effective autonomous maintenance system, it is necessary to trainproduction operators specifically, establishing solid involvement and collaborationbetween maintenance staff and production workers, through sharing of the sametargets (overall equipment efficiency OEE, functioning cost reduction, rejectreduction…).
WAY TO OPERATE
To be done during planned working time (during normal production shifts)
To be done outside planned working time
Knowledge of using conditions and maintenance
Professional knowledge about functional features of equipments and components
Analysis skills and improvement solutions to repair
“KNOW-HOW” REQUIRED
X
1) AUTONOMOUS MAINTENANCE
ACTIVITIES
2) PROFESSIONAL MAINTENANCE
ACTIVITIES
3) EXTERNAL PROFESSIONAL MAINTENANCE
ACTIVITIES
4) PROFESSIONAL MAINTENANCE ACTIVITIES ON
DEMAND
EXECUTIVE COMPETENCES
ACTIVITIES TYPOLOGIES
It is necessary to give instructions to the operators
It is necessary to have a statistical data collecting system
It is necessary to define precise agrrements
It is necessary to predict costs and define rules
Fig. 5.2 Ordinary maintenance activities classification
124 5 Manufacturing System Management and Maintenance Criteria
5.3.2 Professional Maintenance Activites (Type B, C and D)
These are charged to Staff Technical Departments, which should be proficient in:
• Analysing the root causes of breakdowns and determining countermeasures toeffect in agreement with equipment constructor.
• Studying methods for intervention and setting necessary resources (personnel,working means, spare parts).
• Organizing resources locally to assure a fast response to requests for mainte-nance intervention.
Professional Maintenance can be directly managed by final producer plants,organizing a specific maintenance department, or renting the service from anexternal specialized provider, operating with a specific open agreement. Criteriafor the selection of ‘‘make-or-buy’’ services are the same as those explained inSect. 1.2. From an organizational point of view, professional maintenance activ-ities can be divided into the following categories:
Breakdown Maintenance, on user’s request.For this type of intervention, it is necessary to have local specialist teams, close
to the production units. The size of these dedicated teams is established by con-sidering the frequency of requests on a statistical basis and intervention timerequired (MTTR), according to technical availability (A) targets for each of theplanned working shifts.
It is important to know that ‘‘quick intervention’’ does not always solve theproblem definitively; in this case, it is necessary to set a temporary solution,followed by a final definitive countermeasure, to be planned opportunely.
Time-Based Maintenance (TBM), to be performed as follows:
• in calendar terms, possibly outside of the working shift so as not to interferewith production activity, when dealing with consumable materials (lubricant,filters, galvanic fluids…) that decline by themselves, or with equipment underlegal safety prescriptions (lifters, high pressure tanks, fluid depurationequipment…);
• in working time terms, calculated based on the progressive working timecumulated; typical such interventions are: substitution of used tools, machineparts under mechanical stress (gears and bearings, transmission chains and belts,mechatronic devices…). Additionally, these interventions should be done out-side of planned working time whenever possible.
Maintenance standard procedure and frequency are defined based on statisticalanalysis and economic estimation. Data are more reliable when culled fromstandard solutions widely tested in the field.
We can observe that fatigue limits for machine parts under stress depend on thebehaviour and dimensions of the forming materials. Eventual critical conditions,
5.3 Maintenance Management 125
due to accidental failures or lack of maintenance, influence the frequency ofmaintenance intervention. Discounting these anomalous events, normal compo-nent life can be represented by a curve comparable to a gauss histogram distri-bution as represented in the following diagram.
The bigger the dispersion relative to breakdown frequency, the more severe thecosts for preventive substitution of parts subject to fatigue stress. To choose theright frequency of intervention, it is necessary to search the convenience point on astatistical base, comparing costs for preventive maintenance to benefits derivedfrom well-functioning equipment (fewer production losses).
Considering the distribution in Fig. 5.3, we can distinguish the followingalternative intervention strategies:
1. Period of intervention WT/1, preventing 97 % of probable failure events; in thecase shown, this leads to double the specific maintenance cost, compared to abreakdown maintenance strategy.
2. Period of intervention WT/2, preventing 85 % of probable failure events; in thecase shown, this leads to an increase of 25 % of the specific maintenance cost,compared to a breakdown maintenance strategy.
It is more convenient to adopt strategy (1), oriented to a higher technical reli-ability, when the type of breakdown can affect final product quality or imply severeinterruption of production activity, compromising the final level of customer serviceand leading consequently to high costs for functioning (final product stocks).
It is more convenient to adopt strategy (2), oriented to optimize working costs,when the type of breakdown affects the technical availability (A) without implyingthe risks of the previous point.
Condition Based Maintenance (CBM) and Predictive Maintenance, inconsequence of specific controls on the working conditions of the equipment andon ‘‘process capability’’.
Nr of breakdowns
WT (Working Time)WT/M = medium working timeWT/1 WT/2
85%
97%
100%
% probability of breakdown
Fig. 5.3 Breakdown phenomena statistical distribution in relation to progressive working time
126 5 Manufacturing System Management and Maintenance Criteria
For this purpose, it is first defined as the necessary cycle of inspections with therelative frequencies, to be performed during the planned working time, in col-laboration with the users. These inspections do not imply the disassembly of themachine’s mechanical parts and are possible thanks to techniques based on processparameters controlled through specific ‘‘detecting tools’’ that work on equipmentworking conditions.
As a result of these inspections, technicians evaluate the necessity of predictivemaintenance intervention, to prevent failures.
According to the best practices, the techniques most used for diagnosis are:
• working cycle analyser, interfaced with machine control panels;• vibration analysis, thermography, infrared analysis, X-ray analysis, fluidic
tests…;• telemetric tests for geometrical trim of kinematic parts influencing ‘‘process
capability’’;• remote diagnosis systems, that allow for the use of Technical Assistance Cen-
tres, specialized for addressing the re-setting of interventions remotely.
The above-mentioned techniques should be opportunely integrated by statisticalanalysis in the field, as previously recommended.
The development of planned maintenance, under predictive inspection, can leadto consistent economic and technical advantages, but requires highly qualifiedemployees and specific techniques, of the types mentioned above. For this reason,‘‘carmakers’’ and Main Component Producers tend to delegate this type of activityto Equipment Suppliers themselves or to Specialized Maintenance Service Com-panies, through specific technical assistance purchasing agreements.
Let us conclude the argument in favour of maintenance activities organi-zation, underlining the importance of studying ‘‘methods of intervention’’.
The starting point is statistical data MTBF, MTTR and the estimation of spe-cialized manpower requirements for performing maintenance activities, havingestablished a standard time of intervention. For parts with normal usage, frequencyand length of intervention are defined in a predictive way, considering conditionsfor substitution and intervention cost compared to the benefits obtainable throughadvantages in the production process.
Relative to more complex planned maintenance activities, it is necessary first todefine the methods, time and frequency of intervention required with accuracy,through specific statistical analysis, whereupon personnel requirement can bedetermined applying the criteria for working time and work analysis demonstratedin Sects. 3.3 and 4.1.
We need to emphasize that, for maintenance activities, it is impossible to reachthe full saturation of dedicated labour, due to the fact that workload variations arerelevant and long waiting times can be generated through lengthy analysis ofbreakdowns and the time it takes for spare parts to be supplied. To optimize themaintenance workforce, the saturation degree can be determined statistically, witha proper system for recording interventions. Generally, a 70 % degree of saturation
5.3 Maintenance Management 127
can be considered acceptable, because it avoids delays for emergency calls andcontains maintenance costs.
To reduce MTTR, we must act on the following factors:
• increasing technicians’ professional knowledge and improving operators’skills through training, on-the-job in the case of the latter;
• supplying the right tools for detecting failures’ mode and for speeding upmaintenance intervention;
• quick availability of spare parts.
In relation to the last point, the logistic organization of the supply system isparticularly strategic. Spare parts can be classified into the following categories:
(a) Spare parts necessary for recurrent ‘‘back-up’’, which should be availableat machine side to speed-up interventions; these parts are normally recoverableand repairable for further use as ‘‘back-up’’ parts.
(b) Spare parts necessary for non-recurrent interventions, the storage space ofwhich should be nearby the equipment and machines on the shop floor andmanaged with a ‘‘minimum stock level’’ criteria, considering utilization fre-quencies and supply lead times.
(c) Standard parts widely employed, the storage space of which should beorganized on two levels: the first peripheral level should be small and locatednear the equipment and machines on the shop floor, while the second levelshould be centrally located and able to serve more plants, operating to replacethe parts withdrawn from the peripheral warehouse on the first level, normallyat a weekly rate. In this way it is possible to assure a good service level andcontain the relative invested working capital.
To simplify the process of supplying spare parts and to minimize workingcapital, technical solutions and automatic components must be standardized asmuch as possible (the same type of machine centre, robot and controlling devices,material handling equipment, etc., should all be used in the same plant).
Modern ICT allow for the automatic checking of stock levels in the warehousesin real time and for the organization of and supply plans for spare parts based on‘‘minimum safety stock’’ criteria.
To purchase spare parts, it is normal to operate on open agreements, engagingthe suppliers in obtaining short delivery lead time and then relying on them to be incharge of supplying the necessary stocks.
5.4 Correlation Between Cost and MaintenanceEffectiveness
As seen in Sect. 4.5, maintenance expenses for manufacturing systems signifi-cantly influence hourly transformation costs (burden). This incidence is particu-larly high for metal transformation processes (foundries, steel metal printing,
128 5 Manufacturing System Management and Maintenance Criteria

machining), reinforced polymer transformation processes and body welding andpainting.
To plan and control these costs, it is first important to distinguish the partconsidered ‘‘variable’’ in relation to the activity levels (PWT and PAV) from thepart considered ‘‘fixed’’ on a yearly basis, depending on the structural asset of theplant’s technical systems.
On first approximation and in proportion to activity level (PWT and PAV), wecan consider the expenses as variable for:
• consumable materials and spare parts used in maintenance, evaluated at thesupplied cost;
• fees for time-based maintenance activities planned on cumulated working timeand evaluated at contract price (if performed by external providers) or at hourlylabour cost of Maintenance Department.
We can consider expenses linked to fixing maintenance garrisons set forassistance to production and emergency calls for each of the planned workingshifts as ‘‘variable by step’’, in relation to the planned working time (PWT).
Conversely, we can consider expenses as fixed per year for:
• salaries for managers and technicians dedicated to maintenance;• other technical and logistic services provided by external suppliers on specific
initiatives;• time-based maintenance activities on calendar normally provided by external
suppliers, set at contract price.
In this way, it is easy to plan and control maintenance cost trends, analysingvariation causes month by month and year by year, distinguishing:
• variation due to activity volume effect (PAV and PWT);• variation due to purchasing prices and labour unitary cost;• variation due to efficiencies.
The evaluation of maintenance cost trends should be done together with theevaluation of technical availability (A) and overall equipment efficiency (OEE) forthe plant’s technical systems.
We have to emphasize that, in searching for the best maintenance asset(organizational structure and methodologies for intervention), the followingpoints should be considered:
• incidence of maintenance costs referring to total transformation costs, normallyhigher when accompanied by a quick response to emergency calls and a highlevel of failure prevention, with positive effect on technical availability (A);
• incidence of costs due to productivity losses, which depends on statistical data(1-OEE), according to what was laid out in Sect. 3.5;
• economic advantage obtainable from increase in equipment productivity, as aconsequence of a higher available productive capacity (possibility of reducingworking shifts, or increasing the sales plan).
5.4 Correlation Between Cost and Maintenance Effectiveness 129
To conclude this section, we will focus on the labour factor of maintenancecosts, which we classified as ‘‘indirect labour’’ in Chap. 4; looking at all main-tenance parameters, it is possible to estimate the maintenance labour force requiredfor maintaining a production department by measuring the following data:
• frequency and severity of breakdowns by department• frequency and duration of preventive activities recorded in the maintenance
calendar (TBM and CBM activities).
Referring to the calculation of the Direct Labour Requirement (DLR) seen inSect. 4.2, the calculation of Maintenance Labour Requirement could be carried outby the following calculations in.
5.4.1 Breakdown Maintenance Activity Volume
BMAV ¼XN
i¼1
160
MTTRi � Bi
where:
• MTTRi is the Mean Time To Repair at the production department level mea-sured in minutes;
• Bi is the total number of breakdowns occurring during the working periodconsidered in the department for the typology of failure I;
• N is the number of different typologies of failure occurring in the department.
5.4.2 Preventive Professional Maintenance Activity Volume
PMAV ¼XJ
j¼1
160
TBMj þXK
k¼1
160
CBMk
where:
• TBMj is the time required for the Time Based Maintenance activities in thedepartment recorded on the professional maintenance calendar, measured inminutes;
• J is the number of different Time Based Maintenance activities managed in theproduction department;
• CBMk is the time required to execute the Condition Based Maintenance activ-ities in the department recorded on the professional maintenance calendar,measured in minutes;
• K is the number of different Condition Based Maintenance activities managed inthe production department.
130 5 Manufacturing System Management and Maintenance Criteria
5.4.3 Individual Activity Achievable
IAA = g � IWH � (12a) equal to the hours worked on average by each worker,being:IWH working hours, corresponding to the hours of presence on the job
determined by the collective agreement for the working period considered(average data that also considers the organization of shifts);
g maintenance labour efficiency (measured as indicated in Sect. 4.1);a absenteeism index, estimated by statistical data.
The Maintenance Labour Requirement will be determined by:
MLR ¼ BMAV þ PMAV
IAA
5.5 General and Complementary Equipmentfor Production
5.5.1 General Services Equipment and Energy ConsumptionOptimization
Energy employed in transformation processes can be divided into:
1. Electric Energy, supplied to technological users through primary and sec-ondary distribution nets; these are designed and dimensioned in relation to aunit’s production and power consumption parametrically estimated, dependingon types of processes and production volumes. The connections to the specificequipment are realized based on layout of machines and installed systems.Devices for monitoring consumption are opportunely positioned, along withone for safety protection and other specific needs for equipment power supply(high voltage smoothers, frequency converter…).
2. Energetic Fluids employed in material transformation processes: methane,propane, ethylene, steam, compressed air…Each one of the above fluidic vectors is supplied by plant specific nets, orthrough control units close to the users. Distribution nets are designed based ontechnological layout and in relation to power consumption parametricallyestimated, applying necessary saving systems, pressure regulation and flowcontrol. Some fluidic vectors, conversely, are supplied by generators/accumu-lators integrated into the technological equipment itself (for example: controlunit for hydraulic or pneumatic servo-controls).
3. Other Technological Fluids used in the transformation process: inert gas,industrial water, liquid for lubrication and refrigeration….
5.4 Correlation Between Cost and Maintenance Effectiveness 131
For the fluidic vectors considered ‘‘critical’’ from a safety point of view(compressed gas, inflammable or hazardous fluids) strict safety prescriptions mustbe applied.
Whenever production processes are energy consumption intensive, it isappropriate to set out some modern systems for monitoring, to allow theoperators to adjust the process parameters requiring necessary specificmaintenance intervention quickly.
In order of effect on transformation cost, we review the automotive productionprocesses of high specific energy consumption level below:
• body in white painting;• foundry for cast iron or light alloys;• polymer transformation;• steel cold stamping;• metal machining;• body in white welding and assembly.
Relative to the above processes, it is proper to adopt energy-saving tech-nological solutions. In particular, it is necessary to apply modern systems forheat generated from the recovery of transformation processes and for therecycling of rejected fluid and solid material.
Furthermore, it is to be underlined that conditioning necessary for solid func-tioning of some technological processes and occasionally for the needs of theworking environment is a relevant part of energy consumption in automotivefactories. Relative equipment must be well designed to optimize thermal flow andto be easily regulated while functioning, according to need.
Another point of attention concerns the lighting systems for the shop floor andthe offices, which must be set considering energy-saving criteria as well as thesystems mentioned earlier; this is to assure the necessary level of illumination inthe working areas, distinguishing them from the transit areas, the warehouses andthe other secondary areas, while respecting safety criteria. Lighting groups shouldbe high performing, divided by sectors and regulated automatically by photo-electric cells with programmable thresholds.
In the future, more restrictive norms for energy-saving criteria and CO2
emission will be applied, so as to engage General Equipment Makers in devel-oping more sophisticated technological solutions.
5.5.2 Co-generation Equipment and Electric EnergyConsumption Control Systems
At some automotive final assembly plants, where scale of economy and localizedactivity provide convenience, co-generation equipment for energy production(thermo-electric power stations nearby or inside the plant) are employed. In these
132 5 Manufacturing System Management and Maintenance Criteria
situations, steam generated from low pressure turbines can be directly used bothfor heating of the working environment and for technological use, especially forbody painting processes. The economic advantage is more significant when thesepower stations are connected to public networks and can interact, absorbing energywhen more is needed or providing energy when there is an excess. In the future,photoelectric panel application will be more common, so that solar power will beused for conditioning working environments.
To optimize energy consumption, it is important to have dedicated monitoringsystems. Starting from data collecting in real time, weekly or monthly reports areorganized to better focus countermeasures or improve necessary actions.
It is suitable to appoint a specific person responsible for ‘‘energy-saving’’activities for each production plant, with whom all unit managers should collab-orate in general equipment management. Concentration of activities on certainworking shifts, as well as considering the differences in energy fees, appropriatearea sectioning, and modular equipment adoption, are all typical actions for lim-iting energy consumption.
From the moment that energy resources are ‘‘critical’’ by definition, it isappropriate to control equipment efficiency and plan necessary correctiveactions. The analysis of final specific consumption allows for monthly moni-toring of deviations from standard utilization.
In this regard, it is important to consider that:
• in Italy, electric energy cost is higher than the average in EU countries, and evenmore if compared to North America or Eastern Europe;
• in other world areas with poor mineral resources, but where industrial activitiesare developing fast (such as Brazil or China), serious electrical energy shortagescan occur periodically, as a consequence of sudden hydric lacks that can con-dition trends in production activity.
Let us conclude this section by underlining the importance of fire fightingsystems that are included in the general equipment. Maintaining efficiency withinthese systems, according to risk prevention policies, is the responsibility of PlantTechnical System Management.
5.5.3 Auxiliary Equipment and Exhaust MaterialManagement
By auxiliary equipment, we mean:
1. equipment for technological fluid treatment and recirculation, such as lubricantand cooling liquid for metal printing and metal machining process, industrialwater for body in white pre-treatment processes…;
2. equipment for collecting and recovering chips resulting from metal transfor-mation processes, such as foundry wastes, blanking and shearing chips…;
5.5 General and Complementary Equipment for Production 133
3. equipment for regeneration and exhaustion of solid and liquid materialsresulting from transformation processes, such as sands and soil in foundry,lubricants and coolants, chemical products in the painting process;
4. equipment for decreasing dust and the depuration of gas resulting from metaland polymer transforming processes, chemical-physical treatments and surfacecoating and functional dynamic tests in cells for engines and vehicle.
The above types of auxiliary equipment are becoming more relevant from atechnical and economic point of view, in relation to the more severe norm forinternal and external environmental emissions. Managers and those responsible arein charge of assuring that these rules will be respected and that maintenance andcontrol of this equipment will be done according to legal requirements.
Working costs for this equipment is principally due to the specific energyconsumption and particularly expensive consumable materials, such as diaphragmsfor ionic exchangers and liquids for technical cleaning. As a consequence, themanagement of this equipment requires serious attention, both from a cost point ofview and from a legal liability point of view.
5.6 Tools and Consumables Management
5.6.1 General Criteria
For many technological areas, the use of consumables significantly influences theexercise costs for Plant Technical Systems and their efficiency.
Let us remember that the distinction between direct material and indirectmaterial (consumables) derives from the ‘‘transformation’’ concept. Those mate-rials that are transformed and transferred to the final product are considered directmaterial. Both tools and tooling subject to consumption and normal substitution,other than consumable materials necessary to perform the transformation pro-cesses, without being transferred to the final product, are considered indirectmaterial.
Management of tools and consumables includes the following activities:
1. development of specific technical characteristics, in relation to transformationprocesses;
2. specific consumption analysis and definition of requirements (parametric toproduction volumes);
3. checks on feed planning and relative acceptance;4. planning and controlling of costs related to consumption, in relation to each
centre of responsibility (productive units).
134 5 Manufacturing System Management and Maintenance Criteria
First of all, it is necessary to perform activities of applied research, exploringoffers and convenience in introducing innovative solutions, as explained inSect. 5.6.2.
If solutions and relative processes are technically delivered, consumptionstandards are defined. These standard values, correlated to purchasing price andmaintenance costs (re-generation), are input for the planning of material supplyand consumption expenses.
In the same manufacturing system, consumable material cost is assigned to eachproduct in relation to the working cycle time per unit (WCT/K), or consideringother parameters (for example, the weight of developed products in the case ofmetal processes).
All of this concerns the analysed cost, while for the purpose of controlledmanagement, consumption expenses for consumable materials are normallydivided in proportion to volume of hours of each cost centre (DAV, DevelopedActivity Volumes or, EWT, Employed Working Time, see Sect. 4.2).
5.6.2 Tools and Tooling Subject to Quick Usury
For the importance of the manufacturing of mechanical components in automotiveapplications, we specifically examine the topic of the management of tools used inmechanical machining.
• Precise stamping technologies for steel componentsThey are subject to fast consumption and are key determinant factors for‘‘process capability’’ and economic savings: dies and tools specific for forgingand for sintering-forging processes and dies for cold extrusion and form coinage.The precision of produced elements and the over-metal entity, necessary for thefinishing steps, depends on them.
The absence of structural (cracks, inclusions…) and geometric defects aredeterminant conditions for final product availability during functioning and forlimiting machining rejects.
Determinant factors for this purpose are:
• steel conforming to technical specifications and absence of defects due tolamination and rolling processes;
• correct shearing of slugs from profile bars (weight conformity, absence ofreworking);
• intrinsic ‘‘process capability’’ in the stamping process, resulting from processcontinuity and matrix/die management.
5.6 Tools and Consumables Management 135
Let us deeply examine the technical aspects of dies:
1. Building designs are studied with accuracy, simulating forming processes andoptimizing step by step phases through the application of CAD/CAE techniquesand using materials with high structural and superficial resistance.
2. Die substitution is planned to prevent defects, searching for a more appropriateintervention frequency to assure the necessary level of ‘‘process capability’’,with the minimum industrial cost. Equipment technical availability (A) isgreatly influenced by the life length of matrix dies and by the continuity andregularity of the productive process. Particularly important for forging pro-cesses are: temperature control for incoming machined materials, optimaldeployment of progressive stamping phases. Particularly important for coldextrusion processes are: geometrical uniformity, heat treatment and regular sluglubrication, incoming in the stamping process.
3. Matrix die building should be localized near the stamping unit, because of thestrict correlation between the two processes. A die building centre includes:numeric control tool machines, programmable machine for electrical erosion,measuring tools with profile projection, heat treatment equipment for steel andPVD coating.
The correct technical management of processes and dies is determinant forassuring the final quality of these steel components, which are widely applied inthe ‘‘important’’ functional class for availability and safety of vehicles and pow-ertrain systems.
• Metal removal machining technologiesThis technological area covers all manufacturing activities of mechanicalcomponents. Technical management of tools, together with equipment main-tenance, is particularly important for the optimization of processes.
Let us review the following topics, considered essential for the technicalmanagement of cutting tools:
– Material and technologies for tools constructionThese are characterized from progressive innovations due to the introduction ofceramic coating (form tools), metal-ceramic composites (cutting inserts) andpoly-crystal composites with a polymeric matrix (abrasive tools). The increaseof economic cutting speed, obtainable through these innovative materials,allows for improving the productivity of machining systems dedicated to themechanical components of powertrains and space frames.
– Construction characteristics of standard tools and tool-carriersThe evolution of solutions for cutting materials has occurred simultaneous toresearch for suitable configurations for detaching and breaking chips, drymachining and operations for the fast retooling of insert tools.It is to be emphasized that materials used for form and cutting tools are used indifferent applications, in relation to working speed and the economic life length
136 5 Manufacturing System Management and Maintenance Criteria
of cutting tools: super-rapid steels allow for lower cutting speed, even if they arevery resistant to shocks and, for this reason, are convenient for roughing andsemi-finishing. Ceramic coated tools (Al2O3, Si3N4…) have a high cost per unit,but allow for higher cutting speeds at economical working conditions. Finally,poly-crystalline tools (PCD and CBN) are particularly expensive, but allow forreaching very high cutting speeds, with a contained power supply, so as togenerate precise super-finishing.Analysis of applications is based on experimental techniques and research foroptimal parameters for economic efficiency, comparing benefits emerging fromspeed-up of the working cycle to a higher incidence of technical stoppage fortool change. This technical–economic analysis leads to the definition of optimalconditions for minimizing working cost, considering the following parametersand cost factors:
• theoretic productive capacity, equivalent to the system’s hourly virtual pro-duction (HVP)
• incidence of technical stoppage for tool change, influencing process inactivity(pu)
• expenses due to tool consumption and maintenance.The above parameters have been defined in Chap. 3.
– Construction characteristics of form specific toolsThese include evolving profile makers, broaches for the enlargement of shapedholes, diametric high precise enlarger, grindstones and relative revitalizingdevices.
With the evolution of applied materials, construction techniques for tools havealso improved and higher levels of quality and lower costs have been reached.
Considering the above technical aspects, for effective tool management, thefollowing rules are to be observed:
1. Set-up and managing of pre-setting activities, consisting of preparing the toolcarrier outside of the machine, adjusting the inserts precisely and verifyinggeometric positions of the cutting tools, in relation to cutting directions.
2. Set-up and management of tool regeneration, including sharpening of inte-gral cutting inserts, regeneration and dynamic equilibration of grindstones…
3. Organization of tool changes, according to pre-defined programs, that con-sider life length of tools, evaluated on a statistical basis, for advance inter-vention in spite of critical consumption limits; simultaneous interventions onmore tools in the same machining unit are generally organized to shorten ‘‘set-up-time’’, searching for the best convenience point for substitution frequencyand way of intervention, to increase technical availability and decrease workingcosts of the systems.
4. Controlling quality in acceptance and focusing the choosing process of toolsuppliers. For this purpose, statistical control methodologies are applied andperformances are evaluated in relation to purchasing costs.
5.6 Tools and Consumables Management 137
5. Adopting more convenient lubricant and coolant fluids, to improve toolefficiency and technical life, also considering regeneration needs and costsderived from recycling and exhaustion of consumable liquids.
6. Optimizing working speed and tool consumption. This activity requiresteamwork, involving more job specializations: manufacturing engineeringexperts, tool machine specialists, tool specialists, and those responsible forproductive units.
Let us conclude the topic of tool management, underlining that we have dealtwith mechanical machining in more detail owing to the greater implications of thisaspect. We must say that, for other technological areas, the criteria are almost thesame. From the relevance that assumes in automotive applications, we alsomention the following types of tools and consumables subject to high usury:
• resistance welding electrodes, which highly influence qualitative levels andefficiencies in spaceframe and body assembling systems;
• filling materials, powered by welding wire for arc and/or braze-laser welding(above considerations are almost true);
• special steel insert and hard league filling materials, applied on die parts subjectto consumption, which highly influence quality levels and transformation costsin sheet metal printing and die casting processes.
5.7 ‘‘Total Productive Maintenance’’ Approach
Before concluding this chapter, it is useful to remember the organizationalapproach for maintenance activities known as ‘‘Total Productive Maintenance’’(TPM). Its historical origins begin in 1960, when major Japanese industries,determined to compete on a worldwide market, understood that they had toimprove the quality of their products dramatically; one of the weakest points wasthe management of plant technical systems maintenance and, to improve in thisregard, they adopted a benchmarking method taken from the United States ofAmerica; the concept of ‘‘preventive maintenance’’, naturally adjusted to a Japa-nese approach and also considering the increasing level of automation in theproduction processes, became one of the key strategic factors of success of theJapanese industrial model.
Once more, we find Toyota to be the main applicant of this approach that waslater, during the 1970s, also adopted by other Japanese enterprises. TPM approachcombines professional and autonomous maintenance activities to improve equip-ment efficiency and establish a total productive maintenance system through theadoption of techniques based on the continuous improvement (kobetsu kaizen)methodology that we will look at in Chap. 8.
138 5 Manufacturing System Management and Maintenance Criteria
This method gave production managers the responsibility of improving PlantTechnical Systems constantly, putting the human factor at the centre of attention.The TPM acronym stands for:
• Total, because it actively involves all employees working in the industrialprocesses (from production to maintenance, quality and supply chain) in theimprovement of equipment efficiency.
• Productive, because the target is the continuous improvement of ‘‘manufac-turing systems’’.
• Maintenance, because the goal is to maintain efficiency and effectiveness ofthe equipment during use.
TPM is oriented to the ‘‘excellence’’ of production processes and the ambitioustarget of zero breakdowns. For this purpose, some technical-managerial topics aresystematically approached, such as:
• improving working cycle in every phase, to speed-up, stabilize and make morecontinuous the production flow in every stage;
• improving the Overall Equipment Efficiency (OEE), increasing the availableproduction capacity;
• developing techniques for preventive maintenance, assuring its applicationduring the entire system cycle;
• developing a full interfunctional integration between Product Engineering andProcess Engineering, Manufacturing, Maintenance and Quality Departments;
• obtaining the involvement of all workers in the productive and maintenanceprocess, to optimize functioning costs (minimum indirect labour, minimumconsumption of consumables and energy, maximum utilization of investments);
• improving safety in utilization of equipment;• reducing safety stocks between the equipment;• promoting continuous improvement initiatives for increase in quality and pro-
ductivity through ‘‘teamwork’’ oriented to a ‘‘problem-solving’’ approach.
In Chap. 8, we will see that the TPM approach, together with those of TotalQuality Management (TQM), Total Industrial Engineering (TIE) and Just in Time(JIT), are the main pillars for a competitive ‘‘Production System’’, referring to theToyota model. In the 1990s, many western enterprises began to study the ToyotaProduction System as an ideal benchmark.
5.7 ‘‘Total Productive Maintenance’’ Approach 139
Chapter 6Logistics and Supply Chain Basicsfor Automotive Application
6.1 Historical Evolution of Logistics and Actual Strategies
Logistics started with military applications, as a function for supplying materialand equipment necessary for war missions, getting them to the right place at theright time for an operation’s success, and assuring a connection between the frontand back lines of the army. In ancient history, the Roman Empire succeeded inextending and protecting its extended borders for a long period of time thanks toadvanced military logistic organization, with the ability to transmit informationand move legions very quickly for that time.
In modern history, at the beginning of the Nineteenth century, NapoleonBonaparte rediscovered the importance of strategic Logistics, making it a veryimportant pillar in the organizational structure of his army. As a consequence, allof the top military academies introduced Logistics into their war sciencedepartments.
Still focusing on military applications, it is very interesting to observe the waylogistic efficiency was a determinant in the final result of the Second World War.This is particularly evident in the disembarkation of Anglo-American forces atNormandy, the utilization of American Navy fighting planes through aircraftcarriers in Pacific battles, and the ability to encode radio-transmitted messageswhile decoding those of the enemy. These strategic-logistic prerogatives of theAnglo-American forces made it possible to outmaneuver German and Japanesearmies, despite the latter being superior in combat.
In civil applications, Logistics only assumed an important role beginning in1960, in particular for public transportation and the delivery of goods. Onlythrough the application of suitable logistic and information technology systems hasit been possible to develop major airports and harbors. In the same way, anenterprise’s success in major distribution of goods has been a consequence of theapplication of effective logistic systems.
In industrial manufacturing applications, the ‘‘automotive industry’’ has beenthe first to develop logistic and information technology systems to manage:
M. Gobetto, Operations Management in Automotive Industries,Springer Series in Advanced Manufacturing, DOI: 10.1007/978-94-007-7593-0_6,� Springer Science+Business Media Dordrecht 2014
141

• numerous and technologically complex products;• production activities at more plants, linked together through multi-purpose
transport systems;• sales and after sales branched networks, geared towards guaranteeing good
service.
Let us take a look at the main historical periods in which the most significantchanges for logistic systems occurred in the automotive industry.
6.1.1 1925–1975: Logistics as ‘‘Material Management’’Support
Through the ‘‘products diversification and production activities delocalization’’policy adopted by A.P. Sloan in the United States during the ’20s, ‘‘materialmanagement’’ had to approach more complex problems, compared to those of theprevious era. ‘‘Material handling’’ studies were placed beside manufacturingengineering studies of a Tayloristic origin. Means of transport were defined on astandard basis, as were the equipment and buildings dedicated to inventory andmaterial handling.
During the ‘60s, logistic processes improved principally for second generationinformation technology systems, developed by specialized companies begun inNorth America and grown worldwide (IBM, HP…). Data electronic elaborationallowed for sped up planning and control processes. Nevertheless, at the time,transmission networks were still based on analogic techniques and did not allowfor the exchange of real time information.
Manufacturing systems operate at a high rhythm, but are not flexible;changeover requires long ‘‘set-up-time’’. Production is normally set by economicbatches, and the logistic process assures continuity of production only throughhigh levels of stock and long lead time at the plant level. The work in progressincludes a significant portion of the financial resources and there is still consid-erable inertia in answering commercial variation requests.
This logistic model was revealed to be inadequate when two important oil crisesoccurred in 1973 and 1979, reflecting negatively on market trends and transportcosts and generating high demand instability. Furthermore, an increase in oil andenergy costs resulted in severe consequences for inflation, the consequent costincreases obliging carmakers to reduce their working capital dramatically.
Top-management realized they would need to reform logistic processes deeplyand turn to organizational consultancy specializing in the introduction of newsystems, especially for the purpose of overcoming internal resistance to changes inmanagement.
142 6 Logistics and Supply Chain Basics for Automotive Application
6.1.2 1975–1990: Logistics Oriented to ‘‘Time-to-Market’’and ‘‘Commercial Network Service’’
During the second half of the ‘70s, ‘‘New Generation’s Information TechnologiesSystems’’ became available; these systems had applied software models, specifi-cally developed for the planning of operations and management of supply pro-cesses (Product Data Management systems, Material Requirement Planning…).Big Information Technology Enterprises offered interesting and convenient solu-tions for investments with an advantage breakeven point, thanks to a reduction inpeople employed in data collection and input processes, paper reports consultingprocesses, and so on. With automation, the availability of logistic processes alsoincreased and production flows were under control in real time, especially with theintroduction of ‘‘PC-based’’ peripheral information technology systems.
At the same time in Japan, Taiichi Ohno of Toyota was introducing a visualmanagement system for material supply, which worked in a kind of pull logic forapplication of the Just in Time principle called ‘‘kan-ban’’ (tag), a simple andeffective method, as seen in the section on basic concepts.
Productive flow organization is definitively oriented to a pull logic, especiallyfor final assembly of cars and big components. Production is based more oncustomer orders than on forecasts.
Nevertheless, with WEB networks still not widely spread out, it was not pos-sible to extend information technology systems along the ‘‘supply chain’’, oper-ating interactively and with direct connection to the dealer’s network. So, duringthe ’80s, logistic processes improved at the plant and delivery levels, but pro-duction and material supply planning was still performed in cascade along thesupply chain, with a monthly re-order system. At any rate, production flowappeared leaner compared to the past, and lead times in reacting to customerdemand changes were shorter, also thanks to the diffusion of programmablemanufacturing systems (numeric control machines, robots…).
It is important to consider that, even in this historical period, ‘‘time to market’’and ‘‘customer service levels’’ were recognized as strategic factors for an enter-prise’s success. Logistics focused on these new important targets.
6.1.3 Actual period: Logistics as an ‘‘Integrated Process’’to Support ‘‘Supply Chain Management’’
As seen in Chap. 1, major ‘‘carmakers’’ adopt product strategies based on theconcept of a ‘‘world car’’, with ‘‘global sourcing’’ purchasing policies (that we willanalyse in Chap. 7). Many industrial co-operations through ‘‘co-makership’’ aresigned between makers of powertrain systems and carmakers. So, it becomes veryimportant to connect the different worldwide productive sites through an integratedinformation technology system, assuring homogeneous product from a technical
6.1 Historical Evolution of Logistics and Actual Strategies 143
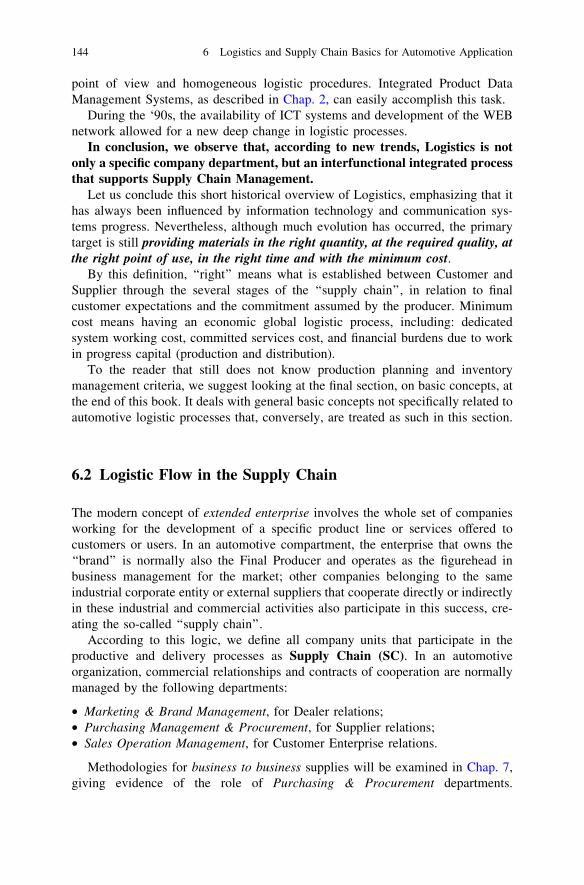
point of view and homogeneous logistic procedures. Integrated Product DataManagement Systems, as described in Chap. 2, can easily accomplish this task.
During the ‘90s, the availability of ICT systems and development of the WEBnetwork allowed for a new deep change in logistic processes.
In conclusion, we observe that, according to new trends, Logistics is notonly a specific company department, but an interfunctional integrated processthat supports Supply Chain Management.
Let us conclude this short historical overview of Logistics, emphasizing that ithas always been influenced by information technology and communication sys-tems progress. Nevertheless, although much evolution has occurred, the primarytarget is still providing materials in the right quantity, at the required quality, atthe right point of use, in the right time and with the minimum cost.
By this definition, ‘‘right’’ means what is established between Customer andSupplier through the several stages of the ‘‘supply chain’’, in relation to finalcustomer expectations and the commitment assumed by the producer. Minimumcost means having an economic global logistic process, including: dedicatedsystem working cost, committed services cost, and financial burdens due to workin progress capital (production and distribution).
To the reader that still does not know production planning and inventorymanagement criteria, we suggest looking at the final section, on basic concepts, atthe end of this book. It deals with general basic concepts not specifically related toautomotive logistic processes that, conversely, are treated as such in this section.
6.2 Logistic Flow in the Supply Chain
The modern concept of extended enterprise involves the whole set of companiesworking for the development of a specific product line or services offered tocustomers or users. In an automotive compartment, the enterprise that owns the‘‘brand’’ is normally also the Final Producer and operates as the figurehead inbusiness management for the market; other companies belonging to the sameindustrial corporate entity or external suppliers that cooperate directly or indirectlyin these industrial and commercial activities also participate in this success, cre-ating the so-called ‘‘supply chain’’.
According to this logic, we define all company units that participate in theproductive and delivery processes as Supply Chain (SC). In an automotiveorganization, commercial relationships and contracts of cooperation are normallymanaged by the following departments:
• Marketing & Brand Management, for Dealer relations;• Purchasing Management & Procurement, for Supplier relations;• Sales Operation Management, for Customer Enterprise relations.
Methodologies for business to business supplies will be examined in Chap. 7,giving evidence of the role of Purchasing & Procurement departments.
144 6 Logistics and Supply Chain Basics for Automotive Application
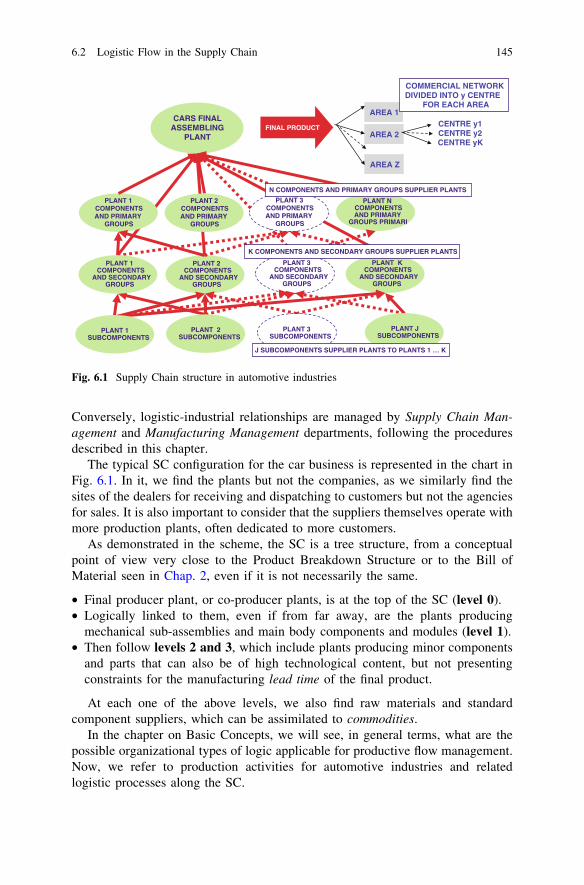
Conversely, logistic-industrial relationships are managed by Supply Chain Man-agement and Manufacturing Management departments, following the proceduresdescribed in this chapter.
The typical SC configuration for the car business is represented in the chart inFig. 6.1. In it, we find the plants but not the companies, as we similarly find thesites of the dealers for receiving and dispatching to customers but not the agenciesfor sales. It is also important to consider that the suppliers themselves operate withmore production plants, often dedicated to more customers.
As demonstrated in the scheme, the SC is a tree structure, from a conceptualpoint of view very close to the Product Breakdown Structure or to the Bill ofMaterial seen in Chap. 2, even if it is not necessarily the same.
• Final producer plant, or co-producer plants, is at the top of the SC (level 0).• Logically linked to them, even if from far away, are the plants producing
mechanical sub-assemblies and main body components and modules (level 1).• Then follow levels 2 and 3, which include plants producing minor components
and parts that can also be of high technological content, but not presentingconstraints for the manufacturing lead time of the final product.
At each one of the above levels, we also find raw materials and standardcomponent suppliers, which can be assimilated to commodities.
In the chapter on Basic Concepts, we will see, in general terms, what are thepossible organizational types of logic applicable for productive flow management.Now, we refer to production activities for automotive industries and relatedlogistic processes along the SC.
CARS FINAL ASSEMBLING
PLANT
PLANT N COMPONENTS AND PRIMARY
GROUPS PRIMARI
FINAL PRODUCT
PLANT 2 COMPONENTS
AND SECONDARY GROUPS
PLANT K COMPONENTS
AND SECONDARY GROUPS
PLANT 3 COMPONENTS
AND SECONDARY GROUPS
AREA 1
AREA 2
AREA Z
COMMERCIAL NETWORK DIVIDED INTO y CENTRE
FOR EACH AREA
CENTRE y1CENTRE y2CENTRE yK
PLANT 2 COMPONENTS AND PRIMARY
GROUPS
PLANT 1 COMPONENTS AND PRIMARY
GROUPS
PLANT 1 SUBCOMPONENTS
PLANT 2 SUBCOMPONENTS
PLANT 3 SUBCOMPONENTS
PLANT J SUBCOMPONENTS
J SUBCOMPONENTS SUPPLIER PLANTS TO PLANTS 1 … K
PLANT 1 COMPONENTS
AND SECONDARY GROUPS
K COMPONENTS AND SECONDARY GROUPS SUPPLIER PLANTS
PLANT 3 COMPONENTS AND PRIMARY
GROUPS
N COMPONENTS AND PRIMARY GROUPS SUPPLIER PLANTS
Fig. 6.1 Supply Chain structure in automotive industries
6.2 Logistic Flow in the Supply Chain 145
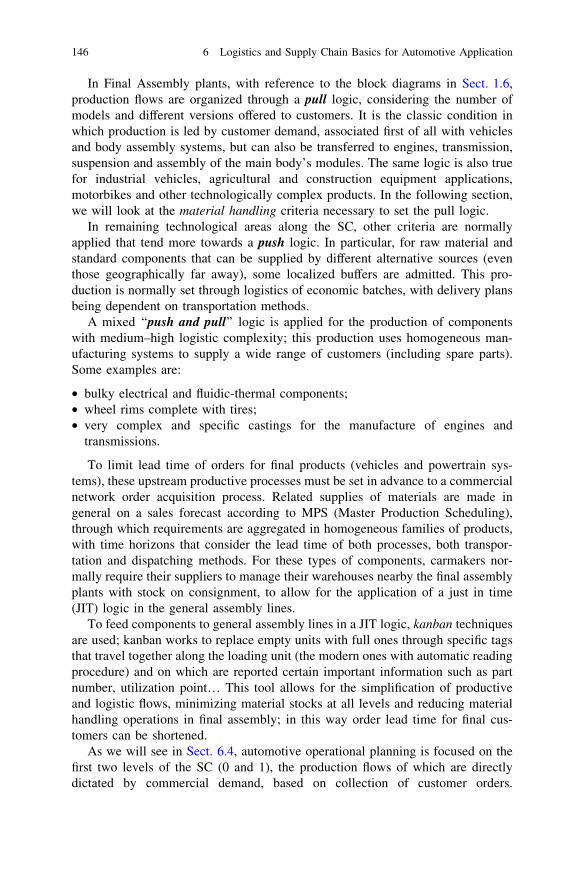
In Final Assembly plants, with reference to the block diagrams in Sect. 1.6,production flows are organized through a pull logic, considering the number ofmodels and different versions offered to customers. It is the classic condition inwhich production is led by customer demand, associated first of all with vehiclesand body assembly systems, but can also be transferred to engines, transmission,suspension and assembly of the main body’s modules. The same logic is also truefor industrial vehicles, agricultural and construction equipment applications,motorbikes and other technologically complex products. In the following section,we will look at the material handling criteria necessary to set the pull logic.
In remaining technological areas along the SC, other criteria are normallyapplied that tend more towards a push logic. In particular, for raw material andstandard components that can be supplied by different alternative sources (eventhose geographically far away), some localized buffers are admitted. This pro-duction is normally set through logistics of economic batches, with delivery plansbeing dependent on transportation methods.
A mixed ‘‘push and pull’’ logic is applied for the production of componentswith medium–high logistic complexity; this production uses homogeneous man-ufacturing systems to supply a wide range of customers (including spare parts).Some examples are:
• bulky electrical and fluidic-thermal components;• wheel rims complete with tires;• very complex and specific castings for the manufacture of engines and
transmissions.
To limit lead time of orders for final products (vehicles and powertrain sys-tems), these upstream productive processes must be set in advance to a commercialnetwork order acquisition process. Related supplies of materials are made ingeneral on a sales forecast according to MPS (Master Production Scheduling),through which requirements are aggregated in homogeneous families of products,with time horizons that consider the lead time of both processes, both transpor-tation and dispatching methods. For these types of components, carmakers nor-mally require their suppliers to manage their warehouses nearby the final assemblyplants with stock on consignment, to allow for the application of a just in time(JIT) logic in the general assembly lines.
To feed components to general assembly lines in a JIT logic, kanban techniquesare used; kanban works to replace empty units with full ones through specific tagsthat travel together along the loading unit (the modern ones with automatic readingprocedure) and on which are reported certain important information such as partnumber, utilization point… This tool allows for the simplification of productiveand logistic flows, minimizing material stocks at all levels and reducing materialhandling operations in final assembly; in this way order lead time for final cus-tomers can be shortened.
As we will see in Sect. 6.4, automotive operational planning is focused on thefirst two levels of the SC (0 and 1), the production flows of which are directlydictated by commercial demand, based on collection of customer orders.
146 6 Logistics and Supply Chain Basics for Automotive Application
Nevertheless, the logistic process also invests the other levels of the SC andincludes the following macro flows:
• Physical Flow
This begins with raw material supply, crosses all stages of transformation alongthe SC, and also includes stocking and handling phases up to final assembly andfinal testing of vehicles, from which follows commercial dispatching anddistribution.
Speeding up physical flow allows for the quick answering of customer demandand short order lead time.
• Information Flow
This goes in the opposite direction of physical flow, starting from customerdemand to suppliers through different stages of the Master Production Scheduling(MPS), the Material Requirement Planning (MRP) and the Production Scheduling(scheduling), up to the dispatching of goods (dispatching).
Information flow allows for constant planning and controlling of the progress ofproduction and delivery, at every stage of SC.
• Financial Flows
This is a consequence of physical flow and is evaluated based on data detectedfrom the information flow at every delivery point incoming and outgoing at thedifferent stages of the SC. Direct materials are transformed and aggregated, pro-gressively adding value, up to product completion and customer delivery.
It is fundamental to observe that, under the same economic conditions (pur-chasing prices, transformation costs), working capital reduces in inverse propor-tion to physical flow speed Fig. 6.2.
CUSTOMERSTRANSFORMATION IN COMPANY’S PLANTS
information flow
physical flow
financial flow
DIRECT MATERIAL SUPPLY PROCESS FROM SUPPLIER’S PLANTS
FINALPRODUCT DISPATCHING TO COMMERCIAL NETWORK (DEALERS)
Fig. 6.2 The three main flows of logistics
6.2 Logistic Flow in the Supply Chain 147
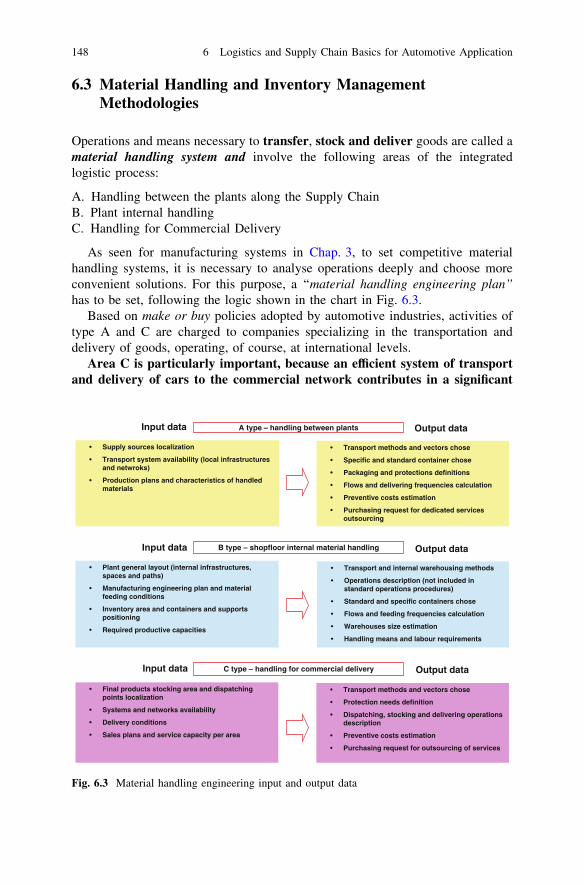
6.3 Material Handling and Inventory ManagementMethodologies
Operations and means necessary to transfer, stock and deliver goods are called amaterial handling system and involve the following areas of the integratedlogistic process:
A. Handling between the plants along the Supply ChainB. Plant internal handlingC. Handling for Commercial Delivery
As seen for manufacturing systems in Chap. 3, to set competitive materialhandling systems, it is necessary to analyse operations deeply and choose moreconvenient solutions. For this purpose, a ‘‘material handling engineering plan’’has to be set, following the logic shown in the chart in Fig. 6.3.
Based on make or buy policies adopted by automotive industries, activities oftype A and C are charged to companies specializing in the transportation anddelivery of goods, operating, of course, at international levels.
Area C is particularly important, because an efficient system of transportand delivery of cars to the commercial network contributes in a significant
Input data Output data
• Supply sources localization
• Transport system availability (local infrastructures and netwroks)
• Production plans and characteristics of handled materials
A type – handling between plants
• Transport methods and vectors chose
• Specific and standard container chose
• Packaging and protections definitions
• Flows and delivering frequencies calculation
• Preventive costs estimation
• Purchasing request for dedicated services outsourcing
• Plant general layout (internal infrastructures, spaces and paths)
• Manufacturing engineering plan and material feeding conditions
• Inventory area and containers and supports positioning
• Required productive capacities
B type – shopfloor internal material handling
• Transport and internal warehousing methods
• Operations description (not included in standard operations procedures)
• Standard and specific containers chose
• Flows and feeding frequencies calculation
• Warehouses size estimation
• Handling means and labour requirements
• Final products stocking area and dispatching points localization
• Systems and networks availability
• Delivery conditions
• Sales plans and service capacity per area
C type – handling for commercial delivery
• Transport methods and vectors chose
• Protection needs definition
• Dispatching, stocking and delivering operations description
• Preventive costs estimation
• Purchasing request for outsourcing of services
Input data Output data
Input data Output data
Fig. 6.3 Material handling engineering input and output data
148 6 Logistics and Supply Chain Basics for Automotive Application
way to reducing the lead time of orders. This area also includes operations ofsupply, stocking and delivery of spare parts necessary for after sales technicalassistance (important operations for the customer service level and for thecompany’s final net operative result).
Topics related to transport systems both external and internal to the shop floor(Areas A and C) are not addressed here. We note only that in the general layoutdesign of a plant, qualitative and quantitative incoming material and outgoingproduct flows are estimated. As a consequence, infrastructures necessary forconnecting the plant to suppliers and commercial networks are considered.
Now, we focus on the internal handling operations (Area B), which are typi-cally managed by the factories, with rare exceptions. Material handling engi-neering is oriented towards searching for the best compromise between the twofollowing opposing needs:
• full utilization of transport vectors operating in Area A, to minimize workingcosts;
• high frequency for feeding of production line, to operate with a lean flowaccording to ‘‘just in time’’.
For this purpose, the criteria for choosing transport means and calculating loadsizes are:
(1) aggregating parts in container elements, calculating the size of loading units,so that they are transferable under safe conditions by using normal means ofhandling, maintaining the same configuration during all handling operationsalong the logistic process and allocating containers directly at utilizationpoints;
(2) choosing types of containers that will assure protection of goods and makewithdrawal and warehousing easier, according to standard operation instruc-tions and;
(3) organizing delivery batches by joining more loading units, so that transportvectors can be well used, even through mixed deliveries (more elementdesigns, collected and delivered according to planned transport paths).
Obviously, the size of the transported load for each mission will determine howlow the cost of the transported unit will be, without considering other factors.
Handling systems used to feed direct materials into the productive process canbe classified as:
1. Supports/Primary Containers, which sustain parts and group them togetherboth in the transferal and warehousing phases; they are studied to save spaceand can be divided into the following types:
• standard pallet, on which the single parts or secondary containers are placedon top (if necessary, blocked for safety reasons through specific packagingsolutions);
• standard containers with fixed sides (bud), with more layers of parts andeventual protective separators;
6.3 Material Handling and Inventory Management Methodologies 149
• special containers with collapsing sides, with intermediate layers engineeredfor positioning of parts.
These supports are of a standard modular shape and can be handled by forkliftand stocked one on top of the other to save space in the warehouse. They are builtof steel plate and are strong enough to be used and re-used over a long period oftime and a wide range of transportation. Conversely, pre-printed inserts are spe-cific (normally built in reinforced resin), used for protecting elements from shocksand collision during handling.
For smaller elements, secondary containers are used (bins, standard or specificbaskets), able to be handled manually and put on the standard pallets. Wherenecessary, protective films or recycling plastics or cartons, the utilization of whichgenerates cost for exhaustion, are used for packaging.
Special containers with movable sides are subject to time-based maintenance,because deterioration can generate severe quality defects in the productionprocess.
It is necessary to check incoming and outgoing flows for each of the aboverecyclable supports, at every stage of the SC, to equilibrate interchangeability andfinalize destinations.
2. Big containers, accessible through forklifts, inside of which are the above-mentioned primary containers, composing the loading unit.
These are universally used, both for multiple trans-boarding on transportationplatforms or outdoor warehousing on factory loading docks.
3. Internal transport vectors, used for transfer of loads and elements, inside theplants, which can be classified in relation to the different ways of driving:
• manual vectors, such as: vehicles, small ro–ro carts, trans-elevator carts,trans-elevator equipment with fixed structures (cranes, hoist, …);
• automatic vectors, such as: continuous or power and free electro-mechanicaltransport systems, auto-motors cart with monorail or guided on floor tracks,programmed trans-elevator equipment, handling robot…
We will refer now specifically to final assembly lines for vehicles andmechanical groups, characterized by a high logistic complexity. Supply flow mustcorrespond to the operative speed of the productive process, which is the hourlyvirtual productivity HVP, referring to each assembled component (k) and to therelative utilization coefficient (u), according to the bill of material.
Even though the decision as to the flow of all components/material to be fedinto the general assembly line is one of the key activities in affording the successof a lean manufacturing system, we need first to clarify the concept of logisticcomplexity and a first important output that results from it.
We have already stated in Chap. 2 how technologically complex a vehicle is,referring to the bill of material, and in that section, we noted that this importantdocument is also used to manage the material requirement planning process thatwe will approach later on in more detail. In a bill of material for mass production
150 6 Logistics and Supply Chain Basics for Automotive Application
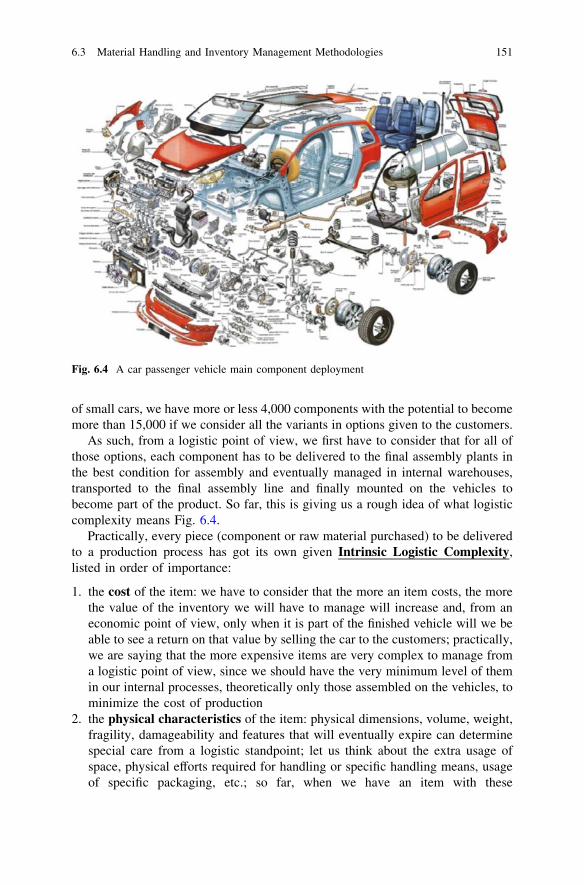
of small cars, we have more or less 4,000 components with the potential to becomemore than 15,000 if we consider all the variants in options given to the customers.
As such, from a logistic point of view, we first have to consider that for all ofthose options, each component has to be delivered to the final assembly plants inthe best condition for assembly and eventually managed in internal warehouses,transported to the final assembly line and finally mounted on the vehicles tobecome part of the product. So far, this is giving us a rough idea of what logisticcomplexity means Fig. 6.4.
Practically, every piece (component or raw material purchased) to be deliveredto a production process has got its own given Intrinsic Logistic Complexity,listed in order of importance:
1. the cost of the item: we have to consider that the more an item costs, the morethe value of the inventory we will have to manage will increase and, from aneconomic point of view, only when it is part of the finished vehicle will we beable to see a return on that value by selling the car to the customers; practically,we are saying that the more expensive items are very complex to manage froma logistic point of view, since we should have the very minimum level of themin our internal processes, theoretically only those assembled on the vehicles, tominimize the cost of production
2. the physical characteristics of the item: physical dimensions, volume, weight,fragility, damageability and features that will eventually expire can determinespecial care from a logistic standpoint; let us think about the extra usage ofspace, physical efforts required for handling or specific handling means, usageof specific packaging, etc.; so far, when we have an item with these
Fig. 6.4 A car passenger vehicle main component deployment
6.3 Material Handling and Inventory Management Methodologies 151
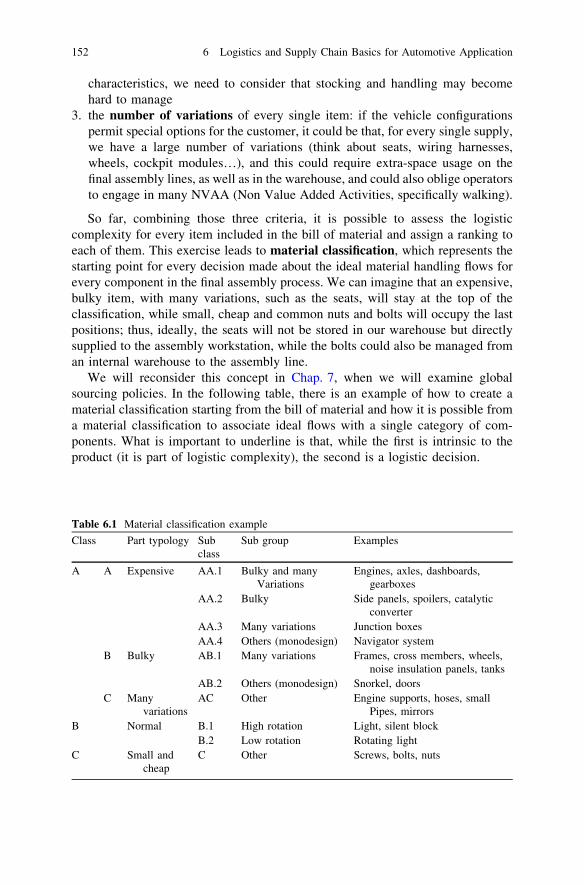
characteristics, we need to consider that stocking and handling may becomehard to manage
3. the number of variations of every single item: if the vehicle configurationspermit special options for the customer, it could be that, for every single supply,we have a large number of variations (think about seats, wiring harnesses,wheels, cockpit modules…), and this could require extra-space usage on thefinal assembly lines, as well as in the warehouse, and could also oblige operatorsto engage in many NVAA (Non Value Added Activities, specifically walking).
So far, combining those three criteria, it is possible to assess the logisticcomplexity for every item included in the bill of material and assign a ranking toeach of them. This exercise leads to material classification, which represents thestarting point for every decision made about the ideal material handling flows forevery component in the final assembly process. We can imagine that an expensive,bulky item, with many variations, such as the seats, will stay at the top of theclassification, while small, cheap and common nuts and bolts will occupy the lastpositions; thus, ideally, the seats will not be stored in our warehouse but directlysupplied to the assembly workstation, while the bolts could also be managed froman internal warehouse to the assembly line.
We will reconsider this concept in Chap. 7, when we will examine globalsourcing policies. In the following table, there is an example of how to create amaterial classification starting from the bill of material and how it is possible froma material classification to associate ideal flows with a single category of com-ponents. What is important to underline is that, while the first is intrinsic to theproduct (it is part of logistic complexity), the second is a logistic decision.
Table 6.1 Material classification example
Class Part typology Subclass
Sub group Examples
A A Expensive AA.1 Bulky and manyVariations
Engines, axles, dashboards,gearboxes
AA.2 Bulky Side panels, spoilers, catalyticconverter
AA.3 Many variations Junction boxesAA.4 Others (monodesign) Navigator system
B Bulky AB.1 Many variations Frames, cross members, wheels,noise insulation panels, tanks
AB.2 Others (monodesign) Snorkel, doorsC Many
variationsAC Other Engine supports, hoses, small
Pipes, mirrorsB Normal B.1 High rotation Light, silent block
B.2 Low rotation Rotating lightC Small and
cheapC Other Screws, bolts, nuts
152 6 Logistics and Supply Chain Basics for Automotive Application
In the example of material classification displayed in Table 6.1, starting fromthe cost criteria and going through the other two, each item of the bill of materialcan be assessed and linked first to a specific class and then to a sub-class. Once wehave identified all classes and sub-classes, it is possible to identify an ideal way ofdelivering the specific sub-classes to the line in order to follow the main guidelinesfor internal handling:
• In sequence flow• Direct Flow: Just in Time by use of kanban card systems• Indirect Flow: feeding from internal buffers or warehouses.
For concerns of external handling, a good match between the ideal deliveryflow and the supplier’s geographical location will depend mostly on the globalsourcing policies adopted by the company, a job for the Purchasing Department incollaboration with Logistics and the Supply Chain. This aspect will be examined inmore detail in Chap. 7.
Once we know the ideal policies for feeding parts and components to theprocess, we have to determine the proper handling unit (the quantity of elements/goods we have to handle during a single handling) and the feeding frequency ofeach of them. For each element k (expressed in number of missions per hour), thefrequency is determined by the ratio:
FFk = (u � HVP)k/Uk, where Uk is the number of elements included in thehandling unit.
The calculation of Uk should be consistent with the withdrawal condition ofspaces and elements as foreseen in the technological layout.
The number of transport missions necessary to feed the manufacturing sys-tems with continuity, within a certain period of working time (working shift,week…), corresponds to:
OEE � FFk � PWT/N, where:PWT is the system’s planned working time (hours)OEE is the system’s overall equipment efficiencyN is the number of handling units transported simultaneously, in relation to
the capacity of carriers employed and the composition of transport ofeconomic batches.
Criteria applied for inventory management corresponds to the logisticsmentioned in the section on ‘‘basic concepts’’ at the end of this book (deterministicand stochastic/probability methods).
For this, it is fundamental to distinguish the utilization of intermediate stocks inthe productive process:
(a) stocks necessary for production by batches, the management of which is basedon economic batch or minimum sustainable batch policies, according to whatis laid out in the section on ‘‘basic concepts’’;
(b) stocks necessary to make two independent process stages, for compensatingfor differences in flow speed and limit interferences due to technical failures(first-in/first-out dynamic warehouses, known as dynamic buffers);
6.3 Material Handling and Inventory Management Methodologies 153
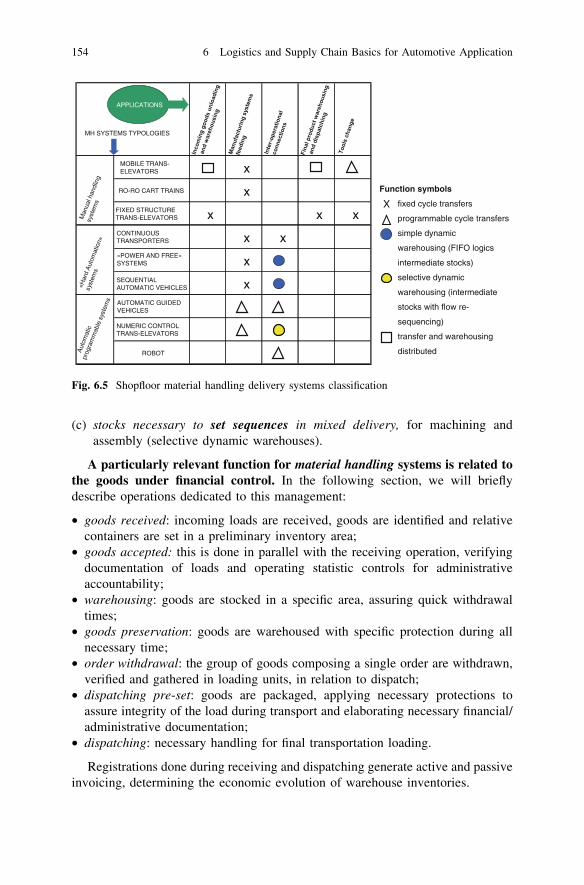
(c) stocks necessary to set sequences in mixed delivery, for machining andassembly (selective dynamic warehouses).
A particularly relevant function for material handling systems is related tothe goods under financial control. In the following section, we will brieflydescribe operations dedicated to this management:
• goods received: incoming loads are received, goods are identified and relativecontainers are set in a preliminary inventory area;
• goods accepted: this is done in parallel with the receiving operation, verifyingdocumentation of loads and operating statistic controls for administrativeaccountability;
• warehousing: goods are stocked in a specific area, assuring quick withdrawaltimes;
• goods preservation: goods are warehoused with specific protection during allnecessary time;
• order withdrawal: the group of goods composing a single order are withdrawn,verified and gathered in loading units, in relation to dispatch;
• dispatching pre-set: goods are packaged, applying necessary protections toassure integrity of the load during transport and elaborating necessary financial/administrative documentation;
• dispatching: necessary handling for final transportation loading.
Registrations done during receiving and dispatching generate active and passiveinvoicing, determining the economic evolution of warehouse inventories.
X
Function symbols
fixed cycle transfers
programmable cycle transfers
simple dynamic
warehousing (FIFO logics
intermediate stocks)
selective dynamic
warehousing (intermediate
stocks with flow re-
sequencing)
transfer and warehousing
distributed
MOBILE TRANS-ELEVATORS x
RO-RO CART TRAINS xFIXED STRUCTURE TRANS-ELEVATORS x x xCONTINUOUS TRANSPORTERS x x«POWER AND FREE» SYSTEMS xSEQUENTIAL AUTOMATIC VEHICLES xAUTOMATIC GUIDED VEHICLES
NUMERIC CONTROL TRANS-ELEVATORS
ROBOT
MH SYSTEMS TYPOLOGIES
APPLICATIONS
Fig. 6.5 Shopfloor material handling delivery systems classification
154 6 Logistics and Supply Chain Basics for Automotive Application
In Fig. 6.5, a resuming scheme for material handling systems on the shop flooris represented, in relation to logistic functions performed. Even if we don’t con-sider building characteristics for equipment (a specific topic of the IndustrialEquipment module), the chart matches material handling system typologies inevery application to the specific logistic function required in a matrix concept.
This scheme can be very useful for the setting-up of material handling systemson the shop floor.
We remember that, in Sect. 4.1, we considered the workers involved in ware-house handling (indirect labour) as auxiliary functions. The relative requirement isdetermined based on the frequency and length of material handling operations,also considering features of handling means used.
Total material handling cost, in the same integrated logistic process, includes:
1. dedicated labour cost, except that which is still included in standard operationdescriptions and accounted in the direct labour standard time (ST);
2. functioning cost of handling means, including depreciations;3. cost of dedicated information technology systems, including fees for func-
tioning and depreciations;4. consumables for packaging and cost of protection of goods;5. burdens derived from working capital of the logistic process.
During project setting and outsourcing of services, solutions should be soughtthat minimize the global cost mentioned above, considering the same functionalityof systems (productive and delivering capacity, attended service level…).
Considering the whole logistic process along the SC, including delivery tocommercial networks, the global cost for material handling generally ranges from6 to 9 % of final product cost (passenger cars and commercial vehicles). Itsincidence is relevant and should be controlled with rigour. It is obviously higherwhen production is far from the final products’ market destinations and when theinfrastructure of an area in which an enterprise operates is not suitable for thetransport of goods.
6.4 Production and Delivery Planning
Here we link to what was discussed in Chap. 1 on the topic of strategic planning.For automotive industries, information resulting from strategic planning is takenup again in the following documents of primary relevance for business:
• product range plan and its evolution in the medium-long term;• market mission and targets, referring to the different geographical areas and to
product lines considered strategic for business, in relation to a brand’s mission(market shares and sales forecast);
6.3 Material Handling and Inventory Management Methodologies 155
• industrial initiatives, delivered for development of new products and for settingnew production capacities needed, in relation to the above market targets andreturn of investments.
In Chaps. 2 and 3, we specifically examined the methodological criteria appliedfor developing new products and processes and new manufacturing systems atavailable productive sites, according to make or buy policies agreed to by thecompany.
Furthermore, to organize production and commercial delivery, a ‘‘medium termoperative plan’’ is needed, normally on a three year horizon, determining:
(1) a catalogue of products to be delivered to markets, with reference to technicalcontents and margin targets (sale prices, without considering the margins ofintermediaries);
(2) periods of product availability, with particular reference to launch plans fornew models;
(3) sales forecast for each model, considering all the types of engine and trans-mission and special versions requiring specific production capacity for toolconditioning.
To realize the necessary capacities for production (manufacturing systemdevelopment) and commercial considerations (sales network development) ontime, specific investment initiatives are run, following the methodological criteriamentioned in Sect. 3.1.
The above-mentioned medium term operative plan is normally updated on ayearly basis (preliminary to the budget), after some research cycles on demand andcompetitive scenarios to define operative solutions, subject to delivery by TopManagement. At the cycle of every year, working activity levels are updated forthe three years of horizon and, as a consequence, company resource requirementsare updated too (workforce, investments, purchasing needs).
Production and commercialization planning begins with the medium termoperative plan and becomes more defined in the short term in each production andcommercial department (month by month, week by week, day by day…) toestablish requirements. These obligations are for:
1. sales managers and intermediates, who are engaged in obtaining orders fromcustomers and delivering products on time;
2. plant managers, who are engaged in manufacturing products in the rightquantities at the right time;
3. supply chain managers, who are engaged in the punctual transfer of products tocommercial dispatching centres, including spare parts for after sales technicalassistance.
Before describing the elaboration process for the Operative Plan, hereinreferred to as the OP, we have to lay out a few facts:
156 6 Logistics and Supply Chain Basics for Automotive Application
• OP normally covers a temporal horizon of at least twelve months (some com-panies cover eighteen months, to have enough information for the annual budgetin advance);
• OP is updated monthly (rolling system), so as to introduce timely variations dueto market trends, sales results and eventual delays or anticipations in productdelivery;
• OP determines labour requirements, start of working time and monthly supplyplan for direct materials, according to MRP procedures;
• OP determines shop floor scheduling and relative supply frequencies per day/week for direct materials;
• OP determines lead times for delivery of final product to customers;• OP determines activity levels to be considered for annual budget and its revision
every three months.
To elaborate OP, we have to start from the available catalogue for sale products,month by month. This catalogue is, opportunely encoded, in correlation with thePDM system (see Chap. 2) and represents the product grid, because it defines andlinks in a matrix the following data related to vehicles sold:
• models and relative standard contents;• alternative solutions for engines and transmissions, eventually solutions for
4WD;• special solutions for space frame and body, also in relation to specific markets
(right hand drive, stronger suspension, cold country versions…).
For the cars, we can also distinguish:
• specific body versions derived from the basic model (2- or 4-doors, sportsversions, pick-up, wagon, open top…);
• special non-standard versions that are subject to temporal and quantity con-straints (special acclimatization solutions, automatic seats, special infosystems…);
• other specific versions not subject to specific quantity constraints (externalcolours, internal dressing, wheels, special tires…);
For commercial and multipurpose vehicles, more alternative versions areforeseen for the same basic model, such as: minibus, cabin van or multi van withdifferent size and wheel axle positions. Solutions for special use, subject to specificmanufacturing lead times, are offered as well because they are manufactured byexternal suppliers:
• special refrigerator vans, special tiltable vans…• special versions for transport or craft (military vehicles, ambulances, camper…);
The above shows the complexity of a product catalogue for cars, commercialand multipurpose vehicles, and that which customers can choose at order,obtaining engagement on delivery lead time.
6.4 Production and Delivery Planning 157
Both for total productive capacity, at a basic model level, and for capacityrelated to specific engines and more complex versions, there are some temporaland capacity constraints, as a consequence of investment plans and specific leadtimes. To test the feasibility of programs, it is necessary to aggregate sales fore-casts in this way, using the PDM system discussed in Chap. 2.
In Fig. 6.6, OP preparation flow is represented, beginning at commercialdemand, performing necessary feasibility tests and matching demand with an offer,up to defining the executive OP that generates manufacturing and delivery oper-ations of the final and intermediate products at every stage of the SC.
The OP cycle operates simultaneously on two different sides:
• the commercial side, towards the different market areas where company brandsare set;
• the industrial side, including final assembly plants and SC first level plants.
Coordination is made with the Supply Chain Department, who must match theevolving requirements coming from the commercial side with the evolving pro-ductive capacities offered from the industrial side; a more productive, more flexibleand faster system is the answer to required variations. At the end of these feasibilityverifications, production planning is aligned with commercial planning, attemptingto maintain a physiological level for the finished product stocks at the plant andcommercial network levels (the latter are normally charged to the dealers).
In Sects. 3.8 and 4.1, we saw how to adjust shop floor activity levels toaccommodate trends in market demand, setting extra work hours when demand is
FEASIBILITY
?
INDUSTRIAL CONFIRMATIONS
COMMERCIAL CONFIRMATIONS
EXECUTIVE CONFIRMED
OP
COMMERCIAL DISPATCHING
DEMAND
YES
CUSTOMER ORDERS
COLLECTION
NO NOCORRECTIVE
ACTIONS
PL
AN
TS
OR
DE
RS
DE
PL
OY
ME
NT
MA
RK
ET
S O
RD
ER
S D
EP
LO
YM
EN
T
PLANT’S EXECUTIVE PROGRAMS ALONG THE
SUPPLY CHAIN
REQUIRED DELIVERIES (NETWORK STOCKS
CONSIDERING)
OFFERED DELIVERIES (PLANT STOCK CONSIDERING)
AVAILABLE PRODUCTIVE CAPACITIES
SUPPLY CHAIN
FINAL ASSEMBLING PLANT
Area 1Area 2
Area 3MARKETS
CORRECTIVE ACTIONS
Fig. 6.6 Operative plan flow diagram
158 6 Logistics and Supply Chain Basics for Automotive Application
higher than productive capacity or reducing working time when demand is lower.With these types of countermeasures, we can:
• contain waiting times for customers within acceptable values;• avoid workforce unsaturation on the shop floor;• contain the stocks of finished vehicles produced according to forecasts but not
covered by customers’ orders, within acceptable limits from a financial point ofview.
The process of collecting and aggregating orders is coordinated from OperativeMarketing Management, who are also in charge of correcting eventual imbalancesbetween the market and single dealers. In this way, dispatch programs are bal-anced, transferring shares of demand from one market area to another, consideringconstraints due to different versions. In implementing these changes, it is importantto give priority to market areas and products with higher profitability.
To make commercial demand agree with productive capacity, it is necessary tojoin demands by basic model coming from different market areas (meaning bybody and vehicle assembly lines), and by engine and vehicle versions consideredmore difficult for manufacturing lead time.
The final document derived (recurrent monthly OP) distinguishes informationand obligations, in relation to the temporal horizon, N being the actual month:
(1) For the medium-long term, over N ? 6 months, predicted information focuseson basic models and engine families, joined according to logistics of theproduction lines. The mix of models and versions is estimated on a statisticalbasis, referring to the previous months or to a forecast made by dealers. Basedon these forecasts, productive capacities and resource requirements, for plantsand along the SC, are planned.
(2) For the medium-short term, from N ? 3 to N ? 6, predicted information ismore analytical and deals with bodies and specific space frame versions andconfigurations considered more difficult from a lead time point of view. As aconsequence, obligations for supply of less easily accessible components aretaken and required weekly working shifts are planned to correspond to themarket demand, assuring probable delivery time month by month.
(3) For the short term, from N ? 1 to N ? 2, information determines the pro-grams’ execution, because it derives from customers’ orders, and eventuallyintegrates with anonymous orders made by dealers at their own showrooms.Eventual deficiencies in specific orders or delays in the delivery of productpromised for month N or N ? 1 represent a severe failure for the logisticprocess of the company, because they can affect customer satisfaction leveland cause losses in the utilization of resources (overproduction and overstockat the plant). These failures should not occur (with the exception of raresituations), because the rolling logic of OP leads to a monthly alignment of theplan, considering commercial trends and eventual constraints coming out ofthe production and supply processes.
6.4 Production and Delivery Planning 159
In the scheme in Fig. 6.7, the operative planning process applied to productionand commercial delivery is summarized, distinguishing executive phases from thoseof setting and checking, necessary to set resources for adjusting ongoing programs.
Examining the phases shown above, it is evident that a core coordination is madethrough the Supply Chain, connecting dealers with final assembly plants to assurethe necessary information flow for managing delivery priorities for customers.
For shop floor scheduling, the methodological criteria shown in Chap. 3(machine/equipment loading evaluation) and Chap. 4 (workload assignment) areapplied.
Referring to Vehicle Final Assembly Plants, in the following section, we willdescribe information technology systems applied for the management of produc-tion flows.
6.5 Logistics’ Information Technology Systems
Methodologies described in the previous section require the utilization of moderninformation technology systems (ICT), with the application of software solutions,specifically developed and depending on company and process needs. Thesesystems operate on two different levels:
• Central Level: process information necessary for operative planning in themedium term; data collection and elaboration is related to sales forecasts,
Physical flow
FINAL VEHICLES PLANTS
DEALERSDELIVERING /SUPPLY CHAIN
MANAGEMENTDEALERS
MAIN ASSEMBLIES
PLANTS
COMPONENTS PLANTS
3
5
Executive information flow (real time systems)
Information check flows with weekly or daily frequence (batch systems)
DELIVERY TO
CUSTOMERS
0 Process key points
KEY
1
Transport and inventory planning
2
Verifications and corrective actions
Weekly delivery
plans
JIT deliveries
SchedulingProduction control
Transport to warehousing centres and dealers dispatching
4
• Orders collection from customers
• Commercial stocks management
• Orders portfolio management
Customers or anonymous order emission
Delivery date confirmation and up-dating
Final product delivery
Fig. 6.7 Delivery and production planning flows
160 6 Logistics and Supply Chain Basics for Automotive Application
productive capacity availability, management of industrial constraints, supplymanagement and planning through MRP systems and inventory management offinal products, in the plant and the market network. This information is normallyprocessed on a monthly basis, consistent with OP rolling technique.
• Peripheral Level: process information necessary in each productive unit formanaging working loads and production flows, and in each market area formanaging delivery flows; data collection and elaboration is related to detailedplanning of production (scheduling), daily and weekly line supply, daily andweekly dispatching of final and intermediate products (dispatching), as well asplanning for delivery of final product to the dealers network. For this purpose,systems are used for data collecting, processing and sending in real time or dailyfrequency.
The above information technology systems also allow for the automatic gen-eration of a monthly report on the effectiveness of company logistic processes,according to parameters that will be described in Sect. 6.7.
Applying simulation models developed on the spot, it is possible to verifyprogram feasibility quickly, searching for the best solutions for adjusting pro-grams, according to temporal and industrial constraints. Proceeding this way, it ispossible to speed up OP processing, according to the monthly rolling system.
Parameters to be considered in the development of software and hardwarearchitecture are:
• complexity of product catalogues and correlation with PDM (products grid);• complexity of final product in regard to subassemblies and modules (BOM).• localization of plants and relative web network connection points;• localization of delivery points and relative web network connection points;• lead times for each of the logistic process phases that influence the lead time of
order evasion;• setting of production flow and controlling points, for each plant;• criteria adopted for management of productive capacity constraints;• criteria adopted for management of anticipations and delays in delivery;• link to company economic and financial control.
Let us now examine some aspects related to information technology systemsapplied to the production process, with reference to body assembly, and paint andvehicle final assembly. The following chart shows, as an example, the main sta-tions for flow setting and information diffusion to assure conformity of vehicleversions in relation to specific orders.
Flows related to space frames and body settings (operative pace and mixsequence) start from the insertion of main space frame subassemblies (station A),with body framing stations flexible enough for a mix of body versions to beproduced.
Orders characterizing specific configurations of vehicles are associated with thebodies (and consequently with the serial number printed on the space frame),immediately before the bodies are introduced into the painting process, normally
6.5 Logistics’ Information Technology Systems 161
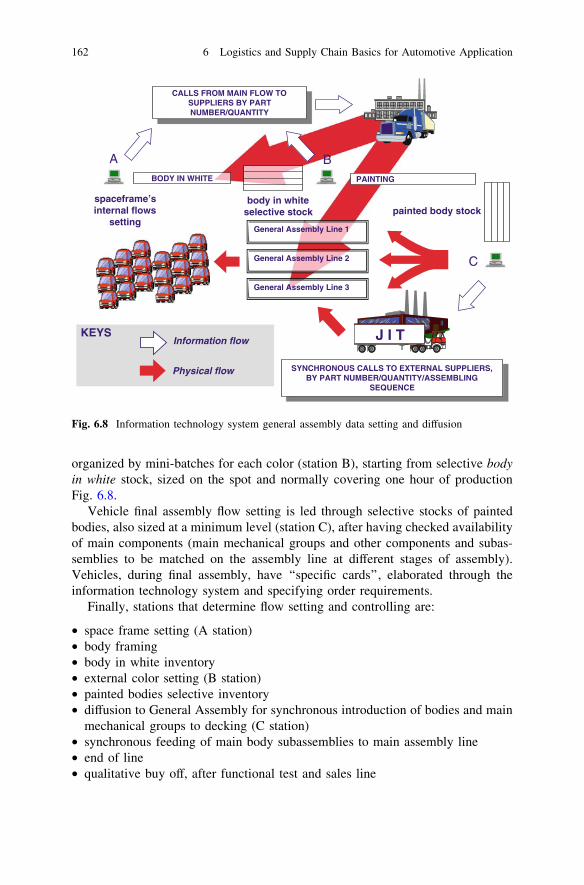
organized by mini-batches for each color (station B), starting from selective bodyin white stock, sized on the spot and normally covering one hour of productionFig. 6.8.
Vehicle final assembly flow setting is led through selective stocks of paintedbodies, also sized at a minimum level (station C), after having checked availabilityof main components (main mechanical groups and other components and subas-semblies to be matched on the assembly line at different stages of assembly).Vehicles, during final assembly, have ‘‘specific cards’’, elaborated through theinformation technology system and specifying order requirements.
Finally, stations that determine flow setting and controlling are:
• space frame setting (A station)• body framing• body in white inventory• external color setting (B station)• painted bodies selective inventory• diffusion to General Assembly for synchronous introduction of bodies and main
mechanical groups to decking (C station)• synchronous feeding of main body subassemblies to main assembly line• end of line• qualitative buy off, after functional test and sales line
BODY IN WHITE PAINTING
CALLS FROM MAIN FLOW TO SUPPLIERS BY PART NUMBER/QUANTITY
SYNCHRONOUS CALLS TO EXTERNAL SUPPLIERS, BY PART NUMBER/QUANTITY/ASSEMBLING
SEQUENCE
General Assembly Line 1
General Assembly Line 2
General Assembly Line 3
A B
C
J I T
painted body stockbody in white
selective stockspaceframe’s internal flows
setting
Physical flow
Information flow KEYS
Fig. 6.8 Information technology system general assembly data setting and diffusion
162 6 Logistics and Supply Chain Basics for Automotive Application

• vehicle assigning and dispatching.
According to modern techniques, the above-mentioned systems for flow settingand controlling use:
• automatic devices for products and component ‘‘on process’’ identification (barcode systems, capacitive memory devices…);
• wireless systems for easy diffusion of information in real time to the differentworking stations for controlling and dispatching;
• monitoring networks interfaced with PLC and Numeric Control, which controlmachinery and equipment.
Similar systems are also used for engine, transmission and suspension assem-bly, because they present a high level of complexity, even if not directly connectedto the final customer orders.
It is important to consider that the above IT systems allow for detecting and storinginformation related to supply batches and the manufacturing period, specifically forelements critical for safety (Traceability). Every supplied batch and every temporalphase during the assembly process subject to traceability obligation is assigned to therelative space frame serial number on each vehicle or engine, so that it is possible totrace specific responsibilities in case of problems. Whenever it becomes necessary tointervene on commercialized vehicles, through recall campaigns, the traceabilitydatabase allows for focalizing interventions at point of occurrence, minimizing thetotal number and their consequent costs as much as possible.
6.6 Key Performance Indicators of Logistics
As we saw in Chap. 3 regarding Manufacturing Systems, the appropriate keyperformance indicators (KPIs) of Logistics Systems can also be used to evaluatethe effectiveness of processes and choose the right methods and actions in thetechnological layout setting phase for development of material handling.
For existing logistic systems, trend analysis of these parameters allows forevaluating effectiveness in orders, flows and inventory management.
6.6.1 Finished Product Inventory Indicatorsand Work In Process (WIP)
There are financial data and technical–economic parameters, related to workingcapital invested in the productive process. These indicators are typically:
1. economic value of inventory (WIP), calculated applying the standard cost ofproduction per unit to the quantity of elements in stock in the inventory and inprogress along the process (according to manufacturing procedures);
6.5 Logistics’ Information Technology Systems 163
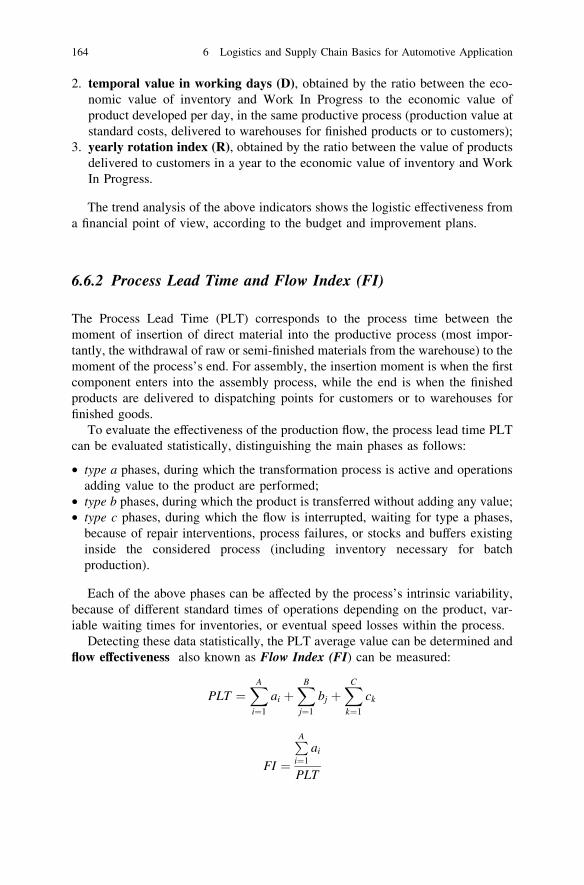
2. temporal value in working days (D), obtained by the ratio between the eco-nomic value of inventory and Work In Progress to the economic value ofproduct developed per day, in the same productive process (production value atstandard costs, delivered to warehouses for finished products or to customers);
3. yearly rotation index (R), obtained by the ratio between the value of productsdelivered to customers in a year to the economic value of inventory and WorkIn Progress.
The trend analysis of the above indicators shows the logistic effectiveness froma financial point of view, according to the budget and improvement plans.
6.6.2 Process Lead Time and Flow Index (FI)
The Process Lead Time (PLT) corresponds to the process time between themoment of insertion of direct material into the productive process (most impor-tantly, the withdrawal of raw or semi-finished materials from the warehouse) to themoment of the process’s end. For assembly, the insertion moment is when the firstcomponent enters into the assembly process, while the end is when the finishedproducts are delivered to dispatching points for customers or to warehouses forfinished goods.
To evaluate the effectiveness of the production flow, the process lead time PLTcan be evaluated statistically, distinguishing the main phases as follows:
• type a phases, during which the transformation process is active and operationsadding value to the product are performed;
• type b phases, during which the product is transferred without adding any value;• type c phases, during which the flow is interrupted, waiting for type a phases,
because of repair interventions, process failures, or stocks and buffers existinginside the considered process (including inventory necessary for batchproduction).
Each of the above phases can be affected by the process’s intrinsic variability,because of different standard times of operations depending on the product, var-iable waiting times for inventories, or eventual speed losses within the process.
Detecting these data statistically, the PLT average value can be determined andflow effectiveness also known as Flow Index (FI) can be measured:
PLT ¼XA
i¼1
ai þXB
j¼1
bj þXC
k¼1
ck
FI ¼
PA
i¼1ai
PLT
164 6 Logistics and Supply Chain Basics for Automotive Application
These calculations consider the total of A, B and C phases composing theanalyzed productive flow, deployed into the above-mentioned typologies.
The analysis of parameter FI is necessary for searching for the best logisticorganization of productive flow, choosing a more convenient method and layout.The more FI is close to one, the more the flow can be considered logistically lean,with reduction of PLT and speed-up of rotation index R of work in process internalto the productive process analyzed.
6.6.3 Risk Indicators of Inventory Obsolescence
These indicators are related to the following types of goods:
• spare parts for after sales technical assistance;• spare parts for equipment and working means maintenance;• other consumable materials used in industrial processes.
Through withdrawals and monitoring of materials in stock, the following can beautomatically obtained:
1. stock rotation index, deployed by utilization classes and value segmentsaccording to ABC analysis criteria (see chapter on basic concepts at the end ofthe book);
2. number of handled parts, in stock and without request of utilization since ‘‘n’’months (where ‘‘n’’ is the alarm threshold, according to the utilization mode);
3. goods obsolescence index, expressed as percentage of goods not handled (andprobably no longer useful), for which it is necessary to calculate the devaluationand proceed to a partial or total disinvestment of inventories, having eliminatedany possibility of re-utilization.
The trend analysis of indicators 1 and 2 can determine countermeasures forinventory optimization, assuring continuity of service and decreasing workingcapital, consequently avoiding risk of obsolescence.
6.6.4 Order Execution Lead Time (OELT)
We refer to a car’s final assembly. The time necessary for the execution of ordersstarts from date of order acquisition (customer’s obligation) and ends when theproduct is delivered to the same customer. We call the duration of this processOrder Execution Lead Time (OELT), evaluated as a statistical data, referring to aspecific model or product line, the final assembly plant and the commercial des-tination area.
6.6 Key Performance Indicators of Logistics 165
OELT = Time necessary to introduce the order into the production plan,manufacture and deliver the product to the final customer
Let us see what the phases affecting the total duration of the execution of ordersare:
(a) time necessary to introduce the order into final production process, consideringavailable productive capacities in relation to order portfolio (order processingtime);
(b) time necessary to end production process (manufacturing lead time), alsoincluding supply process of intermediate products affecting lead time;
(c) time necessary to transfer finished products from final assembly plants tocommercial dealers, also including inventory waiting times necessary fororganization of transport batches (distribution lead time);
(d) time necessary for sales operations at commercial dealers and public regis-tration (customer care time).
To minimize Order Execution Lead Time, ideal conditions are:
• sales flow balanced with production flow;• ‘‘one-piece-flow’’ production systems, with necessary degree of flexibility for
multi-model production;• production sites linked in an easy way to product dispatching centres;• products diligently respecting order requirements, in terms of quality and
specifications, without performing extraordinary finishing operations to correctmanufacturing defects or damages occurring during transportation.
For mass produced cars, organized in a one-piece-flow, where ideal conditionsare set, the order execution lead time is normally 3–4 weeks by best practices. Incase of higher values, processes being slower and/or having a customer demandhigher than production capacities, it is still important to define the necessary leadtime precisely to maintain delivery obligations towards final customers.
As already established for Time To Market relative to new products, OELTfor actual productions is also considered to be one of the strategic factors forsales success. When ideal conditions are not met, critical conditions can affectrelationships between dealers and customers and there is a high risk of lostmarket shares.
6.6.5 Service Level (SL)
These indicators are strictly related to the satisfaction of obligations in terms ofdelivering on time and products corresponding to original requisites, according toorder specifications.
166 6 Logistics and Supply Chain Basics for Automotive Application
Indicators normally used to evaluate Service Level are:(SL)1 = number of deliveries on time/total number of deliveries (punctuality
index)(SL)2 = number of corresponding deliveries/total number of deliveries
(conformity index)
Deviations from delivery obligations are evaluated through statistical criteria,dividing them into severity classes (1 or 2 weeks delay, 2–4 weeks delay, higherdelays). These indicators can be referred to a specific industrial customer when weare dealing with materials or intermediate product supplies or to a specific com-mercial distribution area when we are dealing with final products, always inrelation to the final assembly plant for a specific model or product line.
Indicator SL1 is used to estimate punctuality of deliveries for componentsuppliers along the Supply Chain; this argument will be examined in Chap. 7, inthe section on supplier performance evaluation.
Let us conclude this section underlining that the main Logistic Key Per-formance Indicators are those relative to Finished Products and WIP inven-tories, to Service Level towards commercial networks and Order ExecutionLead Time. Modern information technology systems allow for automatic datacollection, assuring a monthly report.
Other indicators are not subject to recurrent data collection and reporting,but are specifically analysed in process phases and the setting up of manu-facturing systems or in considering specific improvement programs forlogistic processes.
6.7 Just in Time Approach
As mentioned in the historical outlines in the first section of this chapter, starting inthe ’70s, Japanese industries, predominantly Toyota, developed a peculiarapproach to logistics called Just In Time (JIT); this method of production was aconsequence of specific constraints affecting the automotive industry in Japan:
• small spaces available in plants;• product complexity, increasing of model mix over the years;• worldwide markets scenario, with several competitors;• cost reduction needed to increase profit margin;• service level towards customers to be increased (lead time to be reduced at all
levels).
Starting from these items, Taiichi Ohno, at that time responsible for manu-facturing for Toyota Motors, took some basic concepts of massive distributionfrom observing the American industry’s big supermarket approach to business andcreated the JIT approach.
6.6 Key Performance Indicators of Logistics 167
This approach is based on the principle of producing only what customersrequire, at the time it is required, under the conditions required and in the quantityrequired. To apply this concept, it is necessary first to have a continuous flow inthe internal process and then search for the synchronization of internal processes(at all levels) with customer demand, by transmitting information at the shop floorlevel from customers to suppliers through the whole manufacturing process, whichshould always be regular without failures (machines breakdowns, human errors).
These basic rules can be seen in the following JIT four principles:
1. Continuous One Piece Flow: process should be set to have one single piecemoving from one stage of the process to the next without breaking the sequenceand without waiting times along the way.
2. Takt Time: the rhythm of the process should be set considering customerdemand (orders if possible) during a certain period of time and leveling pro-duction (heijunka) by playing on shifting peaks of customer requirements whendowntimes in production are visible to create a constant production request forthe longest time possible; pace of production can be calculated by the ratiobetween net available working time in the period considered and customerdemand.
3. Pull: production must be performed by pulling the products requested bycustomers from the end of the assembly process up to the incoming raw andsemi-finished materials by moving the information process to process. For thispurpose, Ohno introduced the kanban (little tag) system, which carries infor-mation of the requested production to the previous step of the process, applyingthe principle used in American supermarkets to replace only those goodswithdrawn from shelves directly by customers.
4. Zero Errors: this means having no defects on the products due to human errorsor equipment failures; if an error occurs during production, the process must bestopped to avoid the production of a defective product that will have to bereworked once out of the process; production can be restarted only if conditionsare fixed.
These concepts, seen in the logic of JIT, have become one of the main pillars ofthe Toyota Production System and, at the end of the ‘80s, also the basis of the LeanManufacturing logic applied worldwide beginning in the USA.
The international bibliography on these topics is very rich, and readers can findmore details in multiple publications by Japanese, American and European writers.
168 6 Logistics and Supply Chain Basics for Automotive Application
Chapter 7Global Purchasing Operations
7.1 Role of the Purchasing Department
As seen in Chap. 1, industrial policies adopted by carmakers during recent decadeshave resulted in a higher involvement of suppliers in the development of productand production processes. Referring to the world’s foremost carmakers, we notethat their make or buy policies have been consequential for the following items:
• in engine production, according to schemes discussed in Sect. 1.5, the shares for‘‘buy’’ stay within 65 % and 70 % of the total product cost;
• in final assembly of automobiles, according to schemes discussed in Sect. 1.5,the shares for ‘‘buy’’ stay within 75 % and 80 % of the total product cost(excluding engines from the calculation).
The supplier’s obligation then becomes determinant for reaching final productcompetitiveness. For this purpose, we dedicate a whole chapter to the topic ofpurchasing and industrial cooperation, dealing with the methodological criteria forpurchasing applied by carmakers rather than with the capacity of component andworking means producers to correspond to these criteria.
In major industries, particular automotive compartments, the process of makingpurchasing decisions is shared by a number of departments within the company,with the assistance of a cross-functional committee or project groups (productplatforms).
The Purchasing Department is in charge of managing the ordering process,from choice of suppliers to gauging satisfaction in regard to cost, quality andpunctuality from same. The decision-making process, even if shared with otherdepartments, must be coherent with Top Management Purchasing policies,assuring a certain ethic in relations with suppliers to protect company businessinterests.
In big companies, both for reasons of function and need for control, orderingand contract obligations respecting verification processes involve three subjects:
M. Gobetto, Operations Management in Automotive Industries,Springer Series in Advanced Manufacturing, DOI: 10.1007/978-94-007-7593-0_7,� Springer Science+Business Media Dordrecht 2014
169
• Technical Purchasing Department (authorized to spend), in charge of pur-chasing orders, according to necessary technical and economic information, inrelation to the target of industrial initiatives of competence;
• Purchasing Department, in charge of procuring agreements with suppliers, inrelation to the production plan, assuring best market conditions;
• User Department (production or technical systems manager), in charge ofauthorizing bill payment after delivery of goods or services has been provided,corresponding to orders made by the Purchasing Department and to the supplyplan.
The Purchasing Department must also take part in management of contractrelations, solving eventual problems, so as to avoid, if possible, legal actionbetween parties.
Let us remember that an enterprise’s processes involve several types of materialand industrial resources; these are outsourced and can be classified as follows:
• direct materials, subject to transformation and assembly operations during theproduction process and composition of the final product; direct materials arepurchased by quantity when they are ‘‘finished elements’’ by drawing specifi-cations, or by ‘‘weight or volume’’ when they are ‘‘raw or undefined materials’’,even if determined by precise technical standards;
• energetic vectors and consumable materials, not composing final product, butused for industrial processes;
• services, used for administrative and industrial processes (engineering, logistics,maintenance, after sales technical assistance, information technologyservices…);
• other goods included in fixed capital, according to classifications laid out inSect. 6.1.
In this field, the Purchasing Department is in charge of the following funda-mental tasks:
1) selecting and strengthening set of suppliers, applying evaluation criteria sharedwith User Departments;
2) procuring offers, coordinating technical–economic comparisons and proceed-ing to purchasing tenders;
3) leading negotiations and making orders, based on technical specifications andtargets set in specific initiatives;
4) managing contractual relations with suppliers.
To resume, the Purchasing Department is the ‘‘linking point’’ between theCompany Purchase Departments (plants, technical offices, project leader…) andsuppliers for materials, services and industrial goods. The relative contractualobligations are fine-tuned by the Purchasing Department, by proxy for TopManagement or Business Unit. For management of contractual relationships, thePurchasing Department is assisted by certain staff departments, such as Financeand Administration, Legal Services, and Quality Assurance.
170 7 Global Purchasing Operations
As seen in Chap. 6, logistic effectiveness is particularly relevant in supplypolicy. In fact, supply and the reduction of technical lead times along the supplychain is determinant for sales success and for reduction of work in progress.
Finally, the Purchasing Department must procure agreements from suppliers toobtain the following results:
• Secure sources/adequate stocks for availability of direct materials andconsumables
• New product development planning in respect to production means and avail-ability of systems
• Flexible production systems, ‘‘just in time’’sourcing methodologies for effectivelogistic process for management of production planning
• Optimal localization of plants and fast flow for effective delivery of goods
The Purchasing Department is also in charge of preventing critical situations,such as those derived from a supplier’s financial problems, by using necessarycountermeasures to avoid sourcing interruptions. For this purpose, other Depart-ments are in charge of supporting this task (Finance and Administration, LegalServices and Corporate Business Management Staff Department).
7.2 Evolution of Purchasing Policies
It is right to link this topic to what we discussed in Chap. 1 regarding ‘‘make-or-buy’’ policies and technological aspects developed autonomously by SpecializedSuppliers (Sect. 1.5).
It is to be underlined that the actual trend in vehicle development, as much aspossible in a modular concept, on one hand simplifies final assembly operationsand on the other obliges first level suppliers to localize their productive activitiesnear the Final Assembly Plants.
Purchasing policies adopted recently by ‘‘carmakers’’ tend to create stable andeven more engaging relationships, according to the ‘‘extended enterprise’’ model,which involves first level suppliers in ‘‘co-makership’’. As a consequence, lessexpensive and higher quality supplies are obtained through open agreements overthe long term and through shared efficiency plans, in relation to final productcompetitiveness targets.
Changes that occurred in the main ‘‘carmaking’’ organizations and new trendsaffirming the supply of vehicle space frame modules (brakes-suspension modules)are summarized in the scheme in Fig. 7.1.
Another example is represented by vehicle air conditioning systems: from theprocurement of single components to complete conditioning subsystems, made bycomponents partially connected to cockpit modules (controls, controlling devicesand secondary thermal traders), partially to the vehicle’s ‘‘front-end’’(sensors andprimary thermal traders) and partially to the engine (compressor). Pipes for
7.1 Role of the Purchasing Department 171
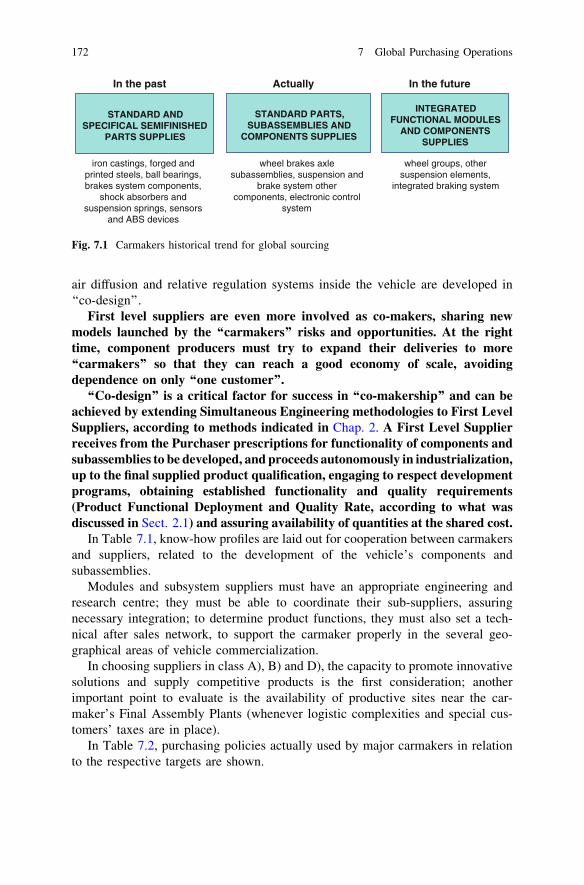
air diffusion and relative regulation systems inside the vehicle are developed in‘‘co-design’’.
First level suppliers are even more involved as co-makers, sharing newmodels launched by the ‘‘carmakers’’ risks and opportunities. At the righttime, component producers must try to expand their deliveries to more‘‘carmakers’’ so that they can reach a good economy of scale, avoidingdependence on only ‘‘one customer’’.
‘‘Co-design’’ is a critical factor for success in ‘‘co-makership’’ and can beachieved by extending Simultaneous Engineering methodologies to First LevelSuppliers, according to methods indicated in Chap. 2. A First Level Supplierreceives from the Purchaser prescriptions for functionality of components andsubassemblies to be developed, and proceeds autonomously in industrialization,up to the final supplied product qualification, engaging to respect developmentprograms, obtaining established functionality and quality requirements(Product Functional Deployment and Quality Rate, according to what wasdiscussed in Sect. 2.1) and assuring availability of quantities at the shared cost.
In Table 7.1, know-how profiles are laid out for cooperation between carmakersand suppliers, related to the development of the vehicle’s components andsubassemblies.
Modules and subsystem suppliers must have an appropriate engineering andresearch centre; they must be able to coordinate their sub-suppliers, assuringnecessary integration; to determine product functions, they must also set a tech-nical after sales network, to support the carmaker properly in the several geo-graphical areas of vehicle commercialization.
In choosing suppliers in class A), B) and D), the capacity to promote innovativesolutions and supply competitive products is the first consideration; anotherimportant point to evaluate is the availability of productive sites near the car-maker’s Final Assembly Plants (whenever logistic complexities and special cus-tomers’ taxes are in place).
In Table 7.2, purchasing policies actually used by major carmakers in relationto the respective targets are shown.
STANDARD AND SPECIFICAL SEMIFINISHED
PARTS SUPPLIES
STANDARD PARTS, SUBASSEMBLIES AND
COMPONENTS SUPPLIES
INTEGRATED FUNCTIONAL MODULES
AND COMPONENTS SUPPLIES
iron castings, forged and printed steels, ball bearings, brakes system components,
shock absorbers and suspension springs, sensors
and ABS devices
wheel brakes axle subassemblies, suspension and
brake system other components, electronic control
system
wheel groups, other suspension elements,
integrated braking system
In the past Actually In the future
Fig. 7.1 Carmakers historical trend for global sourcing
172 7 Global Purchasing Operations
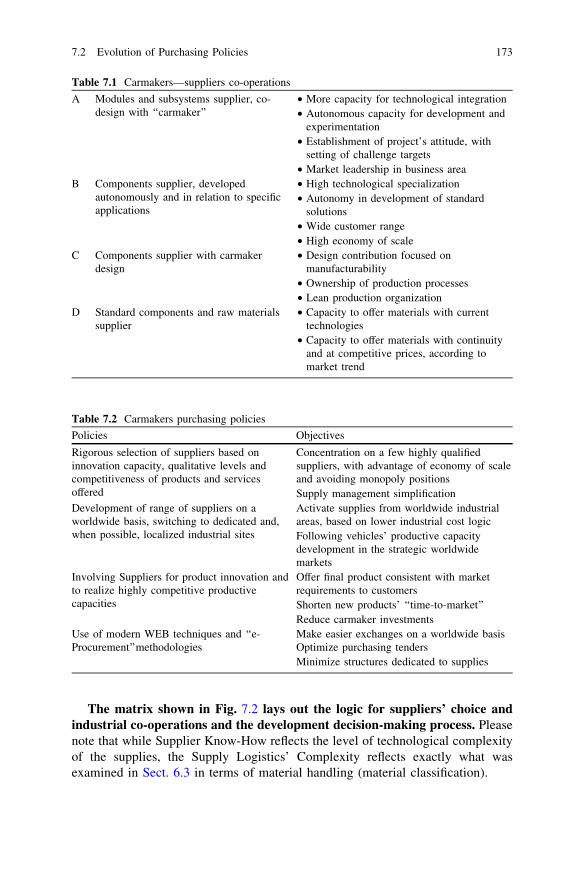
The matrix shown in Fig. 7.2 lays out the logic for suppliers’ choice andindustrial co-operations and the development decision-making process. Pleasenote that while Supplier Know-How reflects the level of technological complexityof the supplies, the Supply Logistics’ Complexity reflects exactly what wasexamined in Sect. 6.3 in terms of material handling (material classification).
Table 7.1 Carmakers—suppliers co-operations
A Modules and subsystems supplier, co-design with ‘‘carmaker’’
• More capacity for technological integration• Autonomous capacity for development and
experimentation• Establishment of project’s attitude, with
setting of challenge targets• Market leadership in business area
B Components supplier, developedautonomously and in relation to specificapplications
• High technological specialization• Autonomy in development of standard
solutions• Wide customer range• High economy of scale
C Components supplier with carmakerdesign
• Design contribution focused onmanufacturability
• Ownership of production processes• Lean production organization
D Standard components and raw materialssupplier
• Capacity to offer materials with currenttechnologies
• Capacity to offer materials with continuityand at competitive prices, according tomarket trend
Table 7.2 Carmakers purchasing policies
Policies Objectives
Rigorous selection of suppliers based oninnovation capacity, qualitative levels andcompetitiveness of products and servicesoffered
Concentration on a few highly qualifiedsuppliers, with advantage of economy of scaleand avoiding monopoly positionsSupply management simplification
Development of range of suppliers on aworldwide basis, switching to dedicated and,when possible, localized industrial sites
Activate supplies from worldwide industrialareas, based on lower industrial cost logicFollowing vehicles’ productive capacitydevelopment in the strategic worldwidemarkets
Involving Suppliers for product innovation andto realize highly competitive productivecapacities
Offer final product consistent with marketrequirements to customersShorten new products’ ‘‘time-to-market’’Reduce carmaker investments
Use of modern WEB techniques and ‘‘e-Procurement’’methodologies
Make easier exchanges on a worldwide basisOptimize purchasing tendersMinimize structures dedicated to supplies
7.2 Evolution of Purchasing Policies 173
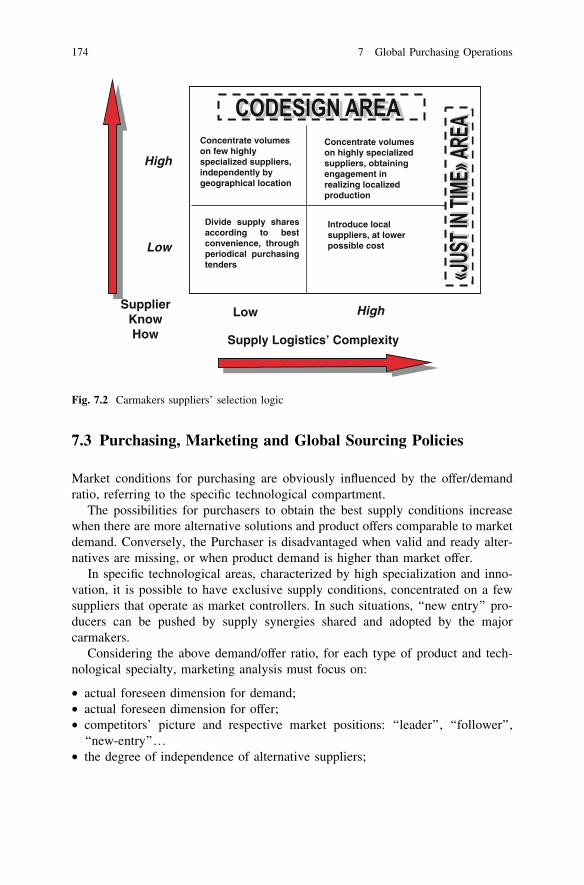
7.3 Purchasing, Marketing and Global Sourcing Policies
Market conditions for purchasing are obviously influenced by the offer/demandratio, referring to the specific technological compartment.
The possibilities for purchasers to obtain the best supply conditions increasewhen there are more alternative solutions and product offers comparable to marketdemand. Conversely, the Purchaser is disadvantaged when valid and ready alter-natives are missing, or when product demand is higher than market offer.
In specific technological areas, characterized by high specialization and inno-vation, it is possible to have exclusive supply conditions, concentrated on a fewsuppliers that operate as market controllers. In such situations, ‘‘new entry’’ pro-ducers can be pushed by supply synergies shared and adopted by the majorcarmakers.
Considering the above demand/offer ratio, for each type of product and tech-nological specialty, marketing analysis must focus on:
• actual foreseen dimension for demand;• actual foreseen dimension for offer;• competitors’ picture and respective market positions: ‘‘leader’’, ‘‘follower’’,
‘‘new-entry’’…• the degree of independence of alternative suppliers;
Low
Low
Introduce local suppliers, at lower possible cost
Divide supply sharesaccording to bestconvenience, throughperiodical purchasingtenders
Supplier KnowHow Supply Logistics’ Complexity
High
Concentrate volumes on few highly specialized suppliers, independently by geographical location
Concentrate volumes on highly specialized suppliers, obtaining engagement in realizing localized production
High
Fig. 7.2 Carmakers suppliers’ selection logic
174 7 Global Purchasing Operations
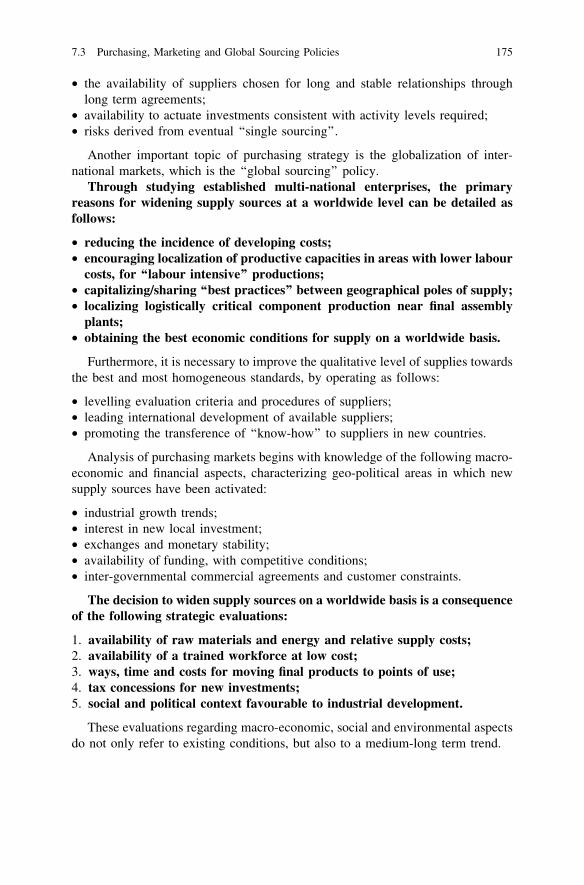
• the availability of suppliers chosen for long and stable relationships throughlong term agreements;
• availability to actuate investments consistent with activity levels required;• risks derived from eventual ‘‘single sourcing’’.
Another important topic of purchasing strategy is the globalization of inter-national markets, which is the ‘‘global sourcing’’ policy.
Through studying established multi-national enterprises, the primaryreasons for widening supply sources at a worldwide level can be detailed asfollows:
• reducing the incidence of developing costs;• encouraging localization of productive capacities in areas with lower labour
costs, for ‘‘labour intensive’’ productions;• capitalizing/sharing ‘‘best practices’’ between geographical poles of supply;• localizing logistically critical component production near final assembly
plants;• obtaining the best economic conditions for supply on a worldwide basis.
Furthermore, it is necessary to improve the qualitative level of supplies towardsthe best and most homogeneous standards, by operating as follows:
• levelling evaluation criteria and procedures of suppliers;• leading international development of available suppliers;• promoting the transference of ‘‘know-how’’ to suppliers in new countries.
Analysis of purchasing markets begins with knowledge of the following macro-economic and financial aspects, characterizing geo-political areas in which newsupply sources have been activated:
• industrial growth trends;• interest in new local investment;• exchanges and monetary stability;• availability of funding, with competitive conditions;• inter-governmental commercial agreements and customer constraints.
The decision to widen supply sources on a worldwide basis is a consequenceof the following strategic evaluations:
1. availability of raw materials and energy and relative supply costs;2. availability of a trained workforce at low cost;3. ways, time and costs for moving final products to points of use;4. tax concessions for new investments;5. social and political context favourable to industrial development.
These evaluations regarding macro-economic, social and environmental aspectsdo not only refer to existing conditions, but also to a medium-long term trend.
7.3 Purchasing, Marketing and Global Sourcing Policies 175
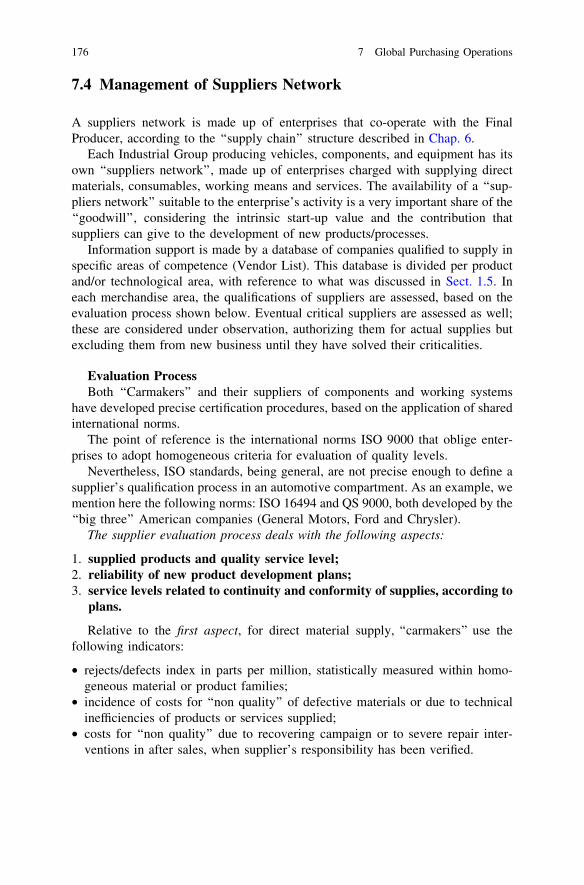
7.4 Management of Suppliers Network
A suppliers network is made up of enterprises that co-operate with the FinalProducer, according to the ‘‘supply chain’’ structure described in Chap. 6.
Each Industrial Group producing vehicles, components, and equipment has itsown ‘‘suppliers network’’, made up of enterprises charged with supplying directmaterials, consumables, working means and services. The availability of a ‘‘sup-pliers network’’ suitable to the enterprise’s activity is a very important share of the‘‘goodwill’’, considering the intrinsic start-up value and the contribution thatsuppliers can give to the development of new products/processes.
Information support is made by a database of companies qualified to supply inspecific areas of competence (Vendor List). This database is divided per productand/or technological area, with reference to what was discussed in Sect. 1.5. Ineach merchandise area, the qualifications of suppliers are assessed, based on theevaluation process shown below. Eventual critical suppliers are assessed as well;these are considered under observation, authorizing them for actual supplies butexcluding them from new business until they have solved their criticalities.
Evaluation ProcessBoth ‘‘Carmakers’’ and their suppliers of components and working systems
have developed precise certification procedures, based on the application of sharedinternational norms.
The point of reference is the international norms ISO 9000 that oblige enter-prises to adopt homogeneous criteria for evaluation of quality levels.
Nevertheless, ISO standards, being general, are not precise enough to define asupplier’s qualification process in an automotive compartment. As an example, wemention here the following norms: ISO 16494 and QS 9000, both developed by the‘‘big three’’ American companies (General Motors, Ford and Chrysler).
The supplier evaluation process deals with the following aspects:
1. supplied products and quality service level;2. reliability of new product development plans;3. service levels related to continuity and conformity of supplies, according to
plans.
Relative to the first aspect, for direct material supply, ‘‘carmakers’’ use thefollowing indicators:
• rejects/defects index in parts per million, statistically measured within homo-geneous material or product families;
• incidence of costs for ‘‘non quality’’ of defective materials or due to technicalinefficiencies of products or services supplied;
• costs for ‘‘non quality’’ due to recovering campaign or to severe repair inter-ventions in after sales, when supplier’s responsibility has been verified.
176 7 Global Purchasing Operations
This last factor is considered one of the most important and can determinesevere actions towards the supplier, especially if brand image can be affected.
For each one of the above statistical data, monthly and yearly reports are done,comparing suppliers and applying homogeneous evaluation criteria.
Relative to the second aspect, we have to emphasize that the evaluation dealswith the ‘‘key points’’of the industrialization process (see Sect. 2.2). For example,delays in development of a new manufacturing system can be determined by adelay in production start-up and in commercial launch, with loss of profit marginand damage to the brand image.
Relative to the third aspect, criteria shown for logistics in Chap. 6 apply.A supplier evaluation is done in advance to supply decisions and is a deter-
minant element for the assigning of initiatives. Then, it must be found in objectiveand transparent data in regard to the enterprises that are deemed unreliable.
Within the ‘‘Suppliers Network’’, the choice of which suppliers will be moreengaged and involved in the development and launch of a new product ischarged to the Purchasing Department in agreement with the Company UserDepartment, based on references and evaluations made through the followingrequirements:
a) capacity to correspond to product targets (Product Function Deployment)and to guarantee stable quality levels;
b) competitive prices, compared to best market conditions and within specificbenchmarks or tenders;
c) availability of corresponding necessary investments to guarantee requiredproductive capacities.
The basic element for evaluating the Purchaser/Supplier relationship is theachievement of the new product’s targets (cost, quality, and development leadtimes). The evaluation of ‘‘performances’’ deals with key points of respect of theindustrialization process (seen in Sect. 2.2) and the regular deliveries establishedthrough agreed programmes.
It is useful for the Top Management of major carmakers to establish ‘‘excel-lence awards’’ for suppliers who have shown they are capable of good results and agood level of service. These are very sought after prizes, because they represent animportant reference on the market.
For the introduction of a new supplier, after marketing analysis and based ontenders, through the collection of references and technical assessments, it isimportant to evaluate:
• financial solidity and structural suitability of a company;• availability of R&D structures, whenever there are co-operations in future
technical projects;• availability of technologies and manufacturing systems, specifically related to
supplies;• quality system qualifications, through an external entity allowed to verify
international certifications (ISO 16494, QS 9000…).
7.4 Management of Suppliers Network 177
After these evaluations, the introduction of the new supplier is delivered basedon economic advantages obtainable from actual production and/or the capacity todevelop new products competitively.
7.5 Order Procedure and Cooperation Agreements
The contract relationship between a Purchaser and a Supplier is based on emittedorders and the supply conditions specified in it (generally technical specifications,with reference to drawings and control methods attached). Normally, generalconditions, applied by the Purchaser to all suppliers operating in the same com-partment of activity, are also included. The offer and negotiation process, pre-liminary to order emission, can lead to the modification of the initial requirementof the Purchaser, if judged inconvenient for both parts.
Ordering procedures can be distinguished as:
1. Closed orders: applied for purchasing when there is a specific order for whichnegotiation is periodically employed, or when products are ordered from ‘‘acatalogue’’, according to a price list. The most relevant part of closed orders isrelated to working tools and equipment.
2. Open Orders: applied for direct and consumable materials, executed throughmaterial requirement planning procedures, according to MRP (see Chap. 6). Forthis purpose, specific order cards are set, shared with the Purchasing Depart-ment and uploaded into the information technology system; these cards showthe shares assigned to each supplier for each product code. Prices must bedefined by the Purchasing Department, with a confidential level on the infor-mation technology system and administrated by the Administration and FinanceDepartments.
Relative to direct materials and part components, a supplier’s contractobligations consist in guaranteeing the Purchaser of:
• required production capacity, according to agreed programmes;• established quality levels, based on drawings and technical specifications;• agreed-upon supply and delivery conditions;• respect of new product development plans, according to shared targets;• prices maintained for the entire agreed-upon period (with eventual issues of
variation linked to labour and raw material costs, according to the recog-nised statistical index);
• efficiency and cost reduction programmes, agreed relative to the contractperiod.
At the same time, obligations charged to the Purchaser consist mostly of:
• assigning shares of production planning as agreed in the contract, for thelength of the agreements;
178 7 Global Purchasing Operations
• withdrawing delivered products (if responding to agreed-upon qualitylevels and requirement planning transmitted) and consequently payingunder established conditions;
• recognizing activities for product/process development (if established targethas been achieved) and consequently paying under established conditions.
Other contractual obligations can be related to cooperation for Researchand Development for Product Improvement or recognition of patent orlicence, or other specific warranty conditions.
Expenses necessary for R&D activities charged to suppliers and for the specifictooling of new products are partially or totally to be sustained by the Purchaser,together with negotiations over the purchase of components.
The relative remuneration (una tantum) is managed by the Purchaser with thefollowing payment alternatives:
1. by eventual anticipation of each step of activity improvement and final paymentat delivery of product, considering product qualification and fulfilment of finalcheck;
2. by ‘‘shares’’ on quantities of products delivered progressively and up to theextinguishment of agreed payment;
3. by other method of delayed payment, during the product life cycle (normallythrough established annual shares).
When the Purchaser is in charge of specific tools, they are included in theequipment database (invested capital), even if they are rented to the Supplier, whois in charge of providing for necessary maintenance to assure normal technical life.
We underline that payment methods are normally a financial leverage for thePurchaser, considering the lead time between delivery of the goods and accountingof the relative remuneration.
Order emission starts the information flow for supply management and for theaccounting charged to the Purchaser. Modern information technology systemsallow for automatically matching the receiving note (delivery document) to theinvoice made by the Supplier, to be considered as anticipation or expiration of thesame order, in case of ‘‘closed orders’’. If this information technology system isreliable and protected from external risks, the accounting process is made auto-matically, simplifying the invoice verification process.
7.6 Supplying Cost and Purchasing EffectivenessIndicators
At this point, we deal with the topics of ‘‘purchasing price’’ and ‘‘supply cost,’’ thelatter related to direct and consumable materials.
Purchasing price is only a part of total supply cost, even if it is the mostimportant part.
7.5 Order Procedure and Cooperation Agreements 179
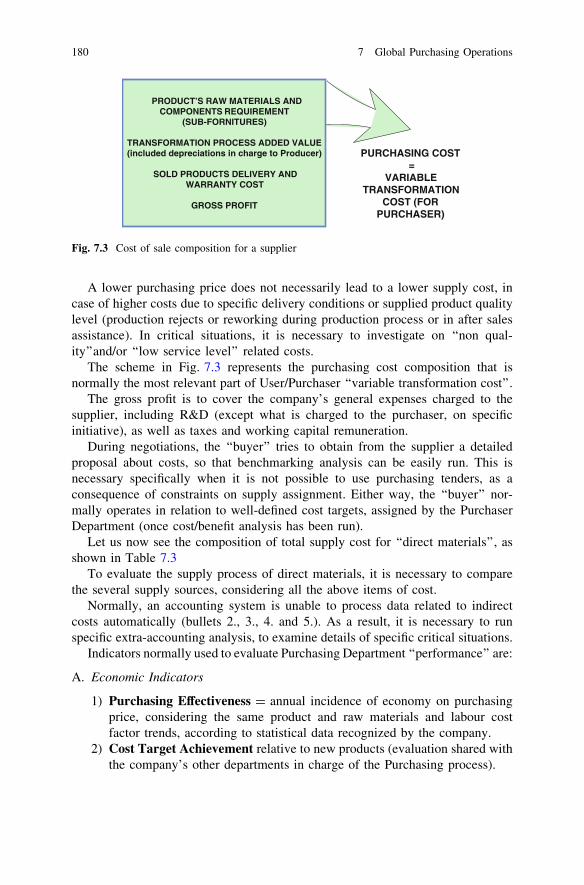
A lower purchasing price does not necessarily lead to a lower supply cost, incase of higher costs due to specific delivery conditions or supplied product qualitylevel (production rejects or reworking during production process or in after salesassistance). In critical situations, it is necessary to investigate on ‘‘non qual-ity’’and/or ‘‘low service level’’ related costs.
The scheme in Fig. 7.3 represents the purchasing cost composition that isnormally the most relevant part of User/Purchaser ‘‘variable transformation cost’’.
The gross profit is to cover the company’s general expenses charged to thesupplier, including R&D (except what is charged to the purchaser, on specificinitiative), as well as taxes and working capital remuneration.
During negotiations, the ‘‘buyer’’ tries to obtain from the supplier a detailedproposal about costs, so that benchmarking analysis can be easily run. This isnecessary specifically when it is not possible to use purchasing tenders, as aconsequence of constraints on supply assignment. Either way, the ‘‘buyer’’ nor-mally operates in relation to well-defined cost targets, assigned by the PurchaserDepartment (once cost/benefit analysis has been run).
Let us now see the composition of total supply cost for ‘‘direct materials’’, asshown in Table 7.3
To evaluate the supply process of direct materials, it is necessary to comparethe several supply sources, considering all the above items of cost.
Normally, an accounting system is unable to process data related to indirectcosts automatically (bullets 2., 3., 4. and 5.). As a result, it is necessary to runspecific extra-accounting analysis, to examine details of specific critical situations.
Indicators normally used to evaluate Purchasing Department ‘‘performance’’ are:
A. Economic Indicators
1) Purchasing Effectiveness = annual incidence of economy on purchasingprice, considering the same product and raw materials and labour costfactor trends, according to statistical data recognized by the company.
2) Cost Target Achievement relative to new products (evaluation shared withthe company’s other departments in charge of the Purchasing process).
PURCHASING COST=
VARIABLE TRANSFORMATION
COST (FOR PURCHASER)
PRODUCT’S RAW MATERIALS AND COMPONENTS REQUIREMENT
(SUB-FORNITURES)
TRANSFORMATION PROCESS ADDED VALUE(included depreciations in charge to Producer)
SOLD PRODUCTS DELIVERY AND WARRANTY COST
GROSS PROFIT
Fig. 7.3 Cost of sale composition for a supplier
180 7 Global Purchasing Operations
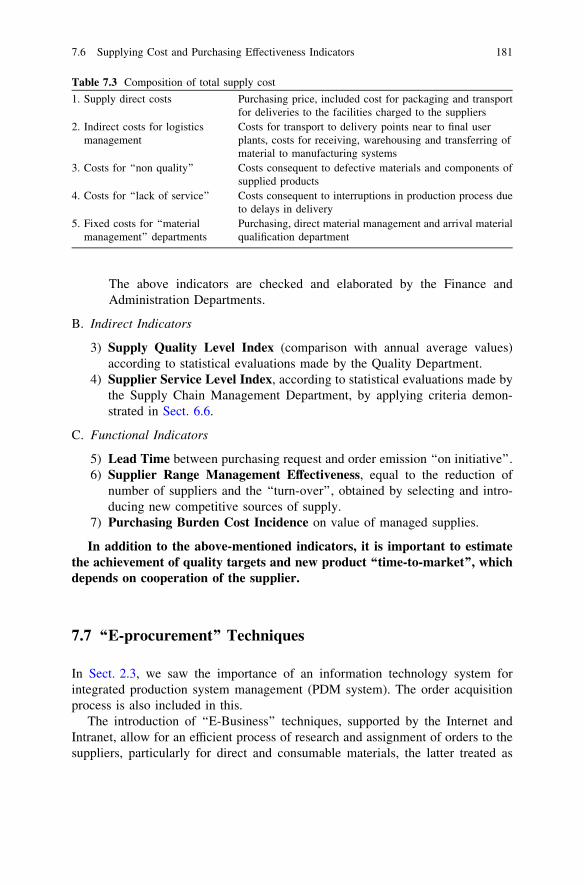
The above indicators are checked and elaborated by the Finance andAdministration Departments.
B. Indirect Indicators
3) Supply Quality Level Index (comparison with annual average values)according to statistical evaluations made by the Quality Department.
4) Supplier Service Level Index, according to statistical evaluations made bythe Supply Chain Management Department, by applying criteria demon-strated in Sect. 6.6.
C. Functional Indicators
5) Lead Time between purchasing request and order emission ‘‘on initiative’’.6) Supplier Range Management Effectiveness, equal to the reduction of
number of suppliers and the ‘‘turn-over’’, obtained by selecting and intro-ducing new competitive sources of supply.
7) Purchasing Burden Cost Incidence on value of managed supplies.
In addition to the above-mentioned indicators, it is important to estimatethe achievement of quality targets and new product ‘‘time-to-market’’, whichdepends on cooperation of the supplier.
7.7 ‘‘E-procurement’’ Techniques
In Sect. 2.3, we saw the importance of an information technology system forintegrated production system management (PDM system). The order acquisitionprocess is also included in this.
The introduction of ‘‘E-Business’’ techniques, supported by the Internet andIntranet, allow for an efficient process of research and assignment of orders to thesuppliers, particularly for direct and consumable materials, the latter treated as
Table 7.3 Composition of total supply cost
1. Supply direct costs Purchasing price, included cost for packaging and transportfor deliveries to the facilities charged to the suppliers
2. Indirect costs for logisticsmanagement
Costs for transport to delivery points near to final userplants, costs for receiving, warehousing and transferring ofmaterial to manufacturing systems
3. Costs for ‘‘non quality’’ Costs consequent to defective materials and components ofsupplied products
4. Costs for ‘‘lack of service’’ Costs consequent to interruptions in production process dueto delays in delivery
5. Fixed costs for ‘‘materialmanagement’’ departments
Purchasing, direct material management and arrival materialqualification department
7.6 Supplying Cost and Purchasing Effectiveness Indicators 181
Commodities, and for standard working means. For this reason, we deal withutilization of these techniques in the following ways.
By ‘‘e-Procurement’’, we mean the order acquisition process for goods andservices using WEB networks and modern ‘‘information technologies systems’’described in Chap. 2: the process begins with research into the most convenientsupplier, including order acquisition and emission (consequent to transaction), andending with final delivery verification, which activates automatic payment andinvoicing.
A Selected Suppliers catalogue is managed through the company’s intranet, sothat transactions and orders can be done directly, assuring privacy of informationand constant control of the supply process through the company’s informationtechnology system.
Benefits obtainable from the utilization of a modern ‘‘e-Procurement’’ systemcan be:
• optimization of processes, with purchasing cost and time reduction;• ‘‘on line’’ availability of updated information about goods and service offers;• possibility of running purchasing tenders through ‘‘on-line pools’’;• automation of communication between Suppliers and Users, even those at great
distances;• electronic management of documents (offer requirements, orders, technical
specifications…), reducing the need for paper documentation;• integration between Purchaser and Supplier information technology systems.
This method allows minimization of cost related to information and adminis-tration in Purchaser/Supplier relationships. The difficulties in the adoption of‘‘e-Procurement’’ are due to the characteristics of pre-existing information tech-nology systems and data protection issues.
The utilization of these techniques is very useful for the acquisition process butcannot be independent of a supplier’s evaluation criteria for capacity and avail-ability, as specified in Sect. 7.4.
182 7 Global Purchasing Operations
Chapter 8Quality Management and ContinuousImprovement
8.1 The ‘‘Learning Curve’’ Concept
Innovations and new technologies applied to new products improve by increasingactivity levels and applications, as well as applying criteria for industrialimprovement.
Historically, the concept of the learning curve was tested for the first time inplane factories during the Second World War, when it was noticed that workingtimes and related costs were decreasing in a regular and progressive trend ifintensive productive plans were applied, according to a predictable trend on astatistical basis. From that moment on, the learning curve concept has been con-sidered valid for several industrial applications, especially in conjunction with ahigh level of technology.
This concept is connected to ‘‘standard logic’’, as seen in Chap. 2; in fact, oncethe testing and research phase is complete, for every new product, industries refinetechnologies and manufacturing methodologies, searching for the most conve-nient, allowing for higher economy of scale as the product is affirmed on themarket.
In general terms, it is possible to trace the ‘‘learning curve’’ for a new product,predicting it through comparison with that of a similar previous product. In thisway, it is possible to evaluate the cost reduction over time in relation to theprogressively produced quantity. The unitary cost reduction is expressed in per-centage for every time the progressively produced quantity is doubled. Practically,a ‘‘learning curve’’ with a negative apex sign means that the unitary cost decreases10 % at every doubling of the cumulated productive volume.
Thus, the arithmetical formula that describes this trend is an exponential one:
y ¼ aþ b � xð�kÞ; where:
a is the final unitary cost when the product will be fully affirmed on the market;b is the additional unitary cost recorded in the first production batch;x is the progressive number of homogeneous batches;
M. Gobetto, Operations Management in Automotive Industries,Springer Series in Advanced Manufacturing, DOI: 10.1007/978-94-007-7593-0_8,� Springer Science+Business Media Dordrecht 2014
183

y is the unitary cost related to the progressive batch x;k is the exponential apex that determines the decrease of the unitary cost in
relation to the progressive production quantity developed.
The exponential apex (k) is called the cost decrease index, as a consequence ofthe ‘‘learning curve.’’
By using a logarithmic scale for the product unitary cost in relation to theprogressively produced quantity, the diagram represented in Fig. 8.1 showsdecreasing linear straight lines, in which k represents the slope, as in the next chart.
We emphasize that the cost decrease index (k) is higher when applied tech-nologies are more innovative.
As the above formula is derived from a statistical analysis, the ‘‘learning curve’’also represents the capacity to improve a specific product progressively, from thestart-up phase to its ‘‘industrial maturity.’’
This trend is related not only to the standard manufacturing cost, but also toquality parameters (production rejects incidence, defect rate during product life,duration reliability).
8.2 Production Ramp up and Maximum Rate Achievement
The so-called industrial logic of ‘‘continuous improvement’’, which we will dealwith in this chapter, is based on the above-mentioned ‘‘learning curve’’ concept.
Relative to the Manufacturing Systems, the ‘‘learning curve’’ is mainly affectedby the speed with which the workers learn and by working time needed fortechnical settlement. For mass production, in tracing the ‘‘learning curve’’ through
2 3 4 5 6 7 8 9 10 x L
k = 30 %
k = 20 %
k = 10 %
x
y
1 x L
a + b
a
Fig. 8.1 Learning curvesexample
184 8 Quality Management and Continuous Improvement
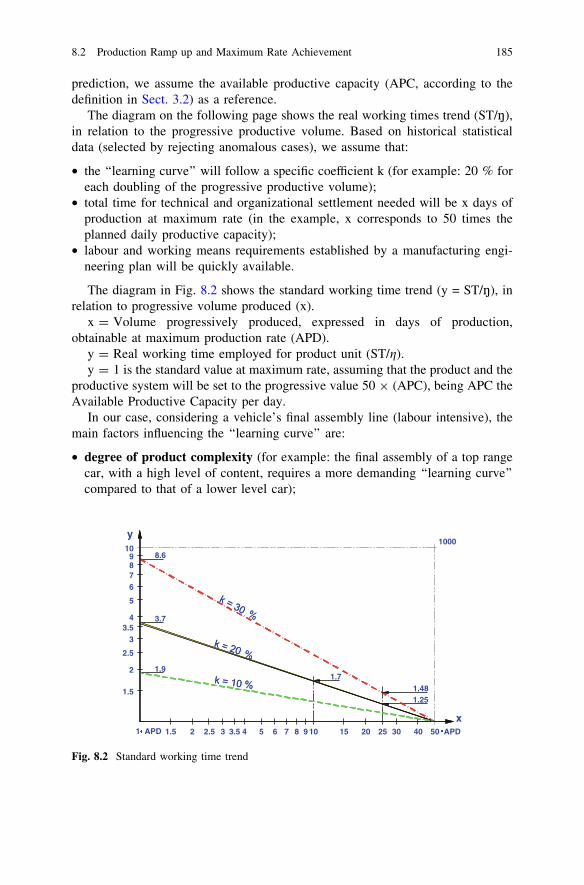
prediction, we assume the available productive capacity (APC, according to thedefinition in Sect. 3.2) as a reference.
The diagram on the following page shows the real working times trend (ST/n),in relation to the progressive productive volume. Based on historical statisticaldata (selected by rejecting anomalous cases), we assume that:
• the ‘‘learning curve’’ will follow a specific coefficient k (for example: 20 % foreach doubling of the progressive productive volume);
• total time for technical and organizational settlement needed will be x days ofproduction at maximum rate (in the example, x corresponds to 50 times theplanned daily productive capacity);
• labour and working means requirements established by a manufacturing engi-neering plan will be quickly available.
The diagram in Fig. 8.2 shows the standard working time trend (y = ST/n), inrelation to progressive volume produced (x).
x = Volume progressively produced, expressed in days of production,obtainable at maximum production rate (APD).
y = Real working time employed for product unit (ST/g).y = 1 is the standard value at maximum rate, assuming that the product and the
productive system will be set to the progressive value 50 9 (APC), being APC theAvailable Productive Capacity per day.
In our case, considering a vehicle’s final assembly line (labour intensive), themain factors influencing the ‘‘learning curve’’ are:
• degree of product complexity (for example: the final assembly of a top rangecar, with a high level of content, requires a more demanding ‘‘learning curve’’compared to that of a lower level car);
1.5 2 2.5 3 3.5 4 5 6 7 8 9 10 15 20 25 30 40 50 APD
1.5
2
2.5
33.5
4
5
6789
108.6
3.7
1.9
1.251.48
1.7
x
y
1 APD
1000
Fig. 8.2 Standard working time trend
8.2 Production Ramp up and Maximum Rate Achievement 185
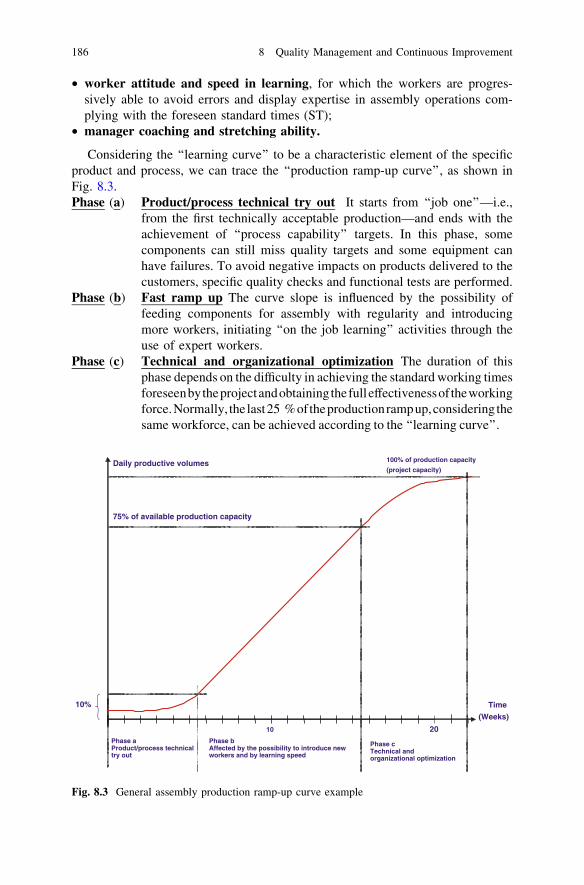
• worker attitude and speed in learning, for which the workers are progres-sively able to avoid errors and display expertise in assembly operations com-plying with the foreseen standard times (ST);
• manager coaching and stretching ability.
Considering the ‘‘learning curve’’ to be a characteristic element of the specificproduct and process, we can trace the ‘‘production ramp-up curve’’, as shown inFig. 8.3.Phase (a) Product/process technical try out It starts from ‘‘job one’’—i.e.,
from the first technically acceptable production—and ends with theachievement of ‘‘process capability’’ targets. In this phase, somecomponents can still miss quality targets and some equipment canhave failures. To avoid negative impacts on products delivered to thecustomers, specific quality checks and functional tests are performed.
Phase (b) Fast ramp up The curve slope is influenced by the possibility offeeding components for assembly with regularity and introducingmore workers, initiating ‘‘on the job learning’’ activities through theuse of expert workers.
Phase (c) Technical and organizational optimization The duration of thisphase depends on the difficulty in achieving the standard working timesforeseenbytheprojectandobtainingthefulleffectivenessof theworkingforce.Normally, the last25 %oftheproductionrampup,considering thesame workforce, can be achieved according to the ‘‘learning curve’’.
Time
(Weeks)
Daily productive volumes
10%
100% of production capacity
(project capacity)
10 20
75% of available production capacity
Phase aProduct/process technical try out
Phase bAffected by the possibility to introduce new workers and by learning speed
Phase cTechnical and organizational optimization
Fig. 8.3 General assembly production ramp-up curve example
186 8 Quality Management and Continuous Improvement
For production operations that concern complex, capital intensive processes, theproduction ramp up speed and time necessary to achieve the maximum rateforeseen by the project depends mainly on the reliability and maintainability of themanufacturing systems, according to what was discussed in Sect. 5.2.
The production ramp up speed determines the time needed for start-up ofseries production (job one) and the date of achievement of the maximumplanned production rate. Let us remember that this parameter heavilyinfluences the new product’s ‘‘time-to-market.’’
8.3 Quality Management in Industrial Processes
Quality for a product or service is measured directly by Customer Satisfac-tion, in much the same way that reliability can be described as the capacity ofthe product to perform its function over time in a continuous way, accordingto the customer’s needs, assuming that utilization and maintenance rules,defined by the product maker, will be respected.
Product Quality at Origin and Quality of Service in After Sales are determinantfor achieving the customer’s trust and maintaining fidelity for future ordinations.
This is true not only for the Producer/Final Customer relationship, but alsobetween all enterprises along the ‘‘supply chain’’ up to the dealers’ network,according to the concept of ‘‘extended enterprise.’’
Even inside the same enterprise, each department or productive unit must trynot to create problems for their internal customers, both in supplying sub-assemblies, working means or services and in transmitting technical or managerialinformation. This philosophy inspires Total Quality Management (which we willdiscuss in the following section), to which the behaviour of all involved shouldcorrespond.
In this section, we will deal with the improvement of Industrial Process Quality,assuming that a normative ISO for Quality has been achieved.
We will also consider the known concept of ‘‘Process Capability’’ and themeaning of the parameters Cp (determined by intrinsic dispersion, according to theGauss curve) and Cpk (determined by the positioning of dispersions in relation tothe limits of the range of tolerance admitted). Let us see which is the best way toobtain Cp and Cpk, as defined by the project and in relation to the components andfinal product quality targets:
1. During project design, the ‘‘manufacturing engineering plan’’ is set, in relationto the product’s technical specifications, by selecting the best technical solu-tions for assuring tolerances defined by drawings. For this purpose, it is nec-essary to verify the possibility of obtaining these restrictions in advance,according to manufacturing ‘‘Process Capability’’.
8.2 Production Ramp up and Maximum Rate Achievement 187
As a result of this verification, manufacturing methodologies are defined andpart design can be refined by competing technical specifications necessary fordeveloping manufacturing systems.For example, to contain the flatness and parallelism errors of brake disk friction, theoperation of grinding on braking bends can be performed. In this way, the effec-tiveness of braking is increased as the dimension of brakes remains the same, evenif a higher specific investment and a higher cost of machining are necessary.Conversely, by turning with accuracy, a lower precision on flatness and parallelismof friction surfaces will be achieved, even if the match with the braking device isimproved by improving the life of the moulding friction. This last solution ischeaper and the selection between the two options depends on the product’s targets.
2. Based on the above-mentioned project analysis, suitable industrial processesare chosen, assuring that:
• machines and equipment will be robust and accurate to guarantee ‘‘intrinsicreliability’’;
• machine’s gears and leverages will assure the necessary ‘‘repeatability’’ of theprocess, by applying the necessary self-compensation systems;
• tools and gigs will assure necessary ‘‘precision’’ for each operation of theproductive cycle;
• measuring techniques and tools will be coherent with ‘‘Process Capability’’requirements;
• an ad hoc monitoring system for checking process parameters will be adopted,with an effective visual management of diagnosis indicators easy to be read bymachine operators;
• operators and maintenance operators will be properly trained to check andadjust parameters, substitute spare parts and worn tools and perform main-tenance interventions necessary to maintain the ‘‘process capability’’ overtime (according to the organizational logic discussed in Chap. 5).We emphasize that eventual non-fulfilment in applying the above preventivecriteria will lead to problems in obtaining and maintaining the values of‘‘SIGMA’’ necessary to assure product quality, with ‘‘zero defects’’ in finalproduct and the lowest number of rejects possible.On the subject of quality prevention, let us lay out the modern techniques(CAD/CAE/CAPE) recommended in the design phase for optimizing themanufacturing system’s ‘‘process capability’’:
(a) Transformation and Simulation of Element Forming ProcessesStarting from tri-dimensional CAD drawings of mouldings and tools, byprocessing specific physical/chemical data of materials during the trans-formation phase, it is possible to simulate the filling of forms and thesolidification and shrinking of materials, examining the influence of theprocess parameters. In this way, it is possible to adjust moulding drawings,relative thermal power supply and conditioning schemes to obtain the bestproductivity results and assure the desired quality levels. These virtualtechniques are almost consolidated for processes of steel gravity casting
188 8 Quality Management and Continuous Improvement
and polymer injection and injection-compression. Other satisfactory solu-tions are available for the forging of steel components and extrusion pro-cesses, as well as for forging processes by sintering.Conversely, satisfactory solutions for thick sheet metal or aluminiumstamping by pressing are still not available, this for the dispersion due to theelastic behaviour of metals during the process (mostly due to thicknessvariation and to gardening during lamination). But even for this techno-logical area, significant improvements will be introduced in the next fewyears, thanks to new research.By applying the above-mentioned virtual techniques, time and costsrequired for experimentation and adjusting of dies are reduced,defining in advance the ‘‘process capability’’ level required andobtainable.
(b) Assembly Processes SimulationsStarting from elements to be assembled and tools and jigs for framing andpositioning tri-dimensional drawings (CAD), the kinematic functioning ofthe process may be represented virtually, so that it is possible to:
• avoid and prevent interference or excess of gaps in assembly and adjustment ofparts (system called ROBCAD, DIGITAL MOCK-UP, etc.);
• assure the possibility of the proper assembly of components and subassemblies,complying with the ergonomic criteria for working and the use of partner tools.The above virtual verifications are very useful for body part subassembly designactivities and for manufacturing engineering plan elaboration, because theyallow for the minimization of time and costs for experimentation necessary tooptimize the product’s functionality and styling.During these project verifications, it is important to analyse in terms ofprobability the effects of the ‘‘chain of tolerance’’, trying to assign for eachpart and component the right precision and exact tolerance, selecting, whenneeded, the elements produced in matching classes.For mechanical assembly in power-train systems, we mention the followingexamples of selected preparation of components, after having divided thecomponents into classes of high precision of centesimal order: piston/rodmatching, application of selected half-bearings to optimize the driving shaft pin/sedge diametrical gap. These selections lead to specific measuring, recognitionand automatic assembly techniques.
(c) Software Programs for Process Automation SimulationsTo develop hard automation manufacturing systems, it is necessary toverify the reliability of software programs during the design phase, throughthe simulation of ‘‘time sequence diagrams’’, by introducing process vari-ables that can introduce instability in normal functioning.In this way, machinery and tool design is optimized, shortening timeneeded to try out systems during productive start-up.
8.3 Quality Management in Industrial Processes 189
8.4 Quality and Reliability Assurance Techniquesin Product Design Phase
To reach the level of quality demanded in the automotive industry, it is funda-mental to apply the following analysis, necessary for ‘‘preventing’’ eventualdefects in the final product or process failures that could determine productionrejects or reworking operations:
(a) Product FMEA and Design ReviewDuring the design phase, the probable ‘‘failure modes’’ of a product’s com-ponents and subsystems are detected by predicting them by induction method,on a statistical basis. As a consequence, the necessary ‘‘design reviews’’ are setto strengthen the critical part, assuring the required reliability. In the mean-time, it is important to search for a lean solution by eliminating eventualredundancies in terms of weight, cost and maintainability.
(b) Process FMEA and Simulation MethodologiesIn both the definition of the manufacturing engineering plan phase and thedesign of machines and specific equipment phase, the probable process failuremodes with critical consequences for product quality must be determined. As aconsequence, the necessary countermeasures in terms of virtual and experi-mental verifications are taken, so that the proper level of ‘‘capability’’ in thetransformation processes will be consistent with product objectives (range oftolerance, Cp and Cpk values), in an attempt to eliminate eventual redun-dancies that cost money and investments.
(c) Experiment Techniques for Products and Process ControlIn relation to a project’s technical data and process parameters considered‘‘important’’, based on research of the above points (a) and (b), the experi-mentation plans for products and process control are established throughstatistical methods.
Also dealing with methodologies for the achievement of excellence in qualityresults, we mention the ‘‘Six Sigma’’ system, particularly widespread in com-partments with technologically complex products, with high impacts on safety andenvironmental aspects. It was conceived in the USA, and adopted by NASA tosolve the biggest problems of reliability in the aero-space industries.
Further on, in the ‘70s and ‘80s, other companies, including Motorola andGeneral Electric, successfully adopted the ‘‘SIX SIGMA’’ application for otherimportant industrial applications: civil aeronautics, railway transportation, ther-mal-nuclear power stations, chemical processes, etc.
The logic of ‘‘SIX SIGMA’’ consists in containing the possible dispersion rangeof process variables that influence product and process reliabilities at a minimumlevel, with the aim of reducing the probability of failures to zero or to parts permillion.
In recent years, ‘‘SIX SIGMA’’ has also been applied to some automotiveindustries: it effectively integrates the preventive methodologies mentioned in the
190 8 Quality Management and Continuous Improvement
previous points (a), (b) and (c) by establishing a systematic link between theseveral company departments engaged in management of industrial processes andafter sales customer assistance, to obtain the best results for Quality and Safety.
8.5 Total Quality Management and ContinuousImprovement Approach
First of all, we would like to note that, for quality management in industrialprocesses, it is fundamental to apply statistical methods and some basic qualitytools, also known as 7 Basic Quality Tools.
1. check sheet: this consists of checklists to be applied for verifying if specificconditions regarding quality have been applied during transformationprocesses;
2. bar graph (histogram) elaborations: for descriptions of critical defects, in termsof frequency and gravity;
3. Pareto analysis: starting from histograms, it is possible to prioritize the defects/phenomena by calculating the cumulate curve and by ordering them decreased(see example on the next page);
4. cause and effect diagrams: these consist of a fish-bone diagram by which thefour main factors of analysis of causes (man, method, machine, material) aregrouped separately and connected through a cause-effect relationship (seefollowing pages for more details);
5. analysis of scattering of process variables, according to Gaüss’s theory;6. control chart: this is a graph or chart with limit lines, called control lines (Upper
Control Limit, Lower Control Limit and Central Line); the purpose of drawinga control chart is to detect any changes in the process that would be evident byany abnormal points listed on the graph from the data collected;
7. Np attribute control chart: when items are compared by some standard and thenare classified as to whether or not they meet that standard; The Np control chartis used to determine if the rate of nonconforming product is stable, and willdetect when a deviation from stability has occurred.
To gather actions for improvement in order of priority, it is important to detectproblems by classifying them by gravity and relevance, searching for the rootcauses through theoretical analysis and experimental research. In Chap. 5, weexamined how to proceed with preventive actions for equipment failures due tobreakdowns. In the same way, it is possible to improve the quality level ofproducts and processes.
The easier and more effective statistical method consists of elaborating a dia-gram like the one shown below: on the x axle, ‘‘critical phenomena’’ in order ofgravity (bar diagrams) are grouped by type; on the y axle, the relative impacts are
8.4 Quality and Reliability Assurance Techniques 191
shown. It is then possible to draw the cumulative curve of produced effects (Paretocurve).
According to the diagram in Fig. 8.4, by selecting and approaching threephenomena out of fifteen, the improvement obtainable is equal to 66 % (i.e.,reducing the impact of defects by 2/3); if we extend intervention to 50 % of thephenomena, the improvement obtainable increases to 90 %.
We emphasize that the Pareto diagram technique is useful not only for qualityand function reliability phenomena, but also for detecting priorities for positivephenomena such as pushing sales for product with a better profit margin, using thesame productive capacity.
After this introduction on the importance of statistical methods, let us dealwith the most popular organizational methodologies applied by companies toachieve excellence in quality and productivity.
To generate ‘‘new ideas for improvement’’, an enterprise’s internal andexternal resources are involved, from internal resources up to the provider ofengineering services, equipment and components, through the application oftechniques of ‘‘continuous improvement.’’ These have been adopted in severalindustrial industries by the best competitors for the achievement of excellence,notably, in the automotive industry, Toyota, which, in the last 40 years, hasrealized a very efficient production and industrial system (the so-calledToyota Production System), based on the logic of Kaizen for continuousimprovement of their standard.
31.0%
21.0%
14.0%10.0%
7.7%5.6%
3.3% 2.4%5.0%
52.0%
66.0%
76.0%
83.7%
89.3%92.6%
95.0%
0%
10%
20%
30%
40%
50%
60%
70%
80%
90%
100%
A B C D E F G H Others
Fig. 8.4 Pareto diagram example
192 8 Quality Management and Continuous Improvement

Some of the main logistics and organizational methodologies upon which themodern industrial organizations are based belong to the Problem Solving approachand involve the following basic tools:
• 5 W 1 HThis is a very simple tool for describing a situation or phenomenon by using sixsimple questions; the Five Ws and one H is a common concept used in jour-nalism, police investigations and other endeavours involving research and basicinformation-gathering.It is a formula for getting the ‘‘full’’ story on something. The maxim of the FiveWs and one H is that, in order for a report to be considered complete, it mustanswer a checklist of six questions, each of which is comprised of an inter-rogative word:
1. Who?2. What?3. Where?4. When?5. Why?6. How?
In the end, it is possible to consolidate all the elements and formulate a gooddescription of the phenomena to be analysed.
• BrainstormingThis consists of exchanging ideas openly, within a small cross-functional groupof workers, obtaining a full analysis of all aspects, a good discussion on sug-gestions for improvement, and a complete sharing of solutions adopted; the firstphase of brainstorming must be conducted without rejecting any proposal, whilethe next phases are oriented towards verifying and checking opportunities to runthe effective countermeasures. It represents the first step of cause analysis inproblem solving.
• Cause and Effect Analysis and the Ishikawa diagramThe Ishikawa diagram (also known as a fishbone diagram or cause-and-effectdiagram) shows the causes of a certain event. A common use of the Ishikawadiagram is in product design, to identify potential factors that may cause anoverall effect, but can be easily applied to other phenomena, such as defects andother failures in manufacturing processes. Kaoru Ishikawa proposed the Ishik-awa diagrams in the 1960s, pioneering quality management processes in theKawasaki shipyards, and, as a result, becoming one of the founding fathers ofmodern management. The diagram was first used in the 1960s, and is consideredone of the seven basic tools of quality (see above).Most Ishikawa diagrams have a box at the right-hand side, where the effect to beexamined is written. The main body of the diagram is a horizontal line fromwhich stems the general causes, represented as ‘‘bones.’’ These are drawntowards the left-hand side of the paper and are each labelled with the causes tobe investigated, often brainstormed beforehand and based on the major causes
8.5 Total Quality Management 193
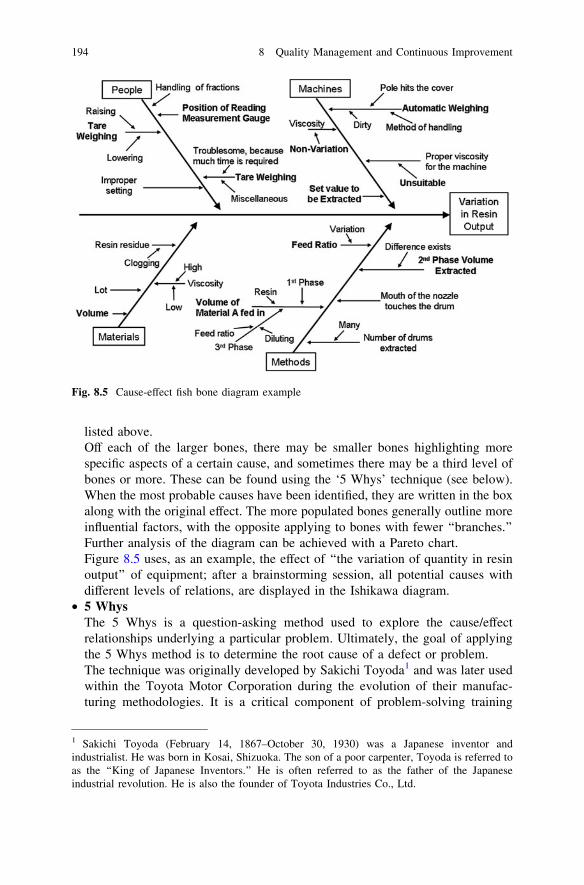
listed above.Off each of the larger bones, there may be smaller bones highlighting morespecific aspects of a certain cause, and sometimes there may be a third level ofbones or more. These can be found using the ‘5 Whys’ technique (see below).When the most probable causes have been identified, they are written in the boxalong with the original effect. The more populated bones generally outline moreinfluential factors, with the opposite applying to bones with fewer ‘‘branches.’’Further analysis of the diagram can be achieved with a Pareto chart.Figure 8.5 uses, as an example, the effect of ‘‘the variation of quantity in resinoutput’’ of equipment; after a brainstorming session, all potential causes withdifferent levels of relations, are displayed in the Ishikawa diagram.
• 5 WhysThe 5 Whys is a question-asking method used to explore the cause/effectrelationships underlying a particular problem. Ultimately, the goal of applyingthe 5 Whys method is to determine the root cause of a defect or problem.The technique was originally developed by Sakichi Toyoda1 and was later usedwithin the Toyota Motor Corporation during the evolution of their manufac-turing methodologies. It is a critical component of problem-solving training
Fig. 8.5 Cause-effect fish bone diagram example
1 Sakichi Toyoda (February 14, 1867–October 30, 1930) was a Japanese inventor andindustrialist. He was born in Kosai, Shizuoka. The son of a poor carpenter, Toyoda is referred toas the ‘‘King of Japanese Inventors.’’ He is often referred to as the father of the Japaneseindustrial revolution. He is also the founder of Toyota Industries Co., Ltd.
194 8 Quality Management and Continuous Improvement
delivered as part of the induction into the Toyota Production System. Thearchitect of the Toyota Production System, Taiichi Ohno,2 described the 5 Whysmethod as ‘‘���the basis of Toyota’s scientific approach ��� by repeating ‘why’ fivetimes, the nature of the problem as well as its solution becomes clear.’’
• Plan Do Check ActThis is the basic approach for all problem-solving activities; it was invented byEdward Deming3 and is also known as the Deming Cycle. It works in thefollowing way:
Plan Establish the objectives and processes necessary to deliver results inaccordance with the expected output. By making the expected output thefocus, it differs from other approaches in that the completeness andaccuracy of the specification is also part of the improvement
Do Implement the new processesCheck Measure the new processes and compare the results against the expected
results to ascertain any differencesAct Analyse the differences to determine their cause. Each will be part of
either one or more of the P-D-C-A steps. Determine where to applychanges that will effect improvement. When a pass through these foursteps does not result in the need to improve, refine the scope to whichPDCA is applied until there is a plan that involves improvement.
• Continuous Improvement and Kaizen ActivitiesKaizen (Japanese for ‘‘continuous improvement’’) is a Japanese philosophy thatfocuses on continuous improvement throughout all aspects of life.When applied to the workplace, kaizen activities continually improve allfunctions of a business, from manufacturing to management and from the CEOto the assembly line workers. By improving standardized activities and pro-cesses, kaizen aims to eliminate waste. The logic applied is very close to thePDCA method mentioned above, and considers the ‘‘actual standard’’ as thestarting point for improvement to create a ‘‘new standard’’, which becomes thearrival point of the kaizen activity, as displayed in Fig. 8.6.
Using this approach, it is possible to improve through small steps, being surenot to lose the benefit achieved from the improvement activities over time, because
2 Taiichi Ohno (February 29, 1912–May 28, 1990) is considered to be the father of the ToyotaProduction System, also known as Lean Manufacturing. He wrote several books about thesystem, the most popular of which is Toyota Production System: Beyond Large-Scale Production.Born in Dalian, China, and a graduate of the Nagoya Technical High School, he was an employeefirst of the Toyoda family’s Toyoda Spinning, then moved to the motor company in 1943, andgradually rose through the ranks to become an executive.3 William Edwards Deming (October 14, 1900–December 20, 1993) was an Americanstatistician, professor, author, lecturer and consultant. In Japan, from 1950 onwards, he taughttop management how to improve design (and thus service), product quality, testing, and sales (thelast through global markets) through various methods, including the application of statisticalmethods.
8.5 Total Quality Management 195
of the base standard created (Fig. 8.7a). Conversely, by improving in big steps(radical technological innovations), there is a risk of regression if no standard hasbeen created to support the innovation (Fig. 8.7b). The ideal condition is tocombine the big improvements (less frequent) with a consistent application ofsmaller ones (continuous improvement, Fig. 8.7c).
Kaizen was first implemented in several Japanese businesses during thecountry’s recovery after World War II, including Toyota, and has since spread tobusinesses throughout the world.
The Toyota Production System is known for kaizen, where all line personnelare expected to halt production on their respective moving lines in case of anyabnormality and, along with their supervisor, suggest an improvement to resolvethe abnormality in order to initiate a kaizen
The cycle of kaizen activity can be defined as:
• standardize an operation• measure the standardized operation (find cycle time and amount of in-process
inventory)• gauge measurements against requirements• innovate to meet requirements and increase productivity• standardize the new, improved operations• continue cycle ad infinitum
kaizen
Time
Change of technology
Time Time
Change of technology combined to (a) (b) (c)
Fig. 8.7 Different approaches to improvement
Improvement
Time
new standard
new standard
new standard
new standard
new standard
new standard
Fig. 8.6 PDCA cycle andnew standard achievementthrough continuousimprovement logic
196 8 Quality Management and Continuous Improvement
Considering the entity and complexity of the phenomena, kaizen activities canbe different in terms of time, resources and dedicated tools, distinguishing morelevels of kaizen activity.
Other important techniques that can be used in approaching ContinuousImprovement are:
• BenchmarkingIt is a good approach to introduce new ideas and stimulate new energies forimproving organizations and methodologies that can really shore up industrialcompetitiveness.First, products and processes are identified that are considered ‘‘critical’’ and forwhich it is a priority to introduce improvements in relation to customerexpectations and competitors’ scenarios. Then, organizations (belonging to thesame or to other enterprises) with the wherewithal to lead the research andestablish a benchmark are identified and contacts are made to arrange for visitsand exchange experiences, starting up analysis ad hoc to identify the bestpractices to be adopted.
• Quality CirclesThese are volunteer groups composed of workers who meet to talk aboutworkplace improvement, and then make presentations to management com-municating their ideas, especially relating to quality of output, in order toimprove the performance of the organization and to motivate and enrich thework of the employees. Typical topics are improving occupational safety andhealth, improving product design, and improvement in the manufacturing pro-cess. The ideal size of a quality circle is eight to ten members.
Quality circles were first established in Japan in 1962, and Kaoru Ishikawa4 hasbeen credited with their creation. The movement in Japan was coordinated by theJapanese Union of Scientists and Engineers (JUSE). The use of quality circles thenspread beyond Japan. Quality circles have been implemented elsewhere, such as inIndia where they have proven useful to the educational sector, and QCFI (QualityCircle Forum of India) has promoted such activities.
Considering all of the above-mentioned logistics and, in particular, the Con-tinuous Improvement approach, it is important to introduce the concept of TotalQuality Management, and the typical way to approach quality in industrialprocesses:
(1) Reactive approach: maintenance of a constant quality levelThis consists of checking quality on the products at different points of theproduction processes (from raw material to final products) and reacting toproblems detected with specific countermeasures so that a constant quality
4 Kaoru Ishikawa (1915–1989) was a Japanese University professor and influential qualitymanagement innovator best known in North America for the Ishikawa or cause and effectdiagram (also known as Fishbone Diagram) used in the analysis of multiple cause phenomena.
8.5 Total Quality Management 197
level may continue to be achieved. This is a traditional approach in whichquality is obtained through inspection and checking results on the product.
(2) Preventive approach: continuous improvement of actual standardsBy using the inspections and checks on the product and introducing specificinspections throughout the process, it is possible to use kaizen activities toimprove the quality standards to fit better with customer requests. With thisapproach, it is very important to orientate to benchmarking activities for quickimprovement of the best practices and, as a consequence, the quality standardsof products and processes. In this logistic, the focus is on research of thecondition of ‘‘zero defects’’ to be set within the industrial processes (design,industrialization and manufacturing), shifting the quality approach frominspection of the product to control of the processes.
(3) Proactive approach: anticipating the generation of errors and defectsAt this level of application, the conditions for zero defects have been clearlyset and the kaizen actions are directed to prevent and improve the risks ofgenerating defects and errors that could also lead to an increase in non-qualitycosts.
In modern and advanced industrial applications, where there are more productsand service lines, all three approaches could exist, even if it were more beneficialto move from a preventive approach to a proactive one; to adopt the rightapproach, the benefit to cost ratio and the customer’s perception of quality shouldbe considered.
The typical conditions of defect rate improvement consequent to theimprovement of actions are shown in Fig. 8.8.
TIME
REJECTS/CHRONICAL DEFECTS
ACTUAL STANDARDS
IMPROVEMENT OF THE STANDARDS
NEW STANDARDS
DE
FE
CT
S
ZERO
DEVIATION FROM ACTUAL STANDARDS
SPORADIC DEFECT
Fig. 8.8 Defect rate index and improvement actions effect
198 8 Quality Management and Continuous Improvement
In using a continuous improvement approach, enterprises must also adopt aneffective organization in which the right commitment will follow a ‘‘top-down’’line and proposals will follow a ‘‘bottom-up’’ line, reversing the classic pyramidalorganization, according to what is displayed in Fig. 8.9. Continuous Improvementmakes it possible to overcome the classical organizational template of the com-pany, where all the departments address losses in the value chain.
On the Value Chain line, the small kaizen team contributes to reduce rejects andwaste, while the other staff departments contribute with their support to the con-tinuous improvement of the standards. The success can be directly measured inreal benefits by using Key Performance Indicators and also translated into costsavings, according to Finance Department cost accounting rules, while the bestperforming teams are rewarded in terms of social involvement and sometimes alsofinancially.
Through an organization like this one, Toyota has designed its own ProductionSystem, known as TPS (Toyota Production System), in which the main logics ofTotal Productive Maintenance (TPM), Total Quality Management (TQM), TotalIndustrial Engineering (TIE) and Just in Time (JIT) can be applied, with theinvolvement of all employees in the industrial organization, from top managementto the workers. TPS has become a real benchmark over time, not only for auto-motive industries, but for all other industrial compartments, inspiring several leanmanufacturing models of industrial organization based on these principles forachieving a world class level in manufacturing applications and beyond.
To conclude this section, it is useful to summarize the main conceptsmentioned above:
• Continuous Improvement activities must not be considered as ‘‘una tantuminitiatives’’, but as ‘‘normal activities’’ constantly necessary to achieve andmaintain the best quality levels for guaranteeing the brand image and thecustomers’ satisfaction.
DistributionProductionSuppliesDevelopment
Management
Main departments
Operating departments
Reversal of the pyramid
DistributionProductionSuppliesDevelopment
Management
Main departments
Operating departments
Customer expectation
Customer satisfaction
Fig. 8.9 Organization pyramid reverse through continuous improvement approach
8.5 Total Quality Management 199

• At the shop floor level, lean organizational procedures should be estab-lished, so that it is possible to focus improvement activities according topriorities and through the employees’ involvement, clearly demonstratingTop Management’s commitment.
• For these purposes, it is important to organize cross-functional teams, madeup of a few people, to make the interaction easier and make it possible tocollect the suggestions of each of the members.
• Awards for improvement proposals generated and for results achievedmust be weighed and assigned with care, to stimulate the engagement ofeach worker and promote the collaboration of all employees: certification tothe team, public presentations of results, prizes, not necessarily financial,development of professionalism and opportunities according to merit.
200 8 Quality Management and Continuous Improvement
Chapter 9Value Creation and Final Considerations
Let us now reconsider the entire book, underlining correlations between thedifferent sections and providing a final synthesis.
After having dealt in Chap. 1 with industrial policies that determine the stra-tegic assets of manufacturing activities, we explored in Chap. 2 how the industrialdevelopment of a product is managed, according to sales targets and customerexpectations.
In Chap. 3, we discussed methodological criteria applied to setting productioncapacities in a competitive scenario, assuring the necessary degree of utilization ofinvestments.
Chapters 4 and 5, strictly in relation to Chap. 3, dealt with the organizationalcriteria of labour and management of technical systems, with an eye towardsquality targets, productivity and flexibility.
In Chap. 6, we examined the ‘‘logistic process’’ , from supply sources toproduction flow management, up to delivery of final products, emphasizing certainstrategic factors such as the service level toward the commercial network and theorder lead time.
Chapter 7 was dedicated to the Customer/Supplier relationship throughout theProcurement activities, with reference to the modern policies of global sourcing toassure effective cooperation between the enterprises that are engaged in productdevelopment and productive activities, on a competitive ‘‘worldwide’’ basis.
Finally, in Chap. 8, we considered the main modern methodologies applied toobtain ‘‘quality for industrial processes’’, according to continuous improvementlogic, finalized to empower the company’s brand and achieve/maintain customerfidelity.
We have attempted to offer the reader a ‘‘wide ranging’’ vision of automotiveindustrial processes.
To conclude, we think it is important to focus on the contribution asked ofProduction Management and Industrial Co-operations in ‘‘creating value’’ for anenterprise.
Let us remember that companies’ business units create value when the marginsobtained from sales of the products/services are positive, sufficiently covering thenet invested capital and the burden, rewarding entrepreneurial risk.
M. Gobetto, Operations Management in Automotive Industries,Springer Series in Advanced Manufacturing, DOI: 10.1007/978-94-007-7593-0_9,� Springer Science+Business Media Dordrecht 2014
201

It is clear that, at the same value and price of sold products and services, if wereduce production and commercial costs (including warranty expenses), the grossprofit margin increases proportionally, as a determinant factor to ‘‘create value’’.For this purpose, during the design phase, it is important to balance the product’svalue with its cost ratio, to obtain, during the operative phase, the highest effi-ciency along the entire supply chain.
Every initiative of renewal of products and empowering/improvement ofproductive capacities must be well-planned, in relation to the profit targets and theobtainable operative margin, assuring that the financial effort will be remunerative.The ‘‘business planning’’ criteria and the methodologies for investment profit-ability analysis are not included in this text, being matters of Enterprise Economy.By the way, we think it important to emphasize that an effective setting ofproduction processes, with the right selection of technologies applied, cancontribute to generate value for enterprises.
The scheme in Fig. 9.1 synthesizes this topic, with reference to the itemsalready discussed in Chap. 1 and to the strategic characteristics for the competi-tiveness of enterprises.
Another recurrent ‘‘leit motif’’ in all chapters is the concept of economy ofscale. As we saw in Sects. 1.2 and 2.1, this is strictly related to the strategic planfor product range and the productive capacities. The standardization processmakes possible the horizontal expansion of components and working means,
Fig. 9.1 ‘‘Production system’’ prerogatives that contribute to create value for the enterprise
202 9 Value Creation and Final Considerations
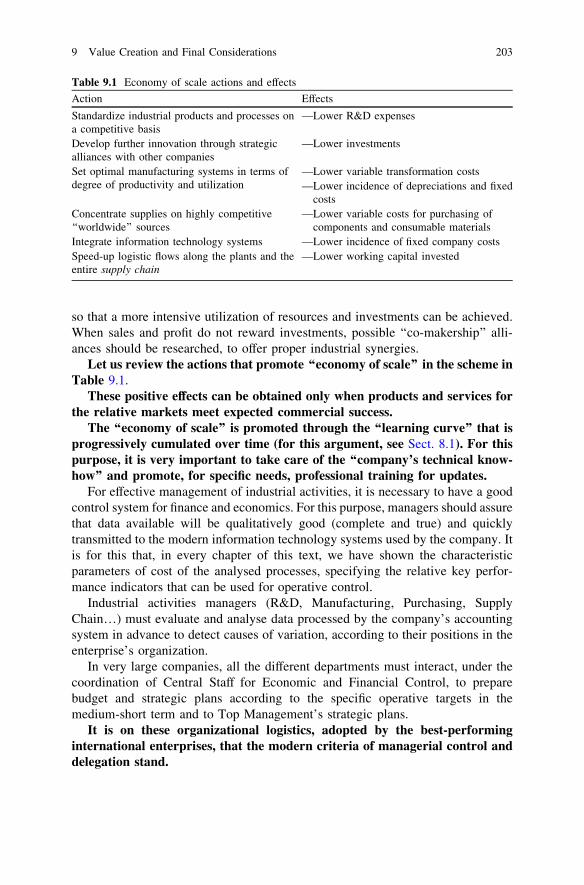
so that a more intensive utilization of resources and investments can be achieved.When sales and profit do not reward investments, possible ‘‘co-makership’’ alli-ances should be researched, to offer proper industrial synergies.
Let us review the actions that promote ‘‘economy of scale’’ in the scheme inTable 9.1.
These positive effects can be obtained only when products and services forthe relative markets meet expected commercial success.
The ‘‘economy of scale’’ is promoted through the ‘‘learning curve’’ that isprogressively cumulated over time (for this argument, see Sect. 8.1). For thispurpose, it is very important to take care of the ‘‘company’s technical know-how’’ and promote, for specific needs, professional training for updates.
For effective management of industrial activities, it is necessary to have a goodcontrol system for finance and economics. For this purpose, managers should assurethat data available will be qualitatively good (complete and true) and quicklytransmitted to the modern information technology systems used by the company. Itis for this that, in every chapter of this text, we have shown the characteristicparameters of cost of the analysed processes, specifying the relative key perfor-mance indicators that can be used for operative control.
Industrial activities managers (R&D, Manufacturing, Purchasing, SupplyChain…) must evaluate and analyse data processed by the company’s accountingsystem in advance to detect causes of variation, according to their positions in theenterprise’s organization.
In very large companies, all the different departments must interact, under thecoordination of Central Staff for Economic and Financial Control, to preparebudget and strategic plans according to the specific operative targets in themedium-short term and to Top Management’s strategic plans.
It is on these organizational logistics, adopted by the best-performinginternational enterprises, that the modern criteria of managerial control anddelegation stand.
Table 9.1 Economy of scale actions and effects
Action Effects
Standardize industrial products and processes ona competitive basis
—Lower R&D expenses
Develop further innovation through strategicalliances with other companies
—Lower investments
Set optimal manufacturing systems in terms ofdegree of productivity and utilization
—Lower variable transformation costs—Lower incidence of depreciations and fixed
costsConcentrate supplies on highly competitive‘‘worldwide’’ sources
—Lower variable costs for purchasing ofcomponents and consumable materials
Integrate information technology systems —Lower incidence of fixed company costsSpeed-up logistic flows along the plants and theentire supply chain
—Lower working capital invested
9 Value Creation and Final Considerations 203

AppendixProduction Management Basics
A.1 The Product
A.1.1 Product Development
Every enterprise exists in an environment in which economic conditions andsociety are continuously changing and evolving. Therefore it is important toattempt to forecast what the future of the environment will be in its differentaspects, and to consider the environmental constraints that might limit the behaviorof the enterprise (Fig. A.1).
The principal aspects to be considered in this type of analysis are:
• The demand. Every enterprise must consider the current and the expectedcharacteristics of its market. Such studies must be aimed at appraising the futurepossible market background, assessing the possible effects of decisions alreadytaken, anticipating decisions that might consider only single environmentalhypotheses, and finally contributing to the development of the enterprise into anexpanding organization.
• The offer. It is fundamental to examine the behavior of competitors, to considertheir composition, their market share, their sales policies, and their financialposition. Such factors must be carefully sifted to determine the degree of theirvulnerability and therefore to take advantage of this knowledge and analysis.
• The technological process. Considering the numerous innovations in everyfield of business activities, no enterprise can avoid technological progress inincreasing their own competitiveness.
• Rules and regulations. An external constraint of primary importance for anyenterprise is the effect of public regulation on private entrepreneurial activities.Many restrictions, such as hygienic-sanitary regulations, environmentalprotection regulations, inland trade and monopoly regulations, can limit thefreedom of the enterprises themselves.
M. Gobetto, Operations Management in Automotive Industries,Springer Series in Advanced Manufacturing DOI: 10.1007/978-94-007-7593-0,� Springer Science+Business Media Dordrecht 2014
205
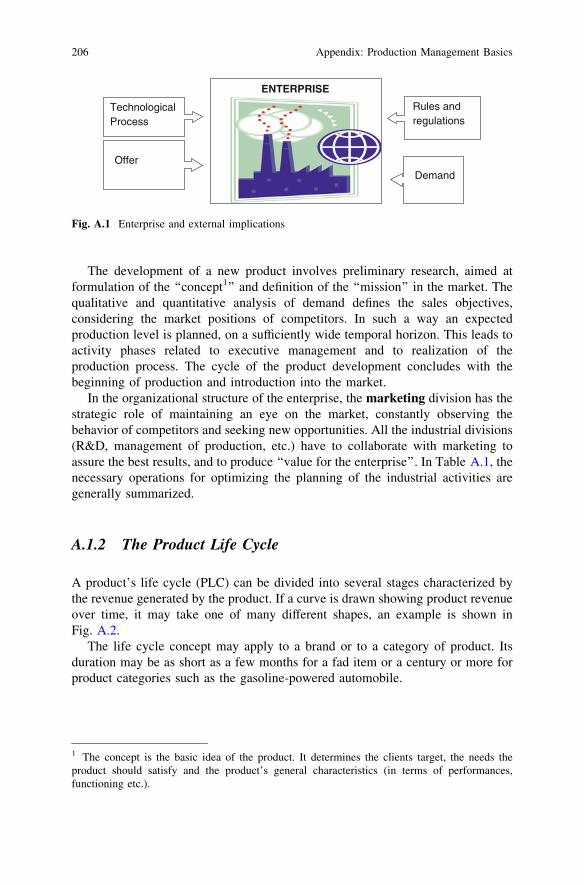
The development of a new product involves preliminary research, aimed atformulation of the ‘‘concept1’’ and definition of the ‘‘mission’’ in the market. Thequalitative and quantitative analysis of demand defines the sales objectives,considering the market positions of competitors. In such a way an expectedproduction level is planned, on a sufficiently wide temporal horizon. This leads toactivity phases related to executive management and to realization of theproduction process. The cycle of the product development concludes with thebeginning of production and introduction into the market.
In the organizational structure of the enterprise, the marketing division has thestrategic role of maintaining an eye on the market, constantly observing thebehavior of competitors and seeking new opportunities. All the industrial divisions(R&D, management of production, etc.) have to collaborate with marketing toassure the best results, and to produce ‘‘value for the enterprise’’. In Table A.1, thenecessary operations for optimizing the planning of the industrial activities aregenerally summarized.
A.1.2 The Product Life Cycle
A product’s life cycle (PLC) can be divided into several stages characterized bythe revenue generated by the product. If a curve is drawn showing product revenueover time, it may take one of many different shapes, an example is shown inFig. A.2.
The life cycle concept may apply to a brand or to a category of product. Itsduration may be as short as a few months for a fad item or a century or more forproduct categories such as the gasoline-powered automobile.
TechnologicalProcess
OfferDemand
Rules and regulations
ENTERPRISE
Fig. A.1 Enterprise and external implications
1 The concept is the basic idea of the product. It determines the clients target, the needs theproduct should satisfy and the product’s general characteristics (in terms of performances,functioning etc.).
206 Appendix: Production Management Basics
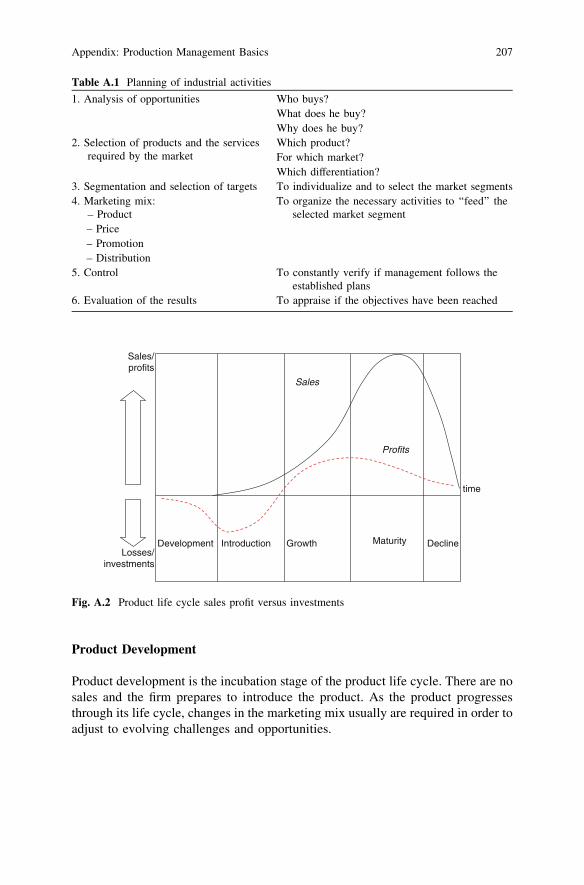
Product Development
Product development is the incubation stage of the product life cycle. There are nosales and the firm prepares to introduce the product. As the product progressesthrough its life cycle, changes in the marketing mix usually are required in order toadjust to evolving challenges and opportunities.
Table A.1 Planning of industrial activities
1. Analysis of opportunities Who buys?What does he buy?Why does he buy?
2. Selection of products and the servicesrequired by the market
Which product?For which market?Which differentiation?
3. Segmentation and selection of targets To individualize and to select the market segments4. Marketing mix:
– ProductTo organize the necessary activities to ‘‘feed’’ the
selected market segment– Price– Promotion– Distribution
5. Control To constantly verify if management follows theestablished plans
6. Evaluation of the results To appraise if the objectives have been reached
Development Introduction Growth Maturity Decline
Profits
Sales
Sales/ profits
Losses/ investments
time
Fig. A.2 Product life cycle sales profit versus investments
Appendix: Production Management Basics 207
Introduction Stage
When the product is introduced, sales will be low until customers become aware ofthe product and its benefits. Some firms may announce their product before it isintroduced, but such announcements also alert competitors and remove theelement of surprise. Advertising costs typically are high during this stage in orderto rapidly increase customer awareness of the product and to target early adopters.During the introductory stage the firm is likely to incur additional costs associatedwith the initial distribution of the product. These higher costs coupled with a lowsales volume usually make the introduction stage a period of negative profits.
During the introduction stage, the primary goal is to establish a market andbuild primary demand for the product class. The following are some of themarketing mix implications of the introduction stage:
• Product—one or few products, relatively undifferentiated.• Price—Generally high, assuming a skim pricing strategy for a high profit margin
as the early adopters buy the product and the firm seeks to recoup developmentcosts quickly. In some cases a penetration pricing strategy is used andintroductory prices are set low to gain market share rapidly.
• Distribution—Distribution is selective and scattered as the firm commencesimplementation of the distribution plan.
• Promotion—Promotion is aimed at building brand awareness. Samples or trialincentives may be directed toward early adopters. The introductory promotionalso is intended to convince potential resellers to carry the product.
Growth Stage
The growth stage is a period of rapid revenue growth. Sales increase as morecustomers become aware of the product and its benefits and additional marketsegments are targeted. Once the product has been proven a success and customersbegin asking for it, sales will increase further as more retailers become interestedin carrying it. The marketing team may expand the distribution at this point. Whencompetitors enter the market, often during the latter part of the growth stage, theremay be price competition and/or increased promotional costs in order to convinceconsumers that the firm’s product is better than that of the competition.
During the growth stage, the goal is to gain consumer preference and increasesales. The marketing mix may be modified as follows:
• Product—New product features and packaging options; improvement ofproduct quality.
• Price—Maintained at a high level if demand is high, or reduced to captureadditional customers.
• Distribution—Distribution becomes more intensive. Trade discounts areminimal if resellers show a strong interest in the product.
• Promotion—Increased advertising to build brand preference.
208 Appendix: Production Management Basics
Maturity Stage
The maturity stage is the most profitable. While sales continue to increase into thisstage, they do so at a slower pace. Because brand awareness is strong, advertisingexpenditures will be reduced. Competition may result in decreased market share and/or prices. The competing products may be very similar at this point, increasing thedifficulty of differentiating the product. The firm places effort into encouragingcompetitors’ customers to switch, increasing usage per customer, and convertingnon-users into customers. Sales promotions may be offered to encourage retailers togive the product more shelf space over competing products.
During the maturity stage, the primary goal is to maintain market share andextend the product life cycle. Marketing mix decisions may include:
• Product—Modifications are made and features are added in order todifferentiate the product from competing products that may have beenintroduced.
• Price—Possible price reductions in response to competition while avoiding aprice war.
• Distribution—New distribution channels and incentives to resellers in order toavoid losing shelf space.
• Promotion—Emphasis on differentiation and building of brand loyalty. Incentivesto get competitors’ customers to switch.
Decline Stage
Eventually sales begin to decline as the market becomes saturated, the productbecomes technologically obsolete, or customer tastes change. If the product hasdeveloped brand loyalty, the profitability may be maintained longer. Unit costsmay increase with declining production volumes and eventually no more profit canbe made.
During the decline phase, the firm generally has three options:
• Maintain the product in hopes that competitors will exit. Reduce costs and findnew uses for the product.
• Harvest it, reducing marketing support and coasting along until no more profitcan be made.
• Discontinue the product when no more profit can be made or there is a successorproduct.
The marketing mix may be modified as follows:
• Product—The number of products in the product line may be reduced.Rejuvenate surviving products to make them look new again.
• Price—Prices may be lowered to liquidate inventory of discontinued products.Prices may be maintained for continued products serving a niche market.
Appendix: Production Management Basics 209
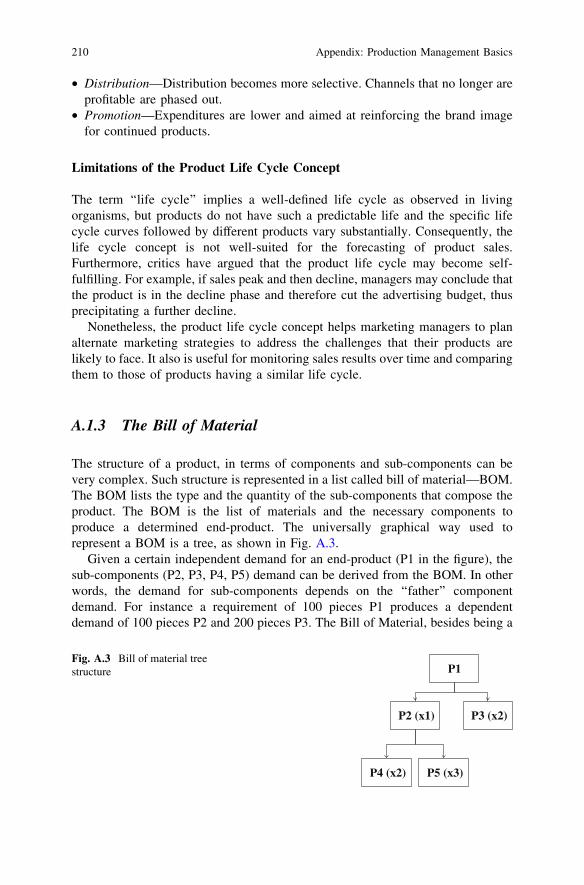
• Distribution—Distribution becomes more selective. Channels that no longer areprofitable are phased out.
• Promotion—Expenditures are lower and aimed at reinforcing the brand imagefor continued products.
Limitations of the Product Life Cycle Concept
The term ‘‘life cycle’’ implies a well-defined life cycle as observed in livingorganisms, but products do not have such a predictable life and the specific lifecycle curves followed by different products vary substantially. Consequently, thelife cycle concept is not well-suited for the forecasting of product sales.Furthermore, critics have argued that the product life cycle may become self-fulfilling. For example, if sales peak and then decline, managers may conclude thatthe product is in the decline phase and therefore cut the advertising budget, thusprecipitating a further decline.
Nonetheless, the product life cycle concept helps marketing managers to planalternate marketing strategies to address the challenges that their products arelikely to face. It also is useful for monitoring sales results over time and comparingthem to those of products having a similar life cycle.
A.1.3 The Bill of Material
The structure of a product, in terms of components and sub-components can bevery complex. Such structure is represented in a list called bill of material—BOM.The BOM lists the type and the quantity of the sub-components that compose theproduct. The BOM is the list of materials and the necessary components toproduce a determined end-product. The universally graphical way used torepresent a BOM is a tree, as shown in Fig. A.3.
Given a certain independent demand for an end-product (P1 in the figure), thesub-components (P2, P3, P4, P5) demand can be derived from the BOM. In otherwords, the demand for sub-components depends on the ‘‘father’’ componentdemand. For instance a requirement of 100 pieces P1 produces a dependentdemand of 100 pieces P2 and 200 pieces P3. The Bill of Material, besides being a
P1
P2 (x1) P3 (x2)
P4 (x2) P5 (x3)
Fig. A.3 Bill of material treestructure
210 Appendix: Production Management Basics
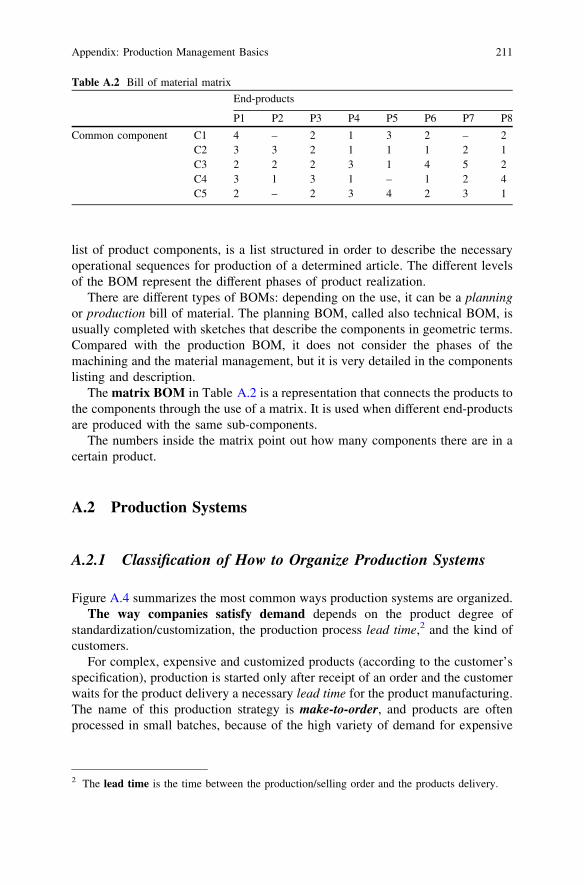
list of product components, is a list structured in order to describe the necessaryoperational sequences for production of a determined article. The different levelsof the BOM represent the different phases of product realization.
There are different types of BOMs: depending on the use, it can be a planningor production bill of material. The planning BOM, called also technical BOM, isusually completed with sketches that describe the components in geometric terms.Compared with the production BOM, it does not consider the phases of themachining and the material management, but it is very detailed in the componentslisting and description.
The matrix BOM in Table A.2 is a representation that connects the products tothe components through the use of a matrix. It is used when different end-productsare produced with the same sub-components.
The numbers inside the matrix point out how many components there are in acertain product.
A.2 Production Systems
A.2.1 Classification of How to Organize Production Systems
Figure A.4 summarizes the most common ways production systems are organized.The way companies satisfy demand depends on the product degree of
standardization/customization, the production process lead time,2 and the kind ofcustomers.
For complex, expensive and customized products (according to the customer’sspecification), production is started only after receipt of an order and the customerwaits for the product delivery a necessary lead time for the product manufacturing.The name of this production strategy is make-to-order, and products are oftenprocessed in small batches, because of the high variety of demand for expensive
Table A.2 Bill of material matrix
End-products
P1 P2 P3 P4 P5 P6 P7 P8
Common component C1 4 – 2 1 3 2 – 2C2 3 3 2 1 1 1 2 1C3 2 2 2 3 1 4 5 2C4 3 1 3 1 – 1 2 4C5 2 – 2 3 4 2 3 1
2 The lead time is the time between the production/selling order and the products delivery.
Appendix: Production Management Basics 211
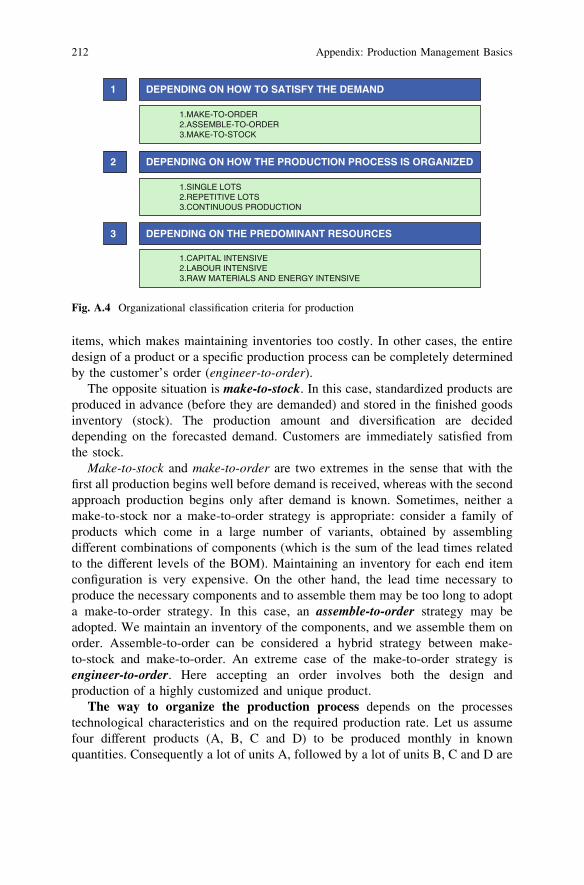
items, which makes maintaining inventories too costly. In other cases, the entiredesign of a product or a specific production process can be completely determinedby the customer’s order (engineer-to-order).
The opposite situation is make-to-stock. In this case, standardized products areproduced in advance (before they are demanded) and stored in the finished goodsinventory (stock). The production amount and diversification are decideddepending on the forecasted demand. Customers are immediately satisfied fromthe stock.
Make-to-stock and make-to-order are two extremes in the sense that with thefirst all production begins well before demand is received, whereas with the secondapproach production begins only after demand is known. Sometimes, neither amake-to-stock nor a make-to-order strategy is appropriate: consider a family ofproducts which come in a large number of variants, obtained by assemblingdifferent combinations of components (which is the sum of the lead times relatedto the different levels of the BOM). Maintaining an inventory for each end itemconfiguration is very expensive. On the other hand, the lead time necessary toproduce the necessary components and to assemble them may be too long to adopta make-to-order strategy. In this case, an assemble-to-order strategy may beadopted. We maintain an inventory of the components, and we assemble them onorder. Assemble-to-order can be considered a hybrid strategy between make-to-stock and make-to-order. An extreme case of the make-to-order strategy isengineer-to-order. Here accepting an order involves both the design andproduction of a highly customized and unique product.
The way to organize the production process depends on the processestechnological characteristics and on the required production rate. Let us assumefour different products (A, B, C and D) to be produced monthly in knownquantities. Consequently a lot of units A, followed by a lot of units B, C and D are
DEPENDING ON HOW THE PRODUCTION PROCESS IS ORGANIZED
1.SINGLE LOTS2.REPETITIVE LOTS3.CONTINUOUS PRODUCTION
DEPENDING ON HOW TO SATISFY THE DEMAND
DEPENDING ON THE PREDOMINANT RESOURCES
1.CAPITAL INTENSIVE2.LABOUR INTENSIVE3.RAW MATERIALS AND ENERGY INTENSIVE
2
1
3
1.MAKE-TO-ORDER2.ASSEMBLE-TO-ORDER3.MAKE-TO-STOCK
Fig. A.4 Organizational classification criteria for production
212 Appendix: Production Management Basics
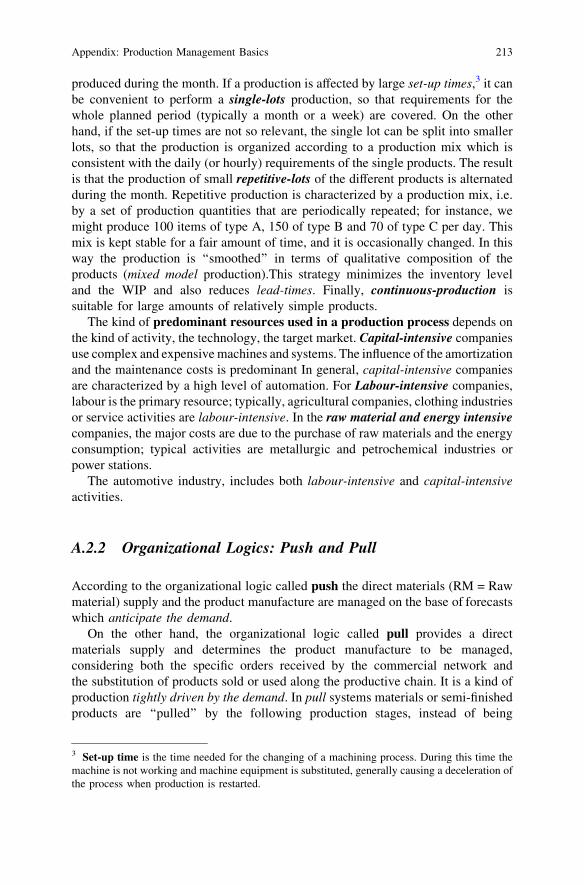
produced during the month. If a production is affected by large set-up times,3 it canbe convenient to perform a single-lots production, so that requirements for thewhole planned period (typically a month or a week) are covered. On the otherhand, if the set-up times are not so relevant, the single lot can be split into smallerlots, so that the production is organized according to a production mix which isconsistent with the daily (or hourly) requirements of the single products. The resultis that the production of small repetitive-lots of the different products is alternatedduring the month. Repetitive production is characterized by a production mix, i.e.by a set of production quantities that are periodically repeated; for instance, wemight produce 100 items of type A, 150 of type B and 70 of type C per day. Thismix is kept stable for a fair amount of time, and it is occasionally changed. In thisway the production is ‘‘smoothed’’ in terms of qualitative composition of theproducts (mixed model production).This strategy minimizes the inventory leveland the WIP and also reduces lead-times. Finally, continuous-production issuitable for large amounts of relatively simple products.
The kind of predominant resources used in a production process depends onthe kind of activity, the technology, the target market. Capital-intensive companiesuse complex and expensive machines and systems. The influence of the amortizationand the maintenance costs is predominant In general, capital-intensive companiesare characterized by a high level of automation. For Labour-intensive companies,labour is the primary resource; typically, agricultural companies, clothing industriesor service activities are labour-intensive. In the raw material and energy intensivecompanies, the major costs are due to the purchase of raw materials and the energyconsumption; typical activities are metallurgic and petrochemical industries orpower stations.
The automotive industry, includes both labour-intensive and capital-intensiveactivities.
A.2.2 Organizational Logics: Push and Pull
According to the organizational logic called push the direct materials (RM = Rawmaterial) supply and the product manufacture are managed on the base of forecastswhich anticipate the demand.
On the other hand, the organizational logic called pull provides a directmaterials supply and determines the product manufacture to be managed,considering both the specific orders received by the commercial network andthe substitution of products sold or used along the productive chain. It is a kind ofproduction tightly driven by the demand. In pull systems materials or semi-finishedproducts are ‘‘pulled’’ by the following production stages, instead of being
3 Set-up time is the time needed for the changing of a machining process. During this time themachine is not working and machine equipment is substituted, generally causing a deceleration ofthe process when production is restarted.
Appendix: Production Management Basics 213

‘‘pushed’’ ahead, as it happens for the push systems. The production in every stageof the process is activated according to the needs of the following stages.
For pull systems inventories have a smaller relevance, because the production isdriven by real demand, and anticipating the production is not necessary. TheFinished Products (FP) are delivered directly to Customers, as shown in Fig. A.5.
A classic example of pull logic is given by the Japanese system kanban(literally ‘‘tag’’): the sample of semi-finished or finished components causes thedispatch of a kanban to the previous production stages (inner departments orsupplying establishments). The production goes on in relationship to the return ofthe kanban and the supply flow is thought to be ‘‘just in time’’, re-establishingevery time the small existing stocks.
The two alternative logics (push and pull) have advantages and drawbacks. In apush system it is probable that the activities of the productive stages are notcoordinated; if the lead times are overestimated, the previous production stagespush the following stages earlier than needed, with consequent accumulation ofintermediary stocks. Besides, if following production stages jam because of acritical event, the previous stages keep on producing according to the program.This doesn’t happen in a pull system which produces only to replace theintermediary products already used. On the other hand, a pull system is not theproper system in case of productions with long lead times, when the clientsdemand should be promptly satisfied.
The choice among the two alternatives is made according to the productionprocess features and depending on the policies of marketing. When it is possible, itis certainly preferable to adopt a pull logic, eventually turning to hybrid systemswhen the lead times are articulated in several manufacturing stages and supplysources. When the supply time required by clients (determined by marketconditions) is less than the global time required for the complete productiveprocess, some activities have to be done before the orders are placed.
A classical push and pull hybrid system is the so-called assemble-to-order (seeFig. A.6): the supply of base materials and standard products modules is plannedbased on forecast, whilst the final assemblage is done only on specific clientorders. This kind of approach is a sort of border line between the two differentproduction logics. Modern ‘‘integrated computing systems’’ are used to assure the
RM FPDemand forecast
PUSH
RM FP Client order
PULL
Fig. A.5 Push and pull logics
214 Appendix: Production Management Basics
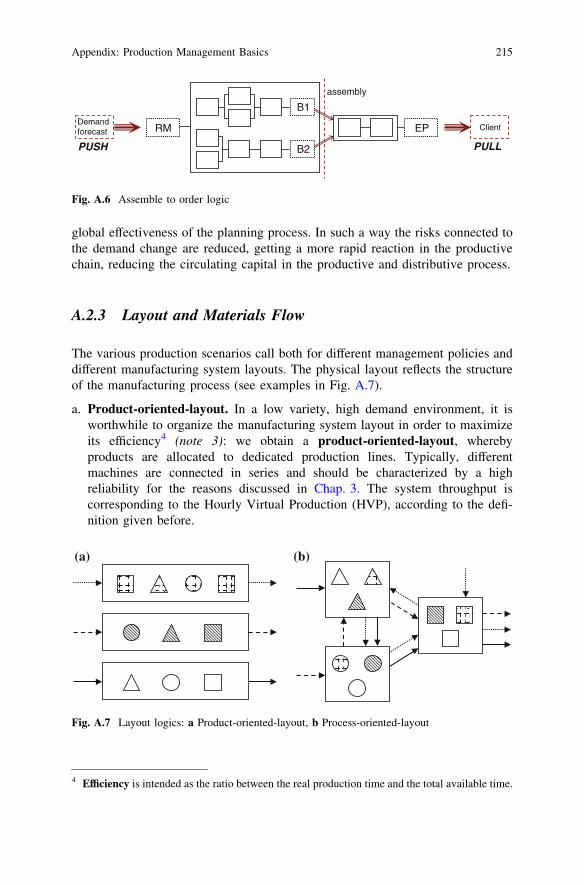
global effectiveness of the planning process. In such a way the risks connected tothe demand change are reduced, getting a more rapid reaction in the productivechain, reducing the circulating capital in the productive and distributive process.
A.2.3 Layout and Materials Flow
The various production scenarios call both for different management policies anddifferent manufacturing system layouts. The physical layout reflects the structureof the manufacturing process (see examples in Fig. A.7).
a. Product-oriented-layout. In a low variety, high demand environment, it isworthwhile to organize the manufacturing system layout in order to maximizeits efficiency4 (note 3): we obtain a product-oriented-layout, wherebyproducts are allocated to dedicated production lines. Typically, differentmachines are connected in series and should be characterized by a highreliability for the reasons discussed in Chap. 3. The system throughput iscorresponding to the Hourly Virtual Production (HVP), according to the defi-nition given before.
Demand forecast
PUSH
Client
PULL
assembly
EP
B1
B2
RM
Fig. A.6 Assemble to order logic
(a) (b)
Fig. A.7 Layout logics: a Product-oriented-layout, b Process-oriented-layout
4 Efficiency is intended as the ratio between the real production time and the total available time.
Appendix: Production Management Basics 215
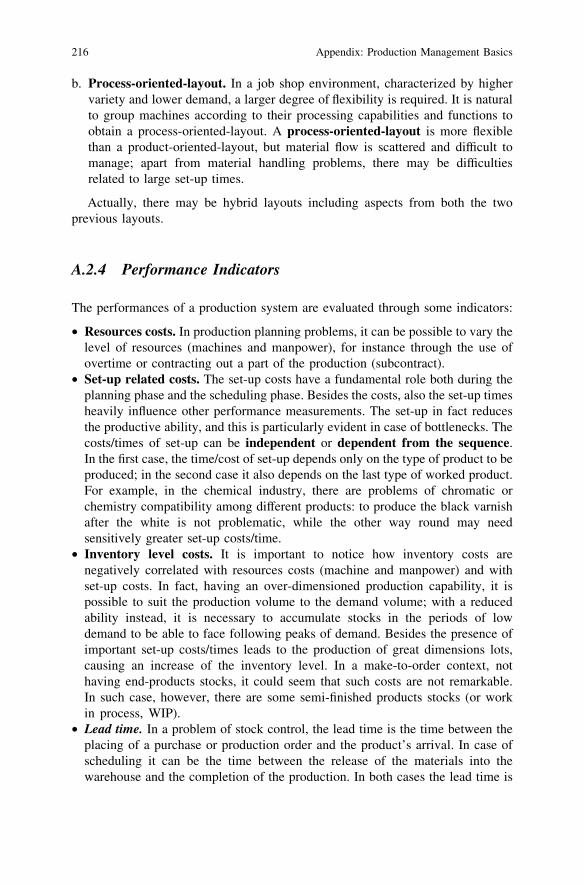
b. Process-oriented-layout. In a job shop environment, characterized by highervariety and lower demand, a larger degree of flexibility is required. It is naturalto group machines according to their processing capabilities and functions toobtain a process-oriented-layout. A process-oriented-layout is more flexiblethan a product-oriented-layout, but material flow is scattered and difficult tomanage; apart from material handling problems, there may be difficultiesrelated to large set-up times.
Actually, there may be hybrid layouts including aspects from both the twoprevious layouts.
A.2.4 Performance Indicators
The performances of a production system are evaluated through some indicators:
• Resources costs. In production planning problems, it can be possible to vary thelevel of resources (machines and manpower), for instance through the use ofovertime or contracting out a part of the production (subcontract).
• Set-up related costs. The set-up costs have a fundamental role both during theplanning phase and the scheduling phase. Besides the costs, also the set-up timesheavily influence other performance measurements. The set-up in fact reducesthe productive ability, and this is particularly evident in case of bottlenecks. Thecosts/times of set-up can be independent or dependent from the sequence.In the first case, the time/cost of set-up depends only on the type of product to beproduced; in the second case it also depends on the last type of worked product.For example, in the chemical industry, there are problems of chromatic orchemistry compatibility among different products: to produce the black varnishafter the white is not problematic, while the other way round may needsensitively greater set-up costs/time.
• Inventory level costs. It is important to notice how inventory costs arenegatively correlated with resources costs (machine and manpower) and withset-up costs. In fact, having an over-dimensioned production capability, it ispossible to suit the production volume to the demand volume; with a reducedability instead, it is necessary to accumulate stocks in the periods of lowdemand to be able to face following peaks of demand. Besides the presence ofimportant set-up costs/times leads to the production of great dimensions lots,causing an increase of the inventory level. In a make-to-order context, nothaving end-products stocks, it could seem that such costs are not remarkable.In such case, however, there are some semi-finished products stocks (or workin process, WIP).
• Lead time. In a problem of stock control, the lead time is the time between theplacing of a purchase or production order and the product’s arrival. In case ofscheduling it can be the time between the release of the materials into thewarehouse and the completion of the production. In both cases the lead time is
216 Appendix: Production Management Basics
tightly tied to the WIP, and it is not always exactly a-priori respectable. In thescheduling problems the term flow time is typically used.
• Use of resources. This is defined as the ratio between the time that a resourcespends in production and the available time. The analysis of the resource’sfunction is useful to spot bottlenecks and to improve system performances. Itmakes no sense to try to maximize the use of all resources; if one of them has abottleneck, an excessive use of the preceding resource increases the WIPwithout any advantage. In general resources use and WIP are contrastingperformance measurement.
• Productive lilt or throughput. This is defined as the number of parts producedin a given unit of time. The throughput is limited by bottlenecks and it is tied tothe WIP level. It is possible to show that, under a general hypothesis thefollowing relationship (known as law of Little) is worth:
WIP ¼ throughput � lead time
• Level of service. A 95 % service level means that in 95 % of cases the order canbe satisfied. The orders which cannot be satisfied because of a lack of materialsconstitute the backlog (or backorders) and they can only be satisfied late.
• Handling Costs. Material handling is particularly problematic in case of aprocess oriented layout. If the different departments are physically far from eachother, the wait for material handling creates a WIP and the lead time increase.
The listed indicators are described with greater detail inside Chaps. 1 and 6, withspecific reference to the productive and logistic trials in the automotive sector.
A.3 Criteria for Stock and Lots Management
A.3.1 Stocks Typologies and Relative Costs
There are many different typologies of direct materials stocks, depending on theprogress of the integrated productive process and on the need for supplycontinuity:
• End products, these are products ready to be sold or delivered to clients.• Intermediary products and semi-finished products (WIP = work in process).
These are materials still in different work stations, as well as buffer stocks.Sometimes the production stages are geographically separated, even in differentestablishments. In such cases it is necessary to guarantee the necessary stocks toallow economic transport frequencies.
• Raw materials, incoming in the transformation process. Their supply flow isconditioned by the size of the economic transport lots.
Appendix: Production Management Basics 217
• Safety stocks. They are useful to face critical situations, such as sudden changesof manufacturing program or production stops due to unexpected causes.
• Seasonal stocks. In case of products characterized by seasonal demand, it isnecessary to prearrange opportune stocks in the period of low demand to be ableto satisfy the demand in the period in which it is high.
There are many cost factors to be considered in stocks and lots management:
• Inventory related costs. These costs are due to capital immobilization, buildingrental, insurance etc.
• Order related costs. These costs are essentially related to products handling,machines set-up, bureaucratic files needed for the placing of orders.
• Customer satisfaction related costs. In case of end-products, these costs arerelated to client loss or to a brand image loss.
The last cost category, which is related to malfunctioning effects, is moredifficult to quantify and it will be specifically described in Chap. 6.
A.3.2 Classification of Stock Control Systems
The criteria of stock management can be classified according to buying ordersmanagement.
• Periodic review: the decision of whether or not to buy is taken based on aperiodical examination of inventory level. The period between two consecutiveexaminations is called the covering period. Let ‘‘I’’ be the warehouse levelfound and ‘‘Q’’ the unknown quantity to be ordered. The buying order dependson two parameters: ‘‘S’’ the inventory target level (in general equal to themaximum quantity that the warehouse can stock), and ‘‘R’’ the restock level.This criterion can be schematized in the following way:
Q ¼ 0 if I [ R;
Q ¼ S� I if I ¼\R:
The restock level (R) is useful to prevent too many small size orders, which maystrongly affect the fixed costs. In the diagram (a) of Fig. A.8 the warehousebehavior is represented, when the periodic review criterion is applied, under the(unrealistic) hypothesis of zero lead time.• Fixed order quantity (or continuous review): with this approach the order
quantity Q is constant while the ordering moment is consequently determined.In this case the warehouse level must be constantly monitored, since a new stockis ordered when the inventory level goes under the point of restock R. Theinventory level behavior is presented in diagram (b) of Fig. A.8.
218 Appendix: Production Management Basics
The lot sizing policies—used for lots management and for stock sizing—can beclassified as static or dynamic. The dynamic models are able to treat time varyingdemands, while for static models the demand is assumed to be constant. Thecomputational criteria can be deterministic or stochastic. In the first case thedemand is considered defined, while in the second case it is considered a randomvariable, defined through a probability distribution. In the following we will dealonly with deterministic models.
A.3.3 ABC Analysis and Hybrid Systems
In the previous section two classical alternative criteria of stocks managementhave been discussed, classifying them according to the kind of inventoryinspection: periodic inspection (periodic review) and continuous inspection(continuous review or fixed order quantity). Both of them have some advantagesand drawbacks: a system under periodic inspection is simpler to be managed, sinceit doesn’t require a continuous monitoring of the stocks levels and makes it easierto control the different products order; on the other hand, a system undercontinuous examination eases the producer, since the ordered quantities areconstant and not theoretically needed for safety stocks. Also in this case, it ispossible to adopt hybrid criterions, so that a part of the products is managed in oneway and the other part in the other way.
In many practical cases, the most of the overall value of the inventory stockscorresponds to a small portion of the stored products. The value of a storedproduct, in a determined period, can be expressed as the product between therelative demand rate and the unitary cost. A typical situation is represented in thegraph of Fig. A.9.
It is commonly known that 20 % of a quantity of products represent 80 % oftheir total inventory value; such products are the A class product and are consideredthe most important. On the other hand, 65 % of the inventory products is made of Cclass products, whose value is only 5 % of the total inventory value and, thereforeare not considered so important. There is then an intermediary class B, whose value
t
I
R
S
0 T 2T 3T 4T t
I
R
S
0
QQ’
T’ T’’ T’’’
Q’’’Q’’
(a) (b)
Fig. A.8 Re-ordering logics for stock management: a Periodic review, b Fixed order quantity
Appendix: Production Management Basics 219
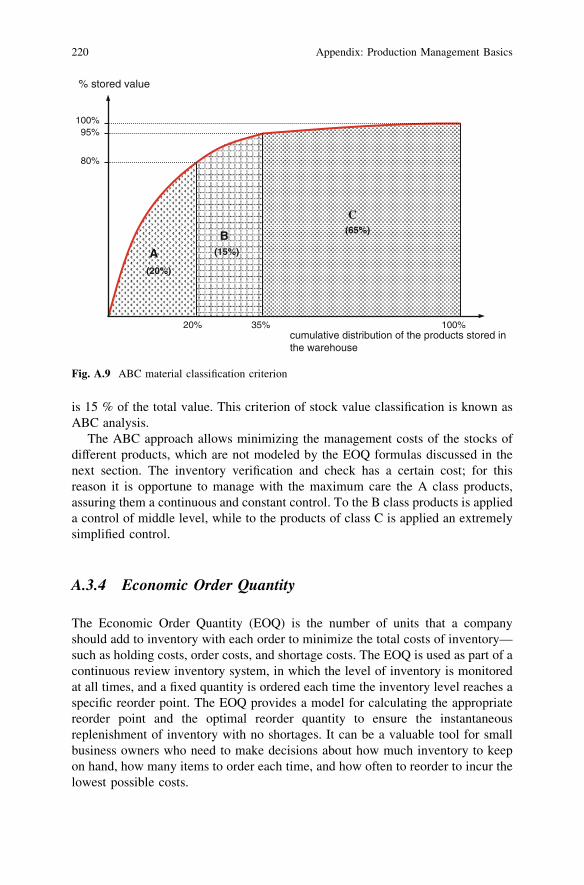
is 15 % of the total value. This criterion of stock value classification is known asABC analysis.
The ABC approach allows minimizing the management costs of the stocks ofdifferent products, which are not modeled by the EOQ formulas discussed in thenext section. The inventory verification and check has a certain cost; for thisreason it is opportune to manage with the maximum care the A class products,assuring them a continuous and constant control. To the B class products is applieda control of middle level, while to the products of class C is applied an extremelysimplified control.
A.3.4 Economic Order Quantity
The Economic Order Quantity (EOQ) is the number of units that a companyshould add to inventory with each order to minimize the total costs of inventory—such as holding costs, order costs, and shortage costs. The EOQ is used as part of acontinuous review inventory system, in which the level of inventory is monitoredat all times, and a fixed quantity is ordered each time the inventory level reaches aspecific reorder point. The EOQ provides a model for calculating the appropriatereorder point and the optimal reorder quantity to ensure the instantaneousreplenishment of inventory with no shortages. It can be a valuable tool for smallbusiness owners who need to make decisions about how much inventory to keepon hand, how many items to order each time, and how often to reorder to incur thelowest possible costs.
100%
% stored value
AB
C
95%
80%
cumulative distribution of the products stored in the warehouse
100%35%20%
(20%)
(65%)
(15%)
Fig. A.9 ABC material classification criterion
220 Appendix: Production Management Basics
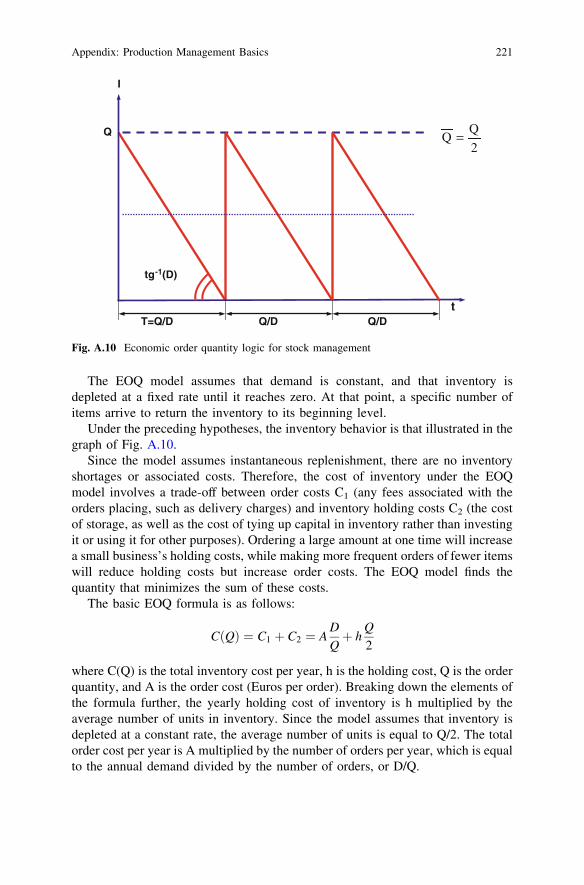
The EOQ model assumes that demand is constant, and that inventory isdepleted at a fixed rate until it reaches zero. At that point, a specific number ofitems arrive to return the inventory to its beginning level.
Under the preceding hypotheses, the inventory behavior is that illustrated in thegraph of Fig. A.10.
Since the model assumes instantaneous replenishment, there are no inventoryshortages or associated costs. Therefore, the cost of inventory under the EOQmodel involves a trade-off between order costs C1 (any fees associated with theorders placing, such as delivery charges) and inventory holding costs C2 (the costof storage, as well as the cost of tying up capital in inventory rather than investingit or using it for other purposes). Ordering a large amount at one time will increasea small business’s holding costs, while making more frequent orders of fewer itemswill reduce holding costs but increase order costs. The EOQ model finds thequantity that minimizes the sum of these costs.
The basic EOQ formula is as follows:
CðQÞ ¼ C1 þ C2 ¼ AD
Qþ h
Q
2
where C(Q) is the total inventory cost per year, h is the holding cost, Q is the orderquantity, and A is the order cost (Euros per order). Breaking down the elements ofthe formula further, the yearly holding cost of inventory is h multiplied by theaverage number of units in inventory. Since the model assumes that inventory isdepleted at a constant rate, the average number of units is equal to Q/2. The totalorder cost per year is A multiplied by the number of orders per year, which is equalto the annual demand divided by the number of orders, or D/Q.
2
QQ =
t
I
T=Q/D
Q
Q/D Q/D
tg-1(D)
Fig. A.10 Economic order quantity logic for stock management
Appendix: Production Management Basics 221
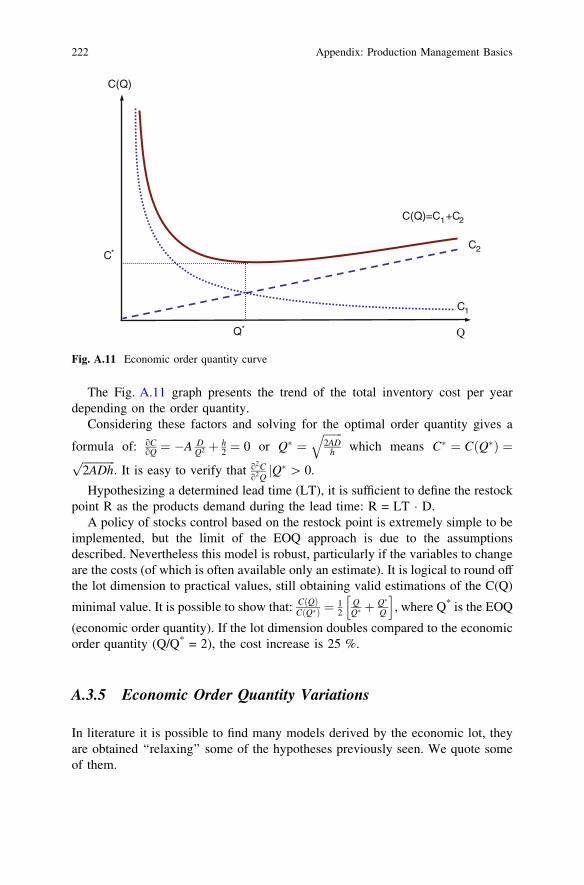
The Fig. A.11 graph presents the trend of the total inventory cost per yeardepending on the order quantity.
Considering these factors and solving for the optimal order quantity gives a
formula of: oCoQ ¼ �A D
Q2 þ h2 ¼ 0 or Q� ¼
ffiffiffiffiffiffiffi2AD
h
qwhich means C� ¼ CðQ�Þ ¼
ffiffiffiffiffiffiffiffiffiffiffiffi2ADhp
: It is easy to verify that o2Co2Q
Q�j [ 0.
Hypothesizing a determined lead time (LT), it is sufficient to define the restockpoint R as the products demand during the lead time: R = LT � D.
A policy of stocks control based on the restock point is extremely simple to beimplemented, but the limit of the EOQ approach is due to the assumptionsdescribed. Nevertheless this model is robust, particularly if the variables to changeare the costs (of which is often available only an estimate). It is logical to round offthe lot dimension to practical values, still obtaining valid estimations of the C(Q)
minimal value. It is possible to show that: CðQÞCðQ�Þ ¼ 1
2QQ� þ
Q�
Q
h i, where Q* is the EOQ
(economic order quantity). If the lot dimension doubles compared to the economicorder quantity (Q/Q* = 2), the cost increase is 25 %.
A.3.5 Economic Order Quantity Variations
In literature it is possible to find many models derived by the economic lot, theyare obtained ‘‘relaxing’’ some of the hypotheses previously seen. We quote someof them.
Q
C(Q)=C1+C2
C1
C2
Q*
C*
C(Q)
Fig. A.11 Economic order quantity curve
222 Appendix: Production Management Basics
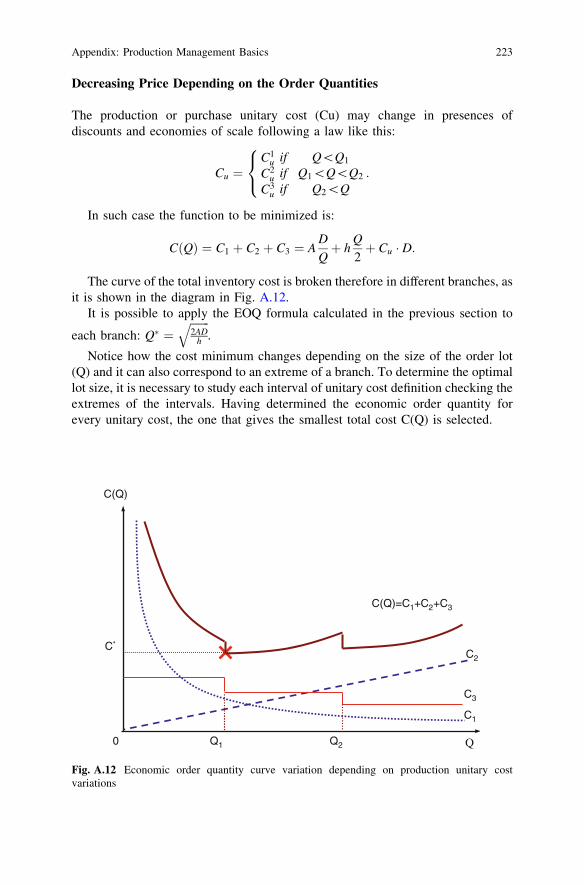
Decreasing Price Depending on the Order Quantities
The production or purchase unitary cost (Cu) may change in presences ofdiscounts and economies of scale following a law like this:
Cu ¼C1
uC2
uC3
u
8<
:
ififif
Q\Q1
Q1\Q\Q2
Q2\Q:
In such case the function to be minimized is:
CðQÞ ¼ C1 þ C2 þ C3 ¼ AD
Qþ h
Q
2þ Cu � D:
The curve of the total inventory cost is broken therefore in different branches, asit is shown in the diagram in Fig. A.12.
It is possible to apply the EOQ formula calculated in the previous section to
each branch: Q� ¼ffiffiffiffiffiffiffi2AD
h
q.
Notice how the cost minimum changes depending on the size of the order lot(Q) and it can also correspond to an extreme of a branch. To determine the optimallot size, it is necessary to study each interval of unitary cost definition checking theextremes of the intervals. Having determined the economic order quantity forevery unitary cost, the one that gives the smallest total cost C(Q) is selected.
Q
C(Q)=C1+C2+C3
C1
C2C*
C(Q)
C3
Q1 Q20
Fig. A.12 Economic order quantity curve variation depending on production unitary costvariations
Appendix: Production Management Basics 223
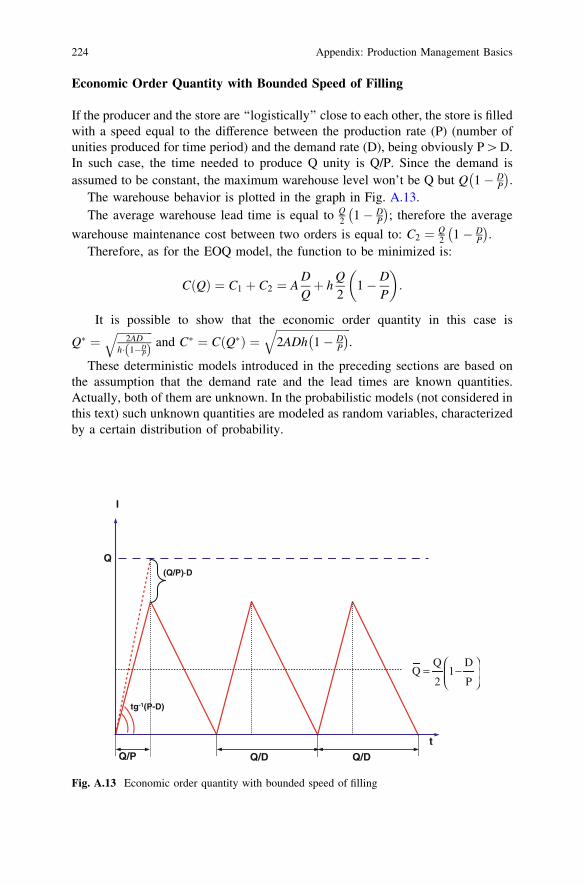
Economic Order Quantity with Bounded Speed of Filling
If the producer and the store are ‘‘logistically’’ close to each other, the store is filledwith a speed equal to the difference between the production rate (P) (number ofunities produced for time period) and the demand rate (D), being obviously P[D.In such case, the time needed to produce Q unity is Q/P. Since the demand isassumed to be constant, the maximum warehouse level won’t be Q but Q 1� D
P
� �.
The warehouse behavior is plotted in the graph in Fig. A.13.The average warehouse lead time is equal to Q
2 1� DP
� �; therefore the average
warehouse maintenance cost between two orders is equal to: C2 ¼ Q2 1� D
P
� �.
Therefore, as for the EOQ model, the function to be minimized is:
CðQÞ ¼ C1 þ C2 ¼ AD
Qþ h
Q
21� D
P
� �
:
It is possible to show that the economic order quantity in this case is
Q� ¼ffiffiffiffiffiffiffiffiffiffiffiffiffi
2ADh� 1�D
Pð Þq
and C� ¼ CðQ�Þ ¼ffiffiffiffiffiffiffiffiffiffiffiffiffiffiffiffiffiffiffiffiffiffiffiffiffiffiffi2ADh 1� D
P
� �q.
These deterministic models introduced in the preceding sections are based onthe assumption that the demand rate and the lead times are known quantities.Actually, both of them are unknown. In the probabilistic models (not considered inthis text) such unknown quantities are modeled as random variables, characterizedby a certain distribution of probability.
t
I
Q/P
Q
Q/D Q/D
tg-1(P-D)
(Q/P)⋅
Q DQ 1
2 P
⎛ ⎞= −⎜ ⎟⎝ ⎠
⋅D
Fig. A.13 Economic order quantity with bounded speed of filling
224 Appendix: Production Management Basics
A.3.6 Smallest Sustainable Lot Size
To determine the dimension of the production lot it is necessary to consider theeffect of set-up times, in presence of production constraints. In other words, it isopportune to verify that the production is realizable in the planned lead time, notonly considering some working cycle times, but also of the set-up times needed tochange the machining, including the production losses due to the lot starting,whose incidence increases with the decreasing of the lot dimension.
To study the problem, in the following we describe a model based on thefollowing hypotheses:
• N different articles or sketch-elements (for ex. A, B, C, D) must be produced onthe same working machine and with the same cycle time. For each article QPn
pieces must be produced.• The production of the various articles is organized in repetitive cycles (for
example A–B–C–D A–B–C–D etc..). For each different article the lot size isproportional to the respective quantities to produce.
• The machines set-up is done before the production of each lot.• The set-up times are the same for every typology of products and they do not
depend on the size of the lots to produce.• The machine’s unavailability due to breakdowns or to programmed maintenance
interventions, is ignored, assuming that it does not depend on the frequency ofthe set-up.
With reference to the definitions given in Sect. 3.2, we consider the followingquantities:
SOT [min./piece]
The standard operation time is the time needed for a machining cycle; it issupposed to be the same for all the types of articles to be produced
N Number of different articles to be producedAWT [h] Available working time to produce the scheduled articlesUST [pcs] Unitary set-up time: inactivity time due to the machines set-up (UST = set-
up time/SOT); actually it is the number of pieces that could be producedduring the set-up time
LTP [pcs] Lot turnover period in production neglecting the set-up times, defined as anumber of SOT; under the hypothesis of equal SOT for all the articles, theLTP is actually equal to the total number of articles produced during acomplete lots turnover
HVP [pcs/h] Hourly virtual production obtainable without machining changes(HVP = 60/SOT)
QPn [pcs] quantity of elements of the nth article to be produced in the available workingtime (AWT)
QPTOT [pcs]Total number of elements to be produced (QPTOT ¼
PN
nQPn)
qn Ratio between the programmed quantity of the n-th article and the totalproduction: (qn = QPn / QPTOT).
Appendix: Production Management Basics 225

The percentage of set-up times on the working time is given by: N�USTLTP .
The available productive capability is equal to:
APC ¼ AWT � HVP=ð1þ N � UST
LTPÞ
If the production strategy is to produce in order to get a good products mix, it isinteresting to calculate the smallest value of sustainable LTP able to guarantee theplanned production program, both in terms of total quantity and mix.
Let us consider the required production capability (X), as a dependent variable.Obviously it must be X B APC. We are interested in the quantity Y = smallestsustainable LTP, as a function of X.
We can define X through the following mathematical relationship: X ¼ HVP�AWT1þN�UST
yð Þ :
Expressing Y as a function of X: yðxÞ ¼ N�USTHVP�AWT
x �1ð Þ :Figure A.14 describes the y(x) behavior.The smallest sustainable lot size Ln, min i.e. the quantity of the n-th article to
be produced in each turnover period is: Ln, min = y � qn. The resultant value must berounded toward the bigger unity.
First feasibility verification: in order to adopt a repetitive lot productionstrategy the available working time must be necessary at least to adopt a single lotsproduction strategy (i.e. to produce first all the scheduled A products, then B, Cand so on).On the other hand if it is not possible to adopt a single lots productionstrategy then a repetitive lots production strategy is even more impossible torealize because of the set-up time incidence.
SOT
60� QPTOT þ N � USTð Þ�AWT :
y = LTP
x HVP ⋅AWT x = QPTOT
y(x)
Fig. A.14 Smallest sustainable lot size trend
226 Appendix: Production Management Basics
As it is possible to notice from the inequality above, the number of set-ups in asingle lots production is equal to N.
The number of necessary lots turnover (LTN) is equal to QPTOTPN
n
Ln;min
rounded
towards the bigger units.Second feasibility verification: considering the rounding off done, it is
reasonable to verify the following temporal constraint:
LTN � turnover duration�AWT ) LTN � SOT
60�Xn
n
An;min þ N � UST
!
�AWT
In order to satisfy the second feasibility condition, a practical suggestion is toreserve a part of the AWT as spare time and to introduce a slightly smaller(5–10 %) AWT in the LTP calculation. For example if AWT = 8 h it is possible tocalculate LTP, introducing in the formula a TED equal to 7.5 h, reserving a sparetime of half an hour to the production. As a result of the rounding off introduced,the resulting TED will be definitely slightly larger than the scheduled 7.5 h, butstill smaller than the limit of 8 h.
Conclusive considerations on this theme:
1. The smallest sustainable lot size grows with the set-up time (UST) and thenumber of different elements to be produced. It decreases with an increase ofproduction capacity.
2. The set-up time incidence increases with the number of different elements to beproduced. For this reason it is important to adopt technical and organizationalsystems designed to reduce the set-up time the most possible.
3. The smallest sustainable lot approach is typical of pull production systems,while the EOQ production strategy is peculiar to push systems.
A.4 Problems Connected to the Planning Horizon
To manage production it is necessary to predispose the necessary resources,considering the product’s sales forecast and coordinating the materials flowscoming into the process of transformations and the outgoing end products.
To that purpose, it is necessary to predispose an effective strategic planning,following the criteria described in Chap. 1, in order to assign and to opportunelyallocate production resources. The temporal horizon to be considered for strategicplanning depends on the activity typologies: the required lead times for the product’sdevelopment and for their industrialization depend on the product technologicalcomplexity and on the necessary characteristics of the manufacturing systems.
Production planning is strictly connected to strategic planning, but in differentways depending on production management logic. Its main aim is that of regulatingorder fulfillment, according to a client’s agreement. The operational planning
Appendix: Production Management Basics 227
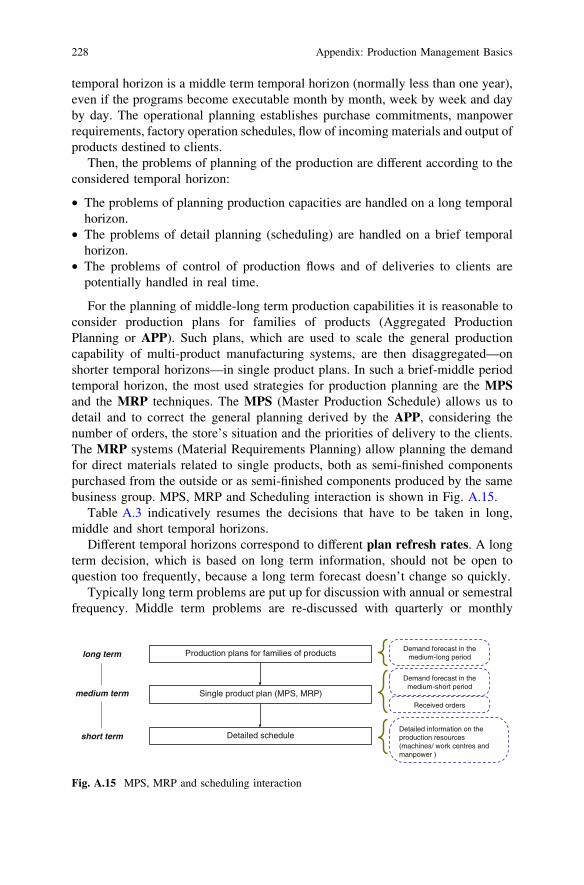
temporal horizon is a middle term temporal horizon (normally less than one year),even if the programs become executable month by month, week by week and dayby day. The operational planning establishes purchase commitments, manpowerrequirements, factory operation schedules, flow of incoming materials and output ofproducts destined to clients.
Then, the problems of planning of the production are different according to theconsidered temporal horizon:
• The problems of planning production capacities are handled on a long temporalhorizon.
• The problems of detail planning (scheduling) are handled on a brief temporalhorizon.
• The problems of control of production flows and of deliveries to clients arepotentially handled in real time.
For the planning of middle-long term production capabilities it is reasonable toconsider production plans for families of products (Aggregated ProductionPlanning or APP). Such plans, which are used to scale the general productioncapability of multi-product manufacturing systems, are then disaggregated—onshorter temporal horizons—in single product plans. In such a brief-middle periodtemporal horizon, the most used strategies for production planning are the MPSand the MRP techniques. The MPS (Master Production Schedule) allows us todetail and to correct the general planning derived by the APP, considering thenumber of orders, the store’s situation and the priorities of delivery to the clients.The MRP systems (Material Requirements Planning) allow planning the demandfor direct materials related to single products, both as semi-finished componentspurchased from the outside or as semi-finished components produced by the samebusiness group. MPS, MRP and Scheduling interaction is shown in Fig. A.15.
Table A.3 indicatively resumes the decisions that have to be taken in long,middle and short temporal horizons.
Different temporal horizons correspond to different plan refresh rates. A longterm decision, which is based on long term information, should not be open toquestion too frequently, because a long term forecast doesn’t change so quickly.
Typically long term problems are put up for discussion with annual or semestralfrequency. Middle term problems are re-discussed with quarterly or monthly
Production plans for families of products
Single product plan (MPS, MRP)
Detailed schedule
Demand forecast in the medium-long period
Demand forecast in the medium-short period
Received orders
long term
medium term
short termDetailed information on the production resources (machines/ work centres and manpower )
Fig. A.15 MPS, MRP and scheduling interaction
228 Appendix: Production Management Basics
frequency. Short term problems are revised week by week and day by day, whilethe control of the productive flows and the dispatches to the clients is done in realtime.
In the following sections the adopted techniques for working planning aredescribed, independently of the production contexts. In Chap. 6 such matters arepicked up and widened with specific reference to the automobile production.
A.5 Aggregate Production Planning
The aim of Aggregate Production Planning (APP) is to determine production,inventory, and workforce levels in order to meet a time-varying demand pattern. TheAPP problem pertains to strategic decision levels; therefore, APP models representsuitable aggregations of manufacturing systems. Aggregation has different facets:
• Similar products are often grouped in families; in this way the uncertainty indemand is reduced, since it is easier to forecast the demand for a family of itemsthan for the single item (see the scheme below);
Table A.3 Problems and decision making in production planning management
Temporal horizon Duration More representative decisions
Long term(strategic problems)
Several years • Marketing strategies• Make or buy policies• Products range plan• Decisions about activity levels• Choice of technological solutions• Production resources allocation• Decisions about industrial cooperation• Purchase commitment• Planning of production capabilities• Staff development plans• Quality policies• Financial plans
Medium term(tactical problems)
Annual/three-monthly • Sales promotion• Production capability adjustment• Material supply plan• Personnel recruitment• Quality control plan• Annual budget and quarterly revisions
Short term(problems of scheduling)
Monthly/weekly/daily
• Working times of industrial installation• Assignment of working tasks• Restocking planning• Production flows management• Production process control• Clients deliveries management• Emergency interventions
Appendix: Production Management Basics 229
• Time is discretized in relatively large time-buckets; this means that more thanone product/family is produced during each time-bucket, but no sequencingdecision is taken;
• Resources are grouped in work-centers; since we are not concerned with short-term scheduling at this level, it does not make sense to specify which machine ina work-center will carry out a certain job.
Such aggregation implies that what is obtained is not a detailed productionschedule, but only a rough-cut indication of what should be done (Fig. A.16).
Aggregation has to consider the production factors which are considered morebinding for the levels of activity. For instance:
• Strategic raw materials;• General and specific manufacturing systems;• Workforce.
To develop the aggregate production plan, it is necessary to have a middle-longterm demand forecast, organized for families of products and for lines ofproduction.
A.5.1 APP in the Case of Single Aggregated Product
Hypothesizing to have only a single aggregated product whose demand forecast isknown in the middle-long period, for instance within six months, the cumulateddemand curve is traced in Fig. A.17.
There are different strategies for planning the production in order to satisfy theforecasted demand. To didactic purpose, two opposite alternatives are nowillustrated (see also diagrams in Fig. A.18).
(a) Level strategy—using inventory as the lever: With this strategy, a stablemachine capacity And workforces are maintained with a constant output rate.Shortages and surpluses result in inventory levels fluctuating over time. In thiscase production is not synchronized with demand. Either inventories are builtup in anticipation of future demand or backlogs are carried over from high to
A B C D E F G HReal products
Aggregated products A1 A2
Product family Product family
Fig. A.16 Product aggregation logic
230 Appendix: Production Management Basics

low demand periods. Employees benefit from stable working conditions. Adrawback associated with this strategy is that large inventories mayaccumulate and customers’ orders may be delayed. This strategy keepscapacity and costs of changing capacity relatively low. It should be used wheninventory carrying and backlog costs are relatively low.
(b) Chase strategy—using capacity as the lever: With this strategy, theproduction rate is synchronized with demand rate by varying machine capacityor hiring and laying off employees as the demand rate varies. In practice,achieving this synchronization can be very problematic because of thedifficulty of varying capacity and workforce on short notice. This strategy canbe expensive to implement if the cost of varying machine or labor capacityover time is high. It can also have a significant negative impact on the morale
t [months] 1 2 3 4 5 6d [pcs/month]t 30 30 120 90 60 30d cumulatet 30 60 180 270 330 360
cumulate demand
0
30
60
90
120
150
180
210
240
270
300
330
360
1 2 3 4 5 6month
Fig. A.17 Cumulated demand curve for a single aggregated product
(a) Level Strategy (b) Chase Strategy
0306090
120150180210240270300330360390
1 2 3 4 5 6
Strategia Magazzino Costante
0306090
120150180210240270300330360390
1 2 3 4 5 6
Cumulate demand
Level strategy cumulateLevel strategy cumulate with an initial stock of 30 units
Cumulate demandChase strategy cumulate with an initial stock of 30 units
Chase Strategy
months
Level Strategy
mesi
Fig. A.18 Production planning alternatives
Appendix: Production Management Basics 231

of the workforce. The chase strategy results in low levels of inventory in thesupply chain and high levels of change in capacity and workforce. It should beused when the cost of carrying inventory is very high and costs to changelevels of machine and labor capacity are low.
The two proposed strategies are two extreme admissible solutions. In realitystrategies can be built combining the preceding ones. For instance it is possible tokeep producing at a constant rate, but changing it in correspondence to demandpeaks.
The aggregate production planning involves a preventive analysis of feasibility.For instance, after having planned the production, it is necessary to verify theresource’s availability in terms of machines and workforce; if the availability isnot enough it is necessary to increase it or to do overtime or sub-contracts.
A.6 Master Production Schedule
The Master Production Schedule (MPS) is a typical support for operationaldetailed planning, regarding the brief-middle term temporal horizon. The MPS isbuilt from aggregate production planning (APP). The products aggregated in‘‘families’’ or ‘‘lines of production’’ are separated into individual products. Theproduction is separately planned, based on orders already received or on brief-middle term sale forecasts. The middle-long term sale forecasts for a singleproduct are inevitably uncertain, because of the subjectivity of the orders. That isthe reason why in the middle-long term temporal horizon, the planning isdeveloped in an aggregate way, for families or product lines (APP).
The planning temporal terms (time bucket) are reduced as soon as the period ofexecution of the programs gets closer: time buckets pass from monthly bucket toweekly or daily bucket.
Summarizing, the MPS defines in a detailed way the coarse APP planning,considering every single product, in a shorter and therefore less mutable temporalhorizon. For instance, if the APP foresees producing 100 units of the aggregatedproduct P1 in a certain month, through the MPS it is decided what is the singleproduct combination to be realized (for example 25 type A products, 45 type B and
Single product
Aggregate product
A B C
P1
Demand forecast in the short-medium period
Received orders
APP in the medium-long period
Production scheduling in the short-medium period (MPS)
input output
Definition of the single products mix
Fig. A.19 MPS logic, input and output
232 Appendix: Production Management Basics
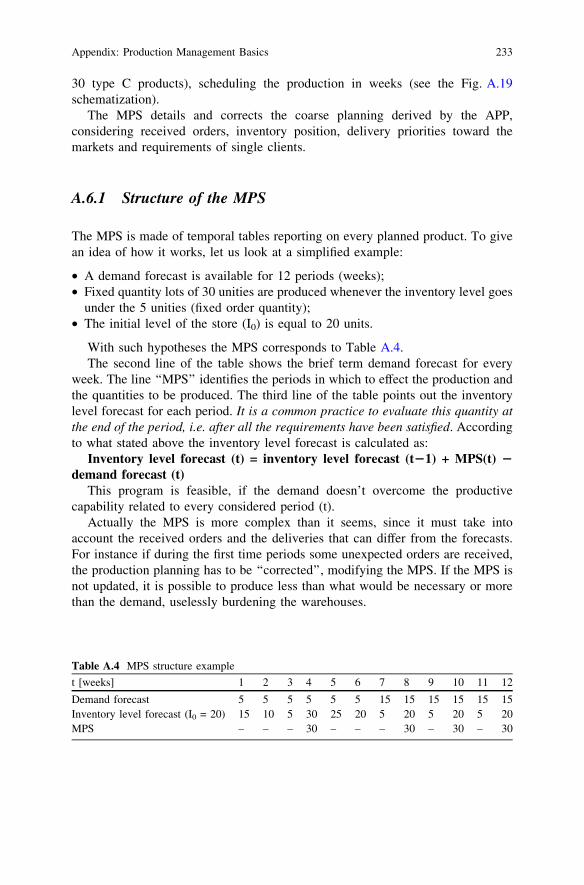
30 type C products), scheduling the production in weeks (see the Fig. A.19schematization).
The MPS details and corrects the coarse planning derived by the APP,considering received orders, inventory position, delivery priorities toward themarkets and requirements of single clients.
A.6.1 Structure of the MPS
The MPS is made of temporal tables reporting on every planned product. To givean idea of how it works, let us look at a simplified example:
• A demand forecast is available for 12 periods (weeks);• Fixed quantity lots of 30 unities are produced whenever the inventory level goes
under the 5 unities (fixed order quantity);• The initial level of the store (I0) is equal to 20 units.
With such hypotheses the MPS corresponds to Table A.4.The second line of the table shows the brief term demand forecast for every
week. The line ‘‘MPS’’ identifies the periods in which to effect the production andthe quantities to be produced. The third line of the table points out the inventorylevel forecast for each period. It is a common practice to evaluate this quantity atthe end of the period, i.e. after all the requirements have been satisfied. Accordingto what stated above the inventory level forecast is calculated as:
Inventory level forecast (t) = inventory level forecast (t21) + MPS(t) 2demand forecast (t)
This program is feasible, if the demand doesn’t overcome the productivecapability related to every considered period (t).
Actually the MPS is more complex than it seems, since it must take intoaccount the received orders and the deliveries that can differ from the forecasts.For instance if during the first time periods some unexpected orders are received,the production planning has to be ‘‘corrected’’, modifying the MPS. If the MPS isnot updated, it is possible to produce less than what would be necessary or morethan the demand, uselessly burdening the warehouses.
Table A.4 MPS structure example
t [weeks] 1 2 3 4 5 6 7 8 9 10 11 12
Demand forecast 5 5 5 5 5 5 15 15 15 15 15 15Inventory level forecast (I0 = 20) 15 10 5 30 25 20 5 20 5 20 5 20MPS – – – 30 – – – 30 – 30 – 30
Appendix: Production Management Basics 233
A.7 Material Requirements Planning
The final product demand is considered independent, because it comes fromfactors, such as the market demand, which are external to the production process.On the contrary, the subcomponents demand is considers dependent, because it istightly connected to the finished product demand. For the elaboration of theMaterial Requirements Planning (MRP) each product is broken down in terms ofsubcomponent and relative base materials, according to what established by thebill of material (BOM), as we have seen in the precedent Sect. 2.3.
Both the two policies of stocks management (periodic review, fixed orderquantity) can result unsatisfactory, when the market demand is affected by short-middle term variations since they assume a constant market demand. On the otherend the stocks management policies discussed have the advantage of being simpleand doesn’t necessarily require the use of information systems.
To avoid this assumption in the sixties the Material Requirements Planning(MRP) system has been introduced.
The MRP systems allow to plan the material demand, both for semi-finishedproducts that are purchased from the outside, and for semi-finished productsproduced inside the company. The MRP systems are very useful for the stockmanagement in order to define the quantity or the time periods in which topurchase or to produce. The MRP has a short brief temporal horizon (generallyfew weeks).
The logic of the MRP is a production planning logic:
• Which supposes an unlimited production capability;• Which is directed towards a stocks reduction.
The production capability constraint is not directly taken into account, but it isconsidered through its principal effect, which is the creation of delays, which forceto arrange the production or purchase orders with enough advances in comparisonto the demand. The advance is equal to a lead time a-priori fixed. For instance ifduring the n-th time bucket there is a requirement for 20 unities of a certainproduct and the fixed lead time is equal to 3 periods, then the order is planned forthe time bucket n-3. Such process is called lead time offsetting.
The MRP data structure is constituted by a chart, called MRP record. Thetemporal horizon is divided in periods called time buckets that at the verybeginning were monthly. Thanks to the evolution of the processors time bucketspassed from being monthly to weekly and then daily. In the MRP tables (presentedin the following) the following information are reported period by period:
• Gross requirements (GS). They express the demand forecast during each timebucket. The gross requirements of the end-products correspond to the MPSplanning, which gives a projection of the future production. The grosscomponents requirements depend on the received demand of the aggregatedproduct.
234 Appendix: Production Management Basics
• Scheduled receipts (SR). They correspond to the orders (of production orpurchase) already placed, that are expected to be satisfied at the begging of acertain time bucket.
• On-hand inventory (OH). It is the inventory level at the end of every timebucket, after that all the orders have been satisfied. The inventory level for theMRP is not said to be equal to the available inventory level: in fact, all the deadstock of defective or expired elements (in case of materials affected bydeterioration) and of elements assigned to other production plans must beexcluded.
• Net requirements (NR) are obtained from the gross requirements, applying theaforesaid ‘‘net-ification’’.
• Planned order receipts (OP). Purchase/production orders, whose accomplish-ment is programmed in correspondence of every time period; they are obtainedfrom the net requirements considering the lot sizing criterions adopted.
• Planned order releases (OR). Purchase/production orders placed in eachconsidered time bucket; they are obtained from the planned orders consideringthe lead time offsetting.
The MRP logic proceeds recursively beginning from the end-products, goingdown along the bill of material and ‘‘exploding’’ the requirements of each end-product, also considering the necessary times to put into production the orders inall the levels of the integrated production process.
The necessary information for the construction of the MRP is:
• The BOM of all the end and intermediary products;• The MPS related to the single products, that is the respective gross requirements;• The initial inventory and safety stocks situation;• Lot sizing rules used (quoted in the following);• Situation of the scheduled receipts, related to the orders of end-products and
sub-components which have been issued in the preceding time buckets;• Information about the lead times.
Let consider the example in the underlying tables. An end-product P1 needs theproduction of a subgroup P2; the production of a subgroup P2 in turn needs theproduction of two components P3 (according to the Bill of Material). 10 unities of P1and 20 unities of P2 are available in the warehouse; besides a delivery of20 unities P2 is expected at the beginning of the third week. The lead time for P1 isone week, two weeks for P2 and three weeks for P3. The lots sizing is banal for P1 andP2; the lot size correspond to the net requirements (this rule of lot sizing is known aslot-for-lot). For P3, it is hypothesized, instead, that the orders have a constraint: thesize of the order must be a multiple quantity of 50 unities (fixed order quantity).
This information is usually gathered in a resuming table that is defined as itemmaster file, as shown in Table A.5.
Starting from these data (see Table A.5), the net requirements are calculatedand the placing of the orders is planned. The arrows in Table A.6 point out theadvantage necessary to satisfy the demand.
Appendix: Production Management Basics 235
As it can be observed, the MRP allows elaborating a planning starting from theestablished moment of the end-product delivery, in order to define the moments inwhich to effect the placing of the orders and the relative production period of eachcomponent elements, specifying the relative quantities.
If the lead times are correctly estimated, the MRP logic allows to optimize thestocks and the WIP (work in process), since it synchronizes the production of thenecessary components for the assemblages. In this way the materials become
Table A.5 Item master file
Item master file
Product/component
Initial inventorylevel (OH0)
Safetystocks
Lead time Scheduledreceipts
Rule oflot sizing
P1 10 unity – 1 time bucket – Lot-for-lotP2 20 unity – 2 time buckets 20 unity during
the time bucket 3Lot-for-lot
P3 – – 3 time buckets – Fixed orderquantity(Q = n • 50)
Table A.6 Net requirement calculation example
P1
P2 (x1)
P3 (x2)
Bill of Material
End-product P1 (Lead time= 1 week)T [weeks] 1 2 3 4 5 6 7 8
(GR) gross requirements = MPS 50 60(SR) scheduled receipts(OH) on-hand OH0=10 10 10 10 10 0 0 0 0(NR) net requirements 40 60(OP) planned orders receipts 40 60(OR) planned orders releases 40 60
sub-component P2t [weeks] 1 2 3 4 5 6 7 8
(GR) gross requirements 40 60(SR) scheduled receipts 20*(OH) on-hand OH0=20 20 20 40 0 0 0 0 0(NR) net requirements 60(OP) planned orders receipts 60(OR) planned orders releases 60
* notice how the delivery of 20 unities of the under-component P2, attended for the period 3 could be delayed of one period, not to uselessly burden the warehouse.
sub-component P3t [weeks] 1 2 3 4 5 6 7 8
(GR) gross requirements 120(SR) scheduled receipts(OH) on-hand OH0=0 0 0 0 30 30 30 30 30(NR) net requirements 120(OP) planned orders receipts 150(OR) planned orders releases 150
236 Appendix: Production Management Basics
available in the moment in which they are necessary. Once placed, the plannedorders become operative and they are turned into scheduled receipts. To launch anorder with too much advance is unadvisable since the stocks can burden thewarehouses and it is difficult to modify an operative order to conform itself to thechanges of the MPS.
To counterbalance the demand uncertainties, the MRP has to be updated with acertain frequency, introducing the occurred variations. In the requirementscalculation it is possible to plan the necessary safety stocks; in this way the netrequirements are not produced not when the inventory is empty, but when it goesunder a certain threshold. The safety stocks allow to cope with the peaks ofdemand, and to make up for to possible delays.
When more components of the same type are necessary to assemble a parentproduct, as for P3 in the preceding example, the number of parent product ordersmust be multiplied for the quantity of necessary sub-components to assemble asingle parent product. Such number can be overestimated to consider of the realperformance of the production process in order to compensate the number ofdefective parts. For example, to forehead of a net clean requirement of 100 pieces,an order of 110 pieces can be placed, assuming that around 10 pieces will bedefective. Naturally this approach is discussable, since it assumes that the defect isnoticed after the produced lot has been stored into the warehouse.
In the shown examples it is assumed that the products requirements and thedead stocks in inventory are quantified in numerical terms and not in terms ofweight or volume.
A.7.1 Lot Sizing in the MRP Systems
The rules of lot-sizing in the MRP packets have been object of researches.Nevertheless there are not sure ‘‘recipes’’ for the adoption of a rule of lot-sizing.There are varying quantity rules for which the inventory level is null at the end ofthe horizon of planning (unless a safety stocks level has been specified); this is thecase of the rule lot-for-lot, adopted for the products P1 and P2 of the precedingexample. For product P3, the fixed order quantity rule is adopted instead, with theconsequence that at the end of the horizon of 8 weeks, there is still a dead stock of30 pieces. It follows a brief description of the most common rules of lot sizing.
• The fixed order quantity (FOQ) rule a-priori fixes the order quantity. Sometimessuch policy is made necessary by the technological process that furnishes the lotsin fixed quantity, or from the possibility to order only a fixed quantity (or multipleof a given quantity) from the suppliers. The fixed quantity to be ordered can also becalculated applying the rule of the economic order quantity (EOQ). This requiresto determine the average demand per period basing on the requirements.Hypothesizing a fixed cost (A) equal to 100 and an unitary cost for a dead stock (h)
Appendix: Production Management Basics 237
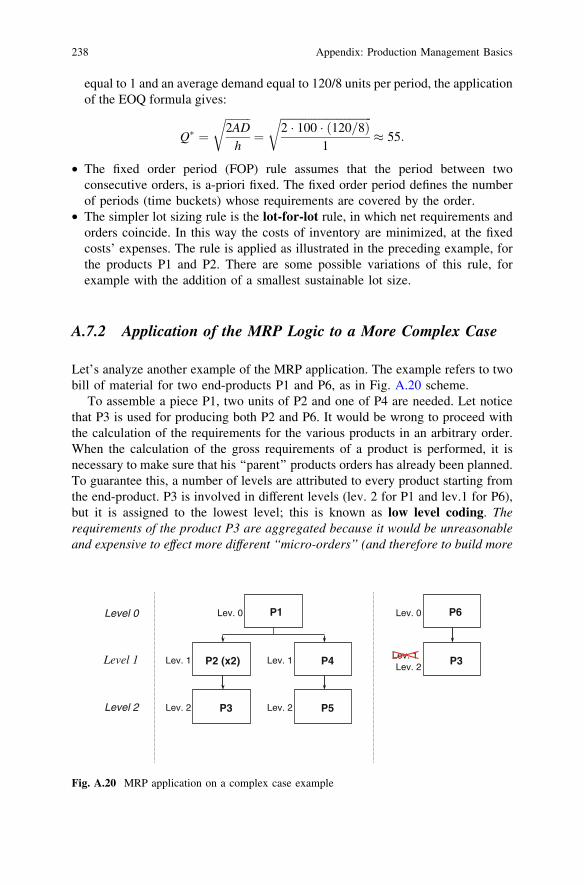
equal to 1 and an average demand equal to 120/8 units per period, the applicationof the EOQ formula gives:
Q� ¼ffiffiffiffiffiffiffiffiffi2AD
h
r
¼ffiffiffiffiffiffiffiffiffiffiffiffiffiffiffiffiffiffiffiffiffiffiffiffiffiffiffiffiffiffiffiffiffi2 � 100 � 120=8ð Þ
1
r
� 55:
• The fixed order period (FOP) rule assumes that the period between twoconsecutive orders, is a-priori fixed. The fixed order period defines the numberof periods (time buckets) whose requirements are covered by the order.
• The simpler lot sizing rule is the lot-for-lot rule, in which net requirements andorders coincide. In this way the costs of inventory are minimized, at the fixedcosts’ expenses. The rule is applied as illustrated in the preceding example, forthe products P1 and P2. There are some possible variations of this rule, forexample with the addition of a smallest sustainable lot size.
A.7.2 Application of the MRP Logic to a More Complex Case
Let’s analyze another example of the MRP application. The example refers to twobill of material for two end-products P1 and P6, as in Fig. A.20 scheme.
To assemble a piece P1, two units of P2 and one of P4 are needed. Let noticethat P3 is used for producing both P2 and P6. It would be wrong to proceed withthe calculation of the requirements for the various products in an arbitrary order.When the calculation of the gross requirements of a product is performed, it isnecessary to make sure that his ‘‘parent’’ products orders has already been planned.To guarantee this, a number of levels are attributed to every product starting fromthe end-product. P3 is involved in different levels (lev. 2 for P1 and lev.1 for P6),but it is assigned to the lowest level; this is known as low level coding. Therequirements of the product P3 are aggregated because it would be unreasonableand expensive to effect more different ‘‘micro-orders’’ (and therefore to build more
Lev. 1P2 (x2) P4
P3 P5
P1 P6
P3
Level 0
Level 1
Level 2 Lev. 2
Lev. 1
Lev. 0 Lev. 0
Lev. 2
Lev. 2
Lev. 1
Fig. A.20 MRP application on a complex case example
238 Appendix: Production Management Basics
MRP) for a same sub-component. The data to build the MRP are shown in theunderlying item master file (Table A.7).
The calculation of the requirements proceeds, level for level, as illustrated inthe MRP Table A.8, that is substantially self-explanatory.
In the moment in which the demand for a certain product cannot be satisfiedthanks to the scheduled receipts (SR) or thanks to the on-hand (OH), the netrequirement (NR) of every product is equal to the gross requirement (GR). Moreprecisely: NR(t) = GR(t) - (OH(t-1) + SR(t)).
Once calculated the net requirement and considering the selected rule of lot-sizing, it is possible to plan the orders.
It is worth to underline as the gross requirements for P3 are given by the sum ofthe planned orders releases for P2 and P6. Besides, the P3 MRP shows the effect ofthe safety stocks; in the period 3, despite a requirement of 100 pieces and anavailability of 40, the net requirement is of 80 pieces and not 60. To facilitate thecalculations, the safety stocks can be systematically subtracted from the on-hand;in this case the initial availability of P3 is only of 20 pieces (40–20) rather than 40.
Inside the MRP it is possible to correct the scheduled receipts, bringing themforward or backward, to make the MRP admissible or to optimize the inventory.There are two types of rectifications:
(1) Expediting: a request to anticipate the scheduled receipt in comparison to theplanned period in order to be ready in case of a demand peak;
(2) Deferring: a request to delay the scheduled receipt in comparison to theplanned period, not to burden the inventory in the periods of low demand.
The expediting and the deferring are rectifications that cannot always begranted, both in the case the supplier is internal or external, because it may involve
Table A.7 Item master file example 1
Item master file
Product/compon.
BOMlevel
Initial inv.lev. (OH0)
Safetystocks
Leadtime
Scheduledreceipts
Rule oflot sizing
P1 0 30 units – 1 period – Lot-for-lotP2 1 – – 2 periods – Lot-for-lotP3 2 40 units 20 units 1 period – Fixed order quantity
(Q = n(50)P4 1 – – 1 period 20 units during
the period 3Lot-for-lot
P5 2 – – 2 periods – Fixed order period(3 periods)
P6 0 – – 1 period – Fixed order period(3 periods)
t [weeks] 1 2 3 4 5 6 7 8
MPS (P1) 20 40 20MPS (P6) 30 10 10
Appendix: Production Management Basics 239
Table A.8 MRP table example 1
End-product P1t [weeks] 1 2 3 4 5 6 7 8
(GR) gross requirements 20 40 20(SR) scheduled receipts(OH) on-hand OH0=30 30 10 10 10 10 0 0 0(FN) net requirements 30 20(OP) planned orders receipts 30 20(OR) planned orders releases 30 20
End-product P6t [weeks] 1 2 3 4 5 6 7 8
(GR) gross requirements 30 10 10(SR) scheduled receipts(OH) on-hand OH0=0 0 0 0 10 0 0 0 0(FN) net requirements 30 10 10(OP) planned orders receipts 40 10(OR) planned orders releases 40 10
Sub-component (Lev. I) P2t [weeks] 1 2 3 4 5 6 7 8
(GR) gross requirements 60 40(SR) scheduled receipts(OH) on-hand OH0=0 0 0 0 0 0 0 0 0(FN) net requirements 60 40(OP) planned orders receipts 60 40(OR) planned orders releases 60 40
Sub-component (Lev. I) P4t [weeks] 1 2 3 4 5 6 7 8
(GR) gross requirements 30 20(SR) scheduled receipts 20 20*(OH) on-hand OH0=0 0 0 20 20 0 0 0 0(FN) net requirements 10 20(OP) planned orders receipts 10 20(OR) planned orders releases 10 20
* scheduled receipts delayed of 2 periods (deferring)
Sub-component (Lev. II) P3t [weeks] 1 2 3 4 5 6 7 8
(GR)gross requirements (ORP6+ ORP2)
100 40 10
(SR) scheduled receipts(OH) on hand OH0=20+20 20+20 20+20 20+20 20+20 30+20 20+20 20+20 20+20(NR) net requirements 80 20(OP) planned orders receipts 2 50 1 50(OR) planned orders releases 100 50
Sub-component (II lev.) P5t [weeks] 1 2 3 4 5 6 7 8
(GR) gross requirements 10 20(SR) scheduled receipts(OH) on-hand OH0=0 0 0 0 20 20 0 0 0(NR) net requirements 10 20(OP) planned orders receipts 30(OR) planned orders releases 30
240 Appendix: Production Management Basics
some changes in the planned production. If the rectifications are feasible then theMRP is admissible. The rectifications are generally resumed in a table similar tothe following. If such rectifications are not realizable, the MRP can resultinadmissible and therefore it has to be planned again.
Table A.9 contains the results of the MRP.
A.7.3 The MRP Nervousness
The rules of lot-sizing that use different quantity product orders (such as the lot-for-lot rule or the fixed order period rule) are affected by a phenomenon callednervousness. Small variations in the input MPS can have remarkable effects on therequirements computation. Here it follows a typical example of nervousness, inwhich the plan becomes inadmissible because of a slight variation of the grossrequirements (Table A.10).
This plan is admissible, but if the gross requirement of P1 suffers a light change,passing from 24 to 23 units in the period 2, the MRP of P2 it changes notably (seeTable A.11).
The reduction of the product P1 gross requirement causes ‘‘nervousness’’because the production plan changes notably and produces an urgent order. Theorder of 47 units, attended for the second period, is delayed of four periods.
There are different approaches to avoid the nervousness. The adoption of rules offixed quantity lot-sizing allows to face the variations of small entity, even if with anincrease of the inventory costs. Quantity varying lot-sizing rules are generallypreferred for the end-products, not to burden too much the warehouses; at the sametime for the sub-components fixed quantity rules are adopted, in order to contain thenervousness, whereas some troubles would be produced. It is possible to adopt
Table A.9 MRP results example 1
Product/component
Quantity[unity]
Period ofrelease
State Annotations
P1 30 5 OK (OR) planned orders releasesP1 20 7 OK (OR) planned orders releasesP6 40 3 OK (OR) planned orders releasesP6 10 6 OK (OR) planned orders releasesP2 60 3 OK (OR) planned orders releasesP2 40 5 OK (OR) planned orders releasesP4 20 5 delay (SR) schedule receipts delayed of 2 periodsP4 10 4 OK (OR) planned orders releasesP4 20 6 OK (OR) planned orders releasesP3 100 2 OK (OR) planned orders releasesP3 50 4 OK (OR) planned orders releasesP5 30 2 OK (OR) planned orders releases
Appendix: Production Management Basics 241
Table A.10 Item master file and MRP table example 2
ITEM MASTER FILE
P2
P1
Bill of Materials
product /component
On-hand (OH0)
lead time Scheduled receipts rule oflot sizing
P1 28 units 2 periods - fixed order period
(5 periods)
P2 2 units 4 periods 14 units during the
period 1 fixed order period
(5 periods)
End-product P1t [weeks] 1 2 3 4 5 6 7 8
(GR) gross requirements 2 24 3 5 1 3 4 50(SR) scheduled receipts(OH) on-hand OH0=28 26 2 13 8 7 4 0 0(NR) net requirements 1 5 1 3 4 50(OP) planned orders receipts 14 50(OR) planned orders releases 14 50
Sub-component P2t [weeks] 1 2 3 4 5 6 7 8
(GR) gross requirements 14 50(SR) scheduled receipts 14(OH) on-hand OH0=2 2 2 2 2 2 0 0 0(NR) net requirements 48(OP) planned orders receipts 48(OR) planned orders releases 48
Table A.11 MRP results example 2
End-product P1t [weeks] 1 2 3 4 5 6 7 8
(GR) gross requirements 2 2423
3 5 1 3 4 50
(SR) scheduled receipts(OH) on-hand OH0=28 26 3 0 58 57 54 50 0(NR) net requirements 5 1 3 4 50(OP) planned orders receipts 63(OR) planned orders releases 63
Sub-component P2t [weeks] 1 2 3 4 5 6 7 8
(GR) gross requirements 63(SR) scheduled receipts 14*(OH) on-hand OH0=2 2 0 0 0 0 0 0 0(NR) net requirements 47(OP) planned orders receipts 47(OR) planned orders releases 47**
* scheduled receipts delayed of 1 period (deferring)** order delayed of 4 periods
242 Appendix: Production Management Basics
strategies of diversified management of the planning temporal horizon. In the shortterm temporal horizon the starting MPS is generally not changed; in the middle termtemporal horizon the MPS can be changed after specific analysis and authorization;the MPS is changed at one’s pleasure in the long term temporal horizon instead.
A.7.4 Critical Analysis of the MRP Systems
The MRP system aims to reduce the stocks through the calculation of the netrequirements and placing the necessary orders the later it is possible to, subtractingthe lead time to the delivery dates. It is really the lead time the core of the matter;if it was possible to have an exact estimate of the lead time, the MRP systemwould allow to produce what it is necessary when it is necessary. Nevertheless thelead time can be considerably greater than the time required for the productmanufacturing; since it depends also:
• From the queue times;• From the times required for the materials movement;• From the possible need for reworking due to the presence of defects;• From the lot subdivision, due to the presence of important set-up times.
These dead times are impossible to be exactly foreseen. Therefore it is natural‘‘to inflate’’ the lead time in comparison to its average value, in order to be sure notto remain without materials. Great lead times cause high-levels of WIP. During thedead times, the materials and the semi-finished products are steady, stuck in thewarehouses or in some intermediary buffer. The presence of long lead timescreates a particularly perverse vicious circle. In presence of long lead times, it isnecessary to adopt a long term horizon of planning. But a long term horizon ofplanning causes a greater level of uncertainty, relating to the input data (MPS),which in turn causes an increase both of the lead time and of the safety stocks. Apartial solution to this problem is to reduce the time buckets passing from weeks todays, or even to job turns. This doesn’t resolve the capacity problem, but at least itreduces the possible amplification of the lead times.
Appendix: Production Management Basics 243

About the Author
Marco Gobetto was born in Rimini (RN, Italy) in 1967 and took his master’sdegree in Electronic Engineering in 1993 at Politecnico of Turin.
He currently holds positions as Manufacturing Training Unit Manager at FIATSepin S.c.p.A. and Professor at the Faculty of Automotive Engineering. He hastaught courses in both Production Management and Production Processes, Safety,Organization and Management.
After having complete his University studies, he began his professional careerat FIAT Auto S.p.A. in the Manufacturing Engineering Department, as part of theStyle Design Manufacturing Analysis Team. From there he proceeded to theposition of Body in White Process Engineer, contributing to the productionlaunches of two new cars in Italy and then coordinating industrialization activitiesin Poland for a new body in white model.
In 1998 he moved to Ferrari S.p.A. as Body in White Plant Manager at the‘‘Carrozzeria Scaglietti’’ facility in Modena.
In 2000 he left FIAT to assume responsibility for the ManufacturingEngineering Department at Carrozzeria Bertone S.p.A. in Grugliasco (TO,Italy). In two years, three new models of vehicles were launched and, for thefirst time in Bertone history, second and third shifts in production wereactivated.
At the beginning of 2002 he rejoined the FIAT Group at ISVOR FIAT S.c.p.A.where he specialized in Total Productive Maintenance and ContinuousImprovement training programs, following on IVECO and FIAT Powertrainsectors. He subsequently coordinated international training initiatives for a jointventure in India between FIAT and TATA. In 2007 he assumed responsibility forthe Manufacturing, Quality and Product Development Training Area that, at theend of 2008, became the central Manufacturing Training Unit in the new trainingorganization in FIAT, thereby contributing to all initiatives worldwide both inFIAT and Chrysler LLC with a major focus on World Class Manufacturing, theCorporate Production System.
M. Gobetto, Operations Management in Automotive Industries,Springer Series in Advanced Manufacturing DOI: 10.1007/978-94-007-7593-0,� Springer Science+Business Media Dordrecht 2014
245