on the weibull cost estimation of building frames designed by simulated annealing
TRANSCRIPT

Meccanica (2010) 45: 693–704DOI 10.1007/s11012-010-9285-0
S I M U L AT I O N , O P T I M I Z AT I O N & I D E N T I F I C AT I O N
On the Weibull cost estimation of building frames designedby simulated annealing
Ignacio Paya-Zaforteza · Víctor Yepes ·Fernando González-Vidosa · Antonio Hospitaler
Received: 4 March 2009 / Accepted: 21 January 2010 / Published online: 16 February 2010© Springer Science+Business Media B.V. 2010
Abstract This paper proposes a general methodologyto determine the number of numerical tests required toprovide a solution for a heuristic optimization problemwith a user-defined accuracy as compared to a globaloptimal solution. The methodology is based on the ex-treme value theory and is explained through a problemof cost minimization for reinforced concrete build-ing frames. Specifically, 1000 numerical experimentswere performed for the cost minimization of a two-bayand four-floor frame using the Simulated Annealing(SA) algorithm. Analysis of the results indicates that(a) a three-parameter Weibull distribution function fitsthe results well, (b) an objective and general procedurecan be established to determine the number of experi-ments necessary to solve an optimization problem witha heuristic which generates independent random solu-tions, and (c) a small number of experiments is enoughto obtain good results for the structural engineer.
Keywords Optimization · Reinforced concrete ·Weibull distribution · Extreme value theory
I. Paya-Zaforteza (�) · V. Yepes · F. González-Vidosa ·A. HospitalerICITECH, Departamento de Ingeniería de la Construccióny Proyectos de Ingeniería Civil, Universidad Politécnicade Valencia, Camino Vera S/N, 46022 Valencia, Spaine-mail: [email protected]
1 Introduction
Initial attempts to solve structural optimization prob-lems date back to the 1600s, when Leonardo da Vinciand Galileo conducted tests with models and full-scalestructures [1]. Modern optimization is linked to theuse of computers. The spectacular increase in compu-tational resources available to engineers in the 1980sgreatly improved the structural analysis of complexstructures, especially as regards linear elastic analysisof bar structures and 2-D and 3-D finite element mod-eling. Structural analysis software was upgraded withthe many computer-aided design (CAD) programs de-veloped in the 1990s. CAD programs allowed usersto tentatively optimize the structure by trial-and-error,but they did not include any design variables subjectto optimization. Current research focuses on structuraloptimization programs, like the one used in the presentstudy. These programs build on CAD programs anddefine the structure in terms of design variables whichthe optimization algorithm must modify in the searchfor the optimum structure. Despite the potential ca-pabilities of structural design by optimization, eco-nomic design of concrete structures is at present highlyconditioned by the experience of the structural engi-neer. Basically, designing concrete structures is a prob-lem of selecting design variables subject to structuralconstraints. Design variables include material grades,cross section dimensions and reinforcement. Most cur-rent design office procedures still adopt cross-sectiondimensions and material grades based on sanctioned

694 Meccanica (2010) 45: 693–704
common practice. Once the structure is defined, it fol-lows the CAD structural analysis and computation ofpassive and active reinforcement. Should the dimen-sions or material grades be insufficient, the structure isredefined on a trial-and-error basis. Such process leadsto safe designs, yet the cost of concrete structures is,therefore, very much linked to the experience of thestructural designer.
There are two main methods for structural opti-mization. Exact methods are generally based on math-ematic programming (Hernández and Fontan [2]),while heuristics are artificial intelligence strategiesusually emulating natural processes. Heuristic meth-ods include a large number of algorithms, such as ge-netic algorithms (GA henceforth), tabu search, sim-ulated annealing (SA), ant colony optimization andneuronal networks, among others [3–6]. Heuristicsusually provide near-optimal solutions. Among thefirst studies on heuristic optimization applied to struc-tures, the contributions of Goldberg and Samtani [7]and Coello et al. [8] are worthy of mention. Thesepioneering authors applied GA to the weight opti-mization of a steel truss structure and to the cost ofa simply supported reinforced concrete (RC) beam,respectively. Recent research using GA strategies canbe found in Panigrahi et al. [9], Bassir et al. [10] andSid et al. [11]. Regarding concrete structures, the useof non-evolutionary methods as an alternative to GAis rare, but applications can be found in Balling andYao [12] and Ceranic et al. [13]. Recently, our researchgroup has also used non-evolutionary algorithms suchas SA, threshold acceptance and ant colonies to op-timize earth retaining walls, frame bridges, buildingframes, road vaults and bridge piers [14–18]. Further,the multiobjective optimization of building frameshas been examined by the authors [19]. Kicingeret al. [20] and Adeli and Sarma [6] have recently pub-lished surveys on structural evolutionary optimizationof steel and RC structures. Other recent applicationsof structural optimization to civil, naval, mechani-cal and aerospace engineering are discussed in Nietoet al. [21], Marannano and Mariotti [22], Callegari andPalpacelli [23], and Guadagni [24].
Heuristic methods are not deterministic since theyprovide a different result every time they are run inthe computer. This is so because they include a largenumber of iterations governed by random decisions.In these terms, they provide as many different resultsas algorithms run. The key question then is how many
times the algorithm should be run to achieve sufficientaccuracy: 10, 50, 100, 200 or 500 times. Most pub-lished papers on structural optimization do not evenreport the number of runs performed by their algo-rithms, and in most cases researchers simply reportbest predictions and compare algorithms on the basisof these best predictions. A second crucial question ishow close the results are to the unknown global opti-mum. In practice, it is necessary to achieve a balancebetween the quality of the results and the amount ofcomputing time required to obtain them. Further, it isnecessary to assess how close the heuristic method so-lutions are to the global optimum, given that the globaloptimum solution is usually unknown for the problemsthat justify the use of a heuristic method. Any solutiongiven by a heuristic stochastic procedure is generallya good quality solution regarding the overall solutionspace. Each independent solution of a stochastic al-gorithm can be considered a rare event, and we canconstruct a rare event distribution by multiple runs ofthe algorithm. The occurrence of rare events is studiedin this paper by the extreme value theory (EVT hence-forth). The use of the EVT to estimate the global opti-mum solution to a heuristic method has been describedpreviously in McRoberts [25], Golden and Alt [26],and more recently in Bettinger et al. [27] for largecombinatorial problems.
In this line of study, this paper describes a methodto define the minimum number of computer runs anoptimization algorithm must be performed to ensurethat the best result differs to a certain degree from theglobal optimum estimation. One thousand numericalruns are carried out so that the cost of a RC buildingframe was optimized by SA. The EVT is applied tothe results obtained. The paper is organized as follows.Section 2 specifies the optimization problem, that is,structural system analyzed, objective function, vari-ables, parameters, and optimization algorithm. Sec-tion 3 describes the three-parameter Weibull statisticaldistribution function. This distribution fits the resultsof the optimization problem very well as described inSect. 4. A methodology based on the estimation of thelocation parameter of the three-parameter Weibull dis-tribution is proposed as well in Sect. 4 to determine theminimum number of computer runs necessary to solvethe optimization problem with a required accuracy. Fi-nally, the main conclusions of the work are drawn inSect. 5.

Meccanica (2010) 45: 693–704 695
2 Optimization problem
2.1 Structures studied
This example is related to RC frames commonly usedin building construction. Building frames (see Fig. 1)typically have horizontal beams measuring 5.00 to10.00 m in horizontal span. These beams sustain thevertical loads of the floors and transfer them to verticalcolumns measuring 3.00 to 5.00 m in height. Moder-ate horizontal loads are usually included in the design,but high levels of horizontal loading are usually trans-ferred to adjacent shear walls. Building frames are cal-culated to sustain the loads prescribed by the codes andmust satisfy all the limit states required as a RC struc-ture.
2.2 Objective function
The structural concrete design problem established inthis study involves an economic optimization, whichaims to minimize the objective function F of expres-sion (1), satisfying as well the constraints of expres-sions (2):
F( �X) =∑
i=1,r
pi · mi( �X), (1)
gj ( �X) ≤ 0. (2)
The objective function in expression (1) is the costof the structure. The structure is split in r construction
units (concrete, steel, formwork, etc.) to calculate thecost of a RC frame. Each unit has a price pi and a mea-surement mi . Thus, the cost of the frame is the sum ofthe unit prices multiplied by the measurement. Con-struction units considered in this study and their pricesare detailed in Table 1. Constraints in expression (2)are all the service and ultimate limit states that thestructure must satisfy as well as the geometrical andconstructibility constraints of the problem. The com-ponents of the �X vector are the design variables of theoptimization problem.
2.3 Design variables, parameters and constraints
Figure 2 illustrates the typical symmetrical frame of 2bays and 4 floors which will be used for the analy-ses in Sect. 4. This frame has a total of 77 designvariables which have been previously described in de-tail in [19, 28]. All variables in this analysis are dis-crete. These variables include (1) the type of reinforc-ing steel which has a characteristic yield stress of 400or 500 MPa, (2) the type of concrete for the columnsand beams of each floor, which may vary from a min-imum characteristic compressive strength of 25 MPato a maximum of 50 MPa in steps of 5 MPa, (3) thecross section dimensions of each column of the frame,(4) the cross-section dimensions of the beams, and(5) the reinforcement steel variables which follow astandard reinforcement setup. Figure 3 shows a typi-cal longitudinal reinforcement setup of the beams ofthe structure. It includes basic top and bottom bars in
Fig. 1 Structural systems analyzed in this study: 3D view (left) and real structure during construction (right)
696 Meccanica (2010) 45: 693–704
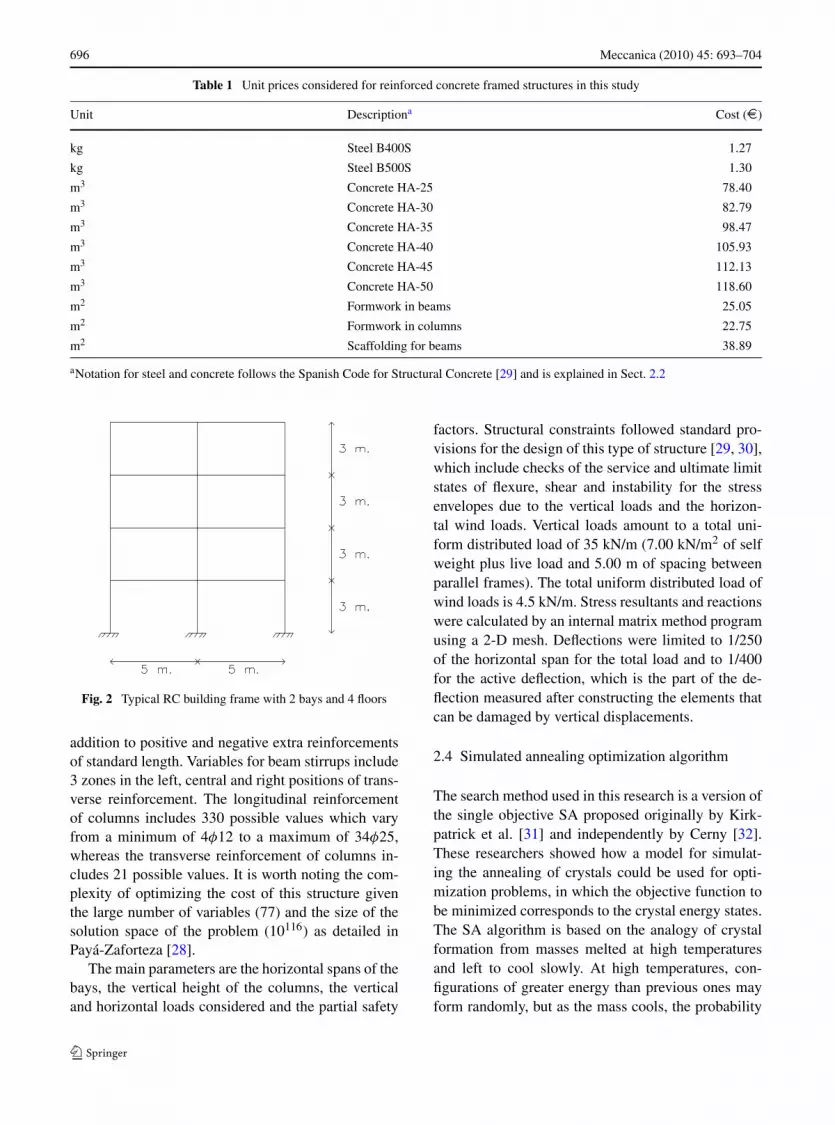
Table 1 Unit prices considered for reinforced concrete framed structures in this study
Unit Descriptiona Cost (€)
kg Steel B400S 1.27
kg Steel B500S 1.30
m3 Concrete HA-25 78.40
m3 Concrete HA-30 82.79
m3 Concrete HA-35 98.47
m3 Concrete HA-40 105.93
m3 Concrete HA-45 112.13
m3 Concrete HA-50 118.60
m2 Formwork in beams 25.05
m2 Formwork in columns 22.75
m2 Scaffolding for beams 38.89
aNotation for steel and concrete follows the Spanish Code for Structural Concrete [29] and is explained in Sect. 2.2
Fig. 2 Typical RC building frame with 2 bays and 4 floors
addition to positive and negative extra reinforcementsof standard length. Variables for beam stirrups include3 zones in the left, central and right positions of trans-verse reinforcement. The longitudinal reinforcementof columns includes 330 possible values which varyfrom a minimum of 4φ12 to a maximum of 34φ25,whereas the transverse reinforcement of columns in-cludes 21 possible values. It is worth noting the com-plexity of optimizing the cost of this structure giventhe large number of variables (77) and the size of thesolution space of the problem (10116) as detailed inPayá-Zaforteza [28].
The main parameters are the horizontal spans of thebays, the vertical height of the columns, the verticaland horizontal loads considered and the partial safety
factors. Structural constraints followed standard pro-visions for the design of this type of structure [29, 30],which include checks of the service and ultimate limitstates of flexure, shear and instability for the stressenvelopes due to the vertical loads and the horizon-tal wind loads. Vertical loads amount to a total uni-form distributed load of 35 kN/m (7.00 kN/m2 of selfweight plus live load and 5.00 m of spacing betweenparallel frames). The total uniform distributed load ofwind loads is 4.5 kN/m. Stress resultants and reactionswere calculated by an internal matrix method programusing a 2-D mesh. Deflections were limited to 1/250of the horizontal span for the total load and to 1/400for the active deflection, which is the part of the de-flection measured after constructing the elements thatcan be damaged by vertical displacements.
2.4 Simulated annealing optimization algorithm
The search method used in this research is a version ofthe single objective SA proposed originally by Kirk-patrick et al. [31] and independently by Cerny [32].These researchers showed how a model for simulat-ing the annealing of crystals could be used for opti-mization problems, in which the objective function tobe minimized corresponds to the crystal energy states.The SA algorithm is based on the analogy of crystalformation from masses melted at high temperaturesand left to cool slowly. At high temperatures, con-figurations of greater energy than previous ones mayform randomly, but as the mass cools, the probability

Meccanica (2010) 45: 693–704 697
Fig. 3 Typical longitudinal reinforcement bars of the beams in RC building frames
of higher energy configurations forming diminishes.The process is governed by the Boltzmann expressionexp(−�E/T ), where �E is the increment in the en-ergy of the new configuration and T is the tempera-ture. The algorithm starts with a feasible solution ran-domly generated and a high initial temperature. Theinitial working solution is changed by a small randommove of the values of the variables. The new currentsolution is evaluated in terms of cost. Greater cost so-lutions are accepted when a 0 to 1 random number issmaller than the expression exp(−�E/T ), where �E
is the cost increment and T is the current temperature.The current solution is then checked against structuralconstraints and if it is feasible, it is adopted as the newworking solution. The initial temperature is decreasedgeometrically (T = kT ) by means of a cooling coeffi-cient k. A number of iterations called Markov chainsis allowed for each step in temperature. The algorithmstops when there are no improvements in the currentsolution after a certain number of Markov chains. TheSA method is capable of surpassing local optima athigh-medium temperatures, and it gradually convergesas the temperature reduces to zero. The SA methodrequires the calibration of the initial temperature, thelength of the Markov chains, the number of Markovchains without improvement to stop the algorithm, andthe cooling coefficient. The initial temperature is ad-justed following the method proposed by Medina [33],which consists in choosing an initial value and check-ing whether the acceptances of higher energy solutionsfall between 20 and 40 percent. If they are greater than
40%, the initial temperature is halved; and if they areless than 20%, the initial temperature is doubled.
The SA algorithm used in this research was codedin Compaq Visual Fortran Professional 6.6.0. The run-ning time of one execution of the algorithm on aPC Pentium IV 3.20 GHz computer was, on average,25 minutes. The calibration of the algorithm recom-mended Markov chains of 70000 iterations, a coolingcoefficient of 0.80 and two Markov chains without im-provement in the current solution as stop criterion. Themost efficient move identified was a random variationof 3 or up to 3 variables of the 77 in the problem.
3 The Weibull distribution function
The Weibull cumulative distribution function (cdfhenceforth) is given by:
FX(x0) = Prob{X ≤ x0}
={
1 − exp{−(x0−γ
η)β}, x0 > γ,
0, x0 ≤ γ,(3)
where
η,β > 0 (4)
where γ is the location parameter, η is the scale para-meter, and β is the shape parameter.
The distribution was developed by the Swedishphysicist Waloddi Weibull [34] to describe the strength

698 Meccanica (2010) 45: 693–704
behavior of materials. It is well-known that the Weibulldistribution belongs to the extreme value distribu-tions. It represents the distribution of the smallestor largest values in random samples of increasingsize. Suppose a number of independent samples ofsize m is taken from a parent continuous populationwhich is bounded from below by γ . Fisher and Tip-pett [35] proved that, as m grows, the distributionof min(X1,X2, . . . ,Xm) approaches a three-parameterWeibull distribution with γ as the location parame-ter. This is applicable to our study since the result ofeach computer run has the lowest cost from a largesample of solutions considered throughout the opti-mization search. Regarding continuity and althoughthe building frame studied has an extremely high butfinite number of potential solutions, it is important tonote that we assume that the population space approx-imates a continuous space well since the number ofvariables is large and it is represented in an almostcontinuous manner.
4 Results and discussion
4.1 Overview
If the statistical distribution of the local optima givenby SA fits a three-parameter Weibull distribution, thenthe estimated location parameter γ can be used as anestimation of the global optimum. In addition, a num-ber of computer runs based on the difference betweenγ and the best solution found by the algorithm can beproposed. Section 4.2 describes the statistical proper-ties of the sample of solutions obtained with 1000 runsof the SA algorithm. Section 4.3 proves that the three-parameter Weibull distribution fits the 1000 resultswell. Finally, in Sect. 4.4 we propose a method to de-fine the number of runs required for a given accuracy.
4.2 Statistical description of 1000 SA results
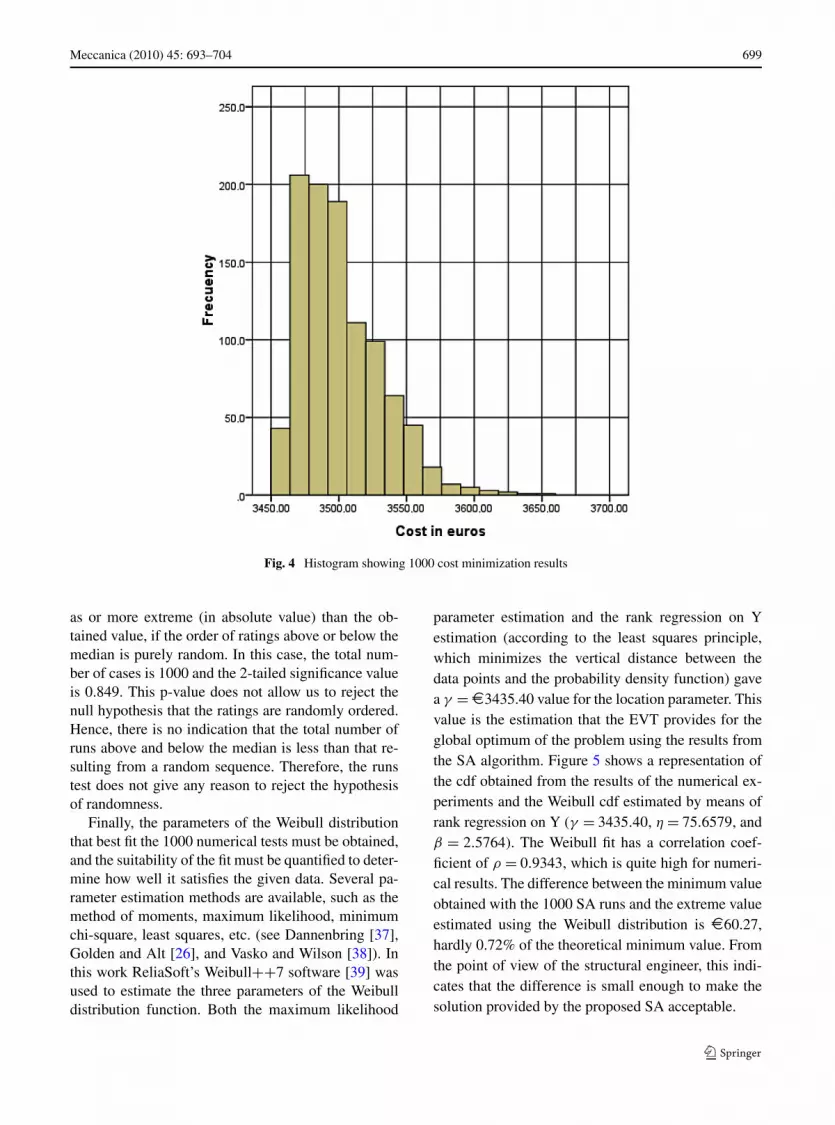
To verify the applicability of the EVT to structural op-timization, the cost of the frame in Fig. 2 was opti-mized 1000 times with the SA algorithm described inSect. 2.4. Figure 4 shows the histogram of the sam-ple of 1000 minimal cost solutions found by SA. Thestatistical description of this sample is the follow-ing: the maximum and minimum values are €4224.19and €3460.00, respectively; the sample mean value is
€3503.48, with a confidence interval of ±€2.654 fora 0.05 level of significance; the standard deviation ofthe sample is €42.82; the median is €3,495.67; thekurtosis coefficient is €90.64, and the skewness co-efficient is €6.67. Therefore, the sample has a posi-tive asymmetric distribution and a leptokurtic distrib-ution (a high degree of values concentrated around themean). There is no reason to rule out the hypothesisthat the histogram corresponds to the probability den-sity function of the Weibull distribution.
4.3 Three-parameter Weibull distribution fitting
This section checks the hypothesis that the 1000 SAresults fit a three-parameter Weibull distribution func-tion. Three conditions must be fulfilled to confirm thishypothesis. Firstly, it must be verified that there is noreason to reject the Weibull hypothesis. Secondly, itmust be shown that the 1000 solutions of minimal costfound by the SA algorithm are independent (see Fisherand Tippett [35]). Finally, the correlation coefficient ofthe Weibull distribution that best fits the 1000 numeri-cal results must be high enough.
Kolmogorov-Smirnov and Chi-squared statistics(see, e.g., Conover [36]) were computed assuming in-dependence to verify that the SA solutions are Weibulldistributed. These tests are non-parametric tests usedto compare a sample with a reference probability dis-tribution. These statistics fell far below the criticalvalue at the 0.05 level of significance in both cases,indicating that there is no reason to reject the Weibullhypothesis.
One of the main assumptions underlying the use ofEVT is that each SA solution can be considered an in-dependent sample from the whole population of 1000samples, because each search process starts with a dif-ferent, randomly-defined solution. A Wald-Wolfowitzruns test was applied to the 1000 SA solutions taken inorder of occurrence so as to confirm that SA best so-lutions are independent. This is a non-parametric testthat may be used as a test for randomness in a se-quence, and it is based on the total number of runs andthe number of cases on the same side of a cut point(see, e.g., Conover [36]). This test dichotomizes thesequence of observations by classifying each observa-tion as either above or below the sample median toensure that there is no order to the resulting sequence.The 2-tailed significance value of this randomness testis the probability of obtaining a Z statistic as extreme
Meccanica (2010) 45: 693–704 699
Fig. 4 Histogram showing 1000 cost minimization results
as or more extreme (in absolute value) than the ob-tained value, if the order of ratings above or below themedian is purely random. In this case, the total num-ber of cases is 1000 and the 2-tailed significance valueis 0.849. This p-value does not allow us to reject thenull hypothesis that the ratings are randomly ordered.Hence, there is no indication that the total number ofruns above and below the median is less than that re-sulting from a random sequence. Therefore, the runstest does not give any reason to reject the hypothesisof randomness.
Finally, the parameters of the Weibull distributionthat best fit the 1000 numerical tests must be obtained,and the suitability of the fit must be quantified to deter-mine how well it satisfies the given data. Several pa-rameter estimation methods are available, such as themethod of moments, maximum likelihood, minimumchi-square, least squares, etc. (see Dannenbring [37],Golden and Alt [26], and Vasko and Wilson [38]). Inthis work ReliaSoft’s Weibull++7 software [39] wasused to estimate the three parameters of the Weibulldistribution function. Both the maximum likelihood
parameter estimation and the rank regression on Yestimation (according to the least squares principle,which minimizes the vertical distance between thedata points and the probability density function) gavea γ =€3435.40 value for the location parameter. Thisvalue is the estimation that the EVT provides for theglobal optimum of the problem using the results fromthe SA algorithm. Figure 5 shows a representation ofthe cdf obtained from the results of the numerical ex-periments and the Weibull cdf estimated by means ofrank regression on Y (γ = 3435.40, η = 75.6579, andβ = 2.5764). The Weibull fit has a correlation coef-ficient of ρ = 0.9343, which is quite high for numeri-cal results. The difference between the minimum valueobtained with the 1000 SA runs and the extreme valueestimated using the Weibull distribution is €60.27,hardly 0.72% of the theoretical minimum value. Fromthe point of view of the structural engineer, this indi-cates that the difference is small enough to make thesolution provided by the proposed SA acceptable.

700 Meccanica (2010) 45: 693–704
Fig. 5 Theoretical 3 parameters Weibull c.d.f. versus experimental values
4.4 Number of runs criterion
The number of times the SA algorithm is run shouldbe large enough to ensure that the difference betweenthe minimum value obtained from all runs and the ex-treme value estimated using the theoretical distribu-tion is less than a given threshold. Then, a new prob-lem arises: the estimation of the γ parameter involvesvariability, since its value depends on the number ofrun solutions used to estimate it. Eight series of ninesamples with replacement were extracted from the ini-tial population of 1000 solutions to study the relation-ship between the estimated value of γ and the numberof data used for the Weibull fit. Each one of these se-ries corresponded with the results of 5, 9, 15, 25, 50,100, 500 or 1000 SA algorithm runs. The first seriescontained nine samples and each sample was com-prised of the results of five SA runs (see Fig. 6); thesecond series had nine samples each one containingthe results of nine SA runs and so on. Therefore, 72(8 × 9) samples were analyzed. First of all, the min-imum cost (Cmin) solution for each one of the eightseries and the γ values corresponding to the Weibullcdf which best fit each one of the 72 samples wereobtained. Therefore, for each series of 5 to 1000 al-gorithm runs, one value of Cmin and nine values of
γ (γ1, . . . , γ9) were calculated. Additionally, each se-ries of these nine γ values was ranked, starting froma minimum value (γmin) and ending with a maximumvalue (γmax). Figure 7 and Table 2 show the values ofγmin, γmax and Cmin. It can be inferred that the vari-ability of the γ parameter is given by the differencebetween the estimations of its value provided by γmin
and γmax. This difference is 3.66% of γmin for 5 SAruns, 1.53% for 9 SA runs, and only 0.22% for 15 SAruns. The reduction in the difference is practically neg-ligible from 15 runs on. Secondly, the percentage dif-ference between γmin and Cmin is minimal for 15 SAruns (0.69%) and for 25 SA runs; it is not possible toreduce the difference in question (0.72%).
Therefore, the number of algorithm runs can bebased on the fulfillment of two conditions. Firstly, thedifference between the best solution found to date andthe theoretical global optimum estimated by adjustinga three-parameter Weibull cdf to the results obtained,which must be less than a given level. Thus, the op-timum found is guaranteed to be sufficiently close tothe theoretical global optimum. Secondly, the value ofthe difference γmax −γmin is less than another prefixedvalue, so the error in the estimation of γ is limited.Considering that when performing the algorithm, onlythose solutions obtained from previous performances,

Meccanica (2010) 45: 693–704 701
Fig. 6 Sample with replacement procedure for estimating minimum cost (Cmin) and location parameters (γmin, γmax) for nine samplesof five SA algorithm runs
Fig. 7 Value of the minimum costs (Cmin) and the location parameter (γ ) for different number of SA algorithm runs
rather than the set of all the solutions, are available, the
use of the bootstrap technique (Efron [40]) is proposed
for estimating the γmax and γmin values. The boot-
strap is a powerful technique for assessing the accu-
racy of a parameter estimator. If a representative sam-
ple is available, the bootstrap randomly reassigns the
observations and recalculates the estimate. This tech-
nique has been successfully applied to solve problemsthat would be too complicated for traditional statisti-cal techniques or to situations in which the classicaltechniques are not valid (Zoubir and Boashash [41]).The bootstrap technique involves processing the sam-ple data as though they constituted the data of the en-tire population. In other words, they are used as the

702 Meccanica (2010) 45: 693–704
Table 2 γmin, γmax, Cmin and the percentage differences for different numbers of SA runs
Number of tests γmin γmax (γmax − γmin)/γmin (%) Cmin (Cmin − γmin)/γmin (%)
5 3330.12 3452.11 3.66 3462.15 3.96
9 3403.17 3455.39 1.53 3462.15 1.73
15 3437.52 3445.22 0.22 3461.33 0.69
25 3436.72 3445.58 0.26 3461.33 0.72
50 3435.40 3440.16 0.14 3460.00 0.72
100 3435.40 3438.18 0.08 3460.00 0.72
500 3435.40 3436.86 0.03 3460.00 0.72
1000 3435.40 3435.85 0.01 3460.00 0.72
universe from which samples with replacements willbe extracted. For the example given, and together withthe original sample, eight additional random sampleswith replacement were extracted and used to estimateeach one of the γ parameters.
For this research, the following methodology isproposed. A set of prior experiments is carried outusing a certain heuristic, thereby permitting an ini-tial sample of results to be obtained. From this sam-ple, the theoretical minimum corresponding to a three-parameter Weibull distribution is estimated. However,to increase the significance of the estimator in ques-tion, new samples are extracted with the bootstraptechnique (see Fig. 8). These samples are then usedto calculate the values of γmin, γmax and Cmin. Ifγmax − γmin and Cmin − γmin are lower than two pre-viously set limits (for example, less than 0.5% of γmin
and 1% of γmin, respectively), additional runs of thealgorithm are not necessary. Otherwise, a new numer-ical experiment is carried out with the heuristic and theprocedure is repeated. Figure 9 and Table 3 show theresults of the solutions found for the building framestudied.
Employing the aforementioned criterion and mak-ing a linear interpolation based on the data featured inTables 2 and 3, it is possible to deduce that the min-imum number of performances is: (a) 14, if 1000 re-sults are used (something that cannot be done in prac-tice) or (b) 18, if the bootstrap technique is used. In thelatter cases, the number of SA runs would be 16 if onlythe condition referring to γmax −γmin is considered. Inthis particular sample, it is worth noting both criterialead to a similar final decision about the algorithm stopcriterion.
Fig. 8 Bootstrap technique to estimate minimum cost (Cmin)
and location parameters (γmin, γmax) for nine samples of fiveSA algorithm runs
5 Conclusions
The following conclusions can be drawn from the re-search described herein:
• The set of solutions found using SA for the cost op-timization of a 2-bay and 4-floor frame is a sam-ple of independent values that the three-parameterWeibull distribution fits well.
• The extreme value theory can be used to estimatethe global optimum achievable via a heuristic pro-cedure such as SA when minimizing the cost of aconcrete structure.
• An objective procedure can be established to deter-mine the number of experiments necessary with aheuristic such as the SA, which generates indepen-dent random solutions. Fulfillment of the follow-ing two criteria is sufficient: (1) the difference be-tween the cost of the best solution found to date and

Meccanica (2010) 45: 693–704 703
Fig. 9 Value of the minimum cost (Cmin) and the location parameter (γ ) for different number of SA runs. Obtained using the bootstraptechnique
Table 3 γmin, γmax, Cmin and percentage differences for different numbers of SA runs. Obtained using the bootstrap technique
Number of tests γmin γmax (γmax − γmin)/γmin (%) Cmin (Cmin − γmin)/γmin (%)
9 3412.92 3443.85 0.91 3468.53 1.63
15 3430.28 3449.10 0.55 3468.53 1.12
25 3437.64 3440.05 0.07 3464.70 0.79
50 3437.64 3440.05 0.07 3462.28 0.72
100 3436.72 3437.64 0.03 3461.33 0.72
500 3435.40 3435.85 0.01 3460.00 0.72
1000 3435.40 3435.40 0.00 3460.00 0.72
the theoretical value estimated using the bootstraptechnique is less than a certain level—for exam-ple 1%—, and (2) the difference between the val-ues of γmin and γmax obtained using the bootstraptechnique must be less than another preestablishedlevel, for example 0.5%.
• The methodology described is general and can beeasily adapted to other optimization problems, if theresults of the heuristic algorithm fit a Weibull distri-bution. Nevertheless, the threshold levels that definethe stop criteria are problem dependent and shouldbe chosen by the individual who solves the opti-mization problem in terms of the accuracy requiredand the time needed to perform one algorithm run.
Acknowledgements This study was funded by the SpanishMinistry of Education (research project BIA2006-01444). Theauthors are grateful to Debra Westall for her thorough revisionof the manuscript.
References
1. Grierson DE (1994) Practical optimization of structuralsteel frameworks. In: Adeli H (ed) Advances in design op-timization. Taylor & Francis, London
2. Hernández S, Fontan A (2002) Practical applications of de-sign optimization. WIT Press, Southampton
3. Dreo J, Petrowsky A, Siarry P, Taillard E, Chatterjee A(2006) Metaheuristics for hard optimization. Methods andcase studies. Springer, Berlin

704 Meccanica (2010) 45: 693–704
4. van Laarhoven PJM, Aarts EHL (1987) Simulated anneal-ing: theory and applications. Kluwer Academic, Dordrecht
5. Goldberg DE (1989) Genetic algorithms in search, op-timization, and machine learning. Addison-Wesley, NewYork
6. Adeli H, Sarma KC (2006) Cost optimization of structures.Fuzzy logic, genetic algorithms and parallel computing.Wiley, Chichester
7. Goldberg DE, Samtani MP (1986) Engineering optimiza-tion via genetic algorithms. In: ASCE proceedings of theninth conference on electronic computation, New York,pp 471–482
8. Coello CA, Christiansen AD, Santos F (1997) A simple ge-netic algorithm for the design of reinforced concrete beams.Eng Comput 13(4):185–196
9. Panigrahi SK, Chakraverty S, Mishra BK (2009) Vi-bration based damage detection in a uniform strengthbeam using genetic algorithm. Meccanica. doi:10.1007/s11012-009-9207-1
10. Bassir DH, Zapico JL, González MP, Alonso R (2007)Identification of a spatial linear model based on earthquake-induced data and genetic algorithm with parallel selection.Int J Simul Multidiscip Des Optim 1(1):39–48
11. Sid B, Domaszewski M, Peyraut F (2007) An adjacencyrepresentation for structural topology optimization usinggenetic algorithm. Int J Simul Multidiscip Des Optim1(1):49–54
12. Balling RJ, Yao X (1997) Optimization of reinforced con-crete frames. ASCE J Struct Eng 123(2):193–202
13. Ceranic B, Fryer C, Bines RW (2001) An applica-tion of simulated annealing to the optimum design ofreinforced concrete retaining structures. Comput Struct79(17):1569–1581
14. González-Vidosa F, Yepes V, Alcalá J, Carrera M,Perea C, Payá-Zaforteza I (2008) Optimization of re-inforced concrete structures by simulated annealing.In: Tan CM (ed) Simulated annealing. I-Tech Edu-cation and Publishing, Vienna, pp 307–320. Availablein http://intechweb.org/book.php?id=37. Accessed 6 Feb2009
15. Paya-Zaforteza I, Yepes V, Hospitaler A, González-VidosaF (2009) CO2-optimization of reinforced concrete framesby simulated annealing. Eng Struct 31(7):1501–1508
16. Yepes V, Alcalá J, Perea C, González-Vidosa F (2008)A parametric study of optimum earth-retaining walls bysimulated annealing. Eng Struct 30(3):821–830
17. Perea C, Alcalá J, Yepes V, González-Vidosa F, HospitalerA (2008) Design of reinforced concrete bridge frames byheuristic optimization. Adv Eng Softw 39(3):676–688
18. Martínez F, Yepes V, Hospitaler A, González-Vidosa F(2007) Ant colony optimization of reinforced concretebridge piers of rectangular hollow section. In: Proceedingsof the ninth international conference on the application ofartificial intelligence to civil, structural and environmentalengineering (AICIVIL-COMP2007), St. Julians, Malta, pa-per 38
19. Payá I, Yepes V, González-Vidosa F, Hospitaler A (2008)Multiobjective optimization of reinforced concrete build-ing frames by simulated annealing. Comput-Aided Civ In-frastruct Eng 23:596–610
20. Kicinger R, Arciszewski T, De Jong K (2005) Evolutionarycomputation and structural design: a survey of the state ofthe art. Comput Struct 83:1943–1978
21. Nieto F, Hernández S, Jurado JA (2009) Optimum de-sign of long-span suspension bridges considering aeroelas-tic and kinematic constraints. Struct Multidiscip Optim39(2):133–151
22. Marannano G, Mariotti GV (2008) Structural optimizationand experimental analysis of composite material panels fornaval use. Meccanica 43(2):251–262
23. Callegari M, Palpacelli MC (2008) Prototype design of atranslating parallel robot. Meccanica 43(2):133–151
24. Guadagni L (2008) Development of a collaborative opti-mization tool for the sizing design of aerospace structures.Int J Simul Multidiscip Des Optim 2(3):187–192
25. McRoberts K (1971) A search model for evaluating combi-natorially explosive problems. Oper Res 19:1331–1349
26. Golden BL, Alt FB (1979) Interval estimation of a globaloptimum for large combinatorial problems. Nav Res Lo-gist Q 26(1):69–77
27. Bettinger P, Boston K, Kim YH, Zhu J (2007) Landscape-level optimization using tabu search and stand density-related forest management prescriptions. Eur J Oper Res176:1265–1282
28. Payá-Zaforteza I (2007) Optimización heurística de pór-ticos de edificación de hormigón armado (Heuristic opti-mization of reinforced concrete building frames). PhD the-sis, Departamento de Ingeniería de la Construcción, Uni-versidad Politécnica de Valencia, Valencia (in Spanish)
29. Ministerio de Fomento (1998) EHE code of structural con-crete. Ministerio de Fomento, Madrid (in Spanish)
30. Ministerio de Fomento (1988) NBE AE-88. Code aboutthe actions to be considered in buildings. Ministerio de Fo-mento, Madrid (in Spanish)
31. Kirkpatrick S, Gelatt CD, Vecchi MP (1983) Optimizationby simulated annealing. Science 220(4598):671–680
32. Cerny V (1985) Thermodynamical approach to the travel-ing salesman problem: an efficient simulation algorithm.J Opt Theory Appl 45(1):41–51
33. Medina JR (2001) Estimation of incident and reflectedwaves using simulated annealing. ASCE J Waterw PortCoast Ocean Eng 127(4):213–221
34. Weibull W (1951) A statistical distribution function of wideapplicability. ASME J Appl Mech Trans 18(3):293–297
35. Fisher R, Tippett L (1928) Limiting forms of the frequencydistribution of the largest or smallest member of a sample.Proc Camb Philos Soc 24:180–190
36. Conover WJ (1971) Practical nonparametric statistics. Wi-ley, New York
37. Dannenbring DG (1977) Procedures for estimating optimalsolution values for large combinatorial problems. ManagSci 23(12):1273–1283
38. Vasko FJ, Wilson JR (1984) An efficient heuristic for largeset covering problems. Nav Res Logist Q 31:163–171
39. ReliaSoft (2007) Weibull++7 user’s guide. Reliasoft, Tuc-son
40. Efron B (1979) Bootstrap methods. Ann Stat 7:1–2641. Zoubir AM, Boashash B (1998) The bootstrap and its ap-
plication in signal processing. IEEE Signal Process Mag15(1):56–67