on small satellites for oceanography: a survey
TRANSCRIPT
On Small Satellites for Oceanography: A Survey
Andre G. C. Guerraa,∗, Frederico Franciscoa, Jaime Villateb, Fernando Aguado Ageletc, OrfeuBertolamia, Kanna Rajanb
aDepartamento de Fısica e Astronomia, Centro de Fısica do Porto, Faculdade de Ciencias, Universidade do Porto,Portugal
bFaculdade de Engenharia da Universidade do Porto, PortugalcEscola de Enxenarıa de Telecomunicacion, Universidade de Vigo, Espana
Abstract
The recent explosive growth of small satellite operations driven primarily from an academic
or pedagogical need, has demonstrated the viability of commercial-off-the-shelf technologies in
space. They have also leveraged and shown the need for development of compatible sensors pri-
marily aimed for Earth observation tasks including monitoring terrestrial domains, communica-
tions and engineering tests. However, one domain that these platforms have not yet made sub-
stantial inroads into, is in the ocean sciences. Remote sensing has long been within the repertoire
of tools for oceanographers to study dynamic large scale physical phenomena, such as gyres and
fronts, bio-geochemical process transport, primary productivity and process studies in the coastal
ocean. We argue that the time has come for micro and nano satellites (with mass smaller than
100 kg and 2 to 3 year development times) designed, built, tested and flown by academic depart-
ments, for coordinated observations with robotic assets in-situ. We do so primarily by surveying
SmallSat missions oriented towards ocean observations in the recent past, and in doing so, we
update the current knowledge about what is feasible in the rapidly evolving field of platforms and
sensors for this domain. We conclude by proposing a set of candidate ocean observing missions
with an emphasis on radar-based observations, with a focus on Synthetic Aperture Radar.
Keywords: Small Satellites, Sensors, Ocean Observation
∗Corresponding authorEmail addresses: [email protected] (Andre G. C. Guerra), [email protected]
(Frederico Francisco), [email protected] (Jaime Villate), [email protected] (Fernando AguadoAgelet), [email protected] (Orfeu Bertolami), [email protected] (Kanna Rajan)
Preprint submitted to Acta Astronautica December 24, 2015
arX
iv:1
512.
0744
2v1
[ph
ysic
s.in
s-de
t] 2
3 D
ec 2
015
1. Introduction
Starting with Sputnik’s launch in 1957, more than 7000 spacecraft have been launched, most
for communication or military purposes. Nevertheless, the scientific potential of satellites was
perceived early on, and even though Sputnik did not have any instruments, the radio beacon it had
was used to determine electron density on the ionosphere [1, 2]. A small percentage of the satellites
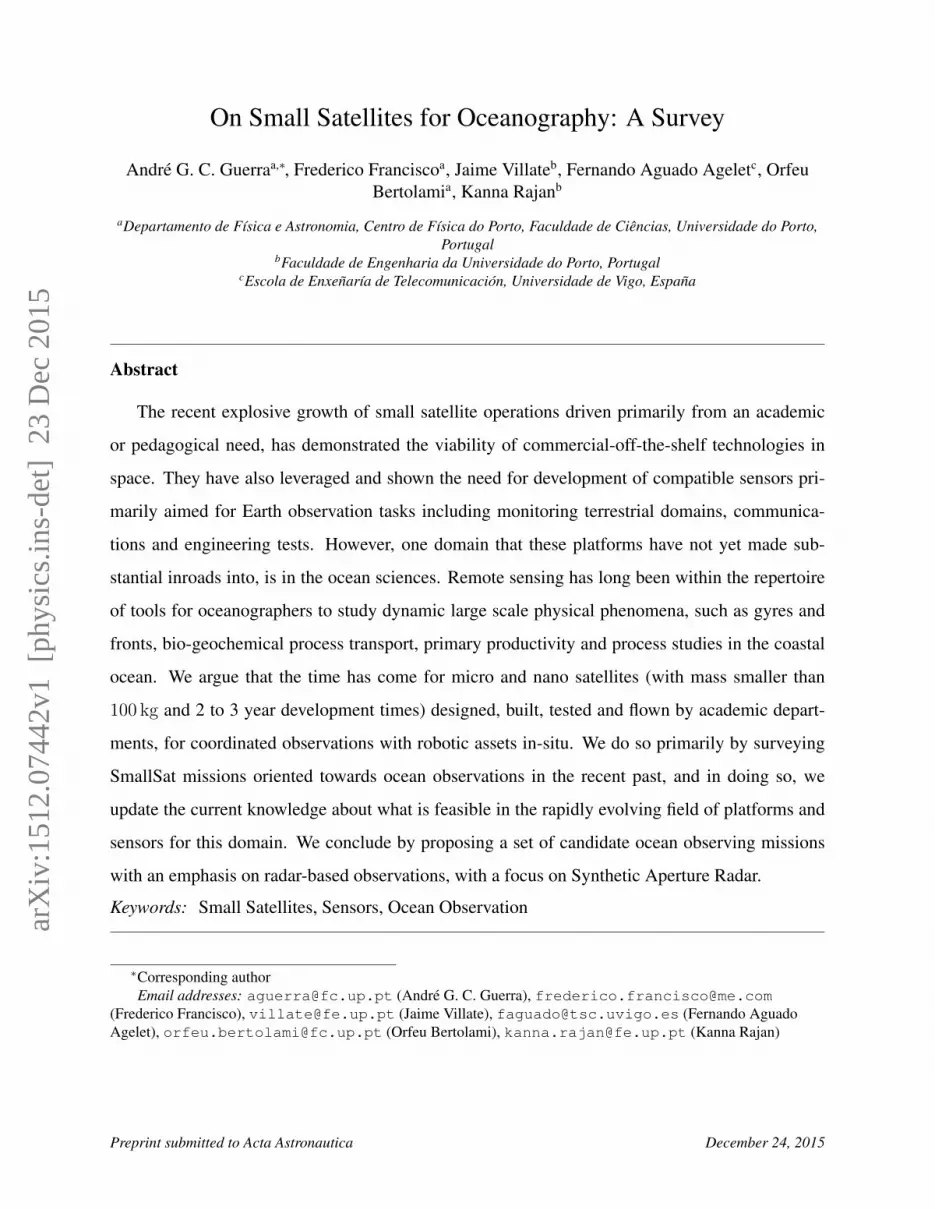
were, and still are, dedicated to research (see Fig. 1). In particular, we focus on Earth observation
and remote sensing satellites, as they have changed the way we perceive and understand our planet.
This transformation started with the first dedicated weather satellite, TIROS (Television Infrared
Observing Satellite) 1, launched 3 years after Sputnik 1 [1].
Space Exploration; 18%Communications;
17%
Technology-Oriented (R&D);
7%
Meteorological; 2,4%
Other Space Applications; 0,4%
Earth Remote Sensing; 3,0%
Military; 53%
Other; 12%
Figure 1: Distribution of the 7472 spacecraft, launched from 1957 to 2013, according to their mission objectives
(from [3])
Although the first satellites had mass smaller than 200 kg, consistent demand on performance
led to a natural growth in spacecraft mass, with direct consequences to their complexity, design,
test, launch, operation and cost. This reached a peak of 7.9 tonnes with ESA’s EnviSat mission
in 2002 [4]. With launch costs to low Earth orbit (LEO) being on average 21 ke/kg, and for geo-
stationary Earth orbits (GEO) 29 ke/kg, for conventional satellites, the missions were mainly de-
veloped by national institutions or multi-national partnerships involving substantial investment [5].
However, several engineering problems arose from having different instruments (with different fea-
tures and requirements) within the confines of a single spacecraft. Consequently, this rise in mass
has stopped and spacecraft of about 1 tonne, with fewer instruments have been preferred by the
2
European Space Agency (ESA) and the American National Aeronautics and Space Administration
(NASA) in the last few years.
The cost of a spacecraft is not only linked to the launch, but also to its development time, so
as to account for mission complexity, production and operation during its life-span [6]. Moreover,
their design, development and subsequent operation require a substantial infrastructure to provide
the end user with the desired data. Furthermore, project, planning and execution demands years of
investment prior to a successful launch.
The revolution of very-large-scale integration, in 1970, opened the possibility of integrating
sophisticated functions into small volumes, with low mass and power, which pave the way for
the modern small satellite [5]. This concept was initially demonstrated in 1961 with the Orbiting
Satellite Carrying Amateur Radio (OSCAR) 1, and kept growing in sophistication until OSCAR-
8, at the end of the 1970s (although still without an on-board computer). In 1981, the launch of the
UoSAT-OSCAR-9 (UoSAT-1), of the University of Surrey, changed this, as it was the first small
satellite with in-orbit re-programmable computers.
In this context, the recent evolution of small satellite (or SmallSats) designs have proved to be
promising for operational remote sensing. Typically these platforms have come to be classified as
small, micro, and nano satellites. According to the International Academy of Astronautics (IAA)
a satellite is considered small if its mass is smaller than 1000 kg [7]. Small satellites comprise
five sub-classes: mini satellites have mass between 100 and 1000 kg; micro satellites, whose mass
range from 10 to 100 kg; nano satellites, with mass smaller than 10 kg; and satellites with mass
smaller than 1 kg are referred to as pico satellites [8]. In this work, we will refer to SmallSats as
encompassing all of the above categories.
For each class of mass, there is an expected value for the total cost (which accounts for the
satellite cost, usually 70% of the total cost, launch cost, about 20%, and orbital operations, 10% [5])
and developing time, as shown in Table 1. Typically, these platforms have been demonstrated in
low to medium Earth orbits, and are launched as secondary payloads from launch vehicles. Due to
this piggyback launch, sometimes is not the mass of the spacecraft that determines the launch cost,
but the integration with the launcher [9].
3

Table 1: Spacecraft classification associated with mass [8], cost [5], and development time [10]
Satellite Class Mass [kg] Cost [M] Development Time [years]
Conventional > 1000 > 100 > 6
Mini 100 - 1000 7 - 100 5 - 6
Micro 10 - 100 1 - 7 2 - 4
Nano 1 - 10 0.1 - 1 2 - 3
Pico < 1 < 0.1 1 - 2
1.1. Advantages of SmallSats
While lower costs are one relevant consideration, SmallSats have other inherent advantages.
With developing times of less than 6 years (substantially less than larger platforms), SmallSats
have more frequent mission opportunities, and thus, faster scientific and data return. Consequently,
a larger number of missions can be designed, with a greater diversity of potential users [7]. In
particular, lower costs makes the mission inherently flexible, and less susceptible to be affected by a
single failure [11]. Furthermore, newer technologies, can iteratively be applied. This is particularly
pertinent for the adoption of commercial-off-the-shelf (COTS) microelectronic technologies (i.e.
without being space qualified), and Micro-Electro-Mechanical Systems (MEMS) technology, that
had a powerful impact on the power and sophistication of SmallSats [5]. Another important feature
of SmallSats is their capability to link in situ experiments with manned ground stations. As they
usually have lower orbits, the power required for communication is less demanding and there is no
need for high gain antennas, on neither the vehicles nor the ground control station. Finally, small
satellites open the possibility of more involvement of local and small industries [7]. These factors
combined, make such platforms complementary to traditional satellites.
There are however some disadvantages associated with small satellites. The two most con-
spicuous are the small space and modest power available for the payload. Both of these have a
particular impact on the instrumentation the spacecraft can carry and the tasks it can perform. As
most of small satellites are launched as secondary payloads, taking advantage of the excess launch
capacity of the launcher, they, most often, do not have any control over launch schedule and target
orbit [12].
Lower cost, greater flexibility, reduced mission complexity and associated managing costs,
4

make small satellites a particularly interesting tool for the pedagogical purposes, with a number of
platforms often designed, tested and operated by students (taking the operations of the spacecraft
to the university or even department level) [5]. Actually, small satellites projects have had a sub-
stantial educational impact even at the undergraduate student level. A number of universities over
the world, have launched satellite programmes, and the first launch took place in 1981 (the already
mentioned UoSAT-1) [13]. Rather unfortunately, these small satellite missions were so different
in kind, in terms of mass, size, power and other features, that by the turn of the century a series of
failures brought the student satellite missions, especially in the United States, nearly to a halt. This
led to the introduction of a standardisation effort, that took shape via the CubeSat.
In 1999 Stanford University and the California Polytechnic State University developed the
CubeSat standard, and with it the Poly Picosatellite Orbital Deployer (POD) for deployment of
CubeSats [14]. The CubeSat (1U) corresponds to a cube of 10 cm side (with a height of 11.35 cm)
and mass up to 1.33 kg, even though other sizes are admitted as a standard (see Table 2). The
hardware cost of a CubeSat can vary between e50,000–200,000.
Table 2: Standard classes for CubeSats [14]
Class Size [cm] Mass [kg]
1U 10× 10× 11.35 < 1.33
1.5U 10× 10× 17 < 2
2U 10× 10× 22.7 < 2.66
3U 10× 10× 34 < 4
3U+ 10× 10× 37.6 < 4
1.2. Ocean observation
Spacecraft have become an indispensable tool for Earth Observation given their capability to
monitor on regional or global scales, and with high spatial and temporal resolution over long
periods of time [15]. Several missions have covered and widely influenced the Earth sciences,
from meteorology and oceanography, to geology and biology [16]. SmallSats (in particular micro
and nano satellites) however, have had little to no impact thus far on oceanography. We intend to
make a case for such a focus.
5

About 70% of Earths surface is covered by the oceans, which are a fundamental component of
the Earth’s ecosystem. Variations on the oceans properties range from: temperature to salinity [17];
the formation or dissolution of episodic phenomenon such as blooms, fronts or anoxic zones; and
anthropogenic events, such as human induced chemical plumes from oil rigs, ships or agricultural
runoff. Other anthropogenic changes, including increased pressure on fishing, extended ship traffic
due to expanded global trade, drug and human trafficking and the recent uptick in maritime dis-
puted boundaries, further call for increased surveillance of the oceans. One should also point out
that the above causes have a significant impact on the coastal ecosystem, inhabited by about 44%
of the human population. Traditional methods for monitoring and observation have involved static
assets such as moorings with sensors fixed to the ocean floor, Lagrangian drifters or subsampling
by manned ships or boats. Understanding the change of ocean features has generated the need
for synoptic measurements with observations over larger spatial and temporal scales, critical to
deal with subsampled point measurements. More recently, robotic platforms such as autonomous
underwater vehicles (AUVs), including slower moving gliders, have extended the reach of such
traditional methods. As a consequence, scientists are now able to characterise a wider swath of
a survey area in less time and more cost effectively. While an advance, they are not considered
to be spatio-temporally synoptic, since they do not match the mesoscale (> 50 km2) observation
capability, necessary to digest the evolving bio-geochemistry or for process studies, especially in
the coastal ocean.
On the other hand, synthetic ocean models to provide means for prediction also come with
their own limitations. Their skill level, in particular, is often poor given the complexity of mixing
in near shore waters. Therefore, observation prediction continues to be a challenge hampering a
better understanding of the global oceans. Such a need is demonstrably important in situations like
oil spill response, such as the Macando event in the Gulf of Mexico.
With recent advances in unmanned aerial vehicles (UAVs), payload sensors, and their cost-
effectiveness in field operations, these platforms offer a tantalising hope of further extending the
reach of oceanographers. Nevertheless, ship-based or robotic-based observation and surveillance
methods have yet to provide that level of scale, maturity or robustness (or all of the above) appro-
priate for providing rapid maritime domain and situation awareness.
For all these reasons, satellite remote sensing continues to be a valuable tool, providing a range
6

of high-resolution data including imagery. More recently, radar imagery, from LIDAR (Light De-
tection and Ranging) to SAR (Synthetic Aperture Radar), have been a boon for maritime author-
ities, as well as policy makers, with their clear all-weather capability to observe the oceans. The
costs and complexity to provide such capabilities however is a significant shortcoming, especially
in the study of the changing ocean.
1.3. SmallSats and Ocean Observations
Our thesis is that micro and nano satellites are a key element in the (near) future needs of
oceanography. Besides the cost and more modest operational requirements, increasingly smaller
form-factor sensors are being designed and built for autonomous robotic (terrestrial, aerial and
underwater) platforms, which can be leveraged for SmallSats. Furthermore, as sensors become
increasingly affordable, we can envision multiple SmallSats in a constellation with identical sen-
sors, pointing Earthwards, to provide near real-time coverage to any part of the planet, especially
the remote oceans. Launch costs associated with a single SmallSat are unlikely to be substantially
reduced from multiply launched vehicles. In other words, we envisage that multiple SmallSats
carrying appropriate sensors in the same orbital plane, can and should become an extension of
oceanographic sensing. While such platforms cannot provide in situ sampling capability, their
synoptic observations can be used to intelligently provide such a capability to ensure robotic ele-
ments are “at the right place and right time”, to obtain data especially of episodic phenomenon.
Thus, combining the robotic capabilities of autonomous underwater vehicles (AUVs), au-
tonomous surface vehicles (ASVs), and unmanned aerial vehicles (UAVs), with dedicated small
satellites will considerably boost the study of the oceans, provide synoptic views potentially close
to real-time, and yield an unprecedented view of our evolving ecosystem on Earth, characterised
by the large mass of the ocean. SmallSats, AUVs, ASVs and UAVs are then elements in a strat-
egy to provide coordinated observation data. Another key objective of our work, is to show that
such a capability, along with novel methods of multi-vehicle control, can provide a new observa-
tional capacity, that combines both hardware and software so to make data more accessible to the
oceanographer, at whatever scales one wishes to select. These can be from small temporal scales
of observing evolving harmful algal blooms, to large spatial scales of movement of coherent La-
grangian structures [18]. Together with new methods in data science and analytics, trends can be
examined in more detail, with point measurements giving way to near continuous observations of
7

the ocean surface and potentially upper water-column. And to be able to do so in a cost-effective
manner.
Our objective in this survey paper is to provide a timely and comprehensive view, with a wide
perspective, of what SmallSats capabilities are currently available, and in many cases previously
proposed. And in surveying the field rigorously, we attempt to provide a perspective of the use
of such technologies now, and in the near future, for oceanographic measurements. Our intended
audience is scientists and engineers typically in the ocean sciences, and students in engineering
with interests in making ocean measurements and ocean engineering, especially marine robotics.
This paper is organised as a survey of SmallSat missions for oceanography cited in the liter-
ature, coupled with current methods in robotic oceanographic observations, and SmallSat charac-
teristics, to make a strong case for their focus on this domain. The organisation of this paper is as
follows: in Section 2, we motivate the use of SmallSats with in situ robotic platforms; in Section 3,
we survey prominent examples of micro and nano satellites and, in particular, those designed for
oceanographic studies or monitoring; in Section 4, we discuss the main building blocks of Small-
Sats; and in Section 5, we present a common set of sensors useful for oceanography. Finally, in
Section 6 we conclude with a discussion and our conclusions and perspectives.
2. Motivation: Coordinated Observations with autonomous platforms
Observing the ocean synoptically in space and time is an increasingly important goal facing
oceanographers. The changing climate has become a major societal problem to tackle, and with
an emphasis on the ocean as the primary sink for greenhouse gases, ocean science and the study
of the changing climate has become critical to understanding our planet. However, much has been
made of the lack of data and the need to analyse oceanographic phenomena at large scales, not
approachable with current observation tools and methodologies, that often rely on traditional ship-
based methods. To study phenomena and processes in the ocean which can spatially and temporally
range from minutes to months, ship-based methods are neither cost-effective nor sustainable in the
long run. Further such measurements do not provide a continuous scale of change in either space
or time necessary to understand natural variability.
Recent advances in robotic vehicles have made a dent in more sustainable ocean observation,
with the use of autonomous and semiautonomous platforms to observe at such varying spatio-
8
temporal scales. While this is a good start, we are at the infancy of systematic observations using
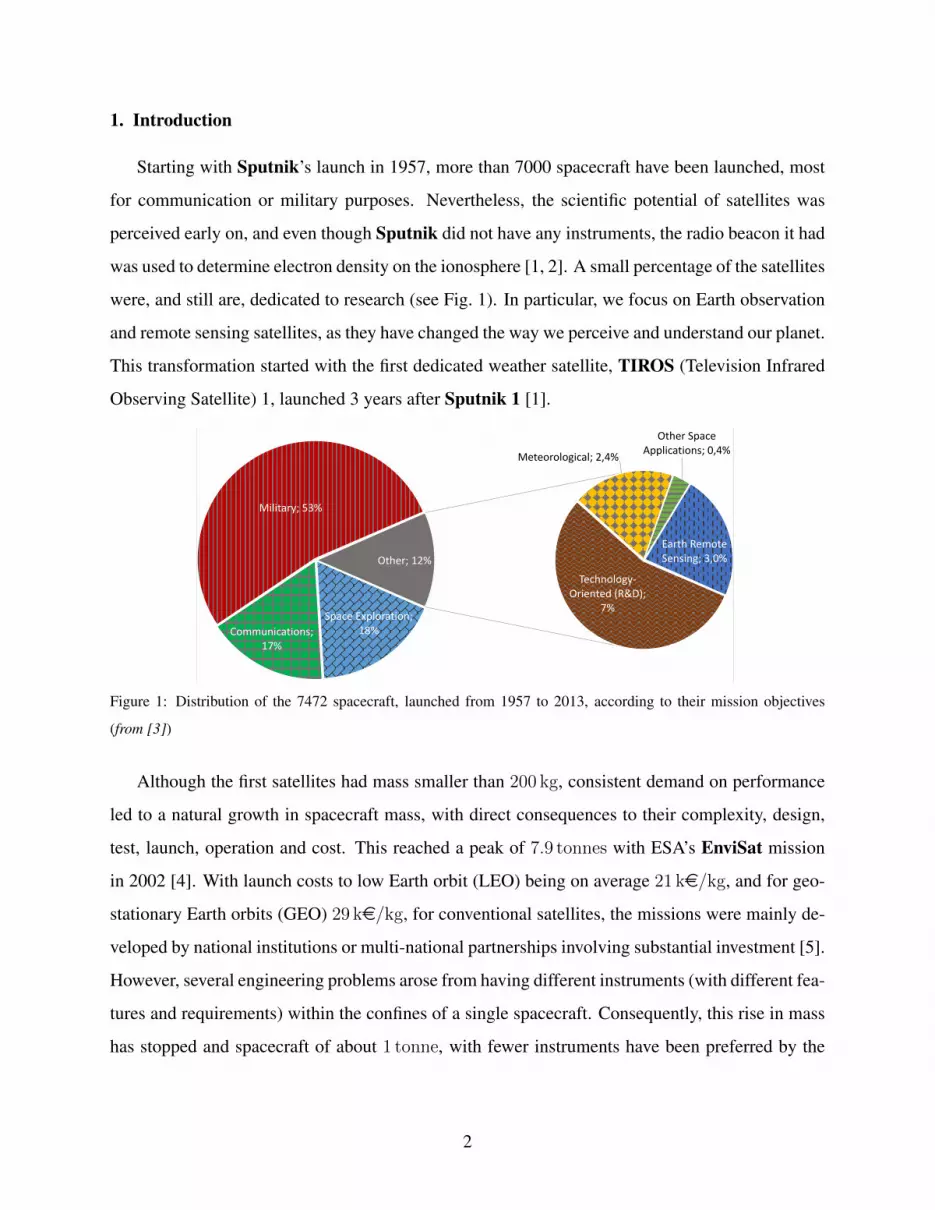
the current generation of robotic hardware. The principal challenge is to observe a water column
not just with point-based observations, but across the mediums of air and water, and the air/water
interface, and doing so continuously. Such observations need not only to be synoptic, but also to
be coordinated across space and time to observe the same patch of the ocean at the same time. Its
enabling requires coordination and control of a range of robots with appropriate sensors, across the
space, aerial, surface and underwater domains (Fig. 2).
CTD
Autonomous Surface VehicleDrifter
Shore-side decision-support
Autonomous Underwater Vehicle
Unmanned Aerial Vehicle(s)
DataMgmt
University Smallsatconstellation
Glider
Student controlledground station
Figure 2: Networked robotic platforms for synoptic oceanographic observations.
This necessitates the use of multi-platform systems to observe a patch of the ocean in the meso-
scale (> 50 km2), and to follow targeted phenomena of interest such as blooms, plumes, anoxic
zones, fronts over a period of days, weeks or longer. Recent experiments [19, 20, 21, 22, 23] have
led to the conclusion that multiple vehicles, operating in different operational domains, are critical
for such observational needs. Detection of the targeted features however require observation over
larger scales, with the consequent need for remote sensing data to drive robotic assets in situ.
9

Current generation of Earth (and ocean) observing spacecraft provide a rich trove of remote
sensing data, and have been credited with understanding the anthropogenic impact on our environ-
ment [24]. These systems have been complex, expensive and years in the making for design, build,
test and launch operations, and typically undertaken by governmental agencies or multinational
institutions.
The advent of the smartphone has resulted in a revolution in sensor technology with a corre-
sponding surge in applications for robotics. This surge has also seeped into satellite technology,
with SmallSats being produced as student projects, and operated in a far more affordable way.
SmallSats provide just such a novel approach to augmenting ocean observation methods. Their
coordination with Earth bound robotic platforms, with all-weather radar imagery, will allow for
localising features or targets (in security scenarios) for the ensemble of vehicles in the open ocean.
Such experiments have already commenced [21, 22], albeit without the space component1. A range
of applications, starting with upper water-column observations targeting Harmful Algal Blooms,
plumes, anoxic zones and frontal zones, will provide a rich trove of experience and equally impor-
tantly, scientific data. Developments along these lines, will push the state of the art, and practice, in
both engineering methods in marine robotics as well as in ocean science. Moreover, the technology
is dual-use and has clear applications to maritime security and defence.
Equally important, SmallSats are increasingly viable as student-led projects. Not only do they
provide a vehicle for student involvement, for a successful operation, such projects provide students
with a strong background in systems engineering and collaborative work in teams across various
disciplines, including electronics, material science, physics and control systems to name a few.
We call for an increased focus in SmallSats, both as a technological push, and for obtaining
new and sustained methods of observation and data collection, as also as pedagogical tools for
students in inter-disciplinary science and engineering. Student-led missions, with help from vari-
ous departments, will be required to design materials, sensors and software to be embedded within
these space-borne assets. Such platforms can then be part of a robotic ensemble, which can be
controlled for purposes of making sustained coordinated measurements in offshore environments.
1See http://rep13.lsts.pt/,http://rep15.lsts.pt/ and http://sunfish.lsts.pt/
10
3. Survey of Ocean Observing SmallSats
We focus now on a survey of SmallSats in the context of observing the oceans. In this and
following sections, we categorise SmallSats in terms of micro, nano or CubeSats. The survey
covers those in design stages, successfully operating, as well as those which were unsuccessful in
meeting their operational requirements. This survey is up to date until around Fall 2015.
Some of the fields where SmallSats (especially below 100 kg) have proved useful are ocean
imaging, data storage and relay, and traffic monitoring (e.g. through the Automatic Identifica-
tion System, AIS). While not all the surveyed examples involve oceanographic variables per se,
they have relevant bearing on oceanography. We also consider missions where a constellation of
SmallSats is employed.
The SmallSat’s described here were referenced through available online databases (the Earth
Observation Portal2, the Union of Concerned Scientist satellite database3, and the Nanosatellite
Database4), and via a wider survey of the literature as well as the web. Whenever possible, refer-
ences of the different missions were used, although some information comes from the databases.
Table 3 summarises the spacecraft discussed here, with mass, power, mission and payload (related
to oceanography), and launch date (past and future).
3.1. Ocean Imaging
While a number of imaging nano and micro satellites have been flown, and although some of
the SmallSat imagery could be used for oceanographic studies, only a few are actually focused on
ocean observation. No CubeSats were found that were equipped with ocean imaging systems [4],
although in 2013 COPPER was about to be the first. Among micro satellites, only two were
found that have already been launched: one for commercial purposes (WINISAT-1); the other
(QSat-EOS) for monitoring ocean health, using data acquired for other purposes.
RISESat. The Rapid International Scientific Experiment Satellite (RISESat) is being developed
under an international cooperation led by Tohoku University, within the Japanese programme
FIRST (Funding Program for World-Leading Innovative R&D on Science and Technology) [25].
2https://directory.eoportal.org/web/eoportal/satellite-missions3http://www.ucsusa.org/nuclear-weapons/space-weapons/satellite-database.html4http://www.nanosats.eu/
11

Table 3: Summary of Ocean Observing SmallSats (Operational if not stated otherwise)
Satellite Mass [kg] Power [W] Size [cm]a Missionb Payloadb Launch
ZACube-2‡ 4 – 10× 10× 34 Vessel tracking and ocean colour AIS and imager –
RISESat‡ 60 100 50× 50× 50 Fisheries and environment studies Multi-band camera 2016
M3MSat‡ 85 80 80× 60× 60Augmenting maritime surveillance ca-
pabilitiesAIS 2016
AAUSat5 0.88 1.15 10× 10× 11 Vessel tracking AIS 2015
LambdaSat? 1.5 1.5 10× 10× 11 Vessel tracking AIS 2015
LAPAN-A2 68 32 50× 47× 36 AIS payload for the equatorial region AIS 2015
AISat 14 15 10× 10× 11Helical antenna technology demonstra-
tionAIS 2014
QSat-EOS 50 70 50× 50× 50 Ocean eutrophication VIS and NIR camerac 2014
AAUSat3? 0.8 1.15 10× 10× 11 Vessel tracking AIS 2013
COPPER+ 1.3 2.5 10× 10× 11 Infrared Earth imagesUncooled Mi-
crobolometer Array2013
WNISAT-1 10 12.6 27× 27× 27 Monitoring Arctic Sea stateVIS and NIR cam-
eras2013
Aeneas 3 2 10× 10× 34 Track cargo containersAntenna and corre-
sponding electronics2012
VesselSat 2 29 – 30× 30× 30 Collect space-borne AIS message data AIS 2012
SDS-4 50 60 50× 50× 45 Demonstrate space-based AIS AIS 2012
exactView 1 98 – 63× 63× 60Commercial constellation of AIS
spacecraftAIS 2012
exactView
6/5R/12/11/1313 15 25× 25× 25
Commercial constellation of AIS
spacecraftAIS 2011/13/14
VesselSat 1 29 – 30× 30× 30 Collect space-borne AIS message data AIS 2011
AISSat-1 6.5 0.97 20× 20× 20Assess feasibility of situational aware-
ness serviceAIS 2010
NTS/CanX-6? 6.5 5.6 20× 20× 20 Demonstrate AIS detection technology AIS 2008
WEOS 50 14.5 52× 52× 45 Data relay from cetacean probes UHF Antenna 2002
a Size of the main structure (not accounting for deployed mechanisms, e.g. antennas).b Related to oceanography.c Visible (VIS) and near infrared (NIR).‡ To be launched.? Concluded operations.+ Mission failed.
With a launch planned for 2016, the objectives are two fold: technological – to demonstrate the
platform performance, as it is planned to be a common bus for future missions; and scientific –
through the integration of scientific payloads from different countries, mainly focused on the Earth
12

and its environments (to a total mass of about 10 kg) [26].
The spacecraft bus, the Advanced Orbital Bus Architecture (AOBA), is intended to be versatile,
cost effective, and with a short development schedule, to be compatible (and competitive) for
future scientific missions. The size of the bus is expected to be smaller than 50× 50× 50 cm, with
a maximum mass equal to 60 kg (but typical less than 55 kg). The main structure has a central
squared pillar, with one side extended to connect to the outer panels (increasing the mounting
surface and resulting in a more stable satellite). The outer panels are made of aluminium isogrid.
Attitude and orbit determination is performed through the use of two star sensors, a 3-axis
fibre optic gyroscope, a 3-axis magnetometer, a GPS receiver, and coarse and accurate sun sensors
(covering 4π). Control is achieved with four reaction wheels and 3-axis magnetic torque rods. To
achieve a high reliability, some sensors and actuators are designed with redundancy.
Power is supplied by gallium arsenide (GaAs) multi-junction cells, divided in two deployable
panels and a body-mounted one, generating more than 100W. The enhanced amount of electric
power, around double the power consumption (expected to be more than 50W), allows for long
period and multi instrument observations. A power control unit (PCU) provides each subsystem
supply lines, although, some more demanding components (in terms of power) are also directly
connected to the PCU. Nickelmetal hydride (NiMH) type batteries are also installed.
Three different bands are used for communications. The UHF is used for command uplinks,
and a S-band for housekeeping downlink. As large amounts of scientific data are expected to be
generated, a X-band downlink system was added [26].
Furthermore, a de-orbit mechanism will be installed, so to make the spacecraft re-enter Earth
in about 25 years, following the standards for the maximum re-entry time after the mission com-
pletion [27, 28]. Six micro cameras will also be installed to monitor the satellite’s structure and
deployment, and to view the Earth and where the instruments are pointing.
The payloads include a High Precision Telescope, a Dual-band Optical Transient Camera, a
Ocean Observation Camera (OOC), a Three-dimensional Telescope, a Space Radiation micro-
Tracker, a micro-Magnetometer, a Very Small Optical Transponder, and a Data Packet Decoder.
The only focused in ocean observation, the OOC is a multi-band camera, with about 100m
spatial resolution, and a wide field of view (swath width of approximately 65 km) [25]. Although
the system will work in a continuous acquisition mode, the region of interest is around Japan
13
and Taiwan. The resulting data will mainly be used for fisheries and environmental studies. The
instrument is compatible with Space Plug & Play technology, and has a mass of about 1 kg [26].
Furthermore, it has a power consumption of less than 3W (5V), and uses a Watec CCD (charge-
coupled device) with 659× 494 pixels (square pitch size of 7.4µm), for each of the three F/1.4
lens.
QSat-EOS. Graduate students of Kyushu University, in Japan, started developing a spacecraft
for space science. However, the main objective of the mission was shifted to Earth Observation,
in particular to disaster monitoring, due to funding requirements [29]. Other objectives include
monitoring of Earth’s magnetic field, detection of micro debris, and observation of water vapour
in the upper atmosphere [30]. Data acquired also supports other studies, namely agricultural pest
control, red tide (harmful algal bloom) detection, and ocean eutrophication (pollution due to excess
of nutrients [31]). Launched in 2014, data is currently being gathered by this SmallSat.
COPPER. The Close Orbiting Propellant Plume and Elemental Recognition CubeSat was an ex-
perimental mission to study the ability of commercially available compact uncooled microbolome-
ter detector arrays to take infrared images, besides providing space situational awareness [32]. Ad-
ditionally, it was intended to improve models of radiation effects on electronic devices in space.
This SmallSat was part of the Argus programme, a proposed flight programme of a few CubeSat
spacecrafts spanning over many years, of which COPPER was the pathfinder mission [33]. It was
launched in November 2013, but communications were unable to be established.
WNISAT-1. One of the largest weather companies, Weathernews Inc. of Tokyo, funded the sea
monitoring mission WNISAT-1 (Weathernews Inc. Satellite-1), which was launched in 2013 [34].
The objective was to provide data on the Arctic Sea state, in particular ice coverage, to shipping
customers operating on that area [35]. The micro satellite was designed by a university venture
company, AXELSPACE. The aim was to use a simple architecture and, when possible, COTS
devices, with a compact design, simple operational support, and minimum redundancies. This
SmallSat continues to be operational.
3.2. Data Relay SmallSats
There are various missions that do not have payloads designed specifically for oceanographic
studies, but even so they perform or support work in oceanography, as data relay spacecraft. Some
14

receive data from in situ experiments (e.g. buoys), and transmit the data received when a ground
station is in view. This alleviates the need for a human operator to monitor an experiment, and to
get the acquired data. A prominent example is the Whale Ecology Observation Satellite (WEOS)
of the Chiba Institute of Technology in Japan.
Other examples within the realm of data relay SmallSats are the ParkinsonSat [36], the
TUBSAT-N and N1 nano spacecrafts (which were launched from a submarine) [37], the twin
CONASAT 8.2 kg spacecrafts [38], and the FedSat (Federation Satellite) [39].
The submarine launch, the first commercially, was made from a Russian vessel, using a con-
verted ballistic missile, in 1998. Such submarine-based launches open up the possibility of sending
a spacecraft to any orbit inclination, without requiring any space manoeuvres. Clearly, form-factors
are critical, since only small spacecraft can be launched in this manner, due to size and rocket power
constraints.
WEOS. Launched in 2002 to a Sun-synchronous orbit of about 800 km, the WEOS spacecraft was
designed, built and operated by students of the Chiba Institute of Technology, in Japan. The goal
was to track signals emitted by probes attached to whales, while studying their migration routes.
The probe transmitted GPS position, diving depth, and sea temperature using the UHF band [40].
Although the spacecraft is still operational, scientists were unable to attach the probes to whales,
and only tests with ocean buoys were made.
3.3. Tracking and AIS
Maritime domain awareness and security is a key need for governments and policy makers
worldwide. This includes protection of critical maritime infrastructures, enforcement of the free-
dom of navigation, deterrence, preventing and countering of unlawful activities [41]. A number of
countries are paying special attention to this problem. One example is Canada, where 1600 ships
transect its extended continental shelf per day [42]. Japan, Norway and Indonesia are other exam-
ples of countries paying attention to maritime traffic, given that their exclusive maritime economic
zones are substantial [43, 44, 45].
To have an effective Maritime Domain Awareness (MDA), a number of information sources
are available, even though most maritime infrastructure still lack a thorough response to the cur-
rent necessities [46]. Most ship monitoring is currently performed using maritime radars, vessel
15
patrolling, and by ground based Automatic Identification System (AIS) [47, 48]. A significant
part of the time is spent in identifying unknown targets, collected from a variety of Intelligence,
Surveillance, and Reconnaissance (ISR) sensors. An efficient process to perform this sorting, and
to correlate information with other ISR data, is critical. A possibility, suggested by many, is the
combination of AIS with SAR imagery. In some cases this has already been initiated, for instance,
by operations of the Norwegian Coast Guard [43].
AIS is a ship-to-ship and ship-to-shore system used primarily to avoid collisions, and to provide
MDA and traffic control [48, 49]. It is mandatory for all vessels with more than 300 tonnes and
all passenger ships in international waters, as also for ships with more than 500 tonnes in most
national waters [43].
AIS works by sending a VHF signal providing the Maritime Mobile Service Identity (i.e. posi-
tion, heading, time, rate of turn, and cargo) [42]. It has a typical range between 50 km and 100 km,
making it only practical nearshore and in maritime choke points. However, due to this limited
range, the system can be simpler, using a self-organised time division multiple access scheme (i.e.
each transmitter within 100 km can self-organise and transmit its information without interfering
with messages sent from other ships in the same cell) [49].
When an AIS receiver is placed in space, a global view of maritime traffic, with a number
of applications can be achieved. These include not only traffic awareness (with capabilities for
national security tasks and shipping), but also for search and rescue, and environmental studies. In
the fourth revision of the recommendations for the system, AIS has been suggested as a means to
promote ship-to-space communication [43]. However, in doing so, signal jamming problems arise,
due to the wider FOV (field of view) of a space-based platform (normally more than the 100 km),
specially in high traffic areas [43]. Furthermore, because the signal has to travel a longer distance
(than the normal maximum 100 km) it is weaker. Another problem is the high relative velocity
of the spacecraft, which induces Doppler shifts [44]. Moreover, the ionosphere induces a Faraday
rotation of the polarisation plane of the signals (dependent on its frequency), decreasing the signal
power received by the satellite (due to the discrepancy between the signal and the antennas), a
problem also present with other remote sensing measurements.
Several spacecraft have carried AIS systems, and much work in this area is still being per-
formed [50]. For some, the literature is not detailed, besides some general data and the launch
16

dates. For instance, Triton 1 and 2 are two examples of 3U CubeSat spacecraft, from the UK, that
intend to test advanced AIS receivers [51]. TianTuo 1 is a Chinese nano satellite (9.3 kg) from the
National University of Defense Technology (NUDT) that also performs tracking of AIS signals,
in addition to other experiments [52]. Two others with less information available are Perseus-M
1 and 2. These spacecraft were built by Canopus Systems US, and follow the 6U CubeSat stan-
dard [53, 54]. Finally, another example is the DX 1 (Dauria Experimental 1), a 27 kg spacecraft,
with a size of 40× 40× 30 cm, built by Dauria Aerospace [55]. Besides testing technology it also
carries an AIS receiver.
ZACube-2. The Cape Peninsula University of Technology (CPUT) created a programme to de-
velop nano satellites in South Africa, of which the ZACube-2 will be the second spacecraft [56].
Although still not launched, this spacecraft will serve as a technology demonstrator including a
software defined radio (SDR), which will be used for tracking AIS signals, and a medium resolu-
tion imager, to perform ocean colour and fire monitoring.
M3MSat. The Canadian Department of National Defence (DND) wanted to expand the range
of AIS farther than the maritime inner zone, and integrate AIS and ISR data to produce an im-
proved Recognized Maritime Picture [42]. Building upon the experience of a previous mission,
the Near Earth Object Surveillance Satellite, a new satellite is scheduled to be launched in 2016,
the M3MSat (Maritime Monitoring and Messaging Microsatellite). The main mission objectives
are: to monitor ship AIS signals, utilised by the Canadian government and Exactearth (a com-
mercial venture for tracking AIS data); serve as a platform demonstrator; and establish a flight
heritage [42].
AAUSat. The Department of Electronic Systems of Aalborg University (AAU) created an edu-
cational programme where students could have access to many aspects of satellite design and
development. From this programme three satellites were designed for tracking vessels with AIS
systems, the AAUSat3, 4 and 5 [57]. Of these, AAUSat3 has concluded its mission, AAUSat5
was launched from the International Space Station (ISS) in October 2015, whereas AAUSat4 is
still being tested. With each spacecraft a new version of the AIS system is flown.
LambdaSat. A group of international students in Silicon Valley, California, have developed a
spacecraft with three main objectives: space qualification of graphene under direct solar radiation
17
and space exposure; demonstration of an AIS system; and space qualification of three-fault tolerant
spacecraft [46]. The SmallSat was deployed in March 2015 from the ISS [58]. About 30 days later,
the mission was concluded and the spacecraft re-entered the atmosphere in May 2015.
LAPAN-A2. The Indonesian space agency (LAPAN) propelled by the training of its own engineers
in the Technical University of Berlin, during the design and building of LAPAN-TUBSAT or
A1, developed the LAPAN-A2 [59]. It was launched in 2015, for Earth observation, disaster
mitigation, and implementation of an AIS system [45].
AISat. The Automatic Identification System Satellite (AISat) was designed by the German Aerospace
Center (DLR) to monitor AIS signals. Launched in 2014, it is currently operational. In particu-
lar, the Institute of Space Systems is responsible for adapting the Clavis bus (an adaptation of the
CubeSat platform by DLR) to this mission, while the Institute of Composite Structures and Adap-
tive Systems developed the helical antenna for the AIS payload [60]. Two companies (The Schutze
Company and Joachims) and the Bremen University of Applied Sciences were also partners in the
project. The difference between this mission and others described here, is in the use of a helical
antenna.
Aeneas. The Aeneas nano satellite was designed to track cargo containers (equipped with a 1W
Wifi type transceiver) around the world [61]. It was developed by students of the University of
Southern California, Space Engineering Research Center in partnership with iControl Inc. (the
primary payload provider) and was launched in 2012 [62]. The orbit is an ellipse with a periapsis
of about 480 km.
VesselSat. LuxSpace Sarl owns and operates two micro satellites, the VesselSat 1 (launched in
2011) and 2 (in 2012), to monitor maritime traffic with a space-based AIS system [63]. Both
continue to be operational. These spacecraft were built upon the experience gained in flying the
Rubin 7, 8 and 9 non-separable payloads, flown before on the upper stage of the Polar Satellite
Launch Vehicle [64].
SDS-4. The Japan Aerospace Exploration Agency (JAXA) created the Small Demonstration Satel-
lite programme in 2006, in order to test the next generation space technologies and, at the same
time, to create a standard 50 kg bus for future missions [44]. Within this programme, the Small
18

Demonstration Satellite 4 (SDS-4) is the second satellite, and one of its objectives, apart from
demonstrating high performance and small bus technology, is to validate a space-based AIS sys-
tem [50]. Launched in 2012, it remains operational, even after completing its designed life time [65].
AISSat-1. Launched in 2010 (to a 630 km altitude Sun-synchronous polar orbit), AISSat-1 is
the first dedicated satellite build for space-based monitoring of AIS signals by Norway, in part-
nership with the University of Toronto, Institute for Aerospace Studies/Space Flight Laboratory
(UTIAS/SFL) [43, 47]. The objective is to enhance MDA in Norwegian waters, which amounts to
more than 2 million square kilometres. Due to continuing success of the AISSat-1 mission (still
operational in late 2015), two more spacecraft, the AISSat-2 and 3, where built (AISSat-2 was
launched in 2014, and AISSat-3 is expected to be launched in 2016).
NTS/CanX-6. In 2007/2008 cooperation between the University of Toronto, Institute for Aerospace
Studies/Space Flight Laboratory (UTIAS/SFL) and COM DEV Ltd. designed, produced and
launched a nano satellite, in less than seven months, to perform experiments in the reception of
AIS signals, the Nanosatellite Tracking Ships (NTS) [49]. While the platform is based on SFL
CanX-2 nano satellite and the Generic Nanosatellite Bus (GNB), the AIS payload was developed
by COM DEV. A top-down approach was performed, based on the mission requirements (lifetime,
data throughput, attitude, schedule, and resources), balanced with a bottom-up analysis, which ac-
counted for hardware limitations (on-board memory, downlink rate, power, volume, and others),
maturity and readiness. Even though the spacecraft is still in orbit, and keeps regular contact with
the ground stations, it is no longer considered operational.
3.4. Constellations
Constellations can be considered as a category of their own. They are primarily used to com-
bine several observations of the same target, performed by different platforms, and to obtain sci-
entific data that could not be acquired using a single spacecraft. Another usage concept for a
constellations is to achieve a permanent global coverage, like the GPS constellation, or Iridium
for communications. An example of such a constellation, and of particularly relevance for this
work, is the exactView discussed below.
19

SOCON. The SOCON (Sustained Ocean Observation from Nanosatellites) project, intends to
develop the SeaHawk 3U CubeSats spacecraft [66]. Two prototypes are expected to be launched in
2017, and will act as forerunners for a constellation of ten SmallSats. The objective is to measuring
ocean colour, using HawkEye Ocean Colour Sensors. The associated cost is expected to be about
eight times less, with a resolution from seven to 15 times better, than its predecessor, the single
mini OrbView-2 satellite (previously named SeaStar).
CYGNSS. Each CYGNSS (Cyclone Global Navigation Satellite System) satellite has a mass of
25 kg, and the constellation has eight identical satellites weighting in total 200 kg [67]. This con-
stellation, expected to be launched in 2016 on a single launch vehicle, will serve to relate ocean
surface properties (retrieved from reflected GPS signals), atmospheric conditions, radiation and
convective dynamics, with tropical cyclone formation [68].
exactView. The exactView spacecrafts/payloads are part of the exactEarth company constellation
of currently seven AIS systems [69]. With this constellation exactEarth expects to have a global
revisit time (gap between subsequent detection of individual ships) of around 90 minutes, giving
their customers a comprehensive view of traffic in an area of interest.
The first satellite was the experimental NTS (EV0), discussed above, which is considered by
exactEarth to be retired. In 2011, came the EV2, an AIS payload aboard the ResourceSat 2
satellite, and EV6 and 5R satellites (which were named AprizeSat-6 and 7) produced by Space-
Quest and transferred to exactEarth. The fifth satellite, launched in 2012, is exactView1 (EV1).
AprizeSat 8 was commissioned and became EV12 in 2013. More recently, in 2014, EV11 and
13 (AprizeSat 9 and 10) started operations. Three more AIS systems are expected to be added to
the constellation, the EV9 spacecraft (launched in September 2015), the EV8 (which is part of the
payload of the Spanish Paz satellite), and the M3MSat satellite discussed above (considered by
exactEarth to be EV7) [70].
The AprizeSat constellation goes beyond the 6 to 10 that passed onto exactEarth. About 64
satellites are planned, so as to build a global system of data communication, tracking and monitor-
ing of assets, and in some cases AIS payloads [71].
20
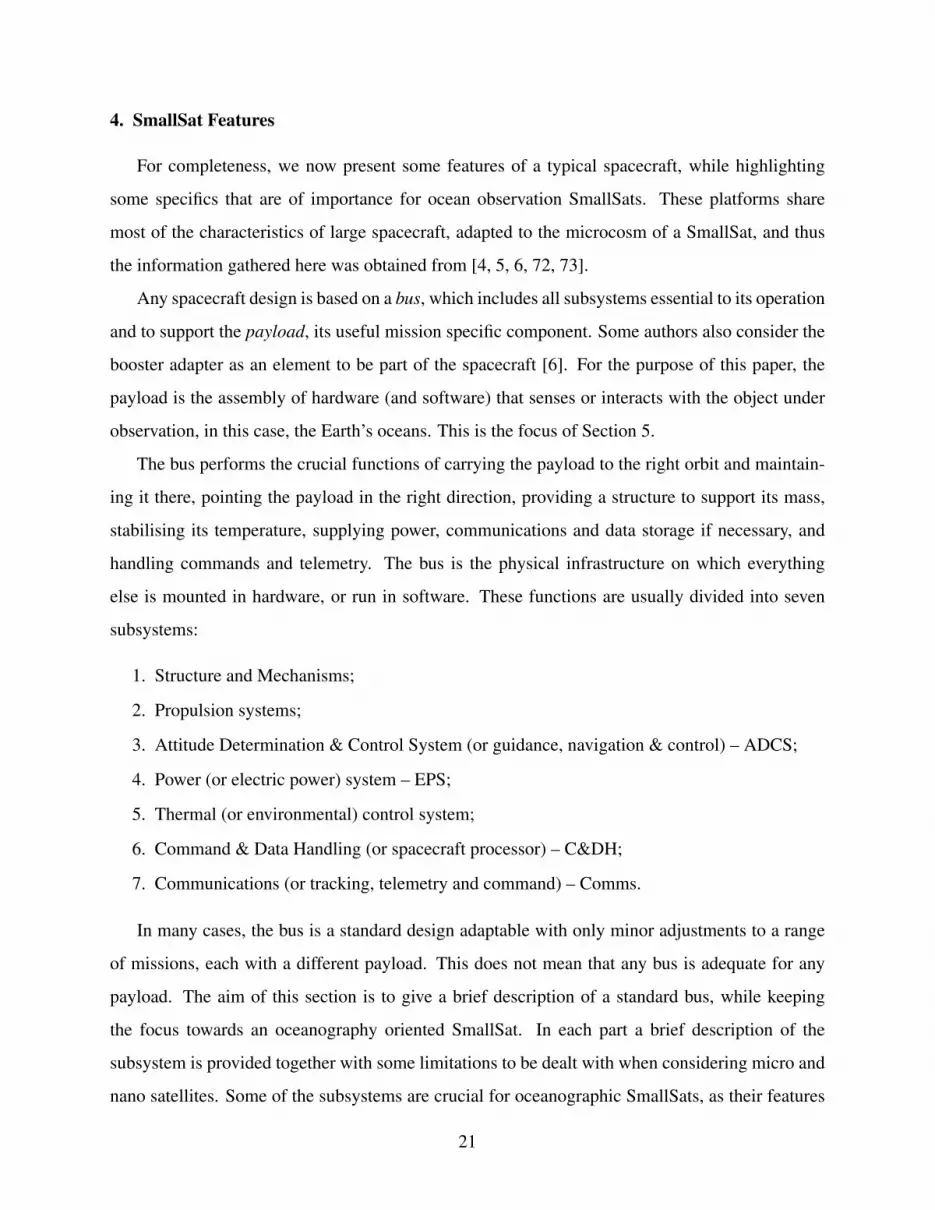
4. SmallSat Features
For completeness, we now present some features of a typical spacecraft, while highlighting
some specifics that are of importance for ocean observation SmallSats. These platforms share
most of the characteristics of large spacecraft, adapted to the microcosm of a SmallSat, and thus
the information gathered here was obtained from [4, 5, 6, 72, 73].
Any spacecraft design is based on a bus, which includes all subsystems essential to its operation
and to support the payload, its useful mission specific component. Some authors also consider the
booster adapter as an element to be part of the spacecraft [6]. For the purpose of this paper, the
payload is the assembly of hardware (and software) that senses or interacts with the object under
observation, in this case, the Earth’s oceans. This is the focus of Section 5.
The bus performs the crucial functions of carrying the payload to the right orbit and maintain-
ing it there, pointing the payload in the right direction, providing a structure to support its mass,
stabilising its temperature, supplying power, communications and data storage if necessary, and
handling commands and telemetry. The bus is the physical infrastructure on which everything
else is mounted in hardware, or run in software. These functions are usually divided into seven
subsystems:
1. Structure and Mechanisms;
2. Propulsion systems;
3. Attitude Determination & Control System (or guidance, navigation & control) – ADCS;
4. Power (or electric power) system – EPS;
5. Thermal (or environmental) control system;
6. Command & Data Handling (or spacecraft processor) – C&DH;
7. Communications (or tracking, telemetry and command) – Comms.
In many cases, the bus is a standard design adaptable with only minor adjustments to a range
of missions, each with a different payload. This does not mean that any bus is adequate for any
payload. The aim of this section is to give a brief description of a standard bus, while keeping
the focus towards an oceanography oriented SmallSat. In each part a brief description of the
subsystem is provided together with some limitations to be dealt with when considering micro and
nano satellites. Some of the subsystems are crucial for oceanographic SmallSats, as their features
21

will limit scientific objectives. A schematic of these subsystems, with their essential components,
is shown in Fig. 3.
Active
Propellant
Active
Cold gas0.1 to 2N
Star Sensor
Communications
Permanent Magnets
Passive
Electric Power
System Gravity Gradient Boom
Receiver
On-board Computer
Antenna
Distribution System
Magnetic Torque Rods
Sun Sensor
Attitude Determination
& Control System
Actuators
GPS
Surface Coatings
Radiators
Power Distribution
Power Management Unit
Thermal Control
Relative
Sensors
Command & Data
Handling
Reaction Wheels
Tanks
Structure and
Mechanisms
Electric0.001 to several N
Power Source
Gyroscopes
BatteryLi-Ion
Propulsion
Transmitter
Thermal Insulation Passive
Heat Pipes
Interface Units
Storage Units
MagnetometerData Buses
Monopropellant0.5 to 3000N
Bipropellant10 to >>1000N
Propellant Supply
Power Storage
Unit
Absolute
Heaters
Thrusters
Solar Array
Figure 3: Schematic of a spacecraft subsystems (squares), with respective components (ellipses).
4.1. Structure and Mechanisms
The structure and mechanisms subsystem is the skeleton of the spacecraft, determining the
overall configuration. It carries and supports all the equipment, and protects (during launch) the
components to be deployed in orbit. The structural architecture is designed based on the attitude
control requirements, and typically its mass range between 10 to 15% of the dry mass of the
spacecraft.
For many SmallSats, the basic shape of the satellite is a cuboid (for 3-axis stabilised spacecraft),
with usually five lightweight sides and a more massive structure which supports the link to the
launch vehicle. The spacecraft components (including payload) are linked to the inner side of the
22
exterior panels. Conversely, CubeSats have four pillars (trusses or stiff rods) at the corners that
support the structure, and face plates (closed or open).
The University of Surrey, which is at the forefront of designing small satellite platforms, also
uses the CubeSat modular approach [5]. Thus each subsystem is machined in identical boxes,
which are stacked on top of each other, and held together by tie-rods, to form the main body, and
to where other instruments and solar panels are mounted onto.
Although in most missions the structure adapts to the payloads that will be installed, there
are some that work the other way around, i.e. structure dimensions, and internal configuration,
constrain the payloads the satellite can carry. Payload restrictions is more evident in CubeSats,
since there is a standard for dimensions (and mass) to be followed.
4.2. Propulsion Systems
A propulsion system serves mostly to change or to fix the orbit of a spacecraft, including de-
orbit manoeuvres at end of life, counteract drag forces, and sometimes to control its attitude and
angular momentum. The most significant parameters of a propulsion system are the total impulse,
and thruster characteristics (number, orientation, and thrust levels). Other important parameters
are total mass, power demand, reliability and mission lifetime.
Common propulsion methods cover, in ascending order of performance: cold gas, which can
supply from 0.1N to 2N; monopropellant, with a capacity between 0.5N and 3000N; bipropel-
lant, yielding 10N to much more than 1000N; and finally electric, with forces of just 0.001N to
several N. Although more efficient, electric propulsion requires a larger power supply, than chem-
ical propulsion, to produce thrust. Usually solar panels are used, for Earth orbiting missions. This
has an inherent increase in mass (about 40W/kg).
Even though a propulsion system is included in most spacecrafts, especially if in geosyn-
chronous orbit (where station-keeping manoeuvres are common), the simplest SmallSats do not
have any thrust capability. Nevertheless, it has been installed in spacecraft as small as CubeSats,
based on either chemical or electrical systems. An example, is the miniature cold gas system
installed in the SNAP-1, a 6.5 kg nano spacecraft.
23

4.3. Attitude Determination & Control System
The spacecraft’s angular orientation (the direction it is pointing to) is controlled and sensed by
the attitude determination and control subsystem (ADCS or ACS). In some cases, it also determines
the satellite’s orbit (and it may even control it if a propulsion system is present, as discussed in
section 4.2). Some references treat orbit determination and control as a different subsystem; we
treat them together in this paper.
Characteristics and performance of the ADCS is determined by the mission, and in particular,
payload requirements. These affect the accuracy (the difference between real-time and post facto
attitude), the stability (the efficiency of keeping attitude rates), and the agility (the time needed to
change between two desired attitudes). Other drivers include mass, power, cost, lifetime, reliability,
and redundancy [73].
Some of the simplest spacecraft do not have any form of ADCS subsystem, and the attitude
will continuously change (one of the oldest examples is the Sputnik 1 itself). They can only have
payloads that are omnidirectional, like antennas, and all facets need to have solar panels if powered
by solar power. In other cases, specially if the mass requirements are stringent, some SmallSats
employ passive control methods [6]. More complex systems have controllers, actuators, and/or
propulsion subsystems (to actively control attitude, velocity, or angular momentum), and sensing
instruments to determine the attitude and orbit position [72].
There are several methods to determine the 3-axis attitude of a spacecraft but, typically, data of
different sensors are combined. Common sensors include: star and sun sensors; magnetometers;
gyroscopes; and GPS.
Attitude control can be achieved either passively or actively. Most common actuators are:
permanent magnets; a gravity gradient boom; thrusters; magnetic torque rods; and reaction wheels
For CubeSats, sensing accuracies of less than 2° have been achieved (which can be translated
to a ground uncertainty of 14 km for a 400 km altitude orbit), while control accuracies are less
than 5° [4]. These accuracies have to be improved for some oceanographic missions, although
the estimated 0.02° of future CubeSats (a ground uncertainty of 140m) will certainly be enough
for most applications. Sun sensors with magnetometers are the preferred solution, combined with
passive or active magnetic control. Reaction wheels have also been tested but are uncommon.
Furthermore, advanced miniature GPS navigation devices have already been used in nano satellites
24

for orbit determination.
A typical set of ADCS actuators for micro satellites, is a pack of reaction wheels with mag-
netic torque rods, as these are necessary for wheel unloading/desaturation, i.e. deceleration of the
wheels. Nevertheless, some passive control using permanent magnets has also been used [5]. Usual
sensors are a magnetometer, a gyroscope, sun sensors (using most times complementary metalox-
idesemiconductor, CMOS, detectors), and a GPS. Star trackers are not as usual, due to size, power
and performance constraints, although there are some cases we have found in our literature survey.
4.4. Electric Power System
The electric power system (EPS) is another critical subsystem, of which micro and nano satel-
lites have to take the maximum advantage of. The system needs to be autonomous and maintain the
power supply whatever the failure conditions [72]. An EPS provides electric power for all other
subsystems of the spacecraft, which influences its size. Not only nominal power requirements
are important, but so is peak power consumption, and the orbit of the satellite (for some types of
energy sources). Therefore, the EPS sizing limits the payloads carried by a spacecraft.
The basic system consist of a power source, a power storage unit, power distribution, and a
power management unit (including conversion, conditioning, and charge and discharge). Due to
degradation of the power source and storage, system dimensions must be made with end-of-life
figures. Nevertheless, low mass and cost is always the primary criteria for SmallSats.
For Earth orbiting satellites, solar arrays equipped with photovoltaic cells are the most common
power source. These are usually body-mounted, and/or in deployable rigid arrays, using multi
junction GaAs triple junction cells.
With a solar array for power source, which is dependent on solar irradiation to generate power,
the power storage unit takes special relevance. Furthermore, it will also support the bus when
peak power is required (higher than what the solar array can supply). The typical means to storage
energy is a battery. If the spacecraft is to survive more than a few weeks of mission life, batteries
with charge capabilities are needed, usually with Li-ion (Lithium-ion), NiCd (nickelcadmium),
and NiMH sources.
25
4.5. Thermal Systems
One problem that is sometimes not dealt with appropriately, is thermal control, which can make
a spacecraft inoperable. The thermal subsystem is responsible to ensure that all components are
kept within the temperature range needed for optimal operation, which in-turn determines its size.
A balance between heat loss and solar radiation received can be achieved passively, through
physical arrangement of equipment, thermal insulation (e.g. thermal blankets) and surface coatings
(e.g. paint). However, passive control may not be enough, and thus active techniques have to be
implemented. These include heaters and heat pipes. Radiators, which have surfaces with high
emissivity and low absorption, are also occasionally used actively or passively [73]. For micro
and nano satellites, passive solutions are usually preferred due to mass saving and small space
and size. In particular, heat sinks and optical tapes are common options for CubeSats [4]. Some
active control (e.g. using joule heating on the battery) has already been used. Nevertheless, when
photodiodes are present on a payload, active temperature control has to be employed (in most
cases), since they have stringent thermal requirements.
4.6. Command & Data Handling
Responsibility for distributing commands controlling other subsystems, handling sequenced or
programmed events, and accumulation, storage and housekeeping for payload data, rests on the
command and data handling system (C&DH). This subsystem is closely linked to the communi-
cation subsystem, to be discussed in section 4.7. In particular, data rates influences the system
parameters, together with data volume [6]. Other aspects to be addressed are performance, re-
liability, self-healing (i.e. the capacity to treat failures or anomalies), fault tolerance, the space
environment requirements (e.g. radiation and temperature), and power and size (which is directly
proportional to spacecraft complexity). Common units are a central processor, data buses, interface
and storage units.
Usually, micro and nano satellites have a single on-board processor which controls all aspects
of the spacecraft. Another trend is the increasing use of FPGA’s (field-programmable gate array
integrated circuits). Furthermore, to have high data processing capabilities, at the risk of less
durability due to space radiation, COTS micro controllers are being increasingly used on micro
and nano satellites, including commonly available ARM and PIC controllers.
26
4.7. Communication Systems
The communications subsystem assumes special relevance for micro and nano satellites, since
limitations of power and size will limit the spacecraft’s capability to transmit data. This subsystem
links the spacecraft to the ground or in some special cases to other spacecraft. This is a critical
system, since without communications a mission can be considered lost in practice, and hence,
redundancy and as much as possible near spherical (4π) coverage, must be implemented.
A receiver, a transmitter, and an antenna (which can be directional, hemispheric, or omnidirec-
tional) are the basic components of a communication system. Each of these elements is selected
and sized taking into account the desirable data rates, error rate allowance, communication path
length, and radio frequency. The transmitting power, coding and modulation are also important
factors. There are COTS components for each of these elements, with specific reliability character-
istics. The communication bandwidth needed for a SmallSat is related to the power the spacecraft
can generate, and correlated to the altitude at which the platform operates. Higher the altitude, less
friction with the atmosphere, resulting in lower orbit decay rate, but it comes with a higher power
requirement to communicate.
This survey of SmallSats confirms a trend found by other surveys, namely that 75% of CubeSats
use UHF (ultra-high frequency) communications, with rates reaching 9.6 kbps, and 10% VHF
(very high frequency), with similar data rates [4]. Only 15% have S-band systems, with maximum
rates of 256 kbps (although in our survey the NTS SmallSat has the maximum rate, 32 kbps). The
power required for communications can reach up to 1W, although it is usually smaller. These
small rates have a great impact on the science that can be performed.
For micro satellites S-band communications are the most common, and there are also cases of
C, X and Ku bands. Typical values for data rates are around 1Mbps, for S-band, but can reach
2.5Mbps with the X-band (RISESat), or even an impressive 30Mbps on the QSat-EOS spacecraft
(using the Ku-band). Nevertheless, most SmallSats keep to UHF, although as more power becomes
available, higher data rates can also be achieved; for instance the VesselSat has a UHF data rate of
512 kbps.
4.8. Regulating SmallSat Communications
With the growing interest of an increasing number of nations in developing their indigenous
space capacity, there is a growing concern in the space community about the lack of adherence
27
of CubeSat missions to international laws, regulations and procedures, as stated in the Prague
declaration on Small Satellite Regulation and Communication Systems [74].
Developers and members of the SmallSat community have been asked, by the United Nations
agency (the International Telecommunication Union, ITU), to re-evaluate current frequency notifi-
cation procedures for registering SmallSats. Most users however, consider this procedure complex
and unduly laborious, and not suitable for such low-cost missions. Consequently, the ITU has been
asked to examine the procedures for notifying space networks, and consider possible modifications
to enable SmallSat deployment and operation. Ideally, this should be done taking into account the
short development and mission time, and unique orbital characteristics of such platforms.
In March 2015, preliminary results of a study showed that there are no specific characteristics
that are relevant from a frequency management perspective [75]. Nevertheless, in April 2015, the
UN Office for Outer Space Affairs (OOSA) and the ITU has issued a best practice guide [76]. It
summaries the laws and regulations that are applicable for launching small satellites, and include
the following:
• Notification and recording of the radio frequencies used by a satellite at the ITU by its
national authority;
• Consideration of space debris citation measures in the design and operation of SmallSats (to
guarantee their re-entry in less than 25 years after the completion of the mission);
• After launch, registration of the spacecraft with the Secretary-General of the United Nations
by its national authority.
Furthermore, SmallSat missions are under the Liability Convention resolution 2777 (XXVI),
which establishes potential liabilities if a collision happens [77]. Consequently, a variety of coun-
tries are approving national space laws, including an obligatorily insurance to cover liabilities
derived by collisions during the platforms life.
Finally, in November 2015, the Provisional Final Acts of the World Radiocommunciation Con-
ference recommends that frequencies used for telemetry, tracking and command communications,
by satellites with missions lasting less than three years, should be preferably within the following
ranges: 150.05 – 174MHz and 400.15 – 420MHz [78].
28
5. Sensors for Oceanography
The use of remote sensing data has been an integral part of oceanography [79]. Typically, sea
surface temperature, ocean colour, winds, and sea-state have been the traditional foci of such data
collection. More recently, SAR has been become a significant asset to both scientific and security
related purposes. In oceanography, often remote sensing data allows for feeding synthetic ocean
models (e.g ROMS [80]), which in turn allows for predications, and can be used for sampling via
manned or robotic assets [81, 82].
Large spacecraft typically from NASA and the National Oceanographic and Atmospheric Ad-
ministration (NOAA) or ESA have been a continuous source of data over a substantial span of
time [83, 84]. More recent trends show that SmallSats are being preferred over large conventional
satellite missions [5]. Although this has not yet evolved to the use of micro or nano spacecrafts, we
believe that SmallSats will end up achieving more cost-effective ways to observe the global ocean.
In this section we describe the primary oceanographic features and the detectors that have been
used in remote sensing. The main source for this discussion are [4, 17, 79, 85, 86, 87, 88].
5.1. Ocean colour
The coastal upper water-column is often a region of high primary productivity especially due to
the presence of phytoplankton with chlorophyll [88]. Through measurement of ocean colour, one
can infer the concentrations of sediments, organic material and phytoplankton, whose quantities
and type influence colour. Anthropomorphic input primarily from sewage, fertiliser run off or
commercial dumping, provides a nutrient base for organisms in the coastal ocean. Therefore,
this influences productivity and in turn phytoplankton concentration, as determined by chlorophyll
density. Consequently, remote sensing provides a wide-scale view in a cogent manner.
Other ocean phenomena that can be observed using ocean colour as a proxy include mesoscale
eddies (circular currents on the ocean spanning 10 km to 500 km in diameter and that persist from
a few days to months), fronts (boundaries between distinct water masses), upwelling (when deep
cold water rises to the surface) and internal waves.
Ocean colour observations using spacecraft began in 1978 with the Coastal Zone Color Scan-
ner (NIMBUS-7) [88]. However, only in 1996 other missions were launched: the Japanese Ocean
Color and Temperature Sensor (ADEOS-1); and the German Modular Optical Scanner (on the
29

IRS-P3). In that same year, the International Ocean-Colour Coordinating Group was established
to support ocean colour technology and studies, backed by the Committee on Earth Observation
Satellites (CEOS) [89]. It has brought together data providers, space agencies, and users, namely
scientists and managers. Moreover, it sets the standards for calibration and validation of measure-
ments.
A typical ocean colour sensor samples with a high spectral resolution in several bands, includ-
ing ultraviolet, visible and near infrared. Two types of sensors exist: a multispectral radiometer,
which has a limited number of narrow wavelengths to capture the structure of the incoming light;
and an imaging spectrometer, which samples across the spectrum with a defined spectral resolu-
tion, generating substantially more data. The combination of different spectrum bands helps to
distinguish the colour origin, and overcome some atmospheric interference. Nevertheless, precise
measurements are difficult to perform due to shortcomings of the instruments (e.g. it demands a
cloud free observation), and accuracies are of about 50%.
Large spacecraft with mass well above the small satellite limit of 1000 kg have flown with
ocean colour sensors (e.g. EnviSat, Aqua, and COMS-1). There are only two examples of mini
satellites, both carrying radiometers, the OceanSat-2 of the Indian Space Research Organization
(ISRO), which has 970 kg [90], and the Chinese Haiyang-1B, with 443 kg [91]. Resolution, swath
and other instrument data of some ocean colour sensors are shown in Table 4. Nevertheless, it is
perfectly possible to include a ocean colour sensor in a CubeSat, and two examples are described
below.
As noted earlier, SeaHawk (of the SOCON constellation) and the ZACube-2, which are sched-
uled to be launched in 2016, will measure ocean colour using nano satellites. In particular, the
SOCON project (a 3U CubeSat) will fly the HawkEye Ocean Colour instrument. This is expected
to have a ground resolution of 75m per pixel (for a 540 km orbit), and a total of 4096× 10000
pixels (each image), for a ground swath of 300× 750 km [92]. Measuring eight bands (similar to
VIS and NIR of the SeaWiFS instrument), with eight linear CCDs, will generate a total of 4.6Gb,
to be aggregated to 655Mb that must be downlinked [92].
5.2. Ocean altimetry
Altimetry has been used to retrieve surface topography (including sea level and wave height),
ocean currents, and bathymetry (submarine topography). Additionally, it is one of the most reliable
30

Table 4: Ocean colour instruments
Sensor Figures of merita COCTS [91] OCM-2 [90] HawkEye [92]
(Satellite) (Past/Future) (HY-1B) (OceanSat-2) (SeaHawk)
Spatial Resolution [km] 1.5/0.7 1.1 0.36 0.15 - 0.075
Swath [km] 1328/1474 2800 1420 750
Wavelength [µm] 0.404 - 5.42 0.402 - 0.885 0.404 - 0.885 -
Mass [kg] 122/242 50 78 -
Power [W] 99/206 29.3 134 -
a Average figures of merit of decommissioned and future sensors [79, 86, 89].
ways to observe mesoscale eddies, detected by small displacements of the sea surface elevation,
and scaler wind speed. Thus, data acquired from altimeters have applications not only to oceanog-
raphy, but also to worldwide weather and climate patterns.
The most common instruments for altimetry are nadir pointing (looking vertically downward)
radar altimeters, sampling along the ground track. The instrument works by emitting short regular
pulses, and recording the travel time, magnitude and shape of the returned signal. From the travel
time one can get the range from the satellite to the sea surface, to which corrections due to the
atmosphere and ionospheric free electrons, sea state effects, and instrument calibrations need to be
considered. Combining this with other measurements, including precise gravity fields (from the
model created by GRACE [93]), and orbit position using other instruments, the range is converted
into the height of the sea surface relative to the reference ellipsoid. Sea surface roughness, for
length scales of the radar wavelength (that is from a few millimetres to centimetres), and sea
surface height variability, on the instrument footprint, can also be retrieved. These yield estimates
for wave height and wind speed.
Accuracies of 1 cm can be achieved, with measurement precisions of 6×10⁻¹¹ s, but most often
are in the 2 cm to 3 cm range. However, the obtained accuracies are only for open ocean, since
coastal waters induce other effects [94]. Altimeter constellations are deemed important, since they
bring an increase in temporal resolution, and some ocean phenomenon can only be perceived if
subject to an almost continuous observation. At the same time, a higher revisit time represents an
31
increase in spatial coverage and a finer spatial sampling grid, for a single altimetry sensor. Equally,
sun synchronous orbits should be avoided, because of the errors associated with solar tidal effects.
The most successful missions are compact satellites (with low drag resistance), which are
equipped with supporting sensors, to measure the necessary corrections and determine orbital posi-
tion. These supporting sensors consist of: a radiometer – for atmospheric corrections; the Doppler
Orbitography and Radiopositioning Integrated by Satellite (DORIS) – a precise orbit determination
instrument using ground beacons spread over the world; and a Laser Retroreflector Array – which
provides a reference target for satellite laser ranging measurements. Although DORIS has been
widely used, many spacecraft are replacing it by a Global Navigation Satellite Systems (GNSS)
instrument (or adding to DORIS a GNSS sensor). Another measure that may be important is the
inertial position.
Past missions equipped with altimeters oscillated between large spacecraft with more than
2000 kg mass (SeaSat, ERS-1, and ERS-2), and mini satellites with mass around 500 kg (GEOS-
3 and GEOSAT) [86]. Examples of recent altimetry missions, and which use dual frequency (C
and Ku-band) with increased accuracy, are: TOPEX/Poseidon – with 2388 kg and active between
1992 and 2005; Jason-1 – active from 2001 to 2013, with a mass of 500 kg [95]; and finally
EnviSat – one of the heaviest so far, with a mass of 8140 kg, that was operational between 2003
and 2012, and was equipped with several instruments [96]. Currently, three mini satellites are
dedicated to altimetry, namely SARAL (with Ka-band for which ionospheric delay corrections are
substantially reduced) [97], Jason-2 (C and Ku-bands) [98], and CryoSat-2 (Ku-band with two
antennas) [99].
Typically, an altimetry mission requires a payload mass of about 100 kg, a power consumption
of 150W, and one antenna with 1.1m in diameter (averaging the values of the three currently
flying mini satellite missions). Features from past, current and future altimeter instruments are
presented in Table 5.
From the figures presented above, it appears to be challenging for altimetry to be performed
with a SmallSat platform (nano satellites are obviously out of the question), if the same accuracy
is required. Nevertheless, there has been some effort to miniaturise Ka-band radar altimeters. A
study of a constellation of twelve small satellites (with an expected mass of less than 150 kg),
GENDER, was made in 1999, but the objective was only to obtain significant wave height and
32
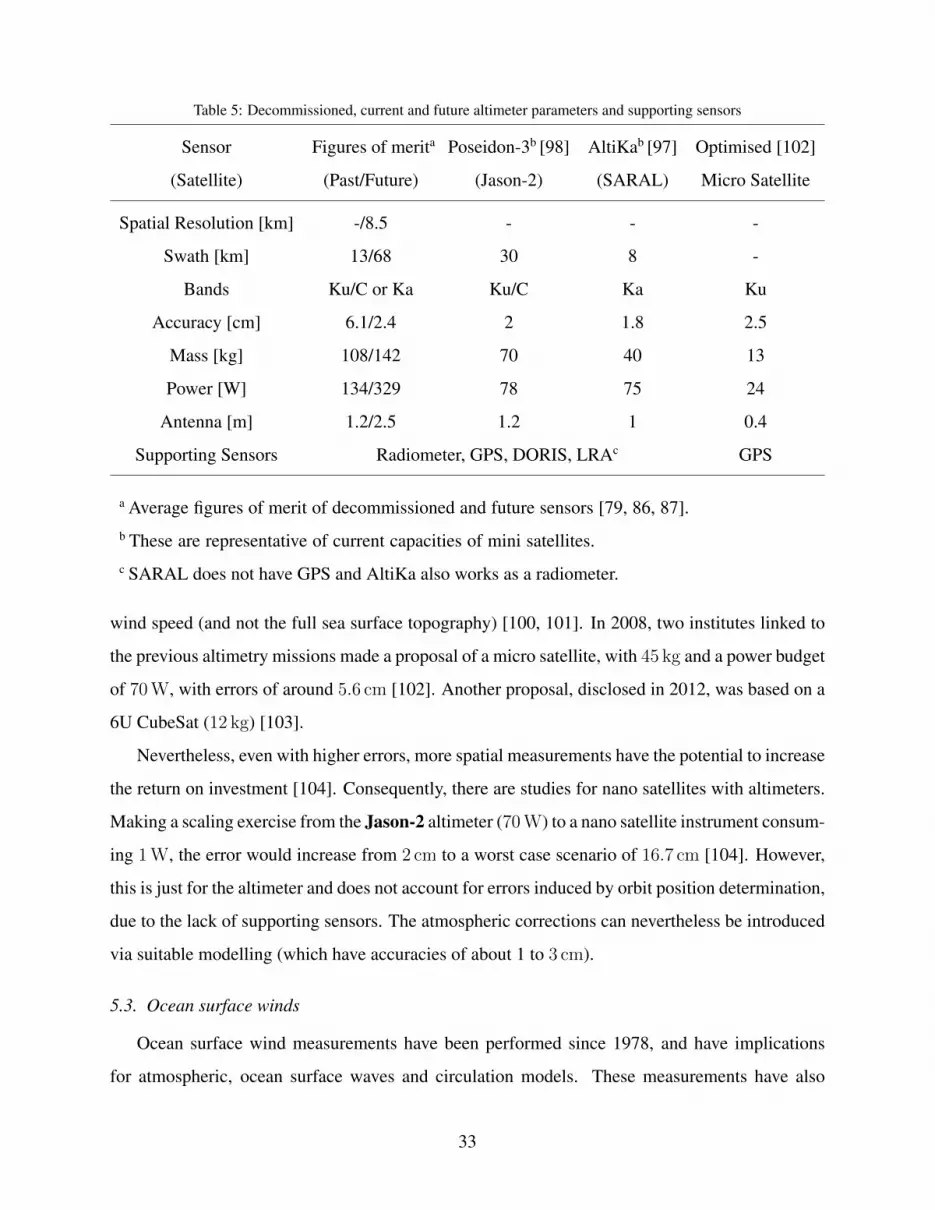
Table 5: Decommissioned, current and future altimeter parameters and supporting sensors
Sensor Figures of merita Poseidon-3b [98] AltiKab [97] Optimised [102]
(Satellite) (Past/Future) (Jason-2) (SARAL) Micro Satellite
Spatial Resolution [km] -/8.5 - - -
Swath [km] 13/68 30 8 -
Bands Ku/C or Ka Ku/C Ka Ku
Accuracy [cm] 6.1/2.4 2 1.8 2.5
Mass [kg] 108/142 70 40 13
Power [W] 134/329 78 75 24
Antenna [m] 1.2/2.5 1.2 1 0.4
Supporting Sensors Radiometer, GPS, DORIS, LRAc GPS
a Average figures of merit of decommissioned and future sensors [79, 86, 87].b These are representative of current capacities of mini satellites.c SARAL does not have GPS and AltiKa also works as a radiometer.
wind speed (and not the full sea surface topography) [100, 101]. In 2008, two institutes linked to
the previous altimetry missions made a proposal of a micro satellite, with 45 kg and a power budget
of 70W, with errors of around 5.6 cm [102]. Another proposal, disclosed in 2012, was based on a
6U CubeSat (12 kg) [103].
Nevertheless, even with higher errors, more spatial measurements have the potential to increase
the return on investment [104]. Consequently, there are studies for nano satellites with altimeters.
Making a scaling exercise from the Jason-2 altimeter (70W) to a nano satellite instrument consum-
ing 1W, the error would increase from 2 cm to a worst case scenario of 16.7 cm [104]. However,
this is just for the altimeter and does not account for errors induced by orbit position determination,
due to the lack of supporting sensors. The atmospheric corrections can nevertheless be introduced
via suitable modelling (which have accuracies of about 1 to 3 cm).
5.3. Ocean surface winds
Ocean surface wind measurements have been performed since 1978, and have implications
for atmospheric, ocean surface waves and circulation models. These measurements have also
33
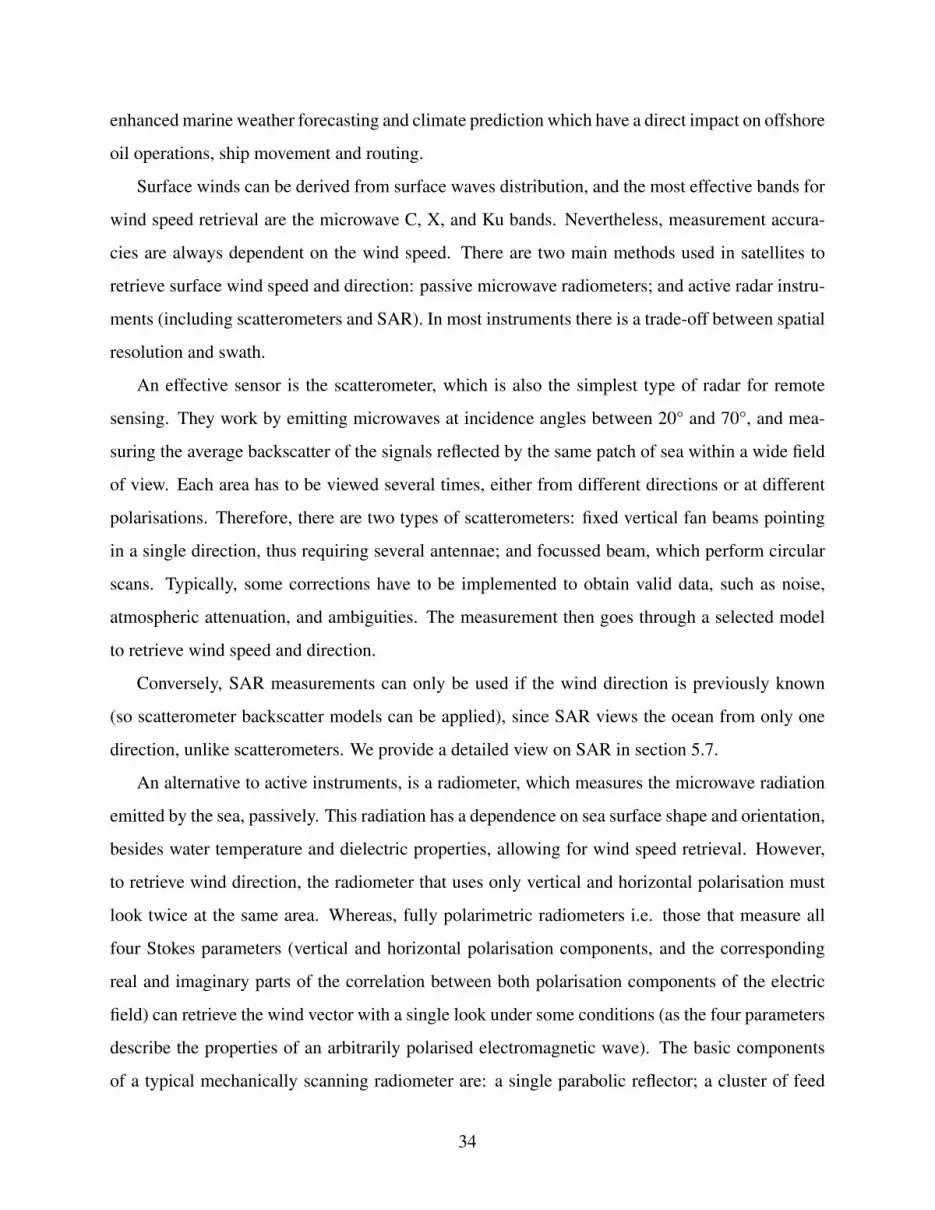
enhanced marine weather forecasting and climate prediction which have a direct impact on offshore
oil operations, ship movement and routing.
Surface winds can be derived from surface waves distribution, and the most effective bands for
wind speed retrieval are the microwave C, X, and Ku bands. Nevertheless, measurement accura-
cies are always dependent on the wind speed. There are two main methods used in satellites to
retrieve surface wind speed and direction: passive microwave radiometers; and active radar instru-
ments (including scatterometers and SAR). In most instruments there is a trade-off between spatial
resolution and swath.
An effective sensor is the scatterometer, which is also the simplest type of radar for remote
sensing. They work by emitting microwaves at incidence angles between 20° and 70°, and mea-
suring the average backscatter of the signals reflected by the same patch of sea within a wide field
of view. Each area has to be viewed several times, either from different directions or at different
polarisations. Therefore, there are two types of scatterometers: fixed vertical fan beams pointing
in a single direction, thus requiring several antennae; and focussed beam, which perform circular
scans. Typically, some corrections have to be implemented to obtain valid data, such as noise,
atmospheric attenuation, and ambiguities. The measurement then goes through a selected model
to retrieve wind speed and direction.
Conversely, SAR measurements can only be used if the wind direction is previously known
(so scatterometer backscatter models can be applied), since SAR views the ocean from only one
direction, unlike scatterometers. We provide a detailed view on SAR in section 5.7.
An alternative to active instruments, is a radiometer, which measures the microwave radiation
emitted by the sea, passively. This radiation has a dependence on sea surface shape and orientation,
besides water temperature and dielectric properties, allowing for wind speed retrieval. However,
to retrieve wind direction, the radiometer that uses only vertical and horizontal polarisation must
look twice at the same area. Whereas, fully polarimetric radiometers i.e. those that measure all
four Stokes parameters (vertical and horizontal polarisation components, and the corresponding
real and imaginary parts of the correlation between both polarisation components of the electric
field) can retrieve the wind vector with a single look under some conditions (as the four parameters
describe the properties of an arbitrarily polarised electromagnetic wave). The basic components
of a typical mechanically scanning radiometer are: a single parabolic reflector; a cluster of feed
34
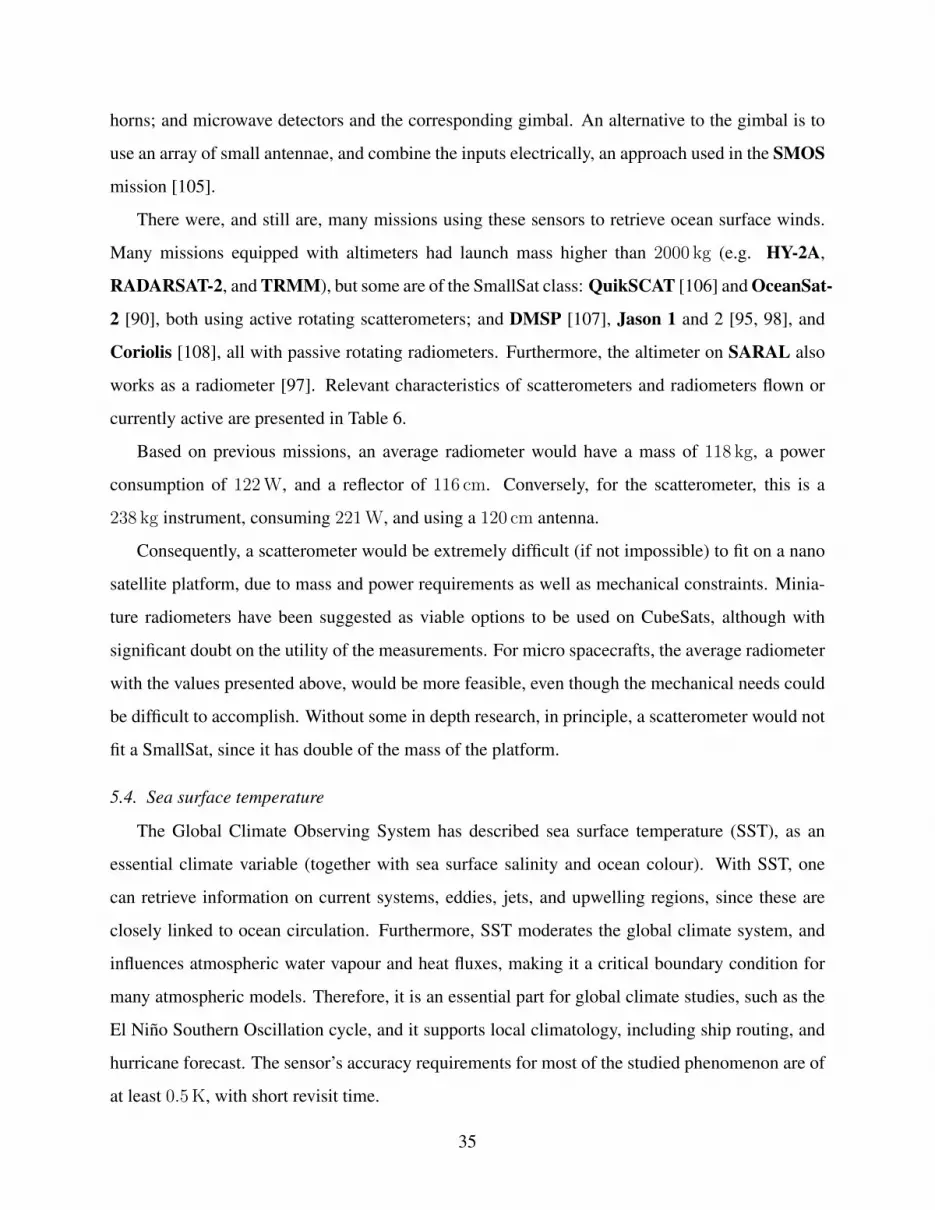
horns; and microwave detectors and the corresponding gimbal. An alternative to the gimbal is to
use an array of small antennae, and combine the inputs electrically, an approach used in the SMOS
mission [105].
There were, and still are, many missions using these sensors to retrieve ocean surface winds.
Many missions equipped with altimeters had launch mass higher than 2000 kg (e.g. HY-2A,
RADARSAT-2, and TRMM), but some are of the SmallSat class: QuikSCAT [106] and OceanSat-
2 [90], both using active rotating scatterometers; and DMSP [107], Jason 1 and 2 [95, 98], and
Coriolis [108], all with passive rotating radiometers. Furthermore, the altimeter on SARAL also
works as a radiometer [97]. Relevant characteristics of scatterometers and radiometers flown or
currently active are presented in Table 6.
Based on previous missions, an average radiometer would have a mass of 118 kg, a power
consumption of 122W, and a reflector of 116 cm. Conversely, for the scatterometer, this is a
238 kg instrument, consuming 221W, and using a 120 cm antenna.
Consequently, a scatterometer would be extremely difficult (if not impossible) to fit on a nano
satellite platform, due to mass and power requirements as well as mechanical constraints. Minia-
ture radiometers have been suggested as viable options to be used on CubeSats, although with
significant doubt on the utility of the measurements. For micro spacecrafts, the average radiometer
with the values presented above, would be more feasible, even though the mechanical needs could
be difficult to accomplish. Without some in depth research, in principle, a scatterometer would not
fit a SmallSat, since it has double of the mass of the platform.
5.4. Sea surface temperature
The Global Climate Observing System has described sea surface temperature (SST), as an
essential climate variable (together with sea surface salinity and ocean colour). With SST, one
can retrieve information on current systems, eddies, jets, and upwelling regions, since these are
closely linked to ocean circulation. Furthermore, SST moderates the global climate system, and
influences atmospheric water vapour and heat fluxes, making it a critical boundary condition for
many atmospheric models. Therefore, it is an essential part for global climate studies, such as the
El Nino Southern Oscillation cycle, and it supports local climatology, including ship routing, and
hurricane forecast. The sensor’s accuracy requirements for most of the studied phenomenon are of
at least 0.5K, with short revisit time.
35

Table 6: Decommissioned and active instruments to measure ocean surface winds
Sensor Figures of merita SeaWindsb [106] WindSatc [108]
(Satellite) (Past) (QuikScat) (Coriolis)
Spatial Resolution [km] 50 50 25
Swath [km] 1000 1800 1000
Wind Accuracy (Wind speed) [m/s] 2 (4 – 20) 2 (3 – 20) 2 (3 – 25)
Wind Direction Accuracy [deg] 20 20 20
Bands Ku/C Ku C/X/K/Ka
Frequency [GHz] 13.9/5.3 13.4 6.8/10.7/18.7/23.8/37
Mass [kg] 230 205 341
Power [W] 197 250 350
Antenna [m] 1.7 1 1.8
a Average figures of merit of decommissioned sensors [79, 86, 88].b The only currently active scatterometer in a mini satellite.c An example of a currently active fully polarimetric radiometer in a mini satellite.
Typical satellite sensors for SST are closely related to those used in ocean colour, such as in-
frared systems, and for surface wind retrieval, such as passive microwave systems. While infrared
payloads need a cloud free for observation, microwave instruments using appropriate channels can
perform measurements through no rain induced cloud cover, with necessary atmospheric correc-
tions. However, the microwave data cannot be used within 75 km of land, due to a reduction of
signal to noise ratio (the noise coming from ground communications systems). The infrared sensor
usually requires a black body of known temperature for on-board calibration. Although temper-
ature difference requirements are possible with current instruments, to achieve the needed revisit
time (i.e. to have more readings of the temperature of a specific place), satellite data and data
collected in situ (e.g. with buoys, AUVs and ships) is usually combined.
Typically, many of the spacecraft performing these measurements have mass over the 1000 kg
limit of SmallSats (e.g. EnviSat and Terra). Within this limit there are only two mini satellites:
Meteosat-7 (with 696 kg) [109] and EO-1 (572 kg) [110]. The first, has a high resolution 3-band
(thermal infrared, water vapour absorption and visible range bands) passive radiometer, spinning
36
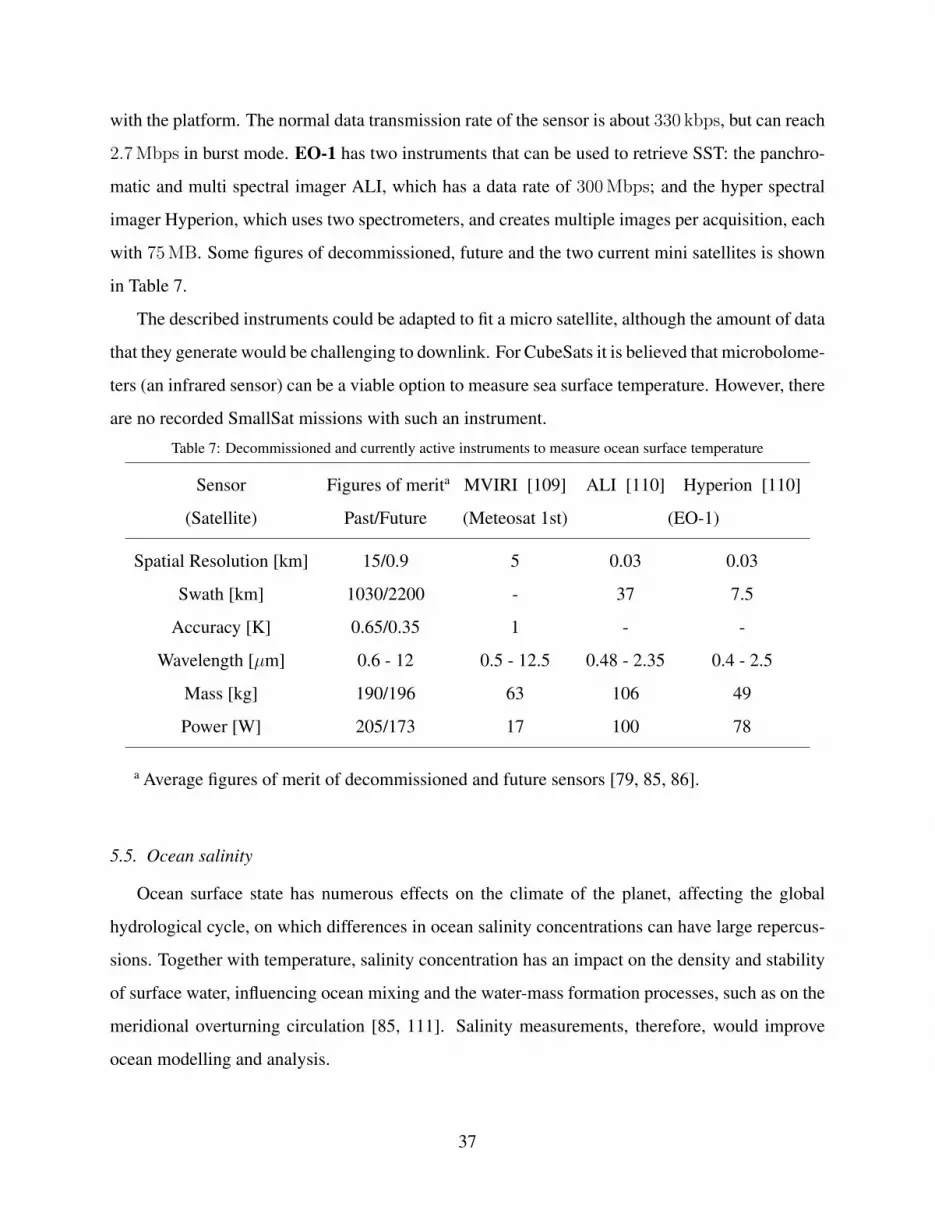
with the platform. The normal data transmission rate of the sensor is about 330 kbps, but can reach
2.7Mbps in burst mode. EO-1 has two instruments that can be used to retrieve SST: the panchro-
matic and multi spectral imager ALI, which has a data rate of 300Mbps; and the hyper spectral
imager Hyperion, which uses two spectrometers, and creates multiple images per acquisition, each
with 75MB. Some figures of decommissioned, future and the two current mini satellites is shown
in Table 7.
The described instruments could be adapted to fit a micro satellite, although the amount of data
that they generate would be challenging to downlink. For CubeSats it is believed that microbolome-
ters (an infrared sensor) can be a viable option to measure sea surface temperature. However, there
are no recorded SmallSat missions with such an instrument.
Table 7: Decommissioned and currently active instruments to measure ocean surface temperature
Sensor Figures of merita MVIRI [109] ALI [110] Hyperion [110]
(Satellite) Past/Future (Meteosat 1st) (EO-1)
Spatial Resolution [km] 15/0.9 5 0.03 0.03
Swath [km] 1030/2200 - 37 7.5
Accuracy [K] 0.65/0.35 1 - -
Wavelength [µm] 0.6 - 12 0.5 - 12.5 0.48 - 2.35 0.4 - 2.5
Mass [kg] 190/196 63 106 49
Power [W] 205/173 17 100 78
a Average figures of merit of decommissioned and future sensors [79, 85, 86].
5.5. Ocean salinity
Ocean surface state has numerous effects on the climate of the planet, affecting the global
hydrological cycle, on which differences in ocean salinity concentrations can have large repercus-
sions. Together with temperature, salinity concentration has an impact on the density and stability
of surface water, influencing ocean mixing and the water-mass formation processes, such as on the
meridional overturning circulation [85, 111]. Salinity measurements, therefore, would improve
ocean modelling and analysis.
37

Passive microwave radiometers are used to obtain readings for the surface salinity from satel-
lites. The most suitable frequency for this is 1.41GHz, in the L-band. To acquire valid and relevant
information, salinity should be determined with at least 0.2 psu5. Phenomena that require correc-
tions include: sea surface roughness; ionospheric effects (inducing Faraday rotation); and heavy
rain. Salinity can also be determined using brightness temperature (or radiance of microwave
radiation) measurements, if the sea surface temperature is known. To accomplish that, the bright-
ness temperature measurements accuracy must be about 0.1K [88]. Typically, moored buoys also
perform salinity measurements, and can be used to ground-truth satellite data.
Currently, two missions perform these measurements, the SMOS (a 670 kg spacecraft) [105],
and the SAC-D/Aquarius Mission. SMOS is a SmallSat with only one payload, the Microwave
Imaging Radiometer using Aperture Synthesis, which weighs 369 kg and has a power consumption
of 375W. This is a synthetic aperture radiometer, with 69 antenna/receiver modules distributed in
a deployable three arm (each with a length of 8m) structure, creating a sparsely populated antenna.
The signals of each receiver is electronically combined, forming a two dimensional interferometer
microwave image.
Currently, there are no radiometers that would fit on a nano satellite platform, and studies
conducted raise doubts on the validity of measurements performed by a small instrument. Further
research might allow for fitting a radiometer in a micro satellite. Finally, as stated above, there
is a correlation between brightness temperature measurements and salinity, which could lead to
microbolometers (that fit on micro or nano satellites) for measuring salinity. However, due to the
low spectral resolution, this has still to be demonstrated.
5.6. GNSS Reflectometry
As shown in the previous sections, most instruments used for oceanography have characteris-
tics that makes them difficult to implement on micro and nano satellites. Additionally, many in-
struments suffer from limitations due to the frequency band in which they operate, which is often
blocked by clouds and heavy rainfall conditions. However, a promising method to perform some
of these measurements has been proposed, namely the use of Global Navigation Satellite Systems
5Seawater of 35 psu (precision salinity units), has a conductivity ratio of unity at 15 degrees Centigrade at 1
atmosphere, for 32.4356 grams of KCl (potassium chloride) per kilogram of solution.
38
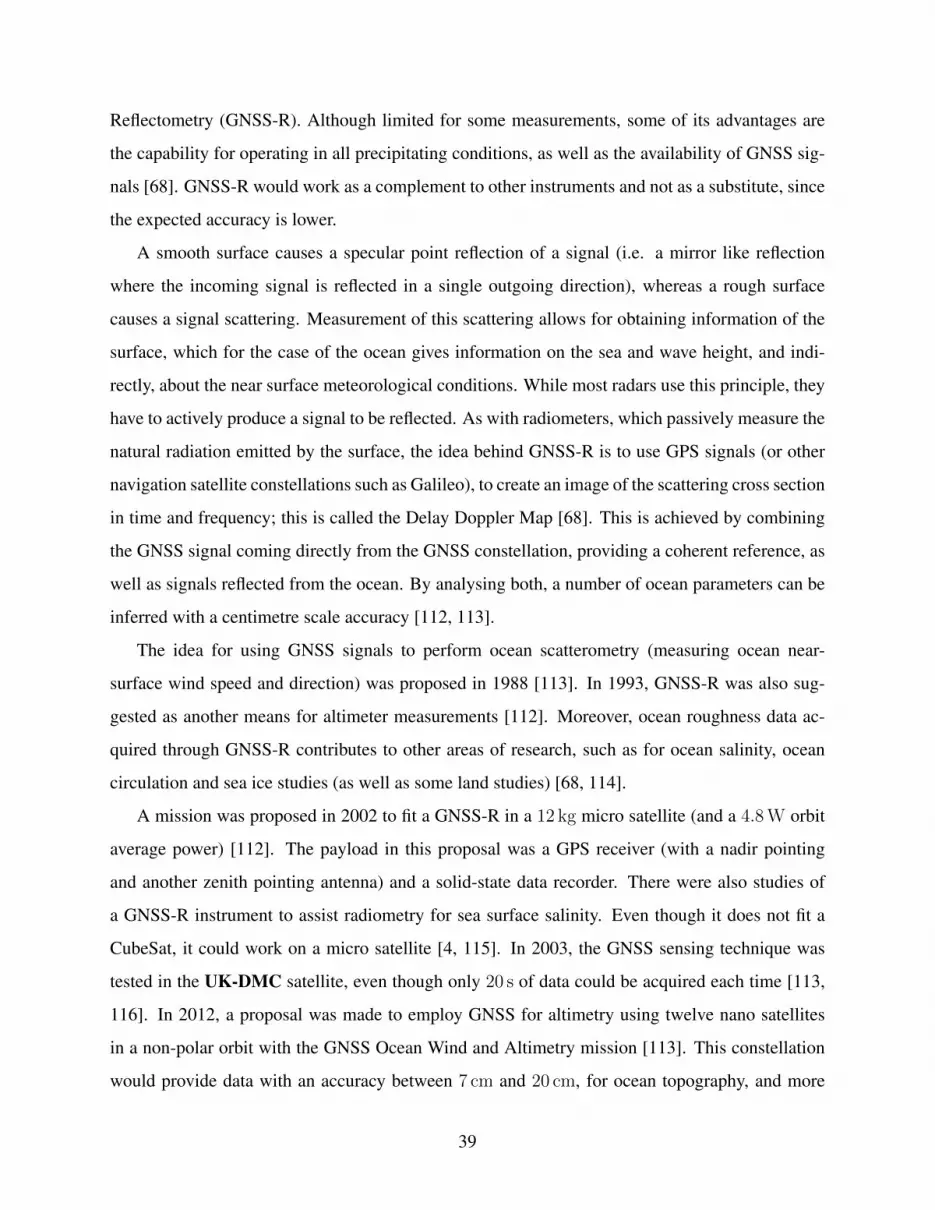
Reflectometry (GNSS-R). Although limited for some measurements, some of its advantages are
the capability for operating in all precipitating conditions, as well as the availability of GNSS sig-
nals [68]. GNSS-R would work as a complement to other instruments and not as a substitute, since
the expected accuracy is lower.
A smooth surface causes a specular point reflection of a signal (i.e. a mirror like reflection
where the incoming signal is reflected in a single outgoing direction), whereas a rough surface
causes a signal scattering. Measurement of this scattering allows for obtaining information of the
surface, which for the case of the ocean gives information on the sea and wave height, and indi-
rectly, about the near surface meteorological conditions. While most radars use this principle, they
have to actively produce a signal to be reflected. As with radiometers, which passively measure the
natural radiation emitted by the surface, the idea behind GNSS-R is to use GPS signals (or other
navigation satellite constellations such as Galileo), to create an image of the scattering cross section
in time and frequency; this is called the Delay Doppler Map [68]. This is achieved by combining
the GNSS signal coming directly from the GNSS constellation, providing a coherent reference, as
well as signals reflected from the ocean. By analysing both, a number of ocean parameters can be
inferred with a centimetre scale accuracy [112, 113].
The idea for using GNSS signals to perform ocean scatterometry (measuring ocean near-
surface wind speed and direction) was proposed in 1988 [113]. In 1993, GNSS-R was also sug-
gested as another means for altimeter measurements [112]. Moreover, ocean roughness data ac-
quired through GNSS-R contributes to other areas of research, such as for ocean salinity, ocean
circulation and sea ice studies (as well as some land studies) [68, 114].
A mission was proposed in 2002 to fit a GNSS-R in a 12 kg micro satellite (and a 4.8W orbit
average power) [112]. The payload in this proposal was a GPS receiver (with a nadir pointing
and another zenith pointing antenna) and a solid-state data recorder. There were also studies of
a GNSS-R instrument to assist radiometry for sea surface salinity. Even though it does not fit a
CubeSat, it could work on a micro satellite [4, 115]. In 2003, the GNSS sensing technique was
tested in the UK-DMC satellite, even though only 20 s of data could be acquired each time [113,
116]. In 2012, a proposal was made to employ GNSS for altimetry using twelve nano satellites
in a non-polar orbit with the GNSS Ocean Wind and Altimetry mission [113]. This constellation
would provide data with an accuracy between 7 cm and 20 cm, for ocean topography, and more
39
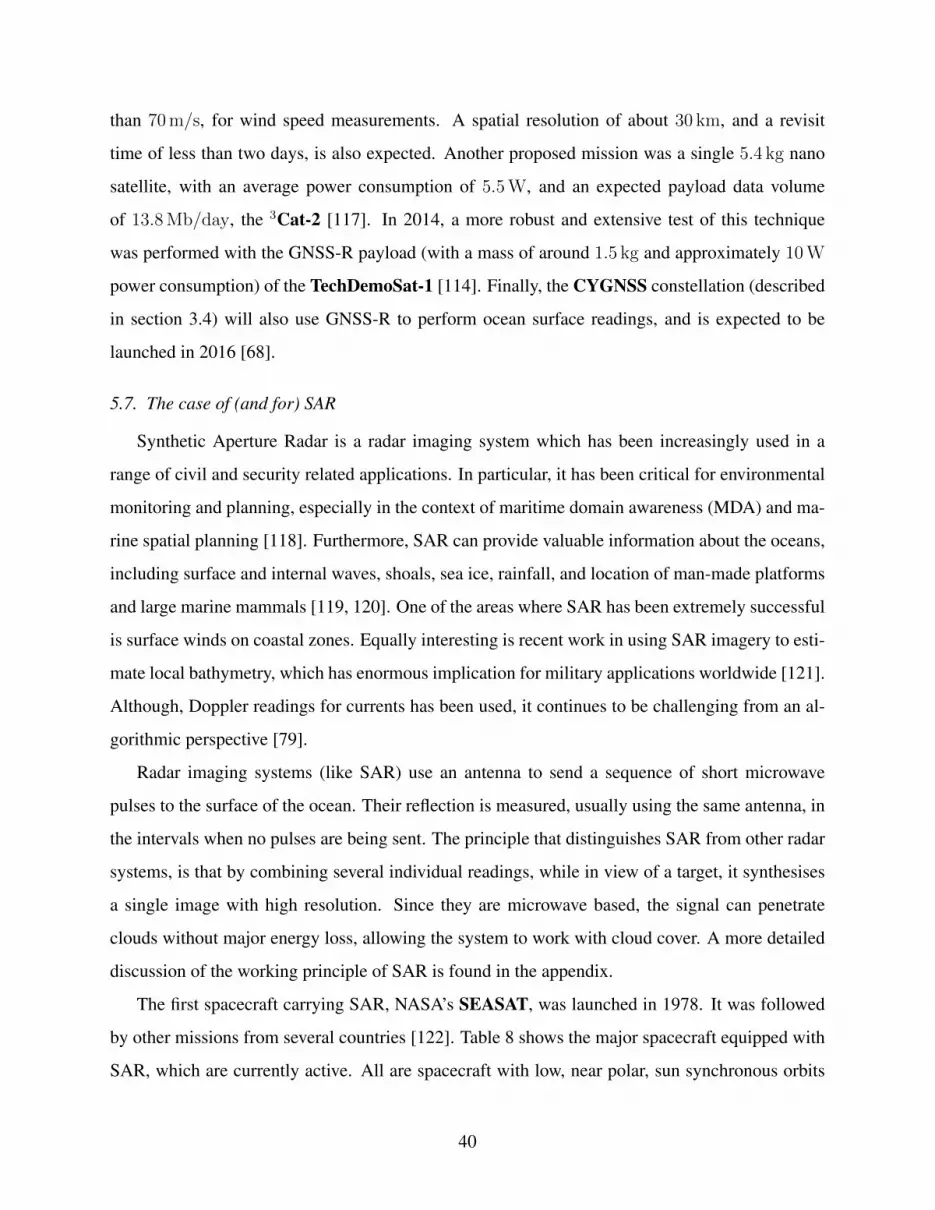
than 70m/s, for wind speed measurements. A spatial resolution of about 30 km, and a revisit
time of less than two days, is also expected. Another proposed mission was a single 5.4 kg nano
satellite, with an average power consumption of 5.5W, and an expected payload data volume
of 13.8Mb/day, the 3Cat-2 [117]. In 2014, a more robust and extensive test of this technique
was performed with the GNSS-R payload (with a mass of around 1.5 kg and approximately 10W
power consumption) of the TechDemoSat-1 [114]. Finally, the CYGNSS constellation (described
in section 3.4) will also use GNSS-R to perform ocean surface readings, and is expected to be
launched in 2016 [68].
5.7. The case of (and for) SAR
Synthetic Aperture Radar is a radar imaging system which has been increasingly used in a
range of civil and security related applications. In particular, it has been critical for environmental
monitoring and planning, especially in the context of maritime domain awareness (MDA) and ma-
rine spatial planning [118]. Furthermore, SAR can provide valuable information about the oceans,
including surface and internal waves, shoals, sea ice, rainfall, and location of man-made platforms
and large marine mammals [119, 120]. One of the areas where SAR has been extremely successful
is surface winds on coastal zones. Equally interesting is recent work in using SAR imagery to esti-
mate local bathymetry, which has enormous implication for military applications worldwide [121].
Although, Doppler readings for currents has been used, it continues to be challenging from an al-
gorithmic perspective [79].
Radar imaging systems (like SAR) use an antenna to send a sequence of short microwave
pulses to the surface of the ocean. Their reflection is measured, usually using the same antenna, in
the intervals when no pulses are being sent. The principle that distinguishes SAR from other radar
systems, is that by combining several individual readings, while in view of a target, it synthesises
a single image with high resolution. Since they are microwave based, the signal can penetrate
clouds without major energy loss, allowing the system to work with cloud cover. A more detailed
discussion of the working principle of SAR is found in the appendix.
The first spacecraft carrying SAR, NASA’s SEASAT, was launched in 1978. It was followed
by other missions from several countries [122]. Table 8 shows the major spacecraft equipped with
SAR, which are currently active. All are spacecraft with low, near polar, sun synchronous orbits
40

with a period of about 100 minutes. The SAR instrument is usually turned on for approximately
10 minutes in each orbit due to its high energy demand.
Currently it is challenging to fulfil the user needs of SAR. That has led ESA to focus the use
of their Sentinel-1 spacecraft to view some regions of the globe they believe are of interest, since
there is considerable lack of global coverage. Other SAR-based spacecraft still try to be open to
scientist’s requests for specific area observations. TerraSAR-X, for instance, makes some of the
images available to the public. RADARSAT 2 has better accuracy and resolution, but its images
are less freely accessible.
Table 8: Earth observing spacecraft with SAR payloads.
Satellite RADARSAT 2 TSX/TDX COSMO-SkyMed KOMPSAT-5 Sentinel 1
[123] [124] [125] [126] [127]
Launch date 2007 2007 2007 2013 2014
Sat. Mass [kg]a 2200 1230/1340 1700 1400 2300
Sat. Altitude [km]a 798 514 620 550 693
SAR Mass [kg]a 750 394 - 520 945
Peak Power [W]a 1650 2260 - 1700 4075
Swath [km] 20 – 500 30 – 260 30 – 200 30 – 100 80 – 400
Resolution [m] 3 – 100 1.7 – 10 1 – 100 1 – 20 5 – 40
System Band C X X X C
a Figures from [86].
5.8. The case for SmallSat SAR
The use of SAR in SmallSats poses some significant challenges. The spacecraft in Table 8
have masses ranging from about 1200 kg to 2300 kg. The SAR antennas used until recently have
a length of 12 meters, although more recent instruments use shorter antennas of around 5 meters.
Israel’s military satellite TecSAR uses a smaller deployable antenna, however, with an umbrella
shape, with a mass of less than 0.5 kg [128]. Another challenge is how to generate the power
needed to obtain a reasonable signal-to-noise ratio.
41
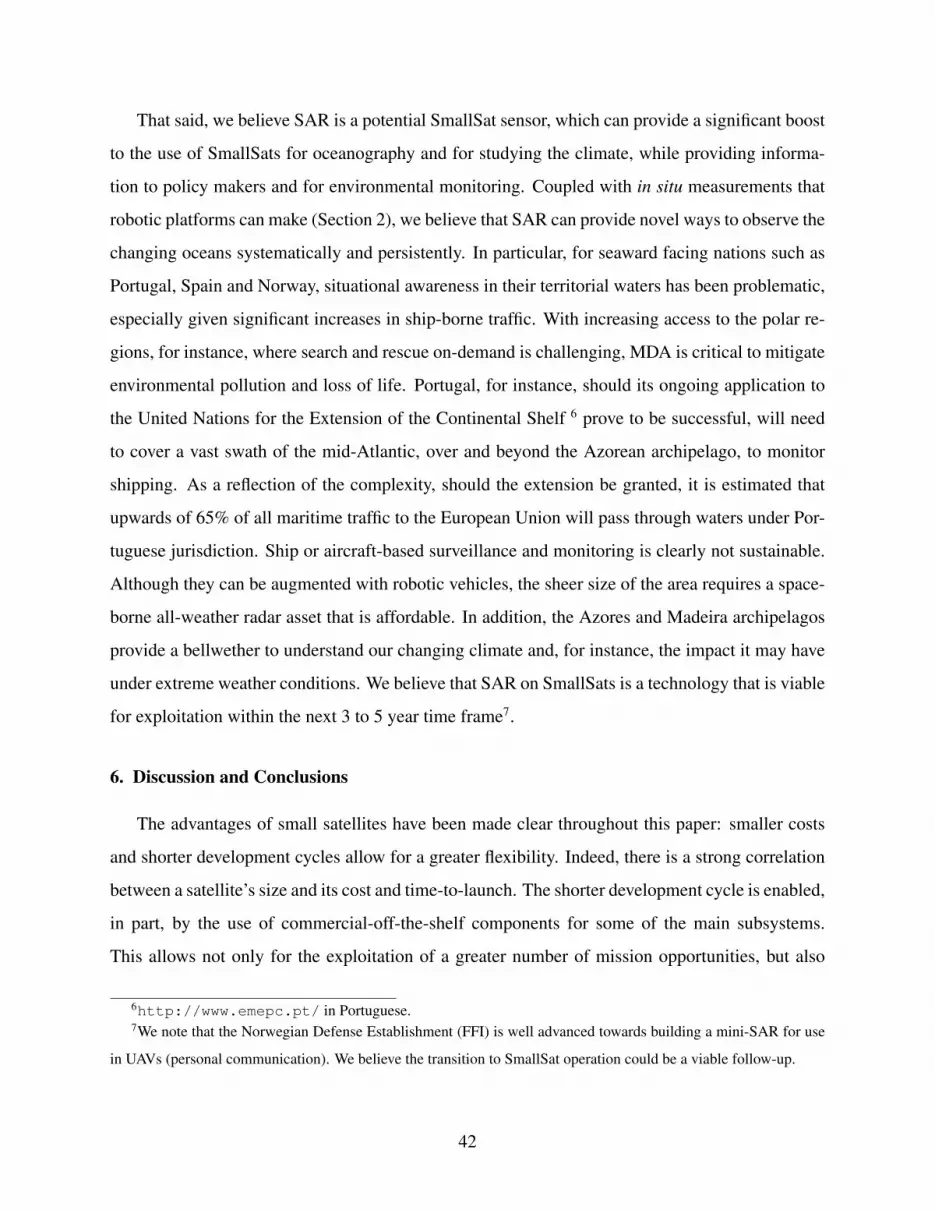
That said, we believe SAR is a potential SmallSat sensor, which can provide a significant boost
to the use of SmallSats for oceanography and for studying the climate, while providing informa-
tion to policy makers and for environmental monitoring. Coupled with in situ measurements that
robotic platforms can make (Section 2), we believe that SAR can provide novel ways to observe the
changing oceans systematically and persistently. In particular, for seaward facing nations such as
Portugal, Spain and Norway, situational awareness in their territorial waters has been problematic,
especially given significant increases in ship-borne traffic. With increasing access to the polar re-
gions, for instance, where search and rescue on-demand is challenging, MDA is critical to mitigate
environmental pollution and loss of life. Portugal, for instance, should its ongoing application to
the United Nations for the Extension of the Continental Shelf 6 prove to be successful, will need
to cover a vast swath of the mid-Atlantic, over and beyond the Azorean archipelago, to monitor
shipping. As a reflection of the complexity, should the extension be granted, it is estimated that
upwards of 65% of all maritime traffic to the European Union will pass through waters under Por-
tuguese jurisdiction. Ship or aircraft-based surveillance and monitoring is clearly not sustainable.
Although they can be augmented with robotic vehicles, the sheer size of the area requires a space-
borne all-weather radar asset that is affordable. In addition, the Azores and Madeira archipelagos
provide a bellwether to understand our changing climate and, for instance, the impact it may have
under extreme weather conditions. We believe that SAR on SmallSats is a technology that is viable
for exploitation within the next 3 to 5 year time frame7.
6. Discussion and Conclusions
The advantages of small satellites have been made clear throughout this paper: smaller costs
and shorter development cycles allow for a greater flexibility. Indeed, there is a strong correlation
between a satellite’s size and its cost and time-to-launch. The shorter development cycle is enabled,
in part, by the use of commercial-off-the-shelf components for some of the main subsystems.
This allows not only for the exploitation of a greater number of mission opportunities, but also
6http://www.emepc.pt/ in Portuguese.7We note that the Norwegian Defense Establishment (FFI) is well advanced towards building a mini-SAR for use
in UAVs (personal communication). We believe the transition to SmallSat operation could be a viable follow-up.
42
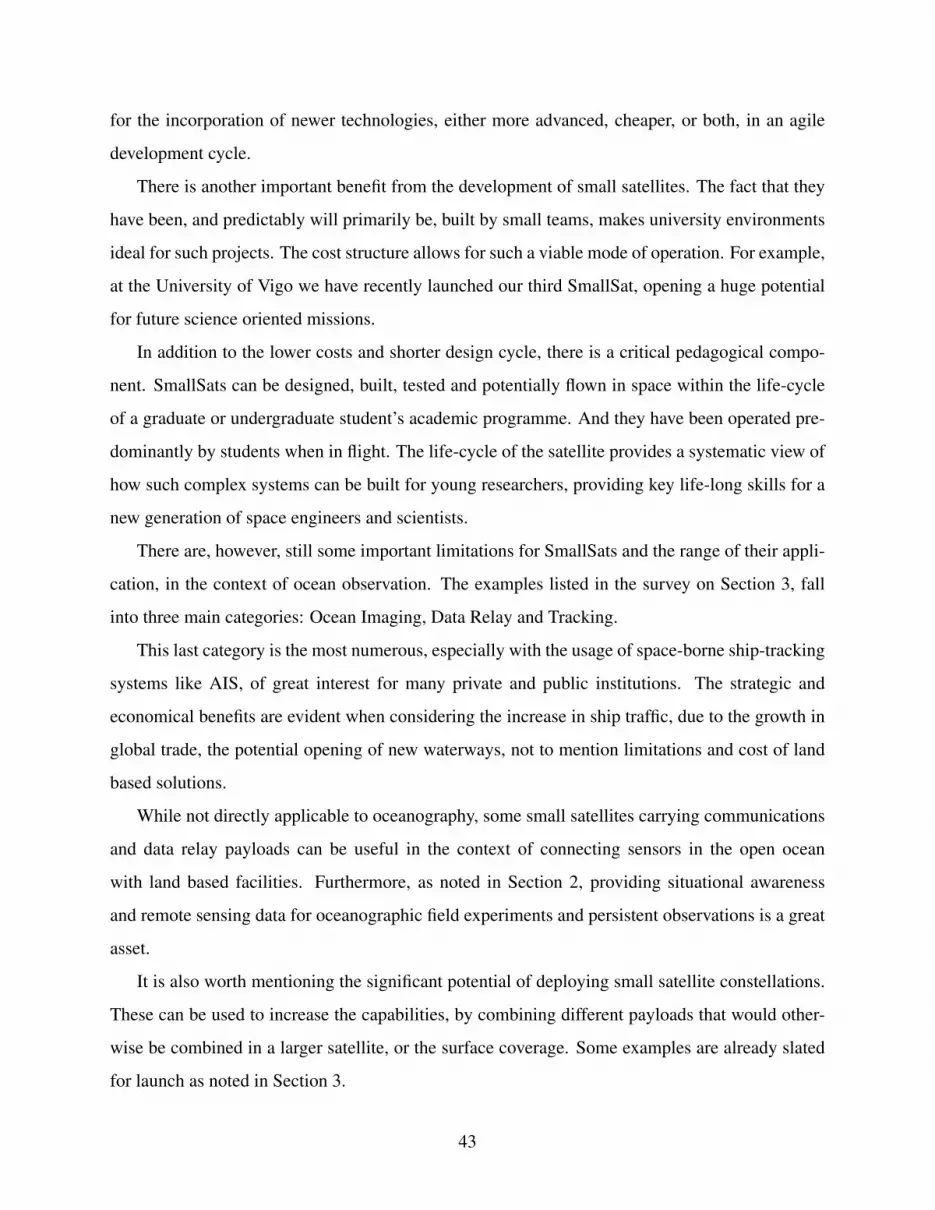
for the incorporation of newer technologies, either more advanced, cheaper, or both, in an agile
development cycle.
There is another important benefit from the development of small satellites. The fact that they
have been, and predictably will primarily be, built by small teams, makes university environments
ideal for such projects. The cost structure allows for such a viable mode of operation. For example,
at the University of Vigo we have recently launched our third SmallSat, opening a huge potential
for future science oriented missions.
In addition to the lower costs and shorter design cycle, there is a critical pedagogical compo-
nent. SmallSats can be designed, built, tested and potentially flown in space within the life-cycle
of a graduate or undergraduate student’s academic programme. And they have been operated pre-
dominantly by students when in flight. The life-cycle of the satellite provides a systematic view of
how such complex systems can be built for young researchers, providing key life-long skills for a
new generation of space engineers and scientists.
There are, however, still some important limitations for SmallSats and the range of their appli-
cation, in the context of ocean observation. The examples listed in the survey on Section 3, fall
into three main categories: Ocean Imaging, Data Relay and Tracking.
This last category is the most numerous, especially with the usage of space-borne ship-tracking
systems like AIS, of great interest for many private and public institutions. The strategic and
economical benefits are evident when considering the increase in ship traffic, due to the growth in
global trade, the potential opening of new waterways, not to mention limitations and cost of land
based solutions.
While not directly applicable to oceanography, some small satellites carrying communications
and data relay payloads can be useful in the context of connecting sensors in the open ocean
with land based facilities. Furthermore, as noted in Section 2, providing situational awareness
and remote sensing data for oceanographic field experiments and persistent observations is a great
asset.
It is also worth mentioning the significant potential of deploying small satellite constellations.
These can be used to increase the capabilities, by combining different payloads that would other-
wise be combined in a larger satellite, or the surface coverage. Some examples are already slated
for launch as noted in Section 3.
43
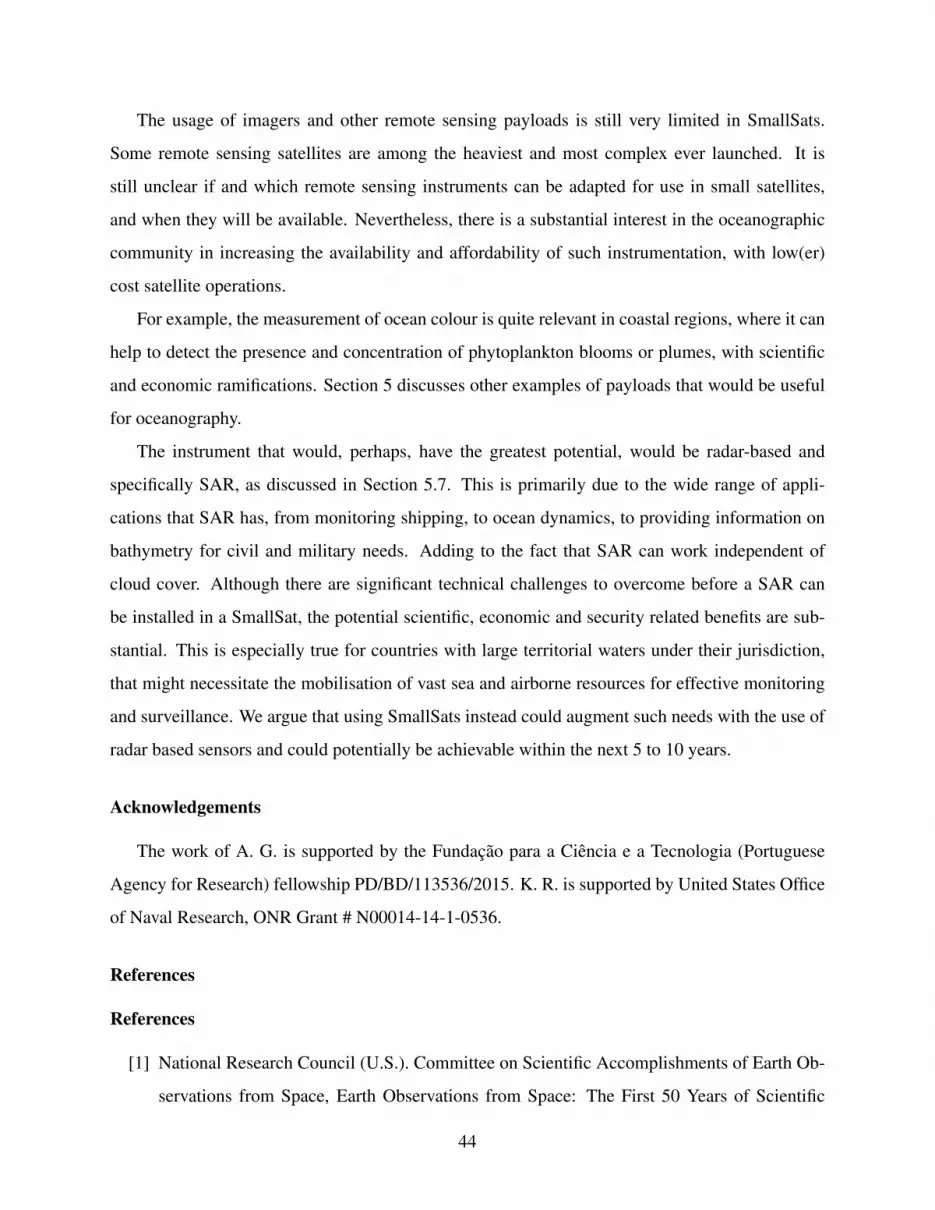
The usage of imagers and other remote sensing payloads is still very limited in SmallSats.
Some remote sensing satellites are among the heaviest and most complex ever launched. It is
still unclear if and which remote sensing instruments can be adapted for use in small satellites,
and when they will be available. Nevertheless, there is a substantial interest in the oceanographic
community in increasing the availability and affordability of such instrumentation, with low(er)
cost satellite operations.
For example, the measurement of ocean colour is quite relevant in coastal regions, where it can
help to detect the presence and concentration of phytoplankton blooms or plumes, with scientific
and economic ramifications. Section 5 discusses other examples of payloads that would be useful
for oceanography.
The instrument that would, perhaps, have the greatest potential, would be radar-based and
specifically SAR, as discussed in Section 5.7. This is primarily due to the wide range of appli-
cations that SAR has, from monitoring shipping, to ocean dynamics, to providing information on
bathymetry for civil and military needs. Adding to the fact that SAR can work independent of
cloud cover. Although there are significant technical challenges to overcome before a SAR can
be installed in a SmallSat, the potential scientific, economic and security related benefits are sub-
stantial. This is especially true for countries with large territorial waters under their jurisdiction,
that might necessitate the mobilisation of vast sea and airborne resources for effective monitoring
and surveillance. We argue that using SmallSats instead could augment such needs with the use of
radar based sensors and could potentially be achievable within the next 5 to 10 years.
Acknowledgements
The work of A. G. is supported by the Fundacao para a Ciencia e a Tecnologia (Portuguese
Agency for Research) fellowship PD/BD/113536/2015. K. R. is supported by United States Office
of Naval Research, ONR Grant # N00014-14-1-0536.
References
References
[1] National Research Council (U.S.). Committee on Scientific Accomplishments of Earth Ob-
servations from Space, Earth Observations from Space: The First 50 Years of Scientific
44
Achievements, Vol. 244, National Academies Press, Washington, D.C, 2008.
[2] V. Kuznetsov, V. Sinelnikov, S. Alpert, Yakov Alpert: Sputnik-1 and the first satellite
ionospheric experiment, Advances in Space Research 55 (12) (2015) 2833–2839. doi:
10.1016/j.asr.2015.02.033.
[3] C. Lafleur, The Spacecrafts Encyclopedia, accessed on 10th of November 2015 (2014).
URL http://claudelafleur.qc.ca/Spacecrafts-index.html
[4] D. Selva, D. Krejci, A survey and assessment of the capabilities of Cubesats for Earth ob-
servation, Acta Astronautica 74 (2012) 50–68. doi:10.1016/j.actaastro.2011.
12.014.
[5] P. Fortescue, J. Stark, G. Swinerd, Spacecraft Systems Engineering, 4th Edition, Wiley,
Hoboken, N.J, 2011.
[6] W. J. Larson, J. R. Wertz, Space Mission Analysis and Design, 3rd Edition, Microcosm
Press, Kluwer Academic Publishers, Boston, 1999.
[7] R. Sandau, Status and trends of small satellite missions for Earth observation, Acta Astro-
nautica 66 (1-2) (2010) 1–12. doi:10.1016/j.actaastro.2009.06.008.
[8] R. Sandau, International study on cost-effective earth observation missions outcomes and
visions, Revue francaise de photogrammetrie et de teledetection (185) (2007) 5–10.
[9] M. Swartwout, The First One Hundred CubeSats: A Statistical Look, Journal of Small
Satellites 2 (2) (2013) 213–233.
[10] K. Briess, F. Baumann, S. Trowitzsch, Present and Future Picosatellite Missions at TU
Berlin, in: 8th IAA Symposium on Small Satellites for Earth Observation, Berlin, 2011, pp.
49–52.
[11] CubeSats: A bright future for nanosatellites, Central European Journal of Engineering 1 (1)
(2011) 9–15. doi:10.2478/s13531-011-0007-8.
[12] M. Swartwout, Secondary spacecraft in 2015: Analyzing success and failure, in: 2015 IEEE
Aerospace Conference, IEEE, 2015, pp. 1–12. doi:10.1109/AERO.2015.7119175.
45
[13] M. Swartwout, The Long-Threatened Flood of University-Class Spacecraft (and CubeSats)
Has Come: Analyzing the Numbers, in: 27th Annual AIAA/USU Conference on Small
Satellites, no. SSC13-IX-01, Logan, Utah, 2013.
[14] The CubeSat Program, CubeSat Design Specification (2015).
[15] C. Garcia-Soto, J. Vazquez-Cuervo, P. Clemente-Colon, F. Hernandez, Satellite oceanogra-
phy and climate change, Deep Sea Research Part II: Topical Studies in Oceanography 77-80
(2012) 1–9. doi:10.1016/j.dsr2.2012.07.004.
[16] H. J. Kramer (Ed.), Observation of the Earth and Its Environment: Survey of Missions
and Sensors, 3rd Edition, Springer Berlin Heidelberg, Berlin, Heidelberg, 1996. doi:
10.1007/978-3-642-97678-0.
[17] I. S. Robinson, Discovering the Ocean from Space, Springer-Verlag Berlin Heidelberg,
Berlin, Heidelberg, 2010. doi:10.1007/978-3-540-68322-3.
[18] G. Haller, Lagrangian coherent structures, Annual Review of Fluid Mechanics 47 (2015)
137–162.
[19] J. P. Ryan, S. Johnson, A. Sherman, K. Rajan, F. Py, H. Thomas, J. Harvey, L. Bird, J. Pad-
uan, R. Vrijenhoek, Mobile autonomous process sampling within coastal ocean observing
systems, Limnology & Oceanography: Methods 8 (2010) 394–402.
[20] J. P. Ryan, M. A. McManus, R. M. Kudela, M. L. Artigas, J. G. Bellingham, F. P. Chavez,
G. Doucette, D. Foley, M. Godin, J. B. J. Harvey, R. M. III, M. Messie, C. Mikulski, T. Pen-
nington, F. Py, K. Rajan, I. Shulman, Z. Wang, Y. Zhang, Boundary influences on HAB
phytoplankton ecology in a stratification-enhanced upwelling shadow, Deep Sea Research
Part II: Topical Studies in Oceanography (0).
[21] J. Pinto, M. Faria, J. Fortuna, R. Martins, J. Sousa, N. Queiroz, F. Py, K. Rajan, Chas-
ing Fish: Tracking and control in a autonomous multi-vehicle real-world experiment, in:
MTS/IEEE Oceans, San Diego, California, 2013.
46
[22] M. Faria, J. Pinto, F. Py, J. Fortuna, H. Dias, R. M. F. Leira, T. A. Johansen, J. B. Sousa,
K. Rajan, Coordinating UAVs and AUVs for Oceanographic Field Experiments: Challenges
and Lessons Learned, in: IEEE International Conference on Robotics and Automation
(ICRA), Hong Kong, 2014.
[23] J. Das, F. Py, J. Harvey, J. Ryan, A. Gellene, R. Graham, D. A. Caron, K. Rajan, G. S.
Sukhatme, Data-driven Robotic Sampling for Marine Ecosystem Monitoring, Intnl. Journal
of Robotics Researchdoi:10.1177/0278364915587723.
[24] IPCC, 2014: Climate Change 2014: Synthesis Report. Contribution of Working Groups I, II
and III to the Fifth Assessment Report of the Intergovernmental Panel on Climate Change,
Tech. rep., IPCC, Geneva, Switzerland (2014).
[25] T. Kuwahara, K. Yoshida, Y. Sakamoto, Y. Tomioka, K. Fukuda, M. Fukuyama, Interna-
tional Scientific Micro-satellite RISESAT based on Space Plug and Play Avionics, in: 26th
Annual AIAA/USU Conference on Small Satellites, Logan, Utah, 2012.
[26] European Space Agency, RISESat, accessed on 30th of September 2015 (2015).
URL https://directory.eoportal.org/web/eoportal/
satellite-missions/r/risesat
[27] H. Klinkrad, P. Beltrami, S. Hauptmann, C. Martin, H. Sdunnus, H. Stokes, R. Walker,
J. Wilkinson, The ESA Space Debris Mitigation Handbook 2002, Advances in Space Re-
search 34 (5) (2004) 1251–1259. doi:10.1016/j.asr.2003.01.018.
[28] E. A. Taylor, J. R. Davey, Implementation of debris mitigation using International Or-
ganization for Standardization (ISO) standards, Proceedings of the Institution of Me-
chanical Engineers, Part G: Journal of Aerospace Engineering 221 (6) (2007) 987–996.
doi:10.1243/09544100JAERO233.
[29] European Space Agency, QSat-EOS, accessed on 1st of October 2015 (2015).
URL https://directory.eoportal.org/web/eoportal/
satellite-missions/q/qsat
47
[30] B. S. Aso, T. Yasaka, Y. Tani, T. Hanada, M. Murozono, M. Omura, Y. Tsuruda, S. Onishi,
K. Arai, M. Cho, M. Nishio, QSAT-EOS: 50kg-class Small Satellite for Earth Observa-
tion System Demonstration, in: 28th International Symposium on Space Technology and
Science, Okinawa, 2011.
[31] R. B. Wallace, H. Baumann, J. S. Grear, R. C. Aller, C. J. Gobler, Coastal ocean acidifi-
cation: The other eutrophication problem, Estuarine, Coastal and Shelf Science 148 (2014)
1–13. doi:10.1016/j.ecss.2014.05.027.
[32] S. Massey, COPPER: IR Imaging and Radiation Studies Overview Payloads Spacecraft
Bus Conclusion (2012).
URL http://mstl.atl.calpoly.edu/˜bklofas/Presentations/
SummerWorkshop2011/Massey_COPPER.pdf
[33] European Space Agency, COPPER, accessed on 07th of September 2015 (2015).
URL https://directory.eoportal.org/web/eoportal/
satellite-missions/c-missions/copper
[34] AXELSPACE Cooperation, Micro-Satellite for Monitoring Polar Ice WNISAT-1 (2013).
URL http://en.axelspace.com/solution/wnisat1/
[35] S. Kim, T. Eishima, N. Miyashita, Y. Nojiri, Y. Nakamura, WNISAT - Nanosatellite for
North Arctic Routes and Atmosphere Monitoring, in: 24th Annual AIAA/USU Conference
on Small Satellites, Logan, Utah, 2010.
[36] European Space Agency, ParkinsonSat, accessed on 29th of September 2015 (2015).
URL https://directory.eoportal.org/web/eoportal/
satellite-missions/p/parkinsonsat
[37] European Space Agency, TUBSAT, accessed on 29th of September 2015 (2015).
URL https://directory.eoportal.org/web/eoportal/
satellite-missions/t/tubsat
48

[38] V. Carrara, H. K. Kuga, P. M. Bringhenti, M. J. de Carvalho, Attitude Determination, Control
and Operating Modes for CONASAT Cubesats, in: 24th International Symposium on Space
Flight Dynamics (ISSFD), Laurel, Maryland, 2014.
[39] European Space Agency, Fedsat, accessed on 29th of September 2015 (2015).
URL https://directory.eoportal.org/web/eoportal/
satellite-missions/f/fedsat
[40] T. Hayashi, Y. Okamoto, K. Yokoyama, S. Hosokawa, T. Takahashi, K. Nakazawa,
T. Takashima, S. Watanabe, T. Hashimoto, M. Nomachi, Y. Masumoto, Data Collection
by Means of Formation Flight of Small Satellites with Gravity Gradient Attitude Stabi-
lization, in: 55th International Astronautical Congress of the International Astronautical
Federation, the International Academy of Astronautics, and the International Institute of
Space Law, American Institute of Aeronautics and Astronautics, Reston, Virigina, 2004.
doi:10.2514/6.IAC-04-IAA.4.11.4.04.
[41] Council of the European Union, European Union Maritime Security Strategy (2014).
URL http://ec.europa.eu/maritimeaffairs/policy/
maritime-security/index_en.htm
[42] D. Bedard, A. Spaans, Responsive Space for the Canadian Forces, in: 5th Responsive Space
Conference, Los Angeles, 2007.
[43] T. Eriksen, A. N. Skauen, B. Narheim, O. Helleren, O. Olsen, R. B. Olsen, Tracking
ship traffic with Space-Based AIS: Experience gained in first months of operations, in:
2010 International WaterSide Security Conference, Vol. 1, IEEE, 2010, pp. 1–8. doi:
10.1109/WSSC.2010.5730241.
[44] Y. Nakamura, K. Nishijo, N. Murakami, K. Kawashima, Y. Horikawa, K. Yamamoto,
T. Ohtani, Y. Takhashi, K. Inoue, Small Demonstration Satellite-4 (SDS-4): Development,
Flight Results, and Lessons Learned in JAXAs Microsatellite Project, in: 27th Annual
AIAA/USU Conference on Small Satellites, Logan, Utah, 2013.
49
[45] S. Hardhienata, R. H. Triharjanto, M. Mukhayadi, LAPAN-A2: Indonesian Near-Equatorial
Surveilance Satellite, in: 18th Asia-Pacific Regional Space Agency Forum, Singapore,
2011.
[46] G. Mantzouris, P. Papadopoulos, N. Nikitakos, M. Manso, G. Markarian, Experiments on
Pico-Satellites for Maritime Security Applications, Tech. Rep. Paper ID: 067.
[47] B. Narheim, O. Olsen, O. Helleren, R. Olsen, A. Beattie, R. Zee, A Norwegian Satellite for
Space-based Observations of AIS in the High North, in: 22nd Annual AIAA/USU Confer-
ence on Small Satellites, Logan, Utah, 2008.
[48] N. G. Orr, J. Cain, L. Stras, R. E. Zee, Space Based Ais Detection With the Maritime
Monitoring and Messaging, in: 64th International Astronautical Congress, 2013, pp. 1–9.
[49] F. M. Pranajaya, R. E. Zee, J. Cain, R. Kolacz, Nanosatellite Tracking Ships: Cost-Effective
Responsive Space, in: The 4S Symposium - Small Satellites Systems and Services, Funchal,
2010.
[50] M. Takai, T. Ohtani, Y. Nakamura, Y. Takahashi, K. Inoue, JAXA’s technology demonstra-
tion mission SDS-4, in: 2013 IEEE International Geoscience and Remote Sensing Sympo-
sium - IGARSS, IEEE, 2013, pp. 839–842. doi:10.1109/IGARSS.2013.6721289.
[51] Gunter Dirk Krebs, Triton 1, 2, accessed on 29th of September 2015 (2015).
URL http://space.skyrocket.de/doc_sdat/triton-1.htm
[52] Gunter Dirk Krebs, TT 1, accessed on 29th of September 2015 (2015).
URL http://space.skyrocket.de/doc_sdat/tt-1.htm
[53] Gunter Dirk Krebs, Perseus-M 1, 2, accessed on 21st of September 2015 (2015).
URL http://space.skyrocket.de/doc_sdat/perseus-m.htm
[54] Wikipedia, Perseus-M, accessed on 21st of September 2015 (2015).
URL https://en.wikipedia.org/wiki/Perseus-M
[55] Gunter Dirk Krebs, DX 1, accessed on 23rd of September 2015 (2015).
URL http://space.skyrocket.de/doc_sdat/dx-1.htm
50
[56] D. D. Villiers, R. V. Zyl, ZACube-2: The successor to Africa’s first nanosatellite, in: South-
ern African Amateur Radio Satellite Association Space Symposium, Pretoria, 2015.
[57] A. team, AAU Student Space, accessed on 28th of September 2015 (2015).
URL http://www.space.aau.dk
[58] European Space Agency, LambdaSat, accessed on 29th of September 2015 (2015).
URL https://directory.eoportal.org/web/eoportal/
satellite-missions/l/lambdasat
[59] European Space Agency, LAPAN-A2, accessed on 1st of October 2015 (2015).
URL https://directory.eoportal.org/web/eoportal/
satellite-missions/l/lapan-a2
[60] J. Block, A. Bager, J. Behrens, T. Delovski, L.-C. Hauer, M. Schutze, R. Schutze,
T. Sprowitz, A self-deploying and self-stabilizing helical antenna for small satellites, Acta
Astronautica 86 (2013) 88–94. doi:10.1016/j.actaastro.2011.10.012.
[61] M. R. Aherne, J. T. Barrett, L. Hoag, E. Teegarden, R. Ramadas, Aeneas – Colony I Meets
Three-Axis Pointing, in: 25th Annual AIAA/USU Conference on Small Satellites, Logan,
Utah, 2011.
[62] Union of Concerned Scientists, UCS Satellite Database, accessed on 9th of September 2015
(2015).
[63] European Space Agency, VesselSat, accessed on 23rd of September 2015 (2015).
URL https://directory.eoportal.org/web/eoportal/
satellite-missions/v-w-x-y-z/vesselsat
[64] Gunter Dirk Krebs, Rubin 9, accessed on 23rd of September 2015 (2015).
URL http://space.skyrocket.de/doc_sdat/rubin-9-ais.htm
[65] European Space Agency, SDS-4, accessed on 24th of September 2015 (2015).
URL https://directory.eoportal.org/web/eoportal/
satellite-missions/s/sds-4
51

[66] Gunter Dirk Krebs, SeaHawk 1, 2, accessed on 29th of September 2015 (2015).
URL http://space.skyrocket.de/doc_sdat/seahawk.htm
[67] European Space Agency, CYGNSS, accessed on 29th of September 2015 (2015).
URL https://directory.eoportal.org/web/eoportal/
satellite-missions/c-missions/cygnss
[68] R. Rose, S. Gleason, C. Ruf, The NASA CYGNSS mission: a pathfinder for GNSS scat-
terometry remote sensing applications, in: SPIE 9240, Remote Sensing of the Ocean, Sea
Ice, Coastal Waters, and Large Water Regions, 2014, p. 924005. doi:10.1117/12.
2068378.
[69] exactEarth Ltd., exactEarth, accessed on 23rd of September 2015 (2015).
URL http://www.exactearth.com/
[70] exactEarth Ltd., The exactView Constellation - Product Information, retrieved on 15th of
September 2015 (2015).
[71] Gunter Dirk Krebs, LatinSat A, B, C, D / AprizeSat 1, ..., 10 / exactView 3, 4, 5, 5R, 6, 11,
12, 13, accessed on 23rd of September 2015 (2015).
URL http://space.skyrocket.de/doc_sdat/aprizesat-1_
latinsat-1.htm
[72] W. Ley, K. Wittmann, W. Hallmann (Eds.), Handbook of Space Technology, John Wiley &
Sons, Ltd, Chichester, UK, 2009. doi:10.1002/9780470742433.
[73] M. Macdonald, V. Badescu, The International Handbook of Space Technology, Springer
Berlin Heidelberg, Berlin, Heidelberg, 2014. doi:10.1007/978-3-642-41101-4.
[74] International Telecommunication Union, Prague Declaration on Small Satellite Regulation
and Communication Systems (2015).
URL http://www.itu.int/en/ITU-R/space/workshops/
2015-prague-small-sat
[75] W. J. Ubbels, M. Buscher, Status of ITU-R studies related to small satellites, iTU Sympo-
sium and Workshop on small satellite regulation and communication systems (2015).
52
[76] United Nations Office for Outer Space Affairs, International Telecommunication Union,
Guidance on Space Object Registration and Frequency Management for Small and Very
Small Satellites, Tech. Rep. April (2015).
URL http://www.unoosa.org/oosa/en/spaceobjectregister/
resources/index.html
[77] United Nations Office for Outer Space Affairs, Convention on International Liability for
Damage Caused by Space Objects, adopted by the General Assembly in its resolution 2777
(XXVI), opened for signature on 29 March 1972, entered into force on 1 September 1972
(1971).
URL http://www.unoosa.org/oosa/en/ourwork/spacelaw/treaties/
liability-convention.html
[78] International Telecommunication Union, Studies to accommodate requirements in the space
operation service for non-geostationary satellites with short duration missions, Tech. Rep.
November, world Radiocommunication Conference 2015 - Provisional Final Acts (2015).
[79] I. S. Robinson, Measuring the Oceans from Space: The principles and methods of satellite
oceanography, 1st Edition, Springer-Verlag Berlin Heidelberg, New York, 2004.
[80] A. F. Shchepetkin, J. C. McWilliams, The regional oceanic modelling system (ROMS): a
split-explicit, free-surface, topography-following-coordinate oceanic model, Ocean Mod-
elling 9 (2005) 347–404, doi:10.1016/j.ocemod.2004.08.002.
[81] J. Das, K. Rajan, S. Frolov, J. P. Ryan, F. Py, D. A. Caron, G. S. Sukhatme, Towards Marine
Bloom Trajectory Prediction for AUV Mission Planning, in: IEEE International Conference
on Robotics and Automation (ICRA), Anchorage, Alaska, 2010.
[82] M. Bernstein, R. Graham, D. Cline, J. Dolan, K. Rajan, Towards machine learning-based
oceanographic event response, Carnegie Mellon University Technical Report, In Progress
(2012).
53

[83] European Space Agency, OrbView-2, accessed on 18th of November 2015 (2015).
URL https://directory.eoportal.org/web/eoportal/
satellite-missions/o/orbview-2
[84] European Space Agency, TerraSAR-X, accessed on 18th of November 2015 (2015).
URL https://directory.eoportal.org/web/eoportal/
satellite-missions/t/terrasar-x
[85] Committee on Earth Observation Satellites, THE CEOS Database: Missions, Instruments
and Measurements, accessed on 12th of October 2015 (2014).
URL http://database.eohandbook.com/
[86] European Space Agency, Satellite Missions Directory - Earth Observation Missions -
eoPortal (2015).
URL https://directory.eoportal.org/web/eoportal/
satellite-missions
[87] D. B. Chelton, J. C. Ries, B. J. Haines, L.-L. Fu, P. S. Callahan, Satellite Altimetry, in: L.-L.
Fu, A. Cazenave (Eds.), Satellite Altimetry and Earth Sciences - A Handbook of Techniques
and Applications, 1st Edition, Vol. 69 of International Geophysics, Elsevier, 2001, Ch. 1,
pp. 1–131. doi:10.1016/S0074-6142(01)80146-7.
[88] S. Martin, An Introduction to Ocean Remote Sensing, 2nd Edition, Cambridge University
Press, New York, 2014.
[89] International Ocean-Colour Corrdinating Group, International Ocean Colour Coordinating
Group, accessed on 18th of November 2015 (2015).
URL http://www.ioccg.org/
[90] European Space Agency, OceanSat-2, accessed on 12th of October 2015 (2015).
URL https://directory.eoportal.org/web/eoportal/
satellite-missions/o/oceansat-2
54
[91] European Space Agency, HY-1B, accessed on 18th of November 2015 (2015).
URL https://directory.eoportal.org/web/eoportal/
satellite-missions/h/hy-1b
[92] Cloudland Instruments, Seahawk Cubesat Project, accessed on 13th of October 2015 (2015).
URL http://cloudlandinstruments.com/?page_id=7
[93] European Space Agency, GRACE, accessed on 14th of October 2015 (2015).
URL https://directory.eoportal.org/web/eoportal/
satellite-missions/g/grace
[94] S. Vignudelli, H. M. Snaith, F. Lyard, P. Cipollini, F. Venuti, F. Birol, J. Bouffard, L. Roblou,
Satellite radar altimetry from open ocean to coasts: challenges and perspectives, in: R. J.
Frouin, V. K. Agarwal, H. Kawamura, S. Nayak, D. Pan (Eds.), SPIE 6406, Remote Sensing
of the Marine Environment, 2006, p. 64060L. doi:10.1117/12.694024.
[95] European Space Agency, Jason-1, accessed on 14th of October 2015 (2015).
URL https://directory.eoportal.org/web/eoportal/
satellite-missions/j/jason-1
[96] European Space Agency, EnviSat, accessed on 4th of November 2015 (2015).
URL https://directory.eoportal.org/web/eoportal/
satellite-missions/e/envisat
[97] European Space Agency, SARAL, accessed on 14th of October 2015 (2015).
URL https://directory.eoportal.org/web/eoportal/
satellite-missions/s/saral
[98] European Space Agency, Jason-2, accessed on 14th of October 2015 (2015).
URL https://directory.eoportal.org/web/eoportal/
satellite-missions/j/jason-2
[99] European Space Agency, CryoSat-2, accessed on 14th of October 2015 (2015).
URL https://directory.eoportal.org/web/eoportal/
satellite-missions/c-missions/cryosat-2
55
[100] Y. Zheng, The GANDER Microsatellite Radar Altimeter Constellation for Global Sea State
Monitoring, in: 13th Annual AIAA/USU Conference on Small Satellites, Logan, Utah,
1999.
[101] R. da Silva Curiel, G. Jolly, Y. Zheng, The GANDER constellation for maritime dis-
saster mitigation, Acta Astronautica 44 (7-12) (1999) 685–692. doi:10.1016/
S0094-5765(99)00064-8.
[102] J. Richard, V. Enjolras, L. Rys, J. Vallon, I. Nann, P. Escudier, Space Altimetry from Nano-
Satellites: Payload Feasibility, Missions and System Performances, in: IGARSS 2008 -
2008 IEEE International Geoscience and Remote Sensing Symposium, Vol. 3, IEEE, 2008,
pp. III – 71–III – 74. doi:10.1109/IGARSS.2008.4779285.
[103] N. Stacy, 6U Radar Altimeter Concept, in: 6U Cubesat Low Cost Space Missions Workshop,
Canberra, 2012.
[104] A. Mroczek, G. Jacobs, Nanosats for Radar Altimetry, in: 29th Annual AIAA/USU Confer-
ence on Small Satellites, Logan, Utah, 2015.
[105] European Space Agency, SMOS, accessed on 16th of October 2015 (2015).
URL https://directory.eoportal.org/web/eoportal/
satellite-missions/s/smos
[106] European Space Agency, QuikSCAT, accessed on 15th of October 2015 (2015).
URL https://directory.eoportal.org/web/eoportal/
satellite-missions/q/quikscat
[107] European Space Agency, DMSP, accessed on 15th of October 2015 (2015).
URL https://directory.eoportal.org/web/eoportal/
satellite-missions/d/dmsp-block-5d
[108] European Space Agency, Coriolis, accessed on 15th of October 2015 (2015).
URL https://directory.eoportal.org/web/eoportal/
satellite-missions/c-missions/coriolis
56
[109] European Space Agency, Meteosat - First Generation, accessed on 19th of October 2015
(2015).
URL https://directory.eoportal.org/web/eoportal/
satellite-missions/m/meteosat-first-generation
[110] European Space Agency, EO-1, accessed on 19th of October 2015 (2015).
URL https://directory.eoportal.org/web/eoportal/
satellite-missions/e/eo-1
[111] A. Schmittner, J. C. Chiang, S. R. Hemming, Introduction: The ocean’s meridional overturn-
ing circulation, in: Ocean Circulation: Mechanisms and Impacts - Past and Future Changes
of Meridional Overturning, 2007, pp. 1–4. doi:10.1029/173GM02.
[112] M. Meerman, M. Unwin, S. Gleason, S. Jason, M. Sweeting, A Nanosatellite to Demon-
strate GPS Oceanography Reflectometry, in: 16th Annual AIAA/USU Conference on Small
Satellites, Logan, Utah, 2002.
[113] R. Rose, C. S. Ruf, H. Seki, Ocean altimetry and wind applications of a GNSS nanosatellite
constellation, in: H. Shimoda, X. Xiong, C. Cao, X. Gu, C. Kim, A. S. Kiran Kumar (Eds.),
SPIE 8528, Earth Observing Missions and Sensors: Development, Implementation, and
Characterization II, 2012, p. 85280G. doi:10.1117/12.977595.
[114] G. Foti, C. Gommenginger, P. Jales, M. Unwin, A. Shaw, C. Robertson, J. Rosello, Space-
borne GNSS reflectometry for ocean winds: First results from the UK TechDemoSat-
1 mission, Geophysical Research Letters 42 (13) (2015) 5435–5441. doi:10.1002/
2015GL064204.
[115] A. Camps, N. Rodriguez-Alvarez, X. Bosch-Lluis, J. Marchan, I. Ramos-Perez, M. Segarra,
L. Sagues, D. Tarrago, O. Cunado, R. Vilaseca, A. Tomas, J. Mas, J. Guillamon, PAU in
SeoSAT: A proposed hybrid L-band microwave radiometer/GPS reflectometer to improve
Sea Surface Salinity estimates from space, in: 2008 Microwave Radiometry and Remote
Sensing of the Environment, IEEE, 2008, pp. 1–4. doi:10.1109/MICRAD.2008.
4579467.
57
[116] European Space Agency, TechDemoSat-1, accessed on 14th of October 2015 (2015).
URL https://directory.eoportal.org/web/eoportal/
satellite-missions/t/techdemosat-1
[117] H. Carreno-Luengo, A. Camps, I. Perez-Ramos, G. Forte, R. Onrubia, R. Diez, 3Cat-2: A
P(Y) and C/A GNSS-R experimental nano-satellite mission, in: 2013 IEEE International
Geoscience and Remote Sensing Symposium - IGARSS, IEEE, 2013, pp. 843–846. doi:
10.1109/IGARSS.2013.6721290.
[118] W. Pitz, D. Miller, The TerraSAR-X Satellite, IEEE Transactions on Geoscience and Remote
Sensing 48 (2) (2010) 615–622. doi:10.1109/TGRS.2009.2037432.
[119] J. Pineda, V. Starczak, J. C. Silva, K. Helfrich, M. Thompson, D. Wiley, Whales and waves:
Humpback whale foraging response and the shoaling of internal waves at stellwagen bank,
Journal of Geophysical Research: Oceans 120 (4) (2015) 2555–2570.
[120] J. da Silva, M. Buijsman, J. Magalhaes, Internal waves on the upstream side of a large sill of
the Mascarene Ridge: a comprehensive view of their generation mechanisms and evolution,
Deep Sea Research Part I: Oceanographic Research Papers 99 (2015) 87–104.
[121] M. K. Mishra, D. Ganguly, P. Chauhan, et al., Estimation of coastal bathymetry using
RISAT-1 C-band microwave SAR data, Geoscience and Remote Sensing Letters, IEEE
11 (3) (2014) 671–675.
[122] S. W. McCandless Jr., C. R. Jackson, Chapter 1: Principles of Synthetic Aperture Radar, in:
SAR Marine User’s Manual, U. S. Department of Commerce, Washington, DC, 2004, pp.
1–24.
URL http://sarusersmanual.com/
[123] G. C. Staples, J. Hornsby, Turning the Scientifically Possible into the Operationally Practi-
cal: RADARSAT-2 Polarimetry Applications, in: Proceedings of IGARS — IEEE Interna-
tional Geoscience and Remote Sensing Symposium, 2002.
58
[124] U. Steinbrecher, T. Kraus, G. Castellanos Alfonzo, C. Grigorov, D. Schulze, B. Brutigam,
TerraSAR-X: Design of the new operational Wide ScanSAR mode, in: Proceedings of EU-
SAR 2014 (10th European Conference on Synthetic Aperture Radar), 2014.
[125] M. Di Lazzaro, G. Angino, M. Piemontese, A. Capuzi, R. Leonardi, COSMO-SkyMed: The
Dual-Use Component of a Geospatial System for Environment and Security, in: Proceedings
of the 2008 IEEE Aerospace Conference, 2008.
[126] S.-R. Lee, Overview of KOMPSAT-5 Program, Mission, and System, in: Proceedings of
IGARS — IEEE International Geoscience and Remote Sensing Symposium, 2010.
[127] P. Snoeij, E. Attema, B. Duesmann, M. Davidson, N. Floury, B. Rosich, Betlem amd Rom-
men, G. Levrini, GMES Sentinel-1 Mission, System and Products, in: Proceedings of 4th
International POLinSAR 2009 Workshop, 2009.
[128] Y. Sharay, N. U, TecSAR Satellite — Novel Approach in Space SAR Design, in: Proceed-
ings of IRSI (International Radar Symposium India), 2005.
[129] I. G. Cumming, F. H. Wong, Digital processing of synthetic aperture radar data: algorithms
and implementation, Artech House, Inc., Nortwood, MA, USA, 2005.
[130] H. Zebker, Lecture notes for Radar Remote Sensing: Fundamentals and Geophysical Appli-
cation of Imaging Radar Systems, accessed on 14th of December 2015 (2015).
URL http://web.stanford.edu/class/ee355/syllabus.htm
[131] J. J. Kovaly (Ed.), Synthetic Aperture Radar, Artech House, Dedham, MA, 1976.
59
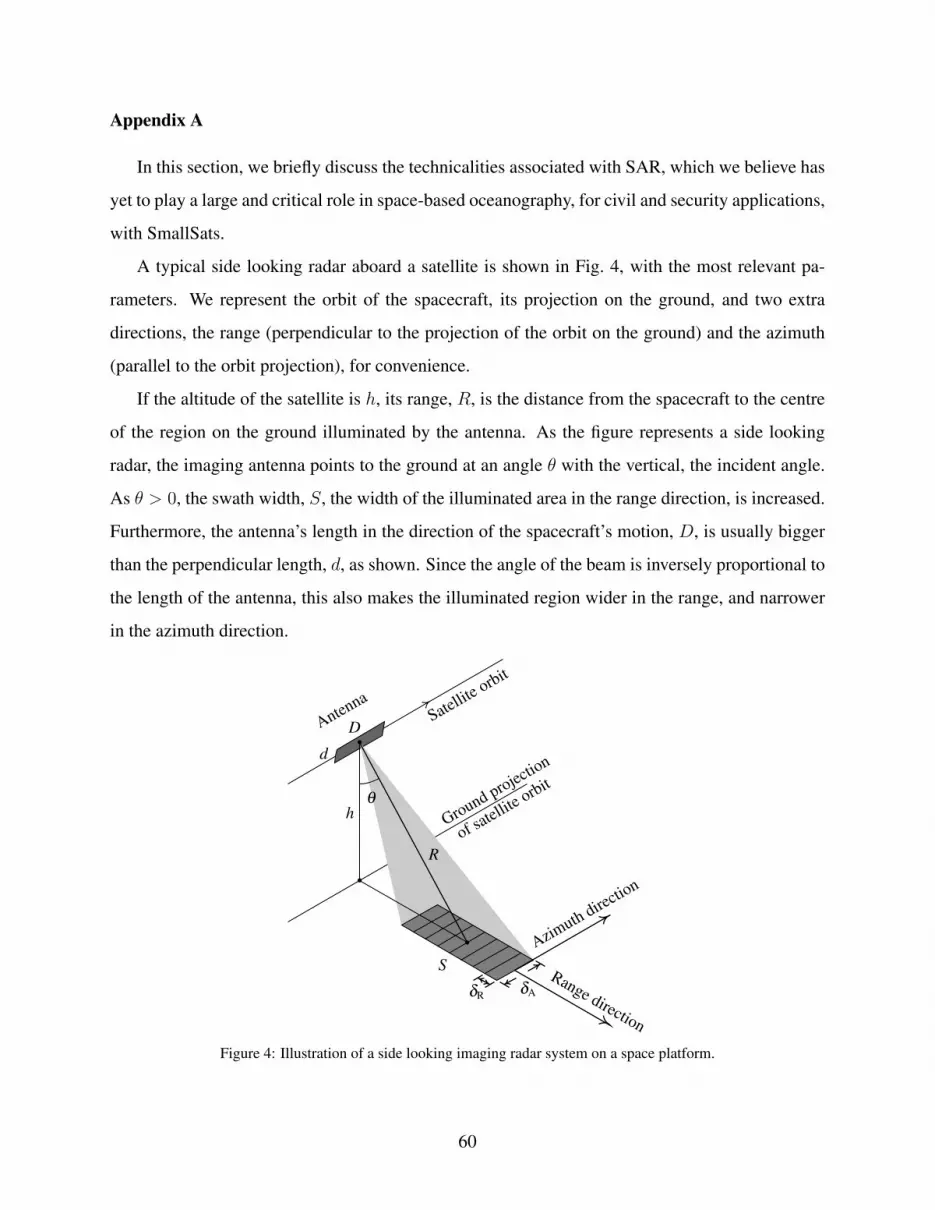
Appendix A
In this section, we briefly discuss the technicalities associated with SAR, which we believe has
yet to play a large and critical role in space-based oceanography, for civil and security applications,
with SmallSats.
A typical side looking radar aboard a satellite is shown in Fig. 4, with the most relevant pa-
rameters. We represent the orbit of the spacecraft, its projection on the ground, and two extra
directions, the range (perpendicular to the projection of the orbit on the ground) and the azimuth
(parallel to the orbit projection), for convenience.
If the altitude of the satellite is h, its range, R, is the distance from the spacecraft to the centre
of the region on the ground illuminated by the antenna. As the figure represents a side looking
radar, the imaging antenna points to the ground at an angle θ with the vertical, the incident angle.
As θ > 0, the swath width, S, the width of the illuminated area in the range direction, is increased.
Furthermore, the antenna’s length in the direction of the spacecraft’s motion, D, is usually bigger
than the perpendicular length, d, as shown. Since the angle of the beam is inversely proportional to
the length of the antenna, this also makes the illuminated region wider in the range, and narrower
in the azimuth direction.
h
S
D
d
R
θ
δRδA
AntennaSatellit
e orbit
Ground projection
of satellit
e orbit
Azimuth dire
ction
Range direction
Figure 4: Illustration of a side looking imaging radar system on a space platform.
60
Consequently, different points along the range direction are characterised by different time
delays between the emitted pulse and the return of the back-scattered signal to the antenna. A
pulse reflected from a point with a distance Ri, from the antenna, takes a time 2Ri/c to get back,
where c is the speed of light. To distinguish two different points, the difference between their time
delays must be larger than the time, τ , that each pulse lasts. Therefore, the resolution distance, δR,
in the range direction is approximately
δR ≈ cτ
2. (1)
For the altitude of the spacecraft, typically a few hundreds of kilometres, very short pulses of
a few nanoseconds are required to attain a resolution of the order of tens of meters. However, to
give those short pulses the minimum energy to allow the reflected pulse to be distinguishable from
the background noise, the peak intensity of the emitted pulse would need to be large. Thus, the
required intensity would burn the antenna. The problem can be solved by sending a frequency-
modulated (chirped) pulse, i.e. a pulse whose frequency decreases with time. The reflected pulse
detected in the antenna is then filtered, delaying the higher frequencies. That shortens the time
span, τ , of the detected pulses, which turn them equal to 1/B, where B is the bandwidth (that is,
the difference between the higher and lower frequencies of the emitted pulse). The resolution in
the range direction then becomes
δR ≈ c
2B. (2)
The resolution in the azimuth direction, δA in Fig. 4, depends only on the capability of the
antenna to receive independent pulses from two points without interference, and it is approximately
equal to
δA ≈ λR
D, (3)
where λ is the wavelength of the signal used.
An important parameter in radar systems is the signal-to-noise ratio (SNR). The expression for
the SNR is usually called the radar equation. Various radar equations are found in the literature,
specific to different types of images [129, 130]. A general expression can be written as
SNR =PtGtGr λ
2Aσ0(4π)3R4 k T B Fn Ls
, (4)
61

where Pt is the average transmitted power, Gt and Gr are the gains of the transmitter and receiver
antennas respectively (often equal since a single antenna is usually used), A is the area of the
target and σ0 its normalised cross section (the fraction of the power of the radar radiation which is
returned by the target in the direction of the receiver). In the denominator, we have Boltzmann’s
constant, k, the absolute temperature of the radar system, T , the receiver noise figure, Fn, and
Ls that accounts for the system losses. As before, R is the range, λ the wavelength of the radar
radiation, and B is the bandwidth of the emitted pulse.
For a typical radar, for instance, with a bandwidth of 15MHz, a range resolution of 10m can
be attained, and the emitted pulse can have a longer duration, τ , of the order of tens of micro
seconds. The bandwidth cannot be increased much further because it poses technical difficulties,
and the possibility of getting off the range of frequencies allowed for microwave radars (without
interfering with other telecommunication devices) [79].
Conversely, a wide antenna, with D = 10m, is not capable to achieve an azimuth resolution
better than tens of meters. In fact, for microwaves, in order to get a reasonable image resolution,
an antenna of several kilometres would be needed.
It is in this context, that SAR manages to outperform other radar systems. By taking advantage
of the motion of the antenna relative to the target, a point in the ground reflects back the pulses
to the antenna during the time that the satellite illuminates it. Meanwhile, the antenna moves a
sizeable distance, receiving back-scattered pulses. Combining all signals, it is as if the antenna had
the length of the distance that the satellite as moved while the target is still in view. In other words,
the effective length of a SAR antenna, DSAR, is of the order of the size of the illuminated region
itself, yielding a much larger azimuth resolution. To distinguish pulses coming from different
points along the azimuth direction, the Doppler shift of the received pulses is used [131].
To fully exploit SAR features we should then consider the minimum area of the antenna,
Amin = δRδA/ sin θ, and the “velocity”, v = D/τ . Applying this to the the radar equation, it
follows the SAR equation
SNR =PtGtGr λ
3 σ0 c
128 π3R3 k T B Fn Ls v sin θ, (5)
which exhibits the distinct 1/R3 SAR factor.
From this equation it is clear that in order to improve SAR performance, one should either
62

increase the signal or decrease the noise and losses (or both). The former asks for more power,
more gain, and greater wavelengths. The latter can be achieved, in principle, by avoiding losses
and increasing the velocity, v, which in turn requires shorter pulses and an upgraded discrimination
of the incoming signal.
63