on apfim of grain boundaries in a nickel base superalloy
TRANSCRIPT
Seediscussions,stats,andauthorprofilesforthispublicationat:https://www.researchgate.net/publication/45068595
OnAPFIMofgrainboundariesinanickelbasesuperalloy
ARTICLEinJOURNALDEPHYSIQUEIV(PROCEEDINGS)·SEPTEMBER1996
ImpactFactor:0.35·DOI:10.1051/jp4:1996540
CITATIONS
2
READS
15
2AUTHORS,INCLUDING:
MattiasThuvander
ChalmersUniversityofTechnology
68PUBLICATIONS466CITATIONS
SEEPROFILE
Availablefrom:MattiasThuvander
Retrievedon:04February2016

JOURNAL, DE PHYSIQUE TV Colloque C5, suppltment au Journal de Physique III, Volume 6, septembre 1996
On APFIM of Grain Boundaries in a Nickel Base Superalloy
M. Thuvander and K. Stiller
Department of Physics, Chalmers University of Technology, 412 96 Goteborg, Sweden
Abstract. Experimental details of atom probe field ion microscopy (APFIM) of a Ni-16Cr-9Fe alloy are presented. In particular, studies concerning analysis of intergranular carbides and borides and segregation to grain boundaries are described. It was found that NiZ3B6 precipitates are very sensitive to preferential field evaporation, which necessitates optimization of the analysis conditions. In the FIM images, nickel- and boron-rich precipitates exhibited either dark or bright contrast with respect to the austenitic matrix. Analysis of a grain boundary that contained a high level of segregated carbon, revealed that carbon is partially field evaporated as complex ions. In this analysis, chromium and carbon often appeared next to each other in the ion chain. Together, these two observations indicate nucleation of chromium carbides, which are known to form after extended heat treatment at the applied temperature (600°C).
1. INTRODUCTION
The grain boundary microstructure of the investigated material is of importance because similar alloys have been found to be susceptible to intergranular stress corrosion cracking (IGSCC) under certain conditions [I]. IGSCC occurs in many austenitic materials, such as stainless steels and superalloys [2]. This phenomenon has been of particular interest in the nuclear power industry, since failures of pipes in steam generators have caused costly repairs. A common material that is used in this application is the nickel based Alloy 600, with major composition Ni-16Cr-9Fe (wt%). Alloy 600 contains carbon, 0.01-0.1 wt%, which has a major influence on the microstructure. Because of its low solubility in the material [3], carbon segregates to grain boundaries during heat treatment and subsequently forms precipitates, mainly chromium carbides. In materials alloyed with boron, precipitation of nickel borides has also been observed [4, 51, resulting in a complex grain boundary microstructure.
To obtain detailed information about the grain boundary microstructure of Alloy 600, an experimental technique with high spatial resolution together with the possibility of making quantitative chemical analysis of all elements including carbon and boron is needed. APFIM fulfils these requirements [5-81. In this paper we report details concerning specimen preparation, contrast of intergranular precipitates in FIM images and field evaporation effects observed when analysing model materials with compositions similar to commercial Alloy 600.
2. EXPERIMENTAL
2.1 Equipment
An energy compensated atom probe was used for microanalysis. The instrument has been previously described in detail [9-111. The analysis temperature was varied in the range 40-90 K. Neon, at a pressure of 30 mPa, was used as the imaging gas, whereas chemical analysis was performed at about 30 nPa. Voltage pulse fractions of 15%, 20% and 25% were used at a pulse frequency of 167 Hz and a pulse duration about 5 ns. The standing voltage was controlled to obtain a constant evaporation rate of about 10 ions per minute and per square nanometer. The detection system has eight timing channels, which limits the number of ions that can be detected per pulse. Before analysis, the specimens were investigated in a Philips 300 transmission electron microscope (TEM), operating at 100 kV.
Article published online by EDP Sciences and available at http://dx.doi.org/10.1051/jp4:1996540

C5-248 JOURNAL DE PHYSIQUE IV
2.2 Materials
The compositions of the investigated materials are presented in table 1. They are model materials of a higher purity than commercial Alloy 600. Depending on the solution annealing treatment, the grain size varied from 20 pm (Alloy A) to 200 pm (Alloy B).
Table 1. Composition of the investigated materials (at.%). Alloy Ni Cr Fe C B S i A1
2.3 Specimen preparation
A standard preparation technique was applied to fabricate sharp needle shaped specimens. In the first step a neck was created by electropolishing in a layer of 10% perchloric acid and 20% glycerol in methanol. The layer was floating on tricloroethylene. In the second step, the whole blank was electropolished in 2% perchloric acid in 2-butoxyethanol until the blank fractured at the position of the neck created in the first step. The circuit was automatically broken after the fracture. The voltage that was used for both steps was approximately 22 V. The success rate of the method was about 90%.
To enable grain boundary studies of a material with a grain size much larger than the accessible depth of atom probe analysis, which is typically 100 nm, special preparation techniques are necessary. Electropolishing, using short voltage pulses, in the same electrolyte as in step two above was used to produce specimens containing a grain boundary close to the tip apex [12, 131. Pulsed polishing (back- polishing) and subsequent TEM inspection were repeatedly performed to monitor the specimen preparation process. Specimens containing a grain boundary several micrometers away from the tip apex could be successfully back-polished only if the specimen shape was suitable. In order to maintain a small tip radius and a symmetrical cross section, the taper angle should be Iess than 30". On the other hand, specimens with extremely low taper angles are also unwanted, because in that case the amount of material that is removed per pulse is hard to predict.
A pulse of 10 ms at a voltage of 22 V typically shortened the tip by about 200 nm and a pulse of 2 ms by about 50 nm (taper angle approximately 20"). To remove smaller amounts of material, polishing was performed at 15 V for 1 ms, which removed less than 10 nm. When the grain size was 200 pm, not more than one grain boundary was accessible per specimen, so if too much material was removed that specimen could not be used further. For the preparation of specimens containing a grain boundary close to the tip apex, the success rate for Alloy A was about 50%, whereas it was only about 10% for Alloy B, due to the large grain size. The most distant grain boundary that was successfully analysed was originally 30 pm away from the tip apex. A problem with back-polishing is that the specimen tends to get an elliptical cross section after extensive polishing, due to variations in polishing rate with crystallographic orientation.
3. RESULTS AND DISCUSSION
3.1 Field evaporation of Ni23B6
It has previously been shown by TEM that Ni23B6 is one of two main types of intergranular precipitates, the other is Cr7C3, in materials similar to Alloy B in this investigation [4]. When analysing Ni23B6 by atom probe-at a specimen temperature of 80 K using a pulse fraction of 20%, a standard condition that gave reliable results for matrix analysis, the obtained boron concentration was higher than expected. TEM analysis, using electron diffraction, showed undoubtedly that the precipitate was Ni23B6 (fcc structure with lattice parameter 1.06 nm), i.e. with an expected boron concentration of 20.7 at.%. Therefore, the composition was measured at various temperatures and using different voltage pulse fractions. From the relatively large precipitate in figure 1, about 1.000 ions were detected for a number of different experimental conditions. The results are presented in figure 2. It is obvious that the obtained boron concentration was strongly dependent on the specimen temperature and in particular on the pulse fraction. The high values of the boron concentration that were obtained at low pulse fractions and high temperatures must have been a consequence of preferential field evaporation 1141 of nickel. Boron has a high evaporation field El41 and has often been shown to image brightly, e.g. in NiAl[15] and NiqMo [16], and therefore it is expected that its content will be too high if preferential evaporation occurs [17].

It is also interesting to note that no complex ions were detected, contrary to what has been observed in analysis of boron-containing NiqMo, where nickel and boron formed compound ions, such as NiB and Nil32 [16]. The result is not particularly surprising, because the chemical bonding between nickel and boron should be different in the two phases.
Figure 1: Field ion images of a darkly appearing intergranular Ni23B6 precipitate (mowed) in Alloy B, obtained using neon as imaging gas. Before imaging the specimen was field evaporated using a pulse fraction of 15% and 25% in a) and b), respectively. The large, bright spots in the precipitate region most probably originated from boron atoms. The material was heat treated at 700°C for 10 h.
Figure 2: Variation of boron concentration in NiZ3B6 with the experimental conditions. Correct composition at 80 K is obtained for a pulse fraction of 25%. At 40 K the optimum pulse fraction is 20%.
35 - @ - 2 30: 6 : B - 1 25-
3 : 5 : $ 2 0 -
15
3.2 Field ion microscopy of precipitates
Three types of intergranular precipitates have been previously observed by FIM in this material [S]: Cr7C3, Ni23B6 and a chromium horide, probably of type Cr7B3 [4]. The latter phase was observed only occasionally. In the field ion image, Cr7C3 appeared dark with respect to the matrix and Cr7B3 bright. Previously, the authors have reported that Ni23B6 gives bright contrast [S]. However, recent analyses have shown that precipitates rich in nickel and boron can exhibit bright or dark contrast with respect to the matrix. Bright contrast was observed in two different specimens when small (10 nm) precipitates were situated between two grains, figure 3, whereas dark contrast was observed in the images of three large (100 nm) precipitates. An example is presented in figure 1. In these cases one of the grains had been
10 15 20 25 30 30 40 50 GO 70 80 YO Puke fraction (8) Ter~perature (K)
T = 80 K
I I I
I I I
35
C 3 30 - - -
ij 25-
I g 20 - m
IS
Puke = 208
I I 1 I I I I I

C5-250 JOURNAL DE PHYSIQUE IV
electropolished away leaving the precipitate in contact with only one grain. The reason for the difference in contrast is at present not well understood but some possible explanations are discussed below.
Figure 3: Field ion images of two grain boundaries containing brightly appearing precipitates (mowed) in Alloy B, obtained using neon as imaging gas. Before imaging the specimens were field evaporated using pulse fractions of 15% and 20% in a) and b), respectively. The precipitate in a) was a nickel boride. The intergranular precipitation in h) was a mixture of chromium boride and nickel boride. Both materials were heat treated at 700°C for 1 h.
The bright spots appearing in the image of the dark precipitate originate from boron atoms that, as mentioned above, have a high evaporation field and therefore are retained on the surface. The fact that principally only boron atoms are imaged, explains why the density of spots is low in the dark regions of figure 1. The contrast in FIM images may change depending on the experimental conditions used during atom probe analysis [17]. When the applied conditions lead to strong preferential evaporation the density of retained atoms will be higher resulting in a brighter image. The image of a brightly appearing precipitate in figure 3 a) was recorded at 90 K at a voltage equal to the DC voltage reached after atom probe analysis using a pulse fraction of 15%. According to the diagrams in figure 2, this condition results in preferential evaporation and hence gives rise to a brighter image compared to what is obtained when the conditions are optimized. However, the darkly appearing precipitate remained dark with respect to the matrix independently of the used pulse fraction, see figure 1. This indicates that the marked difference in contrast between the precipitates in figure 1 and figure 3 was not due to preferential evaporation effects.
The contrast of FIM images depends also on temperature and DC voltage [14]. The observed contrast of the precipitate in figure 1 did not appreciably change when the specimen temperature was varied between 60 K and 80 K. The dark contrast, with respect to the matrix, also remained when the DC voltage was increased from a low value, giving rise to practically no contrast, to a voltage where DC evaporation occurred for both matrix and precipitate. Therefore, it is concluded that the difference in contrast between dark and bright precipitates can not simply be explained by differences in experimental conditions.
One possible explanation for the different contrast of the precipitates would be a difference in their chemistry. However, the compositions of bright and dark precipitates obtained using similar experimental conditions are not significantly different (see table 3) and close to this expected for Ni23B6. This is the only type of nickel-rich precipitate observed in the material in our TEWEDX investigations of extraction replicas and also according to the investigation by Kruger and Was of a similar material [4]. The observed boron concentration is also close to this of Ni3B, which is a stable phase in the binary nickel-boron system [18]. However, this phase has never been observed in the investigated type of material. The only other boride discovered in similar nickel base alloys is M3B2 [19], which has a much higher boron content than these obtained in our study. Analysis of electron diffraction from large, darkly appearing precipitates confinned that they have the same structure as Ni23B6. On the other hand, the structure of the brightly appearing precipitates could not be undoubtedly determined from electron diffraction, hecause of their small size. It might then be possible that these small precipitates are precursors of larger Ni23B6 with a similar composition hut with a different structure. If this is true, the observed difference in contrast of the
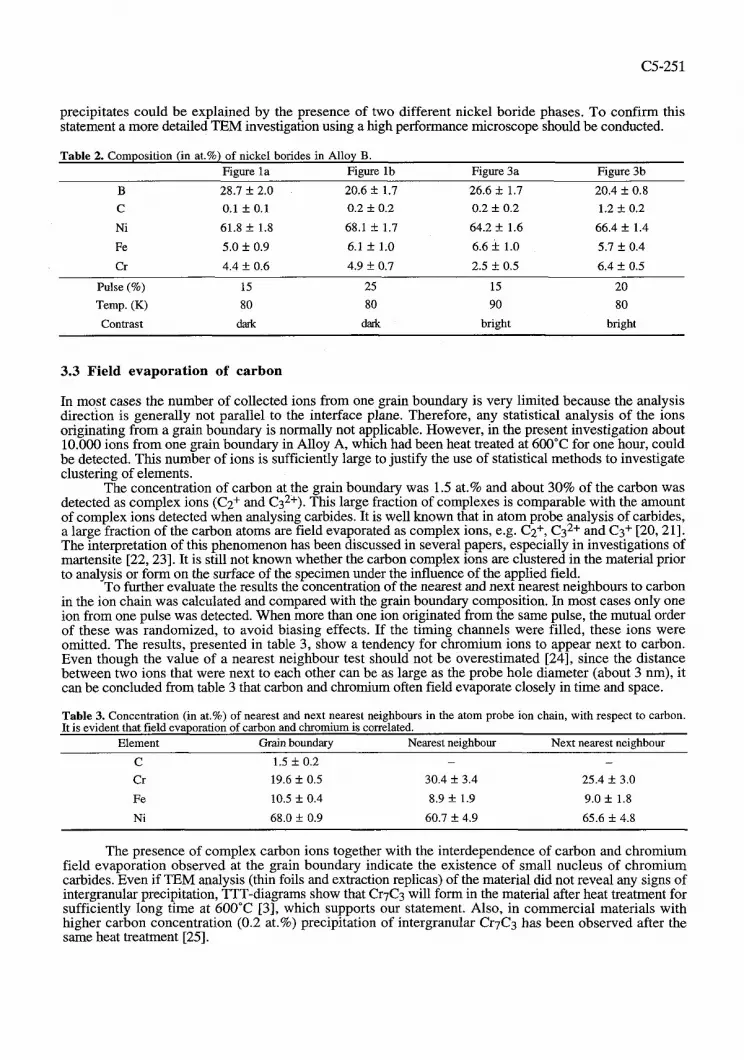
precipitates could be explained by the presence of two different nickel boride phases. To confirm this statement a more detailed TEM investigation using a high performance microscope should be conducted.
Table 2. Composition (in at.%) of nickel borides in Alloy B. Figure la Figure lb Figure 3a Figure 3b
B 28.7 + 2.0 20.6 + 1.7 26.6 + 1.7 20.4 f 0.8
C 0.1 f 0.1 0.2 f 0.2 0.2 f 0.2 1.2 + 0.2
Ni 61.8 + 1.8 68.1 f 1.7 64.2 + 1.6 66.4 f 1.4
Fe 5.0 + 0.9 6.1 + 1.0 6.6 + 1.0 5.7 f 0.4
Cr 4.4 + 0.6 4.9 + 0.7 2.5 + 0.5 6.4 f 0.5
Pulse (%) 15
Temp. (K) 80
Contrast dark
25
80
dark
15 20
90 80
bright bright
3.3 Field evaporation of carbon
In most cases the number of collected ions from one grain boundary is very limited because the analysis direction is generally not parallel to the interface plane. Therefore, any statistical analysis of the ions originating from a grain boundary is normally not applicable. However, in the present investigation about 10.000 ions from one grain boundary in Alloy A, which had been heat treated at 600°C for one hour, could be detected. This number of ions is sufficiently large to justify the use of statistical methods to investigate clustering of elements.
The concentration of carbon at the grain boundary was 1.5 at.% and about 30% of the carbon was detected as complex ions (C2+ and C32+). This large fraction of complexes is comparable with the amount of complex ions detected when analysing carbides. It is well known that in atom probe analysis of carbides, a large fraction of the carbon atoms are field evaporated as complex ions, e.g. C2+, C32+ and C3+ [20,21]. The interpretation of this phenomenon has been discussed in several papers, especially in investigations of martensite [22,23]. It is still not known whether the carbon complex ions are clustered in the material prior to analysis or form on the surface of the specimen under the influence of the applied field.
To further evaluate the results the concentration of the nearest and next nearest neighbours to carbon in the ion chain was calculated and compared with the grain boundary composition. In most cases only one ion from one pulse was detected. When more than one ion originated from the same pulse, the mutual order of these was randomized, to avoid biasing effects. If the timing channels were filled, these ions were omitted. The results, presented in table 3, show a tendency for chromium ions to appear next to carbon. Even though the value of a nearest neighbour test should not be overestimated [24], since the distance between two ions that were next to each other can be as large as the probe hole diameter (about 3 nm), it can be concluded from table 3 that carbon and chromium often field evaporate closely in time and space.
Table 3. Concentration (in at.%) of nearest and next nearest neighbours in the atom probe ion chain, with respect to carbon. It is evident that field evaporation of carbon and chromium is correlated.
Element Grain boundarv Nearest neighbour Next nearest neighbour
The presence of complex carbon ions together with the interdependence of carbon and chromium field evaporation observed at the grain boundary indicate the existence of small nucleus of chromium carbides. Even if TEM analysis (thin foils and extraction replicas) of the material did not reveal any signs of intergranular precipitation, TTT-diagrams show that Cr7C3 will form in the material after heat treatment for sufficiently long time at 600°C [3], which supports our statement. Also, in commercial materials with higher carbon concentration (0.2 at.%) precipitation of intergranular Cr7C3 has been observed after the same heat treatment [25].

C5-252 JOURNAL D E PHYSIQUE IV
4. CONCLUSIONS
(i) Atom probe analysis of Ni23B6 is sensitive to preferential field evaporation of nickel. At 80 K a pulse fraction of 25% gives the expected composition, whereas at 40 K a pulse fraction of 20% is sufficient. (ii) Intergranular nickel borides can appear bright or dark in FIM images, with respect to the matrix. (iii) Nucleation of intergranular chromium carbides occurs in less than one hour at 600°C.
Acknowledgement This work was supported by Swedish Research Council for Engineering Science (TFR).
References [I] Was G.S., Corrosion 46 (1990) 319-330. [2] Bruemmer S.M. and Was G.S., J. Nucl. Mat. 216 (1994) 348-363. [3] Scarberry R.C., Pearman S.C. and Crum J.R., Corrosion 32 (1976) 401-406. [4] Kruger R.M. and Was G.S., Metall. Trans. A 19 (1988) 2555-2566. [5] Thuvander M. and Stiller K., Appl. Sur$ Sci. 87/88 (1995) 251-256. [6] Thuvander M., Stiller K., Blavette D. and Menand A., Appl. Sur$ Sci. 94/95 (1996) 343-350. [7] Stiller K., Nilsson J.-0. and Norring K., Metall. Trans. A 26 (1995) 1-15. [8] Stiller K., Surf Sci. 266 (1992) 402-408. [9] AndrCn H.-0. and NordCn H., Scand. J. Metallurgy 8 (1979) 147-152. [lo] AndrCn H.-O., J. Phys. (Paris) 47-C7 (1986) 483-488. [I 11 Rolander U. and AndrCn H.-O., Sur$ Sci. 246 (1991) 390-395. [12] Henjered A. and NordCn H., J. Phys. E 16 (1983) 617. [13] Alvensleben L.v., J. Phys. (Paris) 49-C6 (1988) 335-340. [14] Miller M.K. and Smith G.D.W., Atom Probe Microanalysis (Mater. Res. Soc., Pittsburgh, PA, 1989) pp. 61-95. [15] Jayaram R. and Miller M.K., Sur$ Sci. 266 (1992) 3 10-3 15. [16] Yamamoto M., Sugiyama A., Matsushima H., Uemori R. and Morikawa H., Sur$ Sci. 266 (1992) 322-327. [17] Miller M.K. and Jayaram R., Sur$ Sci. 266 (1992) 458-462. [I81 Smithells C.J., Metals Reference Book, 5th ed. (Buttenvorths, London, 1976) p. 11-101. [19] Collins H.E., Trans. ASM 62 (1969) 82-104. [20] Rolander U. and AndrCn H.-O., J. Phys. (Paris) 50-C8 (1989) 371-376. [21] Sha W., Chang L., Smith G.D.W., Cheng L. and Mittermeijer E.J., S u ~ Sci. 266 (1992) 416-423. [22] Miller M.K., Beaven P.A., Brenner S.S. and Smith G.D.W., Metall. Trans. A 14 (1983) 1021- 1024. [23] Olsen G.B. and Cohen M., Metall. Trans. A 14 (1983) 1057-1065. [24] Miller M.K., Beaven P.A. and Smith G.D.W., Metall. Trans. A 12 (1981) 1197-1204. [25] Airey G.P., Metallography 13 (1980) 21-41.