omasp | annual report 2021
TRANSCRIPT

Annual Report2021
ContentsOmaSp in brief
CEO Pasi Sydänlammi 3
Investor information 6
Key figures 8
A profitably growing Finnish bank 9
At the heart of the strategy 11
Efficient sales and service network 12
Comprehensive banking services 13
From a local savings bank to the fastest growing bank in the Nordic countries 14
Corporate Governance
Board of Directors 15
Board Committees 16
CEO and Management Team 17
Members of the Group's Management team 18
Report of Board of Directors 20
Strategy and financial goals 21
The company’s operation 22
Operating environment 25
Result 27
Balance sheet 30
Deposit Guarantee Fund and Investors’ Compensation Fund 31
The Group’s capital adequacy and risk management 32
Resolutions of the General Annual Meeting 37
Administration and personnel 38
Corporate social responsibility and sustainability 39
Significant events after the period 40
Outlook for 2022 41
The Group’s Financial Statements 43
Parent Company’s Notes 111
Signatures on the Financial Statements and the Annual Report 150
Auditor’s Report 151
Corporate Social Responsibility Report 155
Survey of impacts and risks related to climate change 176
Carbon Footprint Report 2021 181
The Annual Report 2021 is a translation of the original Finnish version "Vuosikertomus 2021".
If discrepancies occur, the Finnish version is dominant.
Ann
ual R
epor
t 2
021
2 Contents OmaSp in brief Corporate Governance Report of Board of Directors Financial
StatementsCorporate Social
Responsibility Report
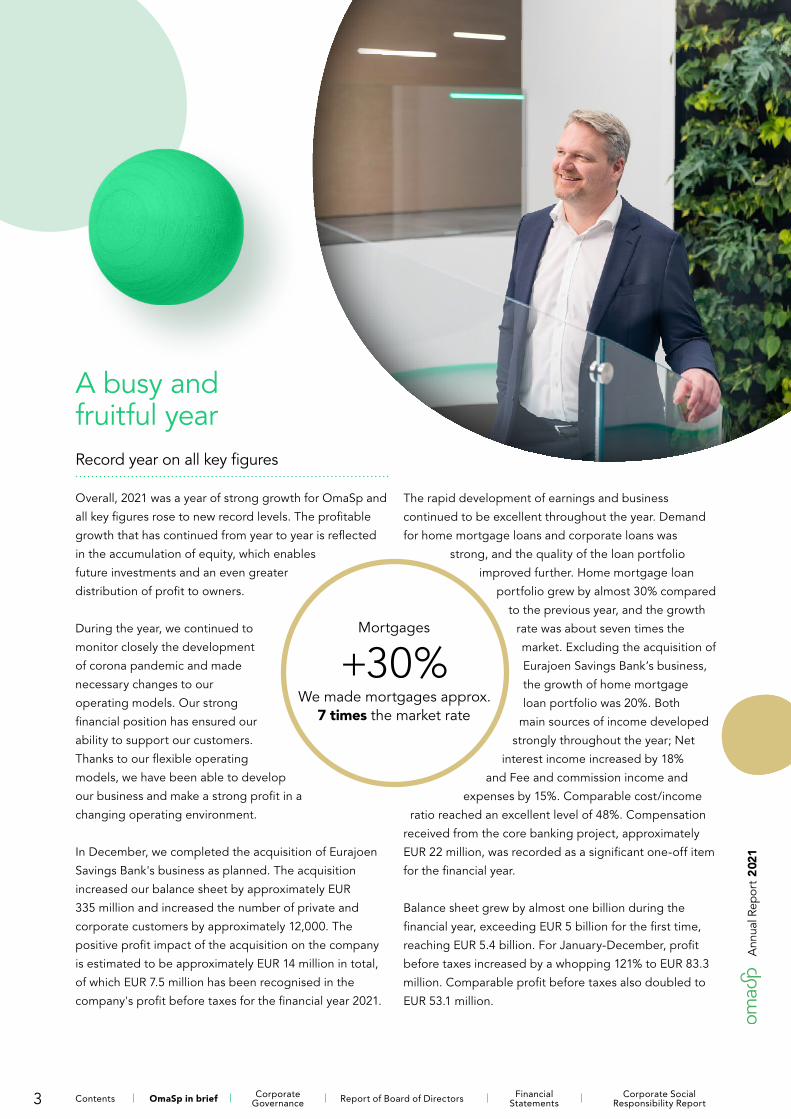
A busy and fruitful yearRecord year on all key figures
Overall, 2021 was a year of strong growth for OmaSp and
all key figures rose to new record levels. The profitable
growth that has continued from year to year is reflected
in the accumulation of equity, which enables
future investments and an even greater
distribution of profit to owners.
During the year, we continued to
monitor closely the development
of corona pandemic and made
necessary changes to our
operating models. Our strong
financial position has ensured our
ability to support our customers.
Thanks to our flexible operating
models, we have been able to develop
our business and make a strong profit in a
changing operating environment.
In December, we completed the acquisition of Eurajoen
Savings Bank's business as planned. The acquisition
increased our balance sheet by approximately EUR
335 million and increased the number of private and
corporate customers by approximately 12,000. The
positive profit impact of the acquisition on the company
is estimated to be approximately EUR 14 million in total,
of which EUR 7.5 million has been recognised in the
company's profit before taxes for the financial year 2021.
The rapid development of earnings and business
continued to be excellent throughout the year. Demand
for home mortgage loans and corporate loans was
strong, and the quality of the loan portfolio
improved further. Home mortgage loan
portfolio grew by almost 30% compared
to the previous year, and the growth
rate was about seven times the
market. Excluding the acquisition of
Eurajoen Savings Bank’s business,
the growth of home mortgage
loan portfolio was 20%. Both
main sources of income developed
strongly throughout the year; Net
interest income increased by 18%
and Fee and commission income and
expenses by 15%. Comparable cost/income
ratio reached an excellent level of 48%. Compensation
received from the core banking project, approximately
EUR 22 million, was recorded as a significant one-off item
for the financial year.
Balance sheet grew by almost one billion during the
financial year, exceeding EUR 5 billion for the first time,
reaching EUR 5.4 billion. For January-December, profit
before taxes increased by a whopping 121% to EUR 83.3
million. Comparable profit before taxes also doubled to
EUR 53.1 million.
Mortgages
+30%We made mortgages approx.
7 times the market rate
3
Ann
ual R
epor
t 2
021
Contents OmaSp in brief Corporate Governance Report of Board of Directors Financial
StatementsCorporate Social
Responsibility Report

Investments in customer experience development
Our key aim is to serve our customers personally and
to be local and close in both digital and traditional
service channels. Significant investments have been
made, among other things, in cloud and data security
capabilities, mobile development and
extensively to system development. We
introduced to our customers a new
type of online conferencing service
as well as an OmaPostilaatikko
mailbox to facilitate secure
communication between the
customer and the bank. The
investments made will improve
customer experience, bring
immediate efficiency to our
operations and strengthen our
competitiveness even in the future.
With the acquisition of Eurajoen Savings Bank's
business, our branch network expanded in Satakunta
region. Now OmaSp's branches can also be found in Pori,
Rauma and Eurajoki.
Driven by strong growth, we have been able to make
further investment again in the wellbeing of our
personnel. In autumn of 2021, we launched an extensive
training program for the entire organisation, On the
road to a winning culture, with the aim of clarifying the
organisation's operating models and developing
managerial work.
We ensured our ability to meet the
increased demand of our customers
and issued two bonds during the
year. In June, a covered bond of
EUR 150 million and an unsecured
senior bond of EUR 200 million in
November.
Our cooperation with the European
Investment Fund (EIF) continued. We
signed a new EUR 150 million guarantee
agreement provided by the European Guarantee
Fund (EGF). It will enable us to support around 500
Finnish small and medium-sized enterprises over the
financial crisis caused by corona.
Net interest income
+18% Fee and commission income
+15%
Both main sources of income, Net interest income and Fee and commission income developed strongly throughout the year.
4
Ann
ual R
epor
t 2
021
Contents OmaSp in brief Corporate Governance Report of Board of Directors Financial
StatementsCorporate Social
Responsibility Report

Increasing dividend for the sixth year in a row
The ever-strengthening profitability enables a growing
dividend to owners. Dividend proposal to the Annual
General Meeting is record high, totalling EUR 0.50 per
share. In accordance with the Board's profit distribution
proposal, an actual dividend of EUR 0.30 per share is
proposed based on the result of continuing operations
for the last financial year, and an additional dividend of
EUR 0.20 per share is proposed due to significant one-off
items last year.
In the coming years, the company's use of capital will
become even more efficient with IRB methods. OmaSp
has been preparing the application of the IRB method
in capital adequacy calculations for a long time, and
we submitted an application for a permit to the Finnish
Financial Supervisory Authority in early February. It
is also important to us that the application of the IRB
method improves risk management and raises OmaSp to
a comparable position with benchmark banks.
Excellent customer and personnel experience as the basis for profitable growth
Our operation is based on excellent personnel and
customer experience, and both components are at
record highs as studied. OmaSp has been one of
the most profitable and efficient banks in the Nordic
countries in recent years, and we want to cherish it in
the future as well. We are following with great interest
the ongoing changes and possible restructuring in the
financial sector. In line with our earnings guidance, we
expect OmaSp's profitable growth to remain strong in
2022.
Warm thanks to customers, personnel,
owners and partners for 2021!
Pasi Sydänlammi
CEO
5
Ann
ual R
epor
t 2
021
Contents OmaSp in brief Corporate Governance Report of Board of Directors Financial
StatementsCorporate Social
Responsibility Report

Investor informationCalendar 2022
30 Annual General Meeting 2022
2 Interim Report January–March 2022
1 Interim Report January–June 2022
31 Report January–September 2022
Capital and Risk Management Report
Oma Savings Bank Plc's internal control, risk management
and risks are described in more detail in the Capital and
Risk Management Report 2021, published as a separate
report. The report is available on the company's website
www.omasp.fi/investors
Share Register
The shares of Oma Savings Bank Plc are maintained by
Euroclear Finland Oy. Issues relating to share information
are managed by Oma Savings Bank Plc
Helena Juutilainen, Chief Legal Officer,
phone +358 40 580 6401.
Annual General Meeting 2022
Oma Savings Bank Plc's Annual General Meeting will
be held on Wednesday 30 March 2022 at 13 pm Finnish
time at Oma Savings Bank Plc's Helsinki branch office
(Kluuvikatu 3, 7th floor).
Shareholders of the company and their representatives
may attend the meeting and exercise their shareholders
rights only by voting in advance and by submitting
counterproposals and questions in advance. It is not
possible to attend the Annual General Meeting in
person at the meeting place.
Shareholder, who is registered in the company's register
of shareholder maintained by Euroclear Finland Ltd as
at 18 March 2022, has the right to participate in the
Annual General Meeting. A shareholder, whose shares
are registered in his/her personal Finnish book-entry
account, is registered in the shareholder's register of the
company.
More detailed registration and voting instructions
for the Annual General Meeting can be found on the
company's website sijoittaminen.omasp.fi/en/ general-
meeting-2022
Oma Savings Bank follows the official instructions in all
arrangements and updates the intructions for the Annual
General Meeting if the situation so requires. Participants
in the Annual General Meeting are asked to follow the
company's website sijoittaminen.omasp.fi/en/general-
meeting-2022 for any additional intructions or changes.
March
May
August
October
6
Ann
ual R
epor
t 2
021
Contents OmaSp in brief Corporate Governance Report of Board of Directors Financial
StatementsCorporate Social
Responsibility Report
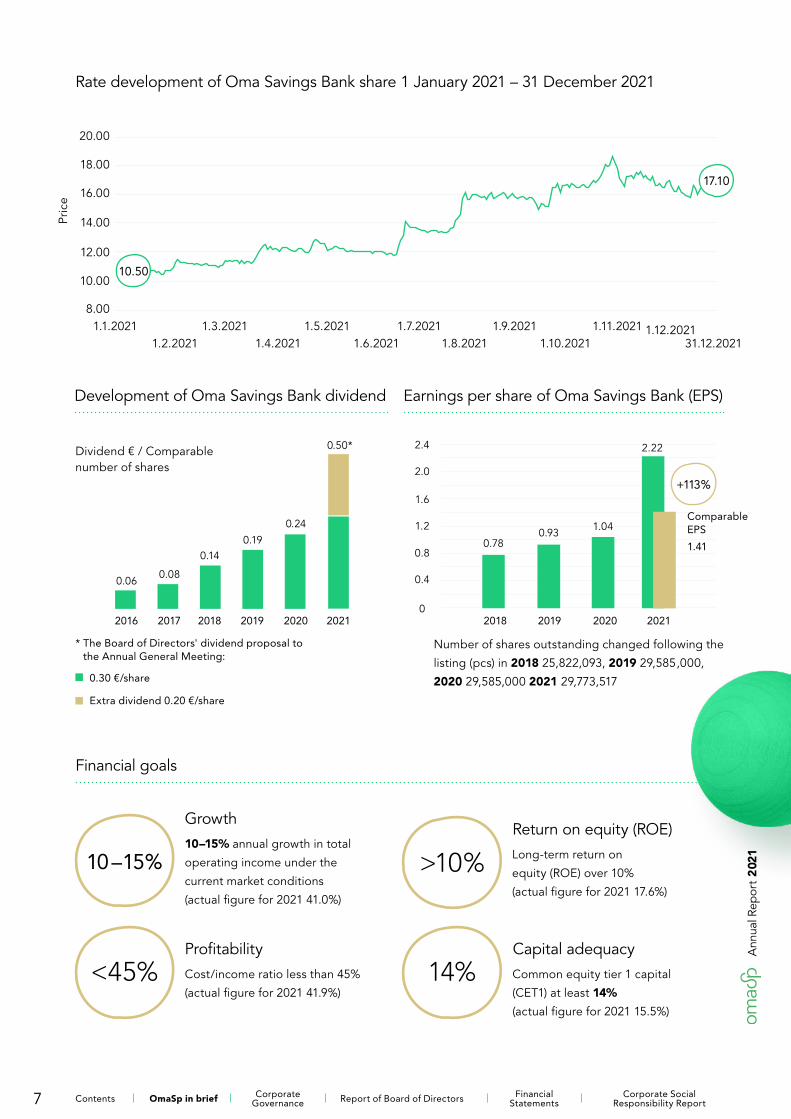
Rate development of Oma Savings Bank share 1 January 2021 – 31 December 2021
1.1.2021
Pric
e
10.50
1.2.20211.3.2021
1.4.20211.5.2021
1.6.20211.7.2021
1.8.20211.9.2021
1.10.20211.11.2021 1.12.2021
31.12.2021
17.10
Development of Oma Savings Bank dividend
Dividend € / Comparable number of shares
2016
0.06
2017
0.08
2018
0.14
2019
0.19
2020
0.24
0.50*
2021
* The Board of Directors' dividend proposal to the Annual General Meeting:
0.30 €/share
Extra dividend 0.20 €/share
Earnings per share of Oma Savings Bank (EPS)
2018
0.78
2019
0.93
2020
1.04
2021
2.22
+113%
Comparable EPS
1.41
Number of shares outstanding changed following the
listing (pcs) in 2018 25,822,093, 2019 29,585,000,
2020 29,585,000 2021 29,773,517
Financial goals
Growth 10–15% annual growth in total
operating income under the
current market conditions
(actual figure for 2021 41.0%)
ProfitabilityCost/income ratio less than 45%
(actual figure for 2021 41.9%)
Return on equity (ROE) Long-term return on
equity (ROE) over 10%
(actual figure for 2021 17.6%)
Capital adequacy Common equity tier 1 capital
(CET1) at least 14%
(actual figure for 2021 15.5%)
10–15%
<45% 14%
>10%
20.00
18.00
14.00
16.00
12.00
10.00
8.00
0
0.4
0.8
1.2
1.6
2.0
2.4
7
Ann
ual R
epor
t 2
021
Contents OmaSp in brief Corporate Governance Report of Board of Directors Financial
StatementsCorporate Social
Responsibility Report
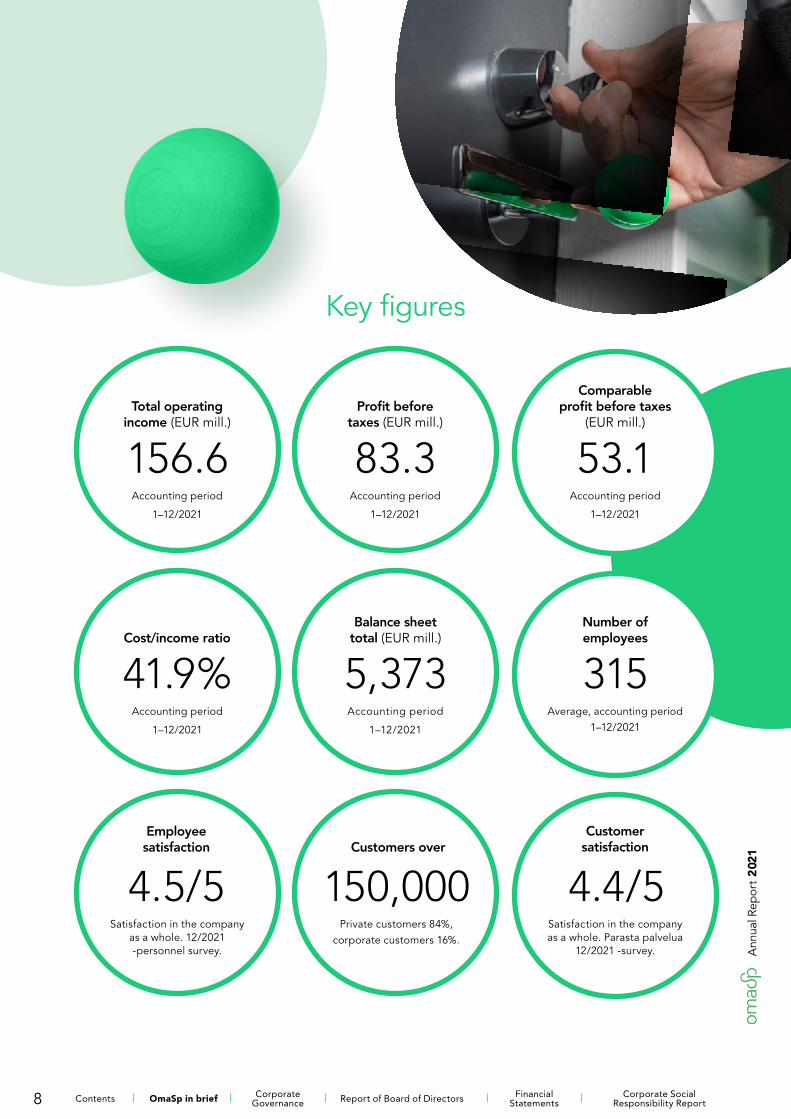
Key figures
Total operating income (EUR mill.)
156.6Accounting period
1–12/2021
Profit before taxes (EUR mill.)
83.3Accounting period
1–12/2021
Comparable profit before taxes
(EUR mill.)
53.1Accounting period
1–12/2021
Cost/income ratio
41.9%Accounting period
1–12/2021
Balance sheet total (EUR mill.)
5,373Accounting period
1–12/2021
Number of employees
315Average, accounting period
1–12/2021
Employee satisfaction
4.5/5Satisfaction in the company
as a whole. 12/2021 -personnel survey.
Customers over
150,000Private customers 84%,
corporate customers 16%.
Customer satisfaction
4.4/5Satisfaction in the company as a whole. Parasta palvelua
12/2021 -survey.
8
Ann
ual R
epor
t 2
021
Contents OmaSp in brief Corporate Governance Report of Board of Directors Financial
StatementsCorporate Social
Responsibility Report
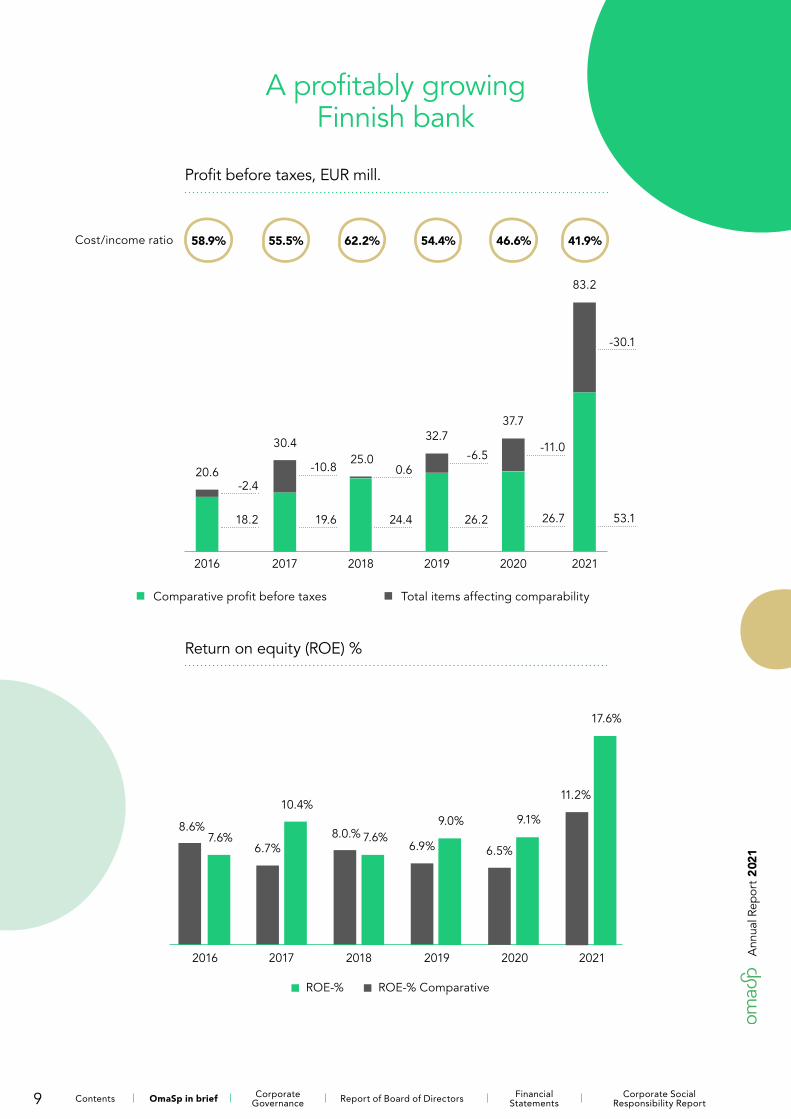
A profitably growing Finnish bank
Profit before taxes, EUR mill.
Cost/income ratio
2016
58.9%
Total items affecting comparabilityComparative profit before taxes
-2.4
18.2
20.6
2017
55.5%
-10.8
19.6
30.4
2018
62.2%
0.6
24.4
25.0
2019
54.4%
-6.5
26.2
32.7
2020
46.6%
-11.0
26.7
37.7
2021
41.9%
-30.1
53.1
83.2
Return on equity (ROE) %
ROE-% ROE-% Comparative
2016
8.6%7.6%
2017
6.7%
10.4%
2018
8.0.% 7.6%
2019
6.9%
9.0%
2020
6.5%
9.1%
2021
11.2%
17.6%
9
Ann
ual R
epor
t 2
021
Contents OmaSp in brief Corporate Governance Report of Board of Directors Financial
StatementsCorporate Social
Responsibility Report
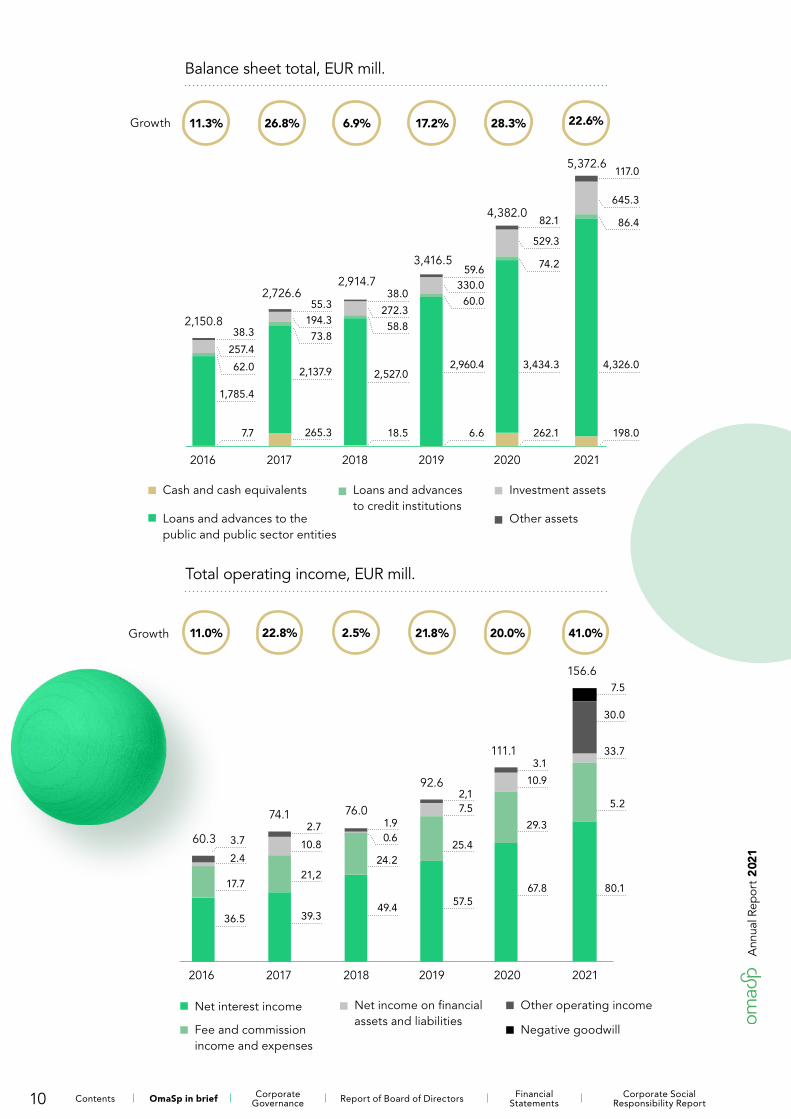
Balance sheet total, EUR mill.
2016
Cash and cash equivalents
7.7
Loans and advances to the public and public sector entities
1,785.4
Loans and advances to credit institutions
62.0
Investment assets
257.4
Other assets
38.32,150.8
Growth 11.3%
2017
265.3
2,137.9
73.8
194.3
55.3 2,726.6
26.8%
2018
18.5
2,527.0
58.8
38.0 2,914.7
6.9%
2019
6.6
2,960.4
60.0
330.0 59.6
3,416.5
17.2%
2020
262.1
272.3
3,434.3
74.2
529.3
82.14,382.0
28.3%
2021
198.0
4,326.0
86.4
645.3
117.05,372.6
22.6%
Total operating income, EUR mill.
2016
Net interest income
36.5
Fee and commission income and expenses
17.7
Net income on financial assets and liabilities
Other operating income
2.4
Negative goodwill
3.760.3
Growth 11.0%
2017
39.3
21,2
10.8
2.774.1
22.8%
2018
49.4
24.2
0.61.9
76.0
2.5%
2019
57.5
25.4
7.52,1
92.6
21.8%
2020
67.8
29.3
10.9
3.1111.1
20.0%
2021
80.1
5.2
33.7
30.0
7.5
156.6
41.0%
10
Ann
ual R
epor
t 2
021
Contents OmaSp in brief Corporate Governance Report of Board of Directors Financial
StatementsCorporate Social
Responsibility Report
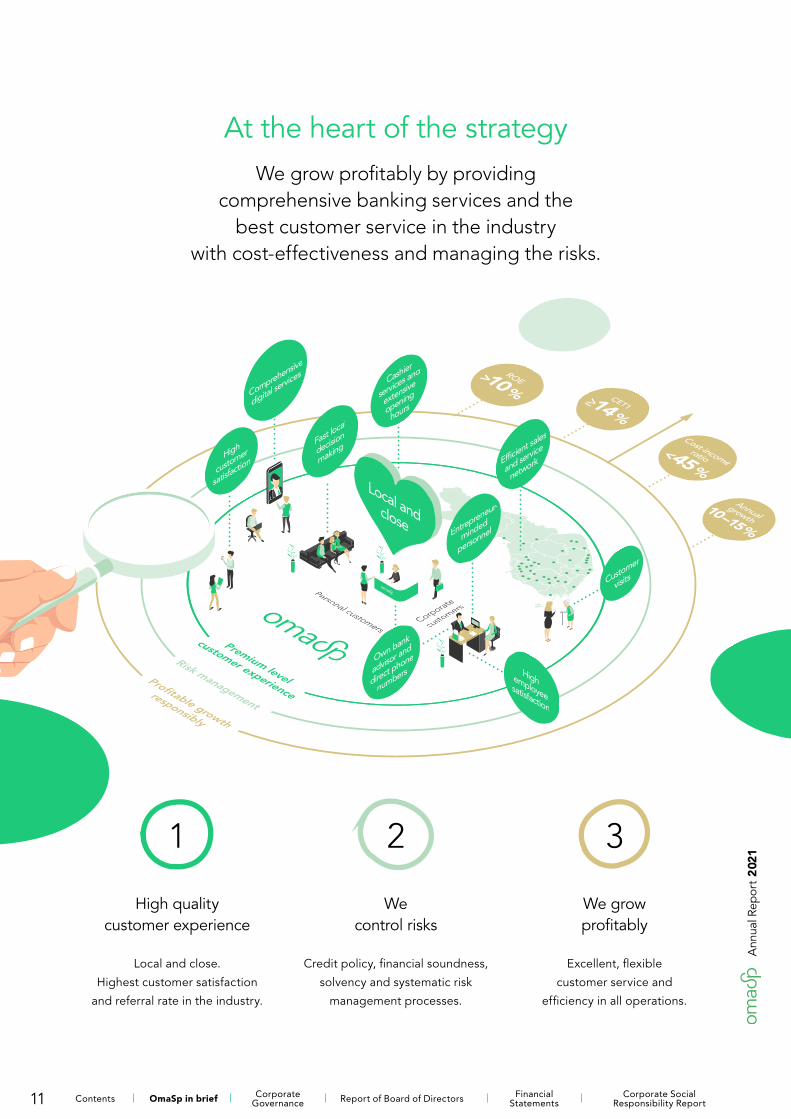
At the heart of the strategyWe grow profitably by providing
comprehensive banking services and the best customer service in the industry
with cost-effectiveness and managing the risks.
1
High quality customer experience
Local and close.
Highest customer satisfaction
and referral rate in the industry.
2
We control risks
Credit policy, financial soundness,
solvency and systematic risk
management processes.
3
We grow profitably
Excellent, flexible
customer service and
efficiency in all operations.
11
Ann
ual R
epor
t 2
021
Contents OmaSp in brief Corporate Governance Report of Board of Directors Financial
StatementsCorporate Social
Responsibility Report

Efficient sales and service network
35OmaSp
branches
OmaVahvistus & OmaAllekirjoitus mobile applications
OmaMobiili mobile bank
Customer service, call center
Online conferencing service
Online bank
Chat, OmaBotti
Google Pay & Apple Pay
OmaPostilaatikko mailbox
Extensive opening hours in branches
Cash service every weekday
Own banking advisor and direct phone numbers
Loan decisions locally
Customer visits
Digital services with the customer
everywhere.
Our goal is to offer the best local banking service local and close to you. Our goal is a high level of service experience and the highest customer satisfaction within the industry
both in digital service channels and bank branches on site.
12
Ann
ual R
epor
t 2
021
Contents OmaSp in brief Corporate Governance Report of Board of Directors Financial
StatementsCorporate Social
Responsibility Report

Comprehensive banking services
At the heart of the service are daily banking services and lending designed for private and corporate customers. We also offer financing, savings,
investment services and legal advisory services.
Services for private customers Services for corporate customers
Accounts, payment cards, cashier and payment services,and
comprehensive digital services. Daily banking
Corporate accounts, payment, invoice and payment transaction services, money services,
Corporate Netbank and other digital trading services.
A broad selection of loans from home loans to consumer credit and payment cards with credit facilities. Guarantee solutions also in
collaboration with partners.Loans, financing
and lending
Extensive financial services for financing business and investments, bank guarantees
as well as guarantee products from the cooperation network.
An extensive range of savings products from savings accounts to ASP accounts and time deposits, basket equity linked deposits and different types of savings insurance. Shares, funds and asset management together with
Sp-Fund Management Company and Sp-Life Insurance.
Saving, investments and
asset management
An extensive range of savings products from savings accounts to time deposits, basket equity
linked deposits and different types of savings insurance. Capital redemption contracts and capital redemption operations together with
Sp-Life Insurance.
Mortgages and consumer credit, together with AXA and Insurance Company Garantia
and Sp-Life Insurance. Loan insuranceTo reduce the company's personnel risks.
Inheritance and family-related legal matters.Legal advisory
services
For example establishing a company, taxation and generational handovers.
13
Ann
ual R
epor
t 2
021
Contents OmaSp in brief Corporate Governance Report of Board of Directors Financial
StatementsCorporate Social
Responsibility Report

From a local savings bank to the fastest growing bank in
the Nordic countries
Savings Bank operations commenced since 1875–
Formation of OmaSp
2010
Balance sheet total, EUR billion
0.333
Merger of Töysän Säästöpankki and Kuortaneen Säästöpankki
2011
0.361
2012
0.393
Building nationwide operations
2013
0.745
Parkanon Säästöpankki
2014
1.618
Suodenniemen Säästöpankki
Etelä-Karjalan Säästöpankki
Kantasäästöpankki
2015
1.935
Joroisten Osuuspankki
Pyhäselän Osuuspankki
2016
2.151
SAV-rahoitus
+11%
Development of
business and fund-raising
2017
2.727
S-Pankki’s SME, agriculture and forestry business
Expansion in Lahti and Jyväskylä
+27%
2018
2.915
Listing on Helsinki Stock Exchange
Figure Taloushallinto Oy
+7%
2019
3.417
10 y
Expansion in Greater Helsinki, Turku and Oulu
Selling of shareholding in Oy Samlink Ab
GT Invest Oy
+17%
2020
4.382
+28%
2021
5.373
Eurajoen Säästöpankki
+23%
14
Ann
ual R
epor
t 2
021
Contents OmaSp in brief Corporate Governance Report of Board of Directors Financial
StatementsCorporate Social
Responsibility Report

Board of DirectorsThe Board of Directors shall represent the bank and
direct its activities in accordance with the law and its
Articles of Association.
Board of Directors is responsible for the bank’s
management and for ensuring that the activities are
properly organised. The Board of Directors is also
responsible for far-reaching operational and strategic
policies and for ensuring the adequacy of risk control and
the functionality of management systems. The Board is
also responsible for appointing the CEO. The Board of
Directors shall constitute a quorum when more than half
of its members are present.
The assessment of the board members’ independence
is carried out according to the Financial Supervisory
Authority's regulations. When elected, and later on
annually, the Board members must provide a report of
the communities in which they operate. In addition, the
CEO must provide a suitability and reliability report in
accordance with the Financial Supervisory Authority's
regulations when accepting the position.
Board members as of 30 March 2021:
Chairman of the Board Jarmo Salmi
Vice Chairman of the Board Jyrki Mäkynen
Member Aila Hemminki
Member Aki Jaskari
Member Timo Kokkala
Member Jarmo Partanen
Member Jaana Sandström
Jyrki Mäkynen, b. 1964Vice Chairman of the Board, Board member since 2009, Chairman of the Board 2009–2014Master of Science in Economics
Aki Jaskari, b. 1961Board member, Board member since 2014Master of Economic Sciences
Jarmo Partanen b. 1956Board member, Board member since 2021, Chairman of the Board 2014-2019Master of Arts, eMBA,
Commercial Counselor
Jaana Sandström, b. 1963Board member, Board member since 2019Doctor of Science (Technology)
Jarmo Salmi, b. 1963Chairman of the Board, Board member since 2014Master of Laws
Timo Kokkala, b. 1960Board member, Board member since 2014Master of Science in Agriculture and Forestry
Aila Hemminki, b. 1966Board member, Board member since 2017Master of Economic Sciences
15
Ann
ual R
epor
t 2
022
Contents OmaSp in brief Corporate Governance Report of Board of Directors Financial
StatementsCorporate Social
Responsibility Report
Board Committees
Audit Committee
The Board of Directors performs the regulatory duties
assigned to the Audit Committee. The Board of Directors
has assessed that the creation of a separate audit
committee is not necessary at this stage, taking into
account the industry.
Remuneration committee
The remuneration committee consists of at least three
members, elected annually from amongst and by the
Board of Directors. The Board of Directors specifies the
tasks of the remuneration committee within the rules of
procedure adopted by the Board of Directors. The tasks
of the remuneration committee consist of the preparation
of the compensation and other economic benefits of the
CEO and other management, the preparation of matters
relating to the bank's incentive schemes, the evaluation
of the CEO’s and management’s compensation, caring
for the appropriateness of the incentive schemes, the
preparation of appointment matters in relation to the
CEO and other management as well as the surveying
of their successors and the development of the
remuneration of the personnel and the organisation.
The members of the Remuneration Committee as of 30 March 2021:
Jarmo Salmi
Jyrki Mäkynen
Aila Hemminki
Nomination Committee
The task of the Shareholders' Nomination Committee
is to prepare proposals regarding the election of
the members of the Board of Directors and their
compensations for the next annual general meeting and,
if needed, for the next extraordinary general meeting.
The company's five largest shareholders each have the
right to appoint one representative to the Nomination
Committee. Should a shareholder not wish to use his or
her appointment right, the right will be transferred to
the next largest shareholder, who otherwise would not
have the right to appoint a representative. The largest
shareholders are defined in the bank's shareholders’
register based on their share of ownership on 1 June
preceding the general meeting. The Nomination
Committee should give their recommendations
regarding the members of the Board of Directors and
their respective compensations to the Board of Directors
by the end of January preceding the annual general
meeting. In the case of an extraordinary general meeting,
the Nomination Committee should accordingly give their
respective recommendations well in advance before
the general meeting, taking into account applicable
regulations.
The Chairman of the Board of Directors acts as the
convener and attends the meetings of the Nomination
Committee as a specialist. The Nomination Committee
conducts its tasks in accordance with the rules of
procedure adopted by the general meeting.
The members of the Shareholders'
Nomination Committee are:
Raimo Härmä (Etelä-Karjalan Säästöpankkisäätiö)
Ari Lamminmäki (Parkanon Säästöpankkisäätiö)
Aino Lamminmäki (Töysän Säästöpankkisäätiö)
Jukka Sysilampi (Kuortaneen Säästöpankkisäätiö)
Jukka Kuivaniemi (Hauhon Säästöpankkisäätiö)
The company has published a separate Corporate Governance Statement, which is available on
the company's website https://sijoittaminen.omasp.fi/en.
16
Ann
ual R
epor
t 2
022
Contents OmaSp in brief Corporate Governance Report of Board of Directors Financial
StatementsCorporate Social
Responsibility Report

CEO and Management TeamOma Savings Bank Plc Group's Management team consists of seven members, including the CEO.
The CEO manages and develops the bank's business
and is in charge of the day to day administration of the
bank in accordance with the instructions of the Board of
Directors. The CEO presents matters and reports to the
Board of Directors. The CEO carries out the day to day
administration in accordance with the instructions of the
Board of Directors and is responsible for the appropriate
arrangement of the control of accounts and finances.
The assessment of the CEO's independence is carried
out according to the Financial Supervisory Authority’s
regulations. When elected, and later on annually, the
CEO must provide a report of the communities in which
he/she operates. In addition, the CEO must provide
a suitability and reliability report in accordance with
the Financial Supervisory Authority's regulations when
accepting the position.
The Group's Management team assists the CEO
to manage the bank's operational business, each
member has its own area of responsibility. The Group's
Management team is a decision-making body, assigned
to operational management, financial management,
ICT operations, business development projects, products
and services, communication and risk control-related
issues. Management team meet every two weeks by the
invitation of the CEO and minutes of meetings are held.
Composition of the Group'sManagement Team 2021:
Pasi Sydänlammi
Pasi Turtio
Helena Juutilainen
Sarianna Liiri
Ville Rissanen
Minna Sillanpää
Kimmo Tapionsalo
17
Ann
ual R
epor
t 2
022
Contents OmaSp in brief Corporate Governance Report of Board of Directors Financial
StatementsCorporate Social
Responsibility Report

Members of the Group's Management team
Pasi Sydänlammi, b. 1974CEOMaster of Administrative Sciences, MBA, Harvard Business School Advanced Management Program
Sydänlammi has been the CEO of Oma Savings Bank since 2009. Sydänlammi has served as a representative of Töysän Savings Bank Foundation since 2009 and what before he was the CEO of Töysän Savings Bank 2007–2009. Previously he was the CEO of Lappajärven Osuuspankki 2005–2007, bank manager of Lammin Osuuspankki 2004–2005, Business Development Manager at Savings Banks’ Union Coop 2002–2003, management consultant and project manager at Talent Partner Group 2001–2002 and auditor at KPMG Oy Ab 2000–2001.
Helena Juutilainen, b. 1958Chief Legal OfficerMaster of Laws, trained on the bench
Juutilainen has been the Head of Legal of Oma Savings Bank since 2017. Previously she was the legal counsel of Kuntien Tiera Oy 2010–2017 and the legal counsel of Oy Samlink Ab 1998–2010.
Ville Rissanen, b. 1971Director of Digital Services Master of Economic Sciences
Rissanen has served as the Head of Digital Services at OmaSp since September 2019. Rissanen has worked as IT Director at Aktia Bank Ltd 2004–2019 and as IT Director at Gyllenberg Private Bank Oy 2001–2004.
Kimmo Tapionsalo, b. 1963Chief Risk OfficerMaster of Economic Sciences, eMBA, CBM
Tapionsalo has served as the Chief Risk Officer since 2016, before which he was in risk management positions in the years 2013–2015. Tapion salo has acted as Banking and Corporate Banking Director and Head of Corporate Finance at Kantasäästöpankki Oy in 2010–2013, as Head of Corporate Banking and Investment Manager at Nooa Säästöpankki Oy in 2003–2010, as Head of Bank and Investment Advisor at Aktia Plc in 1998–2003.
Pasi Turtio, b. 1974Deputy CEO, Director of Customer operationsAgrologist
Turtio has been the Deputy CEO since 2009 and the Customer Operations Director since 2018 of Oma Savings Bank what before he worked as regional director 2014–2017, as manager 2008–2014. Turtio has served as the managing director of Kuortaneen Savings Bank Foundation since 2018, before which he served as a representative for Kuortaneen Savings Bank Foundation 2017–2018. Before he worked as bank manager of Lammin Osuuspankki 2005–2008 and as branch manager 2001–2005.
Sarianna Liiri, b. 1981Chief Financial and Administrative OfficerMaster of Economic Sciences, eMBA
Liiri has been the Chief Financial and Administrative Officer of Oma Savings Bank since 2018, prior to which she was the administrative officer 2015–2018 and development manager 2014–2015. Previously she was the account manager of South-Karelian Savings Bank 2006–2014.
Minna Sillanpää, b. 1970Chief Communications OfficerMBA, Industrie- und Aussenhandels assistent, Gross- und Aussenhandelskaufmann, College Degree in Foreign Trade, CBM
Sillanpää has been the Chief Communications Officer of Oma Savings Bank since 2017. Sillanpää was the CEO of the Regional Organization of Enterprises in South Ostrobothnia 2009–2017, CEO of E-P:n Yrittäjien Palvelu Oy 2009–2017, deputy director of South Ostrobothnia Chamber of Commerce 2007–2009, division manager at Berner Oy 2000–2007, and export manager/ division manager at Berner Oy 1996–2000.
Extended Management Team
Extended Management Team acts as a communication channel.
Members of the Extended Management Team in addition to the above:Area Director Rafael Eerola (as of 1 December 2021), Area Director Harri Karjalainen, Director of customer and society Kari Mononen (as of 3 May 2021), Area Director Jarmo Nikunen, Area Director Markus Souru, Director of Corporate Banking Antti Varila and employee representative Joonas Haavisto.
18
Ann
ual R
epor
t 2
022
Contents OmaSp in brief Corporate Governance Report of Board of Directors Financial
StatementsCorporate Social
Responsibility Report
Year 2021 Report of Board of Directors and
Financial Statements
Year 2021 Report of Board of Directors and Financial Statements is a translation of the original Finnish version “Vuoden 2021 hallituksen toimintakertomus ja
tilinpäätös”. If discrepancies occur, the Finnish version is dominant.
Report of Board of Directors 20
Strategy and financial goals 21
The company’s operation 22
Operating environment 25
Result 27
Balance sheet 30
Deposit Guarantee Fund and Investors’ Compensation Fund 31
The Group’s capital adequacy and risk management 32
Resolutions of the General Annual Meeting 37
Administration and personnel 38
Corporate social responsibility and sustainability 39
Significant events after the period 40
Outlook for 2022 41
The Group’s Financial Statements 43
Parent Company’s Notes 111
Signatures on the Financial Statements and the Annual Report 150
Auditor’s Report 151
2
Contents
Report of Board of Directors 3
Strategy and financial goals 3
The company’s operation 4
Operating environment 7
Result 9
Balance sheet 12
Deposit Guarantee Fund and Investors’ Compensation Fund 13
The Group’s capital adequacy and risk management 14 Resolutions of the General Annual Meeting 19
Administration and personnel 20
Corporate social responsibility and sustainability 21
Significant events after the period 22
Outlook for 2022 23
The Group’s Financial Statements 25
Parent Company’s Notes 97
Signatures on the Financial Statements and the Annual Report 132
Auditor’s Report 133
20
Ann
ual R
epor
t 2
021
Contents OmaSp in brief Corporate Governance Report of Board of Directors Financial
StatementsCorporate Social
Responsibility Report
3
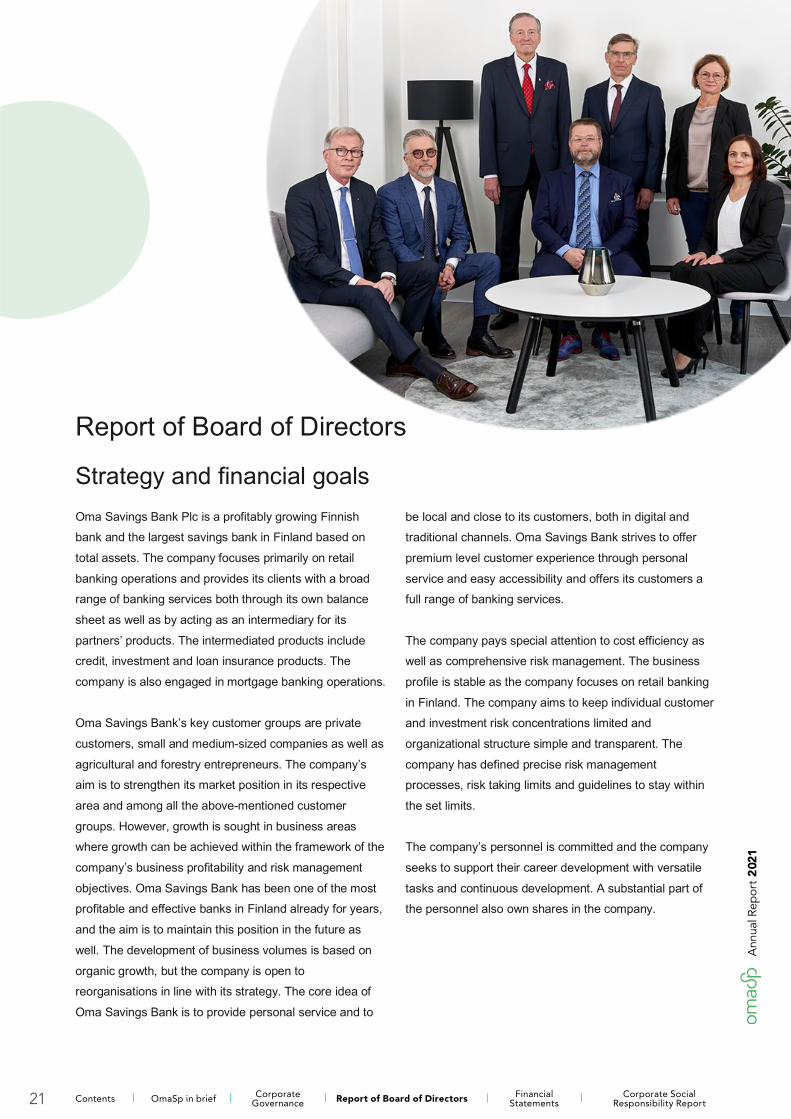
Report of Board of Directors
Strategy and financial goals Oma Savings Bank Plc is a profitably growing Finnish bank and the largest savings bank in Finland based on
total assets. The company focuses primarily on retail
banking operations and provides its clients with a broad range of banking services both through its own balance
sheet as well as by acting as an intermediary for its
partners’ products. The intermediated products include credit, investment and loan insurance products. The
company is also engaged in mortgage banking operations.
Oma Savings Bank’s key customer groups are private
customers, small and medium-sized companies as well as
agricultural and forestry entrepreneurs. The company’s aim is to strengthen its market position in its respective
area and among all the above-mentioned customer
groups. However, growth is sought in business areas where growth can be achieved within the framework of the
company’s business profitability and risk management
objectives. Oma Savings Bank has been one of the most profitable and effective banks in Finland already for years,
and the aim is to maintain this position in the future as
well. The development of business volumes is based on
organic growth, but the company is open to reorganisations in line with its strategy. The core idea of
Oma Savings Bank is to provide personal service and to
be local and close to its customers, both in digital and traditional channels. Oma Savings Bank strives to offer
premium level customer experience through personal
service and easy accessibility and offers its customers a full range of banking services.
The company pays special attention to cost efficiency as well as comprehensive risk management. The business
profile is stable as the company focuses on retail banking
in Finland. The company aims to keep individual customer and investment risk concentrations limited and
organizational structure simple and transparent. The
company has defined precise risk management processes, risk taking limits and guidelines to stay within
the set limits.
The company’s personnel is committed and the company
seeks to support their career development with versatile
tasks and continuous development. A substantial part of the personnel also own shares in the company.
21
Ann
ual R
epor
t 2
021
Contents OmaSp in brief Corporate Governance Report of Board of Directors Financial
StatementsCorporate Social
Responsibility Report
4
The company’s operation Oma Savings Bank offers its customers a full range of
banking services. The company serves its customers
through its branch network as well as comprehensive digital service channels. Oma Savings Bank’s offering to
private customers covers daily banking services, various
financing solutions, saving services, financial services,
insurance, as well as inheritance and family law matters. The range of services to corporate customers covers
payment services and other business daily banking
services, financial services, corporate pension insurance, investment services and legal and other advisory services.
Oma Savings Bank has complemented its own service
offering with services provided by partner companies.
The company's savings and investment product range
includes, in addition to its own products, such as accounts and OmaTuotto deposits, as well as the investment and
savings products of the partners Sp-Rahastoyhtiö Oy and
Sp-Henkivakuutus Oy. The Central Bank of Savings Banks Finland Plc acts as the company’s account
operator. Brokerage services are supplied by
Skandinaviska Enskilda Banken (SEB). At the end of 2021, the customers had EUR 580 million in fund and
insurance savings brokered by the company.
The company’s financial services are complemented by
partner products such as loan insurances
and various conditional guarantees. The company's
partners in offering these financial products include Sp-Henkivakuutus Oy, Axa and insurance company Garantia.
Oma Savings Bank operates as an independent issuer of
Visa cards and finances the cards from its balance sheet.
Acquisition of Eurajoen Savings Bank's business
In accordance with the plan, the company completed the
acquisition of Eurajoen Savings Bank's business in December. The acquisition increased the company's
balance sheet by approximately EUR 335 million and
increased the number of private and corporate customers by approximately 12,000. The positive profit impact of the
acquisition on the company is estimated to be
approximately EUR 14 million in total, of which EUR 7.5
million has been recognised in the company's profit before taxes for the financial year 2021. The rest of the profit
impact is estimated to be recorded over the next five
years. The transaction price was paid in part by cash and, in part, by issuing new shares. The total costs related to
the acquisition of the business were approximately EUR
4.4 million and costs will be for 2021 and early 2022. The acquisition is expected to increase the company's profit
before taxes by EUR 3-5 million annually.
Investments in customer experience development
Oma Savings Bank's key aim is to serve its customers
personally and to be local and close in both digital and
traditional service channels. The company has been
developing its distribution network by investing to the development of digital services, as well as developing its
branch network over the course of the year. In line with the
company's strategy, presence in growth centers is key. The corona pandemic had a large impact on the daily lives
of people and companies during the financial year. Oma
Savings Bank has invested in guaranteeing and promoting safe banking and encouraged customers to take
advantage of digital service channels.
With the acquisition of Eurajoen Savings Bank's business,
the company's branch network expanded to include the
branches of Pori, Rauma and Eurajoki in Satakunta region. The development of the branch network continued
with an extensive renovation of the Parkano branch, which
was completed in late 2021. Investments in branch premises are part of Oma Savings Bank's ongoing
investments in developing the customer experience.
Impacts of the corona pandemic on business
The company has closely monitored the development of
the corona pandemic situation and made the necessary
changes to its operating models. During the early autumn
2021, due to the progress of vaccine coverage, the corona restrictions were lifted, but the restrictions had to be
22
Ann
ual R
epor
t 2
021
Contents OmaSp in brief Corporate Governance Report of Board of Directors Financial
StatementsCorporate Social
Responsibility Report
5
tightened again towards the end of the year due to new
virus variants. The guidelines and recommendations of the
government and other authorities have been applied to customer service and to the personnel’s work. The
precautionary measures undertaken are intended to
secure well-being of personnel and customers and guarantee safe banking. In customer service, remote
banking opportunities and guidance for customers have
been increased. Customers have been served throughout the pandemic, both in branches and through digital
channels during extensive opening hours.
The corona pandemic has not affected the growth of grace
periods during 2021, and there have been no short-term
peaks in demand for them. Nearly all of the pandemic-related grace periods granted in 2020 have already
expired as customers continue to service loans under
normal shortening plans.
During 2020 and the beginning of 2021, the company
made additional credit loss allowances based on
management's judgement, totalling EUR 5.9 million, which predicted growth in credit risk in specific sectors. The
sectors were selected based on both their significance and
the estimated size of the pandemic’s impact. In September, the company decided to release its previous
additional allowance of corona by EUR 2.0 million. The
quality of the company's loan portfolio has remained at a good level throughout the pandemic. The company is
releasing its loss allowance on corona in stages, as the
restrictive measures had to be tightened again towards the end of the year, so the impact on the financial situation will
be seen later. In connection with the corona pandemic,
loss allowances are still available for EUR 3.9 million. The allowances anticipate the effects of the prolongation of the
corona pandemic on company's loan portfolio and seeks
to cover potential credit losses to the extent that the expected credit loss calculation model does not recognise
them. The company continues monitoring the situation
monthly.
Progress of key IT projects
In June 2021, the company announced the termination of
the contract for the core banking platform mutually agreed with Cognizant. Samlink continues as an essential IT
services provider for the company. As part of the
agreement Cognizant paid the company a significant
financial compensation, which had a positive impact of approximately EUR 22 million on company's profit before
taxes. The company has continued to investigate the
renewal of the core banking platform.
Development of digital services has continued, and the
company introduced a new type of online conferencing service as well as an OmaPostilaatikko mailbox to its
customers to facilitate secure communication between the
customer and the bank at the end of the year. During the first quarter of 2022, the company will launch new savings
and investment services in digital channels.
The IRB preliminary study project has progressed as
planned. In February 2022, the company submitted an
application to the Finnish Financial Supervisory Authority
(FIN-FSA) for the application of IRB methods.
The system project to develop functions to prevent money
laundering and terrorist financing is progressing according to plan. The system will be put into production in stages
and the first operations have been put in place in late
2021. The system will be fully operational during 2022. In addition, the company has an ongoing project related to
the development of data warehousing and data analytics
solutions on the basis of which the company will renew amongst other things areas of the regulatory reporting.
Focus on investing in personnel competence is key
The development of personnel has been one of the operational development priorities in the company in
recent years. Oma Saving Bank’s extensive management
and expert training programme, OmaSp Master, was completed in early 2021 for the second programme.
Altogether 10 experts and supervisors graduated from the
training programme. The company carried out the training programme in co-operation with Tampere University and it
was 15 credits. In autumn 2021, the company launched
an extensive organization-wide training programme aimed
at brightening the strategy and operating model of the organization and developing the work of close supervisors.
The training programme will run until autumn 2022 and
23
Ann
ual R
epor
t 2
021
Contents OmaSp in brief Corporate Governance Report of Board of Directors Financial
StatementsCorporate Social
Responsibility Report
6
aims to improve customer satisfaction and personnel
satisfaction, as well as growth in business profitability.
The training program is a significant investment in the development of personnel skills. In addition to ongoing
and regular training, the company offers supervisors and
experts the opportunity to complete licensed real estate agent (LKV) qualification. Investing in young workers
continued through the year. The company offered
internships for university and vocational college students in different units. Several Bachelor’s and Master’s theses
were prepared for the company as part of various
development projects. In the summer of 2021, the company was involved in the Responsible Summer Job
campaign, offering summer employment opportunities for
about 40 young people in the company.
Updating profitability target
The company updated its financial targets as part of its
strategy process in accordance with the guidelines established in connection with the stock exchange listing.
The financial targets and target levels remained largely
unchanged, but the target level for the cost/income ratio was updated to less than 45% as of 1 October 2021.
Issuance of bonds
The company issued two bonds during the year. In November, an unsecured senior bond of EUR 200 million
was issued. In June, a covered bond of EUR 150 million
was issued on same terms as the covered bond maturing on 25 November 2027.
24
Ann
ual R
epor
t 2
021
Contents OmaSp in brief Corporate Governance Report of Board of Directors Financial
StatementsCorporate Social
Responsibility Report
7
Operating environment
The Finnish economy has recovered rapidly from the deep
recession caused by the corona crisis, although the pandemic continues to overshadow the outlook. Private
consumption is growing despite inflation. Finnish exports
are expected to return rapidly to pre-crisis levels although global disruptions in supply chains and component
availability are slowing recovery. The fluctuating disease
situation increases economic uncertainty. Finland's GDP growth was strong in 2021 and strong growth will continue
in 2022. After that, growth is forecasted to a level of close
to the long-term growth rate. The Bank of Finland’s estimate for GDP growth is 3.5% in 2021 and another
2.6% in 2022. (1
The seasonally adjusted savings rate of households decreased still in July-September compared to the
previous quarter and was only 0.6%. The investment rate
of households increased slightly from the previous quarter. The majority of investments of households are in housing
investments. The investment rate in the corporate sector
decreased. (2
According to Statistics Finland, there were 62,000 more
employed and 24,000 fewer unemployed in November than a year ago. In November 2021, the employment rate
was 72.8% (aged 15-64) and the average unemployment
rate was 6.9%. (3
The consumer confidence indicator hit frost in December.
All four components deteriorated. The confidence indicators are an estimate of the own economy now,
expectations of their own economy and the Finnish
economy in 12 months, and the intentions of spending on durable goods in the next 12 months. Expectations about
the current state of Finland's and consumers' own
finances were quiet. However, the estimate of the current
state of the consumer's own economy corresponded to the long-term average. (4
According to Statistics Finland's preliminary data, the prices of old share dwellings rose in November 2021
compared to last year in the largest cities but the rise in
prices has calmed down. Of the large cities, Turku and
Helsinki saw the largest increases in house prices. There was an increase in both apartments and terraced houses.
Prices increased by 3.6% throughout Finland. The number
of home transactions rose across the country in the third quarter from the same time last year by 2.6%. (5 In the
company's view, the business environment in Finland is
still stable in terms of household indebtedness and house prices, but the uncertainty brought by the corona
pandemic has not disappeared from the market.
In November 2021, total number of loans to households
had increased by 4.1% over the previous 12 months. The
mortgage loan portfolio growth was 4.2%. The volume of
corporate loans increased 0.4% in the same period. The volume of households’ deposits grew a total of 6.1% over
a 12-month period. (6
The number of bankruptcies filed in January-November
2021 increased by 10.9% compared to the previous year.
The number of personnel in the companies filing for bankruptcy came to 10,640, i.e. 0.6% more than in the
corresponding period in 2020. (7 The number of new
building permits granted decreased by 8.7% in August-October compared to the previous year and was 9.1
million cubic meters. (8
1) Bank of Finland, Euro & Economy 5/2021. Published on 17 December
2021.
2) Statistics Finland, Household savings rate decline in the third quarter.
Published on 17 December 2021.
3) Statistics Finland, Employment increased, and unemployment
decreased in November. Published on 21 December 2021.
4) Statistics Finland, Consumer confidence fell into freezing temperatures
during Christmas. Published on 27 December 2021.
5) Statistics Finland, Prices of old share dwellings rose in large cities in
November. Published on 30 December 2021.
6) Bank of Finland, MFI balance sheet (loans and deposits) and interest
rates, Mortgage market still brisk in November 2021. Published on 3
January 2022.
7) Statistics Finland, In January-November 2021, the number of
bankruptcies increased by 11 percent from the previous year. Published on
22 December 2021.
8) Statistic Finland, In August-October, cubic volume of building permits
issued lower than a year earlier. Published on 21 December 2021.
25
Ann
ual R
epor
t 2
021
Contents OmaSp in brief Corporate Governance Report of Board of Directors Financial
StatementsCorporate Social
Responsibility Report
8
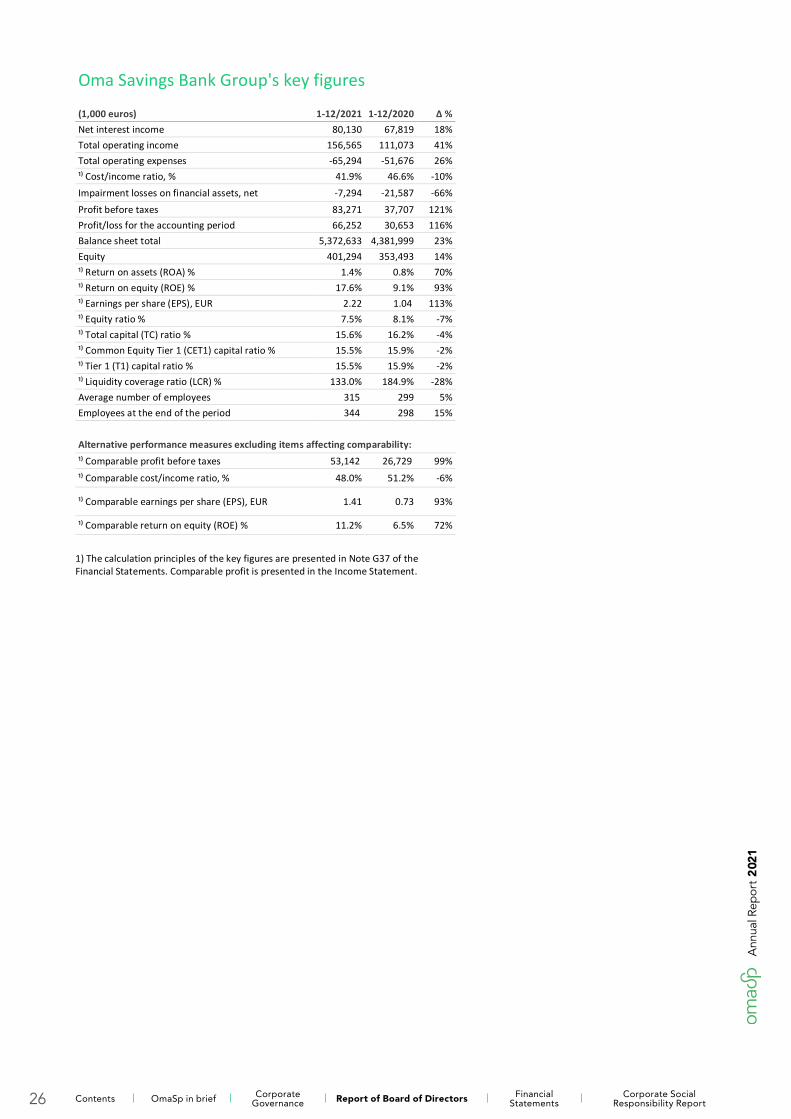
Oma Savings Bank Group's key figures (1,000 euros) 1-12/2021 1-12/2020 Δ % Net interest income 80,130 67,819 18% Total operating income 156,565 111,073 41% Total operating expenses -65,294 -51,676 26% ¹⁾ Cost/income ratio, % 41.9% 46.6% -10% Impairment losses on financial assets, net -7,294 -21,587 -66% Profit before taxes 83,271 37,707 121% Profit/loss for the accounting period 66,252 30,653 116% Balance sheet total 5,372,633 4,381,999 23% Equity 401,294 353,493 14% ¹⁾ Return on assets (ROA) % 1.4% 0.8% 70% ¹⁾ Return on equity (ROE) % 17.6% 9.1% 93% ¹⁾ Earnings per share (EPS), EUR 2.22 1.04 113% ¹⁾ Equity ratio % 7.5% 8.1% -7% ¹⁾ Total capital (TC) ratio % 15.6% 16.2% -4% ¹⁾ Common Equity Tier 1 (CET1) capital ratio % 15.5% 15.9% -2% ¹⁾ Tier 1 (T1) capital ratio % 15.5% 15.9% -2% ¹⁾ Liquidity coverage ratio (LCR) % 133.0% 184.9% -28% Average number of employees 315 299 5% Employees at the end of the period 344 298 15%
Alternative performance measures excluding items affecting comparability: ¹⁾ Comparable profit before taxes 53,142 26,729 99%
¹⁾ Comparable cost/income ratio, % 48.0% 51.2% -6%
¹⁾ Comparable earnings per share (EPS), EUR 1.41 0.73 93%
¹⁾ Comparable return on equity (ROE) % 11.2% 6.5% 72%
1) The calculation principles of the key figures are presented in Note G37 of the Financial Statements. Comparable profit is presented in the Income Statement.
26
Ann
ual R
epor
t 2
021
Contents OmaSp in brief Corporate Governance Report of Board of Directors Financial
StatementsCorporate Social
Responsibility Report
9
Result 1–12 / 2021 The Group’s profit before taxes for January-December
was EUR 83.3 (37.7) million and the profit for the period
was EUR 66.3 (30.7) million. The cost/income ratio was 41.9 (46.6)%.
Comparable profit before taxes in January-December
amounted to EUR 53.1 (26.7) million and the comparable cost/income ratio was 48.0 (51.2)%. The comparable profit
before taxes has been adjusted for the net income on
financial assets and liabilities, the items recorded for the termination of the contract regarding the core banking
project as well the expenses related to the acquisition of
Eurajoen Savings Bank's business and negative goodwill recognised on the acquisition.
Income
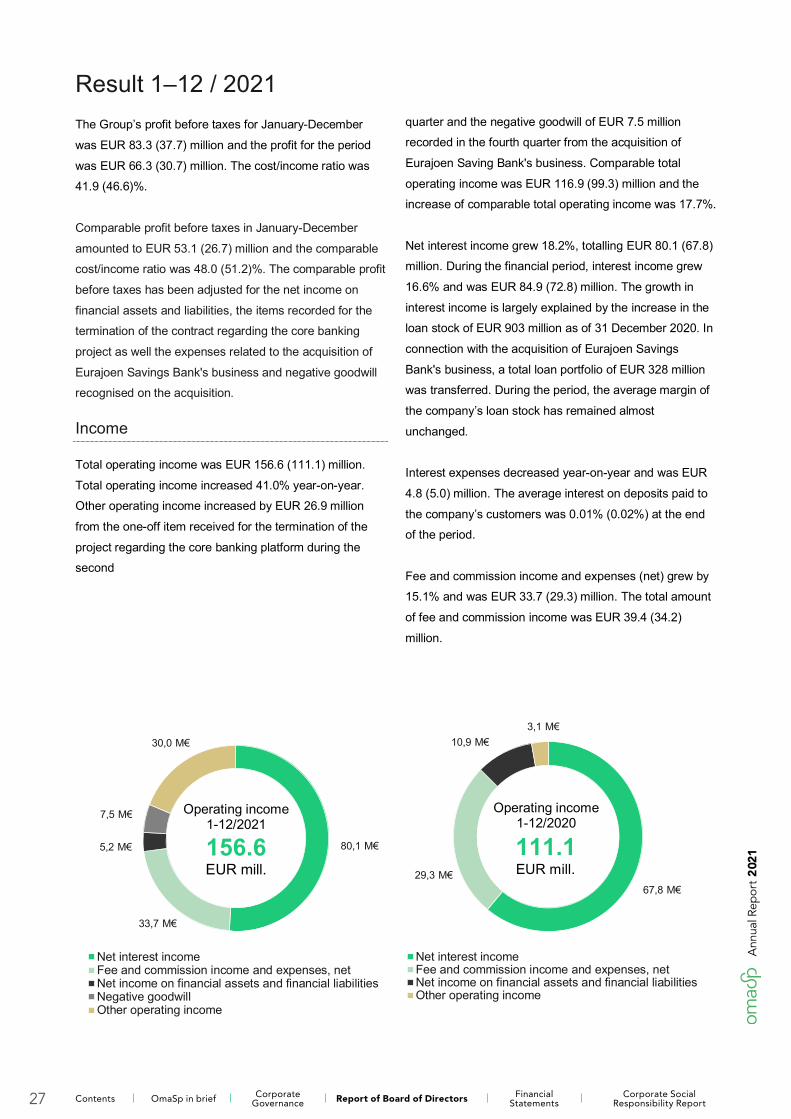
Total operating income was EUR 156.6 (111.1) million.
Total operating income increased 41.0% year-on-year. Other operating income increased by EUR 26.9 million
from the one-off item received for the termination of the
project regarding the core banking platform during the second
quarter and the negative goodwill of EUR 7.5 million recorded in the fourth quarter from the acquisition of
Eurajoen Saving Bank's business. Comparable total
operating income was EUR 116.9 (99.3) million and the increase of comparable total operating income was 17.7%.
Net interest income grew 18.2%, totalling EUR 80.1 (67.8) million. During the financial period, interest income grew
16.6% and was EUR 84.9 (72.8) million. The growth in
interest income is largely explained by the increase in the loan stock of EUR 903 million as of 31 December 2020. In
connection with the acquisition of Eurajoen Savings
Bank's business, a total loan portfolio of EUR 328 million was transferred. During the period, the average margin of
the company’s loan stock has remained almost
unchanged.
Interest expenses decreased year-on-year and was EUR
4.8 (5.0) million. The average interest on deposits paid to
the company’s customers was 0.01% (0.02%) at the end of the period.
Fee and commission income and expenses (net) grew by 15.1% and was EUR 33.7 (29.3) million. The total amount
of fee and commission income was EUR 39.4 (34.2)
million.
80,1 M€
33,7 M€
5,2 M€
7,5 M€
30,0 M€
Net interest incomeFee and commission income and expenses, netNet income on financial assets and financial liabilitiesNegative goodwillOther operating income
156.6EUR mill.
Operating income 1-12/2021
67,8 M€29,3 M€
10,9 M€3,1 M€
Net interest incomeFee and commission income and expenses, netNet income on financial assets and financial liabilitiesOther operating income
111.1EUR mill.
Operating income 1-12/2020
27
Ann
ual R
epor
t 2
021
Contents OmaSp in brief Corporate Governance Report of Board of Directors Financial
StatementsCorporate Social
Responsibility Report

10
Commissions from cards and payment transactions net
grew 15.3% compared on the comparative period and was
EUR 19.0 (16.4) million. The increase is mainly explained by volume growth. The amount of commission income on
lending was EUR 12.0 (11.1) million.
The net income on financial assets and liabilities was EUR
5.2 (10.9) million during the period. In February 2020, the
company eased its investment portfolio, which was reflected in return of EUR 8 million in financial assets in
the comparative period.
Other operating income was EUR 30.0 (3.1) million. The
impact of the contract termination regarding the core
banking platform is reflected in other operating income EUR 26.9 million.
Expenses
Operating expenses increased 26.4% compared to the previous year’s corresponding period. Operating expenses
came to a total of EUR 65.3 (51.7) million. Comparable
operating expenses were EUR 55.7 (50.9) million. The increase of comparable operating expenses was 9.6%.
Personnel expenses increased 18.3%, totalling EUR 20.6 (16.9) million. The number of employees at the end of the
period was 344 (298), of which 55 (38) were fixed-term.
With the acquisition of the business, 33 people transferred from Eurajoen Savings Bank, and at the same time EUR
1.1 million was recorded in personnel expenses as one-off
item arrangement costs in the fourth quarter.
Other operating expenses increased 16.2% to EUR 34.4
(29.6) million. The item includes office, IT, PR and
marketing costs and those stemming from the business premises in own use. The increase in operating expenses
was mainly due to development expenses of IT systems.
The item includes costs related to the acquisition of Eurajoen Savings Bank's business of EUR 3.3 million.
Depreciation, amortisation and impairment on tangible and intangible assets were EUR 10.3 (5.2) million. During the
second quarter, items recorded as impairment for the core
banking project were in total EUR 4.6 million. During the fourth quarter, an impairment loss of EUR 0.5 million was
recorded for an individual branch building.
19,6 M€
31,0 M€
10,3 M€
4,4 M€
Personnel expensesOther operating expensesDepreciations, impairmentsCosts relating to business combinations
65.3EUR mill.
Operating expenses1-12/2021
16,9 M€
29,6 M€
5,2 M€
Personnel expensesOther operating expensesDepreciations, impairments
51.7EUR mill.
Operating expenses1-12/2020
28
Ann
ual R
epor
t 2
021
Contents OmaSp in brief Corporate Governance Report of Board of Directors Financial
StatementsCorporate Social
Responsibility Report
11
Impairment losses on financial assets
Impairment losses on financial assets (net) decreased
compared to the comparison year and were during the year EUR 7.3 (21.6) million. In the comparison year, the
impairment losses on financial assets were highlighted by
the provision for individual customer insolvency as well as
the additional loss allowance based on management’s judgement for the corona pandemic.
The net impact of final credit losses decreased compared to the comparison year and was in January-December
EUR 4.4 (13.7) million. Credit losses recorded during the
period are mostly targeted at corporate customers.
During January-December, the expected credit losses
decreased compared to the comparison period and was EUR 2.9 (7.8) million. Of the change in expected credit
losses, EUR 2.3 million was allocated to receivables from
customers and off-balance sheet items. The change in the investment portfolio was EUR 0.6 million.
The company increased during the first quarter its
additional loss allowance based on management’s judgement related to corona pandemic from EUR 1.5
million to EUR 5.9 million. With the additional loss
allowances the company is prepared for the possible consequences of the corona pandemic in the quality of the
loan portfolio. The quality of the loan portfolio has
remained at a good level throughout the pandemic. As
vaccine coverage improved, restrictions related to the coronary pandemic were lifted in early autumn. During the
third quarter, the company released additional loss
allowances related to corona pandemic of EUR 2.0 million. As the corona pandemic weakened again towards the end
of the year, restrictions had to be tightened in many areas.
As a result, the company did not release additional loss allowances in the fourth quarter.
Additional loss allowances remain for use EUR 3.9 million.
A total of EUR 2.0 million of the additional loss allowances has been allocated to corporate customers and EUR 1.9
million to private customers. Additional allowances made
are targeted to stage 2.
An additional loss allowance of EUR 4.8 million was
recorded in the second and third quarter as anticipated for the increase in the credit risk of an individual customer.
Accounting made are targeted to stage 3.
The company prepared for the introduction of the new
definition of insolvency at the end of the financial year
2020 with an additional loss allowance of EUR 1.4 million. This additional allowance the company has offloaded
during the first two quarters of financial year 2021.
29
Ann
ual R
epor
t 2
021
Contents OmaSp in brief Corporate Governance Report of Board of Directors Financial
StatementsCorporate Social
Responsibility Report
12
Balance sheetThe Group’s balance sheet total grew to EUR 5,372.6
(4,382.0) million during January-December 2021. The
growth was 22.6%. Approximately EUR 335 million of the increase came from the acquisition of Eurajoen Savings
Bank's business.
Loans and other receivables
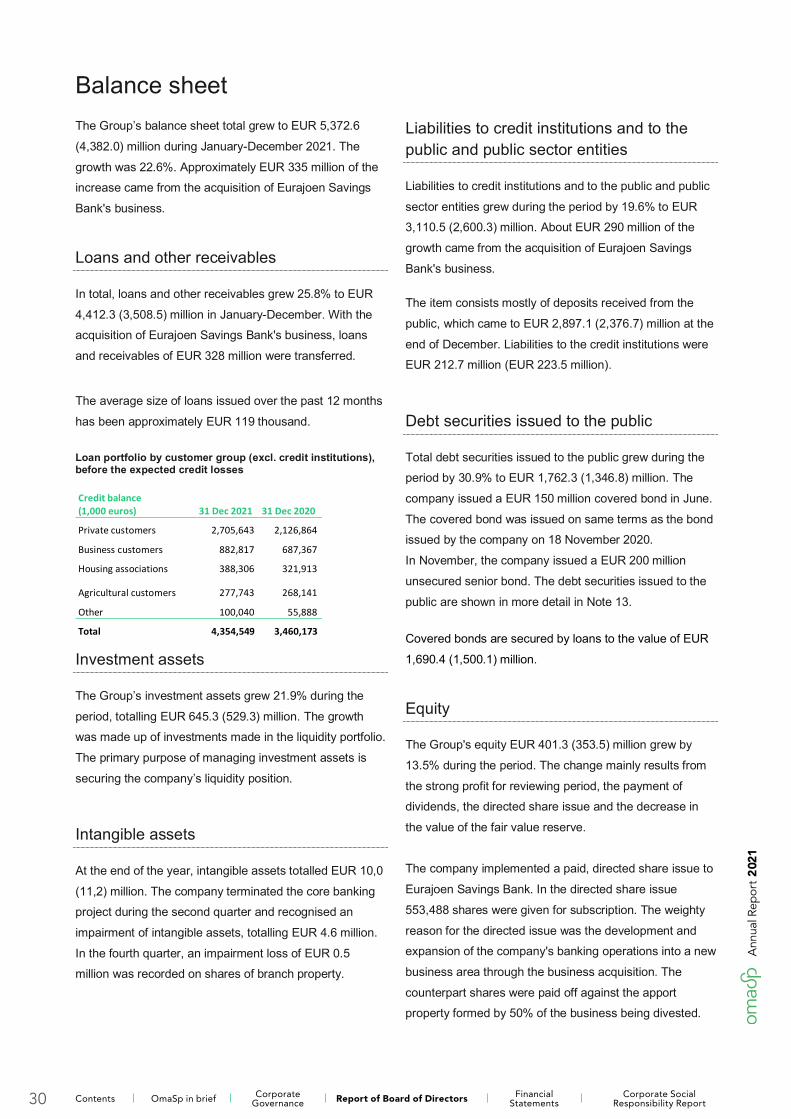
In total, loans and other receivables grew 25.8% to EUR
4,412.3 (3,508.5) million in January-December. With the acquisition of Eurajoen Savings Bank's business, loans
and receivables of EUR 328 million were transferred.
The average size of loans issued over the past 12 months
has been approximately EUR 119 thousand.
Loan portfolio by customer group (excl. credit institutions), before the expected credit losses Credit balance (1,000 euros) 31 Dec 2021 31 Dec 2020
Private customers 2,705,643 2,126,864
Business customers 882,817 687,367
Housing associations 388,306 321,913
Agricultural customers 277,743 268,141
Other 100,040 55,888
Total 4,354,549 3,460,173
Investment assets
The Group’s investment assets grew 21.9% during the
period, totalling EUR 645.3 (529.3) million. The growth was made up of investments made in the liquidity portfolio.
The primary purpose of managing investment assets is
securing the company’s liquidity position.
Intangible assets
At the end of the year, intangible assets totalled EUR 10,0
(11,2) million. The company terminated the core banking project during the second quarter and recognised an
impairment of intangible assets, totalling EUR 4.6 million.
In the fourth quarter, an impairment loss of EUR 0.5 million was recorded on shares of branch property.
Liabilities to credit institutions and to the public and public sector entities
Liabilities to credit institutions and to the public and public
sector entities grew during the period by 19.6% to EUR 3,110.5 (2,600.3) million. About EUR 290 million of the
growth came from the acquisition of Eurajoen Savings
Bank's business. The item consists mostly of deposits received from the
public, which came to EUR 2,897.1 (2,376.7) million at the
end of December. Liabilities to the credit institutions were EUR 212.7 million (EUR 223.5 million).
Debt securities issued to the public
Total debt securities issued to the public grew during the period by 30.9% to EUR 1,762.3 (1,346.8) million. The
company issued a EUR 150 million covered bond in June.
The covered bond was issued on same terms as the bond issued by the company on 18 November 2020.
In November, the company issued a EUR 200 million
unsecured senior bond. The debt securities issued to the
public are shown in more detail in Note 13.
Covered bonds are secured by loans to the value of EUR
1,690.4 (1,500.1) million.
Equity
The Group's equity EUR 401.3 (353.5) million grew by
13.5% during the period. The change mainly results from
the strong profit for reviewing period, the payment of dividends, the directed share issue and the decrease in
the value of the fair value reserve.
The company implemented a paid, directed share issue to
Eurajoen Savings Bank. In the directed share issue
553,488 shares were given for subscription. The weighty
reason for the directed issue was the development and expansion of the company's banking operations into a new
business area through the business acquisition. The
counterpart shares were paid off against the apport property formed by 50% of the business being divested.
30
Ann
ual R
epor
t 2
021
Contents OmaSp in brief Corporate Governance Report of Board of Directors Financial
StatementsCorporate Social
Responsibility Report
13
A share issue of EUR 7.8 million was recorded in the
reserve for invested non-restricted equity.
The fair value reserve decreased by EUR 11.3 million during the period due to changes in market prices.
Own shares
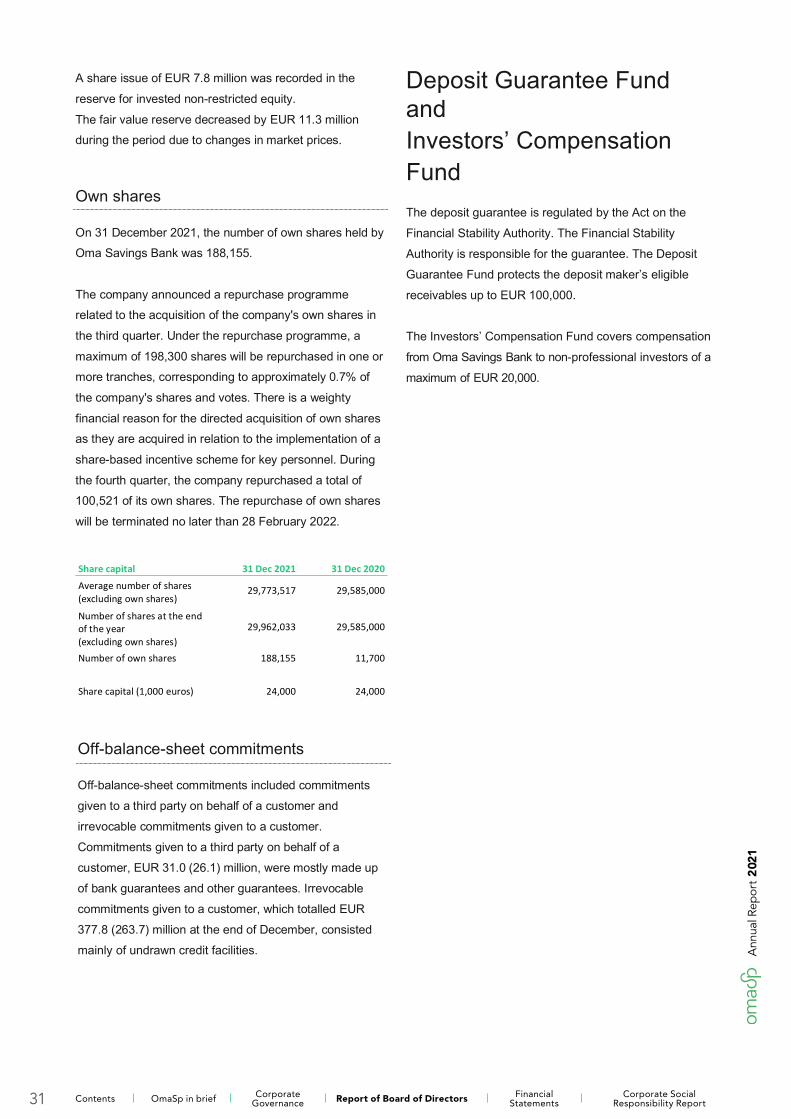
On 31 December 2021, the number of own shares held by Oma Savings Bank was 188,155.
The company announced a repurchase programme related to the acquisition of the company's own shares in
the third quarter. Under the repurchase programme, a
maximum of 198,300 shares will be repurchased in one or more tranches, corresponding to approximately 0.7% of
the company's shares and votes. There is a weighty
financial reason for the directed acquisition of own shares as they are acquired in relation to the implementation of a
share-based incentive scheme for key personnel. During
the fourth quarter, the company repurchased a total of 100,521 of its own shares. The repurchase of own shares
will be terminated no later than 28 February 2022.
Share capital 31 Dec 2021 31 Dec 2020
Average number of shares (excluding own shares)
29,773,517 29,585,000
Number of shares at the end of the year (excluding own shares)
29,962,033 29,585,000
Number of own shares 188,155 11,700
Share capital (1,000 euros) 24,000 24,000
Deposit Guarantee Fund and Investors’ Compensation Fund The deposit guarantee is regulated by the Act on the Financial Stability Authority. The Financial Stability Authority is responsible for the guarantee. The Deposit Guarantee Fund protects the deposit maker’s eligible receivables up to EUR 100,000.
The Investors’ Compensation Fund covers compensation
from Oma Savings Bank to non-professional investors of a
maximum of EUR 20,000.
Off-balance-sheet commitments
Off-balance-sheet commitments included commitments given to a third party on behalf of a customer and irrevocable commitments given to a customer. Commitments given to a third party on behalf of a customer, EUR 31.0 (26.1) million, were mostly made up of bank guarantees and other guarantees. Irrevocable commitments given to a customer, which totalled EUR 377.8 (263.7) million at the end of December, consisted mainly of undrawn credit facilities.
31
Ann
ual R
epor
t 2
021
Contents OmaSp in brief Corporate Governance Report of Board of Directors Financial
StatementsCorporate Social
Responsibility Report
14
The Group’s capital adequacy and risk management
Capital adequacy management
Oma Savings Bank Plc has introduced a capital adequacy
management process, whose objective is to secure the
company’s risk-bearing capacity relative to all substantial operational risks. To achieve this goal, the company
comprehensively identifies and evaluates the risks related
to its operations and measures its risk-bearing capacity to correspond to the company's total risks. To secure its
capital adequacy, the company sets risk-based equity
objectives and creates an equity plan to reach those objectives. The objective of the capital adequacy
management process is also to maintain and develop
high-quality risk management operations.
The internal capital needs, which are determined through
the capital adequacy management process, are based on
the capital requirements of solvency regulations, Pillar I, and its external risks, such as the interest rate risk of the
financial account, the market risk of the investment
portfolio and business risk.
In its internal evaluation process, the bank estimates the
amount of capital sufficient to cover any unexpected losses emerging from risks that are external to Pillar I.
The company’s Board of Directors confirms the general requirements for the capital adequacy measurement and
evaluation processes as well as general principles for the
structuring of the capital adequacy management process. The Board confirms risk strategies and defines target
levels for capital, which covers all essential risks emerging
from business operations and changes in the external operating environment. In retail bank operations, the
company operates according to its strategy. By restricting
its operations to this sector alone, the company is able to keep its risks on a manageable level and small in terms of
operational quality. The company’s Board of Directors is
responsible for managing the company’s capital
adequacy, which also defines the risk limits related to operations. The Board also defines the operational levels
of risks. Annually, the Board of Directors reviews the
company’s capital adequacy management risks, the
capital plan as well as the limits set for the risks.
Capital adequacy position and own funds
The total capital (TC) ratio of Oma Savings Bank Group
remained strong and was 15.6 (16.2)% at the end of the period. The Common Equity Tier 1 capital (CET1) ratio
was 15.5 (15.9)% clearly exceeding the minimum level for
the financial goals approved by the Board of Directors (14%). Risk-weighted assets grew 17.7% to EUR 2,398.1
(2,037.4) million. Risk-weighted assets grew most
significantly due to the strong growth in the loan portfolio for private customers. The corporate loan portfolio also
grew strongly during the period, but the impact on risk-
weighted assets was mitigated by the application of the
provisions of the EU Capital Requirement Regulation Update (CRR2) as of 28 June 2021. Under the new
regulation, liabilities related to SMEs will receive a greater
reduction in capital requirements.
Oma Savings Bank Group applies in the capital
requirement calculation for credit risk calculation the standardised approach and for operational risk the basic
indicator approach. The capital requirement for market risk
is calculated using the basic method for the currency position.
At the end of the review period, the capital structure of Oma Savings Bank Group was strong, consisting mostly
of Common Equity Tier 1 capital (CET1). The Group’s own
funds (TC) increased by EUR 44.9 million to 375.2 (330.3) million when the capital requirement for own funds was
EUR 287.9 (244.6) million. Tier 1 capital (T1) was EUR
371.9 (324.0) million, consisting entirely of Common Equity Tier 1 capital (CET1), and Tier 2 capital (T2) was
EUR 3.3 (6.3) million, consisting of debenture loans. The
increase in own funds was most significantly the result of
the profit for the accounting period 2021 that are included in the Common Equity Tier 1 capital on the basis of
permission granted by the Finnish Financial Supervisory
Authority (FIN-FSA).
32
Ann
ual R
epor
t 2
021
Contents OmaSp in brief Corporate Governance Report of Board of Directors Financial
StatementsCorporate Social
Responsibility Report
15
The main items in the capital adequacy calculation
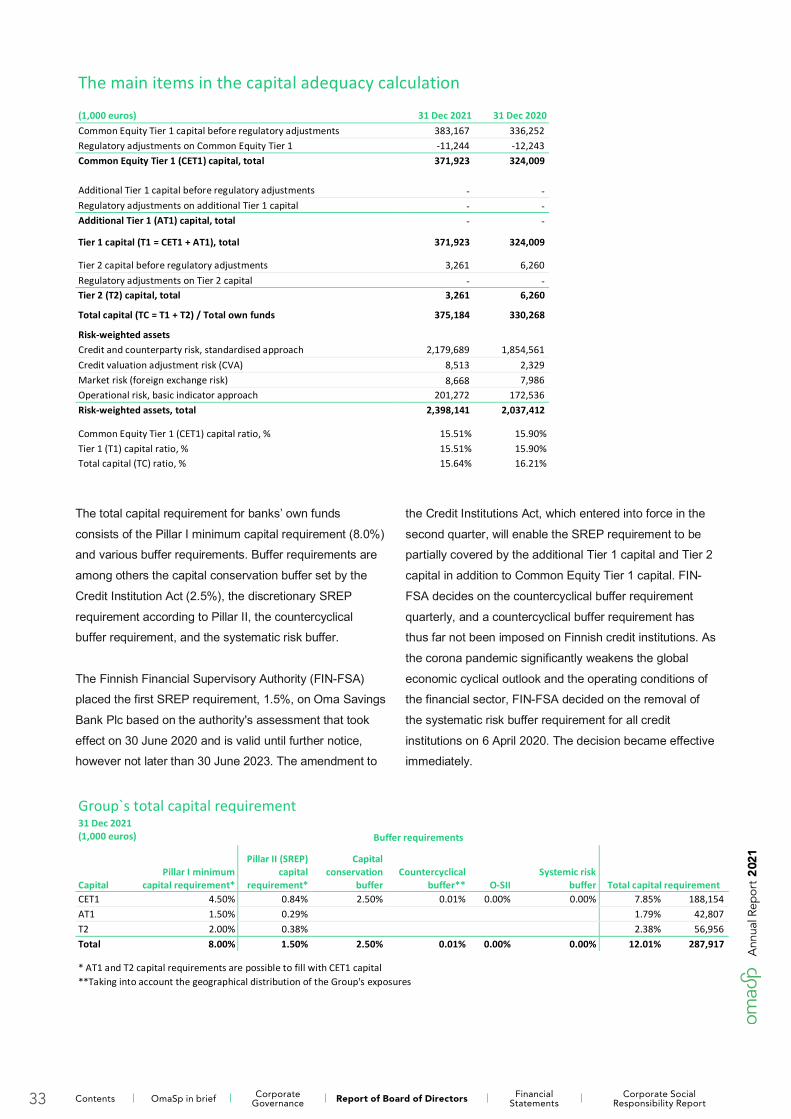
(1,000 euros) 31 Dec 2021 31 Dec 2020 Common Equity Tier 1 capital before regulatory adjustments 383,167 336,252 Regulatory adjustments on Common Equity Tier 1 -11,244 -12,243Common Equity Tier 1 (CET1) capital, total 371,923 324,009
Additional Tier 1 capital before regulatory adjustments - - Regulatory adjustments on additional Tier 1 capital - - Additional Tier 1 (AT1) capital, total - -
Tier 1 capital (T1 = CET1 + AT1), total 371,923 324,009
Tier 2 capital before regulatory adjustments 3,261 6,260 Regulatory adjustments on Tier 2 capital - - Tier 2 (T2) capital, total 3,261 6,260
Total capital (TC = T1 + T2) / Total own funds 375,184 330,268
Risk-weighted assets Credit and counterparty risk, standardised approach 2,179,689 1,854,561 Credit valuation adjustment risk (CVA) 8,513 2,329 Market risk (foreign exchange risk) 8,668 7,986 Operational risk, basic indicator approach 201,272 172,536 Risk-weighted assets, total 2,398,141 2,037,412
Common Equity Tier 1 (CET1) capital ratio, % 15.51% 15.90% Tier 1 (T1) capital ratio, % 15.51% 15.90% Total capital (TC) ratio, % 15.64% 16.21%
The total capital requirement for banks’ own funds
consists of the Pillar I minimum capital requirement (8.0%) and various buffer requirements. Buffer requirements are
among others the capital conservation buffer set by the
Credit Institution Act (2.5%), the discretionary SREP
requirement according to Pillar II, the countercyclical buffer requirement, and the systematic risk buffer.
The Finnish Financial Supervisory Authority (FIN-FSA) placed the first SREP requirement, 1.5%, on Oma Savings
Bank Plc based on the authority's assessment that took
effect on 30 June 2020 and is valid until further notice, however not later than 30 June 2023. The amendment to
the Credit Institutions Act, which entered into force in the
second quarter, will enable the SREP requirement to be partially covered by the additional Tier 1 capital and Tier 2
capital in addition to Common Equity Tier 1 capital. FIN-
FSA decides on the countercyclical buffer requirement
quarterly, and a countercyclical buffer requirement has thus far not been imposed on Finnish credit institutions. As
the corona pandemic significantly weakens the global
economic cyclical outlook and the operating conditions of the financial sector, FIN-FSA decided on the removal of
the systematic risk buffer requirement for all credit
institutions on 6 April 2020. The decision became effective immediately.
Group`s total capital requirement31 Dec 2021 (1,000 euros) Buffer requirements
Capital Pillar I minimum
capital requirement*
Pillar II (SREP) capital
requirement*
Capital conservation
buffer Countercyclical
buffer** O-SIISystemic risk
buffer Total capital requirement CET1 4.50% 0.84% 2.50% 0.01% 0.00% 0.00% 7.85% 188,154 AT1 1.50% 0.29% 1.79% 42,807 T2 2.00% 0.38% 2.38% 56,956 Total 8.00% 1.50% 2.50% 0.01% 0.00% 0.00% 12.01% 287,917
* AT1 and T2 capital requirements are possible to fill with CET1 capital **Taking into account the geographical distribution of the Group's exposures
33
Ann
ual R
epor
t 2
021
Contents OmaSp in brief Corporate Governance Report of Board of Directors Financial
StatementsCorporate Social
Responsibility Report
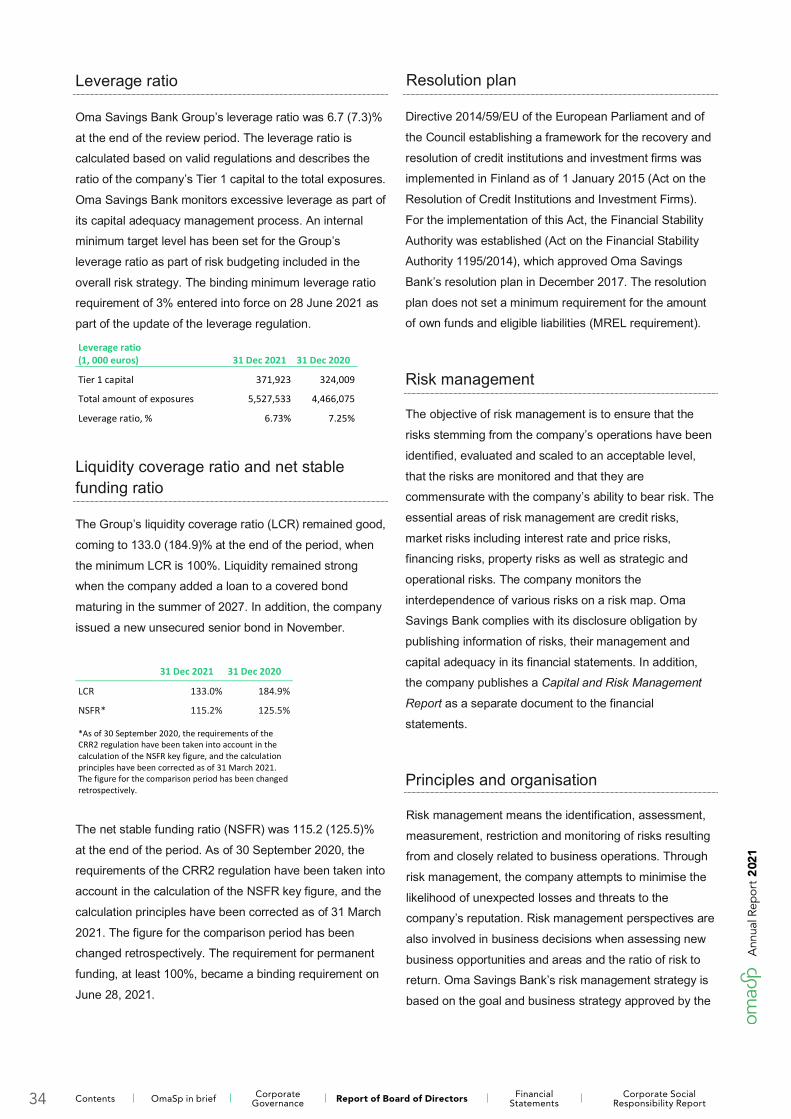
16
Leverage ratio
Oma Savings Bank Group’s leverage ratio was 6.7 (7.3)% at the end of the review period. The leverage ratio is calculated based on valid regulations and describes the
ratio of the company’s Tier 1 capital to the total exposures.
Oma Savings Bank monitors excessive leverage as part of
its capital adequacy management process. An internal minimum target level has been set for the Group’s
leverage ratio as part of risk budgeting included in the
overall risk strategy. The binding minimum leverage ratio requirement of 3% entered into force on 28 June 2021 as
part of the update of the leverage regulation.
Leverage ratio (1, 000 euros) 31 Dec 2021 31 Dec 2020
Tier 1 capital 371,923 324,009
Total amount of exposures 5,527,533 4,466,075
Leverage ratio, % 6.73% 7.25%
Liquidity coverage ratio and net stable funding ratio
The Group’s liquidity coverage ratio (LCR) remained good,
coming to 133.0 (184.9)% at the end of the period, when
the minimum LCR is 100%. Liquidity remained strong when the company added a loan to a covered bond
maturing in the summer of 2027. In addition, the company
issued a new unsecured senior bond in November.
31 Dec 2021 31 Dec 2020
LCR 133.0% 184.9%
NSFR* 115.2% 125.5%
*As of 30 September 2020, the requirements of the CRR2 regulation have been taken into account in the calculation of the NSFR key figure, and the calculation principles have been corrected as of 31 March 2021. The figure for the comparison period has been changed retrospectively.
The net stable funding ratio (NSFR) was 115.2 (125.5)%
at the end of the period. As of 30 September 2020, the requirements of the CRR2 regulation have been taken into
account in the calculation of the NSFR key figure, and the
calculation principles have been corrected as of 31 March
2021. The figure for the comparison period has been changed retrospectively. The requirement for permanent
funding, at least 100%, became a binding requirement on
June 28, 2021.
Resolution plan
Directive 2014/59/EU of the European Parliament and of
the Council establishing a framework for the recovery and
resolution of credit institutions and investment firms was implemented in Finland as of 1 January 2015 (Act on the
Resolution of Credit Institutions and Investment Firms).
For the implementation of this Act, the Financial Stability
Authority was established (Act on the Financial Stability Authority 1195/2014), which approved Oma Savings
Bank’s resolution plan in December 2017. The resolution
plan does not set a minimum requirement for the amount of own funds and eligible liabilities (MREL requirement).
Risk management
The objective of risk management is to ensure that the
risks stemming from the company’s operations have been
identified, evaluated and scaled to an acceptable level,
that the risks are monitored and that they are commensurate with the company’s ability to bear risk. The
essential areas of risk management are credit risks,
market risks including interest rate and price risks, financing risks, property risks as well as strategic and
operational risks. The company monitors the
interdependence of various risks on a risk map. Oma Savings Bank complies with its disclosure obligation by
publishing information of risks, their management and
capital adequacy in its financial statements. In addition, the company publishes a Capital and Risk Management
Report as a separate document to the financial
statements.
Principles and organisation
Risk management means the identification, assessment,
measurement, restriction and monitoring of risks resulting from and closely related to business operations. Through
risk management, the company attempts to minimise the
likelihood of unexpected losses and threats to the company’s reputation. Risk management perspectives are
also involved in business decisions when assessing new
business opportunities and areas and the ratio of risk to return. Oma Savings Bank’s risk management strategy is
based on the goal and business strategy approved by the
34
Ann
ual R
epor
t 2
021
Contents OmaSp in brief Corporate Governance Report of Board of Directors Financial
StatementsCorporate Social
Responsibility Report

17
Board of Directors for the company, the risk management
policy and instructions, the authorisation system and the
risk and incident reporting generated from the most important business areas. In accordance with its strategy,
the company operates in the low-risk area of retail banking
activities. The company does not have too much customer or investment risk concentrations in relation to its financial
capacity, nor does the company take them in accordance
with its strategy.
The company’s Board sets the level of risk appetite by
approving risk area-specific risk strategies and the necessary risk limits and monitoring limits. The realisation
of the risk strategy is monitored through the control of risk
limits and monitoring limits and reporting, which are performed independently of business operations. The
company maintains its solvency at a safe level. The
company’s solvency and risk bearing ability are fortified
with profitable operations. The Board is regularly provided information about the various risks to the company as well
as an assessment of the level of each risk. The Board also
accepts authorisations and frameworks for risk-taking by determining the approved levels of credit and market risks.
Within the limits of authorisation, the responsibility for the daily risk monitoring and surveillance belongs to the
management. The executive management utilizes system-
produced reports on the various areas of risk. Systems and policies intended for risk reporting and monitoring
meet the requirements set for risk management, taking
into consideration the character and extent of the company’s operations.
The company has established independent operations to ensure efficient and comprehensive internal control.
Independent operations: • Independent risk control
• Ensuring compliance with regulations (compliance-function)
• Internal audit
Risk management and compliance arrangements
Risk control and independent monitoring of compliance with regulations are performed by the risk control function
and the company's compliance function. The first of these
is further divided into three units. The risk control function maintains the operating principles and framework of risk
management and promotes a healthy risk culture by
supporting the business in its risk management. The
purpose of the independent risk control is to ensure and monitor that the company’s risk management is conducted
on a sufficient level in terms of the quality, extent, diversity
and risks of the company’s business operations. In addition, all new and essential previously unknown risks
will be included in the company’s risk management.
The compliance function ensures that the company
complies with laws, regulations and internal guidelines in
all its operations. The compliance function also ensures that the practises followed and the company's internal
instructions are coordinated with the requirements of
legislation and other regulations. The goal of the compliance function is to promote the company's
compliance culture. The risk control function and the
compliance function report directly to the CEO.
Oma Savings Bank's internal audit is an independent and
objective assessment and assurance activity, the task of which is to check the adequacy, functionality and
efficiency of the internal control system, risk management
and management and governance processes in the bank's
various units and functions.
Internal audit supports Oma Savings Bank's top
management and the organization in achieving its goals by providing a systematic approach to the organisation's
processes and providing added value to Oma Savings
Bank and improving its operational reliability.
Credit ratings
Standard & Poor's confirmed a credit rating of BBB+ for
Oma Savings Bank’s long-term borrowing in June 2021, as well as a rating of A-2 for short-term borrowing. In
January 2021, Standard & Poor's changed the outlook for
35
Ann
ual R
epor
t 2
021
Contents OmaSp in brief Corporate Governance Report of Board of Directors Financial
StatementsCorporate Social
Responsibility Report
18
Oma Savings Bank's long-term credit rating from negative
to stable with the update of the BICRA (Banking Industry
Country Risk Assessment) rating.
Pillar III publication principles
In accordance with Regulation (EU) No 575/2013 of the
European Parliament and the Council, Oma Savings Bank Group publishes information on capital adequacy and risk
management listed in Part 8, Title II and its Supplementary
Regulation (EU) 2019/876 annually in Capital and Risk Management Report and for certain parts biannually
together with its Half-Year Report. The company’s
independent operations evaluate and authenticate the relevance of the published information at the time of
publication. At the time of approving the Capital and Risk
Management Report and Pillar III information on capital adequacy and risk management publication, the
company's Board of Directors assesses, on the proposal
of independent operations, whether the published information provides market participants a comprehensive
understanding of the company's risk profile.
36
Ann
ual R
epor
t 2
021
Contents OmaSp in brief Corporate Governance Report of Board of Directors Financial
StatementsCorporate Social
Responsibility Report
19
Resolutions of the Annual General Meeting Oma Savings Bank Plc’s Annual General Meeting was held on 30 March 2021 by exceptional meeting procedure
based on the temporary legislative act (677/2020)
approved by the Finnish Parliament to limit spread of corona pandemic. The AGM confirmed the company's
financial statements and consolidated financial statements
for the 2020 financial year, granted discharge to the members of the company's Board of Directors and CEO
from liability, and decided to approve the company's
remuneration report.
In accordance with the Board's proposal, the AGM
decided to authorise the Board to decide on the payment of a dividend of up to EUR 0.24 per share for the financial
year 2020 and in respect of dividends not paid in 2019 due
to the authority’s profit-sharing restrictions an additional
payment of a dividend of up to EUR 0.06 on each share entitling to a dividend for 2020. According to the decision
of the AGM, dividends will be paid upon completion of the
authority’s profit-sharing restrictions. The Board of Directors was authorised to decide the record date and
date of payment for possible dividend.
In accordance with the Board's proposal, the AGM
decided to remove the restriction on the age of the Board
member and amend Section 4 of the company’s Articles of Association to include the following:
The company has a board of directors comprising five (5)
to eight (8) actual members and up to two (2) deputies. The term of the Board of Directors shall expire at the close
of the Annual General Meeting following the election in the
first place. The Board of Directors elects a Chairman from among its midst and one (1) to two (2) Vice-Chairmen. A
quorum for a Board meeting is when more than half of the
Board members are present. The Board of Directors represents the bank and manages its operations in
accordance with the law and these Articles of Association.
In accordance with the proposal of the Shareholders’ Nomination Committee, the AGM decided to keep the
remuneration of Board members unchanged and the
members shall be paid the following annual remuneration
for the period ending at the AGM in 2022: EUR 50,000 per year to the Chairman, EUR 37,500 per year to the Vice
Chairman and for other members EUR 25,000 per year. In
addition, the meeting fees of EUR 1,000 for each Board meeting and EUR 500 for each single-issue email meeting
and committee meeting will be paid.
A condition for obtaining and paying a fixed annual fee is
that the Board Member commits to purchase Oma
Savings Bank Plc shares amounting to 40% of the fixed annual remuneration on the regulated market (Nasdaq
Helsinki Ltd) at a price determined by trading. The
recommendation is that a member of the Board of Directors shall not transfer the shares awarded as annual
remuneration until the membership in the Board has
expired.
The number of members of the Board of Directors was
confirmed to be seven. Aila Hemminki, Aki Jaskari, Timo
Kokkala, Jyrki Mäkynen, Jarmo Salmi and Jaana Sandström were re-elected as Board members and Jarmo
Partanen was elected as a new member for a term ending
at the end of the 2022 AGM.
KPMG Oy Ab, a firm of authorised public accountants,
was elected to continue for a term ending at the 2022 AGM. M.Sc (Econ.), APA Fredrik Westerholm continued
as responsible auditor. The auditor's remuneration is paid
against an invoice approved by the company.
The AGM decided, in accordance with the Board of
Directors’ proposal, to authorise the Board of Directors to resolve on the issuance of shares or transfer of the
company's shares and the issuance of special rights
entitled to shares as referred to in Chapter 10, Section 1 of the Finnish Companies Act, subject to the following
conditions:
• Shares and special rights can be issued or disposed of in one or more instalments, either in return for
payment or free of charge.
• The total number of shares to be issued under the
authorisation, including shares acquired on the basis of special rights, cannot exceed 5,000,000 shares,
37
Ann
ual R
epor
t 2
021
Contents OmaSp in brief Corporate Governance Report of Board of Directors Financial
StatementsCorporate Social
Responsibility Report
20
which corresponds to approximately 17 per cent of
the company's total shares on the day of the AGM.
• The Board of Directors decides on all terms and conditions related to the issuance of shares. The
authorisation concerns both the issuance of new shares and the transfer of own shares.
The authorisation is valid until the end of the next AGM, but not later than June 30, 2022. The authorisation
revokes previous authorisations given by the AGM to
decide on a share issue, as well as the option rights and the issuance of special rights entitling to shares.
The AGM decided, in accordance with the Board of Directors’ proposal, to authorise the Board of Directors to
decide on the repurchase of the company's own shares
with funds belonging to the company's free equity under the following conditions: Maximum number of 500,000
own shares may be repurchased, representing
approximately 1.7% of the company's total shares according to the situation on the date of the notice of the
meeting, however, that the number of own shares held by
the company does not exceed 10% of the company’s total shares of the company at any time. This amount includes
the own shares held by the company itself and its
subsidiaries within the meaning of Chapter 15, Section 11
(1) of the Finnish Companies Act. The Board of Directors is authorised to decide how to acquire own shares. The
authorisation is valid until the closing of the next AGM, but
not later than 30 June 2022.
Oma Savings Bank Plc's Board of Directors consists of
seven members. The Board of Directors convened 16 times during the year, of which five were email meetings.
Members of the Board: Chairman of the Board Jarmo Salmi
Deputy chairman Jyrki Mäkynen
Member Aila Hemminki Member Aki Jaskari
Member Timo Kokkala
Member Jarmo Partanen Member Jaana Sandström
Administration and personnel Oma Savings Bank Plc Group employed an average of
315 people in 2021. The goal of the company is that every
employee has a clear role in the organisation as well as adequate responsibilities and tasks. The number of
employees in the company during the financial year was
315 on average. The number of employees at SAV-
Rahoitus Oyj was eight on 31 December 2021.
Oma Savings Bank invests considerably in the skills and
ability of its personnel. The company has an extensive training package related to corporate culture, operating
models and improving the customer experience. The
training program is aimed the whole personnel and started in August 2021. The second extensive training package,
OmaSp Master, was completed in early 2021 for the
second group of participants. The training program is a 1.5-year package for supervisors and experts and is
implemented together with the University of Tampere. The
first OmaSp Master training program ended in February 2018. The training and development of personnel with
various themes through training events, webinars and
online training is the company's continuous development of competence and professional skills.
The company’s personnel is generally very satisfied and committed. A significant portion of the company’s
personnel own company shares. The company has carried
out two personnel issues in 2017 and 2018.
Personnel satisfaction is a key indicator for the company’s
operations and success. The company monitors personnel
satisfaction through an annual personnel survey. The overall satisfaction was at an excellent level of 4.5/5 in
December 2021.
Corporate governance
The company’s corporate governance principles are
described in a separate document ‘Oma Savings Bank
Plc’s Corporate Governance Statement’, approved by the Board, which can be found on Oma Savings Bank’s
website.
38
Ann
ual R
epor
t 2
021
Contents OmaSp in brief Corporate Governance Report of Board of Directors Financial
StatementsCorporate Social
Responsibility Report
21
Reward schemes
Oma Savings Bank complies with the requirements on reward schemes laid down in Section 8 of the Act on
Credit Institutions. The company’s Board of Directors has
approved the general principles concerning the reward schemes and supervises and assesses their functioning
and compliance with them regularly.
The reward scheme is aligned with the company’s
business strategy, goals and targets, and the company’s
long-term benefit. The goal of the reward scheme is to assist the bank in achieving its strategic and operative
targets by keeping the personnel motivated and
committed. Remuneration also impacts work satisfaction, work well-being and commitment. The reward scheme is
also in line with the company’s good and efficient risk
management and risk-bearing capacity and promotes
these.
One of the forms of rewards at Oma Savings Bank is the
personnel fund. The personnel fund means a fund owned and managed by the company’s personnel, the purpose of
which is to manage earnings and profit bonuses paid into
it by the company and other assets in accordance with the Act on Personnel Funds. The purpose of the personnel
fund is to reward the whole personnel for achieving goals,
improve the company’s productivity and competitiveness and promote co-operation between the employer and the
personnel and financial participation of the personnel. The
company’s Board of Directors decides annually on the amount of the profit-sharing bonus to be distributed to the
personnel fund and the objectives behind the distribution.
All employees that have been working at Oma Savings Bank for six months, excluding the CEO and the members
of the management team, become members of the
personnel fund. The personnel fund rules determine how the bonus gets distributed to the personnel fund members.
The operation of the personnel fund is regulated by the
Act on Personnel Funds.
In February 2020, the company’s Board of Directors
decided on an incentive scheme for its key personnel. The
purpose of the scheme is to harmonise the owners’ and key personnel’s goals in order to raise the company’s
long-term value and to commit the key personnel to
implementing the company’s strategy, goals and long-term
interests and to offer them a competitive remuneration
system based on the earning and accrual of shares.
The share remuneration scheme 2020–2021 consists of a
single two-year-long earning period 1 January 2020 – 31
December 2021. The target audience of the scheme includes up to 15 key people, including the company's
CEO and members of the group's management team. The
remuneration paid from the scheme corresponds to the value of no more than 420,000 Oma Savings Bank Plc
shares, including the portion paid in cash.
Salaries and rewards for the financial year are presented
in Note G21 Personnel expenses. The company publishes
the Remuneration Report alongside the Financial Statements.
Corporate social responsibility and sustainability Sustainability is one of the cornerstones of Oma Savings
Bank's strategy. It is at the heart of the business and an
important part of the future operations. The company publishes a separate Corporate Social Responsibility
Report each year, describing the most important social,
environmental and economic impacts of the company’s operations. The company’s CSR efforts are based on the
company’s values, Code of Conduct, stakeholder
expectations and megatrends that affect the operations.
Based on these, the company has defined four key sustainability themes - we are local and close to the
customer, we take care of our personnel, we promote
collective well-being and we contribute to sustainable development.
Oma Savings Bank builds sustainable economy and promotes mitigating and adapting to climate change. The
company’s products and services are developed to
encourage customers to take sustainable and environmentally friendly action. The company aims to plan
its operations to be as low carbon as possible in order to
reduce the total carbon footprint of the company.
39
Ann
ual R
epor
t 2
021
Contents OmaSp in brief Corporate Governance Report of Board of Directors Financial
StatementsCorporate Social
Responsibility Report
22
CSR Report is a part of the Company's Annual Report and
includes also a study of the effects and risks of climate
change and the carbon footprint of the company's actual operations.
Significant events after the period In early 2022, the company's Board of Directors approved
the IRB permit application package and the company decided to initiate a permit process with the Finnish
Financial Supervisory Authority (FIN-FSA) on the
application of IRB method in capital adequacy. In the first stage, the company applies permission to apply an
internal risk classification under the IRB method to
calculate capital requirements for retail credit risk liabilities.
At its meeting on 26 January 2022, the Shareholders'
Nomination Committee proposes to the company's Annual General Meeting on 30 March 2022 that the number of
Board members to be further confirmed at seven. The
Shareholders' Nomination Committee proposes that the current Board members Aila Hemminki, Aki Jaskari, Timo
Kokkala, Jyrki Mäkynen, Jarmo Partanen, Jarmo Salmi
and Jaana Sandström to be re-elected as members of the Board of Directors.
There are no other events following the end of the reporting period that would require the presentation of
additional information or that would materially affect the
company's financial position are unknown.
40
Ann
ual R
epor
t 2
021
Contents OmaSp in brief Corporate Governance Report of Board of Directors Financial
StatementsCorporate Social
Responsibility Report
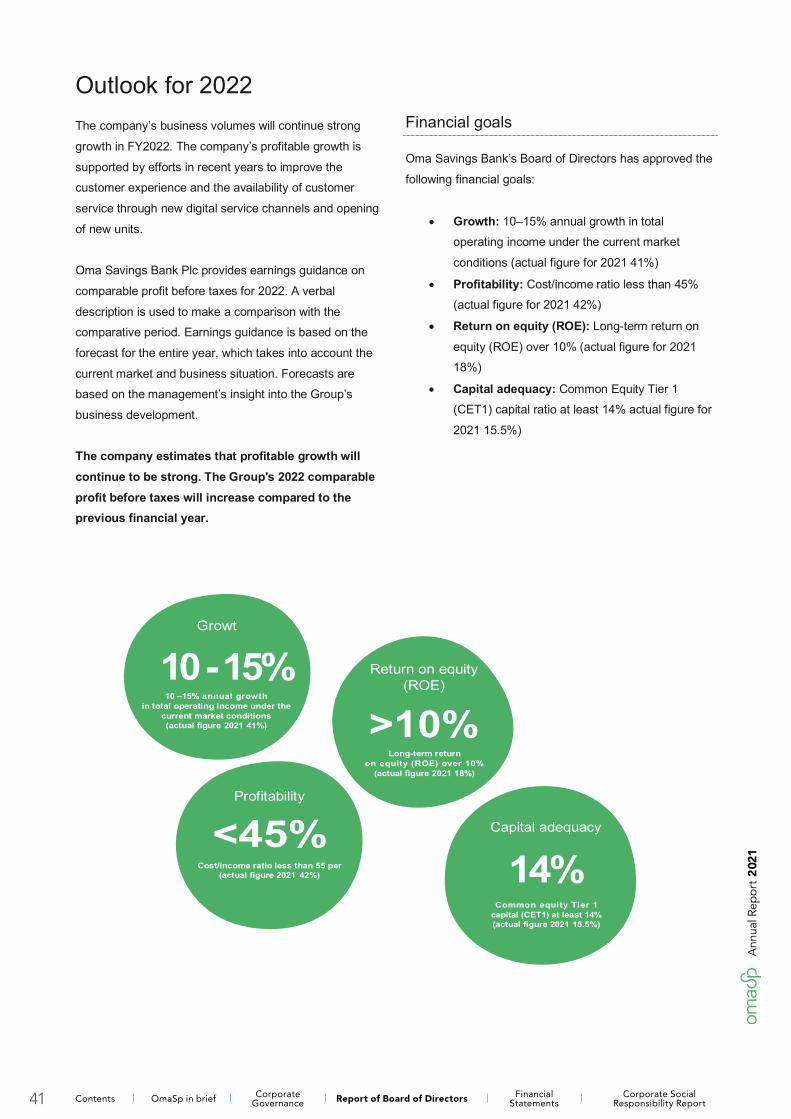
23
Outlook for 2022 The company’s business volumes will continue strong
growth in FY2022. The company’s profitable growth is
supported by efforts in recent years to improve the customer experience and the availability of customer
service through new digital service channels and opening
of new units.
Oma Savings Bank Plc provides earnings guidance on
comparable profit before taxes for 2022. A verbal
description is used to make a comparison with the comparative period. Earnings guidance is based on the
forecast for the entire year, which takes into account the
current market and business situation. Forecasts are based on the management’s insight into the Group’s
business development.
The company estimates that profitable growth will continue to be strong. The Group's 2022 comparable profit before taxes will increase compared to the previous financial year.
Financial goals
Oma Savings Bank’s Board of Directors has approved the
following financial goals:
• Growth: 10–15% annual growth in total operating income under the current market
conditions (actual figure for 2021 41%)
• Profitability: Cost/income ratio less than 45% (actual figure for 2021 42%)
• Return on equity (ROE): Long-term return on
equity (ROE) over 10% (actual figure for 2021 18%)
• Capital adequacy: Common Equity Tier 1 (CET1) capital ratio at least 14% actual figure for
2021 15.5%)
41
Ann
ual R
epor
t 2
021
Contents OmaSp in brief Corporate Governance Report of Board of Directors Financial
StatementsCorporate Social
Responsibility Report
24
Dividend policy
The company’s target is to pay a steady and growing dividend of at least 20 per cent of the net profit. The
Board of Directors of the company evaluates the balance
between the dividends or the capital to be distributed and the amount of own funds required by the company’s
capital adequacy requirements and targets and, on the
basis of this evaluation, makes a proposal on the amount of dividend or capital to be distributed.
Board of Directors’ proposal for the distribution of profit
The Board of Directors proposes that, based on the
financial statements to be approved for 2021, a dividend of EUR 0.30 to be paid from the parent company’s
distributable profits for each share entitling the
shareholder to dividend for 2021. In addition, the Board of Directors proposes to pay an additional dividend due to
the strong earnings and significant one-off items for the
financial year 2021. An additional dividend of EUR 0.20 is proposed for each share entitling to a dividend for 2021. A
total dividend of EUR 0.50 per share for 2021 would be
paid for the financial year 2021. Record date for dividends would be 1 April 2022 and payment date 8 April 2022.
The Board’s proposal complies with the company’s dividend policy. No significant changes took place in the
company’s financial position after the end of the
accounting period. The company’s liquidity is good, and
the proposed profit distribution does not compromise the company’s liquidity according to the Board of Directors’
insight.
General Meeting
Oma Savings Bank Plc’s Annual General Meeting will be
held on Wednesday 30 March 2022. The company's Board of Directors will convene the Annual General
Meeting separately at a later date.
42
Ann
ual R
epor
t 2
021
Contents OmaSp in brief Corporate Governance Report of Board of Directors Financial
StatementsCorporate Social
Responsibility Report
Consolidated Income statement 44
Consolidated Statement of comprehensive income 46
Consolidated Balance sheet 47
Consolidated Statement of changes in equity 49
Consolidated Cash flow statement 50
Notes to the Consolidated Financial Statements 51
G1 Accounting principles for the Consolidated Financial Statements 51
G2 Risk management notes 64
G3 Classification of financial assets and liabilities 77
G4 Cash and cash equivalents 78
G5 Loans and other receivables 78
G6 Financial derivatives 79
G7 Investment assets 80
G8 Intangible assets 82
G9 Tangible assets 83
G10 Other assets 84
G11 Tax assets and liabilities 85
G12 Liabilities to the public and public sector entities and liabilities to credit institutions 86
G13 Debt securities issued to the public 86
G14 Subordinated liabilities 87
G15 Provisions and other liabilities 89
G16 Equity 89
G17 Net interest income 91
G18 Fee and commission income and expenses 91
G19 Net income on financial assets and financial liabilities 92
G20 Other operating income and negative goodwill 93
G21 Personnel expenses 93
G22 Other operating expenses 94
G23 Depreciation, amortisation and impairment losses and tangible and intangible assets 94
G24 Impairment losses on financial assets 95
G25 Income taxes 96
G26 Guarantees granted and received 97
G27 Off-balance sheet commitment 97
G28 Pension liability 98
G29 Offsetting financial assets and financial liabilities 100
G30 Fair values in accordance with the valuation method 101
G31 Management compensation and related party transactions 103
G32 Share-based incentive scheme 104
G33 Leases 105
G34 Entities and changes in the Group structure included in the Consolidated Financial Statements 106
G35 Business acquisitions 107
G36 Significant events after the period 108
G37 Alternative Performance Measures (APM) and calculation of key figures 109
25
The Group’s Financial Statements
26
28
Consolidated Income statement Consolidated Statement of comprehensive income Consolidated Balance sheet 29
31 Consolidated Statement of changes in equity Consolidated Cash flow statement 32
Notes to the Consolidated Financial Statements 33 G1 Accounting principles for the Consolidated
Financial Statements 33 G2 Risk management notes 46
G3 Classification of financial assets and
liabilities 59 G4 Cash and cash equivalents 60
G5 Loans and other receivables 60
G6 Financial derivatives 61 G7 Investment assets 62
G8 Intangible assets 64
G9 Tangible assets 65 G10 Other assets 66
G11 Tax assets and liabilities 67
G12 Liabilities to the public and public sector
entities and liabilities to credit institutions 68 G13 Debt securities issued to the public 68
G14 Subordinated liabilities 69
G15 Provisions and other liabilities 70 G16 Equity 71
G17 Net interest income 73
G18 Fee and commission income and expenses 73
G19 Net income on financial assets and financial
liabilities 74 G20 Other operating income and negative
goodwill 75
G21 Personnel expenses 75 G22 Other operating expenses 76
G23 Depreciation, amortisation and impairment
losses and tangible and intangible assets 76 G24 Impairment losses on financial assets 77
G25 Income taxes 78
G26 Guarantees granted and received 79
G27 Off-balance sheet commitment 79 G28 Pension liability 80
G29 Offsetting financial assets and financial
liabilities 82 G30 Fair values in accordance with the valuation
method 83
G31 Management compensation and related party transactions 85
G32 Share-based incentive scheme 86
G33 Leases 87 G34 Entities and changes in the Group
structure included in the Consolidated Financial
Statements 88 G35 Business acquisitions 89
G36 Significant events after the period 90
G37 Alternative Performance Measures (APM) and calculation of key figures 91
43
Fina
ncia
l Sta
tem
ents
202
1
Consolidated financial statements
Group’s notes
Parent company’s financial statements
Parent company’s notes
Signatures and audit report
Contents OmaSp in brief Corporate Governance Report of Board of Directors Financial
StatementsCorporate Social
Responsibility Report
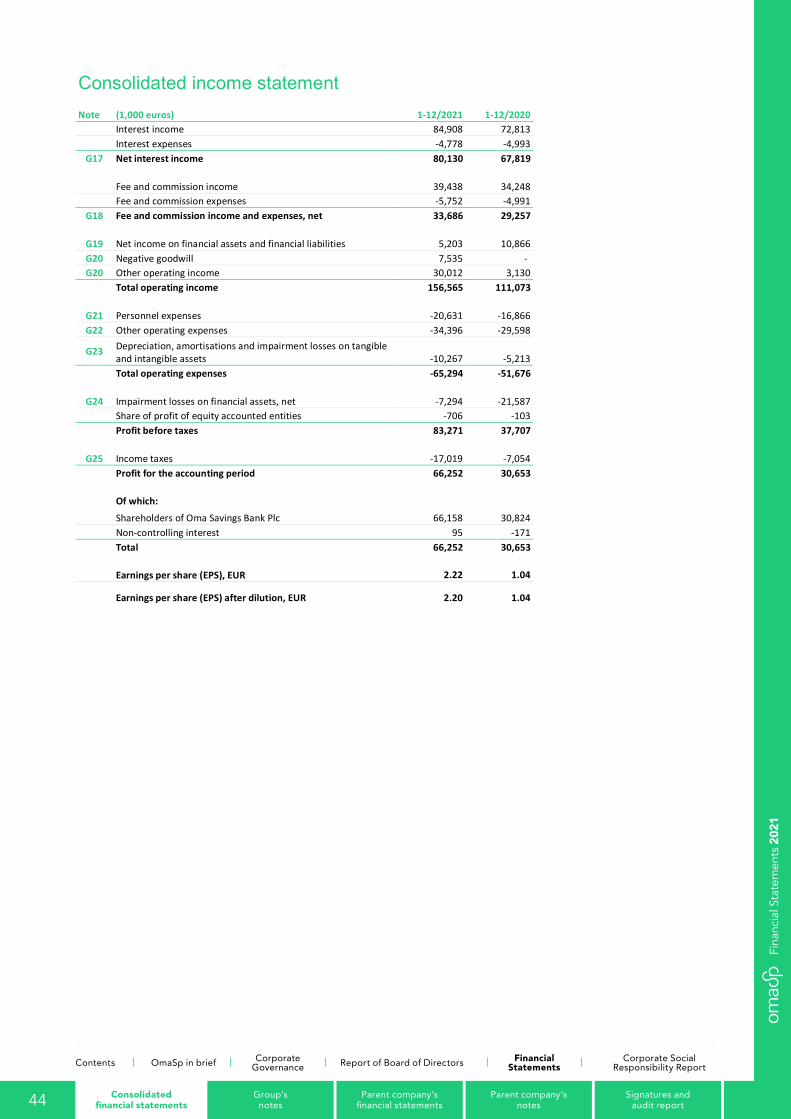
26
Consolidated income statement
Note (1,000 euros) 1-12/2021 1-12/2020 Interest income 84,908 72,813 Interest expenses -4,778 -4,993
G17 Net interest income 80,130 67,819 Fee and commission income 39,438 34,248 Fee and commission expenses -5,752 -4,991
G18 Fee and commission income and expenses, net 33,686 29,257
G19 Net income on financial assets and financial liabilities 5,203 10,866 G20 Negative goodwill 7,535 - G20 Other operating income 30,012 3,130
Total operating income 156,565 111,073
G21 Personnel expenses -20,631 -16,866 G22 Other operating expenses -34,396 -29,598
G23 Depreciation, amortisations and impairment losses on tangible and intangible assets -10,267 -5,213
Total operating expenses -65,294 -51,676
G24 Impairment losses on financial assets, net -7,294 -21,587 Share of profit of equity accounted entities -706 -103 Profit before taxes 83,271 37,707
G25 Income taxes -17,019 -7,054 Profit for the accounting period 66,252 30,653 Of which:
Shareholders of Oma Savings Bank Plc 66,158 30,824 Non-controlling interest 95 -171 Total 66,252 30,653 Earnings per share (EPS), EUR 2.22 1.04
Earnings per share (EPS) after dilution, EUR 2.20 1.04
44
Fina
ncia
l Sta
tem
ents
202
1
Consolidated financial statements
Group’s notes
Parent company’s financial statements
Parent company’s notes
Signatures and audit report
Contents OmaSp in brief Corporate Governance Report of Board of Directors Financial
StatementsCorporate Social
Responsibility Report
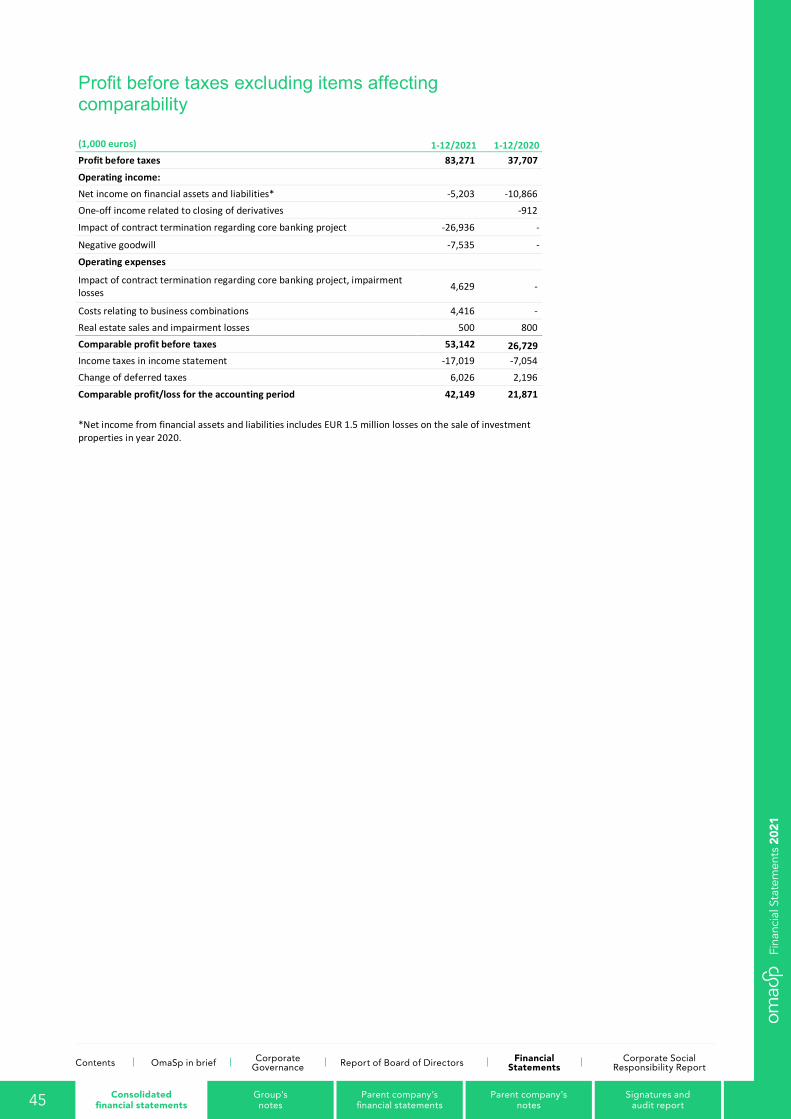
27
Profit before taxes excluding items affecting comparability
(1,000 euros) 1-12/2021 1-12/2020 Profit before taxes 83,271 37,707
Operating income: Net income on financial assets and liabilities* -5,203 -10,866 One-off income related to closing of derivatives -912
Impact of contract termination regarding core banking project -26,936 -
Negative goodwill -7,535 -
Operating expenses
Impact of contract termination regarding core banking project, impairment losses 4,629 -
Costs relating to business combinations 4,416 - Real estate sales and impairment losses 500 800 Comparable profit before taxes 53,142 26,729 Income taxes in income statement -17,019 -7,054 Change of deferred taxes 6,026 2,196
Comparable profit/loss for the accounting period 42,149 21,871 *Net income from financial assets and liabilities includes EUR 1.5 million losses on the sale of investment properties in year 2020.
45
Fina
ncia
l Sta
tem
ents
202
1
Consolidated financial statements
Group’s notes
Parent company’s financial statements
Parent company’s notes
Signatures and audit report
Contents OmaSp in brief Corporate Governance Report of Board of Directors Financial
StatementsCorporate Social
Responsibility Report
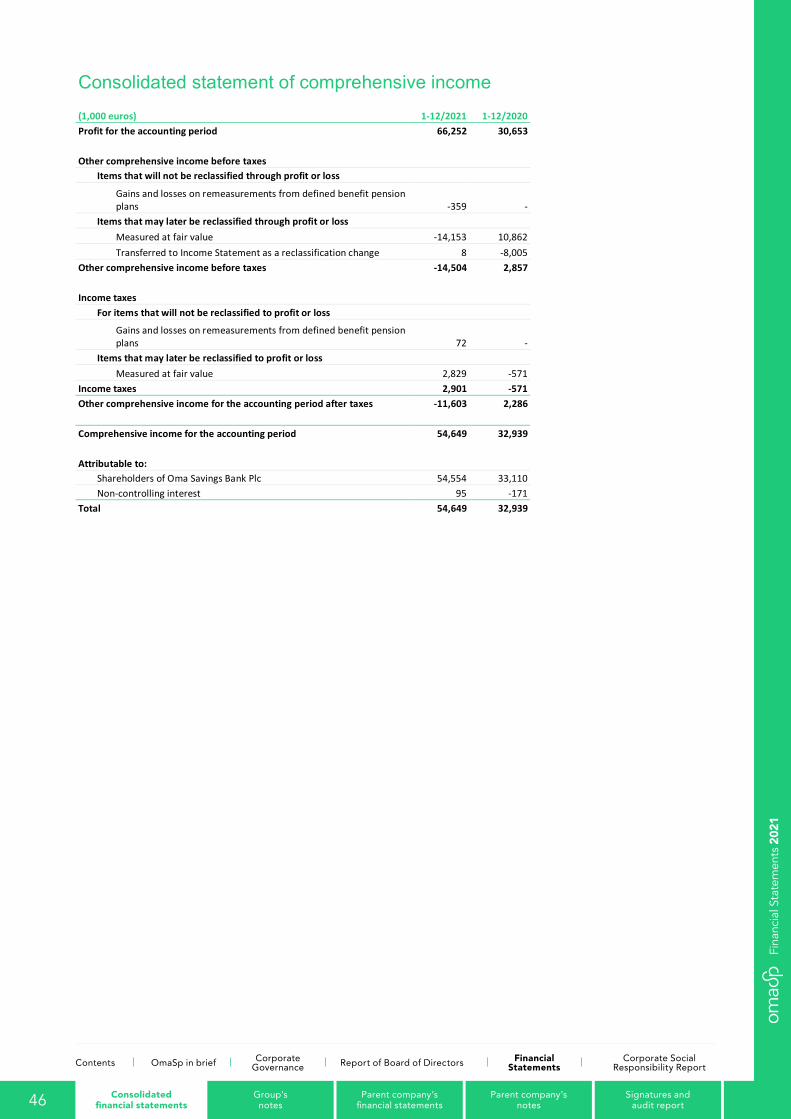
28
Consolidated statement of comprehensive income (1,000 euros) 1-12/2021 1-12/2020 Profit for the accounting period 66,252 30,653
Other comprehensive income before taxes
Items that will not be reclassified through profit or loss
Gains and losses on remeasurements from defined benefit pension plans -359 -
Items that may later be reclassified through profit or loss Measured at fair value -14,153 10,862 Transferred to Income Statement as a reclassification change 8 -8,005 Other comprehensive income before taxes -14,504 2,857
Income taxes
For items that will not be reclassified to profit or loss
Gains and losses on remeasurements from defined benefit pension plans 72 -
Items that may later be reclassified to profit or loss Measured at fair value 2,829 -571 Income taxes 2,901 -571 Other comprehensive income for the accounting period after taxes -11,603 2,286
Comprehensive income for the accounting period 54,649 32,939
Attributable to:
Shareholders of Oma Savings Bank Plc 54,554 33,110 Non-controlling interest 95 -171 Total 54,649 32,939
46
Fina
ncia
l Sta
tem
ents
202
1
Consolidated financial statements
Group’s notes
Parent company’s financial statements
Parent company’s notes
Signatures and audit report
Contents OmaSp in brief Corporate Governance Report of Board of Directors Financial
StatementsCorporate Social
Responsibility Report
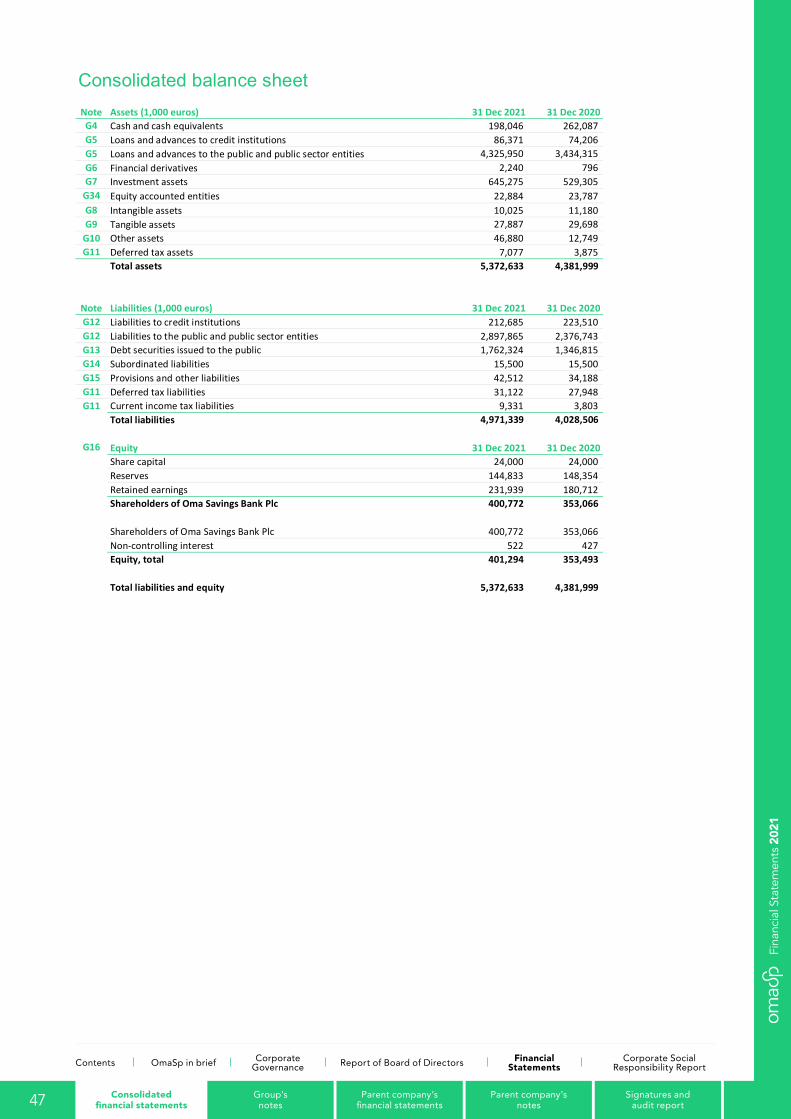
29
Consolidated balance sheet
Note Assets (1,000 euros) 31 Dec 2021 31 Dec 2020 G4 Cash and cash equivalents 198,046 262,087 G5 Loans and advances to credit institutions 86,371 74,206 G5 Loans and advances to the public and public sector entities 4,325,950 3,434,315 G6 Financial derivatives 2,240 796 G7 Investment assets 645,275 529,305
G34 Equity accounted entities 22,884 23,787 G8 Intangible assets 10,025 11,180 G9 Tangible assets 27,887 29,698
G10 Other assets 46,880 12,749 G11 Deferred tax assets 7,077 3,875
Total assets 5,372,633 4,381,999
Note Liabilities (1,000 euros) 31 Dec 2021 31 Dec 2020 G12 Liabilities to credit institutions 212,685 223,510 G12 Liabilities to the public and public sector entities 2,897,865 2,376,743 G13 Debt securities issued to the public 1,762,324 1,346,815 G14 Subordinated liabilities 15,500 15,500 G15 Provisions and other liabilities 42,512 34,188 G11 Deferred tax liabilities 31,122 27,948 G11 Current income tax liabilities 9,331 3,803
Total liabilities 4,971,339 4,028,506
G16 Equity 31 Dec 2021 31 Dec 2020 Share capital 24,000 24,000 Reserves 144,833 148,354 Retained earnings 231,939 180,712 Shareholders of Oma Savings Bank Plc 400,772 353,066 Shareholders of Oma Savings Bank Plc 400,772 353,066 Non-controlling interest 522 427 Equity, total 401,294 353,493 Total liabilities and equity 5,372,633 4,381,999
47
Fina
ncia
l Sta
tem
ents
202
1
Consolidated financial statements
Group’s notes
Parent company’s financial statements
Parent company’s notes
Signatures and audit report
Contents OmaSp in brief Corporate Governance Report of Board of Directors Financial
StatementsCorporate Social
Responsibility Report
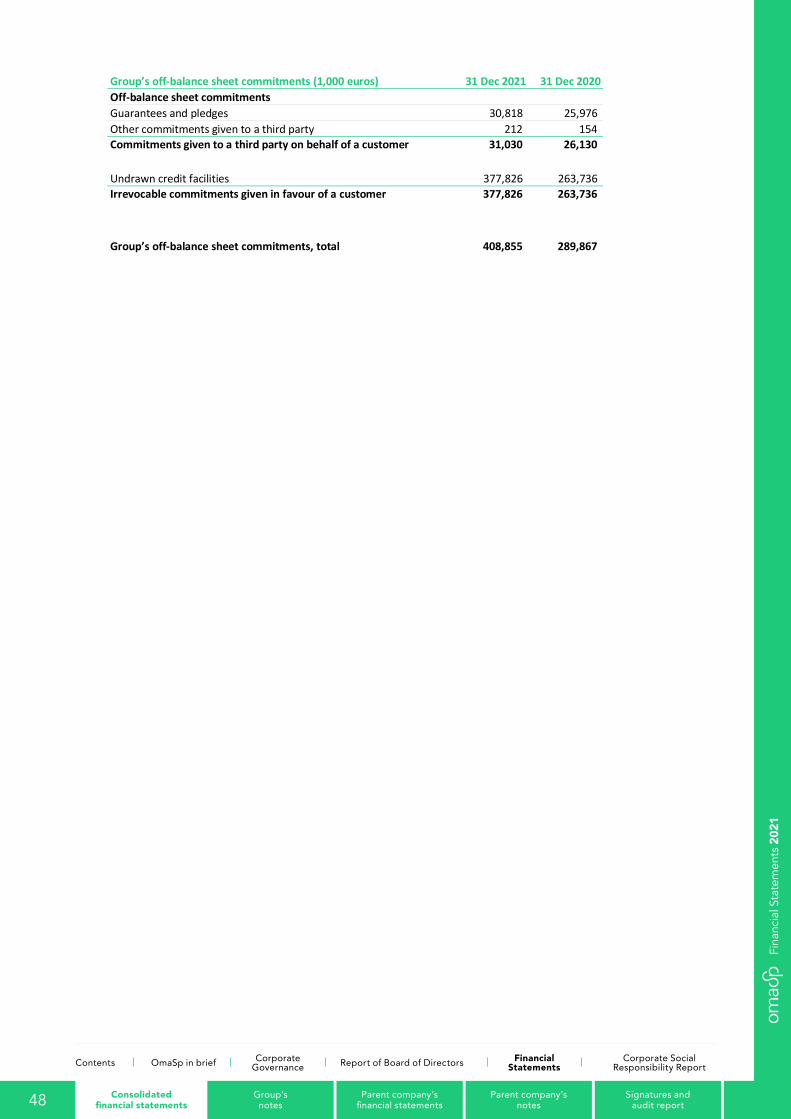
30
Group’s off-balance sheet commitments (1,000 euros) 31 Dec 2021 31 Dec 2020 Off-balance sheet commitments Guarantees and pledges 30,818 25,976 Other commitments given to a third party 212 154
Commitments given to a third party on behalf of a customer 31,030 26,130
Undrawn credit facilities 377,826 263,736
Irrevocable commitments given in favour of a customer 377,826 263,736
Group’s off-balance sheet commitments, total 408,855 289,867
48
Fina
ncia
l Sta
tem
ents
202
1
Consolidated financial statements
Group’s notes
Parent company’s financial statements
Parent company’s notes
Signatures and audit report
Contents OmaSp in brief Corporate Governance Report of Board of Directors Financial
StatementsCorporate Social
Responsibility Report
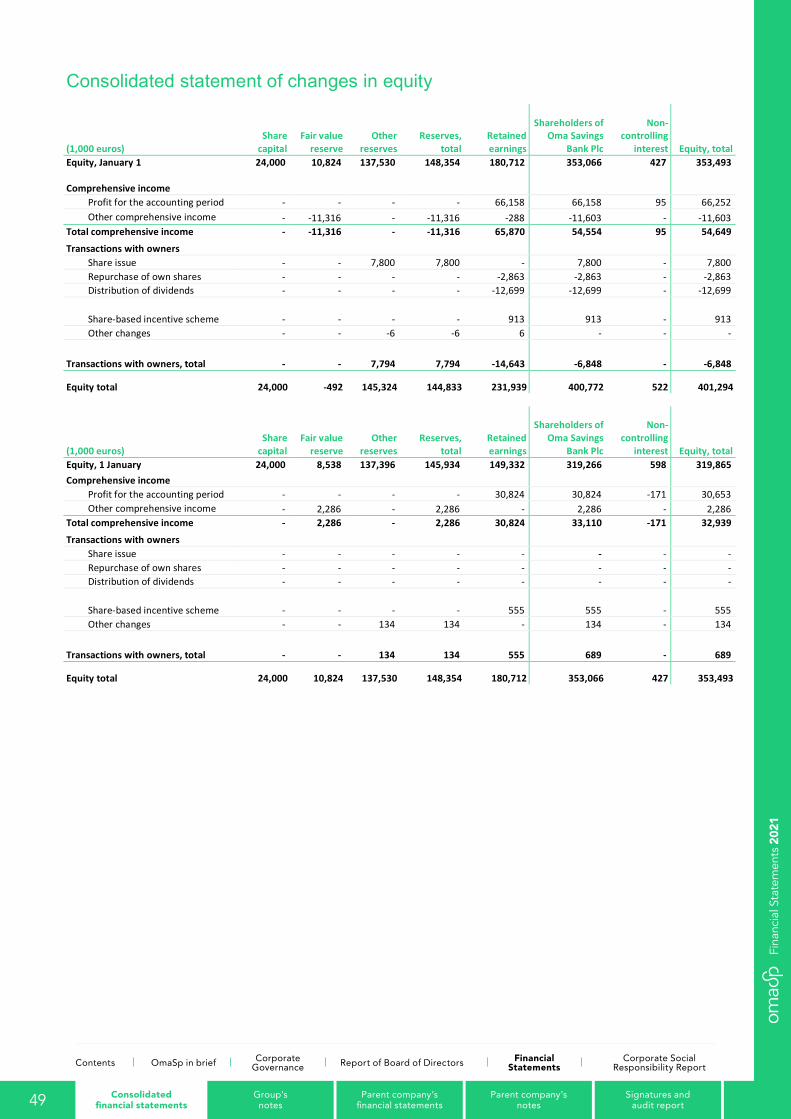
31
Consolidated statement of changes in equity
(1,000 euros) Share
capital Fair value
reserve Other
reserves Reserves,
total Retained earnings
Shareholders of Oma Savings
Bank Plc
Non-controlling
interest Equity, total Equity, January 1 24,000 10,824 137,530 148,354 180,712 353,066 427 353,493
Comprehensive income
Profit for the accounting period - - - - 66,158 66,158 95 66,252 Other comprehensive income - -11,316 - -11,316 -288 -11,603 - -11,603 Total comprehensive income - -11,316 - -11,316 65,870 54,554 95 54,649
Transactions with owners Share issue - - 7,800 7,800 - 7,800 - 7,800 Repurchase of own shares - - - - -2,863 -2,863 - -2,863 Distribution of dividends - - - - -12,699 -12,699 - -12,699
Share-based incentive scheme - - - - 913 913 - 913 Other changes - - -6 -6 6 - - -
Transactions with owners, total - - 7,794 7,794 -14,643 -6,848 - -6,848
Equity total 24,000 -492 145,324 144,833 231,939 400,772 522 401,294
(1,000 euros) Share
capital Fair value
reserve Other
reserves Reserves,
total Retained earnings
Shareholders of Oma Savings
Bank Plc
Non-controlling
interest Equity, total Equity, 1 January 24,000 8,538 137,396 145,934 149,332 319,266 598 319,865
Comprehensive income Profit for the accounting period - - - - 30,824 30,824 -171 30,653 Other comprehensive income - 2,286 - 2,286 - 2,286 - 2,286 Total comprehensive income - 2,286 - 2,286 30,824 33,110 -171 32,939
Transactions with owners Share issue - - - - - - - - Repurchase of own shares - - - - - - - - Distribution of dividends - - - - - - - -
Share-based incentive scheme - - - - 555 555 - 555 Other changes - - 134 134 - 134 - 134
Transactions with owners, total - - 134 134 555 689 - 689
Equity total 24,000 10,824 137,530 148,354 180,712 353,066 427 353,493
49
Fina
ncia
l Sta
tem
ents
202
1
Consolidated financial statements
Group’s notes
Parent company’s financial statements
Parent company’s notes
Signatures and audit report
Contents OmaSp in brief Corporate Governance Report of Board of Directors Financial
StatementsCorporate Social
Responsibility Report
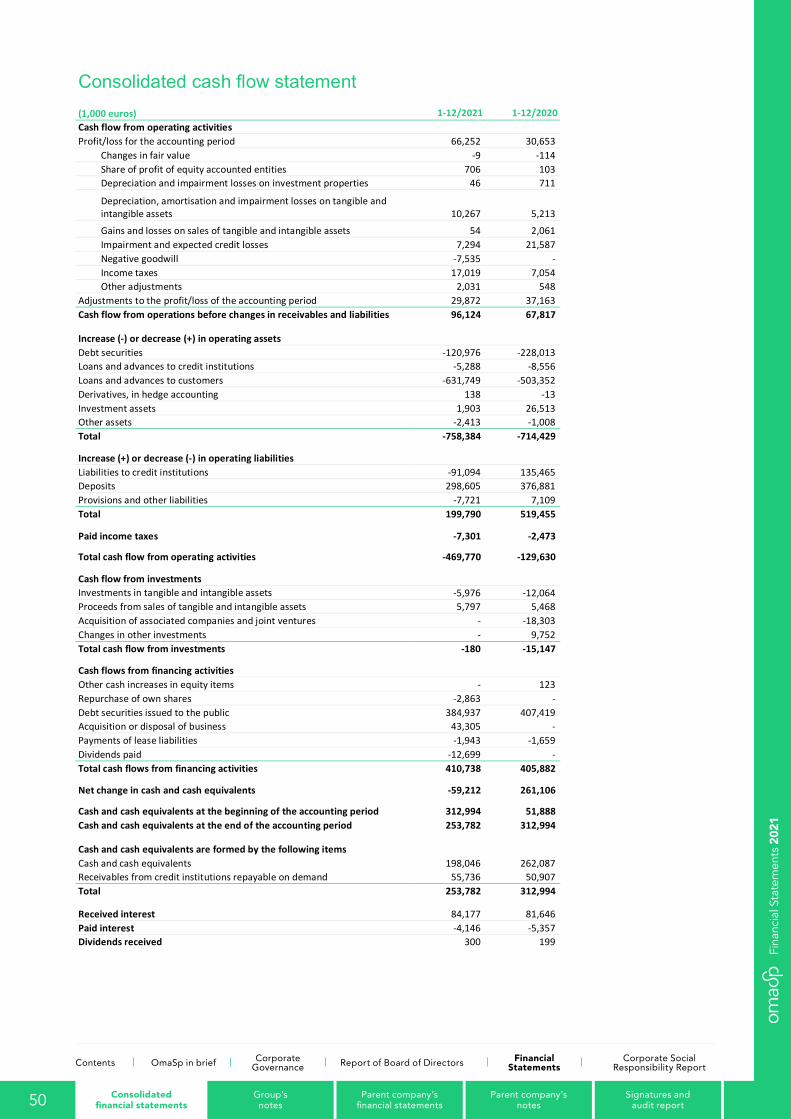
32
Consolidated cash flow statement (1,000 euros) 1-12/2021 1-12/2020 Cash flow from operating activities Profit/loss for the accounting period 66,252 30,653
Changes in fair value -9 -114 Share of profit of equity accounted entities 706 103 Depreciation and impairment losses on investment properties 46 711
Depreciation, amortisation and impairment losses on tangible and intangible assets 10,267 5,213
Gains and losses on sales of tangible and intangible assets 54 2,061 Impairment and expected credit losses 7,294 21,587 Negative goodwill -7,535 - Income taxes 17,019 7,054 Other adjustments 2,031 548 Adjustments to the profit/loss of the accounting period 29,872 37,163 Cash flow from operations before changes in receivables and liabilities 96,124 67,817
Increase (-) or decrease (+) in operating assets Debt securities -120,976 -228,013 Loans and advances to credit institutions -5,288 -8,556 Loans and advances to customers -631,749 -503,352 Derivatives, in hedge accounting 138 -13 Investment assets 1,903 26,513 Other assets -2,413 -1,008 Total -758,384 -714,429
Increase (+) or decrease (-) in operating liabilities Liabilities to credit institutions -91,094 135,465 Deposits 298,605 376,881 Provisions and other liabilities -7,721 7,109 Total 199,790 519,455
Paid income taxes -7,301 -2,473
Total cash flow from operating activities -469,770 -129,630
Cash flow from investments Investments in tangible and intangible assets -5,976 -12,064 Proceeds from sales of tangible and intangible assets 5,797 5,468 Acquisition of associated companies and joint ventures - -18,303 Changes in other investments - 9,752 Total cash flow from investments -180 -15,147
Cash flows from financing activities Other cash increases in equity items - 123 Repurchase of own shares -2,863 - Debt securities issued to the public 384,937 407,419 Acquisition or disposal of business 43,305 - Payments of lease liabilities -1,943 -1,659 Dividends paid -12,699 - Total cash flows from financing activities 410,738 405,882
Net change in cash and cash equivalents -59,212 261,106
Cash and cash equivalents at the beginning of the accounting period 312,994 51,888 Cash and cash equivalents at the end of the accounting period 253,782 312,994
Cash and cash equivalents are formed by the following items Cash and cash equivalents 198,046 262,087 Receivables from credit institutions repayable on demand 55,736 50,907 Total 253,782 312,994
Received interest 84,177 81,646 Paid interest -4,146 -5,357 Dividends received 300 199
50
Fina
ncia
l Sta
tem
ents
202
1
Consolidated financial statements
Group’s notes
Parent company’s financial statements
Parent company’s notes
Signatures and audit report
Contents OmaSp in brief Corporate Governance Report of Board of Directors Financial
StatementsCorporate Social
Responsibility Report
33
Notes to the consolidated financial statements
G1 Accounting principles for the consolidated financial statement
1. About the accounting principles
Oma Savings Bank Plc is a Finnish public limited
company, whose domicile is in Seinäjoki and head office
in Lappeenranta, Valtakatu 32, 53100 Lappeenranta. The
Group's parent company is Oma Savings Bank Plc. Copies of the Financial Statements and Interim Reports
are available on the Bank’s website www.omasp.fi.
The Board of Directors has approved the Operating
Report and Financial Statements for the period from 1
January to 31 December 2021 at its meeting 24 February 2022, and the Annual General Meeting will approve them
on 30 March 2022. Oma Savings Bank Group is formed as follows:
Subsidiaries
• Real estate company Lappeenrannan Säästökeskus
holding 100%
• SAV-Rahoitus Oyj holding 50.7%
Associated companies
• GT Invest Oy holding 48.7%
• City Kauppapaikat Oy holding 42.1%
Joint ventures and joint operations
• Figure Taloushallinto Oy holding 25%
• Deleway Projects Oy holding 49%
• Housing company Seinäjoen Oma Savings Bank house holding 25.5%
The Consolidated Financial Statements of Oma Savings Bank Plc (hereinafter Company) have been prepared in
compliance with the International Financial Reporting
Standards (IFRS), and in accordance with SIC and IFRIC interpretations. The preparation of the Notes to the
Financial Statements took into account also the Finnish
accounting and entity legislation and the supplementary requirements of authorities’ requirements.
The Consolidated Financial Statements (hereinafter
Group) are presented in thousands of euros unless
otherwise specified. The figures in the notes are rounded off, so the combined sum of single figures may deviate
from the grand total presented in a table or a calculation.
The accounting and functional currency of the Group and
its companies is the euro. The Consolidated Financial Statements can also be signed electronically.
The Group’s Consolidated Financial Statements have been prepared on a historical cost basis, except for
financial assets recognised at fair value through profit or
loss, financial assets held for trading, fair value hedges (for hedged risk) and hedging derivatives used in fair value
or cash flow hedges that are recognised at fair value.
1.1 New and revised standards and interpretations applied Oma Savings Bank has applied the standard amendments and interpretations concerning the company that came
into force during the financial year. The changes that took
effect in 2021 have not had a material effect on the Group's result for the financial year, financial position or
presentation of Financial Statements.
In April 2021, the IFRS Interpretations Committee issued a final agenda decision on the accounting for configuration
and customization costs for cloud services (IAS 38
Intangible Assets). In this agenda decision IFRS IC considered, whether, applying IAS 38, the customer
recognises an intangible asset in relation to configuration
or customisation of the application software, and if an intangible asset is not recognised, how the customer
accounts for the configuration or customisation costs. The
company has taken into account the effects of the agenda decision on the handling of cloud services during the
financial period and stated that the decision has not had a
significant impact on the company's financial reporting.
51 Consolidated financial statements
Group’s notes
Parent company’s financial statements
Parent company’s notes
Signatures and audit report
Contents OmaSp in brief Corporate Governance Report of Board of Directors Financial
StatementsCorporate Social
Responsibility Report
Fina
ncia
l Sta
tem
ents
202
1
34
2. Consolidation principles
2.1. Subsidiaries The Group’s Consolidated Financial Statements include
the parent company and its subsidiaries in which the bank
has control. Control arises when the Group, by participating in an entity, is exposed to or is entitled to a
variable return on an investee and is able to exercise that
return by exercising its power over the investee.
Mutual ownership in the Group has been eliminated using
the acquisition method. The consideration transferred, the identifiable assets of the acquired entity and liabilities
taken for liability are valued at fair value at the time of
acquisition. Any goodwill shall be recorded in the amount by which the cost exceeds the Group's share of the fair
value of acquired assets and liabilities at the time of
acquisition. Expenditure related to acquisition has been
recorded as an expense. The non-controlling owners share is valued at an amount equal to the non-controlling
owners´ share of the identifiable net assets of the subject
of the acquisition. If the consideration given undercuts identifiable assets and liabilities taken for liability, negative
goodwill arise due to low cost trading, recorded in the
Income Statement under other operating income.
The acquired subsidiaries are included in the Consolidated
Financial Statements from the moment that the Group gains control over them and the sold subsidiaries are
included until control ceases. Internal transactions,
receivables and liabilities, unrealised profits and internal profit distribution in the Group have been eliminated in the
Consolidated Financial Statements.
Unrealised losses are not eliminated if the loss is due to
impairment. The distribution of profit or loss for the period
to the controlling and non-controlling interests of the parent company is disclosed separately in the income
statement. The distribution of comprehensive income for
the period to the controlling and non-controlling interests
of the parent company is presented in the statement of comprehensive income. Profit or loss for the period and
comprehensive income are allocated to the controlling and
non-controlling interests of the parent company, even if this were to result in the non-controlling interest becoming
negative. The share of equity belonging to non-controlling
interest is presented as a separate item in the balance
sheet, as part of equity.
2.2. Joint ventures and associated companies Joint ventures are defined as joint arrangements in which
the bank has joint control together with other parties to the arrangement and the arrangement brings the bank the
right to the arrangement’s net assets. Joint ventures and
associated companies have been consolidated using the equity method. The investment is initially recognised at
cost, after which the Group’s share of the profit of the joint
venture for the period is consolidated in the income statement. Similarly, the potential Group’s share of other
comprehensive income of the joint venture or associate
company is recognised in the Group’s comprehensive income.
A joint venture is an arrangement in which the Group has
right to the arrangement’s net assets, while in a joint operation, the Group has rights to the assets and liabilities
of the arrangement. Mutual real estate companies are joint
operations from which the Group has combined its own assets, liabilities, income and expenses and its own share
of common assets, liabilities, income and expenses.
3. Goodwill
Goodwill arising from the combination of business operations is recognised in the amount by which the
combined amount of transferred consideration, non-
controlling interest in the acquired item and the previously owned share exceeds the fair value of the acquired net
assets.
No depreciation is recognised in goodwill, but it is tested in
case of impairment at least on every reporting day and
whenever there is any indication that the value may have decreased. Goodwill is valued at the initial acquisition
value less impairment.
4. Financial instruments
4.1. Classification and valuation of financial assets On initial recognition, the item belonging to financial assets is valued at fair value in accordance with IFRS 9. If
52 Consolidated financial statements
Group’s notes
Parent company’s financial statements
Parent company’s notes
Signatures and audit report
Contents OmaSp in brief Corporate Governance Report of Board of Directors Financial
StatementsCorporate Social
Responsibility Report
Fina
ncia
l Sta
tem
ents
202
1
35
the financial asset is an item not recognised at fair value
through profit or loss, the incremental direct transaction
costs from the acquisition of the assets are added to it or deducted from it.
Financial assets are classified in one of the three following classes when they are initially recognised:
• valued at amortised cost,
• valued at fair value through other comprehensive income or
• financial assets valued at fair value through profit or loss.
Immediately subsequent to the initial recognition, a loss allowance concerning expected credit losses (ECL) is
recognised on the financial assets, if the financial asset is
valued at amortised cost or at fair value through other comprehensive income. Impairments of financial assets
are assessed for each receivable and receivable category.
Impairments that cannot be allocated to individual receivables are recognised as impairments of a receivable
category.
The classification and valuation of financial assets is based on the company’s business model and nature of
contractual cash flows. Financial assets are not
reclassified subsequent to their initial recognition, except in the period after the Group changes its business model
for managing financial assets.
4.1.1 Financial assets valued at amortised cost Financial assets are valued at amortised cost when the
contractual cash flows only include capital repayments and interest payments, and the company holds them as
part of a business model whose objective is to collect
contractual cash flows over the life of the contract. Financial assets valued at amortised cost include
receivables from customers and credit institutions, as well
as cash assets.
4.1.2 Financial assets valued at fair value through other comprehensive income Financial assets are valued at fair value through other
comprehensive income when the contractual cash flows
consist only of capital repayments and interest payments and the company holds the financial asset as part of a
business model whose objective is both collecting
contractual cash flows and possibly selling the financial
assets before the maturity date. Oma Savings Bank has classified some of its debt instruments to be valued at fair
value through other comprehensive income.
4.1.3 Financial assets valued at fair value through profit or loss Financial assets are valued at fair value through profit or loss, unless they are valued at amortised cost or at fair
value through other comprehensive income. Items that do
not meet the SPPI test are also recognised at fair value through profit or loss. Mainly financial assets whose
business model is to trade actively, and which have been
acquired to generate earnings in the short term, are recognised at fair value through profit or loss. Oma
Savings Bank has classified some of its debt securities in
this class.
4.2 Equity instrument Equity instruments are recognised at fair value through
profit or loss, unless the company makes an irrevocable choice at the time of acquisition to measure the
investment at fair value through other comprehensive
income.
The Group does not have equity investments valued at fair
value through other comprehensive income. All equity instruments recognised according to IFRS 9 are
recognised at fair value through profit and loss.
4.2.1 Assessment of business models The company specifies the business model objective for
each portfolio according to how business operations are managed and reported to the management. The
objectives are specified on the basis of the investment and
lending policy approved by the company.
The business model describes a portfolio-specific earnings
model with the purpose of collecting only contractual cash
flows, collecting contractual cash flows and cash flows from sales of financial assets or collecting cash flows from
trading in financial assets.
4.2.2 Cash flow testing If the business model is other than trading, the company
assesses whether the contractual cash flows are based
53 Consolidated financial statements
Group’s notes
Parent company’s financial statements
Parent company’s notes
Signatures and audit report
Contents OmaSp in brief Corporate Governance Report of Board of Directors Financial
StatementsCorporate Social
Responsibility Report
Fina
ncia
l Sta
tem
ents
202
1

36
solely on payment of principal and interest (so called SPPI
test). If the cash flow criterion is not met, the financial
asset is recognised at fair value through profit or loss.
In assessing whether contractual cash flows are solely
payments of principal and interest, the company will consider the contractual terms of the instrument. This will
include assessing whether the financial asset contains a
contractual term that could change the timing or amount of cash flows so that it does not meet the SPPI contractual
cash flow characteristics test requirements.
The retail bank and corporate loans granted by the
company contain a prepayment feature. This feature does
meet the cash flow testing criteria as, in connection with a prematurely repaid loan, the company is entitled to collect
reasonable compensation for the premature termination of
the contract.
4.3 Changes in contractual cash flows Whenever a change is made to a financial asset or liability
valued at amortised cost without removing the asset or liability from the balance sheet any profit or loss must be
recognised. The profit or loss is calculated as the
difference between the original contractual cash flows and the modified cash flows discounted at the contractual
interest rate. An example of a situation of this kind are
changes made to the amortisation plan for a loan granted to the customer or granting amortisation suspension.
Changes due to a deterioration in the customers solvency
are treated as a significant growth in credit risk.
In connection with significant loan term changes, the loan
is derecognised from the balance sheet and a new loan is recognised in its place. If the credit risk of the loan
derecognised from the balance sheet has grown
significantly, the new loan is recognised in the balance sheet as credit-impaired.
4.4 Derecognition The Group derecognises a financial asset when the contractual rights to cash flows from the financial asset
expire, or it transfers the rights to receive the contractual
cash flows in a transaction in which substantially all of the risks and rewards of ownership of the financial asset are
transferred or in which the Group does not retain control of
the financial assets.
4.5 Impairment of financial assets The impairment estimate, the expected credit loss (ECL),
is recognised on all debt instruments belonging to financial assets valued at amortised cost and valued at fair value
through the fair value reserve and on off-balance sheet
loan commitments and guarantee contracts.
For financial assets valued at amortised cost, a loss
allowance for the expected credit loss is recognised in a separate account as a reduction in the carrying amount.
The expected credit loss on the financial assets valued at
fair value through other comprehensive income is recognised in the fair value reserve through other
comprehensive income. For off-balance-sheet items, the
expected credit loss is recognised as a provision.
The expected credit losses are measured at an amount
equal to lifetime ECL of the financial asset when, on the
date of reporting, the credit risk related to the financial asset has significantly increased since its initial recognition
(stage 2) or when the contract is credit-impaired (stage 3).
Otherwise, the expected credit loss is calculated based on the assessment that default event will occur within 12
months of the date of reporting.
The expected credit losses are recognised for each date
of reporting and they describe:
• an unbiased and probability-weighted monetary amount that is determined by evaluating a range of
possible outcomes,
• the time value of money and
• reasonable and justifiable information that is available
on the date of reporting without any excessive costs or efforts and which applies to past events, current
circumstances and forecasts of the economic
environment.
The financial assets used in the calculations are classified
into three stages, which describe the weakening of the quality of the financial assets compared to the initial
recognition.
Stage 1: Contracts whose credit risk has not grown since
the initial recognition and for which a 12-month ECL is
calculated.
54 Consolidated financial statements
Group’s notes
Parent company’s financial statements
Parent company’s notes
Signatures and audit report
Contents OmaSp in brief Corporate Governance Report of Board of Directors Financial
StatementsCorporate Social
Responsibility Report
Fina
ncia
l Sta
tem
ents
202
1
37
Stage 2: Contracts whose credit risk has grown
significantly since the initial recognition and for which a
lifetime ECL is calculated. Stage 3: Credit-impaired contracts (counterparty has been
classified as being in default) for which a lifetime ECL is
calculated.
4.5.1 Significant increase in credit risk In assessing whether the credit risk related to a financial instrument has increased significantly, the change in the
risk of a default occurring over the expected life of the
financial instrument shall be observed. When carrying out this assessment, the risk of default occurring over the
expected life of the instrument at the reporting date is
compared with the risk of default at the date of initial recognition. A significant increase in credit risk leads to the
transfer of the loan from stage 1 to stage 2. The company
uses both quantitative and qualitative indicators in credit
risk assessment.
The company uses as indicators to assess a significant
increase in credit risk, among other things, changes in the behavioral scoring and rating classifications. In the case of
classifications, absolute change is used, i.e., if the retail
customer's behavioral scoring gets a value of C or lower, or if the rating of a corporate customer is B or lower, the
credit risk is considered to have significantly increased. In
addition to classifications, credit risk is considered to have increased significantly if the customer has a forbearance,
the customer is on the watch list or contractual payments
are at least 30 but not more than 90 days delayed. This review is automated in the calculation.
Loan-specific stage allocations are monitored monthly. The loan can improve at most one step per calculation
date. Loans from stage 2 are transferred to stage 1 only
after a delay period. With a loan at stage 2, improvement to stage 1 requires at least two consecutive months in
which the loan does not meet the criteria of stage 2 or 3.
This means that the loan is always at least two months in
stage 2, regardless of whether it is a loan improved from stage 3, which has not met the stage 2 or 3 criteria at any
stage after improvement, or which has met the criteria for
stage 2 or initially in stage 2 been a loan that would be entering stage 1.
4.5.2 Definition of default The company has defined defaults (stage 3) as occurring
in accordance with IFRS 9 in the following situations:
• Contractual payments are 90 days overdue,
• A loan is non-performing or assigned to a collection agency,
• The customer has insolvency marking,
• The customer is bankrupt or subject to debt restructuring or
• 20% or more of the customer's loans meet the above
default conditions, as a result of which all of the customer's loans are considered to be in default.
The definition corresponds with the definition of default used by the Group in its regulatory reporting and is
consistent with the definition of customer default. A debtor
is default when the aggregate amount of its overdue credit obligations exceeds both of the thresholds listed below. All
receivables due at the overall level are taken into account,
regardless of maturity.
• Absolute threshold of EUR 100 / EUR 500: The total amount of receivables due to the Group is at least EUR 100 for retail exposures or at least EUR 500 for
all other “non-retail” receivables.
• Relative 1% threshold: The total amount of payments due to the Group in relation to the total amount of
each debtor's liabilities is at least 1% of the total receivables
Once both thresholds have been met for 90 consecutive days, the customer is classified as insolvent. The other
criterion of uncertain repayment may also result in
customer default if it is likely that the customer will not repay their credit obligation in full without resorting to
collateral liquidation.
In assessing when a debtor is in a state of default, the
company takes into account qualitative indicators such as
violations of loan terms or covenants and quantitative
indicators such as the number of days past due date, by using internal and external sources to collect information
on the debtor’s financial position.
4.5.3 Inputs of expected credit loss model The calculation of the expected credit losses is based on
portfolio-specific calculation rules. The Group’s loan
55 Consolidated financial statements
Group’s notes
Parent company’s financial statements
Parent company’s notes
Signatures and audit report
Contents OmaSp in brief Corporate Governance Report of Board of Directors Financial
StatementsCorporate Social
Responsibility Report
Fina
ncia
l Sta
tem
ents
202
1
38
portfolio is divided on the basis of product-specific risk
characteristics into the following clusters:
• Loans to housing corporations
• Private customers’ home mortgages and consumer credits
• Accounts with overdraft facilities
• Credit cards
• Loans to farmers
• Student loans
• Corporate loans Private customers’ home mortgages and consumer credits
and corporate customers’ loans form the Group’s two most
significant clusters. With regard to these two clusters, the calculation of the expected credit losses is based on the
Exposure at Default (EAD), Probability of Default (PD) and
the Loss Given Default (LGD). The company uses the
recorded customers’ repayment behaviour data, customer-specific ratings and loanspecific collateral values as the
basis for determining the parameters.
When calculating home mortgages and consumer credits,
the PD parameter used is based on vintage analysis, in
which loans are monitored based on their maturity. In terms of corporate loans, the PD parameter is based on a
transition matrix describing changes in the customer-
specific ratings. Credit rating is a grade assigned by an external party. In smaller portfolios, the PD parameter
applied by the company is a simple lossrate model.
The Exposure at Default (EAD) is the amount of exposure
at the reporting date. Its calculation takes into account the
repayments to the loan as stated in the payment plan. However, certain financial instruments include both a loan
principal and an undrawn portion of a loan commitment.
The undrawn portion of a loan is taken into account in the exposures for the total limit granted. With credit card
receivables, EAD calculation applies the so-called CCF
coefficient when taking into account undrawn limits. The
CCF coefficient is 100% for all limite-related products, in which case it is considered that at the time of the default of
the loan, all undrawn share is still available to the
counterparty. In ECL calculation, the maturity of check accounts is defined as three years and five years for credit
card receivables.
Loss Given Default (LGD) describes the credit losses’
share of the loan capital after loan-specific collateral has
been factored in, when the receivable is classified in stage 3.
For debt security investments, the Group determines the allowance for credit loss using the formula EAD*PD*LGD.
Instrument-specific material from the market database is
used as the source for calculating PDs. In addition, the low credit risk exemption is applied for debt security
investments with a credit rating of at least investment
grade at the reporting date. The investment grade level is the highest possible rating level that debt security
investments can receive from credit rating agencies and
therefore the low credit risk exemption may apply to such investments. In these cases, the allowance for credit loss
will be measured at an amount equal to the 12-month
expected credit losses.
The management of the company monitors the
development of an allowance for credit loss to ensure that
the model properly reflects the amount of expected credit loss. If necessary, the management refines the calculation
parameters.
4.6 Recognising final credit losses Financial assets are derecognised from the balance sheet
when it is expected that payment on the loans will no longer be received and the final credit loss can be
calculated. The previously recognised expected credit loss
is reversed at the same time as the item is removed from the balance sheet and the final credit loss is recognised.
The loans are removed from the balance sheet when their enforcement activities have been finished or when the
loan terms are changed significantly, for example in
connection with refinancing. After derecognition, payments allocated to recoveries of amounts previously written off
are recognised through profit or loss in the item
‘Impairment losses on financial assets, net’.
56 Consolidated financial statements
Group’s notes
Parent company’s financial statements
Parent company’s notes
Signatures and audit report
Contents OmaSp in brief Corporate Governance Report of Board of Directors Financial
StatementsCorporate Social
Responsibility Report
Fina
ncia
l Sta
tem
ents
202
1
39
4.7 Classification and valuation of financial liabilities At the time of the initial recognition, financial liabilities are
classified in one of the following classes:
• financial assets valued at amortised cost, or
• recognised at fair value through profit and loss.
Financing liabilities are originally recognised at fair value.
Consequently, financial liabilities, with the exception of
liabilities recognised at fair value through profit and loss, are valued at amortised cost using the effective interest
method. Transaction costs are included in the original
carrying value of financial liabilities valued at amortised cost. Transaction costs related to financial liabilities
recognised at fair value through profit or loss are
expensed as incurred.
Financial liabilities valued at fair value through profit or
loss comprise derivative instruments to which hedge
accounting is not applied. At the reporting date, the Group does not have derivative instruments valued at fair value
through profit or loss.
Liabilities to credit institutions, liabilities to the public and
general government as well as debt securities issued to
the public are recognised in other financial liabilities valued at amortised cost.
Financial liabilities are not reclassified subsequent to their initial recognition.
4.8 Offsetting financial assets and liabilities Financial assets have not been netted in the Group’s
financial statements.
4.9 Items denominated in foreign currencies Assets and liabilities denominated in foreign currencies
outside of the euro zone have been translated into to
euros as per the European Central Bank’s average rate on the reporting date. On the income statement, foreign
currency differencies that arising from during valuation
have been recognised in net gains from investment operations.
4.10 Cash and cash equivalents Cash and cash equavalents consist of cash, bank
receivables and short-term deposits of less than three months.
4.11 Determining the fair value Fair value is the price that would be received for the sale
of an asset or that would be paid for assuming a liability
between market participants in a common transaction occurring on the valuation date.
The fair value of a financial instrument is determined either
utilising quoted prices obtained from active markets or, if active markets do not exist, utilising an established
valuation method. Markets are considered to be active if
price quotes are easily and regularly available and if they reflect real and regularly reoccurring market transactions
between parties that are independent of each other. The
current bid price is used as the quoted market price of
financial assets.
If there is an established valuation method in the markets
for financial instruments for which a market price cannot be directly acquired, the fair value is based on the
generally used calculation model of market price and on
the input quotes used by the model.
If the valuation method is not well-established in the
markets, a specific widely recognised valuation model for the product in question is used to determine the market
value. Valuation models are based on widely utilized
calculation methods and they cover all factors that market participants would take into consideration when calculating
prices. When determining the fair value, uses observable
prices of market transactions, discounted cash flows and the fair value at the time of financial statements of another,
essentially similar instrument. The valuation methods take
into account credit risk assessments, used discount rates, the possibility of prepayments and other factors that
impact the valuation of the financial instrument's fair value.
The fair values of financial instruments are divided in three hierarchies according to how the fair value is determined:
Level 1: Fair values quoted in active markets for identical
assets or liabilities. Level 2: Fair values that have been determined by the use
of input information other than quoted in Level 1 prices,
57 Consolidated financial statements
Group’s notes
Parent company’s financial statements
Parent company’s notes
Signatures and audit report
Contents OmaSp in brief Corporate Governance Report of Board of Directors Financial
StatementsCorporate Social
Responsibility Report
Fina
ncia
l Sta
tem
ents
202
1
40
that are verifiable for assets or liabilities either directly
(e.g. as prices) or indirectly (e.g. derived from prices).
Level 3: Fair values that have been determined for assets or liabilities using inputs that are not essentially based on
verifiable market prices.
The hierarchy levels of fair values are determined based
on the lowest level of input that is significant for the
investee. The significance of an input is assessed against the item valued at fair value in its entirety. Transfers
between fair value hierarchy levels are determined to have
occurred on the date when the event or change in circumstances occurs.
5. Derivatives and hedge accounting
Oma Savings Bank hedges its interest-bearing loans
against interest rate fluctuations with derivatives and
applies hedge accounting in addition to regularly evaluating the effectiveness of such hedging and changes
in fair values. Hedge accounting conforms to the IFRS 9
standard’s provision that allows to continue to apply portfolio hedge accounting pursuant to the IAS 39
standard. The fair value of interest rate risk is hedged
using the IAS 39 “carve out” method.
Interest rate swaps are used to hedge fixed-rate deposit
stocks and stock derivatives have been used to hedge deposits, whose yield is tied to changes in stock value.
At the time of its Financial Statements, the Group has
equity derivatives to hedge deposits whose returns are tied to the change in the value of the shares. The Group
also has interest rate derivatives that protect avista-
conditional interest-bearing loans.
Derivative contracts are valued at fair value and changes
in value are recognised through profit or loss or, if hedge accounting is applied, through other comprehensive
income. The positive fair values of derivative contracts are
presented in the balance sheet assets under ‘Derivatives’.
The credit valuation adjustment (CVA) is taken into account in the valuation of assets.
The negative fair values of derivative contracts are presented in the balance sheet’s liabilities under the
‘Derivative contracts’ item. The debit valuation adjustment
(DVA) is taken into account in the valuation. Derivative
contracts are valued at fair value and hedge accounting is
applied to them. The changes in the fair value of hedged items and hedging instruments designated for hedging the
fair value are entered in the income statement item ‘Net
income on financial assets and liabilities’ and in the balance sheet as an adjustment of the item in question.
The interest expenses of hedge derivatives are presented
under interest expenses and the income under interest income.
The fair values of discontinued hedging calculation
derivatives are amortised over the period to the original maturity.
Derivatives are not held for the purpose of trading. Before beginning hedge accounting, the connection between
hedging derivatives and instruments to be hedged
(economic hedge relationship) and the effectiveness of
hedging are documented.
6. Intangible assets
The most significant intangible assets in the Consolidated
Financial Statements are the information systems used in
the banking operations and intangible assets related to customer relationships recognised in the balance sheet in
connection with acquisitions.
Intangible assets are recognised in the balance sheet if it
is likely that the expected economic benefits associated
with the asset will flow to the Group and the acquisition cost of the asset can be measured reliably.
The acquisition cost comprises the purchase price including expenditure that are direct results of preparing
the asset for its intended purpose. Internal development
work related directly to the information system project is also in the carrying amount of the asset. Expenses related
to the use of the asset and the training of personnel are
not included in the acquisition cost, nor are administrative
expenses or other general expenses. After initial recognition, the intangible asset is measured at cost less
amortisation and impairments.
Intangible assets are recognised in the balance sheet
under ‘Intangible assets’ and any amortisation is
58 Consolidated financial statements
Group’s notes
Parent company’s financial statements
Parent company’s notes
Signatures and audit report
Contents OmaSp in brief Corporate Governance Report of Board of Directors Financial
StatementsCorporate Social
Responsibility Report
Fina
ncia
l Sta
tem
ents
202
1
41
recognised on the income statement under ‘Depreciation,
amortisation and impairment losses on tangible and
intangible assets’.
The acquisition cost of intangible assets is recognised as
depreciation in accordance with useful life. Depreciations of intangible assets are commenced at the moment when
the asset is ready for use. The useful life of intangible
assets is reviewed annually.
The estimated useful lives are as follows:
• Information systems: 3 – 10 years
• Customer relationships related to deposits: 6 years
• Other intangible assets: 3 – 5 years
The accounting for cloud computing arrangements
depends on whether cloud-based software is classifies as a software intangible asset or a service contract. Those
arrangements where the Company does not have control
over the underlying software are accounted as service contracts providing the Company the right to access the
cloud provider's application software over the contract
period. The ongoing licensing fees to the application
software, together with related configuration or customisation cost incurred, are recognised under Other
operating expenses when the services are received.
Prepayments paid to the cloud vendor customizing services which are not distinct are recognised over the
contract period.
7. Tangible assets and investment properties
Based on the purpose of use, the Group’s properties are divided into properties in own use and investment
properties. The purpose of investment properties is to
generate rental income or increases in capital value. If a
property is both in own and investment use, the assets are presented separately only if they can be sold separately.
In these cases, the division is based on the ratio of square
metres in different uses.
If these parts could be sold separately, they are processed
separately in bookkeeping by the purpose of use. If the parts cannot be sold separately, the property is treated as
an investment property only if merely a small portion of the
property is in own or the personnel’s use. If the parts
cannot be sold separately, the premises are classified as
per the purpose of use of the larger area in use.
Property, plant and equipment are recognised in the
balance sheet under ‘Tangible assets’ and investment properties are recognised under ‘Investment assets’. On
the income statement, income related to properties in own
use is recognised under ‘Other operating income’ and the related expenses are recognised under ‘Other operating
expenses’. Depreciation and impairment losses from all
property, plant and equipment are recognised under ‘Depreciation, amortisation and impairment losses from
tangible and intangible assets’. Net income from
investment properties, including accumulated depreciation, amortisation and impairment, are included in
‘Net income from investment activities’. Gains or losses
arising from disposal or retirement are recognised as a
difference between received income and balance sheet value.
Property, plant and equipment as well as investment properties are valued at acquisition cost less depreciation
and impairment. Depreciations are based on estimates on
the assets’ useful lives. Depreciations are not made for land areas. Subsequent expenditure on asset is
capitalized only when it increases the future economic
benefits embodied in the specific asset to which it relates or the economic life is extended.
The estimated useful lives are primarily as follows:
• Buildings: 10 – 40 years
• Machines and equipment: 3 – 8 years
• Other tangible assets: 3 – 10 years
8. Lease agreements
Leases in which the Group functions as a lessee are
recognised in the balance sheet as lease liability and as a right-of-use asset. The right-of-use assets recognised in
the Group’s balance sheet are related to the leases on
properties, flats and machines and equipment.
At the commencement date of the lease, the right-of-use
asset is valued at acquisition cost, which includes an initial
amount of lease liability and any initial direct costs and an
59 Consolidated financial statements
Group’s notes
Parent company’s financial statements
Parent company’s notes
Signatures and audit report
Contents OmaSp in brief Corporate Governance Report of Board of Directors Financial
StatementsCorporate Social
Responsibility Report
Fina
ncia
l Sta
tem
ents
202
1

42
estimate of costs to dismantle and any rents paid by the
commencement date of the lease, minus received
incentives. The lease term of a lease agreement is defined as a period during which the agreement cannot be
terminated. A period including a possible extension or
termination option is added to the lease term, if it is relatively certain that the Group will exercise the extension
option or not use the termination option. The company’s
management has determined that the duration of offices’ permanent leases is five years.
After the start of the agreement, the Group values the fixed asset in accordance with the acquisition cost model.
Depreciation and interest expenses related to lease
liabilities are recognised in the fixed asset item. Depreciation is recognised in the period between the date
of commencement of the contract and the end of the
economic life of the fixed asset or the end of the lease
term.
The lease liability is initially measured at the present value
the rents to be paid during the lease term, which have not yet been paid. Leases are discounted at using the interest
rate implicit in the lease or the Group’s incremental
borrowing rate. When a variable lease is based on the index or price, these are taken into account in determining
the lease liability. Subsequently the lease liability is
measured using the effective interest method. Rents consist of fixed payments and variable lease payments,
which depend on the index. The lease liability is
remeasured when a change occurs in future leases, which results from a change in the index or price level used to
determine the payment in question or a change occurs in
the expected amounts paid based on the residual value guarantee. Also changes in estimates concerning the
purchase option or extension or termination option of the
underlying asset can lead to a reassessment of the lease liability. The amount resulting from the remeasurement of
the lease liability is used to adjust the carrying amount of
the right-of-use asset, or if the value of the right-of-use
asset is zero, it is recognised in profit or loss. The Group applies the recognition exemptions under IFRS 16 for
leases of no more than 12 months and low value assets.
These are expensed on a straight-line basis over the lease term. These are not recognised as assets and their related
liabilities in the balance sheet.
As a lessor, Oma Savings Bank Group does not have any
contracts that are classified as finance leases. Leases
classified as operating leases are recognised on a straight-line basis over the lease term in the income
statement item ‘Net income from investment assets’ or
‘Other operating income’. Some fixed-term leases include extension options, the effect of which is taken into account
in the calculation if it can be assumed with reasonable
certainty that the option in the agreement will be exercised.
9. Provisions
Provisions are recognised when the Group has a legal or
an actual obligation resulting from a previous event, the fulfilment of the obligation is likely and the management
can evaluate the amount of the obligation in a reliable
manner. If it is certain that partial compensation for the
obligation will be received from a third party, the compensation is recognised as a separate item.
Provisions are reviewed annually on the date of reporting
and adjusted if necessary. Provisions are valued at the current value of the amount that is expected in order to
fulfil the obligation.
10. Employee benefits
The Group’s employee benefits as per the IAS 19 Employee Benefits standard comprise short-term
employee benefits, benefits related to the termination of
employment and benefits after the employment has been terminated.
Short-term employee benefits are, for example, salaries and benefits in kind, annual holidays, performance
rewards and additional insurance that are expected to be
paid in full within 12 months from the end of the accounting period during which the employees perform the
work in question. Benefits based on the termination of
employment comprise severance payments. Pension
plans related to benefits after the employment has been terminated are classified as defined benefit plans and
defined contribution plans. Defined benefits plans are, for
the most part, agreements that include additional pension schemes.
60 Consolidated financial statements
Group’s notes
Parent company’s financial statements
Parent company’s notes
Signatures and audit report
Contents OmaSp in brief Corporate Governance Report of Board of Directors Financial
StatementsCorporate Social
Responsibility Report
Fina
ncia
l Sta
tem
ents
202
1
43
In terms of defined contribution plans, the Group makes
fixed pension insurance payments to pension insurance
companies and there is no legal or actual obligation to make additional payments if the pension insurance
company is unable to make payments on such benefits.
Expenses are recognised as expenses during the relevant accounting period.
In terms of defined benefit plans, the Group has obligations after making payments during the accounting
period. For defined benefit plans, liability is presented as
the current value of obligations resulting from the plans on the date of reporting less the fair value of funds in the
plans. The Group uses an external actuary to define the
obligations resulting from benefits after employment has been terminated.
In February 2020, Oma Savings Bank's Board of Directors
decided on a share-based incentive scheme for the Group's key personnel, in which payments are made partly
in the form of equity instruments and partly in cash. The
purpose of the cash contribution is to cover taxes and tax-like payments incurred to the key personnel. Benefits
under the plan are valued at fair value at the time they are
granted and are recognised as an expense in the income statement during the period of entitlement. The amount
recognised as an expense is based on an estimate of the
number of shares to which are expected to be entitled. The fees are fully recognised as a share-based
arrangement payable in equity and the expense is
amortised for the entire entitlement period and the expense effect is presented in the income statement under
personnel expenses. The Group revises the expected
number of shares that are expected to be ultimately exercised at each Financial Statements date. Changes in
estimates are recognised in the income statement. The
amount recognised as an expense is subsequently adjusted to reflect the number of shares finally issued. The
requirements of IFRS 2 Share-based Payment apply to
the incentive scheme.
11. Revenue recognition principles
11.1 Interest income and expenses Interest income and expenses are recognised over the
duration of the contract. Interest income and expenses are
recognised on the income statement under ‘Net interest
income’.
Significant arrangement and transaction fees are
recognised using the effective interest method based on
the average expected maturity of the loan rather than recognising the income as a one-off gain. The clarification
of recognition principles relates to new credit issued to
corporates and housing companies.
11.2 Fee and commission income and expenses Income from services offered to customers related to, for instance, payment transactions and lending, and fee and
commission income related to funds are recognised in fee
and commission income. The income is recognised when control of the performance obligation has transferred to
the customer in the amount that the Group considers itself
entitled to against services rendered. Income from
services is recognised over time. For fees and commissions spanning several years, the portion related
to the accounting period is entered. Fee and commission
expenses mainly include fees and commissions related to card and payment transactions as well as costs related to
obtaining financing.
On the basis of the exemption allowed by the IFRS 15
standard, information is not presented for the transaction
prices allocated to the remaining performance obligations, which transaction prices are part of an agreement whose
original expected duration is no more than one year, or if
the Group is entitled to invoice the customer for a consideration, the cash amount of which directly
corresponds with the value of the performance provided
by the Group to the customer by the moment of review.
11.3 Net income on financial assets and financial liabilities The following are recognised in net income on financial
assets and liabilities: gains and losses from sales,
valuation gains and losses, dividend income from financial instruments recognised at fair value in profit and loss,
including equity instruments and net income from financial
assets held for trading and net income from investment properties. Dividend income has been recognised when
an entitlement to dividend exists.
61 Consolidated financial statements
Group’s notes
Parent company’s financial statements
Parent company’s notes
Signatures and audit report
Contents OmaSp in brief Corporate Governance Report of Board of Directors Financial
StatementsCorporate Social
Responsibility Report
Fina
ncia
l Sta
tem
ents
202
1
44
Additionally, net income from currency exchanges as well
as net income from fair value hedge accounting are
recognised under the same item.
12. Income taxes
Result-based taxes of the accounting period for
companies in the Group, adjustments to taxes for previous
accounting periods and changes in deferred taxes are recognised in the Group’s income statement. Taxes are
recognised in the income statement except for items that
are directly related to equity or other items recognised in the comprehensive income statement. In these cases, the
tax is also recognised under these items. Income taxes
are recognised based on the estimated taxable income for the year.
Deferred taxes are calculated on the taxable temporary
and deductible differences between bookkeeping and taxation. Deferred tax assets are recognised up to the
amount for which there is likely to be future taxable
income, against which the temporary difference can be applied. Deferred tax assets based on unused losses
verified in taxation are recognised if the accumulation of
taxable income is likely and the asset can be utilised.
13. Operating segments
The company’s banking operations form a segment as per
the definition in the IFRS 8 Operating Segments standard.
Based on the company’s business model and the nature of operations, the entire Group is treated as a reportable
segment. The Group conducts business only in Finland.
14. Accounting principles for the financial statements requiring management’s judgement and factors of uncertainty related to estimates
Preparing financial statements in compliance with the
IFRS standards has required the Group’s management to
make certain estimates and assumptions that impact the amounts of items presented in the financial statements
and the information included in the accompanying notes.
The essential estimates by the management relate to the
future and the material factors of uncertainty in terms of
the date of reporting. They are closely related to, for
example, the determination of fair value and the impairment of financial assets, loans and other receivables
as well as tangible and intangible assets. Even though the
estimates are based on management’s best current perception, it is possible that the outcome deviate from the
estimates used in the financial statements.
During the financial years 2020 and 2021, there have
been changes in the accounting principles and
uncertainties related to estimates that require management's judgment as result of the corona
pandemic. The application of the impairment losses on
financial assets model under IFRS 9 requires the management to make estimates and assumptions about
whether the credit risk associated with the financial
instrument has increased significantly since the initial
recognition and requires forward-looking information to be taken into account in the recognition of on-demand credit
losses. The company’s management has assessed the
effects of the ongoing corona pandemic on an industry-by-industry basis and made group-specific additional loss
allowances. Due to the corona pandemic, the company
generally offered its customers loan grace periods or other arrangements under in accordance with its normal credit
policy especially in the early stages of corona pandemic.
Further details of the impact of corona pandemic on the company's risk position are provided in Note G2.
14.1 Impairment of financial assets The model for impairment of financial assets brought by
IFRS 9 requires management to make decisions,
estimates and assumptions especially on the following topics:
Selecting and defining calculation models,
• Assessing whether the credit risk related to a financial
instrument has increased significantly after initial recognition and
• Taking into account forward-looking information in the recognition of expected credit losses.
Calculation models and parameters for different portfolios
have been selected based on their business significance
and criticality. More complex models and parameters are defined for portfolios that are the largest in euro and
62 Consolidated financial statements
Group’s notes
Parent company’s financial statements
Parent company’s notes
Signatures and audit report
Contents OmaSp in brief Corporate Governance Report of Board of Directors Financial
StatementsCorporate Social
Responsibility Report
Fina
ncia
l Sta
tem
ents
202
1
45
customer numbers. The company has emphasized the
model most suitable for each type of loan in its ECL model
choices, as well as considering the company's size using the principle of proportionality.
In ECL computation, the company notes information based on future prospects. The company uses quantitative
adjustments to the PD parameter of housing and
consumer credit for corporate customers and private customers based on projections of macroeconomic
environment development. In the macroeconomic model,
PD values are adjusted from the moment of calculation to the next three years based on projections of Finland's
GDP developments and the scenarios generated from
these. Three scenarios and related realization probabilities have been defined: baseline scenario (50%), negative
scenario (30%), and positive scenario (20%). The weight
of the negative scenario is relatively high due to continuing
uncertainty in the economy. GDP changes have historically predicted the number of bankruptcies well and
have therefore been chosen as an explanatory variable for
the model. The bankruptcy indirectly presents the number of insolvency events and its use instead of the internal
default variable has been concluded due to the insufficient
size and quality of the internal material.
14.2 Evaluation of fair value The management's judgement is also used in cases where the fair value of a financial instrument is determined
through valuation methods. If no verifiable market inputs
exist on which the used valuation methods can be based, the management team has to assess which other inputs to
use to determine fair value. The principles used to
determine fair value are described in more detail in the section ‘Determining the fair value’.
Management assesses when it considers that the market for financial instruments is not functioning. Such a
situation could arise as a result of widespread disruption to
the global economy. Additionally, it must be evaluated
whether a single financial instrument is the object of active
trading and whether the price information received from
the market is a reliable indicator of the fair value of the financial instrument.
14.3 Impairment of tangible and intangible assets In connection with the financial statements, the
management reviews the impairment of tangible and
intangible assets. Impairment tests require the management team’s discretion and assessment of the
amount of money accrued by the asset in the future, its
financial useful life and used discount rate.
14.4 Business combinations In business consolidation, the determination of fair values requires consideration from the company's management
regarding the recognition and valuation at fair value of the
consideration given and identifiable assets, liabilities and
contingent liabilities. The company recognised in other operating income the negative goodwill of EUR 7.5 million
arising in connection with the acquisition of Eurajoen
Savings Bank's business in December. As part of the arrangement, a payment obligation related to the fixed-
term liability through profit or loss was recorded EUR 6.5
million for the five-year periodic of Eurajoen Savings Bank being a credit institution member leaving the consortium of
savings banks. The effect of the valuation of the loan
portfolio at the time of acquisition on the expected credit losses was EUR 0.5 million. More detailed information of
the business acquisition is presented in Note G35.
15. IFRS standards and interpretations not yet in effect
New and amended standards and interpretations
published by IASB by 31 December 2021 are not expected to have a significant impact on Oma Savings
Bank’s consolidated financial statements.
63 Consolidated financial statements
Group’s notes
Parent company’s financial statements
Parent company’s notes
Signatures and audit report
Contents OmaSp in brief Corporate Governance Report of Board of Directors Financial
StatementsCorporate Social
Responsibility Report
Fina
ncia
l Sta
tem
ents
202
1
46
G2 Risk management notes
Oma Savings Bank Plc focuses on retail banking
operations and provides its clients a broad range of
banking services both through its own balance sheet as well as by acting as an intermediary for its partners’
products. The intermediated products include credit,
investment and loan insurance products. The company is also engaged in mortgage banking
operations. The company’s key risk types are credit risk,
operational risk, market risk and liquidity risk.
The Group’s internal control, risks and risk management
and disclosure requirements of CRR, Part 8, (Pillar III) are
discussed in more detail in the Capital and Risk
Management Report, which is released as a separate
report alongside the Financial Statements.
1. Organising risk management
Risk management is an essential part of the bank’s
business and internal control. Oma Savings Bank’s risk
management principles are defined by the risk
management policy approved by the Board of Directors. The purpose of the company’s risk management is to
ensure that the company’s significant risks are identified,
assessed and quantified, and that the risks are monitored and controlled as part of day-to-day business
management. The company’s risks are evaluated
regularly, and the Board of Directors regularly assesses the company’s risk management strategy, risk-bearing
ability and approach towards risk-taking. Risk surveys and
measures taken based on the surveys, systematic monitoring and the analysis of the operating environment
and market are used to control risks. Functions
independent of business operations have been arranged to ensure efficient and comprehensive risk management
and internal control as follows:
• Risk control function
• Compliance function
• Internal audit function
It is the task of the Board of Directors to ensure that the
risk control function, compliance function and internal audit
function have adequate and competent personnel resources with respect to the nature, scope and diversity
of the company’s operations. The goal of the risk control
function is to develop systematic and preemptive risk management, through which the company’s business can
be developed safely. In the company’s organisation the
risk control function reports directly to the CEO and
reports to the Board of Directors, the CEO and other executive management.
Risk management has three lines of defence
The framework for Oma Savings Bank’s risk management function is based on a principle of three defence lines,
which are
1st line of defence: Business units.
The entire company’s personnel, both the customer
interface and those working with other tasks, must comply in their daily work with the bank’s Code of Conduct and
risk management principles.
2nd line of defence: Risk management and compliance
function.
The risk control function monitors and ensures that the
company’s operations comply with the set strategies and limits. The function carries out continuous monitoring and
ensures that the practices develop over time. The
compliance function monitors compliance with regulations.
3rd line of defence: Internal audit.
Internal audit assesses and ensures the sufficiency, functioning and efficiency of internal control in the
company’s different units, functions and subsidiaries.
64 Consolidated financial statements
Group’s notes
Parent company’s financial statements
Parent company’s notes
Signatures and audit report
Contents OmaSp in brief Corporate Governance Report of Board of Directors Financial
StatementsCorporate Social
Responsibility Report
Fina
ncia
l Sta
tem
ents
202
1
47
2. Capital adequacy management
Risk management reports on capital adequacy on a quarterly basis in connection with the Board of Director’s
risk reporting. The reporting monitors the total capital ratio
and Common Equity Tier 1 capital. The company’s Board of Directors has approved a minimum Common Equity
Tier 1 capital (CET1) financial target of at least 14 per
cent. The objective is to ensure the sufficiency of capital also when the economy slackens.
More detailed information on the Group’s capital adequacy is available in the Report of Board of Directors and the
Capital and Risk Management Report.
3. Credit risk
Credit risk refers to the possibility that a counterparty fails to meet its obligations in accordance with agreed terms
and conditions. Oma Savings Bank’s credit risk largely
consists of granted loans. Oma Savings Bank has developed new credit rating models that meet IRB
requirements during 2021, and these models were
introduced in late 2021.
Counterparty risk is defined as a risk of loss or a negative
valuation difference resulting from a weakening of the counterparty’s credit rating. Credit risk and counterparty
risk also result from other receivables, such as bonds in
the company’s investment portfolio, debt securities and
derivative contracts and off-balance sheet commitments, such as undrawn credit facilities and limits, guarantees
and letters of credit.
Oma Savings Bank’s credit risk primarily consists of
exposures secured by immovable property, retail
exposures and business loans. On 31 December 2021, the share of exposures secured by immovable property of
the credit risks was 45.5% (42.3%), the share of retail
exposures 17.2% (19.6%) and exposures to corporates 27.7% (28.4%). Credit risk exposures are well-diversified
geographically and sector-wise, which reduces the
company’s concentration risk. Oma Savings Bank has introduced the definition of non-performing loans
according to EBA/GL/2016/07. Non-performing loans
accounted for 1.4% of the loan portfolio.
The goal of credit risk management is to limit the profit
and loss and capital adequacy effects of risks resulting
from customer exposures to an acceptable level. Credit and counterparty risk are measured by estimating
expected credit losses. Expected credit losses are
estimated using the ECL model, in accordance with IFRS 9.
3.1 Loan relief granted by the company Corona pandemic has not affected in the amount of grace
periods during 2021, and there have been no short-term
peaks in demand for them. Nearly all of the pandemic-related grace periods granted in 2020 have already
expired as customers continue to service loans under
normal shortening plans. At the end of the reporting period, the total grace periods of the loans from the entire
loan stock amounted to EUR 259.5 million. All grace
periods in force at the end of the reporting period,
regardless of the reason or start date, have been included in the capital.
3.2 Calculation of expected credit losses The calculation of Expected Credit Loss (ECL) is carried
out monthly for each loan. In ECL calculation, the
expected credit loss for each month is calculated for each loan, based on the Probability of Default (PD) and the
Loss Given Default (LGD).
The company’s loan portfolio is classified into different
clusters based on customers’ different risk characteristics.
In assessing whether the credit risk related to a financial instrument has increased significantly, the change in the
risk of a default occurring over the expected life of the
financial instrument shall be observed. When carrying out this assessment, the risk of default occurring over the
expected life of the instrument at the reporting date is
compared with the risk of default at the date of initial recognition. A significant increase in credit risk leads to the
transfer of the loan from stage 1 to stage 2.
The company's loan portfolio has grown strongly during the financial year. Part of the increase is due to the
acquisition of Eurajoen Savings Bank's business. The
quality of the loan portfolio has remained at a good level despite the corona pandemic. However, the pandemic is
once again in the process of accelerating, which may lead
to a deterioration in the quality of the loan portfolio in the
65 Consolidated financial statements
Group’s notes
Parent company’s financial statements
Parent company’s notes
Signatures and audit report
Contents OmaSp in brief Corporate Governance Report of Board of Directors Financial
StatementsCorporate Social
Responsibility Report
Fina
ncia
l Sta
tem
ents
202
1
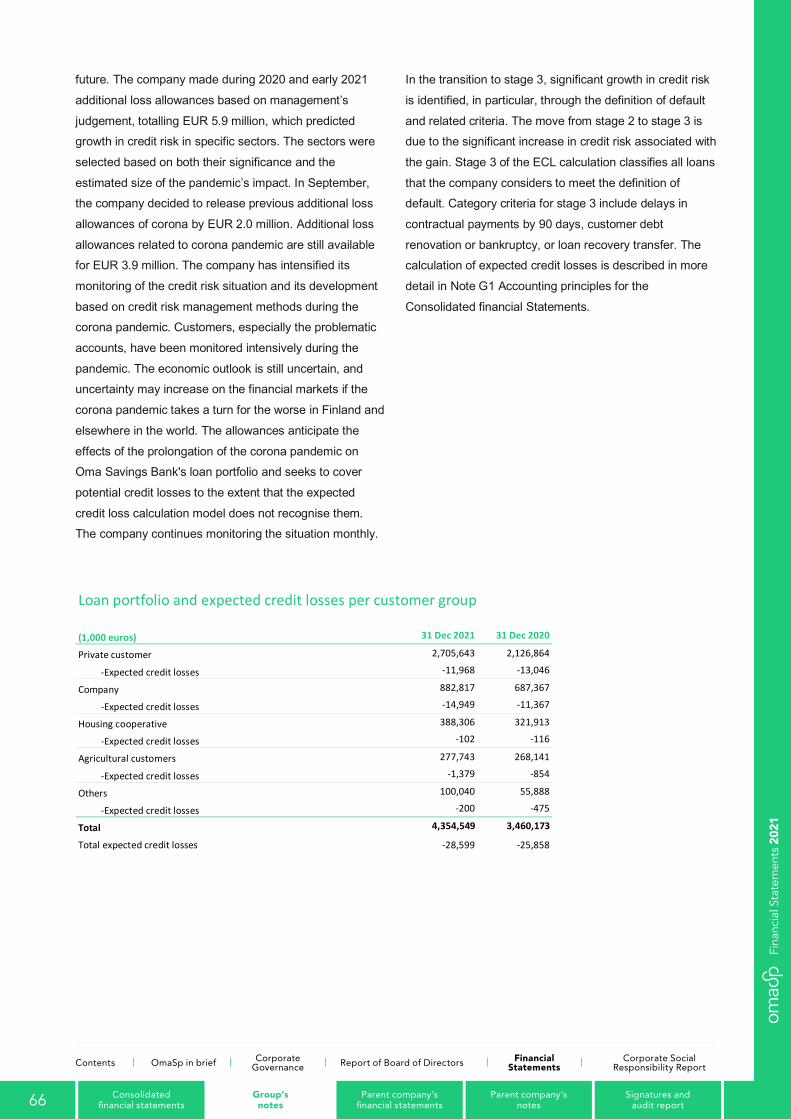
48
future. The company made during 2020 and early 2021
additional loss allowances based on management’s
judgement, totalling EUR 5.9 million, which predicted growth in credit risk in specific sectors. The sectors were
selected based on both their significance and the
estimated size of the pandemic’s impact. In September, the company decided to release previous additional loss
allowances of corona by EUR 2.0 million. Additional loss
allowances related to corona pandemic are still available for EUR 3.9 million. The company has intensified its
monitoring of the credit risk situation and its development
based on credit risk management methods during the corona pandemic. Customers, especially the problematic
accounts, have been monitored intensively during the
pandemic. The economic outlook is still uncertain, and uncertainty may increase on the financial markets if the
corona pandemic takes a turn for the worse in Finland and
elsewhere in the world. The allowances anticipate the
effects of the prolongation of the corona pandemic on Oma Savings Bank's loan portfolio and seeks to cover
potential credit losses to the extent that the expected
credit loss calculation model does not recognise them. The company continues monitoring the situation monthly.
In the transition to stage 3, significant growth in credit risk
is identified, in particular, through the definition of default
and related criteria. The move from stage 2 to stage 3 is due to the significant increase in credit risk associated with
the gain. Stage 3 of the ECL calculation classifies all loans
that the company considers to meet the definition of default. Category criteria for stage 3 include delays in
contractual payments by 90 days, customer debt
renovation or bankruptcy, or loan recovery transfer. The calculation of expected credit losses is described in more
detail in Note G1 Accounting principles for the
Consolidated financial Statements.
Loan portfolio and expected credit losses per customer group
(1,000 euros) 31 Dec 2021 31 Dec 2020
Private customer 2,705,643 2,126,864
-Expected credit losses -11,968 -13,046
Company 882,817 687,367
-Expected credit losses -14,949 -11,367
Housing cooperative 388,306 321,913
-Expected credit losses -102 -116
Agricultural customers 277,743 268,141
-Expected credit losses -1,379 -854
Others 100,040 55,888
-Expected credit losses -200 -475
Total 4,354,549 3,460,173
Total expected credit losses -28,599 -25,858
66 Consolidated financial statements
Group’s notes
Parent company’s financial statements
Parent company’s notes
Signatures and audit report
Contents OmaSp in brief Corporate Governance Report of Board of Directors Financial
StatementsCorporate Social
Responsibility Report
Fina
ncia
l Sta
tem
ents
202
1
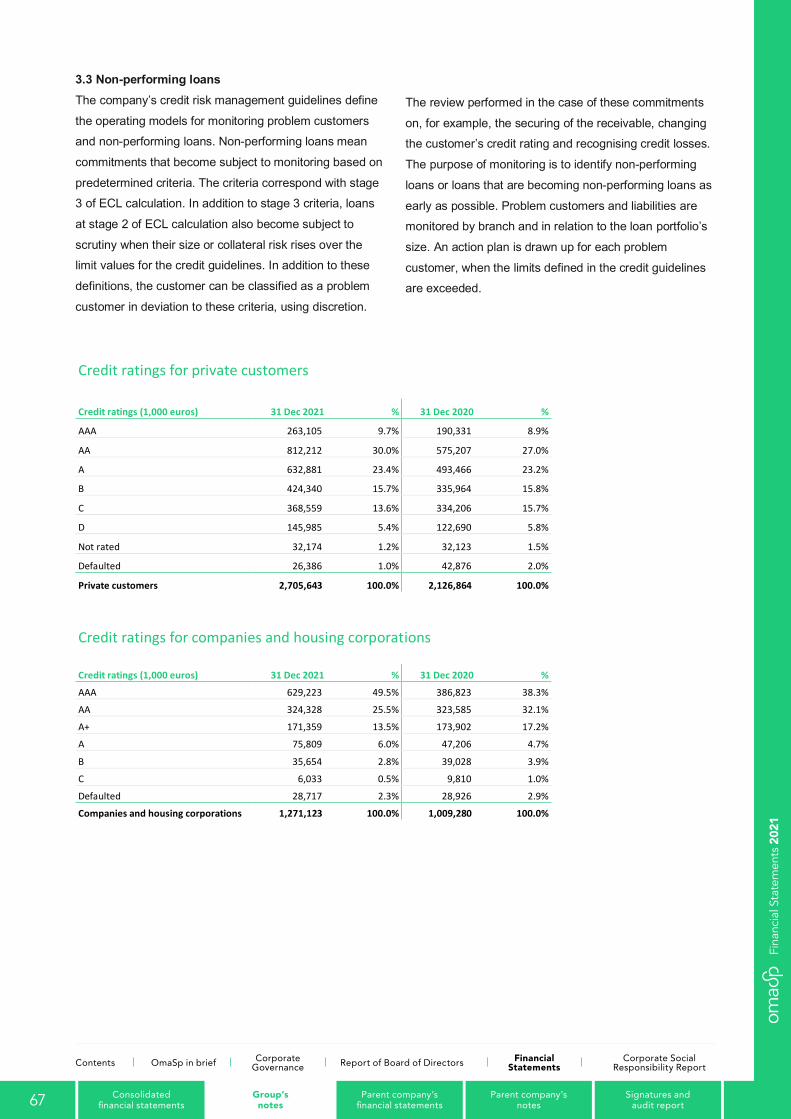
49
3.3 Non-performing loans The company’s credit risk management guidelines define
the operating models for monitoring problem customers and non-performing loans. Non-performing loans mean
commitments that become subject to monitoring based on
predetermined criteria. The criteria correspond with stage 3 of ECL calculation. In addition to stage 3 criteria, loans
at stage 2 of ECL calculation also become subject to
scrutiny when their size or collateral risk rises over the limit values for the credit guidelines. In addition to these
definitions, the customer can be classified as a problem
customer in deviation to these criteria, using discretion.
The review performed in the case of these commitments
on, for example, the securing of the receivable, changing the customer’s credit rating and recognising credit losses.
The purpose of monitoring is to identify non-performing
loans or loans that are becoming non-performing loans as
early as possible. Problem customers and liabilities are monitored by branch and in relation to the loan portfolio’s
size. An action plan is drawn up for each problem customer, when the limits defined in the credit guidelines are exceeded.
Credit ratings for private customers
Credit ratings (1,000 euros) 31 Dec 2021 % 31 Dec 2020 %
AAA 263,105 9.7% 190,331 8.9%
AA 812,212 30.0% 575,207 27.0%
A 632,881 23.4% 493,466 23.2%
B 424,340 15.7% 335,964 15.8%
C 368,559 13.6% 334,206 15.7%
D 145,985 5.4% 122,690 5.8%
Not rated 32,174 1.2% 32,123 1.5%
Defaulted 26,386 1.0% 42,876 2.0%
Private customers 2,705,643 100.0% 2,126,864 100.0%
Credit ratings for companies and housing corporations
Credit ratings (1,000 euros) 31 Dec 2021 % 31 Dec 2020 %
AAA 629,223 49.5% 386,823 38.3%
AA 324,328 25.5% 323,585 32.1%
A+ 171,359 13.5% 173,902 17.2%
A 75,809 6.0% 47,206 4.7%
B 35,654 2.8% 39,028 3.9%
C 6,033 0.5% 9,810 1.0%
Defaulted 28,717 2.3% 28,926 2.9%
Companies and housing corporations 1,271,123 100.0% 1,009,280 100.0%
67 Consolidated financial statements
Group’s notes
Parent company’s financial statements
Parent company’s notes
Signatures and audit report
Contents OmaSp in brief Corporate Governance Report of Board of Directors Financial
StatementsCorporate Social
Responsibility Report
Fina
ncia
l Sta
tem
ents
202
1

50
3.4 Distribution by risk class The company classifies its customers into risk classes
based on information available on the counterparty. External credit rating data or an internal assessment is
used for credit rating. Monitoring is continuous and can
lead to a transfer from one risk class to another.
In lending, a risk concentration is born or can be born, for
example when the loan portfolio includes large amounts of loans and other liabilities:
• to a single counterparty
• to groups that are made up of individual counterparties or entities tied to them
• to specific sectors
• against specific collateral
• whose maturity is the same or
• whose product/instrument is the same
68 Consolidated financial statements
Group’s notes
Parent company’s financial statements
Parent company’s notes
Signatures and audit report
Contents OmaSp in brief Corporate Governance Report of Board of Directors Financial
StatementsCorporate Social
Responsibility Report
Fina
ncia
l Sta
tem
ents
202
1
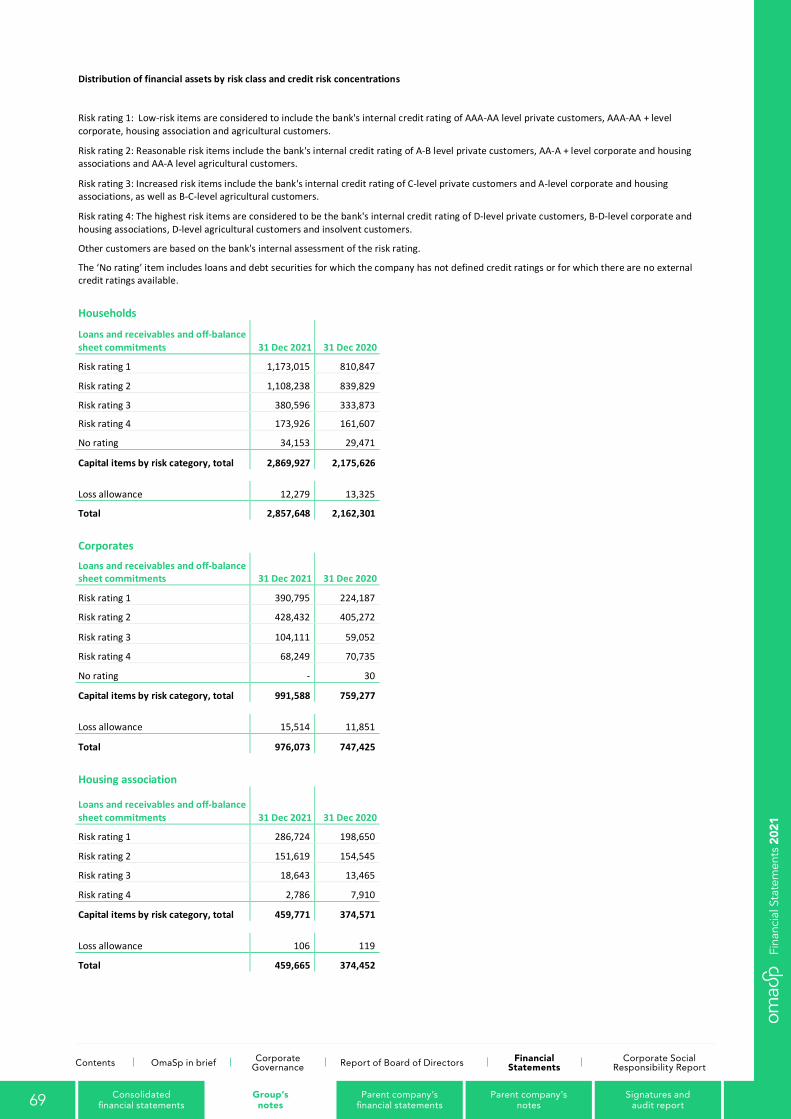
51
Distribution of financial assets by risk class and credit risk concentrations Risk rating 1: Low-risk items are considered to include the bank's internal credit rating of AAA-AA level private customers, AAA-AA + level corporate, housing association and agricultural customers.
Risk rating 2: Reasonable risk items include the bank's internal credit rating of A-B level private customers, AA-A + level corporate and housing associations and AA-A level agricultural customers.
Risk rating 3: Increased risk items include the bank's internal credit rating of C-level private customers and A-level corporate and housing associations, as well as B-C-level agricultural customers.
Risk rating 4: The highest risk items are considered to be the bank's internal credit rating of D-level private customers, B-D-level corporate and housing associations, D-level agricultural customers and insolvent customers.
Other customers are based on the bank's internal assessment of the risk rating.
The ‘No rating’ item includes loans and debt securities for which the company has not defined credit ratings or for which there are no external credit ratings available.
Households Loans and receivables and off-balance sheet commitments 31 Dec 2021 31 Dec 2020 Risk rating 1 1,173,015 810,847 Risk rating 2 1,108,238 839,829 Risk rating 3 380,596 333,873 Risk rating 4 173,926 161,607 No rating 34,153 29,471 Capital items by risk category, total 2,869,927 2,175,626
Loss allowance 12,279 13,325 Total 2,857,648 2,162,301
Corporates Loans and receivables and off-balance sheet commitments 31 Dec 2021 31 Dec 2020 Risk rating 1 390,795 224,187 Risk rating 2 428,432 405,272 Risk rating 3 104,111 59,052 Risk rating 4 68,249 70,735 No rating - 30 Capital items by risk category, total 991,588 759,277
Loss allowance 15,514 11,851 Total 976,073 747,425
Housing association
Loans and receivables and off-balance sheet commitments 31 Dec 2021 31 Dec 2020 Risk rating 1 286,724 198,650 Risk rating 2 151,619 154,545 Risk rating 3 18,643 13,465 Risk rating 4 2,786 7,910 Capital items by risk category, total 459,771 374,571
Loss allowance 106 119 Total 459,665 374,452
69 Consolidated financial statements
Group’s notes
Parent company’s financial statements
Parent company’s notes
Signatures and audit report
Contents OmaSp in brief Corporate Governance Report of Board of Directors Financial
StatementsCorporate Social
Responsibility Report
Fina
ncia
l Sta
tem
ents
202
1
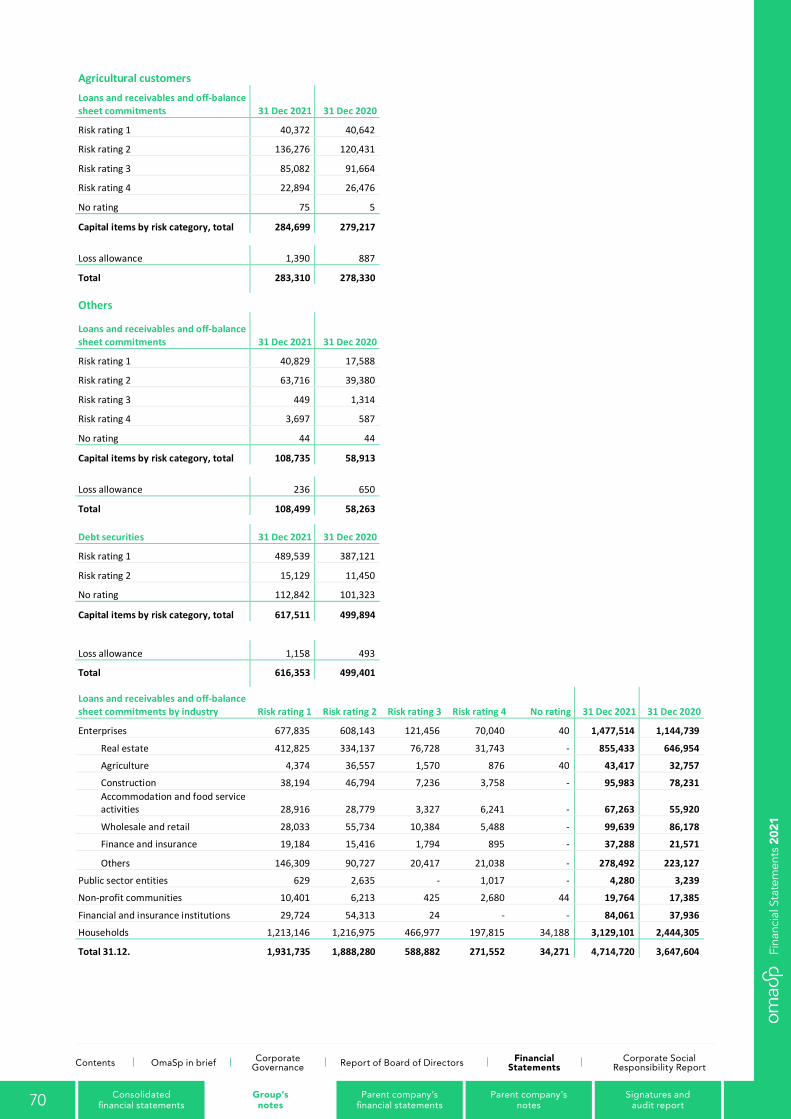
52
Agricultural customers Loans and receivables and off-balance sheet commitments 31 Dec 2021 31 Dec 2020 Risk rating 1 40,372 40,642 Risk rating 2 136,276 120,431 Risk rating 3 85,082 91,664 Risk rating 4 22,894 26,476 No rating 75 5 Capital items by risk category, total 284,699 279,217
Loss allowance 1,390 887 Total 283,310 278,330
Others
Loans and receivables and off-balance sheet commitments 31 Dec 2021 31 Dec 2020 Risk rating 1 40,829 17,588 Risk rating 2 63,716 39,380 Risk rating 3 449 1,314 Risk rating 4 3,697 587 No rating 44 44 Capital items by risk category, total 108,735 58,913
Loss allowance 236 650 Total 108,499 58,263
Debt securities 31 Dec 2021 31 Dec 2020 Risk rating 1 489,539 387,121 Risk rating 2 15,129 11,450 No rating 112,842 101,323 Capital items by risk category, total 617,511 499,894
Loss allowance 1,158 493 Total 616,353 499,401
Loans and receivables and off-balance sheet commitments by industry Risk rating 1 Risk rating 2 Risk rating 3 Risk rating 4 No rating 31 Dec 2021 31 Dec 2020
Enterprises 677,835 608,143 121,456 70,040 40 1,477,514 1,144,739
Real estate 412,825 334,137 76,728 31,743 - 855,433 646,954
Agriculture 4,374 36,557 1,570 876 40 43,417 32,757
Construction 38,194 46,794 7,236 3,758 - 95,983 78,231
Accommodation and food service activities 28,916 28,779 3,327 6,241 - 67,263 55,920
Wholesale and retail 28,033 55,734 10,384 5,488 - 99,639 86,178
Finance and insurance 19,184 15,416 1,794 895 - 37,288 21,571
Others 146,309 90,727 20,417 21,038 - 278,492 223,127
Public sector entities 629 2,635 - 1,017 - 4,280 3,239
Non-profit communities 10,401 6,213 425 2,680 44 19,764 17,385
Financial and insurance institutions 29,724 54,313 24 - - 84,061 37,936
Households 1,213,146 1,216,975 466,977 197,815 34,188 3,129,101 2,444,305
Total 31.12. 1,931,735 1,888,280 588,882 271,552 34,271 4,714,720 3,647,604
70 Consolidated financial statements
Group’s notes
Parent company’s financial statements
Parent company’s notes
Signatures and audit report
Contents OmaSp in brief Corporate Governance Report of Board of Directors Financial
StatementsCorporate Social
Responsibility Report
Fina
ncia
l Sta
tem
ents
202
1
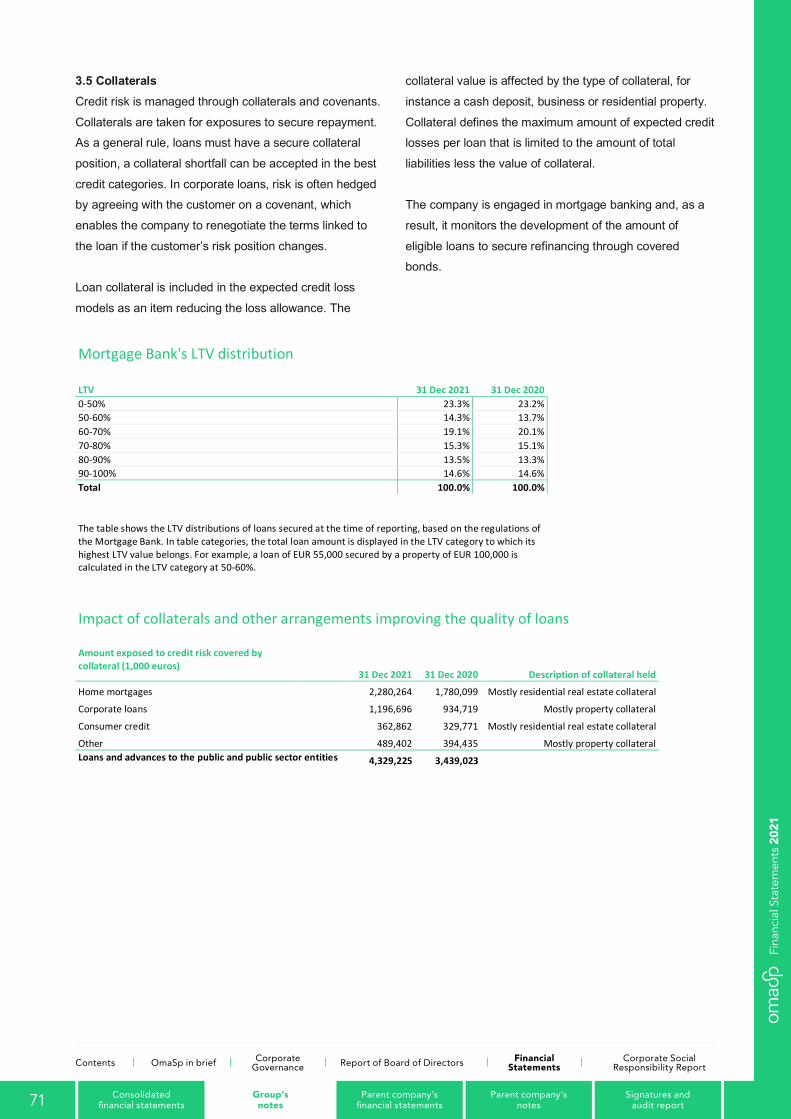
53
3.5 Collaterals Credit risk is managed through collaterals and covenants.
Collaterals are taken for exposures to secure repayment. As a general rule, loans must have a secure collateral
position, a collateral shortfall can be accepted in the best
credit categories. In corporate loans, risk is often hedged by agreeing with the customer on a covenant, which
enables the company to renegotiate the terms linked to
the loan if the customer’s risk position changes.
Loan collateral is included in the expected credit loss
models as an item reducing the loss allowance. The
collateral value is affected by the type of collateral, for
instance a cash deposit, business or residential property.
Collateral defines the maximum amount of expected credit losses per loan that is limited to the amount of total
liabilities less the value of collateral.
The company is engaged in mortgage banking and, as a
result, it monitors the development of the amount of
eligible loans to secure refinancing through covered bonds.
Mortgage Bank's LTV distribution
LTV 31 Dec 2021 31 Dec 2020 0-50% 23.3% 23.2% 50-60% 14.3% 13.7% 60-70% 19.1% 20.1% 70-80% 15.3% 15.1% 80-90% 13.5% 13.3% 90-100% 14.6% 14.6% Total 100.0% 100.0%
The table shows the LTV distributions of loans secured at the time of reporting, based on the regulations of the Mortgage Bank. In table categories, the total loan amount is displayed in the LTV category to which its highest LTV value belongs. For example, a loan of EUR 55,000 secured by a property of EUR 100,000 is calculated in the LTV category at 50-60%.
Impact of collaterals and other arrangements improving the quality of loans
Amount exposed to credit risk covered by collateral (1,000 euros)
31 Dec 2021 31 Dec 2020 Description of collateral held
Home mortgages 2,280,264 1,780,099 Mostly residential real estate collateral
Corporate loans 1,196,696 934,719 Mostly property collateral
Consumer credit 362,862 329,771 Mostly residential real estate collateral
Other 489,402 394,435 Mostly property collateral Loans and advances to the public and public sector entities
4,329,225 3,439,023
71 Consolidated financial statements
Group’s notes
Parent company’s financial statements
Parent company’s notes
Signatures and audit report
Contents OmaSp in brief Corporate Governance Report of Board of Directors Financial
StatementsCorporate Social
Responsibility Report
Fina
ncia
l Sta
tem
ents
202
1
54
4. Liquidity risk
Liquidity risk can be defined as the difference in the balance between incoming and outgoing cash flows. The
risk may materialise if the company cannot meet its
maturing payment obligations, or an acceptable balance is
not achieved within the limits of tolerable costs. The company’s greatest liquidity risks arise from the difference
in maturity of borrowing and lending.
The company's liquidity has remained stable during 2021,
and during the corona pandemic the company has been
monitoring the changes in liquidity risk more closely. The investment certificate market has largely recovered from
the uncertainty of the early stages of the corona pandemic
and is operating at almost pre-corona levels. The company's liquidity has continued to strengthen after the
company made a loan amount increase to its covered
bond due in the summer of 2027. In addition to this, the company issued a new unsecured senior bond in
November.
In addition to the issuance of the company's bonds in June
and November, the company's deposit portfolio has
continued to grow steadily during 2021, keeping the credit-deposit ratio stable. Growth in new lending has also
continued to be strong. The company matures a bond of
EUR 350 million in December 2022.
The management of Oma Savings Bank’s liquidity risk is
based on the company’s ability to procure sufficient cash
that is competitive in price in both the short and long term. A key component of liquidity risk management is the
planning of the liquidity position in both the short and long
term. Additionally, by planning the liquidity reserve, the bank can prepare for weakening economic trends on the
markets and for any changes to legislation. The goal of the
company’s liquidity reserve is to cover one month’s outflows.
Liquidity risk management is supported by active risk management, monitoring of the balance sheet and cash
flows and internal calculation models. The continuous
monitoring of the liquidity situation is important so that the company can manage outgoing cash flows.
The company’s liquidity risk is also managed by monitoring and forecasting changes in market factors and
market development. If forecasts show that market
liquidity is falling, the company can set tighter internal limits for liquidity risk management. Liquidity risk
management also includes liquidity reserve management.
This ensures that the company has sufficient amounts of liquid securities available to cover the collateral
requirements of different business activities.
72 Consolidated financial statements
Group’s notes
Parent company’s financial statements
Parent company’s notes
Signatures and audit report
Contents OmaSp in brief Corporate Governance Report of Board of Directors Financial
StatementsCorporate Social
Responsibility Report
Fina
ncia
l Sta
tem
ents
202
1
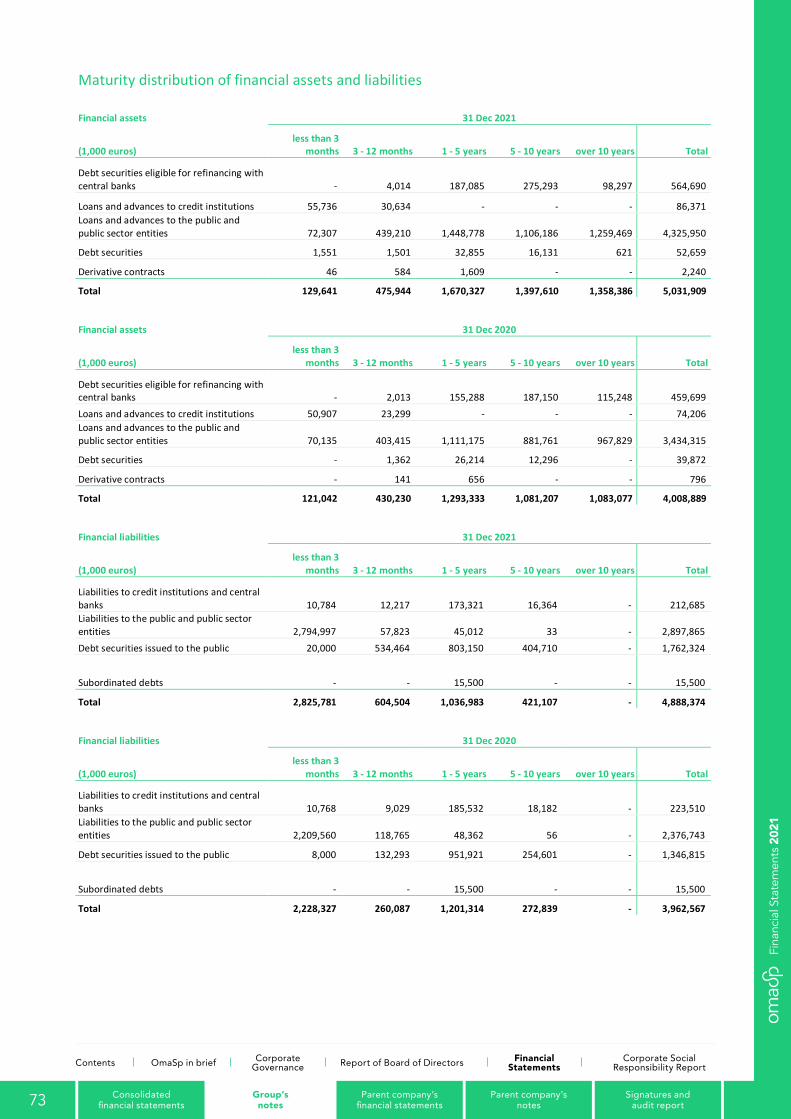
55
Maturity distribution of financial assets and liabilities
Financial assets 31 Dec 2021
(1,000 euros) less than 3
months 3 - 12 months 1 - 5 years 5 - 10 years over 10 years Total
Debt securities eligible for refinancing with central banks - 4,014 187,085 275,293 98,297 564,690
Loans and advances to credit institutions 55,736 30,634 - - - 86,371 Loans and advances to the public and public sector entities 72,307 439,210 1,448,778 1,106,186 1,259,469 4,325,950
Debt securities 1,551 1,501 32,855 16,131 621 52,659
Derivative contracts 46 584 1,609 - - 2,240
Total 129,641 475,944 1,670,327 1,397,610 1,358,386 5,031,909
Financial assets 31 Dec 2020
(1,000 euros) less than 3
months 3 - 12 months 1 - 5 years 5 - 10 years over 10 years Total
Debt securities eligible for refinancing with central banks - 2,013 155,288 187,150 115,248 459,699 Loans and advances to credit institutions 50,907 23,299 - - - 74,206 Loans and advances to the public and public sector entities 70,135 403,415 1,111,175 881,761 967,829 3,434,315
Debt securities - 1,362 26,214 12,296 - 39,872
Derivative contracts - 141 656 - - 796
Total 121,042 430,230 1,293,333 1,081,207 1,083,077 4,008,889
Financial liabilities 31 Dec 2021
(1,000 euros) less than 3
months 3 - 12 months 1 - 5 years 5 - 10 years over 10 years Total
Liabilities to credit institutions and central banks 10,784 12,217 173,321 16,364 - 212,685 Liabilities to the public and public sector entities 2,794,997 57,823 45,012 33 - 2,897,865 Debt securities issued to the public 20,000 534,464 803,150 404,710 - 1,762,324
Subordinated debts - - 15,500 - - 15,500
Total 2,825,781 604,504 1,036,983 421,107 - 4,888,374
Financial liabilities 31 Dec 2020
(1,000 euros) less than 3
months 3 - 12 months 1 - 5 years 5 - 10 years over 10 years Total
Liabilities to credit institutions and central banks 10,768 9,029 185,532 18,182 - 223,510 Liabilities to the public and public sector entities 2,209,560 118,765 48,362 56 - 2,376,743
Debt securities issued to the public 8,000 132,293 951,921 254,601 - 1,346,815
Subordinated debts - - 15,500 - - 15,500
Total 2,228,327 260,087 1,201,314 272,839 - 3,962,567
73 Consolidated financial statements
Group’s notes
Parent company’s financial statements
Parent company’s notes
Signatures and audit report
Contents OmaSp in brief Corporate Governance Report of Board of Directors Financial
StatementsCorporate Social
Responsibility Report
Fina
ncia
l Sta
tem
ents
202
1
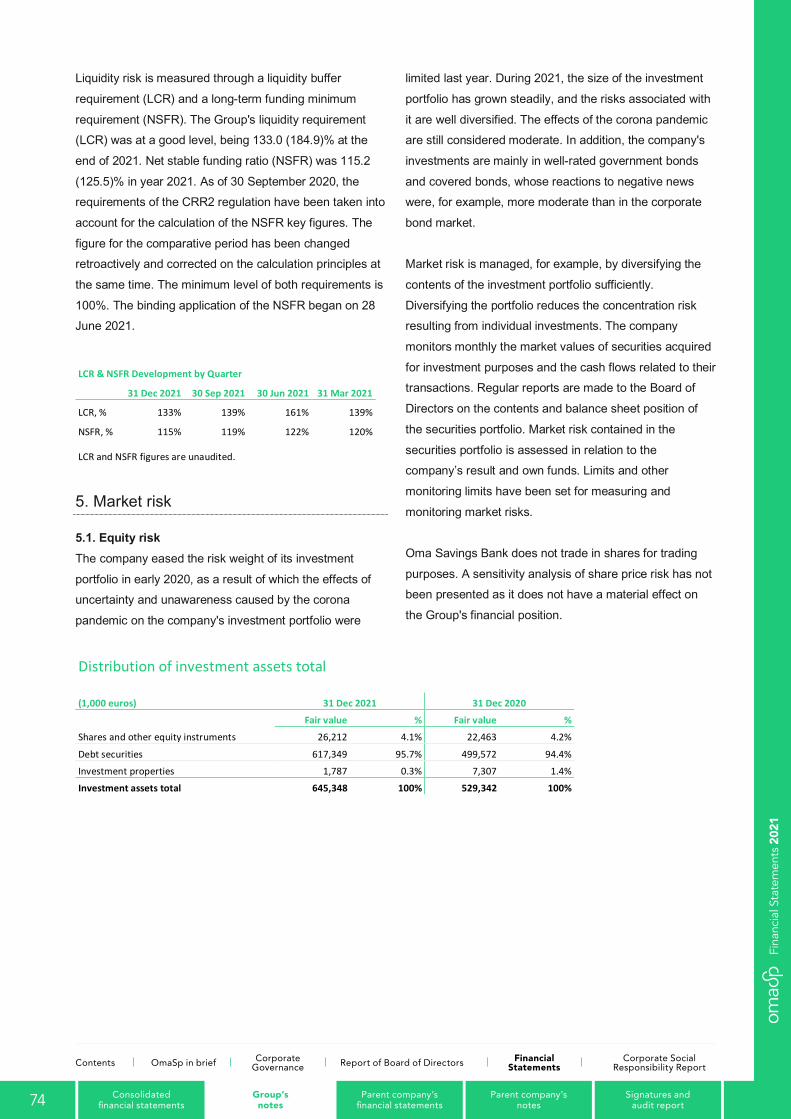
56
Liquidity risk is measured through a liquidity buffer
requirement (LCR) and a long-term funding minimum
requirement (NSFR). The Group's liquidity requirement (LCR) was at a good level, being 133.0 (184.9)% at the
end of 2021. Net stable funding ratio (NSFR) was 115.2
(125.5)% in year 2021. As of 30 September 2020, the requirements of the CRR2 regulation have been taken into
account for the calculation of the NSFR key figures. The
figure for the comparative period has been changed retroactively and corrected on the calculation principles at
the same time. The minimum level of both requirements is
100%. The binding application of the NSFR began on 28 June 2021.
LCR & NSFR Development by Quarter
31 Dec 2021 30 Sep 2021 30 Jun 2021 31 Mar 2021
LCR, % 133% 139% 161% 139%
NSFR, % 115% 119% 122% 120%
LCR and NSFR figures are unaudited.
5. Market risk
5.1. Equity risk The company eased the risk weight of its investment
portfolio in early 2020, as a result of which the effects of uncertainty and unawareness caused by the corona
pandemic on the company's investment portfolio were
limited last year. During 2021, the size of the investment
portfolio has grown steadily, and the risks associated with
it are well diversified. The effects of the corona pandemic are still considered moderate. In addition, the company's
investments are mainly in well-rated government bonds
and covered bonds, whose reactions to negative news were, for example, more moderate than in the corporate
bond market.
Market risk is managed, for example, by diversifying the
contents of the investment portfolio sufficiently.
Diversifying the portfolio reduces the concentration risk resulting from individual investments. The company
monitors monthly the market values of securities acquired
for investment purposes and the cash flows related to their transactions. Regular reports are made to the Board of
Directors on the contents and balance sheet position of
the securities portfolio. Market risk contained in the
securities portfolio is assessed in relation to the company’s result and own funds. Limits and other
monitoring limits have been set for measuring and
monitoring market risks.
Oma Savings Bank does not trade in shares for trading
purposes. A sensitivity analysis of share price risk has not been presented as it does not have a material effect on
the Group's financial position.
Distribution of investment assets total
(1,000 euros) 31 Dec 2021 31 Dec 2020
Fair value % Fair value %
Shares and other equity instruments 26,212 4.1% 22,463 4.2%
Debt securities 617,349 95.7% 499,572 94.4%
Investment properties 1,787 0.3% 7,307 1.4%
Investment assets total 645,348 100% 529,342 100%
74 Consolidated financial statements
Group’s notes
Parent company’s financial statements
Parent company’s notes
Signatures and audit report
Contents OmaSp in brief Corporate Governance Report of Board of Directors Financial
StatementsCorporate Social
Responsibility Report
Fina
ncia
l Sta
tem
ents
202
1
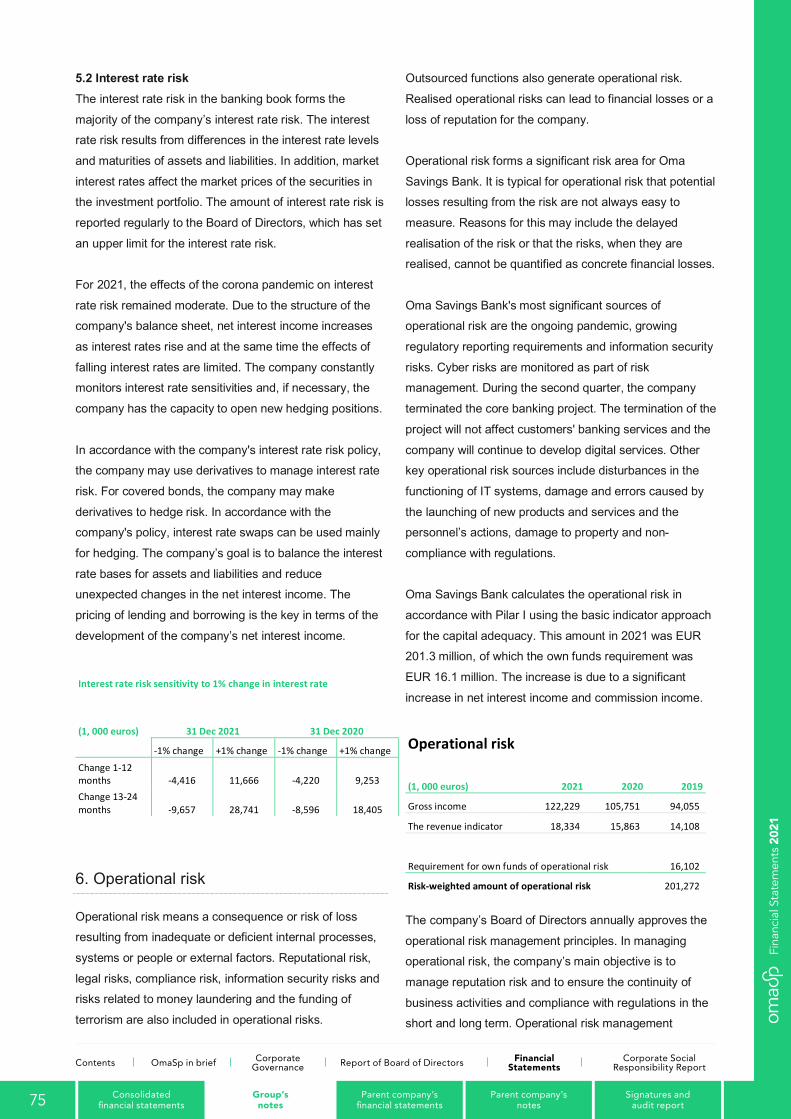
57
5.2 Interest rate risk The interest rate risk in the banking book forms the
majority of the company’s interest rate risk. The interest rate risk results from differences in the interest rate levels
and maturities of assets and liabilities. In addition, market
interest rates affect the market prices of the securities in the investment portfolio. The amount of interest rate risk is
reported regularly to the Board of Directors, which has set
an upper limit for the interest rate risk.
For 2021, the effects of the corona pandemic on interest
rate risk remained moderate. Due to the structure of the company's balance sheet, net interest income increases
as interest rates rise and at the same time the effects of
falling interest rates are limited. The company constantly monitors interest rate sensitivities and, if necessary, the
company has the capacity to open new hedging positions.
In accordance with the company's interest rate risk policy, the company may use derivatives to manage interest rate
risk. For covered bonds, the company may make
derivatives to hedge risk. In accordance with the company's policy, interest rate swaps can be used mainly
for hedging. The company’s goal is to balance the interest
rate bases for assets and liabilities and reduce unexpected changes in the net interest income. The
pricing of lending and borrowing is the key in terms of the
development of the company’s net interest income.
Interest rate risk sensitivity to 1% change in interest rate
(1, 000 euros) 31 Dec 2021 31 Dec 2020
-1% change +1% change -1% change +1% change
Change 1-12 months -4,416 11,666 -4,220 9,253 Change 13-24 months -9,657 28,741 -8,596 18,405
6. Operational risk
Operational risk means a consequence or risk of loss resulting from inadequate or deficient internal processes,
systems or people or external factors. Reputational risk,
legal risks, compliance risk, information security risks and risks related to money laundering and the funding of
terrorism are also included in operational risks.
Outsourced functions also generate operational risk.
Realised operational risks can lead to financial losses or a
loss of reputation for the company.
Operational risk forms a significant risk area for Oma
Savings Bank. It is typical for operational risk that potential losses resulting from the risk are not always easy to
measure. Reasons for this may include the delayed
realisation of the risk or that the risks, when they are realised, cannot be quantified as concrete financial losses.
Oma Savings Bank's most significant sources of operational risk are the ongoing pandemic, growing
regulatory reporting requirements and information security
risks. Cyber risks are monitored as part of risk management. During the second quarter, the company
terminated the core banking project. The termination of the
project will not affect customers' banking services and the
company will continue to develop digital services. Other key operational risk sources include disturbances in the
functioning of IT systems, damage and errors caused by
the launching of new products and services and the personnel’s actions, damage to property and non-
compliance with regulations.
Oma Savings Bank calculates the operational risk in
accordance with Pilar I using the basic indicator approach
for the capital adequacy. This amount in 2021 was EUR 201.3 million, of which the own funds requirement was
EUR 16.1 million. The increase is due to a significant
increase in net interest income and commission income.
Operational risk (1, 000 euros) 2021 2020 2019
Gross income 122,229 105,751 94,055
The revenue indicator 18,334 15,863 14,108
Requirement for own funds of operational risk 16,102
Risk-weighted amount of operational risk 201,272
The company’s Board of Directors annually approves the
operational risk management principles. In managing operational risk, the company’s main objective is to
manage reputation risk and to ensure the continuity of
business activities and compliance with regulations in the short and long term. Operational risk management
75 Consolidated financial statements
Group’s notes
Parent company’s financial statements
Parent company’s notes
Signatures and audit report
Contents OmaSp in brief Corporate Governance Report of Board of Directors Financial
StatementsCorporate Social
Responsibility Report
Fina
ncia
l Sta
tem
ents
202
1
58
ensures that the values and strategy of Oma Savings
Bank are achieved throughout the business activities.
Operational risk management covers all material risks related to business activities.
Operational risk management is applied in all of the company’s business units by identifying, measuring,
monitoring and assessing the operational risks linked to
the units. The business units also assess the likelihood of the risks and their impacts if the risks materialise. The
company-wide process allows the management to assess
the extent of any losses stemming from operational risk if the risk were to materialise. The risk assessment process
is updated at least once a year and always when the
business’s operational environment changes.
As part of operational risk management, the company
aims to reduce the likelihood of operational risk through its
internal code of conduct and by training personnel. The control points defined for the processes are also a key
component of preventing operational risk. The company
reduces the impact of operational risk also by maintaining insurance for real estate and the fixed assets it owns.
Each employee is responsible for managing operational
risk in their own job role. Realised operational risks are reported to the management of the business unit.
New products, services, and outsourced service providers are approved separately through a separate company
approval process prior to deployment. The approval
process ensures that the risks associated with new products and services are properly identified and
assessed. The same approval process also applies when
developing existing products.
The monitoring, control and reporting of operational risks
are handled by the company's risk control. At least annually, the company's management receives the risk
assessments and a report on realized risks of the
business units' on the realized risks, based on which a
separate operational risk matrix is compiled, which is reported to the Board of Directors. The created process
allows the Board to form an overall picture of the
operational risks to the business and their potential effects on the company. The risk identification process enables
the Board to decide on risk management measures and
priorities regarding operational risk. The new risk
management system used during the year has improved
the management, monitoring and reporting of operational risks.
7 Measures to reduce the risks posed by corona pandemic
The company's customer service has operated
uninterrupted throughout the exceptional circumstances,
and this has ensured necessary banking services to customers. The company has continuously monitored the
development of the corona virus situation and personnel
has been notified concerning health-related matters, in accordance with the guidelines of the Finnish government
and the authorities. Internal operating models have been
adapted to the situation.
In terms of credit risk, preventive measures have included
the above-mentioned grace periods granted to customers, increased monitoring of problem customers and loans in
arrears and the careful assessment and, if required,
reassessment, of collateral values. Additionally, when
granting new loans, the applicant’s repayment capacity and the value of collateral are monitored bearing in mind
the economic uncertainty caused by the pandemic.
76 Consolidated financial statements
Group’s notes
Parent company’s financial statements
Parent company’s notes
Signatures and audit report
Contents OmaSp in brief Corporate Governance Report of Board of Directors Financial
StatementsCorporate Social
Responsibility Report
Fina
ncia
l Sta
tem
ents
202
1
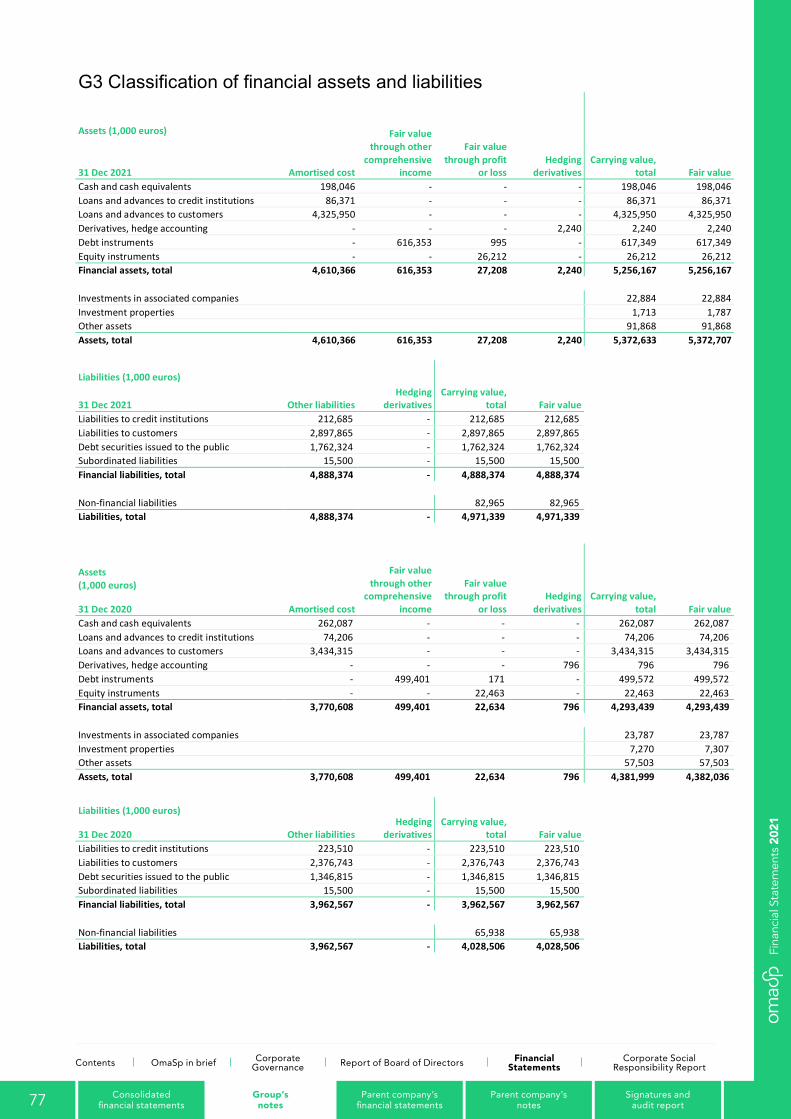
59
G3 Classification of financial assets and liabilities
Assets (1,000 euros)
Amortised cost
Fair value through other
comprehensive income
Fair value through profit
or loss Hedging
derivatives Carrying value,
total Fair value 31 Dec 2021 Cash and cash equivalents 198,046 - - - 198,046 198,046 Loans and advances to credit institutions 86,371 - - - 86,371 86,371 Loans and advances to customers 4,325,950 - - - 4,325,950 4,325,950 Derivatives, hedge accounting - - - 2,240 2,240 2,240 Debt instruments - 616,353 995 - 617,349 617,349 Equity instruments - - 26,212 - 26,212 26,212 Financial assets, total 4,610,366 616,353 27,208 2,240 5,256,167 5,256,167
Investments in associated companies 22,884 22,884 Investment properties 1,713 1,787 Other assets 91,868 91,868 Assets, total 4,610,366 616,353 27,208 2,240 5,372,633 5,372,707
Liabilities (1,000 euros)
Other liabilities Hedging
derivatives Carrying value,
total Fair value
31 Dec 2021 Liabilities to credit institutions 212,685 - 212,685 212,685 Liabilities to customers 2,897,865 - 2,897,865 2,897,865 Debt securities issued to the public 1,762,324 - 1,762,324 1,762,324 Subordinated liabilities 15,500 - 15,500 15,500 Financial liabilities, total 4,888,374 - 4,888,374 4,888,374
Non-financial liabilities 82,965 82,965 Liabilities, total 4,888,374 - 4,971,339 4,971,339
Assets (1,000 euros)
Amortised cost
Fair value through other
comprehensive income
Fair value through profit
or loss Hedging
derivatives Carrying value,
total Fair value 31 Dec 2020 Cash and cash equivalents 262,087 - - - 262,087 262,087 Loans and advances to credit institutions 74,206 - - - 74,206 74,206 Loans and advances to customers 3,434,315 - - - 3,434,315 3,434,315 Derivatives, hedge accounting - - - 796 796 796 Debt instruments - 499,401 171 - 499,572 499,572 Equity instruments - - 22,463 - 22,463 22,463 Financial assets, total 3,770,608 499,401 22,634 796 4,293,439 4,293,439
Investments in associated companies 23,787 23,787 Investment properties 7,270 7,307 Other assets 57,503 57,503 Assets, total 3,770,608 499,401 22,634 796 4,381,999 4,382,036
Liabilities (1,000 euros)
Other liabilities Hedging
derivatives Carrying value,
total Fair value
31 Dec 2020 Liabilities to credit institutions 223,510 - 223,510 223,510 Liabilities to customers 2,376,743 - 2,376,743 2,376,743 Debt securities issued to the public 1,346,815 - 1,346,815 1,346,815 Subordinated liabilities 15,500 - 15,500 15,500 Financial liabilities, total 3,962,567 - 3,962,567 3,962,567
Non-financial liabilities 65,938 65,938 Liabilities, total 3,962,567 - 4,028,506 4,028,506
77 Consolidated financial statements
Group’s notes
Parent company’s financial statements
Parent company’s notes
Signatures and audit report
Contents OmaSp in brief Corporate Governance Report of Board of Directors Financial
StatementsCorporate Social
Responsibility Report
Fina
ncia
l Sta
tem
ents
202
1
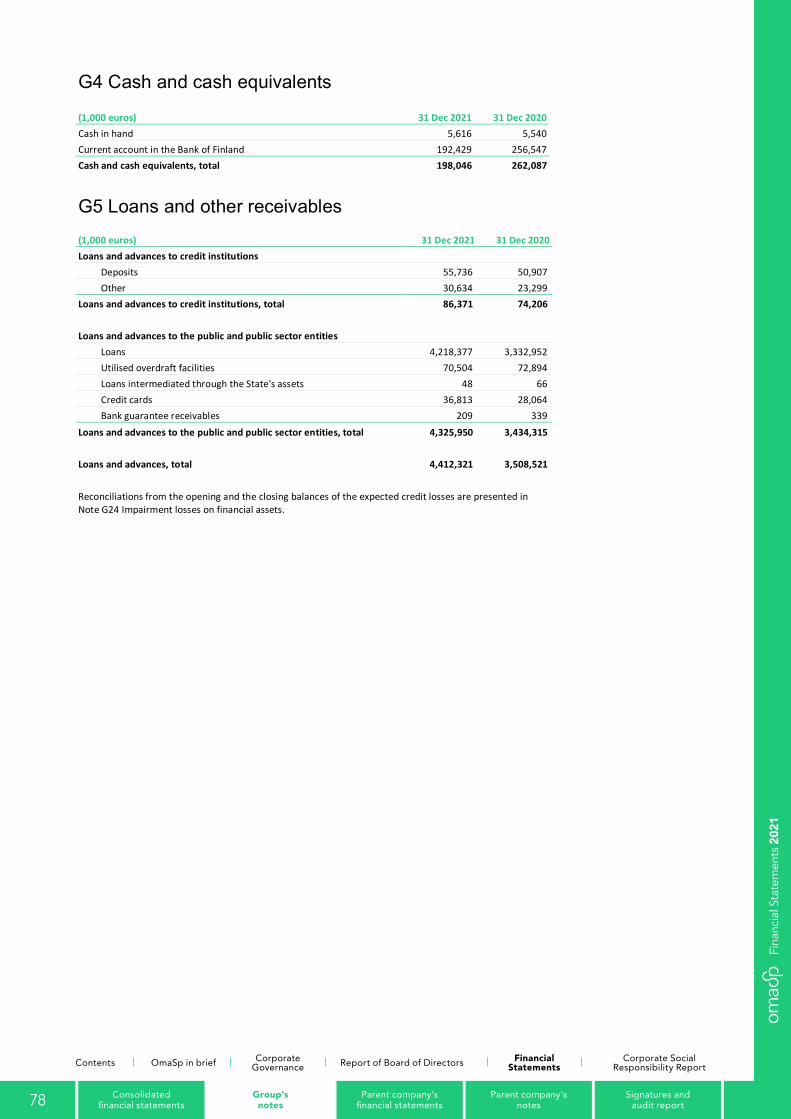
60
G4 Cash and cash equivalents (1,000 euros) 31 Dec 2021 31 Dec 2020 Cash in hand 5,616 5,540 Current account in the Bank of Finland 192,429 256,547 Cash and cash equivalents, total 198,046 262,087
G5 Loans and other receivables
(1,000 euros) 31 Dec 2021 31 Dec 2020 Loans and advances to credit institutions
Deposits 55,736 50,907 Other 30,634 23,299 Loans and advances to credit institutions, total 86,371 74,206
Loans and advances to the public and public sector entities
Loans 4,218,377 3,332,952 Utilised overdraft facilities 70,504 72,894 Loans intermediated through the State's assets 48 66 Credit cards 36,813 28,064 Bank guarantee receivables 209 339 Loans and advances to the public and public sector entities, total 4,325,950 3,434,315
Loans and advances, total 4,412,321 3,508,521
Reconciliations from the opening and the closing balances of the expected credit losses are presented in Note G24 Impairment losses on financial assets.
78 Consolidated financial statements
Group’s notes
Parent company’s financial statements
Parent company’s notes
Signatures and audit report
Contents OmaSp in brief Corporate Governance Report of Board of Directors Financial
StatementsCorporate Social
Responsibility Report
Fina
ncia
l Sta
tem
ents
202
1
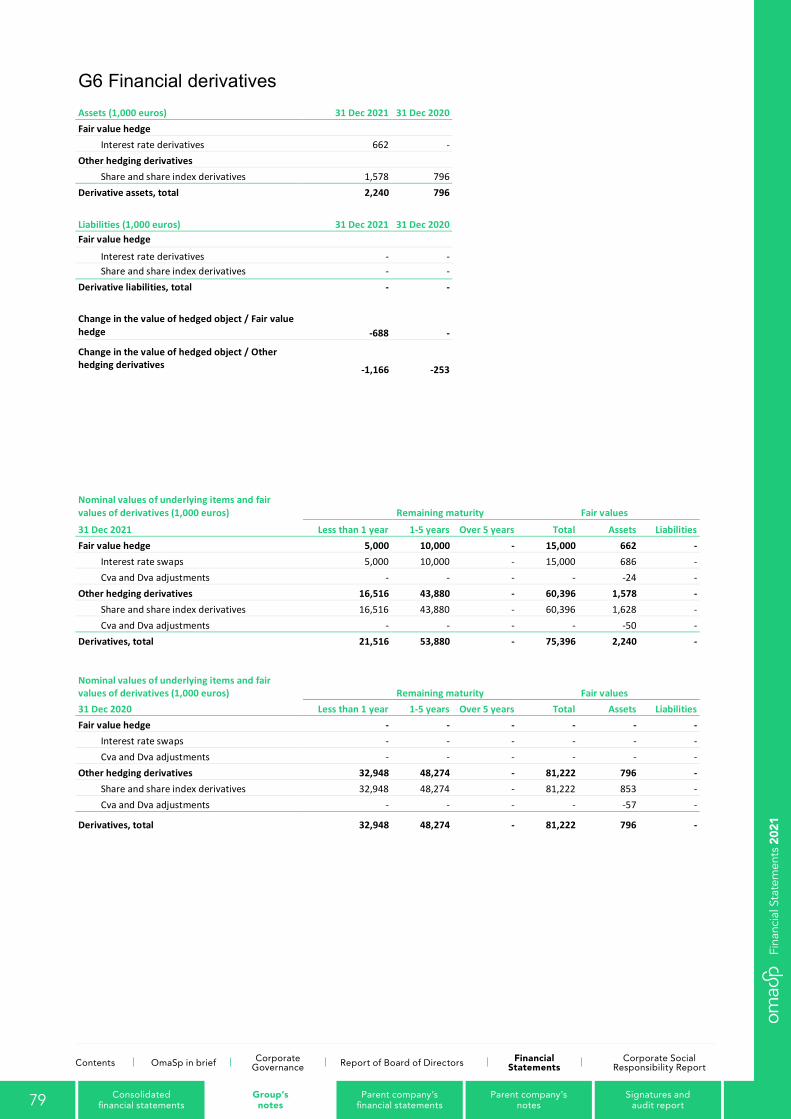
61
G6 Financial derivatives Assets (1,000 euros) 31 Dec 2021 31 Dec 2020 31 Dec 2020 Fair value hedge
Interest rate derivatives 662 - - Other hedging derivatives
Share and share index derivatives 1,578 796 796 Derivative assets, total 2,240 796 796
Liabilities (1,000 euros) 31 Dec 2021 31 Dec 2020 31 Dec 2020 Fair value hedge
Interest rate derivatives - - - Share and share index derivatives - - - Derivative liabilities, total - - -
Change in the value of hedged object / Fair value hedge -688 - - Change in the value of hedged object / Other hedging derivatives -1,166 -253 -253
Nominal values of underlying items and fair values of derivatives (1,000 euros) Remaining maturity Fair values
31 Dec 2021 Less than 1 year 1-5 years Over 5 years Total Assets Liabilities Fair value hedge 5,000 10,000 - 15,000 662 -
Interest rate swaps 5,000 10,000 - 15,000 686 - Cva and Dva adjustments - - - - -24 - Other hedging derivatives 16,516 43,880 - 60,396 1,578 -
Share and share index derivatives 16,516 43,880 - 60,396 1,628 - Cva and Dva adjustments - - - - -50 - Derivatives, total 21,516 53,880 - 75,396 2,240 -
Nominal values of underlying items and fair values of derivatives (1,000 euros) Remaining maturity Fair values 31 Dec 2020 Less than 1 year 1-5 years Over 5 years Total Assets Liabilities Fair value hedge - - - - - -
Interest rate swaps - - - - - - Cva and Dva adjustments - - - - - - Other hedging derivatives 32,948 48,274 - 81,222 796 -
Share and share index derivatives 32,948 48,274 - 81,222 853 - Cva and Dva adjustments - - - - -57 -
Derivatives, total 32,948 48,274 - 81,222 796 -
79 Consolidated financial statements
Group’s notes
Parent company’s financial statements
Parent company’s notes
Signatures and audit report
Contents OmaSp in brief Corporate Governance Report of Board of Directors Financial
StatementsCorporate Social
Responsibility Report
Fina
ncia
l Sta
tem
ents
202
1
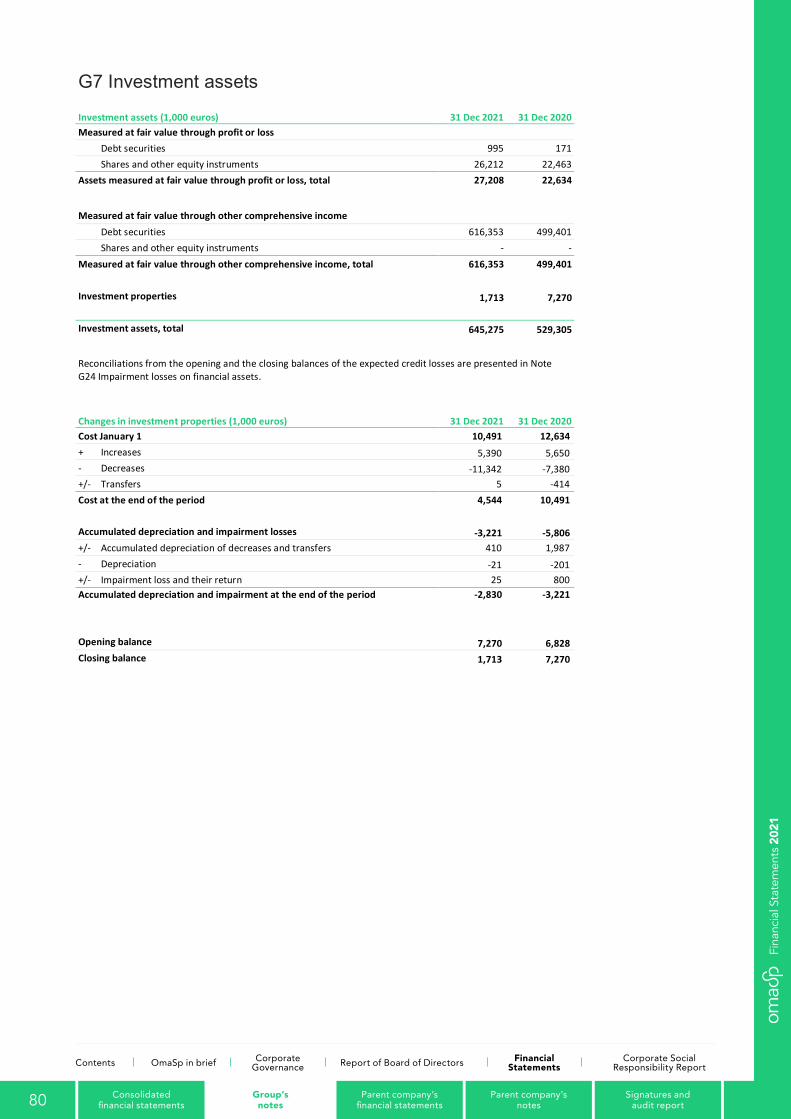
62
G7 Investment assets Investment assets (1,000 euros) 31 Dec 2021 31 Dec 2020 Measured at fair value through profit or loss
Debt securities 995 171 Shares and other equity instruments 26,212 22,463 Assets measured at fair value through profit or loss, total 27,208 22,634
Measured at fair value through other comprehensive income Debt securities 616,353 499,401 Shares and other equity instruments - - Measured at fair value through other comprehensive income, total 616,353 499,401
Investment properties 1,713 7,270
Investment assets, total 645,275 529,305
Reconciliations from the opening and the closing balances of the expected credit losses are presented in Note G24 Impairment losses on financial assets.
Changes in investment properties (1,000 euros) 31 Dec 2021 31 Dec 2020 Cost January 1 10,491 12,634 + Increases 5,390 5,650 - Decreases -11,342 -7,380 +/- Transfers 5 -414 Cost at the end of the period 4,544 10,491
Accumulated depreciation and impairment losses -3,221 -5,806 +/- Accumulated depreciation of decreases and transfers 410 1,987 - Depreciation -21 -201 +/- Impairment loss and their return 25 800 Accumulated depreciation and impairment at the end of the period -2,830 -3,221
Opening balance 7,270 6,828 Closing balance 1,713 7,270
80 Consolidated financial statements
Group’s notes
Parent company’s financial statements
Parent company’s notes
Signatures and audit report
Contents OmaSp in brief Corporate Governance Report of Board of Directors Financial
StatementsCorporate Social
Responsibility Report
Fina
ncia
l Sta
tem
ents
202
1
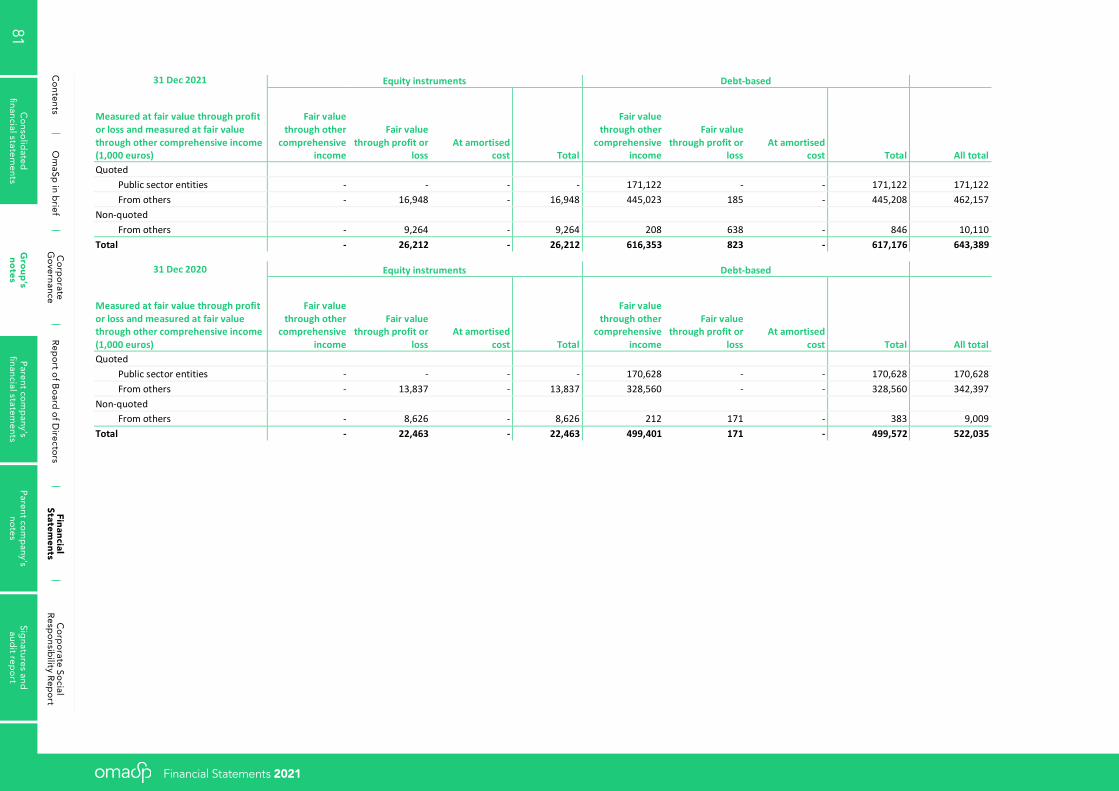
63
31 Dec 2021 Equity instruments Debt-based
Measured at fair value through profit or loss and measured at fair value through other comprehensive income (1,000 euros)
Fair value through other
comprehensive income
Fair value through profit or
loss At amortised
cost Total
Fair value through other
comprehensive income
Fair value through profit or
loss At amortised
cost Total All total Quoted
Public sector entities - - - - 171,122 - - 171,122 171,122 From others - 16,948 - 16,948 445,023 185 - 445,208 462,157 Non-quoted
From others - 9,264 - 9,264 208 638 - 846 10,110 Total - 26,212 - 26,212 616,353 823 - 617,176 643,389
31 Dec 2020 Equity instruments Debt-based
Measured at fair value through profit or loss and measured at fair value through other comprehensive income (1,000 euros)
Fair value through other
comprehensive income
Fair value through profit or
loss At amortised
cost Total
Fair value through other
comprehensive income
Fair value through profit or
loss At amortised
cost Total All total Quoted
Public sector entities - - - - 170,628 - - 170,628 170,628 From others - 13,837 - 13,837 328,560 - - 328,560 342,397 Non-quoted
From others - 8,626 - 8,626 212 171 - 383 9,009 Total - 22,463 - 22,463 499,401 171 - 499,572 522,035
81C
onso
lidated
financial statem
entsG
roup
’s no
tesP
arent com
pany’s
financial statements
Parent co
mp
any’s no
tesSig
natures and
audit rep
ort
Co
ntentsO
maSp
in brief
Co
rpo
rate G
overnance
Rep
ort o
f Bo
ard o
f Directo
rsF
inancial Statem
entsC
orp
orate So
cial R
espo
nsibility R
epo
rt
Financial Statements 2021
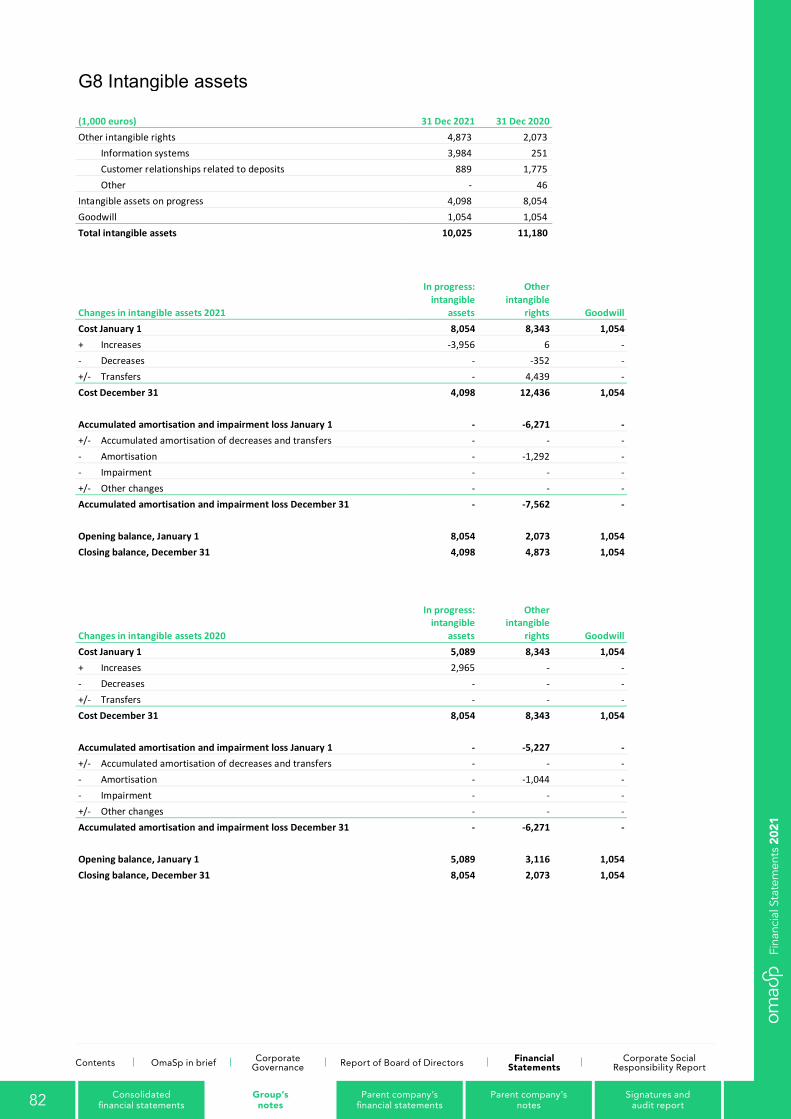
64
G8 Intangible assets (1,000 euros) 31 Dec 2021 31 Dec 2020 Other intangible rights 4,873 2,073
Information systems 3,984 251 Customer relationships related to deposits 889 1,775 Other - 46 Intangible assets on progress 4,098 8,054 Goodwill 1,054 1,054 Total intangible assets 10,025 11,180
Changes in intangible assets 2021
In progress: intangible
assets
Other intangible
rights Goodwill Cost January 1 8,054 8,343 1,054 + Increases -3,956 6 - - Decreases - -352 - +/- Transfers - 4,439 - Cost December 31 4,098 12,436 1,054
Accumulated amortisation and impairment loss January 1 - -6,271 - +/- Accumulated amortisation of decreases and transfers - - - - Amortisation - -1,292 - - Impairment - - - +/- Other changes - - - Accumulated amortisation and impairment loss December 31 - -7,562 -
Opening balance, January 1 8,054 2,073 1,054 Closing balance, December 31 4,098 4,873 1,054
Changes in intangible assets 2020
In progress: intangible
assets
Other intangible
rights Goodwill Cost January 1 5,089 8,343 1,054 + Increases 2,965 - - - Decreases - - - +/- Transfers - - - Cost December 31 8,054 8,343 1,054
Accumulated amortisation and impairment loss January 1 - -5,227 - +/- Accumulated amortisation of decreases and transfers - - - - Amortisation - -1,044 - - Impairment - - - +/- Other changes - - - Accumulated amortisation and impairment loss December 31 - -6,271 -
Opening balance, January 1 5,089 3,116 1,054 Closing balance, December 31 8,054 2,073 1,054
82 Consolidated financial statements
Group’s notes
Parent company’s financial statements
Parent company’s notes
Signatures and audit report
Contents OmaSp in brief Corporate Governance Report of Board of Directors Financial
StatementsCorporate Social
Responsibility Report
Fina
ncia
l Sta
tem
ents
202
1
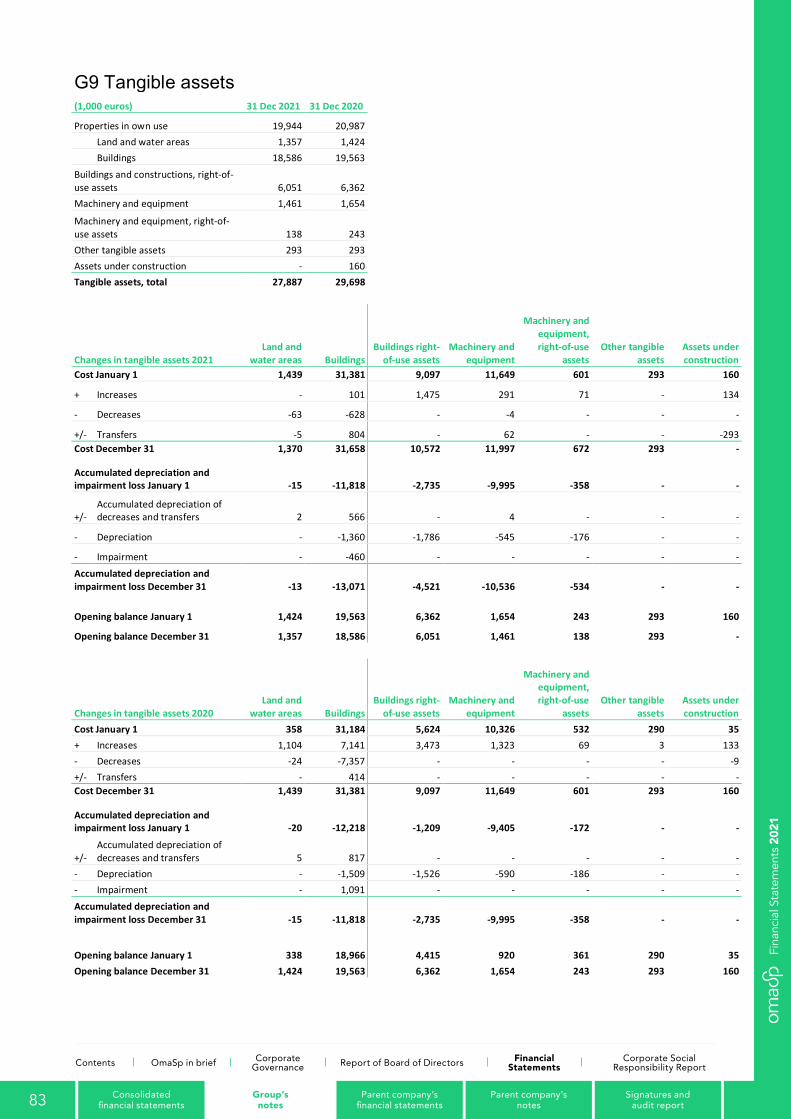
65
G9 Tangible assets (1,000 euros) 31 Dec 2021 31 Dec 2020 Properties in own use 19,944 20,987 Land and water areas 1,357 1,424 Buildings 18,586 19,563 Buildings and constructions, right-of-use assets 6,051 6,362 Machinery and equipment 1,461 1,654
Machinery and equipment, right-of-use assets 138 243 Other tangible assets 293 293 Assets under construction - 160 Tangible assets, total 27,887 29,698
Changes in tangible assets 2021 Land and
water areas Buildings Buildings right-
of-use assets Machinery and
equipment
Machinery and equipment, right-of-use
assets Other tangible
assets Assets under construction
Cost January 1 1,439 31,381 9,097 11,649 601 293 160
+ Increases - 101 1,475 291 71 - 134
- Decreases -63 -628 - -4 - - -
+/- Transfers -5 804 - 62 - - -293 Cost December 31 1,370 31,658 10,572 11,997 672 293 -
Accumulated depreciation and impairment loss January 1 -15 -11,818 -2,735 -9,995 -358 - -
+/- Accumulated depreciation of decreases and transfers 2 566 - 4 - - -
- Depreciation - -1,360 -1,786 -545 -176 - -
- Impairment - -460 - - - - - Accumulated depreciation and impairment loss December 31 -13 -13,071 -4,521 -10,536 -534 - -
Opening balance January 1 1,424 19,563 6,362 1,654 243 293 160
Opening balance December 31 1,357 18,586 6,051 1,461 138 293 -
Changes in tangible assets 2020 Land and
water areas Buildings Buildings right-
of-use assets Machinery and
equipment
Machinery and equipment, right-of-use
assets Other tangible
assets Assets under construction
Cost January 1 358 31,184 5,624 10,326 532 290 35 + Increases 1,104 7,141 3,473 1,323 69 3 133 - Decreases -24 -7,357 - - - - -9 +/- Transfers - 414 - - - - - Cost December 31 1,439 31,381 9,097 11,649 601 293 160
Accumulated depreciation and impairment loss January 1 -20 -12,218 -1,209 -9,405 -172 - -
+/- Accumulated depreciation of decreases and transfers 5 817 - - - - -
- Depreciation - -1,509 -1,526 -590 -186 - - - Impairment - 1,091 - - - - - Accumulated depreciation and impairment loss December 31 -15 -11,818 -2,735 -9,995 -358 - -
Opening balance January 1 338 18,966 4,415 920 361 290 35 Opening balance December 31 1,424 19,563 6,362 1,654 243 293 160
83 Consolidated financial statements
Group’s notes
Parent company’s financial statements
Parent company’s notes
Signatures and audit report
Contents OmaSp in brief Corporate Governance Report of Board of Directors Financial
StatementsCorporate Social
Responsibility Report
Fina
ncia
l Sta
tem
ents
202
1
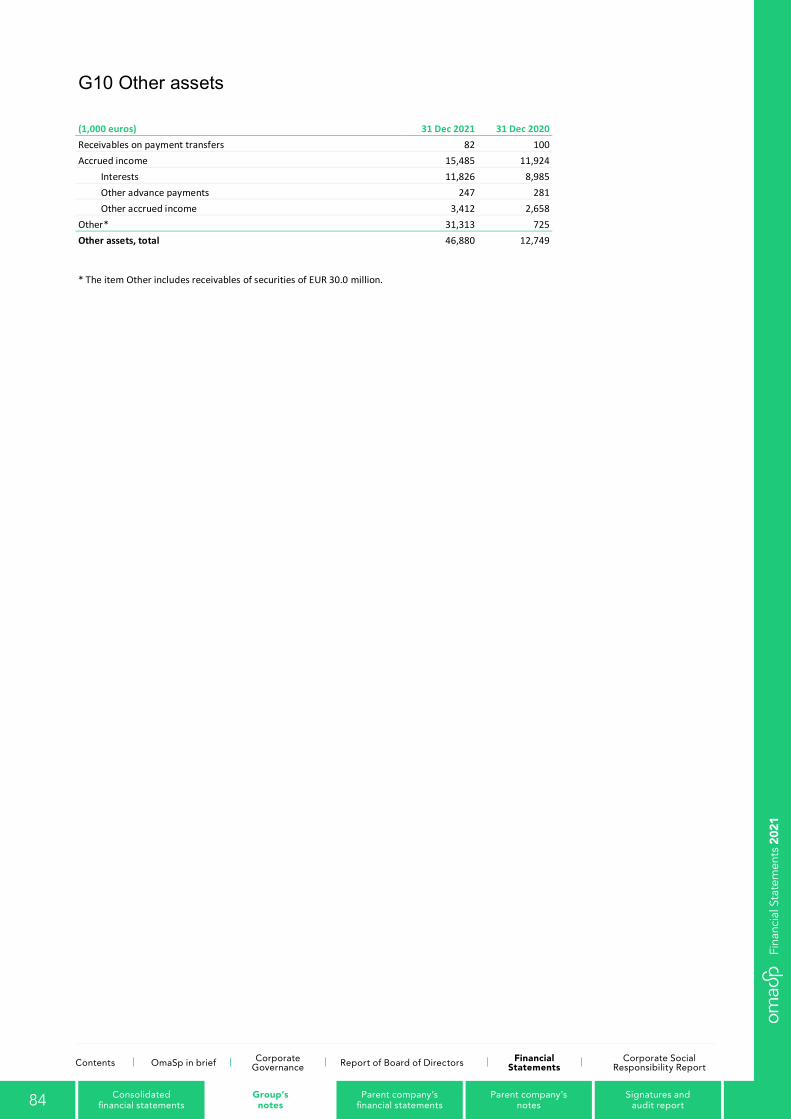
66
G10 Other assets (1,000 euros) 31 Dec 2021 31 Dec 2020 Receivables on payment transfers 82 100 Accrued income 15,485 11,924
Interests 11,826 8,985 Other advance payments 247 281 Other accrued income 3,412 2,658 Other* 31,313 725 Other assets, total 46,880 12,749
* The item Other includes receivables of securities of EUR 30.0 million.
84 Consolidated financial statements
Group’s notes
Parent company’s financial statements
Parent company’s notes
Signatures and audit report
Contents OmaSp in brief Corporate Governance Report of Board of Directors Financial
StatementsCorporate Social
Responsibility Report
Fina
ncia
l Sta
tem
ents
202
1

67
G11 Tax assets and liabilities (1,000 euros) 31 Dec 2021 31 Dec 2020 Tax assets
Deferred tax assets 7,077 3,875 Tax assets, total 7,077 3,875
Tax liabilities
Current income tax liabilities 9,331 3,803 Deferred tax liabilities 31,122 27,948 Tax liabilities, total 40,453 31,751
Deferred tax assets 2021 1.1.
Recognised through profit
or loss
Other comprehensive
income* Business
acquisitions 31.12.
Assets at fair value through other comprehensive income 75 - 1,361 - 1,436
Tangible assets 177 85 - - 262 Defined benefit pension plans 45 1 72 - 118 Impairment - - - 10 10 Confirmed losses 308 -92 - - 217 Derivatives - - - 6 6 Liabilities - - - 1,300 1,300 Other items 3,269 458 - 3,727 Deferred tax assets, total 3,875 453 1,433 1,316 7,077
Deferred tax liabilities 2021 1.1.
Recognised through profit
or loss
Other comprehensive
income* Business
acquisitions 31.12. On taxable reserves 24,733 4,763 - - 29,496
Assets at fair value through other comprehensive income 2,781 - -1,467 - 1,314
Derivatives - - - 6 6 Liabilities 355 -171 - 10 194 Other items 79 34 - 113 Deferred tax liabilities, total 27,948 4,626 -1,467 16 31,122
The item of acquisition cost calculation includes the deferred tax asset and liability for the acquisition of the Eurajoen Savings Bank's business.
Deferred tax assets 2020 1.1.
Recognised through profit
or loss
Other comprehensive
income Business
acquisitions 31.12.
Assets at fair value through other comprehensive income 11 - 64 - 75
Tangible assets 461 -283 - - 177 Defined benefit pension plans 45 - - - 45 Confirmed losses 426 -117 - - 308 Other items 871 2,398 - - 3,269 Deferred tax assets, total 1,814 1,997 64 - 3,875
Deferred tax liabilities 2020 1.1.
Recognised through profit
or loss
Other comprehensive
income Business
acquisitions 31.12. On taxable reserves 21,872 2,861 - - 24,733
Assets at fair value through other comprehensive income 2,146 - 635 - 2,781
Liabilities 510 -155 - - 355 Other items 50 29 - - 79 Deferred tax liabilities, total 24,578 2,735 635 - 27,948
85 Consolidated financial statements
Group’s notes
Parent company’s financial statements
Parent company’s notes
Signatures and audit report
Contents OmaSp in brief Corporate Governance Report of Board of Directors Financial
StatementsCorporate Social
Responsibility Report
Fina
ncia
l Sta
tem
ents
202
1
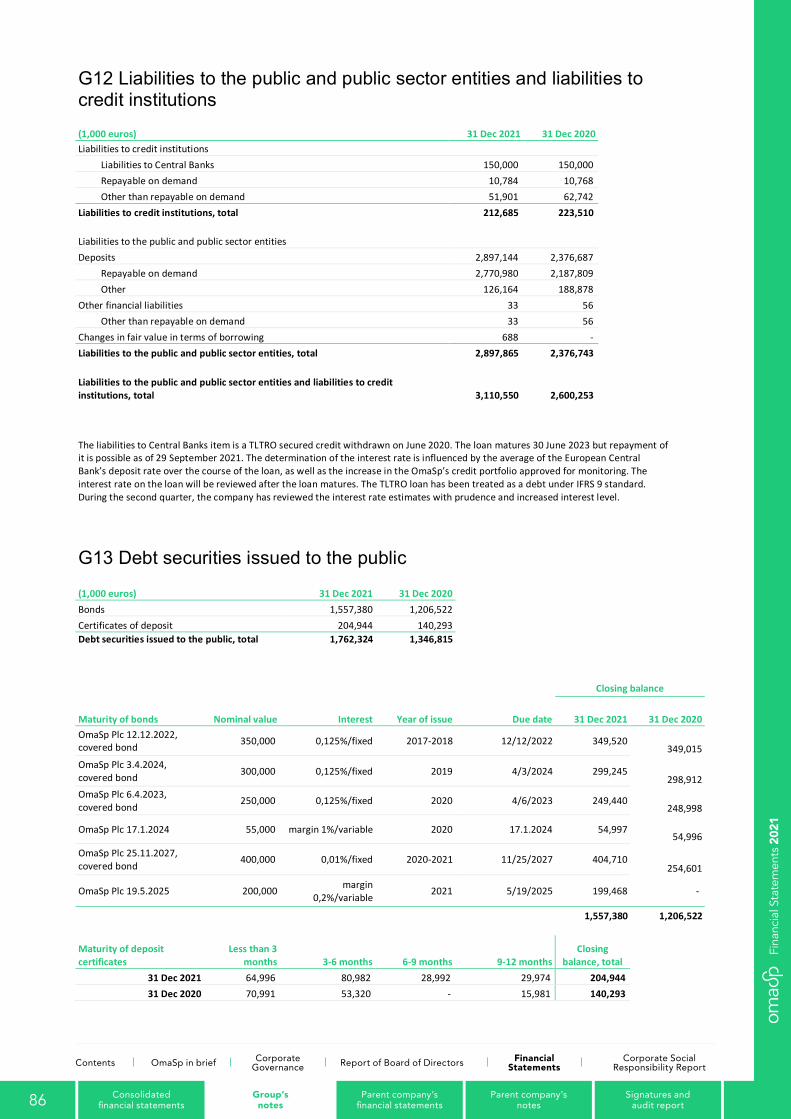
68
G12 Liabilities to the public and public sector entities and liabilities to credit institutions
(1,000 euros) 31 Dec 2021 31 Dec 2020 31 Dec 2020 Liabilities to credit institutions
Liabilities to Central Banks 150,000 150,000 150,000 Repayable on demand 10,784 10,768 10,768 Other than repayable on demand 51,901 62,742 62,742 Liabilities to credit institutions, total 212,685 223,510 223,510
Liabilities to the public and public sector entities Deposits 2,897,144 2,376,687 2,376,687
Repayable on demand 2,770,980 2,187,809 2,187,809 Other 126,164 188,878 188,878 Other financial liabilities 33 56 56
Other than repayable on demand 33 56 56 Changes in fair value in terms of borrowing 688 - - Liabilities to the public and public sector entities, total 2,897,865 2,376,743 2,376,743
Liabilities to the public and public sector entities and liabilities to credit institutions, total 3,110,550 2,600,253 2,600,253
The liabilities to Central Banks item is a TLTRO secured credit withdrawn on June 2020. The loan matures 30 June 2023 but repayment of it is possible as of 29 September 2021. The determination of the interest rate is influenced by the average of the European Central Bank’s deposit rate over the course of the loan, as well as the increase in the OmaSp’s credit portfolio approved for monitoring. The interest rate on the loan will be reviewed after the loan matures. The TLTRO loan has been treated as a debt under IFRS 9 standard. During the second quarter, the company has reviewed the interest rate estimates with prudence and increased interest level.
G13 Debt securities issued to the public (1,000 euros) 31 Dec 2021 31 Dec 2020 31 Dec 2020 Bonds 1,557,380 1,206,522 1206521.703 Certificates of deposit 204,944 140,293 140292.9733 Debt securities issued to the public, total 1,762,324 1,346,815 1,346,815
Closing balance
Maturity of bonds Nominal value Interest Year of issue Due date 31 Dec 2021 31 Dec 2020 OmaSp Plc 12.12.2022, covered bond 350,000 0,125%/fixed 2017-2018 12/12/2022 349,520
349,015 OmaSp Plc 3.4.2024, covered bond 300,000 0,125%/fixed 2019 4/3/2024 299,245
298,912 OmaSp Plc 6.4.2023, covered bond
250,000 0,125%/fixed 2020 4/6/2023 249,440 248,998
OmaSp Plc 17.1.2024 55,000 margin 1%/variable 2020 17.1.2024 54,997 54,996
OmaSp Plc 25.11.2027, covered bond
400,000 0,01%/fixed 2020-2021 11/25/2027 404,710 254,601
OmaSp Plc 19.5.2025 200,000 margin 0,2%/variable
2021 5/19/2025 199,468 -
1,557,380 1,206,522
Maturity of deposit certificates
Less than 3 months 3-6 months 6-9 months 9-12 months
Closing balance, total
31 Dec 2021 64,996 80,982 28,992 29,974 204,944 31 Dec 2020 70,991 53,320 - 15,981 140,293
86 Consolidated financial statements
Group’s notes
Parent company’s financial statements
Parent company’s notes
Signatures and audit report
Contents OmaSp in brief Corporate Governance Report of Board of Directors Financial
StatementsCorporate Social
Responsibility Report
Fina
ncia
l Sta
tem
ents
202
1
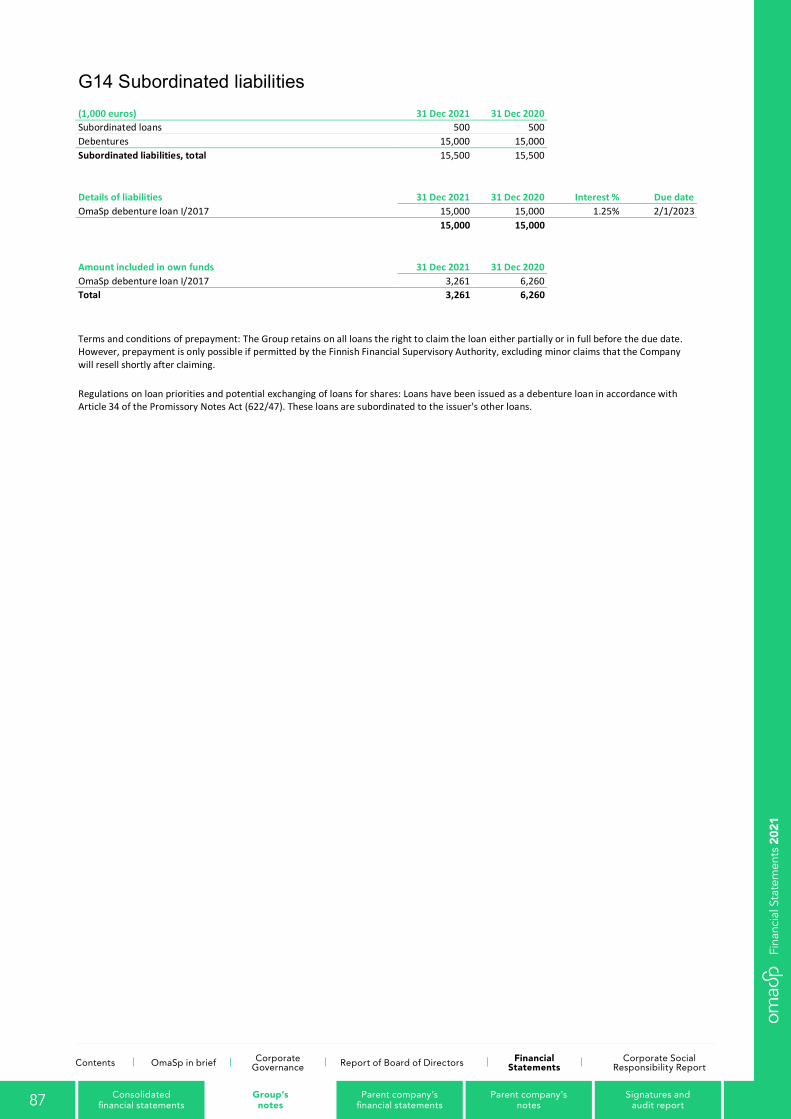
69
G14 Subordinated liabilities (1,000 euros) 31 Dec 2021 31 Dec 2020 Subordinated loans 500 500 Debentures 15,000 15,000 Subordinated liabilities, total 15,500 15,500
Details of liabilities 31 Dec 2021 31 Dec 2020 Interest % Due date OmaSp debenture loan I/2017 15,000 15,000 1.25% 2/1/2023 15,000 15,000
Amount included in own funds 31 Dec 2021 31 Dec 2020 OmaSp debenture loan I/2017 3,261 6,260 Total 3,261 6,260
Terms and conditions of prepayment: The Group retains on all loans the right to claim the loan either partially or in full before the due date. However, prepayment is only possible if permitted by the Finnish Financial Supervisory Authority, excluding minor claims that the Company will resell shortly after claiming.
Regulations on loan priorities and potential exchanging of loans for shares: Loans have been issued as a debenture loan in accordance with Article 34 of the Promissory Notes Act (622/47). These loans are subordinated to the issuer's other loans.
87 Consolidated financial statements
Group’s notes
Parent company’s financial statements
Parent company’s notes
Signatures and audit report
Contents OmaSp in brief Corporate Governance Report of Board of Directors Financial
StatementsCorporate Social
Responsibility Report
Fina
ncia
l Sta
tem
ents
202
1
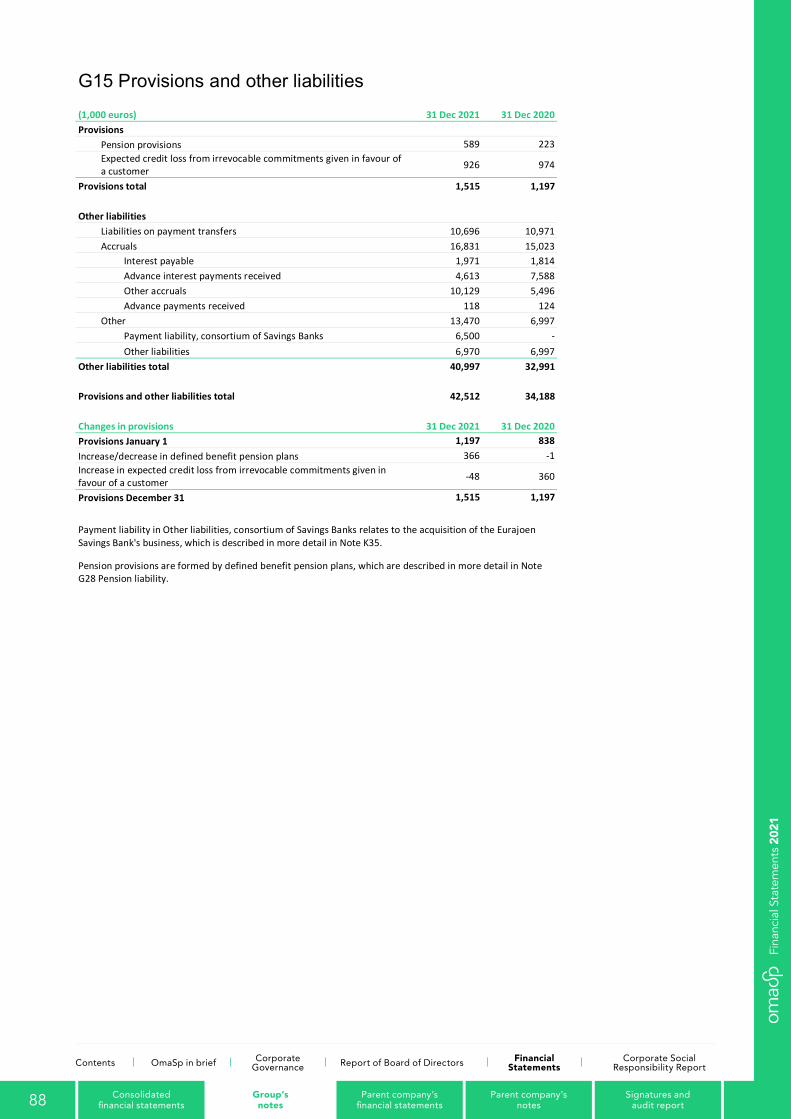
70
G15 Provisions and other liabilities (1,000 euros) 31 Dec 2021 31 Dec 2020 Provisions
Pension provisions 589 223
Expected credit loss from irrevocable commitments given in favour of a customer 926 974
Provisions total 1,515 1,197 Other liabilities
Liabilities on payment transfers 10,696 10,971 Accruals 16,831 15,023 Interest payable 1,971 1,814 Advance interest payments received 4,613 7,588 Other accruals 10,129 5,496 Advance payments received 118 124 Other 13,470 6,997 Payment liability, consortium of Savings Banks 6,500 - Other liabilities 6,970 6,997 Other liabilities total 40,997 32,991
Provisions and other liabilities total 42,512 34,188
Changes in provisions 31 Dec 2021 31 Dec 2020 Provisions January 1 1,197 838 Increase/decrease in defined benefit pension plans 366 -1 Increase in expected credit loss from irrevocable commitments given in favour of a customer -48 360
Provisions December 31 1,515 1,197
Payment liability in Other liabilities, consortium of Savings Banks relates to the acquisition of the Eurajoen Savings Bank's business, which is described in more detail in Note K35.
Pension provisions are formed by defined benefit pension plans, which are described in more detail in Note G28 Pension liability.
88 Consolidated financial statements
Group’s notes
Parent company’s financial statements
Parent company’s notes
Signatures and audit report
Contents OmaSp in brief Corporate Governance Report of Board of Directors Financial
StatementsCorporate Social
Responsibility Report
Fina
ncia
l Sta
tem
ents
202
1
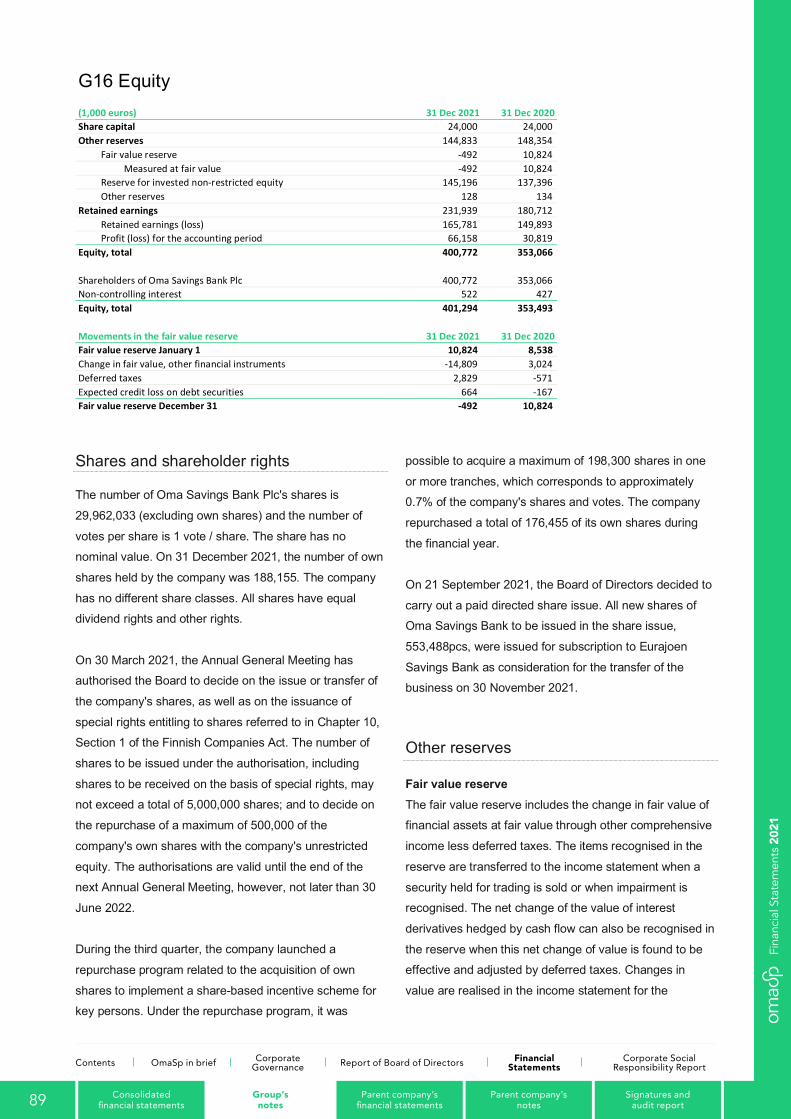
71
G16 Equity (1,000 euros) 31 Dec 2021 31 Dec 2020 Share capital 24,000 24,000 Other reserves 144,833 148,354
Fair value reserve -492 10,824 Measured at fair value -492 10,824 Reserve for invested non-restricted equity 145,196 137,396 Other reserves 128 134 Retained earnings 231,939 180,712
Retained earnings (loss) 165,781 149,893 Profit (loss) for the accounting period 66,158 30,819 Equity, total 400,772 353,066
Shareholders of Oma Savings Bank Plc 400,772 353,066 Non-controlling interest 522 427 Equity, total 401,294 353,493
Movements in the fair value reserve 31 Dec 2021 31 Dec 2020 Fair value reserve January 1 10,824 8,538 Change in fair value, other financial instruments -14,809 3,024 Deferred taxes 2,829 -571 Expected credit loss on debt securities 664 -167 Fair value reserve December 31 -492 10,824
Shares and shareholder rights
The number of Oma Savings Bank Plc's shares is
29,962,033 (excluding own shares) and the number of
votes per share is 1 vote / share. The share has no nominal value. On 31 December 2021, the number of own
shares held by the company was 188,155. The company
has no different share classes. All shares have equal dividend rights and other rights.
On 30 March 2021, the Annual General Meeting has authorised the Board to decide on the issue or transfer of
the company's shares, as well as on the issuance of
special rights entitling to shares referred to in Chapter 10, Section 1 of the Finnish Companies Act. The number of
shares to be issued under the authorisation, including
shares to be received on the basis of special rights, may not exceed a total of 5,000,000 shares; and to decide on
the repurchase of a maximum of 500,000 of the
company's own shares with the company's unrestricted
equity. The authorisations are valid until the end of the next Annual General Meeting, however, not later than 30
June 2022.
During the third quarter, the company launched a
repurchase program related to the acquisition of own
shares to implement a share-based incentive scheme for key persons. Under the repurchase program, it was
possible to acquire a maximum of 198,300 shares in one
or more tranches, which corresponds to approximately 0.7% of the company's shares and votes. The company
repurchased a total of 176,455 of its own shares during
the financial year.
On 21 September 2021, the Board of Directors decided to
carry out a paid directed share issue. All new shares of Oma Savings Bank to be issued in the share issue,
553,488pcs, were issued for subscription to Eurajoen
Savings Bank as consideration for the transfer of the business on 30 November 2021.
Other reserves
Fair value reserve The fair value reserve includes the change in fair value of financial assets at fair value through other comprehensive
income less deferred taxes. The items recognised in the
reserve are transferred to the income statement when a
security held for trading is sold or when impairment is recognised. The net change of the value of interest
derivatives hedged by cash flow can also be recognised in
the reserve when this net change of value is found to be effective and adjusted by deferred taxes. Changes in
value are realised in the income statement for the
89 Consolidated financial statements
Group’s notes
Parent company’s financial statements
Parent company’s notes
Signatures and audit report
Contents OmaSp in brief Corporate Governance Report of Board of Directors Financial
StatementsCorporate Social
Responsibility Report
Fina
ncia
l Sta
tem
ents
202
1
72
accounting period during which cash flows being hedged
occur.
Reserve for invested non-restricted equity The assets raised in the institutional and public offerings
and personnel offerings in 2017–2018 are entered in the
reserve for invested non-restricted equity. In addition, the reserve for invested non-restricted equity includes the
assets gained from issued shares in connection with
reorganisations in previous accounting periods and the funds received from the directed share issue to Eurajoen
Savings Bank in the ended financial year.
Retained earnings
Retained earnings are earnings accumulated over
previous accounting periods that have not been distributed as dividends to owners. Retained earnings also include
voluntary reserves included in the separate financial
statements and the depreciation difference, minus deferred tax liabilities.
90 Consolidated financial statements
Group’s notes
Parent company’s financial statements
Parent company’s notes
Signatures and audit report
Contents OmaSp in brief Corporate Governance Report of Board of Directors Financial
StatementsCorporate Social
Responsibility Report
Fina
ncia
l Sta
tem
ents
202
1
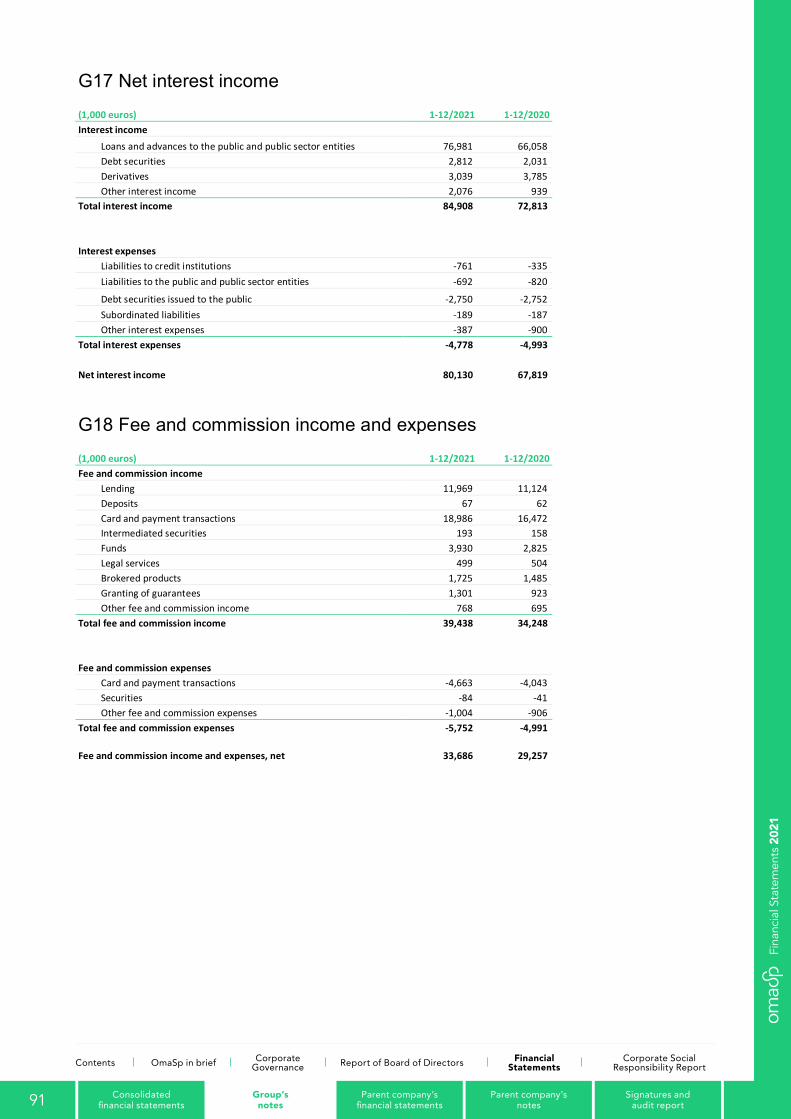
73
G17 Net interest income (1,000 euros) 1-12/2021 1-12/2020 Interest income
Loans and advances to the public and public sector entities 76,981 66,058 Debt securities 2,812 2,031 Derivatives 3,039 3,785 Other interest income 2,076 939 Total interest income 84,908 72,813
Interest expenses
Liabilities to credit institutions -761 -335 Liabilities to the public and public sector entities -692 -820
Debt securities issued to the public -2,750 -2,752 Subordinated liabilities -189 -187 Other interest expenses -387 -900 Total interest expenses -4,778 -4,993
Net interest income 80,130 67,819
G18 Fee and commission income and expenses (1,000 euros) 1-12/2021 1-12/2020 Fee and commission income
Lending 11,969 11,124 Deposits 67 62 Card and payment transactions 18,986 16,472 Intermediated securities 193 158 Funds 3,930 2,825 Legal services 499 504 Brokered products 1,725 1,485 Granting of guarantees 1,301 923 Other fee and commission income 768 695 Total fee and commission income 39,438 34,248
Fee and commission expenses
Card and payment transactions -4,663 -4,043 Securities -84 -41 Other fee and commission expenses -1,004 -906 Total fee and commission expenses -5,752 -4,991
Fee and commission income and expenses, net 33,686 29,257
91 Consolidated financial statements
Group’s notes
Parent company’s financial statements
Parent company’s notes
Signatures and audit report
Contents OmaSp in brief Corporate Governance Report of Board of Directors Financial
StatementsCorporate Social
Responsibility Report
Fina
ncia
l Sta
tem
ents
202
1
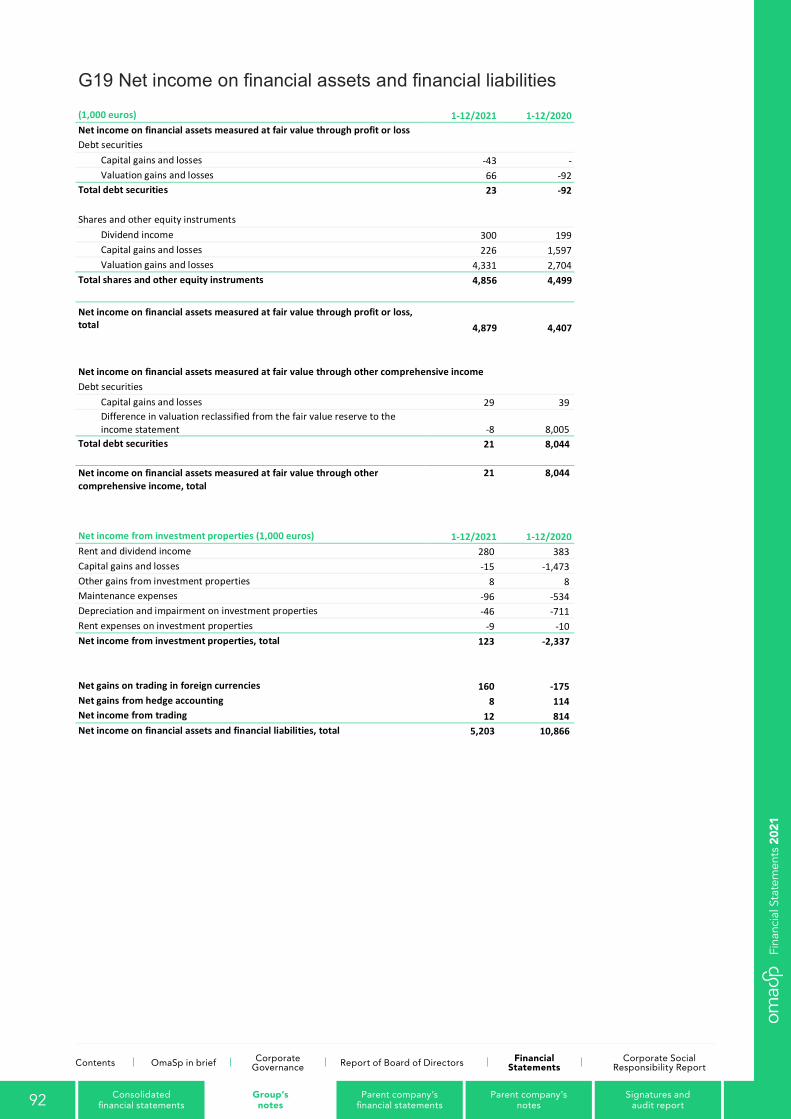
74
G19 Net income on financial assets and financial liabilities (1,000 euros) 1-12/2021 1-12/2020 Net income on financial assets measured at fair value through profit or loss Debt securities
Capital gains and losses -43 - Valuation gains and losses 66 -92 Total debt securities 23 -92
Shares and other equity instruments
Dividend income 300 199 Capital gains and losses 226 1,597 Valuation gains and losses 4,331 2,704 Total shares and other equity instruments 4,856 4,499
Net income on financial assets measured at fair value through profit or loss, total 4,879 4,407
Net income on financial assets measured at fair value through other comprehensive income Debt securities
Capital gains and losses 29 39
Difference in valuation reclassified from the fair value reserve to the income statement -8 8,005
Total debt securities 21 8,044 Net income on financial assets measured at fair value through other comprehensive income, total
21 8,044
Net income from investment properties (1,000 euros) 1-12/2021 1-12/2020 Rent and dividend income 280 383 Capital gains and losses -15 -1,473 Other gains from investment properties 8 8 Maintenance expenses -96 -534 Depreciation and impairment on investment properties -46 -711 Rent expenses on investment properties -9 -10 Net income from investment properties, total 123 -2,337
Net gains on trading in foreign currencies 160 -175 Net gains from hedge accounting 8 114 Net income from trading 12 814 Net income on financial assets and financial liabilities, total 5,203 10,866
92 Consolidated financial statements
Group’s notes
Parent company’s financial statements
Parent company’s notes
Signatures and audit report
Contents OmaSp in brief Corporate Governance Report of Board of Directors Financial
StatementsCorporate Social
Responsibility Report
Fina
ncia
l Sta
tem
ents
202
1
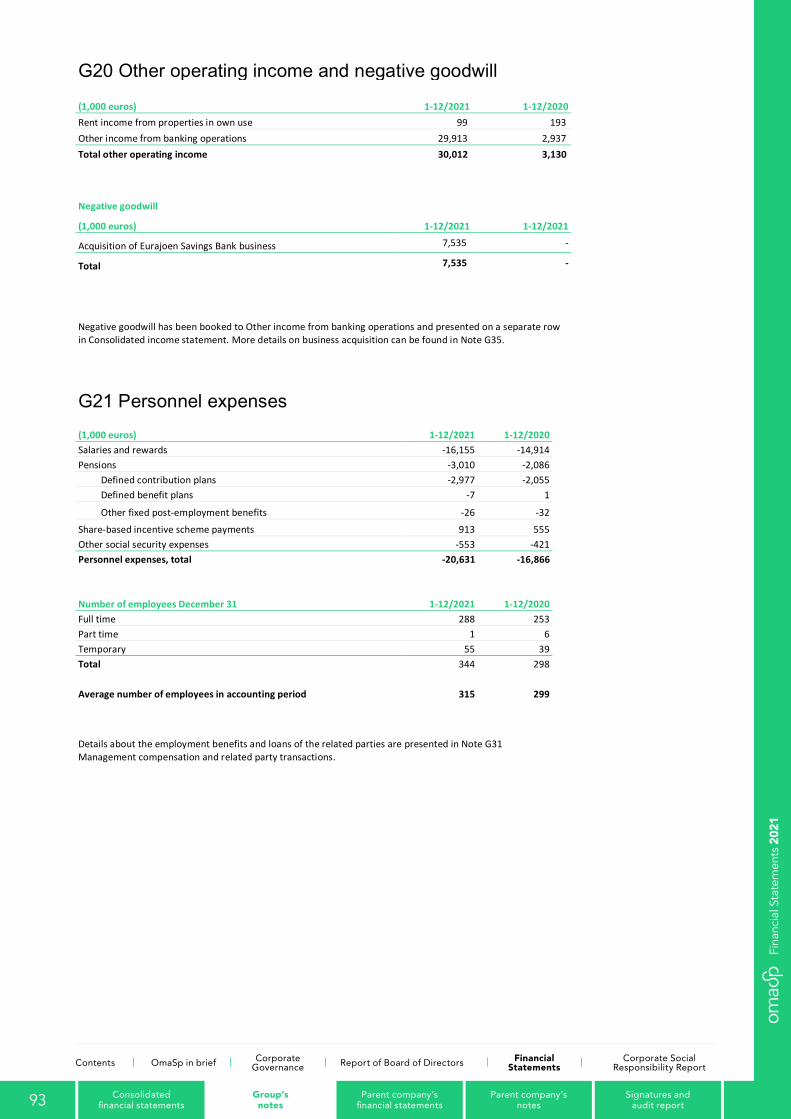
75
G20 Other operating income and negative goodwill (1,000 euros) 1-12/2021 1-12/2020 Rent income from properties in own use 99 193 Other income from banking operations 29,913 2,937 Total other operating income 30,012 3,130
Negative goodwill
(1,000 euros) 1-12/2021 1-12/2021
Acquisition of Eurajoen Savings Bank business 7,535 -
Total 7,535 -
Negative goodwill has been booked to Other income from banking operations and presented on a separate row in Consolidated income statement. More details on business acquisition can be found in Note G35.
G21 Personnel expenses (1,000 euros) 1-12/2021 1-12/2020 Salaries and rewards -16,155 -14,914 Pensions -3,010 -2,086
Defined contribution plans -2,977 -2,055 Defined benefit plans -7 1
Other fixed post-employment benefits -26 -32
Share-based incentive scheme payments 913 555 Other social security expenses -553 -421 Personnel expenses, total -20,631 -16,866
Number of employees December 31 1-12/2021 1-12/2020 Full time 288 253 Part time 1 6 Temporary 55 39 Total 344 298
Average number of employees in accounting period 315 299
Details about the employment benefits and loans of the related parties are presented in Note G31 Management compensation and related party transactions.
93 Consolidated financial statements
Group’s notes
Parent company’s financial statements
Parent company’s notes
Signatures and audit report
Contents OmaSp in brief Corporate Governance Report of Board of Directors Financial
StatementsCorporate Social
Responsibility Report
Fina
ncia
l Sta
tem
ents
202
1
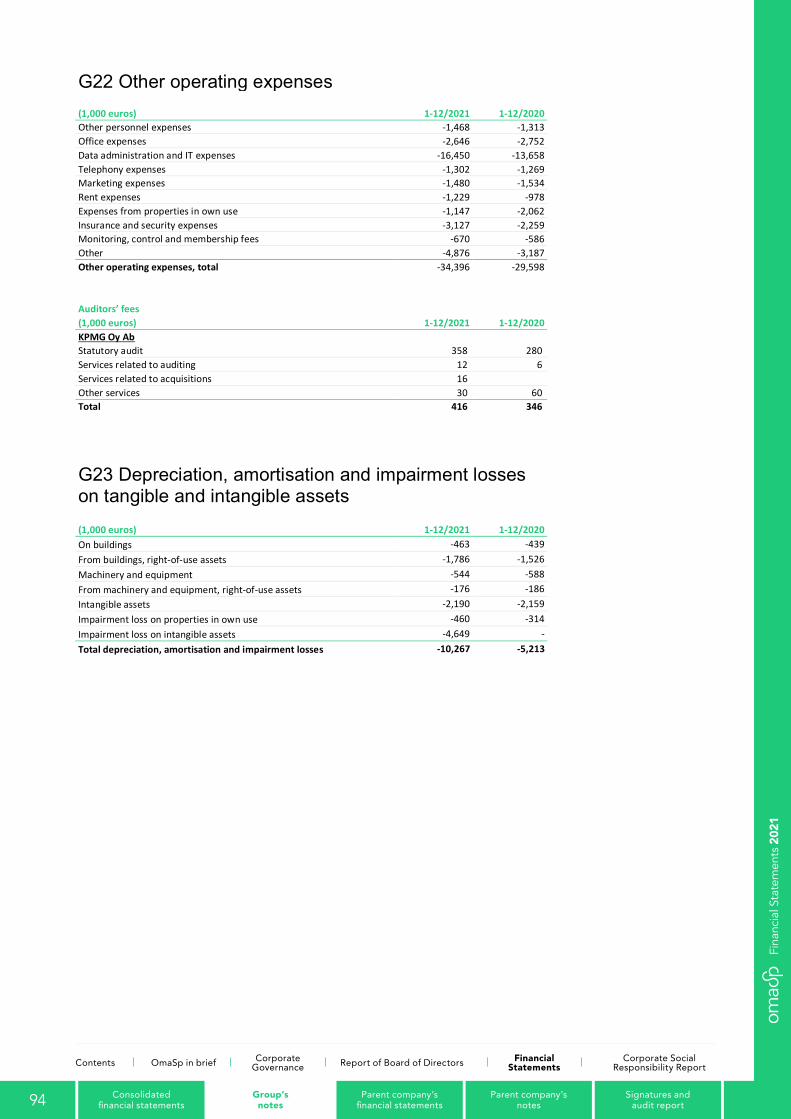
76
G22 Other operating expenses (1,000 euros) 1-12/2021 1-12/2020 Other personnel expenses -1,468 -1,313 Office expenses -2,646 -2,752 Data administration and IT expenses -16,450 -13,658 Telephony expenses -1,302 -1,269 Marketing expenses -1,480 -1,534 Rent expenses -1,229 -978 Expenses from properties in own use -1,147 -2,062 Insurance and security expenses -3,127 -2,259 Monitoring, control and membership fees -670 -586 Other -4,876 -3,187 Other operating expenses, total -34,396 -29,598
Auditors’ fees (1,000 euros) 1-12/2021 1-12/2020 KPMG Oy Ab Statutory audit 358 280 Services related to auditing 12 6 Services related to acquisitions 16 Other services 30 60 Total 416 346
G23 Depreciation, amortisation and impairment losses on tangible and intangible assets
(1,000 euros) 1-12/2021 1-12/2020 On buildings -463 -439 From buildings, right-of-use assets -1,786 -1,526 Machinery and equipment -544 -588 From machinery and equipment, right-of-use assets -176 -186 Intangible assets -2,190 -2,159 Impairment loss on properties in own use -460 -314 Impairment loss on intangible assets -4,649 - Total depreciation, amortisation and impairment losses -10,267 -5,213
94 Consolidated financial statements
Group’s notes
Parent company’s financial statements
Parent company’s notes
Signatures and audit report
Contents OmaSp in brief Corporate Governance Report of Board of Directors Financial
StatementsCorporate Social
Responsibility Report
Fina
ncia
l Sta
tem
ents
202
1
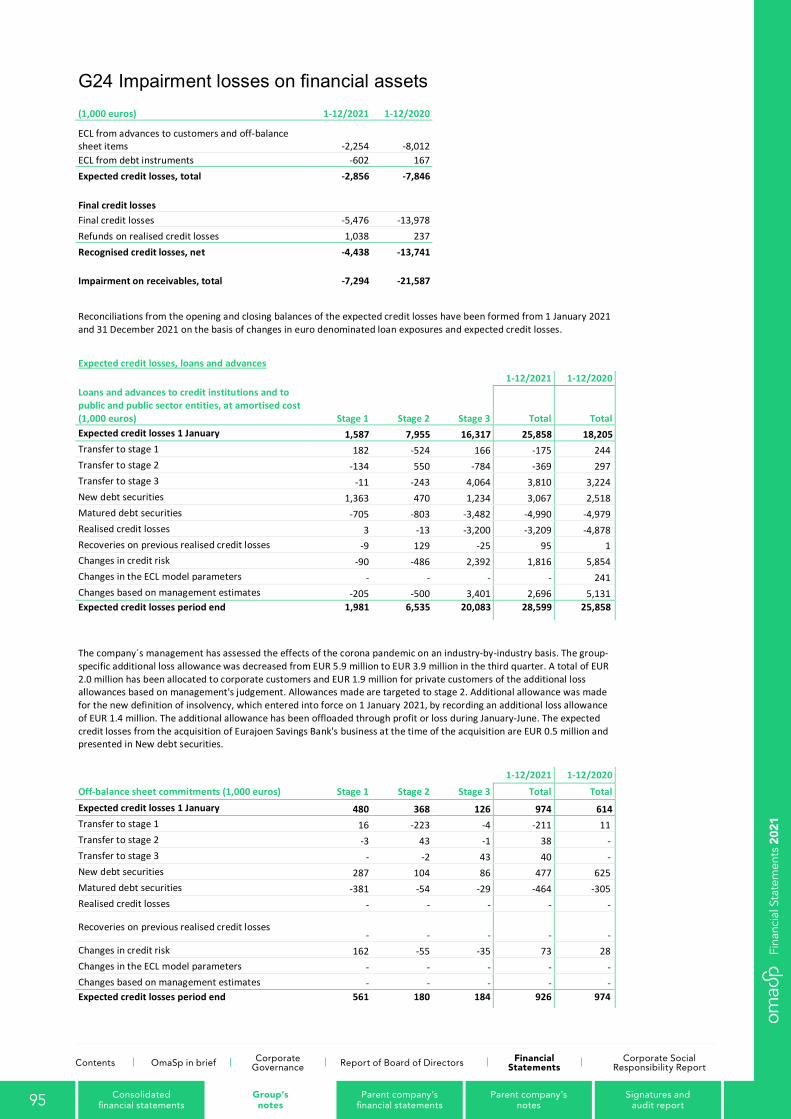
77
G24 Impairment losses on financial assets (1,000 euros) 1-12/2021 1-12/2020 1-12/2020 2021 Q4 2020 Q4
ECL from advances to customers and off-balance sheet items -2,254 -8,012 -8,012 -525 -3,189 ECL from debt instruments -602 167 167 156 261 Expected credit losses, total -2,856 -7,846 -7,846 -369 -2,928
Final credit losses Final credit losses -5,476 -13,978 -13,978 -1,306 -4,753 Refunds on realised credit losses 1,038 237 237 43 79 Recognised credit losses, net -4,438 -13,741 -13,741 -1,264 -4,674
Impairment on receivables, total -7,294 -21,587 -21,587 -1,632 -7,602
Reconciliations from the opening and closing balances of the expected credit losses have been formed from 1 January 2021 and 31 December 2021 on the basis of changes in euro denominated loan exposures and expected credit losses.
Expected credit losses, loans and advances
1-12/2021 1-12/2020 Loans and advances to credit institutions and to public and public sector entities, at amortised cost (1,000 euros) Stage 1 Stage 2 Stage 3 Total Total Expected credit losses 1 January 1,587 7,955 16,317 25,858 18,205 Transfer to stage 1 182 -524 166 -175 244 Transfer to stage 2 -134 550 -784 -369 297 Transfer to stage 3 -11 -243 4,064 3,810 3,224 New debt securities 1,363 470 1,234 3,067 2,518 Matured debt securities -705 -803 -3,482 -4,990 -4,979 Realised credit losses 3 -13 -3,200 -3,209 -4,878 Recoveries on previous realised credit losses -9 129 -25 95 1 Changes in credit risk -90 -486 2,392 1,816 5,854 Changes in the ECL model parameters - - - - 241 Changes based on management estimates -205 -500 3,401 2,696 5,131 Expected credit losses period end 1,981 6,535 20,083 28,599 25,858
The company´s management has assessed the effects of the corona pandemic on an industry-by-industry basis. The group-specific additional loss allowance was decreased from EUR 5.9 million to EUR 3.9 million in the third quarter. A total of EUR 2.0 million has been allocated to corporate customers and EUR 1.9 million for private customers of the additional loss allowances based on management's judgement. Allowances made are targeted to stage 2. Additional allowance was made for the new definition of insolvency, which entered into force on 1 January 2021, by recording an additional loss allowance of EUR 1.4 million. The additional allowance has been offloaded through profit or loss during January-June. The expected credit losses from the acquisition of Eurajoen Savings Bank's business at the time of the acquisition are EUR 0.5 million and presented in New debt securities.
1-12/2021 1-12/2020 Off-balance sheet commitments (1,000 euros) Stage 1 Stage 2 Stage 3 Total Total Expected credit losses 1 January 480 368 126 974 614 Transfer to stage 1 16 -223 -4 -211 11 Transfer to stage 2 -3 43 -1 38 - Transfer to stage 3 - -2 43 40 - New debt securities 287 104 86 477 625 Matured debt securities -381 -54 -29 -464 -305 Realised credit losses - - - - -
Recoveries on previous realised credit losses - - - - -
Changes in credit risk 162 -55 -35 73 28 Changes in the ECL model parameters - - - - - Changes based on management estimates - - - - - Expected credit losses period end 561 180 184 926 974
95 Consolidated financial statements
Group’s notes
Parent company’s financial statements
Parent company’s notes
Signatures and audit report
Contents OmaSp in brief Corporate Governance Report of Board of Directors Financial
StatementsCorporate Social
Responsibility Report
Fina
ncia
l Sta
tem
ents
202
1
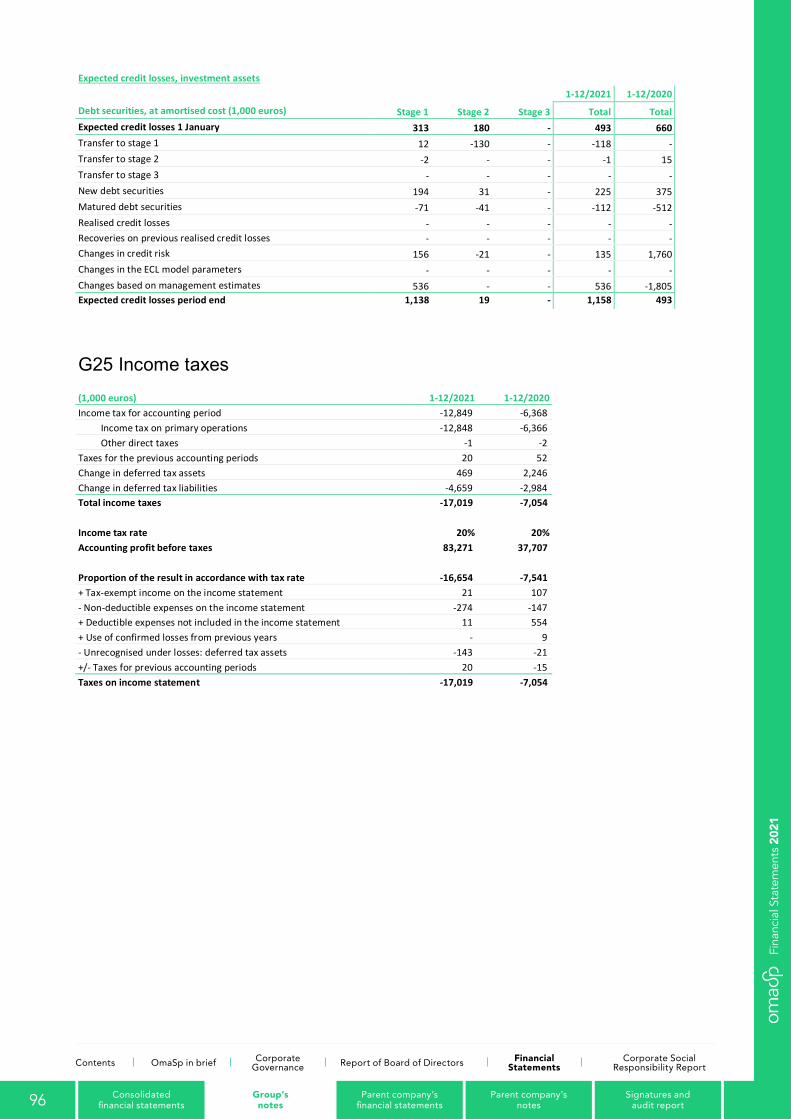
78
Expected credit losses, investment assets 1-12/2021 1-12/2020 Debt securities, at amortised cost (1,000 euros) Stage 1 Stage 2 Stage 3 Total Total Expected credit losses 1 January 313 180 - 493 660 Transfer to stage 1 12 -130 - -118 - Transfer to stage 2 -2 - - -1 15 Transfer to stage 3 - - - - - New debt securities 194 31 - 225 375 Matured debt securities -71 -41 - -112 -512 Realised credit losses - - - - - Recoveries on previous realised credit losses - - - - - Changes in credit risk 156 -21 - 135 1,760 Changes in the ECL model parameters - - - - - Changes based on management estimates 536 - - 536 -1,805 Expected credit losses period end 1,138 19 - 1,158 493
G25 Income taxes (1,000 euros) 1-12/2021 1-12/2020 Income tax for accounting period -12,849 -6,368
Income tax on primary operations -12,848 -6,366 Other direct taxes -1 -2 Taxes for the previous accounting periods 20 52 Change in deferred tax assets 469 2,246 Change in deferred tax liabilities -4,659 -2,984 Total income taxes -17,019 -7,054
Income tax rate 20% 20% Accounting profit before taxes 83,271 37,707
Proportion of the result in accordance with tax rate -16,654 -7,541 + Tax-exempt income on the income statement 21 107 - Non-deductible expenses on the income statement -274 -147 + Deductible expenses not included in the income statement 11 554 + Use of confirmed losses from previous years - 9 - Unrecognised under losses: deferred tax assets -143 -21 +/- Taxes for previous accounting periods 20 -15 Taxes on income statement -17,019 -7,054
96 Consolidated financial statements
Group’s notes
Parent company’s financial statements
Parent company’s notes
Signatures and audit report
Contents OmaSp in brief Corporate Governance Report of Board of Directors Financial
StatementsCorporate Social
Responsibility Report
Fina
ncia
l Sta
tem
ents
202
1
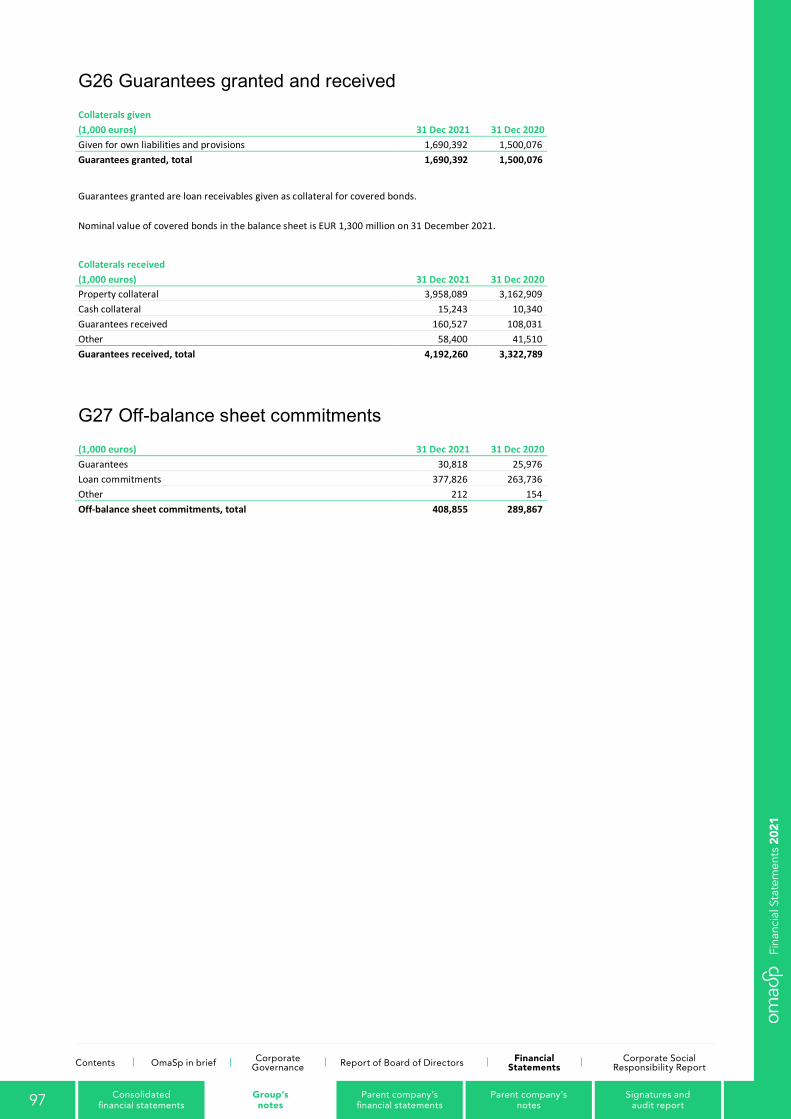
79
G26 Guarantees granted and received Collaterals given (1,000 euros) 31 Dec 2021 31 Dec 2020 Given for own liabilities and provisions 1,690,392 1,500,076 Guarantees granted, total 1,690,392 1,500,076
Guarantees granted are loan receivables given as collateral for covered bonds.
Nominal value of covered bonds in the balance sheet is EUR 1,300 million on 31 December 2021.
Collaterals received (1,000 euros) 31 Dec 2021 31 Dec 2020 Property collateral 3,958,089 3,162,909 Cash collateral 15,243 10,340 Guarantees received 160,527 108,031 Other 58,400 41,510 Guarantees received, total 4,192,260 3,322,789
G27 Off-balance sheet commitments (1,000 euros) 31 Dec 2021 31 Dec 2020 Guarantees 30,818 25,976 Loan commitments 377,826 263,736 Other 212 154 Off-balance sheet commitments, total 408,855 289,867
97 Consolidated financial statements
Group’s notes
Parent company’s financial statements
Parent company’s notes
Signatures and audit report
Contents OmaSp in brief Corporate Governance Report of Board of Directors Financial
StatementsCorporate Social
Responsibility Report
Fina
ncia
l Sta
tem
ents
202
1
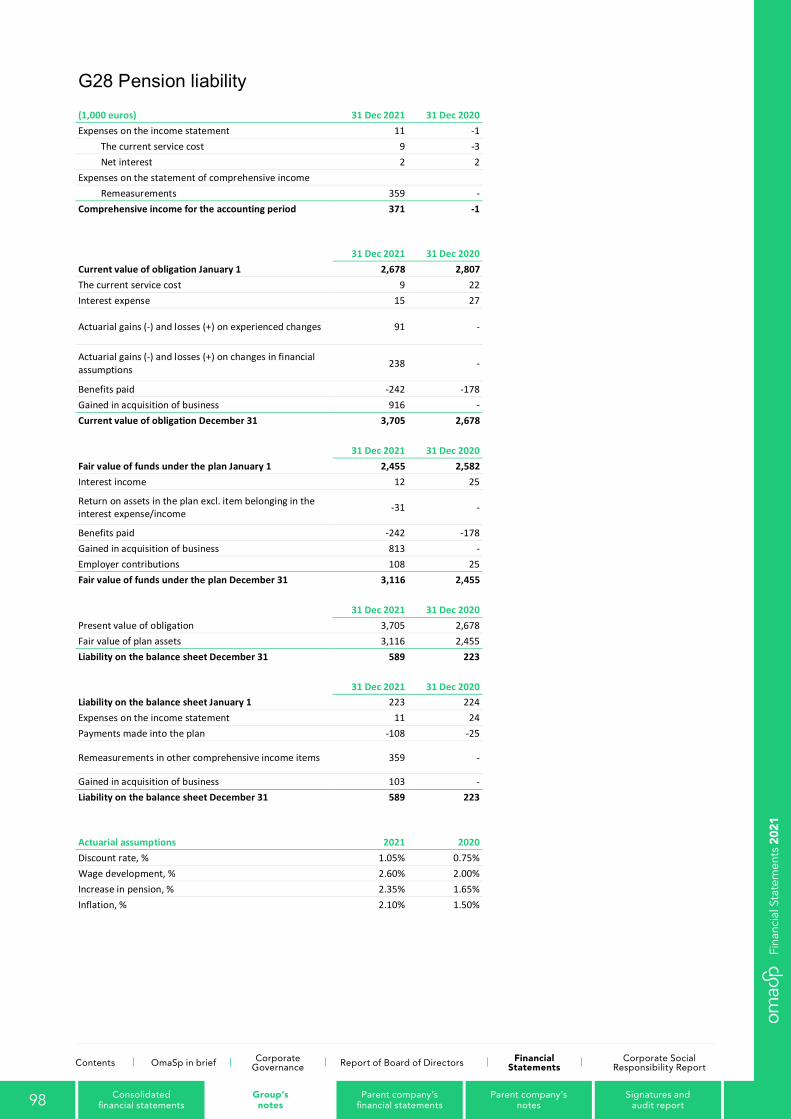
80
G28 Pension liability (1,000 euros) 31 Dec 2021 31 Dec 2020 Expenses on the income statement 11 -1
The current service cost 9 -3 Net interest 2 2 Expenses on the statement of comprehensive income
Remeasurements 359 - Comprehensive income for the accounting period 371 -1
31 Dec 2021 31 Dec 2020 Current value of obligation January 1 2,678 2,807 The current service cost 9 22 Interest expense 15 27
Actuarial gains (-) and losses (+) on experienced changes 91 -
Actuarial gains (-) and losses (+) on changes in financial assumptions 238 -
Benefits paid -242 -178 Gained in acquisition of business 916 - Current value of obligation December 31 3,705 2,678
31 Dec 2021 31 Dec 2020 Fair value of funds under the plan January 1 2,455 2,582 Interest income 12 25
Return on assets in the plan excl. item belonging in the interest expense/income -31 -
Benefits paid -242 -178 Gained in acquisition of business 813 - Employer contributions 108 25 Fair value of funds under the plan December 31 3,116 2,455
31 Dec 2021 31 Dec 2020 Present value of obligation 3,705 2,678 Fair value of plan assets 3,116 2,455 Liability on the balance sheet December 31 589 223
31 Dec 2021 31 Dec 2020 Liability on the balance sheet January 1 223 224 Expenses on the income statement 11 24 Payments made into the plan -108 -25
Remeasurements in other comprehensive income items 359 -
Gained in acquisition of business 103 - Liability on the balance sheet December 31 589 223
Actuarial assumptions 2021 2020 Discount rate, % 1.05% 0.75% Wage development, % 2.60% 2.00% Increase in pension, % 2.35% 1.65% Inflation, % 2.10% 1.50%
98 Consolidated financial statements
Group’s notes
Parent company’s financial statements
Parent company’s notes
Signatures and audit report
Contents OmaSp in brief Corporate Governance Report of Board of Directors Financial
StatementsCorporate Social
Responsibility Report
Fina
ncia
l Sta
tem
ents
202
1
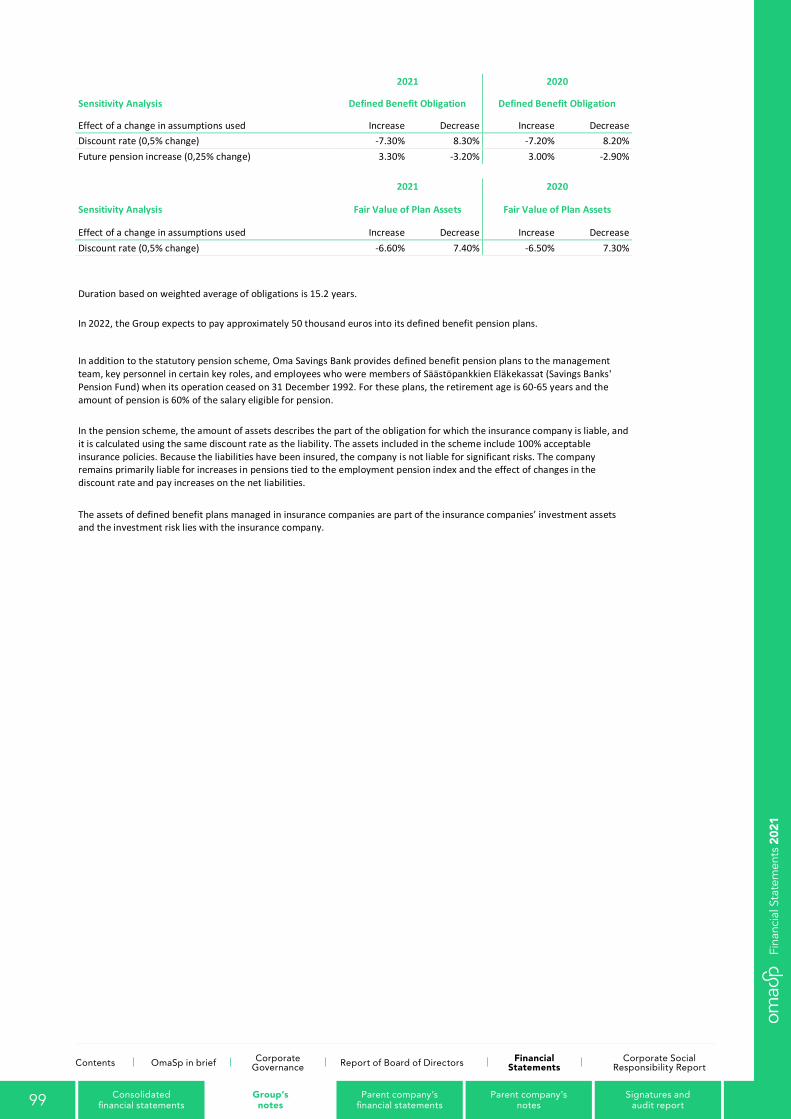
81
2021 2020
Sensitivity Analysis Defined Benefit Obligation Defined Benefit Obligation
Effect of a change in assumptions used Increase Decrease Increase Decrease Discount rate (0,5% change) -7.30% 8.30% -7.20% 8.20% Future pension increase (0,25% change) 3.30% -3.20% 3.00% -2.90%
2021 2020
Sensitivity Analysis Fair Value of Plan Assets Fair Value of Plan Assets
Effect of a change in assumptions used Increase Decrease Increase Decrease Discount rate (0,5% change) -6.60% 7.40% -6.50% 7.30%
Duration based on weighted average of obligations is 15.2 years.
In 2022, the Group expects to pay approximately 50 thousand euros into its defined benefit pension plans.
In addition to the statutory pension scheme, Oma Savings Bank provides defined benefit pension plans to the management team, key personnel in certain key roles, and employees who were members of Säästöpankkien Eläkekassat (Savings Banks' Pension Fund) when its operation ceased on 31 December 1992. For these plans, the retirement age is 60-65 years and the amount of pension is 60% of the salary eligible for pension.
In the pension scheme, the amount of assets describes the part of the obligation for which the insurance company is liable, and it is calculated using the same discount rate as the liability. The assets included in the scheme include 100% acceptable insurance policies. Because the liabilities have been insured, the company is not liable for significant risks. The company remains primarily liable for increases in pensions tied to the employment pension index and the effect of changes in the discount rate and pay increases on the net liabilities.
The assets of defined benefit plans managed in insurance companies are part of the insurance companies’ investment assets and the investment risk lies with the insurance company.
99 Consolidated financial statements
Group’s notes
Parent company’s financial statements
Parent company’s notes
Signatures and audit report
Contents OmaSp in brief Corporate Governance Report of Board of Directors Financial
StatementsCorporate Social
Responsibility Report
Fina
ncia
l Sta
tem
ents
202
1

82
G29 Offsetting financial assets and financial liabilities (1,000 euros) Monetary amounts not offset in the Balance Sheet
Financial assets 31 Dec 2021 Financial instruments Received security
collateral Received cash
collateral Net amount Derivative assets 2240 - - 2240 Other - - - - Total financial assets 2240 - - 2240
Monetary amounts not offset in the Balance Sheet
Financial liabilities 31 Dec 2021 Financial instruments Granted security
collateral Granted cash
collateral Net amount Derivative liabilities - - - - Other - - - - Total financial liabilities - - - -
Monetary amounts not offset in the Balance Sheet
Financial assets 31 Dec 2020 Financial instruments Received security
collateral Received cash
collateral Net amount Derivative assets 796 - - 796 Other - - - - Total financial assets 796 - - 796
Monetary amounts not offset in the Balance Sheet
Financial liabilities 31 Dec 2020 Financial instruments Granted security
collateral Granted cash
collateral Net amount Derivative liabilities - - - - Other - - - - Total financial liabilities - - - -
100 Consolidated financial statements
Group’s notes
Parent company’s financial statements
Parent company’s notes
Signatures and audit report
Contents OmaSp in brief Corporate Governance Report of Board of Directors Financial
StatementsCorporate Social
Responsibility Report
Fina
ncia
l Sta
tem
ents
202
1
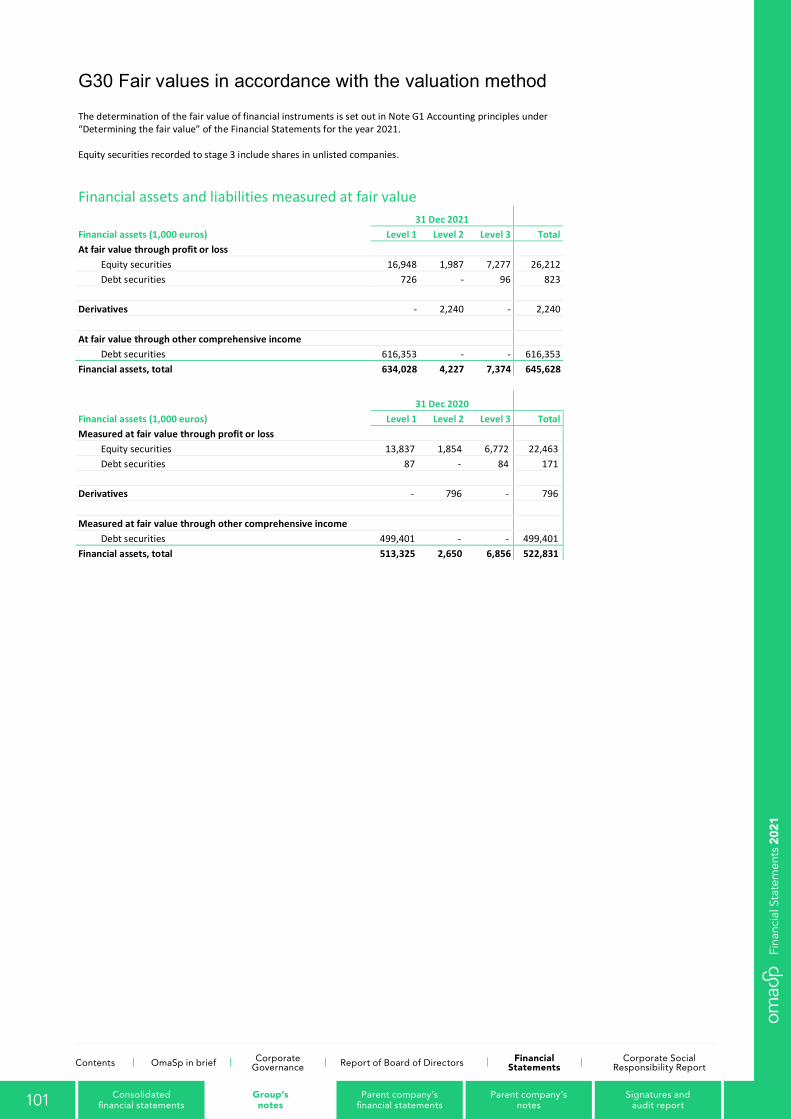
83
G30 Fair values in accordance with the valuation method The determination of the fair value of financial instruments is set out in Note G1 Accounting principles under “Determining the fair value” of the Financial Statements for the year 2021.
Equity securities recorded to stage 3 include shares in unlisted companies.
Financial assets and liabilities measured at fair value
31 Dec 2021 Financial assets (1,000 euros) Level 1 Level 2 Level 3 Total At fair value through profit or loss
Equity securities 16,948 1,987 7,277 26,212 Debt securities 726 - 96 823 Derivatives - 2,240 - 2,240
At fair value through other comprehensive income
Debt securities 616,353 - - 616,353 Financial assets, total 634,028 4,227 7,374 645,628
31 Dec 2020 Financial assets (1,000 euros) Level 1 Level 2 Level 3 Total Measured at fair value through profit or loss
Equity securities 13,837 1,854 6,772 22,463 Debt securities 87 - 84 171 Derivatives - 796 - 796
Measured at fair value through other comprehensive income
Debt securities 499,401 - - 499,401 Financial assets, total 513,325 2,650 6,856 522,831
101 Consolidated financial statements
Group’s notes
Parent company’s financial statements
Parent company’s notes
Signatures and audit report
Contents OmaSp in brief Corporate Governance Report of Board of Directors Financial
StatementsCorporate Social
Responsibility Report
Fina
ncia
l Sta
tem
ents
202
1
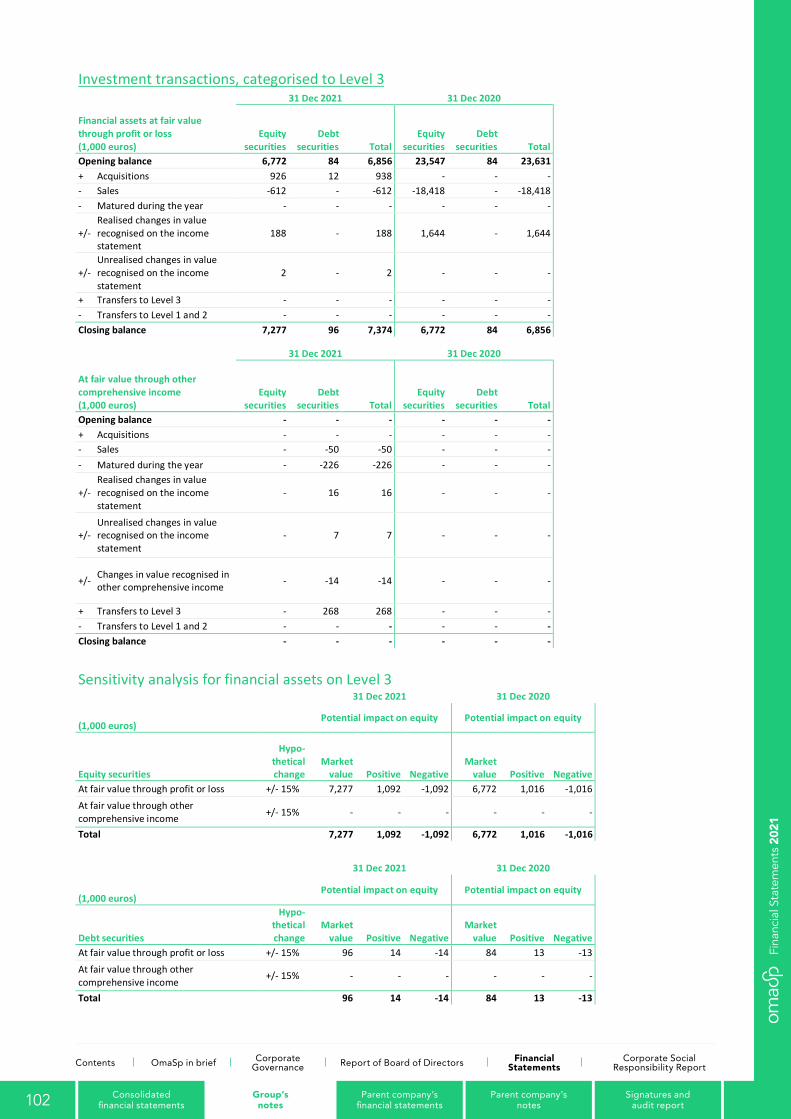
84
Investment transactions, categorised to Level 3
31 Dec 2021 31 Dec 2020
Financial assets at fair value through profit or loss (1,000 euros)
Equity securities
Debt securities Total
Equity securities
Debt securities Total
Opening balance 6,772 84 6,856 23,547 84 23,631 + Acquisitions 926 12 938 - - - - Sales -612 - -612 -18,418 - -18,418 - Matured during the year - - - - - -
+/- Realised changes in value recognised on the income statement
188 - 188 1,644 - 1,644
+/- Unrealised changes in value recognised on the income statement
2 - 2 - - -
+ Transfers to Level 3 - - - - - - - Transfers to Level 1 and 2 - - - - - - Closing balance 7,277 96 7,374 6,772 84 6,856
31 Dec 2021 31 Dec 2020
At fair value through other comprehensive income (1,000 euros)
Equity securities
Debt securities Total
Equity securities
Debt securities Total
Opening balance - - - - - - + Acquisitions - - - - - - - Sales - -50 -50 - - - - Matured during the year - -226 -226 - - -
+/- Realised changes in value recognised on the income statement
- 16 16 - - -
+/- Unrealised changes in value recognised on the income statement
- 7 7 - - -
+/- Changes in value recognised in other comprehensive income - -14 -14 - - -
+ Transfers to Level 3 - 268 268 - - - - Transfers to Level 1 and 2 - - - - - - Closing balance - - - - - -
Sensitivity analysis for financial assets on Level 3 31 Dec 2021 31 Dec 2020
(1,000 euros) Potential impact on equity Potential impact on equity
Equity securities
Hypo-thetical change
Market value Positive Negative
Market value Positive Negative
At fair value through profit or loss +/- 15% 7,277 1,092 -1,092 6,772 1,016 -1,016 At fair value through other comprehensive income +/- 15% - - - - - -
Total 7,277 1,092 -1,092 6,772 1,016 -1,016 31 Dec 2021 31 Dec 2020
(1,000 euros) Potential impact on equity Potential impact on equity
Debt securities
Hypo-thetical change
Market value Positive Negative
Market value Positive Negative
At fair value through profit or loss +/- 15% 96 14 -14 84 13 -13 At fair value through other comprehensive income
+/- 15% - - - - - -
Total 96 14 -14 84 13 -13
102 Consolidated financial statements
Group’s notes
Parent company’s financial statements
Parent company’s notes
Signatures and audit report
Contents OmaSp in brief Corporate Governance Report of Board of Directors Financial
StatementsCorporate Social
Responsibility Report
Fina
ncia
l Sta
tem
ents
202
1
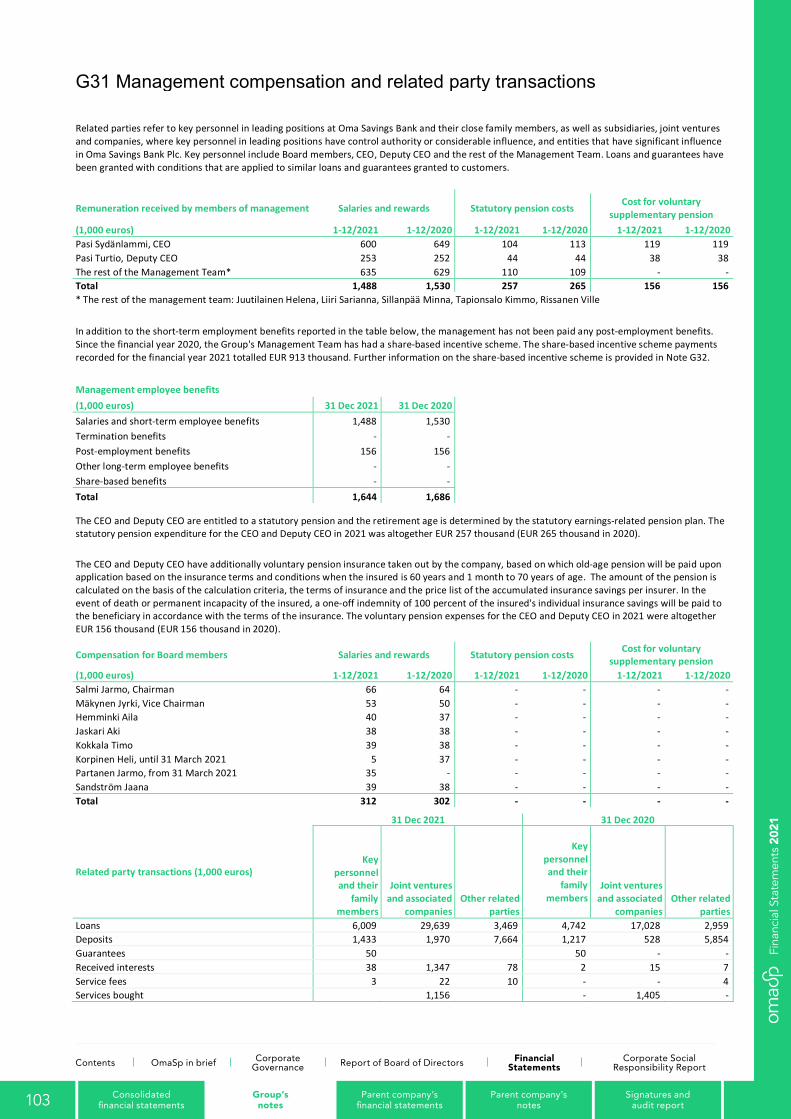
85
G31 Management compensation and related party transactions
Related parties refer to key personnel in leading positions at Oma Savings Bank and their close family members, as well as subsidiaries, joint ventures and companies, where key personnel in leading positions have control authority or considerable influence, and entities that have significant influence in Oma Savings Bank Plc. Key personnel include Board members, CEO, Deputy CEO and the rest of the Management Team. Loans and guarantees have been granted with conditions that are applied to similar loans and guarantees granted to customers.
Remuneration received by members of management Salaries and rewards Statutory pension costs
Cost for voluntary supplementary pension
(1,000 euros) 1-12/2021 1-12/2020 1-12/2021 1-12/2020 1-12/2021 1-12/2020 Pasi Sydänlammi, CEO 600 649 104 113 119 119 Pasi Turtio, Deputy CEO 253 252 44 44 38 38 The rest of the Management Team* 635 629 110 109 - - Total 1,488 1,530 257 265 156 156 * The rest of the management team: Juutilainen Helena, Liiri Sarianna, Sillanpää Minna, Tapionsalo Kimmo, Rissanen Ville
In addition to the short-term employment benefits reported in the table below, the management has not been paid any post-employment benefits. Since the financial year 2020, the Group's Management Team has had a share-based incentive scheme. The share-based incentive scheme payments recorded for the financial year 2021 totalled EUR 913 thousand. Further information on the share-based incentive scheme is provided in Note G32.
Management employee benefits (1,000 euros) 31 Dec 2021 31 Dec 2020 Salaries and short-term employee benefits 1,488 1,530 Termination benefits - - Post-employment benefits 156 156 Other long-term employee benefits - - Share-based benefits - - Total 1,644 1,686
The CEO and Deputy CEO are entitled to a statutory pension and the retirement age is determined by the statutory earnings-related pension plan. The statutory pension expenditure for the CEO and Deputy CEO in 2021 was altogether EUR 257 thousand (EUR 265 thousand in 2020).
The CEO and Deputy CEO have additionally voluntary pension insurance taken out by the company, based on which old-age pension will be paid upon application based on the insurance terms and conditions when the insured is 60 years and 1 month to 70 years of age. The amount of the pension is calculated on the basis of the calculation criteria, the terms of insurance and the price list of the accumulated insurance savings per insurer. In the event of death or permanent incapacity of the insured, a one-off indemnity of 100 percent of the insured's individual insurance savings will be paid to the beneficiary in accordance with the terms of the insurance. The voluntary pension expenses for the CEO and Deputy CEO in 2021 were altogether EUR 156 thousand (EUR 156 thousand in 2020).
Compensation for Board members Salaries and rewards Statutory pension costs Cost for voluntary supplementary pension
(1,000 euros) 1-12/2021 1-12/2020 1-12/2021 1-12/2020 1-12/2021 1-12/2020 Salmi Jarmo, Chairman 66 64 - - - - Mäkynen Jyrki, Vice Chairman 53 50 - - - - Hemminki Aila 40 37 - - - - Jaskari Aki 38 38 - - - - Kokkala Timo 39 38 - - - - Korpinen Heli, until 31 March 2021 5 37 - - - - Partanen Jarmo, from 31 March 2021 35 - - - - - Sandström Jaana 39 38 - - - - Total 312 302 - - - -
31 Dec 2021 31 Dec 2020
Related party transactions (1,000 euros) Key
personnel and their
family members
Joint ventures and associated
companies Other related
parties
Key personnel and their
family members
Joint ventures and associated
companies Other related
parties Loans 6,009 29,639 3,469 4,742 17,028 2,959 Deposits 1,433 1,970 7,664 1,217 528 5,854 Guarantees 50
50 - - Received interests 38 1,347 78 2 15 7 Service fees 3 22 10 - - 4 Services bought 1,156 - 1,405 -
103 Consolidated financial statements
Group’s notes
Parent company’s financial statements
Parent company’s notes
Signatures and audit report
Contents OmaSp in brief Corporate Governance Report of Board of Directors Financial
StatementsCorporate Social
Responsibility Report
Fina
ncia
l Sta
tem
ents
202
1
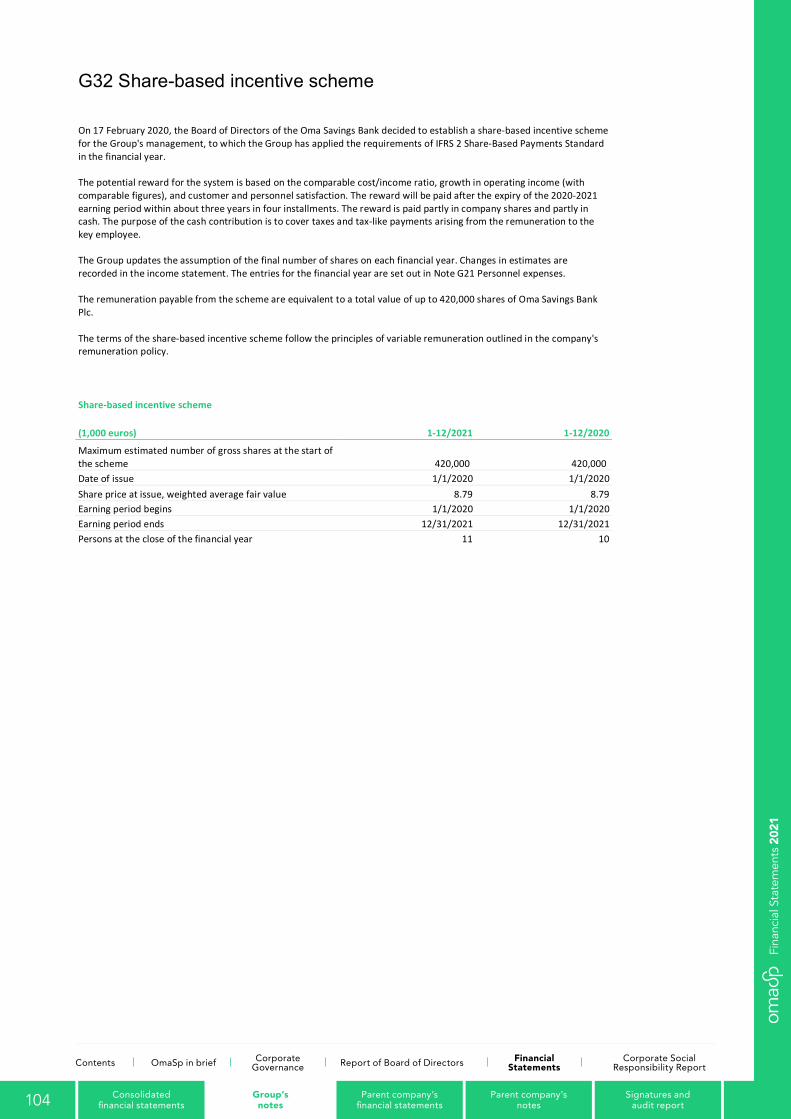
86
G32 Share-based incentive scheme
On 17 February 2020, the Board of Directors of the Oma Savings Bank decided to establish a share-based incentive scheme for the Group's management, to which the Group has applied the requirements of IFRS 2 Share-Based Payments Standard in the financial year. The potential reward for the system is based on the comparable cost/income ratio, growth in operating income (with comparable figures), and customer and personnel satisfaction. The reward will be paid after the expiry of the 2020-2021 earning period within about three years in four installments. The reward is paid partly in company shares and partly in cash. The purpose of the cash contribution is to cover taxes and tax-like payments arising from the remuneration to the key employee. The Group updates the assumption of the final number of shares on each financial year. Changes in estimates are recorded in the income statement. The entries for the financial year are set out in Note G21 Personnel expenses. The remuneration payable from the scheme are equivalent to a total value of up to 420,000 shares of Oma Savings Bank Plc. The terms of the share-based incentive scheme follow the principles of variable remuneration outlined in the company's remuneration policy.
Share-based incentive scheme
(1,000 euros) 1-12/2021 1-12/2020
Maximum estimated number of gross shares at the start of the scheme 420,000 420,000 Date of issue 1/1/2020 1/1/2020 Share price at issue, weighted average fair value 8.79 8.79 Earning period begins 1/1/2020 1/1/2020 Earning period ends 12/31/2021 12/31/2021 Persons at the close of the financial year 11 10
104 Consolidated financial statements
Group’s notes
Parent company’s financial statements
Parent company’s notes
Signatures and audit report
Contents OmaSp in brief Corporate Governance Report of Board of Directors Financial
StatementsCorporate Social
Responsibility Report
Fina
ncia
l Sta
tem
ents
202
1
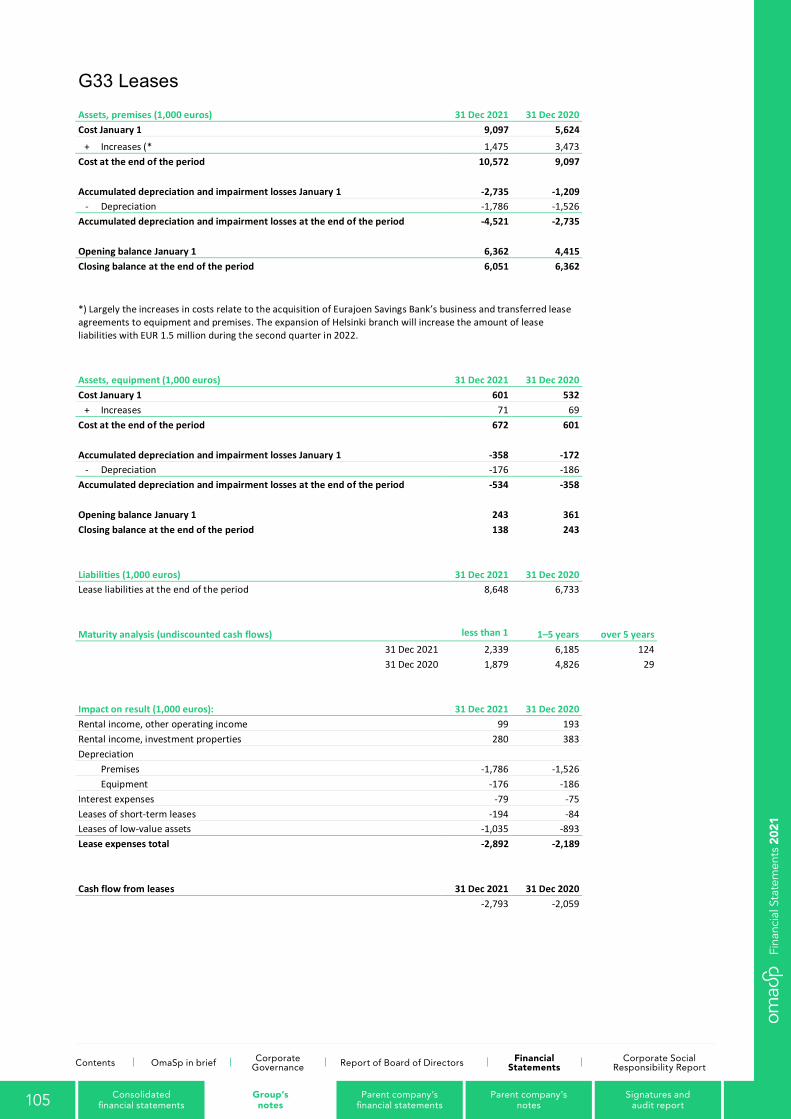
87
G33 Leases Assets, premises (1,000 euros) 31 Dec 2021 31 Dec 2020 Cost January 1 9,097 5,624
+ Increases (* 1,475 3,473 Cost at the end of the period 10,572 9,097
Accumulated depreciation and impairment losses January 1 -2,735 -1,209
- Depreciation -1,786 -1,526 Accumulated depreciation and impairment losses at the end of the period -4,521 -2,735
Opening balance January 1 6,362 4,415 Closing balance at the end of the period 6,051 6,362
*) Largely the increases in costs relate to the acquisition of Eurajoen Savings Bank’s business and transferred lease agreements to equipment and premises. The expansion of Helsinki branch will increase the amount of lease liabilities with EUR 1.5 million during the second quarter in 2022.
Assets, equipment (1,000 euros) 31 Dec 2021 31 Dec 2020 Cost January 1 601 532
+ Increases 71 69 Cost at the end of the period 672 601
Accumulated depreciation and impairment losses January 1 -358 -172
- Depreciation -176 -186 Accumulated depreciation and impairment losses at the end of the period -534 -358
Opening balance January 1 243 361 Closing balance at the end of the period 138 243
Liabilities (1,000 euros) 31 Dec 2021 31 Dec 2020 Lease liabilities at the end of the period 8,648 6,733
Maturity analysis (undiscounted cash flows) less than 1
1–5 years over 5 years
31 Dec 2021 2,339 6,185 124 31 Dec 2020 1,879 4,826 29 Impact on result (1,000 euros): 31 Dec 2021 31 Dec 2020 Rental income, other operating income 99 193 Rental income, investment properties 280 383 Depreciation
Premises -1,786 -1,526 Equipment -176 -186 Interest expenses -79 -75 Leases of short-term leases -194 -84 Leases of low-value assets -1,035 -893 Lease expenses total -2,892 -2,189
Cash flow from leases 31 Dec 2021 31 Dec 2020
-2,793 -2,059
105 Consolidated financial statements
Group’s notes
Parent company’s financial statements
Parent company’s notes
Signatures and audit report
Contents OmaSp in brief Corporate Governance Report of Board of Directors Financial
StatementsCorporate Social
Responsibility Report
Fina
ncia
l Sta
tem
ents
202
1
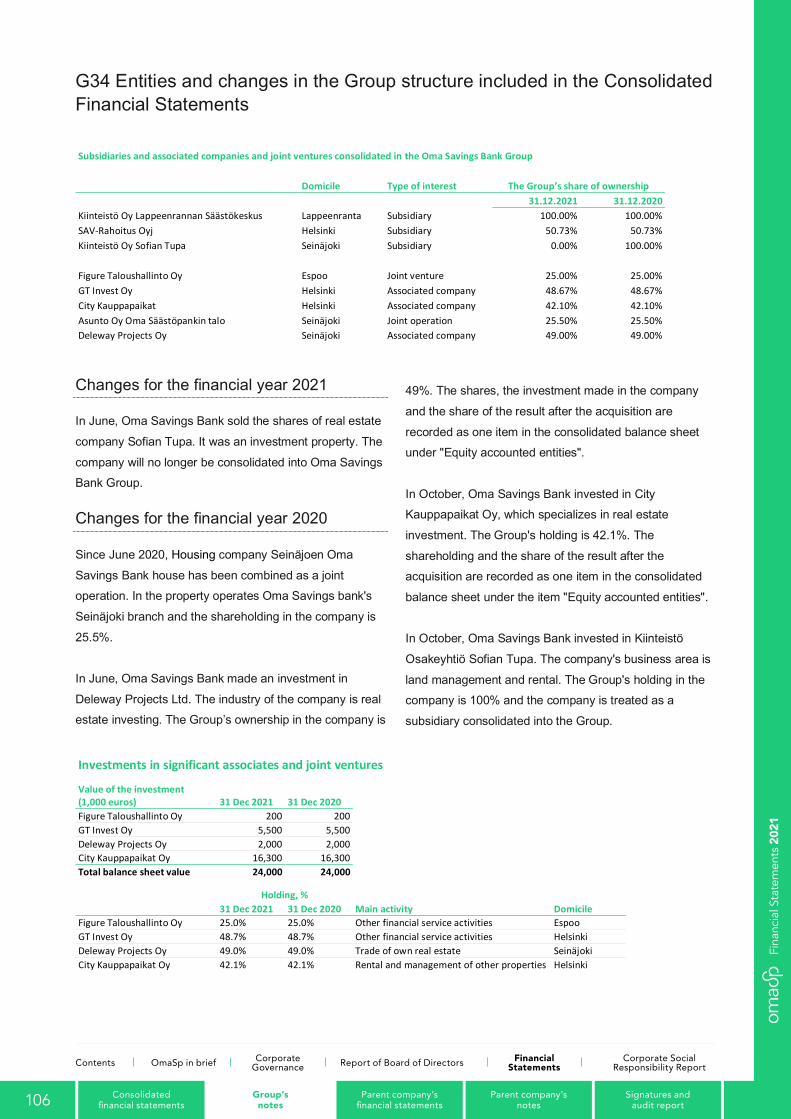
88
G34 Entities and changes in the Group structure included in the Consolidated Financial Statements
Subsidiaries and associated companies and joint ventures consolidated in the Oma Savings Bank Group Domicile Type of interest The Group’s share of ownership 31.12.2021 31.12.2020 Kiinteistö Oy Lappeenrannan Säästökeskus Lappeenranta Subsidiary 100.00% 100.00% SAV-Rahoitus Oyj Helsinki Subsidiary 50.73% 50.73% Kiinteistö Oy Sofian Tupa Seinäjoki Subsidiary 0.00% 100.00%
Figure Taloushallinto Oy Espoo Joint venture 25.00% 25.00% GT Invest Oy Helsinki Associated company 48.67% 48.67% City Kauppapaikat Helsinki Associated company 42.10% 42.10% Asunto Oy Oma Säästöpankin talo Seinäjoki Joint operation 25.50% 25.50% Deleway Projects Oy Seinäjoki Associated company 49.00% 49.00%
Changes for the financial year 2021
In June, Oma Savings Bank sold the shares of real estate
company Sofian Tupa. It was an investment property. The
company will no longer be consolidated into Oma Savings Bank Group.
Changes for the financial year 2020
Since June 2020, Housing company Seinäjoen Oma
Savings Bank house has been combined as a joint operation. In the property operates Oma Savings bank's
Seinäjoki branch and the shareholding in the company is
25.5%.
In June, Oma Savings Bank made an investment in
Deleway Projects Ltd. The industry of the company is real estate investing. The Group’s ownership in the company is
49%. The shares, the investment made in the company
and the share of the result after the acquisition are
recorded as one item in the consolidated balance sheet under "Equity accounted entities".
In October, Oma Savings Bank invested in City Kauppapaikat Oy, which specializes in real estate
investment. The Group's holding is 42.1%. The
shareholding and the share of the result after the acquisition are recorded as one item in the consolidated
balance sheet under the item "Equity accounted entities".
In October, Oma Savings Bank invested in Kiinteistö
Osakeyhtiö Sofian Tupa. The company's business area is
land management and rental. The Group's holding in the company is 100% and the company is treated as a
subsidiary consolidated into the Group.
Investments in significant associates and joint ventures Value of the investment (1,000 euros) 31 Dec 2021 31 Dec 2020 Figure Taloushallinto Oy 200 200 GT Invest Oy 5,500 5,500 Deleway Projects Oy 2,000 2,000 City Kauppapaikat Oy 16,300 16,300 Total balance sheet value 24,000 24,000
Holding, %
31 Dec 2021 31 Dec 2020 Main activity Domicile Figure Taloushallinto Oy 25.0% 25.0% Other financial service activities Espoo GT Invest Oy 48.7% 48.7% Other financial service activities Helsinki Deleway Projects Oy 49.0% 49.0% Trade of own real estate Seinäjoki City Kauppapaikat Oy 42.1% 42.1% Rental and management of other properties Helsinki
106 Consolidated financial statements
Group’s notes
Parent company’s financial statements
Parent company’s notes
Signatures and audit report
Contents OmaSp in brief Corporate Governance Report of Board of Directors Financial
StatementsCorporate Social
Responsibility Report
Fina
ncia
l Sta
tem
ents
202
1

89
G35 Business acquisitions
Acquisition of Eurajoen Savings Bank's business
Company’s Board of Directors decided to acquire the business of Eurajoen Savings Bank in accordance with
the acquisition plan. In September, in accordance with
a decision made by the governing body of Eurajoen Savings Bank, Eurajoen Savings Bank transferred its
entire business to the company except for the minor
assets mentioned in the acquisition plan. The registration date for the implementation of the business
transfer was 30 November 2021. The purchase price of
the business acquisition was paid half in cash and half by issuing shares.
The values of the assets acquired and liabilities taken to bear were at the time of acquisition:
Business combination EUR million
Loans and advances to public and credit institutions
328.3
Accruals and other assets 6.3
Deposits from public and credit institutions -294.2
Accruals and other liabilities -10.9
Liability, consortium of Saving banks -6.5
Acquired net assets 23.0
Purchase price, settled in cash 7.7
Purchase price, settled in share issue 7.7
Cost of combination 15.5
Negative goodwill 7.5
According to estimates, the positive profit impact of the business transfer will be EUR 14.0 million for the
company. Of this profit impact, EUR 7.5 million is
negative goodwill, which has been recognised in the
company's results for the financial year 2021. Negative goodwill has been formed as the difference between
the net assets of the acquired business and the
purchase price. The formation of negative goodwill was facilitated by market conditions at the time of the
agreement and favorable terms for the company. The
net assets acquired in the acquisition of the business
exceeded the acquisition price. Assets and liabilities are measured at fair value. Leases have been valued in
accordance with IFRS 16.
In connection with the transitioning of the business, a
liability of EUR 6.5 million was recognised in the
company's balance sheet to cover a payment obligation related to the fixed-term liability of Eurajoen Savings
Bank being a credit institution member leaving the
consortium of savings banks (Law on the consortium of deposit banks 599/2010). The amount of liability will be
estimated annually, and the liability item is estimated to
be recognised as income over the next five years.
The value of receivables received in the acquisition of
the business is approx. EUR 328.3 million and in this at the time of the acquisition has been taken into account
the gross value of receivables of EUR 0.5 million as a
reduction in expected credit losses. The effect is
presented in Note G24 under “New debt securities”.
Negative goodwill recognised from the acquisition is
presented in the cash flow statement in cash flow adjustments. The cash payment paid for the acquisition
and the net effect of the merging bank on balance sheet
items is EUR 43.3 million presented in the cash flow statement is line Acquisition or sale of business, in
Cash flows from financing activities.
Operating income after the acquisition, EUR 0.5 million
are included in the income statement for 2021.
According to the management's estimate, Oma Savings Bank Group's operating income in 2021 would have
been EUR 163 million and profit before taxes EUR 86.3
million, if the acquired business had been consolidated in the consolidated financial statements from the
beginning of the financial year 2021.
The acquisition increased the company's balance sheet
by approximately EUR 335 million. Approximately
12,000 private and corporate customers transferred in
the acquisition of the business. 33 people transferred as former employees. The total cost of the arrangement
was EUR 4.4 million and will mainly be for 2021.
107 Consolidated financial statements
Group’s notes
Parent company’s financial statements
Parent company’s notes
Signatures and audit report
Contents OmaSp in brief Corporate Governance Report of Board of Directors Financial
StatementsCorporate Social
Responsibility Report
Fina
ncia
l Sta
tem
ents
202
1
90
G36 Significant events after the period
In early 2022, the company's Board of Directors approved
the IRB permit application package and the company decided to initiate a permit process with the Finnish
Financial Supervisory Authority (FIN-FSA) on the
application of IRB method in capital adequacy. In the first stage, the company applies permission to apply an
internal risk classification under the IRB method to
calculate capital requirements for retail credit risk liabilities.
At its meeting on 26 January 2022, the Shareholders' Nomination Committee proposed to the company's Annual
General Meeting that the number of Board members to be
further confirmed at seven. The Shareholders' Nomination Committee proposes that the current Board members Aila
Hemminki, Aki Jaskari, Timo Kokkala, Jyrki Mäkynen,
Jarmo, Partanen, Jarmo Salmi and Jaana Sandström to be re-elected as members of the Board of Directors. All
nominees have given their consent to the election and are
independent at the time of the election in their relationship
with the company and its significant shareholders.
There are no other events following the end of the
reporting period that would require the presentation of additional information or that would materially affect the
company's financial position are unknown.
108 Consolidated financial statements
Group’s notes
Parent company’s financial statements
Parent company’s notes
Signatures and audit report
Contents OmaSp in brief Corporate Governance Report of Board of Directors Financial
StatementsCorporate Social
Responsibility Report
Fina
ncia
l Sta
tem
ents
202
1
91
G37 Alternative Performance Measures (APM) and calculation of key figures
Oma Savings Bank Plc’s financial reporting presents
Alternative Performance Measures (APM) that describe the company’s historical financial result, financial position
or cash flows. The APMs are drawn up in line with the
guidelines set by the European Securities and Markets Authority (ESMA). APMs are not key figures defined or
specified in compliance with IFRS standards, solvency,
regulations (CRD/CRR) or Solvency II (SII) regulations. The Company presents APMs as supplementary
information to the key figures that are presented in the
Group’s IFRS-compliant income statement, Group’s balance sheets and Group’s cash flow statements.
In the Company’s view, alternative key figures provide meaningful and useful information to investors, securities
market analysts and others concerning Oma Savings
Bank Plc’s performance, financial position and cash flows.
Oma Savings Bank Plc uses the following Alternative Performance Measures: • Comparable profit before taxes
• Cost/income ratio, %
• Total return on assets, ROA %
• Return on equity, ROE %
• Equity ratio, %
• Comparable cost/income ratio, %
• Comparable return on equity, ROE %
• Comparable earnings per share (EPS), EUR
109 Consolidated financial statements
Group’s notes
Parent company’s financial statements
Parent company’s notes
Signatures and audit report
Contents OmaSp in brief Corporate Governance Report of Board of Directors Financial
StatementsCorporate Social
Responsibility Report
Fina
ncia
l Sta
tem
ents
202
1
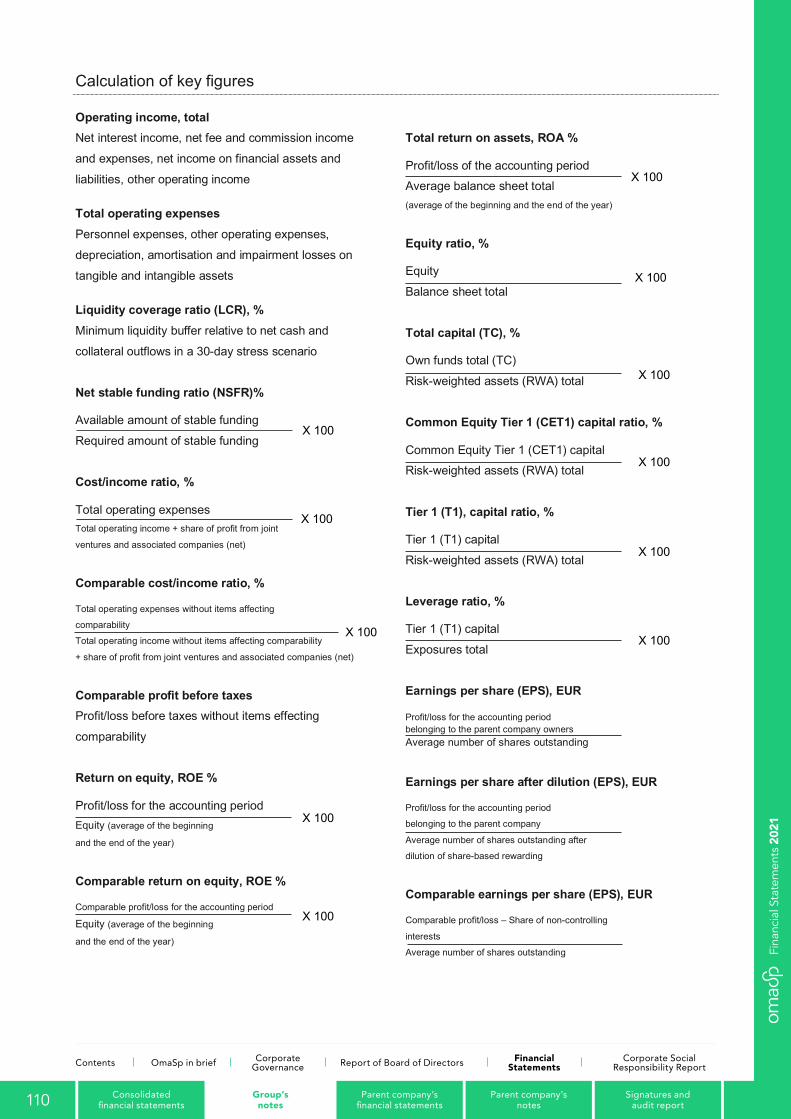
92
Calculation of key figures
Operating income, total Net interest income, net fee and commission income
and expenses, net income on financial assets and
liabilities, other operating income Total operating expenses Personnel expenses, other operating expenses,
depreciation, amortisation and impairment losses on
tangible and intangible assets Liquidity coverage ratio (LCR), % Minimum liquidity buffer relative to net cash and
collateral outflows in a 30-day stress scenario
Net stable funding ratio (NSFR)% Available amount of stable funding
Required amount of stable funding
Cost/income ratio, % Total operating expenses Total operating income + share of profit from joint
ventures and associated companies (net)
Comparable cost/income ratio, % Total operating expenses without items affecting
comparability
Total operating income without items affecting comparability
+ share of profit from joint ventures and associated companies (net)
Comparable profit before taxes Profit/loss before taxes without items effecting
comparability
Return on equity, ROE % Profit/loss for the accounting period Equity (average of the beginning
and the end of the year)
Comparable return on equity, ROE % Comparable profit/loss for the accounting period Equity (average of the beginning
and the end of the year)
Total return on assets, ROA % Profit/loss of the accounting period Average balance sheet total (average of the beginning and the end of the year)
Equity ratio, % Equity
Balance sheet total
Total capital (TC), % Own funds total (TC)
Risk-weighted assets (RWA) total
Common Equity Tier 1 (CET1) capital ratio, % Common Equity Tier 1 (CET1) capital Risk-weighted assets (RWA) total
Tier 1 (T1), capital ratio, % Tier 1 (T1) capital
Risk-weighted assets (RWA) total
Leverage ratio, % Tier 1 (T1) capital
Exposures total
Earnings per share (EPS), EUR Profit/loss for the accounting period belonging to the parent company owners Average number of shares outstanding
Earnings per share after dilution (EPS), EUR Profit/loss for the accounting period
belonging to the parent company Average number of shares outstanding after
dilution of share-based rewarding
Comparable earnings per share (EPS), EUR Comparable profit/loss – Share of non-controlling
interests
Average number of shares outstanding
X 100
X 100
X 100
X 100
X 100
X 100
X 100
X 100
X 100
X 100
X 100
110 Consolidated financial statements
Group’s notes
Parent company’s financial statements
Parent company’s notes
Signatures and audit report
Contents OmaSp in brief Corporate Governance Report of Board of Directors Financial
StatementsCorporate Social
Responsibility Report
Fina
ncia
l Sta
tem
ents
202
1
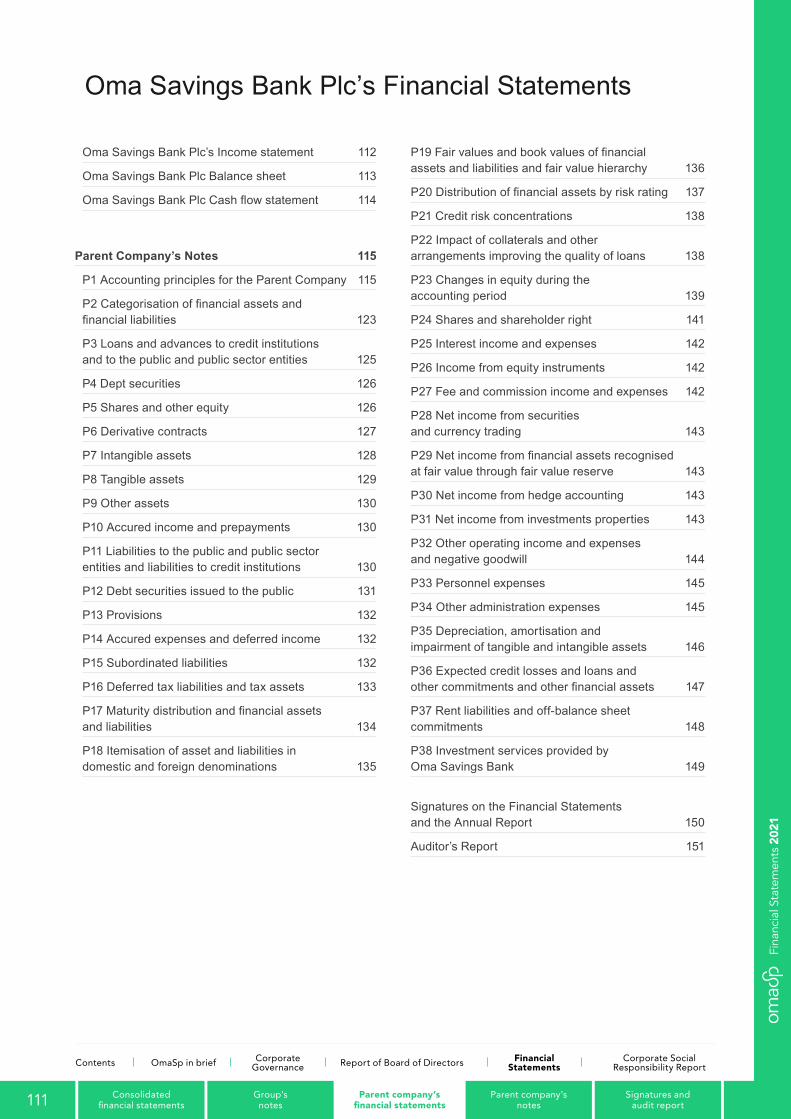
Oma Savings Bank Plc’s Income statement 112
Oma Savings Bank Plc Balance sheet 113
Oma Savings Bank Plc Cash flow statement 114
Parent Company’s Notes 115
P1 Accounting principles for the Parent Company 115
P2 Categorisation of financial assets and financial liabilities 123
P3 Loans and advances to credit institutions and to the public and public sector entities 125
P4 Dept securities 126
P5 Shares and other equity 126
P6 Derivative contracts 127
P7 Intangible assets 128
P8 Tangible assets 129
P9 Other assets 130
P10 Accured income and prepayments 130
P11 Liabilities to the public and public sector entities and liabilities to credit institutions 130
P12 Debt securities issued to the public 131
P13 Provisions 132
P14 Accured expenses and deferred income 132
P15 Subordinated liabilities 132
P16 Deferred tax liabilities and tax assets 133
P17 Maturity distribution and financial assets and liabilities 134
P18 Itemisation of asset and liabilities in domestic and foreign denominations 135
P19 Fair values and book values of financial assets and liabilities and fair value hierarchy 136
P20 Distribution of financial assets by risk rating 137
P21 Credit risk concentrations 138
P22 Impact of collaterals and other arrangements improving the quality of loans 138
P23 Changes in equity during the accounting period 139
P24 Shares and shareholder right 141
P25 Interest income and expenses 142
P26 Income from equity instruments 142
P27 Fee and commission income and expenses 142
P28 Net income from securities and currency trading 143
P29 Net income from financial assets recognised at fair value through fair value reserve 143
P30 Net income from hedge accounting 143
P31 Net income from investments properties 143
P32 Other operating income and expenses and negative goodwill 144
P33 Personnel expenses 145
P34 Other administration expenses 145
P35 Depreciation, amortisation and impairment of tangible and intangible assets 146
P36 Expected credit losses and loans and other commitments and other financial assets 147
P37 Rent liabilities and off-balance sheet commitments 148
P38 Investment services provided by Oma Savings Bank 149
Signatures on the Financial Statements and the Annual Report 150
Auditor’s Report 151
93
Oma Savings Bank Plc’s Financial Statements
Oma Savings Bank Plc’s Income statement 94 Oma Savings Bank Plc Balance sheet 95
Oma Savings Bank Plc Cash flow statement 96
Parent Company’s Notes 97
97
105
107
108
109
110 111
112
112 118
112 113
P1 Accounting principles for the Parent Company
P2 Categorisation of financial assets and financial liabilities P3 Loans and advances to credit institutions and to the public and public sector entities P4 Dept securities P5 Shares and other equity P6 Derivative contracts P7 Intangible assets P8 Tangible assets P9 Other assets P10 Accured income and prepayments P11 Liabilities to the public and public sector entities and liabilities to credit institutions P12 Debt securities issued to the public P13 Provisions 114
P14 Accured expenses and deferred income 114 P15 Subordinated liabilities 114
P16 Deferred tax liabilities and tax assets 115
P17 Maturity distribution and financial assets and liabilities 116
P18 Itemisation of asset and liabilities in
domestic and foreign denominations 117 P19 Fair values and book values of financial
assets and liabilities and fair value hierarchy 118
P20 Distribution of financial assets by risk rating 119
P21 Credit risk concentrations 120
P22 Impact of collaterals and other arrangements improving the quality of loans 120
P23 Changes in equity during the accounting
period 121 P24 Shares and shareholder right 123
P25 Interest income and expenses 124
P26 Income from equity instruments 124 P27 Fee and commission income and expenses 124
P28 Net income from securities and currency
trading 125
P29 Net income from financial assets recognised at fair value through fair value reserve 125
P30 Net income from hedge accounting 125
P31 Net income from investments properties 125 P32 Other operating income and expenses and
negative goodwill 126 P33 Personnel expenses 127 P34 Other administration expenses 127
P35 Depreciation, amortisation and impairment
of tangible and intangible assets 128 P36 Expected credit losses and loans and other
commitments and other financial assets 129
P37 Rent liabilities and off-balance sheet commitments 130
P38 Investment services provided by
Oma Savings Bank 131
111 Parent company’s financial statements
Contents OmaSp in brief Corporate Governance Report of Board of Directors Financial
StatementsCorporate Social
Responsibility Report
Group’s notes
Parent company’s notes
Signatures and audit report
Consolidated financial statements
Fina
ncia
l Sta
tem
ents
202
1
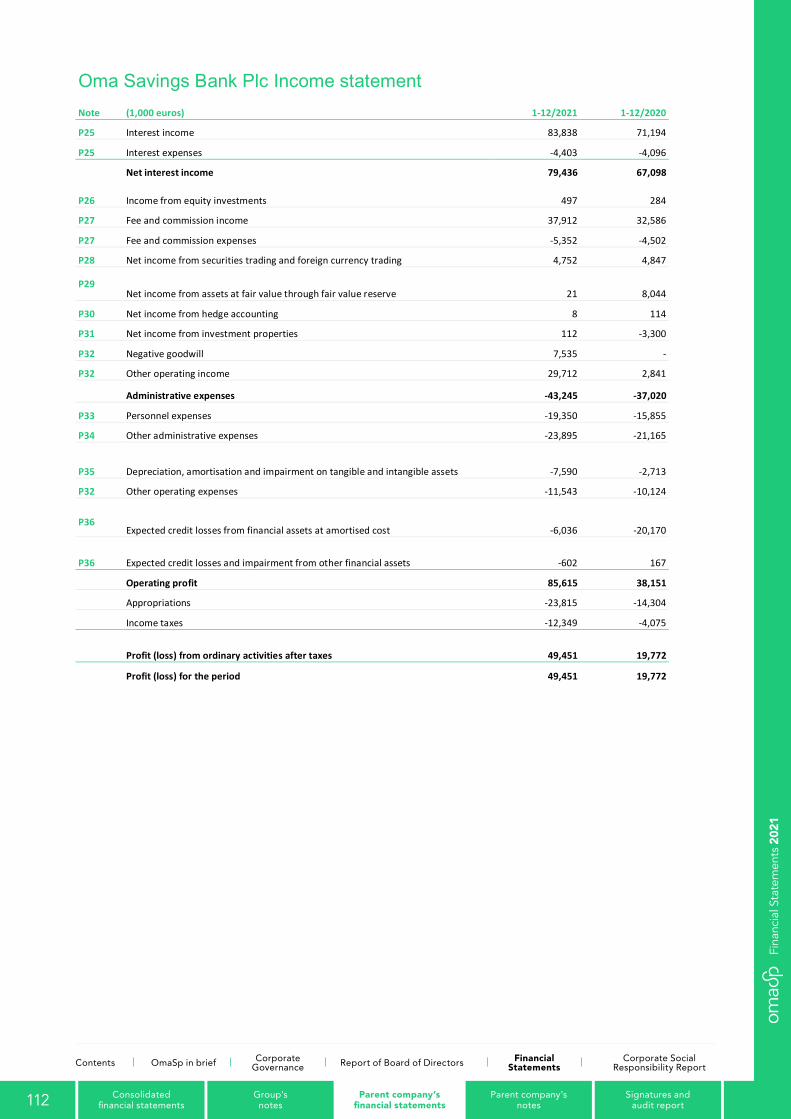
94
Oma Savings Bank Plc Income statement Note (1,000 euros) 1-12/2021 1-12/2020
P25 Interest income 83,838 71,194
P25 Interest expenses -4,403 -4,096
Net interest income 79,436 67,098 P26 Income from equity investments 497 284
P27 Fee and commission income 37,912 32,586
P27 Fee and commission expenses -5,352 -4,502
P28 Net income from securities trading and foreign currency trading 4,752 4,847
P29 Net income from assets at fair value through fair value reserve 21 8,044
P30 Net income from hedge accounting 8 114
P31 Net income from investment properties 112 -3,300
P32 Negative goodwill 7,535 -
P32 Other operating income 29,712 2,841 Administrative expenses -43,245 -37,020
P33 Personnel expenses -19,350 -15,855
P34 Other administrative expenses -23,895 -21,165
P35 Depreciation, amortisation and impairment on tangible and intangible assets -7,590 -2,713
P32 Other operating expenses -11,543 -10,124
P36 Expected credit losses from financial assets at amortised cost -6,036 -20,170
P36 Expected credit losses and impairment from other financial assets -602 167
Operating profit 85,615 38,151
Appropriations -23,815 -14,304
Income taxes -12,349 -4,075
Profit (loss) from ordinary activities after taxes 49,451 19,772
Profit (loss) for the period 49,451 19,772
112 Parent company’s financial statements
Contents OmaSp in brief Corporate Governance Report of Board of Directors Financial
StatementsCorporate Social
Responsibility Report
Group’s notes
Parent company’s notes
Signatures and audit report
Consolidated financial statements
Fina
ncia
l Sta
tem
ents
202
1
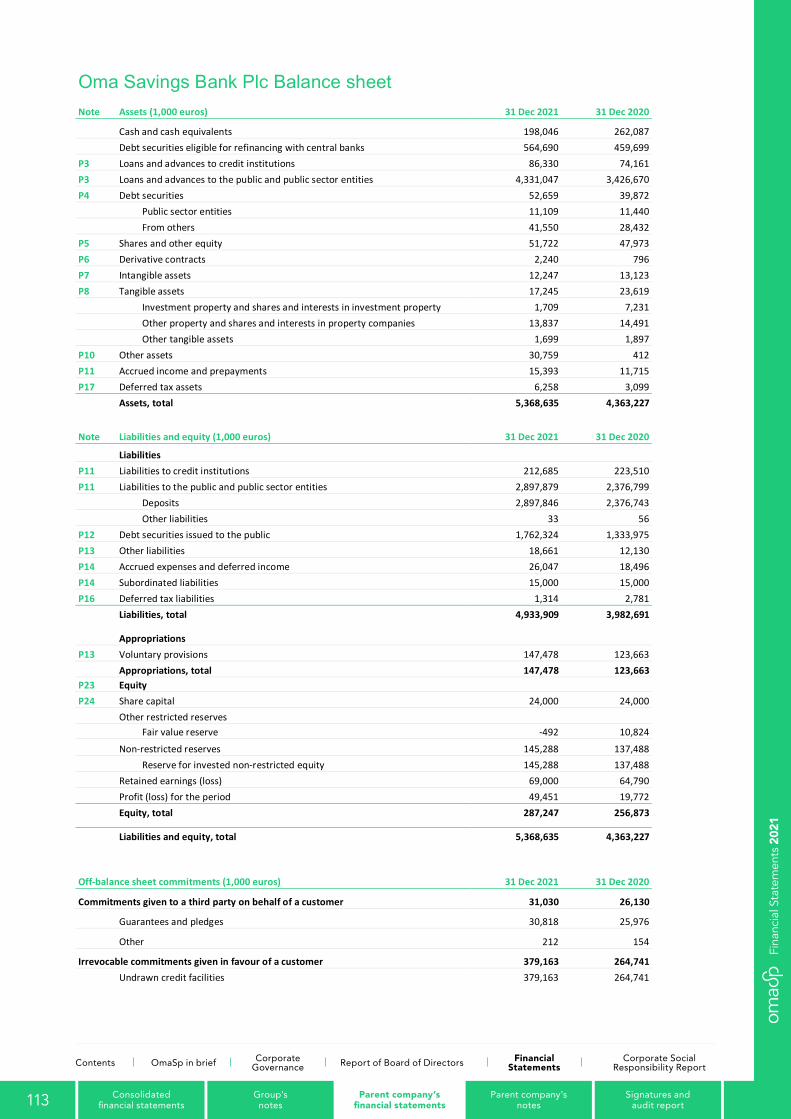
95
Oma Savings Bank Plc Balance sheet Note Assets (1,000 euros) 31 Dec 2021 31 Dec 2020
Cash and cash equivalents 198,046 262,087 Debt securities eligible for refinancing with central banks 564,690 459,699 P3 Loans and advances to credit institutions 86,330 74,161 P3 Loans and advances to the public and public sector entities 4,331,047 3,426,670 P4 Debt securities 52,659 39,872
Public sector entities 11,109 11,440 From others 41,550 28,432 P5 Shares and other equity 51,722 47,973 P6 Derivative contracts 2,240 796 P7 Intangible assets 12,247 13,123 P8 Tangible assets 17,245 23,619
Investment property and shares and interests in investment property 1,709 7,231 Other property and shares and interests in property companies 13,837 14,491 Other tangible assets 1,699 1,897 P10 Other assets 30,759 412 P11 Accrued income and prepayments 15,393 11,715 P17 Deferred tax assets 6,258 3,099
Assets, total 5,368,635 4,363,227
Note Liabilities and equity (1,000 euros) 31 Dec 2021 31 Dec 2020
Liabilities P11 Liabilities to credit institutions 212,685 223,510 P11 Liabilities to the public and public sector entities 2,897,879 2,376,799
Deposits 2,897,846 2,376,743 Other liabilities 33 56 P12 Debt securities issued to the public 1,762,324 1,333,975 P13 Other liabilities 18,661 12,130 P14 Accrued expenses and deferred income 26,047 18,496 P14 Subordinated liabilities 15,000 15,000 P16 Deferred tax liabilities 1,314 2,781
Liabilities, total 4,933,909 3,982,691 Appropriations P13 Voluntary provisions 147,478 123,663
Appropriations, total 147,478 123,663 P23 Equity P24 Share capital 24,000 24,000
Other restricted reserves Fair value reserve -492 10,824 Non-restricted reserves 145,288 137,488 Reserve for invested non-restricted equity 145,288 137,488 Retained earnings (loss) 69,000 64,790 Profit (loss) for the period 49,451 19,772 Equity, total 287,247 256,873 Liabilities and equity, total 5,368,635 4,363,227
Off-balance sheet commitments (1,000 euros) 31 Dec 2021 31 Dec 2020
Commitments given to a third party on behalf of a customer 31,030 26,130
Guarantees and pledges 30,818 25,976
Other 212 154
Irrevocable commitments given in favour of a customer 379,163 264,741 Undrawn credit facilities 379,163 264,741
113 Parent company’s financial statements
Contents OmaSp in brief Corporate Governance Report of Board of Directors Financial
StatementsCorporate Social
Responsibility Report
Group’s notes
Parent company’s notes
Signatures and audit report
Consolidated financial statements
Fina
ncia
l Sta
tem
ents
202
1
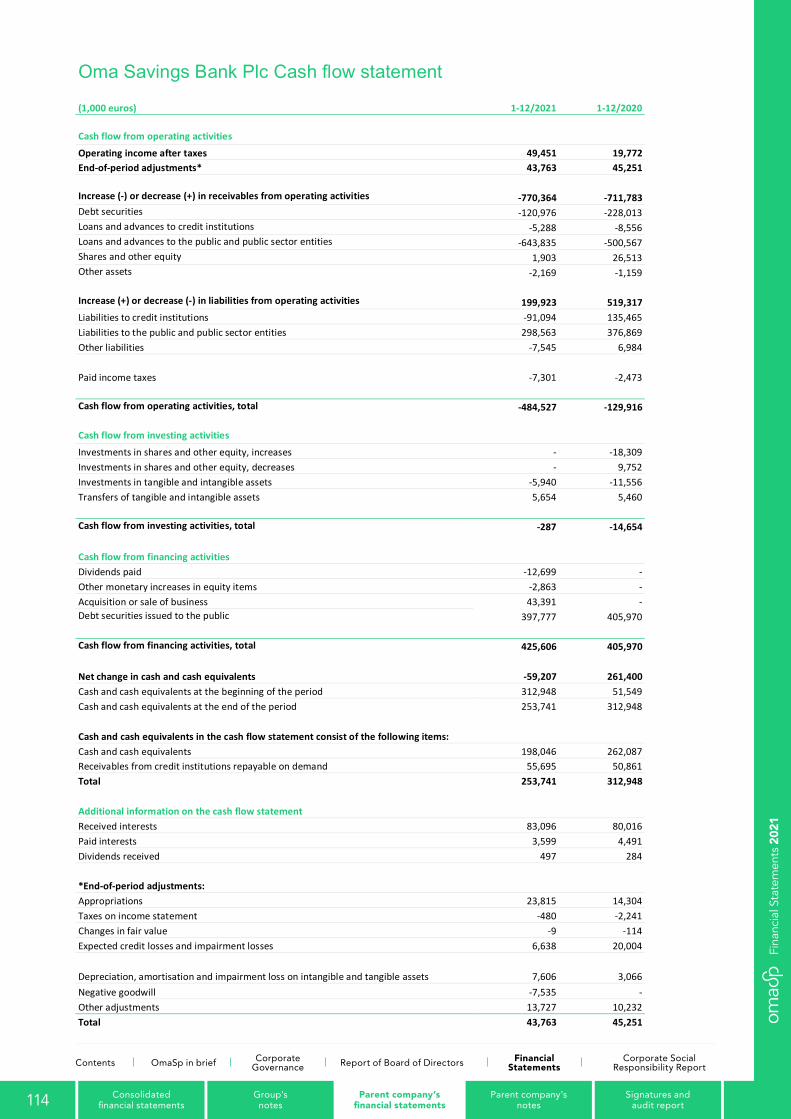
96
Oma Savings Bank Plc Cash flow statement (1,000 euros) 1-12/2021 1-12/2020
Cash flow from operating activities
Operating income after taxes 49,451 19,772 End-of-period adjustments* 43,763 45,251
Increase (-) or decrease (+) in receivables from operating activities -770,364 -711,783 Debt securities -120,976 -228,013 Loans and advances to credit institutions -5,288 -8,556 Loans and advances to the public and public sector entities -643,835 -500,567 Shares and other equity 1,903 26,513 Other assets -2,169 -1,159
Increase (+) or decrease (-) in liabilities from operating activities 199,923 519,317 Liabilities to credit institutions -91,094 135,465 Liabilities to the public and public sector entities 298,563 376,869 Other liabilities -7,545 6,984
Paid income taxes -7,301 -2,473
Cash flow from operating activities, total -484,527 -129,916
Cash flow from investing activities Investments in shares and other equity, increases - -18,309 Investments in shares and other equity, decreases - 9,752 Investments in tangible and intangible assets -5,940 -11,556 Transfers of tangible and intangible assets 5,654 5,460
Cash flow from investing activities, total -287 -14,654
Cash flow from financing activities Dividends paid -12,699 - Other monetary increases in equity items -2,863 - Acquisition or sale of business 43,391 - Debt securities issued to the public 397,777 405,970
Cash flow from financing activities, total 425,606 405,970
Net change in cash and cash equivalents -59,207 261,400 Cash and cash equivalents at the beginning of the period 312,948 51,549 Cash and cash equivalents at the end of the period 253,741 312,948
Cash and cash equivalents in the cash flow statement consist of the following items: Cash and cash equivalents 198,046 262,087 Receivables from credit institutions repayable on demand 55,695 50,861 Total 253,741 312,948
Additional information on the cash flow statement Received interests 83,096 80,016 Paid interests 3,599 4,491 Dividends received 497 284
*End-of-period adjustments: Appropriations 23,815 14,304 Taxes on income statement -480 -2,241 Changes in fair value -9 -114 Expected credit losses and impairment losses 6,638 20,004
Depreciation, amortisation and impairment loss on intangible and tangible assets 7,606 3,066 Negative goodwill -7,535 - Other adjustments 13,727 10,232 Total 43,763 45,251
114 Parent company’s financial statements
Contents OmaSp in brief Corporate Governance Report of Board of Directors Financial
StatementsCorporate Social
Responsibility Report
Group’s notes
Parent company’s notes
Signatures and audit report
Consolidated financial statements
Fina
ncia
l Sta
tem
ents
202
1
97
Parent Company’s Notes
P1 Accounting principles for the Parent Company
The parent company Oma Savings Bank Plc draws up separate financial statements in accordance with the
provisions of the Accounting Act and Act on Credit
Institutions, the Decree of the Ministry of Finance on financial statements and consolidated financial statements
of credit institutions (698/2014) and Regulations and
Guidelines 2/2016 of the Finnish Financial Supervisory Authority on accounting, financial statements and
management reports for the financial sector.
1. Items denominated in foreign currencies
Assets and liabilities tied to items denominated in foreign
currencies outside of the euro zone have been converted to euros as per the European Central Bank’s closing price
on the reporting date. On the income statement, foreign
exchange differences that emerged during valuation have
been recognised in net gains on trading in foreign currencies.
2. Financial instruments
2.1 Classification and valuation of financial assets
In connection with initial recognition, the item belonging to
financial assets is valued at fair value. If the item is an item not recognised at fair value through profit or loss, the
transaction costs immediately resulting from the
acquisition of the item are added to it or deducted from it.
Immediately subsequent to the initial recognition, a loss
allowance concerning expected credit losses (ECL) is
recognised on the financial assets, if the financial asset is valued at amortised cost or through a fair value reserve.
Impairments of financial assets are assessed for each
receivable and receivable category. Impairments that cannot be allocated to individual receivables are
recognised as impairments of a receivable category.
Financial assets are classified in one of the three following categories when they are initially recognised:
• valued at amortised cost
• valued through the fair value reserve or
• financial assets valued at fair value through profit or
loss.
The classification and valuation of financial assets is
based on the company’s business model and nature of contractual cash flows. Financial assets are not
reclassified subsequent to their initial recognition, except
in the period after the Group changes its business model for managing financial assets.
2.1.1 Financial assets valued at amortised cost Financial assets are valued at amortised cost when the
contractual cash flows only include capital repayments
and interest payments, and the company holds them as part of a business model whose objective is to collect
contractual cash flows over the life of the contract. Loans
and advances customers and credit institutions and cash
assets belong to financial assets valued at amortised cost.
2.1.2 Financial assets valued through the fair value reserve Financial assets are valued at fair value through the fair value reserve when the contractual cash flows consist only
of capital repayments and interest payments and the
company holds the financial asset as part of a business model whose objective is both collecting contractual cash
flows and possibly selling the financial assets before the
maturity date. Oma Savings Bank has classified some of its debt securities in this class.
2.1.3 Financial assets valued at fair value through profit or loss Financial assets are valued at fair value through profit or
loss, unless they are valued at amortised cost or at fair value through the fair value reserve. Mainly financial
assets whose business model is to trade actively, and
which have been acquired to generate earnings in the
115 Parent company’s notes
Group’s notes
Signatures and audit report
Consolidated financial statements
Parent company’s financial statements
Fina
ncia
l Sta
tem
ents
202
1
Contents OmaSp in brief Corporate Governance Report of Board of Directors Financial
StatementsCorporate Social
Responsibility Report
98
short term are recognised at fair value through profit or
loss. Oma Savings Bank has classified some of its debt
securities in this class. 2.2 Equity instruments Equity instruments are recognised at fair value through profit or loss, unless the company irrevocably chooses to
measure an individual asset at fair value through the fair
value reserve.
The company does not have equity-based investments
valued at fair value through the fair value reserve. All
equity instruments recognised according to IFRS 9 are recognised at fair value through profit and loss.
2.2.1 Assessment of business models The company specifies the business model objective for
each portfolio according to how business operations are
managed and reported to the management. The objectives are specified on the basis of the investment and
lending policy approved by the company.
The business model describes a portfolio-specific earnings model with the purpose of collecting only contractual cash
flows, collecting contractual cash flows and cash flows
from sales of financial assets or collecting cash flows from trading in financial assets.
2.2.2 Cash flow testing If the business model is other than trading, the company assesses whether the contractual cash flows are based
solely on payment of principal and interest (SPPI test). If
the cash flow criterion is not met, the financial asset is recognised at fair value through profit or loss.
In assessing whether contractual cash flows are solely payments of principal and interest, the company will
consider the contractual terms of the instrument. This will
include assessing whether the financial asset contains a contractual term that could change the timing or amount of
cash flows so that it does not meet the SPPI (solely
payments of principal and interest) contractual cash flow characteristics test requirements.
All retail and company loans granted by the company
contain a prepayment feature. This feature does meet the
cash flow testing criteria as, in connection with a prematurely repaid loan, the company is entitled to collect
reasonable compensation for the premature termination of
the contract.
2.3 Derecognition The Group derecognises financial assets when the contractual rights to cash flows from the financial assets
expire, or it transfers the rights to receive the contractual
cash flows in a transaction in which substantially all of the risks and rewards of ownership of the financial asset are
transferred or in which the Group does not retain control of
the financial assets.
2.4 Impairment of financial assets The impairment estimate, the expected credit loss (ECL),
is recognised on all debt instruments belonging to financial assets valued at amortised cost and valued at fair value
through the fair value reserve and on off-balance sheet
loan commitments and guarantee contracts.
For financial assets valued at amortised cost, a loss
allowance for the expected credit loss is recognised in a separate account as a reduction in the carrying amount.
The expected credit loss is recognised on the financial
assets valued at fair value through the fair value reserve in the fair value reserve. For off-balance-sheet commitments,
the expected credit loss is recognised as a provision.
The expected credit losses are calculated for the entire
effective period of the financial asset when, on the date of
reporting, the credit risk related to the financial asset has significantly increased since its initial recognition (stage 2)
or when the contract is impaired (stage 3). Otherwise, the
expected credit loss is calculated based on the assessment that default of payment will occur within 12
months of the date of reporting.
116 Parent company’s notes
Group’s notes
Signatures and audit report
Consolidated financial statements
Parent company’s financial statements
Fina
ncia
l Sta
tem
ents
202
1
Contents OmaSp in brief Corporate Governance Report of Board of Directors Financial
StatementsCorporate Social
Responsibility Report

99
The expected credit losses are recognised for each
date of reporting and they describe:
• an unbiased and probability-weighted monetary amount that is determined by evaluating a range of
possible outcomes,
• the time value of money and
• reasonable and justifiable information that is available
on the date of reporting without any excessive costs or efforts and which applies to past events, current
circumstances and forecasts of the economic
environment.
The financial assets used in the calculations are classified
into three stages, which describe the weakening of the quality of the financial assets compared to the initial
recognition.
Stage 1: Contracts whose credit risk has not grown since
the initial recognition and for which a 12-month ECL is
calculated. Stage 2: Contracts whose credit risk has grown
significantly since the initial recognition and for which a
lifetime ECL is calculated.
Stage 3: Credit-impaired contracts (counterparty has been classified as being in default) for which a lifetime ECL
is calculated.
2.4.1 Significant increase in credit risk In assessing whether the credit risk related to a financial
instrument has increased significantly, the change in the
risk of a default occurring over the expected life of the financial instrument shall be observed. When carrying out
this assessment, the entity shall compare the risk of
default occurring over the expected life of the instrument at the reporting date with the risk of default at the date of
initial recognition. A significant increase in credit risk leads
to the transfer of the loan from stage 1 to stage 2. The company uses both quantitative and qualitative indicators
in credit risk assessment.
Indicators for assessing significant increase in credit risk vary between different portfolios, but for the largest loan
receivables (private and corporate customer loans), the
company considers changes in behavioral scoring and credit rating, as well as certain qualitative indicators such
as forbearance, placement on watchlist and 30-day delays
in contractual payments.
The company has automated a credit scoring system
which is based, depending on the type of the loan, on
changes in the behavioral scoring of private customers and on changes in credit ratings of business customers as
well as qualitative indicators. Loan-specific stage
allocation is monitored regularly. A probation period is applied for the transfers of loans out of stage 2 to stage 1.
2.4.2 Definition of default The company has defined defaults (stage 3) as occurring
in accordance with IFRS 9 in the following situations:
• Contractual payments are 90 days overdue,
• A loan is non-performing or assigned to a collection agency,
• The customer is bankrupt or subject to debt restructuring or
• 20% or more of the customer’s loans meet the above default conditions, as a result of which all of the
customer’s loans are considered to be in default. The definition corresponds with the definition of default
used by the company in its regulatory reporting and is
consistent with the definition of customer default. In assessing when a debtor is in default, the company takes
into account qualitative indicators (such as breaches of
loan terms) and quantitative indicators (such as the number of days past due date) by using internal and
external sources to collect information on the debtor’s
financial position.
2.4.3 Inputs of expected credit loss model The calculation of the expected credit losses is based on
portfolio-specific calculation rules. The loan portfolio is divided on the basis of product-specific risk characteristics
into the following clusters:
• Loans to housing corporations
• Private customers’ home mortgages and consumer credits
• Accounts with overdraft facilities
• Credit cards
• Loans to farmers
• Student loans
• Loans to corporate customers
117 Parent company’s notes
Group’s notes
Signatures and audit report
Consolidated financial statements
Parent company’s financial statements
Fina
ncia
l Sta
tem
ents
202
1
Contents OmaSp in brief Corporate Governance Report of Board of Directors Financial
StatementsCorporate Social
Responsibility Report
100
Private customers’ home mortgages and consumer credits
and corporate customers’ loans form the company’s two
most significant clusters. With regard to these two clusters, the calculation of the expected credit losses is
based on the Exposure at Default (EAD), Probability of
Default (PD) and the Loss Given Default (LGD). The company uses the recorded customers’ repayment
behavior data, customer-specific ratings and loan-specific
collateral values as the basis for determining the parameters.
When calculating home mortgages and consumer credits, the PD parameter used is based on vintage analysis, in
which loans are monitored based on their maturity. In
terms of corporate loans, the PD parameter is based on a transition matrix describing changes in the customer-
specific ratings. Credit rating is a grade assigned by an
external party. In smaller portfolios, the PD parameter
applied by the company is a simple loss-rate model.
The Exposure at Default (EAD) is the amount of exposure
at the reporting date. Calculation of the EAD takes into account the payments to the loan as stated in the payment
plan. However, certain financial instruments include both a
loan principal and an undrawn portion of a loan commitment. The undrawn portion of a loan is taken into
account in the exposures for the total limit granted. With
credit card receivables, EAD calculation applies the so-called CCF coefficient when taking into account undrawn
limits.
Loss Given Default (LGD) describes the credit losses’
share of the loan capital after loan-specific collateral has
been factored in, when the receivable is classified in stage 3.
For debt security investments, the company determines the allowance for credit loss using the formula
EAD*PD*LGD. Instrument-specific material from the
market database is used as the source for calculating
PDs. In addition, a low credit risk exception for debt security investments with a credit rating of at least
investment grade at the reporting date is used. In these
cases, the allowance for credit loss will be measured at an amount equal to the 12-month expected credit losses.
The management of the company monitors the
development of a loss allowance to ensure that the model
properly reflects the amount of expected credit loss. If necessary, the management refines the calculation
parameters.
2.4.4 Changing contractual cash flows Whenever a change is made to a financial asset or liability
valued at amortised cost without removing the asset or
liability from the balance sheet any profit or loss must be recognised. The profit or loss is calculated as the
difference between the original contractual cash flows and
the modified cash flows discounted at the contractual interest rate.
An example of a situation of this kind are changes made to the amortisation plan for a loan granted to the customer or
granting deferred amortisation. Changes to the loan terms
resulting from a customer’s weakened solvency are treated as a significant growth in credit risk.
In connection with significant loan term changes, the loan
is removed from the balance sheet and a new loan is recognised in its place. If the credit risk of the loan
removed from the balance sheet has grown significantly,
the new loan is recognised in the balance sheet as impaired.
2.5 Recognising final credit losses Financial assets are removed from the balance sheet when it is expected that payment on the loans will no
longer be received, and the final credit loss can be
calculated. The previously recognised expected credit loss is reversed at the same time as the item is removed from
the balance sheet and the final credit loss is recognised.
The loans are removed from the balance sheet when their
collection proceedings have been finished or when the
loan terms are changed significantly, for example in connection with refinancing. After derecognition, payments
allocated to credit loss receivables are recognised through
profit or loss in the item ‘Expected credit loss from financial assets recognised at amortised cost’.
118 Parent company’s notes
Group’s notes
Signatures and audit report
Consolidated financial statements
Parent company’s financial statements
Fina
ncia
l Sta
tem
ents
202
1
Contents OmaSp in brief Corporate Governance Report of Board of Directors Financial
StatementsCorporate Social
Responsibility Report
101
2.6 Classification and valuation of financial liabilities At the time of the initial recognition, financial liabilities are
classified in one of the following items:
• financial assets valued at amortised cost, or,
• recognised at fair value through profit and loss.
Financing liabilities are originally recognised in the
statements at fair value. Later, financial liabilities, with the
exception of liabilities recognised at fair value through profit and loss, are valued at amortised cost using the
effective interest method. Transaction costs are included
in the original bookkeeping value of financial liabilities valued at amortised cost. Transaction costs related to
financial liabilities recognised at fair value through profit or
loss are recognised as expenditure.
Financial liabilities valued at fair value through profit or
loss are formed by derivative liabilities to which hedge
accounting is not applied. At the reporting date, the company does not have derivative liabilities valued at fair
value through profit or loss.
Liabilities to credit institutions, liabilities to the public and
general government as well as debt securities issued to
the public are recognised in other financial liabilities valued at amortised cost.
Financial liabilities are not reclassified subsequent to their initial recognition.
2.7 Offsetting financial assets and liabilities Financial assets have not been netted in the company’s
Financial Statements.
2.8 Items denominated in foreign currencies Assets and liabilities tied to items denominated in foreign
currencies outside of the euro zone have been converted
to euros as per the European Central Bank’s average rate on the reporting date. On the income statement, foreign
exchange differences that emerged during valuation have
been recognised in net gains from investment operations.
2.9 Cash and cash equivalents Cash and cash equivalents consist of cash in hand and at banks as well as short-term deposits of less than three
months.
2.10 Determining the fair value Fair value is the price that could be received for the sale of
an asset or that could be paid for assuming a debt between market parties in a common transaction occurring
on the valuation date.
The fair value of a financial instrument is determined either
utilising price quotes obtained from active markets or, if
active markets do not exist, utilising an established valuation method. Markets are considered to be active if
price quotes are easily and regularly available and if they
reflect real and regularly reoccurring market transactions between parties that are independent of each other. The
current bid price is used as the quoted market price of
financial assets.
If there is an established valuation method in the markets
for financial instruments for which a market price cannot
be directly acquired, the fair value is based on the generally used calculation model of market price and on
the input quotes used by the model.
If the valuation method is not well-established in the
markets, a specific generally used valuation model for the
product in question is used to determine the market value. Valuation models are based on generally utilised
calculation methods, and they cover all factors that parties
in the markets would take into consideration when calculating prices. When determining the fair value, the
utilised aspects are the prices of market transactions,
discounted cash flows and the fair value at the time of financial statements of another, essentially similar
instrument. The valuation methods take into account credit
risk assessments, used discount rates, the possibility of prepayments and other factors that impact the valuation of
the financial instrument’s fair value.
119 Parent company’s notes
Group’s notes
Signatures and audit report
Consolidated financial statements
Parent company’s financial statements
Fina
ncia
l Sta
tem
ents
202
1
Contents OmaSp in brief Corporate Governance Report of Board of Directors Financial
StatementsCorporate Social
Responsibility Report
102
The fair values of financial instruments are divided in three
hierarchies according to how the fair value is determined:
Level 1: Fair values quoted in active markets for identical
assets or liabilities.
Level 2: Fair values that have been determined by the use of input information other than quoted Level 1 prices that
are verifiable for assets or liabilities either directly (e.g. as
prices) or indirectly (e.g. derived from prices). Level 3: Fair values that have been determined for assets
or liabilities using inputs that are not essentially based on
verifiable market prices.
The hierarchy levels of fair values are determined based
on the lowest level of input that is significant for the investment item. The significance of an input is assessed
against the item valued at fair value in its entirety.
Transfers between fair value hierarchy levels are
determined to have occurred on the date when the event or change in circumstances occurred.
3. Derivatives and hedge accounting
Oma Savings Bank protects its interest-bearing loans
against interest rate fluctuations with derivatives and applies hedge accounting regulations in addition to
regularly following the effectiveness of such hedging and
changes in fair values. Hedge accounting conforms to the IFRS 9 standard’s provision that makes it possible to
continue to apply portfolio hedge accounting pursuant to
the IAS 39 standard.
Interest rate swaps are used to hedge fixed-rate deposit
stocks and stock derivatives have been used to hedge deposits, whose yield is tied to changes in stock value. At
the end of the accounting period, the company does not
have derivatives that hedge the cash flow.
Derivative contracts are valued at fair value and changes
in value have been recognised on the balance sheet and
the income statement. The positive fair values of derivative contracts are recognised in the balance sheet’s
assets’ item ‘Derivative contracts’. The credit valuation
adjustment (CVA) is taken into account in the valuation of assets. The negative fair values of derivative contracts are
presented under ‘Derivative contracts and other liabilities
held for trading’ in the balance sheet’s liabilities. The debit
valuation adjustment (DVA) is taken into account in the
valuation.
Derivative contracts are valued at fair value and hedge
accounting is applied to them. The changes in the fair value of hedged items and hedging instruments
designated for hedging the fair value are entered in the
income statement item ‘Net income from hedge accounting’ and in the balance sheet as an adjustment of
the item in question. The interest expenses of hedge
derivatives are presented under interest expenses and the income under interest income.
Derivatives are not created for the purpose of trading. The connection between hedging derivatives and instruments
to be hedged (hedge relationship) and the effectiveness of
hedging are documented.
4. Tangible and intangible assets
Properties and shares in property companies have been divided into properties in the company’s own use and
investment properties, based on the purpose of use.
Properties have been recognised in the balance sheet at
acquisition cost less planned depreciation. Shares and
other equity in investment properties are recognised on the balance sheet at acquisition cost. The bank does not
apply the option provided in Section 12, Article 8 of the
Credit Institution Act, which allows the valuation of investment properties at fair value.
The balance sheet values of properties in the company’s own use and shares and other equity in property
companies are based on the value of the assets relative to
the expected income of core business operations.
The difference between the bookkeeping value of
investment properties and shares and other equity in
property companies, and the permanently lower likely transfer price, if it is significant, is an impairment loss
recognised as an expense under ‘Net income of
investment properties’. Any reversals of impairment are recognised as adjustments in the same item.
120 Parent company’s notes
Group’s notes
Signatures and audit report
Consolidated financial statements
Parent company’s financial statements
Fina
ncia
l Sta
tem
ents
202
1
Contents OmaSp in brief Corporate Governance Report of Board of Directors Financial
StatementsCorporate Social
Responsibility Report
103
The company’s key investment properties have been
evaluated by property with the purchase price allocation
method or the yield value method. The estimates of the yield value method are based on the amounts of net rent
income from the property and the yield requirement of
property markets. The fair values of investment properties are listed in Note P8.
5. Appropriations
5.1 Tax-based provisions Tax-based provisions, such as credit loss provisions, are used in the planning of the company’s Financial
Statements and taxes. As such, the amounts of tax-based
provisions and their changes do not depict the risks faced by the company.
In the company’s Financial Statements, appropriations are
listed without deducting the deferred tax liability.
6. Off-balance-sheet commitments
Off-balance-sheet commitments are commitments given to
a third party on behalf of a customer and irrevocable
commitments given in favour of a customer.
Commitments given to a third party on behalf of a
customer are, for example, guarantees and guarantee commitments equated to them. Commitments are listed at
the maximum amounts of the guarantees or guarantee
commitments at the end of the year.
Irrevocable commitments given in favour of a customer
are, for example, binding loan commitments, granted undrawn loans as well as unused credit limits.
Commitments are listed at the maximum amounts that
could be payable at the end of the accounting period.
7. Interest income and expenses
All interest income and expenses derived from interest-
bearing assets and liabilities are recognised in ‘Interest income and expenses’. Interest is recognised on an
accrual basis excluding interest for late payments, which
are recognised when payments are received.
Also recognised as interest income or expense is the
difference between the acquisition cost and nominal value
of receivables and liabilities, which is amortised on the maturity period of the receivable or the liability. The
counterpart is recognised as a change in receivable or
liability.
Interest income has also been accrued on impaired
receivables’ remaining balance in the bookkeeping at the original effective interest rate in the contract.
Significant lending transaction and processing fee income is recognised in interest income over time using the
effective interest method in accordance with the average
expected maturity of the loan rather than recognising the income as a one-off gain. The clarification of the over-time
accounting principles concerns new credit issued to
companies and housing companies.
8. Impairment of financial assets
The model for impairment of financial assets brought by IFRS 9 requires management to make decisions,
estimates and assumptions especially on the following
topics:
• Selecting and defining calculation models,
• Assessing whether the credit risk related to a financial instrument has increased significantly after initial recognition, and
• Taking into account forward-looking information in the recognition of expected credit losses.
8.1 Evaluation of fair value The management team’s discretion is also used in cases
where the fair value of a financial instrument is determined
through valuation methods. If no verifiable market inputs exist on which the used valuation methods can be based,
the management team has to assess which other inputs to
use to determine fair value. The principles used to determine fair value are described in more detail in the
section ‘Determining the fair value’.
The management decides when it considers the markets
of financial instruments to be inactive. Additionally, it must
be evaluated whether a single financial instrument is the
object of active trading and whether the price information
121 Parent company’s notes
Group’s notes
Signatures and audit report
Consolidated financial statements
Parent company’s financial statements
Fina
ncia
l Sta
tem
ents
202
1
Contents OmaSp in brief Corporate Governance Report of Board of Directors Financial
StatementsCorporate Social
Responsibility Report
104
received from the market is a reliable indicator of the fair
value of the financial instrument.
9. Depreciation principles
The acquisition costs of buildings and other wearable tangible and intangible assets are depreciated based on
the financial holding time in equal instalments and in
accordance with a previously created depreciation plan. The depreciation time is 10–40 years for buildings and 3–8
years for machinery and equipment. Depreciations are not
performed for land.
Development expenses and licences of computer software
are added under ‘Intangible rights’ and depreciated within 3–10 years. Long-term expenses are depreciated during
their useful life of 3–5 years.
10. Income and expenses from other than ordinary activities and statutory provision
The company has not recognised income or expenses
from other than ordinary activities. If the exact sum of a future loss or cost is not known, it must be entered as a
statutory provision in the balance sheet.
11. Taxes
Income taxes are recognised in the company’s financial statements based on the calculations of taxable income.
Of the positive change in value included in the fair value
reserve, deferred tax liabilities are recognised on the
balance sheet, and of the negative change in value, deferred tax assets are recognised on the balance sheet.
Additionally, of the negative change in value transferred
from the fair value reserve to the result, deferred tax
assets are recognised. Other deferred taxes have not
been recognised at company level.
122 Parent company’s notes
Group’s notes
Signatures and audit report
Consolidated financial statements
Parent company’s financial statements
Fina
ncia
l Sta
tem
ents
202
1
Contents OmaSp in brief Corporate Governance Report of Board of Directors Financial
StatementsCorporate Social
Responsibility Report
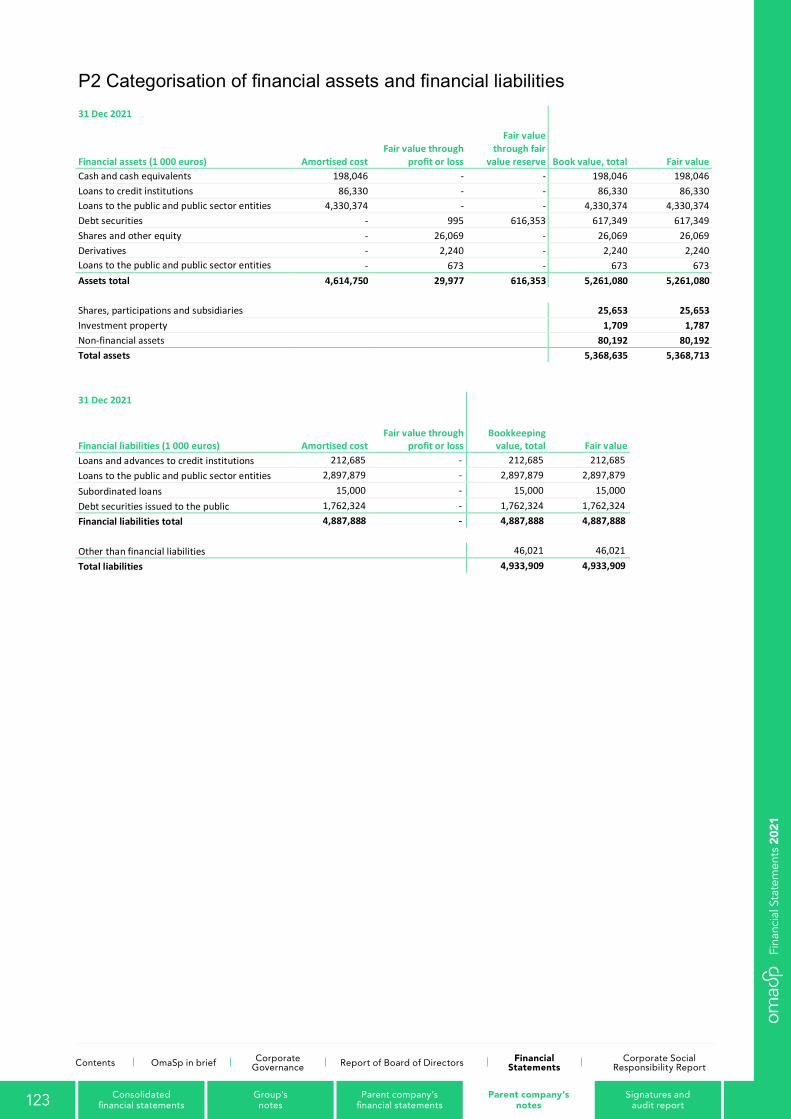
105
P2 Categorisation of financial assets and financial liabilities 31 Dec 2021
Amortised cost Fair value through
profit or loss
Fair value through fair
value reserve Book value, total Fair value Financial assets (1 000 euros) Cash and cash equivalents 198,046 - - 198,046 198,046 Loans to credit institutions 86,330 - - 86,330 86,330 Loans to the public and public sector entities 4,330,374 - - 4,330,374 4,330,374 Debt securities - 995 616,353 617,349 617,349 Shares and other equity - 26,069 - 26,069 26,069 Derivatives - 2,240 - 2,240 2,240 Loans to the public and public sector entities
- 673 - 673 673 Assets total 4,614,750 29,977 616,353 5,261,080 5,261,080
Shares, participations and subsidiaries 25,653 25,653 Investment property 1,709 1,787 Non-financial assets 80,192 80,192 Total assets 5,368,635 5,368,713
31 Dec 2021
Amortised cost Fair value through
profit or loss Bookkeeping
value, total Fair value
Financial liabilities (1 000 euros) Loans and advances to credit institutions 212,685 - 212,685 212,685 Loans to the public and public sector entities 2,897,879 - 2,897,879 2,897,879 Subordinated loans 15,000 - 15,000 15,000 Debt securities issued to the public 1,762,324 - 1,762,324 1,762,324 Financial liabilities total 4,887,888 - 4,887,888 4,887,888
Other than financial liabilities 46,021 46,021 Total liabilities 4,933,909 4,933,909
123 Parent company’s notes
Group’s notes
Signatures and audit report
Consolidated financial statements
Parent company’s financial statements
Fina
ncia
l Sta
tem
ents
202
1
Contents OmaSp in brief Corporate Governance Report of Board of Directors Financial
StatementsCorporate Social
Responsibility Report
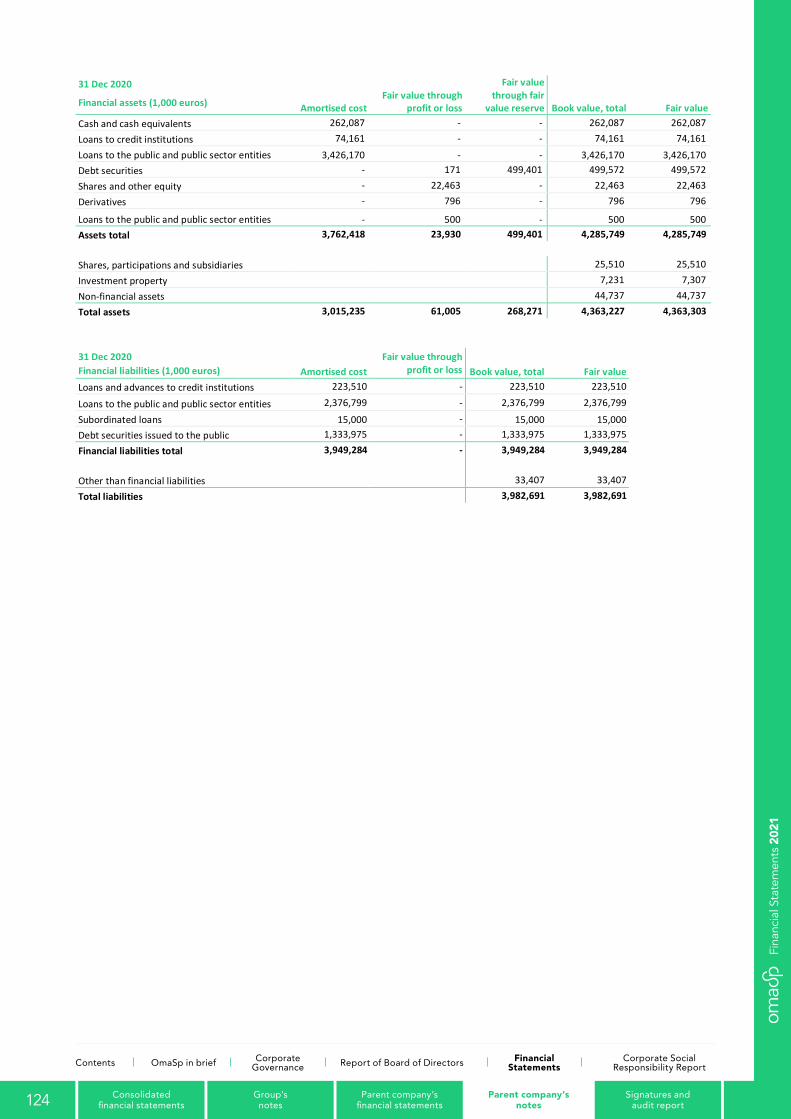
106
31 Dec 2020
Amortised cost Fair value through
profit or loss
Fair value through fair
value reserve Book value, total Fair value Financial assets (1,000 euros)
Cash and cash equivalents 262,087 - - 262,087 262,087 Loans to credit institutions 74,161 - - 74,161 74,161 Loans to the public and public sector entities 3,426,170 - - 3,426,170 3,426,170 Debt securities - 171 499,401 499,572 499,572 Shares and other equity - 22,463 - 22,463 22,463 Derivatives - 796 - 796 796
Loans to the public and public sector entities - 500 - 500 500 Assets total 3,762,418 23,930 499,401 4,285,749 4,285,749
Shares, participations and subsidiaries 25,510 25,510 Investment property 7,231 7,307 Non-financial assets 44,737 44,737 Total assets 3,015,235 61,005 268,271 4,363,227 4,363,303
31 Dec 2020
Amortised cost Fair value through
profit or loss Book value, total Fair value
Financial liabilities (1,000 euros) Loans and advances to credit institutions 223,510 - 223,510 223,510
Loans to the public and public sector entities 2,376,799 - 2,376,799 2,376,799
Subordinated loans 15,000 - 15,000 15,000 Debt securities issued to the public 1,333,975 - 1,333,975 1,333,975 Financial liabilities total 3,949,284 - 3,949,284 3,949,284
Other than financial liabilities 33,407 33,407 Total liabilities 3,982,691 3,982,691
124 Parent company’s notes
Group’s notes
Signatures and audit report
Consolidated financial statements
Parent company’s financial statements
Fina
ncia
l Sta
tem
ents
202
1
Contents OmaSp in brief Corporate Governance Report of Board of Directors Financial
StatementsCorporate Social
Responsibility Report
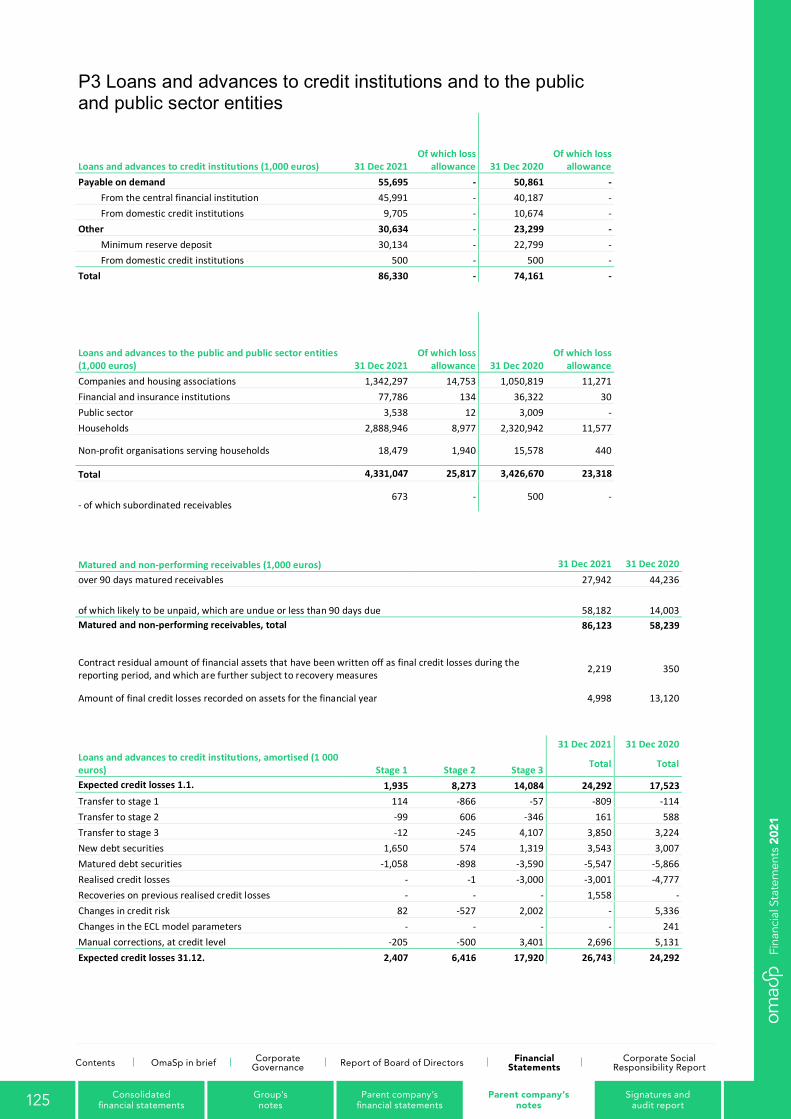
107
P3 Loans and advances to credit institutions and to the public and public sector entities
Loans and advances to credit institutions (1,000 euros) 31 Dec 2021 Of which loss
allowance 31 Dec 2020 Of which loss
allowance Payable on demand 55,695 - 50,861 -
From the central financial institution 45,991 - 40,187 - From domestic credit institutions 9,705 - 10,674 - Other 30,634 - 23,299 -
Minimum reserve deposit 30,134 - 22,799 - From domestic credit institutions 500 - 500 - Total 86,330 - 74,161 -
Loans and advances to the public and public sector entities (1,000 euros) 31 Dec 2021
Of which loss allowance 31 Dec 2020
Of which loss allowance
Companies and housing associations 1,342,297 14,753 1,050,819 11,271 Financial and insurance institutions 77,786 134 36,322 30 Public sector 3,538 12 3,009 - Households 2,888,946 8,977 2,320,942 11,577
Non-profit organisations serving households 18,479 1,940 15,578 440
Total 4,331,047 25,817 3,426,670 23,318
- of which subordinated receivables 673 - 500 -
Matured and non-performing receivables (1,000 euros) 31 Dec 2021 31 Dec 2020 over 90 days matured receivables 27,942 44,236
of which likely to be unpaid, which are undue or less than 90 days due 58,182 14,003 Matured and non-performing receivables, total 86,123 58,239
Contract residual amount of financial assets that have been written off as final credit losses during the reporting period, and which are further subject to recovery measures 2,219 350
Amount of final credit losses recorded on assets for the financial year 4,998 13,120 31 Dec 2021 31 Dec 2020 Loans and advances to credit institutions, amortised (1 000 euros) Stage 1 Stage 2 Stage 3 Total Total
Expected credit losses 1.1. 1,935 8,273 14,084 24,292 17,523 Transfer to stage 1 114 -866 -57 -809 -114 Transfer to stage 2 -99 606 -346 161 588 Transfer to stage 3 -12 -245 4,107 3,850 3,224 New debt securities 1,650 574 1,319 3,543 3,007 Matured debt securities -1,058 -898 -3,590 -5,547 -5,866 Realised credit losses - -1 -3,000 -3,001 -4,777 Recoveries on previous realised credit losses - - - 1,558 - Changes in credit risk 82 -527 2,002 - 5,336 Changes in the ECL model parameters - - - - 241 Manual corrections, at credit level -205 -500 3,401 2,696 5,131 Expected credit losses 31.12. 2,407 6,416 17,920 26,743 24,292
125 Parent company’s notes
Group’s notes
Signatures and audit report
Consolidated financial statements
Parent company’s financial statements
Fina
ncia
l Sta
tem
ents
202
1
Contents OmaSp in brief Corporate Governance Report of Board of Directors Financial
StatementsCorporate Social
Responsibility Report
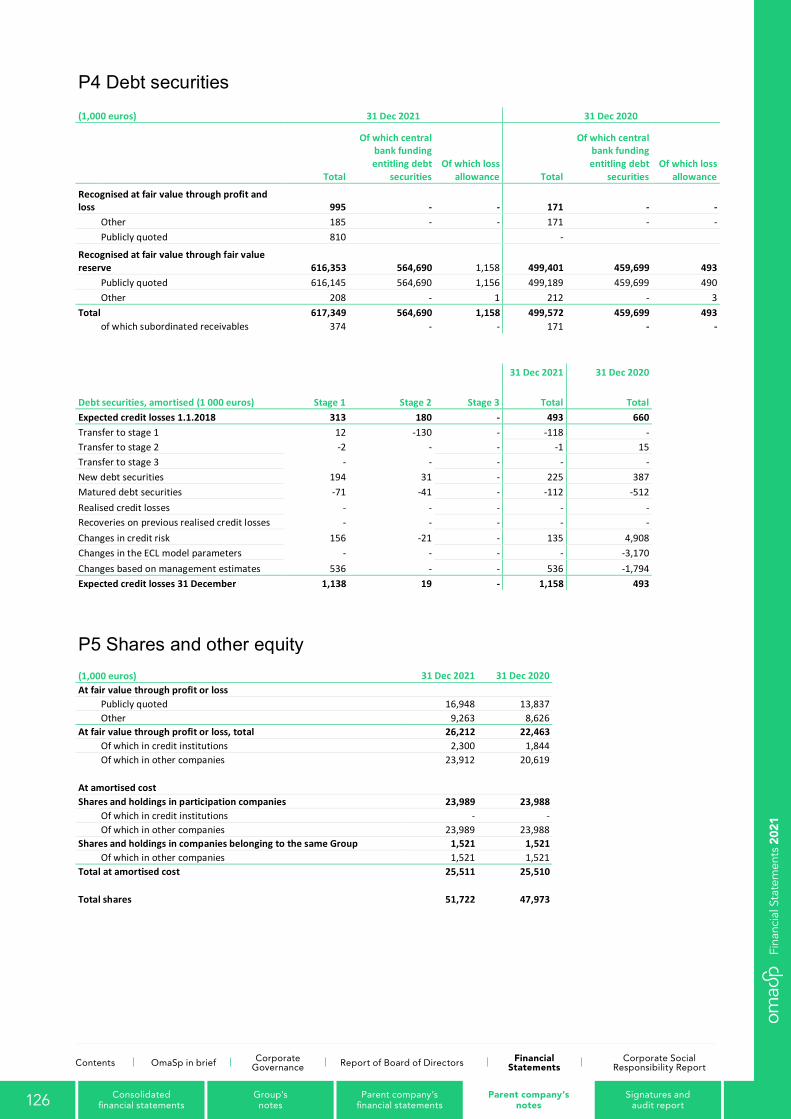
108
P4 Debt securities (1,000 euros) 31 Dec 2021 31 Dec 2020
Total
Of which central bank funding entitling debt
securities Of which loss
allowance Total
Of which central bank funding entitling debt
securities Of which loss
allowance
Recognised at fair value through profit and loss 995 - - 171 - -
Other 185 - - 171 - - Publicly quoted 810 -
Recognised at fair value through fair value reserve 616,353 564,690 1,158 499,401 459,699 493
Publicly quoted 616,145 564,690 1,156 499,189 459,699 490 Other 208 - 1 212 - 3 Total 617,349 564,690 1,158 499,572 459,699 493
of which subordinated receivables 374 - - 171 - - 31 Dec 2021 31 Dec 2020
Debt securities, amortised (1 000 euros) Stage 1 Stage 2 Stage 3 Total Total Expected credit losses 1.1.2018 313 180 - 493 660 Transfer to stage 1 12 -130 - -118 - Transfer to stage 2 -2 - - -1 15 Transfer to stage 3 - - - - - New debt securities 194 31 - 225 387 Matured debt securities -71 -41 - -112 -512 Realised credit losses - - - - - Recoveries on previous realised credit losses - - - - - Changes in credit risk 156 -21 - 135 4,908 Changes in the ECL model parameters - - - - -3,170 Changes based on management estimates 536 - - 536 -1,794 Expected credit losses 31 December 1,138 19 - 1,158 493
P5 Shares and other equity (1,000 euros) 31 Dec 2021 31 Dec 2020 At fair value through profit or loss
Publicly quoted 16,948 13,837 Other 9,263 8,626 At fair value through profit or loss, total 26,212 22,463
Of which in credit institutions 2,300 1,844 Of which in other companies 23,912 20,619 At amortised cost Shares and holdings in participation companies 23,989 23,988
Of which in credit institutions - - Of which in other companies 23,989 23,988 Shares and holdings in companies belonging to the same Group 1,521 1,521
Of which in other companies 1,521 1,521 Total at amortised cost 25,511 25,510
Total shares 51,722 47,973
126 Parent company’s notes
Group’s notes
Signatures and audit report
Consolidated financial statements
Parent company’s financial statements
Fina
ncia
l Sta
tem
ents
202
1
Contents OmaSp in brief Corporate Governance Report of Board of Directors Financial
StatementsCorporate Social
Responsibility Report
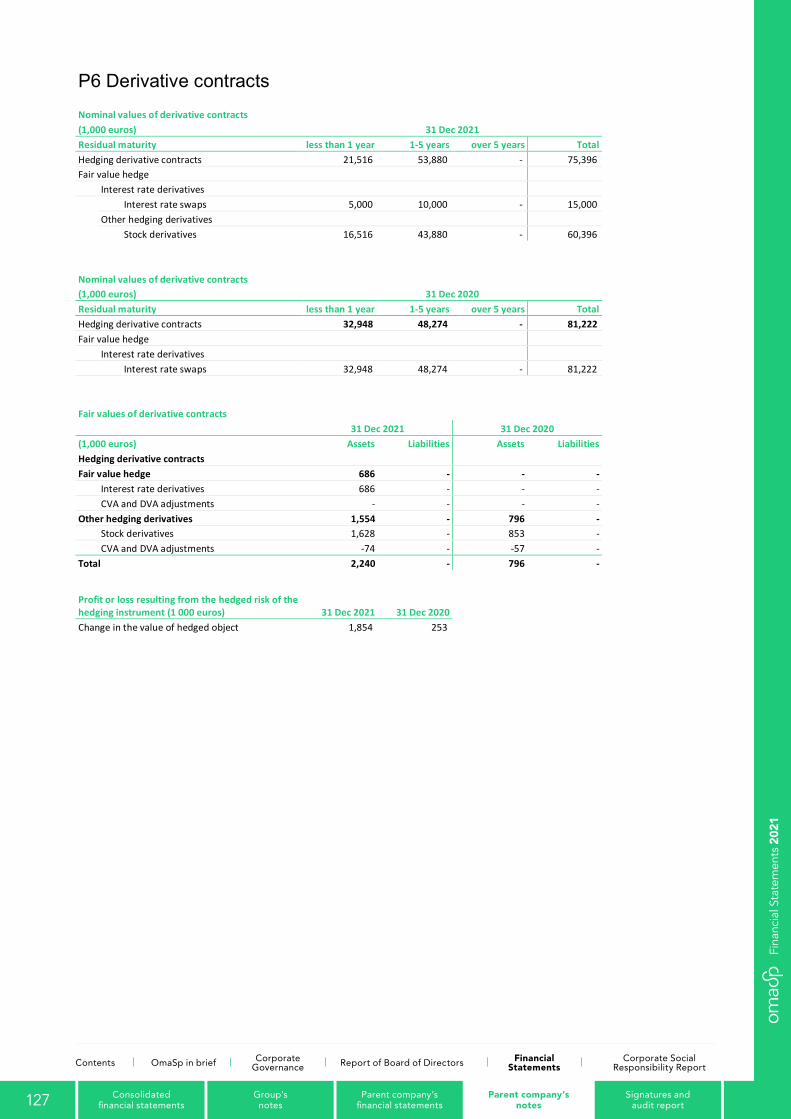
109
P6 Derivative contracts Nominal values of derivative contracts (1,000 euros) 31 Dec 2021 Residual maturity less than 1 year 1-5 years over 5 years Total Hedging derivative contracts 21,516 53,880 - 75,396 Fair value hedge
Interest rate derivatives Interest rate swaps 5,000 10,000 - 15,000 Other hedging derivatives Stock derivatives 16,516 43,880 - 60,396 Nominal values of derivative contracts (1,000 euros) 31 Dec 2020 Residual maturity less than 1 year 1-5 years over 5 years Total Hedging derivative contracts 32,948 48,274 - 81,222 Fair value hedge
Interest rate derivatives Interest rate swaps 32,948 48,274 - 81,222 Fair values of derivative contracts
31 Dec 2021 31 Dec 2020 (1,000 euros) Assets Liabilities Assets Liabilities Hedging derivative contracts Fair value hedge 686 - - -
Interest rate derivatives 686 - - - CVA and DVA adjustments - - - - Other hedging derivatives 1,554 - 796 -
Stock derivatives 1,628 - 853 - CVA and DVA adjustments -74 - -57 - Total 2,240 - 796 -
Profit or loss resulting from the hedged risk of the hedging instrument (1 000 euros) 31 Dec 2021 31 Dec 2020 Change in the value of hedged object 1,854 253
127 Parent company’s notes
Group’s notes
Signatures and audit report
Consolidated financial statements
Parent company’s financial statements
Fina
ncia
l Sta
tem
ents
202
1
Contents OmaSp in brief Corporate Governance Report of Board of Directors Financial
StatementsCorporate Social
Responsibility Report
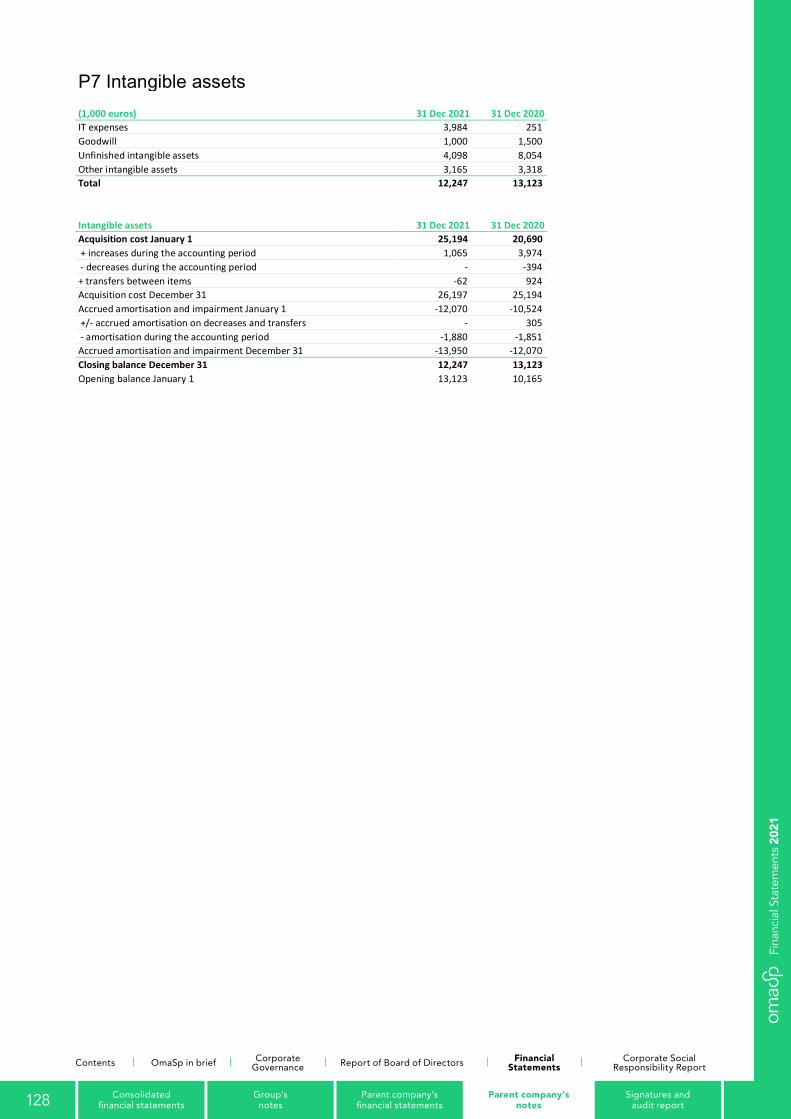
110
P7 Intangible assets (1,000 euros) 31 Dec 2021 31 Dec 2020 IT expenses 3,984 251 Goodwill 1,000 1,500 Unfinished intangible assets 4,098 8,054 Other intangible assets 3,165 3,318 Total 12,247 13,123
Intangible assets 31 Dec 2021 31 Dec 2020 Acquisition cost January 1 25,194 20,690 + increases during the accounting period 1,065 3,974 - decreases during the accounting period - -394 + transfers between items -62 924 Acquisition cost December 31 26,197 25,194 Accrued amortisation and impairment January 1 -12,070 -10,524 +/- accrued amortisation on decreases and transfers - 305 - amortisation during the accounting period -1,880 -1,851 Accrued amortisation and impairment December 31 -13,950 -12,070 Closing balance December 31 12,247 13,123 Opening balance January 1 13,123 10,165
128 Parent company’s notes
Group’s notes
Signatures and audit report
Consolidated financial statements
Parent company’s financial statements
Fina
ncia
l Sta
tem
ents
202
1
Contents OmaSp in brief Corporate Governance Report of Board of Directors Financial
StatementsCorporate Social
Responsibility Report
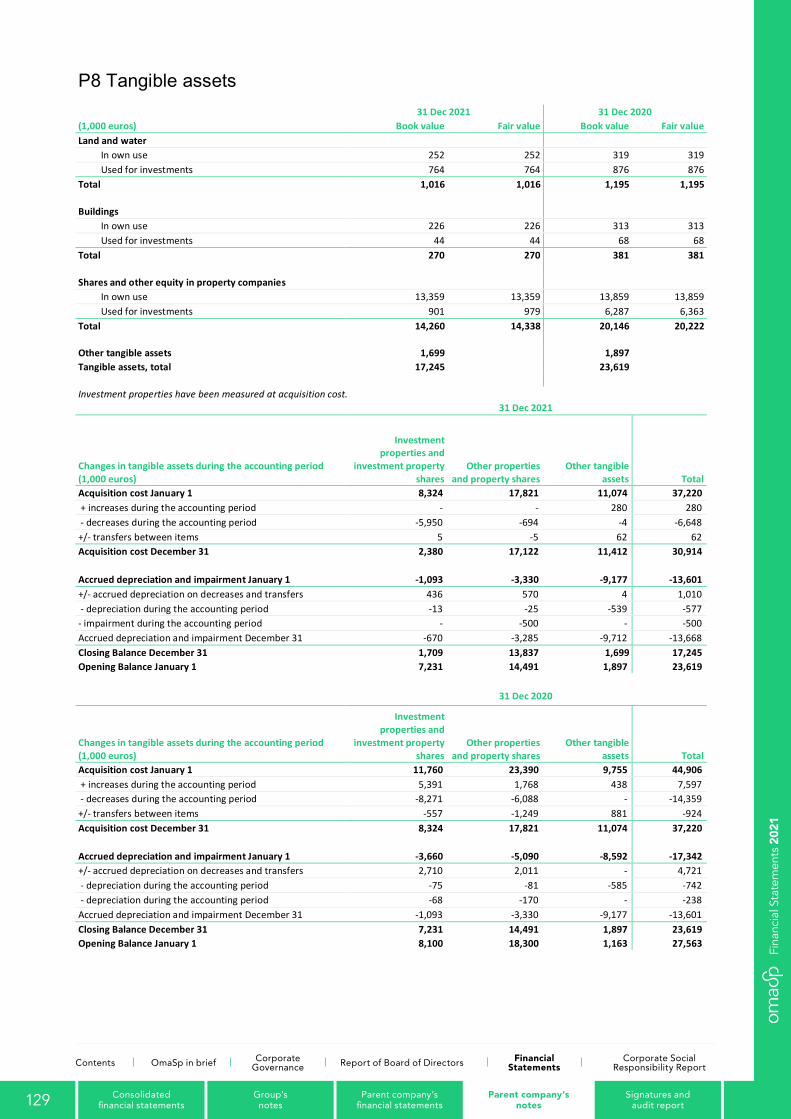
111
P8 Tangible assets 31 Dec 2021 31 Dec 2020 (1,000 euros) Book value Fair value Book value Fair value Land and water
In own use 252 252 319 319 Used for investments 764 764 876 876 Total 1,016 1,016 1,195 1,195
Buildings
In own use 226 226 313 313 Used for investments 44 44 68 68 Total 270 270 381 381
Shares and other equity in property companies
In own use 13,359 13,359 13,859 13,859 Used for investments 901 979 6,287 6,363 Total 14,260 14,338 20,146 20,222
Other tangible assets 1,699 1,897 Tangible assets, total 17,245 23,619
Investment properties have been measured at acquisition cost.
31 Dec 2021
Changes in tangible assets during the accounting period (1,000 euros)
Investment properties and
investment property shares
Other properties and property shares
Other tangible assets Total
Acquisition cost January 1 8,324 17,821 11,074 37,220 + increases during the accounting period - - 280 280 - decreases during the accounting period -5,950 -694 -4 -6,648 +/- transfers between items 5 -5 62 62 Acquisition cost December 31 2,380 17,122 11,412 30,914
Accrued depreciation and impairment January 1 -1,093 -3,330 -9,177 -13,601 +/- accrued depreciation on decreases and transfers 436 570 4 1,010 - depreciation during the accounting period -13 -25 -539 -577 - impairment during the accounting period - -500 - -500 Accrued depreciation and impairment December 31 -670 -3,285 -9,712 -13,668 Closing Balance December 31 1,709 13,837 1,699 17,245 Opening Balance January 1 7,231 14,491 1,897 23,619
31 Dec 2020
Changes in tangible assets during the accounting period (1,000 euros)
Investment properties and
investment property shares
Other properties and property shares
Other tangible assets Total
Acquisition cost January 1 11,760 23,390 9,755 44,906 + increases during the accounting period 5,391 1,768 438 7,597 - decreases during the accounting period -8,271 -6,088 - -14,359 +/- transfers between items -557 -1,249 881 -924 Acquisition cost December 31 8,324 17,821 11,074 37,220
Accrued depreciation and impairment January 1 -3,660 -5,090 -8,592 -17,342 +/- accrued depreciation on decreases and transfers 2,710 2,011 - 4,721 - depreciation during the accounting period -75 -81 -585 -742 - depreciation during the accounting period -68 -170 - -238 Accrued depreciation and impairment December 31 -1,093 -3,330 -9,177 -13,601 Closing Balance December 31 7,231 14,491 1,897 23,619 Opening Balance January 1 8,100 18,300 1,163 27,563
129 Parent company’s notes
Group’s notes
Signatures and audit report
Consolidated financial statements
Parent company’s financial statements
Fina
ncia
l Sta
tem
ents
202
1
Contents OmaSp in brief Corporate Governance Report of Board of Directors Financial
StatementsCorporate Social
Responsibility Report

112
P9 Other assets (1,000 euros) 31 Dec 2021 31 Dec 2020 Receivables on payment transfers 82 100 Receivables from securities 30,034 - Other 643 312 Total 30,759 412
P10 Accured income and prepayments (1,000 euros) 31 Dec 2021 31 Dec 2020 Interests 11,632 8,795 Other 3,761 2,921 Total 15,393 11,715
P11 Liabilities to the public and public sector entities and liabilities to credit institutions
Liabilities to the public and public sector entities (1,000 euros) 31 Dec 2021 31 Dec 2020 Deposits 2,897,846 2,376,743
Repayable on demand 2,771,682 2,187,865 Other 126,164 188,878 Other liabilitites 33 56
Other 33 56 Total 2,897,879 2,376,799
Liabilities to credit institutions (1,000 euros) 31 Dec 2021 31 Dec 2020 Liabilities to central banks 150,000 150,000 Repayable on demand 10,784 10,768 Other 51,901 62,742 Total 212,685 223,510
130 Parent company’s notes
Group’s notes
Signatures and audit report
Consolidated financial statements
Parent company’s financial statements
Fina
ncia
l Sta
tem
ents
202
1
Contents OmaSp in brief Corporate Governance Report of Board of Directors Financial
StatementsCorporate Social
Responsibility Report
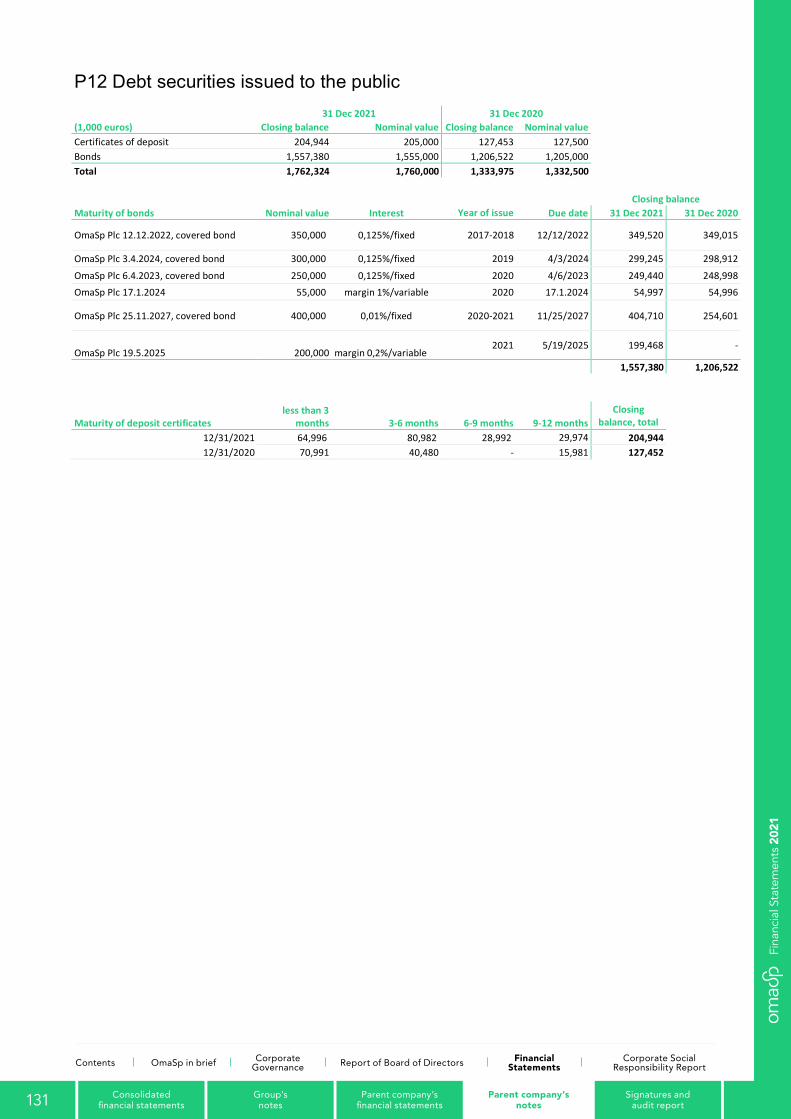
113
P12 Debt securities issued to the public 31 Dec 2021 31 Dec 2020 (1,000 euros) Closing balance Nominal value Closing balance Nominal value Certificates of deposit 204,944 205,000 127,453 127,500 Bonds 1,557,380 1,555,000 1,206,522 1,205,000 Total 1,762,324 1,760,000 1,333,975 1,332,500
Closing balance Maturity of bonds Nominal value Interest Year of issue Due date 31 Dec 2021 31 Dec 2020
OmaSp Plc 12.12.2022, covered bond 350,000 0,125%/fixed 2017-2018 12/12/2022 349,520 349,015
OmaSp Plc 3.4.2024, covered bond 300,000 0,125%/fixed 2019 4/3/2024 299,245 298,912
OmaSp Plc 6.4.2023, covered bond 250,000 0,125%/fixed 2020 4/6/2023 249,440 248,998 OmaSp Plc 17.1.2024 55,000 margin 1%/variable 2020 17.1.2024 54,997 54,996
OmaSp Plc 25.11.2027, covered bond 400,000 0,01%/fixed 2020-2021 11/25/2027 404,710 254,601
OmaSp Plc 19.5.2025 200,000 margin 0,2%/variable 2021 5/19/2025 199,468 -
1,557,380 1,206,522
Maturity of deposit certificates less than 3
months 3-6 months 6-9 months 9-12 months Closing
balance, total 12/31/2021 64,996 80,982 28,992 29,974 204,944 12/31/2020 70,991 40,480 - 15,981 127,452
131 Parent company’s notes
Group’s notes
Signatures and audit report
Consolidated financial statements
Parent company’s financial statements
Fina
ncia
l Sta
tem
ents
202
1
Contents OmaSp in brief Corporate Governance Report of Board of Directors Financial
StatementsCorporate Social
Responsibility Report
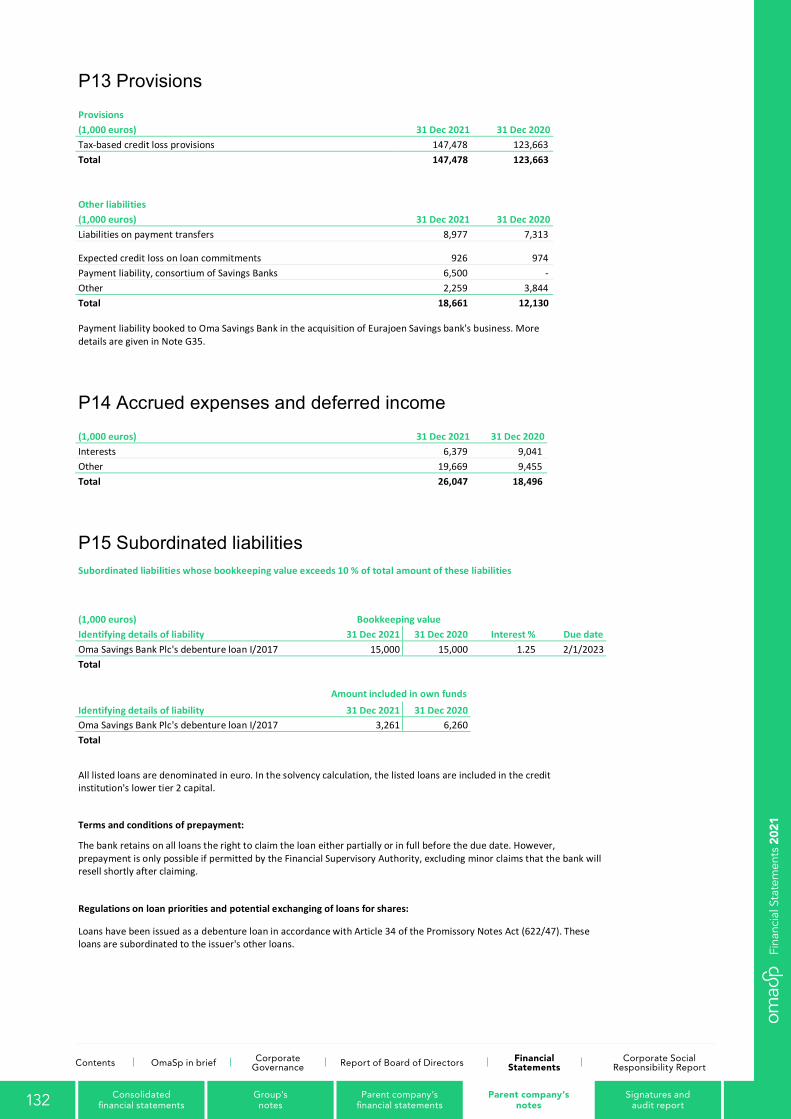
114
P13 Provisions Provisions (1,000 euros) 31 Dec 2021 31 Dec 2020 Tax-based credit loss provisions 147,478 123,663 Total 147,478 123,663
Other liabilities (1,000 euros) 31 Dec 2021 31 Dec 2020 Liabilities on payment transfers 8,977 7,313
Expected credit loss on loan commitments 926 974 Payment liability, consortium of Savings Banks 6,500 - Other 2,259 3,844 Total 18,661 12,130
Payment liability booked to Oma Savings Bank in the acquisition of Eurajoen Savings bank's business. More details are given in Note G35.
P14 Accrued expenses and deferred income (1,000 euros) 31 Dec 2021 31 Dec 2020 Interests 6,379 9,041 Other 19,669 9,455 Total 26,047 18,496
P15 Subordinated liabilities Subordinated liabilities whose bookkeeping value exceeds 10 % of total amount of these liabilities
(1,000 euros) Bookkeeping value Identifying details of liability 31 Dec 2021 31 Dec 2020 Interest % Due date Oma Savings Bank Plc's debenture loan I/2017 15,000 15,000 1.25 2/1/2023 Total
Amount included in own funds Identifying details of liability 31 Dec 2021 31 Dec 2020 Oma Savings Bank Plc's debenture loan I/2017 3,261 6,260 Total
All listed loans are denominated in euro. In the solvency calculation, the listed loans are included in the credit institution's lower tier 2 capital.
Terms and conditions of prepayment:
The bank retains on all loans the right to claim the loan either partially or in full before the due date. However, prepayment is only possible if permitted by the Financial Supervisory Authority, excluding minor claims that the bank will resell shortly after claiming.
Regulations on loan priorities and potential exchanging of loans for shares:
Loans have been issued as a debenture loan in accordance with Article 34 of the Promissory Notes Act (622/47). These loans are subordinated to the issuer's other loans.
132 Parent company’s notes
Group’s notes
Signatures and audit report
Consolidated financial statements
Parent company’s financial statements
Fina
ncia
l Sta
tem
ents
202
1
Contents OmaSp in brief Corporate Governance Report of Board of Directors Financial
StatementsCorporate Social
Responsibility Report
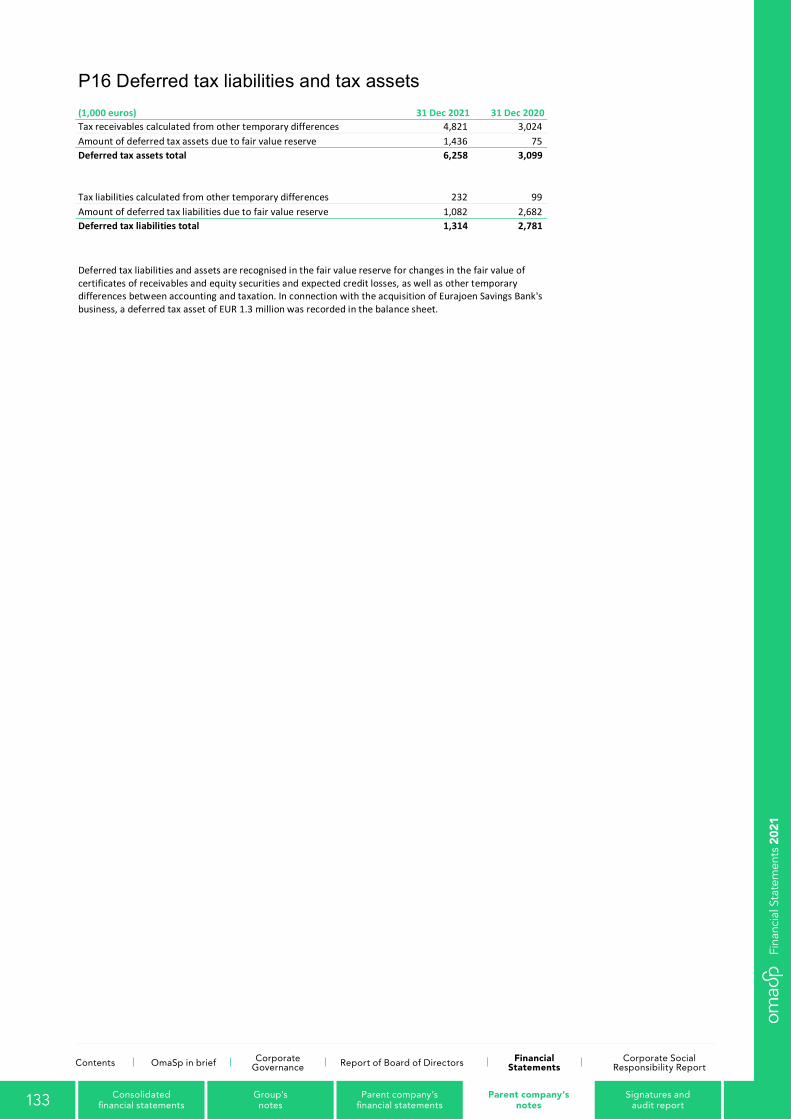
115
P16 Deferred tax liabilities and tax assets (1,000 euros) 31 Dec 2021 31 Dec 2020 Tax receivables calculated from other temporary differences 4,821 3,024 Amount of deferred tax assets due to fair value reserve 1,436 75 Deferred tax assets total 6,258 3,099
Tax liabilities calculated from other temporary differences 232 99 Amount of deferred tax liabilities due to fair value reserve 1,082 2,682 Deferred tax liabilities total 1,314 2,781
Deferred tax liabilities and assets are recognised in the fair value reserve for changes in the fair value of certificates of receivables and equity securities and expected credit losses, as well as other temporary differences between accounting and taxation. In connection with the acquisition of Eurajoen Savings Bank's business, a deferred tax asset of EUR 1.3 million was recorded in the balance sheet.
133 Parent company’s notes
Group’s notes
Signatures and audit report
Consolidated financial statements
Parent company’s financial statements
Fina
ncia
l Sta
tem
ents
202
1
Contents OmaSp in brief Corporate Governance Report of Board of Directors Financial
StatementsCorporate Social
Responsibility Report
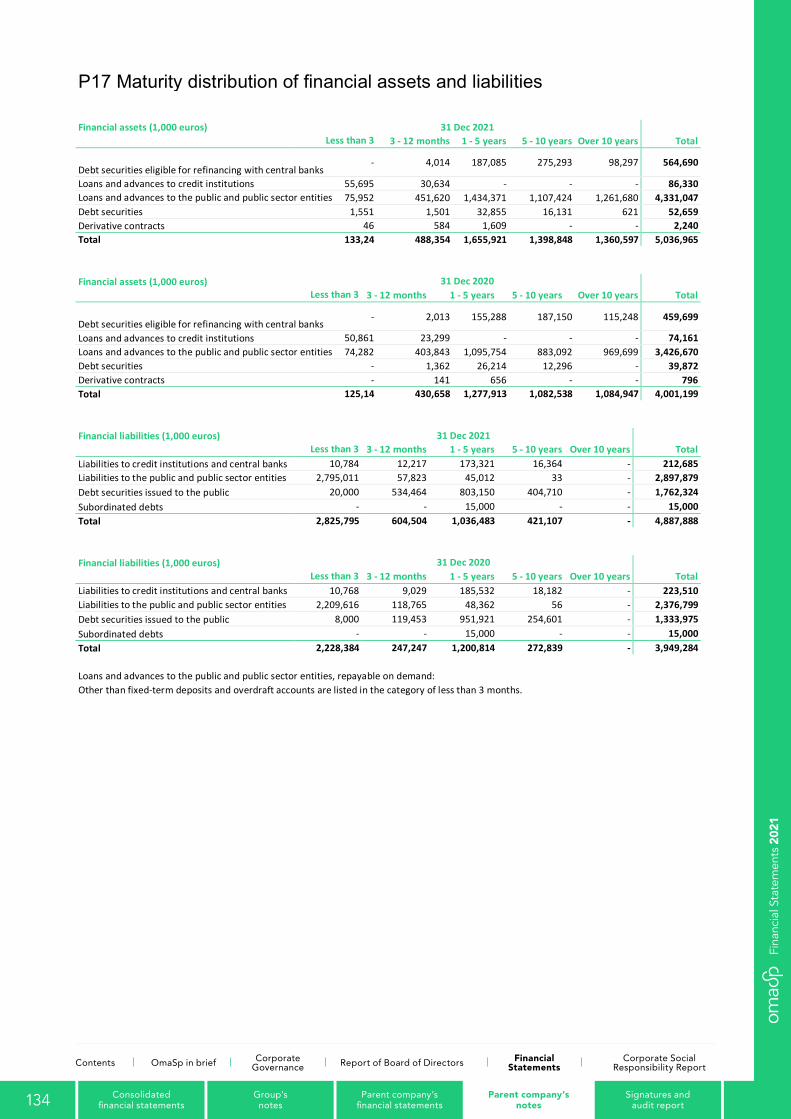
116
P17 Maturity distribution of financial assets and liabilities Financial assets (1,000 euros) 31 Dec 2021
Less than 3
3 - 12 months 1 - 5 years 5 - 10 years Over 10 years Total
Debt securities eligible for refinancing with central banks - 4,014 187,085 275,293 98,297 564,690
Loans and advances to credit institutions 55,695 30,634 - - - 86,330 Loans and advances to the public and public sector entities
75,952 451,620 1,434,371 1,107,424 1,261,680 4,331,047
Debt securities 1,551 1,501 32,855 16,131 621 52,659 Derivative contracts 46 584 1,609 - - 2,240 Total 133,24
488,354 1,655,921 1,398,848 1,360,597 5,036,965
Financial assets (1,000 euros) 31 Dec 2020
Less than 3
3 - 12 months 1 - 5 years 5 - 10 years Over 10 years Total
Debt securities eligible for refinancing with central banks - 2,013 155,288 187,150 115,248 459,699
Loans and advances to credit institutions 50,861 23,299 - - - 74,161 Loans and advances to the public and public sector entities
74,282 403,843 1,095,754 883,092 969,699 3,426,670
Debt securities - 1,362 26,214 12,296 - 39,872 Derivative contracts - 141 656 - - 796 Total 125,14
430,658 1,277,913 1,082,538 1,084,947 4,001,199
Financial liabilities (1,000 euros) 31 Dec 2021
Less than 3
3 - 12 months 1 - 5 years 5 - 10 years Over 10 years Total Liabilities to credit institutions and central banks 10,784 12,217 173,321 16,364 - 212,685 Liabilities to the public and public sector entities 2,795,011 57,823 45,012 33 - 2,897,879 Debt securities issued to the public 20,000 534,464 803,150 404,710 - 1,762,324 Subordinated debts - - 15,000 - - 15,000 Total 2,825,795 604,504 1,036,483 421,107 - 4,887,888
Financial liabilities (1,000 euros) 31 Dec 2020
Less than 3
3 - 12 months 1 - 5 years 5 - 10 years Over 10 years Total Liabilities to credit institutions and central banks 10,768 9,029 185,532 18,182 - 223,510 Liabilities to the public and public sector entities 2,209,616 118,765 48,362 56 - 2,376,799 Debt securities issued to the public 8,000 119,453 951,921 254,601 - 1,333,975 Subordinated debts - - 15,000 - - 15,000 Total 2,228,384 247,247 1,200,814 272,839 - 3,949,284
Loans and advances to the public and public sector entities, repayable on demand: Other than fixed-term deposits and overdraft accounts are listed in the category of less than 3 months.
134 Parent company’s notes
Group’s notes
Signatures and audit report
Consolidated financial statements
Parent company’s financial statements
Fina
ncia
l Sta
tem
ents
202
1
Contents OmaSp in brief Corporate Governance Report of Board of Directors Financial
StatementsCorporate Social
Responsibility Report
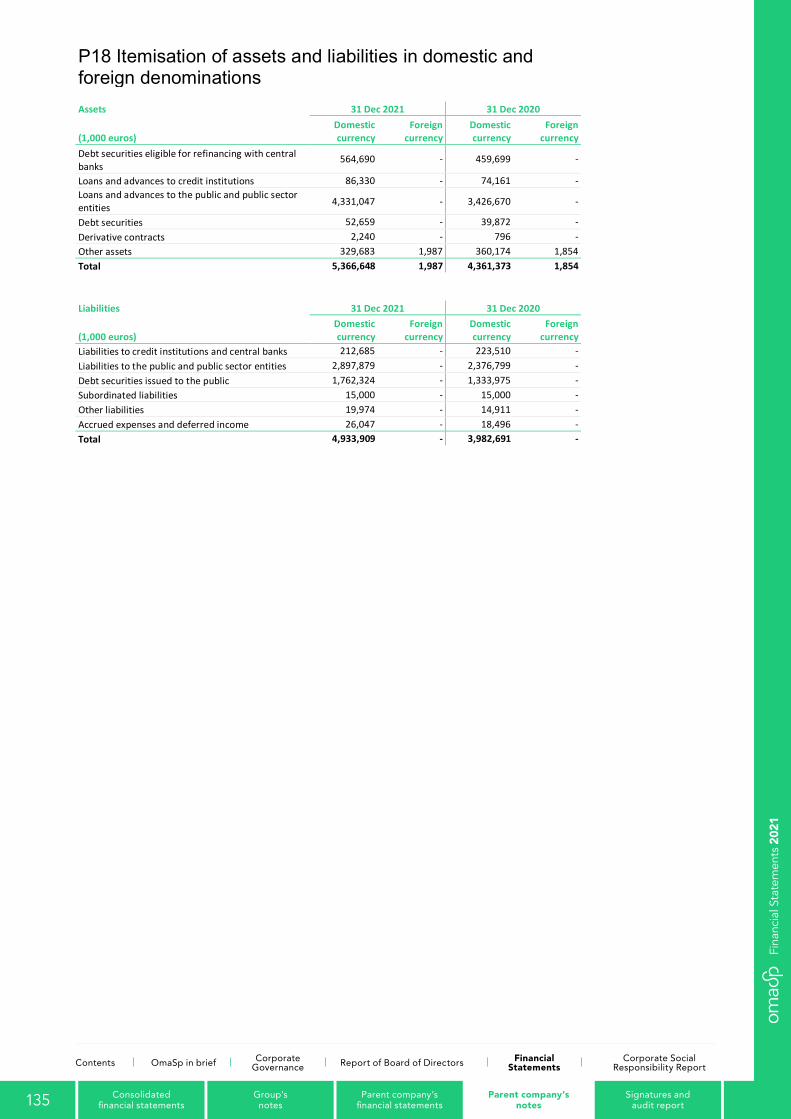
117
P18 Itemisation of assets and liabilities in domestic and foreign denominations
Assets 31 Dec 2021 31 Dec 2020
(1,000 euros) Domestic currency
Foreign currency
Domestic currency
Foreign currency
Debt securities eligible for refinancing with central banks
564,690 - 459,699 -
Loans and advances to credit institutions 86,330 - 74,161 - Loans and advances to the public and public sector entities 4,331,047 - 3,426,670 -
Debt securities 52,659 - 39,872 - Derivative contracts 2,240 - 796 - Other assets 329,683 1,987 360,174 1,854 Total 5,366,648 1,987 4,361,373 1,854
Liabilities 31 Dec 2021 31 Dec 2020
(1,000 euros) Domestic currency
Foreign currency
Domestic currency
Foreign currency
Liabilities to credit institutions and central banks 212,685 - 223,510 - Liabilities to the public and public sector entities 2,897,879 - 2,376,799 - Debt securities issued to the public 1,762,324 - 1,333,975 - Subordinated liabilities 15,000 - 15,000 - Other liabilities 19,974 - 14,911 - Accrued expenses and deferred income 26,047 - 18,496 - Total 4,933,909 - 3,982,691 -
135 Parent company’s notes
Group’s notes
Signatures and audit report
Consolidated financial statements
Parent company’s financial statements
Fina
ncia
l Sta
tem
ents
202
1
Contents OmaSp in brief Corporate Governance Report of Board of Directors Financial
StatementsCorporate Social
Responsibility Report

118
P19 Fair values and book values of financial assets and liabilities and fair value hierarchy
The fair values of financial assets have been determined primarily on the basis of the quoted market prices. If a quoted market price was not available, the current value discounted by the market interest rate or another generally accepted valuation model or method was used in the valuation. The book value was used as the fair value for other financial assets. The book value was used as the fair value for financial liabilities.
Financial assets 31 Dec 2021 31 Dec 2020 (1,000 euros) Book value Fair value Book value Fair value Cash and cash equivalents 198,046 198,046 262,087 262,087 Loans and advances to credit institutions 86,330 86,330 74,161 74,161 Loans and advances to the public and the public sector entities
4,331,047 4,331,047 3,426,670 3,426,670 Debt securities 617,349 617,349 499,572 500,072 Shares and other equity 51,722 51,722 47,973 47,973 Derivative contracts 2,240 2,240 796 796 Total 5,286,733 5,286,733 4,311,259 4,311,759
Financial liabilities 31 Dec 2021 31 Dec 2020 (1,000 euros) Book value Fair value Book value Fair value Liabilities to credit institutions 212,685 212,685 223,510 223,510 Liabilities to the public and public sector entities 2,897,879 2,897,879 2,376,799 2,376,799 Debt securities issued to the public 1,762,324 1,762,324 1,333,975 1,333,975 Subordinated liabilities 15,000 15,000 15,000 15,000 Total 4,887,888 4,887,888 3,949,284 3,949,284
31 Dec 2021 Level 1 Level 2 Level 3 Total
Financial instruments measured at fair value 634,028 4,227 7,546 645,801
31 Dec 2020 Level 1 Level 2 Level 3 Total
Financial instruments measured at fair value 513,325 2,650 6,856 522,831
Fair value and changes in value entered directly into the income statement as well as changes, entered into the fair value reserve, from each group of financial instruments measured at fair value
(1,000 euros) 31 Dec 2021 31 Dec 2020
Fair value
Change in value in income
statement Fair value
reserve 31.12. Fair value
Change in value in income
statement Fair value
reserve 31.12. Financial assets at fair value through fair value reserve 616,353 -8 -1,772 499,401 8,005 13,037
Financial assets at fair value through profit or loss 29,448 4,397 - 23,430 2,612 - Total 645,801 4,389 -1,772 522,831 10,616 13,037
136 Parent company’s notes
Group’s notes
Signatures and audit report
Consolidated financial statements
Parent company’s financial statements
Fina
ncia
l Sta
tem
ents
202
1
Contents OmaSp in brief Corporate Governance Report of Board of Directors Financial
StatementsCorporate Social
Responsibility Report
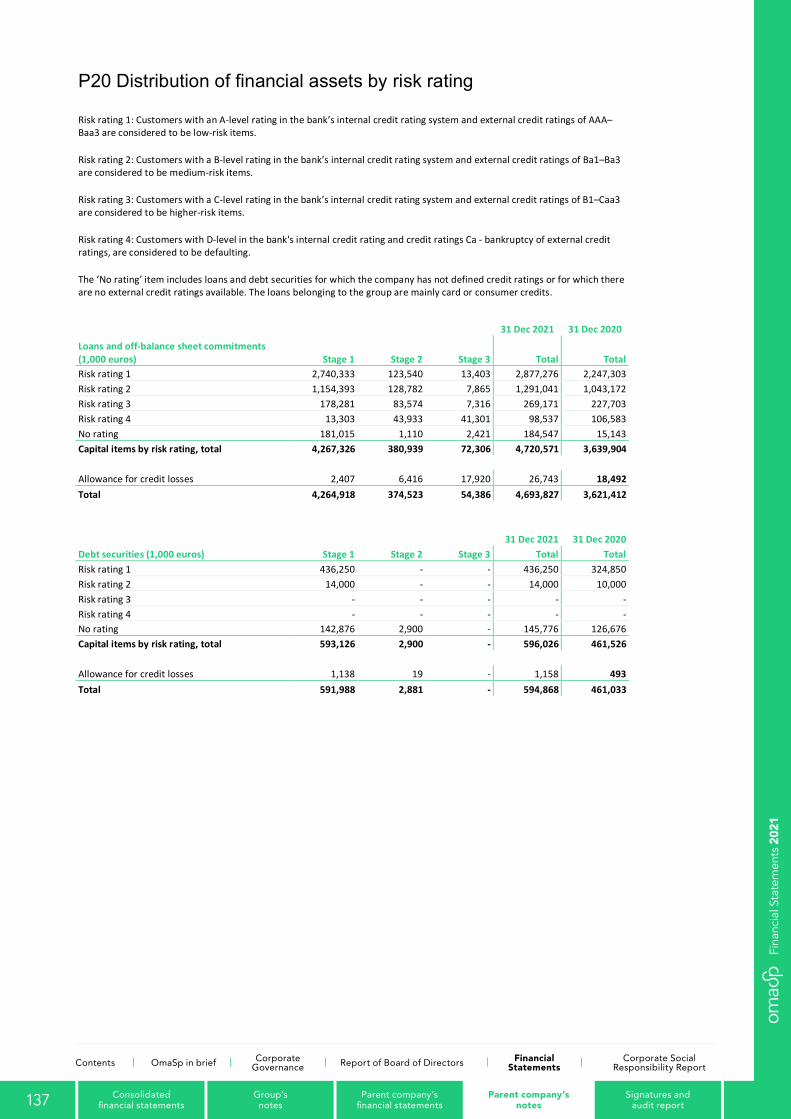
119
P20 Distribution of financial assets by risk rating
Risk rating 1: Customers with an A-level rating in the bank’s internal credit rating system and external credit ratings of AAA–Baa3 are considered to be low-risk items.
Risk rating 2: Customers with a B-level rating in the bank’s internal credit rating system and external credit ratings of Ba1–Ba3 are considered to be medium-risk items.
Risk rating 3: Customers with a C-level rating in the bank’s internal credit rating system and external credit ratings of B1–Caa3 are considered to be higher-risk items.
Risk rating 4: Customers with D-level in the bank's internal credit rating and credit ratings Ca - bankruptcy of external credit ratings, are considered to be defaulting.
The ‘No rating’ item includes loans and debt securities for which the company has not defined credit ratings or for which there are no external credit ratings available. The loans belonging to the group are mainly card or consumer credits.
31 Dec 2021 31 Dec 2020
Loans and off-balance sheet commitments (1,000 euros) Stage 1 Stage 2 Stage 3 Total Total Risk rating 1 2,740,333 123,540 13,403 2,877,276 2,247,303 Risk rating 2 1,154,393 128,782 7,865 1,291,041 1,043,172 Risk rating 3 178,281 83,574 7,316 269,171 227,703 Risk rating 4 13,303 43,933 41,301 98,537 106,583 No rating 181,015 1,110 2,421 184,547 15,143 Capital items by risk rating, total 4,267,326 380,939 72,306 4,720,571 3,639,904
Allowance for credit losses 2,407 6,416 17,920 26,743 18,492 Total 4,264,918 374,523 54,386 4,693,827 3,621,412
31 Dec 2021 31 Dec 2020 Debt securities (1,000 euros) Stage 1 Stage 2 Stage 3 Total Total Risk rating 1 436,250 - - 436,250 324,850 Risk rating 2 14,000 - - 14,000 10,000 Risk rating 3 - - - - - Risk rating 4 - - - - - No rating 142,876 2,900 - 145,776 126,676 Capital items by risk rating, total 593,126 2,900 - 596,026 461,526
Allowance for credit losses 1,138 19 - 1,158 493 Total 591,988 2,881 - 594,868 461,033
137 Parent company’s notes
Group’s notes
Signatures and audit report
Consolidated financial statements
Parent company’s financial statements
Fina
ncia
l Sta
tem
ents
202
1
Contents OmaSp in brief Corporate Governance Report of Board of Directors Financial
StatementsCorporate Social
Responsibility Report
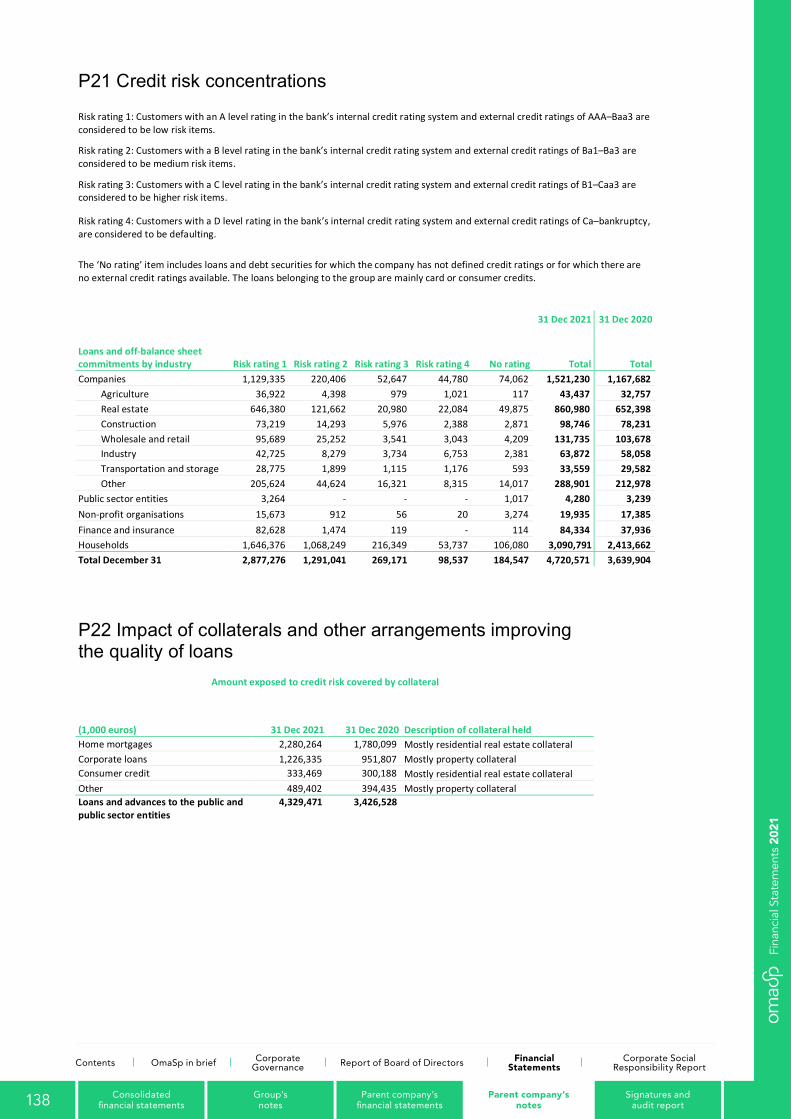
120
P21 Credit risk concentrations
Risk rating 1: Customers with an A level rating in the bank’s internal credit rating system and external credit ratings of AAA–Baa3 are considered to be low risk items.
Risk rating 2: Customers with a B level rating in the bank’s internal credit rating system and external credit ratings of Ba1–Ba3 are considered to be medium risk items.
Risk rating 3: Customers with a C level rating in the bank’s internal credit rating system and external credit ratings of B1–Caa3 are considered to be higher risk items.
Risk rating 4: Customers with a D level rating in the bank’s internal credit rating system and external credit ratings of Ca–bankruptcy, are considered to be defaulting.
The ‘No rating’ item includes loans and debt securities for which the company has not defined credit ratings or for which there are no external credit ratings available. The loans belonging to the group are mainly card or consumer credits.
31 Dec 2021 31 Dec 2020
Loans and off-balance sheet commitments by industry Risk rating 1 Risk rating 2 Risk rating 3 Risk rating 4 No rating Total Total Companies 1,129,335 220,406 52,647 44,780 74,062 1,521,230 1,167,682
Agriculture 36,922 4,398 979 1,021 117 43,437 32,757 Real estate 646,380 121,662 20,980 22,084 49,875 860,980 652,398 Construction 73,219 14,293 5,976 2,388 2,871 98,746 78,231 Wholesale and retail 95,689 25,252 3,541 3,043 4,209 131,735 103,678 Industry 42,725 8,279 3,734 6,753 2,381 63,872 58,058 Transportation and storage 28,775 1,899 1,115 1,176 593 33,559 29,582 Other 205,624 44,624 16,321 8,315 14,017 288,901 212,978
Public sector entities 3,264 - - - 1,017 4,280 3,239 Non-profit organisations 15,673 912 56 20 3,274 19,935 17,385 Finance and insurance 82,628 1,474 119 - 114 84,334 37,936 Households 1,646,376 1,068,249 216,349 53,737 106,080 3,090,791 2,413,662 Total December 31 2,877,276 1,291,041 269,171 98,537 184,547 4,720,571 3,639,904
P22 Impact of collaterals and other arrangements improving the quality of loans
Amount exposed to credit risk covered by collateral
(1,000 euros) 31 Dec 2021 31 Dec 2020 Description of collateral held Home mortgages 2,280,264 1,780,099 Mostly residential real estate collateral Corporate loans 1,226,335 951,807 Mostly property collateral Consumer credit 333,469 300,188 Mostly residential real estate collateral Other 489,402 394,435 Mostly property collateral Loans and advances to the public and public sector entities
4,329,471 3,426,528
138 Parent company’s notes
Group’s notes
Signatures and audit report
Consolidated financial statements
Parent company’s financial statements
Fina
ncia
l Sta
tem
ents
202
1
Contents OmaSp in brief Corporate Governance Report of Board of Directors Financial
StatementsCorporate Social
Responsibility Report
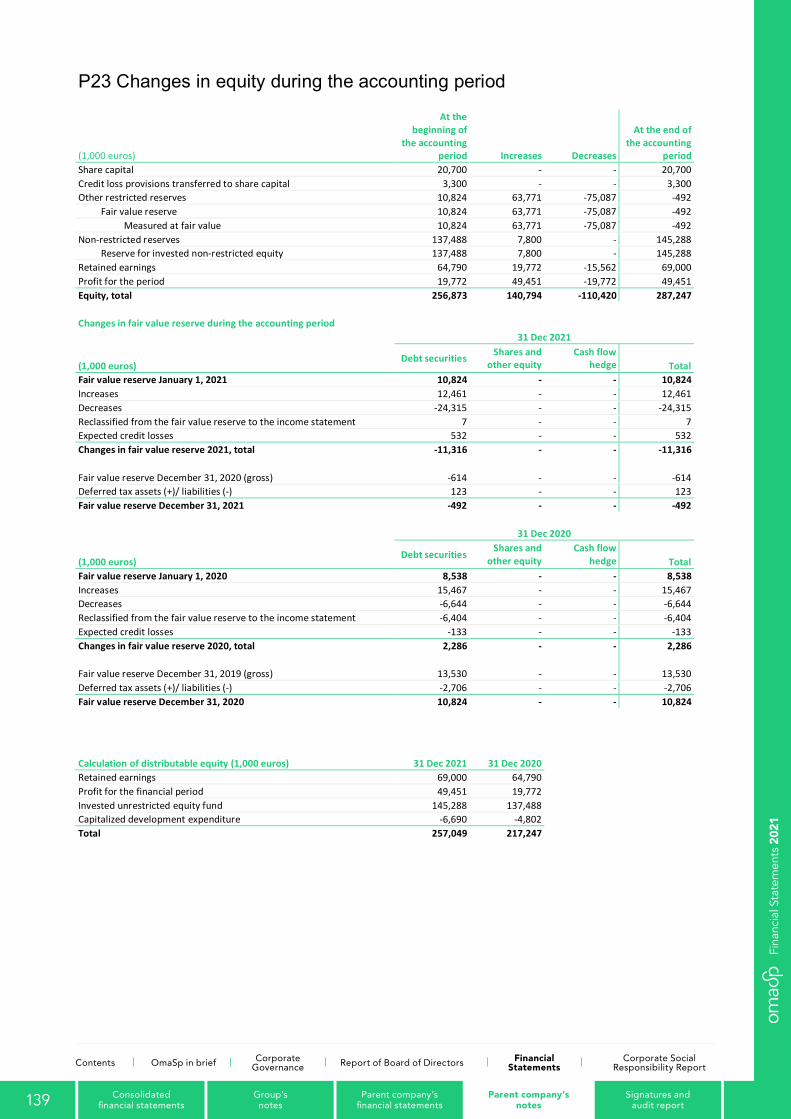
121
P23 Changes in equity during the accounting period
(1,000 euros)
At the beginning of
the accounting period Increases Decreases
At the end of the accounting
period Share capital 20,700 - - 20,700 Credit loss provisions transferred to share capital 3,300 - - 3,300 Other restricted reserves 10,824 63,771 -75,087 -492
Fair value reserve 10,824 63,771 -75,087 -492 Measured at fair value 10,824 63,771 -75,087 -492 Non-restricted reserves 137,488 7,800 - 145,288
Reserve for invested non-restricted equity 137,488 7,800 - 145,288 Retained earnings 64,790 19,772 -15,562 69,000 Profit for the period 19,772 49,451 -19,772 49,451 Equity, total 256,873 140,794 -110,420 287,247
Changes in fair value reserve during the accounting period
31 Dec 2021
(1,000 euros) Debt securities Shares and
other equity Cash flow
hedge Total Fair value reserve January 1, 2021 10,824 - - 10,824 Increases 12,461 - - 12,461 Decreases -24,315 - - -24,315 Reclassified from the fair value reserve to the income statement 7 - - 7 Expected credit losses 532 - - 532 Changes in fair value reserve 2021, total -11,316 - - -11,316
Fair value reserve December 31, 2020 (gross) -614 - - -614 Deferred tax assets (+)/ liabilities (-) 123 - - 123 Fair value reserve December 31, 2021 -492 - - -492
31 Dec 2020
(1,000 euros) Debt securities
Shares and other equity
Cash flow hedge Total
Fair value reserve January 1, 2020 8,538 - - 8,538 Increases 15,467 - - 15,467 Decreases -6,644 - - -6,644 Reclassified from the fair value reserve to the income statement -6,404 - - -6,404 Expected credit losses -133 - - -133 Changes in fair value reserve 2020, total 2,286 - - 2,286
Fair value reserve December 31, 2019 (gross) 13,530 - - 13,530 Deferred tax assets (+)/ liabilities (-) -2,706 - - -2,706 Fair value reserve December 31, 2020 10,824 - - 10,824
Calculation of distributable equity (1,000 euros) 31 Dec 2021 31 Dec 2020 Retained earnings 69,000 64,790 Profit for the financial period 49,451 19,772 Invested unrestricted equity fund 145,288 137,488 Capitalized development expenditure -6,690 -4,802 Total 257,049 217,247
139 Parent company’s notes
Group’s notes
Signatures and audit report
Consolidated financial statements
Parent company’s financial statements
Fina
ncia
l Sta
tem
ents
202
1
Contents OmaSp in brief Corporate Governance Report of Board of Directors Financial
StatementsCorporate Social
Responsibility Report
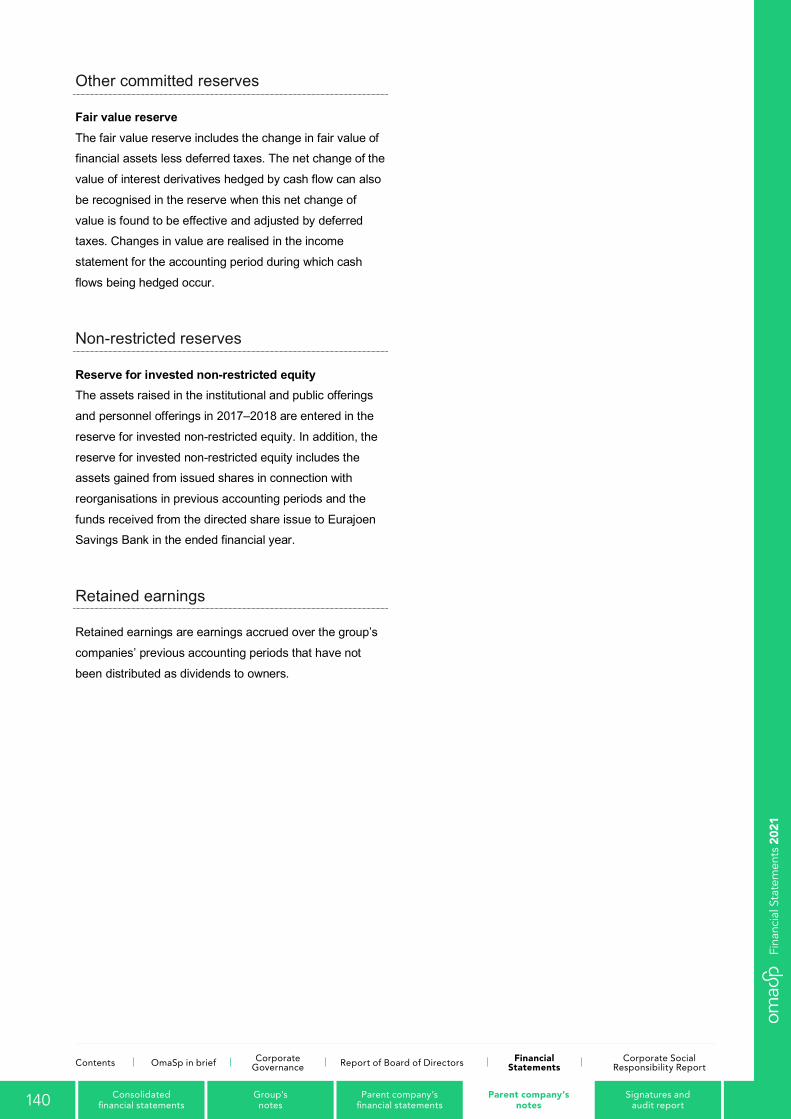
122
Other committed reserves
Fair value reserve The fair value reserve includes the change in fair value of financial assets less deferred taxes. The net change of the
value of interest derivatives hedged by cash flow can also
be recognised in the reserve when this net change of
value is found to be effective and adjusted by deferred taxes. Changes in value are realised in the income
statement for the accounting period during which cash
flows being hedged occur.
Non-restricted reserves
Reserve for invested non-restricted equity The assets raised in the institutional and public offerings
and personnel offerings in 2017–2018 are entered in the
reserve for invested non-restricted equity. In addition, the
reserve for invested non-restricted equity includes the assets gained from issued shares in connection with
reorganisations in previous accounting periods and the
funds received from the directed share issue to Eurajoen Savings Bank in the ended financial year.
Retained earnings
Retained earnings are earnings accrued over the group’s
companies’ previous accounting periods that have not
been distributed as dividends to owners.
140 Parent company’s notes
Group’s notes
Signatures and audit report
Consolidated financial statements
Parent company’s financial statements
Fina
ncia
l Sta
tem
ents
202
1
Contents OmaSp in brief Corporate Governance Report of Board of Directors Financial
StatementsCorporate Social
Responsibility Report

123
P24 Shares and shareholder right
The number of shares is 29,62,033 in total (excluding own shares) and the number of votes per share is 1 vote / share. The shares do not have a nominal value.
Ownership December 31, 2021 Ownership December 31, 2020
Number of
shares % in shares Number of
shares % in shares South Karelia's Savings Bank Foundation 9,078,759 30.3 10,078,759 34.1 Parkano's Savings Bank Foundation 3,290,000 11.0 3,366,000 11.4 Töysä's Savings Bank Foundation 2,970,000 9.9 2,970,000 10.0 Kuortane's Savings Bank Foundation 1,920,000 6.4 1,960,000 6.6 Hauho's Savings Bank Foundation 1,649,980 5.5 1,680,000 5.7 Renko's Savings Bank Foundation 1,079,661 3.6 1,120,000 3.8 Suodennieme's Savings Bank Foundation 805,000 2.7 805,000 2.7 Elo Mutual Pension Insurance Company 788,405 2.6 788,405 2.7 Savolainen Heikki Antero* 777,158 2.6 - - Joroinen's Oma Cooperative 689,150 2.3 689,150 2.3 Varma Mutual Pension Insurance Company** - - 530,000 1.8 10 largest shareholders 23,048,113 76.9 23,987,314 81.1
Other 6,913,920 23.1 5,597,686 18.9 Total 29,962,033 100.0 29,585,000 100.0
*Savolainen Heikki Antero not among the 10 biggest owners on 31 December 2020 ** Varma Mutual Pension Insurance Company not among the 10 largest owners as of 31 December 2021
The company holds 188,155 shares on 31 December 2021. The company has no different share classes. All shares have equal dividend rights and other rights. On 30 March 2021, the Annual General Meeting authorised the Board of Directors to decide on the issue or transfer of the company's shares and on the issuance of special rights entitling to shares referred to in Chapter 10, Section 1 of the Finnish Companies Act. The number of shares to be issued under the authorisation, including shares to be received on the basis of special rights, may not exceed a total of 5,000,000 shares; and to decide on the repurchase of a maximum of 500,000 of the company's own shares with the company's unrestricted equity. The authorisations are valid until the end of the next Annual General Meeting, but not later than 30 June 2022. During the third quarter, the company launched a share repurchase program to implement a share-based incentive plan for key personnel. Under the repurchase program, it was possible to repurchase a maximum of 198,300 shares in one or more tranches, corresponding to approximately 0.7% of the company's shares and votes. The company repurchased a total of 176,455 of its own shares during the financial year.
On 21 September 2021, the Board of Directors decided to carry out a paid directed share issue. All the new shares of Oma Savings Bank Plc to be issued in the share issue, 553,488, were issued for subscription to Eurajoen Savings Bank as consideration for the transfer of the business on 30 November 2021.
141 Parent company’s notes
Group’s notes
Signatures and audit report
Consolidated financial statements
Parent company’s financial statements
Fina
ncia
l Sta
tem
ents
202
1
Contents OmaSp in brief Corporate Governance Report of Board of Directors Financial
StatementsCorporate Social
Responsibility Report
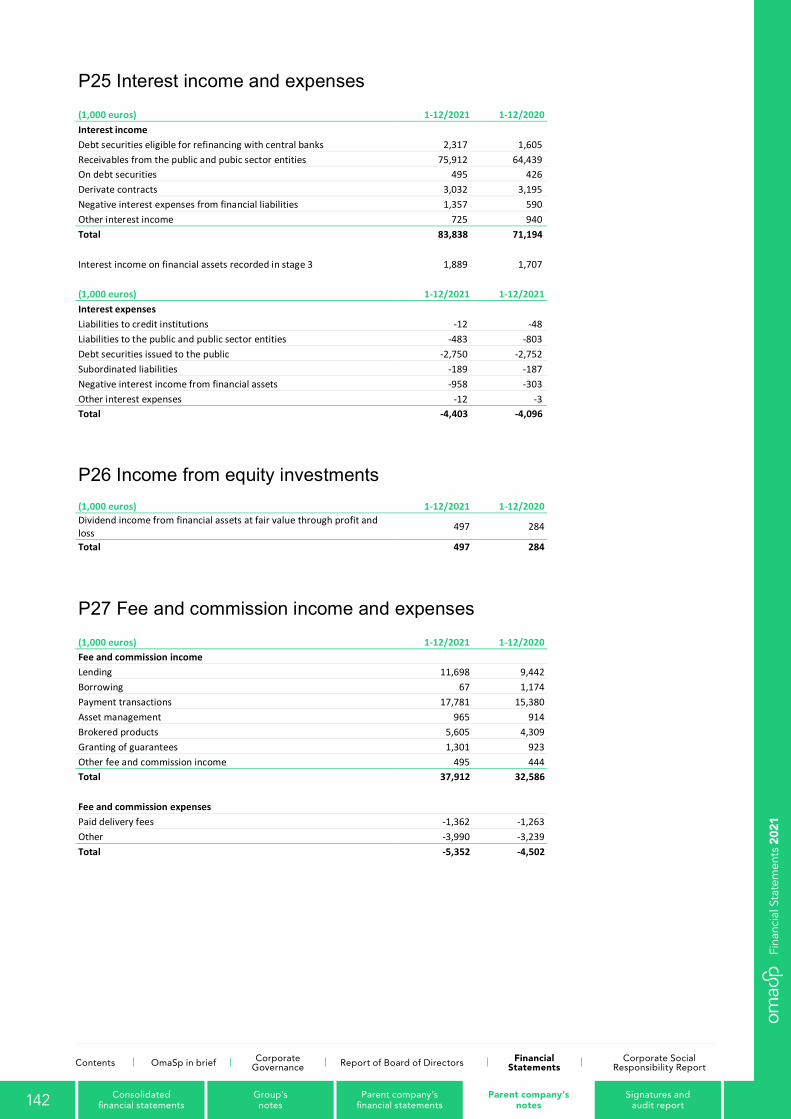
124
P25 Interest income and expenses (1,000 euros) 1-12/2021 1-12/2020 Interest income Debt securities eligible for refinancing with central banks 2,317 1,605 Receivables from the public and pubic sector entities 75,912 64,439 On debt securities 495 426 Derivate contracts 3,032 3,195 Negative interest expenses from financial liabilities 1,357 590 Other interest income 725 940 Total 83,838 71,194
Interest income on financial assets recorded in stage 3 1,889 1,707
(1,000 euros) 1-12/2021 1-12/2021 Interest expenses Liabilities to credit institutions -12 -48 Liabilities to the public and public sector entities -483 -803 Debt securities issued to the public -2,750 -2,752 Subordinated liabilities -189 -187 Negative interest income from financial assets -958 -303 Other interest expenses -12 -3 Total -4,403 -4,096
P26 Income from equity investments (1,000 euros) 1-12/2021 1-12/2020 Dividend income from financial assets at fair value through profit and loss
497 284
Total 497 284
P27 Fee and commission income and expenses (1,000 euros) 1-12/2021 1-12/2020 Fee and commission income Lending 11,698 9,442 Borrowing 67 1,174 Payment transactions 17,781 15,380 Asset management 965 914 Brokered products 5,605 4,309 Granting of guarantees 1,301 923 Other fee and commission income 495 444 Total 37,912 32,586
Fee and commission expenses Paid delivery fees -1,362 -1,263 Other -3,990 -3,239 Total -5,352 -4,502
142 Parent company’s notes
Group’s notes
Signatures and audit report
Consolidated financial statements
Parent company’s financial statements
Fina
ncia
l Sta
tem
ents
202
1
Contents OmaSp in brief Corporate Governance Report of Board of Directors Financial
StatementsCorporate Social
Responsibility Report
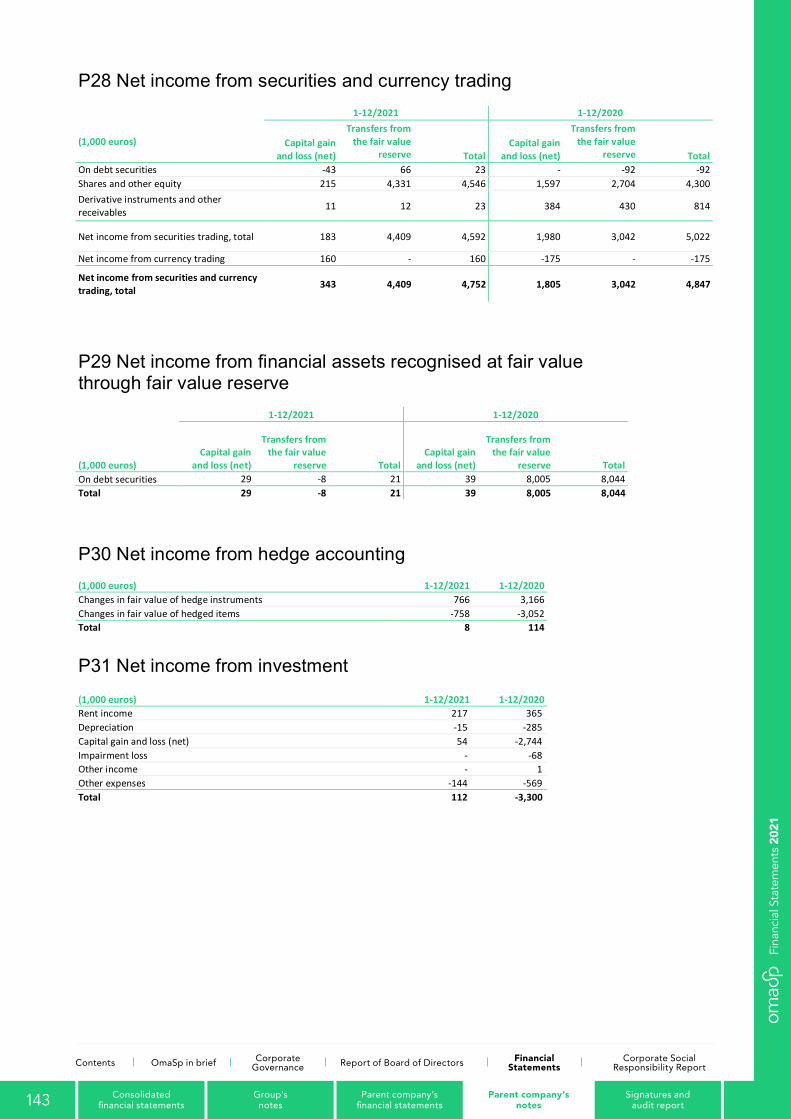
125
P28 Net income from securities and currency trading 1-12/2021 1-12/2020
(1,000 euros) Capital gain and loss (net)
Transfers from the fair value
reserve Total Capital gain
and loss (net)
Transfers from the fair value
reserve Total On debt securities -43 66 23 - -92 -92 Shares and other equity 215 4,331 4,546 1,597 2,704 4,300 Derivative instruments and other receivables 11 12 23 384 430 814
Net income from securities trading, total 183 4,409 4,592 1,980 3,042 5,022
Net income from currency trading 160 - 160 -175 - -175
Net income from securities and currency trading, total 343 4,409 4,752 1,805 3,042 4,847
P29 Net income from financial assets recognised at fair value through fair value reserve
1-12/2021 1-12/2020
(1,000 euros) Capital gain
and loss (net)
Transfers from the fair value
reserve Total Capital gain
and loss (net)
Transfers from the fair value
reserve Total On debt securities 29 -8 21 39 8,005 8,044 Total 29 -8 21 39 8,005 8,044
P30 Net income from hedge accounting (1,000 euros) 1-12/2021 1-12/2020 Changes in fair value of hedge instruments 766 3,166 Changes in fair value of hedged items -758 -3,052 Total 8 114
P31 Net income from investment
(1,000 euros) 1-12/2021 1-12/2020 Rent income 217 365 Depreciation -15 -285 Capital gain and loss (net) 54 -2,744 Impairment loss - -68 Other income - 1 Other expenses -144 -569 Total 112 -3,300
143 Parent company’s notes
Group’s notes
Signatures and audit report
Consolidated financial statements
Parent company’s financial statements
Fina
ncia
l Sta
tem
ents
202
1
Contents OmaSp in brief Corporate Governance Report of Board of Directors Financial
StatementsCorporate Social
Responsibility Report
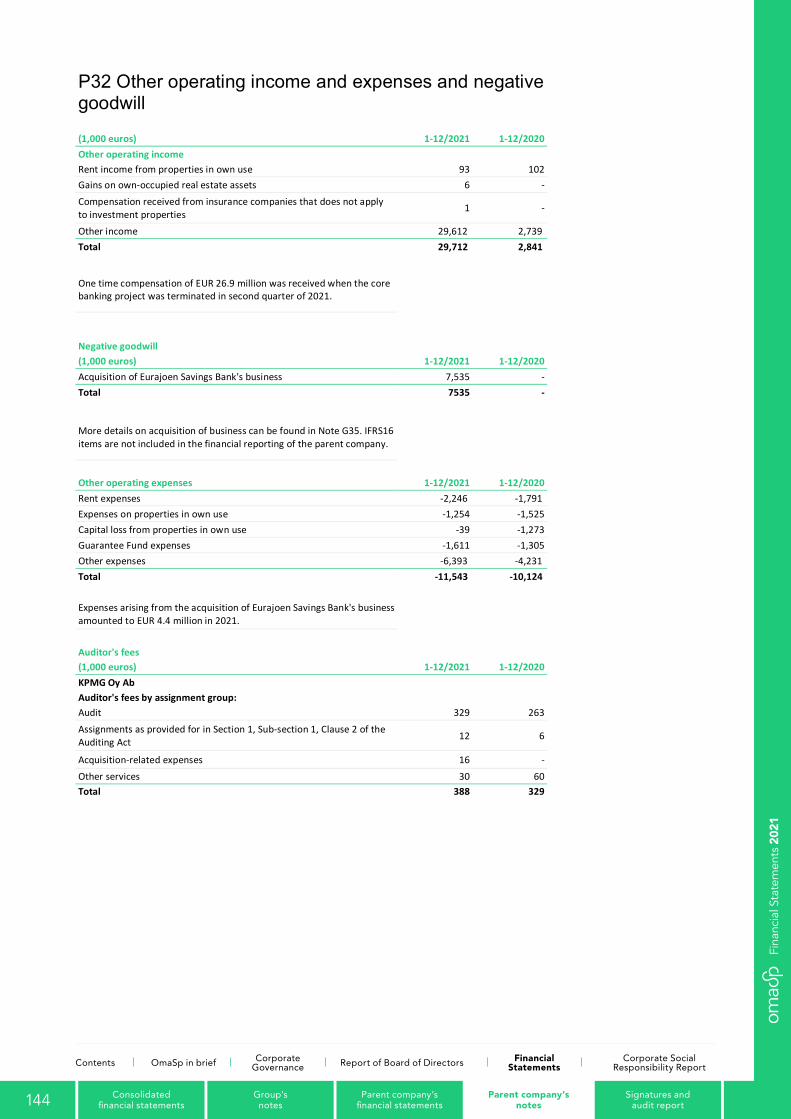
126
P32 Other operating income and expenses and negative goodwill
(1,000 euros) 1-12/2021 1-12/2020 Other operating income Rent income from properties in own use 93 102 Gains on own-occupied real estate assets 6 - Compensation received from insurance companies that does not apply to investment properties
1 -
Other income 29,612 2,739 Total 29,712 2,841
One time compensation of EUR 26.9 million was received when the core banking project was terminated in second quarter of 2021.
Negative goodwill (1,000 euros) 1-12/2021 1-12/2020 Acquisition of Eurajoen Savings Bank's business 7,535 - Total 7535 -
More details on acquisition of business can be found in Note G35. IFRS16 items are not included in the financial reporting of the parent company.
Other operating expenses 1-12/2021 1-12/2020 Rent expenses -2,246 -1,791 Expenses on properties in own use -1,254 -1,525 Capital loss from properties in own use -39 -1,273 Guarantee Fund expenses -1,611 -1,305 Other expenses -6,393 -4,231 Total -11,543 -10,124
Expenses arising from the acquisition of Eurajoen Savings Bank's business amounted to EUR 4.4 million in 2021.
Auditor's fees (1,000 euros) 1-12/2021 1-12/2020 KPMG Oy Ab Auditor's fees by assignment group: Audit 329 263 Assignments as provided for in Section 1, Sub-section 1, Clause 2 of the Auditing Act 12 6
Acquisition-related expenses 16 - Other services 30 60 Total 388 329
144 Parent company’s notes
Group’s notes
Signatures and audit report
Consolidated financial statements
Parent company’s financial statements
Fina
ncia
l Sta
tem
ents
202
1
Contents OmaSp in brief Corporate Governance Report of Board of Directors Financial
StatementsCorporate Social
Responsibility Report
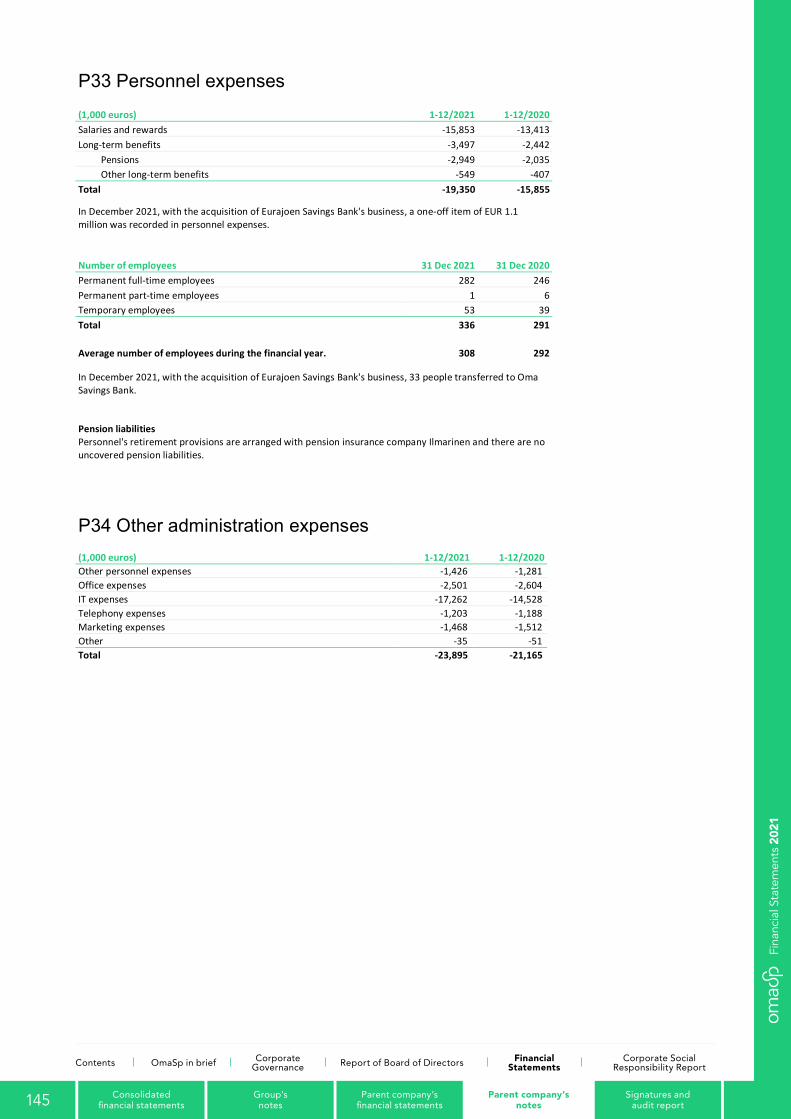
127
P33 Personnel expenses (1,000 euros) 1-12/2021 1-12/2020 Salaries and rewards -15,853 -13,413 Long-term benefits -3,497 -2,442
Pensions -2,949 -2,035 Other long-term benefits -549 -407 Total -19,350 -15,855
In December 2021, with the acquisition of Eurajoen Savings Bank's business, a one-off item of EUR 1.1 million was recorded in personnel expenses.
Number of employees 31 Dec 2021 31 Dec 2020 Permanent full-time employees 282 246 Permanent part-time employees 1 6 Temporary employees 53 39 Total 336 291
Average number of employees during the financial year. 308 292
In December 2021, with the acquisition of Eurajoen Savings Bank's business, 33 people transferred to Oma Savings Bank.
Pension liabilities Personnel's retirement provisions are arranged with pension insurance company Ilmarinen and there are no uncovered pension liabilities.
P34 Other administration expenses (1,000 euros) 1-12/2021 1-12/2020 Other personnel expenses -1,426 -1,281 Office expenses -2,501 -2,604 IT expenses -17,262 -14,528 Telephony expenses -1,203 -1,188 Marketing expenses -1,468 -1,512 Other -35 -51 Total -23,895 -21,165
145 Parent company’s notes
Group’s notes
Signatures and audit report
Consolidated financial statements
Parent company’s financial statements
Fina
ncia
l Sta
tem
ents
202
1
Contents OmaSp in brief Corporate Governance Report of Board of Directors Financial
StatementsCorporate Social
Responsibility Report
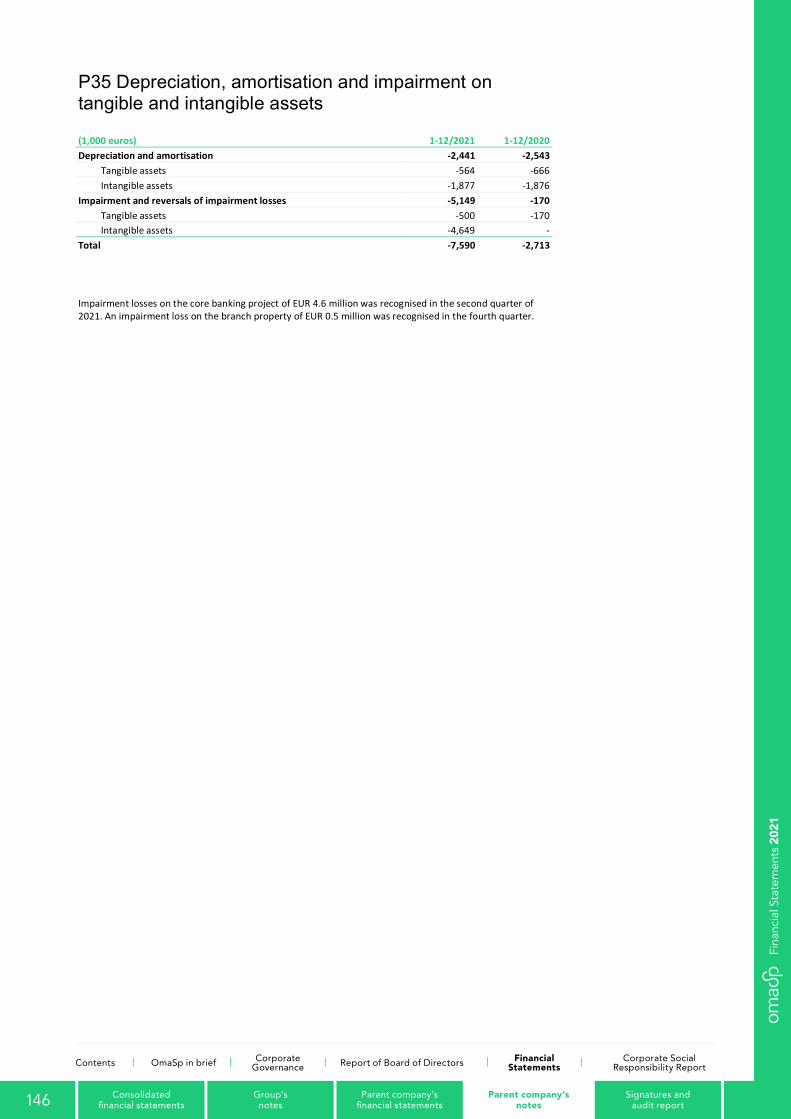
128
P35 Depreciation, amortisation and impairment on tangible and intangible assets
(1,000 euros) 1-12/2021 1-12/2020 Depreciation and amortisation -2,441 -2,543
Tangible assets -564 -666 Intangible assets -1,877 -1,876 Impairment and reversals of impairment losses -5,149 -170
Tangible assets -500 -170 Intangible assets -4,649 - Total -7,590 -2,713
Impairment losses on the core banking project of EUR 4.6 million was recognised in the second quarter of 2021. An impairment loss on the branch property of EUR 0.5 million was recognised in the fourth quarter.
146 Parent company’s notes
Group’s notes
Signatures and audit report
Consolidated financial statements
Parent company’s financial statements
Fina
ncia
l Sta
tem
ents
202
1
Contents OmaSp in brief Corporate Governance Report of Board of Directors Financial
StatementsCorporate Social
Responsibility Report
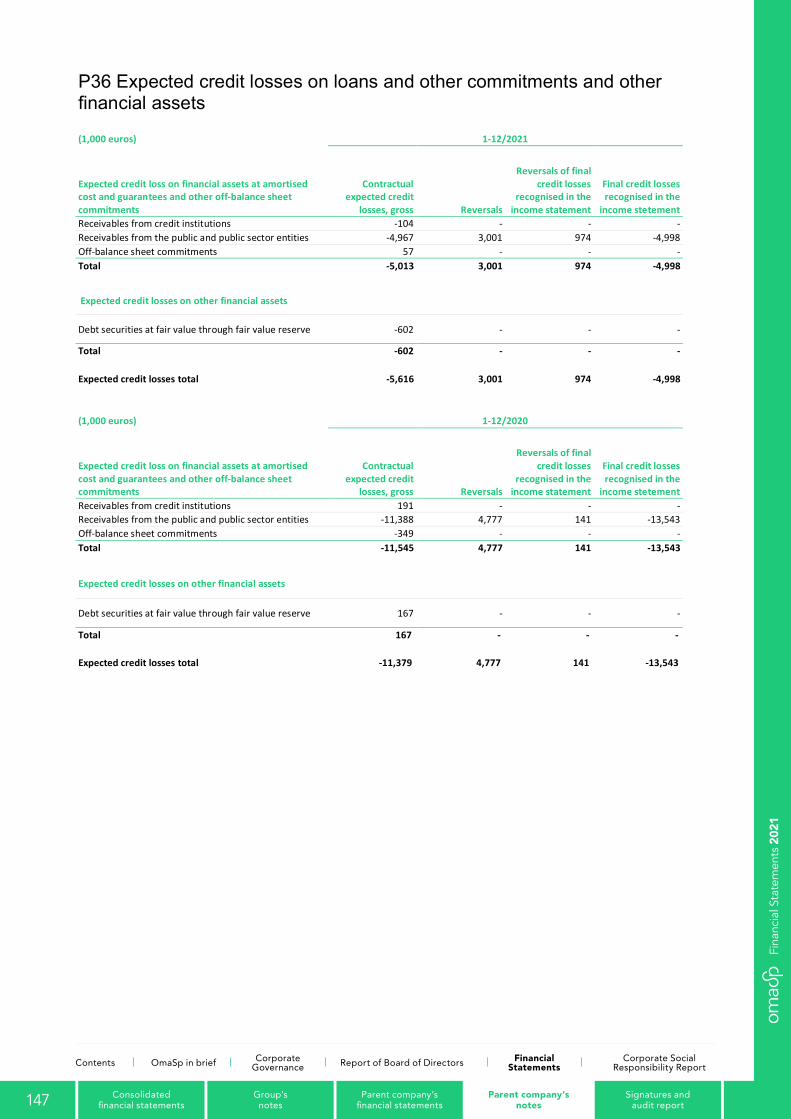
129
P36 Expected credit losses on loans and other commitments and other financial assets
(1,000 euros) 1-12/2021
Expected credit loss on financial assets at amortised cost and guarantees and other off-balance sheet commitments
Contractual expected credit
losses, gross Reversals
Reversals of final credit losses
recognised in the income statement
Final credit losses recognised in the
income stetement Receivables from credit institutions -104 - - - Receivables from the public and public sector entities -4,967 3,001 974 -4,998 Off-balance sheet commitments 57 - - - Total -5,013 3,001 974 -4,998
Expected credit losses on other financial assets
Debt securities at fair value through fair value reserve -602 - - -
Total -602 - - - Expected credit losses total -5,616 3,001 974 -4,998
(1,000 euros) 1-12/2020
Expected credit loss on financial assets at amortised cost and guarantees and other off-balance sheet commitments
Contractual expected credit
losses, gross Reversals
Reversals of final credit losses
recognised in the income statement
Final credit losses recognised in the
income stetement Receivables from credit institutions 191 - - - Receivables from the public and public sector entities -11,388 4,777 141 -13,543 Off-balance sheet commitments -349 - - - Total -11,545 4,777 141 -13,543
Expected credit losses on other financial assets
Debt securities at fair value through fair value reserve 167 - - -
Total 167 - - - Expected credit losses total -11,379 4,777 141 -13,543
147 Parent company’s notes
Group’s notes
Signatures and audit report
Consolidated financial statements
Parent company’s financial statements
Fina
ncia
l Sta
tem
ents
202
1
Contents OmaSp in brief Corporate Governance Report of Board of Directors Financial
StatementsCorporate Social
Responsibility Report
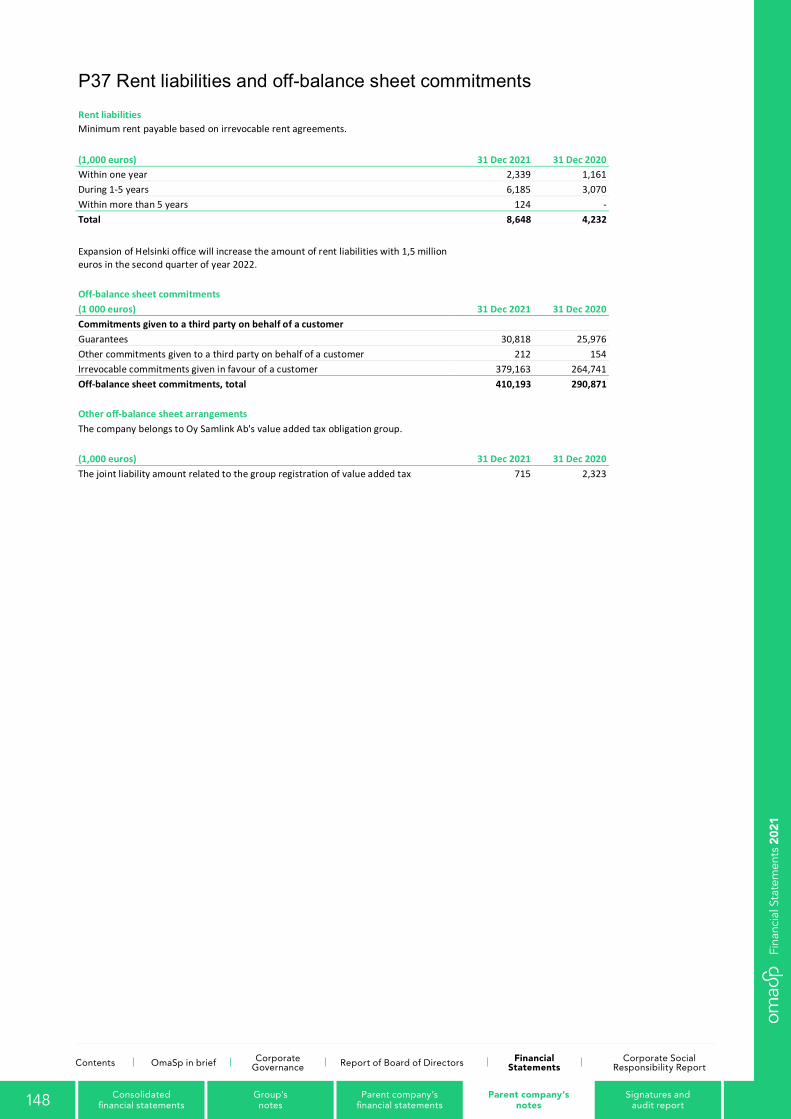
130
P37 Rent liabilities and off-balance sheet commitments Rent liabilities Minimum rent payable based on irrevocable rent agreements.
(1,000 euros) 31 Dec 2021 31 Dec 2020 Within one year 2,339 1,161 During 1-5 years 6,185 3,070 Within more than 5 years 124 - Total 8,648 4,232
Expansion of Helsinki office will increase the amount of rent liabilities with 1,5 million euros in the second quarter of year 2022.
Off-balance sheet commitments (1 000 euros) 31 Dec 2021 31 Dec 2020 Commitments given to a third party on behalf of a customer Guarantees 30,818 25,976 Other commitments given to a third party on behalf of a customer 212 154 Irrevocable commitments given in favour of a customer 379,163 264,741 Off-balance sheet commitments, total 410,193 290,871
Other off-balance sheet arrangements The company belongs to Oy Samlink Ab's value added tax obligation group.
(1,000 euros) 31 Dec 2021 31 Dec 2020 The joint liability amount related to the group registration of value added tax 715 2,323
148 Parent company’s notes
Group’s notes
Signatures and audit report
Consolidated financial statements
Parent company’s financial statements
Fina
ncia
l Sta
tem
ents
202
1
Contents OmaSp in brief Corporate Governance Report of Board of Directors Financial
StatementsCorporate Social
Responsibility Report
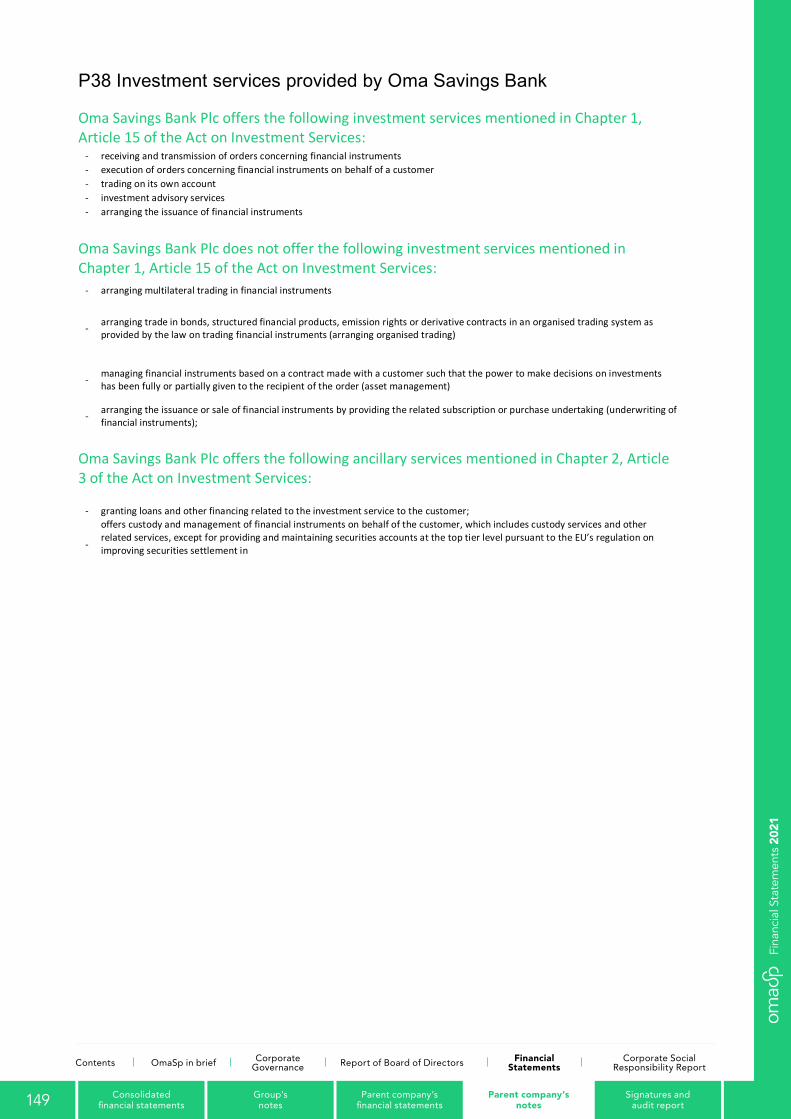
131
P38 Investment services provided by Oma Savings Bank
Oma Savings Bank Plc offers the following investment services mentioned in Chapter 1, Article 15 of the Act on Investment Services:
- receiving and transmission of orders concerning financial instruments - execution of orders concerning financial instruments on behalf of a customer - trading on its own account - investment advisory services - arranging the issuance of financial instruments
Oma Savings Bank Plc does not offer the following investment services mentioned in Chapter 1, Article 15 of the Act on Investment Services:
- arranging multilateral trading in financial instruments
- arranging trade in bonds, structured financial products, emission rights or derivative contracts in an organised trading system as provided by the law on trading financial instruments (arranging organised trading)
- managing financial instruments based on a contract made with a customer such that the power to make decisions on investments has been fully or partially given to the recipient of the order (asset management)
- arranging the issuance or sale of financial instruments by providing the related subscription or purchase undertaking (underwriting of financial instruments);
Oma Savings Bank Plc offers the following ancillary services mentioned in Chapter 2, Article 3 of the Act on Investment Services:
- granting loans and other financing related to the investment service to the customer;
-
offers custody and management of financial instruments on behalf of the customer, which includes custody services and other related services, except for providing and maintaining securities accounts at the top tier level pursuant to the EU’s regulation on improving securities settlement in
149 Parent company’s notes
Group’s notes
Signatures and audit report
Consolidated financial statements
Parent company’s financial statements
Fina
ncia
l Sta
tem
ents
202
1
Contents OmaSp in brief Corporate Governance Report of Board of Directors Financial
StatementsCorporate Social
Responsibility Report
132
Signatures on the Financial Statements and the Annual
Report
In Helsinki, 24 February 2022
OMA SAVINGS BANK PLC’S BOARD OF DIRECTORS
Jarmo Salmi Jyrki Mäkynen
Chairman of the Board Vice Chairman of the Board
Aila Hemminki Aki Jaskari Timo Kokkala
Jarmo Partanen Jaana Sandström Pasi Sydänlammi
CEO
Auditor’s Note
An audit report has been provided today. In Helsinki, 24 February 2022
KPMG Oy Ab
APA Fredrik Westerholm
150 Signatures and audit report
Contents OmaSp in brief Corporate Governance Report of Board of Directors Financial
StatementsCorporate Social
Responsibility Report
Group’s notes
Parent company’s notes
Consolidated financial statements
Parent company’s financial statements
Fina
ncia
l Sta
tem
ents
202
1
133
The document is an English translation of the Finnish auditor’s report. Only the Finnish version of the report is legally binding
Auditor’s Report
To the Annual General Meeting of Oma Savings Bank Plc
Report on the Audit of the Financial Statements Opinion We have audited the financial statements of Oma Savings Bank Plc (business identity code 2231936-2) for the year ended 31 December, 2021. The financial statements comprise the consolidated balance sheet, income statement, statement of comprehensive income, statement of changes in equity, statement of cash flows and notes, including a summary of significant accounting policies, as well as the parent company’s balance sheet, income statement, statement of cash flows and notes.
In our opinion
• the consolidated financial statements give a true and fair view of the group’s financial position, financial performance and cash flows in accordance with International Financial Reporting Standards (IFRS) as adopted by the EU
• the financial statements give a true and fair view of the parent company’s financial performance and financial position in accordance with the laws and regulations governing the preparation of financial statements in Finland and comply with statutory requirements.
Our opinion is consistent with the additional report submitted to the Board of Directors.
Basis for Opinion
We conducted our audit in accordance with good auditing practice in Finland. Our responsibilities under good auditing practice are further described in the Auditor’s Responsibilities for the Audit of the Financial Statements section of our report. We are independent of the parent company and of the group companies in accordance with the ethical requirements that are applicable in Finland and are relevant to our audit, and we have fulfilled our other ethical responsibilities in accordance with these requirements. In our best knowledge and understanding, the non-audit services that we have provided to the parent company and group companies are in compliance with laws and regulations applicable in Finland regarding these services, and we have not provided any prohibited non-audit services referred to in Article 5(1) of regulation (EU) 537/2014. The non-audit services that we have provided have been disclosed in note K22 to the consolidated financial statements. We believe that the audit evidence we have obtained is sufficient and appropriate to provide a basis for our opinion.
Materiality
The scope of our audit was influenced by our application of materiality. The materiality is determined based on our professional judgement and is used to determine the nature, timing and extent of our audit procedures and to evaluate the effect of identified misstatements on the financial statements as a whole. The level of materiality we set is based on our assessment of the magnitude of misstatements that, individually or in aggregate, could reasonably be expected to have influence on the economic decisions of the users of the financial statements. We have also taken into account misstatements and/or possible misstatements that in our opinion are material for qualitative reasons for the users of the financial statements
Key Audit Matters
Key audit matters are those matters that, in our professional judgment, were of most significance in our audit of the financial statements of the current period. These matters were addressed in the context of our audit of the financial statements as a whole, and in forming our opinion thereon, and we do not provide a separate opinion on these matters. The significant risks of material misstatement referred to in the EU Regulation No 537/2014 point (c) of Article 10(2) are included in the description of key audit matters below. We have also addressed the risk of management override of internal controls. This includes consideration of whether there was evidence of management bias that represented a risk of material misstatement due to fraud.
151 Signatures and audit report
Contents OmaSp in brief Corporate Governance Report of Board of Directors Financial
StatementsCorporate Social
Responsibility Report
Group’s notes
Parent company’s notes
Consolidated financial statements
Parent company’s financial statements
Fina
ncia
l Sta
tem
ents
202
1
134
The Key Audit Matter How the matter was addressed on the audit
Loans and advances to customers - valuation (Note K1 Accounting principles for the consolidated financial statements and notes K2, K5 and K24 to the consolidated financial statements)
• Loans and advances to the public and public sector entities, totalling EUR 4.326 million, is the most significant item on Oma Savings Bank Plc Group’s balance sheet, accounting for 81% of the consolidated total assets.
• Oma Savings Bank Plc applies IFRS 9 Financial Instruments to recognition of impairment losses on receivables and in calculating expected credit loss (ECL) using models in accordance with the standard.
• Calculation of expected credit losses involves
assumptions, estimates and management judgment, for example in determining the probability and amount of expected credit losses, value of any collaterals as well as the significant increases in credit risk
• Due to the significance of the carrying amount
involved, complexity of the accounting methods used for measurement purposes and management valuation judgements, valuation of loans and advances to customers are addressed as a key audit matter.
• We evaluated compliance with the lending instructions and assessed the appropriateness of the recognition and measurement principles, as well as tested controls over valuation of loan receivables and collaterals.
• We assessed the models and the key assumptions for
calculating expected credit losses, as well as tested the related controls over the calculation process.
• We considered the impacts of the COVID-19 pandemic on the credit risk position and the accounting for expected credit losses.
• Our IFRS and financial instruments specialists were involved in the audit.
• Furthermore, we considered the appropriateness of
the disclosures provided in respect of receivables and expected credit losses.
Control environment relating to financial reportind process and IT systems
• In respect of the accuracy of the financial statements of Oma Savings Bank Plc, the key reporting processes are dependent on information systems. Therefore, information technology plays an essential role for business continuity, incident management and the accuracy of financial reporting.
• The most significant risks relate to integrity of data, confidentiality and services disruptions.
• Consequently, the IT environment related to the
financial reporting process and the application controls of individual IT systems have a significant effect on the selected audit approach.
• We obtained an understanding of the IT systems related to financial reporting and the associated control environment and tested the effectiveness of the related internal controls. We also utilised assurance reports received from external service providers.
• As part of our audit we performed substantive procedures and data analyses relating to various aspects in the financial reporting process.
• We evaluated the correctness of accounting treatment
for the, during the financial year, terminated core banking project and the acquisition of Eurajoen Savings Bank´s business. In addition, we assessed the appropriateness of the disclosures on the business acquisition.
152 Signatures and audit report
Contents OmaSp in brief Corporate Governance Report of Board of Directors Financial
StatementsCorporate Social
Responsibility Report
Group’s notes
Parent company’s notes
Consolidated financial statements
Parent company’s financial statements
Fina
ncia
l Sta
tem
ents
202
1
135
Responsibilities of the Board of Directors and the Managing Director for the Financial Statements
The Board of Directors and the Managing Director are responsible for the preparation of consolidated financial statements that give a true and fair view in accordance with International Financial Reporting Standards (IFRS) as adopted by the EU, and of financial statements that give a true and fair view in accordance with the laws and regulations governing the preparation of financial statements in Finland and comply with statutory requirements. The Board of Directors and the Managing Director are also responsible for such internal control as they determine is necessary to enable the preparation of financial statements that are free from material misstatement, whether due to fraud or error. In preparing the financial statements, the Board of Directors and the Managing Director are responsible for assessing the parent company’s and the group’s ability to continue as a going concern, disclosing, as applicable, matters relating to going concern and using the going concern basis of accounting. The financial statements are prepared using the going concern basis of accounting unless there is an intention to liquidate the parent company or the group or cease operations, or there is no realistic alternative but to do so.
Auditor’s Responsibilities for the Audit of the Financial Statements
Our objectives are to obtain reasonable assurance about whether the financial statements as a whole are free from material misstatement, whether due to fraud or error, and to issue an auditor’s report that includes our opinion. Reasonable assurance is a high level of assurance but is not a guarantee that an audit conducted in accordance with good auditing practice will always detect a material misstatement when it exists. Misstatements can arise from fraud or error and are considered material if, individually or in the aggregate, they could reasonably be expected to influence the economic decisions of users taken on the basis of the financial statements. As part of an audit in accordance with good auditing practice, we exercise professional judgment and maintain professional skepticism throughout the audit. We also: • Identify and assess the risks of material misstatement of the financial statements, whether due to fraud or error,
design and perform audit procedures responsive to those risks, and obtain audit evidence that is sufficient and appropriate to provide a basis for our opinion. The risk of not detecting a material misstatement resulting from fraud is higher than for one resulting from error, as fraud may involve collusion, forgery, intentional omissions, misrepresentations, or the override of internal control.
• Obtain an understanding of internal control relevant to the audit in order to design audit procedures that are
appropriate in the circumstances, but not for the purpose of expressing an opinion on the effectiveness of the parent company’s or the group’s internal control.
• Evaluate the appropriateness of accounting policies used and the reasonableness of accounting estimates and
related disclosures made by management. • Conclude on the appropriateness of the Board of Directors’ and the Managing Director’s use of the going concern
basis of accounting and based on the audit evidence obtained, whether a material uncertainty exists related to events or conditions that may cast significant doubt on the parent company’s or the group’s ability to continue as a going concern. If we conclude that a material uncertainty exists, we are required to draw attention in our auditor’s report to the related disclosures in the financial statements or, if such disclosures are inadequate, to modify our opinion. Our conclusions are based on the audit evidence obtained up to the date of our auditor’s report. However, future events or conditions may cause the parent company or the group to cease to continue as a going concern.
• Evaluate the overall presentation, structure and content of the financial statements, including the disclosures, and
whether the financial statements represent the underlying transactions and events so that the financial statements give a true and fair view.
• Obtain sufficient appropriate audit evidence regarding the financial information of the entities or business activities
within the group to express an opinion on the consolidated financial statements. We are responsible for the direction, supervision and performance of the group audit. We remain solely responsible for our audit opinion.
We communicate with those charged with governance regarding, among other matters, the planned scope and timing of the audit and significant audit findings, including any significant deficiencies in internal control that we identify during our audit. We also provide those charged with governance with a statement that we have complied with relevant ethical requirements regarding independence, and communicate with them all relationships and other matters that may reasonably be thought to bear on our independence, and where applicable, related safeguards.
153 Signatures and audit report
Contents OmaSp in brief Corporate Governance Report of Board of Directors Financial
StatementsCorporate Social
Responsibility Report
Group’s notes
Parent company’s notes
Consolidated financial statements
Parent company’s financial statements
Fina
ncia
l Sta
tem
ents
202
1
136
From the matters communicated with those charged with governance, we determine those matters that were of most significance in the audit of the financial statements of the current period and are therefore the key audit matters. We describe these matters in our auditor’s report unless law or regulation precludes public disclosure about the matter or when, in extremely rare circumstances, we determine that a matter should not be communicated in our report because the adverse consequences of doing so would reasonably be expected to outweigh the public interest benefits of such communication
Other Reporting Requirements Information on our audit engagement
We were first appointed as auditors by the Annual General Meeting on April 9, 2016, and our appointment represents a total period of uninterrupted engagement of six years.
Other Information
The Board of Directors and the Managing Director are responsible for the other information. The other information comprises the report of the Board of Directors and the information included in the Annual Report, but does not include the financial statements and our auditor’s report thereon. We have obtained the report of the Board of Directors prior to the date of this auditor’s report, and the Annual Report is expected to be made available to us after that date. Our opinion on the financial statements does not cover the other information. In connection with our audit of the financial statements, our responsibility is to read the other information identified above and, in doing so, consider whether the other information is materially inconsistent with the financial statements or our knowledge obtained in the audit, or otherwise appears to be materially misstated. With respect to the report of the Board of Directors, our responsibility also includes considering whether the report of the Board of Directors has been prepared in accordance with the applicable laws and regulations. In our opinion, the information in the report of the Board of Directors is consistent with the information in the financial statements and the report of the Board of Directors has been prepared in accordance with the applicable laws and regulations. If, based on the work we have performed on the other information that we obtained prior to the date of this auditor’s report, we conclude that there is a material misstatement of this other information, we are required to report that fact. We have nothing to report in this regard.
Helsinki, 24 February 2022
KPMG OY AB
FREDRIK WESTERHOLM Authorised Public Accountant, KHT
154 Signatures and audit report
Contents OmaSp in brief Corporate Governance Report of Board of Directors Financial
StatementsCorporate Social
Responsibility Report
Group’s notes
Parent company’s notes
Consolidated financial statements
Parent company’s financial statements
Fina
ncia
l Sta
tem
ents
202
1

Corporate Social Responsibility Report2021
ContentsOmaSp's Corporate Social Responsibility Report 157
Starting points for sustainability efforts 159
Value chain and operating environment 159
Megatrends affecting the operating environment 161
Values and Code of Conduct 162
Stakeholder co-operation 163
Sustainability programme 164
Sustainability themes 164
Responsibility reporting 165
Sustainability targets 166
UN Sustainable Development Goals 167
We are local and close to the customer 168
We take care of our personnel 170
We promote collective well-being 172
We contribute to sustainable development 174
Survey of impacts and risks related to climate change 176
Impacts of climate change on Oma Savings Bank’s operations 176
Risks and opportunities of climate change 177
Climate impacts of operations 179
Description of risks and opportunities, and measures to mitigate them 180
Carbon Footprint Report 2021 181
What is a carbon footprint? 181
Oma Savings Bank's carbon footprint formation 182
Baseline data, assumptions and limitations 183
Total carbon footprint 185
Carbon footprint by emission source 187
Carbon footprint comparison 190
156
Cor
por
ate
Soci
al R
esp
ons
ibili
ty R
epor
t 20
21
Contents OmaSp in brief Corporate Governance Report of Board of Directors Financial
StatementsCorporate Social
Responsibility Report
Corporate Social Responsibility Report Survey of impacts and risks related to climate change Carbon Footprint Report
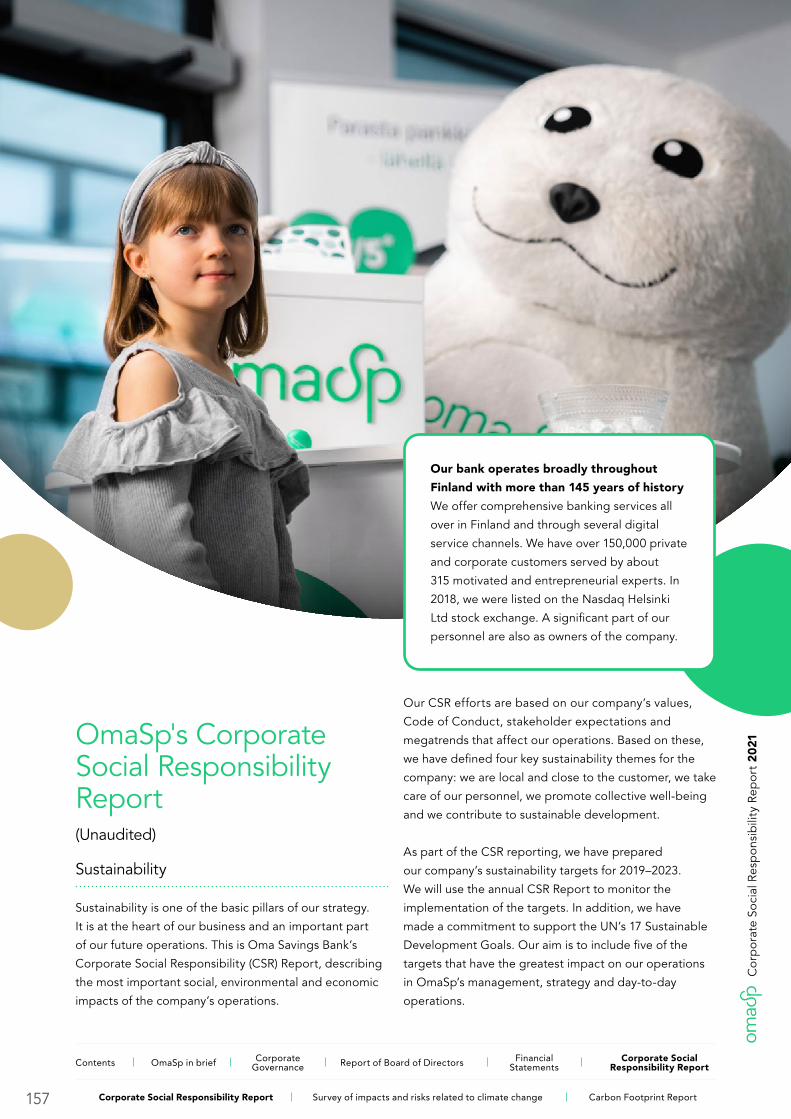
OmaSp's Corporate Social Responsibility Report(Unaudited)
Sustainability
Sustainability is one of the basic pillars of our strategy.
It is at the heart of our business and an important part
of our future operations. This is Oma Savings Bank’s
Corporate Social Responsibility (CSR) Report, describing
the most important social, environmental and economic
impacts of the company’s operations.
Our CSR efforts are based on our company’s values,
Code of Conduct, stakeholder expectations and
megatrends that affect our operations. Based on these,
we have defined four key sustainability themes for the
company: we are local and close to the customer, we take
care of our personnel, we promote collective well-being
and we contribute to sustainable development.
As part of the CSR reporting, we have prepared
our company’s sustainability targets for 2019–2023.
We will use the annual CSR Report to monitor the
implementation of the targets. In addition, we have
made a commitment to support the UN’s 17 Sustainable
Development Goals. Our aim is to include five of the
targets that have the greatest impact on our operations
in OmaSp’s management, strategy and day-to-day
operations.
Our bank operates broadly throughout
Finland with more than 145 years of history
We offer comprehensive banking services all
over in Finland and through several digital
service channels. We have over 150,000 private
and corporate customers served by about
315 motivated and entrepreneurial experts. In
2018, we were listed on the Nasdaq Helsinki
Ltd stock exchange. A significant part of our
personnel are also as owners of the company.
157
Cor
por
ate
Soci
al R
esp
ons
ibili
ty R
epor
t 20
21
Contents OmaSp in brief Corporate Governance Report of Board of Directors Financial
StatementsCorporate Social
Responsibility Report
Corporate Social Responsibility Report Survey of impacts and risks related to climate change Carbon Footprint Report
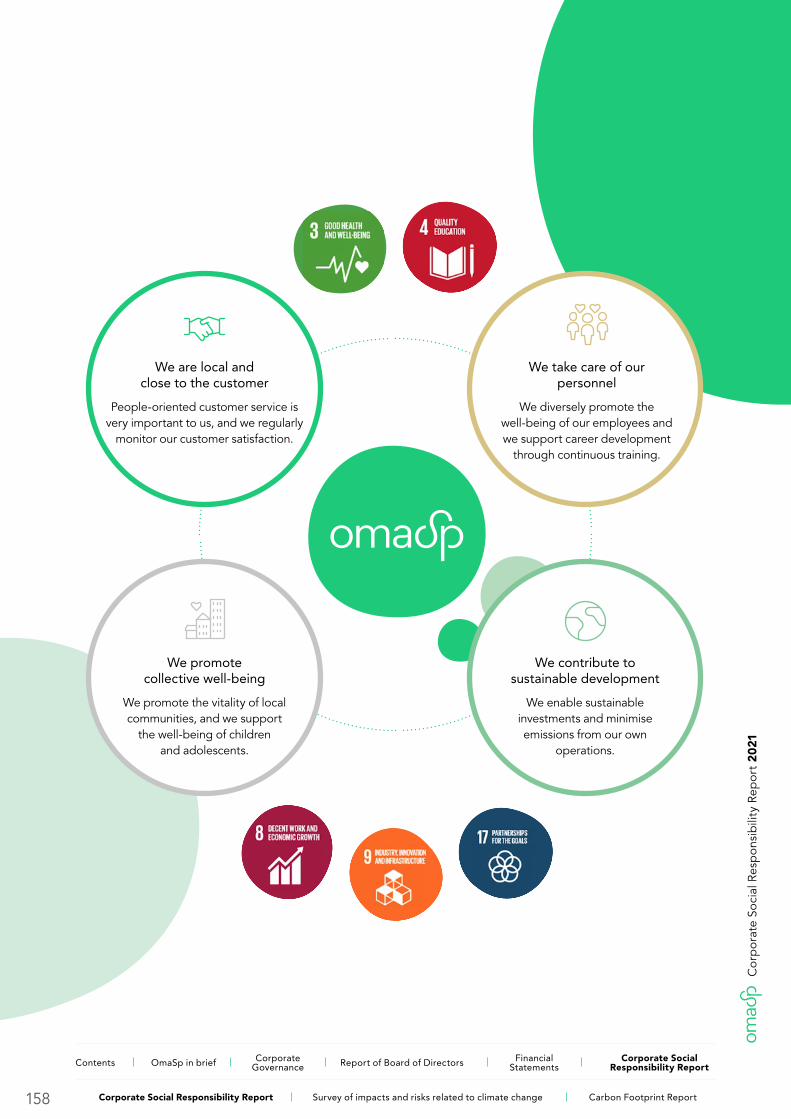
We are local and close to the customer
People-oriented customer service is very important to us, and we regularly
monitor our customer satisfaction.
We promote collective well-being
We promote the vitality of local communities, and we support
the well-being of children and adolescents.
We take care of our personnel
We diversely promote the well-being of our employees and we support career development
through continuous training.
We contribute to sustainable development
We enable sustainable investments and minimise emissions from our own
operations.
158
Cor
por
ate
Soci
al R
esp
ons
ibili
ty R
epor
t 20
21
Contents OmaSp in brief Corporate Governance Report of Board of Directors Financial
StatementsCorporate Social
Responsibility Report
Corporate Social Responsibility Report Survey of impacts and risks related to climate change Carbon Footprint Report

Starting points for sustainability efforts
Value chain and operating environment
Sustainability in the financial sector means complying
with the common practices, laws, regulations and
sustainable development principles that govern the
sector. The idea is to bear responsibility for economic
and social stability, as well as for the climate and the
environment.
The financial sector has played an important role in
building well-being in Finland. It guarantees a stable
society and basic security for citizens. At OmaSp,
we also have an impact on society, people and the
environment, both directly and indirectly. We have
identified these impacts, and we take them into
account in every stage of our value chain.
We contribute to producing direct basic services and
opportunities for citizens, companies and organisations.
Our efforts have an impact both locally and nationwide.
Promoting the financial literacy of young people is one
of the financial sector’s most important sustainability
themes – and it is for us, too. We also have a
significant role in steering financing toward sustainable
development targets.
At the heart of our strategy is satisfied customers.
Our goal is to achieve the highest level of customer
satisfaction in the sector, and we are getting there by
being present in our customers’ lives. Our efforts are
boosted by our enterprising and motivated personnel.
We know that when it comes to responsible and
sustainable operations, taking stakeholders into account
brings a considerable competitive advantage. That is
why we are strongly committed to our customers, our
personnel and our operating environment. We strive to
take the interests of all our stakeholders into account
in our operations. In this way, we are contributing to
building an economically, socially and environmentally
sustainable society.
159
Cor
por
ate
Soci
al R
esp
ons
ibili
ty R
epor
t 20
21
Contents OmaSp in brief Corporate Governance Report of Board of Directors Financial
StatementsCorporate Social
Responsibility Report
Corporate Social Responsibility Report Survey of impacts and risks related to climate change Carbon Footprint Report

Excellent service experience
Ente
rpris
ing
and
mot
ivat
ed p
erso
nnel
Satis
fi ed
cust
omer
Customer orientation
Sustainability
Impacts on society
Impacts on the environment
Impacts on people
Planning and producing services
Equal treatment of personnel
Personnel’s well-being and satisfaction
Developing personnel’s competence
Borrowing
Ethical business operations
Financial profitability and payment of taxes and
dividends
Investing assets and
lendingEmissions: waste and carbon footprint
Financial solutions to promote sustainability
Financial solutions to increase vitality
Responsibility of partners
Sales and marketing of
services
Customer satisfaction: People-oriented customer
service and a comprehensive service offering
Environmental impacts of purchases
Use of products and
services
Promoting well-being in children and adolescents and teaching
financial literacy
160
Cor
por
ate
Soci
al R
esp
ons
ibili
ty R
epor
t 20
21
Contents OmaSp in brief Corporate Governance Report of Board of Directors Financial
StatementsCorporate Social
Responsibility Report
Corporate Social Responsibility Report Survey of impacts and risks related to climate change Carbon Footprint Report
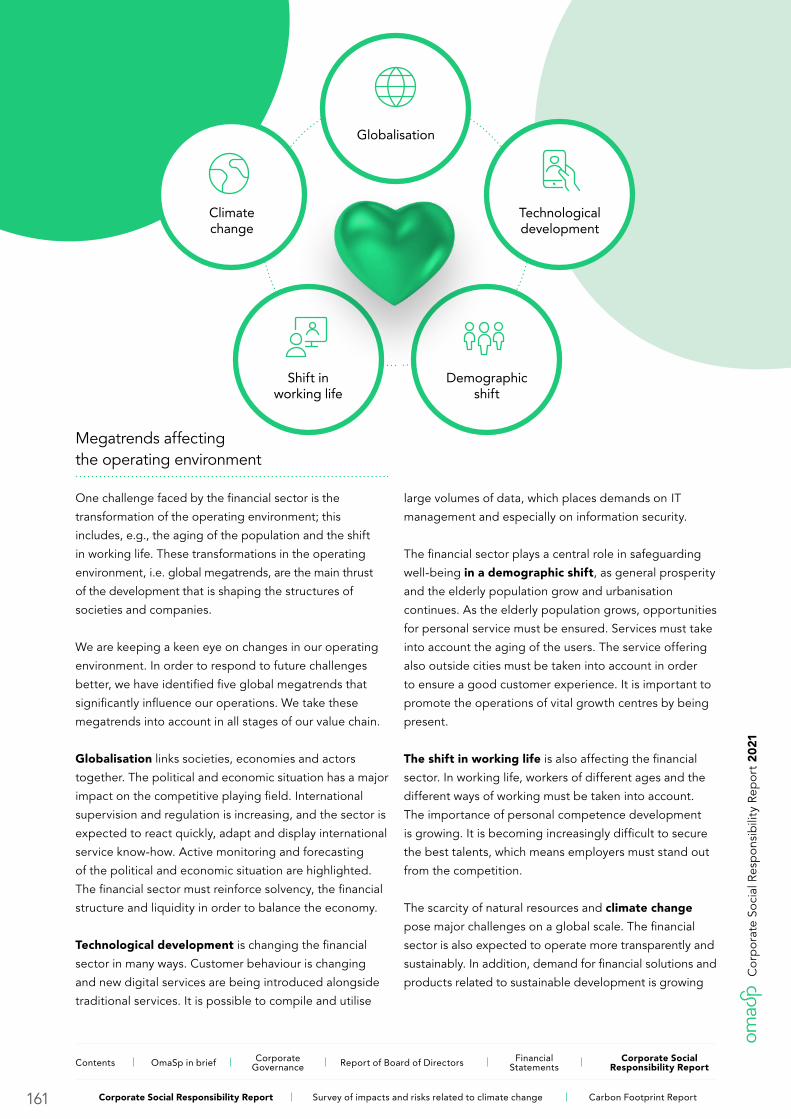
Megatrends affecting the operating environment
One challenge faced by the financial sector is the
transformation of the operating environment; this
includes, e.g., the aging of the population and the shift
in working life. These transformations in the operating
environment, i.e. global megatrends, are the main thrust
of the development that is shaping the structures of
societies and companies.
We are keeping a keen eye on changes in our operating
environment. In order to respond to future challenges
better, we have identified five global megatrends that
significantly influence our operations. We take these
megatrends into account in all stages of our value chain.
Globalisation links societies, economies and actors
together. The political and economic situation has a major
impact on the competitive playing field. International
supervision and regulation is increasing, and the sector is
expected to react quickly, adapt and display international
service know-how. Active monitoring and forecasting
of the political and economic situation are highlighted.
The financial sector must reinforce solvency, the financial
structure and liquidity in order to balance the economy.
Technological development is changing the financial
sector in many ways. Customer behaviour is changing
and new digital services are being introduced alongside
traditional services. It is possible to compile and utilise
large volumes of data, which places demands on IT
management and especially on information security.
The financial sector plays a central role in safeguarding
well-being in a demographic shift, as general prosperity
and the elderly population grow and urbanisation
continues. As the elderly population grows, opportunities
for personal service must be ensured. Services must take
into account the aging of the users. The service offering
also outside cities must be taken into account in order
to ensure a good customer experience. It is important to
promote the operations of vital growth centres by being
present.
The shift in working life is also affecting the financial
sector. In working life, workers of different ages and the
different ways of working must be taken into account.
The importance of personal competence development
is growing. It is becoming increasingly difficult to secure
the best talents, which means employers must stand out
from the competition.
The scarcity of natural resources and climate change
pose major challenges on a global scale. The financial
sector is also expected to operate more transparently and
sustainably. In addition, demand for financial solutions and
products related to sustainable development is growing
Climate change
Globalisation
Technological development
Demographic shift
Shift in working life
161
Cor
por
ate
Soci
al R
esp
ons
ibili
ty R
epor
t 20
21
Contents OmaSp in brief Corporate Governance Report of Board of Directors Financial
StatementsCorporate Social
Responsibility Report
Corporate Social Responsibility Report Survey of impacts and risks related to climate change Carbon Footprint Report
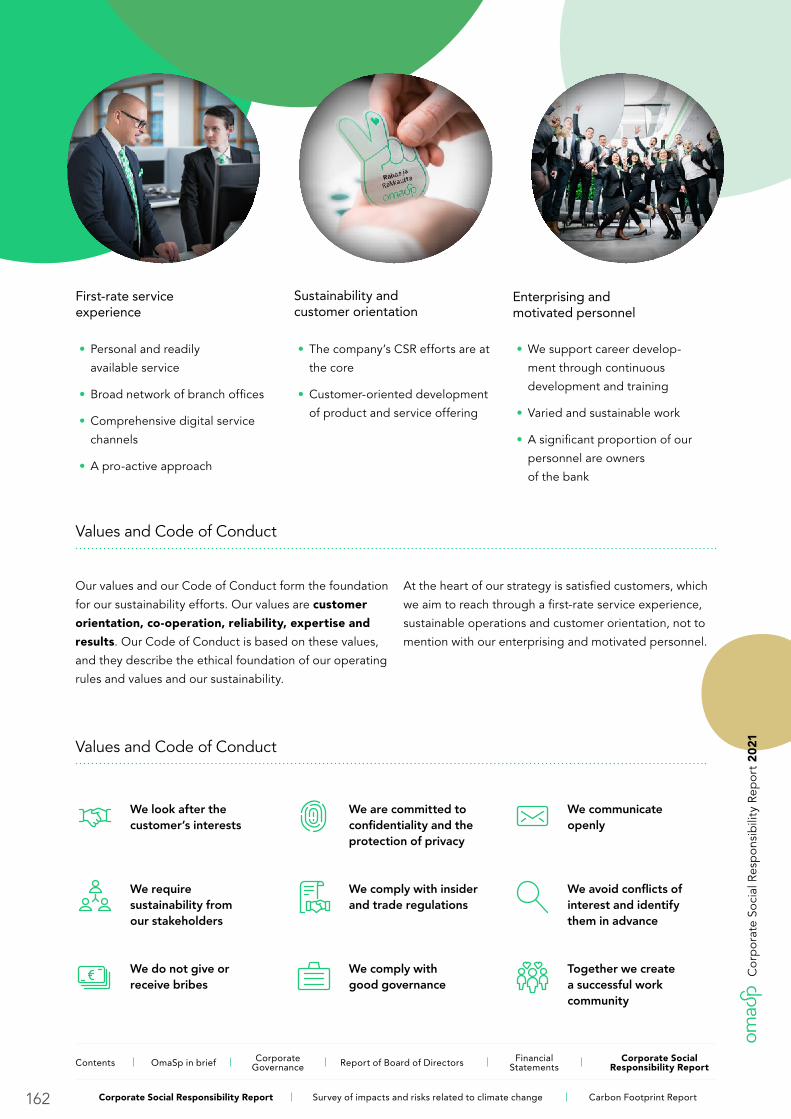
First-rate service experience
• Personal and readily
available service
• Broad network of branch offices
• Comprehensive digital service
channels
• A pro-active approach
Sustainability and customer orientation
• The company’s CSR efforts are at
the core
• Customer-oriented development
of product and service offering
Enterprising and motivated personnel
• We support career develop-
ment through continuous
development and training
• Varied and sustainable work
• A significant proportion of our
personnel are owners
of the bank
Values and Code of Conduct
Our values and our Code of Conduct form the foundation
for our sustainability efforts. Our values are customer
orientation, co-operation, reliability, expertise and
results. Our Code of Conduct is based on these values,
and they describe the ethical foundation of our operating
rules and values and our sustainability.
At the heart of our strategy is satisfied customers, which
we aim to reach through a first-rate service experience,
sustainable operations and customer orientation, not to
mention with our enterprising and motivated personnel.
Values and Code of Conduct
We look after the customer’s interests
We are committed to confidentiality and the protection of privacy
We communicate openly
We require sustainability from our stakeholders
We comply with insider and trade regulations
We avoid conflicts of interest and identify them in advance
We do not give or receive bribes
We comply with good governance
Together we create a successful work community
162
Cor
por
ate
Soci
al R
esp
ons
ibili
ty R
epor
t 20
21
Contents OmaSp in brief Corporate Governance Report of Board of Directors Financial
StatementsCorporate Social
Responsibility Report
Corporate Social Responsibility Report Survey of impacts and risks related to climate change Carbon Footprint Report
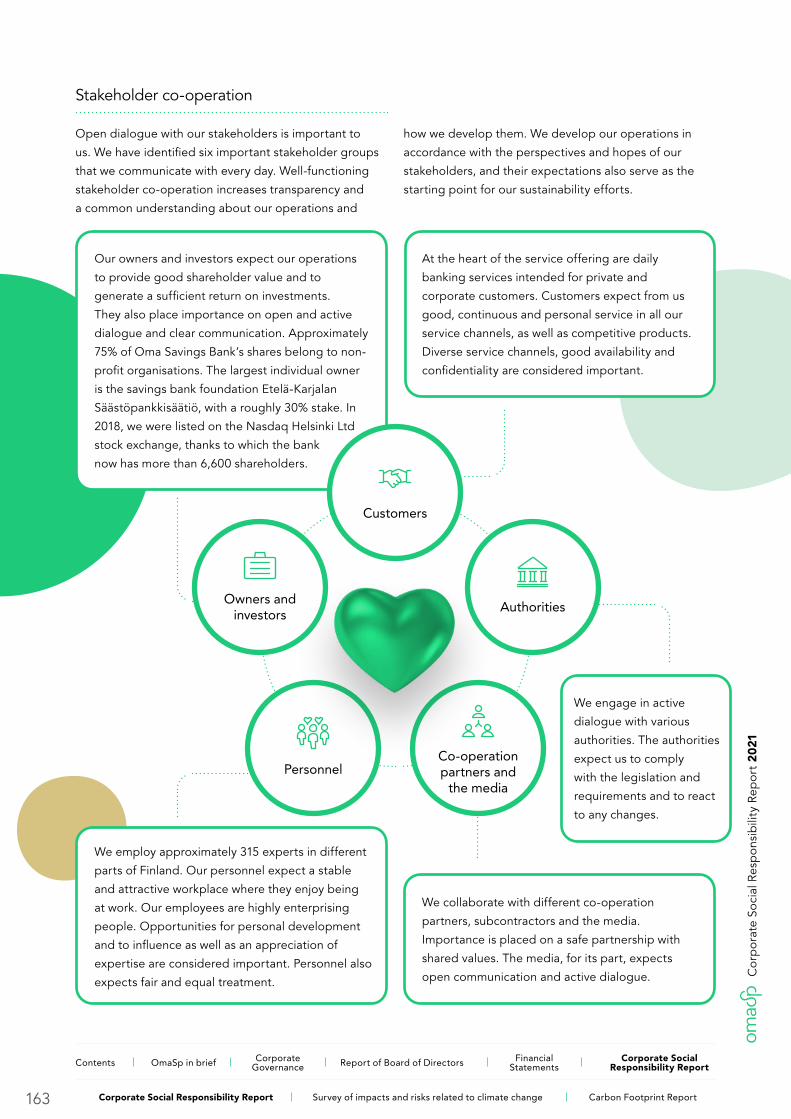
Stakeholder co-operation
Open dialogue with our stakeholders is important to
us. We have identified six important stakeholder groups
that we communicate with every day. Well-functioning
stakeholder co-operation increases transparency and
a common understanding about our operations and
how we develop them. We develop our operations in
accordance with the perspectives and hopes of our
stakeholders, and their expectations also serve as the
starting point for our sustainability efforts.
Customers
At the heart of the service offering are daily
banking services intended for private and
corporate customers. Customers expect from us
good, continuous and personal service in all our
service channels, as well as competitive products.
Diverse service channels, good availability and
confidentiality are considered important.
Authorities
We engage in active
dialogue with various
authorities. The authorities
expect us to comply
with the legislation and
requirements and to react
to any changes.
Co-operation partners and
the media
We collaborate with different co-operation
partners, subcontractors and the media.
Importance is placed on a safe partnership with
shared values. The media, for its part, expects
open communication and active dialogue.
Personnel
We employ approximately 315 experts in different
parts of Finland. Our personnel expect a stable
and attractive workplace where they enjoy being
at work. Our employees are highly enterprising
people. Opportunities for personal development
and to influence as well as an appreciation of
expertise are considered important. Personnel also
expects fair and equal treatment.
Owners and investors
Our owners and investors expect our operations
to provide good shareholder value and to
generate a sufficient return on investments.
They also place importance on open and active
dialogue and clear communication. Approximately
75% of Oma Savings Bank’s shares belong to non-
profit organisations. The largest individual owner
is the savings bank foundation Etelä-Karjalan
Säästöpankkisäätiö, with a roughly 30% stake. In
2018, we were listed on the Nasdaq Helsinki Ltd
stock exchange, thanks to which the bank
now has more than 6,600 shareholders.
163
Cor
por
ate
Soci
al R
esp
ons
ibili
ty R
epor
t 20
21
Contents OmaSp in brief Corporate Governance Report of Board of Directors Financial
StatementsCorporate Social
Responsibility Report
Corporate Social Responsibility Report Survey of impacts and risks related to climate change Carbon Footprint Report
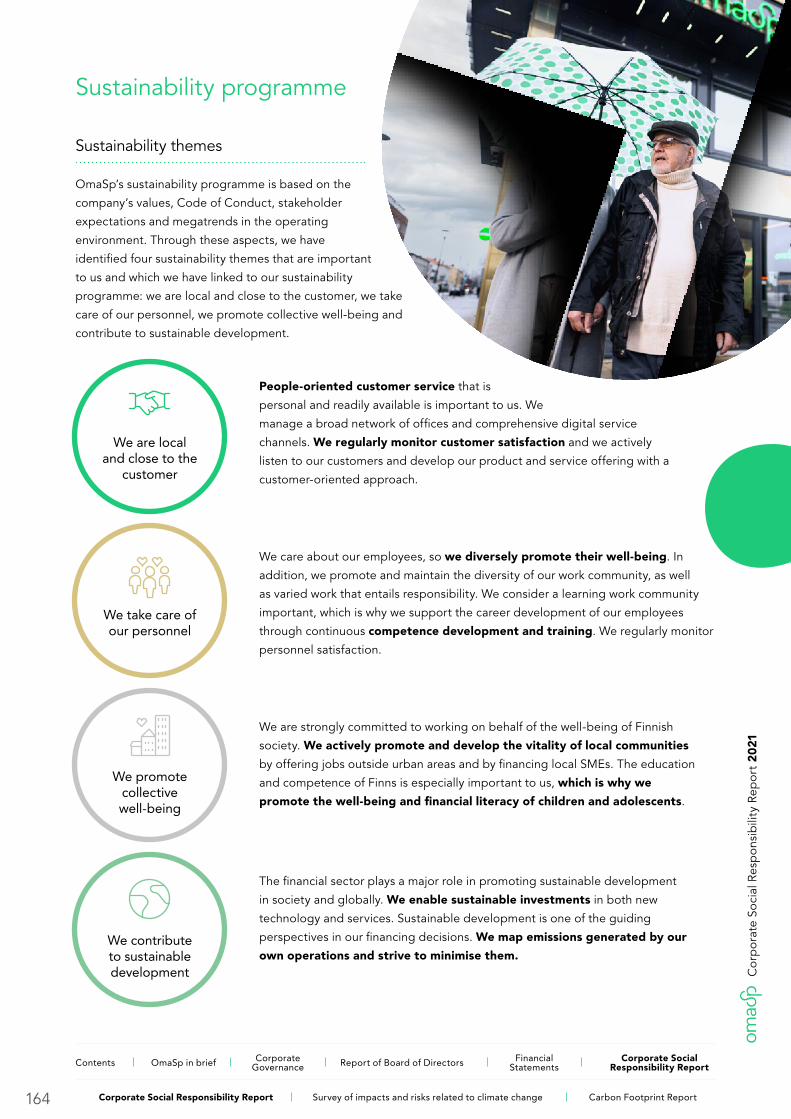
Sustainability programme
Sustainability themes
OmaSp’s sustainability programme is based on the
company’s values, Code of Conduct, stakeholder
expectations and megatrends in the operating
environment. Through these aspects, we have
identified four sustainability themes that are important
to us and which we have linked to our sustainability
programme: we are local and close to the customer, we take
care of our personnel, we promote collective well-being and
contribute to sustainable development.
We are local and close to the
customer
People-oriented customer service that is
personal and readily available is important to us. We
manage a broad network of offices and comprehensive digital service
channels. We regularly monitor customer satisfaction and we actively
listen to our customers and develop our product and service offering with a
customer-oriented approach.
We take care of our personnel
We care about our employees, so we diversely promote their well-being. In
addition, we promote and maintain the diversity of our work community, as well
as varied work that entails responsibility. We consider a learning work community
important, which is why we support the career development of our employees
through continuous competence development and training. We regularly monitor
personnel satisfaction.
We promote collective well-being
We are strongly committed to working on behalf of the well-being of Finnish
society. We actively promote and develop the vitality of local communities
by offering jobs outside urban areas and by financing local SMEs. The education
and competence of Finns is especially important to us, which is why we
promote the well-being and financial literacy of children and adolescents.
We contribute to sustainable development
The financial sector plays a major role in promoting sustainable development
in society and globally. We enable sustainable investments in both new
technology and services. Sustainable development is one of the guiding
perspectives in our financing decisions. We map emissions generated by our
own operations and strive to minimise them.
164
Cor
por
ate
Soci
al R
esp
ons
ibili
ty R
epor
t 20
21
Contents OmaSp in brief Corporate Governance Report of Board of Directors Financial
StatementsCorporate Social
Responsibility Report
Corporate Social Responsibility Report Survey of impacts and risks related to climate change Carbon Footprint Report
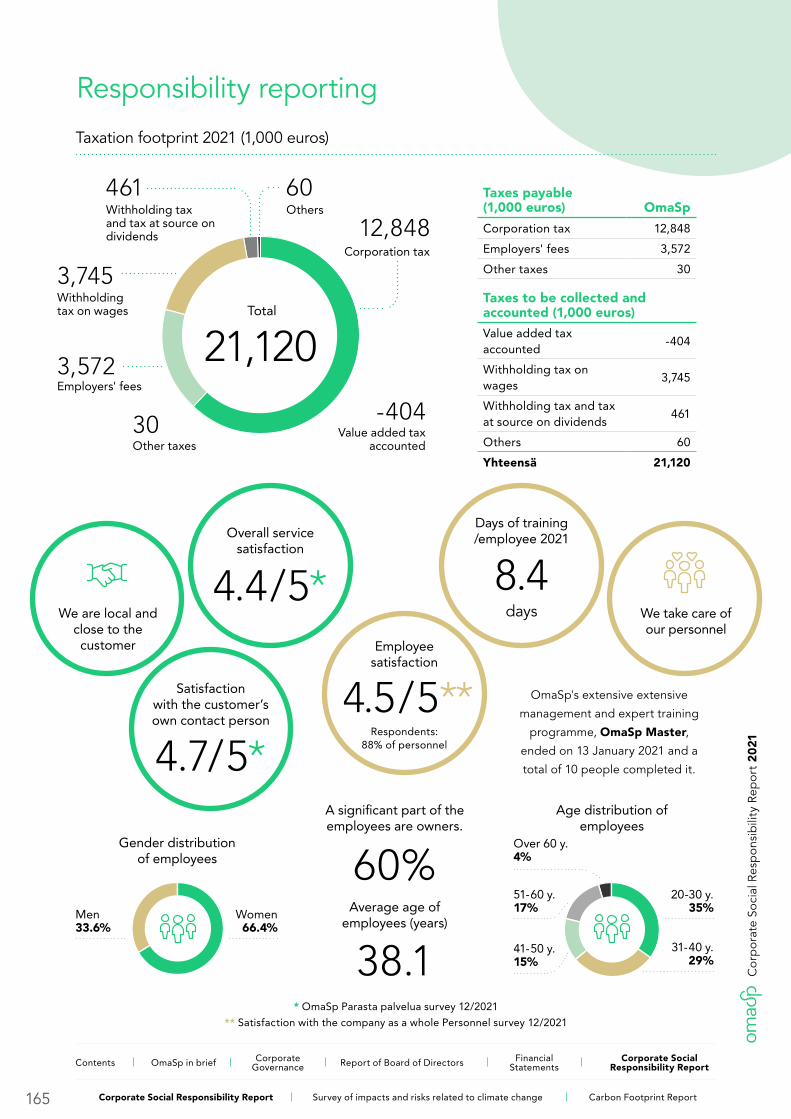
Responsibility reporting
Taxation footprint 2021 (1,000 euros)
Total
21,120
Corporation tax
12,848
Employers' fees3,572
Other taxes30 Value added tax
accounted
-404
Withholding tax on wages
3,745
Withholding tax and tax at source on dividends
461Others
60 Taxes payable (1,000 euros) OmaSp
Corporation tax 12,848
Employers' fees 3,572
Other taxes 30
Taxes to be collected and accounted (1,000 euros)
Value added tax accounted
-404
Withholding tax on wages
3,745
Withholding tax and tax at source on dividends
461
Others 60
Yhteensä 21,120
Overall service satisfaction
4.4/5*
Satisfaction with the customer’s own contact person
4.7/5*
* OmaSp Parasta palvelua survey 12/2021
We are local and close to the customer
OmaSp's extensive extensive
management and expert training
programme, OmaSp Master,
ended on 13 January 2021 and a
total of 10 people completed it.
We take care of our personnel
Days of training /employee 2021
8.4days
Employee satisfaction
4.5/5**Respondents:
88% of personnel
** Satisfaction with the company as a whole Personnel survey 12/2021
Gender distribution of employees
Women 66.4%
Men 33.6%
A significant part of the employees are owners.
60%Average age of
employees (years)
38.1
Age distribution of employees
20-30 y. 35%
31-40 y. 29%
41-50 y. 15%
51-60 y. 17%
Over 60 y. 4%
165
Cor
por
ate
Soci
al R
esp
ons
ibili
ty R
epor
t 20
21
Contents OmaSp in brief Corporate Governance Report of Board of Directors Financial
StatementsCorporate Social
Responsibility Report
Corporate Social Responsibility Report Survey of impacts and risks related to climate change Carbon Footprint Report
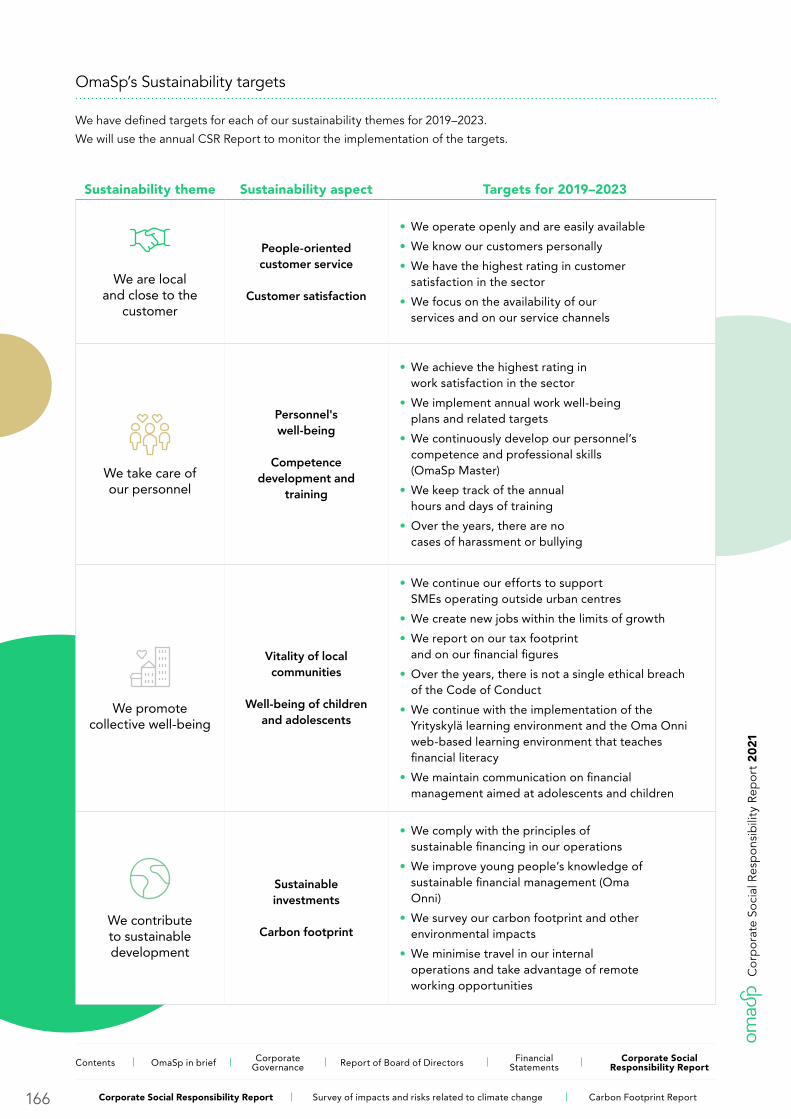
OmaSp’s Sustainability targets
We have defined targets for each of our sustainability themes for 2019–2023.
We will use the annual CSR Report to monitor the implementation of the targets.
Sustainability theme Sustainability aspect Targets for 2019–2023
We are local and close to the
customer
People-oriented customer service
Customer satisfaction
• We operate openly and are easily available
• We know our customers personally
• We have the highest rating in customer satisfaction in the sector
• We focus on the availability of our services and on our service channels
We take care of our personnel
Personnel's well-being
Competence development and
training
• We achieve the highest rating in work satisfaction in the sector
• We implement annual work well-being plans and related targets
• We continuously develop our personnel’s competence and professional skills (OmaSp Master)
• We keep track of the annual hours and days of training
• Over the years, there are no cases of harassment or bullying
We promote collective well-being
Vitality of local communities
Well-being of children and adolescents
• We continue our efforts to support SMEs operating outside urban centres
• We create new jobs within the limits of growth
• We report on our tax footprint and on our financial figures
• Over the years, there is not a single ethical breach of the Code of Conduct
• We continue with the implementation of the Yrityskylä learning environment and the Oma Onni web-based learning environment that teaches financial literacy
• We maintain communication on financial management aimed at adolescents and children
We contribute to sustainable development
Sustainable investments
Carbon footprint
• We comply with the principles of sustainable financing in our operations
• We improve young people’s knowledge of sustainable financial management (Oma Onni)
• We survey our carbon footprint and other environmental impacts
• We minimise travel in our internal operations and take advantage of remote working opportunities
166
Cor
por
ate
Soci
al R
esp
ons
ibili
ty R
epor
t 20
21
Contents OmaSp in brief Corporate Governance Report of Board of Directors Financial
StatementsCorporate Social
Responsibility Report
Corporate Social Responsibility Report Survey of impacts and risks related to climate change Carbon Footprint Report
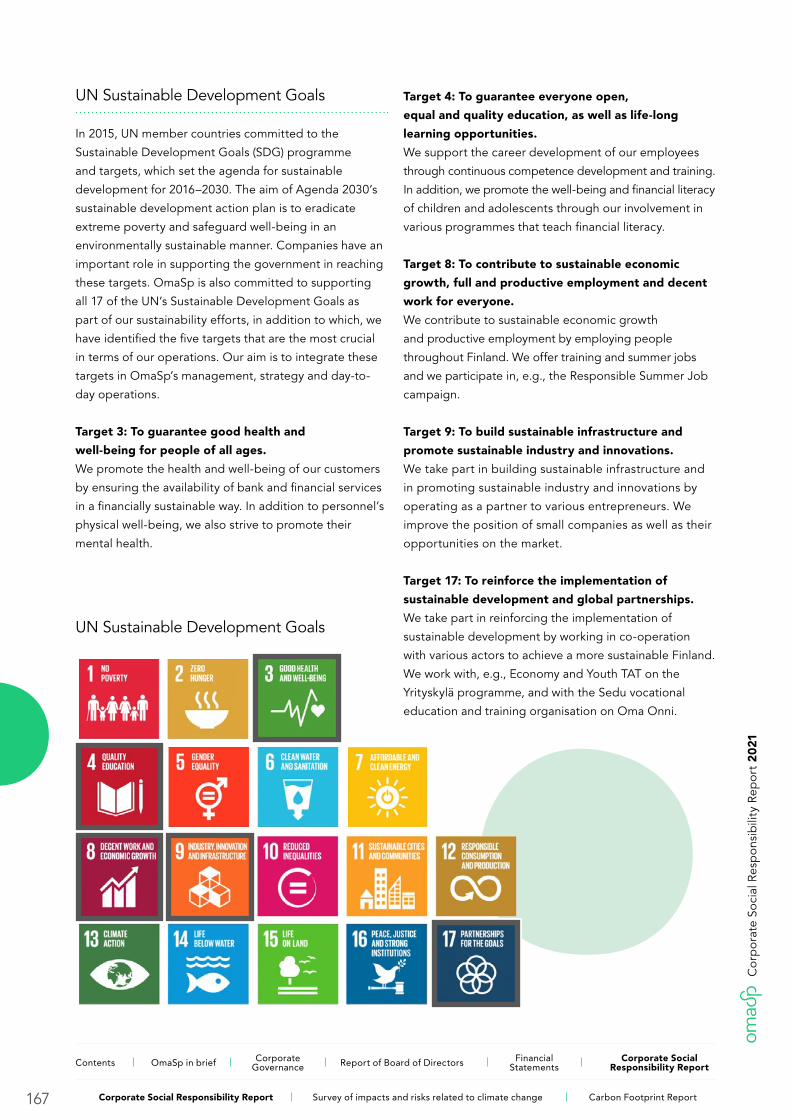
UN Sustainable Development Goals
In 2015, UN member countries committed to the
Sustainable Development Goals (SDG) programme
and targets, which set the agenda for sustainable
development for 2016–2030. The aim of Agenda 2030’s
sustainable development action plan is to eradicate
extreme poverty and safeguard well-being in an
environmentally sustainable manner. Companies have an
important role in supporting the government in reaching
these targets. OmaSp is also committed to supporting
all 17 of the UN’s Sustainable Development Goals as
part of our sustainability efforts, in addition to which, we
have identified the five targets that are the most crucial
in terms of our operations. Our aim is to integrate these
targets in OmaSp’s management, strategy and day-to-
day operations.
Target 3: To guarantee good health and
well-being for people of all ages.
We promote the health and well-being of our customers
by ensuring the availability of bank and financial services
in a financially sustainable way. In addition to personnel’s
physical well-being, we also strive to promote their
mental health.
Target 4: To guarantee everyone open,
equal and quality education, as well as life-long
learning opportunities.
We support the career development of our employees
through continuous competence development and training.
In addition, we promote the well-being and financial literacy
of children and adolescents through our involvement in
various programmes that teach financial literacy.
Target 8: To contribute to sustainable economic
growth, full and productive employment and decent
work for everyone.
We contribute to sustainable economic growth
and productive employment by employing people
throughout Finland. We offer training and summer jobs
and we participate in, e.g., the Responsible Summer Job
campaign.
Target 9: To build sustainable infrastructure and
promote sustainable industry and innovations.
We take part in building sustainable infrastructure and
in promoting sustainable industry and innovations by
operating as a partner to various entrepreneurs. We
improve the position of small companies as well as their
opportunities on the market.
Target 17: To reinforce the implementation of
sustainable development and global partnerships.
We take part in reinforcing the implementation of
sustainable development by working in co-operation
with various actors to achieve a more sustainable Finland.
We work with, e.g., Economy and Youth TAT on the
Yrityskylä programme, and with the Sedu vocational
education and training organisation on Oma Onni.
UN Sustainable Development Goals
167
Cor
por
ate
Soci
al R
esp
ons
ibili
ty R
epor
t 20
21
Contents OmaSp in brief Corporate Governance Report of Board of Directors Financial
StatementsCorporate Social
Responsibility Report
Corporate Social Responsibility Report Survey of impacts and risks related to climate change Carbon Footprint Report

We are local and close to the customer
We are present in the day-to-day lives of our customers
in our 35 offices around Finland, in addition to which,
we serve our customers via our digital channels – at
anytime and wherever they are in the world. Our
broad network of offices and comprehensive digital
services ensure that our services are conveniently
available in the form that suits the customer. Each one of
our offices is the bank’s flagship in that area. Thanks to our
broad network of offices, we know the local market and our
customer base. This allows us to make decisions easily and
quickly in the customer’s own office.
35 offices throughout Finland
OmaMobiili & OmaVahvistus Online bank Customer visits Customer service,
call center & chat
People-oriented customer service is very important to us, and we
regularly monitor our customer satisfaction.
168
Cor
por
ate
Soci
al R
esp
ons
ibili
ty R
epor
t 20
21
Contents OmaSp in brief Corporate Governance Report of Board of Directors Financial
StatementsCorporate Social
Responsibility Report
Corporate Social Responsibility Report Survey of impacts and risks related to climate change Carbon Footprint Report
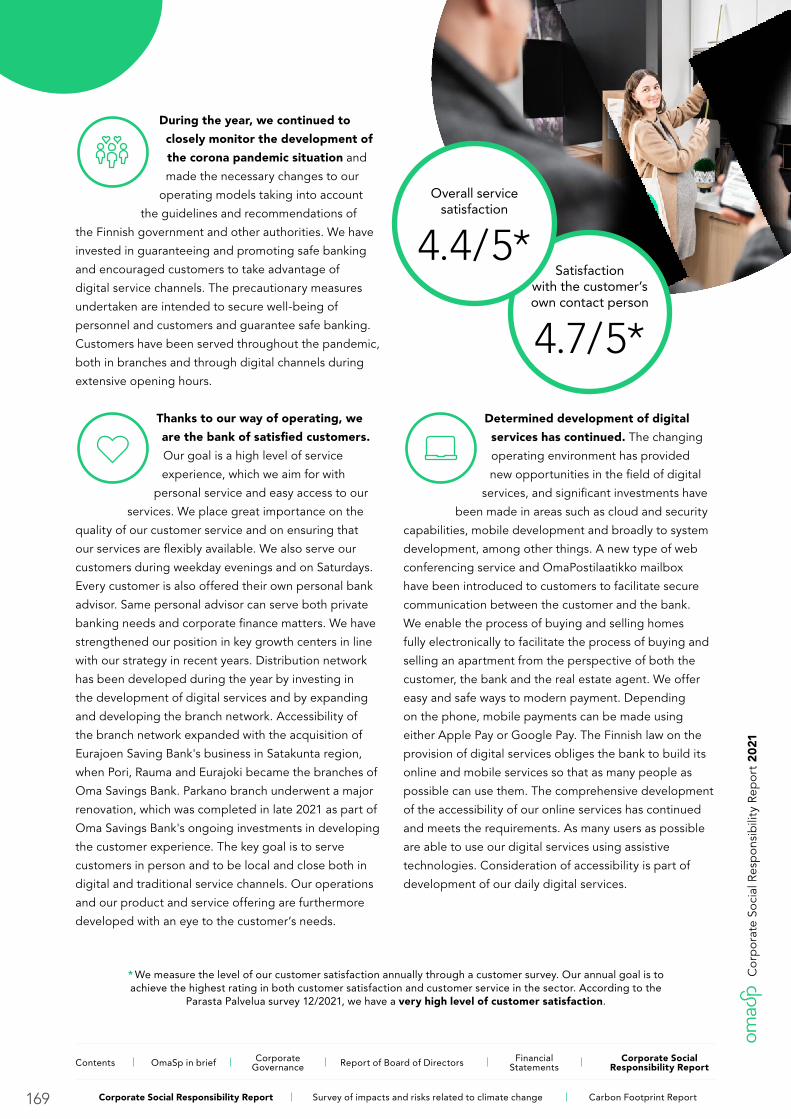
During the year, we continued to
closely monitor the development of
the corona pandemic situation and
made the necessary changes to our
operating models taking into account
the guidelines and recommendations of
the Finnish government and other authorities. We have
invested in guaranteeing and promoting safe banking
and encouraged customers to take advantage of
digital service channels. The precautionary measures
undertaken are intended to secure well-being of
personnel and customers and guarantee safe banking.
Customers have been served throughout the pandemic,
both in branches and through digital channels during
extensive opening hours.
Thanks to our way of operating, we
are the bank of satisfied customers.
Our goal is a high level of service
experience, which we aim for with
personal service and easy access to our
services. We place great importance on the
quality of our customer service and on ensuring that
our services are flexibly available. We also serve our
customers during weekday evenings and on Saturdays.
Every customer is also offered their own personal bank
advisor. Same personal advisor can serve both private
banking needs and corporate finance matters. We have
strengthened our position in key growth centers in line
with our strategy in recent years. Distribution network
has been developed during the year by investing in
the development of digital services and by expanding
and developing the branch network. Accessibility of
the branch network expanded with the acquisition of
Eurajoen Saving Bank's business in Satakunta region,
when Pori, Rauma and Eurajoki became the branches of
Oma Savings Bank. Parkano branch underwent a major
renovation, which was completed in late 2021 as part of
Oma Savings Bank's ongoing investments in developing
the customer experience. The key goal is to serve
customers in person and to be local and close both in
digital and traditional service channels. Our operations
and our product and service offering are furthermore
developed with an eye to the customer’s needs.
Determined development of digital
services has continued. The changing
operating environment has provided
new opportunities in the field of digital
services, and significant investments have
been made in areas such as cloud and security
capabilities, mobile development and broadly to system
development, among other things. A new type of web
conferencing service and OmaPostilaatikko mailbox
have been introduced to customers to facilitate secure
communication between the customer and the bank.
We enable the process of buying and selling homes
fully electronically to facilitate the process of buying and
selling an apartment from the perspective of both the
customer, the bank and the real estate agent. We offer
easy and safe ways to modern payment. Depending
on the phone, mobile payments can be made using
either Apple Pay or Google Pay. The Finnish law on the
provision of digital services obliges the bank to build its
online and mobile services so that as many people as
possible can use them. The comprehensive development
of the accessibility of our online services has continued
and meets the requirements. As many users as possible
are able to use our digital services using assistive
technologies. Consideration of accessibility is part of
development of our daily digital services.
Overall service satisfaction
4.4/5*Satisfaction
with the customer’s own contact person
4.7/5*
* We measure the level of our customer satisfaction annually through a customer survey. Our annual goal is to achieve the highest rating in both customer satisfaction and customer service in the sector. According to the
Parasta Palvelua survey 12/2021, we have a very high level of customer satisfaction.
169
Cor
por
ate
Soci
al R
esp
ons
ibili
ty R
epor
t 20
21
Contents OmaSp in brief Corporate Governance Report of Board of Directors Financial
StatementsCorporate Social
Responsibility Report
Corporate Social Responsibility Report Survey of impacts and risks related to climate change Carbon Footprint Report

We take care of our personnel
We employ about 315 motivated and entrepreneurial
experts across Finland. A significant part, about 60%
of our employees are bank owners, which increases
engagement and motivation for work. We promote
and maintain the diversity of our work community
by recruiting experts of all ages. The gender and age
distribution of our personnel is more equal than average.
We allow responsible and diverse work tasks for our
personnel with training opportunities, in addition to
ensuring the comfort and well-being of our employees
at both physical and mental levels. Investments in the
work ability and well-being of personnel through an
encouraging and developing work environment have
increased. As part of Oma Savings Bank's occupational
well-being and sustainability policy, the personnel were
offered a new bicycle benefit to employees, around
which a competition to support well-being at work and
a charity campaign were carried out to support Hope,
a registered, non-profit organisation. Well-being of
personnel and satisfied customers create the basis for the
development and success of our bank even in the future.
We diversely promote the well-being of our employees
and we support career development through continuous training.
Training opportunities, such as OmaSp Master
Extensive occupational health care
Workplace health promotion events and
WHP days
Exercise and meal benefits, bicycle benefit
to employees
170
Cor
por
ate
Soci
al R
esp
ons
ibili
ty R
epor
t 20
21
Contents OmaSp in brief Corporate Governance Report of Board of Directors Financial
StatementsCorporate Social
Responsibility Report
Corporate Social Responsibility Report Survey of impacts and risks related to climate change Carbon Footprint Report
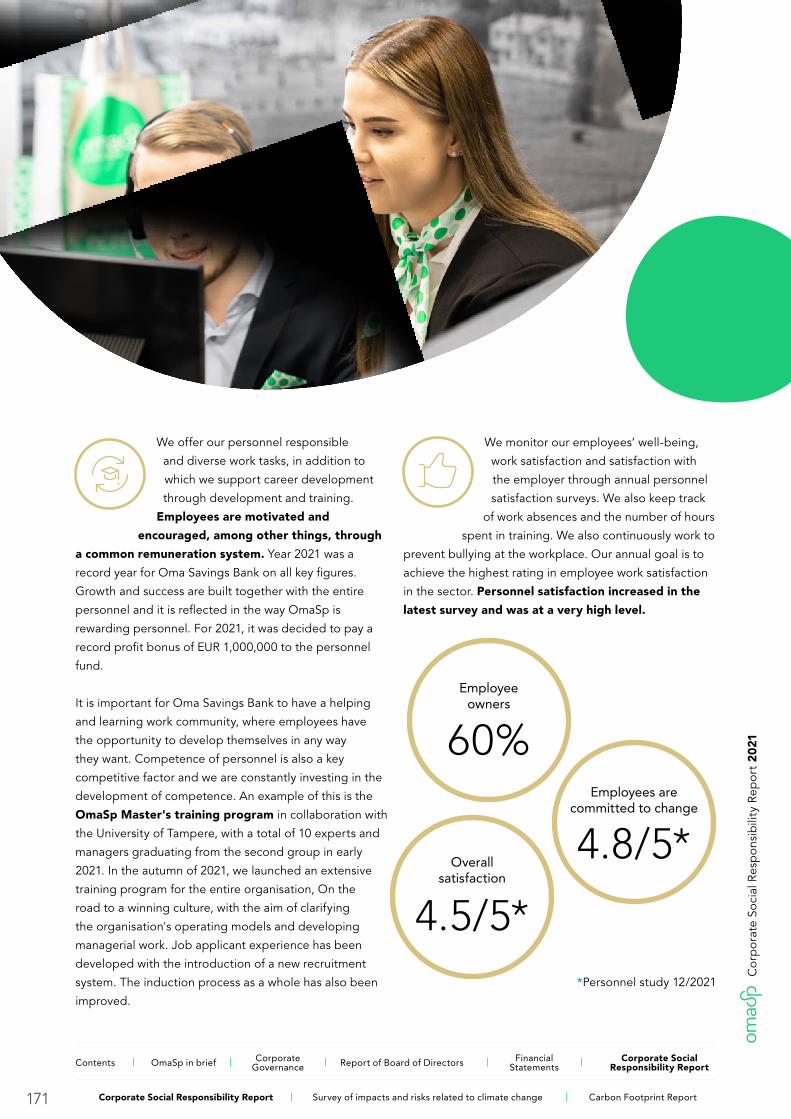
We offer our personnel responsible
and diverse work tasks, in addition to
which we support career development
through development and training.
Employees are motivated and
encouraged, among other things, through
a common remuneration system. Year 2021 was a
record year for Oma Savings Bank on all key figures.
Growth and success are built together with the entire
personnel and it is reflected in the way OmaSp is
rewarding personnel. For 2021, it was decided to pay a
record profit bonus of EUR 1,000,000 to the personnel
fund.
It is important for Oma Savings Bank to have a helping
and learning work community, where employees have
the opportunity to develop themselves in any way
they want. Competence of personnel is also a key
competitive factor and we are constantly investing in the
development of competence. An example of this is the
OmaSp Master's training program in collaboration with
the University of Tampere, with a total of 10 experts and
managers graduating from the second group in early
2021. In the autumn of 2021, we launched an extensive
training program for the entire organisation, On the
road to a winning culture, with the aim of clarifying
the organisation's operating models and developing
managerial work. Job applicant experience has been
developed with the introduction of a new recruitment
system. The induction process as a whole has also been
improved.
We monitor our employees’ well-being,
work satisfaction and satisfaction with
the employer through annual personnel
satisfaction surveys. We also keep track
of work absences and the number of hours
spent in training. We also continuously work to
prevent bullying at the workplace. Our annual goal is to
achieve the highest rating in employee work satisfaction
in the sector. Personnel satisfaction increased in the
latest survey and was at a very high level.
Employee owners
60%Employees are
committed to change
4.8/5*Overall
satisfaction
4.5/5**Personnel study 12/2021
171
Cor
por
ate
Soci
al R
esp
ons
ibili
ty R
epor
t 20
21
Contents OmaSp in brief Corporate Governance Report of Board of Directors Financial
StatementsCorporate Social
Responsibility Report
Corporate Social Responsibility Report Survey of impacts and risks related to climate change Carbon Footprint Report

We promote collective well-being
We are strongly committed to working on behalf of the
well-being of Finnish society. We actively promote and
develop the vitality of local and regional communities by
offering jobs outside urban areas and by financing local
SMEs. In addition, owner foundations and co-operatives
distribute grants and subsidies for non-profit purposes
every year. They support, for example, economic
education, research, children's sports, youth work,
culture and nature conservation. We contribute to society
indirectly through our economic impact, for example,
through the taxes we pay. These proceeds are used
to safeguard the basic functions of society and build
well-being. Our business is steered by our Code of
Conduct. In 2021, there were no reports of breaches of
our Code of Conduct.
Employment and tax footprint
Financing local SMEs
Grants and subsidies
Promoting well-being in children and adolescents
We promote the vitality of local communities and the well-being of children and
adolescents.
172
Cor
por
ate
Soci
al R
esp
ons
ibili
ty R
epor
t 20
21
Contents OmaSp in brief Corporate Governance Report of Board of Directors Financial
StatementsCorporate Social
Responsibility Report
Corporate Social Responsibility Report Survey of impacts and risks related to climate change Carbon Footprint Report
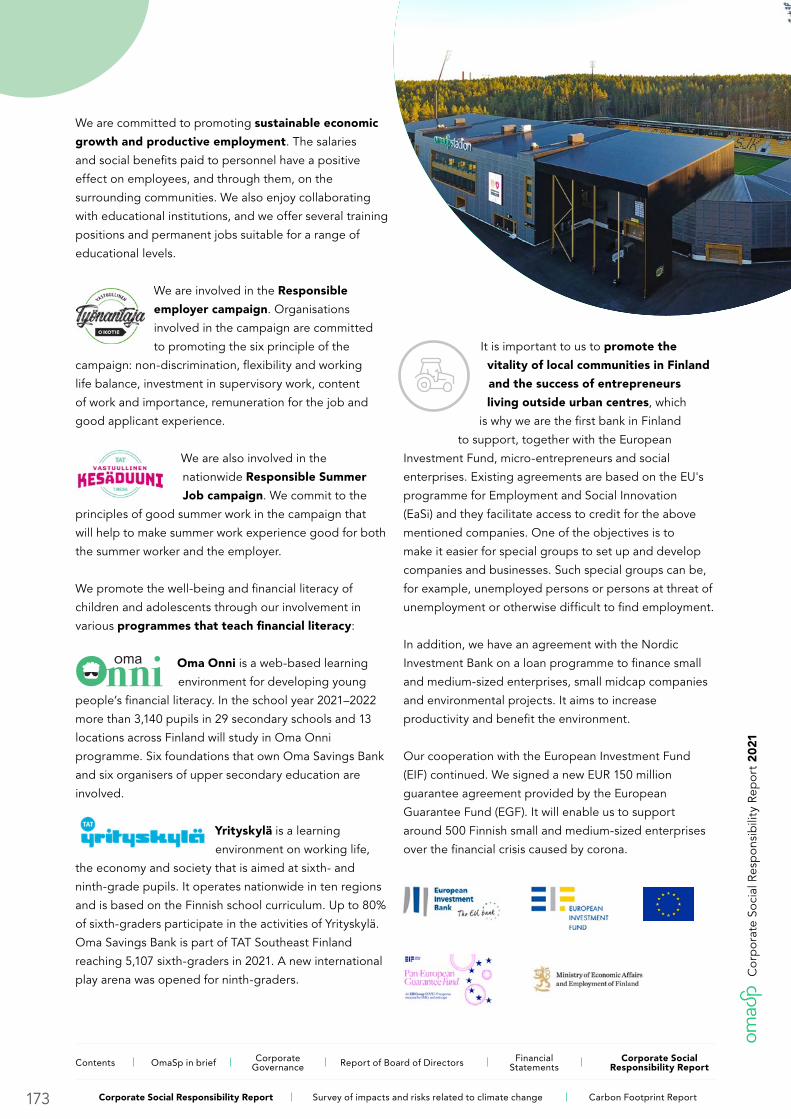
We are committed to promoting sustainable economic
growth and productive employment. The salaries
and social benefits paid to personnel have a positive
effect on employees, and through them, on the
surrounding communities. We also enjoy collaborating
with educational institutions, and we offer several training
positions and permanent jobs suitable for a range of
educational levels.
We are involved in the Responsible
employer campaign. Organisations
involved in the campaign are committed
to promoting the six principle of the
campaign: non-discrimination, flexibility and working
life balance, investment in supervisory work, content
of work and importance, remuneration for the job and
good applicant experience.
We are also involved in the
nationwide Responsible Summer
Job campaign. We commit to the
principles of good summer work in the campaign that
will help to make summer work experience good for both
the summer worker and the employer.
We promote the well-being and financial literacy of
children and adolescents through our involvement in
various programmes that teach financial literacy:
Oma Onni is a web-based learning
environment for developing young
people’s financial literacy. In the school year 2021–2022
more than 3,140 pupils in 29 secondary schools and 13
locations across Finland will study in Oma Onni
programme. Six foundations that own Oma Savings Bank
and six organisers of upper secondary education are
involved.
Yrityskylä is a learning
environment on working life,
the economy and society that is aimed at sixth- and
ninth-grade pupils. It operates nationwide in ten regions
and is based on the Finnish school curriculum. Up to 80%
of sixth-graders participate in the activities of Yrityskylä.
Oma Savings Bank is part of TAT Southeast Finland
reaching 5,107 sixth-graders in 2021. A new international
play arena was opened for ninth-graders.
It is important to us to promote the
vitality of local communities in Finland
and the success of entrepreneurs
living outside urban centres, which
is why we are the first bank in Finland
to support, together with the European
Investment Fund, micro-entrepreneurs and social
enterprises. Existing agreements are based on the EU's
programme for Employment and Social Innovation
(EaSi) and they facilitate access to credit for the above
mentioned companies. One of the objectives is to
make it easier for special groups to set up and develop
companies and businesses. Such special groups can be,
for example, unemployed persons or persons at threat of
unemployment or otherwise difficult to find employment.
In addition, we have an agreement with the Nordic
Investment Bank on a loan programme to finance small
and medium-sized enterprises, small midcap companies
and environmental projects. It aims to increase
productivity and benefit the environment.
Our cooperation with the European Investment Fund
(EIF) continued. We signed a new EUR 150 million
guarantee agreement provided by the European
Guarantee Fund (EGF). It will enable us to support
around 500 Finnish small and medium-sized enterprises
over the financial crisis caused by corona.
173
Cor
por
ate
Soci
al R
esp
ons
ibili
ty R
epor
t 20
21
Contents OmaSp in brief Corporate Governance Report of Board of Directors Financial
StatementsCorporate Social
Responsibility Report
Corporate Social Responsibility Report Survey of impacts and risks related to climate change Carbon Footprint Report

We contribute to sustainable development
We know that the financial sector plays a major role
in promoting sustainable development in society
and globally. Sustainable development is one of
the guiding perspectives in our financing decisions.
We aim to steer assets toward targets that are
sustainable for the well-being of the environment,
the climate and people.
Through our financing decisions we can also promote
the development of green products and services by
enabling sustainable investments. Going forward, our aim
will be to increase our customers’ awareness of the state
of the environment. For that reason, we also examine
the impacts of our own operations on the environment,
biodiversity and the climate.
We enable sustainable investments and we
minimise our emissions.
Sustainable financial decisions
Sustainable investments
Minimising our own emissions
174
Cor
por
ate
Soci
al R
esp
ons
ibili
ty R
epor
t 20
21
Contents OmaSp in brief Corporate Governance Report of Board of Directors Financial
StatementsCorporate Social
Responsibility Report
Corporate Social Responsibility Report Survey of impacts and risks related to climate change Carbon Footprint Report
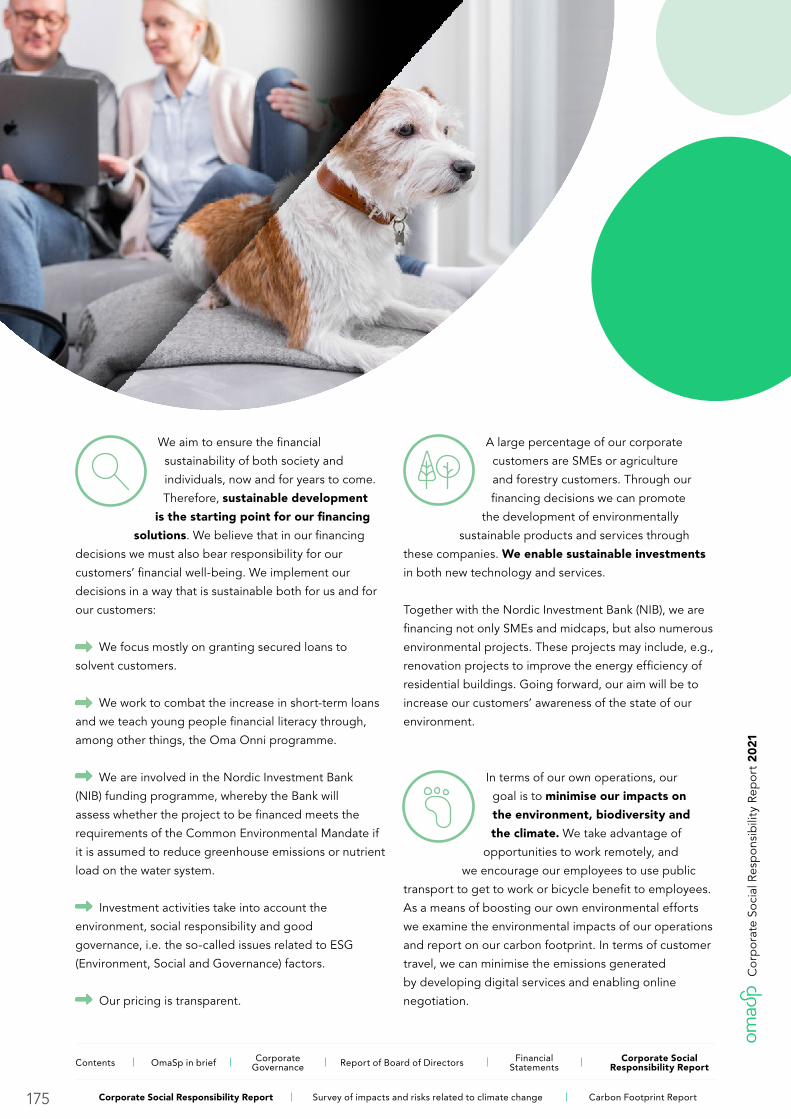
We aim to ensure the financial
sustainability of both society and
individuals, now and for years to come.
Therefore, sustainable development
is the starting point for our financing
solutions. We believe that in our financing
decisions we must also bear responsibility for our
customers’ financial well-being. We implement our
decisions in a way that is sustainable both for us and for
our customers:
We focus mostly on granting secured loans to
solvent customers.
We work to combat the increase in short-term loans
and we teach young people financial literacy through,
among other things, the Oma Onni programme.
We are involved in the Nordic Investment Bank
(NIB) funding programme, whereby the Bank will
assess whether the project to be financed meets the
requirements of the Common Environmental Mandate if
it is assumed to reduce greenhouse emissions or nutrient
load on the water system.
Investment activities take into account the
environment, social responsibility and good
governance, i.e. the so-called issues related to ESG
(Environment, Social and Governance) factors.
Our pricing is transparent.
A large percentage of our corporate
customers are SMEs or agriculture
and forestry customers. Through our
financing decisions we can promote
the development of environmentally
sustainable products and services through
these companies. We enable sustainable investments
in both new technology and services.
Together with the Nordic Investment Bank (NIB), we are
financing not only SMEs and midcaps, but also numerous
environmental projects. These projects may include, e.g.,
renovation projects to improve the energy efficiency of
residential buildings. Going forward, our aim will be to
increase our customers’ awareness of the state of our
environment.
In terms of our own operations, our
goal is to minimise our impacts on
the environment, biodiversity and
the climate. We take advantage of
opportunities to work remotely, and
we encourage our employees to use public
transport to get to work or bicycle benefit to employees.
As a means of boosting our own environmental efforts
we examine the environmental impacts of our operations
and report on our carbon footprint. In terms of customer
travel, we can minimise the emissions generated
by developing digital services and enabling online
negotiation.
175
Cor
por
ate
Soci
al R
esp
ons
ibili
ty R
epor
t 20
21
Contents OmaSp in brief Corporate Governance Report of Board of Directors Financial
StatementsCorporate Social
Responsibility Report
Corporate Social Responsibility Report Survey of impacts and risks related to climate change Carbon Footprint Report
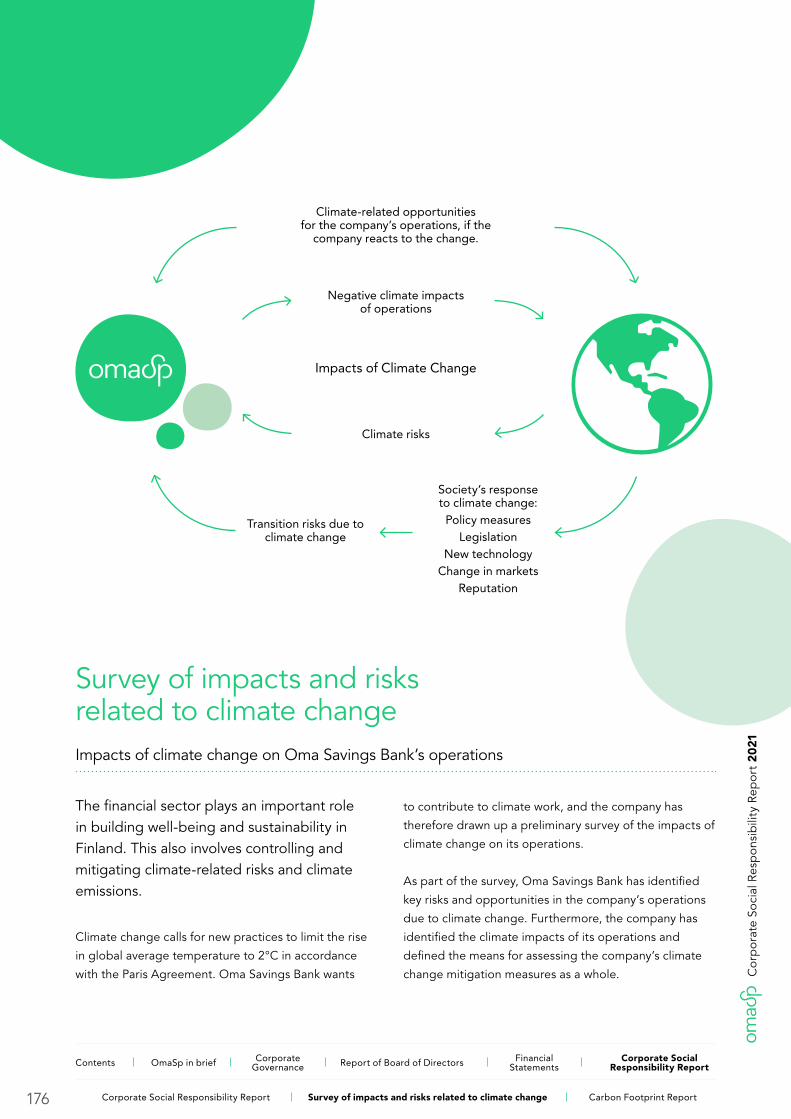
Survey of impacts and risks related to climate changeImpacts of climate change on Oma Savings Bank’s operations
The financial sector plays an important role in building well-being and sustainability in Finland. This also involves controlling and mitigating climate-related risks and climate emissions.
Climate change calls for new practices to limit the rise
in global average temperature to 2°C in accordance
with the Paris Agreement. Oma Savings Bank wants
to contribute to climate work, and the company has
therefore drawn up a preliminary survey of the impacts of
climate change on its operations.
As part of the survey, Oma Savings Bank has identified
key risks and opportunities in the company’s operations
due to climate change. Furthermore, the company has
identified the climate impacts of its operations and
defined the means for assessing the company’s climate
change mitigation measures as a whole.
Impacts of Climate Change
Negative climate impacts of operations
Climate risks
Climate-related opportunities for the company’s operations, if the
company reacts to the change.
Society’s response to climate change:Policy measures
LegislationNew technology
Change in marketsReputation
Transition risks due to climate change
Cor
por
ate
Soci
al R
esp
ons
ibili
ty R
epor
t 20
21
176
Contents OmaSp in brief Corporate Governance Report of Board of Directors Financial
StatementsCorporate Social
Responsibility Report
Corporate Social Responsibility Report Survey of impacts and risks related to climate change Carbon Footprint Report
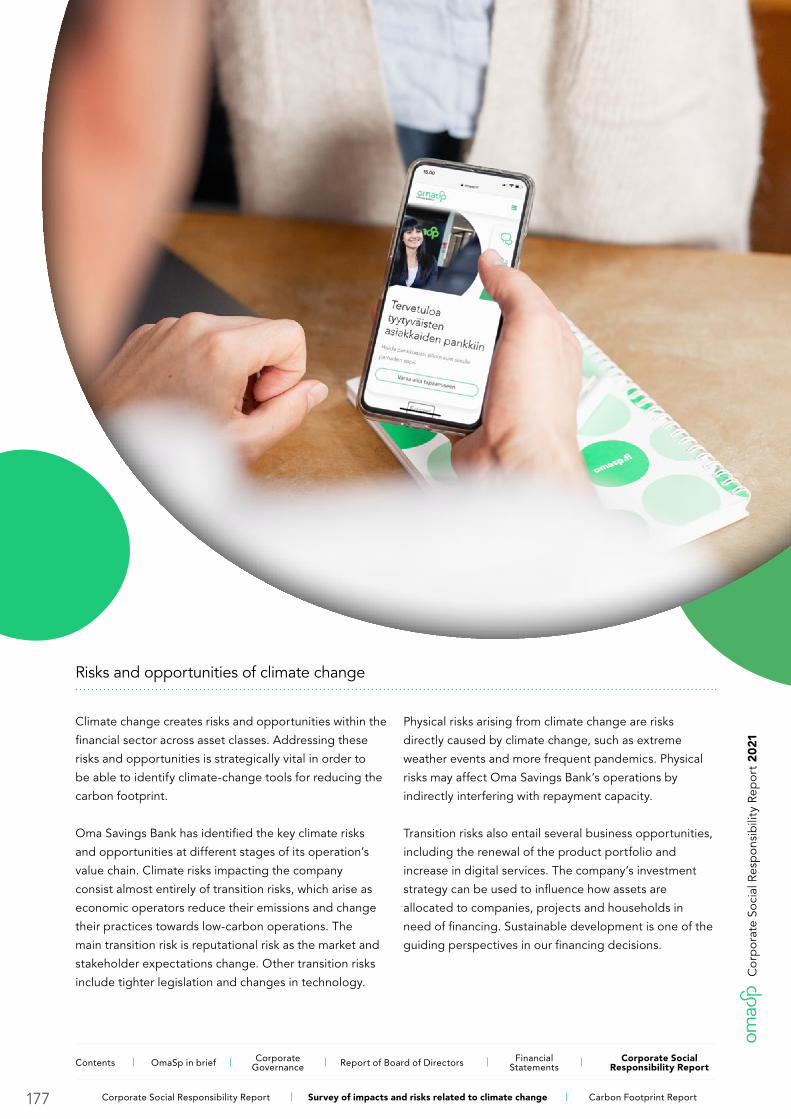
Risks and opportunities of climate change
Climate change creates risks and opportunities within the
financial sector across asset classes. Addressing these
risks and opportunities is strategically vital in order to
be able to identify climate-change tools for reducing the
carbon footprint.
Oma Savings Bank has identified the key climate risks
and opportunities at different stages of its operation’s
value chain. Climate risks impacting the company
consist almost entirely of transition risks, which arise as
economic operators reduce their emissions and change
their practices towards low-carbon operations. The
main transition risk is reputational risk as the market and
stakeholder expectations change. Other transition risks
include tighter legislation and changes in technology.
Physical risks arising from climate change are risks
directly caused by climate change, such as extreme
weather events and more frequent pandemics. Physical
risks may affect Oma Savings Bank’s operations by
indirectly interfering with repayment capacity.
Transition risks also entail several business opportunities,
including the renewal of the product portfolio and
increase in digital services. The company’s investment
strategy can be used to influence how assets are
allocated to companies, projects and households in
need of financing. Sustainable development is one of the
guiding perspectives in our financing decisions.
Cor
por
ate
Soci
al R
esp
ons
ibili
ty R
epor
t 20
21
177
Contents OmaSp in brief Corporate Governance Report of Board of Directors Financial
StatementsCorporate Social
Responsibility Report
Corporate Social Responsibility Report Survey of impacts and risks related to climate change Carbon Footprint Report
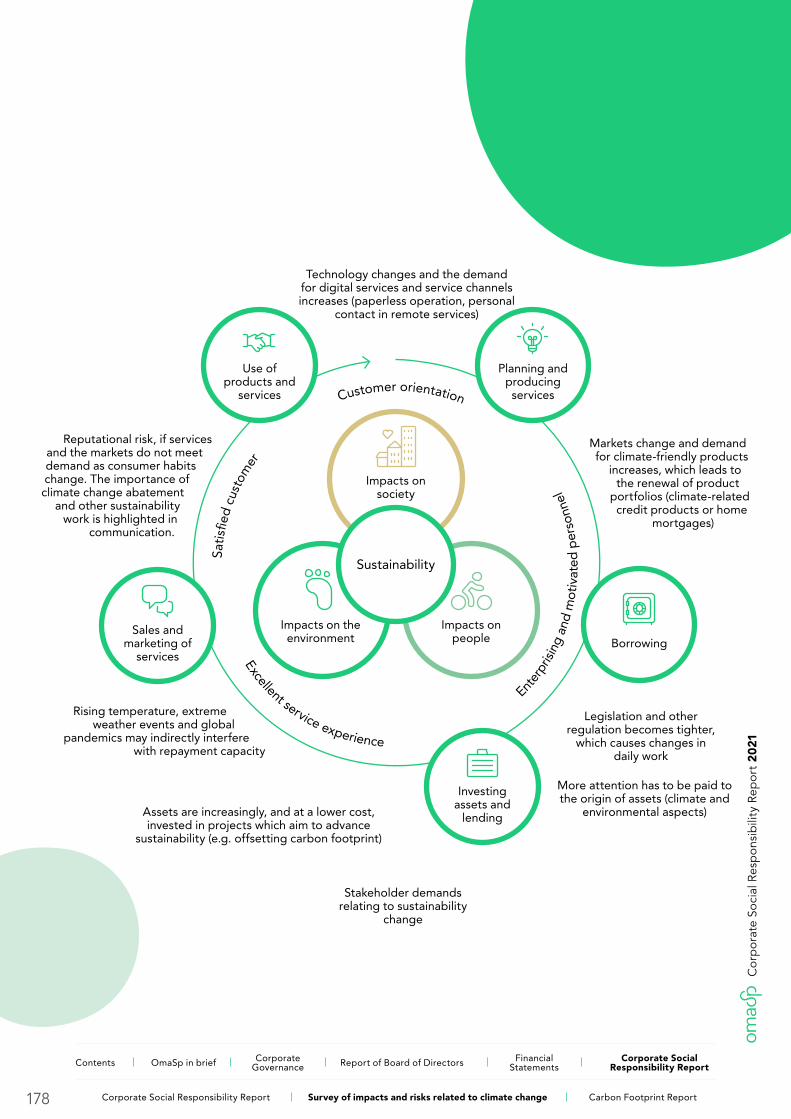
Sustainability
Impacts on society
Impacts on people
Impacts on the environment
Planning and producing services
Markets change and demand for climate-friendly products
increases, which leads to the renewal of product
portfolios (climate-related credit products or home
mortgages)
Borrowing
Legislation and other regulation becomes tighter,
which causes changes in daily work
More attention has to be paid to the origin of assets (climate and
environmental aspects)
Investing assets and
lending
Rising temperature, extreme weather events and global
pandemics may indirectly interfere with repayment capacity
Assets are increasingly, and at a lower cost, invested in projects which aim to advance
sustainability (e.g. offsetting carbon footprint)
Stakeholder demands relating to sustainability
change
Sales and marketing of
services
Reputational risk, if services and the markets do not meet demand as consumer habits change. The importance of climate change abatement
and other sustainability work is highlighted in
communication.
Use of products and
services
Technology changes and the demand for digital services and service channels increases (paperless operation, personal
contact in remote services)
Excellent service experience
Ente
rpris
ing
and
mot
ivat
ed p
erso
nnel
Satis
fi ed
cust
omer
Customer orientation
Cor
por
ate
Soci
al R
esp
ons
ibili
ty R
epor
t 20
21
178
Contents OmaSp in brief Corporate Governance Report of Board of Directors Financial
StatementsCorporate Social
Responsibility Report
Corporate Social Responsibility Report Survey of impacts and risks related to climate change Carbon Footprint Report
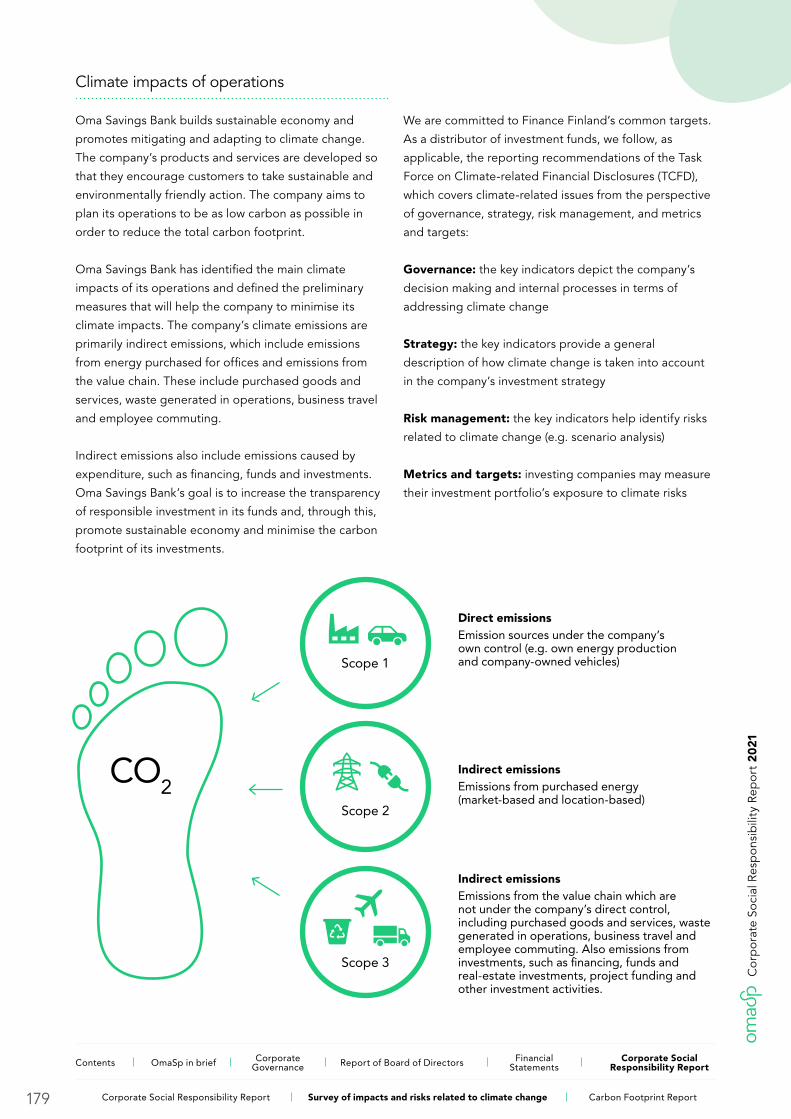
Climate impacts of operations
Oma Savings Bank builds sustainable economy and
promotes mitigating and adapting to climate change.
The company’s products and services are developed so
that they encourage customers to take sustainable and
environmentally friendly action. The company aims to
plan its operations to be as low carbon as possible in
order to reduce the total carbon footprint.
Oma Savings Bank has identified the main climate
impacts of its operations and defined the preliminary
measures that will help the company to minimise its
climate impacts. The company’s climate emissions are
primarily indirect emissions, which include emissions
from energy purchased for offices and emissions from
the value chain. These include purchased goods and
services, waste generated in operations, business travel
and employee commuting.
Indirect emissions also include emissions caused by
expenditure, such as financing, funds and investments.
Oma Savings Bank’s goal is to increase the transparency
of responsible investment in its funds and, through this,
promote sustainable economy and minimise the carbon
footprint of its investments.
We are committed to Finance Finland’s common targets.
As a distributor of investment funds, we follow, as
applicable, the reporting recommendations of the Task
Force on Climate-related Financial Disclosures (TCFD),
which covers climate-related issues from the perspective
of governance, strategy, risk management, and metrics
and targets:
Governance: the key indicators depict the company’s
decision making and internal processes in terms of
addressing climate change
Strategy: the key indicators provide a general
description of how climate change is taken into account
in the company’s investment strategy
Risk management: the key indicators help identify risks
related to climate change (e.g. scenario analysis)
Metrics and targets: investing companies may measure
their investment portfolio’s exposure to climate risks
CO2
Scope 1
Direct emissionsEmission sources under the company’s own control (e.g. own energy production and company-owned vehicles)
Scope 2
Indirect emissionsEmissions from purchased energy (market-based and location-based)
Scope 3
Indirect emissionsEmissions from the value chain which are not under the company’s direct control, including purchased goods and services, waste generated in operations, business travel and employee commuting. Also emissions from investments, such as financing, funds and real-estate investments, project funding and other investment activities.
Cor
por
ate
Soci
al R
esp
ons
ibili
ty R
epor
t 20
21
179
Contents OmaSp in brief Corporate Governance Report of Board of Directors Financial
StatementsCorporate Social
Responsibility Report
Corporate Social Responsibility Report Survey of impacts and risks related to climate change Carbon Footprint Report
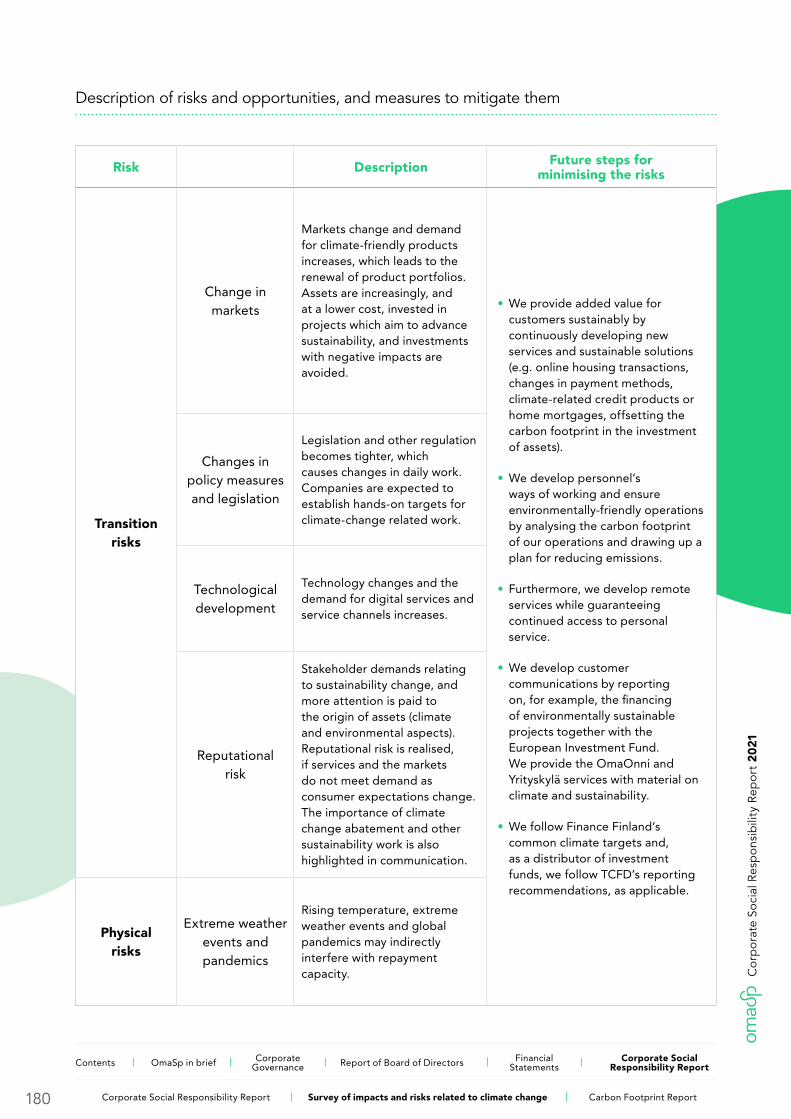
Description of risks and opportunities, and measures to mitigate them
Risk Description Future steps for minimising the risks
Transition risks
Change in markets
Markets change and demand for climate-friendly products increases, which leads to the renewal of product portfolios. Assets are increasingly, and at a lower cost, invested in projects which aim to advance sustainability, and investments with negative impacts are avoided.
• We provide added value for customers sustainably by continuously developing new services and sustainable solutions (e.g. online housing transactions, changes in payment methods, climate-related credit products or home mortgages, offsetting the carbon footprint in the investment of assets).
• We develop personnel’s ways of working and ensure environmentally-friendly operations by analysing the carbon footprint of our operations and drawing up a plan for reducing emissions.
• Furthermore, we develop remote services while guaranteeing continued access to personal service.
• We develop customer communications by reporting on, for example, the financing of environmentally sustainable projects together with the European Investment Fund. We provide the OmaOnni and Yrityskylä services with material on climate and sustainability.
• We follow Finance Finland’s common climate targets and, as a distributor of investment funds, we follow TCFD’s reporting recommendations, as applicable.
Changes in policy measures and legislation
Legislation and other regulation becomes tighter, which causes changes in daily work. Companies are expected to establish hands-on targets for climate-change related work.
Technological development
Technology changes and the demand for digital services and service channels increases.
Reputational risk
Stakeholder demands relating to sustainability change, and more attention is paid to the origin of assets (climate and environmental aspects). Reputational risk is realised, if services and the markets do not meet demand as consumer expectations change. The importance of climate change abatement and other sustainability work is also highlighted in communication.
Physical risks
Extreme weather events and pandemics
Rising temperature, extreme weather events and global pandemics may indirectly interfere with repayment capacity. C
orp
orat
e So
cial
Res
po
nsib
ility
Rep
ort
2021
180
Contents OmaSp in brief Corporate Governance Report of Board of Directors Financial
StatementsCorporate Social
Responsibility Report
Corporate Social Responsibility Report Survey of impacts and risks related to climate change Carbon Footprint Report
Carbon Footprint Report 2021
This report brings together Oma Savings Bank Plc's
carbon footprint from year 2021. The calculation has
been made at the organisational level identifying the
main sources of emissions from the activity. The report
deals with the calculation methods used as well as the
calculation score. The carbon footprints for 2018–2020
have also been calculated in the report for comparison.
What is a carbon footprint?
The carbon footprint refers to the climate emissions that
are generated as a result of human actions and deeds.
It can be calculated for an individual person, company,
organisation, individual activity or product. The carbon
footprint often consists of the movement of people,
food and drink, the energy and materials used, and
the amount of waste generated. The most significant
greenhouse gases affecting the carbon footprint are
carbon dioxide, methane and nitrous oxide.
The company's carbon footprint
Calculating the carbon footprint of a company and
organisation means arising through its activities
calculation of greenhouse gas emissions. Carbon
footprint formation and its magnitude vary considerably
depending on the type of industry in which the company
operates. That’s why a company’s carbon footprint is
always calculated open on a case-by-case basis.
Greenhouse gas emissions in the calculation of
the carbon footprint expressed as carbon dioxide
equivalents, of which the abbreviation CO2 equivalent
(CO2e) is used. The carbon dioxide equivalent reflects
different greenhouse gases modified for global warming
effect corresponding the effect of carbon dioxide in the
atmosphere.
Calculation method
The carbon footprint calculation method used in this
work is based on GHG Protocol guidelines. GHG Protocol
is the sustainable development of the world economy
Council (WBCSD) and the World Resource Center (WRI)
standard published in 1998 that allows companies to
define their operations greenhouse gas emissions.
According to the instructions the resulting greenhouse
gas emissions are sorted into three different dimension:
• Scope 1: Emissions resulting directly from the
company's operations which the company usually has
the possibility to influence. These include, among
other things, your own energy production or moving
with own cars.
• Scope 2: Indirect emission from the company’s
operations arising from the purchase of the company
energy production. These include: district heating and
cooling and electricity.
• Scope 3: Other emissions resulting indirectly from the
company's activities during the supply chain. These
arises from, amongst other things, business travel,
purchases and waste generated.
Emissions from scopes 1 and 2 are always included in
the calculation, while emission from scope 3 are included
only those most important sources of emissions.
181
Cor
por
ate
Soci
al R
esp
ons
ibili
ty R
epor
t 20
21
Contents OmaSp in brief Corporate Governance Report of Board of Directors Financial
StatementsCorporate Social
Responsibility Report
Corporate Social Responsibility Report Survey of impacts and risks related to climate change Carbon Footprint Report
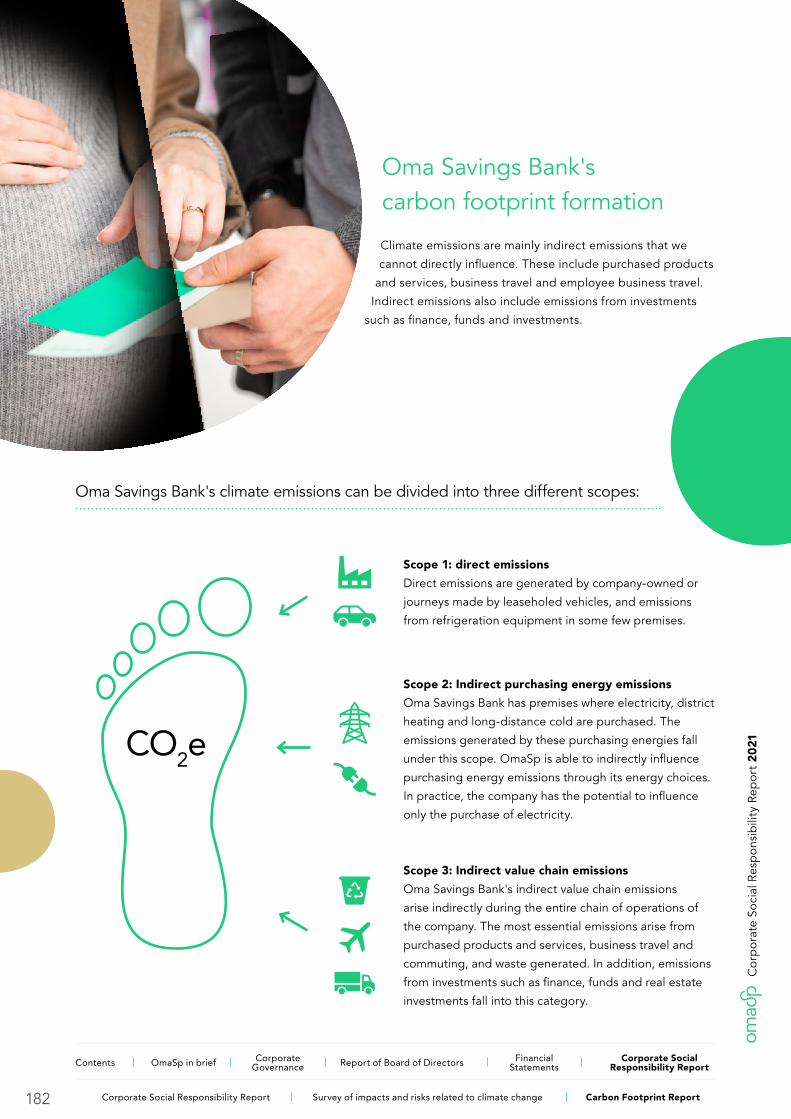
Oma Savings Bank's carbon footprint formation
Climate emissions are mainly indirect emissions that we
cannot directly influence. These include purchased products
and services, business travel and employee business travel.
Indirect emissions also include emissions from investments
such as finance, funds and investments.
Oma Savings Bank's climate emissions can be divided into three different scopes:
CO2e
Scope 1: direct emissions
Direct emissions are generated by company-owned or
journeys made by leaseholed vehicles, and emissions
from refrigeration equipment in some few premises.
Scope 2: Indirect purchasing energy emissions
Oma Savings Bank has premises where electricity, district
heating and long-distance cold are purchased. The
emissions generated by these purchasing energies fall
under this scope. OmaSp is able to indirectly influence
purchasing energy emissions through its energy choices.
In practice, the company has the potential to influence
only the purchase of electricity.
Scope 3: Indirect value chain emissions
Oma Savings Bank's indirect value chain emissions
arise indirectly during the entire chain of operations of
the company. The most essential emissions arise from
purchased products and services, business travel and
commuting, and waste generated. In addition, emissions
from investments such as finance, funds and real estate
investments fall into this category.
182
Cor
por
ate
Soci
al R
esp
ons
ibili
ty R
epor
t 20
21
Contents OmaSp in brief Corporate Governance Report of Board of Directors Financial
StatementsCorporate Social
Responsibility Report
Corporate Social Responsibility Report Survey of impacts and risks related to climate change Carbon Footprint Report
Baseline data, assumptions and limitations
The calculation of the carbon footprint was included
the actual business of the company. After reviewing
the operating environment and identifying the greatest
climate impacts of the operation, calculation limits
were defined to determine the carbon footprint. It was
decided to include in the calculation:
• Scope 1: Emissions from company-owned
or leased car journeys
• Scope 2: Emissions from purchasing energy of prem-
ises, i.e. electricity, district heating and district cooling
• Scope 3: Products and services purchased,
leased products and employee business travel
Calculation limitations
The following things were excluded from the calculation
due to irrelevance or challenging access to data:
• Scope 1: emissions from refrigeration equipments
located in individual premises
• Scope 3: Employees commute between home
and workplace, as well as investment emissions
i.e. emission from financing, funds, real estate
investments, project financing and other investment
activities
183
Cor
por
ate
Soci
al R
esp
ons
ibili
ty R
epor
t 20
21
Contents OmaSp in brief Corporate Governance Report of Board of Directors Financial
StatementsCorporate Social
Responsibility Report
Corporate Social Responsibility Report Survey of impacts and risks related to climate change Carbon Footprint Report
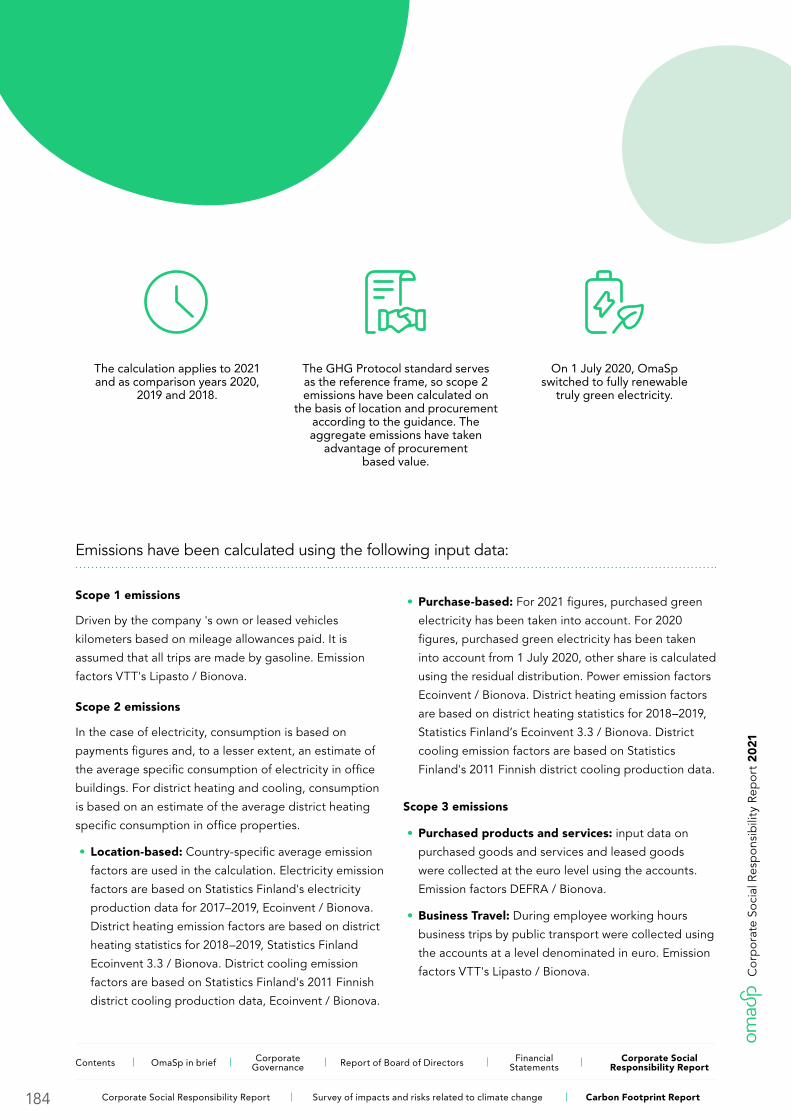
The calculation applies to 2021 and as comparison years 2020,
2019 and 2018.
The GHG Protocol standard serves as the reference frame, so scope 2 emissions have been calculated on
the basis of location and procurement according to the guidance. The aggregate emissions have taken
advantage of procurement based value.
On 1 July 2020, OmaSp switched to fully renewable
truly green electricity.
Emissions have been calculated using the following input data:
Scope 1 emissions
Driven by the company 's own or leased vehicles
kilometers based on mileage allowances paid. It is
assumed that all trips are made by gasoline. Emission
factors VTT's Lipasto / Bionova.
Scope 2 emissions
In the case of electricity, consumption is based on
payments figures and, to a lesser extent, an estimate of
the average specific consumption of electricity in office
buildings. For district heating and cooling, consumption
is based on an estimate of the average district heating
specific consumption in office properties.
• Location-based: Country-specific average emission
factors are used in the calculation. Electricity emission
factors are based on Statistics Finland's electricity
production data for 2017–2019, Ecoinvent / Bionova.
District heating emission factors are based on district
heating statistics for 2018–2019, Statistics Finland
Ecoinvent 3.3 / Bionova. District cooling emission
factors are based on Statistics Finland's 2011 Finnish
district cooling production data, Ecoinvent / Bionova.
• Purchase-based: For 2021 figures, purchased green
electricity has been taken into account. For 2020
figures, purchased green electricity has been taken
into account from 1 July 2020, other share is calculated
using the residual distribution. Power emission factors
Ecoinvent / Bionova. District heating emission factors
are based on district heating statistics for 2018–2019,
Statistics Finland’s Ecoinvent 3.3 / Bionova. District
cooling emission factors are based on Statistics
Finland's 2011 Finnish district cooling production data.
Scope 3 emissions
• Purchased products and services: input data on
purchased goods and services and leased goods
were collected at the euro level using the accounts.
Emission factors DEFRA / Bionova.
• Business Travel: During employee working hours
business trips by public transport were collected using
the accounts at a level denominated in euro. Emission
factors VTT's Lipasto / Bionova.
184
Cor
por
ate
Soci
al R
esp
ons
ibili
ty R
epor
t 20
21
Contents OmaSp in brief Corporate Governance Report of Board of Directors Financial
StatementsCorporate Social
Responsibility Report
Corporate Social Responsibility Report Survey of impacts and risks related to climate change Carbon Footprint Report
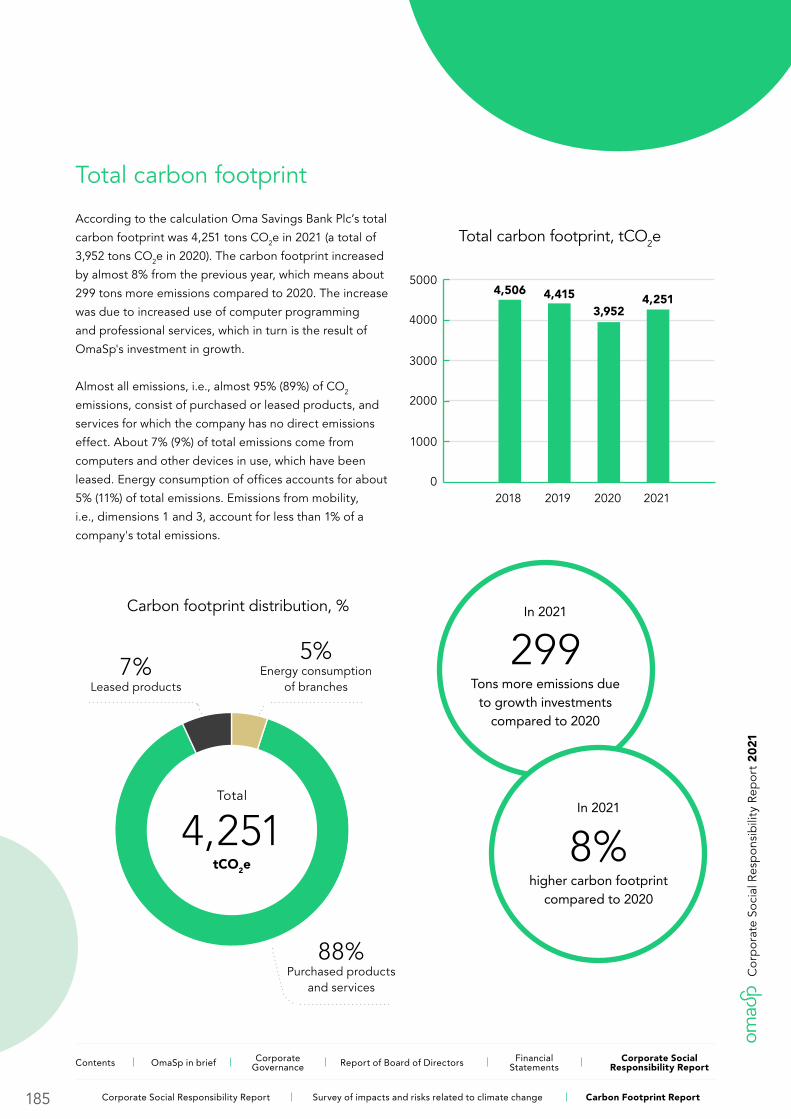
Total carbon footprint
According to the calculation Oma Savings Bank Plc’s total
carbon footprint was 4,251 tons CO2e in 2021 (a total of
3,952 tons CO2e in 2020). The carbon footprint increased
by almost 8% from the previous year, which means about
299 tons more emissions compared to 2020. The increase
was due to increased use of computer programming
and professional services, which in turn is the result of
OmaSp's investment in growth.
Almost all emissions, i.e., almost 95% (89%) of CO2
emissions, consist of purchased or leased products, and
services for which the company has no direct emissions
effect. About 7% (9%) of total emissions come from
computers and other devices in use, which have been
leased. Energy consumption of offices accounts for about
5% (11%) of total emissions. Emissions from mobility,
i.e., dimensions 1 and 3, account for less than 1% of a
company's total emissions.
In 2021
299Tons more emissions due
to growth investments compared to 2020
In 2021
8%higher carbon footprint
compared to 2020
Total carbon footprint, tCO2e
0
1000
2000
3000
4000
5000
2018
4,506
2019
4,415
2020
3,952
2021
4,251
Carbon footprint distribution, %
Total
4,251tCO2e
88%Purchased products
and services
5%Energy consumption
of branches7%
Leased products
185
Cor
por
ate
Soci
al R
esp
ons
ibili
ty R
epor
t 20
21
Contents OmaSp in brief Corporate Governance Report of Board of Directors Financial
StatementsCorporate Social
Responsibility Report
Corporate Social Responsibility Report Survey of impacts and risks related to climate change Carbon Footprint Report
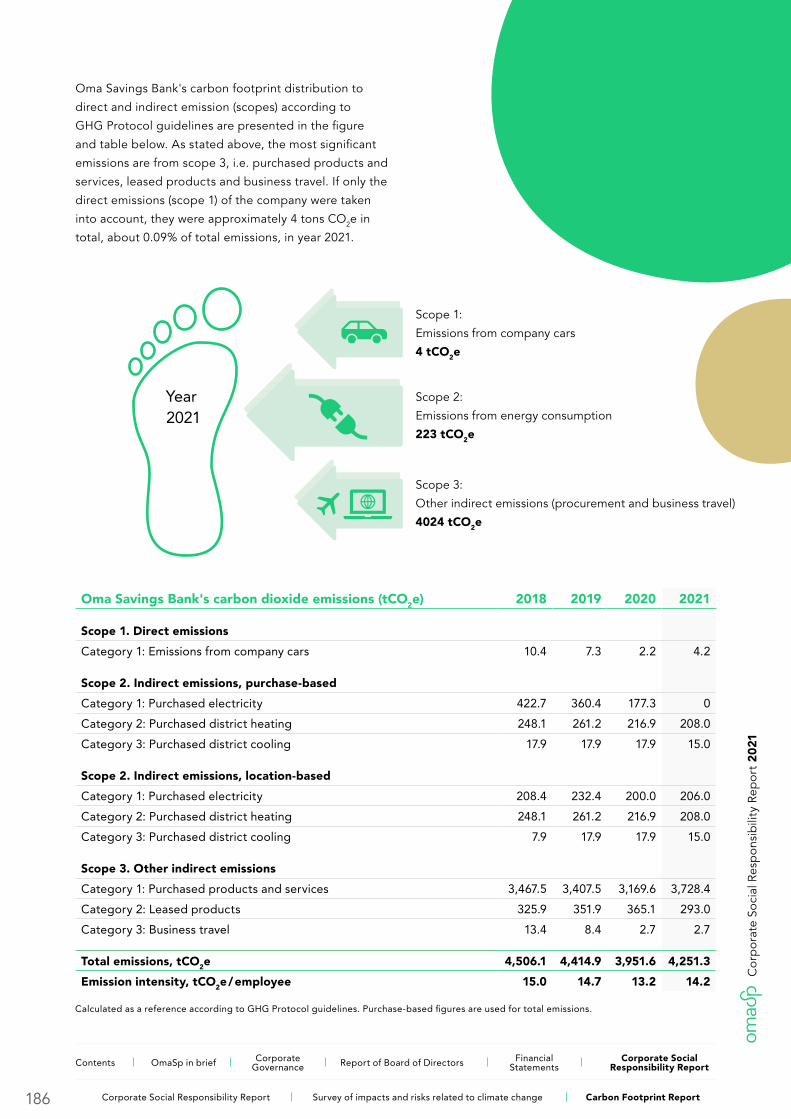
Oma Savings Bank's carbon footprint distribution to
direct and indirect emission (scopes) according to
GHG Protocol guidelines are presented in the figure
and table below. As stated above, the most significant
emissions are from scope 3, i.e. purchased products and
services, leased products and business travel. If only the
direct emissions (scope 1) of the company were taken
into account, they were approximately 4 tons CO2e in
total, about 0.09% of total emissions, in year 2021.
Year 2021
Scope 1:
Emissions from company cars
4 tCO2e
Scope 2:
Emissions from energy consumption
223 tCO2e
Scope 3:
Other indirect emissions (procurement and business travel)
4024 tCO2e
Oma Savings Bank's carbon dioxide emissions (tCO2e) 2018 2019 2020 2021
Scope 1. Direct emissions
Category 1: Emissions from company cars 10.4 7.3 2.2 4.2
Scope 2. Indirect emissions, purchase-based
Category 1: Purchased electricity 422.7 360.4 177.3 0
Category 2: Purchased district heating 248.1 261.2 216.9 208.0
Category 3: Purchased district cooling 17.9 17.9 17.9 15.0
Scope 2. Indirect emissions, location-based
Category 1: Purchased electricity 208.4 232.4 200.0 206.0
Category 2: Purchased district heating 248.1 261.2 216.9 208.0
Category 3: Purchased district cooling 7.9 17.9 17.9 15.0
Scope 3. Other indirect emissions
Category 1: Purchased products and services 3,467.5 3,407.5 3,169.6 3,728.4
Category 2: Leased products 325.9 351.9 365.1 293.0
Category 3: Business travel 13.4 8.4 2.7 2.7
Total emissions, tCO2e 4,506.1 4,414.9 3,951.6 4,251.3
Emission intensity, tCO2e / employee 15.0 14.7 13.2 14.2
Calculated as a reference according to GHG Protocol guidelines. Purchase-based figures are used for total emissions.
186
Cor
por
ate
Soci
al R
esp
ons
ibili
ty R
epor
t 20
21
Contents OmaSp in brief Corporate Governance Report of Board of Directors Financial
StatementsCorporate Social
Responsibility Report
Corporate Social Responsibility Report Survey of impacts and risks related to climate change Carbon Footprint Report
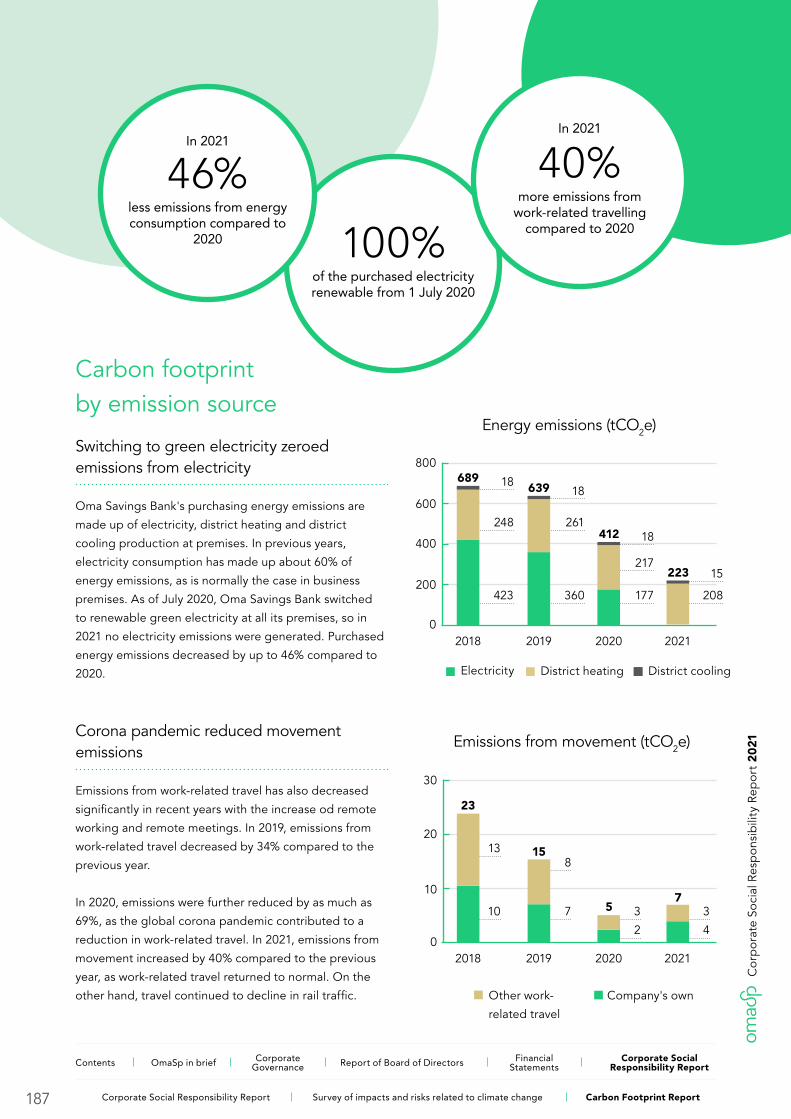
Carbon footprint by emission source
Switching to green electricity zeroed emissions from electricity
Oma Savings Bank's purchasing energy emissions are
made up of electricity, district heating and district
cooling production at premises. In previous years,
electricity consumption has made up about 60% of
energy emissions, as is normally the case in business
premises. As of July 2020, Oma Savings Bank switched
to renewable green electricity at all its premises, so in
2021 no electricity emissions were generated. Purchased
energy emissions decreased by up to 46% compared to
2020.
Corona pandemic reduced movement emissions
Emissions from work-related travel has also decreased
significantly in recent years with the increase od remote
working and remote meetings. In 2019, emissions from
work-related travel decreased by 34% compared to the
previous year.
In 2020, emissions were further reduced by as much as
69%, as the global corona pandemic contributed to a
reduction in work-related travel. In 2021, emissions from
movement increased by 40% compared to the previous
year, as work-related travel returned to normal. On the
other hand, travel continued to decline in rail traffic.
In 2021
46%less emissions from energy consumption compared to
2020 100% of the purchased electricity renewable from 1 July 2020
In 2021
40%more emissions from
work-related travelling compared to 2020
Energy emissions (tCO2e)
0
200
400
600
800
2018
689
Electricity
423
District heating
248
District cooling
18
2019
639
360
261
18
2020
412
177
217
18
2021
223
208
15
Emissions from movement (tCO2e)
2018
23
Company's own
10
Other work-
related travel
13
2019
15
7
8
2020
5
2
3
2021
7
4
3
0
10
20
30
187
Cor
por
ate
Soci
al R
esp
ons
ibili
ty R
epor
t 20
21
Contents OmaSp in brief Corporate Governance Report of Board of Directors Financial
StatementsCorporate Social
Responsibility Report
Corporate Social Responsibility Report Survey of impacts and risks related to climate change Carbon Footprint Report
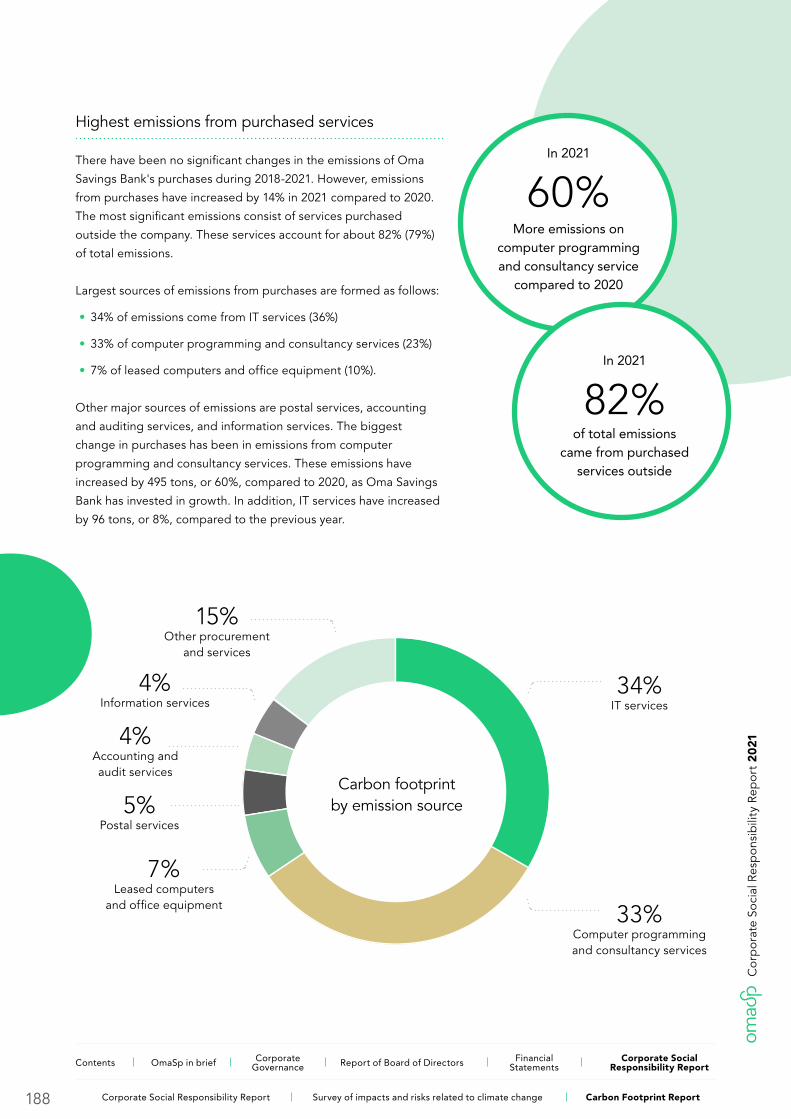
Highest emissions from purchased services
There have been no significant changes in the emissions of Oma
Savings Bank's purchases during 2018-2021. However, emissions
from purchases have increased by 14% in 2021 compared to 2020.
The most significant emissions consist of services purchased
outside the company. These services account for about 82% (79%)
of total emissions.
Largest sources of emissions from purchases are formed as follows:
• 34% of emissions come from IT services (36%)
• 33% of computer programming and consultancy services (23%)
• 7% of leased computers and office equipment (10%).
Other major sources of emissions are postal services, accounting
and auditing services, and information services. The biggest
change in purchases has been in emissions from computer
programming and consultancy services. These emissions have
increased by 495 tons, or 60%, compared to 2020, as Oma Savings
Bank has invested in growth. In addition, IT services have increased
by 96 tons, or 8%, compared to the previous year.
In 2021
60%More emissions on
computer programming and consultancy service
compared to 2020
In 2021
82%of total emissions
came from purchased services outside
Carbon footprint by emission source
34%IT services
33%Computer programming and consultancy services
7%Leased computers
and office equipment
5%Postal services
4%Accounting and audit services
4%Information services
15%Other procurement
and services
188
Cor
por
ate
Soci
al R
esp
ons
ibili
ty R
epor
t 20
21
Contents OmaSp in brief Corporate Governance Report of Board of Directors Financial
StatementsCorporate Social
Responsibility Report
Corporate Social Responsibility Report Survey of impacts and risks related to climate change Carbon Footprint Report

0 300 600 900 1 200 1 500
CO2 emissions from purchases (tCO2e)
IT services
2021
1,351
2020
1,255
2019
1,300
2018
1,206
Computer programming and consultancy services
1,322827
783885
Leased computers ja office equipments293
365352
325
Postal service182
245278290
Accounting and audit service142
175190
152
Information services144
117109
92
Premises cleaning and outdoor maintenance
110110111103
Paper-products55
78106
231
Computers and other office equipments6869
12483
Telecommunication services69
588278
Occupational health care55425154
Advertising and marketing services383142
77
Coffee expense22
313228
Educational services293053
29
Insurance and financial services32272721
Leisure activities29243122
Security and investigation services17192115
Repair and installation services6.516
5142
Radio, television and other communications51
9.69.65.4
Work clothes5.95.94.1
53
189
Cor
por
ate
Soci
al R
esp
ons
ibili
ty R
epor
t 20
21
Contents OmaSp in brief Corporate Governance Report of Board of Directors Financial
StatementsCorporate Social
Responsibility Report
Corporate Social Responsibility Report Survey of impacts and risks related to climate change Carbon Footprint Report
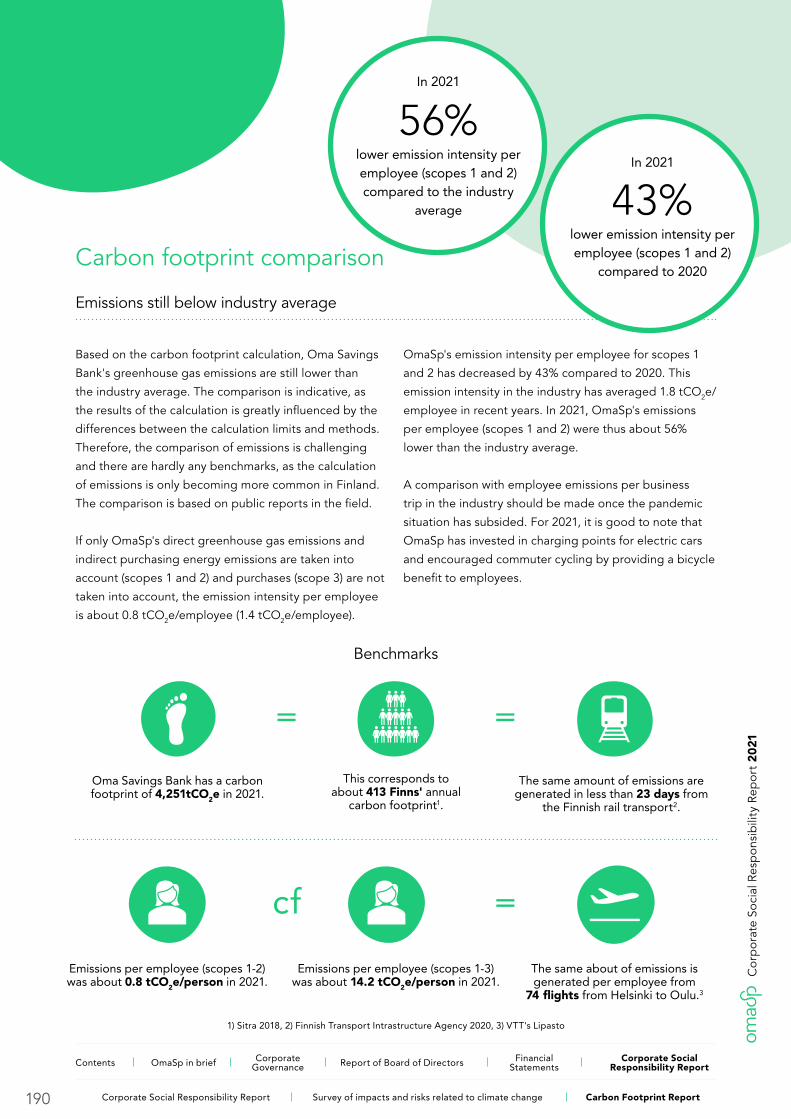
Carbon footprint comparison
Emissions still below industry average
Based on the carbon footprint calculation, Oma Savings
Bank's greenhouse gas emissions are still lower than
the industry average. The comparison is indicative, as
the results of the calculation is greatly influenced by the
differences between the calculation limits and methods.
Therefore, the comparison of emissions is challenging
and there are hardly any benchmarks, as the calculation
of emissions is only becoming more common in Finland.
The comparison is based on public reports in the field.
If only OmaSp's direct greenhouse gas emissions and
indirect purchasing energy emissions are taken into
account (scopes 1 and 2) and purchases (scope 3) are not
taken into account, the emission intensity per employee
is about 0.8 tCO2e/employee (1.4 tCO2e/employee).
OmaSp's emission intensity per employee for scopes 1
and 2 has decreased by 43% compared to 2020. This
emission intensity in the industry has averaged 1.8 tCO2e/
employee in recent years. In 2021, OmaSp's emissions
per employee (scopes 1 and 2) were thus about 56%
lower than the industry average.
A comparison with employee emissions per business
trip in the industry should be made once the pandemic
situation has subsided. For 2021, it is good to note that
OmaSp has invested in charging points for electric cars
and encouraged commuter cycling by providing a bicycle
benefit to employees.
In 2021
56%lower emission intensity per employee (scopes 1 and 2) compared to the industry
average
In 2021
43%lower emission intensity per employee (scopes 1 and 2)
compared to 2020
Benchmarks
Oma Savings Bank has a carbon footprint of 4,251tCO2e in 2021.
This corresponds to about 413 Finns' annual
carbon footprint1.
The same amount of emissions are generated in less than 23 days from
the Finnish rail transport2.
Emissions per employee (scopes 1-2) was about 0.8 tCO2e/person in 2021.
Emissions per employee (scopes 1-3) was about 14.2 tCO2e/person in 2021.
The same about of emissions is generated per employee from
74 flights from Helsinki to Oulu.3
1) Sitra 2018, 2) Finnish Transport Intrastructure Agency 2020, 3) VTT's Lipasto
= =
=cf
190
Cor
por
ate
Soci
al R
esp
ons
ibili
ty R
epor
t 20
21
Contents OmaSp in brief Corporate Governance Report of Board of Directors Financial
StatementsCorporate Social
Responsibility Report
Corporate Social Responsibility Report Survey of impacts and risks related to climate change Carbon Footprint Report