annual report 2021 - inchcape
TRANSCRIPT
INC
HC
APE A
NN
UAL REPO
RT AN
D A
CC
OU
NTS 2021
ANNUAL REPORT AND ACCOUNTS 2021
Note: Spine set to 12.5mm. Please adjust if necessary
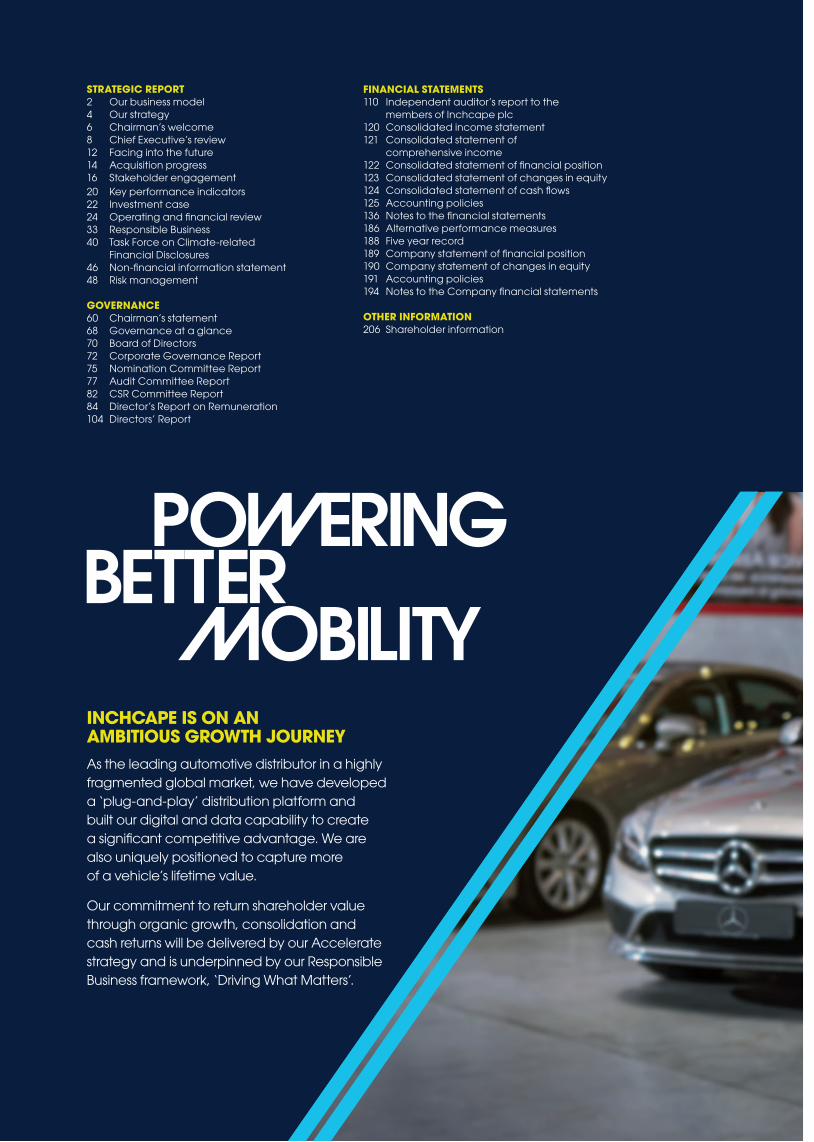
INCHCAPE IS ON AN AMBITIOUS GROWTH JOURNEYAs the leading automotive distributor in a highly fragmented global market, we have developed a ‘plug-and-play’ distribution platform and built our digital and data capability to create a significant competitive advantage. We are also uniquely positioned to capture more of a vehicle’s lifetime value.
Our commitment to return shareholder value through organic growth, consolidation and cash returns will be delivered by our Accelerate strategy and is underpinned by our Responsible Business framework, ‘Driving What Matters’.
STRATEGIC REPORT2 Our business model4 Our strategy6 Chairman’s welcome8 Chief Executive’s review12 Facing into the future14 Acquisition progress16 Stakeholder engagement20 Key performance indicators22 Investment case24 Operating and financial review33 Responsible Business40 Task Force on Climate-related
Financial Disclosures46 Non-financial information statement48 Risk management
GOVERNANCE60 Chairman’s statement68 Governance at a glance70 Board of Directors72 Corporate Governance Report75 Nomination Committee Report77 Audit Committee Report82 CSR Committee Report84 Director’s Report on Remuneration104 Directors’ Report
FINANCIAL STATEMENTS110 Independent auditor’s report to the
members of Inchcape plc120 Consolidated income statement121 Consolidated statement of
comprehensive income122 Consolidated statement of financial position123 Consolidated statement of changes in equity124 Consolidated statement of cash flows125 Accounting policies136 Notes to the financial statements186 Alternative performance measures188 Five year record189 Company statement of financial position190 Company statement of changes in equity191 Accounting policies194 Notes to the Company financial statements
OTHER INFORMATION206 Shareholder information
HIGHLIGHTSRevenue
£7.6bn2020: £6.8bn
Free cash flow1
£289m2020: £177m
Return on capital employed1
30%2020: 12%
Dividend per share
22.5p2020: 6.9p
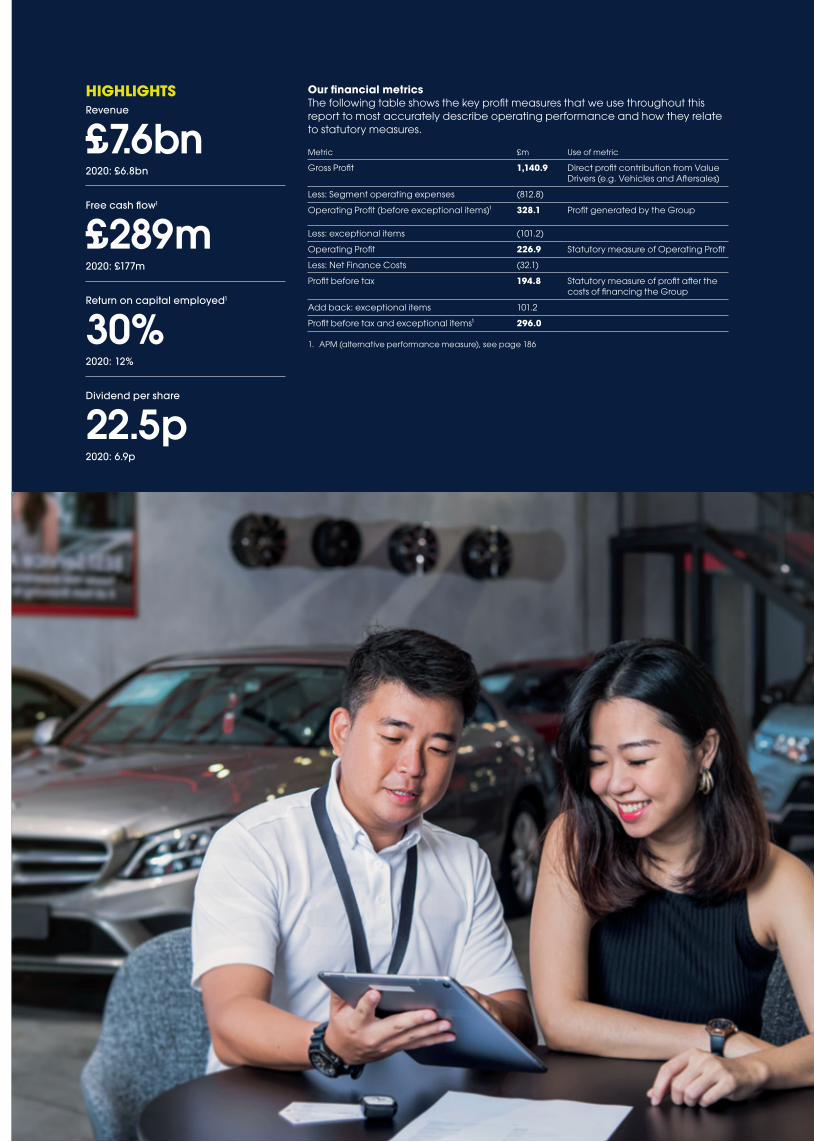
Our financial metricsThe following table shows the key profit measures that we use throughout this report to most accurately describe operating performance and how they relate to statutory measures.
Metric £m Use of metric
Gross Profit 1,140.9 Direct profit contribution from Value Drivers (e.g. Vehicles and Aftersales)
Less: Segment operating expenses (812.8)
Operating Profit (before exceptional items)¹ 328.1 Profit generated by the Group
Less: exceptional items (101.2)
Operating Profit 226.9 Statutory measure of Operating Profit
Less: Net Finance Costs (32.1)
Profit before tax 194.8 Statutory measure of profit after the costs of financing the Group
Add back: exceptional items 101.2
Profit before tax and exceptional items¹ 296.0
1. APM (alternative performance measure), see page 186

OUR BUSINESS MODEL: DIFFERENTIATED DISTRIBUTION
“BRINGING MOBILITY TO THE WORLD’S COMMUNITIES – FOR TODAY, FOR TOMORROW AND FOR THE THE BETTER”
AT A GLANCE
£7.6bnRevenue
40+Brand partners
175+Years of successful international trade
14,500+Employees
OUR VALUE CHAINInchcape’s value chain comprises six key elements which provide full spectrum ‘Differentiated Distribution’ services for our original equipment manufacturer (OEM) partners:
Product planning Using our local market expertise to inform certification and vehicle ordering decisions (model types and specifications).
Logistics Operating comprehensive post-factory connections to deliver vehicles and parts in our markets.
Brand and marketing Proposition development, brand positioning (including price setting) and national marketing, aimed to maximise market share for our partners.
Channel management Defining and building the optimal channels to reach consumers and businesses covering network management, digital, and omni-channel. This also includes selection and training of independent dealers, and ongoing performance management.
Retail services Bringing our omni-channel platform to customers to deliver world-class, digital-first experiences across our OEM and market portfolio.
Aftermarket services Distribution of parts, and customer and vehicle lifecycle management including aftersales services via the omni-channel retail network.
Our value chain is differentiated from others by our investments in digital customer experience, in data analytics, our global connected platform – which enables us to deploy our processes consistently worldwide – and deep local market expertise.
Inchcape is the world’s leading independent automotive distributor, operating in over 40 markets and geographies across Asia, Australasia and the Pacific; the Americas; Africa; Europe and the UK
2 INCHCAPE ANNUAL REPORT AND ACCOUNTS 2021
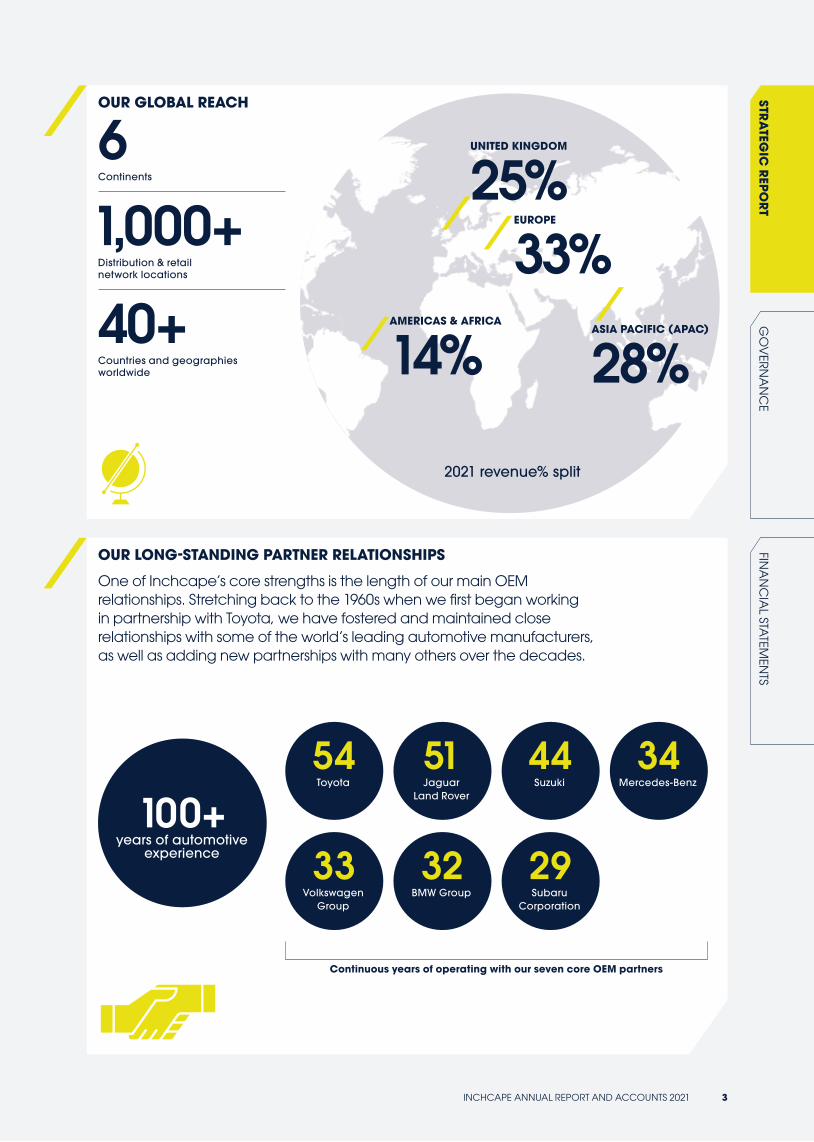
ASIA PACIFIC (APAC)
28%
EUROPE
33%AMERICAS & AFRICA
14%
UNITED KINGDOM
25%
2021 revenue% split
OUR GLOBAL REACH
6Continents
1,000+Distribution & retail network locations
40+Countries and geographies worldwide
OUR LONG-STANDING PARTNER RELATIONSHIPS
One of Inchcape’s core strengths is the length of our main OEM relationships. Stretching back to the 1960s when we first began working in partnership with Toyota, we have fostered and maintained close relationships with some of the world’s leading automotive manufacturers, as well as adding new partnerships with many others over the decades.
100+years of automotive
experience
54Toyota
34Mercedes-Benz
51Jaguar
Land Rover
33Volkswagen
Group
44Suzuki
32BMW Group
29Subaru
Corporation
Continuous years of operating with our seven core OEM partners
INCHCAPE ANNUAL REPORT AND ACCOUNTS 2021 3
GO
VER
NA
NC
EFIN
AN
CIA
L STATEM
ENTS
STRA
TEGIC
REPO
RT
DISTRIBUTION EXCELLENCE VEHICLE LIFECYCLE SERVICES
OUR STRATEGY
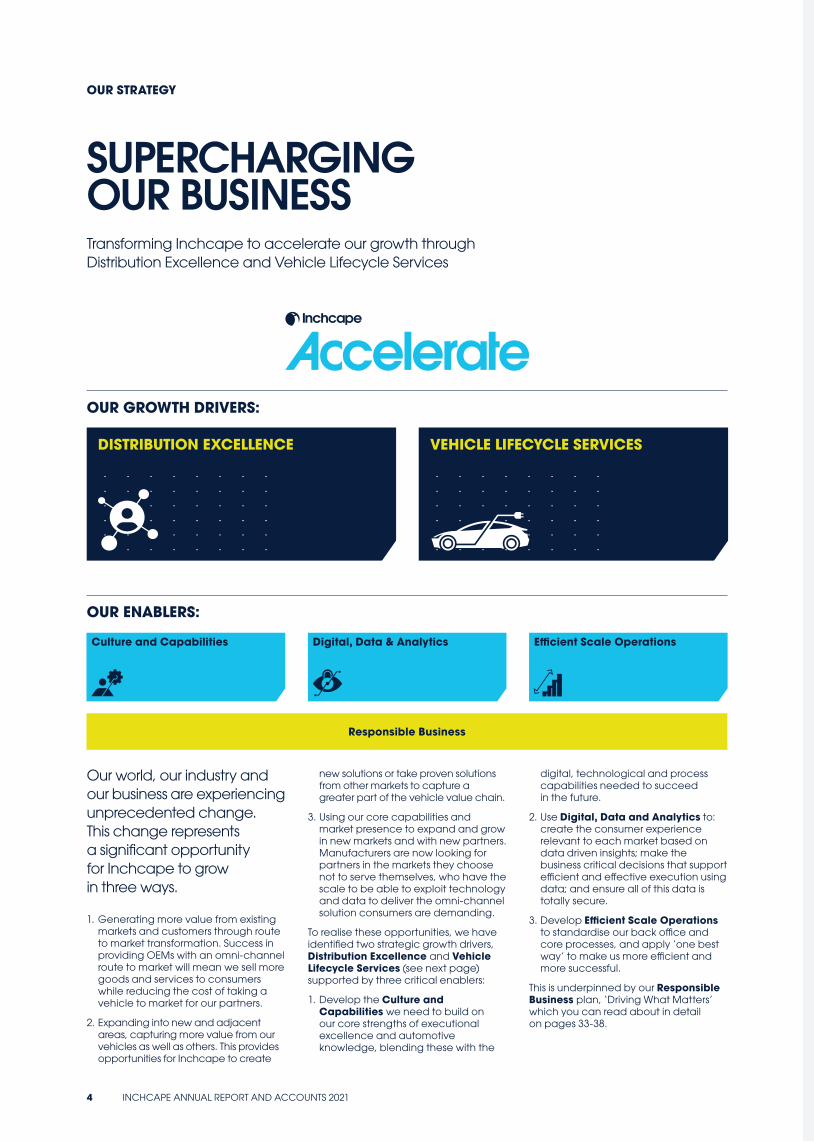
SUPERCHARGING OUR BUSINESSTransforming Inchcape to accelerate our growth through Distribution Excellence and Vehicle Lifecycle Services
OUR GROWTH DRIVERS:
OUR ENABLERS:
Culture and Capabilities Digital, Data & Analytics Efficient Scale Operations
Responsible Business
Our world, our industry and our business are experiencing unprecedented change. This change represents a significant opportunity for Inchcape to grow in three ways.
1. Generating more value from existing markets and customers through route to market transformation. Success in providing OEMs with an omni-channel route to market will mean we sell more goods and services to consumers while reducing the cost of taking a vehicle to market for our partners.
2. Expanding into new and adjacent areas, capturing more value from our vehicles as well as others. This provides opportunities for Inchcape to create
new solutions or take proven solutions from other markets to capture a greater part of the vehicle value chain.
3. Using our core capabilities and market presence to expand and grow in new markets and with new partners. Manufacturers are now looking for partners in the markets they choose not to serve themselves, who have the scale to be able to exploit technology and data to deliver the omni-channel solution consumers are demanding.
To realise these opportunities, we have identified two strategic growth drivers, Distribution Excellence and Vehicle Lifecycle Services (see next page) supported by three critical enablers:
1. Develop the Culture and Capabilities we need to build on our core strengths of executional excellence and automotive knowledge, blending these with the
digital, technological and process capabilities needed to succeed in the future.
2. Use Digital, Data and Analytics to: create the consumer experience relevant to each market based on data driven insights; make the business critical decisions that support efficient and effective execution using data; and ensure all of this data is totally secure.
3. Develop Efficient Scale Operations to standardise our back office and core processes, and apply ‘one best way’ to make us more efficient and more successful.
This is underpinned by our Responsible Business plan, ‘Driving What Matters’ which you can read about in detail on pages 33-38.
4 INCHCAPE ANNUAL REPORT AND ACCOUNTS 2021
RetailServices
A�ermarketServices
Product Planning
Channel Management
Logistics
Brand &Marketing
Digital CustomerExperience
Local Market
Expertise
DataAnalytics
Connected Global
Platforms
I N C H C A P E
DI F F E R E N T I A T E D D I S T R I B U
T I ON
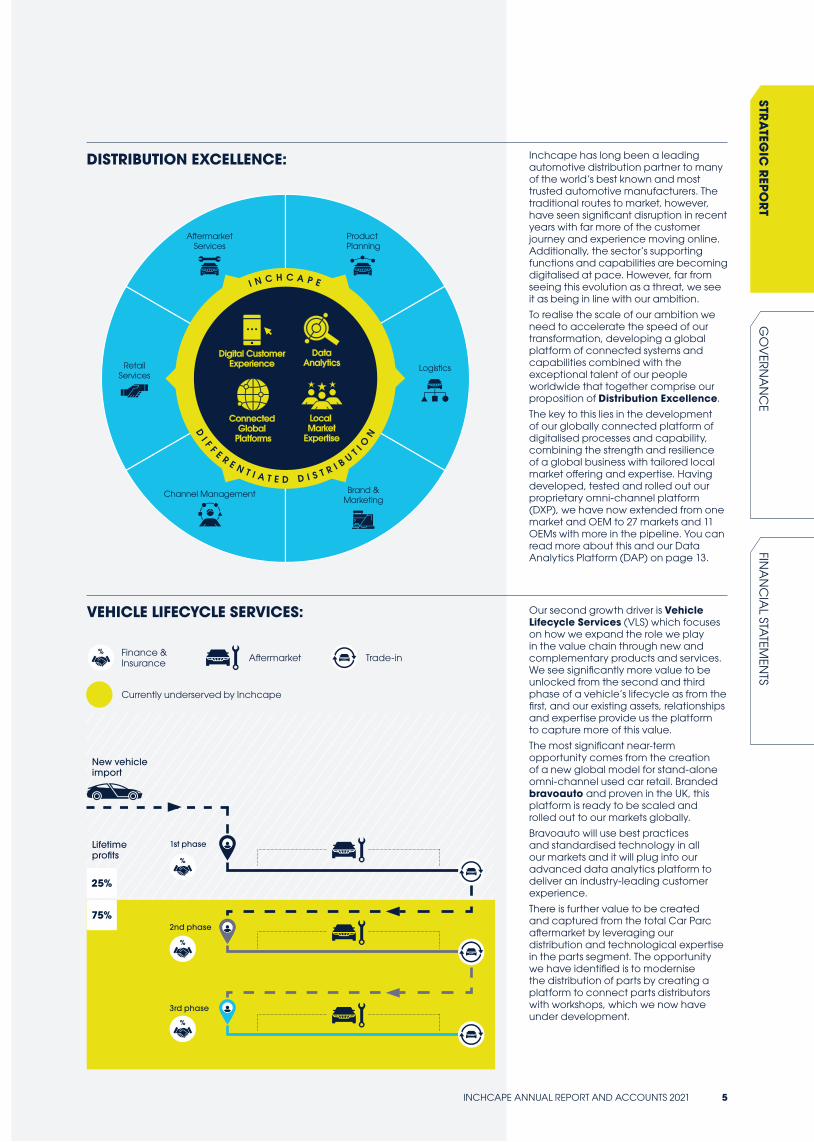
Inchcape has long been a leading automotive distribution partner to many of the world’s best known and most trusted automotive manufacturers. The traditional routes to market, however, have seen significant disruption in recent years with far more of the customer journey and experience moving online. Additionally, the sector’s supporting functions and capabilities are becoming digitalised at pace. However, far from seeing this evolution as a threat, we see it as being in line with our ambition.
To realise the scale of our ambition we need to accelerate the speed of our transformation, developing a global platform of connected systems and capabilities combined with the exceptional talent of our people worldwide that together comprise our proposition of Distribution Excellence.
The key to this lies in the development of our globally connected platform of digitalised processes and capability, combining the strength and resilience of a global business with tailored local market offering and expertise. Having developed, tested and rolled out our proprietary omni-channel platform (DXP), we have now extended from one market and OEM to 27 markets and 11 OEMs with more in the pipeline. You can read more about this and our Data Analytics Platform (DAP) on page 13.
Our second growth driver is Vehicle Lifecycle Services (VLS) which focuses on how we expand the role we play in the value chain through new and complementary products and services. We see significantly more value to be unlocked from the second and third phase of a vehicle’s lifecycle as from the first, and our existing assets, relationships and expertise provide us the platform to capture more of this value.
The most significant near-term opportunity comes from the creation of a new global model for stand-alone omni-channel used car retail. Branded bravoauto and proven in the UK, this platform is ready to be scaled and rolled out to our markets globally.
Bravoauto will use best practices and standardised technology in all our markets and it will plug into our advanced data analytics platform to deliver an industry-leading customer experience.
There is further value to be created and captured from the total Car Parc aftermarket by leveraging our distribution and technological expertise in the parts segment. The opportunity we have identified is to modernise the distribution of parts by creating a platform to connect parts distributors with workshops, which we now have under development.
DISTRIBUTION EXCELLENCE:
VEHICLE LIFECYCLE SERVICES:
2nd phase
Finance & Insurance
3rd phase
1st phaseLifetime profits
New vehicle import
75%
25%
Trade-in
Currently underserved by Inchcape
Aftermarket
INCHCAPE ANNUAL REPORT AND ACCOUNTS 2021 5
GO
VER
NA
NC
EFIN
AN
CIA
L STATEM
ENTS
STRA
TEGIC
REPO
RT
%
%
%
%
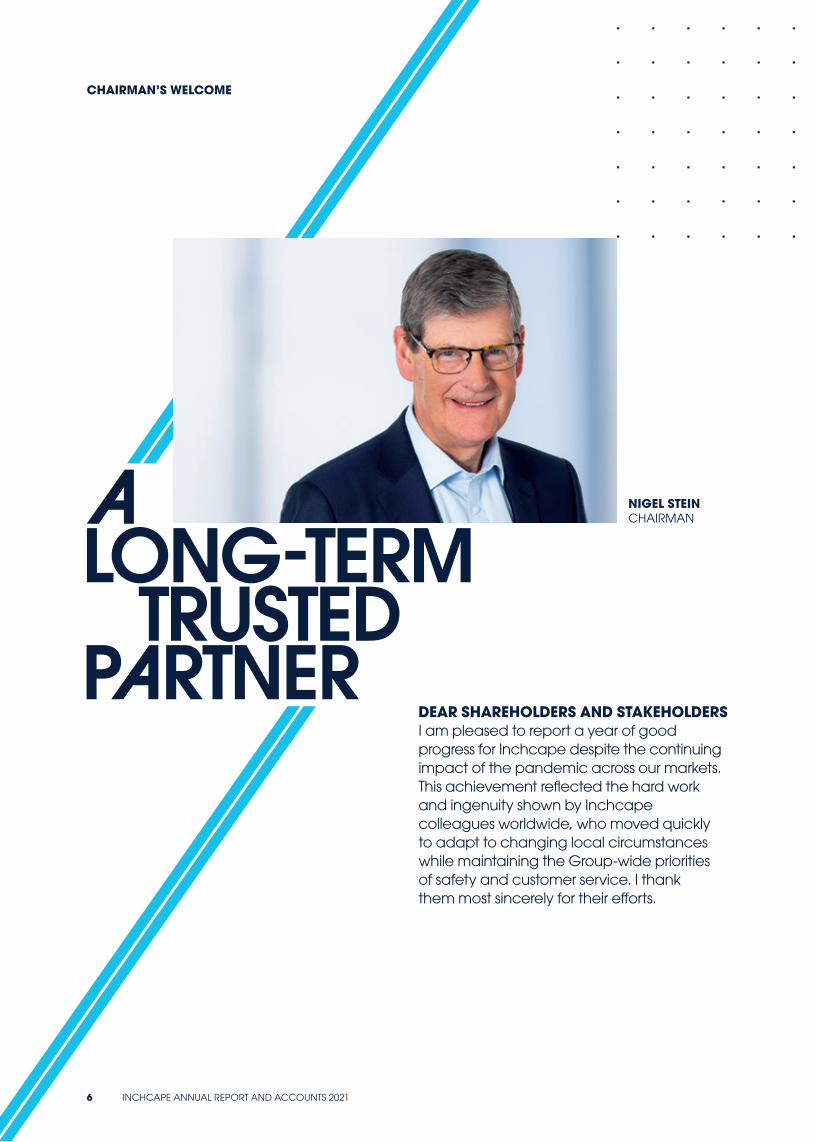
CHAIRMAN’S WELCOME
DEAR SHAREHOLDERS AND STAKEHOLDERSI am pleased to report a year of good progress for Inchcape despite the continuing impact of the pandemic across our markets. This achievement reflected the hard work and ingenuity shown by Inchcape colleagues worldwide, who moved quickly to adapt to changing local circumstances while maintaining the Group-wide priorities of safety and customer service. I thank them most sincerely for their efforts.
A LONG-TERM TRUSTED PARTNER
NIGEL STEINCHAIRMAN
6 INCHCAPE ANNUAL REPORT AND ACCOUNTS 2021
One of the challenges faced in the year was the disruption to automotive supply chains caused by a shortage of components, particularly electronic chips, which progressively impacted OEM vehicle production. The inability of output to match recovering demand held back our sales but, combined with proactive management of appropriate discounts and product mix, led to better margins on both new and used vehicles.
Supply chain disruption seems likely to continue and we expect to have to live with a shortage of new vehicles well into 2022.
As well as achieving a pleasing financial out-turn, the Inchcape team took important strides during the year to improve the business for the future. This included significantly enhancing our digital capabilities to improve our omni-channel customer experience, to step-up our data analytics capability and to streamline our back-office processes. The latter is important to our ability to successfully integrate acquisitions, a key opportunity for future growth.
STRATEGIC PROGRESSThe new “Accelerate” strategy was launched with two key growth pillars: Distribution Excellence – building on the progress made through Ignite – and VLS, in addition to continuing our long-standing strategy of inorganic growth through new contracts and acquisitions. We believe this strategy, which is set out in more detail on pages 4 and 5, will put Inchcape ahead of the competition – offering OEM partners the most professional, international and digital distribution partner who they can trust to represent them in fast growing, developing markets.
In last year’s report, I referred to the increasing pace of electrification of automotive drivetrains. That pace has accelerated and we are seeing that in several key markets OEMs with better electric vehicle (EV) offerings are gaining share. We continue to monitor the market closely and remain confident that Inchcape’s OEM partners, whilst not always being “first to market”, have the technology, capability and partnerships to bring long-term success.
We have been keen to partner more with winning Chinese brands who are expanding into international markets and were pleased to sign our first distribution agreement with Geely Auto in Chile, adding to our presence in that market. This, and other acquisitions announced during the year, will broaden the Group’s profit base across different geographies reducing the historical reliance on Asia, Singapore and Hong Kong in particular.
Businesses in emerging markets often come with additional political risk which, as set out in the Group’s Risk Management report, is part of the Inchcape business model of representing OEM partners in lower volume global markets. The Board carefully review the risk environment, and its risk appetite, when considering potential acquisitions.
Not withstanding the sale of the St. Petersburg business during 2021, the Board continues to closely monitor developments in Russia to assess any impact on our business in that market.
BOARDWe were delighted that Nayantara Bali joined the Board in May, bringing to Inchcape her experience and insights of consumer markets in Asia. We believe the Board greatly benefits from having a Director based in that important region.
Till Vestring who has served on the Board for 10 years, will step down at the 2022 Annual General Meeting (AGM) having prolonged his tenure to help induct Nayantara during this time of Covid-19 restricted travel. We are indebted to Till for the farsighted and independent thinking he has brought to the Board and the excellent contribution he made in his time at Inchcape.
As announced in January 2022, I am also delighted that Sarah Kuijlaars has joined the Board as a Non-Executive Director. Sarah is currently Chief Financial Officer at De Beers plc. Further information is given in the Nomination Committee Report on page 75.
DIVIDENDSBased on the strong financial performance for the year, and the unusual circumstances of last year, the Board paid an interim 2021 dividend at a higher level than its normal practice of one third of the prior year dividend. We intend to revert to the usual one third of prior year dividend calculation in future years.
The Group remains committed to a dividend policy which pays out 40% of net income per annum. We are now pleased to recommend a final dividend of 16.1p, bringing the total dividend for the year to 22.5p.
SHARE BUYBACKThe extremely strong cash generation of the Group also allowed us to restart a share buyback programme in August 2021 with a £100m buyback completed in February 2022.
Our cash allocation strategy of prioritising organic growth, dividends and bolt-on acquisitions, before returning surplus cash to shareholders, remains in place.
FUTURE PROSPECTSIn the next few months, performance seems likely to be restricted to some degree by continuing supply chain disruption and the potential impact of the continuing pandemic. The Board, however, remains very confident in the Group’s medium and long-term prospects, based on the strength of its market positions and successful implementation of the Accelerate strategy.
Directors’ approval of the Strategic Report The 2021 Strategic Report, from pages 2 to 58, were reviewed and approved by the Board of Directors on 25 February 2022
NIGEL STEINCHAIRMAN
INCHCAPE ANNUAL REPORT AND ACCOUNTS 2021 7
GO
VER
NA
NC
EFIN
AN
CIA
L STATEM
ENTS
STRA
TEGIC
REPO
RT
GROUP CHIEF EXECUTIVE’S REVIEW
DUNCAN TAITGROUP CEO
I am pleased to report on a year of significant momentum for the Group. We’ve seen sharp recovery, made great strategic progress and, to a large extent, a return to some of the growth trajectory more familiar to a pre-Covid Inchcape.
AN OUTSTANDING BUSINESS WITH AN EXCITING FUTURE
8 INCHCAPE ANNUAL REPORT AND ACCOUNTS 2021
Like businesses the world over, we faced some uncertainty at the start of the year because of the continued challenges brought by the pandemic. I am delighted to report, however, that we recovered well, adapted to new ways of working, and achieved a performance during 2021 that has exceeded expectations. It’s testament to the resilience of our business, and the determination and ingenuity of our people, that we performed ahead of the market and we emerged with great optimism for the future.
PERFORMANCEThe momentum we built coming out of the most severe restrictions of 2020 propelled the business to an excellent performance overall, thanks to the hard work of our thousands of colleagues around the world. Having joined the Group during the first year of the pandemic, seeing the resolve and resilience of our people left me in no doubt that we would quickly thrive again, and I am delighted to say this confidence was borne out in our results.
Revenues were £7.6bn, an increase of 12% on 2020 as we began our recovery to pre-pandemic levels. We delivered profit (before tax and exceptional items) of £296m, a 131% rise on the prior year and driven by both strong execution and higher vehicle gross margins. We were also highly cash generative in the year, booking free cash flow of £289m which has resulted in the further strengthening of our financial position.
We talked in our updates during the year about the global shortage of semiconductors which has affected manufacturers’ post-pandemic recovery. Although demand is high, there’s a significant impact on the supply of new vehicles and we are expecting constraints to continue well into 2022.
Despite the external challenges we have seen in 2021, our teams continued to deliver against expectations every day. They also continued to innovate at speed, to build our capabilities in digital, and to grow the business through acquisition and contract wins.
Additionally in 2021, we launched our new strategy and our Responsible Business plan, which you can read more about below. In all, we can look back on 2021 as a year of significant recovery and progress that I am confident will prove to be a springboard to accelerated performance and growth in the years to come.
STRATEGIC DEVELOPMENTIn last year’s Report, I described how we were embarking on a new phase of the Group’s journey. With strong foundations in place following a period of growth and forward momentum, our new strategy is all about preparing the Group for the future and has Distribution Excellence and Vehicle Lifecycle Services (VLS) at its heart.
We have called our new strategy ‘Accelerate’, and it will build on our strong foundations through cutting-edge digital technology and smart use of data as described on page 13.
Over the past year, we’ve made progress in rolling out Accelerate across the Group. In particular, we’ve advanced our digital capabilities in a number of important areas.
Our omni-channel platform, (known internally as DXP for Digital eXperience Platform) offers customers a seamless, continuous customer experience, however they choose to interact with us. At the start of the year, the platform was available in just one country. During 2021 we’ve extended its availability to 27 markets, with 11 OEMs now live on the platform. The initial signs are very exciting with the platform driving significantly better sales conversion rates.
DXP is part of a wider platform that we’ve been further developing during the past year. It spans a host of digital capabilities that I believe can position Inchcape as the undisputed number one distribution partner of choice for OEMs. DAP (our Digital Analytics Platform) is another component of this wider platform. It provides advanced analytics and machine learning, leveraging our data and driving smarter, faster and better business decisions which results in improved performance across lead management, customer retention and pricing.
During 2021, we established two digital delivery centres (DDCs) as we embarked on our technological transformation. There are already over 500 ‘Inchcapers’ working in the DDCs, providing 24/7 services and solutions
which has significantly increased our internal digital delivery capability. In the year we also established our Global Business Services in partnership with Cognizant to manage the majority of our transactional finance operations and enable smarter business partnering within the finance function.
Collectively, these services are helping the Group to be more responsive and efficient, providing an ecosystem of connected technology – a ‘plug and play’ platform for our OEM partners that facilitates their preferred route to market. I firmly believe this platform can help us build a highly effective automotive distribution capability and service for automotive partners.
While Distribution Excellence is one cornerstone of our Accelerate strategy, the other is centred around VLS which has untapped potential for us across all our markets. This will be all about placing more emphasis on capturing the lifetime value of both customers and vehicles.
Specifically, we have developed an approach to maximising the opportunity presented by the second and third stages of a vehicle’s lifecycle – in other words, its life beyond the original sale as a new vehicle. We’ll do this by providing an aggregator service in markets where the service doesn’t already exist; something that fits with our well-established approach of building distribution businesses in small to medium-sized markets. Our omni-channel used vehicle platform, bravoauto is now ready to scale and is rolling out globally. This represents an exciting new opportunity for us, as does our digital parts platform which is at an earlier stage of development but will also accelerate during 2022.
BUSINESS DEVELOPMENTIn line with our focus on markets with high growth potential, we continued to further expand our distribution footprint, agreeing deals that will add annualised revenue of £200m. In addition to leveraging our existing geographic and brand footprint, these deals will give us access to new markets and brand partners.
In December 2021 we announced an acquisition of a distribution business in the Caribbean, a new territory for the Group, where we will distribute vehicles for Suzuki, Mercedes-Benz, Subaru and Chrysler – a new OEM brand partner in our portfolio.
INCHCAPE ANNUAL REPORT AND ACCOUNTS 2021 9
GO
VER
NA
NC
EFIN
AN
CIA
L STATEM
ENTS
STRA
TEGIC
REPO
RT
GROUP CHIEF EXECUTIVE’S REVIEW CONTINUED
During 2021 we also signed a global strategic partnership with Geely (initially launching in Chile). We bolstered our presence in Guam with the acquisition of a distributor of commercial vehicles, and entered a number of new markets: Indonesia with Jaguar Land Rover; and Guatemala with Mercedes-Benz. Inchcape has now become Mercedes’ largest distribution partner in Central and South America.
Inchcape is already the leading independent global automotive distributor, and we are extending this leadership with our investment in technological capability. Our ‘plug and play’ distribution platform will help drive both organic and inorganic growth within our current geographic footprint and even faster expansion in new markets, with both existing and new partners.
RESPONDING TO AN EVOLVING SECTOROur industry is changing rapidly, and it is clear that electrification will play an important role in the transformation of the mobility industry. In the second half of 2021, electric vehicle (EV) sales and penetration accelerated in major markets despite the economic crisis caused by the Covid-19 pandemic.
While the consensus is that EVs will spearhead the transformation from use of the internal combustion engine, we believe hybrid will continue to form a major part of the transitional mix and that hydrogen will also have a role to play. The ‘e-volution’ is an exciting development within our industry and we are fully embracing the changes that it’s bringing. Consequently, we’re looking at a wide range of related topics and opportunities, such as the evolving nature of aftersales, re-skilling our employees and developing software that meets the needs of EV-led mobility.
Climate change presents a number of potential risks, as well as opportunities, which are monitored alongside changes in the developing powertrain mix. Some of the factors we consider include the varying pace
of EV adoption and infrastructure development across the markets in which we operate; the impact on aftersales of EVs becoming dominant in the market; and the evolution of energy sourcing as we transition to a significantly greater reliance on renewables. You can read more about this in our Task Force on Climate-related Financial Disclosures (“TCFD”) statement on pages 40-44.
RESPONSIBLE BUSINESSWe have made responsibility a fundamental part of our Accelerate strategy, underpinning our purpose of bringing mobility to the world’s communities – for today, for tomorrow and for the better.
During 2021, we developed our Responsible Business plan, called ‘Driving What Matters’, which focuses on our ‘4Ps’ of responsible business – Planet, People, Places and Practices. Collectively, these topics reach into those areas of our operations where we can make a positive difference for our stakeholders.
I believe what we are doing through ‘Driving What Matters’ will help create a stronger Inchcape, supporting sustainable growth and performance in the future. You can read more about our Responsible Business plan on pages 33-38.
We have also developed a new set of values for the Group as we seek to deliver great experiences through fresh thinking and working better together. You can read more about this on page 74.
OUR PEOPLEI would like to pay tribute to and thank all our colleagues for their contributions individually and as teams in a year of great progress and delivery.
Our people will play an essential role in helping us achieve the goals we’ve set out in our Accelerate strategy. Given the extent of the challenges and opportunities presented by our evolving sector, we have been evaluating the capabilities our
people will need both now and in the future. We have identified data leadership as a crucial capability, alongside our intent to develop our workforce so it can support our globally connected distribution platform.
I would also like to thank my colleagues on the Executive team for their leadership and teamwork during the last year. As we moved forwards with the launch of Accelerate we made some changes to the team, bringing George Ashford into the centre as Chief Transformation Officer. With the departure of James Brearley at the end of the year, George has also taken temporary leadership of the UK business. Ruslan Kinebas succeeded George as CEO of APAC, our most profitable region, and we were delighted to welcome Romeo Lacerda to lead Americas & Africa.
LOOKING AHEADThe Group’s strong performance in 2021 was supported by robust consumer demand and high vehicle gross margins (particularly in Retail), largely due to vehicle supply shortages. Looking ahead, our 2022 performance to date has seen a continuation of the trends experienced last year, although there is ongoing uncertainty relating to vehicle supply and the impact of the pandemic. We expect the Group to continue to make good progress with its strategic priorities in 2022. The strength of our business model and financial position means Inchcape is well placed to continue to grow profits and generate cash, and we are confident in the medium-term outlook set out at the Capital Markets Day in November:
• Distribution Excellence: mid-to-high single digit profit CAGR plus M&A
• Vehicle Lifecycle Services: >£50m of incremental profit
DUNCAN TAITGROUP CEO
10 INCHCAPE ANNUAL REPORT AND ACCOUNTS 2021
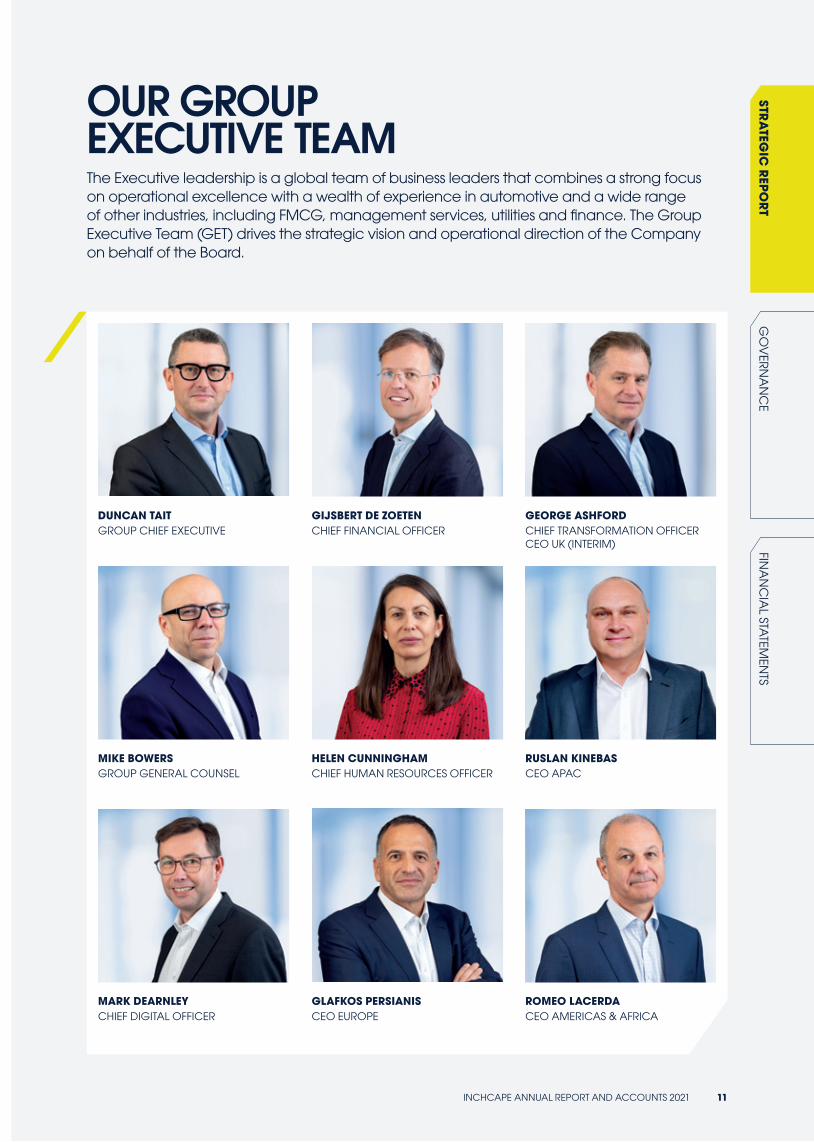
OUR GROUP EXECUTIVE TEAMThe Executive leadership is a global team of business leaders that combines a strong focus on operational excellence with a wealth of experience in automotive and a wide range of other industries, including FMCG, management services, utilities and finance. The Group Executive Team (GET) drives the strategic vision and operational direction of the Company on behalf of the Board.
DUNCAN TAITGROUP CHIEF EXECUTIVE
GLAFKOS PERSIANISCEO EUROPE
GIJSBERT DE ZOETENCHIEF FINANCIAL OFFICER
HELEN CUNNINGHAMCHIEF HUMAN RESOURCES OFFICER
ROMEO LACERDACEO AMERICAS & AFRICA
GEORGE ASHFORDCHIEF TRANSFORMATION OFFICER CEO UK (INTERIM)
RUSLAN KINEBASCEO APAC
MIKE BOWERSGROUP GENERAL COUNSEL
MARK DEARNLEYCHIEF DIGITAL OFFICER
INCHCAPE ANNUAL REPORT AND ACCOUNTS 2021 11
GO
VER
NA
NC
EFIN
AN
CIA
L STATEM
ENTS
STRA
TEGIC
REPO
RT
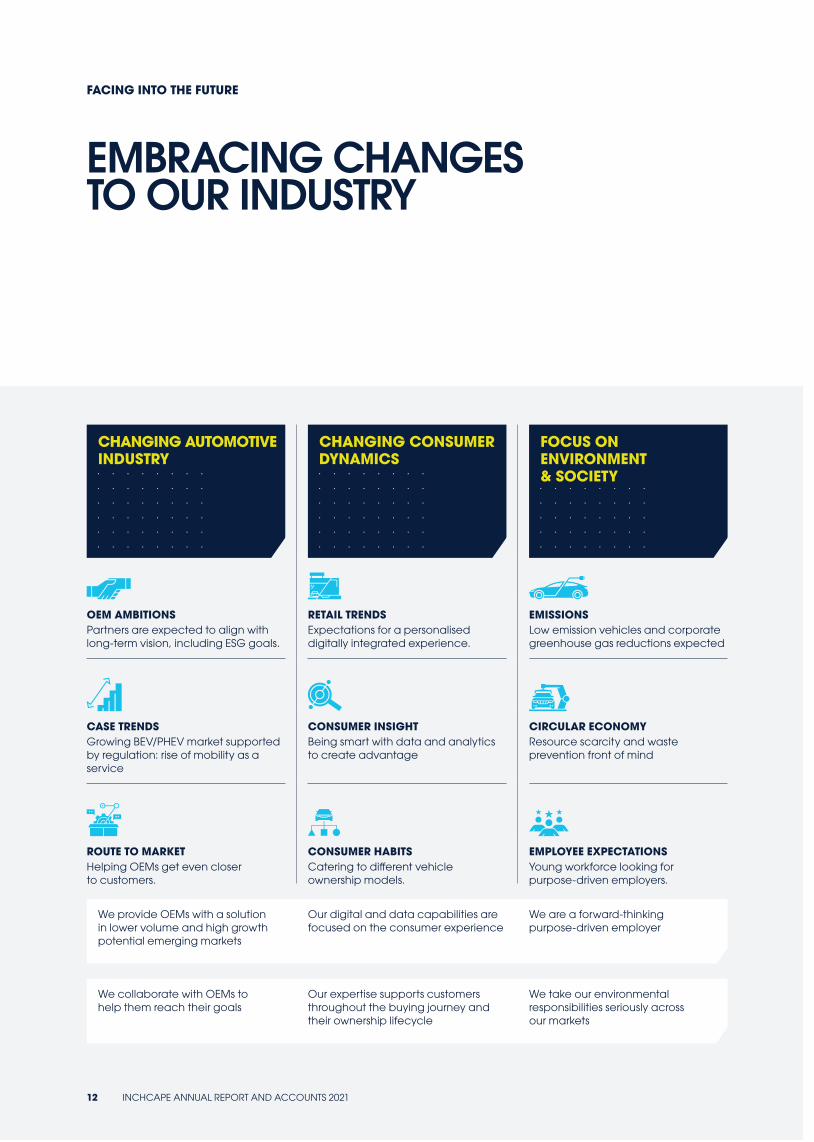
FACING INTO THE FUTURE
EMBRACING CHANGES TO OUR INDUSTRY
CHANGING AUTOMOTIVE INDUSTRY
CHANGING CONSUMER DYNAMICS
FOCUS ON ENVIRONMENT & SOCIETY
OEM AMBITIONSPartners are expected to align with long-term vision, including ESG goals.
RETAIL TRENDSExpectations for a personalised digitally integrated experience.
EMISSIONSLow emission vehicles and corporate greenhouse gas reductions expected
CASE TRENDSGrowing BEV/PHEV market supported by regulation: rise of mobility as a service
CONSUMER INSIGHTBeing smart with data and analytics to create advantage
CIRCULAR ECONOMYResource scarcity and waste prevention front of mind
ROUTE TO MARKETHelping OEMs get even closer to customers.
CONSUMER HABITSCatering to different vehicle ownership models.
EMPLOYEE EXPECTATIONS Young workforce looking for purpose-driven employers.
We provide OEMs with a solution in lower volume and high growth potential emerging markets
Our digital and data capabilities are focused on the consumer experience
We are a forward-thinking purpose-driven employer
We collaborate with OEMs to help them reach their goals
Our expertise supports customers throughout the buying journey and their ownership lifecycle
We take our environmental responsibilities seriously across our markets
12 INCHCAPE ANNUAL REPORT AND ACCOUNTS 2021

Across almost every sector, automotive retail trends and customer dynamics are changing with more of the experience people demand being driven online – now between 85-95% of all automotive customer journeys have a digital starting point.
The Digital Experience Platform, or DXP, is Inchcape’s proprietary omni-channel customer and dealer platform, providing access to our full range of configurable products and services, from first search and comparison through to aftersales care. It enables any combination of digital, in-person or blended interactions from fully online purchase with contactless delivery to combining online reservation with test drives and pickup in-store. This delivers a truly omni-channel experience for both our customers and our dealer staff.
The power of the platform lies in connecting our people’s expertise, the retail networks and our customers with our Data Analytics Platform (see below) and partnership with software providers such as Salesforce, Google and SAP. The platform collects data from every type of customer
The automotive industry is transforming rapidly and data analytics has the opportunity to deliver significant competitive advantage. The enabler Data & Digital is at the heart of Inchcape’s Accelerate strategy, and we will use analytics to improve every part of our value chain from Vehicle Sales, to Aftersales, to marketing and operations.
Since we began work on the strategy, we have developed a range of predictive machine-learning algorithms including:
• Lead scoring • Demand forecasting • Parts pricing• Churn prediction and• Sales promotion assessment
All these align with our growth drivers of Distribution Excellence and VLS. These use-cases have enabled us to unlock the value of our data helping us to drive up customer experience and commercial performance.
Analytics allows us to gain greater insight into all areas of our business. It translates data into intelligence that fuels our decision-making, providing us not only with operational improvements but also putting Inchcape at a competitive advantage.
Central capability to drive better decisions across the Group
Built on a platform with the ability to scale, quickly, to new markets
Capturing significant data for better customer and vehicle lifecycle management
DIGITAL EXPERIENCE PLATFORMOMNI-CHANNEL
DATA ANALYTICS PLATFORMDATA ANALYTICS
interaction both on– and offline, with which we then use predictive modelling to analyse customer behaviours. This supports both our dealer networks and, crucially, our OEM partners by delivering a customer experience that anticipates their needs and exceeds their expectations.
DXP is globally scalable – a factor that is critical to its success. It can be tailored to any market and OEM partner, and can be deployed in multiple languages and currencies. The approach to roll-out has been to ensure we develop the optimum solution for each OEM, working closely with them to make sure we have the right brand experience for each partner prior to implementing in market. Since the start of 2021 we have rapidly deployed DXP, building from one market and OEM at the start of the year (with Subaru in Australia, where we developed the platform) to our position by December: live in 27 markets with 11 OEM partners.
The roll-out will continue in 2022 as we bring more markets and OEMs onto the platform.
We have now developed a globally integrated data repository that feeds DAP/DXP and other enterprise-level initiatives, such as customer experience dashboards and regulatory compliance reporting.
This future-proofed data management strategy has helped us move away from legacy systems with fragmented, local databases that come with deployment and scalability challenges. Thanks to Inchcape’s DAP/DXP platforms both distribution and customer experiences are being reimagined to boost experience and performance.
Inchcape has also developed new ways of reaching customers and for them to access services through online/offline/hybrid channels. Fusing digital, data and analytics, the Company has improved its decision-making abilities to offer more digitalised and personalised customer journeys. In fact, each customer interaction is contextual to each market because they are all based on data-driven insights.
Inchcape’s digital empowerment has also driven more customer traffic to websites. With every visit we are able to track and analyse the data so that leads can be converted. It also helps us increase aftersales value, improve customer retention, and improve their potential to purchase again.
Providing consumers with a fully functioning digital showroom
INCHCAPE ANNUAL REPORT AND ACCOUNTS 2021 13
GO
VER
NA
NC
EFIN
AN
CIA
L STATEM
ENTS
STRA
TEGIC
REPO
RT
ACQUISITION PROGRESS
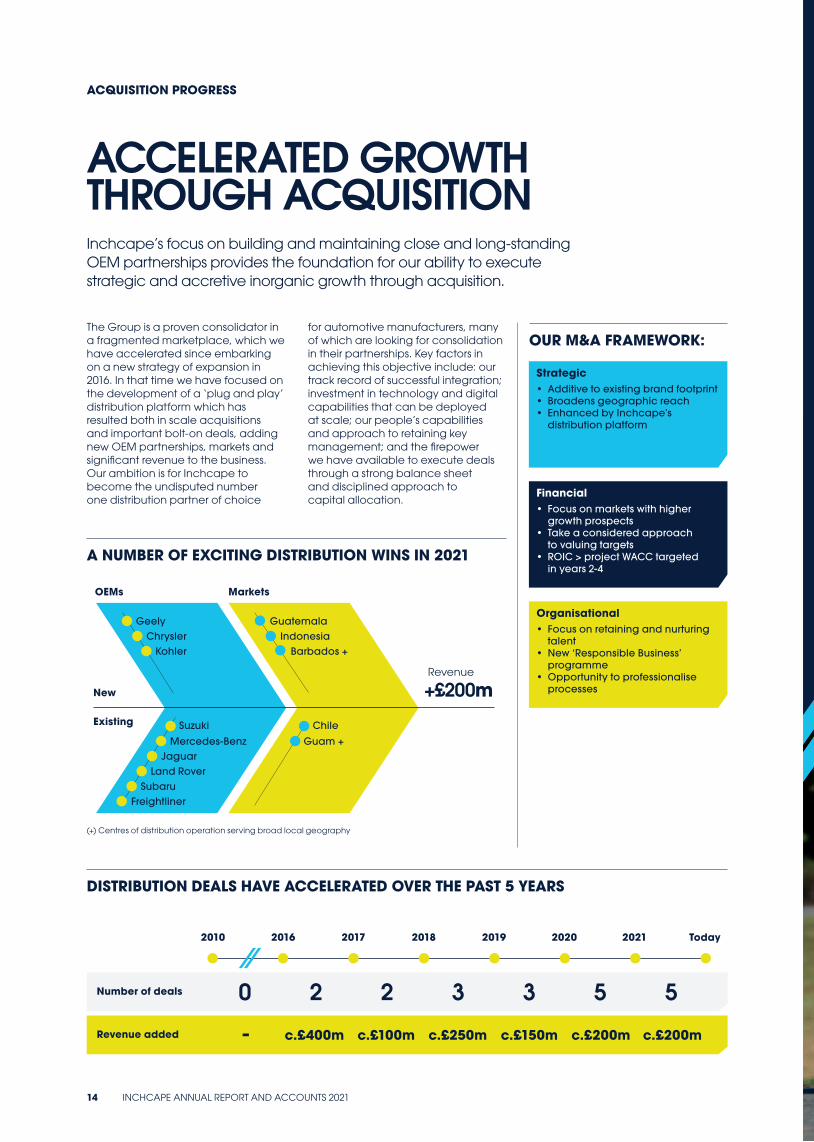
ACCELERATED GROWTH THROUGH ACQUISITIONInchcape’s focus on building and maintaining close and long-standing OEM partnerships provides the foundation for our ability to execute strategic and accretive inorganic growth through acquisition.
The Group is a proven consolidator in a fragmented marketplace, which we have accelerated since embarking on a new strategy of expansion in 2016. In that time we have focused on the development of a ‘plug and play’ distribution platform which has resulted both in scale acquisitions and important bolt-on deals, adding new OEM partnerships, markets and significant revenue to the business. Our ambition is for Inchcape to become the undisputed number one distribution partner of choice
for automotive manufacturers, many of which are looking for consolidation in their partnerships. Key factors in achieving this objective include: our track record of successful integration; investment in technology and digital capabilities that can be deployed at scale; our people’s capabilities and approach to retaining key management; and the firepower we have available to execute deals through a strong balance sheet and disciplined approach to capital allocation.
(+) Centres of distribution operation serving broad local geography
OUR M&A FRAMEWORK:
A NUMBER OF EXCITING DISTRIBUTION WINS IN 2021
DISTRIBUTION DEALS HAVE ACCELERATED OVER THE PAST 5 YEARS
Strategic• Additive to existing brand footprint• Broadens geographic reach• Enhanced by Inchcape’s
distribution platform
New
Existing
Financial• Focus on markets with higher
growth prospects• Take a considered approach
to valuing targets• ROIC > project WACC targeted
in years 2-4
Organisational• Focus on retaining and nurturing
talent• New ‘Responsible Business’
programme• Opportunity to professionalise
processes
OEMs
2010 2016 2017 2018 2019 2020 2021 Today
Markets
Geely
Land RoverSubaru
Freightliner
GuatemalaChrysler
Jaguar
IndonesiaKohler
Mercedes-Benz
Barbados +
Suzuki
+£200mRevenue
Number of deals 0
- c.£400m c.£100m c.£250m c.£150m c.£200m c.£200m
2 2 3 3 5 5
Revenue added
Guam +
Chile
14 INCHCAPE ANNUAL REPORT AND ACCOUNTS 2021
FINA
NC
IAL STA
TEMEN
TSG
OV
ERN
AN
CE
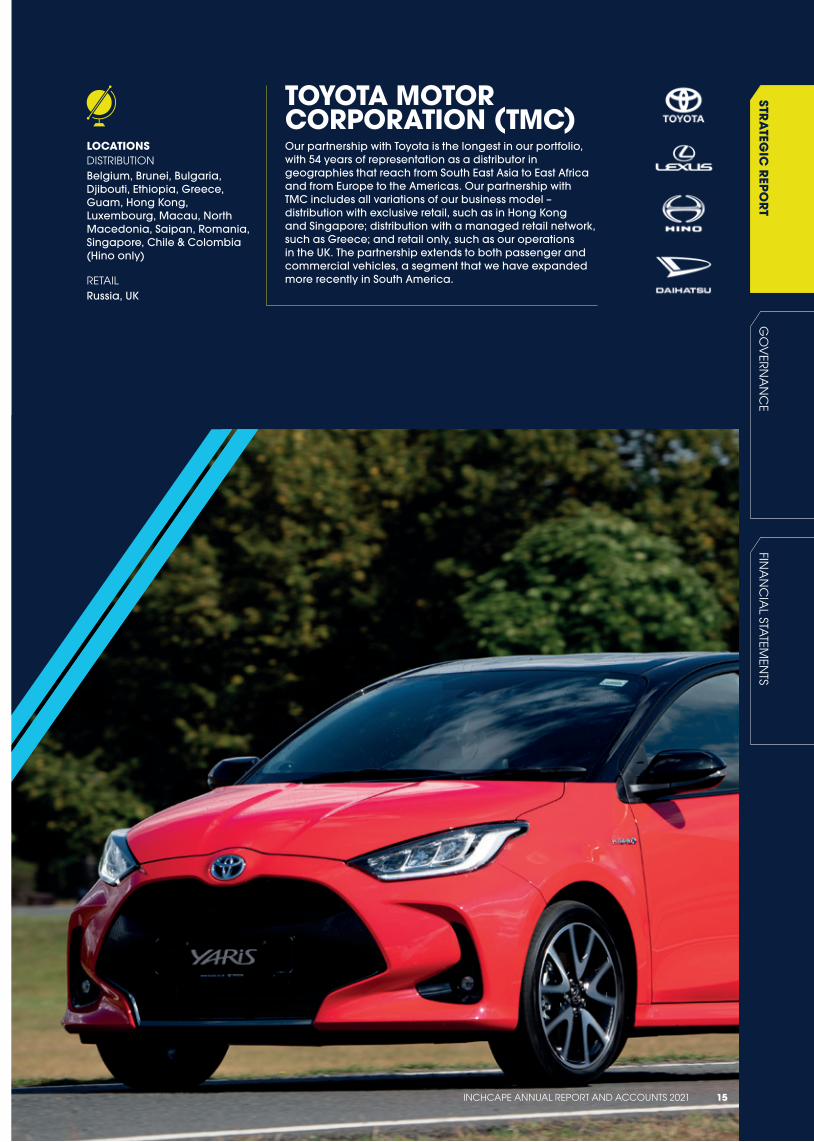
LOCATIONS DISTRIBUTIONBelgium, Brunei, Bulgaria, Djibouti, Ethiopia, Greece, Guam, Hong Kong, Luxembourg, Macau, North Macedonia, Saipan, Romania, Singapore, Chile & Colombia (Hino only)
RETAILRussia, UK
TOYOTA MOTOR CORPORATION (TMC)Our partnership with Toyota is the longest in our portfolio, with 54 years of representation as a distributor in geographies that reach from South East Asia to East Africa and from Europe to the Americas. Our partnership with TMC includes all variations of our business model – distribution with exclusive retail, such as in Hong Kong and Singapore; distribution with a managed retail network, such as Greece; and retail only, such as our operations in the UK. The partnership extends to both passenger and commercial vehicles, a segment that we have expanded more recently in South America.
STRA
TEGIC
REPO
RT
INCHCAPE ANNUAL REPORT AND ACCOUNTS 2021 15
STRA
TEGIC
REPO
RT
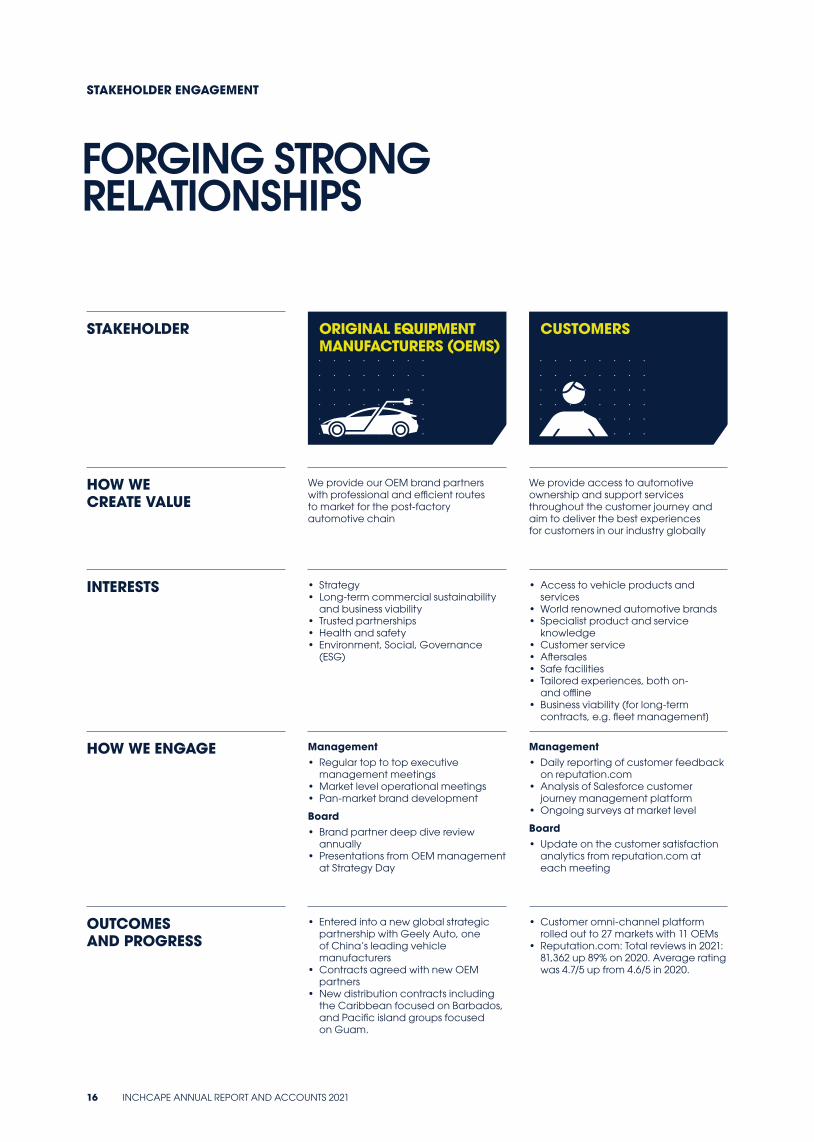
STAKEHOLDER ENGAGEMENT
FORGING STRONG RELATIONSHIPS
STAKEHOLDER ORIGINAL EQUIPMENT MANUFACTURERS (OEMS)
CUSTOMERS EMPLOYEES SHAREHOLDERS COMMUNITIES
HOW WE CREATE VALUE
We provide our OEM brand partners with professional and efficient routes to market for the post-factory automotive chain
We provide access to automotive ownership and support services throughout the customer journey and aim to deliver the best experiences for customers in our industry globally
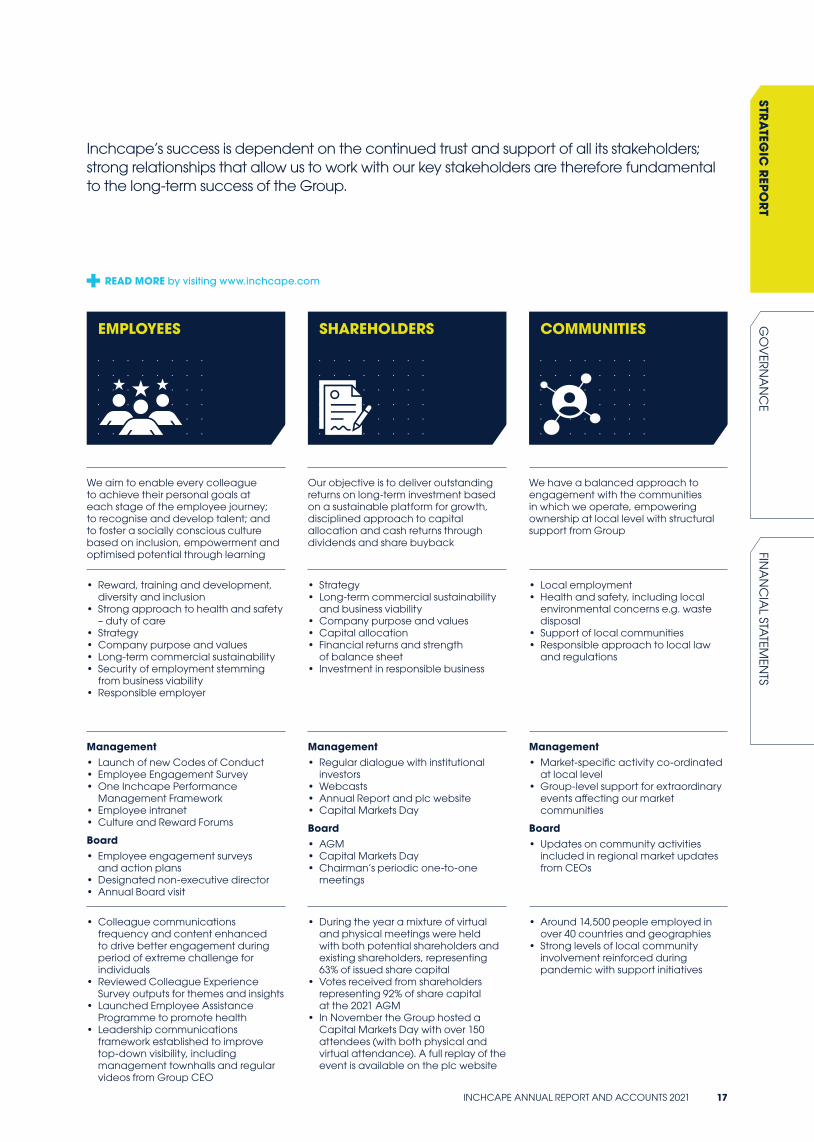
We aim to enable every colleague to achieve their personal goals at each stage of the employee journey; to recognise and develop talent; and to foster a socially conscious culture based on inclusion, empowerment and optimised potential through learning
Our objective is to deliver outstanding returns on long-term investment based on a sustainable platform for growth, disciplined approach to capital allocation and cash returns through dividends and share buyback
We have a balanced approach to engagement with the communities in which we operate, empowering ownership at local level with structural support from Group
INTERESTS • Strategy • Long-term commercial sustainability
and business viability• Trusted partnerships• Health and safety• Environment, Social, Governance
(ESG)
• Access to vehicle products and services
• World renowned automotive brands• Specialist product and service
knowledge• Customer service• Aftersales• Safe facilities• Tailored experiences, both on-
and offline• Business viability (for long-term
contracts, e.g. fleet management]
• Reward, training and development, diversity and inclusion
• Strong approach to health and safety – duty of care
• Strategy• Company purpose and values• Long-term commercial sustainability• Security of employment stemming
from business viability• Responsible employer
• Strategy • Long-term commercial sustainability
and business viability• Company purpose and values• Capital allocation• Financial returns and strength
of balance sheet• Investment in responsible business
• Local employment • Health and safety, including local
environmental concerns e.g. waste disposal
• Support of local communities• Responsible approach to local law
and regulations
HOW WE ENGAGE Management• Regular top to top executive
management meetings • Market level operational meetings• Pan-market brand development
Board• Brand partner deep dive review
annually • Presentations from OEM management
at Strategy Day
Management• Daily reporting of customer feedback
on reputation.com • Analysis of Salesforce customer
journey management platform• Ongoing surveys at market level
Board• Update on the customer satisfaction
analytics from reputation.com at each meeting
Management• Launch of new Codes of Conduct• Employee Engagement Survey• One Inchcape Performance
Management Framework• Employee intranet• Culture and Reward Forums
Board• Employee engagement surveys
and action plans• Designated non-executive director• Annual Board visit
Management• Regular dialogue with institutional
investors • Webcasts• Annual Report and plc website• Capital Markets Day
Board• AGM• Capital Markets Day• Chairman’s periodic one-to-one
meetings
Management• Market-specific activity co-ordinated
at local level • Group-level support for extraordinary
events affecting our market communities
Board• Updates on community activities
included in regional market updates from CEOs
OUTCOMES AND PROGRESS
• Entered into a new global strategic partnership with Geely Auto, one of China’s leading vehicle manufacturers
• Contracts agreed with new OEM partners
• New distribution contracts including the Caribbean focused on Barbados, and Pacific island groups focused on Guam.
• Customer omni-channel platform rolled out to 27 markets with 11 OEMs
• Reputation.com: Total reviews in 2021: 81,362 up 89% on 2020. Average rating was 4.7/5 up from 4.6/5 in 2020.
• Colleague communications frequency and content enhanced to drive better engagement during period of extreme challenge for individuals
• Reviewed Colleague Experience Survey outputs for themes and insights
• Launched Employee Assistance Programme to promote health
• Leadership communications framework established to improve top-down visibility, including management townhalls and regular videos from Group CEO
• During the year a mixture of virtual and physical meetings were held with both potential shareholders and existing shareholders, representing 63% of issued share capital
• Votes received from shareholders representing 92% of share capital at the 2021 AGM
• In November the Group hosted a Capital Markets Day with over 150 attendees (with both physical and virtual attendance). A full replay of the event is available on the plc website
• Around 14,500 people employed in over 40 countries and geographies
• Strong levels of local community involvement reinforced during pandemic with support initiatives
16 INCHCAPE ANNUAL REPORT AND ACCOUNTS 2021
Inchcape’s success is dependent on the continued trust and support of all its stakeholders; strong relationships that allow us to work with our key stakeholders are therefore fundamental to the long-term success of the Group.
READ MORE by visiting www.inchcape.com
STAKEHOLDER ORIGINAL EQUIPMENT MANUFACTURERS (OEMS)
CUSTOMERS EMPLOYEES SHAREHOLDERS COMMUNITIES
HOW WE CREATE VALUE
We provide our OEM brand partners with professional and efficient routes to market for the post-factory automotive chain
We provide access to automotive ownership and support services throughout the customer journey and aim to deliver the best experiences for customers in our industry globally
We aim to enable every colleague to achieve their personal goals at each stage of the employee journey; to recognise and develop talent; and to foster a socially conscious culture based on inclusion, empowerment and optimised potential through learning
Our objective is to deliver outstanding returns on long-term investment based on a sustainable platform for growth, disciplined approach to capital allocation and cash returns through dividends and share buyback
We have a balanced approach to engagement with the communities in which we operate, empowering ownership at local level with structural support from Group
INTERESTS • Strategy • Long-term commercial sustainability
and business viability• Trusted partnerships• Health and safety• Environment, Social, Governance
(ESG)
• Access to vehicle products and services
• World renowned automotive brands• Specialist product and service
knowledge• Customer service• Aftersales• Safe facilities• Tailored experiences, both on-
and offline• Business viability (for long-term
contracts, e.g. fleet management]
• Reward, training and development, diversity and inclusion
• Strong approach to health and safety – duty of care
• Strategy• Company purpose and values• Long-term commercial sustainability• Security of employment stemming
from business viability• Responsible employer
• Strategy • Long-term commercial sustainability
and business viability• Company purpose and values• Capital allocation• Financial returns and strength
of balance sheet• Investment in responsible business
• Local employment • Health and safety, including local
environmental concerns e.g. waste disposal
• Support of local communities• Responsible approach to local law
and regulations
HOW WE ENGAGE Management• Regular top to top executive
management meetings • Market level operational meetings• Pan-market brand development
Board• Brand partner deep dive review
annually • Presentations from OEM management
at Strategy Day
Management• Daily reporting of customer feedback
on reputation.com • Analysis of Salesforce customer
journey management platform• Ongoing surveys at market level
Board• Update on the customer satisfaction
analytics from reputation.com at each meeting
Management• Launch of new Codes of Conduct• Employee Engagement Survey• One Inchcape Performance
Management Framework• Employee intranet• Culture and Reward Forums
Board• Employee engagement surveys
and action plans• Designated non-executive director• Annual Board visit
Management• Regular dialogue with institutional
investors • Webcasts• Annual Report and plc website• Capital Markets Day
Board• AGM• Capital Markets Day• Chairman’s periodic one-to-one
meetings
Management• Market-specific activity co-ordinated
at local level • Group-level support for extraordinary
events affecting our market communities
Board• Updates on community activities
included in regional market updates from CEOs
OUTCOMES AND PROGRESS
• Entered into a new global strategic partnership with Geely Auto, one of China’s leading vehicle manufacturers
• Contracts agreed with new OEM partners
• New distribution contracts including the Caribbean focused on Barbados, and Pacific island groups focused on Guam.
• Customer omni-channel platform rolled out to 27 markets with 11 OEMs
• Reputation.com: Total reviews in 2021: 81,362 up 89% on 2020. Average rating was 4.7/5 up from 4.6/5 in 2020.
• Colleague communications frequency and content enhanced to drive better engagement during period of extreme challenge for individuals
• Reviewed Colleague Experience Survey outputs for themes and insights
• Launched Employee Assistance Programme to promote health
• Leadership communications framework established to improve top-down visibility, including management townhalls and regular videos from Group CEO
• During the year a mixture of virtual and physical meetings were held with both potential shareholders and existing shareholders, representing 63% of issued share capital
• Votes received from shareholders representing 92% of share capital at the 2021 AGM
• In November the Group hosted a Capital Markets Day with over 150 attendees (with both physical and virtual attendance). A full replay of the event is available on the plc website
• Around 14,500 people employed in over 40 countries and geographies
• Strong levels of local community involvement reinforced during pandemic with support initiatives
INCHCAPE ANNUAL REPORT AND ACCOUNTS 2021 17
GO
VER
NA
NC
EFIN
AN
CIA
L STATEM
ENTS
STRA
TEGIC
REPO
RT
CONSEQUENCES OF LONG-TERM DECISIONSMany of the decisions the Board make today will affect the success of the Group in the longer term, the most significant of which is the Group’s strategy. Agreeing and implementing the strategic direction means considering how the Group will need to evolve in order to achieve its purpose of bringing mobility to the world’s communities – for today, for tomorrow and for the better. By setting purpose and strategy, the Board can ensure all outcomes are aligned with the Group’s culture. Decisions made during the year with a long-term impact include the transition to digital, expansion into new and adjacent Vehicle Lifecycle Services and acquisitions of new businesses. Please see pages 4 and 5 and pages 12 to 15 for further information.
When making these decisions the Board considers what value will be created for shareholders, if the appropriate resources are available, how current and future employees will be impacted and what impacts these decisions will have on communities and the environment in which Inchcape operates. Consideration is also given to the ‘what ifs’ as long-term decisions, by their nature, contain a degree of uncertainty about what may happen in the future. The management team provides detailed analysis to the Board to aid in the decision-making process via performance reporting, industry and economic trends data, OEM ambitions, forecasting and scenario planning. The Board also takes into account global mega-trends and CASE (connected, autonomous, shared, electric) trends when making decisions.
INTERESTS OF EMPLOYEES AND FOSTERING BUSINESS RELATIONSHIPSDue to the changing nature of the industry and the evolution of strategy over the longer term the Board has regard to the interests of employees to make sure they have the training, skills and support to enable them to deliver the Accelerate Strategy. The People pillar of the plan is focusing on diversity and inclusion, safety and wellbeing, and skills and talent, to future-proof our people skills. Further information on engagements with employees, and the outcomes, are given throughout this report.
Our OEM relationships are of paramount importance and the length of these relationships is testament to their strength. The OEMs with which we partner are some of the most foremost drivers of technological innovation in the automotive industry, from advances in hybrid and battery electric drivetrains to future mobility. All these elements are taken into consideration by the Board when considering acquisitions and new partnerships as they will be fundamental to achieve the Group’s purpose.
The Digital Analytics Platform has enabled new ways of reaching out to customers and the feedback obtained from them allows us to continually improve the customer journey.
IMPACT OF COMMUNITIES AND THE ENVIRONMENTWe developed the Driving What Matters plan (the Plan) during 2021, as detailed on page 33. Two of its pillars, Places and Planet, will assess the impact of the Group’s operations on the community and the environment. The Responsible Business framework was designed collaboratively, and is owned and delivered by our colleagues around the Group. Their input has shaped the way we approach responsibility and set out what responsible business means for Inchcape.
The CSR Committee, and the Board, will regularly review progress against targets as the Plan matures alongside monitoring the Group’s corporate responsibility, sustainability and stakeholder engagement activities. Please see page 85 for details of how responsible business will be built into the remuneration structure. The Board’s risk management procedures identify the potential consequences of decisions in the short, medium and long term so that mitigation plans can be put in place to prevent, reduce or eliminate risks to the business and wider stakeholders. Please see pages 48 to 56 for further details.
HIGH STANDARDS OF BUSINESS CONDUCTIt is important to the Board to maintain a reputation for high standards of business conduct. During 2021, the Board approved the employee Code of Conduct which sets out the ethical behaviours expected of all who work for Inchcape. We also rolled out a new Supplier Code of Conduct in 2021. This sets out the behaviours we expect from our suppliers which, combined with our Policy Statements on anti-bribery and corruption and modern slavery, provide a strong governance framework in which to do business. Both Codes of Conduct are available at www.inchcape.com.
SHAREHOLDERSWe held a Capital Markets Day in November 2021, giving investors the opportunity to learn about the Accelerate strategy in detail and to give their views on financial and operational performance and future prospects. All shareholders are invited to attend the Annual General Meeting and have the opportunity to speak or ask questions to the Board members.
Please see pages 16 and 17 for further information on stakeholder engagement.
STAKEHOLDER ENGAGEMENT CONTINUED
S172 STATEMENTThe Directors have exercised their duties under the Companies Act 2006 throughout the year, including under Section 172, the duty to promote the success of the Company while having regard for the factors under Sections 172(1)(a) to (f). These and other factors are taken into consideration by the Directors when making decisions in their role as the Board of Inchcape plc.
18 INCHCAPE ANNUAL REPORT AND ACCOUNTS 2021
FINA
NC
IAL STA
TEMEN
TSG
OV
ERN
AN
CE
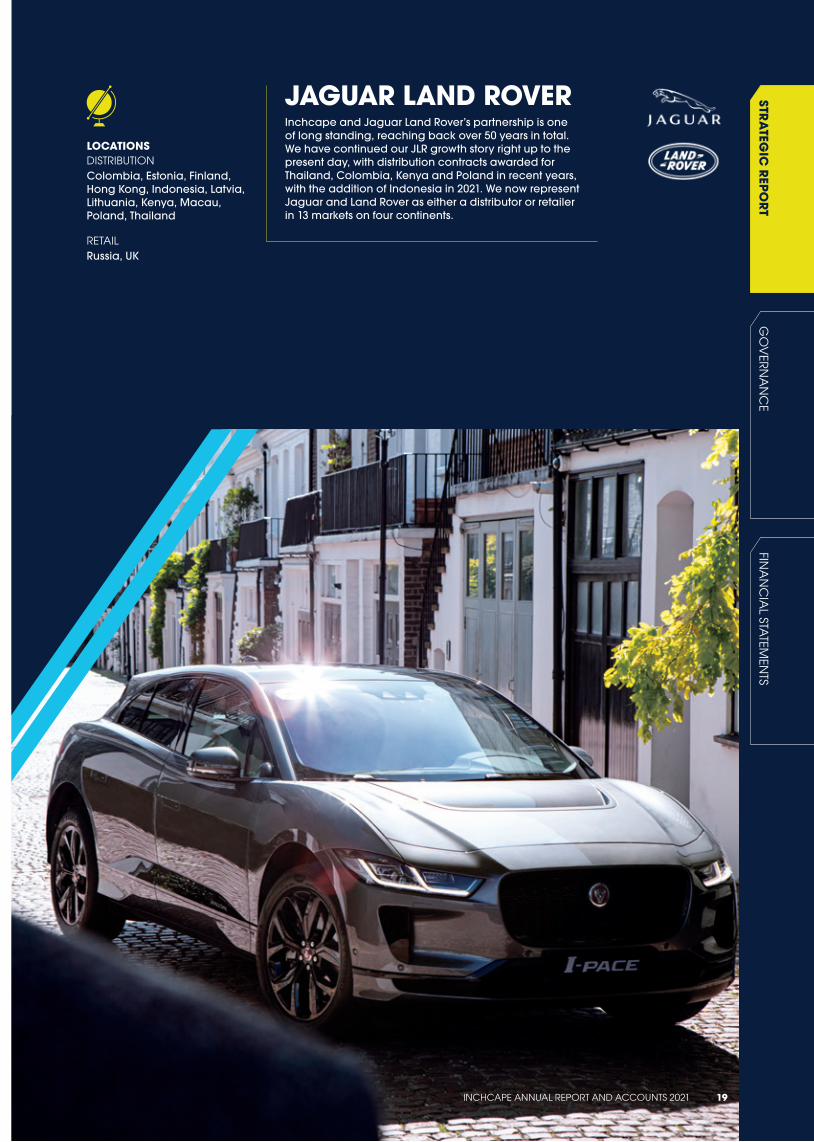
JAGUAR LAND ROVERInchcape and Jaguar Land Rover’s partnership is one of long standing, reaching back over 50 years in total. We have continued our JLR growth story right up to the present day, with distribution contracts awarded for Thailand, Colombia, Kenya and Poland in recent years, with the addition of Indonesia in 2021. We now represent Jaguar and Land Rover as either a distributor or retailer in 13 markets on four continents.
LOCATIONS DISTRIBUTIONColombia, Estonia, Finland, Hong Kong, Indonesia, Latvia, Lithuania, Kenya, Macau, Poland, Thailand
RETAILRussia, UK
STRA
TEGIC
REPO
RT
INCHCAPE ANNUAL REPORT AND ACCOUNTS 2021 19
STRA
TEGIC
REPO
RT
KEY PERFORMANCE INDICATORS
MEASURING PROGRESS
KPI REVENUE
£7.6bn2020: £6.8bn
OPERATING MARGIN2
4.3%2020: 2.4%
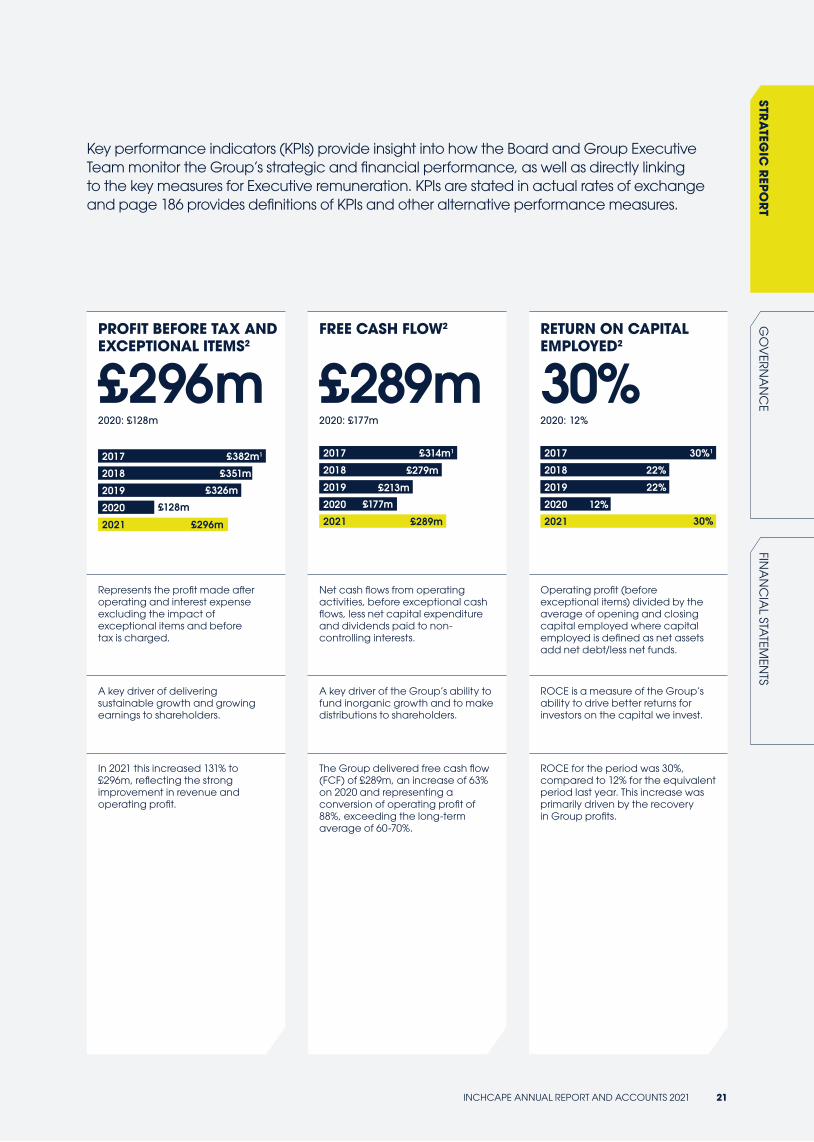
PROFIT BEFORE TAX AND EXCEPTIONAL ITEMS2
£296m2020: £128m
FREE CASH FLOW2
£289m2020: £177m
RETURN ON CAPITAL EMPLOYED2
30%2020: 12%
2017 £9.0bn
2018 £9.3bn
2019 £9.4bn
2020 £6.8bn
2021 £7.6bn
2017 4.5%1
2018
2019
4.3%
2020
4.0%
2021 4.3% [XX]
2.4%
2017 £382m1
2018
2019
£351m
2020
2021
£326m
£296m
£128m
2017 £314m1
2018
2019
2020
£279m
2021
£213m
£289m
£177m
2017 30%1
2018
2019
2020
22%
2021
22%
30%
12%
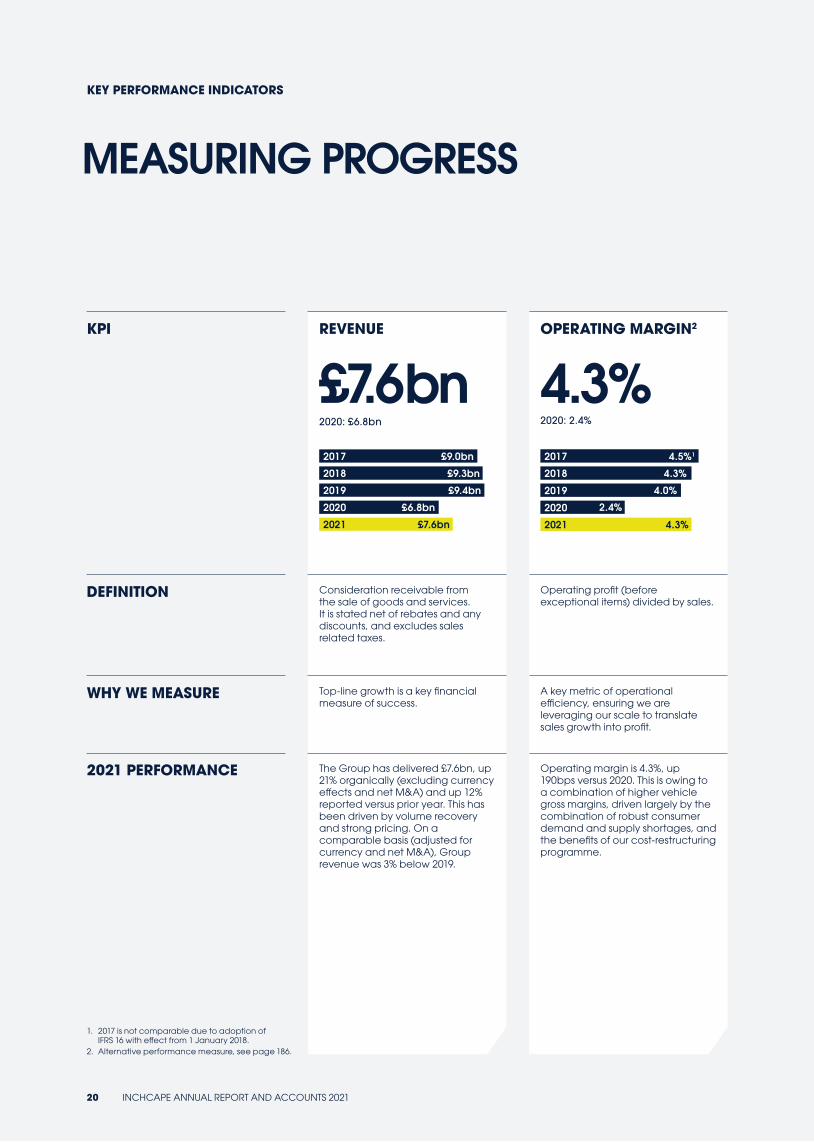
DEFINITION Consideration receivable from the sale of goods and services. It is stated net of rebates and any discounts, and excludes sales related taxes.
Operating profit (before exceptional items) divided by sales.
Represents the profit made after operating and interest expense excluding the impact of exceptional items and before tax is charged.
Net cash flows from operating activities, before exceptional cash flows, less net capital expenditure and dividends paid to non-controlling interests.
Operating profit (before exceptional items) divided by the average of opening and closing capital employed where capital employed is defined as net assets add net debt/less net funds.
WHY WE MEASURE Top-line growth is a key financial measure of success.
A key metric of operational efficiency, ensuring we are leveraging our scale to translate sales growth into profit.
A key driver of delivering sustainable growth and growing earnings to shareholders.
A key driver of the Group’s ability to fund inorganic growth and to make distributions to shareholders.
ROCE is a measure of the Group’s ability to drive better returns for investors on the capital we invest.
2021 PERFORMANCE The Group has delivered £7.6bn, up 21% organically (excluding currency effects and net M&A) and up 12% reported versus prior year. This has been driven by volume recovery and strong pricing. On a comparable basis (adjusted for currency and net M&A), Group revenue was 3% below 2019.
Operating margin is 4.3%, up 190bps versus 2020. This is owing to a combination of higher vehicle gross margins, driven largely by the combination of robust consumer demand and supply shortages, and the benefits of our cost-restructuring programme.
In 2021 this increased 131% to £296m, reflecting the strong improvement in revenue and operating profit.
The Group delivered free cash flow (FCF) of £289m, an increase of 63% on 2020 and representing a conversion of operating profit of 88%, exceeding the long-term average of 60-70%.
ROCE for the period was 30%, compared to 12% for the equivalent period last year. This increase was primarily driven by the recovery in Group profits.
1. 2017 is not comparable due to adoption of IFRS 16 with effect from 1 January 2018.
2. Alternative performance measure, see page 186.
20 INCHCAPE ANNUAL REPORT AND ACCOUNTS 2021
Key performance indicators (KPIs) provide insight into how the Board and Group Executive Team monitor the Group’s strategic and financial performance, as well as directly linking to the key measures for Executive remuneration. KPIs are stated in actual rates of exchange and page 186 provides definitions of KPIs and other alternative performance measures.
KPI REVENUE
£7.6bn2020: £6.8bn
OPERATING MARGIN2
4.3%2020: 2.4%
PROFIT BEFORE TAX AND EXCEPTIONAL ITEMS2
£296m2020: £128m
FREE CASH FLOW2
£289m2020: £177m
RETURN ON CAPITAL EMPLOYED2
30%2020: 12%
2017 £9.0bn
2018 £9.3bn
2019 £9.4bn
2020 £6.8bn
2021 £7.6bn
2017 4.5%1
2018
2019
4.3%
2020
4.0%
2021 4.3% [XX]
2.4%
2017 £382m1
2018
2019
£351m
2020
2021
£326m
£296m
£128m
2017 £314m1
2018
2019
2020
£279m
2021
£213m
£289m
£177m
2017 30%1
2018
2019
2020
22%
2021
22%
30%
12%
DEFINITION Consideration receivable from the sale of goods and services. It is stated net of rebates and any discounts, and excludes sales related taxes.
Operating profit (before exceptional items) divided by sales.
Represents the profit made after operating and interest expense excluding the impact of exceptional items and before tax is charged.
Net cash flows from operating activities, before exceptional cash flows, less net capital expenditure and dividends paid to non-controlling interests.
Operating profit (before exceptional items) divided by the average of opening and closing capital employed where capital employed is defined as net assets add net debt/less net funds.
WHY WE MEASURE Top-line growth is a key financial measure of success.
A key metric of operational efficiency, ensuring we are leveraging our scale to translate sales growth into profit.
A key driver of delivering sustainable growth and growing earnings to shareholders.
A key driver of the Group’s ability to fund inorganic growth and to make distributions to shareholders.
ROCE is a measure of the Group’s ability to drive better returns for investors on the capital we invest.
2021 PERFORMANCE The Group has delivered £7.6bn, up 21% organically (excluding currency effects and net M&A) and up 12% reported versus prior year. This has been driven by volume recovery and strong pricing. On a comparable basis (adjusted for currency and net M&A), Group revenue was 3% below 2019.
Operating margin is 4.3%, up 190bps versus 2020. This is owing to a combination of higher vehicle gross margins, driven largely by the combination of robust consumer demand and supply shortages, and the benefits of our cost-restructuring programme.
In 2021 this increased 131% to £296m, reflecting the strong improvement in revenue and operating profit.
The Group delivered free cash flow (FCF) of £289m, an increase of 63% on 2020 and representing a conversion of operating profit of 88%, exceeding the long-term average of 60-70%.
ROCE for the period was 30%, compared to 12% for the equivalent period last year. This increase was primarily driven by the recovery in Group profits.
INCHCAPE ANNUAL REPORT AND ACCOUNTS 2021 21
GO
VER
NA
NC
EFIN
AN
CIA
L STATEM
ENTS
STRA
TEGIC
REPO
RT
INVESTMENT PROPOSITION: DELIVERING SUSTAINABLE GROWTH AND CASH RETURNS
INVESTMENT CASE
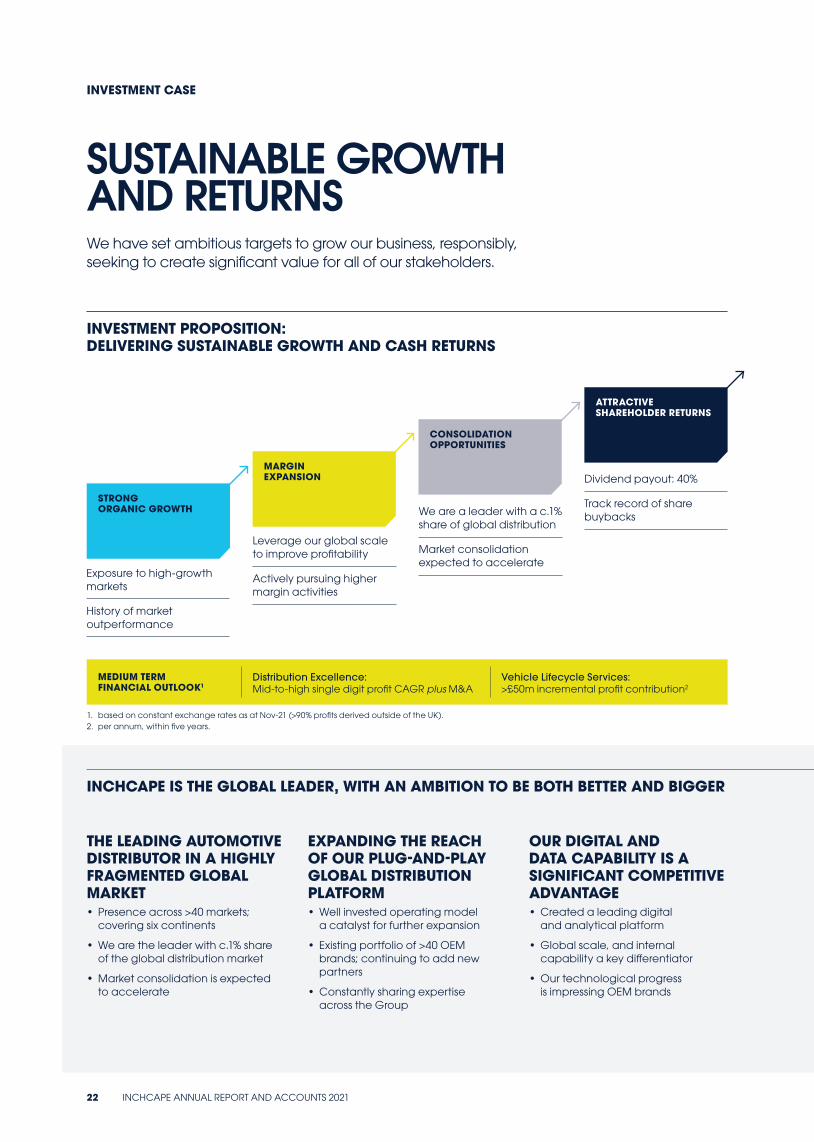
SUSTAINABLE GROWTH AND RETURNSWe have set ambitious targets to grow our business, responsibly, seeking to create significant value for all of our stakeholders.
INCHCAPE IS THE GLOBAL LEADER, WITH AN AMBITION TO BE BOTH BETTER AND BIGGER
THE LEADING AUTOMOTIVE DISTRIBUTOR IN A HIGHLY FRAGMENTED GLOBAL MARKET• Presence across >40 markets;
covering six continents
• We are the leader with c.1% share of the global distribution market
• Market consolidation is expected to accelerate
EXPANDING THE REACH OF OUR PLUG-AND-PLAY GLOBAL DISTRIBUTION PLATFORM• Well invested operating model
a catalyst for further expansion
• Existing portfolio of >40 OEM brands; continuing to add new partners
• Constantly sharing expertise across the Group
OUR DIGITAL AND DATA CAPABILITY IS A SIGNIFICANT COMPETITIVE ADVANTAGE• Created a leading digital
and analytical platform
• Global scale, and internal capability a key differentiator
• Our technological progress is impressing OEM brands
STRONG ORGANIC GROWTH
MARGIN EXPANSION
CONSOLIDATION OPPORTUNITIES
ATTRACTIVE SHAREHOLDER RETURNS
Exposure to high-growth markets
History of market outperformance
Leverage our global scale to improve profitability
Actively pursuing higher margin activities
We are a leader with a c.1% share of global distribution
Market consolidation expected to accelerate
Dividend payout: 40%
Track record of share buybacks
MEDIUM TERM FINANCIAL OUTLOOK1
Distribution Excellence: Mid-to-high single digit profit CAGR plus M&A
Vehicle Lifecycle Services: >£50m incremental profit contribution2
1. based on constant exchange rates as at Nov-21 (>90% profits derived outside of the UK).2. per annum, within five years.
22 INCHCAPE ANNUAL REPORT AND ACCOUNTS 2021
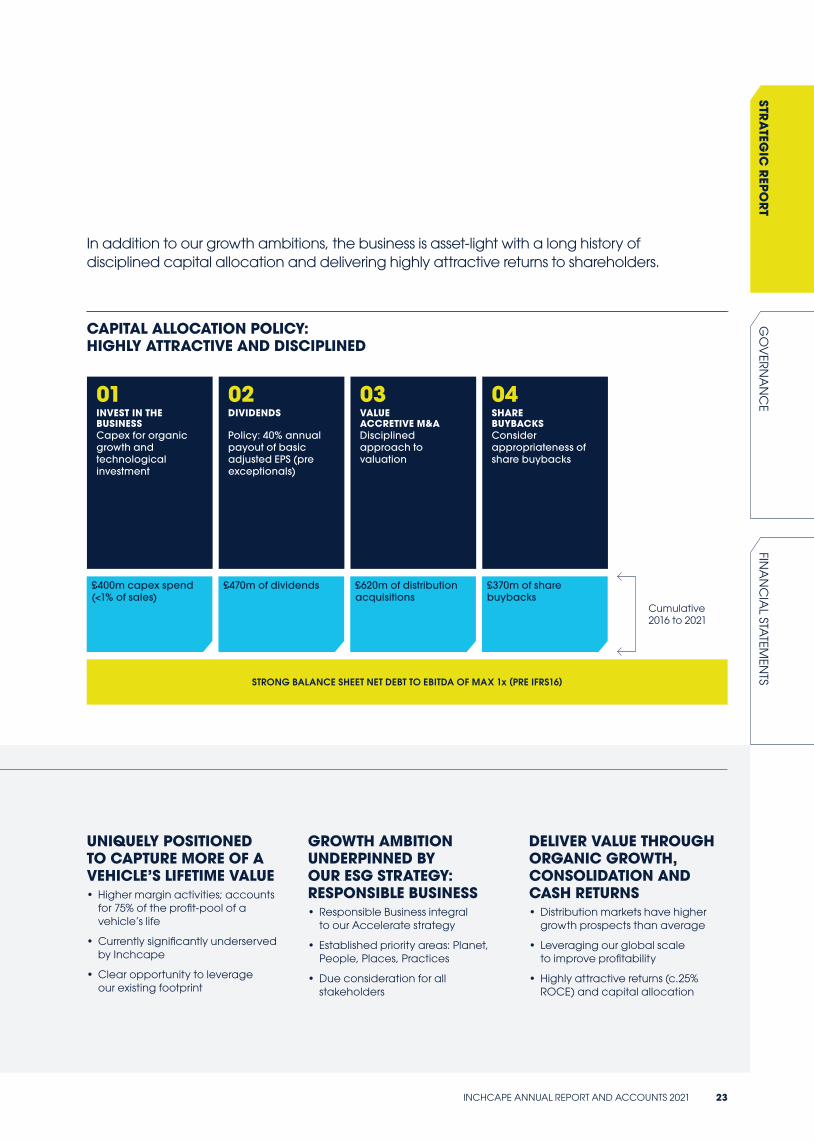
STRONG BALANCE SHEET NET DEBT TO EBITDA OF MAX 1x (PRE IFRS16)
In addition to our growth ambitions, the business is asset-light with a long history of disciplined capital allocation and delivering highly attractive returns to shareholders.
CAPITAL ALLOCATION POLICY: HIGHLY ATTRACTIVE AND DISCIPLINED
UNIQUELY POSITIONED TO CAPTURE MORE OF A VEHICLE’S LIFETIME VALUE• Higher margin activities; accounts
for 75% of the profit-pool of a vehicle’s life
• Currently significantly underserved by Inchcape
• Clear opportunity to leverage our existing footprint
GROWTH AMBITION UNDERPINNED BY OUR ESG STRATEGY: RESPONSIBLE BUSINESS• Responsible Business integral
to our Accelerate strategy
• Established priority areas: Planet, People, Places, Practices
• Due consideration for all stakeholders
DELIVER VALUE THROUGH ORGANIC GROWTH, CONSOLIDATION AND CASH RETURNS• Distribution markets have higher
growth prospects than average
• Leveraging our global scale to improve profitability
• Highly attractive returns (c.25% ROCE) and capital allocation
£400m capex spend (<1% of sales)
£470m of dividends £620m of distribution acquisitions
£370m of share buybacks
Cumulative 2016 to 2021
01INVEST IN THE BUSINESSCapex for organic growth and technological investment
02DIVIDENDS
Policy: 40% annual payout of basic adjusted EPS (pre exceptionals)
03VALUE ACCRETIVE M&ADisciplined approach to valuation
04SHARE BUYBACKSConsider appropriateness of share buybacks
INCHCAPE ANNUAL REPORT AND ACCOUNTS 2021 23
GO
VER
NA
NC
EFIN
AN
CIA
L STATEM
ENTS
STRA
TEGIC
REPO
RT
OPERATING AND FINANCIAL REVIEW
WELL PLACED FOR OPPORTUNITIES AHEAD
GIJSBERT DE ZOETENCHIEF FINANCIAL OFFICER
I am pleased to present our Operating and Financial Review for 2021, a year in which the Group has made substantial strategic and operational progress.
Our teams’ relentless focus on strong execution in all our markets drove a rebound of all our key financial metrics. Of particular note was the delivery of another year of excellent cash flow generation.
24 INCHCAPE ANNUAL REPORT AND ACCOUNTS 2021
Our continued focus on cash management drove another excellent year of cash flow generation, highlighting the cash generative nature of the business model. Over the course of the past 12 months we have added a number of new distribution businesses to our portfolio, and have a healthy pipeline of opportunities. In line with our capital allocation policy, this enabled us to launch a £100m share buyback programme in the middle of the year, which is now complete.
With the Group’s net cash position further improved, in addition to a full-year dividend of 22.5p (final: 16.1p), we have launched another £100m share buyback programme to be completed over the next 12 months.
During 2021, the Group launched its new growth strategy, Accelerate, which continues to put distribution at the core of our business, and extends our ambition to capture more of a vehicle’s lifetime value. We are embarking on this exciting growth journey, while maintaining our disciplined approach to capital allocation, and as such remain focused on delivering long-term benefits to all of our stakeholders.
GIJSBERT DE ZOETENCHIEF FINANCIAL OFFICER
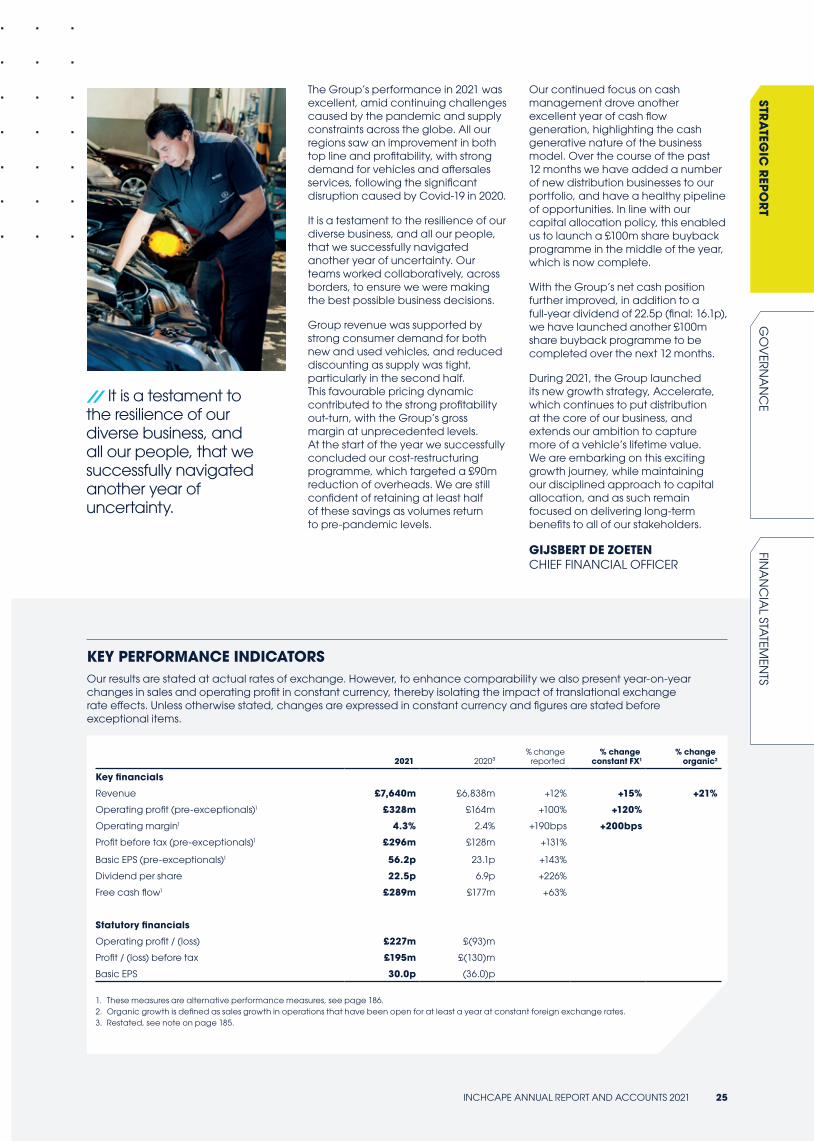
The Group’s performance in 2021 was excellent, amid continuing challenges caused by the pandemic and supply constraints across the globe. All our regions saw an improvement in both top line and profitability, with strong demand for vehicles and aftersales services, following the significant disruption caused by Covid-19 in 2020.
It is a testament to the resilience of our diverse business, and all our people, that we successfully navigated another year of uncertainty. Our teams worked collaboratively, across borders, to ensure we were making the best possible business decisions.
Group revenue was supported by strong consumer demand for both new and used vehicles, and reduced discounting as supply was tight, particularly in the second half. This favourable pricing dynamic contributed to the strong profitability out-turn, with the Group’s gross margin at unprecedented levels. At the start of the year we successfully concluded our cost-restructuring programme, which targeted a £90m reduction of overheads. We are still confident of retaining at least half of these savings as volumes return to pre-pandemic levels.
KEY PERFORMANCE INDICATORSOur results are stated at actual rates of exchange. However, to enhance comparability we also present year-on-year changes in sales and operating profit in constant currency, thereby isolating the impact of translational exchange rate effects. Unless otherwise stated, changes are expressed in constant currency and figures are stated before exceptional items.
2021 2020³% change
reported% change
constant FX1% change
organic2
Key financials
Revenue £7,640m £6,838m +12% +15% +21%
Operating profit (pre-exceptionals)1 £328m £164m +100% +120%
Operating margin1 4.3% 2.4% +190bps +200bps
Profit before tax (pre-exceptionals)1 £296m £128m +131%
Basic EPS (pre-exceptionals)1 56.2p 23.1p +143%
Dividend per share 22.5p 6.9p +226%
Free cash flow1 £289m £177m +63%
Statutory financials
Operating profit / (loss) £227m £(93)m
Profit / (loss) before tax £195m £(130)m
Basic EPS 30.0p (36.0)p
1. These measures are alternative performance measures, see page 186.2. Organic growth is defined as sales growth in operations that have been open for at least a year at constant foreign exchange rates.3. Restated, see note on page 185.
// It is a testament to the resilience of our diverse business, and all our people, that we successfully navigated another year of uncertainty.
INCHCAPE ANNUAL REPORT AND ACCOUNTS 2021 25
GO
VER
NA
NC
ESTR
ATEG
IC R
EPOR
TFIN
AN
CIA
L STATEM
ENTS
OPERATING AND FINANCIAL REVIEW CONTINUED
Our performance in the year was strong, with our Group revenue almost back to pre-pandemic levels on a comparable basis. While the pandemic continued to cause disruption across the globe, the impact on the Group was less pronounced than in 2020, as we had adapted our business operations to better manage in this environment. The widely reported global supply-chain issues had a more pronounced impact in the second half. The demand for vehicles and aftersales remained strong throughout the period, which created a supply-demand imbalance, and led to higher gross margins and profitability.
Over the course of the year, the Group generated revenue of £7.6bn, operating profit pre-exceptionals of £328m and free cash flow of £289m.
Group revenue of £7.6bn rose 12% year-on-year reported and 15% in constant currency. The growth rate was dampened by the disposal of several retail businesses (including sites in St. Petersburg, Russia), which further reduced our standalone retail revenue exposure by c.£0.3bn. In terms of M&A, over the past 12 months we secured five new distribution agreements across both the Americas and Asia, gaining entry into three new markets. As well as broadening our geographic footprint, we secured our first distribution relationships with Geely (Chile), and Chrysler (Barbados and Caribbean).
On an organic basis, excluding currency effects and net M&A, revenue increased by 21%. The growth was broad-based across all regions, driven by a combination of volume recovery and strong pricing. In 2020, pandemic-related restrictions were most pronounced during the second quarter, and weighed significantly on our performance. On a comparable basis (adjusting for currency and portfolio changes), the Group’s revenue in 2021 was 3% below 2019.
PERFORMANCE REVIEW
The Group delivered an operating profit pre-exceptional items of £328m, up 100% year-on-year reported and 120% in constant currency. The strong rebound reflects the topline increase and the year-on-year margin improvement. The 2021 out-turn includes c.£10m of profit from our St. Petersburg, Russia operations sold towards the end of the first-half.
Profit before tax and exceptional items (PBT) of £296m (2020: £128m) reflects the strong improvement in revenue and operating profit. The net interest expense of £32m is £5m lower than prior year primarily as a result of lower inventory levels, which reduced the related interest expense. Adjusting for the impact of currency and changes to our portfolio, profit before tax and exceptional items is back to 2019 pre-pandemic levels (£296m).
During the reporting period, we incurred exceptional charges of £101m. The majority of the charge relates to the £72m loss on the disposal of a part of our Retail operations in Russia, where we realised £108m of accumulated foreign exchange losses upon disposal. In addition, we booked £13m of restructuring costs, largely related to the conclusion of our Covid-19 cost restructuring programme, and £20m of accelerated amortisation of software assets (following a change in accounting policy).
The highly cash-generative nature of our business model was evident with free cash flow generation of £289m (2020: £177m) – this represents a conversion of operating profit pre-exceptionals of 88% (2020: 108%), exceeding the long-term average of 60-70%. During the period we benefitted from a net working capital inflow of £44m, and lower net capital expenditure (£40m), owing to proceeds from the disposal of surplus capital assets and the reallocation of expenditure on intangible assets to operating costs (due to a change in accounting policy).
Other notable elements of the cash flow bridge include: net acquisitions and disposals, which amounted to an inflow of £56m (proceeds from Retail disposals offset by the acquisition of
Daimler Guatemala and a commercial vehicle business in Guam) and dividend payments of £52m. We launched a £100m share buyback programme in July, of which c.£80m was complete by the end of the year.
The Group closed the reporting period in a net cash position of £379m (excluding lease liabilities), which compares to £266m at the end of December 2020, and £435m as at 30 June 2021.
On an IFRS 16 basis (including lease liabilities), we ended the period with net funds of £55m (December 2020: net debt of £67m).
Return on capital employed over the period was 30%, compared to 12% for the equivalent period last year. The increase was primarily driven by the recovery in Group profits, and supported by our portfolio shift towards distribution and asset impairments in 2020 triggered by the pandemic.
FOURTH QUARTER 2021Group revenue for the fourth quarter was £1.8bn, down 4% reported. On an organic basis revenue increased 5%, compared to a 10% increase in Q3 – with the lower growth rate primarily owing to the shortage of vehicles globally, amid low vehicle production levels.
In Distribution, revenue increased 8% organically, following a 20% increase in Q3. In addition to lapping a tough comparator, during Q4 most regions were impacted by vehicle supply constraints, although aftersales performance proved resilient.
In Retail, while revenue was flat year-on-year on an organic basis (Q3: fell 2%), the comparable period was impacted by pandemic related restrictions. The shortage of vehicle availability (both new and used) had a meaningful impact on topline performance.
26 INCHCAPE ANNUAL REPORT AND ACCOUNTS 2021
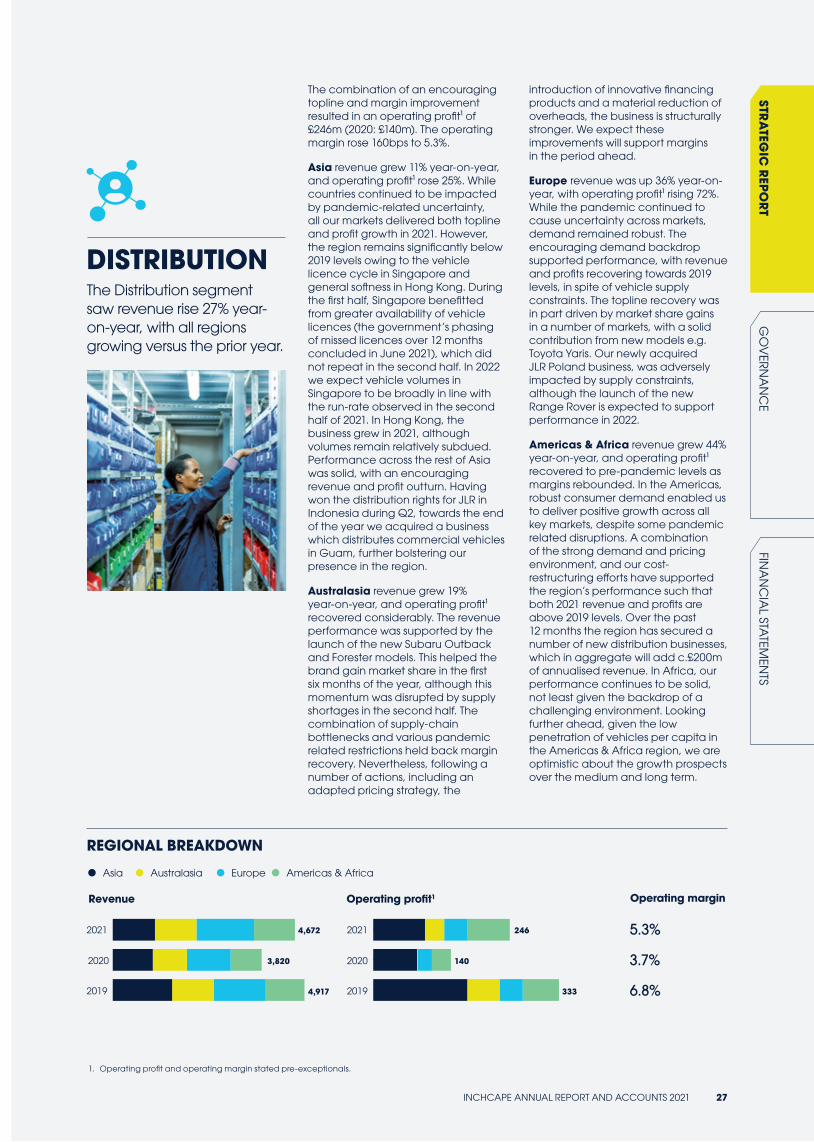
DISTRIBUTIONThe Distribution segment saw revenue rise 27% year-on-year, with all regions growing versus the prior year.
The combination of an encouraging topline and margin improvement resulted in an operating profit¹ of £246m (2020: £140m). The operating margin rose 160bps to 5.3%.
Asia revenue grew 11% year-on-year, and operating profit¹ rose 25%. While countries continued to be impacted by pandemic-related uncertainty, all our markets delivered both topline and profit growth in 2021. However, the region remains significantly below 2019 levels owing to the vehicle licence cycle in Singapore and general softness in Hong Kong. During the first half, Singapore benefitted from greater availability of vehicle licences (the government’s phasing of missed licences over 12 months concluded in June 2021), which did not repeat in the second half. In 2022 we expect vehicle volumes in Singapore to be broadly in line with the run-rate observed in the second half of 2021. In Hong Kong, the business grew in 2021, although volumes remain relatively subdued. Performance across the rest of Asia was solid, with an encouraging revenue and profit outturn. Having won the distribution rights for JLR in Indonesia during Q2, towards the end of the year we acquired a business which distributes commercial vehicles in Guam, further bolstering our presence in the region.
Australasia revenue grew 19% year-on-year, and operating profit¹ recovered considerably. The revenue performance was supported by the launch of the new Subaru Outback and Forester models. This helped the brand gain market share in the first six months of the year, although this momentum was disrupted by supply shortages in the second half. The combination of supply-chain bottlenecks and various pandemic related restrictions held back margin recovery. Nevertheless, following a number of actions, including an adapted pricing strategy, the
introduction of innovative financing products and a material reduction of overheads, the business is structurally stronger. We expect these improvements will support margins in the period ahead.
Europe revenue was up 36% year-on-year, with operating profit¹ rising 72%. While the pandemic continued to cause uncertainty across markets, demand remained robust. The encouraging demand backdrop supported performance, with revenue and profits recovering towards 2019 levels, in spite of vehicle supply constraints. The topline recovery was in part driven by market share gains in a number of markets, with a solid contribution from new models e.g. Toyota Yaris. Our newly acquired JLR Poland business, was adversely impacted by supply constraints, although the launch of the new Range Rover is expected to support performance in 2022.
Americas & Africa revenue grew 44% year-on-year, and operating profit¹ recovered to pre-pandemic levels as margins rebounded. In the Americas, robust consumer demand enabled us to deliver positive growth across all key markets, despite some pandemic related disruptions. A combination of the strong demand and pricing environment, and our cost-restructuring efforts have supported the region’s performance such that both 2021 revenue and profits are above 2019 levels. Over the past 12 months the region has secured a number of new distribution businesses, which in aggregate will add c.£200m of annualised revenue. In Africa, our performance continues to be solid, not least given the backdrop of a challenging environment. Looking further ahead, given the low penetration of vehicles per capita in the Americas & Africa region, we are optimistic about the growth prospects over the medium and long term.
REGIONAL BREAKDOWN
1. Operating profit and operating margin stated pre-exceptionals.
Revenue Operating profit1 Operating margin
4,917
3,820
4,6722021
2020
2019 333
140
2462021
2020
2019
5.3%
3.7%
6.8%
Asia Australasia Europe Americas & Africa
INCHCAPE ANNUAL REPORT AND ACCOUNTS 2021 27
GO
VER
NA
NC
EFIN
AN
CIA
L STATEM
ENTS
STRA
TEGIC
REPO
RT
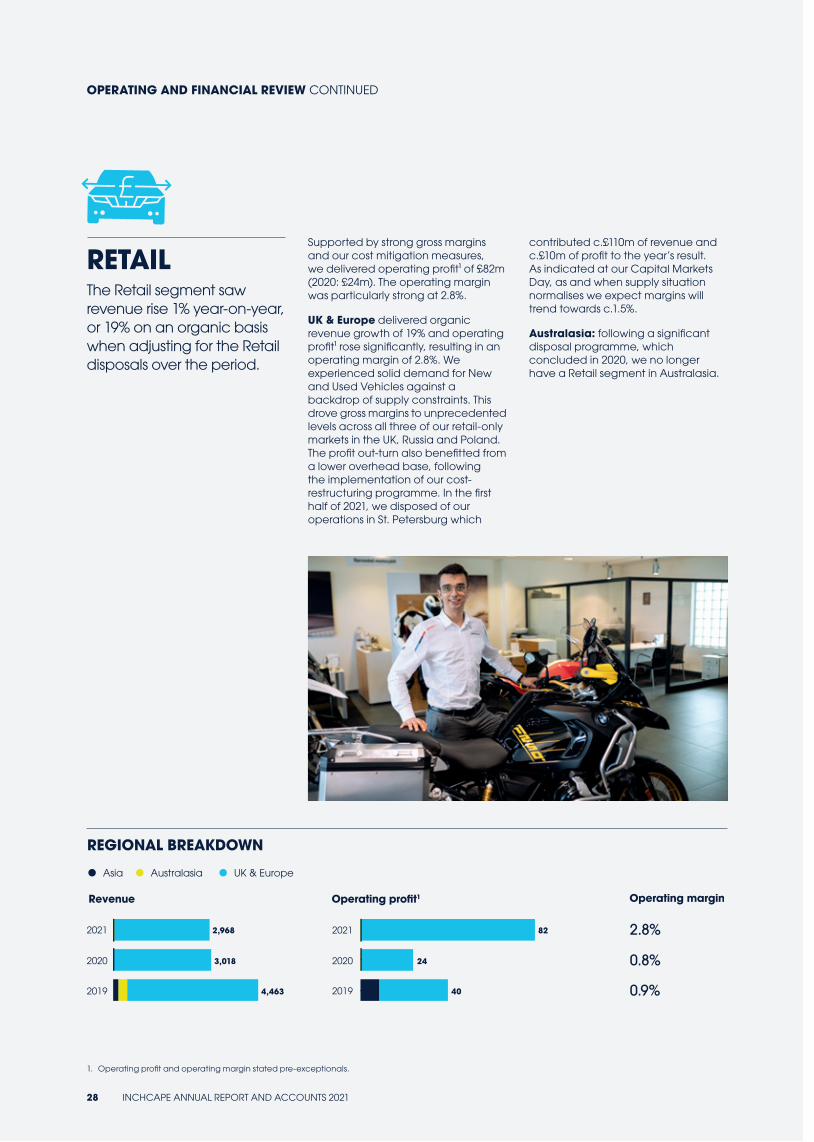
RETAILThe Retail segment saw revenue rise 1% year-on-year, or 19% on an organic basis when adjusting for the Retail disposals over the period.
Supported by strong gross margins and our cost mitigation measures, we delivered operating profit¹ of £82m (2020: £24m). The operating margin was particularly strong at 2.8%.
UK & Europe delivered organic revenue growth of 19% and operating profit¹ rose significantly, resulting in an operating margin of 2.8%. We experienced solid demand for New and Used Vehicles against a backdrop of supply constraints. This drove gross margins to unprecedented levels across all three of our retail-only markets in the UK, Russia and Poland. The profit out-turn also benefitted from a lower overhead base, following the implementation of our cost-restructuring programme. In the first half of 2021, we disposed of our operations in St. Petersburg which
contributed c.£110m of revenue and c.£10m of profit to the year’s result. As indicated at our Capital Markets Day, as and when supply situation normalises we expect margins will trend towards c.1.5%.
Australasia: following a significant disposal programme, which concluded in 2020, we no longer have a Retail segment in Australasia.
REGIONAL BREAKDOWN
1. Operating profit and operating margin stated pre-exceptionals.
Revenue Operating profit1 Operating margin
4,463
3,018
2,9682021
2020
2019 40
24
822021
2020
2019
2.8%
0.8%
0.9%
Asia Australasia UK & Europe
OPERATING AND FINANCIAL REVIEW CONTINUED
28 INCHCAPE ANNUAL REPORT AND ACCOUNTS 2021
OTHER FINANCIAL ITEMSExceptional items During the year, we have incurred exceptional charges of £101m (2020: £257m). The charge arose largely from the recycling of £108m of foreign exchange losses previously recognised in other comprehensive income in relation to the disposal of the Russia Retail business, partially offset by gains on the disposal of other retail businesses in the UK and Europe. Additionally, there was £13m of restructuring costs and £20m of accelerated amortisation on software assets. Further details can be found in note three on page 194.
Net finance costs Net finance costs were £32m (2020: £37m). The decrease is largely due to a reduction in the cost of financing inventory following our retail disposals, and the overall reduction in inventory and associated inventory financing following our S&OP improvements and restrictions in supply globally. The interest charge is stated on an IFRS 16 basis and, excluding interest relating to leases, our net finance charge was £21m compared to £23m in 2020.
Tax The effective tax rate for the year is 24% before exceptional items (2020: 26%). Compared to the prior year, the effective tax rate before exceptional items benefits from improved operational performance reducing the adverse impact of unrecognised losses. The effective tax rate for the year, after exceptional items, is 37% (2020: negative 7%), and is not comparable to the prior year due to the impact of the pandemic on the Group’s performance in the prior period.
Non-controlling interests Profits attributable to our non-controlling interests were £5m (2020: £3m). The Group’s non-controlling interests comprise a 40% holding in PT JLM Auto Indonesia, a 33% share in UAB Vitvela in Lithuania, a 30% share in NBT Brunei, a 30% share in Inchcape JLR Europe, a 10% share of Subaru Australia and 6% of the Motor Engineering Company of Ethiopia.
Dividend The Board has declared a final dividend of 16.1p per ordinary share which will be paid on 21 June 2022 to shareholders on the register at close of business on 13 May 2022. This follows an interim dividend of 6.4p, and takes the total dividend in respect of FY21 to 22.5p (2020: 6.9p). The Dividend Reinvestment Plan is available to ordinary shareholders and the final date for receipt of elections to participate is 27 May 2022.
Cash flow and net debt The Group generated free cash flow of £289m (2020: £177m) driven primarily by an improvement in profitability, the level of working capital and continued careful capital allocation. After the proceeds received from our Retail disposals, as well as the acquisition of the Distribution business in Guatemala and Morrico in Guam, the Group had net cash excluding lease liabilities of £379m (2020: £266m). Including lease liabilities (IFRS 16), the Group had net funds of £55m (2020: net debt of £67m).
Capital expenditure During 2021, the Group incurred net capital expenditure of £40m (2020: £35m), consisting of £65m of capital expenditure and £25m of proceeds from the sale of property. In 2022, we continue to expect net capital expenditure of less than 1% of Group sales.
Financing As at 31 December 2021, the committed funding facilities of the Group comprised a syndicated revolving credit facility of £700m (2020: £700m) and sterling Private Placement loan notes totalling £210m (2020: £210m). As at 31 December 2021, none of the £700m syndicated revolving credit facility was drawn (£nil as at 31 December 2020).
Acquisitions In 2021 the Group continued to further expand its distribution footprint, completing four deals during the year. Towards the end of the fourth quarter the Group agreed terms to acquire an additional distribution business: Simpson Motors in the Caribbean. The deal remains subject to customary conditions, and upon completion (anticipated in the first half of 2022) we expect an aggregate cash outflow of c.£60m.
Pensions At 31 December 2021, the IAS 19 net post-retirement surplus was £82m (2020: £20m), with the increase driven largely by a rise in the discount rate used to determine the value of scheme liabilities. In line with the funding programme agreed with the Trustees, the Group made additional cash contributions to the UK pension schemes amounting to £4m (2020: £4m). Discussions with the Trustees of the Inchcape Motors Pension Scheme in respect of the actuarial valuation as at 5 April 2019 were finalised during the first half of the year and the Group has agreed to contribute an additional £3m per annum to the scheme over the next seven years.
INCHCAPE ANNUAL REPORT AND ACCOUNTS 2021 29
GO
VER
NA
NC
EFIN
AN
CIA
L STATEM
ENTS
STRA
TEGIC
REPO
RT
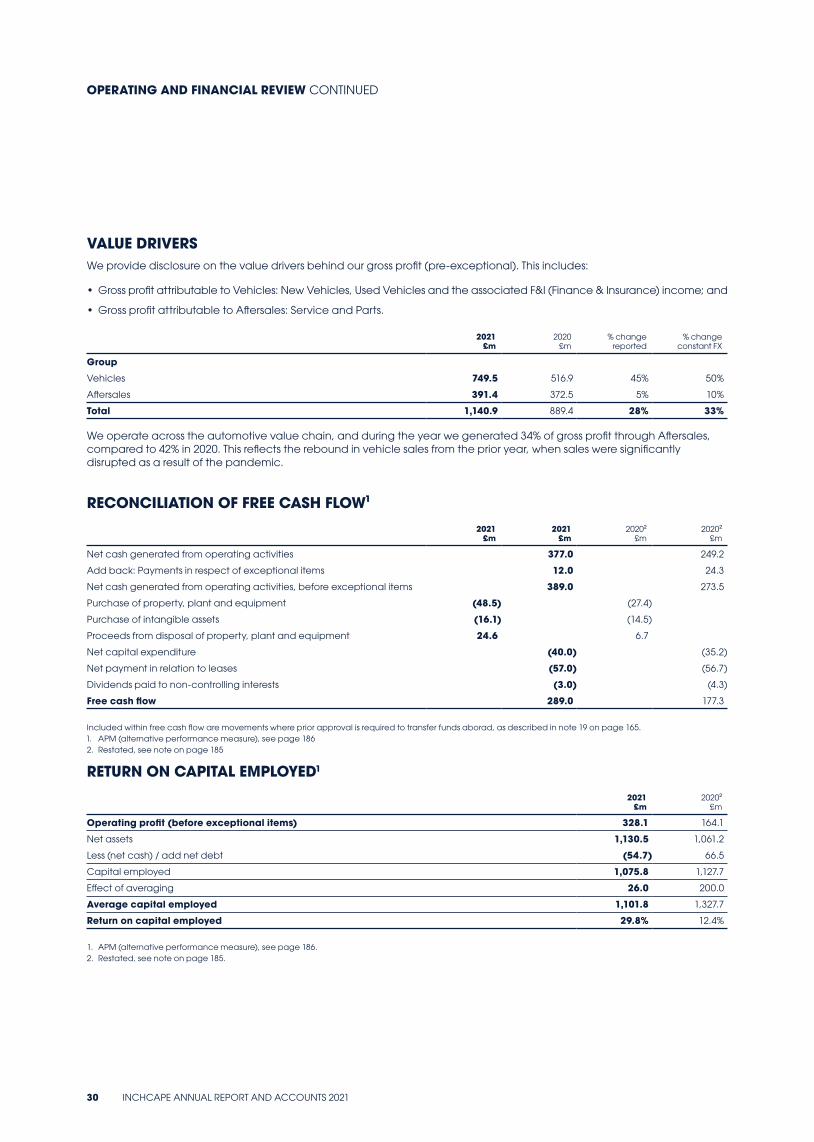
VALUE DRIVERSWe provide disclosure on the value drivers behind our gross profit (pre-exceptional). This includes:
• Gross profit attributable to Vehicles: New Vehicles, Used Vehicles and the associated F&I (Finance & Insurance) income; and
• Gross profit attributable to Aftersales: Service and Parts.
2021 £m
2020 £m
% change reported
% change constant FX
Group
Vehicles 749.5 516.9 45% 50%
Aftersales 391.4 372.5 5% 10%
Total 1,140.9 889.4 28% 33%
We operate across the automotive value chain, and during the year we generated 34% of gross profit through Aftersales, compared to 42% in 2020. This reflects the rebound in vehicle sales from the prior year, when sales were significantly disrupted as a result of the pandemic.
RECONCILIATION OF FREE CASH FLOW¹2021
£m2021
£m2020²
£m2020²
£m
Net cash generated from operating activities 377.0 249.2
Add back: Payments in respect of exceptional items 12.0 24.3
Net cash generated from operating activities, before exceptional items 389.0 273.5
Purchase of property, plant and equipment (48.5) (27.4)
Purchase of intangible assets (16.1) (14.5)
Proceeds from disposal of property, plant and equipment 24.6 6.7
Net capital expenditure (40.0) (35.2)
Net payment in relation to leases (57.0) (56.7)
Dividends paid to non-controlling interests (3.0) (4.3)
Free cash flow 289.0 177.3
Included within free cash flow are movements where prior approval is required to transfer funds aborad, as described in note 19 on page 165.1. APM (alternative performance measure), see page 1862. Restated, see note on page 185
RETURN ON CAPITAL EMPLOYED1
2021£m
2020²£m
Operating profit (before exceptional items) 328.1 164.1
Net assets 1,130.5 1,061.2
Less (net cash) / add net debt (54.7) 66.5
Capital employed 1,075.8 1,127.7
Effect of averaging 26.0 200.0
Average capital employed 1,101.8 1,327.7
Return on capital employed 29.8% 12.4%
1. APM (alternative performance measure), see page 186.2. Restated, see note on page 185.
OPERATING AND FINANCIAL REVIEW CONTINUED
30 INCHCAPE ANNUAL REPORT AND ACCOUNTS 2021
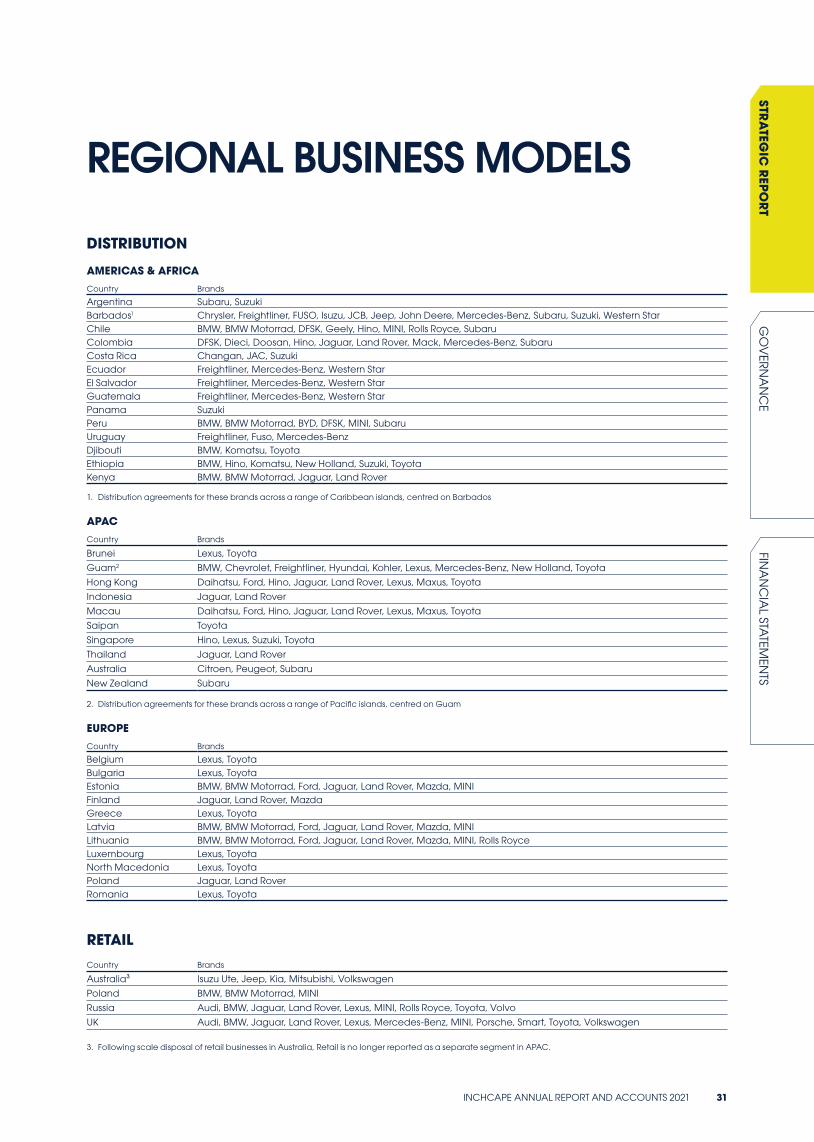
REGIONAL BUSINESS MODELS
DISTRIBUTION
AMERICAS & AFRICACountry Brands
Argentina Subaru, SuzukiBarbados1 Chrysler, Freightliner, FUSO, Isuzu, JCB, Jeep, John Deere, Mercedes-Benz, Subaru, Suzuki, Western StarChile BMW, BMW Motorrad, DFSK, Geely, Hino, MINI, Rolls Royce, SubaruColombia DFSK, Dieci, Doosan, Hino, Jaguar, Land Rover, Mack, Mercedes-Benz, SubaruCosta Rica Changan, JAC, SuzukiEcuador Freightliner, Mercedes-Benz, Western StarEl Salvador Freightliner, Mercedes-Benz, Western StarGuatemala Freightliner, Mercedes-Benz, Western StarPanama SuzukiPeru BMW, BMW Motorrad, BYD, DFSK, MINI, SubaruUruguay Freightliner, Fuso, Mercedes-BenzDjibouti BMW, Komatsu, ToyotaEthiopia BMW, Hino, Komatsu, New Holland, Suzuki, ToyotaKenya BMW, BMW Motorrad, Jaguar, Land Rover
1. Distribution agreements for these brands across a range of Caribbean islands, centred on Barbados
APACCountry Brands
Brunei Lexus, Toyota
Guam2 BMW, Chevrolet, Freightliner, Hyundai, Kohler, Lexus, Mercedes-Benz, New Holland, Toyota
Hong Kong Daihatsu, Ford, Hino, Jaguar, Land Rover, Lexus, Maxus, Toyota
Indonesia Jaguar, Land Rover
Macau Daihatsu, Ford, Hino, Jaguar, Land Rover, Lexus, Maxus, Toyota
Saipan Toyota
Singapore Hino, Lexus, Suzuki, Toyota
Thailand Jaguar, Land Rover
Australia Citroen, Peugeot, Subaru
New Zealand Subaru
2. Distribution agreements for these brands across a range of Pacific islands, centred on Guam
EUROPECountry Brands
Belgium Lexus, ToyotaBulgaria Lexus, ToyotaEstonia BMW, BMW Motorrad, Ford, Jaguar, Land Rover, Mazda, MINIFinland Jaguar, Land Rover, MazdaGreece Lexus, ToyotaLatvia BMW, BMW Motorrad, Ford, Jaguar, Land Rover, Mazda, MINILithuania BMW, BMW Motorrad, Ford, Jaguar, Land Rover, Mazda, MINI, Rolls RoyceLuxembourg Lexus, ToyotaNorth Macedonia Lexus, ToyotaPoland Jaguar, Land RoverRomania Lexus, Toyota
RETAILCountry Brands
Australia³ Isuzu Ute, Jeep, Kia, Mitsubishi, Volkswagen
Poland BMW, BMW Motorrad, MINI
Russia Audi, BMW, Jaguar, Land Rover, Lexus, MINI, Rolls Royce, Toyota, Volvo
UK Audi, BMW, Jaguar, Land Rover, Lexus, Mercedes-Benz, MINI, Porsche, Smart, Toyota, Volkswagen
3. Following scale disposal of retail businesses in Australia, Retail is no longer reported as a separate segment in APAC.
INCHCAPE ANNUAL REPORT AND ACCOUNTS 2021 31
GO
VER
NA
NC
EFIN
AN
CIA
L STATEM
ENTS
STRA
TEGIC
REPO
RT
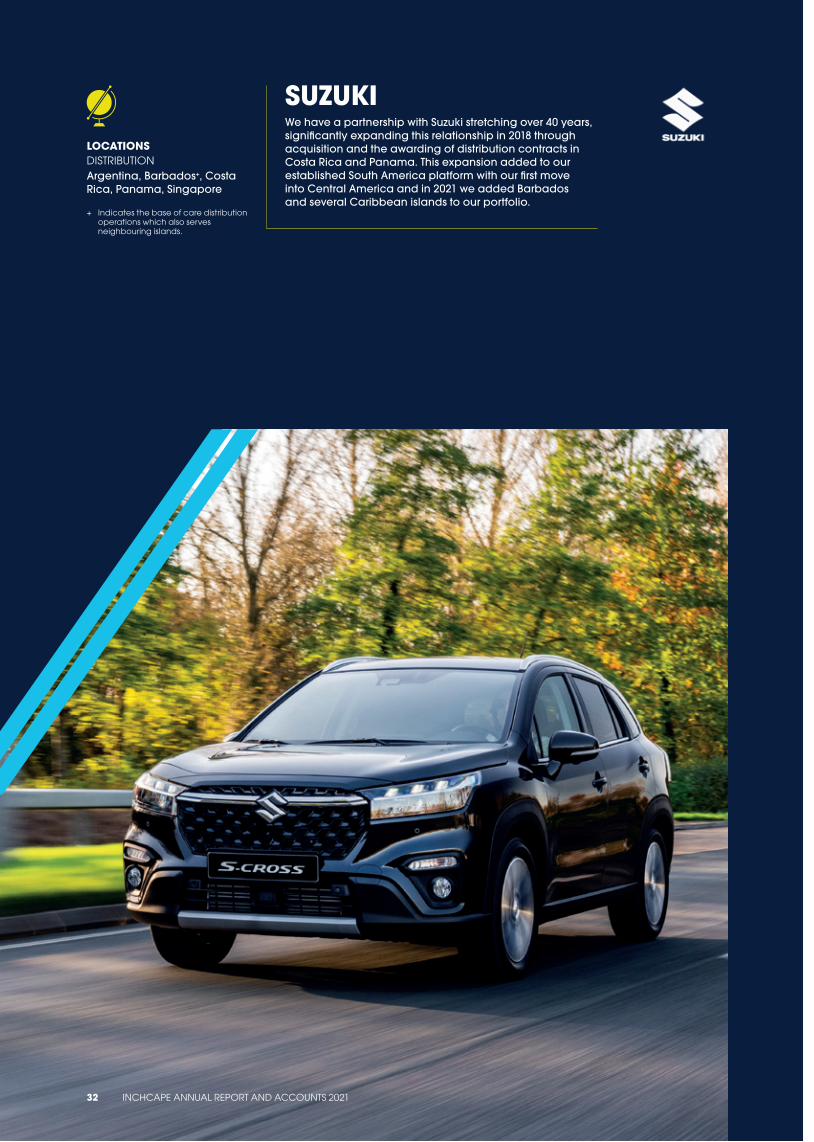
SUZUKIWe have a partnership with Suzuki stretching over 40 years, significantly expanding this relationship in 2018 through acquisition and the awarding of distribution contracts in Costa Rica and Panama. This expansion added to our established South America platform with our first move into Central America and in 2021 we added Barbados and several Caribbean islands to our portfolio.
LOCATIONS DISTRIBUTIONArgentina, Barbados+, Costa Rica, Panama, Singapore
+ Indicates the base of care distribution operations which also serves neighbouring islands.
32 INCHCAPE ANNUAL REPORT AND ACCOUNTS 2021
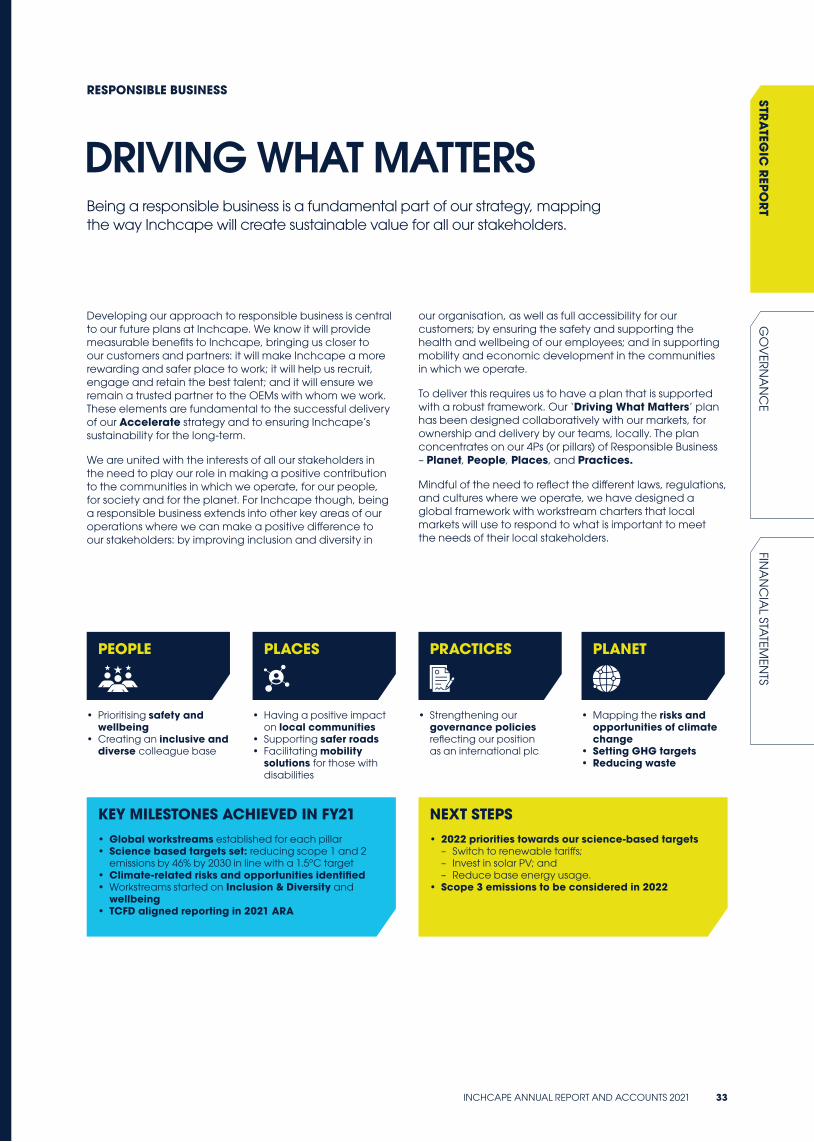
PLANET
RESPONSIBLE BUSINESS
DRIVING WHAT MATTERS
Developing our approach to responsible business is central to our future plans at Inchcape. We know it will provide measurable benefits to Inchcape, bringing us closer to our customers and partners: it will make Inchcape a more rewarding and safer place to work; it will help us recruit, engage and retain the best talent; and it will ensure we remain a trusted partner to the OEMs with whom we work. These elements are fundamental to the successful delivery of our Accelerate strategy and to ensuring Inchcape’s sustainability for the long-term.
We are united with the interests of all our stakeholders in the need to play our role in making a positive contribution to the communities in which we operate, for our people, for society and for the planet. For Inchcape though, being a responsible business extends into other key areas of our operations where we can make a positive difference to our stakeholders: by improving inclusion and diversity in
our organisation, as well as full accessibility for our customers; by ensuring the safety and supporting the health and wellbeing of our employees; and in supporting mobility and economic development in the communities in which we operate.
To deliver this requires us to have a plan that is supported with a robust framework. Our ‘Driving What Matters’ plan has been designed collaboratively with our markets, for ownership and delivery by our teams, locally. The plan concentrates on our 4Ps (or pillars) of Responsible Business – Planet, People, Places, and Practices.
Mindful of the need to reflect the different laws, regulations, and cultures where we operate, we have designed a global framework with workstream charters that local markets will use to respond to what is important to meet the needs of their local stakeholders.
Being a responsible business is a fundamental part of our strategy, mapping the way Inchcape will create sustainable value for all our stakeholders.
KEY MILESTONES ACHIEVED IN FY21• Global workstreams established for each pillar• Science based targets set: reducing scope 1 and 2
emissions by 46% by 2030 in line with a 1.5ºC target• Climate-related risks and opportunities identified• Workstreams started on Inclusion & Diversity and
wellbeing• TCFD aligned reporting in 2021 ARA
NEXT STEPS• 2022 priorities towards our science-based targets
– Switch to renewable tariffs; – Invest in solar PV; and – Reduce base energy usage.
• Scope 3 emissions to be considered in 2022
• Mapping the risks and opportunities of climate change
• Setting GHG targets• Reducing waste
• Prioritising safety and wellbeing
• Creating an inclusive and diverse colleague base
PRACTICESPLACESPEOPLE
• Having a positive impact on local communities
• Supporting safer roads• Facilitating mobility
solutions for those with disabilities
• Strengthening our governance policies reflecting our position as an international plc
INCHCAPE ANNUAL REPORT AND ACCOUNTS 2021 33
GO
VER
NA
NC
EFIN
AN
CIA
L STATEM
ENTS
STRA
TEGIC
REPO
RT
PEOPLEINCLUSION & DIVERSITY• Create an inclusive environment
and diverse colleague base
SAFETY & WELLBEING• Ensure the safety and wellbeing
of our people
TALENTS & SKILLS• Equip the organisation with the
skills and capability to establish and sustain Inchcape in being a commercially successful Responsible Business
CREATE AN INCLUSIVE ENVIRONMENT AND DIVERSE COLLEAGUE BASEWe believe differences drive ideas and innovation. We will create an organisation that actively attracts, recruits and develops people across all aspects of diversity, that reflects our customer base and the communities in which we operate. An organisation that actively enables every person to feel valued and fully contribute, generating the broadest breadth in contribution, ideas and thinking to business performance and decision making.
ENSURE THE SAFETY AND WELLBEING OF OUR PEOPLEWe believe the physical and mental wellbeing of our people is paramount to the success of Inchcape. We will make sure every person both feels safe and is safe at work. We’ll make sure they are able to raise concerns, doubts and fears – and that we listen, take action and help them when needed, so we can support their mental health and wellbeing.
CURRENT PRIORITIES AND INITIATIVES
• Inclusive Leadership ProgrammeCurrent focus for the People pillar is on establishing our Inclusion and Diversity frameworks, narrative and internal communication. This comprises our Inclusive Leadership Programme for which we are targeting rollout to 100% of our senior leadership population (c.75 employees) by end of June 2022. Stage two will be to the next level of management (c.400 employees total) by end Q1 2023.
• Lifeworks Employee Assistance ProgrammeUnder Safety and Wellbeing, we launched the Lifeworks Employee Assistance Programme which was completed in December 2021, use of which is being tracked monthly and success will be measured in wellbeing questions in future employee experience surveys.
• Women in Leadership ProgrammeWe launched our Women in Leadership Programme in 2021 with three pilot cohorts and will run three further cohorts in 2022 with satisfaction measurement as well as retention and progression as measures of success.
EQUIP THE ORGANISATION WITH THE SKILLS AND CAPABILITY TO ESTABLISH AND SUSTAIN INCHCAPE IN BEING A COMMERCIALLY SUCCESSFUL RESPONSIBLE BUSINESSWe believe that providing continuous opportunities for professional and personal growth will guarantee our collective success as a responsible business. We will develop and source skills, capabilities, behaviours and mindsets that enable every person, team and Inchcape as a whole to succeed, delivering in a sustainable way as a truly responsible business; for our people, for our customers, for the communities in which we operate and for our planet.
RESPONSIBLE BUSINESS CONTINUED
34 INCHCAPE ANNUAL REPORT AND ACCOUNTS 2021
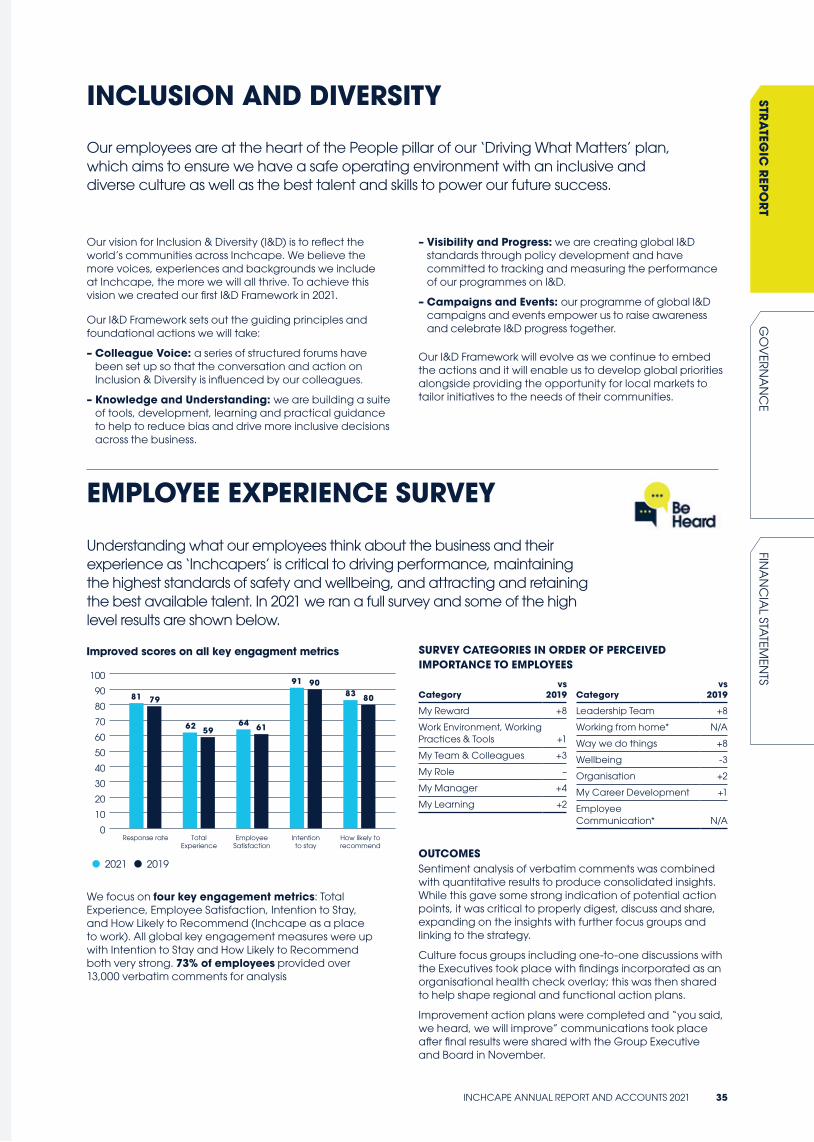
INCLUSION AND DIVERSITY
Understanding what our employees think about the business and their experience as ‘Inchcapers’ is critical to driving performance, maintaining the highest standards of safety and wellbeing, and attracting and retaining the best available talent. In 2021 we ran a full survey and some of the high level results are shown below.
2021 2019
81 79
62 5964 61
91 9083 80
Improved scores on all key engagment metrics
Response rate TotalExperience
EmployeeSatisfaction
Intentionto stay
How likely torecommend
0
10
20
30
40
50
60
70
80
90
100
We focus on four key engagement metrics: Total Experience, Employee Satisfaction, Intention to Stay, and How Likely to Recommend (Inchcape as a place to work). All global key engagement measures were up with Intention to Stay and How Likely to Recommend both very strong. 73% of employees provided over 13,000 verbatim comments for analysis
EMPLOYEE EXPERIENCE SURVEY
Our employees are at the heart of the People pillar of our ‘Driving What Matters’ plan, which aims to ensure we have a safe operating environment with an inclusive and diverse culture as well as the best talent and skills to power our future success.
– Visibility and Progress: we are creating global I&D standards through policy development and have committed to tracking and measuring the performance of our programmes on I&D.
– Campaigns and Events: our programme of global I&D campaigns and events empower us to raise awareness and celebrate I&D progress together.
Our I&D Framework will evolve as we continue to embed the actions and it will enable us to develop global priorities alongside providing the opportunity for local markets to tailor initiatives to the needs of their communities.
Our vision for Inclusion & Diversity (I&D) is to reflect the world’s communities across Inchcape. We believe the more voices, experiences and backgrounds we include at Inchcape, the more we will all thrive. To achieve this vision we created our first I&D Framework in 2021.
Our I&D Framework sets out the guiding principles and foundational actions we will take:
– Colleague Voice: a series of structured forums have been set up so that the conversation and action on Inclusion & Diversity is influenced by our colleagues.
– Knowledge and Understanding: we are building a suite of tools, development, learning and practical guidance to help to reduce bias and drive more inclusive decisions across the business.
Categoryvs
2019
My Reward +8
Work Environment, Working Practices & Tools +1
My Team & Colleagues +3
My Role –
My Manager +4
My Learning +2
Categoryvs
2019
Leadership Team +8
Working from home* N/A
Way we do things +8
Wellbeing -3
Organisation +2
My Career Development +1
Employee Communication* N/A
OUTCOMESSentiment analysis of verbatim comments was combined with quantitative results to produce consolidated insights. While this gave some strong indication of potential action points, it was critical to properly digest, discuss and share, expanding on the insights with further focus groups and linking to the strategy.
Culture focus groups including one-to-one discussions with the Executives took place with findings incorporated as an organisational health check overlay; this was then shared to help shape regional and functional action plans.
Improvement action plans were completed and “you said, we heard, we will improve” communications took place after final results were shared with the Group Executive and Board in November.
SURVEY CATEGORIES IN ORDER OF PERCEIVED IMPORTANCE TO EMPLOYEES
INCHCAPE ANNUAL REPORT AND ACCOUNTS 2021 35
GO
VER
NA
NC
EFIN
AN
CIA
L STATEM
ENTS
STRA
TEGIC
REPO
RT
RESPONSIBLE BUSINESS CONTINUED
PLACESSAFE MOBILITY• An advocate for safer roads
INCLUSIVE MOBILITY• Support people with disabilities to
access mobility solutions
SOCIAL MOBILITY• Supporting equal opportunities
through education, training access and social levelling up
SAFE MOBILITYInchcape promotes the safe use of roads with the objective of becoming a strong and visible advocate for reduced road accidents and deaths across all markets in which we operate. We will support and promote safe driving through sponsorship of educational programmes, awareness creation and campaigns on safe use of roads. We will also partner with relevant bodies, stakeholders and advocates to develop and implement accident prevention initiatives and support emergency responses to save lives on the roads. We will aim to develop and roll-out a proprietary digital engagement platform dedicated to promoting Safe Mobility globally.
INCLUSIVE MOBILITYWe will support people with disabilities to access the right mobility solutions through sponsorship and promotion of specific initiatives in our markets. We will also support key programmes that promote activities and topics such as sports, education, skills acquisition and health of those with disabilities. We will also ensure all Inchcape facilities and operations provide full and inclusive access to mobility for all.
SOCIAL MOBILITYWe will develop specific global and local projects and initiatives that support and enable equal opportunities for young people; for example through internship, apprenticeship, technical education and female education. Focus of such programmes will be on the less privileged and/or disadvantaged young people in communities in which we operate to give those selected a better chance to live, grow and realise their potential. Inchcape will be a key proponent of upward mobility for all by helping and being seen to help young people out of poverty and deprivation.
CURRENT PRIORITIES AND INITIATIVES
• Community activitiesThere is currently a wide range of community-based activity taking place across all markets, including support for S.O.S. Children’s Village and the Red Cross as well as Safe Drive mobility training to employees and their relatives in our Africa and Central America markets.
• Road safety campaigning Our first internal road safety campaign rolled out in December and a key initiative in 2022 will be to develop externally facing campaigns and potentially partnerships with relevant bodies and organisations.
36 INCHCAPE ANNUAL REPORT AND ACCOUNTS 2021
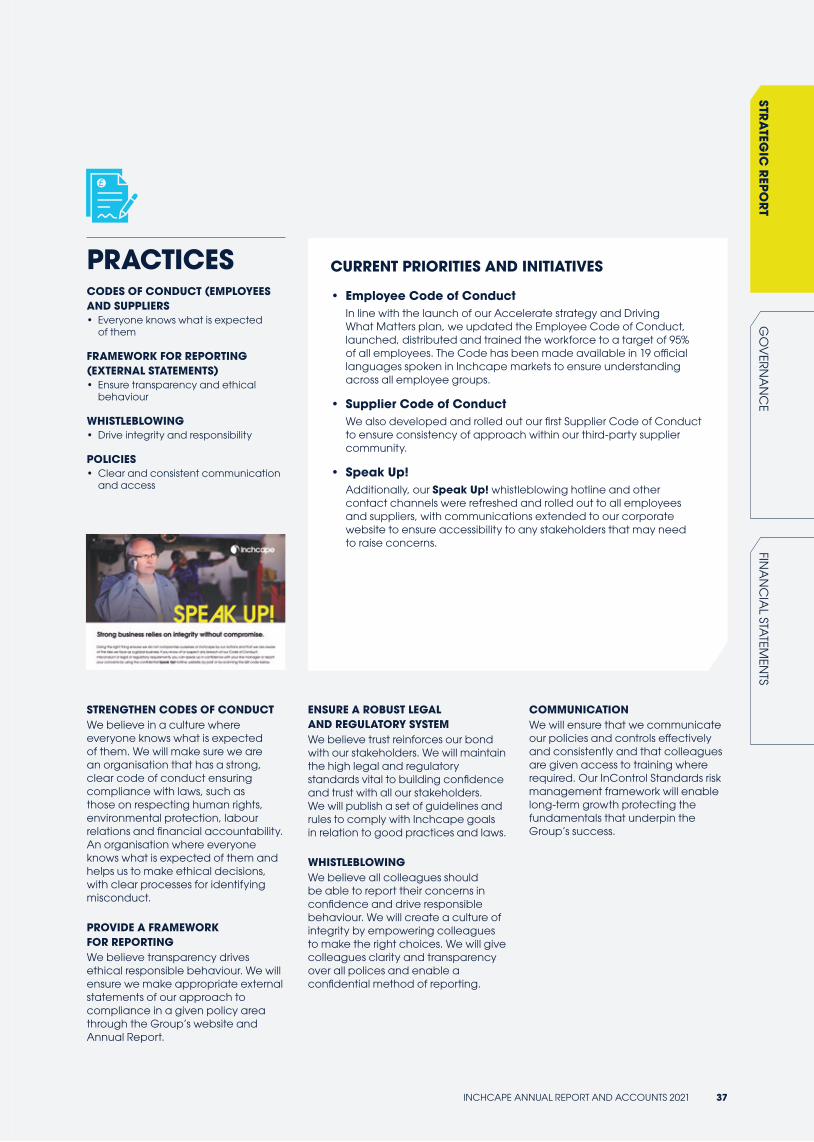
PRACTICESCODES OF CONDUCT (EMPLOYEES AND SUPPLIERS• Everyone knows what is expected
of them
FRAMEWORK FOR REPORTING (EXTERNAL STATEMENTS)• Ensure transparency and ethical
behaviour
WHISTLEBLOWING• Drive integrity and responsibility
POLICIES• Clear and consistent communication
and access
STRENGTHEN CODES OF CONDUCTWe believe in a culture where everyone knows what is expected of them. We will make sure we are an organisation that has a strong, clear code of conduct ensuring compliance with laws, such as those on respecting human rights, environmental protection, labour relations and financial accountability. An organisation where everyone knows what is expected of them and helps us to make ethical decisions, with clear processes for identifying misconduct.
PROVIDE A FRAMEWORK FOR REPORTINGWe believe transparency drives ethical responsible behaviour. We will ensure we make appropriate external statements of our approach to compliance in a given policy area through the Group’s website and Annual Report.
ENSURE A ROBUST LEGAL AND REGULATORY SYSTEMWe believe trust reinforces our bond with our stakeholders. We will maintain the high legal and regulatory standards vital to building confidence and trust with all our stakeholders. We will publish a set of guidelines and rules to comply with Inchcape goals in relation to good practices and laws.
WHISTLEBLOWINGWe believe all colleagues should be able to report their concerns in confidence and drive responsible behaviour. We will create a culture of integrity by empowering colleagues to make the right choices. We will give colleagues clarity and transparency over all polices and enable a confidential method of reporting.
COMMUNICATIONWe will ensure that we communicate our policies and controls effectively and consistently and that colleagues are given access to training where required. Our InControl Standards risk management framework will enable long-term growth protecting the fundamentals that underpin the Group’s success.
CURRENT PRIORITIES AND INITIATIVES
• Employee Code of Conduct In line with the launch of our Accelerate strategy and Driving What Matters plan, we updated the Employee Code of Conduct, launched, distributed and trained the workforce to a target of 95% of all employees. The Code has been made available in 19 official languages spoken in Inchcape markets to ensure understanding across all employee groups.
• Supplier Code of ConductWe also developed and rolled out our first Supplier Code of Conduct to ensure consistency of approach within our third-party supplier community.
• Speak Up!Additionally, our Speak Up! whistleblowing hotline and other contact channels were refreshed and rolled out to all employees and suppliers, with communications extended to our corporate website to ensure accessibility to any stakeholders that may need to raise concerns.
INCHCAPE ANNUAL REPORT AND ACCOUNTS 2021 37
GO
VER
NA
NC
EFIN
AN
CIA
L STATEM
ENTS
STRA
TEGIC
REPO
RT
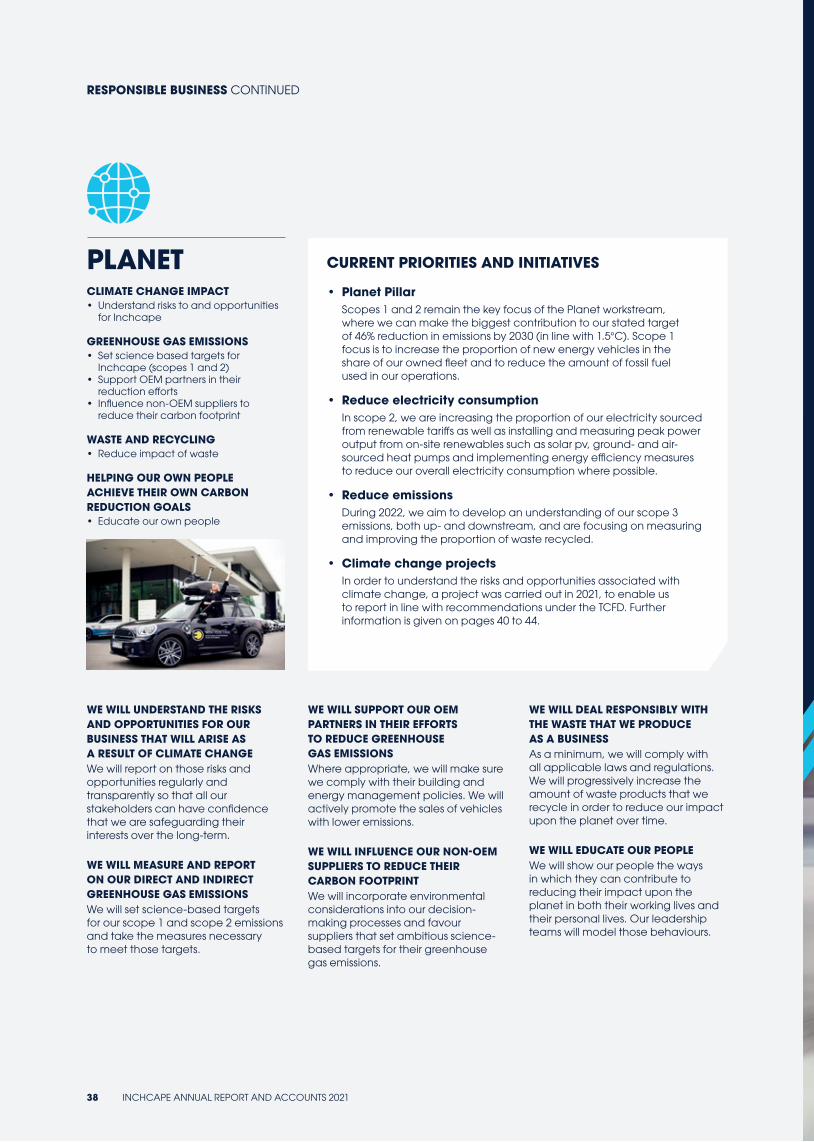
PLANETCLIMATE CHANGE IMPACT• Understand risks to and opportunities
for Inchcape
GREENHOUSE GAS EMISSIONS• Set science based targets for
Inchcape (scopes 1 and 2)• Support OEM partners in their
reduction efforts• Influence non-OEM suppliers to
reduce their carbon footprint
WASTE AND RECYCLING• Reduce impact of waste
HELPING OUR OWN PEOPLE ACHIEVE THEIR OWN CARBON REDUCTION GOALS• Educate our own people
WE WILL UNDERSTAND THE RISKS AND OPPORTUNITIES FOR OUR BUSINESS THAT WILL ARISE AS A RESULT OF CLIMATE CHANGEWe will report on those risks and opportunities regularly and transparently so that all our stakeholders can have confidence that we are safeguarding their interests over the long-term.
WE WILL MEASURE AND REPORT ON OUR DIRECT AND INDIRECT GREENHOUSE GAS EMISSIONSWe will set science-based targets for our scope 1 and scope 2 emissions and take the measures necessary to meet those targets.
WE WILL SUPPORT OUR OEM PARTNERS IN THEIR EFFORTS TO REDUCE GREENHOUSE GAS EMISSIONS Where appropriate, we will make sure we comply with their building and energy management policies. We will actively promote the sales of vehicles with lower emissions.
WE WILL INFLUENCE OUR NON-OEM SUPPLIERS TO REDUCE THEIR CARBON FOOTPRINTWe will incorporate environmental considerations into our decision-making processes and favour suppliers that set ambitious science-based targets for their greenhouse gas emissions.
WE WILL DEAL RESPONSIBLY WITH THE WASTE THAT WE PRODUCE AS A BUSINESSAs a minimum, we will comply with all applicable laws and regulations. We will progressively increase the amount of waste products that we recycle in order to reduce our impact upon the planet over time.
WE WILL EDUCATE OUR PEOPLEWe will show our people the ways in which they can contribute to reducing their impact upon the planet in both their working lives and their personal lives. Our leadership teams will model those behaviours.
CURRENT PRIORITIES AND INITIATIVES
• Planet PillarScopes 1 and 2 remain the key focus of the Planet workstream, where we can make the biggest contribution to our stated target of 46% reduction in emissions by 2030 (in line with 1.5°C). Scope 1 focus is to increase the proportion of new energy vehicles in the share of our owned fleet and to reduce the amount of fossil fuel used in our operations.
• Reduce electricity consumptionIn scope 2, we are increasing the proportion of our electricity sourced from renewable tariffs as well as installing and measuring peak power output from on-site renewables such as solar pv, ground- and air-sourced heat pumps and implementing energy efficiency measures to reduce our overall electricity consumption where possible.
• Reduce emissionsDuring 2022, we aim to develop an understanding of our scope 3 emissions, both up- and downstream, and are focusing on measuring and improving the proportion of waste recycled.
• Climate change projectsIn order to understand the risks and opportunities associated with climate change, a project was carried out in 2021, to enable us to report in line with recommendations under the TCFD. Further information is given on pages 40 to 44.
RESPONSIBLE BUSINESS CONTINUED
38 INCHCAPE ANNUAL REPORT AND ACCOUNTS 2021
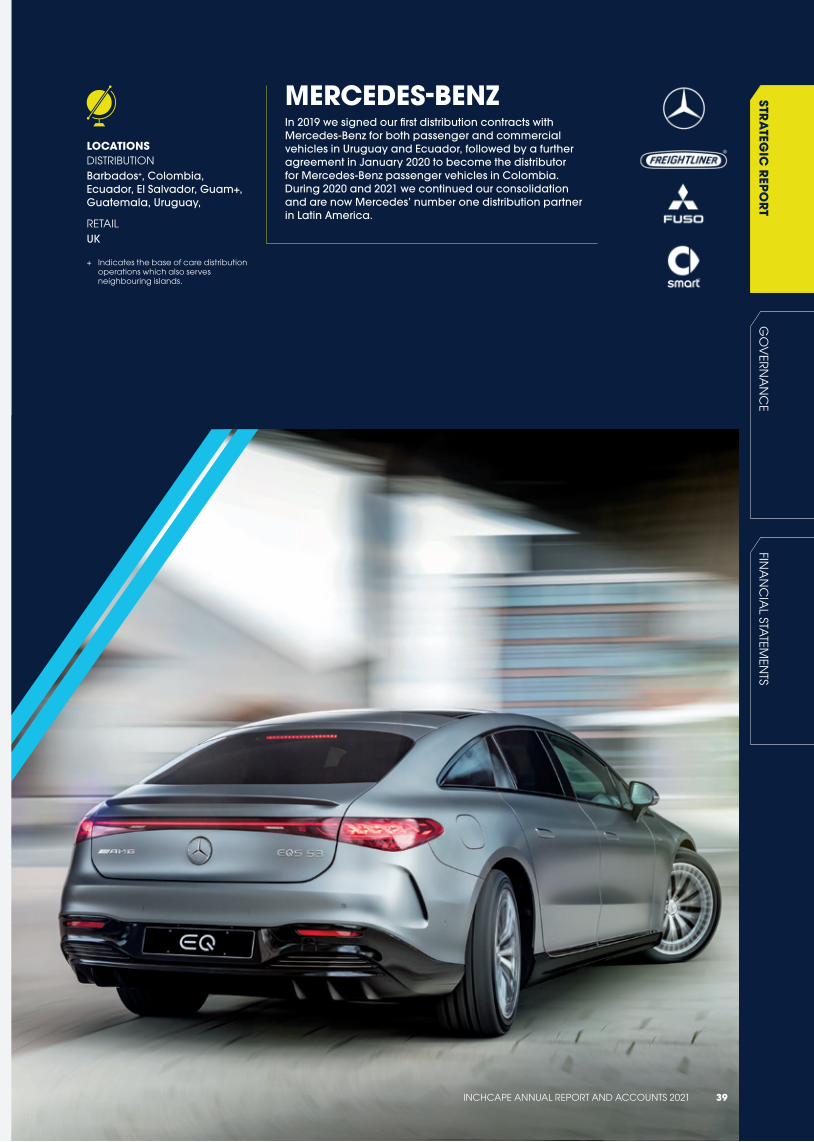
FINA
NC
IAL STA
TEMEN
TSG
OV
ERN
AN
CE
MERCEDES-BENZIn 2019 we signed our first distribution contracts with Mercedes-Benz for both passenger and commercial vehicles in Uruguay and Ecuador, followed by a further agreement in January 2020 to become the distributor for Mercedes-Benz passenger vehicles in Colombia. During 2020 and 2021 we continued our consolidation and are now Mercedes’ number one distribution partner in Latin America.
LOCATIONS DISTRIBUTIONBarbados+, Colombia, Ecuador, El Salvador, Guam+, Guatemala, Uruguay,
RETAILUK
+ Indicates the base of care distribution operations which also serves neighbouring islands.
STRA
TEGIC
REPO
RT
INCHCAPE ANNUAL REPORT AND ACCOUNTS 2021 39
STRA
TEGIC
REPO
RT
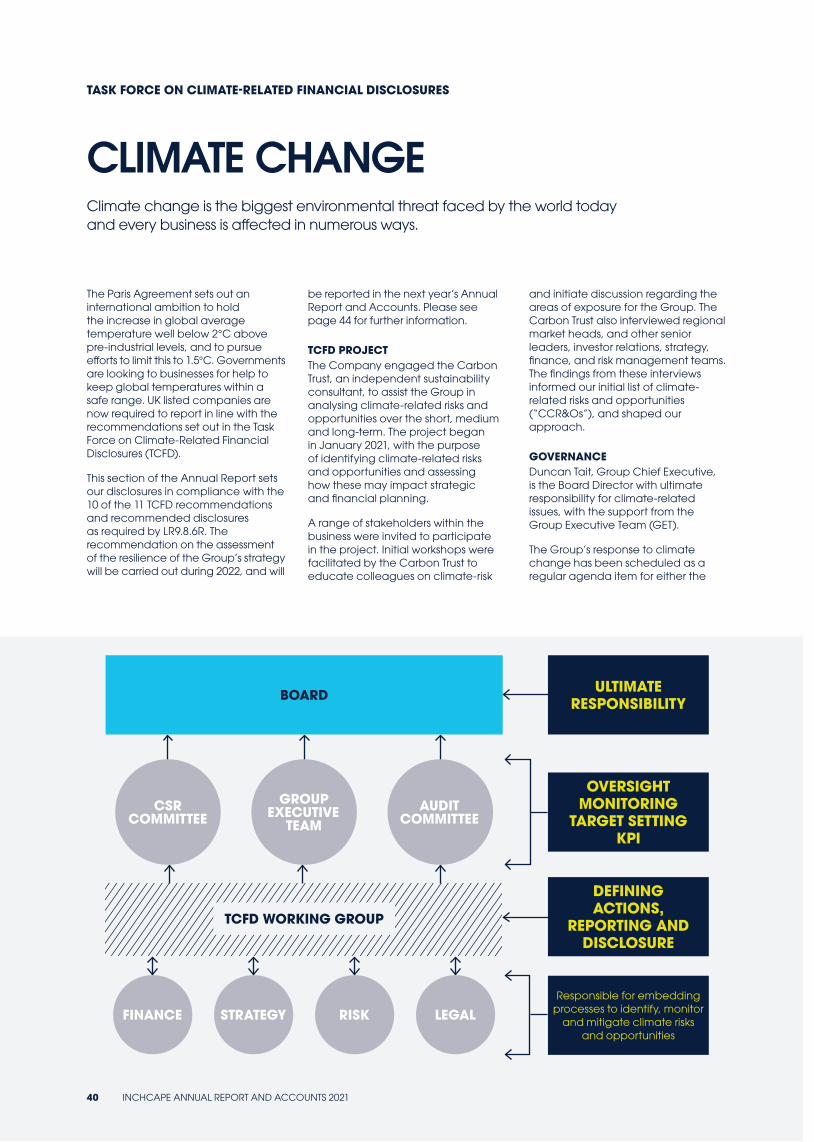
CSR COMMITTEE
FINANCE
GROUP EXECUTIVE
TEAM
STRATEGY
AUDIT COMMITTEE
RISK LEGAL
BOARD ULTIMATE RESPONSIBILITY
OVERSIGHT MONITORING
TARGET SETTING KPI
DEFINING ACTIONS,
REPORTING AND DISCLOSURE
Responsible for embedding processes to identify, monitor
and mitigate climate risks and opportunities
TCFD WORKING GROUP
TASK FORCE ON CLIMATE-RELATED FINANCIAL DISCLOSURES
Climate change is the biggest environmental threat faced by the world today and every business is affected in numerous ways.
The Paris Agreement sets out an international ambition to hold the increase in global average temperature well below 2°C above pre-industrial levels, and to pursue efforts to limit this to 1.5°C. Governments are looking to businesses for help to keep global temperatures within a safe range. UK listed companies are now required to report in line with the recommendations set out in the Task Force on Climate-Related Financial Disclosures (TCFD).
This section of the Annual Report sets our disclosures in compliance with the 10 of the 11 TCFD recommendations and recommended disclosures as required by LR9.8.6R. The recommendation on the assessment of the resilience of the Group’s strategy will be carried out during 2022, and will
be reported in the next year’s Annual Report and Accounts. Please see page 44 for further information.
TCFD PROJECT The Company engaged the Carbon Trust, an independent sustainability consultant, to assist the Group in analysing climate-related risks and opportunities over the short, medium and long-term. The project began in January 2021, with the purpose of identifying climate-related risks and opportunities and assessing how these may impact strategic and financial planning.
A range of stakeholders within the business were invited to participate in the project. Initial workshops were facilitated by the Carbon Trust to educate colleagues on climate-risk
and initiate discussion regarding the areas of exposure for the Group. The Carbon Trust also interviewed regional market heads, and other senior leaders, investor relations, strategy, finance, and risk management teams. The findings from these interviews informed our initial list of climate-related risks and opportunities (“CCR&Os”), and shaped our approach.
GOVERNANCEDuncan Tait, Group Chief Executive, is the Board Director with ultimate responsibility for climate-related issues, with the support from the Group Executive Team (GET).
The Group’s response to climate change has been scheduled as a regular agenda item for either the
CLIMATE CHANGE
40 INCHCAPE ANNUAL REPORT AND ACCOUNTS 2021
Board or one of its Committees (as appropriate) to cover impacts upon the business of climate change; and the impact of the business upon the environment.
The Audit Committee, who meet four times a year, considers emerging and significant risks throughout the year which include climate-related risks. The Audit Committee also reviews the impact of climate change when considering significant judgements such as impairment of goodwill, plant, property and equipment etc. as part of the reporting of financial information. See page 77 for further details.
The CSR Committee, which met four times during 2021, has oversight of the Driving What Matters plan, which comprises four pillars: People, Places, Planet, Practices. The Planet workstream has three principal areas of focus which include understanding, reporting and acting upon CCR&Os.
Where climate-related issues have been considered at Committee level, updates are given to the full Board following each meeting.
The Board and the CSR Committee delegate responsibility for assessing and monitoring climate-related risks to the GET, who considered climate-related issues as part of the following discussions:
• Design of strategy – considering our strategic choices through a climate change lens;
• Implementation of Risk Management framework – related oversight of how climate-related risks are being continually assessed at regional level;
• Financial planning – impact of climate on future cash flows and impairment; and
• Business development – assessment of current and future OEM partners’ new energy vehicle line up and market infrastructure.
The TCFD Working Group (TCFD Group) meets on a quarterly basis and comprises the Group General Counsel, Group Company Secretary, Head of Internal Audit, Risk Manager, the Group Financial Controller, Head of Investor Relations, Group Head of Strategy and the Group Strategy Manager.
The remit of the TCFD Group is to monitor the governance around CCR&Os, continuing identification and verification of CCR&Os, and ensuring the CCR&Os are considered in context of strategy and financial performance. The TCFD Group agrees action plans to improve disclosure under each of the recommended areas with progress tracked at each meeting.
STRATEGYThe most material climate change risk that we face is where there is a misalignment between the speed at which our OEM partners are able to transition their model line up to New Energy Vehicles (NEVs) and the pace of adoption of NEVs in the markets in which we operate.
It is plausible that in some of our markets NEV adoption will outpace the speed at which our OEM partners are able to produce NEVs at scale or vice versa. In those instances we may experience periods of market share loss. However, we remain confident that these impacts will be short-lived as the resilience of our strategy is built on:
• having decades of experience of delivering successful market entries for OEMs, and introducing their latest vehicle innovations.
• expertise in our markets, with domain expertise in regulation, government policy, understanding consumer preferences and infrastructure readiness.
• fostering long-term relationships with the world’s leading OEMs, who are investing and innovating to ensure they have a vehicle line-up which will meet consumer preferences
• working in close collaboration with our OEM partners across our regions and markets, ensuring the most appropriate vehicle line-ups. This requires careful planning regarding the suitability of particular vehicle powertrains, when to introduce new vehicle technologies, and ensuring vehicles will meet local-market homologation requirements..
In setting our strategic direction we concluded that we have relationships with OEMs that will successfully navigate the energy transition. We are also actively engaged in discussions with newer OEM entrants (e.g. those manufacturing only battery EVs), which, if successful, will support a further broadening of our brand footprint.
Please see the table on page 42 for further information on our climate-related risks and opportunities.
RISK MANAGEMENTRegional and Group risk management committees monitor and manage risks as part of the continuous risk management process. Climate-related risks are identified and assessed within the Group’s Risk Management Framework. Climate change is not drawn out as a stand alone risk due to its broad nature; however, the impact of climate change is a key element in several principal risks including EV supply and demand, and supply chain disruption. Principal risks are those which are considered to have a material financial or strategic impact on the business.
We have developed actions plans to embed climate-related assessment and management throughout the Group and to improve climate-related processes and decision making.
Further information on how risks are identified, assessed and managed can be found in the Risk Management Report on pages 48 to 56.
In addition to the risk management process, climate-related risks are considered as part of the strategic and financial planning process which is monitored by the TCFD Working Group.
Establishing climate-related risks and opportunitiesTo determine the risks identified, a value chain/business model approach was taken, combining desk-based research findings and learnings from the interviews to develop the longlist of 192 risks. Scenario data was then brought into the prioritisation assessment. Structuring the longlist development in this way ensured the potential risk of being biased/led by scenario data availability was minimised. Of the 192 risks identified, 119 were taken through the likelihood, velocity and materiality analysis. A threshold was applied to determine which risks would be shortlisted.
The GET spent time reviewing the findings to establish which risks and opportunities are the most relevant taking into account both likelihood and impact. The team also considered how the risks are currently being built into strategic thinking and how they will be considered on an on-going basis. Additionally, they established a process for identifying and assessing CCR&Os in the future.
INCHCAPE ANNUAL REPORT AND ACCOUNTS 2021 41
GO
VER
NA
NC
EFIN
AN
CIA
L STATEM
ENTS
STRA
TEGIC
REPO
RT
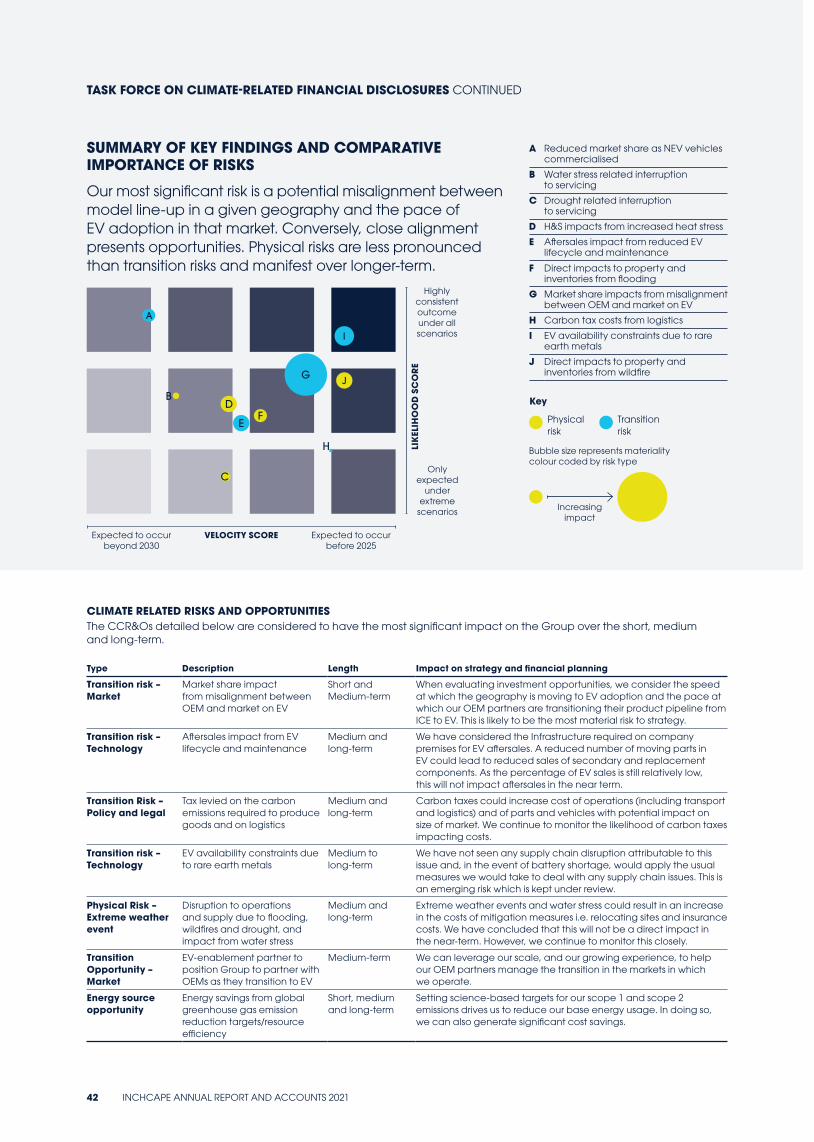
CLIMATE RELATED RISKS AND OPPORTUNITIESThe CCR&Os detailed below are considered to have the most significant impact on the Group over the short, medium and long-term.
Type Description Length Impact on strategy and financial planning
Transition risk – Market
Market share impact from misalignment between OEM and market on EV
Short and Medium-term
When evaluating investment opportunities, we consider the speed at which the geography is moving to EV adoption and the pace at which our OEM partners are transitioning their product pipeline from ICE to EV. This is likely to be the most material risk to strategy.
Transition risk – Technology
Aftersales impact from EV lifecycle and maintenance
Medium and long-term
We have considered the Infrastructure required on company premises for EV aftersales. A reduced number of moving parts in EV could lead to reduced sales of secondary and replacement components. As the percentage of EV sales is still relatively low, this will not impact aftersales in the near term.
Transition Risk – Policy and legal
Tax levied on the carbon emissions required to produce goods and on logistics
Medium and long-term
Carbon taxes could increase cost of operations (including transport and logistics) and of parts and vehicles with potential impact on size of market. We continue to monitor the likelihood of carbon taxes impacting costs.
Transition risk – Technology
EV availability constraints due to rare earth metals
Medium to long-term
We have not seen any supply chain disruption attributable to this issue and, in the event of battery shortage, would apply the usual measures we would take to deal with any supply chain issues. This is an emerging risk which is kept under review.
Physical Risk – Extreme weather event
Disruption to operations and supply due to flooding, wildfires and drought, and impact from water stress
Medium and long-term
Extreme weather events and water stress could result in an increase in the costs of mitigation measures i.e. relocating sites and insurance costs. We have concluded that this will not be a direct impact in the near-term. However, we continue to monitor this closely.
Transition Opportunity – Market
EV-enablement partner to position Group to partner with OEMs as they transition to EV
Medium-term We can leverage our scale, and our growing experience, to help our OEM partners manage the transition in the markets in which we operate.
Energy source opportunity
Energy savings from global greenhouse gas emission reduction targets/resource efficiency
Short, medium and long-term
Setting science-based targets for our scope 1 and scope 2 emissions drives us to reduce our base energy usage. In doing so, we can also generate significant cost savings.
Bubble size represents materiality colour coded by risk type
A Reduced market share as NEV vehicles commercialised
B Water stress related interruption to servicing
C Drought related interruption to servicing
D H&S impacts from increased heat stress
E Aftersales impact from reduced EV lifecycle and maintenance
F Direct impacts to property and inventories from flooding
G Market share impacts from misalignment between OEM and market on EV
H Carbon tax costs from logistics
I EV availability constraints due to rare earth metals
J Direct impacts to property and inventories from wildfire
Increasing impact
Physical risk
Transition risk
KeyLI
KEL
IHO
OD
SC
OR
E
VELOCITY SCOREExpected to occur beyond 2030
Expected to occur before 2025
Highly consistent outcome under all scenarios
Only expected
under extreme
scenarios
A
B
C
EF
G
H
I
J
D
SUMMARY OF KEY FINDINGS AND COMPARATIVE IMPORTANCE OF RISKS
Our most significant risk is a potential misalignment between model line-up in a given geography and the pace of EV adoption in that market. Conversely, close alignment presents opportunities. Physical risks are less pronounced than transition risks and manifest over longer-term.
TASK FORCE ON CLIMATE-RELATED FINANCIAL DISCLOSURES CONTINUED
42 INCHCAPE ANNUAL REPORT AND ACCOUNTS 2021
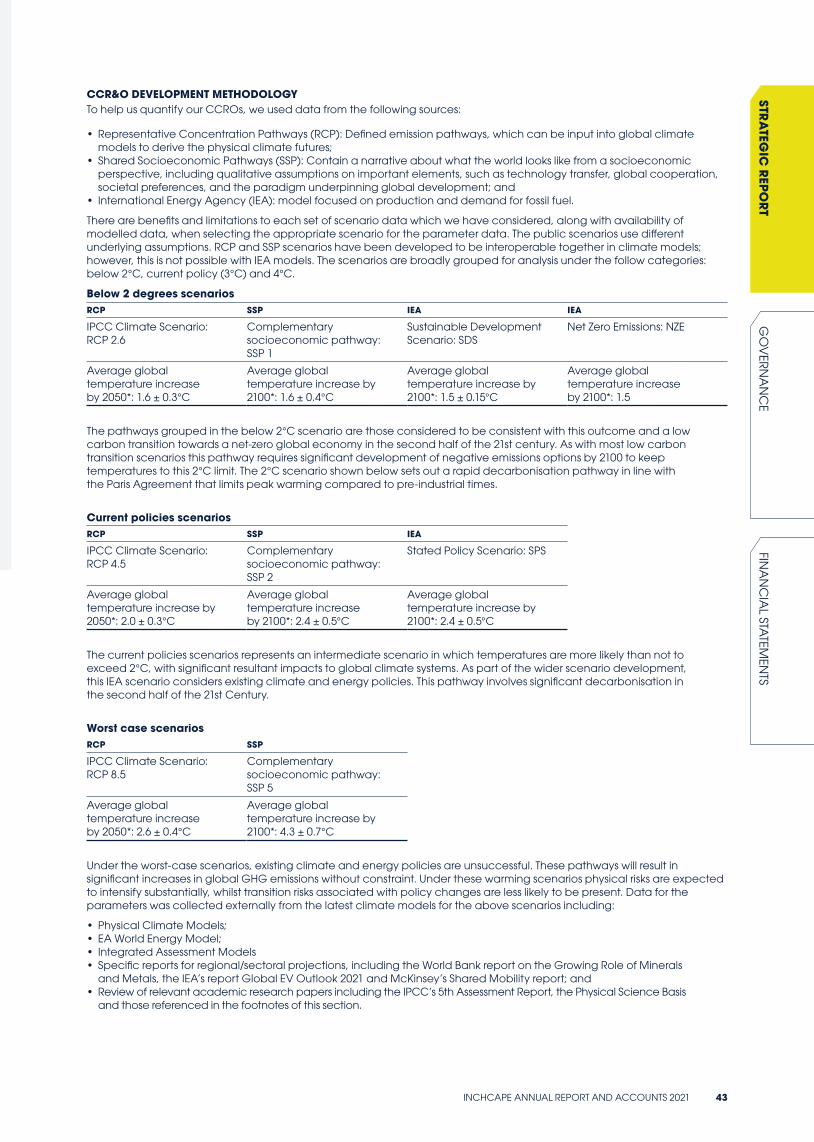
CCR&O DEVELOPMENT METHODOLOGYTo help us quantify our CCROs, we used data from the following sources:
• Representative Concentration Pathways (RCP): Defined emission pathways, which can be input into global climate models to derive the physical climate futures;
• Shared Socioeconomic Pathways (SSP): Contain a narrative about what the world looks like from a socioeconomic perspective, including qualitative assumptions on important elements, such as technology transfer, global cooperation, societal preferences, and the paradigm underpinning global development; and
• International Energy Agency (IEA): model focused on production and demand for fossil fuel.
There are benefits and limitations to each set of scenario data which we have considered, along with availability of modelled data, when selecting the appropriate scenario for the parameter data. The public scenarios use different underlying assumptions. RCP and SSP scenarios have been developed to be interoperable together in climate models; however, this is not possible with IEA models. The scenarios are broadly grouped for analysis under the follow categories: below 2°C, current policy (3°C) and 4°C.
Below 2 degrees scenariosRCP SSP IEA IEA
IPCC Climate Scenario: RCP 2.6
Complementary socioeconomic pathway: SSP 1
Sustainable Development Scenario: SDS
Net Zero Emissions: NZE
Average global temperature increase by 2050*: 1.6 ± 0.3°C
Average global temperature increase by 2100*: 1.6 ± 0.4°C
Average global temperature increase by 2100*: 1.5 ± 0.15°C
Average global temperature increase by 2100*: 1.5
The pathways grouped in the below 2°C scenario are those considered to be consistent with this outcome and a low carbon transition towards a net-zero global economy in the second half of the 21st century. As with most low carbon transition scenarios this pathway requires significant development of negative emissions options by 2100 to keep temperatures to this 2°C limit. The 2°C scenario shown below sets out a rapid decarbonisation pathway in line with the Paris Agreement that limits peak warming compared to pre-industrial times.
Current policies scenariosRCP SSP IEA
IPCC Climate Scenario: RCP 4.5
Complementary socioeconomic pathway: SSP 2
Stated Policy Scenario: SPS
Average global temperature increase by 2050*: 2.0 ± 0.3°C
Average global temperature increase by 2100*: 2.4 ± 0.5°C
Average global temperature increase by 2100*: 2.4 ± 0.5°C
The current policies scenarios represents an intermediate scenario in which temperatures are more likely than not to exceed 2°C, with significant resultant impacts to global climate systems. As part of the wider scenario development, this IEA scenario considers existing climate and energy policies. This pathway involves significant decarbonisation in the second half of the 21st Century.
Worst case scenariosRCP SSP
IPCC Climate Scenario: RCP 8.5
Complementary socioeconomic pathway: SSP 5
Average global temperature increase by 2050*: 2.6 ± 0.4°C
Average global temperature increase by 2100*: 4.3 ± 0.7°C
Under the worst-case scenarios, existing climate and energy policies are unsuccessful. These pathways will result in significant increases in global GHG emissions without constraint. Under these warming scenarios physical risks are expected to intensify substantially, whilst transition risks associated with policy changes are less likely to be present. Data for the parameters was collected externally from the latest climate models for the above scenarios including:
• Physical Climate Models;• EA World Energy Model; • Integrated Assessment Models• Specific reports for regional/sectoral projections, including the World Bank report on the Growing Role of Minerals
and Metals, the IEA’s report Global EV Outlook 2021 and McKinsey’s Shared Mobility report; and• Review of relevant academic research papers including the IPCC’s 5th Assessment Report, the Physical Science Basis
and those referenced in the footnotes of this section.
INCHCAPE ANNUAL REPORT AND ACCOUNTS 2021 43
GO
VER
NA
NC
EFIN
AN
CIA
L STATEM
ENTS
STRA
TEGIC
REPO
RT
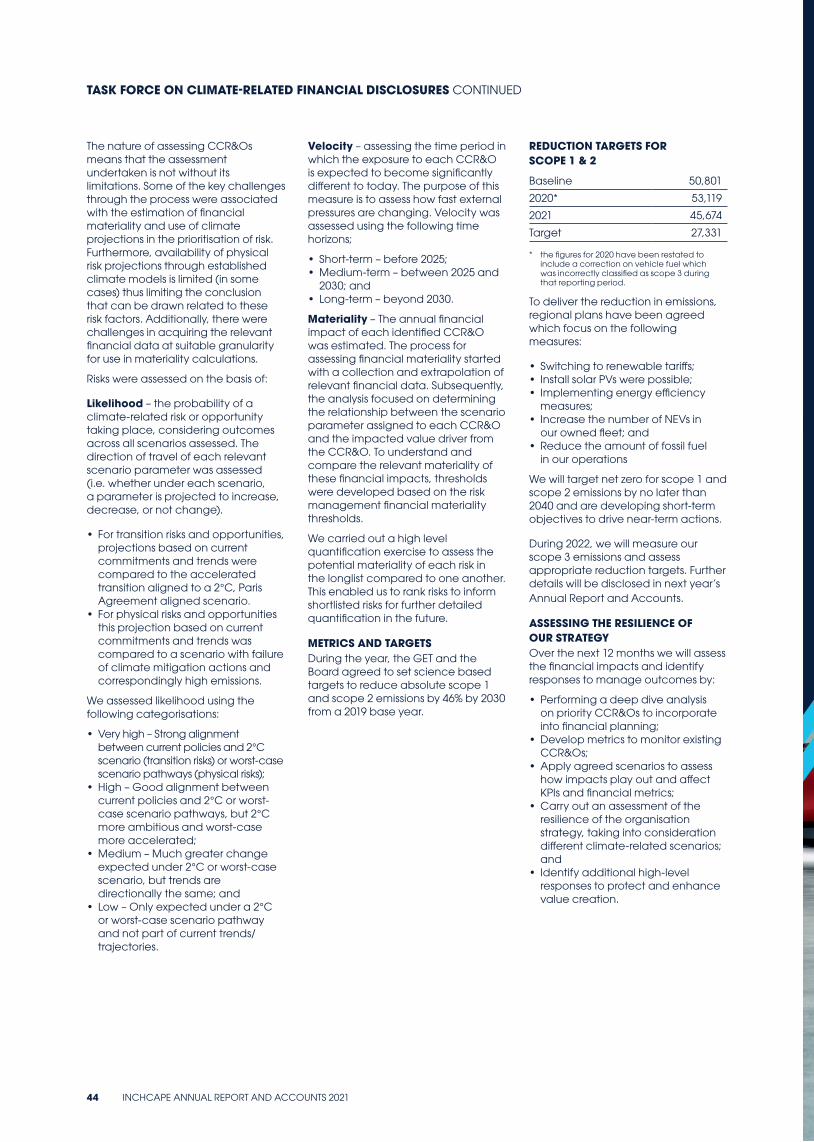
The nature of assessing CCR&Os means that the assessment undertaken is not without its limitations. Some of the key challenges through the process were associated with the estimation of financial materiality and use of climate projections in the prioritisation of risk. Furthermore, availability of physical risk projections through established climate models is limited (in some cases) thus limiting the conclusion that can be drawn related to these risk factors. Additionally, there were challenges in acquiring the relevant financial data at suitable granularity for use in materiality calculations.
Risks were assessed on the basis of:
Likelihood – the probability of a climate-related risk or opportunity taking place, considering outcomes across all scenarios assessed. The direction of travel of each relevant scenario parameter was assessed (i.e. whether under each scenario, a parameter is projected to increase, decrease, or not change).
• For transition risks and opportunities, projections based on current commitments and trends were compared to the accelerated transition aligned to a 2°C, Paris Agreement aligned scenario.
• For physical risks and opportunities this projection based on current commitments and trends was compared to a scenario with failure of climate mitigation actions and correspondingly high emissions.
We assessed likelihood using the following categorisations:
• Very high – Strong alignment between current policies and 2°C scenario (transition risks) or worst-case scenario pathways (physical risks);
• High – Good alignment between current policies and 2°C or worst-case scenario pathways, but 2°C more ambitious and worst-case more accelerated;
• Medium – Much greater change expected under 2°C or worst-case scenario, but trends are directionally the same; and
• Low – Only expected under a 2°C or worst-case scenario pathway and not part of current trends/trajectories.
Velocity – assessing the time period in which the exposure to each CCR&O is expected to become significantly different to today. The purpose of this measure is to assess how fast external pressures are changing. Velocity was assessed using the following time horizons;
• Short-term – before 2025; • Medium-term – between 2025 and
2030; and • Long-term – beyond 2030.
Materiality – The annual financial impact of each identified CCR&O was estimated. The process for assessing financial materiality started with a collection and extrapolation of relevant financial data. Subsequently, the analysis focused on determining the relationship between the scenario parameter assigned to each CCR&O and the impacted value driver from the CCR&O. To understand and compare the relevant materiality of these financial impacts, thresholds were developed based on the risk management financial materiality thresholds.
We carried out a high level quantification exercise to assess the potential materiality of each risk in the longlist compared to one another. This enabled us to rank risks to inform shortlisted risks for further detailed quantification in the future.
METRICS AND TARGETSDuring the year, the GET and the Board agreed to set science based targets to reduce absolute scope 1 and scope 2 emissions by 46% by 2030 from a 2019 base year.
REDUCTION TARGETS FOR SCOPE 1 & 2
Baseline 50,801
2020* 53,119
2021 45,674
Target 27,331
* the figures for 2020 have been restated to include a correction on vehicle fuel which was incorrectly classified as scope 3 during that reporting period.
To deliver the reduction in emissions, regional plans have been agreed which focus on the following measures:
• Switching to renewable tariffs; • Install solar PVs were possible; • Implementing energy efficiency
measures; • Increase the number of NEVs in
our owned fleet; and • Reduce the amount of fossil fuel
in our operations
We will target net zero for scope 1 and scope 2 emissions by no later than 2040 and are developing short-term objectives to drive near-term actions.
During 2022, we will measure our scope 3 emissions and assess appropriate reduction targets. Further details will be disclosed in next year’s Annual Report and Accounts.
ASSESSING THE RESILIENCE OF OUR STRATEGYOver the next 12 months we will assess the financial impacts and identify responses to manage outcomes by:
• Performing a deep dive analysis on priority CCR&Os to incorporate into financial planning;
• Develop metrics to monitor existing CCR&Os;
• Apply agreed scenarios to assess how impacts play out and affect KPIs and financial metrics;
• Carry out an assessment of the resilience of the organisation strategy, taking into consideration different climate-related scenarios; and
• Identify additional high-level responses to protect and enhance value creation.
TASK FORCE ON CLIMATE-RELATED FINANCIAL DISCLOSURES CONTINUED
44 INCHCAPE ANNUAL REPORT AND ACCOUNTS 2021

FINA
NC
IAL STA
TEMEN
TSG
OV
ERN
AN
CE
BMW GROUPOur partnership with BMW Group is over 30 years strong and has been a key focus for consolidated growth, especially in the Baltic region where we now represent the brand in all three countries: Estonia, Latvia and Lithuania. In 2020 we were awarded the Distribution contracts for MINI in Chile and for MINI and BMW Motorrad (the brand’s motorcycle division) in Peru, consolidating our position in those markets. As well as holding Distribution contracts in South America, we also have significant operations of BMW Group’s brands in our Retail-only markets: UK, Poland and Russia.
LOCATIONS DISTRIBUTIONChile, Estonia, Guam, Kenya, Latvia, Lithuania, Peru
RETAILPoland, Russia, UK
STRA
TEGIC
REPO
RT
INCHCAPE ANNUAL REPORT AND ACCOUNTS 2021 45
STRA
TEGIC
REPO
RT

EMPLOYEESENVIRONMENTAL MATTERS
HUMAN RIGHTS
NON-FINANCIAL INFORMATION STATEMENT
NON-FINANCIAL INFORMATION STATEMENT
Environmental matters are considered as part of the Planet pillar of the Driving What Matters plan.
• The Health and Safety (H&S) framework is designed to ensure employees comply with relevant environmental legislation.
• The Group has set science based targets for scope 1 and 2 emissions. Each region has developed their own policies in order to achieve these targets.
• Energy efficiency policies are also implemented at local level .
The Planet Charter, which was developed in 2021 is given on page 38.
Our employees are at the heart of the People pillar of the Driving What Matters plan, which aims to ensure we have a safe operating environment with an inclusive and diverse culture and the best talent and skills for our future success.
• The Inclusion and Diversity framework was developed on 2021.
• The H&S framework is designed to protect the health and safety of employees.
• The Code of Conduct provides guidance on the ethical behaviour we expect from all employees.
• The whistleblowing policy provides guidance to employees to raise concerns without fear of reprisal.
The People Charter, which was developed in 2021 is given on page 34.
We embrace, support and respect the human rights of everyone we work with and we comply with appropriate human rights legislation in the countries in which we operate.
• Employment policies are implemented at local level and are designed to protect employees’ human rights.
• The Modern Slavery statement describes the actions taken in respect of our supply chain.
Modern slavery training is rolled out to those employees whose roles and remit require additional focus in this area.
The Modern Slavery statement is available at www.inchcape.com.
POLICY IMPLEMENTATION To ensure effective implementation of our policies we communicate clearly through employee induction, the Group-wide intranet, updates and briefings and via the Practices pillar of the Driving What Matters plan.
The GET and the Board review certain policies on an annual basis, such as the Tax Strategy Policy, Risk Policy and Delegated Authorities Policy. Other polices are overseen at regional and local level by the subsidiary management teams.
46 INCHCAPE ANNUAL REPORT AND ACCOUNTS 2021
SOCIAL MATTERS ANTI-BRIBERY AND CORRUPTION
CODE OF CONDUCT The Group’s Code of Conduct was refreshed in 2021 to reflect the Accelerate strategy and the Driving What Matters plan and was reviewed and approved by the GET and the Board. The Code sets out the behaviours and conduct expected from all employees and contains ethical decision-making guidance highlighted through ‘Live It’ examples.
It is available in 19 languages and is accompanied by an online training module. Employees are expected to complete the training every two years, with senior managers confirming on an annual basis that they, and their teams, are aware of and fully understand the Code. New joiners are expected to complete the Code of Conduct training within four weeks of joining the business. Where employees do not have access to a computer, they are made aware of the Code through various non-digital means.
It is important to the Board to maintain a reputation for high standards of business conduct. During 2021, the Board also approved a new Supplier Code of Conduct which sets out the behaviours we expect from our suppliers. The Supplier Code of Conduct aligns with the Group’s Policy Statements on anti-bribery and corruption and modern slavery, providing a strong governance framework in which to do business.
READ MORE Both Codes of Conduct are available at www.inchcape.com.
Non-financial information
People Places Planet Practices
Where to find more information
Responsible Business Report – pages 34 and 35CSR Committee Report – pages 82 and 83Directors’ Report – pages 106 and 107
Responsible Business Report – page 36
Responsible Business Report – page 38TCFD – pages 40 to 44Risk Management Report – pages 48 to 55Directors’ Report – page 106
Responsible Business Report – page 37Risk Management Report – pages 48 to 55
The non-financial reporting requirements contained in sections 414CA and 414CB of the Companies Act 2006 are addressed in this section and by means of cross reference. The Group’s business model is given on pages 2 and 3. The Group’s KPIs are stated on pages 20 and 21. Principal risks are given on page 50.
Social matters cover a vast range of potential issues including responsible business policies. We have in place the following Group-wide policies:
• Tax strategy.• Data protection/data privacy.• Competition/anti trust.
The Group’s tax strategy is available at www.inchcape.com
Social matters can also include the impact on the communities in which we operate. We do not have a global policy covering community matters as any initiatives are championed at local level. Social matters form part of the Places pillar of the Driving What Matters plan.
The Places Charter, which was developed in 2021, is given on page 36.
It is important that the Group operates to high ethical standards and complies with all applicable laws. To support this the Group has in place the following policy statements:
• Anti-bribery and corruption.• Anti-money laundering.
The policy statements are available at www.inchcape.com.
Code of Conduct training is rolled out to all employees, and bespoke training, such as anti-bribery and corruption, anti-tax evasion facilitation and modern slavery are rolled out to those employees whose roles and remit require additional focus and expertise in these areas.
The Internal Audit function monitors policy implementation. Our whistleblowing helpline, Speak Up!, enables employees to raise concerns confidentially and without fear of reprisal, including non-compliance with policies and procedures.
INCHCAPE ANNUAL REPORT AND ACCOUNTS 2021 47
GO
VER
NA
NC
EFIN
AN
CIA
L STATEM
ENTS
STRA
TEGIC
REPO
RT

A CHANGING BUSINESS ENVIRONMENTConsumers expect the same levels of convenience, service and online interaction in automotive that they have experienced elsewhere. The post-pandemic economic rebound is testing supply chains in all sectors around the globe, including automotive. The potential for the rapid growth of shared ownership models, fully autonomous vehicles and fully connected cars remains, even if they still lie some way ahead.
Within Inchcape, we are responding to these changes by deploying our refreshed strategy – Accelerate – at
pace. This is transforming our value protection, core processes and back-office activities. Our stakeholders expect Accelerate to be executed responsibly, and ethically, with due care for our people, our planet, and the places in which we operate.
More than ever, our approach to risk management and internal control needs to reflect these trends while actively supporting the rapid deployment of Accelerate and our Responsible Business agenda. In 2021, we launched a refreshed enterprise risk management programme to do just that – to focus on the risks that matter.
RISK MANAGEMENT
ACCELERATING RISK MANAGEMENTOur industry is transforming on an unprecedented scale. Structural changes are underway, with new routes to market opening up. Digitalisation is removing barriers to entry and enabling us, and our competitors, to rapidly scale up business models and enter new sectors of our value chain. Climate change is driving the transformation of vehicle drivetrains and presents us with a wider set of opportunities and new risks.
Using the updated approach, our operating companies, Group functions and major change programmes conducted risk assessments and action planning for the most significant risks to the delivery of the Accelerate strategy and to their related objectives and plans. The Group Executive Team and the Board reviewed the Group’s Principal and Emerging Risks and Risk Appetite in July and November 2021.
Table 1: How the changing external and internal business environment is reflected in our risk profileChanges in the business environment Related principal risk(s) (see page 50) Related emerging risks (see page 55)
Accelerating digitalisation and disruptive automotive trends (Connected vehicles; autonomous driving; shared mobility; electrification)
Electric vehicle supply and demand; People: future skills
Shared mobility; technology vendor landscape; maintaining new OEM relationships
Climate change Electric vehicle supply and demand; margin pressure; health, safety, environment
Availability of rare earth materials; government restrictions on car usage; extreme weather patterns; developing and growing new OEM relationships
Consumer expectations of service and digital capability
Change delivery
Covid-19 Covid trading restrictions; health, safety environment; political risk foreign exchange volatility
Future pandemic (increased frequency or severity)
Deployment of Accelerate – our refreshed strategy
Change delivery; acquisition ROI
Growing economic recovery Supply chain disruption; People: retention; skills; foreign exchange volatility
Inflation and interest rate growth, incl. salary; inflation; economic slowdown
Increased pressure on OEM margins and structural changes in the route to market
Loss of a distribution agreement; margin pressure; new market entrants; change delivery
Developing and growing new OEM relationships
People: – New ways of working;– War for talent (as economies recover)
People: engagement, retention; People: future skills; health, safety, environment
People: inclusion and diversity
Stakeholder expectations of a responsible business
Electric vehicle supply and demand; People: engagement, retention; health, safety, environment; political risks; legal and regulatory compliance; fraud
People: inclusion and diversity
48 INCHCAPE ANNUAL REPORT AND ACCOUNTS 2021
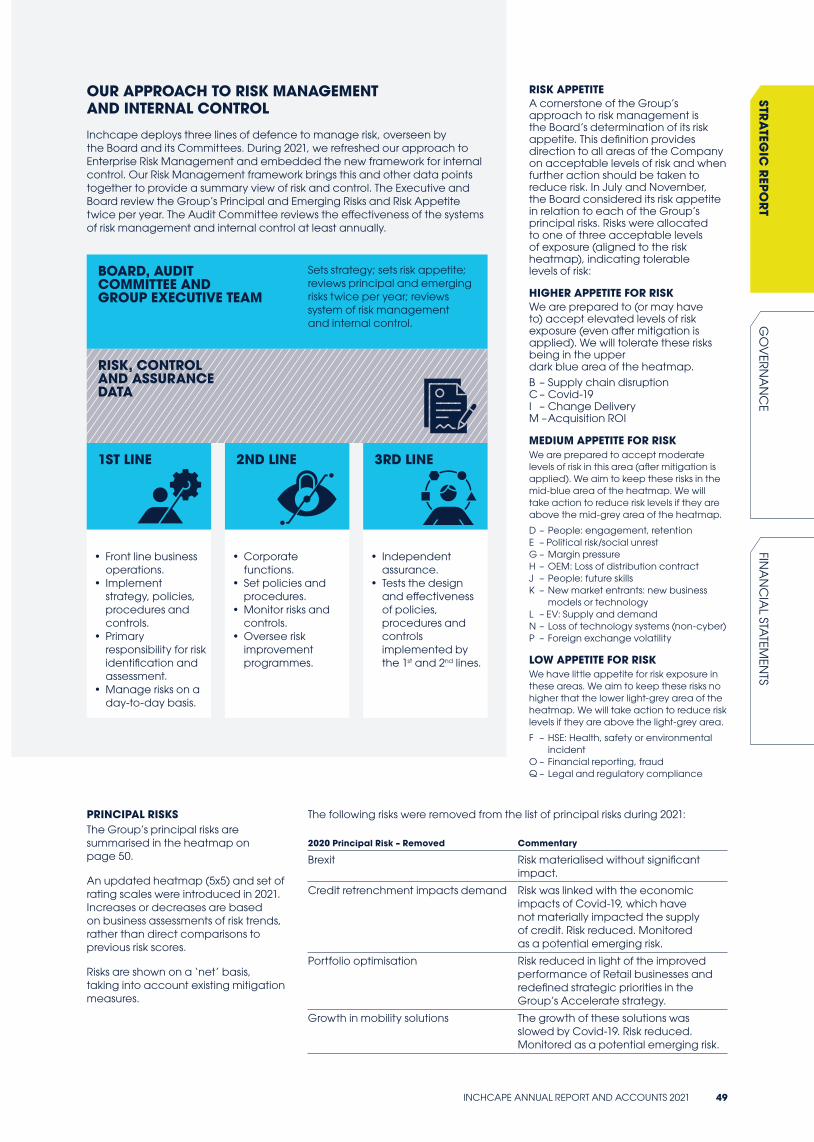
PRINCIPAL RISKS The Group’s principal risks are summarised in the heatmap on page 50.
An updated heatmap (5x5) and set of rating scales were introduced in 2021. Increases or decreases are based on business assessments of risk trends, rather than direct comparisons to previous risk scores.
Risks are shown on a ‘net’ basis, taking into account existing mitigation measures.
The following risks were removed from the list of principal risks during 2021:
2020 Principal Risk – Removed Commentary
Brexit Risk materialised without significant impact.
Credit retrenchment impacts demand Risk was linked with the economic impacts of Covid-19, which have not materially impacted the supply of credit. Risk reduced. Monitored as a potential emerging risk.
Portfolio optimisation Risk reduced in light of the improved performance of Retail businesses and redefined strategic priorities in the Group’s Accelerate strategy.
Growth in mobility solutions The growth of these solutions was slowed by Covid-19. Risk reduced. Monitored as a potential emerging risk.
OUR APPROACH TO RISK MANAGEMENT AND INTERNAL CONTROL
Inchcape deploys three lines of defence to manage risk, overseen by the Board and its Committees. During 2021, we refreshed our approach to Enterprise Risk Management and embedded the new framework for internal control. Our Risk Management framework brings this and other data points together to provide a summary view of risk and control. The Executive and Board review the Group’s Principal and Emerging Risks and Risk Appetite twice per year. The Audit Committee reviews the effectiveness of the systems of risk management and internal control at least annually.
RISK APPETITEA cornerstone of the Group’s approach to risk management is the Board’s determination of its risk appetite. This definition provides direction to all areas of the Company on acceptable levels of risk and when further action should be taken to reduce risk. In July and November, the Board considered its risk appetite in relation to each of the Group’s principal risks. Risks were allocated to one of three acceptable levels of exposure (aligned to the risk heatmap), indicating tolerable levels of risk:
HIGHER APPETITE FOR RISKWe are prepared to (or may have to) accept elevated levels of risk exposure (even after mitigation is applied). We will tolerate these risks being in the upper dark blue area of the heatmap. B – Supply chain disruptionC – Covid-19I – Change DeliveryM – Acquisition ROI
MEDIUM APPETITE FOR RISKWe are prepared to accept moderate levels of risk in this area (after mitigation is applied). We aim to keep these risks in the mid-blue area of the heatmap. We will take action to reduce risk levels if they are above the mid-grey area of the heatmap.
D – People: engagement, retentionE – Political risk/social unrestG – Margin pressure H – OEM: Loss of distribution contractJ – People: future skillsK – New market entrants: new business
models or technologyL – EV: Supply and demandN – Loss of technology systems (non-cyber)P – Foreign exchange volatility
LOW APPETITE FOR RISKWe have little appetite for risk exposure in these areas. We aim to keep these risks no higher that the lower light-grey area of the heatmap. We will take action to reduce risk levels if they are above the light-grey area.
F – HSE: Health, safety or environmental incident
O – Financial reporting, fraudQ – Legal and regulatory compliance
RISK, CONTROL AND ASSURANCE DATA
BOARD, AUDIT COMMITTEE AND GROUP EXECUTIVE TEAM
1ST LINE
• Front line business operations.
• Implement strategy, policies, procedures and controls.
• Primary responsibility for risk identification and assessment.
• Manage risks on a day-to-day basis.
2ND LINE
• Corporate functions.
• Set policies and procedures.
• Monitor risks and controls.
• Oversee risk improvement programmes.
3RD LINE
• Independent assurance.
• Tests the design and effectiveness of policies, procedures and controls implemented by the 1st and 2nd lines.
Sets strategy; sets risk appetite; reviews principal and emerging risks twice per year; reviews system of risk management and internal control.
INCHCAPE ANNUAL REPORT AND ACCOUNTS 2021 49
GO
VER
NA
NC
EFIN
AN
CIA
L STATEM
ENTS
STRA
TEGIC
REPO
RT
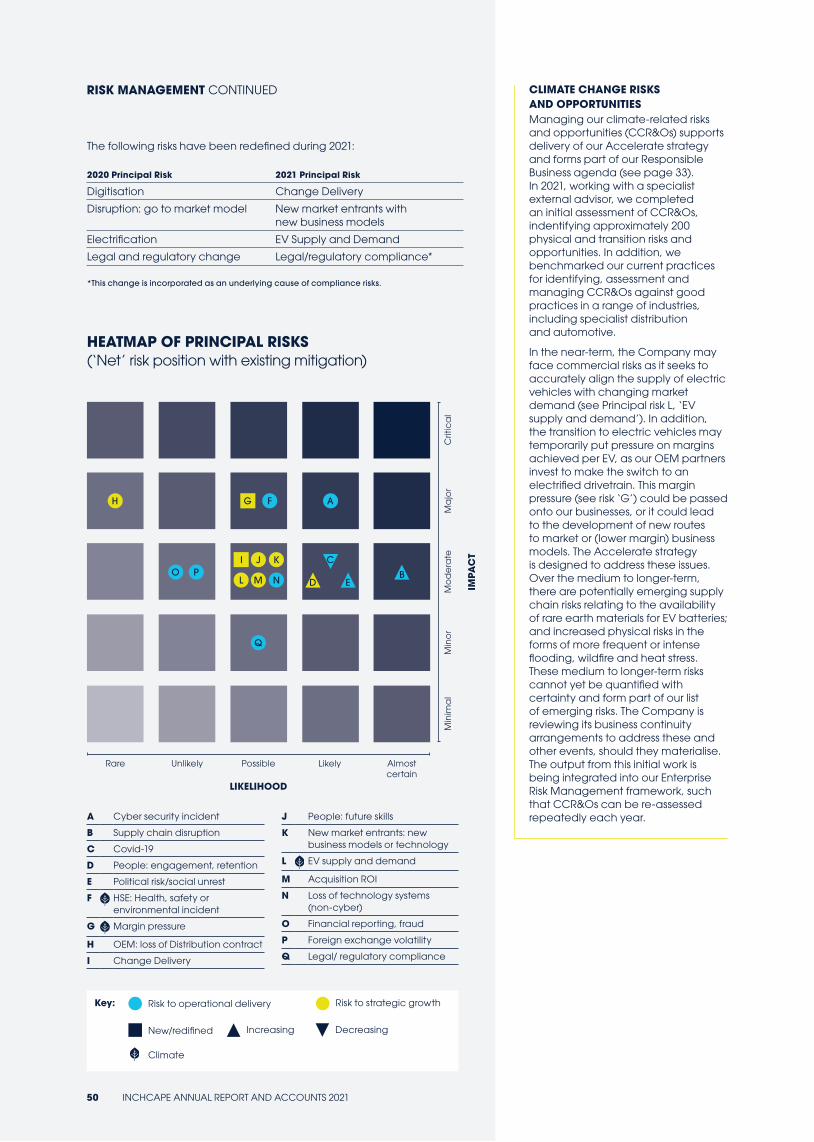
IMPA
CT
Crit
ica
lM
ajo
rM
od
era
teM
ino
rM
inim
al
Rare Unlikely Possible Likely Almost certain
LIKELIHOOD
H G
I J C
M N EB
Q
K
L D
F
O P
A
Risk to operational delivery
New/redifined
Climate
Risk to strategic growth
Increasing Decreasing
Key:
A Cyber security incident
B Supply chain disruption
C Covid-19
D People: engagement, retention
E Political risk/social unrest
F HSE: Health, safety or environmental incident
G Margin pressure
H OEM: loss of Distribution contract
I Change Delivery
J People: future skills
K New market entrants: new business models or technology
L EV supply and demand
M Acquisition ROI
N Loss of technology systems (non-cyber)
O Financial reporting, fraud
P Foreign exchange volatility
Q Legal/ regulatory compliance
HEATMAP OF PRINCIPAL RISKS (‘Net’ risk position with existing mitigation)
RISK MANAGEMENT CONTINUED CLIMATE CHANGE RISKS AND OPPORTUNITIESManaging our climate-related risks and opportunities (CCR&Os) supports delivery of our Accelerate strategy and forms part of our Responsible Business agenda (see page 33). In 2021, working with a specialist external advisor, we completed an initial assessment of CCR&Os, indentifying approximately 200 physical and transition risks and opportunities. In addition, we benchmarked our current practices for identifying, assessment and managing CCR&Os against good practices in a range of industries, including specialist distribution and automotive.
In the near-term, the Company may face commercial risks as it seeks to accurately align the supply of electric vehicles with changing market demand (see Principal risk L, ‘EV supply and demand’). In addition, the transition to electric vehicles may temporarily put pressure on margins achieved per EV, as our OEM partners invest to make the switch to an electrified drivetrain. This margin pressure (see risk ‘G’) could be passed onto our businesses, or it could lead to the development of new routes to market or (lower margin) business models. The Accelerate strategy is designed to address these issues. Over the medium to longer-term, there are potentially emerging supply chain risks relating to the availability of rare earth materials for EV batteries; and increased physical risks in the forms of more frequent or intense flooding, wildfire and heat stress. These medium to longer-term risks cannot yet be quantified with certainty and form part of our list of emerging risks. The Company is reviewing its business continuity arrangements to address these and other events, should they materialise. The output from this initial work is being integrated into our Enterprise Risk Management framework, such that CCR&Os can be re-assessed repeatedly each year.
The following risks have been redefined during 2021:
2020 Principal Risk 2021 Principal Risk
Digitisation Change Delivery
Disruption: go to market model New market entrants with new business models
Electrification EV Supply and Demand
Legal and regulatory change Legal/regulatory compliance*
*This change is incorporated as an underlying cause of compliance risks.
50 INCHCAPE ANNUAL REPORT AND ACCOUNTS 2021

Cyber security risks remain a priority for the Group. In 2021, the Group launched a multi-year security improvement programme, recognising the constantly-changing nature of the threat and the importance of technology to the Group in the future.
Risks of supply chain disruption have increased and are expected to continue well into 2022. The Group has well-established planning procedures and the strength of our OEM relationships has enabled the Company to offset volume impacts through margin improvements, to date. Despite these measures, we expect headwinds from product shortages and further volatility through 2022.
The risk of further Covid-19 business interruption and trading restrictions remains material, although we recognise some reduction in this risk as vaccination programmes take effect and we continue to improve our ability to trade in the current environment.
Climate change underlies two of our principal risks, both related to the electrification of the drivetrain. As markets ultimately transition to electric vehicles (EVs), all distributors and retailers will be challenged to align EV supply with changing
market demand. The increased costs of EV transition will need to be recovered, potentially through a reordering of routes to markets and different business models, which may lead to temporary pressures on our margins. The changing climate presents a larger set of emerging risks (see page 55).
We continue to expand our focus on mental health within our Health, Safety and Environmental (HSE) programme, as our colleagues around the globe manage disrupted ways of working in light of the pandemic. This risk will remain a priority as the Group works through a multi-year programme of improvement and cultural change (in all areas of HSE).
The potential for disruption from a range of political risks is increasing in Africa, Europe and Russia, and Asia. Contingency measures are in place.
As we go through a period of accelerated business change, we may experience a heightened people risks. This may be in the form of challenges to secure the skill sets needed for our future business; or reduced engagement and increased attrition as change is delivered and workload increases. This is exacerbated by increased competition for the best talent
as economies recover. The Group regularly monitors employee engagement levels and develops action plans. Updated mental health programmes have been introduced and are subject to continual review and improvement to address emerging issues.
The materialisation of any of the risks shown on the heatmap could have an adverse effect on the Group’s results or financial condition. If more than one of these risks occur, the combined effect may be compounded. Various strategies are employed to reduce these inherent risks to an acceptable level. These are summarised in the tables on the following pages. The effectiveness of these mitigation strategies can change over time, for example with the acquisition or disposal of businesses. Some of these risks remain beyond the direct control of management. The Risk Management programme, including risk assessments, can therefore only provide reasonable but not absolute assurance that risks are managed to an acceptable level.
In addition to regular reviews of strategy and operational performance (and associated risks), our governance committees have reviewed the following topics relating to the Group’s Principal Risks:
Board Audit Committee Group Executive Team
January Legal and regulatory risks; Cyber; Covid-19; Strategy: Disruptive industry trends; Acquisition ROI
n/a Change delivery; Covid-19
February/March/April
Viability: Loss of distribution agreement and cyber (financial impacts)
Internal controls (fraud, financial reporting, technology systems risks)
People update; Climate (carbon emissions; risk assessment); Change delivery; Acquisition ROI (M&A)
May Health, safety, environment; Strategy: disruptive trends, EV supply and demand
Cyber security; Internal controls (fraud, financial reporting, technology systems risks)
Health, safety, environment; Supply chain; People: future skills
July Principal and Emerging Group Risks; Risk Appetite; Financial forecasts: supply chain disruption
Internal controls (fraud, financial reporting, technology systems risks)
Climate-related risks and opportunities; Principal and Emerging Group Risks; Risk Appetite; Cyber; Change Delivery
September/October
Health, safety, environment n/a Health, safety, environment; People risks (employee survey); Supply chain disruption (semiconductors); Cyber security; Legal and regulatory compliance; Change delivery; People: future skills; Climate (carbon emissions)
November/December
Strategy: Disruptive industry trends, change volume and major programme delivery; Principal and Emerging Group Risks; Risk Appetite; Climate-related risks and opportunities
Effectiveness of risk management;Internal controls (fraud, financial reporting, technology systems risks); Cyber security
Principal and Emerging Group Risks; Risk Appetite; Change delivery; People
INCHCAPE ANNUAL REPORT AND ACCOUNTS 2021 51
GO
VER
NA
NC
EFIN
AN
CIA
L STATEM
ENTS
STRA
TEGIC
REPO
RT
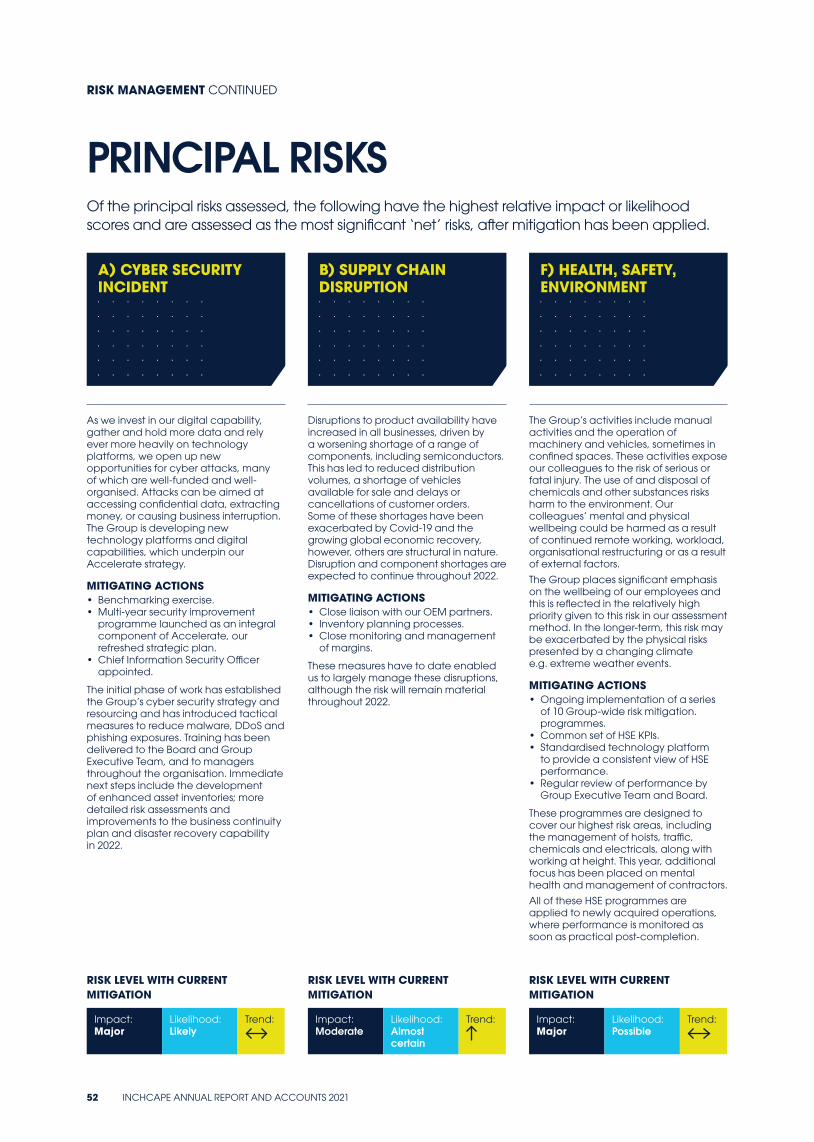
K NL
As we invest in our digital capability, gather and hold more data and rely ever more heavily on technology platforms, we open up new opportunities for cyber attacks, many of which are well-funded and well-organised. Attacks can be aimed at accessing confidential data, extracting money, or causing business interruption. The Group is developing new technology platforms and digital capabilities, which underpin our Accelerate strategy.
MITIGATING ACTIONS• Benchmarking exercise.• Multi-year security improvement
programme launched as an integral component of Accelerate, our refreshed strategic plan.
• Chief Information Security Officer appointed.
The initial phase of work has established the Group’s cyber security strategy and resourcing and has introduced tactical measures to reduce malware, DDoS and phishing exposures. Training has been delivered to the Board and Group Executive Team, and to managers throughout the organisation. Immediate next steps include the development of enhanced asset inventories; more detailed risk assessments and improvements to the business continuity plan and disaster recovery capability in 2022.
Disruptions to product availability have increased in all businesses, driven by a worsening shortage of a range of components, including semiconductors. This has led to reduced distribution volumes, a shortage of vehicles available for sale and delays or cancellations of customer orders. Some of these shortages have been exacerbated by Covid-19 and the growing global economic recovery, however, others are structural in nature. Disruption and component shortages are expected to continue throughout 2022.
MITIGATING ACTIONS• Close liaison with our OEM partners.• Inventory planning processes.• Close monitoring and management
of margins.
These measures have to date enabled us to largely manage these disruptions, although the risk will remain material throughout 2022.
The Group’s activities include manual activities and the operation of machinery and vehicles, sometimes in confined spaces. These activities expose our colleagues to the risk of serious or fatal injury. The use of and disposal of chemicals and other substances risks harm to the environment. Our colleagues’ mental and physical wellbeing could be harmed as a result of continued remote working, workload, organisational restructuring or as a result of external factors.
The Group places significant emphasis on the wellbeing of our employees and this is reflected in the relatively high priority given to this risk in our assessment method. In the longer-term, this risk may be exacerbated by the physical risks presented by a changing climate e.g. extreme weather events.
MITIGATING ACTIONS• Ongoing implementation of a series
of 10 Group-wide risk mitigation. programmes.
• Common set of HSE KPIs. • Standardised technology platform
to provide a consistent view of HSE performance.
• Regular review of performance by Group Executive Team and Board.
These programmes are designed to cover our highest risk areas, including the management of hoists, traffic, chemicals and electricals, along with working at height. This year, additional focus has been placed on mental health and management of contractors.
All of these HSE programmes are applied to newly acquired operations, where performance is monitored as soon as practical post-completion.
PRINCIPAL RISKSOf the principal risks assessed, the following have the highest relative impact or likelihood scores and are assessed as the most significant ‘net’ risks, after mitigation has been applied.
[No leaf] DRE, VLS, M&A
[No leaf] DRE, VLS,
[Leaf] DRE, VLS, M&A
A) CYBER SECURITY INCIDENT
F) HEALTH, SAFETY, ENVIRONMENT
B) SUPPLY CHAIN DISRUPTION
RISK LEVEL WITH CURRENT MITIGATION
Impact: Major
Likelihood: Likely
Trend:
RISK LEVEL WITH CURRENT MITIGATION
Impact: Moderate
Likelihood: Almost certain
Trend:
RISK LEVEL WITH CURRENT MITIGATION
Impact: Major
Likelihood: Possible
Trend:
RISK MANAGEMENT CONTINUED
52 INCHCAPE ANNUAL REPORT AND ACCOUNTS 2021

A F
In response to a changing climate, our OEM partners are developing new ranges of electric vehicles (EVs). For most manufacturers, EVs are more costly to produce and offer lower margins compared to vehicles powered by internal-combustion engines (ICE). Our OEM partners are having to invest heavily in retooling to develop new models and platforms. In some cases, EVs may not be profitable at all. It may take several years for this situation to improve.
As EV market share grows, supported by government incentives, there is a risk that lower margins will be available to all participants in the value chain, including distributors and retailers, such as Inchcape.
MITIGATING ACTIONSThe Group’s refreshed strategy, Accelerate, is designed to address this risk in three ways:• Through a compelling offering to our
OEM partners known as Distribution Excellence by transforming the route to market via the development of a consistent, technologically-advanced, low-cost, low-carbon distribution and retail offering;
• Through Vehicle Lifecycle Services – enabling the Group to capture new sources of value throughout the vehicle and customer lifetime; and
• Through expanded M&A, enabling our growth into new, margin-accretive markets and with potentially new OEM partners.
The Group has individual distribution contracts, several of which have been in place for many years. The loss of such contracts would have a significant impact on revenue and profit, as well as future growth opportunities. The cancellation of a number of smaller contracts at the same time could have a similar impact. The underlying factors which could contribute to this risk may include:
• Unattractive value proposition for OEM partners;
• Failure to meet OEM standards;• Non-compliance with the terms
of distribution agreements;• Failure to deliver growth strategy;• New competitors;• Major operational incident, e.g.
cyber incident, fraud.
MITIGATING ACTIONSThe Group’s refreshed strategy, Accelerate, is designed to address this risk in three ways:• Through a compelling offering to our
OEM partners known as Distribution Excellence – transforming the route to market via the development of a consistent, technologically-advanced, low-cost, low-carbon distribution and retail offering;
• Through Vehicle Lifecycle Services – enabling the Group to capture new sources of value throughout the vehicle and customer lifetime (and potentially offsetting the impact of a loss of any one contract); and
• Through expanded M&A, diversifying our contract base across more markets and potentially more OEM partners.
[Leaf] DRE
[No leaf] DRE
G) MARGIN PRESSURE H) LOSS OF A DISTRIBUTION CONTRACT
RISK LEVEL WITH CURRENT MITIGATION
Impact: Major
Likelihood: Possible
Trend:
RISK LEVEL WITH CURRENT MITIGATION
Impact: Major
Likelihood: Rare
Trend:
INCHCAPE ANNUAL REPORT AND ACCOUNTS 2021 53
GO
VER
NA
NC
EFIN
AN
CIA
L STATEM
ENTS
STRA
TEGIC
REPO
RT
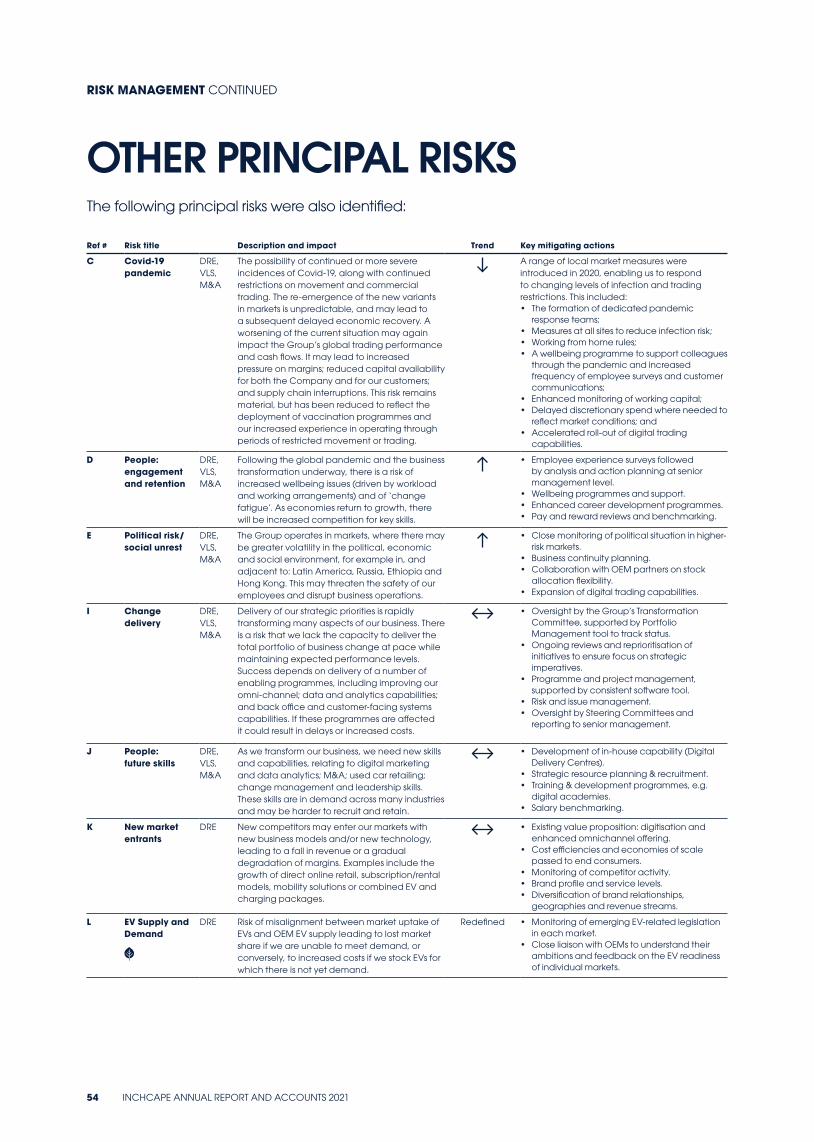
OTHER PRINCIPAL RISKS
Ref # Risk title Description and impact Trend Key mitigating actions
C Covid-19 pandemic
DRE, VLS, M&A
The possibility of continued or more severe incidences of Covid-19, along with continued restrictions on movement and commercial trading. The re-emergence of the new variants in markets is unpredictable, and may lead to a subsequent delayed economic recovery. A worsening of the current situation may again impact the Group’s global trading performance and cash flows. It may lead to increased pressure on margins; reduced capital availability for both the Company and for our customers; and supply chain interruptions. This risk remains material, but has been reduced to reflect the deployment of vaccination programmes and our increased experience in operating through periods of restricted movement or trading.
A range of local market measures were introduced in 2020, enabling us to respond to changing levels of infection and trading restrictions. This included:• The formation of dedicated pandemic
response teams;• Measures at all sites to reduce infection risk;• Working from home rules;• A wellbeing programme to support colleagues
through the pandemic and increased frequency of employee surveys and customer communications;
• Enhanced monitoring of working capital;• Delayed discretionary spend where needed to
reflect market conditions; and• Accelerated roll-out of digital trading
capabilities.
D People: engagement and retention
DRE, VLS, M&A
Following the global pandemic and the business transformation underway, there is a risk of increased wellbeing issues (driven by workload and working arrangements) and of ‘change fatigue’. As economies return to growth, there will be increased competition for key skills.
• Employee experience surveys followed by analysis and action planning at senior management level.
• Wellbeing programmes and support.• Enhanced career development programmes.• Pay and reward reviews and benchmarking.
E Political risk/ social unrest
DRE, VLS, M&A
The Group operates in markets, where there may be greater volatility in the political, economic and social environment, for example in, and adjacent to: Latin America, Russia, Ethiopia and Hong Kong. This may threaten the safety of our employees and disrupt business operations.
• Close monitoring of political situation in higher-risk markets.
• Business continuity planning.• Collaboration with OEM partners on stock
allocation flexibility.• Expansion of digital trading capabilities.
I Change delivery
DRE, VLS, M&A
Delivery of our strategic priorities is rapidly transforming many aspects of our business. There is a risk that we lack the capacity to deliver the total portfolio of business change at pace while maintaining expected performance levels. Success depends on delivery of a number of enabling programmes, including improving our omni-channel; data and analytics capabilities; and back office and customer-facing systems capabilities. If these programmes are affected it could result in delays or increased costs.
• Oversight by the Group’s Transformation Committee, supported by Portfolio Management tool to track status.
• Ongoing reviews and reprioritisation of initiatives to ensure focus on strategic imperatives.
• Programme and project management, supported by consistent software tool.
• Risk and issue management.• Oversight by Steering Committees and
reporting to senior management.
J People: future skills
DRE, VLS, M&A
As we transform our business, we need new skills and capabilities, relating to digital marketing and data analytics; M&A; used car retailing; change management and leadership skills. These skills are in demand across many industries and may be harder to recruit and retain.
• Development of in-house capability (Digital Delivery Centres).
• Strategic resource planning & recruitment.• Training & development programmes, e.g.
digital academies.• Salary benchmarking.
K New market entrants
DRE New competitors may enter our markets with new business models and/or new technology, leading to a fall in revenue or a gradual degradation of margins. Examples include the growth of direct online retail, subscription/rental models, mobility solutions or combined EV and charging packages.
• Existing value proposition: digitisation and enhanced omnichannel offering.
• Cost efficiencies and economies of scale passed to end consumers.
• Monitoring of competitor activity.• Brand profile and service levels.• Diversification of brand relationships,
geographies and revenue streams.
L EV Supply and Demand
DRE Risk of misalignment between market uptake of EVs and OEM EV supply leading to lost market share if we are unable to meet demand, or conversely, to increased costs if we stock EVs for which there is not yet demand.
Redefined • Monitoring of emerging EV-related legislation in each market.
• Close liaison with OEMs to understand their ambitions and feedback on the EV readiness of individual markets.
RISK MANAGEMENT CONTINUED
The following principal risks were also identified:
54 INCHCAPE ANNUAL REPORT AND ACCOUNTS 2021
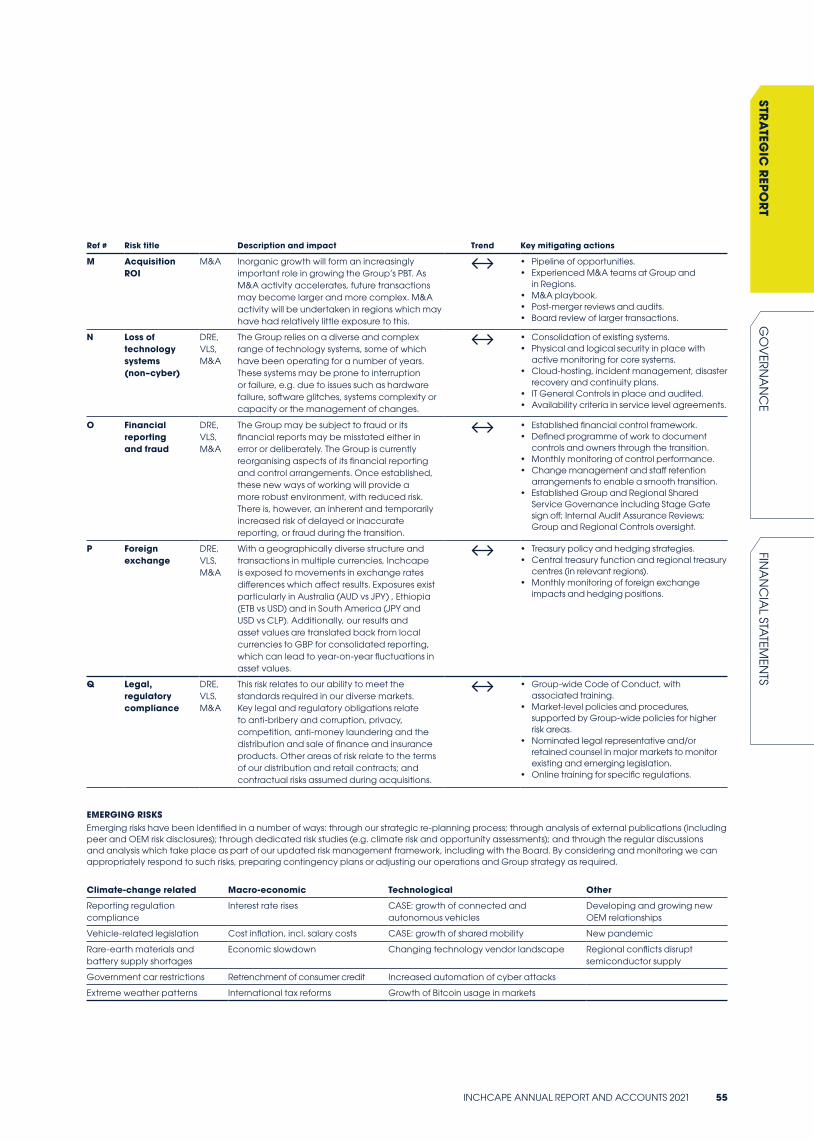
Ref # Risk title Description and impact Trend Key mitigating actions
M Acquisition ROI
M&A Inorganic growth will form an increasingly important role in growing the Group’s PBT. As M&A activity accelerates, future transactions may become larger and more complex. M&A activity will be undertaken in regions which may have had relatively little exposure to this.
• Pipeline of opportunities.• Experienced M&A teams at Group and
in Regions.• M&A playbook.• Post-merger reviews and audits.• Board review of larger transactions.
N Loss of technology systems (non–cyber)
DRE, VLS, M&A
The Group relies on a diverse and complex range of technology systems, some of which have been operating for a number of years. These systems may be prone to interruption or failure, e.g. due to issues such as hardware failure, software glitches, systems complexity or capacity or the management of changes.
• Consolidation of existing systems.• Physical and logical security in place with
active monitoring for core systems.• Cloud-hosting, incident management, disaster
recovery and continuity plans.• IT General Controls in place and audited.• Availability criteria in service level agreements.
O Financial reporting and fraud
DRE, VLS, M&A
The Group may be subject to fraud or its financial reports may be misstated either in error or deliberately. The Group is currently reorganising aspects of its financial reporting and control arrangements. Once established, these new ways of working will provide a more robust environment, with reduced risk. There is, however, an inherent and temporarily increased risk of delayed or inaccurate reporting, or fraud during the transition.
• Established financial control framework.• Defined programme of work to document
controls and owners through the transition.• Monthly monitoring of control performance.• Change management and staff retention
arrangements to enable a smooth transition.• Established Group and Regional Shared
Service Governance including Stage Gate sign off; Internal Audit Assurance Reviews; Group and Regional Controls oversight.
P Foreign exchange
DRE, VLS, M&A
With a geographically diverse structure and transactions in multiple currencies, Inchcape is exposed to movements in exchange rates differences which affect results. Exposures exist particularly in Australia (AUD vs JPY) , Ethiopia (ETB vs USD) and in South America (JPY and USD vs CLP). Additionally, our results and asset values are translated back from local currencies to GBP for consolidated reporting, which can lead to year-on-year fluctuations in asset values.
• Treasury policy and hedging strategies.• Central treasury function and regional treasury
centres (in relevant regions).• Monthly monitoring of foreign exchange
impacts and hedging positions.
Q Legal, regulatory compliance
DRE, VLS, M&A
This risk relates to our ability to meet the standards required in our diverse markets. Key legal and regulatory obligations relate to anti-bribery and corruption, privacy, competition, anti-money laundering and the distribution and sale of finance and insurance products. Other areas of risk relate to the terms of our distribution and retail contracts; and contractual risks assumed during acquisitions.
• Group-wide Code of Conduct, with associated training.
• Market-level policies and procedures, supported by Group-wide policies for higher risk areas.
• Nominated legal representative and/or retained counsel in major markets to monitor existing and emerging legislation.
• Online training for specific regulations.
EMERGING RISKSEmerging risks have been identified in a number of ways: through our strategic re-planning process; through analysis of external publications (including peer and OEM risk disclosures); through dedicated risk studies (e.g. climate risk and opportunity assessments); and through the regular discussions and analysis which take place as part of our updated risk management framework, including with the Board. By considering and monitoring we can appropriately respond to such risks, preparing contingency plans or adjusting our operations and Group strategy as required.
Climate-change related Macro-economic Technological Other
Reporting regulation compliance
Interest rate rises CASE: growth of connected and autonomous vehicles
Developing and growing new OEM relationships
Vehicle-related legislation Cost inflation, incl. salary costs CASE: growth of shared mobility New pandemic
Rare-earth materials and battery supply shortages
Economic slowdown Changing technology vendor landscape Regional conflicts disrupt semiconductor supply
Government car restrictions Retrenchment of consumer credit Increased automation of cyber attacks
Extreme weather patterns International tax reforms Growth of Bitcoin usage in markets
INCHCAPE ANNUAL REPORT AND ACCOUNTS 2021 55
GO
VER
NA
NC
EFIN
AN
CIA
L STATEM
ENTS
STRA
TEGIC
REPO
RT
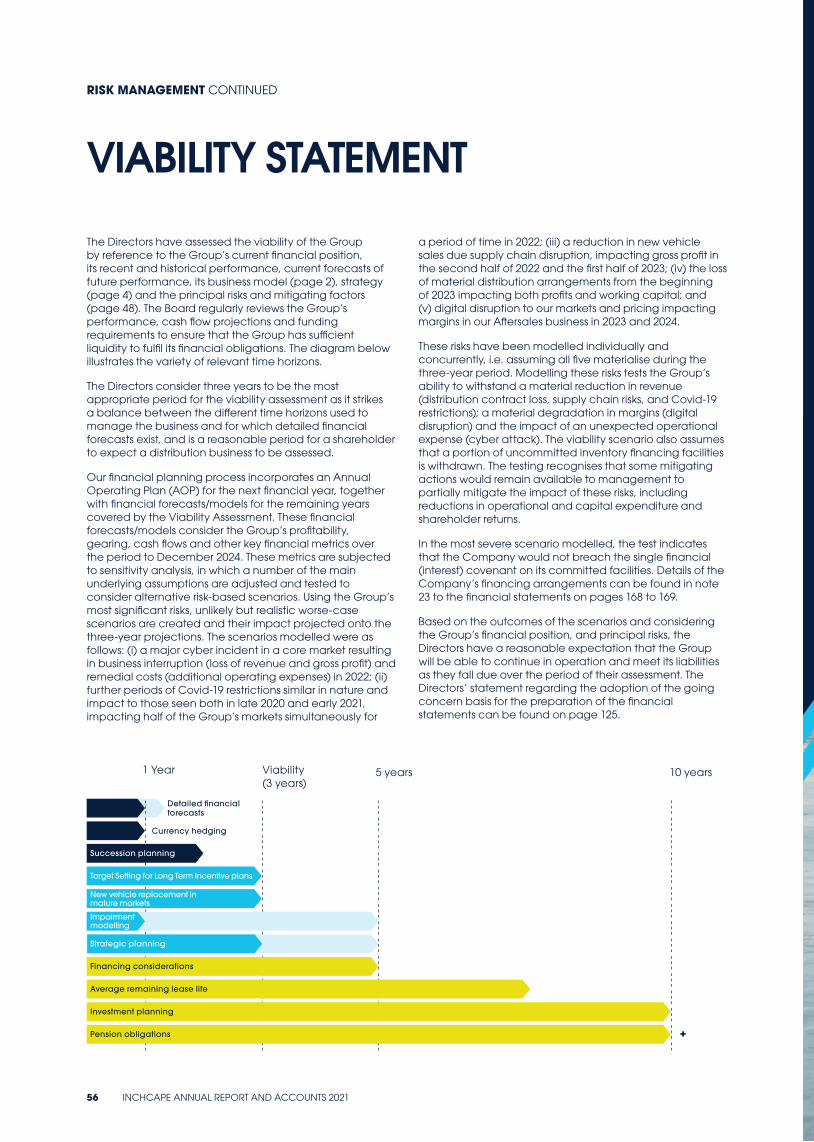
VIABILITY STATEMENT
The Directors have assessed the viability of the Group by reference to the Group’s current financial position, its recent and historical performance, current forecasts of future performance, its business model (page 2), strategy (page 4) and the principal risks and mitigating factors (page 48). The Board regularly reviews the Group’s performance, cash flow projections and funding requirements to ensure that the Group has sufficient liquidity to fulfil its financial obligations. The diagram below illustrates the variety of relevant time horizons.
The Directors consider three years to be the most appropriate period for the viability assessment as it strikes a balance between the different time horizons used to manage the business and for which detailed financial forecasts exist, and is a reasonable period for a shareholder to expect a distribution business to be assessed.
Our financial planning process incorporates an Annual Operating Plan (AOP) for the next financial year, together with financial forecasts/models for the remaining years covered by the Viability Assessment. These financial forecasts/models consider the Group’s profitability, gearing, cash flows and other key financial metrics over the period to December 2024. These metrics are subjected to sensitivity analysis, in which a number of the main underlying assumptions are adjusted and tested to consider alternative risk-based scenarios. Using the Group’s most significant risks, unlikely but realistic worse-case scenarios are created and their impact projected onto the three-year projections. The scenarios modelled were as follows: (i) a major cyber incident in a core market resulting in business interruption (loss of revenue and gross profit) and remedial costs (additional operating expenses) in 2022; (ii) further periods of Covid-19 restrictions similar in nature and impact to those seen both in late 2020 and early 2021, impacting half of the Group’s markets simultaneously for
a period of time in 2022; (iii) a reduction in new vehicle sales due supply chain disruption, impacting gross profit in the second half of 2022 and the first half of 2023; (iv) the loss of material distribution arrangements from the beginning of 2023 impacting both profits and working capital; and (v) digital disruption to our markets and pricing impacting margins in our Aftersales business in 2023 and 2024.
These risks have been modelled individually and concurrently, i.e. assuming all five materialise during the three-year period. Modelling these risks tests the Group’s ability to withstand a material reduction in revenue (distribution contract loss, supply chain risks, and Covid-19 restrictions); a material degradation in margins (digital disruption) and the impact of an unexpected operational expense (cyber attack). The viability scenario also assumes that a portion of uncommitted inventory financing facilities is withdrawn. The testing recognises that some mitigating actions would remain available to management to partially mitigate the impact of these risks, including reductions in operational and capital expenditure and shareholder returns.
In the most severe scenario modelled, the test indicates that the Company would not breach the single financial (interest) covenant on its committed facilities. Details of the Company’s financing arrangements can be found in note 23 to the financial statements on pages 168 to 169.
Based on the outcomes of the scenarios and considering the Group’s financial position, and principal risks, the Directors have a reasonable expectation that the Group will be able to continue in operation and meet its liabilities as they fall due over the period of their assessment. The Directors’ statement regarding the adoption of the going concern basis for the preparation of the financial statements can be found on page 125.
1 Year
Currency hedging
Viability(3 years)
5 years 10 years
Succession planning
Target Setting for Long Term Incentive plans
New vehicle replacement in mature markets
Impairment modelling
Strategic planning
Financing considerations
Average remaining lease life
Investment planning
Pension obligations +
Detailed financial forecasts
RISK MANAGEMENT CONTINUED
56 INCHCAPE ANNUAL REPORT AND ACCOUNTS 2021
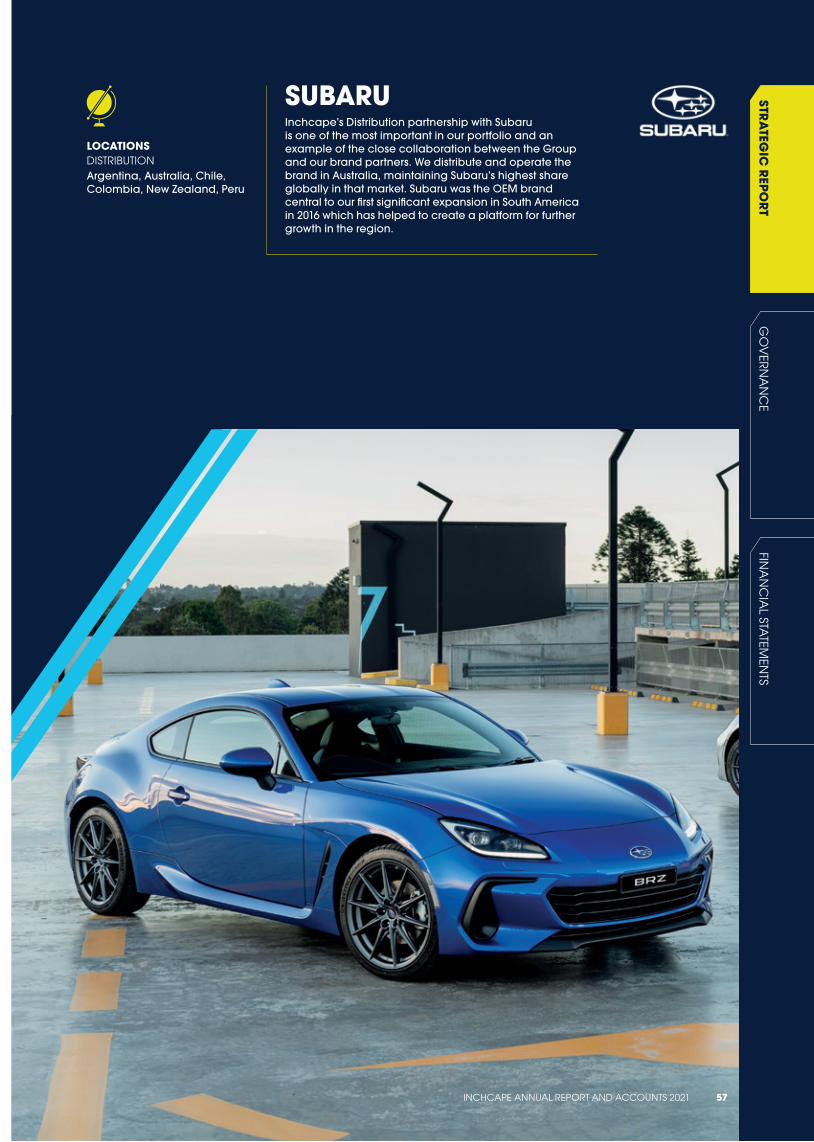
FINA
NC
IAL STA
TEMEN
TSG
OV
ERN
AN
CE
SUBARUInchcape’s Distribution partnership with Subaru is one of the most important in our portfolio and an example of the close collaboration between the Group and our brand partners. We distribute and operate the brand in Australia, maintaining Subaru’s highest share globally in that market. Subaru was the OEM brand central to our first significant expansion in South America in 2016 which has helped to create a platform for further growth in the region.
LOCATIONS DISTRIBUTIONArgentina, Australia, Chile, Colombia, New Zealand, Peru
STRA
TEGIC
REPO
RT
INCHCAPE ANNUAL REPORT AND ACCOUNTS 2021 57
STRA
TEGIC
REPO
RT

VOLKSWAGEN GROUPInchcape has a retail-only partnership with VW Group and represents the core VW brands as well as the performance marque Porsche. Our VW Group relationship extends to over 30 years and we are present today as a Retail operator in the UK and Russia.
LOCATIONS RETAILUK, Russia
58 INCHCAPE ANNUAL REPORT AND ACCOUNTS 2021
GOVERNANCE60 Chairman’s Statement70 Board of Directors72 Corporate Governance Report84 Directors’ Report on Remuneration104 Directors’ Report
INCHCAPE ANNUAL REPORT AND ACCOUNTS 2021 59
FINA
NC
IAL STA
TEMEN
TSSTR
ATEG
IC R
EPORT
GO
VER
NA
NC
E
CORPORATE GOVERNANCE
DEAR SHAREHOLDERS AND STAKEHOLDERSI am pleased to present the Corporate Governance Report for the year ended 31 December 2021. The next few sections explain how the Board and its Committees have discharged their duties throughout the year and I hope you find it informative.
LOOK BACK OVER 2021, ACCELERATE STRATEGY, RESPONSIBLE BUSINESSAs the automotive industry continues to undergo a period of immense change, the Board focused on the refreshed Accelerate strategic plan which was rolled out across the Group in 2021. The Board spent time agreeing the activities required to achieve our strategic ambition and defining the financial benefits we anticipate Accelerate will deliver. Further information on the Board’s decisions can be found on page 72 and details of the Accelerate strategy are given on pages 4 and 5.
Also rolled out in 2021, was the Driving What Matters plan (Plan) which was developed alongside the Accelerate strategy and underpins our purpose. The Plan is built on four strategic pillars: People, Places, Planet and Practices. The Plan has a global workstream for each of the pillars whose remit is to identify key priority actions in both the short, medium and longer term. The CSR Committee has updated its terms of reference and will have oversight of performance against objectives, reporting to the Board on progress throughout the year.
I am excited by both the Accelerate strategy and the Plan and the enthusiasm by which they have both been adopted by our colleagues. It is by delivering this holistic approach to our ambitions that we can achieve our purpose and deliver long-term value for stakeholders.
CHAIRMAN’S STATEMENT
BOARD CHANGESNayantara Bali joined the Board as a Non-Executive Director in May 2021. Nayantara is currently director and co-owner of ANV Consulting Pte, a boutique management consultancy and has held several senior global positions during her career at Procter & Gamble giving her extensive international skills and knowledge. Nayantara is based in Singapore. As announced in January 2022, I am also delighted that Sarah Kuijlaars has joined the Board as a Non-Executive Director. Sarah is currently Chief Financial Officer and Executive Director of De Beers plc and was previously a Non-Executive Director at Aggreko plc.
I am sure both Nayantara and Sarah will be valuable additions to the Board during this period of change for the industry.
Till Vestring prolonged his tenure to assist with the recruitment process and induction on Nayantara which we are grateful. However, he intends to step down at the 2022 AGM and I would like to thank him for his excellent contribution to the Board and to the Company.
TASK-FORCE ON CLIMATE RELATED FINANCIAL DISCLOSURES (TCFD)TCFD reporting became mandatory for UK listed companies in 2021 and the Board has spent time assessing how climate change will impact the business over the coming years. This is of increasing focus, and of upmost importance, with urgent action needed by governments, businesses and individuals alike. Various aspects of the impact of climate change have been a topic of conversation by the Board for many years as we have discussed the move to alternative powertrains and what this will mean for our OEM brand partners, our customers, our employees and of course our business model over the longer term. However, the work carried out during the year to enable us to comply with the recommendations of TCFD have helped focused our thoughts on our business model vulnerabilities, and resilience, and how these can be managed effectively in the long-term. Climate related issues will be considered by the Board on an ongoing basis as the rapidly evolving subject progresses over time. Further details are given on pages 40 to 44.
LOOKING FORWARDAt the beginning of 2022, continuing supply chain disruption and the impact of new strains of Covid-19 may impact performance, however, the Board remains confident that we will be able to deliver success over the longer term. The Accelerate strategy, and the Plan, which are now fully embedded within the Group underpin a strong sense of purpose to bringing mobility to the world’s communities – for today, for tomorrow and for the better.
I would like to take this opportunity to thank all our Inchcape colleagues for their hard work during the year. Their strenuous effort and resilience have contributed to our great performance against the backdrop of continued uncertainty.
I thank you for your support in 2021 and look forward to the coming year.
NIGEL STEINCHAIRMAN
60 INCHCAPE ANNUAL REPORT AND ACCOUNTS 2021
COMPLIANCE WITH THE UK CORPORATE GOVERNANCE CODEThe 2021 Annual Report and Accounts is prepared with reference to the 2018 UK Corporate Governance Code (Code) which is published by the Financial Reporting Council (FRC) and available at www.frc.org.uk. We have complied with the Code throughout the year ended 31 December 2021. Under Code provision 10, the criteria for director independence is set out. The reasons why the Board is satisfied that Till Vestring remains independent, despite having served on the Board for 10 years, are outlined on pages 75 and 76. Our compliance statement, along with the Corporate Governance Report on pages 72 to 108, describes how we apply the principles of the Code.
BOARD LEADERSHIP AND COMPANY PURPOSE
BOARD’S ROLE The Board is collectively responsible for defining, approving, and monitoring the Group’s strategy to ensure it delivers long-term sustainable success.
The Directors’ judgement and objectivity enable the Board to operate effectively within a structured governance framework to:
• Assist in the delivery of strategy;• Promote long-term sustainability;• Generate value of shareholders; and• Contribute to wider society.
If a Director has a concern about the running of the Company which cannot be resolved, it would be recorded in the Board minutes. No such concerns arose during 2021.
FURTHER READINGSTRATEGY – pages 4 to 5
DIRECTOR BIOGRAPHIES – page 70.
REMUNERATION STRUCTURE THAT SUPPORTS STRATEGIC AIMS – pages 84 to 103
MATTERS RESERVED FOR THE BOARD – www.inchcape.com
PURPOSE, VALUES AND CULTURE
The Group’s purpose is underpinned by the Accelerate strategy and Responsible Business plan. A global communication programme was rolled out during 2021 to ensure that all employees understand the behaviours expected of them.
In order to operate effectively, it is important that the appropriate culture is embedded throughout the business and this is approached in several ways:
• Code of Conduct;• Whistleblowing hotline;• Remuneration policies and practices;• Setting appropriate financial targets and monitoring
performance against targets throughout the year;• Employee engagement survey; and• Delegated authorities.
Alex Jensen, the designated Non-Executive Director responsible for workforce engagement, held a forum with a group of employees from various regions and roles to enable two-way dialogue on understanding the culture of the organisation.
We are committed to adapting our operations to help tackle climate change and have launched sustainability targets for 2030.
FURTHER READINGSTRATEGY – pages 4 to 5
RESPONSIBLE BUSINESS PLAN – pages 33 to 38
CULTURE FORUM AND EMPLOYEE ENGAGEMENT– pages 74 and 83
RECRUITMENT AND INDUCTION PROCESS – pages 75 to 76
INCHCAPE ANNUAL REPORT AND ACCOUNTS 2021 61
STRA
TEGIC
REPO
RTFIN
AN
CIA
L STATEM
ENTS
GO
VER
NA
NC
E
CORPORATE GOVERNANCE CONTINUED
BOARD LEADERSHIP AND COMPANY PURPOSE CONTINUED
RESOURCES AND CONTROLS
The Board is responsible for ensuring that the appropriate people are employed to deliver the strategic objectives and that they have the resources available in order to do so.
The Board also ensures that the necessary controls, processes and procedures are in place to drive a strong ethical culture to facilitate the delivery of the strategy.
FURTHER READING STRATEGIC REPORT – pages 2 to 58
PRINCIPAL RISKS – pages 48 to 56
INTERNAL CONTROLS – pages 79 to 80
ENGAGEMENT Inchcape has a broad group of clearly defined stakeholders and the Board engage with each of them on a regular basis through a variety of channels. This engagement allows the Board to understand what issues are important to stakeholders.
FURTHER READING STAKEHOLDER ENGAGEMENT – pages 16 to 18
SECTION 172 STATEMENT – page 18
WORKFORCE POLICIES
A new Code of Conduct was rolled out in 2021 which sets out the behaviours expected of our employees and ensures our policies remain aligned to culture and support long-term success. Other polices include health and safety, anti-bribery and corruption, inclusion and diversity framework, and whistleblowing.
Speak Up!, the Group’s externally hosted whistleblowing line, is a compliance and ethics reporting solution which allows both hotline and web reporting capabilities in multiple languages, integrated with case management software to support efficient and effective investigation, remediation and reporting.
FURTHER READING RESPONSIBLE BUSINESS REPORT – pages 33 to 38
NON-FINANCIAL INFORMATION STATEMENT– pages 46 to 47
REMUNERATION COMMITTEE – pages 84 to 103
62 INCHCAPE ANNUAL REPORT AND ACCOUNTS 2021
DIVISION OF RESPONSIBILITIES
THE ROLE OF THE CHAIRMAN
The Chairman is responsible for the leadership of the Board and is separate from the role of Group Chief Executive Officer. He sets the strategic agendas which are designed to encourage constructive debate and promote a culture of openness and inclusion.
He was considered independent on appointment and continues to be.
The Chairman is also mindful of the need for the Directors to receive information which is accurate, timely and clear, and is supported by the Group Company Secretary.
FURTHER READING BOARD EVALUATION OUTCOMES – page 73
COMPOSITION OF THE BOARD
As at 31 December 2021, the Board was comprised of two Executive Directors, six Non-Executive Directors and the Chairman. All Non-Executive Directors are considered independent. None of the Directors or their connected persons have, or have had, a material relationship with the Company or any of its subsidiaries. Non-Executive Directors receive a fee only and do not participate in shares award schemes or the pension scheme.
The Executive Directors are responsible for developing the Group’s strategy, leading the Group Executive Team, running the day-to-day operations, managing risk and implementing controls, engaging with stakeholders, and reporting to the Board on progress against objectives.
The Senior Independent Director acts as a sounding board for the Chairman, to serve as an intermediary to other Board members and is available to shareholders should they wish. The Senior Independent Director leads the annual Non-Executive DIrectors only meeting during which they appraise the performance of the Chairman.
FURTHER READING DIRECTOR BIOGRAPHIES – pages 70 to 71
COMMITTEE TERMS OF REFERENCE – www.inchcape.com
INCHCAPE ANNUAL REPORT AND ACCOUNTS 2021 63
STRA
TEGIC
REPO
RTFIN
AN
CIA
L STATEM
ENTS
GO
VER
NA
NC
E
DIVISION OF RESPONSIBILITIES CONTINUED
ROLE OF THE NON-EXECUTIVE DIRECTORS
The Non-Executive Directors have a wide range of skills and experience which enable them to provide independent and strategic advice, and to constructively challenge management. An explanation of the contribution of each Director is given in the 2022 Notice of Annual General Meeting, which is available on our website.
The time expected is set out in the letter of appointment, which is available for inspection at the Company’s registered office and at the Annual General Meeting. The Non-Executive Directors are required to allocate sufficient time to the Company to discharge their responsibilities and Board dates are agreed two years in advance to ensure that Directors are able to plan accordingly and for other commitments to be taken into account. Non-Executive Directors are informed of the time commitment expected from them upon appointment and this is reviewed annually to ensure that the time expected is still relevant in light of the Company’s strategic agenda. The Board’s policy on multi-board appointments requires Directors to obtain prior approval from the Nomination Committee and the Board before taking on another directorship where the additional demand will be assessed to ensure that all Directors are able to allocate sufficient time to the role.
FURTHER READING BOARD SKILLS MATRIX AND MEETING ATTENDANCE TABLE– page 69
DIRECTOR’S BIOGRAPHIES – pages 70 to 71
MATTERS RESERVED FOR THE BOARD – www.inchcape.com
COMPANY SECRETARY
The Group Company Secretary supports the Board by providing advice on the governance framework and ensuring that the appropriate policies and procedures are in place to allow it to function effectively.
FURTHER READING MATTERS RESERVED FOR THE BOARD – www.inchcape.com
CORPORATE GOVERNANCE CONTINUED
64 INCHCAPE ANNUAL REPORT AND ACCOUNTS 2021
COMPOSITION, SUCCESSION AND EVALUATION
APPOINTMENTS TO THE BOARD AND SUCCESSION PLANNING
Ensuring there is the right mix of individuals on the Board to support, and challenge, management, to avoid group think and to make the right decisions to facilitate the long-term success of the Group is a key element of the succession planning process.
The Nominations Committee engages external search consultancies when searching for Board position candidates. Appointments to the Board are agreed by the Nomination Committee to be put to the Board for approval.
FURTHER READING NOMINATION COMMITTEE – pages 75 to 76
BOARD DIVERSITY POLICY – page 76
SKILLS, EXPERIENCE AND KNOWLEDGE OF THE BOARD
The Nomination Committee regularly reviews the tenure of each Board member and the skills matrix ensuring the Board’s succession plan remains aligned with the natural rotation of Directors off the Board and the strategic objectives of the business. When appointing Directors to the Board, the Nomination Committee considers the longer-term strategic objectives and the skills and experience needed to deliver these successfully.
The Committee considers breadth of perspective on the Board which can only be achieved by appointing directors from a diverse range of backgrounds, with the range, experience and skills to achieve the strategic aims.
The Board consists of several Board members from outside the traditional UK plc environment, which adds to diversity of thought. The Board believes it has a good balance of new and longer-serving Directors.
FURTHER READING BOARD TENURE – page 68
BOARD SKILLS MATRIX – page 69
NOMINATION COMMITTEE – pages 75 to 76
BOARD EVALUATION The Directors provide feedback on how the Board operates, its culture and effectiveness during the evaluation process.
During 2021, the Board considered the areas of focus following the external evaluation in 2020 and carried out an internal evaluation consisting of an online questionnaire covering:
• Board effectiveness;• Knowledge and contribution;• Succession planning; and• Committee performance.
The specific reasons why the Board considers that each Director’s contribution is, and continues to be, important to the Company’s long-term sustainable success may be found in the Notice of Annual General Meeting. The Board recommends that shareholders vote in favour of the re-election or election of all the Directors at the 2022 Annual General Meeting.
FURTHER READING SECTION 172 STATEMENT – page 18
NOMINATION COMMITTEE REPORT – pages 75 to 76
INCHCAPE ANNUAL REPORT AND ACCOUNTS 2021 65
STRA
TEGIC
REPO
RTFIN
AN
CIA
L STATEM
ENTS
GO
VER
NA
NC
E
AUDIT, RISK AND INTERNAL CONTROL
INTERNAL AND EXTERNAL AUDIT
The Board delegates responsibility for ensuring the independence and effectiveness of internal and external audit functions and the integrity of the financial statements. The Chair of the Audit Committee reports to the Board following each meeting.
The Committee regularly meets with the auditor without the presence of management to discuss any areas of concern they might have. John Langston, Chair of the Audit Committee, also meets with the Chief Financial Officer and Head of Internal Audit in one-to-one meetings which enable him to fully understand the key issues ahead of Committee meetings.
FURTHER READING AUDIT COMMITTEE REPORT – pages 77 to 81
FAIR, BALANCED AND UNDERSTANDABLE
The Board reviews the Annual Report and Accounts as a whole, the interim financial statements and the trading updates prior to publication to ensure that they provide a fair, balanced and understandable assessment of the Group’s position and prospects.
The Board considers the weight given to published information to ensure that it is balanced and there are no omissions. The Board also ensures that the narrative reporting is consistent with the financial statements.
FURTHER READING AUDIT COMMITTEE REPORT – pages 77 to 81
RISK MANAGEMENT AND INTERNAL CONTROLS
The Group has a system of risk management and internal control which is designed around an established three lines of defence model. This model engages management teams, corporate functions and independent assurance to manage risk, which is overseen by the Board and its Committees.
The Board approved the Risk Policy in January 2021, reviewed the Risk Management Framework in July and November and agreed its risk appetite in respect of the principal risks at the half year. At the November meeting, the Board also carried out a robust assessment of the emerging and principal risks. See pages 48 to 55 for the Principal Risks.
The risk management and internal control processes are designed to manage rather than eliminate the risk of failure to achieve business strategic objectives. In establishing and reviewing the system of internal control, the Directors have regard for the nature and extent of relevant risks, the likelihood of loss being incurred and the costs of control. The system can only provide reasonable but not absolute assurance against material misstatement or loss and cannot eliminate business risk.
The Audit Committee carry out a review of the effectiveness of internal control, on behalf of the Board, with any significant control failings or weaknesses reported to the Board, with a detailed review of the findings and mitigation plans being put in place. The Board monitor progress against plans until it is satisfied that the matter has been resolved appropriately.
The Directors are satisfied that the Group’s risk management and internal control systems accord with the FRC’s guidance on Risk Management, Internal Control and Related Financial and Business Reporting.
FURTHER READING RISK MANAGEMENT REPORT – pages 48 to 56
AUDIT COMMITTEE REPORT – pages 77 to 81
CORPORATE GOVERNANCE CONTINUED
66 INCHCAPE ANNUAL REPORT AND ACCOUNTS 2021
REMUNERATION
POLICIES AND PRACTICES
The Board has delegated responsibility for oversight of remuneration policies and practices to the Remuneration Committee. The Chair of the Remuneration Committee reports to the Board following each meeting.
When setting Executive remuneration, the Remuneration Committee takes into account purpose, strategy, and responsible business and is designed to promote the long-term success of the Company. The Remuneration Committee oversee Executive Directors receiving a pension contribution of 10% of salary, which is aligned to the UK employee average.
FURTHER READING DIRECTORS’ REPORT ON REMUNERATION – pages 84 to 103
PROCEDURE FOR DEVELOPING REMUNERATION
There is a clear procedure in place to develop the remuneration policy. The Remuneration Committee has delegated responsibility for setting the Executive Directors’ remuneration under the shareholder-approved Directors’ remuneration policy, as well as the Chairman of the Board and the wider workforce. No Director determines their own remuneration. The Committee is supported by external advisors to provide guidance on best practice and consults with shareholders prior to a policy renewal to ensure their interests are supported. No Executive Director is involved in deciding the remuneration outcome.
FURTHER READING DIRECTORS’ REPORT ON REMUNERATION – pages 84 to 103
EXERCISING INDEPENDENT JUDGEMENT
The Remuneration Committee is made up of only independent Non-Executive Directors. When agreeing Executive remuneration outcomes, the Committee uses its independent judgement to reach its decisions taking into account financial performance, personal objectives, wider business context and the longer-term impacts.
FURTHER READING DIRECTORS’ REPORT ON REMUNERATION – pages 84 to 103
INCHCAPE ANNUAL REPORT AND ACCOUNTS 2021 67
STRA
TEGIC
REPO
RTFIN
AN
CIA
L STATEM
ENTS
GO
VER
NA
NC
E
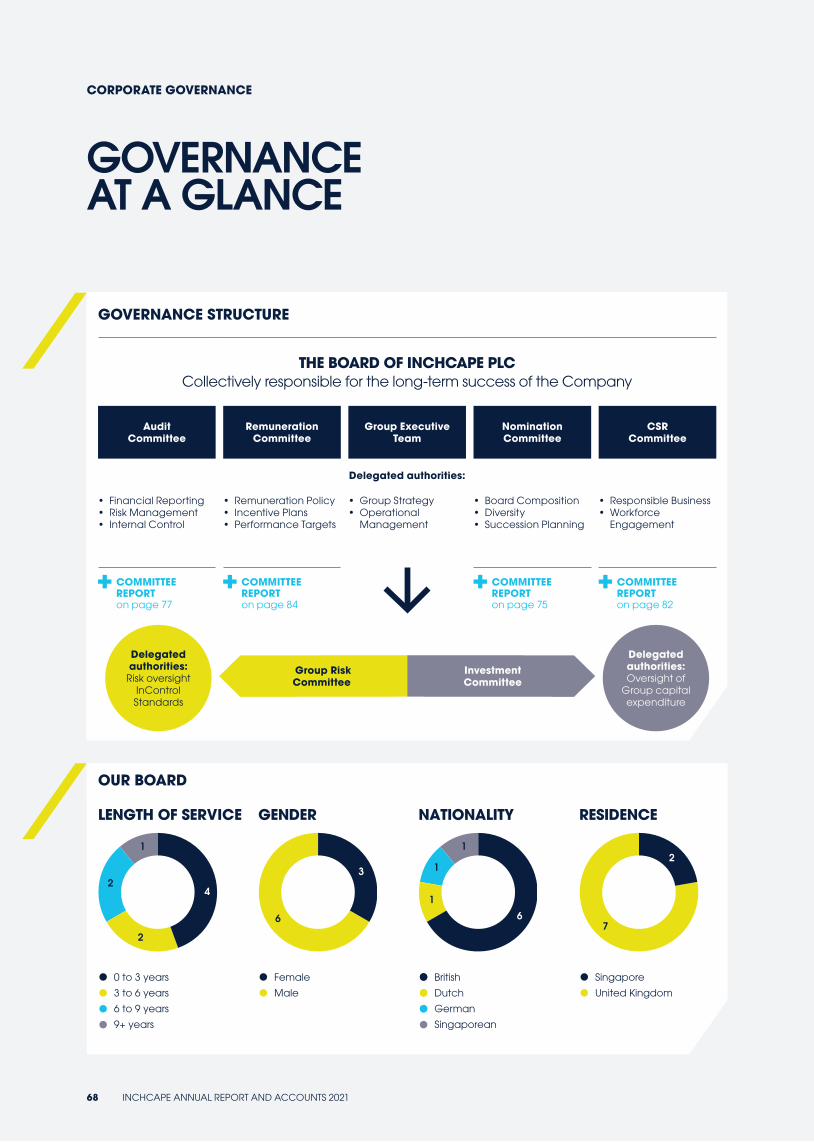
CORPORATE GOVERNANCE
Group Risk Committee
Investment Committee
GOVERNANCE STRUCTURE
THE BOARD OF INCHCAPE PLC Collectively responsible for the long-term success of the Company
Audit Committee
Remuneration Committee
Group Executive Team
Nomination Committee
CSR Committee
Delegated authorities:
• Financial Reporting• Risk Management• Internal Control
• Remuneration Policy• Incentive Plans• Performance Targets
• Group Strategy• Operational
Management
• Board Composition• Diversity• Succession Planning
• Responsible Business• Workforce
Engagement
COMMITTEE REPORT on page 77
COMMITTEE REPORT on page 84
COMMITTEE REPORT on page 75
COMMITTEE REPORT on page 82
Delegated authorities:
Risk oversight InControl Standards
Delegated authorities: Oversight of
Group capital expenditure
OUR BOARD
LENGTH OF SERVICE
0 to 3 years
3 to 6 years
6 to 9 years
9+ years
4
2
2
1
GENDER
Female
Male
3
6
NATIONALITY
British
Dutch
German
Singaporean
6
1
1
1
RESIDENCE
Singapore
United Kingdom
2
7
GOVERNANCE AT A GLANCE
68 INCHCAPE ANNUAL REPORT AND ACCOUNTS 2021

BOARD ATTENDANCE
The table below shows the Board and Committee meetings held during the year
BoardAudit Committee
Remuneration Committee
Nomination Committee
CSR Committee
Scheduled/ Attended
Scheduled/ Attended
Scheduled/ Attended
Scheduled/ Attended
Scheduled/ Attended
Nayantara Bali* 4/4 1/1 2/2
Jerry Buhlmann 7/7 4/4 3/3 2/2 4/4
Gijsbert de Zoeten 7/7
Rachel Empey** 2/2 1/1 1/1
Alex Jensen 7/7 2/2 4/4
Jane Kingston 7/7 3/3 3/3 2/2
John Langston 7/7 4/4 2/2
Nigel Stein 7/7 3/3 2/2 4/4
Duncan Tait 7/7 4/4
Till Vestring 7/7 3/3 2/2 4/4
* Nayantara Bali joined the Group on 27 May 2021.** Rachel Empey left the Group on 30 April 2021.
COMMITTEE HIGHLIGHTS
NOMINATION COMMITTEE AUDIT COMMITTEE
• Review of skills, experience and diversity on the Board.
• Appointment of Nayantara Bali and Sarah Kuijlaars as Non-Executive Directors.
• Monitored Board members’ independence and other commitments to avoid overboarding.
• Reviewed the Group’s enterprise risk management system.
• Reviewed the Group’s climate change risks TCFD disclosure plan.
• Bi-annual review of the global cyber security plan and monitoring progress against improvement plan.
• Review of the Global Business Services transformation programme.
CSR COMMITTEE REMUNERATION COMMITTEE
• Oversight of the Group’s Responsible Business plan.
• Approved the Driving What Matters plan.
• Reviewed and approved the Group’s climate change risks and opportunities.
• Agreed the scope 1 and scope 2 science-based emissions reduction targets.
• CSR Committee Chair attended employee townhalls and chaired employee forum on culture.
• Set executive and senior management bonus targets and approved the grant of long-term incentives for 2021.
• Approved salary increases for Executive Directors, Group Executive Team and wider workforce employees.
• Approved remuneration package for newly appointed Group Executive Team members.
• Remuneration Committee Chair hosted an employee forum on reward.
BOARD SKILLS MATRIXThe Board recognises the importance of the right mix of skills, experience and diversity to deliver the Group’s strategic objectives and contribute towards long-term success.
FINANCE 3
3
4
5
4
DIGITAL/TECHNOLOGY
AUTOMOTIVE/RETAIL
EMERGING MARKETS
REMUNERATION
DEVELOPMENT OF BOARD SKILLS PROFILEThe review of skills and experience on the Board provides input into the Board’s succession planning process. As the digital transformation of the automotive industry continues, the Board has focused on increasing the digital skillset on the Board.
INCHCAPE ANNUAL REPORT AND ACCOUNTS 2021 69
STRA
TEGIC
REPO
RTFIN
AN
CIA
L STATEM
ENTS
GO
VER
NA
NC
E
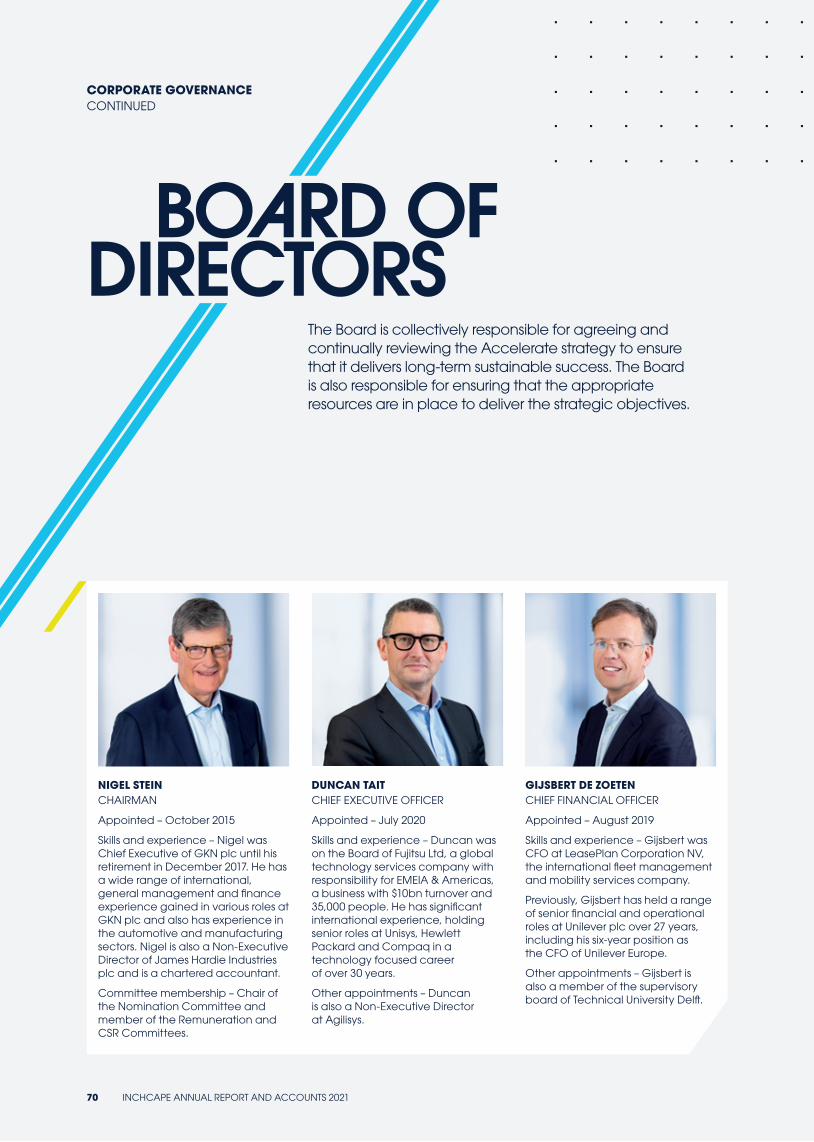
NIGEL STEINCHAIRMAN
Appointed – October 2015
Skills and experience – Nigel was Chief Executive of GKN plc until his retirement in December 2017. He has a wide range of international, general management and finance experience gained in various roles at GKN plc and also has experience in the automotive and manufacturing sectors. Nigel is also a Non-Executive Director of James Hardie Industries plc and is a chartered accountant.
Committee membership – Chair of the Nomination Committee and member of the Remuneration and CSR Committees.
DUNCAN TAITCHIEF EXECUTIVE OFFICER
Appointed – July 2020
Skills and experience – Duncan was on the Board of Fujitsu Ltd, a global technology services company with responsibility for EMEIA & Americas, a business with $10bn turnover and 35,000 people. He has significant international experience, holding senior roles at Unisys, Hewlett Packard and Compaq in a technology focused career of over 30 years.
Other appointments – Duncan is also a Non-Executive Director at Agilisys.
GIJSBERT DE ZOETENCHIEF FINANCIAL OFFICER
Appointed – August 2019
Skills and experience – Gijsbert was CFO at LeasePlan Corporation NV, the international fleet management and mobility services company.
Previously, Gijsbert has held a range of senior financial and operational roles at Unilever plc over 27 years, including his six-year position as the CFO of Unilever Europe.
Other appointments – Gijsbert is also a member of the supervisory board of Technical University Delft.
The Board is collectively responsible for agreeing and continually reviewing the Accelerate strategy to ensure that it delivers long-term sustainable success. The Board is also responsible for ensuring that the appropriate resources are in place to deliver the strategic objectives.
BOARD OFDIRECTORS
CORPORATE GOVERNANCE CONTINUED
70 INCHCAPE ANNUAL REPORT AND ACCOUNTS 2021
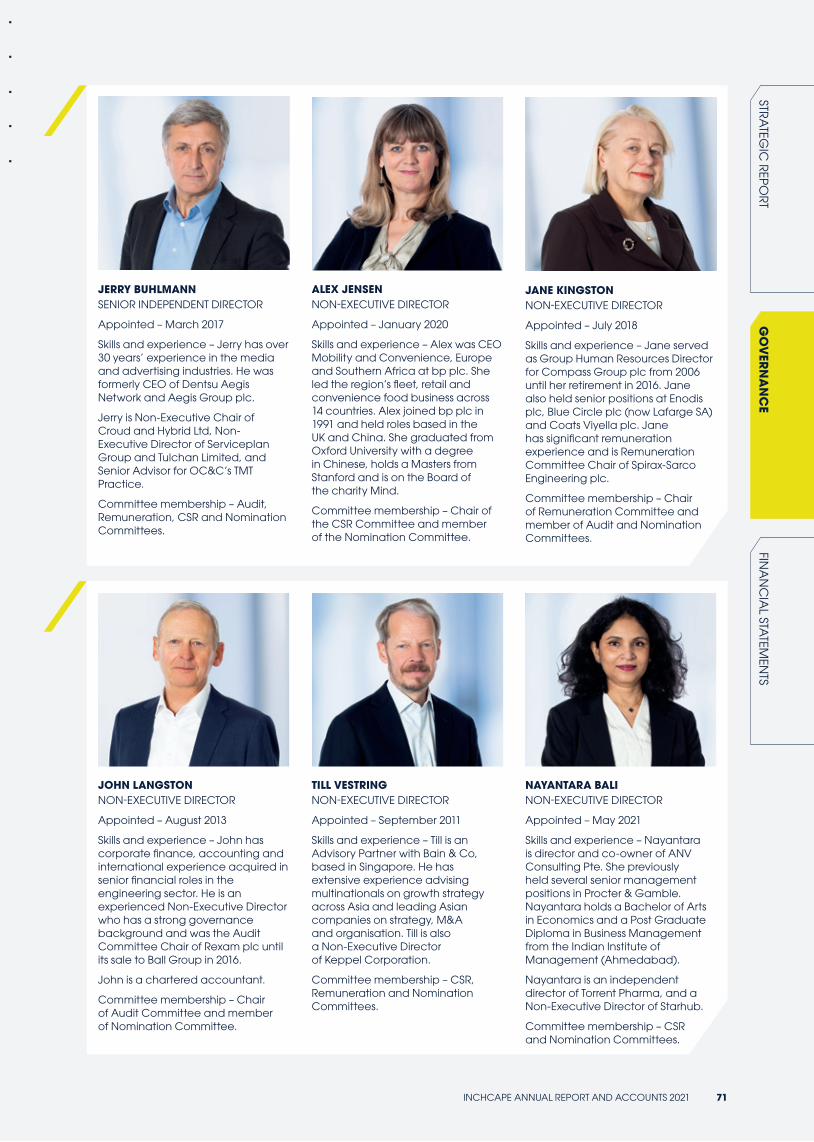
JERRY BUHLMANN SENIOR INDEPENDENT DIRECTOR
Appointed – March 2017
Skills and experience – Jerry has over 30 years’ experience in the media and advertising industries. He was formerly CEO of Dentsu Aegis Network and Aegis Group plc.
Jerry is Non-Executive Chair of Croud and Hybrid Ltd, Non-Executive Director of Serviceplan Group and Tulchan Limited, and Senior Advisor for OC&C’s TMT Practice.
Committee membership – Audit, Remuneration, CSR and Nomination Committees.
JOHN LANGSTONNON-EXECUTIVE DIRECTOR
Appointed – August 2013
Skills and experience – John has corporate finance, accounting and international experience acquired in senior financial roles in the engineering sector. He is an experienced Non-Executive Director who has a strong governance background and was the Audit Committee Chair of Rexam plc until its sale to Ball Group in 2016.
John is a chartered accountant.
Committee membership – Chair of Audit Committee and member of Nomination Committee.
ALEX JENSENNON-EXECUTIVE DIRECTOR
Appointed – January 2020
Skills and experience – Alex was CEO Mobility and Convenience, Europe and Southern Africa at bp plc. She led the region’s fleet, retail and convenience food business across 14 countries. Alex joined bp plc in 1991 and held roles based in the UK and China. She graduated from Oxford University with a degree in Chinese, holds a Masters from Stanford and is on the Board of the charity Mind.
Committee membership – Chair of the CSR Committee and member of the Nomination Committee.
TILL VESTRINGNON-EXECUTIVE DIRECTOR
Appointed – September 2011
Skills and experience – Till is an Advisory Partner with Bain & Co, based in Singapore. He has extensive experience advising multinationals on growth strategy across Asia and leading Asian companies on strategy, M&A and organisation. Till is also a Non-Executive Director of Keppel Corporation.
Committee membership – CSR, Remuneration and Nomination Committees.
JANE KINGSTONNON-EXECUTIVE DIRECTOR
Appointed – July 2018
Skills and experience – Jane served as Group Human Resources Director for Compass Group plc from 2006 until her retirement in 2016. Jane also held senior positions at Enodis plc, Blue Circle plc (now Lafarge SA) and Coats Viyella plc. Jane has significant remuneration experience and is Remuneration Committee Chair of Spirax-Sarco Engineering plc.
Committee membership – Chair of Remuneration Committee and member of Audit and Nomination Committees.
NAYANTARA BALI NON-EXECUTIVE DIRECTOR
Appointed – May 2021
Skills and experience – Nayantara is director and co-owner of ANV Consulting Pte. She previously held several senior management positions in Procter & Gamble. Nayantara holds a Bachelor of Arts in Economics and a Post Graduate Diploma in Business Management from the Indian Institute of Management (Ahmedabad).
Nayantara is an independent director of Torrent Pharma, and a Non-Executive Director of Starhub.
Committee membership – CSR and Nomination Committees.
INCHCAPE ANNUAL REPORT AND ACCOUNTS 2021 71
STRA
TEGIC
REPO
RTFIN
AN
CIA
L STATEM
ENTS
GO
VER
NA
NC
E
PRINCIPAL DECISIONS IN 2021Accelerate Strategy The Board spent time debating the five-year plan required to deliver the Accelerate strategy. The Board’s discussions focused on industry and macro trends which create both risks and opportunities for the Group, the underlying assumptions used to drive growth, and the strategic initiatives which contribute to the strategic ambition.
The Board were fully informed of stakeholder considerations and impacts by both management and external consultants. Key considerations included:
• Customer expectations and the move to online;• Electrification which is a fundamental component of our
original equipment manufacturer (OEM) brand partners agenda and other connected, autonomous, shared, electric elements which will have an impact on our suppliers in the longer term;
• The culture and capabilities needed to deliver the strategic ambition and how this will impact our colleagues; and
• How the strategy will be delivered sustainably and how the business will contribute towards a cleaner energy world.
The Board approved the strategic framework in May 2021 with the global strategy launch in September 2021.
Responsible Business The Driving What Matters plan was developed alongside the Accelerate strategy and underpins the Group’s purpose. During the year the Board, along with the CSR Committee, discussed the strategic priorities of the plan, and how these activities create value by supporting Accelerate.
The Board were able to give consideration to the impact on stakeholders by reviewing the ‘Discovery Report’ which was commissioned to get an understanding of OEM ambitions, customer expectations, the employee experience and the requirements of shareholders and other regulatory bodies.
The four strategic pillar approach built on People, Places, Planet and Practices was endorsed by the Board and the CSR Committee, with four global workstreams established to identify key priorities and targets. Each workstream has developed a charter to tackle the sustainability challenges facing business, our society, and our planet.
Global Business ServicesDuring the year, the Board approved the establishment of a Global Business Services organisation (GBS). The implementation of GBS is necessary to transform the way the finance functions work, standardise and consolidate core accounting processes, add additional controls and introduce a platform that supports rapid M&A integration, which are key features of the strategic enabler to create efficient scale operations.
The Board considered the GBS business case which included the identification of the preferred solution, the vendor selection process and the GBS solution design. When regarding the impact to stakeholders, the Board largely considered these impacts to be positive for OEMs, customers and suppliers, due to the increased efficiency of processes and for shareholders, with increased value in the longer-term. However, it was clear to the Board that there could be negative impacts on employees whose jobs are affected by the transition to GBS. The Board reviewed the detailed transition plan and risk mitigation approach to ensure business continuity.
Throughout the transition, a two-way communications and ongoing engagement plan was put in place. A key principle was to actively listen to, and act on, feedback from colleagues throughout all phases and to support the various market finance teams across all regions. The strategy recognised the need to provide multiple communication channels to suit every audience, such as meetings, round table events, leadership communications, forums and videos, embracing the latest digital technology where possible. Every effort to ensure that colleagues involved in the changes, and especially those whose employment was impacted by the transition, were to be treated fairly, consistent with the Group’s values, and in accordance with local employment law. The engagement programme resulted in a high retention rate throughout the first phases of the project. The Board also agreed that the Internal Audit team would carry out a GBS Programme Assurance review to give assurance over the robustness of overall governance, project delivery, people and change management, cost monitoring and risk management. The Audit Committee reviewed the internal audit reports during the year.
Despite these challenges, the Board and management believe that transitioning to a GBS organisation provides a competitive advantage for the long-term.
Business Development A key element of the Accelerate strategy is the growth opportunities through M&A. During the year, the Board approved several new acquisitions including distribution in Indonesia, Daimler distribution in Guatemala, a partnership with Geely in Chile, and acquisition of ITC and Simpsons Motors in the Caribbean. Building and maintaining strong OEM relationships is critical to the Group’s growth strategy and continuous engagement via top to top and regional meetings with OEM partners allows opportunities to be explored. For each transaction, the Board received detailed reports from the M&A team, and external consultants covering areas such as:
• Economic outlook;• Market and reputational risks;• Climate related ambitions for both OEM and market;• Brand performance;• Strategic rationale; and • Business integration plans.
These reports allow the Board to make considered judgements on the impact to stakeholders. When considering acquisitions the Board pays particular attention to the OEM relationship, employees whose roles will be affected by the changes, the culture and reputation of the business being acquired and the communities in which the OEMs operate. In relation to the recent acquisitions, the Board weighed up the OEM’s stated ambition for transitioning to EV, the CO2 emissions plans, the current and future infrastructure expectations, and the regulatory direction within each market.
In April 2021, the Board agreed the disposal of its retail operations in St Petersburg. This decision is aligned with the Group’s strategy to focus on global distribution ambitions. During the process, management engaged with the OEM brand partners who confirmed their understanding of the strategic rationale and gave their support for the transaction. The Board also considers the impact on employees and whether they will be treated fairly under new ownership.
CORPORATE GOVERNANCE REPORT
72 INCHCAPE ANNUAL REPORT AND ACCOUNTS 2021
PROGRESS FROM 2020 BOARD EVALUATION
Board The Board made sure that it had sufficient time to focus on the refreshed strategy and its oversight of purpose by scheduling time to review at the January, February, May, and November meetings.
The Board increased its awareness of the broader environmental, social, and governance (ESG) agenda during the year and formally incorporated ESG considerations into its decisions on strategy, risk and performance. Oversight of climate related impacts will be considered at least annually with regular updates provided throughout the year by the CSR Committee.
Strategic Report pages 2 to 56.
Responsible Business Report page 33.
CSR Committee The Committee determined its scope and remit and re-defined its terms of reference to ensure appropriate oversight of the Responsible Business agenda.
Workforce engagement was improved with the designated Non-Executive Director attending employee townhalls and facilitating an employee forum on Culture.
Climate change reporting was added to the agenda with external consultants providing an overview of the impacts to the business and what actions are needed to enable the Group to meet its reporting obligations.
Responsible Business Report page 33.
CSR Committee Report on page 82.
Nomination Committee
The Committee continued to focus on diversity both at Board level and throughout the organisation. The composition of the Board remained a priority with the appointment of two Non-Executive Directors.
Nomination Committee Report on page 75.
OUTCOME OF 2021 EVALUATIONA evaluation of the Board is carried out each year with an external review every third year. In 2020, the Board evaluation was an external review consisting of interviews with the members of the Board, Group Executive Team, external auditor and remuneration consultants, as well as Board and Committee meetings being observed. Progress made from the outcome of the 2020 evaluation is reported above.
The internal Board evaluation in 2021 consisted of an online questionnaire for each Board member to complete. anonymously. The questionnaire covered strategy, knowledge and contribution, succession planning, risk management, workforce culture, and committee effectiveness. The Directors were invited to give further comment when answering the questions to provide additional insight into the effectiveness of the Board. The results of the questionnaire were collated into a report which was then discussed at a Board meeting to agree outcomes to focus on in 2022.
The overall impression from this evaluation is that the Board is one of unity and respect, which functions well. The Board feels there is sufficient engagement with stakeholders to be comfortable of a rounded view and that the current strategy has an appropriate balance between short and long-term success. The Board’s considerations on the impact on ESG matters when making decisions has increased in importance and will be further integrated into decision making in 2022.
Board members feel that their experience and contributions are valued and welcomed. Unanimous agreement was given to the open communication both within Board meetings and between Board members and senior management, particularly during the volatile Covid-19 climate, enabling an optimal collaborative and constructive environment. This transparency results in the ability to challenge and support decisions leading to quality discussion where everyone has the opportunity to express themselves.
The Board feels that there is the right level of focus on succession and diversity, with good progress made on identifying and developing future talent. There needs to be a continued focus on enhancing representation of minority diversity groups in senior management to ensure the Company is leading in best practice. Clearer criteria for assessing potential successors is desired ahead of future Board appointments where a sound understanding of the automotive industry and use of digital and technology data is seen as important. Being a global company, over time it will be important to build a balance of UK and non-UK Directors to enhance foreign market representation.
Overall the Board is satisfied with the risk management processes and believe that these are effective and functioning well. Whilst progress with technology usage has excelled, care needs to be taken when evaluating digital risks as this is an evolving area of the business and it is imperative that the Company is well positioned to adapt to such changes.
On culture and workforce engagement, it is viewed that the Company deals with any breaches of rules and conduct sufficiently and that the increase of workforce engagement on wider Company issues has proved insightful and will develop further as time progresses.
The assessment showed that there is a solid platform of competences, however, there is still a strive for continuous development by the directors. Areas of improvement to be built upon throughout 2022 include:
• Improved Board training/induction with greater emphasis on the industry and regulatory environment;
• Greater focus on ethnic diversity at senior management level;
• Review of succession criteria to enable more focused assessment of candidates;
• Seek further Board representation of global operations/regional markets; and
• Continued focus on ESG issues and ensuring they are sufficiently considered during Board decision making.
INCHCAPE ANNUAL REPORT AND ACCOUNTS 2021 73
STRA
TEGIC
REPO
RTFIN
AN
CIA
L STATEM
ENTS
GO
VER
NA
NC
E
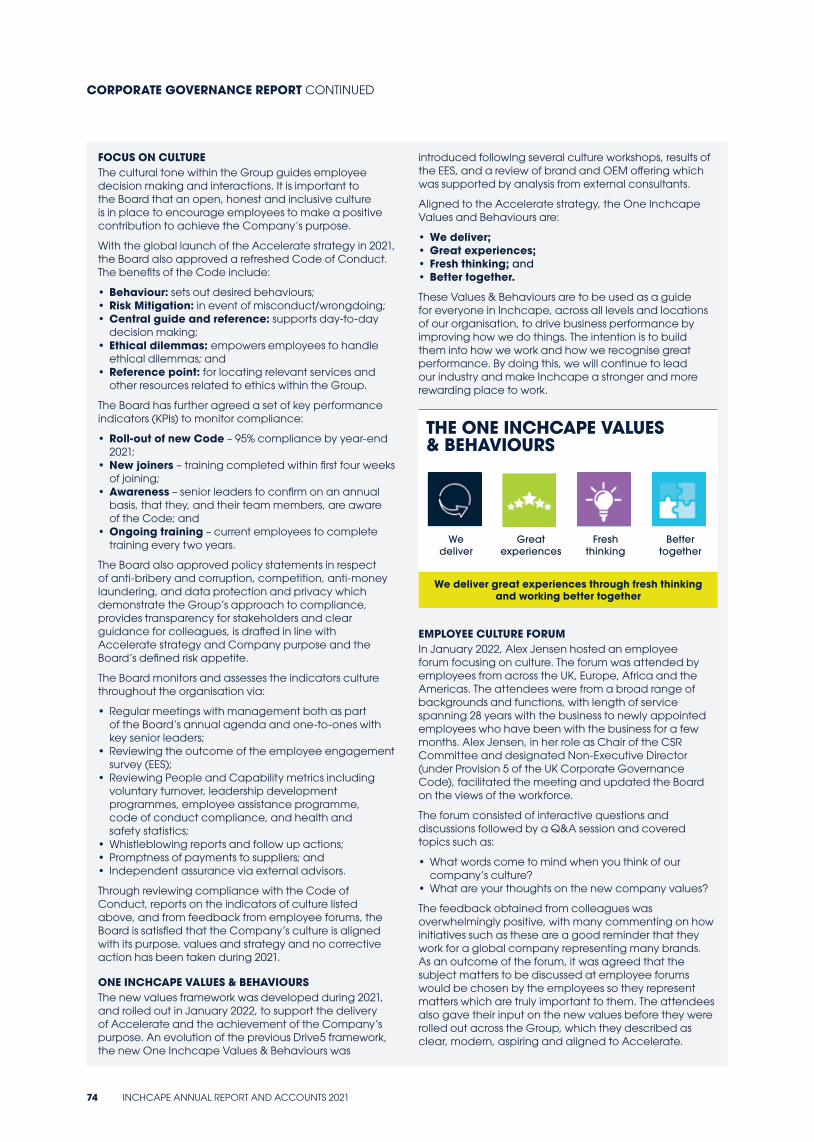
FOCUS ON CULTUREThe cultural tone within the Group guides employee decision making and interactions. It is important to the Board that an open, honest and inclusive culture is in place to encourage employees to make a positive contribution to achieve the Company’s purpose.
With the global launch of the Accelerate strategy in 2021, the Board also approved a refreshed Code of Conduct. The benefits of the Code include:
• Behaviour: sets out desired behaviours;• Risk Mitigation: in event of misconduct/wrongdoing;• Central guide and reference: supports day-to-day
decision making;• Ethical dilemmas: empowers employees to handle
ethical dilemmas; and• Reference point: for locating relevant services and
other resources related to ethics within the Group.
The Board has further agreed a set of key performance indicators (KPIs) to monitor compliance:
• Roll-out of new Code – 95% compliance by year-end 2021;
• New joiners – training completed within first four weeks of joining;
• Awareness – senior leaders to confirm on an annual basis, that they, and their team members, are aware of the Code; and
• Ongoing training – current employees to complete training every two years.
The Board also approved policy statements in respect of anti-bribery and corruption, competition, anti-money laundering, and data protection and privacy which demonstrate the Group’s approach to compliance, provides transparency for stakeholders and clear guidance for colleagues, is drafted in line with Accelerate strategy and Company purpose and the Board’s defined risk appetite.
The Board monitors and assesses the indicators culture throughout the organisation via:
• Regular meetings with management both as part of the Board’s annual agenda and one-to-ones with key senior leaders;
• Reviewing the outcome of the employee engagement survey (EES);
• Reviewing People and Capability metrics including voluntary turnover, leadership development programmes, employee assistance programme, code of conduct compliance, and health and safety statistics;
• Whistleblowing reports and follow up actions;• Promptness of payments to suppliers; and• Independent assurance via external advisors.
Through reviewing compliance with the Code of Conduct, reports on the indicators of culture listed above, and from feedback from employee forums, the Board is satisfied that the Company’s culture is aligned with its purpose, values and strategy and no corrective action has been taken during 2021.
ONE INCHCAPE VALUES & BEHAVIOURSThe new values framework was developed during 2021, and rolled out in January 2022, to support the delivery of Accelerate and the achievement of the Company’s purpose. An evolution of the previous Drive5 framework, the new One Inchcape Values & Behaviours was
introduced following several culture workshops, results of the EES, and a review of brand and OEM offering which was supported by analysis from external consultants.
Aligned to the Accelerate strategy, the One Inchcape Values and Behaviours are:
• We deliver;• Great experiences;• Fresh thinking; and• Better together.
These Values & Behaviours are to be used as a guide for everyone in Inchcape, across all levels and locations of our organisation, to drive business performance by improving how we do things. The intention is to build them into how we work and how we recognise great performance. By doing this, we will continue to lead our industry and make Inchcape a stronger and more rewarding place to work.
THE ONE INCHCAPE VALUES & BEHAVIOURS
We deliver great experiences through fresh thinking and working better together
We deliver
Great experiences
Fresh thinking
Better together
EMPLOYEE CULTURE FORUMIn January 2022, Alex Jensen hosted an employee forum focusing on culture. The forum was attended by employees from across the UK, Europe, Africa and the Americas. The attendees were from a broad range of backgrounds and functions, with length of service spanning 28 years with the business to newly appointed employees who have been with the business for a few months. Alex Jensen, in her role as Chair of the CSR Committee and designated Non-Executive Director (under Provision 5 of the UK Corporate Governance Code), facilitated the meeting and updated the Board on the views of the workforce.
The forum consisted of interactive questions and discussions followed by a Q&A session and covered topics such as:
• What words come to mind when you think of our company’s culture?
• What are your thoughts on the new company values?
The feedback obtained from colleagues was overwhelmingly positive, with many commenting on how initiatives such as these are a good reminder that they work for a global company representing many brands. As an outcome of the forum, it was agreed that the subject matters to be discussed at employee forums would be chosen by the employees so they represent matters which are truly important to them. The attendees also gave their input on the new values before they were rolled out across the Group, which they described as clear, modern, aspiring and aligned to Accelerate.
CORPORATE GOVERNANCE REPORT CONTINUED
74 INCHCAPE ANNUAL REPORT AND ACCOUNTS 2021
ALLOCATION OF TIME SPENT (%)
Board composition
Corporate governance
Succession planning
30
50
20
NOMINATION COMMITTEE REPORT
DEAR SHAREHOLDER
I am pleased to present the report of the Nomination Committee for the year ended 31 December 2021 which aims to set out how we have discharged our duties during the year.
MEMBERSHIPNumber of
meetings held/attendance
Ad hoc meetings held/
attended
Nigel Stein (Chair) 2/2 2/2
Jerry Buhlmann 2/2 2/2
Nayantara Bali* 1/1 0/0
Rachel Empey** 1/1 1/1
Alex Jensen 2/2 2/2
Jane Kingston 2/2 1/1
John Langston 2/2 2/2
Till Vestring 2/2 2/2
* Nayantara Bali joined the Group in May 2021.** Rachel Empey left the Group on 30 April 2021.
The Committee’s terms of reference can be found at www.inchcape.com/governance.
Board composition and succession planning continues to be the main focus of the Committee. 2021 saw several changes, with the appointment of Nayantara Bali and the departure of Rachel Empey.
Nayantara Bali joined the Board following the AGM in May 2021 and is co-owner and director of ANV Consulting, a boutique management consultancy specialising in leveraging data analytics, Prior to this, Nayantara was with Procter & Gamble for over 28 years holding several senior regional and global positions based in Singapore, Thailand, and India.
Rachel Empey left the Board in April 2021 to join the supervisory board of BMW Group in Germany and I would like to thank her for the strong contribution she made to the Board over the past five years. We began the recruitment process to find a successor during 2021 and had a clear idea of the skills and attributes required to support the achievement of the strategic goals in the short and longer-term.
Following a rigorous search process, I am delighted that Sarah Kuijlaars joined the Board as a Non-Executive Director in January 2022. Sarah is currently Chief Financial Officer and Executive Director of De Beers plc and was previously a Non-Executive Director at Aggreko plc. Sarah was also previously CFO of Arcadis NV, deputy CFO at Rolls-Royce Holdings plc, and has held a number of senior financial leadership roles during a 25-year career at Royal Dutch Shell plc. Sarah’s extensive financial and international experience will both strengthen and complement the existing Board’s skill set.
Till Vestring completed nine years’ service in 2020, however, agreed to remain on the Board to assist with the recruitment of Nayantara Bali, and to provide additional support for Ruslan Kinebas who assumed the role of CEO APAC in April 2021. As we were unable to travel for the majority of 2021, Till’s support in the recruitment process and the onboarding of Nayantara has been invaluable as they are both based in Singapore. Till will remain a member of the Board before he intends to step down at the 2022 AGM.
NIGEL STEIN CHAIR OF THE NOMINATION COMMITTEE
DIRECTOR INDEPENDENCEProvision 10 of the Code sets outs circumstances which “which are likely to impair, or could appear to impair” a director’s independence. During 2021, Till did not:
• Act as employee of the Group within the last five years;• Have a material business relationship with the Group
within the last three years; • Receive additional remuneration from the Company
(apart from his basic remuneration);• Participate in the Company’s share option or
performance-related pay schemes;• Become a member of the Company’s pension scheme;
NIGEL STEINCHAIR
INCHCAPE ANNUAL REPORT AND ACCOUNTS 2021 75
STRA
TEGIC
REPO
RTFIN
AN
CIA
L STATEM
ENTS
GO
VER
NA
NC
E
• Have close family ties with any of the Company’s advisers, directors or senior employees;
• Hold cross-directorships or have significant links with other directors through involvement in other companies or bodies;
• Represent a significant shareholder; or• Chair any Committee meeting.
There were no agreements or relationships which could compromise Till’s ability to hold management to account. By serving the Board whilst we looked to appoint two new Non-Executive Directors – which has since taken place – Till’s continued service was in the best interests of the Company and its stakeholders. The Committee is satisfied that despite having over nine years’ service, Till continues to demonstrate independent character, judgement and objectivity, and Till’s continued service has not impaired his independence.
The Board ensures, through the Nomination Committee, that Board composition is kept under review, that appropriate succession plans are in place, that the independence of Non-Executive Directors is not compromised and that they have the time and resources necessary to devote to the role.
SKILLS, EXPERIENCE AND DIVERSITYThe Committee recognises the importance of the right mix of skills, experience and diversity to deliver the Accelerate strategy. With digital, data, analytics and cyber security as key enablers for Distribution Excellence and the acceleration of omni-channel, this remains a key skill area for the Board. Experience and knowledge were strengthened during the year with the appointment of Nayantara Bali who also brings international experience.
During the year the Committee:
• Carried out a review of skills, experience and diversity;• Reviewed the length of service and re-appointment
following three-year term;• Assessed the Non-Executive Directors’ independence;• Recommended election and re-election at the AGM;
and• Approved the policy on multi-board appointments.
SUCCESSION PLANNINGWhen considering succession planning, the Committee looks at length of service in addition to the required skills and experience. It is usual practice for Non-Executives to complete nine years’ service and the succession planning process takes this into account to ensure the continual refreshment of the Board. However, a director may resign before they have completed nine years’ service. In these circumstances, a long-list of potential candidates is continually kept up to date so the appointment process can begin immediately to fill vacancies as they arise.
During the year the Committee recommended the appointment of Nayantara Bali to the Board for approval and continued the search for a Non-Executive Director to fill the current vacancy.
The performance of the Group Executive Team is considered by the Board as a whole during the annual organisational health check and the Non-Executive Directors discuss succession planning for senior leadership during the year without the presence of executive management. There were several changes to the executive team, including internal moves and external hires, during 2021. George Ashford assumed the role of temporary CEO of the UK business and Romeo Lacerda was appointed as CEO of Americas & Africa.
APPOINTMENT PROCESSAn external recruitment consultant is appointed to assist with the recruitment of directors. The Chairman will develop an appropriate job specification, and set out any other desirable attributes, and agree a long-list of potential candidates with the consultant. From this, a short-list is agreed, and the interview process begins. Potential candidates meet with the Chairman, Senior Independent Director and other Board members. Once a preferred candidate has been identified, the Committee makes its recommendation to the Board for approval. During the recruitment process a comprehensive assessment is carried out to evaluate each candidate’s capability, strengths and personal attributes needed to complement and enhance the skills, experience and knowledge of the Board members.
Korn Ferry was appointed to assist with the recruitment of Nayantara Bali and Odgers Berndtson was appointed to assist with the recruitment of Sarah Kuijlaars. Korn Ferry and Odgers Berndtson are signatories of the Voluntary Code of Conduct for Executive Search Firms and neither firm has any other connection to the Company or any individual director.
DIVERSITY POLICY STATEMENTWe value diversity in the broadest sense, including but not limited to, gender, race, social and ethnic backgrounds, skills, industry experience, professional and educational backgrounds. We believe increasing diversity adds fresh perspectives which enrich our decision making and the aim of the policy is to reflect this ethos. The Board’s policy on diversity is a verbally agreed principles-based policy. The importance of Board diversity is clearly understood by our recruitment consultants and is built into the process of succession planning and external hires. We continue to consider all aspects of diversity in our nomination process while also appointing candidates with the skills and experience that are necessary for the continuing growth of our operations.
The Board remains dedicated to meeting recommendations set-out in the Hampton-Alexander and Parker reviews and has an overall ambition of achieving gender parity and greater representation of diverse ethnic backgrounds over time.
With the appointment of Nayantara Bali in May 2021 and Sarah Kuijlaars in January 2022 , the Board has 40% female representation and 10% diverse ethnic representation therefore has exceeded the minimum diversity requirements of both the Hampton-Alexander and Parker reviews.
The Board’s philosophy on diversity is also reflected throughout Inchcape and the business has continued to strive for increased diversity of all identities, backgrounds and experiences across its workforce and is building a more inclusive environment where everyone believes they can belong, be themselves and succeed. For more information on workforce inclusion and diversity see page 35.
CORPORATE GOVERNANCE REPORT CONTINUED
76 INCHCAPE ANNUAL REPORT AND ACCOUNTS 2021
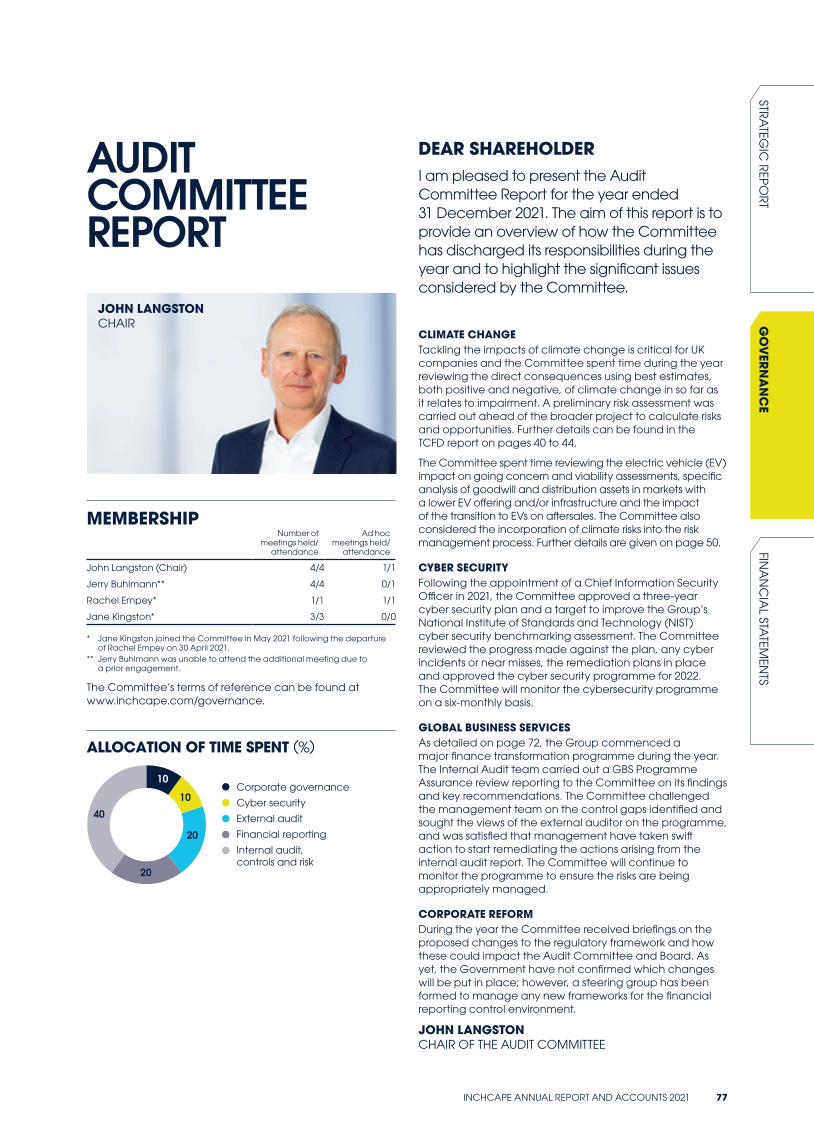
ALLOCATION OF TIME SPENT (%)
Corporate governance
Cyber security
External audit
Financial reporting
Internal audit, controls and risk
10
40
10
20
20
AUDIT COMMITTEE REPORT
DEAR SHAREHOLDERI am pleased to present the Audit Committee Report for the year ended 31 December 2021. The aim of this report is to provide an overview of how the Committee has discharged its responsibilities during the year and to highlight the significant issues considered by the Committee.
CLIMATE CHANGETackling the impacts of climate change is critical for UK companies and the Committee spent time during the year reviewing the direct consequences using best estimates, both positive and negative, of climate change in so far as it relates to impairment. A preliminary risk assessment was carried out ahead of the broader project to calculate risks and opportunities. Further details can be found in the TCFD report on pages 40 to 44.
The Committee spent time reviewing the electric vehicle (EV) impact on going concern and viability assessments, specific analysis of goodwill and distribution assets in markets with a lower EV offering and/or infrastructure and the impact of the transition to EVs on aftersales. The Committee also considered the incorporation of climate risks into the risk management process. Further details are given on page 50.
CYBER SECURITYFollowing the appointment of a Chief Information Security Officer in 2021, the Committee approved a three-year cyber security plan and a target to improve the Group’s National Institute of Standards and Technology (NIST) cyber security benchmarking assessment. The Committee reviewed the progress made against the plan, any cyber incidents or near misses, the remediation plans in place and approved the cyber security programme for 2022. The Committee will monitor the cybersecurity programme on a six-monthly basis.
GLOBAL BUSINESS SERVICESAs detailed on page 72, the Group commenced a major finance transformation programme during the year. The Internal Audit team carried out a GBS Programme Assurance review reporting to the Committee on its findings and key recommendations. The Committee challenged the management team on the control gaps identified and sought the views of the external auditor on the programme, and was satisfied that management have taken swift action to start remediating the actions arising from the internal audit report. The Committee will continue to monitor the programme to ensure the risks are being appropriately managed.
CORPORATE REFORMDuring the year the Committee received briefings on the proposed changes to the regulatory framework and how these could impact the Audit Committee and Board. As yet, the Government have not confirmed which changes will be put in place; however, a steering group has been formed to manage any new frameworks for the financial reporting control environment.
JOHN LANGSTONCHAIR OF THE AUDIT COMMITTEE
JOHN LANGSTONCHAIR
MEMBERSHIP Number of
meetings held/attendance
Ad hoc meetings held/
attendance
John Langston (Chair) 4/4 1/1
Jerry Buhlmann** 4/4 0/1
Rachel Empey* 1/1 1/1
Jane Kingston* 3/3 0/0
* Jane Kingston joined the Committee in May 2021 following the departure of Rachel Empey on 30 April 2021.
** Jerry Buhlmann was unable to attend the additional meeting due to a prior engagement.
The Committee’s terms of reference can be found at www.inchcape.com/governance.
INCHCAPE ANNUAL REPORT AND ACCOUNTS 2021 77
STRA
TEGIC
REPO
RTFIN
AN
CIA
L STATEM
ENTS
GO
VER
NA
NC
E
SIGNIFICANT ISSUES CONSIDERED BY THE COMMITTEE DURING THE YEARImpairment – see note 11 to 13 on pages 153 to 160Impairment reviews are carried out annually in respect of goodwill and indefinite life assets, and if there is an indicator of impairment, reviews are carried out on a more frequent basis. In addition, other intangible assets, property, plant and equipment, including site assets, and right-of-use assets are reviewed for impairment if events or circumstances indicate that the carrying value may not be recoverable. This is a judgemental process which requires assessing whether there is an indicator of impairment, estimating future cash flows based on future business prospects, determining long-term growth rates and discount rates. It is the Committee’s view that management’s approach to impairment is robust, based on reliable supporting data supplied by external sources, and with appropriate challenge from the external auditor. The Audit Committee focused on the following aspects of the impairment:
• The Committee debated the cash flow projections used to calculate the value in use, considering whether these reflect a reasonable expectation of future performance;
• The Committee considered how management had determined the discount rates and long-term growth rates;• The Committee discussed the impact of climate change, including electrification on impairment and the impact
of electric vehicles on aftersales;• The Committee assessed the reliability of data provided by external advisors and independent specialists used in
key assumptions; and• The Committee also discussed the appropriateness of the disclosures to be made in the Annual Report to satisfy itself
that they provided users of the financial statements with sufficient information to understand the judgements made by the Group.
After considering all available information and reviewing the findings and supporting evidence from Deloitte LLP, the Committee concluded that management’s impairment reviews of non-financial assets were appropriate and that a net impairment credit of £0.6m relating to goodwill, indefinite-life intangible assets, property, plant and equipment and right-of-use assets should be recognised for the financial year ending 31 December 2021.
Software as a service – see note 35 on page 185The IFRS Interpretations Committee (IFRS IC) recently issued two agenda decisions on cloud computing arrangements: one in 2019 which considered whether a customer received a software asset at the start of a contract or received a service over the term of the contract; and the second in 2021 considered how a customer should account for configuration or customisation costs when an intangible asset is not recognised – that is, where the customer receives a service over the term of the contract. Although the IFRS IC agenda decisions have not resulted in either a new standard, an amendment to an existing standard or a new interpretation, they do provide guidance/clarification as to how existing standards should be interpreted/applied and the IFRS IC has noted that agenda decisions may result in a change in accounting policy. The Audit Committee considered the key judgements needed to be made as part of the assessment, the conclusions reached and the corresponding consequences for the Group. The Committee considered:
• The IFRIC guidance; • The assessment of asset or service contract; • Accounting treatment of costs of configuration and customisation; • Changes in accounting policy; • The impact of the guidance on plans to migrate the Group’s existing ERP applications to a cloud-based solution;• The financial statement implications from a change in accounting policy; and• The resulting statutory accounting, transfer pricing and tax implications of the Group accounting outcome.
The Audit Committee is of the view that management’s assessment of the Group’s software applications, and whether they should be regarded as an asset or a service is appropriate. The Audit Committee sought assurance from Deloitte LLP that they concur with this approach. The Audit Committee will keep software as a service under review as guidance and best practice develop in this area.
Indefinite life of assets – see note 11 on pages 153 to 156The Group’s principal intangible assets, recognised on the Group balance sheet, are distribution agreements with manufacturers acquired as part of a business combination. A value has been attributed to those distribution agreements on acquisition in accordance with IFRS 3, Business Combinations. The Group’s policy is to assign these assets an indefinite useful life in accordance with IAS 38, Intangible Assets. The Audit Committee considered whether it is appropriate to continue to assign an indefinite useful economic life to these assets, based on the current events and circumstances of the Group and our relationships with the relevant OEMs and whether they still support the assumption of an indefinite life. The Committee considered:
• The expected usage of the distribution agreements by the Group and whether it could be managed efficiently by another management team;
• Typical lifecycles for similar agreements and public information on estimates of useful lives of similar assets that are used in a similar way;
• The stability of the automotive industry and the relevant brand partners and changes in the market demand for the products or services covered by the agreements; and
• The period of control over the agreement and legal or similar limits on their use.
The Audit Committee concluded that the assignment of an indefinite useful life to the Group’s distribution agreements is appropriate as per the requirements set out in IAS 38.
CORPORATE GOVERNANCE REPORT CONTINUED
78 INCHCAPE ANNUAL REPORT AND ACCOUNTS 2021
STRUCTURE OF THE COMMITTEEJane Kingston joined the Audit Committee during the year following the departure of Rachel Empey, whilst the search for a new Non-Executive Director commenced. Jane will step down from the Committee following the successful appointment of Sarah Kuijlaars as announced in January 2022. Sarah joined the Audit Committee upon appointment to the Board. Sarah is currently CFO of De Beers and has held several senior finance positions during her career. Sarah’s extensive financial and international experience will both complement and strengthen the Committee.
John Langston is a qualified chartered accountant and Sarah Kuijlaars is a Fellow of the Chartered Institute of Management Accountants. Both are considered to have recent and relevant financial experience. In addition, the Committee as a whole has competence in the sector in which the Company operates.
Only members of the Committee are entitled to attend Committee meetings. However, the Chairman, Group Chief Executive Officer, Chief Financial Officer, Group Financial Controller and Group Head of Internal Audit attend the Committee meetings along with the external auditor. Other senior executives, such as the Group Tax Director and Group General Counsel, attend during the year to present to the Committee.
FINANCIAL REPORTINGThe role of the Committee in relation to financial reporting is to review with both management and the external auditor the appropriateness of the half year and annual financial statements, taking into account:
• The quality and acceptability of accounting policies and practices;
• Material areas in which significant judgements have been applied or where significant issues have been discussed with the external auditor;
• The clarity of the disclosures and compliance with financial reporting standards and relevant financial and governance reporting requirements including the Code;
• Any correspondence from regulators in relation to the Group’s financial reporting; and
• Reviewing assumptions and providing assurance to support the long-term viability statement.
FAIR, BALANCED AND UNDERSTANDABLEThe Audit Committee also carries out its own assessment of the financial statements, and the Annual Report as a whole, and is satisfied that it provides the necessary information for shareholders. The Committee considered whether the information given in the financial statements is a true reflection of the narrative reporting throughout the Annual Report and Accounts, whether the key performance indicators give a true indication of the health of the business and if the issues considered of significant risk by both the external auditor and the Committee are aligned.
The processes and procedures in place to satisfy the Board of the integrity of the financial and narrative statements include a robust disclosure verification process, monthly financial performance updates, and meetings with the internal and external audit functions without the presence of management.
A statement of the Directors’ responsibilities is set out on pages 104 to 108, going concern statement is set out on page 125 and the strategy and business model are set out on pages 2 to 5.
During the year the Committee:
• Considered all key audit issues, accounting treatment and judgements in relation to the financial statements;
• Where risks were identified, either in relation to processes, key transactions or employees the Board undertook a deeper review of matters, challenging management to improve the control environment and tighten processes;
• Challenged management on the assumptions used and the judgements that have been applied, with assurances given from both external and internal sources; and
• Assessed whether the Annual Report and Accounts were fair, balanced and understandable.
RISK MANAGEMENTThe Audit Committee has delegated responsibility for ensuring that:
• There is an appropriate mechanism in place to identify the risks the Group faces;
• Management teams have the correct focus on those risks and the action plans in place to mitigate or respond to those risks;
• A compliance programme is in place in all markets that meets or exceeds external benchmarks and is appropriate in terms of legal requirements, content, sector, cost and resources;
• Internal controls are appropriate, well designed and operating consistently across the Group to manage risk effectively; and
• The Group’s whistleblowing programme is appropriately managed to reduce the risk of fraud or respond quickly and decisively in the event the Group falls victim to fraud.
Reports are provided at each meeting, detailing the risk environment to allow the Committee to monitor and assess the effectiveness of the Group’s risk management approach.
During the year the Committee:
• Monitored the principal and emerging risks;• Assessed the appropriateness of the risk management
framework and carried out a robust assessment of principal risks;
• Monitored the emerging risks and the process used to identify them;
• Reviewed the risk profile and any changes to the risks;• Climate-related risks and the TCFD reporting
recommendations; and• Major whistleblowing reports and any mitigating plans
implemented by management.
INTERNAL CONTROLThe Internal Control framework encompasses all controls including those relating to financial reporting processes, preparation of consolidated Group accounts, operational and compliance controls and risk management processes.
InControl StandardsThe InControl Standards (ICS) are designed to enable management to establish, assess and enhance strong and consistent risk and control governance. The framework is regularly reviewed and updated in line with emerging Group risks, in response to emerging internal audit issues, and following any investigation activity.
INCHCAPE ANNUAL REPORT AND ACCOUNTS 2021 79
STRA
TEGIC
REPO
RTFIN
AN
CIA
L STATEM
ENTS
GO
VER
NA
NC
E
The standards form part of the broader control environment consisting of:
• Culture and behaviours;• Code of Conduct;• Group, regional and local policies and procedures,
including legal and regulatory compliance;• Delegation of authorities;• Risk management process; and• Roles and responsibilities.
The ICS has been designed to mitigate the most significant risks across the Group providing robust governance and a sound controls framework to ensure:
• Reliability of financial reporting;• Effectiveness and efficiency of operations; and• Compliance with applicable laws and regulations.
They are also there to help protect us from:
• Fraud and misappropriation of cash and assets; and• Material error in the financial statements.
The central and regional Internal Controls teams support the business by providing the framework, tools and training, and ongoing support to embed the ICS across the business which in turn enables management to monitor the effectiveness of controls in the business and to implement actions plans where improvement is required. The Internal Control function is separate from the Internal Audit function and works with management teams to design controls that are proportionate to the level of risk, supported by systems and easy to follow.
The Audit Committee receives reports from the Group Head of Internal Audit at each meeting covering Internal Audit, Internal Controls and Risk Management. The reports provide an update on the control framework, compliance scores, status of management actions and control gaps. This information enables the Committee to assess the effectiveness of internal controls on an on-going basis. The external auditor also provides an annual report on control improvement recommendations and other observations which allows the Committee to assess effectiveness annually.
The reports are available to all Board members to allow them to keep informed, and other Board members are also able to attend any Committee meetings should they wish. However, the Audit Committee also provides an update on the control and risk environment to the full Board following each Committee meeting.
Any significant control failings or weaknesses are reported to the Board, with a detailed review of the findings and mitigation plans being put in place. The Board monitors progress against plans until it is satisfied that such matters are resolved appropriately. The Board has determined that there were no significant failings or weaknesses identified during the review of risk management and internal control processes during the year and further confirms that these systems were in place during 2021 and to the date of this report. The Board is satisfied that the control environment was materially effective during the course of the year.
WHISTLEBLOWINGThe Group Head of Internal Audit reports to the Committee at each meeting on fraud and whistleblowing claims that have been received since the last Audit Committee meeting, and significant currently open issues. The new and open cases which are reported to the Committee are those of sufficient significance to warrant attention, however, a list of all reports is also provided to the Committee along with a breakdown by market, report type and source.
The Audit Committee Chair reports to the Board on any significant issues or resolutions made by the Committee following each meeting. All Directors have full access to the whistleblowing reports and other Audit Committee papers.
During the year the Committee:
• Received updates on cases reported during the year;• Reviewed themes and trends of reported cases;• Reviewed the detailed briefings on material cases; and• Monitored follow-up action plans and resolution.
INTERNAL AUDITThe aim of the Internal Audit function is to provide independent and objective risk-based assurance for the Group by bringing a systematic and disciplined approach to evaluate the effectiveness of risk management, governance and control. An annual programme of audit activity is approved by the Audit Committee; this is flexed if required throughout the year in accordance with the risk profile of the organisation and any subsequent amendments are discussed in detail and agreed by the Committee.
The function carries out audits across a selection of Group businesses, functions and programmes which include the management of risks and controls over financial, operational, IT and other compliance areas, such as GDPR and anti-bribery and corruption.
The Internal Audit function, led by the Group Head of Internal Audit, consists of appropriately qualified and experienced employees with an in-depth understanding of the business culture, systems, and processes. The Group Head of Internal Audit reports to the Audit Committee and has direct access to, and has regular meetings with, the Audit Committee Chair, prepares formal reports for Audit Committee meetings on the activities and key findings of the function and reports on progress against mitigation plans. The purpose, authority and responsibility of Internal Audit are defined in the Internal Audit Charter, which the Committee reviews annually.
During the year the Committee:
• Approved the 2021 Internal Audit plan;• Monitored progress against the plan;• Approved the Internal Audit Charter;• Reviewed status of open issues; and• Monitored mitigation plans for any internal control failings.
EXTERNAL AUDITFollowing an audit tender process during 2017, Deloitte LLP was appointed as the Group’s auditor with shareholder support for the appointment given at the 2018 Annual General Meeting. Anna Marks is the lead audit partner and has been in position since the appointment of Deloitte LLP.
The Company confirms that it complied with the provisions of the Competition and Markets Authority’s Order for the financial year under review.
Auditor effectiveness, independence and objectivityEnsuring that the external auditor provides a high quality audit is a key activity of the Audit Committee as a high quality audit provides stakeholders with assurance that the financial statements give a true and fair view. The Committee carries out its assessment on an ongoing basis by considering its interactions with the auditor, its observations of the auditor and the relationship between the Audit Committee, the auditor and management.
The Committee encourages a culture of open communication and debate and the Committee believes that it is able to ask questions on key issues and to
CORPORATE GOVERNANCE REPORT CONTINUED
80 INCHCAPE ANNUAL REPORT AND ACCOUNTS 2021
challenge when it feels more information is needed. The Committee also looks at how management responds to requests from the auditor and carefully reviews the auditor’s findings and recommendations.
When the auditor supports management’s approach, the Committee considers the evidence supplied by the auditor to support its decision to ensure that the auditor is not compromised and remains objective.
The auditor also meets with the Committee without the presence of management on a regular basis, usually following each meeting. This gives the auditor an opportunity to confirm its view that management are addressing any issues raised appropriately or to raise any concerns they may have.
External evidence of the quality of the audit is also vital in assisting the Committee in its review of the effectiveness of the audit.
FACTORS CONSIDERED TO ASSESS QUALITY OF THE EXTERNAL AUDITMindset and cultureThe ethical and professional principles adhered to by the auditor; whether the auditor has any personal or commercial interests in the Group; and how they have demonstrated high standards of independence, integrity, objectivity and challenge throughout the year.
Skills, character and knowledgeThe auditing skills of the audit team; level of knowledge of the automotive distribution and retail industry possessed by the audit team; the auditor’s understanding of its obligations to users of the financial statements; and ability to challenge where appropriate whilst maintaining strong relationships.
Quality controlThe processes the auditor has in place to identify and address risks to the audit and assessing the steps taken to complete the annual audit plan.
Feedback from businessThe Committee receive feedback from management on the quality of the auditor’s delivery, communication and interaction with the various finance teams across the Group, which is communicated back to the external auditor.
The auditors’ report to the Committee sets out the audit plan, materiality, scoping, the risk assessment process, significant risks, other areas of focus, the purpose of the report and responsibility statement. The Committee reviews at each stage of the audit to ensure that it is satisfied that the audit plan is appropriate, if the auditor is meeting its obligations, and to agree any changes to the audit if they arise.
Deloitte continually monitor their independence and ensure that appropriate safeguards are in place including but not limited to the rotation of senior partners and staff and the involvement of other partners and staff to carry out reviews of the work performed and to otherwise advise if necessary.
After considering all of the above elements, the conclusion of the Committee is that the auditor carried out their audit effectively and that the auditor is independent and objective.
During the year the Committee:
• Reviewed the report from the external auditor in relation to the 2020 Annual Report and Accounts;
• Assessed the auditor’s approach to, and findings in relation to, the audit to assess independence and objectivity;
• Agreed materiality, scope and fees for the annual audit plan; and
• Received updates on upcoming corporate reform and other regulatory topics.
NON-AUDIT SERVICESImplementing a Non-Audit Services Policy (Policy) is also key to ensuring the independence of the external auditor. The Policy for non-audit services sets out the permitted and non-permitted non-audit services as well as the approval levels required by the Audit Committee and is designed to ensure that the external auditor’s objectivity is not compromised by earning a disproportionate level of fees for non-audit services or by performing work that, by its nature, may compromise the auditor’s independence. However, using advisors who have an understanding of the Group’s business can be a benefit and the Committee will consider non-audit services supplied on an ongoing basis.
The Group’s Policy on non-audit services to be provided by the Group’s auditor defines two types of non-audit services that may be performed:
• Regulatory services, which are services undertaken as auditor or reporting accountant which are outside the scope of the statutory audit but which are consistent with the role of statutory auditor; and
• Permitted non-audit services, which are services that the auditor may be permitted to undertake subject to the appropriate level of approval.
The aggregate fees incurred for permitted non-audit services relative to the audit fee should not exceed 70% of the average audit fee over the previous three years, with such cap applicable to both Group and UK audit fees.
The provision of permitted non-audit services will only be approved by the Audit Committee if:
• Engagement of the auditor to provide the services does not impair the independence or objectivity of the external auditor;
• The skills and experience of the external auditor make it the most suitable supplier of the non-audit service;
• The auditor does not have a conflict of interest due to a relationship with another entity; and
• The aggregate fees incurred for permitted non-audit services relative to the audit fee do not exceed 70% of the average audit fee over the previous three years.
Permitted non-audit services above a certain level are approved on a case-by-case basis by the Audit Committee.
The fees for permitted non-audit services relate to the audit of processes for payments and receipts in Russia, local tax audit in El Salvador, review opinion on 2020 financial statements for the Group’s Dutch subsidiary, review of the interim financial statements and a turnover certificate in Hong Kong. The Group remains within the Audit Committee approved ratio of audit to non-audit fees.
The following non-audit fees incurred with Deloitte were:
2021 £’000
2020 £’000
Regulatory services – 25
Permitted non-audit services 123 349
The ratio for audit/non-audit work for the year ended 31 December 2021 is 0.03:1. Full details are shown in note 3d of the notes to the financial statements (page 142).
AUDIT FEES PAID TO THE AUDITORFees paid for services provided by Deloitte (three-year average) were:
2021 £’000
2020 £’000
Audit fees 3,524 3,365
INCHCAPE ANNUAL REPORT AND ACCOUNTS 2021 81
STRA
TEGIC
REPO
RTFIN
AN
CIA
L STATEM
ENTS
GO
VER
NA
NC
E
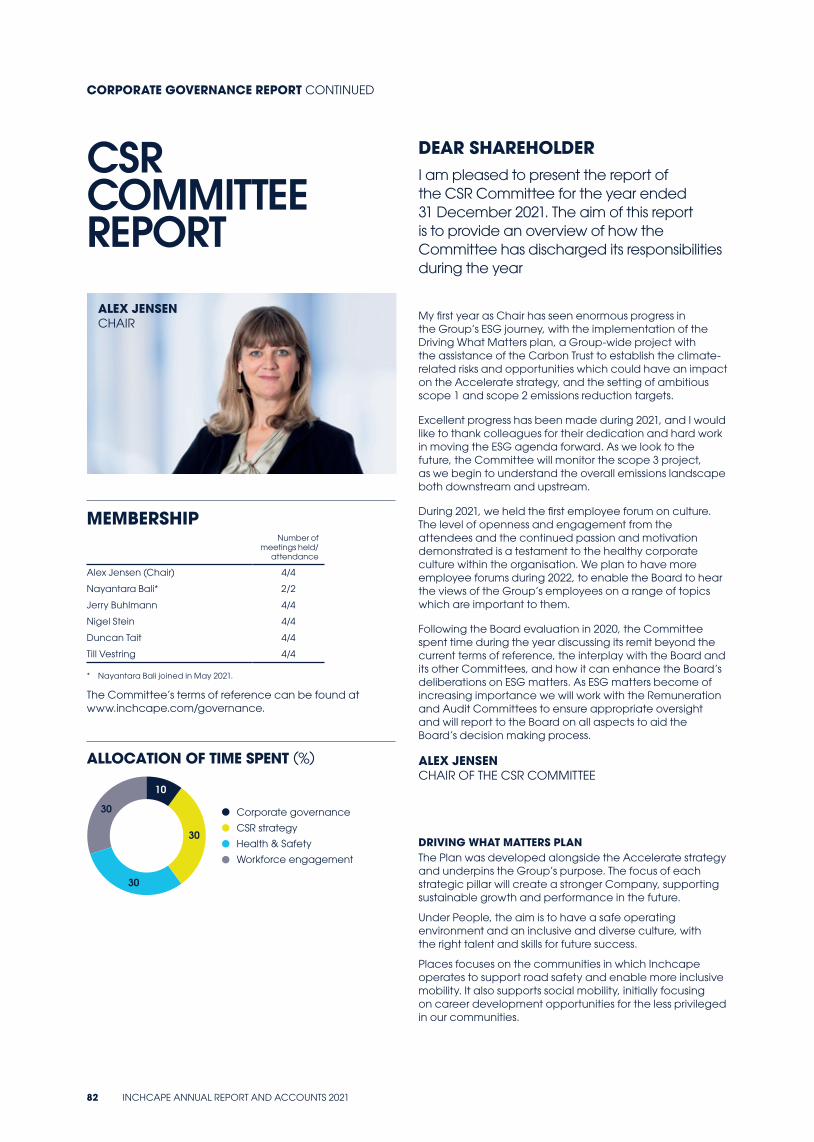
ALLOCATION OF TIME SPENT (%)
Corporate governance
CSR strategy
Health & Safety
Workforce engagement
10
30
30
30
CSR COMMITTEE REPORT
DEAR SHAREHOLDERI am pleased to present the report of the CSR Committee for the year ended 31 December 2021. The aim of this report is to provide an overview of how the Committee has discharged its responsibilities during the year
MEMBERSHIPNumber of
meetings held/attendance
Alex Jensen (Chair) 4/4
Nayantara Bali* 2/2
Jerry Buhlmann 4/4
Nigel Stein 4/4
Duncan Tait 4/4
Till Vestring 4/4
* Nayantara Bali joined in May 2021.
The Committee’s terms of reference can be found at www.inchcape.com/governance.
My first year as Chair has seen enormous progress in the Group’s ESG journey, with the implementation of the Driving What Matters plan, a Group-wide project with the assistance of the Carbon Trust to establish the climate-related risks and opportunities which could have an impact on the Accelerate strategy, and the setting of ambitious scope 1 and scope 2 emissions reduction targets.
Excellent progress has been made during 2021, and I would like to thank colleagues for their dedication and hard work in moving the ESG agenda forward. As we look to the future, the Committee will monitor the scope 3 project, as we begin to understand the overall emissions landscape both downstream and upstream.
During 2021, we held the first employee forum on culture. The level of openness and engagement from the attendees and the continued passion and motivation demonstrated is a testament to the healthy corporate culture within the organisation. We plan to have more employee forums during 2022, to enable the Board to hear the views of the Group’s employees on a range of topics which are important to them.
Following the Board evaluation in 2020, the Committee spent time during the year discussing its remit beyond the current terms of reference, the interplay with the Board and its other Committees, and how it can enhance the Board’s deliberations on ESG matters. As ESG matters become of increasing importance we will work with the Remuneration and Audit Committees to ensure appropriate oversight and will report to the Board on all aspects to aid the Board’s decision making process.
ALEX JENSEN CHAIR OF THE CSR COMMITTEE
DRIVING WHAT MATTERS PLANThe Plan was developed alongside the Accelerate strategy and underpins the Group’s purpose. The focus of each strategic pillar will create a stronger Company, supporting sustainable growth and performance in the future.
Under People, the aim is to have a safe operating environment and an inclusive and diverse culture, with the right talent and skills for future success.
Places focuses on the communities in which Inchcape operates to support road safety and enable more inclusive mobility. It also supports social mobility, initially focusing on career development opportunities for the less privileged in our communities.
ALEX JENSENCHAIR
CORPORATE GOVERNANCE REPORT CONTINUED
82 INCHCAPE ANNUAL REPORT AND ACCOUNTS 2021
The Planet workstream is looking at the Group’s impact on the environment, and the impact of climate change on the Group’s business model and future viability.
Practices focuses on the ethical culture within the business and how this is understood by employees.
The Driving What Matters plan impacts many areas and the Committee works closely with the other Board committees where there is a crossover of responsibilities.
During the year the Committee:
• Reviewed the framework and activation plan for embedding responsible business into the Group;
• Considered the insights and ideas from the Group’s employees on each of the four pillars;
• Reviewed the materiality matrix and stakeholder engagement process; and
• Agreed the priorities and governance structure for the Driving What Matters plan.
The Committee updated its terms of reference to ensure that it has appropriate oversight of the Plan. The terms define the scope and remit of the Committee and are available on the website www.inchcape.com.
CLIMATE CHANGEClimate change has also been a significant topic for the Committee during the year. Members of the Planet workstream completed a project with the Carbon Trust on the Taskforce on climate related financial disclosures (TCFD).
Following on from the Board’s review of climate change risks and opportunities, the Committee carried out a review of stakeholder benchmarking and gap analysis to understand the Group’s current position and to identify priority recommendations to improve disclosure, and to agree a pathway of future steps alongside current actions to meet the requirements of the UK’s listing rules.
During the year the Committee:
• Determined whether the Responsible Business framework supported, and helped progress, the Accelerate strategy;
• Increased its awareness and knowledge of the TCFD recommendations and climate change issues;
• Agreed expectations for the TCFD programme and what inputs would add value;
• Increase knowledge of science-based targets and understanding of the importance of setting targets for the Group;
• Approved science-based targets for scope 1 and 2, and approved plan for reviewing scope 3 targets in 2022; and
• Agreed goal of putting climate aligned strategy that mitigates risks, capitalises on opportunities and ambitiously reduces the Group’s own impacts.
WORKFORCE ENGAGEMENTAs the designated Non-Executive Director for workforce engagement (DNED), I attended several employee townhalls which were held virtually. The townhalls gave me an opportunity to see how employee engagement worked in practice and it was positive to see such a supportive, and transparent forum led by the Group Chief Executive, Duncan Tait. Employees are encouraged to ask any questions on any topics and the responses were detailed and informative.
The role of DNED is relatively new and as such is evolving. We have not been able to have face-to-face meetings so any engagement has been virtual. This has the benefit of being able to reach a wider range of employees but time zone differences have meant that engagement has been
split between regions. The Committee, and the Board, however believe this is the most effective mechanism for engaging with the workforce given the structure and spread of the Group’s operations.
Obtaining the views of employees is a vital source of insight and information and it is proposed that forums will be held on a regular basis covering a wide range of issues.
In addition to the culture forum detailed below, Jane Kingston also held a reward forum with a group of UK-based employees to get their views on Executive remuneration and the UK reward structure as a whole. Further details can be found on page 85.
CULTURE FORUMIn January 2022, I hosted an employee forum on culture, with the support from the Group Talent and Organisational Design Director.
The Group has undergone a significant amount of change in recent years, with the appointment of a new CEO and CFO since 2019, the implementation of the Accelerate strategy, the fast paced digital advances, including a finance change programme, and the acquisition of various new businesses. All of these can impact a company’s culture both positively and negatively so it was felt that an employee forum on culture would give the Board an indication of the current culture and whether that was aligned to Company’s purpose. This also coincided with the development of the new values framework and attendees were asked for their input into the ‘One Inchcape’ values and behaviours. Please see page 74 for further details.
The Board, the Group Executive Team and senior management pride themselves on creating a culture of openness and this was evident during the forum. The attendees were comfortable in expressing their views, both positive and negative, in a constructive manner. The forum consisted of interactive questions followed by open discussion where we discussed a myriad of topics including:
• What words come to mind when you think of Inchcape’s culture;
• How leadership performed during the pandemic;• How wellbeing is considered by senior management; • Language barriers which arise in a global organisation;• What career development actually means and how
it can be achieved; and• What is the ‘way we do things’ at Inchcape.
I update the Board on the forum and any outcomes, to allow additional perspective and insights which are not always clear from the results of employee engagement surveys.
HEALTH & SAFETY The HSE risk management programmes are in place across all regions with solid improvement across all key performance indicators. A cultural shift is emerging as safety in its broadest meaning becomes more prominent with regular meetings and discussions driving awareness, engagement and ownership. The HSE reporting tool now gives the Committee and the Board oversight of compliance, with regular updates given to the Board throughout the year.
INCHCAPE ANNUAL REPORT AND ACCOUNTS 2021 83
STRA
TEGIC
REPO
RTFIN
AN
CIA
L STATEM
ENTS
GO
VER
NA
NC
E
ALLOCATION OF TIME SPENT (%)
Corporate governance
Executive remuneration
Incentives40
40
20
DIRECTORS’ REPORT ON REMUNERATION
DEAR SHAREHOLDER
On behalf of the Board, I am pleased to present the Directors’ Report on Remuneration (DRR) for the year ended 31 December 2021.
MEMBERSHIPNumber of
meetings held/attendance
Ad hoc meetings held/attendance
Jane Kingston (Chair) 3/3 1/1
Jerry Buhlmann 3/3 1/1
Nigel Stein 3/3 1/1
Till Vestring 3/3 1/1
Other regular attendees at meetings at the invitation of the Committee include the Group Chief Executive Officer, Chief Financial Officer, Chief HR Officer, Group Reward and Pensions Director, and the external independent remuneration advisor Ellason LLP.
2021 presented just as many challenges as we experienced in 2020, with many of our markets impacted by pandemic related restrictions, especially in the first half of the year. However, drawing on all we learnt in 2020, the business has performed remarkably well as we have learned to operate effectively in the continuing uncertainty of the Covid-19 world and throughout 2021 the Company did not furlough any employees.
Where we have seen restrictions, we have found ways to continue to operate to meet customers’ needs, receiving orders remotely and delivering directly to the customer’s home. This was further enabled by the significant progress made on our digital capabilities allowing us to trade in a near normal way for both new and used vehicles and providing a seamless, more convenient customer experience.
In addition, we have found Covid-19 safe ways to operate our aftersales businesses despite the restrictions across some of our markets. All the above, together with the diversity of OEMs and revenue streams, and the launch of the Accelerate strategy which added renewed spirit within the organisation, has led to very strong results for the year ended 31 December 2021.
Once again, our employees have shown dedication and resilience throughout the year, for which we thank everyone.
BUSINESS PERFORMANCE AND REMUNERATION OUTCOMES FOR 2021Targets for the 2021 bonus and long-term incentive plans were set by the Committee in the context of Covid-19’s continuing and uncertain impact on business performance, taking into account the reasonably foreseeable impact of disruption during the year.
As noted above, in all markets we found ways to trade successfully though the Covid-19 restrictions, with higher new and used vehicle prices supporting revenue and stronger margins resulting in a high level of profitability and gross margins have exceeded historical averages (most notably in used cars).
JANE KINGSTONCHAIR
CORPORATE GOVERNANCE REPORT CONTINUED
84 INCHCAPE ANNUAL REPORT AND ACCOUNTS 2021
The Group delivered revenue of £7.6bn, profit before tax of £296m, EPS of 56.2p (basic adjusted), and ROCE of 30% which have resulted in the following outcomes:
2021 BONUS The 2021 bonus was based on a matrix of PBT and revenue, with results exceeding the stretch targets resulting in a pay-out at the maximum level for the financial elements of the bonus. Strong progress was also made on the strategic objectives which account for 20% of the annual bonus opportunity. Duncan Tait received a bonus of 147% of salary and Gijsbert de Zoeten received a bonus of 150% of salary. Please see pages 96 and 97 for further details.
2019 PSP/CIP The 2019 awards vested based on EPS and ROCE performance over the three years ending 31 December 2021. Under the EPS component (60% of the award), the threshold growth of 4% p.a. was not achieved. The ROCE component (40% of the award), however, will vest in full as the three-year ROCE average, of 21.5%, is above the maximum target of 20.5%. Therefore, the 2019 LTIP will vest at 40% of maximum.
Neither Duncan Tait nor Gijsbert de Zoeten were granted awards under the 2019 PSP or CIP.
The Committee is satisfied that the total remuneration received by the Executive Directors in 2021 appropriately reflects the Company’s performance over the year and, as such, no discretion was exercised by the Committee to adjust the bonus or long-term incentive outcomes.
WIDER WORKFORCE REMUNERATIONThe Committee receives a broad review of wider workforce remuneration trends and plans at the start of each year and considers this to be important and relevant context for the pay decisions it makes regarding the Executive Directors and senior managers. The review includes analysis of the workforce norms for the major markets in which we operate, together with an overview of the annual review process and notice of any material changes to benefits and incentive arrangements.
ENGAGEMENT WITH THE WORKFORCEIn October 2021, I chaired an employee forum which focused on executive and employee reward at Inchcape. The forum consisted of a range of Group and UK colleagues from a range of Group and UK employees to get a broad range of perspectives. The reward forum was limited to UK personnel as these teams are part of the same pay structure and tax regime as the Executive Directors, although the forum will be expanded to international teams in the future.
The forum gave me an opportunity to converse with employees, get a clear understanding of their views on remuneration and also to give them an understanding of the role and responsibilities of the Board and the Remuneration Committee; this exercise has been especially relevant as we prepare for our three-year remuneration policy review in 2022.
Topics discussed included:
• The Board and its role at Inchcape – Executive and Non-Executive Directors;
• Executive and senior manager reward arrangements and corporate governance framework;
• Structures of reward at Inchcape – why there are differences at different levels; and
• Wider workforce remuneration policies including pay scales and long-term incentives.
We gained valuable insights from employees whose feedback included the importance of further work on gender pay gap issues, the value of employee vehicle purchase plans and the availability for EVs, and an interest in a personalised reward statement for employees.
ENVIRONMENTAL, SOCIAL AND GOVERNANCE (ESG) METRICS REFLECTED IN REMUNERATION PLANSThe Driving What Matters plan, the Group’s responsible business framework, focuses on four pillars: People, Places, Planet and Practices. The plan has been developed alongside the Accelerate strategy and underpins the Company’s purpose of bringing mobility to the world’s communities – for today, for tomorrow and for the better. Further information can be found on pages 33 to 38.
Please see page 97 for details of the strategic objective for Duncan Tait relating to the responsible business framework.
The science-based reduction targets for scope 1 and 2 GHG emissions have been adopted by the Group and we will begin assessing scope 3 emissions during 2022. The Remuneration Committee is following progress on this and executive accountability will be reflected in the personal goal element of the 2022 bonus plan. At this stage, the Committee believes it is premature to embed such goals in the PSP awards but will consider this further as part of the policy review ahead of the 2023 AGM.
APPLICATION OF THE REMUNERATION POLICY FOR 2022
2022 SALARYThe Committee approved a salary increase of 3.5% for the Executive Directors, which is in line with the UK average salary increase. The salary increases will take effect from 1 April 2022.
2022 BONUSThe bonus matrix of revenue and profit before tax will continue to apply for the 2022 performance year. The maximum annual bonus opportunity remains unchanged at 150% of salary. 80% is based on financial measures and 20% on personal objectives.
2022 PSP/CIPThe 2022 PSP and CIP performance measures will continue to be based on EPS, ROCE and cash conversion. Awards will be granted at 180% of salary under the PSP and a matching award of up to 100% of salary under the CIP. Please see page 99 for further details.
LOOKING FORWARDThe current remuneration policy was approved by shareholders at the AGM in May 2020 and as required under the regulations a new remuneration policy will be submitted to shareholders for approval at the AGM in May 2023.
During 2022, the Committee will undertake a review of the policy to ensure that it continues to support the business, the new Accelerate strategy, and meets the expectations of shareholders and other stakeholders. As part of this review, the Committee will engage with colleagues representing the Group, and will consult with major shareholders in advance of any changes to the policy being proposed.
JANE KINGSTON CHAIR OF THE REMUNERATION COMMITTEE
INCHCAPE ANNUAL REPORT AND ACCOUNTS 2021 85
STRA
TEGIC
REPO
RTFIN
AN
CIA
L STATEM
ENTS
GO
VER
NA
NC
E

MEASURES USED FOR ANNUAL BONUS (%)
Profit before tax
Revenue
Objectives
40
40
20
MEASURES USED FOR LONG-TERM INCENTIVE PLANS (%)
EPS
ROCE
60
40
REVENUE*
Actual£7.8b
Target£6.8b
Threshold£6.3b
Stretch£7.3b
PROFIT BEFORE TAX*
Actual£308m
Target£200m
Threshold£170m
Stretch£230m
SHARE OWNERSHIP POLICIESThe Executive Directors are required to hold a fixed number of shares equivalent to 200% of base salary. They have five years from the date of appointment to reach this shareholding.
Duncan Tait and Gijsbert de Zoeten held 99% and 159% of salary respectively as at 31 December 2021, using the share price as at 31 December 2021 of 909.5p.
REMUNERATION AT A GLANCE
SUMMARY OF GROUP FINANCIAL PERFORMANCE IN 2021
£7.6bnRevenue
£296mPBT
30%ROCE
56.2pEPS
CORPORATE GOVERNANCE REPORT CONTINUED
GIJSBERT DE ZOETEN 159%
DUNCAN TAIT 99%
DETAILS OF CURRENT HOLDINGS can be found on page 99
* Targets and performances shown at constant currency rates during year.
86 INCHCAPE ANNUAL REPORT AND ACCOUNTS 2021
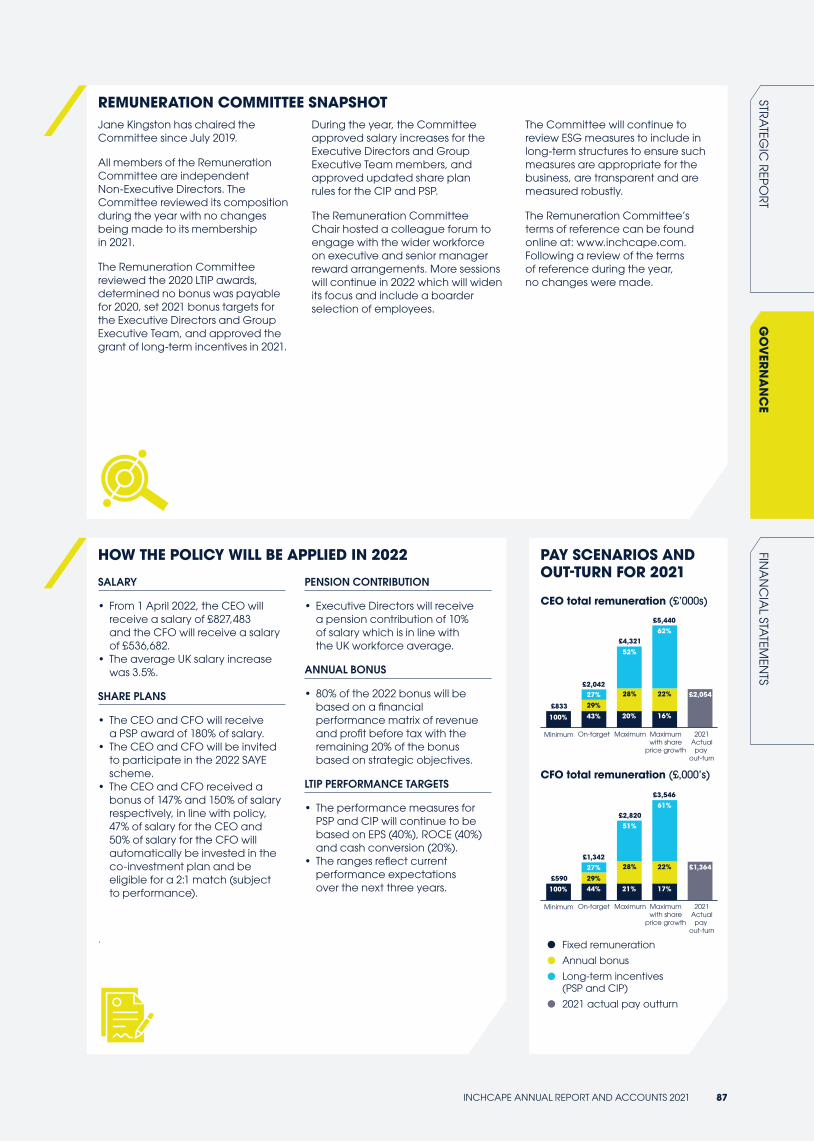
£2,054
£1,364
£833
Fixed remuneration
Annual bonus
Long-term incentives (PSP and CIP)
2021 actual pay outturn
Minimum On-target Maximum Maximumwith share
price growth
2021Actualpay
out-turn
Minimum On-target Maximum Maximumwith share
price growth
2021Actualpay
out-turn
£4,321
100% 43%29%27% 28%
52%
22%
29%
28% 22%
62%
27%
51%
61%
20% 16%
100% 44% 21% 17%
£2,042
£5,440
£590
£2,820
£1,342
£3,546
CFO total remuneration (£,000’s)
CEO total remuneration (£’000s)
REMUNERATION COMMITTEE SNAPSHOTJane Kingston has chaired the Committee since July 2019.
All members of the Remuneration Committee are independent Non-Executive Directors. The Committee reviewed its composition during the year with no changes being made to its membership in 2021.
The Remuneration Committee reviewed the 2020 LTIP awards, determined no bonus was payable for 2020, set 2021 bonus targets for the Executive Directors and Group Executive Team, and approved the grant of long-term incentives in 2021.
During the year, the Committee approved salary increases for the Executive Directors and Group Executive Team members, and approved updated share plan rules for the CIP and PSP.
The Remuneration Committee Chair hosted a colleague forum to engage with the wider workforce on executive and senior manager reward arrangements. More sessions will continue in 2022 which will widen its focus and include a boarder selection of employees.
The Committee will continue to review ESG measures to include in long-term structures to ensure such measures are appropriate for the business, are transparent and are measured robustly.
The Remuneration Committee’s terms of reference can be found online at: www.inchcape.com. Following a review of the terms of reference during the year, no changes were made.
HOW THE POLICY WILL BE APPLIED IN 2022
SALARY
• From 1 April 2022, the CEO will receive a salary of £827,483 and the CFO will receive a salary of £536,682.
• The average UK salary increase was 3.5%.
SHARE PLANS
• The CEO and CFO will receive a PSP award of 180% of salary.
• The CEO and CFO will be invited to participate in the 2022 SAYE scheme.
• The CEO and CFO received a bonus of 147% and 150% of salary respectively, in line with policy, 47% of salary for the CEO and 50% of salary for the CFO will automatically be invested in the co-investment plan and be eligible for a 2:1 match (subject to performance).
.
PENSION CONTRIBUTION
• Executive Directors will receive a pension contribution of 10% of salary which is in line with the UK workforce average.
ANNUAL BONUS
• 80% of the 2022 bonus will be based on a financial performance matrix of revenue and profit before tax with the remaining 20% of the bonus based on strategic objectives.
LTIP PERFORMANCE TARGETS
• The performance measures for PSP and CIP will continue to be based on EPS (40%), ROCE (40%) and cash conversion (20%).
• The ranges reflect current performance expectations over the next three years.
PAY SCENARIOS AND OUT-TURN FOR 2021
INCHCAPE ANNUAL REPORT AND ACCOUNTS 2021 87
STRA
TEGIC
REPO
RTFIN
AN
CIA
L STATEM
ENTS
GO
VER
NA
NC
E
PART 1 —
DIRECTORS’ REMUNERATION POLICYThis section of the report sets out a summary of the policy that was approved by shareholders at the Annual General Meeting held on 21 May 2020. The full policy can be found in last year’s annual report or at www.inchcape.com
ALIGNMENT OF THE REMUNERATION POLICY
This section outlines how clarity, simplicity, risk, predictability, proportionality and alignment to culture were addressed when reviewing the current remuneration policy and its implementation as required under provision 40 of the UK Corporate Governance Code.
• The Committee believes that the disclosure of the remuneration arrangements is transparent with clear rationale provided on implementation and changes to policy. The Committee remains committed to consulting with shareholders and other key stakeholders on the policy and its application.
• The Committee believes the performance measures used in the long-term incentive plans, along with those in the bonus, also aid simplicity due to the clear alignment to Inchcape’s strategy, and are familiar to all stakeholders.
• The Committee has ensured that remuneration arrangements do not encourage and reward excessive risk taking by setting targets to be stretching yet realistic, with discretion to adjust formulaic bonus and PSP outcomes and expanding the circumstances in which malus and clawback can be applied.
• The link to strategy of the performance measures used and the setting of targets balances predictability and proportionality by ensuring outcomes do not reward poor performance in the short and long-term. The policy is consistent with Inchcape’s culture as well as strategy, therefore driving behaviours which promote the long-term success of Inchcape.
SUMMARY OF THE REMUNERATION POLICY FOR EXECUTIVE DIRECTORS
Element Objective and link to strategy Opportunity
Base salary To pay a competitive salary which attracts, retains and motivates talent to make decisions which drive the Company’s strategy and create value for stakeholders.
Increases are not expected to exceed the average increase for senior management, unless a change in scope or complexity of role applies.
Annual bonus To motivate and reward for the achievement of the Company’s strategic annual objectives.
150% of salary maximum payable for achieving stretch performance against all measures.
75% of salary payable for target performance.
15% of salary payable for entry level performance.
Performance Share Plan (PSP)
To provide a meaningful reward to senior executives linked to the long-term success of the business.
The use of performance shares enables the delivery of median pay for median performance and upper quartile pay for upper quartile performance.
Normal PSP opportunities will be 180% of salary.
Award levels are subject to an individual limit of 300% of salary.
Threshold level performance will result in 25% vesting of the PSP award.
Co-Investment Plan (CIP)
To encourage executive share ownership and reinforce long-term success.
Executive Directors may invest up to an overall maximum of 50% of salary. Maximum match of 2:1, threshold of 0.5:1.
Maximum matching award is therefore 100% of salary in any year, and threshold matching award is 25% of salary.
Save As You Earn (SAYE)
To encourage share ownership Participation limits are those set by the UK tax authorities from time to time.
Pension To provide market competitive pension benefits where it is cost-effective and tax-efficient to do so.
Executive Directors are entitled to a cash supplement of up to 10% of salary.
Other benefits To provide market competitive benefits where it is cost-effective and tax-efficient to do so.
It is not anticipated that the costs of benefits provided will materially exceed 5% of salary for existing Executive Directors.
The Committee retains the discretion to approve a higher cost in exceptional circumstances (e.g. relocation).
In-post shareholding guidelines
To encourage share ownership and alignment of executive interest with those of shareholders.
Executive Directors are required to hold a fixed number of shares equivalent to 200% of base salary. They have five years from the date of appointment to reach this shareholding.
Post-exit shareholding guidelines
To reinforce long-term alignment of executive interests with those of shareholders post-termination.
A departing Executive Director is required to maintain a shareholding for two years post-termination, set at the lower of the actual shareholding on exit and the in-post shareholding guideline.
CORPORATE GOVERNANCE REPORT CONTINUED
88 INCHCAPE ANNUAL REPORT AND ACCOUNTS 2021
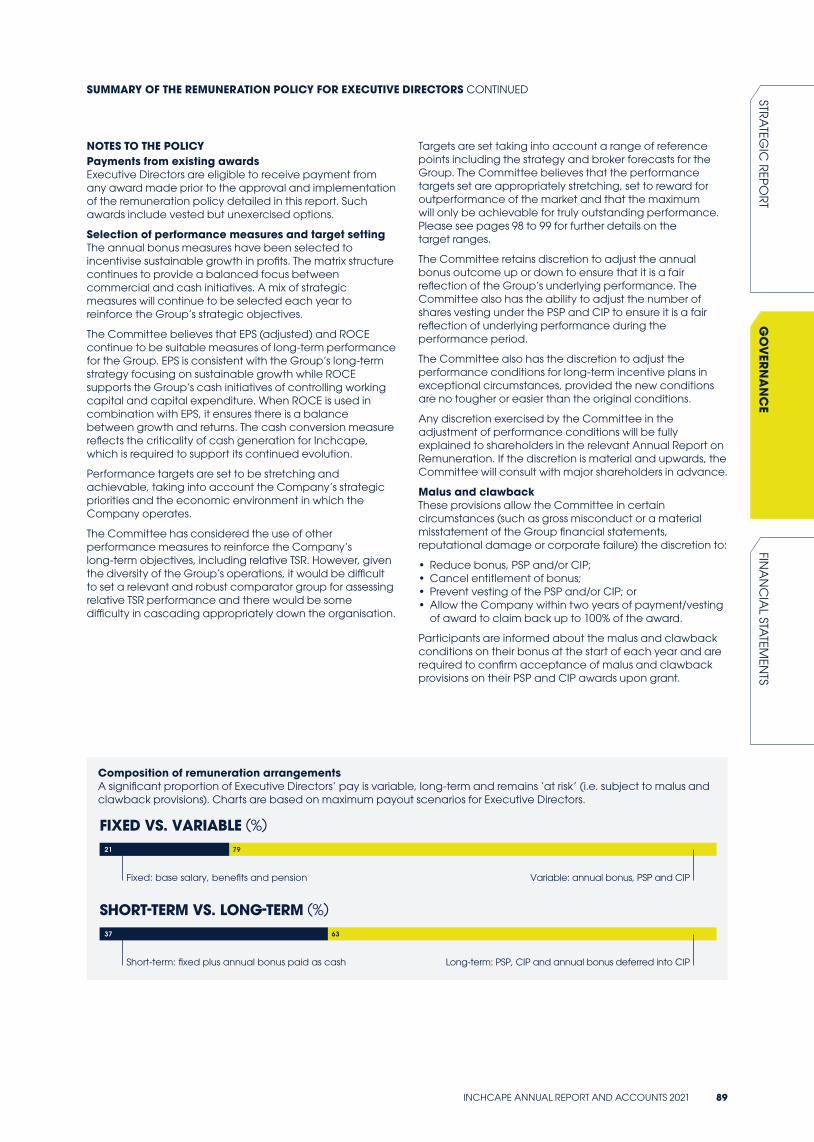
SUMMARY OF THE REMUNERATION POLICY FOR EXECUTIVE DIRECTORS CONTINUED
NOTES TO THE POLICYPayments from existing awardsExecutive Directors are eligible to receive payment from any award made prior to the approval and implementation of the remuneration policy detailed in this report. Such awards include vested but unexercised options.
Selection of performance measures and target settingThe annual bonus measures have been selected to incentivise sustainable growth in profits. The matrix structure continues to provide a balanced focus between commercial and cash initiatives. A mix of strategic measures will continue to be selected each year to reinforce the Group’s strategic objectives.
The Committee believes that EPS (adjusted) and ROCE continue to be suitable measures of long-term performance for the Group. EPS is consistent with the Group’s long-term strategy focusing on sustainable growth while ROCE supports the Group’s cash initiatives of controlling working capital and capital expenditure. When ROCE is used in combination with EPS, it ensures there is a balance between growth and returns. The cash conversion measure reflects the criticality of cash generation for Inchcape, which is required to support its continued evolution.
Performance targets are set to be stretching and achievable, taking into account the Company’s strategic priorities and the economic environment in which the Company operates.
The Committee has considered the use of other performance measures to reinforce the Company’s long-term objectives, including relative TSR. However, given the diversity of the Group’s operations, it would be difficult to set a relevant and robust comparator group for assessing relative TSR performance and there would be some difficulty in cascading appropriately down the organisation.
Targets are set taking into account a range of reference points including the strategy and broker forecasts for the Group. The Committee believes that the performance targets set are appropriately stretching, set to reward for outperformance of the market and that the maximum will only be achievable for truly outstanding performance. Please see pages 98 to 99 for further details on the target ranges.
The Committee retains discretion to adjust the annual bonus outcome up or down to ensure that it is a fair reflection of the Group’s underlying performance. The Committee also has the ability to adjust the number of shares vesting under the PSP and CIP to ensure it is a fair reflection of underlying performance during the performance period.
The Committee also has the discretion to adjust the performance conditions for long-term incentive plans in exceptional circumstances, provided the new conditions are no tougher or easier than the original conditions.
Any discretion exercised by the Committee in the adjustment of performance conditions will be fully explained to shareholders in the relevant Annual Report on Remuneration. If the discretion is material and upwards, the Committee will consult with major shareholders in advance.
Malus and clawbackThese provisions allow the Committee in certain circumstances (such as gross misconduct or a material misstatement of the Group financial statements, reputational damage or corporate failure) the discretion to:
• Reduce bonus, PSP and/or CIP;• Cancel entitlement of bonus;• Prevent vesting of the PSP and/or CIP; or• Allow the Company within two years of payment/vesting
of award to claim back up to 100% of the award.
Participants are informed about the malus and clawback conditions on their bonus at the start of each year and are required to confirm acceptance of malus and clawback provisions on their PSP and CIP awards upon grant.
Composition of remuneration arrangementsA significant proportion of Executive Directors’ pay is variable, long-term and remains ‘at risk’ (i.e. subject to malus and clawback provisions). Charts are based on maximum payout scenarios for Executive Directors.
FIXED VS. VARIABLE (%)
Fixed: base salary, benefits and pension Variable: annual bonus, PSP and CIP
7921
SHORT-TERM VS. LONG-TERM (%)
Short-term: fixed plus annual bonus paid as cash Long-term: PSP, CIP and annual bonus deferred into CIP
6337
INCHCAPE ANNUAL REPORT AND ACCOUNTS 2021 89
STRA
TEGIC
REPO
RTFIN
AN
CIA
L STATEM
ENTS
GO
VER
NA
NC
E
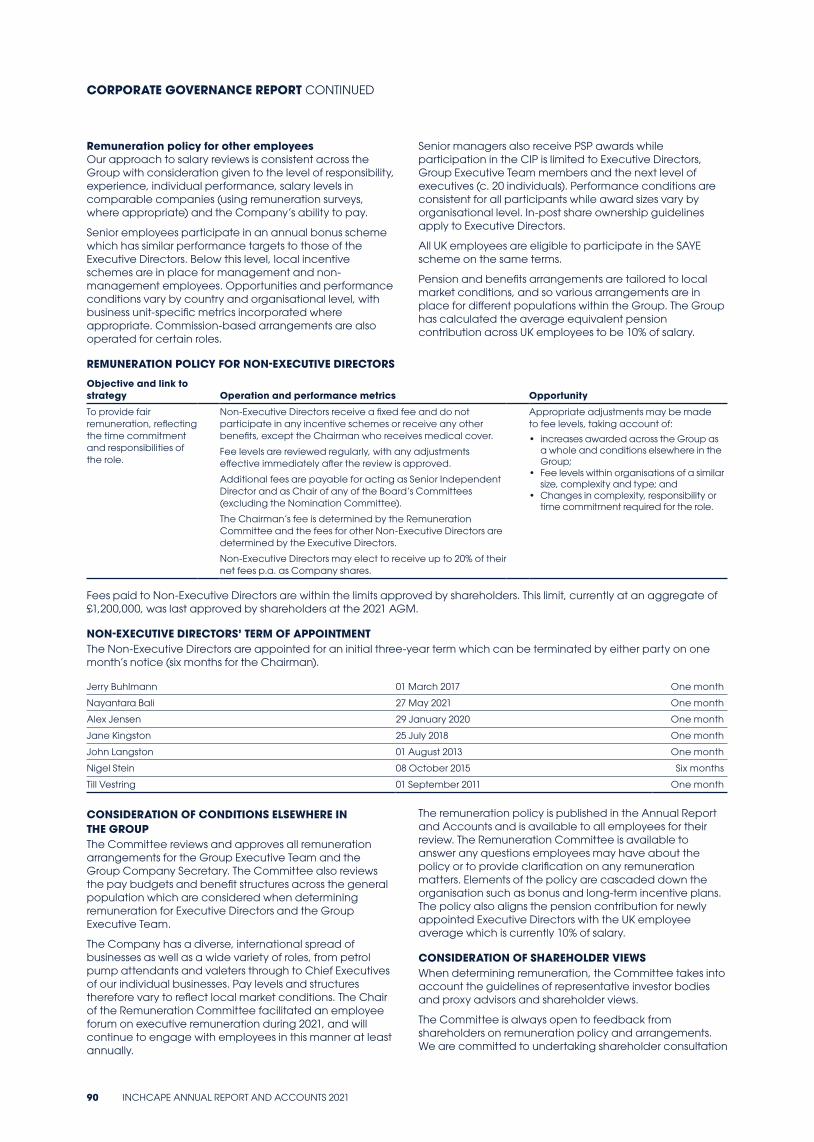
Remuneration policy for other employeesOur approach to salary reviews is consistent across the Group with consideration given to the level of responsibility, experience, individual performance, salary levels in comparable companies (using remuneration surveys, where appropriate) and the Company’s ability to pay.
Senior employees participate in an annual bonus scheme which has similar performance targets to those of the Executive Directors. Below this level, local incentive schemes are in place for management and non-management employees. Opportunities and performance conditions vary by country and organisational level, with business unit-specific metrics incorporated where appropriate. Commission-based arrangements are also operated for certain roles.
Senior managers also receive PSP awards while participation in the CIP is limited to Executive Directors, Group Executive Team members and the next level of executives (c. 20 individuals). Performance conditions are consistent for all participants while award sizes vary by organisational level. In-post share ownership guidelines apply to Executive Directors.
All UK employees are eligible to participate in the SAYE scheme on the same terms.
Pension and benefits arrangements are tailored to local market conditions, and so various arrangements are in place for different populations within the Group. The Group has calculated the average equivalent pension contribution across UK employees to be 10% of salary.
REMUNERATION POLICY FOR NON-EXECUTIVE DIRECTORS
Objective and link to strategy Operation and performance metrics Opportunity
To provide fair remuneration, reflecting the time commitment and responsibilities of the role.
Non-Executive Directors receive a fixed fee and do not participate in any incentive schemes or receive any other benefits, except the Chairman who receives medical cover.
Fee levels are reviewed regularly, with any adjustments effective immediately after the review is approved.
Additional fees are payable for acting as Senior Independent Director and as Chair of any of the Board’s Committees (excluding the Nomination Committee).
The Chairman’s fee is determined by the Remuneration Committee and the fees for other Non-Executive Directors are determined by the Executive Directors.
Non-Executive Directors may elect to receive up to 20% of their net fees p.a. as Company shares.
Appropriate adjustments may be made to fee levels, taking account of:
• increases awarded across the Group as a whole and conditions elsewhere in the Group;
• Fee levels within organisations of a similar size, complexity and type; and
• Changes in complexity, responsibility or time commitment required for the role.
Fees paid to Non-Executive Directors are within the limits approved by shareholders. This limit, currently at an aggregate of £1,200,000, was last approved by shareholders at the 2021 AGM.
NON-EXECUTIVE DIRECTORS’ TERM OF APPOINTMENTThe Non-Executive Directors are appointed for an initial three-year term which can be terminated by either party on one month’s notice (six months for the Chairman).
Jerry Buhlmann 01 March 2017 One month
Nayantara Bali 27 May 2021 One month
Alex Jensen 29 January 2020 One month
Jane Kingston 25 July 2018 One month
John Langston 01 August 2013 One month
Nigel Stein 08 October 2015 Six months
Till Vestring 01 September 2011 One month
CONSIDERATION OF CONDITIONS ELSEWHERE IN THE GROUPThe Committee reviews and approves all remuneration arrangements for the Group Executive Team and the Group Company Secretary. The Committee also reviews the pay budgets and benefit structures across the general population which are considered when determining remuneration for Executive Directors and the Group Executive Team.
The Company has a diverse, international spread of businesses as well as a wide variety of roles, from petrol pump attendants and valeters through to Chief Executives of our individual businesses. Pay levels and structures therefore vary to reflect local market conditions. The Chair of the Remuneration Committee facilitated an employee forum on executive remuneration during 2021, and will continue to engage with employees in this manner at least annually.
The remuneration policy is published in the Annual Report and Accounts and is available to all employees for their review. The Remuneration Committee is available to answer any questions employees may have about the policy or to provide clarification on any remuneration matters. Elements of the policy are cascaded down the organisation such as bonus and long-term incentive plans. The policy also aligns the pension contribution for newly appointed Executive Directors with the UK employee average which is currently 10% of salary.
CONSIDERATION OF SHAREHOLDER VIEWSWhen determining remuneration, the Committee takes into account the guidelines of representative investor bodies and proxy advisors and shareholder views.
The Committee is always open to feedback from shareholders on remuneration policy and arrangements. We are committed to undertaking shareholder consultation
CORPORATE GOVERNANCE REPORT CONTINUED
90 INCHCAPE ANNUAL REPORT AND ACCOUNTS 2021
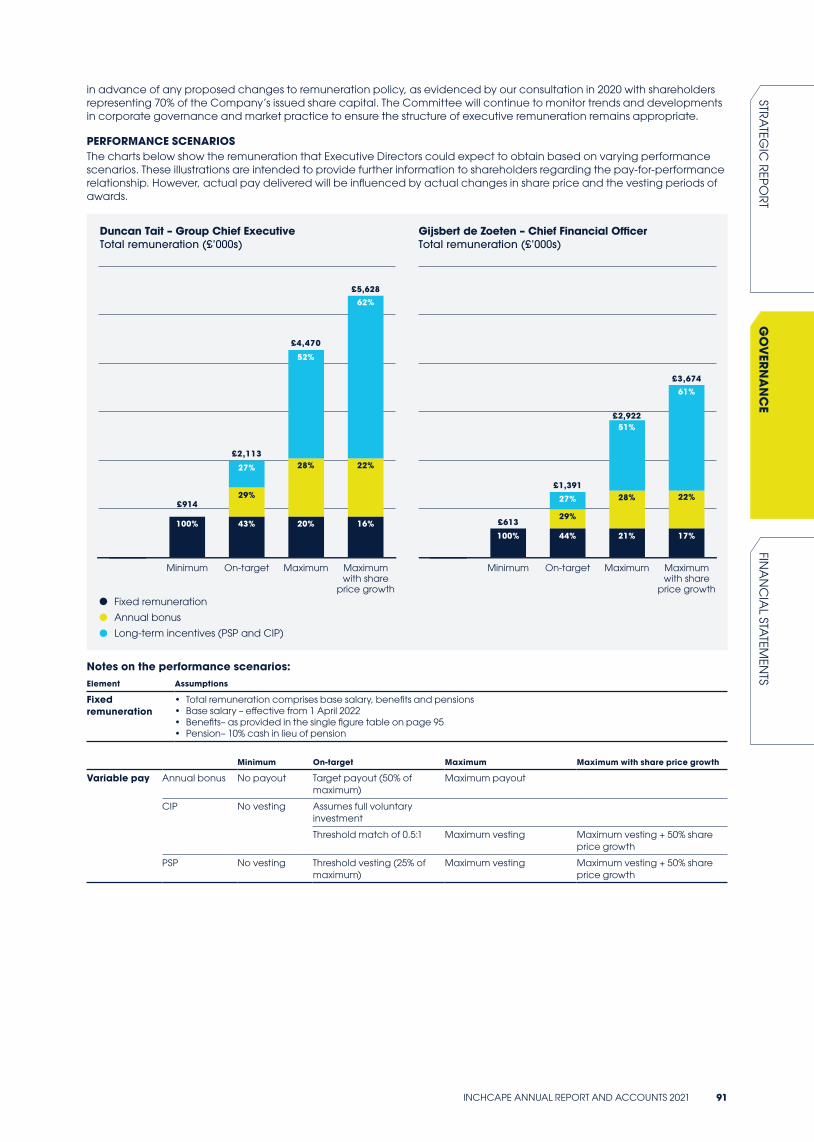
in advance of any proposed changes to remuneration policy, as evidenced by our consultation in 2020 with shareholders representing 70% of the Company’s issued share capital. The Committee will continue to monitor trends and developments in corporate governance and market practice to ensure the structure of executive remuneration remains appropriate.
PERFORMANCE SCENARIOSThe charts below show the remuneration that Executive Directors could expect to obtain based on varying performance scenarios. These illustrations are intended to provide further information to shareholders regarding the pay-for-performance relationship. However, actual pay delivered will be influenced by actual changes in share price and the vesting periods of awards.
Fixed remuneration
Annual bonus
Long-term incentives (PSP and CIP)
£4,470
£914
100% 43%
29%
27%
20%
28%
16%
22%
52%
62%
£2,113
£5,628
Gijsbert de Zoeten – Chief Financial O�cerTotal remuneration (£’000s)
Duncan Tait – Group Chief ExecutiveTotal remuneration (£’000s)
Minimum On-target Maximum Maximumwith share
price growth
£2,922
£613
100% 44%
29%
27%
21%
28%
17%
22%
51%
61%
£1,391
£3,674
Minimum On-target Maximum Maximumwith share
price growth
Notes on the performance scenarios:Element Assumptions
Fixed remuneration
• Total remuneration comprises base salary, benefits and pensions• Base salary – effective from 1 April 2022• Benefits– as provided in the single figure table on page 95• Pension– 10% cash in lieu of pension
Minimum On-target Maximum Maximum with share price growth
Variable pay Annual bonus No payout Target payout (50% of maximum)
Maximum payout
CIP No vesting Assumes full voluntary investment
Threshold match of 0.5:1 Maximum vesting Maximum vesting + 50% share price growth
PSP No vesting Threshold vesting (25% of maximum)
Maximum vesting Maximum vesting + 50% share price growth
INCHCAPE ANNUAL REPORT AND ACCOUNTS 2021 91
STRA
TEGIC
REPO
RTFIN
AN
CIA
L STATEM
ENTS
GO
VER
NA
NC
E
APPROACH TO RECRUITMENT REMUNERATIONExternal appointmentsWhen appointing a new Executive Director, the Committee may make use of any of the existing components of remuneration, as follows:
Component ApproachMaximum annual grant value
Base salary The base salaries of new appointees will be determined by reference to the scope of the role, experience of the individual, pay levels at organisations of a similar size, complexity and type, pay and conditions elsewhere in the Group, implications for total remuneration, internal relativities and the candidate’s current base salary.
n/a
Pension New appointees will be eligible to participate in the Group’s pension plan and receive a cash supplement on similar terms to Executive Directors appointed after 2019.
n/a
Benefits New appointees will be eligible to receive normal benefits available to senior management, including (but not limited to) company cars, medical care, life assurance and relocation allowance.
n/a
Annual bonus The annual bonus described in the policy table will apply to new appointees with the relevant maximum being pro-rated to reflect the proportion of employment over the year.
150% of salary
PSP New appointees will be granted awards on the same terms as other Executive Directors as described in the policy table.
300% of salary The combined maximum is not intended to exceed 400% of salary
CIP New appointees will be granted awards on the same terms as other Executive Directors as described in the policy table.
100% of salary
Other The Committee will consider on a case-by-case basis if all or some of the incentives forfeited on leaving a previous employer will be ‘bought-out’.
If the Committee decides to buy-out forfeited awards, the award will be structured on a comparable basis, taking into account any performance conditions attached, time to vesting and share price at the time of buy-out.
The Committee retains the discretion to make use of the relevant Listing Rule to facilitate such a buy-out.
n/a
NOTES TO RECRUITMENT REMUNERATION POLICYIn determining the appropriate remuneration for a new Executive Director, the Committee will take into consideration all relevant factors to ensure that arrangements are in the best interests of the Group and its shareholders.
INTERNAL APPOINTMENTSIn cases of internal promotions to the Board, the Committee will determine remuneration in line with the policy for external appointees as detailed above. Where an individual has contractual commitments made prior to their promotion to Executive Director level, the Company will continue to honour these arrangements. Incentive opportunities for employees below Board level are typically no higher than for Executive Directors.
NON-EXECUTIVE DIRECTORSIn recruiting a new Non-Executive Director, the Committee will use the policy as set out in the table on page 90. A base fee in line with the prevailing fee schedule would be payable for Board membership, with additional fees payable for acting as Senior Independent Director or as Chair of the Audit, Remuneration and CSR Committees as appropriate.
EXIT PAYMENT POLICY, SERVICE CONTRACTS AND CHANGE OF CONTROLThe Company’s policy is to limit severance payments on termination to pre-established contractual arrangements.
In addition, the Company retains discretion to settle any other amount reasonably due to the Executive Director, for example, to meet legal fees incurred by the Executive Director in connection with the termination of employment, where the Company wishes to enter into a settlement agreement and the individual must seek independent legal advice.
In the event that the employment of an Executive Director is terminated, any compensation payable will be determined in accordance with the terms of the service contract between the Company and the employee as well as the rules of any incentive plans. When considering exit payments, the Committee reviews all potential incentive outcomes to ensure they are fair to both shareholders and participants.
CORPORATE GOVERNANCE REPORT CONTINUED
92 INCHCAPE ANNUAL REPORT AND ACCOUNTS 2021
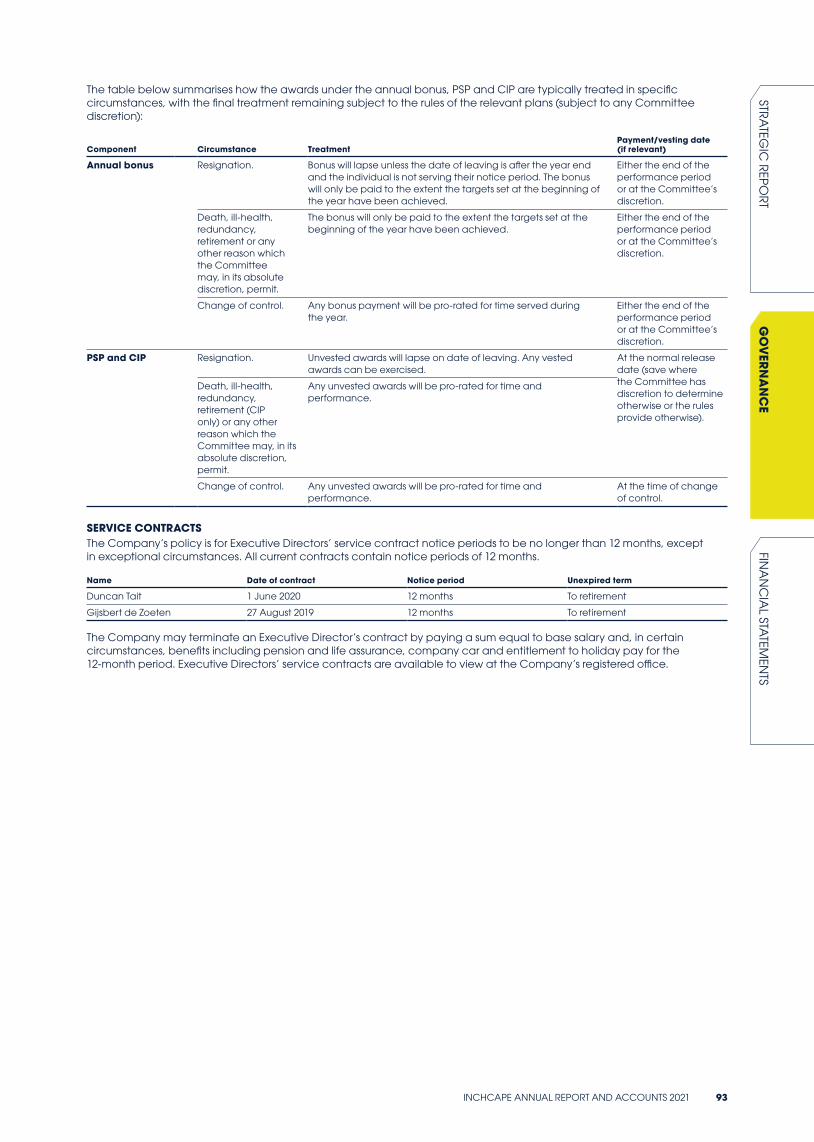
The table below summarises how the awards under the annual bonus, PSP and CIP are typically treated in specific circumstances, with the final treatment remaining subject to the rules of the relevant plans (subject to any Committee discretion):
Component Circumstance TreatmentPayment/vesting date (if relevant)
Annual bonus Resignation. Bonus will lapse unless the date of leaving is after the year end and the individual is not serving their notice period. The bonus will only be paid to the extent the targets set at the beginning of the year have been achieved.
Either the end of the performance period or at the Committee’s discretion.
Death, ill-health, redundancy, retirement or any other reason which the Committee may, in its absolute discretion, permit.
The bonus will only be paid to the extent the targets set at the beginning of the year have been achieved.
Either the end of the performance period or at the Committee’s discretion.
Change of control. Any bonus payment will be pro-rated for time served during the year.
Either the end of the performance period or at the Committee’s discretion.
PSP and CIP Resignation. Unvested awards will lapse on date of leaving. Any vested awards can be exercised.
At the normal release date (save where the Committee has discretion to determine otherwise or the rules provide otherwise).
Death, ill-health, redundancy, retirement (CIP only) or any other reason which the Committee may, in its absolute discretion, permit.
Any unvested awards will be pro-rated for time and performance.
Change of control. Any unvested awards will be pro-rated for time and performance.
At the time of change of control.
SERVICE CONTRACTSThe Company’s policy is for Executive Directors’ service contract notice periods to be no longer than 12 months, except in exceptional circumstances. All current contracts contain notice periods of 12 months.
Name Date of contract Notice period Unexpired term
Duncan Tait 1 June 2020 12 months To retirement
Gijsbert de Zoeten 27 August 2019 12 months To retirement
The Company may terminate an Executive Director’s contract by paying a sum equal to base salary and, in certain circumstances, benefits including pension and life assurance, company car and entitlement to holiday pay for the 12-month period. Executive Directors’ service contracts are available to view at the Company’s registered office.
INCHCAPE ANNUAL REPORT AND ACCOUNTS 2021 93
STRA
TEGIC
REPO
RTFIN
AN
CIA
L STATEM
ENTS
GO
VER
NA
NC
E
PART 2 —
ANNUAL REPORT ON REMUNERATIONThe following section provides details of how the Company’s remuneration policy was implemented during the financial year to 31 December 2021 and how it will be implemented in the financial year to 31 December 2022.
THE PRINCIPAL DECISIONS MADE BY THE COMMITTEE:
LONG-TERM INCENTIVE TARGETS The impact of Covid-19 on the Group’s performance continued into 2021, creating unprecedented levels of uncertainty and volatility of outcomes. The difficulty in forecasting how the measures would perform created a risk that predictions may lead to outcomes which do not fairly represent underlying business performance over the period. When considering whether the proposed targets were challenging enough, the Committee spent time discussing internal forecasts, and investor expectations, the stakeholder experience, and stress-testing specific scenarios. The Committee made the decision to delay setting the targets for the PSP and CIP to May 2021, to ensure that the latest and most accurate information around external market dynamics was used.
The Committee approved the following performance measures for the PSP and CIP awards granted in 2021:
• The relative weighting on EPS, ROCE and FCFC remained unchanged at 40:40:20 respectively;• EPS targets were set as a pence range of 133p to 150p;• ROCE targets were increased from 16.5% to 20.5%, to 19% to 23%;• The FCFC range remained at 55% to 70%; and• Grant sizes remained as per the approved Remuneration Policy.
Please see page 98 for details of the performance target outcomes for the awards granted in 2019, and page 99 for the performance targets for the 2022 long-term incentive awards.
2021 BONUSThe Committee considered the possibility of intermittent lockdowns, the roll-out of the vaccine in each market, and the potential of new strains of the virus impacting the Group’s ability to conduct business in 2021. As such, the potential Covid-19 impact was included in the AOP figures agreed by the Board which was reflected in the performance volatility in the threshold and maximum levels used for the 2021 Bonus Plan. The Committee agreed that the bonus matrix be amended for 2021 to broaden the ranges around Plan to +/- 7.5% on Revenue and +/- 15% on PBT, with the broader range reflecting the differing scenarios which could present over the financial year.
Please see page 96 for details of the performance achieved in 2021 and the resulting bonus outcomes.
EXECUTIVE DIRECTOR’S REMUNERATION 2021 salary review As disclosed in last year’s Annual Report and Accounts, Duncan Tait received a salary increase of 2.5% and Gijsbert de Zoeten received a salary increase of 3.8% with effect from 1 April 2021. The increase for Gijsbert de Zoeten was above the average workforce increase as the Committee agreed that this was appropriate to reflect the significant additional responsibilities the CFO has in his role and also his performance and contribution to the business to date.
2022 salary review The Committee approved a salary increase of 3.5% for each of the Executive Directors. This is in line with the average UK workforce increase.
GROUP EXECUTIVE REMUNERATIONThe Committee reviewed, and approved, the remuneration packages for members of the Group Executive Team taking into account pay for employees across the Group and in the relevant regional markets.
WIDER WORKFORCE REMUNERATION The Committee considered the reward landscape for the wider workforce including total bonus outcomes for all senior management, the achievement of regional financial targets, and the distribution of performance outcomes for personal objectives.
CORPORATE GOVERNANCE REPORT CONTINUED
94 INCHCAPE ANNUAL REPORT AND ACCOUNTS 2021
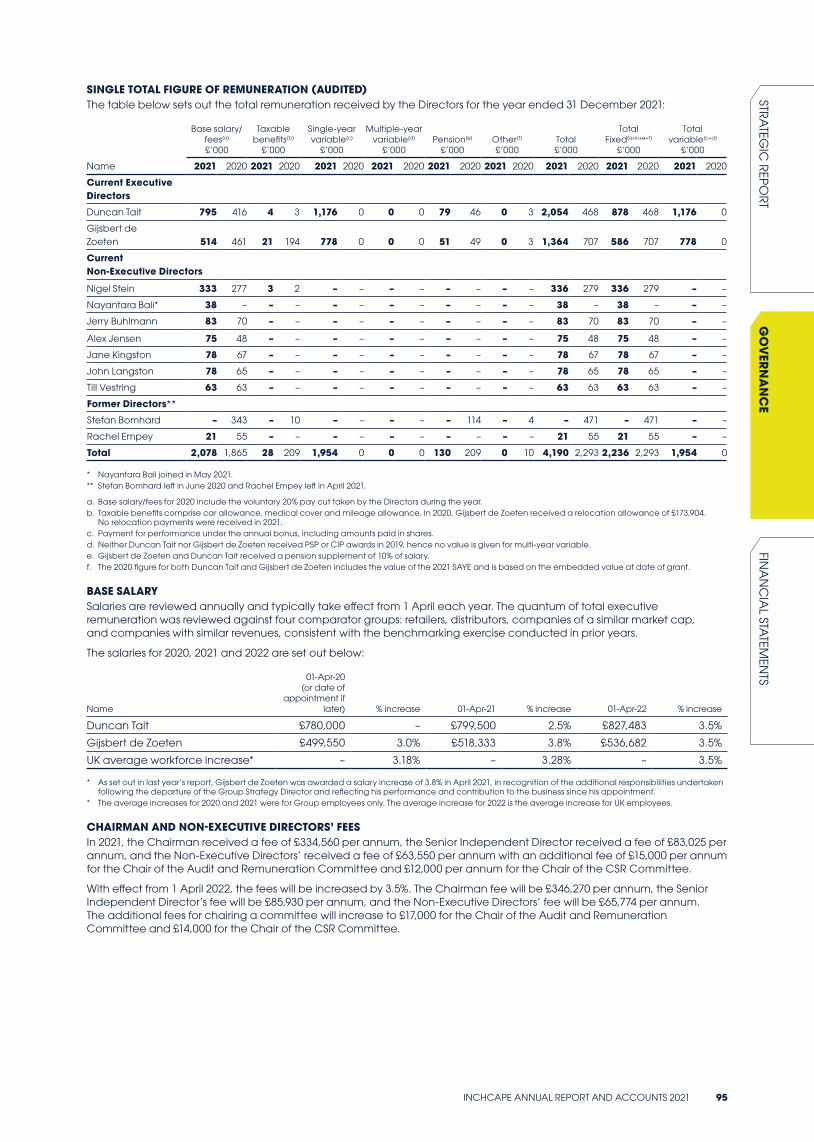
SINGLE TOTAL FIGURE OF REMUNERATION (AUDITED)The table below sets out the total remuneration received by the Directors for the year ended 31 December 2021:
Base salary/fees(a) £’000
Taxable benefits(b)
£’000
Single-year variable(c)
£’000
Multiple-year variable(d)
£’000Pension(e)
£’000Other(f) £’000
Total £’000
Total Fixed(a+b+e+f)
£’000
Total variable(c+d)
£’000
Name 2021 2020 2021 2020 2021 2020 2021 2020 2021 2020 2021 2020 2021 2020 2021 2020 2021 2020
Current Executive Directors
Duncan Tait 795 416 4 3 1,176 0 0 0 79 46 0 3 2,054 468 878 468 1,176 0
Gijsbert de Zoeten 514 461 21 194 778 0 0 0 51 49 0 3 1,364 707 586 707 778 0
Current Non-Executive Directors
Nigel Stein 333 277 3 2 – – – – – – – – 336 279 336 279 – –
Nayantara Bali* 38 – – – – – – – – – – – 38 – 38 – – –
Jerry Buhlmann 83 70 – – – – – – – – – – 83 70 83 70 – –
Alex Jensen 75 48 – – – – – – – – – – 75 48 75 48 – –
Jane Kingston 78 67 – – – – – – – – – – 78 67 78 67 – –
John Langston 78 65 – – – – – – – – – – 78 65 78 65 – –
Till Vestring 63 63 – – – – – – – – – – 63 63 63 63 – –
Former Directors**
Stefan Bomhard – 343 – 10 – – – – – 114 – 4 – 471 – 471 – –
Rachel Empey 21 55 – – – – – – – – – – 21 55 21 55 – –
Total 2,078 1,865 28 209 1,954 0 0 0 130 209 0 10 4,190 2,293 2,236 2,293 1,954 0
* Nayantara Bali joined in May 2021.** Stefan Bomhard left in June 2020 and Rachel Empey left in April 2021.
a. Base salary/fees for 2020 include the voluntary 20% pay cut taken by the Directors during the year.b. Taxable benefits comprise car allowance, medical cover and mileage allowance. In 2020, Gijsbert de Zoeten received a relocation allowance of £173,904.
No relocation payments were received in 2021.c. Payment for performance under the annual bonus, including amounts paid in shares.d. Neither Duncan Tait nor Gijsbert de Zoeten received PSP or CIP awards in 2019, hence no value is given for multi-year variable. e. Gijsbert de Zoeten and Duncan Tait received a pension supplement of 10% of salary.f. The 2020 figure for both Duncan Tait and Gijsbert de Zoeten includes the value of the 2021 SAYE and is based on the embedded value at date of grant.
BASE SALARYSalaries are reviewed annually and typically take effect from 1 April each year. The quantum of total executive remuneration was reviewed against four comparator groups: retailers, distributors, companies of a similar market cap, and companies with similar revenues, consistent with the benchmarking exercise conducted in prior years.
The salaries for 2020, 2021 and 2022 are set out below:
Name
01-Apr-20 (or date of
appointment if later) % increase 01-Apr-21 % increase 01-Apr-22 % increase
Duncan Tait £780,000 – £799,500 2.5% £827,483 3.5%
Gijsbert de Zoeten £499,550 3.0% £518,333 3.8% £536,682 3.5%
UK average workforce increase* – 3.18% – 3.28% – 3.5%
* As set out in last year’s report, Gijsbert de Zoeten was awarded a salary increase of 3.8% in April 2021, in recognition of the additional responsibilities undertaken following the departure of the Group Strategy Director and reflecting his performance and contribution to the business since his appointment.
* The average increases for 2020 and 2021 were for Group employees only. The average increase for 2022 is the average increase for UK employees.
CHAIRMAN AND NON-EXECUTIVE DIRECTORS’ FEESIn 2021, the Chairman received a fee of £334,560 per annum, the Senior Independent Director received a fee of £83,025 per annum, and the Non-Executive Directors’ received a fee of £63,550 per annum with an additional fee of £15,000 per annum for the Chair of the Audit and Remuneration Committee and £12,000 per annum for the Chair of the CSR Committee.
With effect from 1 April 2022, the fees will be increased by 3.5%. The Chairman fee will be £346,270 per annum, the Senior Independent Director’s fee will be £85,930 per annum, and the Non-Executive Directors’ fee will be £65,774 per annum. The additional fees for chairing a committee will increase to £17,000 for the Chair of the Audit and Remuneration Committee and £14,000 for the Chair of the CSR Committee.
INCHCAPE ANNUAL REPORT AND ACCOUNTS 2021 95
STRA
TEGIC
REPO
RTFIN
AN
CIA
L STATEM
ENTS
GO
VER
NA
NC
E
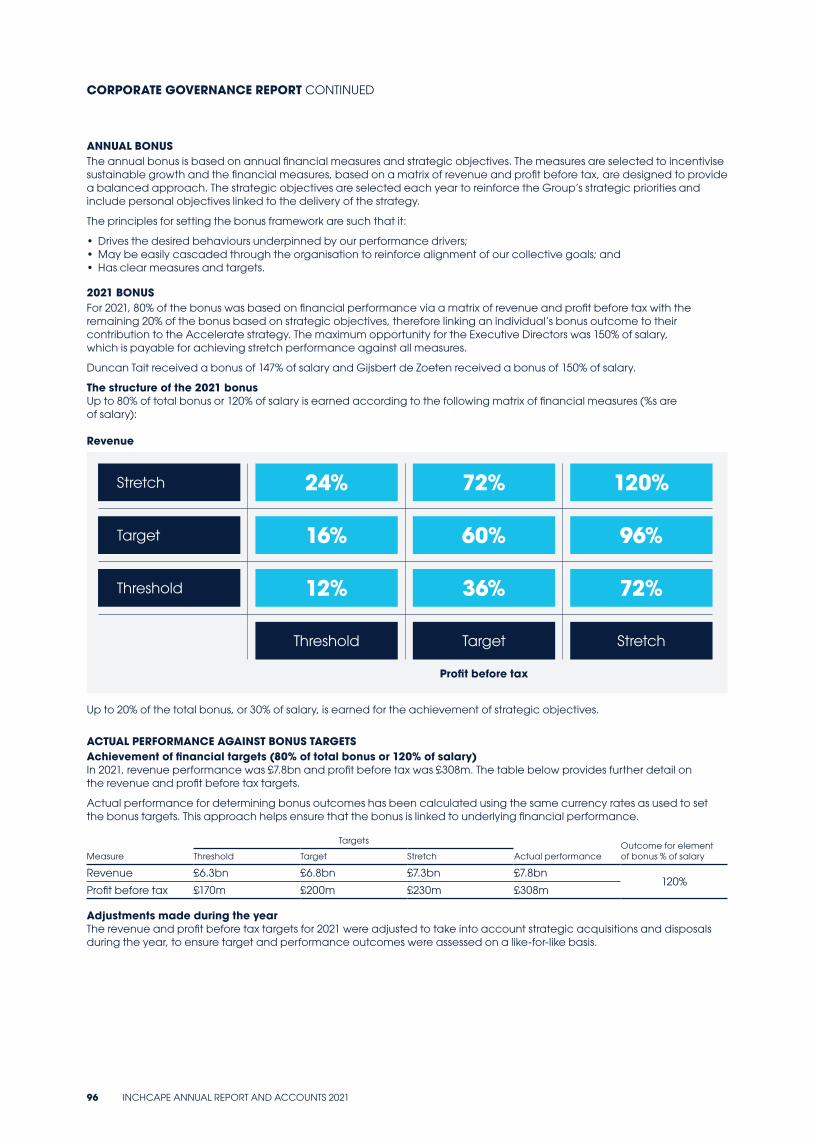
ANNUAL BONUSThe annual bonus is based on annual financial measures and strategic objectives. The measures are selected to incentivise sustainable growth and the financial measures, based on a matrix of revenue and profit before tax, are designed to provide a balanced approach. The strategic objectives are selected each year to reinforce the Group’s strategic priorities and include personal objectives linked to the delivery of the strategy.
The principles for setting the bonus framework are such that it:
• Drives the desired behaviours underpinned by our performance drivers;• May be easily cascaded through the organisation to reinforce alignment of our collective goals; and• Has clear measures and targets.
2021 BONUSFor 2021, 80% of the bonus was based on financial performance via a matrix of revenue and profit before tax with the remaining 20% of the bonus based on strategic objectives, therefore linking an individual’s bonus outcome to their contribution to the Accelerate strategy. The maximum opportunity for the Executive Directors was 150% of salary, which is payable for achieving stretch performance against all measures.
Duncan Tait received a bonus of 147% of salary and Gijsbert de Zoeten received a bonus of 150% of salary.
The structure of the 2021 bonusUp to 80% of total bonus or 120% of salary is earned according to the following matrix of financial measures (%s are of salary):
Revenue
Stretch 24% 72% 120%
Target 16% 60% 96%
Threshold 12% 36% 72%
Threshold Target Stretch
Profit before tax
Up to 20% of the total bonus, or 30% of salary, is earned for the achievement of strategic objectives.
ACTUAL PERFORMANCE AGAINST BONUS TARGETSAchievement of financial targets (80% of total bonus or 120% of salary)In 2021, revenue performance was £7.8bn and profit before tax was £308m. The table below provides further detail on the revenue and profit before tax targets.
Actual performance for determining bonus outcomes has been calculated using the same currency rates as used to set the bonus targets. This approach helps ensure that the bonus is linked to underlying financial performance.
Measure
Targets
Actual performanceOutcome for element of bonus % of salaryThreshold Target Stretch
Revenue £6.3bn £6.8bn £7.3bn £7.8bn120%
Profit before tax £170m £200m £230m £308m
Adjustments made during the yearThe revenue and profit before tax targets for 2021 were adjusted to take into account strategic acquisitions and disposals during the year, to ensure target and performance outcomes were assessed on a like-for-like basis.
CORPORATE GOVERNANCE REPORT CONTINUED
96 INCHCAPE ANNUAL REPORT AND ACCOUNTS 2021
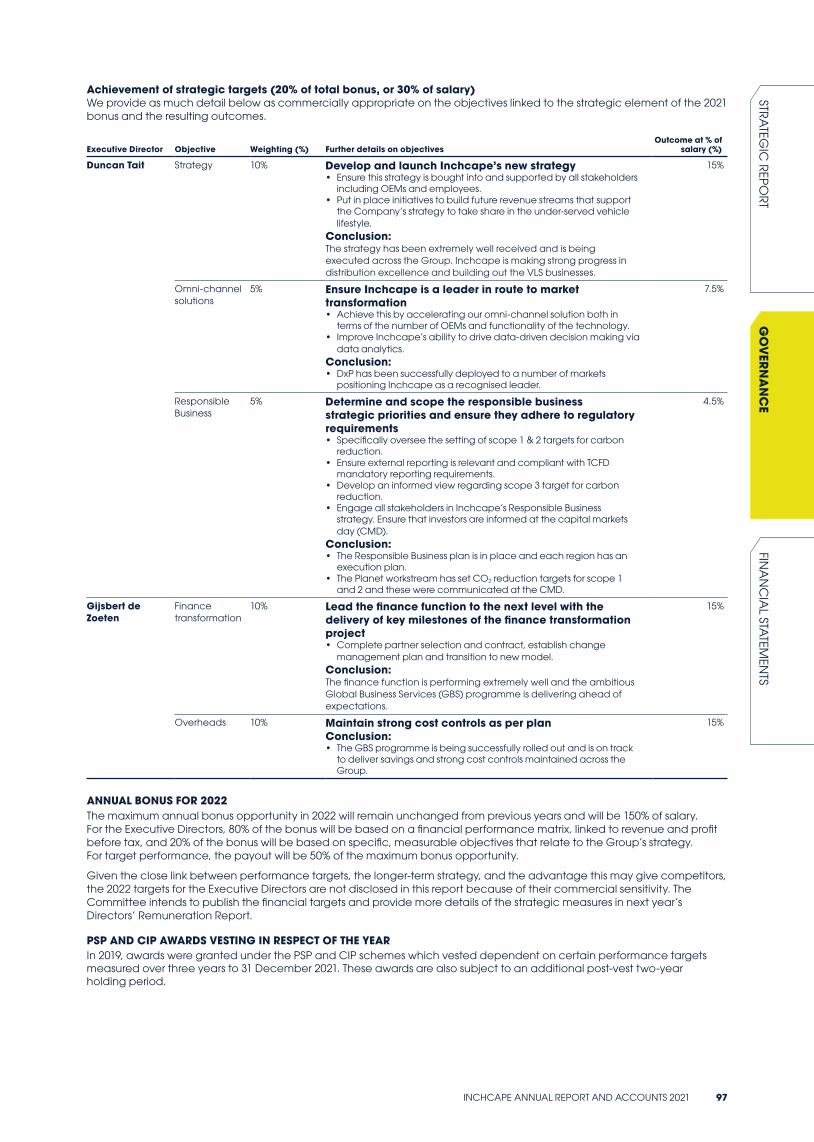
Achievement of strategic targets (20% of total bonus, or 30% of salary)We provide as much detail below as commercially appropriate on the objectives linked to the strategic element of the 2021 bonus and the resulting outcomes.
Executive Director Objective Weighting (%) Further details on objectives Outcome at % of
salary (%)
Duncan Tait Strategy 10% Develop and launch Inchcape’s new strategy• Ensure this strategy is bought into and supported by all stakeholders
including OEMs and employees.• Put in place initiatives to build future revenue streams that support
the Company’s strategy to take share in the under-served vehicle lifestyle.
Conclusion: The strategy has been extremely well received and is being executed across the Group. Inchcape is making strong progress in distribution excellence and building out the VLS businesses.
15%
Omni-channel solutions
5% Ensure Inchcape is a leader in route to market transformation• Achieve this by accelerating our omni-channel solution both in
terms of the number of OEMs and functionality of the technology.• Improve Inchcape’s ability to drive data-driven decision making via
data analytics.Conclusion: • DxP has been successfully deployed to a number of markets
positioning Inchcape as a recognised leader.
7.5%
Responsible Business
5% Determine and scope the responsible business strategic priorities and ensure they adhere to regulatory requirements• Specifically oversee the setting of scope 1 & 2 targets for carbon
reduction. • Ensure external reporting is relevant and compliant with TCFD
mandatory reporting requirements. • Develop an informed view regarding scope 3 target for carbon
reduction. • Engage all stakeholders in Inchcape’s Responsible Business
strategy. Ensure that investors are informed at the capital markets day (CMD).
Conclusion: • The Responsible Business plan is in place and each region has an
execution plan. • The Planet workstream has set CO2 reduction targets for scope 1
and 2 and these were communicated at the CMD.
4.5%
Gijsbert de Zoeten
Finance transformation
10% Lead the finance function to the next level with the delivery of key milestones of the finance transformation project• Complete partner selection and contract, establish change
management plan and transition to new model.Conclusion: The finance function is performing extremely well and the ambitious Global Business Services (GBS) programme is delivering ahead of expectations.
15%
Overheads 10% Maintain strong cost controls as per planConclusion: • The GBS programme is being successfully rolled out and is on track
to deliver savings and strong cost controls maintained across the Group.
15%
ANNUAL BONUS FOR 2022The maximum annual bonus opportunity in 2022 will remain unchanged from previous years and will be 150% of salary. For the Executive Directors, 80% of the bonus will be based on a financial performance matrix, linked to revenue and profit before tax, and 20% of the bonus will be based on specific, measurable objectives that relate to the Group’s strategy. For target performance, the payout will be 50% of the maximum bonus opportunity.
Given the close link between performance targets, the longer-term strategy, and the advantage this may give competitors, the 2022 targets for the Executive Directors are not disclosed in this report because of their commercial sensitivity. The Committee intends to publish the financial targets and provide more details of the strategic measures in next year’s Directors’ Remuneration Report.
PSP AND CIP AWARDS VESTING IN RESPECT OF THE YEARIn 2019, awards were granted under the PSP and CIP schemes which vested dependent on certain performance targets measured over three years to 31 December 2021. These awards are also subject to an additional post-vest two-year holding period.
INCHCAPE ANNUAL REPORT AND ACCOUNTS 2021 97
STRA
TEGIC
REPO
RTFIN
AN
CIA
L STATEM
ENTS
GO
VER
NA
NC
E
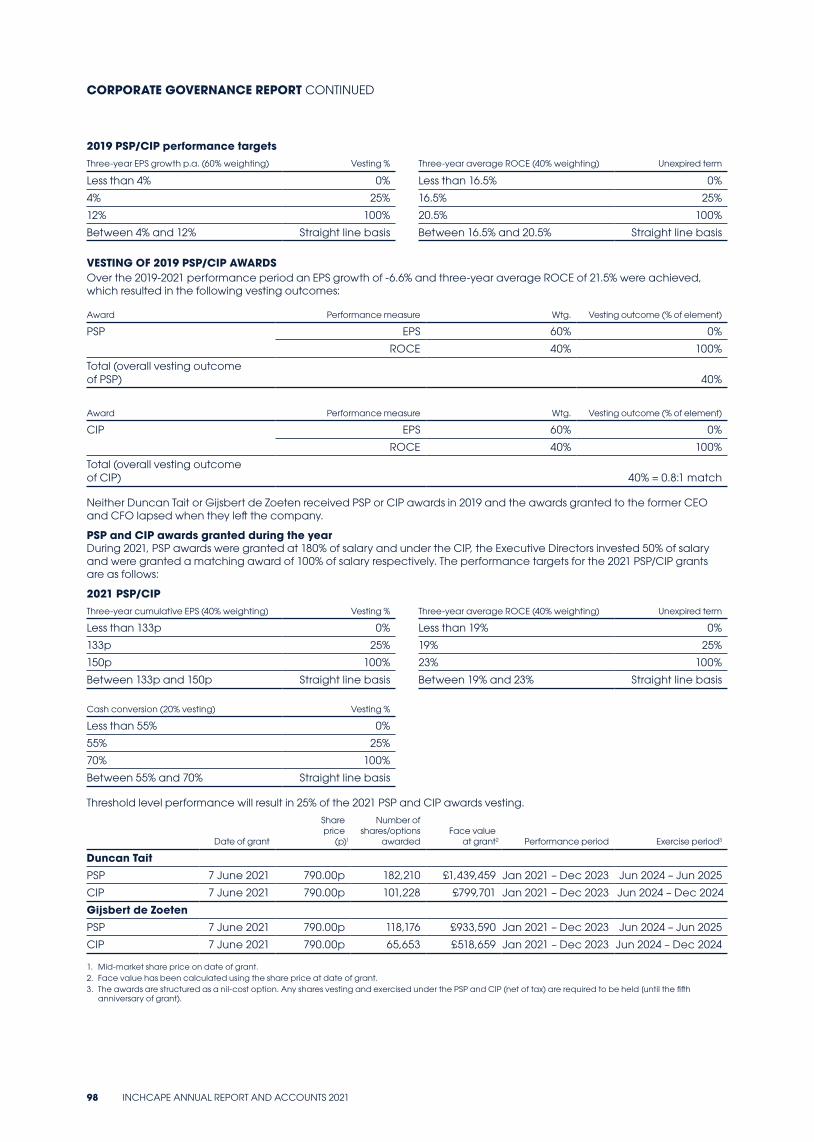
2019 PSP/CIP performance targetsThree-year EPS growth p.a. (60% weighting) Vesting % Three-year average ROCE (40% weighting) Unexpired term
Less than 4% 0% Less than 16.5% 0%
4% 25% 16.5% 25%
12% 100% 20.5% 100%
Between 4% and 12% Straight line basis Between 16.5% and 20.5% Straight line basis
VESTING OF 2019 PSP/CIP AWARDSOver the 2019-2021 performance period an EPS growth of -6.6% and three-year average ROCE of 21.5% were achieved, which resulted in the following vesting outcomes:
Award Performance measure Wtg. Vesting outcome (% of element)
PSP EPS 60% 0%
ROCE 40% 100%
Total (overall vesting outcome of PSP) 40%
Award Performance measure Wtg. Vesting outcome (% of element)
CIP EPS 60% 0%
ROCE 40% 100%
Total (overall vesting outcome of CIP) 40% = 0.8:1 match
Neither Duncan Tait or Gijsbert de Zoeten received PSP or CIP awards in 2019 and the awards granted to the former CEO and CFO lapsed when they left the company.
PSP and CIP awards granted during the yearDuring 2021, PSP awards were granted at 180% of salary and under the CIP, the Executive Directors invested 50% of salary and were granted a matching award of 100% of salary respectively. The performance targets for the 2021 PSP/CIP grants are as follows:
2021 PSP/CIPThree-year cumulative EPS (40% weighting) Vesting % Three-year average ROCE (40% weighting) Unexpired term
Less than 133p 0% Less than 19% 0%
133p 25% 19% 25%
150p 100% 23% 100%
Between 133p and 150p Straight line basis Between 19% and 23% Straight line basis
Cash conversion (20% vesting) Vesting %
Less than 55% 0%
55% 25%
70% 100%
Between 55% and 70% Straight line basis
Threshold level performance will result in 25% of the 2021 PSP and CIP awards vesting.
Date of grant
Share price
(p)1
Number of shares/options
awardedFace value
at grant2 Performance period Exercise period3
Duncan TaitPSP 7 June 2021 790.00p 182,210 £1,439,459 Jan 2021 – Dec 2023 Jun 2024 – Jun 2025
CIP 7 June 2021 790.00p 101,228 £799,701 Jan 2021 – Dec 2023 Jun 2024 – Dec 2024
Gijsbert de ZoetenPSP 7 June 2021 790.00p 118,176 £933,590 Jan 2021 – Dec 2023 Jun 2024 – Jun 2025
CIP 7 June 2021 790.00p 65,653 £518,659 Jan 2021 – Dec 2023 Jun 2024 – Dec 2024
1. Mid-market share price on date of grant. 2. Face value has been calculated using the share price at date of grant.3. The awards are structured as a nil-cost option. Any shares vesting and exercised under the PSP and CIP (net of tax) are required to be held [until the fifth
anniversary of grant).
CORPORATE GOVERNANCE REPORT CONTINUED
98 INCHCAPE ANNUAL REPORT AND ACCOUNTS 2021
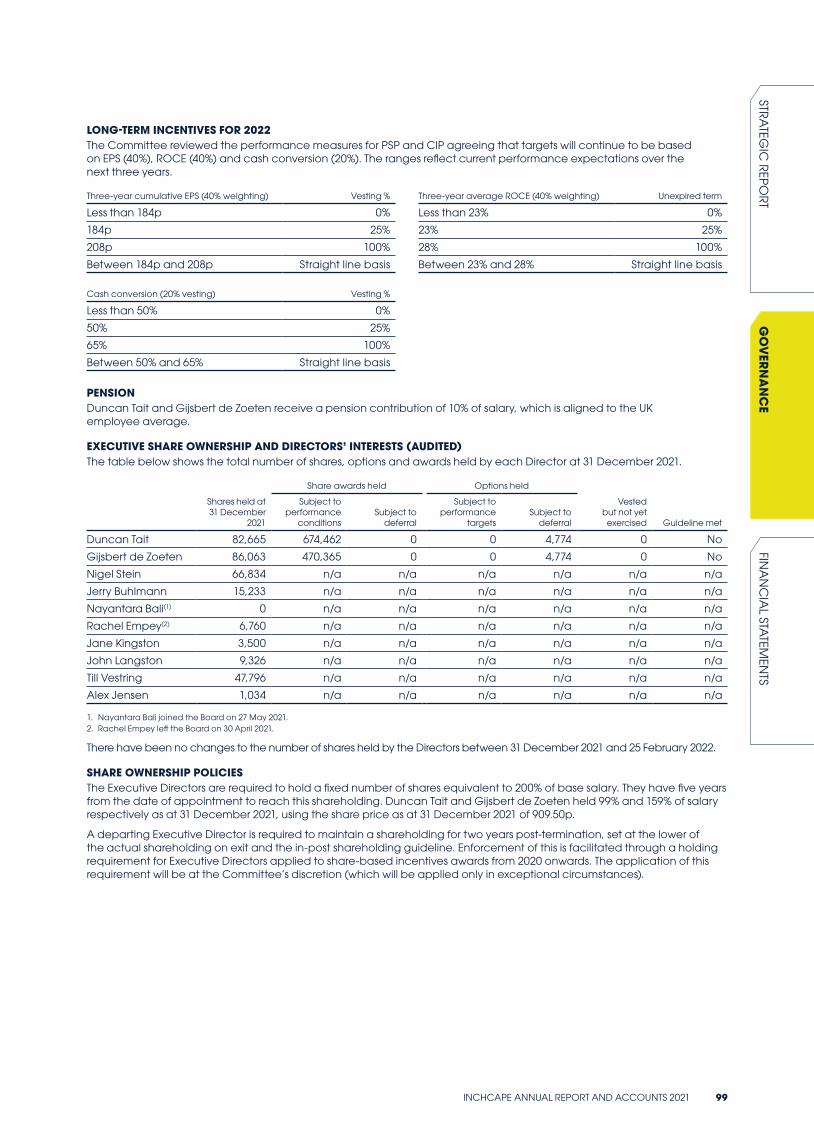
LONG-TERM INCENTIVES FOR 2022The Committee reviewed the performance measures for PSP and CIP agreeing that targets will continue to be based on EPS (40%), ROCE (40%) and cash conversion (20%). The ranges reflect current performance expectations over the next three years.
Three-year cumulative EPS (40% weighting) Vesting % Three-year average ROCE (40% weighting) Unexpired term
Less than 184p 0% Less than 23% 0%
184p 25% 23% 25%
208p 100% 28% 100%
Between 184p and 208p Straight line basis Between 23% and 28% Straight line basis
Cash conversion (20% vesting) Vesting %
Less than 50% 0%
50% 25%
65% 100%
Between 50% and 65% Straight line basis
PENSIONDuncan Tait and Gijsbert de Zoeten receive a pension contribution of 10% of salary, which is aligned to the UK employee average.
EXECUTIVE SHARE OWNERSHIP AND DIRECTORS’ INTERESTS (AUDITED)The table below shows the total number of shares, options and awards held by each Director at 31 December 2021.
Share awards held Options held
Shares held at 31 December
2021
Subject to performance
conditionsSubject to
deferral
Subject to performance
targetsSubject to
deferral
Vested but not yet exercised Guideline met
Duncan Tait 82,665 674,462 0 0 4,774 0 No
Gijsbert de Zoeten 86,063 470,365 0 0 4,774 0 No
Nigel Stein 66,834 n/a n/a n/a n/a n/a n/a
Jerry Buhlmann 15,233 n/a n/a n/a n/a n/a n/a
Nayantara Bali(1) 0 n/a n/a n/a n/a n/a n/a
Rachel Empey(2) 6,760 n/a n/a n/a n/a n/a n/a
Jane Kingston 3,500 n/a n/a n/a n/a n/a n/a
John Langston 9,326 n/a n/a n/a n/a n/a n/a
Till Vestring 47,796 n/a n/a n/a n/a n/a n/a
Alex Jensen 1,034 n/a n/a n/a n/a n/a n/a
1. Nayantara Bali joined the Board on 27 May 2021.2. Rachel Empey left the Board on 30 April 2021.
There have been no changes to the number of shares held by the Directors between 31 December 2021 and 25 February 2022.
SHARE OWNERSHIP POLICIESThe Executive Directors are required to hold a fixed number of shares equivalent to 200% of base salary. They have five years from the date of appointment to reach this shareholding. Duncan Tait and Gijsbert de Zoeten held 99% and 159% of salary respectively as at 31 December 2021, using the share price as at 31 December 2021 of 909.50p.
A departing Executive Director is required to maintain a shareholding for two years post-termination, set at the lower of the actual shareholding on exit and the in-post shareholding guideline. Enforcement of this is facilitated through a holding requirement for Executive Directors applied to share-based incentives awards from 2020 onwards. The application of this requirement will be at the Committee’s discretion (which will be applied only in exceptional circumstances).
INCHCAPE ANNUAL REPORT AND ACCOUNTS 2021 99
STRA
TEGIC
REPO
RTFIN
AN
CIA
L STATEM
ENTS
GO
VER
NA
NC
E
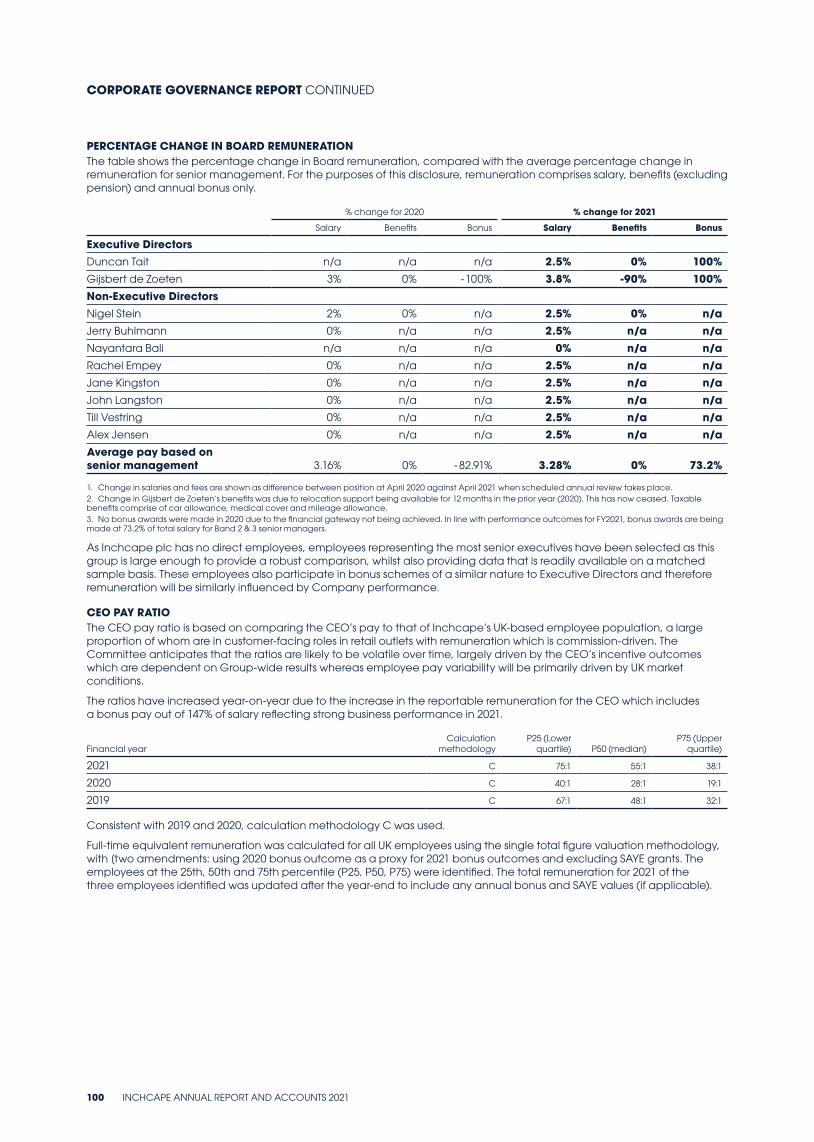
PERCENTAGE CHANGE IN BOARD REMUNERATIONThe table shows the percentage change in Board remuneration, compared with the average percentage change in remuneration for senior management. For the purposes of this disclosure, remuneration comprises salary, benefits (excluding pension) and annual bonus only.
% change for 2020 % change for 2021
Salary Benefits Bonus Salary Benefits Bonus
Executive DirectorsDuncan Tait n/a n/a n/a 2.5% 0% 100%Gijsbert de Zoeten 3% 0% - 100% 3.8% -90% 100%Non-Executive DirectorsNigel Stein 2% 0% n/a 2.5% 0% n/aJerry Buhlmann 0% n/a n/a 2.5% n/a n/aNayantara Bali n/a n/a n/a 0% n/a n/aRachel Empey 0% n/a n/a 2.5% n/a n/aJane Kingston 0% n/a n/a 2.5% n/a n/aJohn Langston 0% n/a n/a 2.5% n/a n/aTill Vestring 0% n/a n/a 2.5% n/a n/aAlex Jensen 0% n/a n/a 2.5% n/a n/aAverage pay based on senior management 3.16% 0% - 82.91% 3.28% 0% 73.2%
1. Change in salaries and fees are shown as difference between position at April 2020 against April 2021 when scheduled annual review takes place.2. Change in Gijsbert de Zoeten’s benefits was due to relocation support being available for 12 months in the prior year (2020). This has now ceased. Taxable benefits comprise of car allowance, medical cover and mileage allowance.3. No bonus awards were made in 2020 due to the financial gateway not being achieved. In line with performance outcomes for FY2021, bonus awards are being made at 73.2% of total salary for Band 2 & 3 senior managers.
As Inchcape plc has no direct employees, employees representing the most senior executives have been selected as this group is large enough to provide a robust comparison, whilst also providing data that is readily available on a matched sample basis. These employees also participate in bonus schemes of a similar nature to Executive Directors and therefore remuneration will be similarly influenced by Company performance.
CEO PAY RATIOThe CEO pay ratio is based on comparing the CEO’s pay to that of Inchcape’s UK-based employee population, a large proportion of whom are in customer-facing roles in retail outlets with remuneration which is commission-driven. The Committee anticipates that the ratios are likely to be volatile over time, largely driven by the CEO’s incentive outcomes which are dependent on Group-wide results whereas employee pay variability will be primarily driven by UK market conditions.
The ratios have increased year-on-year due to the increase in the reportable remuneration for the CEO which includes a bonus pay out of 147% of salary reflecting strong business performance in 2021.
Financial yearCalculation
methodologyP25 (Lower
quartile) P50 (median)P75 (Upper
quartile)
2021 C 75:1 55:1 38:1
2020 C 40:1 28:1 19:1
2019 C 67:1 48:1 32:1
Consistent with 2019 and 2020, calculation methodology C was used.
Full-time equivalent remuneration was calculated for all UK employees using the single total figure valuation methodology, with [two amendments: using 2020 bonus outcome as a proxy for 2021 bonus outcomes and excluding SAYE grants. The employees at the 25th, 50th and 75th percentile (P25, P50, P75) were identified. The total remuneration for 2021 of the three employees identified was updated after the year-end to include any annual bonus and SAYE values (if applicable).
CORPORATE GOVERNANCE REPORT CONTINUED
100 INCHCAPE ANNUAL REPORT AND ACCOUNTS 2021
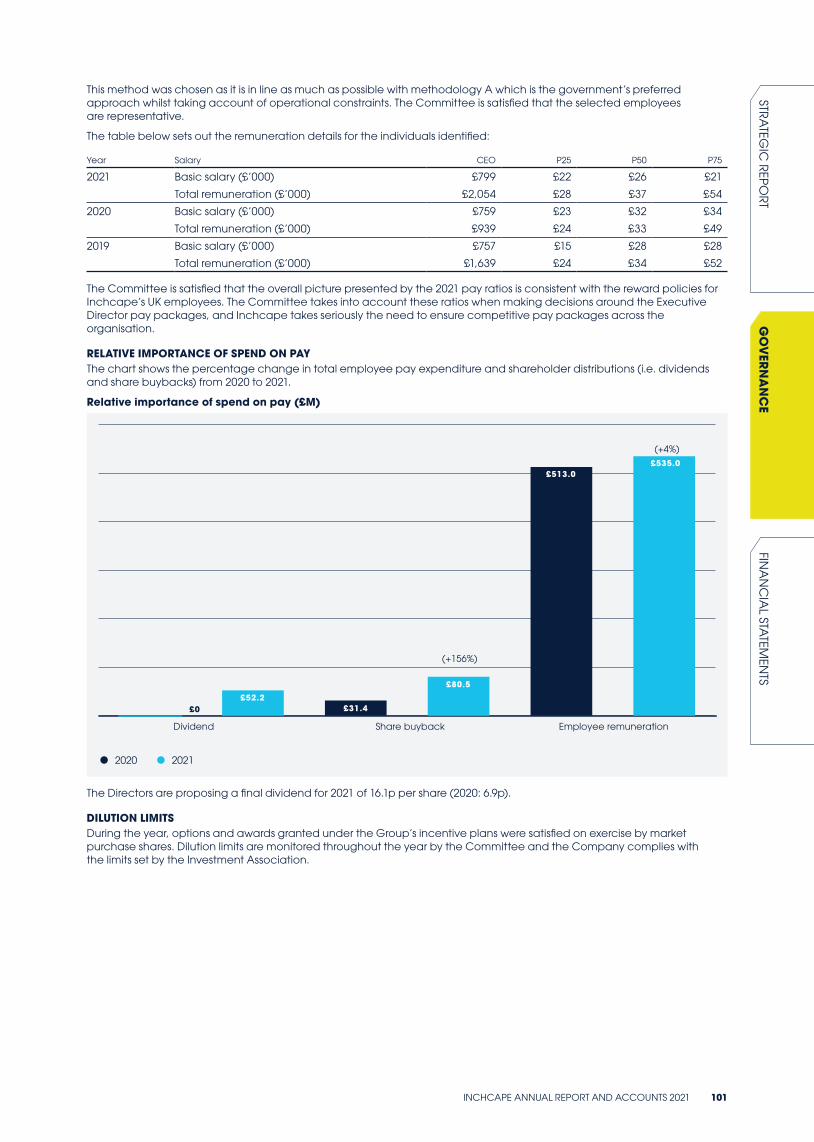
This method was chosen as it is in line as much as possible with methodology A which is the government’s preferred approach whilst taking account of operational constraints. The Committee is satisfied that the selected employees are representative.
The table below sets out the remuneration details for the individuals identified:
Year Salary CEO P25 P50 P75
2021 Basic salary (£’000) £799 £22 £26 £21
Total remuneration (£’000) £2,054 £28 £37 £54
2020 Basic salary (£’000) £759 £23 £32 £34
Total remuneration (£’000) £939 £24 £33 £49
2019 Basic salary (£’000) £757 £15 £28 £28
Total remuneration (£’000) £1,639 £24 £34 £52
The Committee is satisfied that the overall picture presented by the 2021 pay ratios is consistent with the reward policies for Inchcape’s UK employees. The Committee takes into account these ratios when making decisions around the Executive Director pay packages, and Inchcape takes seriously the need to ensure competitive pay packages across the organisation.
RELATIVE IMPORTANCE OF SPEND ON PAYThe chart shows the percentage change in total employee pay expenditure and shareholder distributions (i.e. dividends and share buybacks) from 2020 to 2021.
Relative importance of spend on pay (£M)
2020 2021
£0
£513.0£535.0
£80.5
£31.4£52.2
Dividend Share buyback
(+4%)
(+156%)
Employee remuneration
The Directors are proposing a final dividend for 2021 of 16.1p per share (2020: 6.9p).
DILUTION LIMITSDuring the year, options and awards granted under the Group’s incentive plans were satisfied on exercise by market purchase shares. Dilution limits are monitored throughout the year by the Committee and the Company complies with the limits set by the Investment Association.
INCHCAPE ANNUAL REPORT AND ACCOUNTS 2021 101
STRA
TEGIC
REPO
RTFIN
AN
CIA
L STATEM
ENTS
GO
VER
NA
NC
E
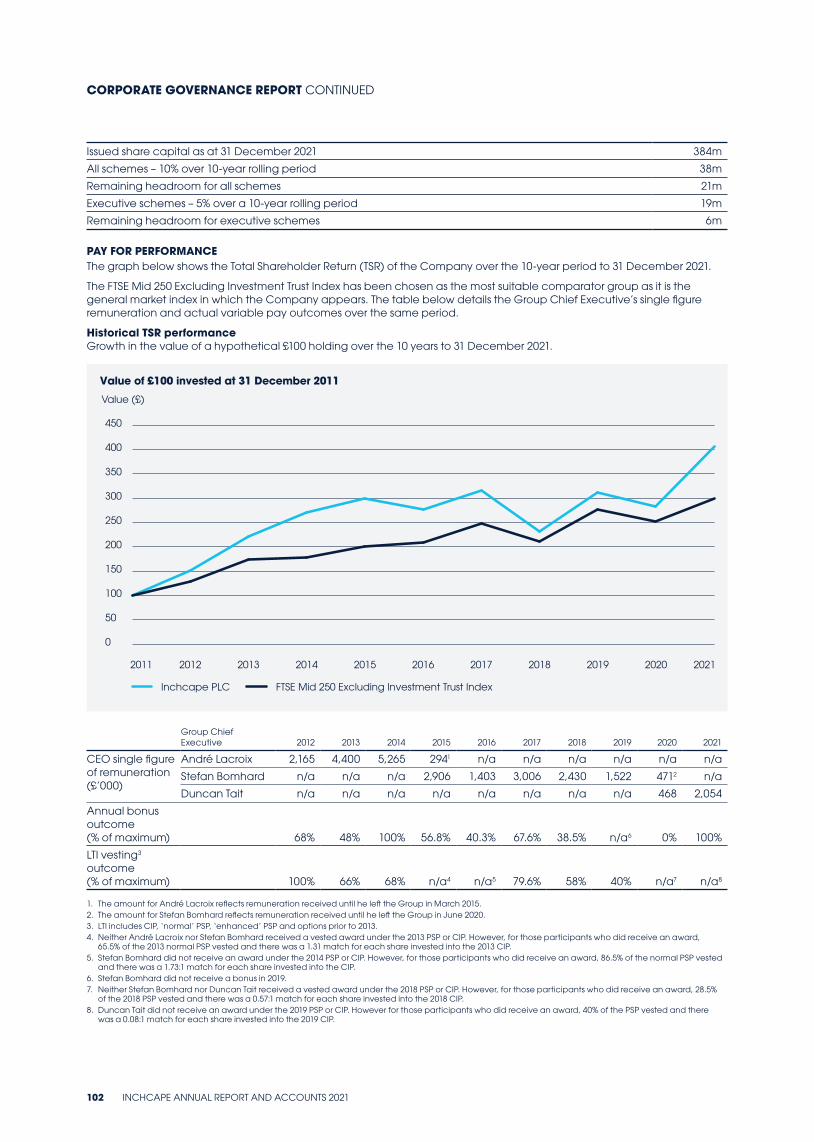
Issued share capital as at 31 December 2021 384m
All schemes – 10% over 10-year rolling period 38m
Remaining headroom for all schemes 21m
Executive schemes – 5% over a 10-year rolling period 19m
Remaining headroom for executive schemes 6m
PAY FOR PERFORMANCEThe graph below shows the Total Shareholder Return (TSR) of the Company over the 10-year period to 31 December 2021.
The FTSE Mid 250 Excluding Investment Trust Index has been chosen as the most suitable comparator group as it is the general market index in which the Company appears. The table below details the Group Chief Executive’s single figure remuneration and actual variable pay outcomes over the same period.
Historical TSR performanceGrowth in the value of a hypothetical £100 holding over the 10 years to 31 December 2021.
0
50
100
150
200
250
300
350
400
450
Value (£)
Value of £100 invested at 31 December 2011
2011 2012 2013
Inchcape PLC FTSE Mid 250 Excluding Investment Trust Index
2014 2015 2016 2017 2018 2019 2020 2021
Group Chief Executive 2012 2013 2014 2015 2016 2017 2018 2019 2020 2021
CEO single figure of remuneration (£’000)
André Lacroix 2,165 4,400 5,265 2941 n/a n/a n/a n/a n/a n/a
Stefan Bomhard n/a n/a n/a 2,906 1,403 3,006 2,430 1,522 4712 n/a
Duncan Tait n/a n/a n/a n/a n/a n/a n/a n/a 468 2,054
Annual bonus outcome (% of maximum) 68% 48% 100% 56.8% 40.3% 67.6% 38.5% n/a6 0% 100%
LTI vesting3 outcome (% of maximum) 100% 66% 68% n/a4 n/a5 79.6% 58% 40% n/a7 n/a8
1. The amount for André Lacroix reflects remuneration received until he left the Group in March 2015.2. The amount for Stefan Bomhard reflects remuneration received until he left the Group in June 2020.3. LTI includes CIP, ‘normal’ PSP, ‘enhanced’ PSP and options prior to 2013.4. Neither André Lacroix nor Stefan Bomhard received a vested award under the 2013 PSP or CIP. However, for those participants who did receive an award,
65.5% of the 2013 normal PSP vested and there was a 1.31 match for each share invested into the 2013 CIP.5. Stefan Bomhard did not receive an award under the 2014 PSP or CIP. However, for those participants who did receive an award, 86.5% of the normal PSP vested
and there was a 1.73:1 match for each share invested into the CIP.6. Stefan Bomhard did not receive a bonus in 2019.7. Neither Stefan Bomhard nor Duncan Tait received a vested award under the 2018 PSP or CIP. However, for those participants who did receive an award, 28.5%
of the 2018 PSP vested and there was a 0.57:1 match for each share invested into the 2018 CIP.8. Duncan Tait did not receive an award under the 2019 PSP or CIP. However for those participants who did receive an award, 40% of the PSP vested and there
was a 0.08:1 match for each share invested into the 2019 CIP.
CORPORATE GOVERNANCE REPORT CONTINUED
102 INCHCAPE ANNUAL REPORT AND ACCOUNTS 2021
SHAREHOLDER CONTEXTThe table below shows the advisory vote on the Remuneration Report at the 2021 AGM:
Total number of votes
% of votes cast
For (including discretionary) 357,761,605 98.61%
Against 5,054,989 1.39%
Total votes cast (excluding votes withheld) 362,816,594 100%
Votes withheld 12,806
(Total votes cast including votes withheld) 362,829,400
The table below shows the binding vote on the remuneration policy at the 2020 AGM:
Total of votes
% of votes cast
For (including discretionary) 323,620,872 94.50%
Against 18,822,513 5.50%
Total votes cast (excluding votes withheld) 342,443,385 100%
Votes withheld 4,359,434
(Total votes cast including votes withheld) 346,802,819
Withheld votes are not included in the final proxy figures as they are not recognised as a vote in law.
EXIT PAYMENTS DURING THE YEARNo exit payments were made to Directors during the year.
PAYMENTS TO PAST DIRECTORSNo payments were made to past Directors in 2021.
OTHER DIRECTORSHIPSThe Executive Directors are generally permitted to take one non-executive directorship as long as it does not lead to conflicts of interest or undue time commitment and is approved in advance by the Nomination Committee and the Board.
Gijsbert de Zoeten is a member of the supervisory board of Technical University Delft, for which he received a fee of €17,651 during 2021.
Duncan Tait currently serves as a non-executive director on the board of Agilisys Ltd for which he received a fee of £25,000 during 2021.
ADVISORS TO THE COMMITTEEEllason LLP was appointed as the independent remuneration advisor to the Committee effective 1 January 2021 following a tender process and was paid a fee of £66,613 for its services during the year.
Ellason LLP is a signatory to the Remuneration Consultant Group’s Code of Conduct which sets out guidelines to ensure that any advice is independent and free of undue influence (which can be found at www.remunerationconsultantsgroup.com).
None of the individual Directors have a personal connection with Ellason LLP.
The Committee is satisfied that the advice it receives is objective and independent and confirms that Ellason LLP does not have any connection with the Company that may impair their independence. The Committee’s advisors attend Committee meetings as required and provide advice on remuneration for executives, analysis of the remuneration policy and regular market and best practice updates. The advisors report directly to the Committee Chair. Fees are charged at an hourly rate in accordance with the terms and conditions set out in the relevant engagement letter.
The Directors’ Report on Remuneration was approved by the Board and has been signed by Jane Kingston on its behalf.
JANE KINGSTONCHAIR OF THE REMUNERATION COMMITTEE
INCHCAPE ANNUAL REPORT AND ACCOUNTS 2021 103
STRA
TEGIC
REPO
RTFIN
AN
CIA
L STATEM
ENTS
GO
VER
NA
NC
E
DIRECTORS’ REPORT
DIRECTORS’ REPORT
The Directors’ Report for the year ended 31 December 2021 comprises pages 104 to 108 of this report (together with sections incorporated by reference).
Information required in the Management Report under DTR 4.1.8R can be found in the following sections: a review of the business and future developments on pages 2 to 39; principal risks and uncertainties on pages 48 to 56; a description of the Group’s internal control framework is given on pages 79 and 80; a description of the Board’s activities and the structure of its Committees is given on pages 60 to 103.
CORPORATE GOVERNANCE STATEMENTThe statement of compliance with the 2018 UK Corporate Governance Code is given on page 61. The Code is published on the Financial Reporting Council’s website www.frc.org.uk. Information required under DTR 7 is given in the Corporate Governance Report on pages 68 to 103.
BOARD OF DIRECTORSThe Directors of the Company who were in office during the year and up to the date of signing the financial statements were:
Nayantara Bali – joined May 2021 Jerry Buhlmann Gijsbert de Zoeten Rachel Empey – left April 2021 Alexandra Jensen Jane Kingston Sarah Kuijlaars – joined January 2022 John Langston Nigel Stein Duncan Tait Till Vestring
In accordance with the 2018 UK Corporate Governance Code, all Directors will stand for election or re-election at the Annual General Meeting (AGM) on 19 May 2022. The Chairman has reviewed the performance of each Director and is satisfied that each continues to be effective and demonstrates commitment to the role. The appointment and replacement of Directors is governed by the Company’s Articles of Association (the Articles), the UK Corporate Governance Code, the Companies Act 2006 and related legislation.
Subject to the Articles, the UK Corporate Governance Code and relevant legislation, the business of the Company is managed by the Board which may exercise all the powers of the Company.
SHAREHOLDERSEngaging with our shareholders is important to the Company so that we are able to understand their views on the business and the key issues of importance to them. Any updates regarding the business, including presentations by the CEO, are available on the Group’s website so that all shareholders have access to the same Company information at the same time.
As the top 20 shareholders own over 70% of the business, shareholder consultations, such as the remuneration policy, are carried out with this group. Extending the consultation to all shareholders would not be cost effective, and shareholders not involved in the consultation process are encouraged to use the AGM forum to express their views either by asking questions or voting on the relevant resolutions.
A dedicated email was put in place during the pandemic to allow shareholders to contact the Board members with any questions if they are unable to attend the AGM in person. This resource will remain in place to allow all shareholders to engage with the Company on any matters of interest to them.
CONFLICTS OF INTERESTThe Articles of Association permit the Board to authorise any matter which would otherwise involve a Director breaching his duty under the Companies Act 2006 to avoid conflicts of interest. When authorising a conflict of interest, the Board must do so without the conflicted Director counting as part of the quorum. In the event that the Board considers it appropriate, the conflicted Director may be permitted to participate in the debate but will be permitted neither to vote nor count in the quorum when the decision is being agreed. The Directors are aware that it is their responsibility to inform the Board of any potential conflicts as soon as possible and procedures are in place to facilitate disclosure.
DIRECTORS’ INDEMNITYA qualifying third-party indemnity (QTPI), as permitted by the Company’s Articles of Association and sections 232 and 234 of the Companies Act 2006, has been granted by the Company to each of the Directors of the Company. Under the provisions of the QTPI the Company undertakes to indemnify each Director against liability to third parties (excluding criminal and regulatory penalties) and to pay Directors’ costs as incurred, provided that they are reimbursed to the Company if the Director is found guilty or, in an action brought by the Company, judgment is given against the Director. The indemnity has been in force for the financial year ended 31 December 2021 and until the date of approval of this report.
RESULTS AND DIVIDENDSThe Group’s audited consolidated financial statements for the year ended 31 December 2021 are shown on pages 120 to 205. The level of distributable reserves is sufficient to pay a dividend.
The Board recommends a final ordinary dividend of 16.1p per ordinary share. If approved at the 2022 AGM, the final ordinary dividend will be paid on 21 June 2022 to shareholders registered in the books of the Company at the close of business on 13 May 2022.
The Company may, by ordinary resolution, declare a dividend not exceeding the amount recommended by the Board. Subject to the Companies Act 2006, the Board may pay interim dividends when the financial position of the Company, in the opinion of the Board, justifies its payment.
104 INCHCAPE ANNUAL REPORT AND ACCOUNTS 2021
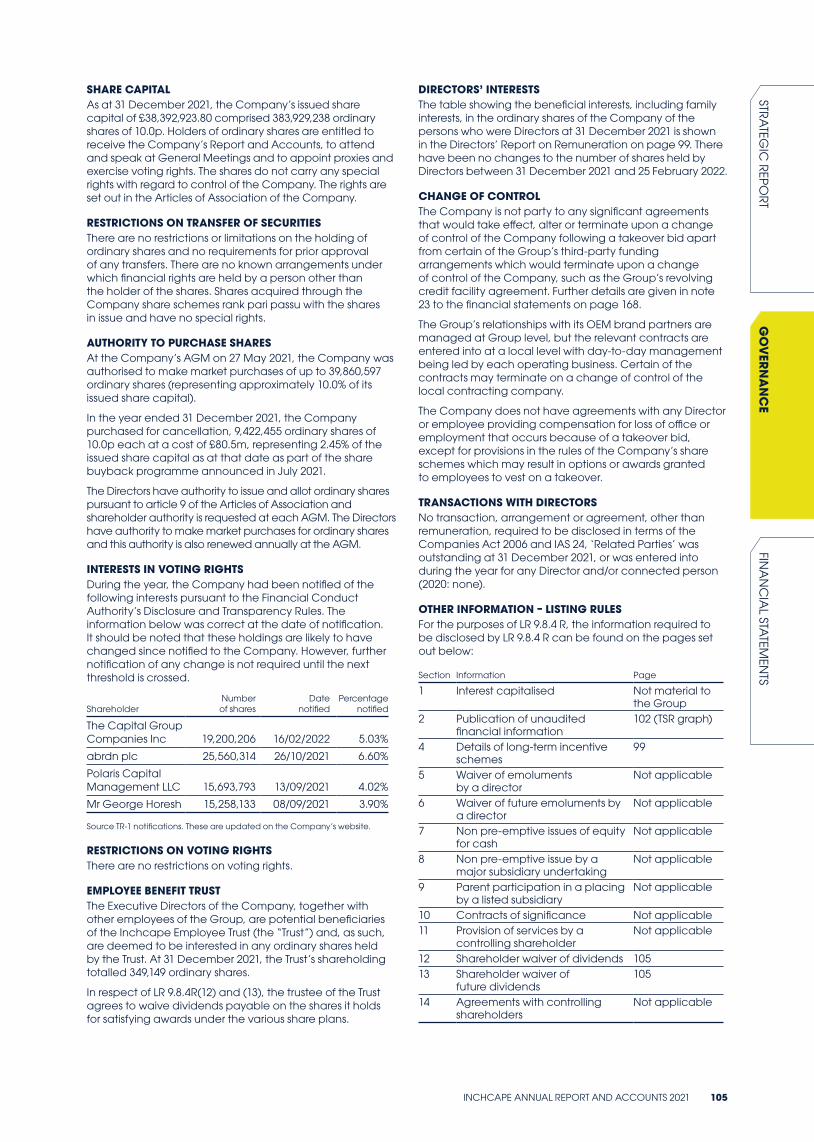
SHARE CAPITALAs at 31 December 2021, the Company’s issued share capital of £38,392,923.80 comprised 383,929,238 ordinary shares of 10.0p. Holders of ordinary shares are entitled to receive the Company’s Report and Accounts, to attend and speak at General Meetings and to appoint proxies and exercise voting rights. The shares do not carry any special rights with regard to control of the Company. The rights are set out in the Articles of Association of the Company.
RESTRICTIONS ON TRANSFER OF SECURITIESThere are no restrictions or limitations on the holding of ordinary shares and no requirements for prior approval of any transfers. There are no known arrangements under which financial rights are held by a person other than the holder of the shares. Shares acquired through the Company share schemes rank pari passu with the shares in issue and have no special rights.
AUTHORITY TO PURCHASE SHARESAt the Company’s AGM on 27 May 2021, the Company was authorised to make market purchases of up to 39,860,597 ordinary shares (representing approximately 10.0% of its issued share capital).
In the year ended 31 December 2021, the Company purchased for cancellation, 9,422,455 ordinary shares of 10.0p each at a cost of £80.5m, representing 2.45% of the issued share capital as at that date as part of the share buyback programme announced in July 2021.
The Directors have authority to issue and allot ordinary shares pursuant to article 9 of the Articles of Association and shareholder authority is requested at each AGM. The Directors have authority to make market purchases for ordinary shares and this authority is also renewed annually at the AGM.
INTERESTS IN VOTING RIGHTSDuring the year, the Company had been notified of the following interests pursuant to the Financial Conduct Authority’s Disclosure and Transparency Rules. The information below was correct at the date of notification. It should be noted that these holdings are likely to have changed since notified to the Company. However, further notification of any change is not required until the next threshold is crossed.
ShareholderNumber of shares
Date notified
Percentage notified
The Capital Group Companies Inc 19,200,206 16/02/2022 5.03%
abrdn plc 25,560,314 26/10/2021 6.60%
Polaris Capital Management LLC 15,693,793 13/09/2021 4.02%
Mr George Horesh 15,258,133 08/09/2021 3.90%
Source TR-1 notifications. These are updated on the Company’s website.
RESTRICTIONS ON VOTING RIGHTSThere are no restrictions on voting rights.
EMPLOYEE BENEFIT TRUSTThe Executive Directors of the Company, together with other employees of the Group, are potential beneficiaries of the Inchcape Employee Trust (the “Trust”) and, as such, are deemed to be interested in any ordinary shares held by the Trust. At 31 December 2021, the Trust’s shareholding totalled 349,149 ordinary shares.
In respect of LR 9.8.4R(12) and (13), the trustee of the Trust agrees to waive dividends payable on the shares it holds for satisfying awards under the various share plans.
DIRECTORS’ INTERESTSThe table showing the beneficial interests, including family interests, in the ordinary shares of the Company of the persons who were Directors at 31 December 2021 is shown in the Directors’ Report on Remuneration on page 99. There have been no changes to the number of shares held by Directors between 31 December 2021 and 25 February 2022.
CHANGE OF CONTROLThe Company is not party to any significant agreements that would take effect, alter or terminate upon a change of control of the Company following a takeover bid apart from certain of the Group’s third-party funding arrangements which would terminate upon a change of control of the Company, such as the Group’s revolving credit facility agreement. Further details are given in note 23 to the financial statements on page 168.
The Group’s relationships with its OEM brand partners are managed at Group level, but the relevant contracts are entered into at a local level with day-to-day management being led by each operating business. Certain of the contracts may terminate on a change of control of the local contracting company.
The Company does not have agreements with any Director or employee providing compensation for loss of office or employment that occurs because of a takeover bid, except for provisions in the rules of the Company’s share schemes which may result in options or awards granted to employees to vest on a takeover.
TRANSACTIONS WITH DIRECTORSNo transaction, arrangement or agreement, other than remuneration, required to be disclosed in terms of the Companies Act 2006 and IAS 24, ‘Related Parties’ was outstanding at 31 December 2021, or was entered into during the year for any Director and/or connected person (2020: none).
OTHER INFORMATION – LISTING RULESFor the purposes of LR 9.8.4 R, the information required to be disclosed by LR 9.8.4 R can be found on the pages set out below:
Section Information Page
1 Interest capitalised Not material to the Group
2 Publication of unaudited financial information
102 (TSR graph)
4 Details of long-term incentive schemes
99
5 Waiver of emoluments by a director
Not applicable
6 Waiver of future emoluments by a director
Not applicable
7 Non pre-emptive issues of equity for cash
Not applicable
8 Non pre-emptive issue by a major subsidiary undertaking
Not applicable
9 Parent participation in a placing by a listed subsidiary
Not applicable
10 Contracts of significance Not applicable11 Provision of services by a
controlling shareholderNot applicable
12 Shareholder waiver of dividends 10513 Shareholder waiver of
future dividends105
14 Agreements with controlling shareholders
Not applicable
INCHCAPE ANNUAL REPORT AND ACCOUNTS 2021 105
STRA
TEGIC
REPO
RTFIN
AN
CIA
L STATEM
ENTS
GO
VER
NA
NC
E
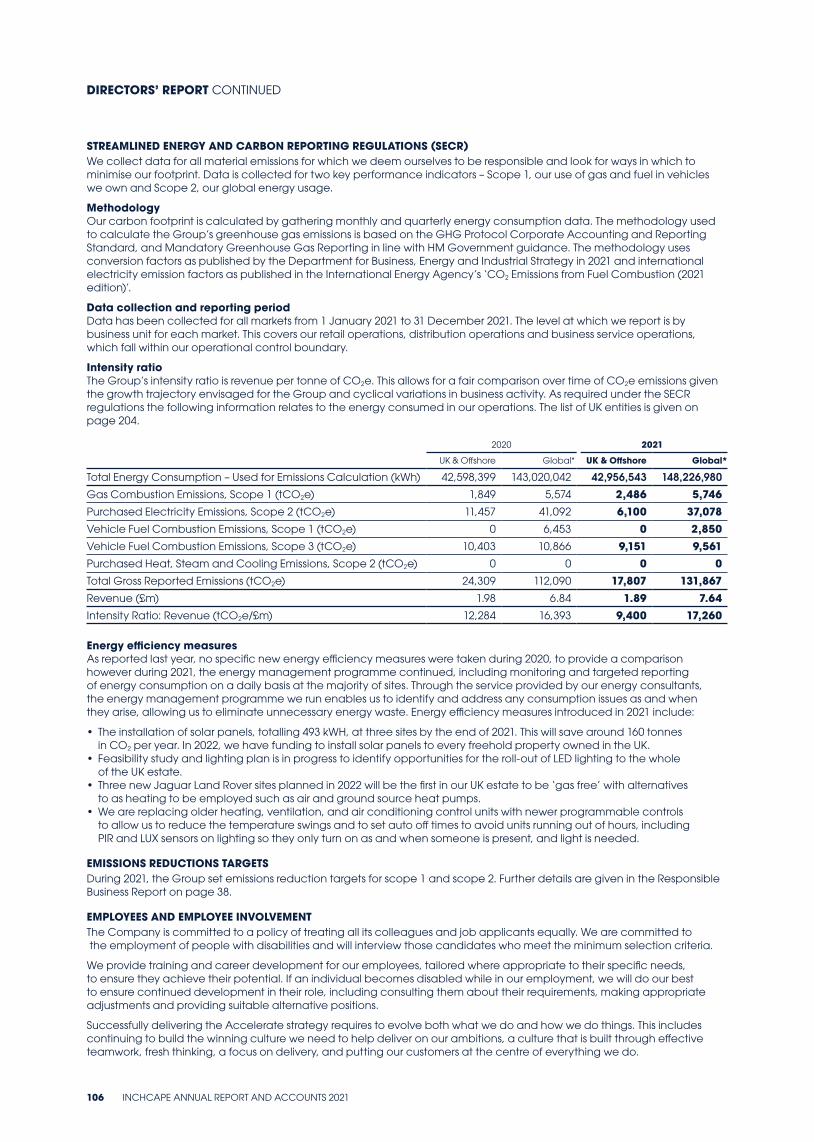
STREAMLINED ENERGY AND CARBON REPORTING REGULATIONS (SECR)We collect data for all material emissions for which we deem ourselves to be responsible and look for ways in which to minimise our footprint. Data is collected for two key performance indicators – Scope 1, our use of gas and fuel in vehicles we own and Scope 2, our global energy usage.
MethodologyOur carbon footprint is calculated by gathering monthly and quarterly energy consumption data. The methodology used to calculate the Group’s greenhouse gas emissions is based on the GHG Protocol Corporate Accounting and Reporting Standard, and Mandatory Greenhouse Gas Reporting in line with HM Government guidance. The methodology uses conversion factors as published by the Department for Business, Energy and Industrial Strategy in 2021 and international electricity emission factors as published in the International Energy Agency’s ‘CO2 Emissions from Fuel Combustion (2021 edition)’.
Data collection and reporting periodData has been collected for all markets from 1 January 2021 to 31 December 2021. The level at which we report is by business unit for each market. This covers our retail operations, distribution operations and business service operations, which fall within our operational control boundary.
Intensity ratioThe Group’s intensity ratio is revenue per tonne of CO2e. This allows for a fair comparison over time of CO2e emissions given the growth trajectory envisaged for the Group and cyclical variations in business activity. As required under the SECR regulations the following information relates to the energy consumed in our operations. The list of UK entities is given on page 204.
2020 2021
UK & Offshore Global* UK & Offshore Global*
Total Energy Consumption – Used for Emissions Calculation (kWh) 42,598,399 143,020,042 42,956,543 148,226,980
Gas Combustion Emissions, Scope 1 (tCO2e) 1,849 5,574 2,486 5,746Purchased Electricity Emissions, Scope 2 (tCO2e) 11,457 41,092 6,100 37,078Vehicle Fuel Combustion Emissions, Scope 1 (tCO2e) 0 6,453 0 2,850Vehicle Fuel Combustion Emissions, Scope 3 (tCO2e) 10,403 10,866 9,151 9,561Purchased Heat, Steam and Cooling Emissions, Scope 2 (tCO2e) 0 0 0 0Total Gross Reported Emissions (tCO2e) 24,309 112,090 17,807 131,867Revenue (£m) 1.98 6.84 1.89 7.64Intensity Ratio: Revenue (tCO2e/£m) 12,284 16,393 9,400 17,260
Energy efficiency measuresAs reported last year, no specific new energy efficiency measures were taken during 2020, to provide a comparison however during 2021, the energy management programme continued, including monitoring and targeted reporting of energy consumption on a daily basis at the majority of sites. Through the service provided by our energy consultants, the energy management programme we run enables us to identify and address any consumption issues as and when they arise, allowing us to eliminate unnecessary energy waste. Energy efficiency measures introduced in 2021 include:
• The installation of solar panels, totalling 493 kWH, at three sites by the end of 2021. This will save around 160 tonnes in CO2 per year. In 2022, we have funding to install solar panels to every freehold property owned in the UK.
• Feasibility study and lighting plan is in progress to identify opportunities for the roll-out of LED lighting to the whole of the UK estate.
• Three new Jaguar Land Rover sites planned in 2022 will be the first in our UK estate to be ‘gas free’ with alternatives to as heating to be employed such as air and ground source heat pumps.
• We are replacing older heating, ventilation, and air conditioning control units with newer programmable controls to allow us to reduce the temperature swings and to set auto off times to avoid units running out of hours, including PIR and LUX sensors on lighting so they only turn on as and when someone is present, and light is needed.
EMISSIONS REDUCTIONS TARGETSDuring 2021, the Group set emissions reduction targets for scope 1 and scope 2. Further details are given in the Responsible Business Report on page 38.
EMPLOYEES AND EMPLOYEE INVOLVEMENTThe Company is committed to a policy of treating all its colleagues and job applicants equally. We are committed to the employment of people with disabilities and will interview those candidates who meet the minimum selection criteria.
We provide training and career development for our employees, tailored where appropriate to their specific needs, to ensure they achieve their potential. If an individual becomes disabled while in our employment, we will do our best to ensure continued development in their role, including consulting them about their requirements, making appropriate adjustments and providing suitable alternative positions.
Successfully delivering the Accelerate strategy requires to evolve both what we do and how we do things. This includes continuing to build the winning culture we need to help deliver on our ambitions, a culture that is built through effective teamwork, fresh thinking, a focus on delivery, and putting our customers at the centre of everything we do.
DIRECTORS’ REPORT CONTINUED
106 INCHCAPE ANNUAL REPORT AND ACCOUNTS 2021
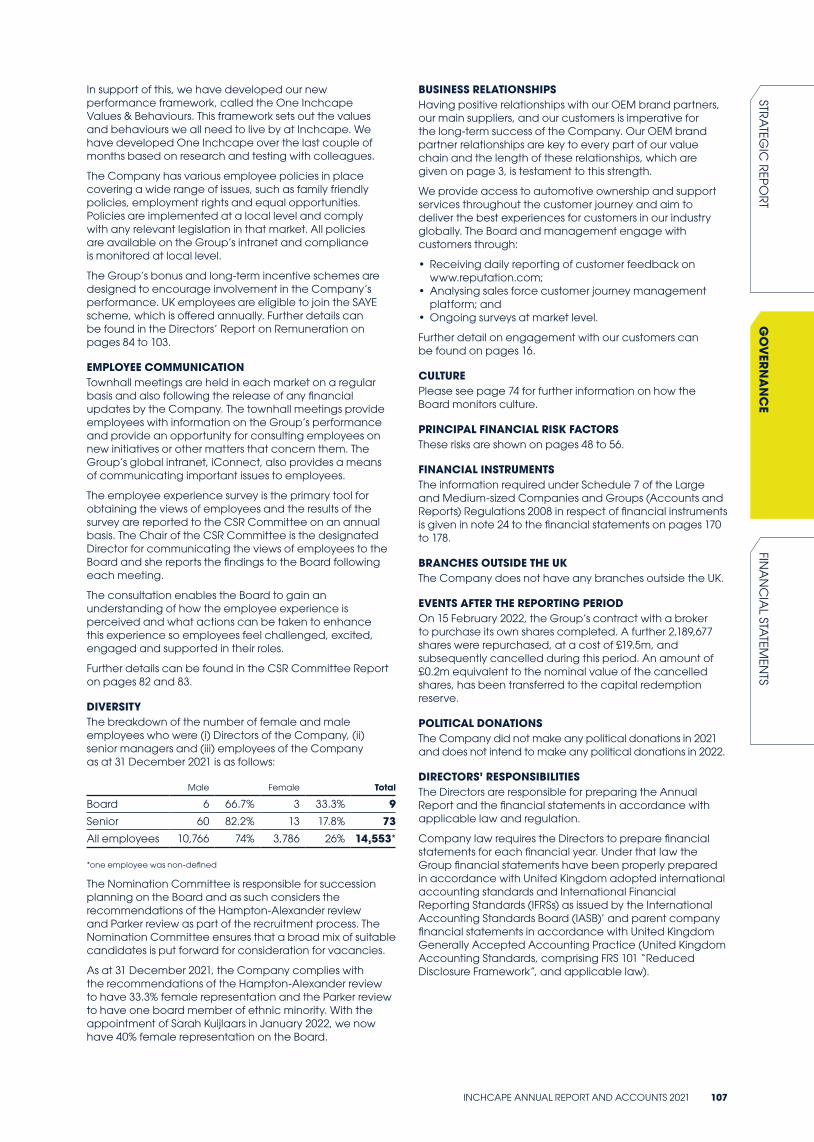
In support of this, we have developed our new performance framework, called the One Inchcape Values & Behaviours. This framework sets out the values and behaviours we all need to live by at Inchcape. We have developed One Inchcape over the last couple of months based on research and testing with colleagues.
The Company has various employee policies in place covering a wide range of issues, such as family friendly policies, employment rights and equal opportunities. Policies are implemented at a local level and comply with any relevant legislation in that market. All policies are available on the Group’s intranet and compliance is monitored at local level.
The Group’s bonus and long-term incentive schemes are designed to encourage involvement in the Company’s performance. UK employees are eligible to join the SAYE scheme, which is offered annually. Further details can be found in the Directors’ Report on Remuneration on pages 84 to 103.
EMPLOYEE COMMUNICATIONTownhall meetings are held in each market on a regular basis and also following the release of any financial updates by the Company. The townhall meetings provide employees with information on the Group’s performance and provide an opportunity for consulting employees on new initiatives or other matters that concern them. The Group’s global intranet, iConnect, also provides a means of communicating important issues to employees.
The employee experience survey is the primary tool for obtaining the views of employees and the results of the survey are reported to the CSR Committee on an annual basis. The Chair of the CSR Committee is the designated Director for communicating the views of employees to the Board and she reports the findings to the Board following each meeting.
The consultation enables the Board to gain an understanding of how the employee experience is perceived and what actions can be taken to enhance this experience so employees feel challenged, excited, engaged and supported in their roles.
Further details can be found in the CSR Committee Report on pages 82 and 83.
DIVERSITYThe breakdown of the number of female and male employees who were (i) Directors of the Company, (ii) senior managers and (iii) employees of the Company as at 31 December 2021 is as follows:
Male Female Total
Board 6 66.7% 3 33.3% 9Senior 60 82.2% 13 17.8% 73All employees 10,766 74% 3,786 26% 14,553*
*one employee was non-defined
The Nomination Committee is responsible for succession planning on the Board and as such considers the recommendations of the Hampton-Alexander review and Parker review as part of the recruitment process. The Nomination Committee ensures that a broad mix of suitable candidates is put forward for consideration for vacancies.
As at 31 December 2021, the Company complies with the recommendations of the Hampton-Alexander review to have 33.3% female representation and the Parker review to have one board member of ethnic minority. With the appointment of Sarah Kuijlaars in January 2022, we now have 40% female representation on the Board.
BUSINESS RELATIONSHIPSHaving positive relationships with our OEM brand partners, our main suppliers, and our customers is imperative for the long-term success of the Company. Our OEM brand partner relationships are key to every part of our value chain and the length of these relationships, which are given on page 3, is testament to this strength.
We provide access to automotive ownership and support services throughout the customer journey and aim to deliver the best experiences for customers in our industry globally. The Board and management engage with customers through:
• Receiving daily reporting of customer feedback on www.reputation.com;
• Analysing sales force customer journey management platform; and
• Ongoing surveys at market level.
Further detail on engagement with our customers can be found on pages 16.
CULTUREPlease see page 74 for further information on how the Board monitors culture.
PRINCIPAL FINANCIAL RISK FACTORSThese risks are shown on pages 48 to 56.
FINANCIAL INSTRUMENTSThe information required under Schedule 7 of the Large and Medium-sized Companies and Groups (Accounts and Reports) Regulations 2008 in respect of financial instruments is given in note 24 to the financial statements on pages 170 to 178.
BRANCHES OUTSIDE THE UKThe Company does not have any branches outside the UK.
EVENTS AFTER THE REPORTING PERIODOn 15 February 2022, the Group’s contract with a broker to purchase its own shares completed. A further 2,189,677 shares were repurchased, at a cost of £19.5m, and subsequently cancelled during this period. An amount of £0.2m equivalent to the nominal value of the cancelled shares, has been transferred to the capital redemption reserve.
POLITICAL DONATIONSThe Company did not make any political donations in 2021 and does not intend to make any political donations in 2022.
DIRECTORS’ RESPONSIBILITIESThe Directors are responsible for preparing the Annual Report and the financial statements in accordance with applicable law and regulation.
Company law requires the Directors to prepare financial statements for each financial year. Under that law the Group financial statements have been properly prepared in accordance with United Kingdom adopted international accounting standards and International Financial Reporting Standards (IFRSs) as issued by the International Accounting Standards Board (IASB)’ and parent company financial statements in accordance with United Kingdom Generally Accepted Accounting Practice (United Kingdom Accounting Standards, comprising FRS 101 “Reduced Disclosure Framework”, and applicable law).
INCHCAPE ANNUAL REPORT AND ACCOUNTS 2021 107
STRA
TEGIC
REPO
RTFIN
AN
CIA
L STATEM
ENTS
GO
VER
NA
NC
E
Under company law the Directors must not approve the financial statements unless they are satisfied that they give a true and fair view of the state of affairs of the Group and parent company and of the profit or loss of the Group and parent company for that period. In preparing the financial statements, the Directors are required to:
• Select suitable accounting policies and then apply them consistently;
• State whether applicable United Kingdom Accounting Standards have been followed, subject to any material departures disclosed and explained in the financial statements; and
• Make judgements and accounting estimates that are reasonable and prudent; and prepare the financial statements on the going concern basis unless it is inappropriate to presume that the Group and parent company will continue in business.
The Directors are responsible for keeping adequate accounting records that are sufficient to show and explain the Group and parent company’s transactions and disclose with reasonable accuracy at any time the financial position of the Group and parent company and enable them to ensure that the financial statements and the Directors’ Remuneration Report comply with the Companies Act 2006 and, as regards the Group financial statements, Article 4 of the IAS Regulation.
The Directors are also responsible for safeguarding the assets of the Group and parent company and hence for taking reasonable steps for the prevention and detection of fraud and other irregularities.
The Directors are responsible for the maintenance and integrity of the parent company’s website. Legislation in the United Kingdom governing the preparation and dissemination of financial statements may differ from legislation in other jurisdictions.
The Directors consider that the Annual Report and Accounts, taken as a whole, is fair, balanced and understandable and provides the information necessary for shareholders to assess the Group and parent company’s performance, business model and strategy.
Each of the Directors, whose names and functions are listed in the Board of Directors, confirm that, to the best of their knowledge:
• The parent company financial statements, which have been prepared in accordance with United Kingdom Generally Accepted Accounting Practice (United Kingdom Accounting Standards, comprising FRS 101 “Reduced Disclosure Framework”, and applicable law), give a true and fair view of the assets, liabilities, financial position and loss of the Company;
• The Group financial statements, which have been properly prepared in accordance with United Kingdom adopted international accounting standards and International Financial Reporting Standards (IFRSs) as issued by the International Accounting Standards Board (IASB), give a true and fair view of the assets, liabilities, financial position and profit of the Group; and
• The Directors’ Report includes a fair review of the development and performance of the business and the position of the Group and parent company, together with a description of the principal risks and uncertainties that it faces.
The Directors considered the key messages contained in the Strategic Report along with the disclosures made throughout to ensure that they are consistent, transparent and a true reflection of the business. The Directors also reviewed supporting documentation which addresses specific statements made in the report and the evidence to support those statements.
Following this review, the Directors consider, when taken as a whole, that the Annual Report and Accounts is fair, balanced and understandable and provides the information necessary for shareholders to assess the Company’s position and performance, business model and strategy.
GOING CONCERNHaving assessed the principal risks and the other matters discussed in connection with the viability statement on page 56, the Directors consider it appropriate to adopt the going concern basis of accounting in the financial statements for the next 12 months.
AUDITOR AND DISCLOSURE OF INFORMATION TO THE AUDITORThe auditor, Deloitte LLP, has indicated its willingness to continue in office. A resolution to reappoint Deloitte as auditor will be proposed at the AGM.
So far as the Directors are aware there is no relevant audit information of which the Company’s auditor is unaware. The Directors have taken all the steps that they ought to have taken as Directors in order to make themselves aware of any relevant audit information and to establish that the Company’s auditor is aware of that information.
ANNUAL GENERAL MEETINGThe AGM will be held at 11.00 a.m. on Thursday, 19 May 2022 at The Royal Automobile Club, 89 Pall Mall, London SW1Y 5HS. The notice convening the meeting and the resolutions to be put to the meeting, together with the explanatory notes, are given in the Circular to all shareholders.
The Directors’ Report was approved by the Board and has been signed by the secretary of the Company.
TAMSIN WATERHOUSEGROUP COMPANY SECRETARY
DIRECTORS’ REPORT CONTINUED
108 INCHCAPE ANNUAL REPORT AND ACCOUNTS 2021
FINANCIAL STATEMENTS110 Independent auditor’s report to the members of
Inchcape plc120 Consolidated income statement121 Consolidated statement of comprehensive income122 Consolidated statement of financial position123 Consolidated statement of changes in equity124 Consolidated statement of cash flows125 Accounting policies136 Notes to the financial statements186 Alternative performance measures188 Five year record189 Company statement of financial position190 Company statement of changes in equity191 Company accounting policies194 Notes to the Company financial statements
OTHER INFORMATION206 Shareholder information
INCHCAPE ANNUAL REPORT AND ACCOUNTS 2021 109
STRA
TEGIC
REPO
RTG
OV
ERN
AN
CE
FINA
NC
IAL STA
TEMEN
TS
INDEPENDENT AUDITOR’S REPORT TO THE MEMBERS OF INCHCAPE PLC
REPORT ON THE AUDIT OF THE FINANCIAL STATEMENTS
1. OPINIONIn our opinion:
• the financial statements of Inchcape plc (the ‘parent company’) and its subsidiaries (the ‘Group’) give a true and fair view of the state of the Group’s and of the parent company’s affairs as at 31 December 2021 and of the Group’s profit for the year then ended;
• the Group financial statements have been properly prepared in accordance with United Kingdom adopted international accounting standards and International Financial Reporting Standards (IFRSs) as issued by the International Accounting Standards Board (IASB);
• the parent company financial statements have been properly prepared in accordance with United Kingdom Generally Accepted Accounting Practice, including Financial Reporting Standard 101 “Reduced Disclosure Framework”; and
• the financial statements have been prepared in accordance with the requirements of the Companies Act 2006.
We have audited the financial statements which comprise:
• the consolidated income statement;• the consolidated statement of comprehensive income;• the consolidated and parent company statements of financial position;• the consolidated and parent company statements of changes in equity;• the consolidated statement of cash flows;• the accounting policies; and• the related notes 1 to 35 to the consolidated financial statements and the related notes 1 to 14 to the parent company
financial statements.
The financial reporting framework that has been applied in the preparation of the Group financial statements is applicable law, United Kingdom adopted international accounting standards and IFRSs as issued by the IASB. The financial reporting framework that has been applied in the preparation of the parent company financial statements is applicable law and United Kingdom Accounting Standards, including FRS 101 “Reduced Disclosure Framework” (United Kingdom Generally Accepted Accounting Practice).
2. BASIS FOR OPINIONWe conducted our audit in accordance with International Standards on Auditing (UK) (ISAs (UK)) and applicable law. Our responsibilities under those standards are further described in the auditor’s responsibilities for the audit of the financial statements section of our report.
We are independent of the Group and the parent company in accordance with the ethical requirements that are relevant to our audit of the financial statements in the UK, including the Financial Reporting Council’s (the ‘FRC’s’) Ethical Standard as applied to listed public interest entities, and we have fulfilled our other ethical responsibilities in accordance with these requirements. The non-audit services provided to the Group and parent company for the year are disclosed in note 3 to the financial statements. We confirm that we have not provided any non-audit services prohibited by the FRC’s Ethical Standard to the Group or the parent company.
We believe that the audit evidence we have obtained is sufficient and appropriate to provide a basis for our opinion.
110 INCHCAPE ANNUAL REPORT AND ACCOUNTS 2021
3. SUMMARY OF OUR AUDIT APPROACH
Key audit matters
The key audit matters that we identified in the current year were:
• Central America goodwill and indefinite-life intangible asset impairment• UK site impairment
Within this report, key audit matters are identified as follows:
Newly identified
Increased level of risk
Similar level of risk
Decreased level of risk
Materiality The materiality that we used for the Group financial statements was £14.6m which equates to 5% of statutory profit before tax and exceptional items including net acquisition costs.
In making our judgement we considered the focus of the users of the financial statements as well as a range of benchmark metrics such as profit before tax, revenue and net assets, before selecting 5% of profit before tax and exceptional items including net acquisition costs as the benchmark for determining materiality (2020: 1% of net assets).
In 2020, we used net assets as the benchmark for determining materiality. This was due the volatility in profit when compared to previous years, resulting from the impact of the Covid-19 pandemic on the Group’s operations and consumer demand in the markets in which the Group operates. We have reverted back to the use of a profit-based benchmark in determining materiality in the current year, due to the stabilisation of the Group’s profit metrics.
Scoping We conducted our work in 12 countries (2020: 18 countries), engaging 12 (2020: 18) component audit teams.
The reporting units where we conducted our audit work accounted for 76% (2020: 90%) of the Group’s revenue, 78% (2020: 90%) of the Group’s profit before taxation and exceptional items and 80% (2020: 90%) of the Group’s net assets.
Significant changes in our approach
In the prior year we had identified a key audit matter relating to Goodwill impairment in the UK, which is no longer a key audit matter because it was fully impaired in 2020.
INCHCAPE ANNUAL REPORT AND ACCOUNTS 2021 111
STRA
TEGIC
REPO
RTG
OV
ERN
AN
CE
FINA
NC
IAL STA
TEMEN
TS
4. CONCLUSIONS RELATING TO GOING CONCERNIn auditing the financial statements, we have concluded that the directors’ use of the going concern basis of accounting in the preparation of the financial statements is appropriate.
Our evaluation of the directors’ assessment of the Group’s and parent company’s ability to continue to adopt the going concern basis of accounting included:
• Understanding the Group’s processes and related controls over the assumptions in the going concern assessment;• Assessing the Group’s available committed borrowing facilities; • Evaluated the reasonableness of the projections and the appropriateness of the sensitivities performed by management;• Assessing the impact of global supply chain constraints due to semi-conductor shortages, Covid-19 and political
uncertainties on the forecast cashflows;• Engaging our modelling specialists to perform consistency checks and integrity checks over the going concern model,
including checking for mathematical and clerical accuracy;• Evaluating the accuracy and completeness of the covenant calculation within the model; • Testing the consistency of the forecast cash flows with the forecasts prepared for the impairment models;• Performing additional sensitivity scenario analysis; and• Assessing the disclosures relating to going concern in the financial statements.
Based on the work we have performed, we have not identified any material uncertainties relating to events or conditions that, individually or collectively, may cast significant doubt on the Group’s and parent company’s ability to continue as a going concern for a period of at least twelve months from when the financial statements are authorised for issue.
In relation to the reporting on how the Group has applied the UK Corporate Governance Code, we have nothing material to add or draw attention to in relation to the directors’ statement in the financial statements about whether the directors considered it appropriate to adopt the going concern basis of accounting.
Our responsibilities and the responsibilities of the directors with respect to going concern are described in the relevant sections of this report.
5. KEY AUDIT MATTERSKey audit matters are those matters that, in our professional judgement, were of most significance in our audit of the financial statements of the current period and include the most significant assessed risks of material misstatement (whether or not due to fraud) that we identified. These matters included those which had the greatest effect on: the overall audit strategy; the allocation of resources in the audit; and directing the efforts of the engagement team.
These matters were addressed in the context of our audit of the financial statements as a whole, and in forming our opinion thereon, and we do not provide a separate opinion on these matters.
INDEPENDENT AUDITOR’S REPORT TO THE MEMBERS OF INCHCAPE PLC CONTINUED
112 INCHCAPE ANNUAL REPORT AND ACCOUNTS 2021
5.1. Central America goodwill and indefinite-life intangible asset impairment
Key audit matter description
Account balances: Intangible assets. Refer to the Audit Committee report on page 77, the Critical accounting judgements and sources of estimation uncertainty in the Accounting policies section on page 134, note 2 Exceptional items on page 140 and note 11 Intangible assets on page 153.
In addition to goodwill of £116.3 million (2020: £119.0 million) the Group has distribution agreements of £239.0 million (2020: £246.6 million) which are classified as indefinite-life intangible assets.
£24.8 million (2020: £37.6 million) of the goodwill is allocated to Central America and £65.8 million (2020: £52.2 million) of the value of the distribution agreements relates to the exclusive right to distribute Suzuki vehicles in Costa Rica and Panama.
The goodwill and distribution agreement assets were recognised after the acquisition of the Grupo Rudelman business in 2018. Since acquisition, political instability, in Costa Rica in particular, has impacted demand for vehicles in that market.
Management performed impairment reviews on the Suzuki CGU and then the Central America Group of CGUs, which resulted in an impairment of £12.9 million against the goodwill (2020: £6.2 million) and a £12.9 million reversal of impairment against the distribution agreement (2020: £31.2 million impairment).
There continues to be uncertainty over market level performance in the short term given the ongoing supplier constraints, as a result of semi-conductor shortages and Covid-19 and there is continuing uncertainty over the strength and timing of the recovery of the market.
As noted on page 56, management’s financial planning process incorporates an Annual Operating Plan (“AOP”) for the next financial year (2022), together with financial forecasts/models for the remaining years based on external market benchmarks. When determining recoverable amount cash flows are discounted using a discount rate and long-term growth rate determined by management’s expert.
Management’s forecast is reliant upon continued supply of vehicles into the market. As noted within note 11, the cash flows used within the impairment models are based on assumptions which are sources of estimation uncertainty and small movements in these assumptions could lead to a further impairment.
Although the penetration of electric vehicles in each market is currently low, in Costa Rica as part of its ‘National Decarbonization Plan’ there are commitments to move to full electrification of its transport network by 2050.
How the scope of our audit responded to the key audit matter
Our procedures in response to the key audit matter identified included:
• Obtaining an understanding of relevant controls, including Group oversight and management review controls, over the preparation and use of cash flow forecasts used in the impairment reviews;
• Assessing the integrity of the models used by management including reviewing their mechanical accuracy;
• Assessing management’s historical forecasting accuracy by comparing budgets to actuals; • Benchmarking management’s assumptions against views of internal industry experts, reputable
third-party industry growth forecasts, publications, news articles, government legislation and economic data;
• Challenging management’s analysis through comparison to external market data and considering contradictory evidence of the risks and opportunities arising from the transition to electric vehicles and the impact this has on forecast future cash flows;
• Evaluating the competence, capabilities and objectivity of management’s expert who were engaged to determine the discount rate and long-term growth rate used;
• Engaging with our internal fair value specialists to independently evaluate the appropriateness of inputs and methodology used in determining the discount rates used;
• Assessing the impact of global supply chain constraints due to semi-conductor shortages and Covid-19 has on the forecast cashflows;
• Performing sensitivities in order to challenge the reasonableness of management’s assumptions; and
• Assessing the appropriateness of management’s disclosures.
Key observations We concluded that the judgements management have made are reasonable.
There are uncertainties which remain, particularly the strength of the recovery in demand for vehicles and aftersales services after the impact of the Covid-19 pandemic. Furthermore, the ongoing supply shortage of semi-conductors, in what has historically been a volatile market, and the risks and opportunities resulting from the transition to electric vehicles add to this uncertainty.
We are satisfied that the Group’s disclosures in the Critical accounting judgements and sources of estimation uncertainty in the Accounting policies section and note 11 Intangible assets appropriately highlight these uncertainties.
INCHCAPE ANNUAL REPORT AND ACCOUNTS 2021 113
STRA
TEGIC
REPO
RTG
OV
ERN
AN
CE
FINA
NC
IAL STA
TEMEN
TS

5.2. UK site impairment
Key audit matter description
Account balances: Intangible assets, property, plant and equipment and right-of-use assets. Refer to the Audit Committee report on page 77, the Critical accounting judgements and sources of estimation uncertainty in the Accounting policies section on page 134, note 2 Exceptional items on page 140, note 11 Intangible assets on page 153, note 12 Property, plant and equipment on page 157 and note 13 Right-of-use assets and Lease liabilities on page 159.
The Group has goodwill of £116.3 million (2020: £119.0 million), property, plant and equipment of £548.0 million (2020: £569.8 million) and right-of-use assets of £261.4 million (2020: £257.3 million).
£nil (2020: £nil) of the goodwill, £209.5 million (2020: £203.6 million) of property, plant and equipment and £59.9 million (£73.6 million) of right-of-use assets relate to the UK.
The UK automotive retail market continues to be subject to volatility, principally caused by the semi-conductor shortage and continued COVID-19 disruption.
In line with IAS 36 “Impairment of assets” management performed an impairment indicator assessment for the UK sites and where an indicator of impairment existed, an impairment review was performed.
The estimation of the recoverable amount requires management to assess the ‘value in use’ of the individual sites. This is particularly judgemental due to the forecasting of future cash flow assumptions, and accordingly we determined these to be the key estimates in management’s determination of the level of impairment charge to record. Given the impact of the continued automotive disruption, forecasting demand for vehicles and aftersales services in the short and medium term is particularly uncertain. Furthermore, with the announcement that the sale of new petrol and diesel vehicles will be banned from 2030, the electrification of the UK’s car parc adds further complexity to forecasting cash flows. Management also engaged specialists to assess the fair values of some of its sites which showed indicators of impairment and may not be supported by value in use. In line with the accounting standard, the impaired assets were written down to the higher of its value in use or fair value less cost to sell.
How the scope of our audit responded to the key audit matter
Our procedures in response to the key audit matter identified included:
• Obtaining an understanding of relevant controls, including Group oversight and management review controls, over the preparation and use of cash flow forecasts used in the impairment reviews;
• Assessing the completeness of management’s impairment indicators assessment;• Assessing the integrity of the models used by management including reviewing their
mechanical accuracy;• Assessing management’s historical forecasting accuracy by comparing budgets to actuals;• Benchmarking management’s assumptions against views of internal industry experts, reputable
third-party industry growth forecasts, publications, news articles, government legislation and economic data;
• Challenging management’s analysis through comparison to external market data and considering contradictory evidence of the risks and opportunities arising from the transition to electric vehicles and the impact this has on forecast future cash flows;
• Evaluating the competence, capabilities and objectivity of management’s expert for both discount rate and property valuations;
• Engaging our internal real estate valuation specialists to assist in assessing valuation reports prepared by management’s expert;
• Involving internal fair value specialists to independently evaluate the appropriateness of inputs and methodology used in determining the discount rates used;
• Assessing the impact of global supply chain constraints due to semi-conductor shortages and Covid-19 has on the forecast cashflows;
• Performing sensitivities in order to challenge the reasonableness of management’s assumptions; and
• Assessing the appropriateness of management’s disclosures.
Key observations We concluded that the judgements management has made are reasonable.
There are sources of estimation uncertainty which remain, particularly the strength of the recovery in demand for vehicles and aftersales services after the impact of the Covid-19 pandemic, the risks and opportunities resulting from the transition to electric vehicles and in the short term, supply chain disruption.
We are satisfied that the Group’s disclosures in the Critical accounting judgements and sources of estimation uncertainty in the Accounting policies section, in note 11 Intangible Assets, note 12 Property, plant and equipment and note 13 Right-of-use-assets and lease liabilities appropriately highlight these uncertainties.
INDEPENDENT AUDITOR’S REPORT TO THE MEMBERS OF INCHCAPE PLC CONTINUED
114 INCHCAPE ANNUAL REPORT AND ACCOUNTS 2021
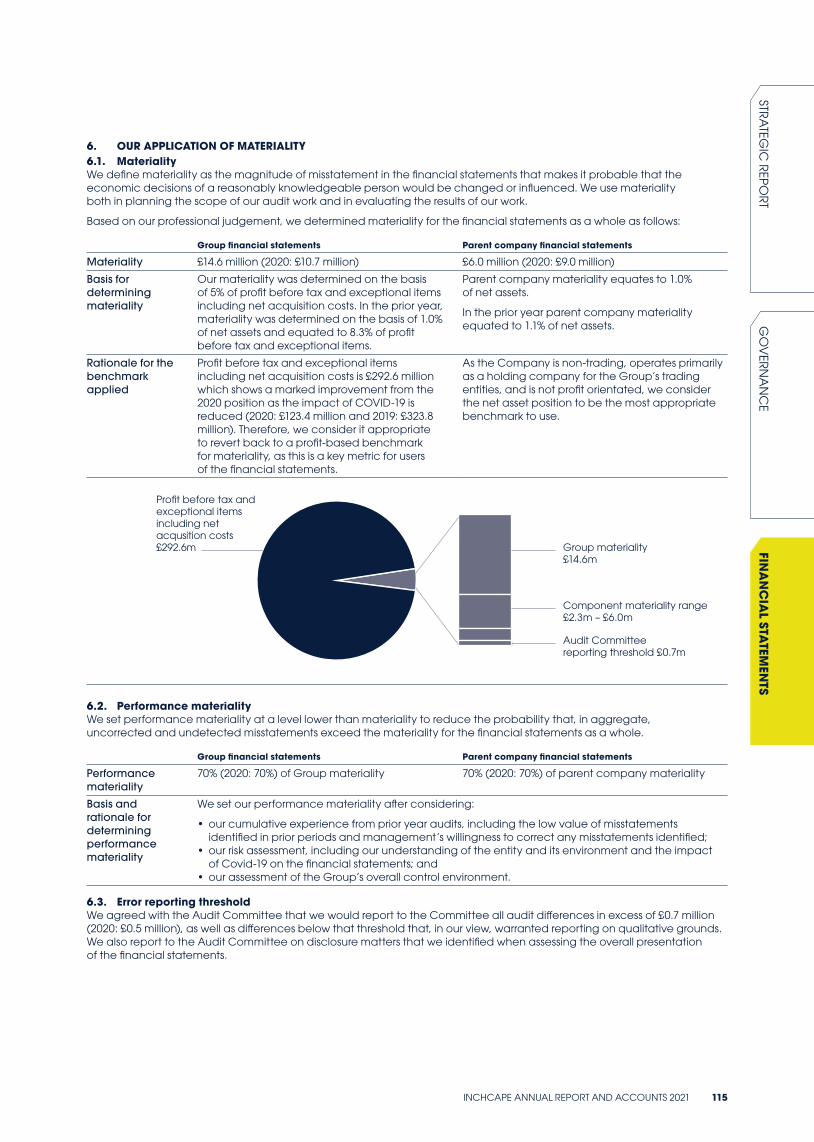
6. OUR APPLICATION OF MATERIALITY6.1. MaterialityWe define materiality as the magnitude of misstatement in the financial statements that makes it probable that the economic decisions of a reasonably knowledgeable person would be changed or influenced. We use materiality both in planning the scope of our audit work and in evaluating the results of our work.
Based on our professional judgement, we determined materiality for the financial statements as a whole as follows:
Group financial statements Parent company financial statements
Materiality £14.6 million (2020: £10.7 million) £6.0 million (2020: £9.0 million)
Basis for determining materiality
Our materiality was determined on the basis of 5% of profit before tax and exceptional items including net acquisition costs. In the prior year, materiality was determined on the basis of 1.0% of net assets and equated to 8.3% of profit before tax and exceptional items.
Parent company materiality equates to 1.0% of net assets.
In the prior year parent company materiality equated to 1.1% of net assets.
Rationale for the benchmark applied
Profit before tax and exceptional items including net acquisition costs is £292.6 million which shows a marked improvement from the 2020 position as the impact of COVID-19 is reduced (2020: £123.4 million and 2019: £323.8 million). Therefore, we consider it appropriate to revert back to a profit-based benchmark for materiality, as this is a key metric for users of the financial statements.
As the Company is non-trading, operates primarily as a holding company for the Group’s trading entities, and is not profit orientated, we consider the net asset position to be the most appropriate benchmark to use.
Profit before tax and exceptional items including net acqusition costs£292.6m Group materiality
£14.6m
Component materiality range £2.3m – £6.0m
Audit Committee reporting threshold £0.7m
6.2. Performance materialityWe set performance materiality at a level lower than materiality to reduce the probability that, in aggregate, uncorrected and undetected misstatements exceed the materiality for the financial statements as a whole.
Group financial statements Parent company financial statements
Performance materiality
70% (2020: 70%) of Group materiality 70% (2020: 70%) of parent company materiality
Basis and rationale for determining performance materiality
We set our performance materiality after considering:
• our cumulative experience from prior year audits, including the low value of misstatements identified in prior periods and management’s willingness to correct any misstatements identified;
• our risk assessment, including our understanding of the entity and its environment and the impact of Covid-19 on the financial statements; and
• our assessment of the Group’s overall control environment.
6.3. Error reporting thresholdWe agreed with the Audit Committee that we would report to the Committee all audit differences in excess of £0.7 million (2020: £0.5 million), as well as differences below that threshold that, in our view, warranted reporting on qualitative grounds. We also report to the Audit Committee on disclosure matters that we identified when assessing the overall presentation of the financial statements.
INCHCAPE ANNUAL REPORT AND ACCOUNTS 2021 115
STRA
TEGIC
REPO
RTG
OV
ERN
AN
CE
FINA
NC
IAL STA
TEMEN
TS

7. AN OVERVIEW OF THE SCOPE OF OUR AUDIT7.1. Identification and scoping of componentsIn selecting the components which are in scope for audit procedures to be performed as part of the Group audit, we consider:
• the inherent risk in each of the markets that the Group operates;• the Group’s control environment;• the significance of identified risks in each of the components;• the financial significance of the component to the Group’s revenue, profit/loss and net assets; and • the nature of any acquisitions and disposals within the year.
We conducted our work in 12 (2020: 18) countries, engaging 12 (2020: 18) component audit teams. Changes in the number of components identified were driven by the disposal of certain of the Group’s operations, as well as acquisitions and changes in the relative prominence and risk of other components within the Group.
Our significant components which were subject to full audit procedures, consistent with the prior year, were in Australia, Chile, Colombia, Ethiopia, Hong Kong, Russia, Singapore and the UK. Our components performed audits of specific account balances in Costa Rica, Poland, Romania and Peru.
As noted on page 72, during the year, the Board approved the establishment of a Global Business Services organisation (“GBS”). We considered the impact of this on our audit, noting that the transition was completed in some markets towards the end of the year, with management retaining a number of their finance team members in the affected components. We therefore retained our audit approach to use component teams in the relevant markets. Our component teams assessed the impact on the control environment and processes before and after the transition and performed additional audit procedures where these had changed significantly.
The range of component materialities applied, excluding the parent company, is £2.3 million to £6.0 million (2020: £1.9 million to £9 million). The reporting units where we conducted our audit work accounted for 76% (2020: 90%) of the Group’s revenue, 78% (2020: 90%) of the Group’s profit before taxation and 80% (2020: 90%) of the Group’s net assets.
REVENUE
Full audit scope
Specified audit procedures
Review at group level
68%
8%
24%
PROFIT BEFORE TAX
Full audit scope
Specified audit procedures
Review at group level
69%
9%
22%
NET ASSETS
Full audit scope
Specified audit procedures
Review at group level
68%
12%
20%
7.2. Working with other auditorsWe engaged component auditors from Deloitte member firms to perform procedures at these components under our direction and supervision. This approach also allows us to engage local auditors who have appropriate knowledge of local regulations to perform the audit work. We issued detailed instructions to the component auditors and held planning meetings, interim update meetings and year end close meetings with each component team. In the continued response to the Covid-19 pandemic which limits our ability to make component visits, frequent calls were held between the Group and component teams throughout the year and remote access to relevant documents was provided. A dedicated senior member of the Group audit team was assigned to facilitate an effective and consistent approach to component oversight, which focused on their audit work over key judgements.
In addition to the work performed at a component level the Group audit team also performed audit procedures on the parent company and consolidated financial statements, corporate activities such as treasury and pensions, goodwill and indefinite-life intangible asset impairments, litigation provisions, the consolidation, going concern assessment and financial statement disclosures. The Group audit team also performed analytical reviews on out-of-scope components.
7.3. Our consideration of the control environmentA part of our overall audit procedures, we have considered the control environment of the Group including the understanding of the key Information Technology (IT) controls in place designed to address the IT risks faced by the Group and how these relate to the entity’s financial reporting processes.
Due to the nature of the IT structures of the Group we have not adopted a single centralised approach to auditing IT controls across the Group and across global locations. As such, whilst our IT audit work continues to be co-ordinated by our
INDEPENDENT AUDITOR’S REPORT TO THE MEMBERS OF INCHCAPE PLC CONTINUED
116 INCHCAPE ANNUAL REPORT AND ACCOUNTS 2021
UK Group team, we have utilised component teams to test locally operated IT controls in audit relevant business units round the world, with the scope of IT work driven by local audit requirements and the maturity of the local control environment.
During the year, the transition to GBS across certain regions of the business commenced. We along with our component teams considered the impact on the control environment and processes before and after the transition and performed additional audit procedures where these had changed significantly.
Some components adopted a control reliance approach for certain business processes.
7.4. Our consideration of climate-related risksAs part of our audit procedures, we have considered the potential impact of climate change on the Group’s business and its financial statements.
The Group continues to develop its assessment of the potential impacts of climate change which is currently premised upon three scenarios; a low carbon scenario, a current policies scenario and a high carbon scenario, as explained in the Strategic Report on pages 40 to 44.
As a part of our audit, we have obtained management’s climate-related risk assessment and held discussions with the management to understand the process of identifying climate-related risks, the determination of mitigating actions and the impact on the Group’s financial statements. Management has considered that climate change is not expected to have a significant impact on short-term forecasts, have applied these adjustments to the outer years in the impairment models. Whilst at this stage there is significant uncertainty regarding what the long-term impact of climate change initiatives may be on the markets in which Inchcape operate in, the forecasts reflect managements assessment of their best estimate made in the financial statements as explained in note 11 on page 154.
We performed our own qualitative risk assessment of the potential impact of climate change on the Group’s account balances and classes of transaction and did not identify any reasonably possible risks of material misstatement. Our procedures were performed with the involvement of our climate change and sustainability specialists and included reading disclosures included in the Strategic Report to consider whether they are materially consistent with the financial statements and our knowledge obtained in the audit.
8. OTHER INFORMATIONThe other information comprises the information included in the annual report, other than the financial statements and our auditor’s report thereon. The directors are responsible for the other information contained within the annual report.
Our opinion on the financial statements does not cover the other information and, except to the extent otherwise explicitly stated in our report, we do not express any form of assurance conclusion thereon.
Our responsibility is to read the other information and, in doing so, consider whether the other information is materially inconsistent with the financial statements or our knowledge obtained in the course of the audit, or otherwise appears to be materially misstated.
If we identify such material inconsistencies or apparent material misstatements, we are required to determine whether this gives rise to a material misstatement in the financial statements themselves. If, based on the work we have performed, we conclude that there is a material misstatement of this other information, we are required to report that fact.
We have nothing to report in this regard.
9. RESPONSIBILITIES OF DIRECTORSAs explained more fully in the directors’ responsibilities statement, the directors are responsible for the preparation of the financial statements and for being satisfied that they give a true and fair view, and for such internal control as the directors determine is necessary to enable the preparation of financial statements that are free from material misstatement, whether due to fraud or error.
In preparing the financial statements, the directors are responsible for assessing the Group’s and the parent company’s ability to continue as a going concern, disclosing as applicable, matters related to going concern and using the going concern basis of accounting unless the directors either intend to liquidate the Group or the parent company or to cease operations, or have no realistic alternative but to do so.
10. AUDITOR’S RESPONSIBILITIES FOR THE AUDIT OF THE FINANCIAL STATEMENTSOur objectives are to obtain reasonable assurance about whether the financial statements as a whole are free from material misstatement, whether due to fraud or error, and to issue an auditor’s report that includes our opinion. Reasonable assurance is a high level of assurance but is not a guarantee that an audit conducted in accordance with ISAs (UK) will always detect a material misstatement when it exists. Misstatements can arise from fraud or error and are considered material if, individually or in the aggregate, they could reasonably be expected to influence the economic decisions of users taken on the basis of these financial statements.
A further description of our responsibilities for the audit of the financial statements is located on the FRC’s website at: www.frc.org.uk/auditorsresponsibilities. This description forms part of our auditor’s report.
11. EXTENT TO WHICH THE AUDIT WAS CONSIDERED CAPABLE OF DETECTING IRREGULARITIES, INCLUDING FRAUDIrregularities, including fraud, are instances of non-compliance with laws and regulations. We design procedures in line with our responsibilities, outlined above, to detect material misstatements in respect of irregularities, including fraud. The extent to which our procedures are capable of detecting irregularities, including fraud is detailed below.
INCHCAPE ANNUAL REPORT AND ACCOUNTS 2021 117
STRA
TEGIC
REPO
RTG
OV
ERN
AN
CE
FINA
NC
IAL STA
TEMEN
TS
11.1. Identifying and assessing potential risks related to irregularitiesIn identifying and assessing risks of material misstatement in respect of irregularities, including fraud and non-compliance with laws and regulations, we considered the following:
• the nature of the industry and sector, control environment and business performance including the design of the Group’s remuneration policies, key drivers for directors’ remuneration, bonus levels and performance targets;
• results of our enquiries of management, internal audit, in-house legal counsel and the audit committee about their own identification and assessment of the risks of irregularities;
• any matters we identified having obtained and reviewed the Group’s documentation of their policies and procedures relating to:
– identifying, evaluating and complying with laws and regulations and whether they were aware of any instances of non-compliance;
– detecting and responding to the risks of fraud and whether they have knowledge of any actual, suspected or alleged fraud;
– the internal controls established to mitigate risks of fraud or non-compliance with laws and regulations;
• the matters discussed among the audit engagement team including significant component audit teams and relevant internal specialists, including tax, fair value, real estate, pensions, financial instruments and IT specialists regarding how and where fraud might occur in the financial statements and any potential indicators of fraud; and
• understood the process by which management understood and identified fraud risk factors across the business, paying particular attention to any specific fraud risk factors identified and tailoring our audit response accordingly.
As a result of these procedures, we considered the opportunities and incentives that may exist within the organisation for fraud and identified the greatest potential for fraud in the judgements related to Central America goodwill and indefinite-life intangible asset impairment as well as UK site impairment. In common with all audits under ISAs (UK), we are also required to perform specific procedures to respond to the risk of management override.
We also obtained an understanding of the legal and regulatory frameworks that the Group operates in, focusing on provisions of those laws and regulations that had a direct effect on the determination of material amounts and disclosures in the financial statements. The key laws and regulations we considered in this context included the UK Companies Act, Listing Rules, pensions legislation and tax legislation.
In addition, we considered provisions of other laws and regulations that do not have a direct effect on the financial statements but compliance with which may be fundamental to the Group’s ability to operate or to avoid a material penalty. These included the Group’s environmental regulations.
11.2. Audit response to risks identifiedAs a result of performing the above, we identified UK site impairment and Central America goodwill and indefinite-life intangible asset impairments as key audit matters related to the potential risk of fraud. The key audit matters section of our report explains the matters in more detail and also describes the specific procedures we performed in response to those key audit matters.
In addition to the above, our procedures to respond to risks identified included the following:
• reviewing the financial statement disclosures and testing to supporting documentation to assess compliance with provisions of relevant laws and regulations described as having a direct effect on the financial statements;
• enquiring of management, the audit committee and in-house legal counsel concerning actual and potential litigation and claims;
• performing analytical procedures to identify any unusual or unexpected relationships that may indicate risks of material misstatement due to fraud;
• reading minutes of meetings of those charged with governance, reviewing internal audit reports and reviewing correspondence with HMRC; and
• in addressing the risk of fraud through management override of controls, testing the appropriateness of journal entries and other adjustments; assessing whether the judgements made in making accounting estimates are indicative of a potential bias; and evaluating the business rationale of any significant transactions that are unusual or outside the normal course of business.
We also communicated relevant identified laws and regulations and potential fraud risks to all engagement team members including internal specialists and significant component audit teams and remained alert to any indications of fraud or non-compliance with laws and regulations throughout the audit.
REPORT ON OTHER LEGAL AND REGULATORY REQUIREMENTS
12. OPINIONS ON OTHER MATTERS PRESCRIBED BY THE COMPANIES ACT 2006In our opinion the part of the directors’ remuneration report to be audited has been properly prepared in accordance with the Companies Act 2006.
In our opinion, based on the work undertaken in the course of the audit:
• the information given in the strategic report and the directors’ report for the financial year for which the financial statements are prepared is consistent with the financial statements; and
• the strategic report and the directors’ report have been prepared in accordance with applicable legal requirements.
In the light of the knowledge and understanding of the Group and the parent company and their environment obtained in the course of the audit, we have not identified any material misstatements in the strategic report or the directors’ report.
INDEPENDENT AUDITOR’S REPORT TO THE MEMBERS OF INCHCAPE PLC CONTINUED
118 INCHCAPE ANNUAL REPORT AND ACCOUNTS 2021
13. CORPORATE GOVERNANCE STATEMENTThe Listing Rules require us to review the directors’ statement in relation to going concern, longer-term viability and that part of the Corporate Governance Statement relating to the Group’s compliance with the provisions of the UK Corporate Governance Code specified for our review.
Based on the work undertaken as part of our audit, we have concluded that each of the following elements of the Corporate Governance Statement is materially consistent with the financial statements and our knowledge obtained during the audit:
• the directors’ statement with regards to the appropriateness of adopting the going concern basis of accounting and any material uncertainties identified set out on page 108;
• the directors’ explanation as to its assessment of the Group’s prospects, the period this assessment covers and why the period is appropriate set out on page 56;
• the directors’ statement on fair, balanced and understandable set out on page 79;• the board’s confirmation that it has carried out a robust assessment of the emerging and principal risks set out on
page 66;• the section of the annual report that describes the review of effectiveness of risk management and internal control
systems set out on page 79; and• the section describing the work of the audit committee set out on page 77.
14. MATTERS ON WHICH WE ARE REQUIRED TO REPORT BY EXCEPTION14.1. Adequacy of explanations received and accounting recordsUnder the Companies Act 2006 we are required to report to you if, in our opinion:
• we have not received all the information and explanations we require for our audit; or• adequate accounting records have not been kept by the parent company, or returns adequate for our audit have not
been received from branches not visited by us; or• the parent company financial statements are not in agreement with the accounting records and returns.
We have nothing to report in respect of these matters.
14.2. Directors’ remunerationUnder the Companies Act 2006 we are also required to report if in our opinion certain disclosures of directors’ remuneration have not been made or the part of the directors’ remuneration report to be audited is not in agreement with the accounting records and returns.
We have nothing to report in respect of these matters.
15. OTHER MATTERS WHICH WE ARE REQUIRED TO ADDRESS15.1. Auditor tenureFollowing the recommendation of the audit committee, we were appointed by the members on 25 May 2018 to audit the financial statements for the year ending 31 December 2018 and subsequent financial periods. The period of total uninterrupted engagement including previous renewals and reappointments of the firm is four years, covering the years ending 31 December 2018 to 31 December 2021.
15.2. Consistency of the audit report with the additional report to the audit committeeOur audit opinion is consistent with the additional report to the audit committee we are required to provide in accordance with ISAs (UK).
16. USE OF OUR REPORTThis report is made solely to the company’s members, as a body, in accordance with Chapter 3 of Part 16 of the Companies Act 2006. Our audit work has been undertaken so that we might state to the company’s members those matters we are required to state to them in an auditor’s report and for no other purpose. To the fullest extent permitted by law, we do not accept or assume responsibility to anyone other than the company and the company’s members as a body, for our audit work, for this report, or for the opinions we have formed.
As required by the Financial Conduct Authority (FCA) Disclosure Guidance and Transparency Rule (DTR) 4.1.14R, these financial statements form part of the European Single Electronic Format (ESEF) prepared Annual Financial Report filed on the National Storage Mechanism of the UK FCA in accordance with the ESEF Regulatory Technical Standard ((‘ESEF RTS’). This auditor’s report provides no assurance over whether the annual financial report has been prepared using the single electronic format specified in the ESEF RTS.
ANNA MARKS FCA SENIOR STATUTORY AUDITOR For and on behalf of Deloitte LLP
Statutory Auditor
London, UK
25 February 2022
INCHCAPE ANNUAL REPORT AND ACCOUNTS 2021 119
STRA
TEGIC
REPO
RTG
OV
ERN
AN
CE
FINA
NC
IAL STA
TEMEN
TS
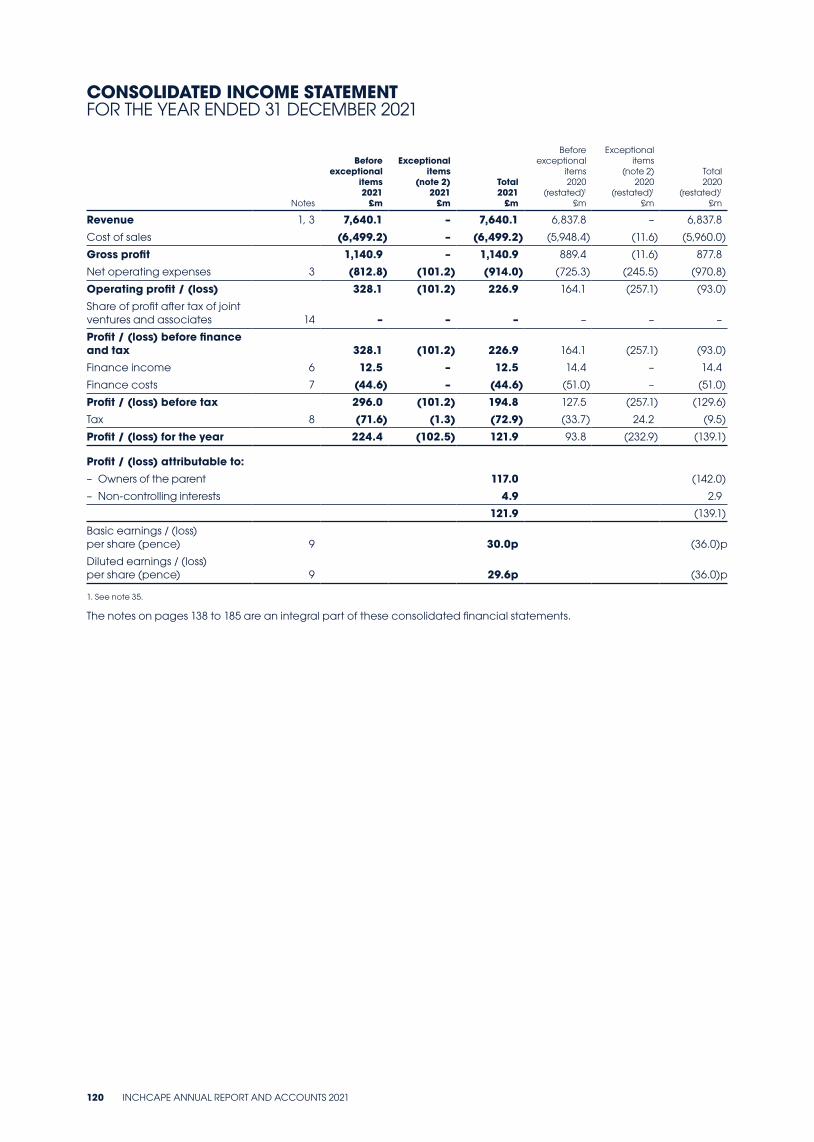
CONSOLIDATED INCOME STATEMENT FOR THE YEAR ENDED 31 DECEMBER 2021
Notes
Before exceptional
items 2021
£m
Exceptional items
(note 2) 2021
£m
Total 2021
£m
Before exceptional
items 2020
(restated)1 £m
Exceptional items
(note 2) 2020
(restated)1 £m
Total 2020
(restated)1 £m
Revenue 1, 3 7,640.1 – 7,640.1 6,837.8 – 6,837.8
Cost of sales (6,499.2) – (6,499.2) (5,948.4) (11.6) (5,960.0)
Gross profit 1,140.9 – 1,140.9 889.4 (11.6) 877.8
Net operating expenses 3 (812.8) (101.2) (914.0) (725.3) (245.5) (970.8)
Operating profit / (loss) 328.1 (101.2) 226.9 164.1 (257.1) (93.0)
Share of profit after tax of joint ventures and associates 14 – – – – – –
Profit / (loss) before finance and tax 328.1 (101.2) 226.9 164.1 (257.1) (93.0)
Finance income 6 12.5 – 12.5 14.4 – 14.4
Finance costs 7 (44.6) – (44.6) (51.0) – (51.0)
Profit / (loss) before tax 296.0 (101.2) 194.8 127.5 (257.1) (129.6)
Tax 8 (71.6) (1.3) (72.9) (33.7) 24.2 (9.5)
Profit / (loss) for the year 224.4 (102.5) 121.9 93.8 (232.9) (139.1)
Profit / (loss) attributable to: – Owners of the parent 117.0 (142.0)
– Non-controlling interests 4.9 2.9
121.9 (139.1)
Basic earnings / (loss) per share (pence) 9 30.0p (36.0)p
Diluted earnings / (loss) per share (pence) 9 29.6p (36.0)p
1. See note 35.
The notes on pages 138 to 185 are an integral part of these consolidated financial statements.
120 INCHCAPE ANNUAL REPORT AND ACCOUNTS 2021
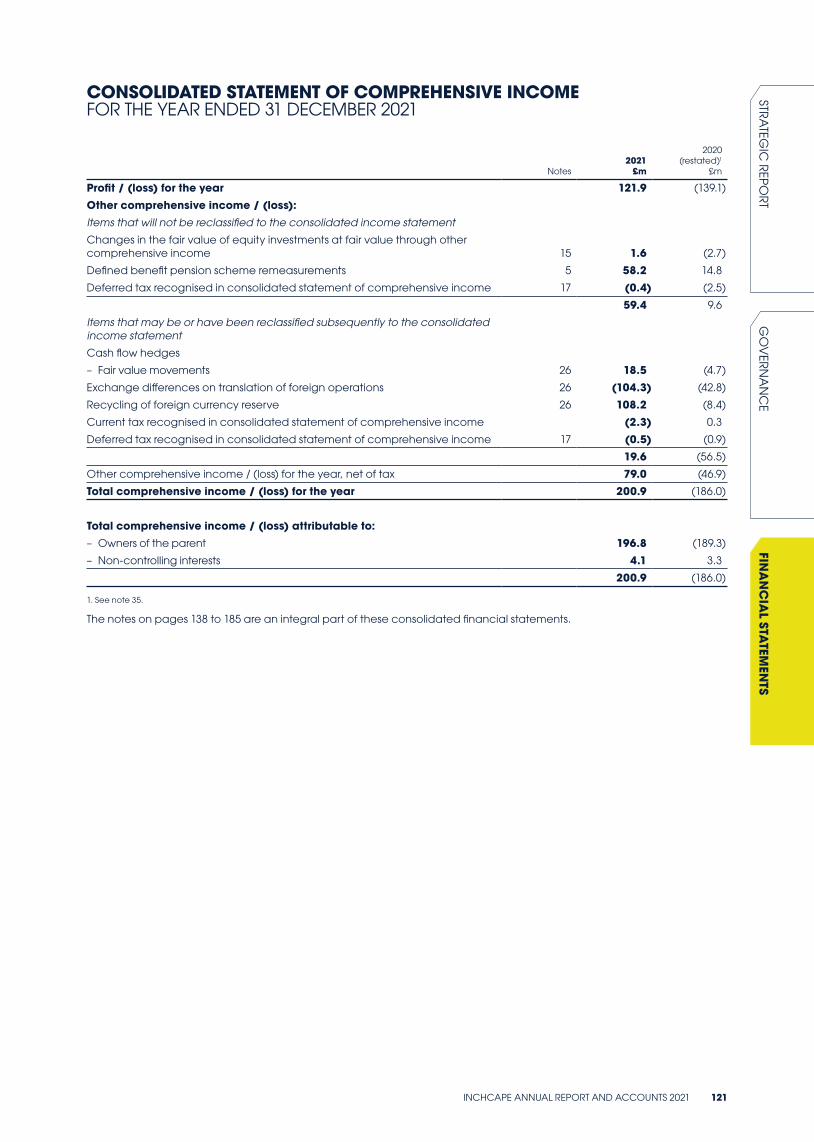
CONSOLIDATED STATEMENT OF COMPREHENSIVE INCOME FOR THE YEAR ENDED 31 DECEMBER 2021
Notes2021
£m
2020(restated)1
£m
Profit / (loss) for the year 121.9 (139.1)
Other comprehensive income / (loss):Items that will not be reclassified to the consolidated income statement
Changes in the fair value of equity investments at fair value through other comprehensive income 15 1.6 (2.7)
Defined benefit pension scheme remeasurements 5 58.2 14.8
Deferred tax recognised in consolidated statement of comprehensive income 17 (0.4) (2.5)
59.4 9.6
Items that may be or have been reclassified subsequently to the consolidated income statement
Cash flow hedges
– Fair value movements 26 18.5 (4.7)
Exchange differences on translation of foreign operations 26 (104.3) (42.8)
Recycling of foreign currency reserve 26 108.2 (8.4)
Current tax recognised in consolidated statement of comprehensive income (2.3) 0.3
Deferred tax recognised in consolidated statement of comprehensive income 17 (0.5) (0.9)
19.6 (56.5)
Other comprehensive income / (loss) for the year, net of tax 79.0 (46.9)
Total comprehensive income / (loss) for the year 200.9 (186.0)
Total comprehensive income / (loss) attributable to: – Owners of the parent 196.8 (189.3)
– Non-controlling interests 4.1 3.3
200.9 (186.0)
1. See note 35.
The notes on pages 138 to 185 are an integral part of these consolidated financial statements.
INCHCAPE ANNUAL REPORT AND ACCOUNTS 2021 121
STRA
TEGIC
REPO
RTG
OV
ERN
AN
CE
FINA
NC
IAL STA
TEMEN
TS
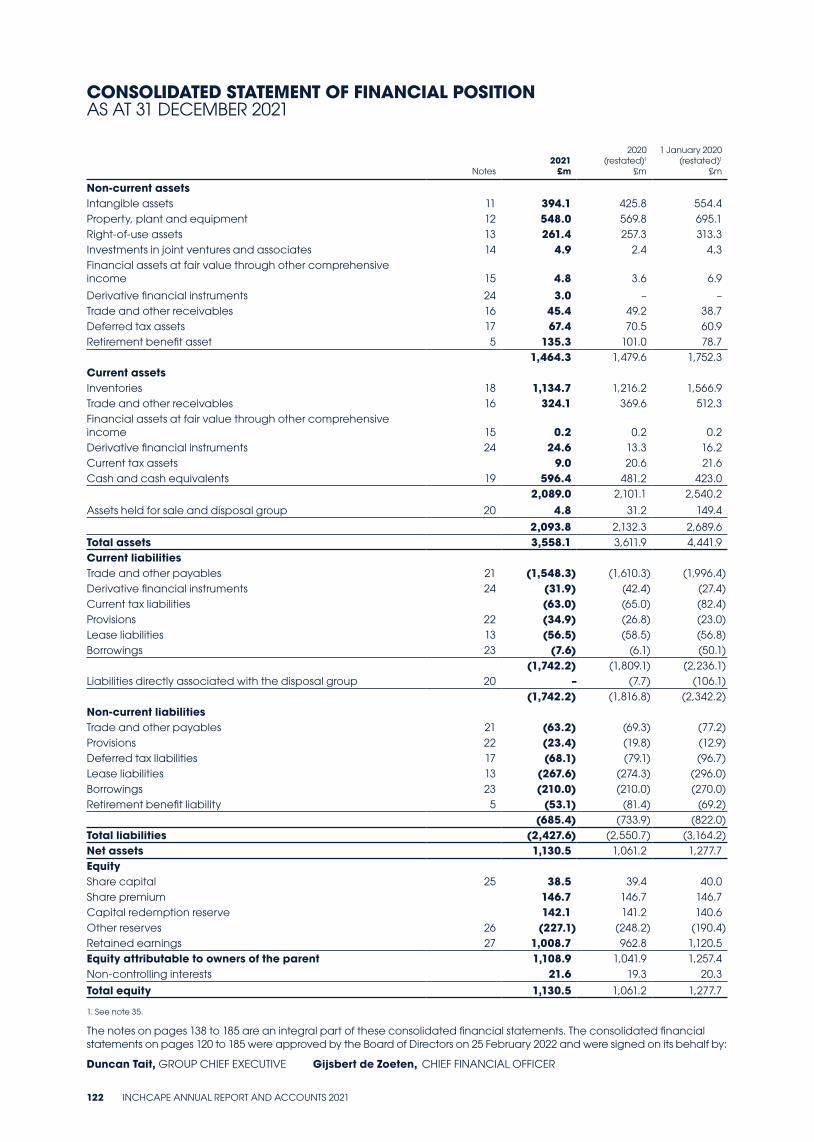
CONSOLIDATED STATEMENT OF FINANCIAL POSITION AS AT 31 DECEMBER 2021
Notes 2021
£m
2020(restated)1
£m
1 January 2020(restated)1
£m
Non-current assetsIntangible assets 11 394.1 425.8 554.4Property, plant and equipment 12 548.0 569.8 695.1Right-of-use assets 13 261.4 257.3 313.3Investments in joint ventures and associates 14 4.9 2.4 4.3Financial assets at fair value through other comprehensive income 15 4.8 3.6 6.9
Derivative financial instruments 24 3.0 – –Trade and other receivables 16 45.4 49.2 38.7Deferred tax assets 17 67.4 70.5 60.9Retirement benefit asset 5 135.3 101.0 78.7
1,464.3 1,479.6 1,752.3Current assetsInventories 18 1,134.7 1,216.2 1,566.9Trade and other receivables 16 324.1 369.6 512.3Financial assets at fair value through other comprehensive income 15 0.2 0.2 0.2Derivative financial instruments 24 24.6 13.3 16.2Current tax assets 9.0 20.6 21.6Cash and cash equivalents 19 596.4 481.2 423.0
2,089.0 2,101.1 2,540.2
Assets held for sale and disposal group 20 4.8 31.2 149.4
2,093.8 2,132.3 2,689.6Total assets 3,558.1 3,611.9 4,441.9Current liabilitiesTrade and other payables 21 (1,548.3) (1,610.3) (1,996.4)Derivative financial instruments 24 (31.9) (42.4) (27.4)Current tax liabilities (63.0) (65.0) (82.4)Provisions 22 (34.9) (26.8) (23.0)Lease liabilities 13 (56.5) (58.5) (56.8)Borrowings 23 (7.6) (6.1) (50.1)
(1,742.2) (1,809.1) (2,236.1)Liabilities directly associated with the disposal group 20 – (7.7) (106.1)
(1,742.2) (1,816.8) (2,342.2)Non-current liabilitiesTrade and other payables 21 (63.2) (69.3) (77.2)Provisions 22 (23.4) (19.8) (12.9)Deferred tax liabilities 17 (68.1) (79.1) (96.7)Lease liabilities 13 (267.6) (274.3) (296.0)Borrowings 23 (210.0) (210.0) (270.0)Retirement benefit liability 5 (53.1) (81.4) (69.2)
(685.4) (733.9) (822.0)Total liabilities (2,427.6) (2,550.7) (3,164.2)Net assets 1,130.5 1,061.2 1,277.7EquityShare capital 25 38.5 39.4 40.0Share premium 146.7 146.7 146.7Capital redemption reserve 142.1 141.2 140.6Other reserves 26 (227.1) (248.2) (190.4)Retained earnings 27 1,008.7 962.8 1,120.5Equity attributable to owners of the parent 1,108.9 1,041.9 1,257.4Non-controlling interests 21.6 19.3 20.3
Total equity 1,130.5 1,061.2 1,277.7
1. See note 35.
The notes on pages 138 to 185 are an integral part of these consolidated financial statements. The consolidated financial statements on pages 120 to 185 were approved by the Board of Directors on 25 February 2022 and were signed on its behalf by:
Duncan Tait, GROUP CHIEF EXECUTIVE Gijsbert de Zoeten, CHIEF FINANCIAL OFFICER
122 INCHCAPE ANNUAL REPORT AND ACCOUNTS 2021
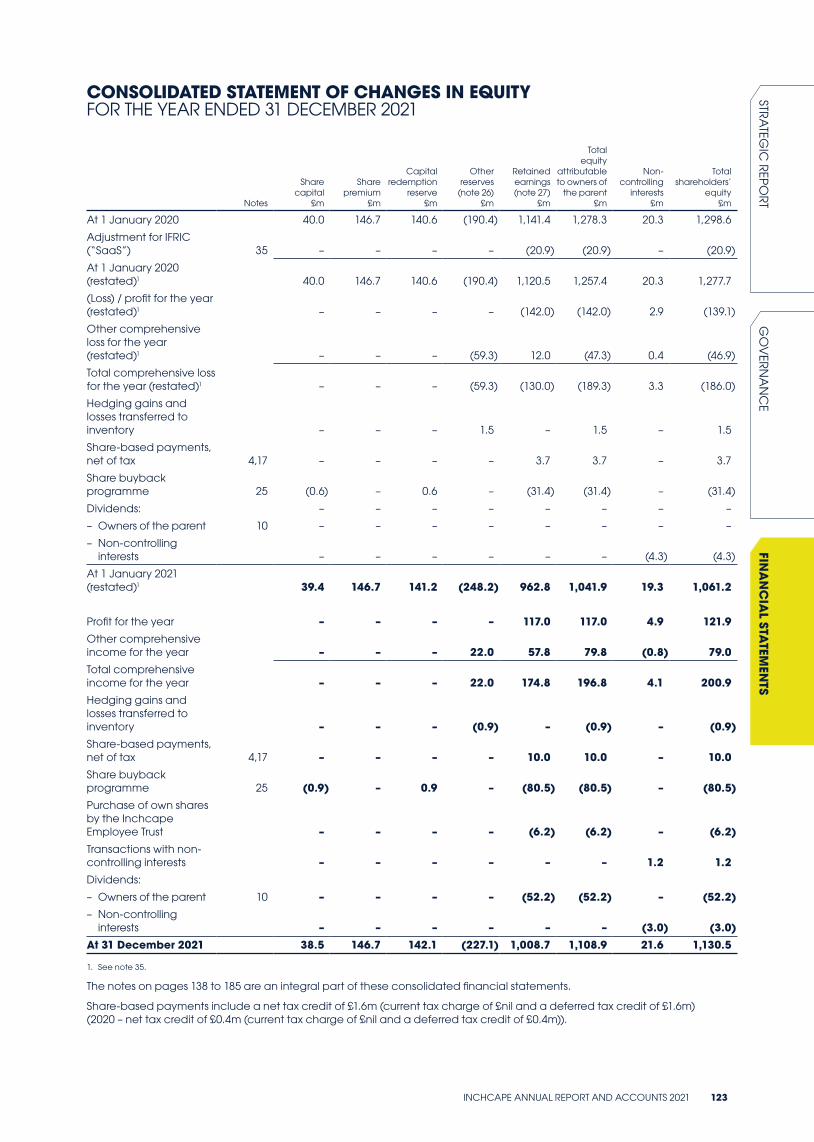
CONSOLIDATED STATEMENT OF CHANGES IN EQUITY FOR THE YEAR ENDED 31 DECEMBER 2021
Notes
Share capital
£m
Share premium
£m
Capital redemption
reserve £m
Other reserves
(note 26) £m
Retained earnings (note 27)
£m
Total equity
attributable to owners of
the parent £m
Non-controlling
interests £m
Total shareholders’
equity £m
At 1 January 2020 40.0 146.7 140.6 (190.4) 1,141.4 1,278.3 20.3 1,298.6
Adjustment for IFRIC (“SaaS”) 35 – – – – (20.9) (20.9) – (20.9)
At 1 January 2020 (restated)1 40.0 146.7 140.6 (190.4) 1,120.5 1,257.4 20.3 1,277.7
(Loss) / profit for the year (restated)1 – – – – (142.0) (142.0) 2.9 (139.1)
Other comprehensive loss for the year (restated)1 – – – (59.3) 12.0 (47.3) 0.4 (46.9)
Total comprehensive loss for the year (restated)1 – – – (59.3) (130.0) (189.3) 3.3 (186.0)
Hedging gains and losses transferred to inventory – – – 1.5 – 1.5 – 1.5
Share-based payments, net of tax 4,17 – – – – 3.7 3.7 – 3.7
Share buyback programme 25 (0.6) – 0.6 – (31.4) (31.4) – (31.4)
Dividends: – – – – – – – –
– Owners of the parent 10 – – – – – – – –
– Non-controlling interests – – – – – – (4.3) (4.3)
At 1 January 2021 (restated)1 39.4 146.7 141.2 (248.2) 962.8 1,041.9 19.3 1,061.2
Profit for the year – – – – 117.0 117.0 4.9 121.9Other comprehensive income for the year – – – 22.0 57.8 79.8 (0.8) 79.0Total comprehensive income for the year – – – 22.0 174.8 196.8 4.1 200.9Hedging gains and losses transferred to inventory – – – (0.9) – (0.9) – (0.9)Share-based payments, net of tax 4,17 – – – – 10.0 10.0 – 10.0Share buyback programme 25 (0.9) – 0.9 – (80.5) (80.5) – (80.5)Purchase of own shares by the Inchcape Employee Trust – – – – (6.2) (6.2) – (6.2)Transactions with non-controlling interests – – – – – – 1.2 1.2Dividends:
– Owners of the parent 10 – – – – (52.2) (52.2) – (52.2) – Non-controlling
interests – – – – – – (3.0) (3.0)At 31 December 2021 38.5 146.7 142.1 (227.1) 1,008.7 1,108.9 21.6 1,130.5
1. See note 35.
The notes on pages 138 to 185 are an integral part of these consolidated financial statements.
Share-based payments include a net tax credit of £1.6m (current tax charge of £nil and a deferred tax credit of £1.6m) (2020 – net tax credit of £0.4m (current tax charge of £nil and a deferred tax credit of £0.4m)).
INCHCAPE ANNUAL REPORT AND ACCOUNTS 2021 123
STRA
TEGIC
REPO
RTG
OV
ERN
AN
CE
FINA
NC
IAL STA
TEMEN
TS
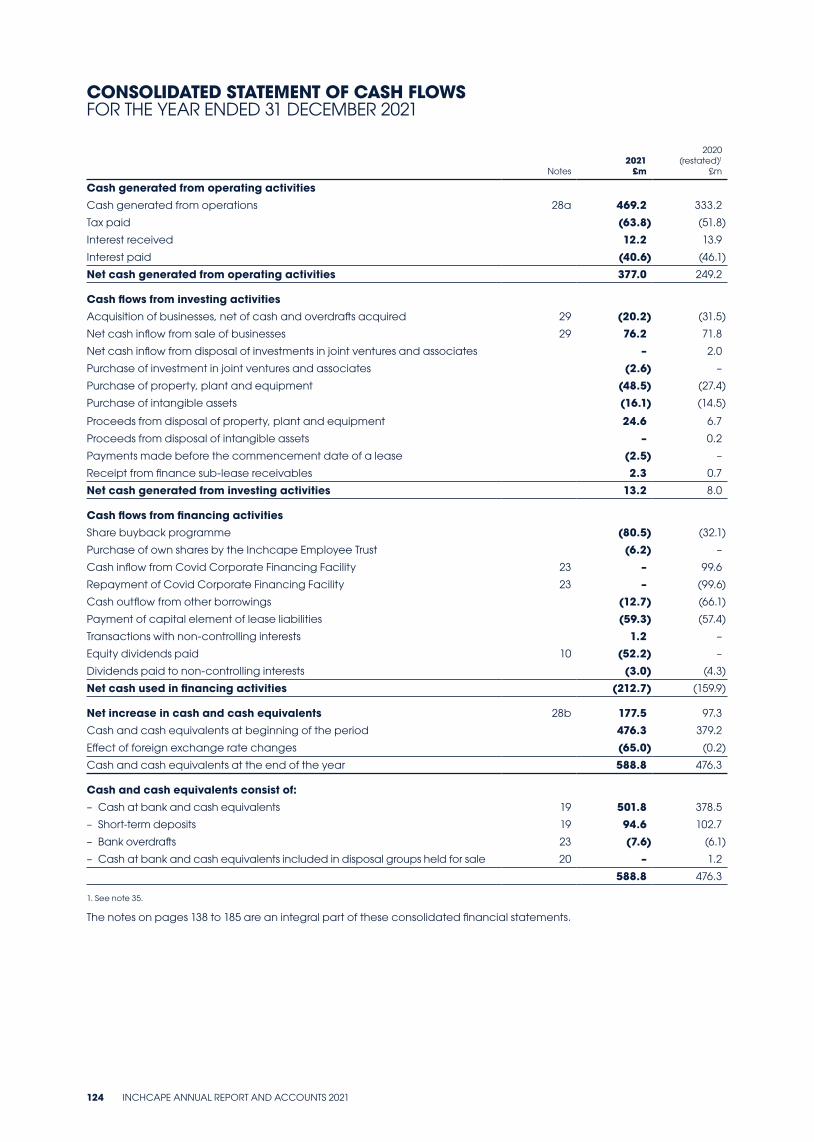
CONSOLIDATED STATEMENT OF CASH FLOWS FOR THE YEAR ENDED 31 DECEMBER 2021
Notes2021
£m
2020(restated)1
£m
Cash generated from operating activitiesCash generated from operations 28a 469.2 333.2
Tax paid (63.8) (51.8)
Interest received 12.2 13.9
Interest paid (40.6) (46.1)
Net cash generated from operating activities 377.0 249.2
Cash flows from investing activitiesAcquisition of businesses, net of cash and overdrafts acquired 29 (20.2) (31.5)
Net cash inflow from sale of businesses 29 76.2 71.8
Net cash inflow from disposal of investments in joint ventures and associates – 2.0
Purchase of investment in joint ventures and associates (2.6) –
Purchase of property, plant and equipment (48.5) (27.4)
Purchase of intangible assets (16.1) (14.5)
Proceeds from disposal of property, plant and equipment 24.6 6.7
Proceeds from disposal of intangible assets – 0.2
Payments made before the commencement date of a lease (2.5) –
Receipt from finance sub-lease receivables 2.3 0.7
Net cash generated from investing activities 13.2 8.0
Cash flows from financing activities Share buyback programme (80.5) (32.1)
Purchase of own shares by the Inchcape Employee Trust (6.2) –
Cash inflow from Covid Corporate Financing Facility 23 – 99.6
Repayment of Covid Corporate Financing Facility 23 – (99.6)
Cash outflow from other borrowings (12.7) (66.1)
Payment of capital element of lease liabilities (59.3) (57.4)
Transactions with non-controlling interests 1.2 –
Equity dividends paid 10 (52.2) –
Dividends paid to non-controlling interests (3.0) (4.3)
Net cash used in financing activities (212.7) (159.9)
Net increase in cash and cash equivalents 28b 177.5 97.3
Cash and cash equivalents at beginning of the period 476.3 379.2
Effect of foreign exchange rate changes (65.0) (0.2)
Cash and cash equivalents at the end of the year 588.8 476.3
Cash and cash equivalents consist of: – Cash at bank and cash equivalents 19 501.8 378.5
– Short-term deposits 19 94.6 102.7
– Bank overdrafts 23 (7.6) (6.1)
– Cash at bank and cash equivalents included in disposal groups held for sale 20 – 1.2
588.8 476.3
1. See note 35.
The notes on pages 138 to 185 are an integral part of these consolidated financial statements.
124 INCHCAPE ANNUAL REPORT AND ACCOUNTS 2021
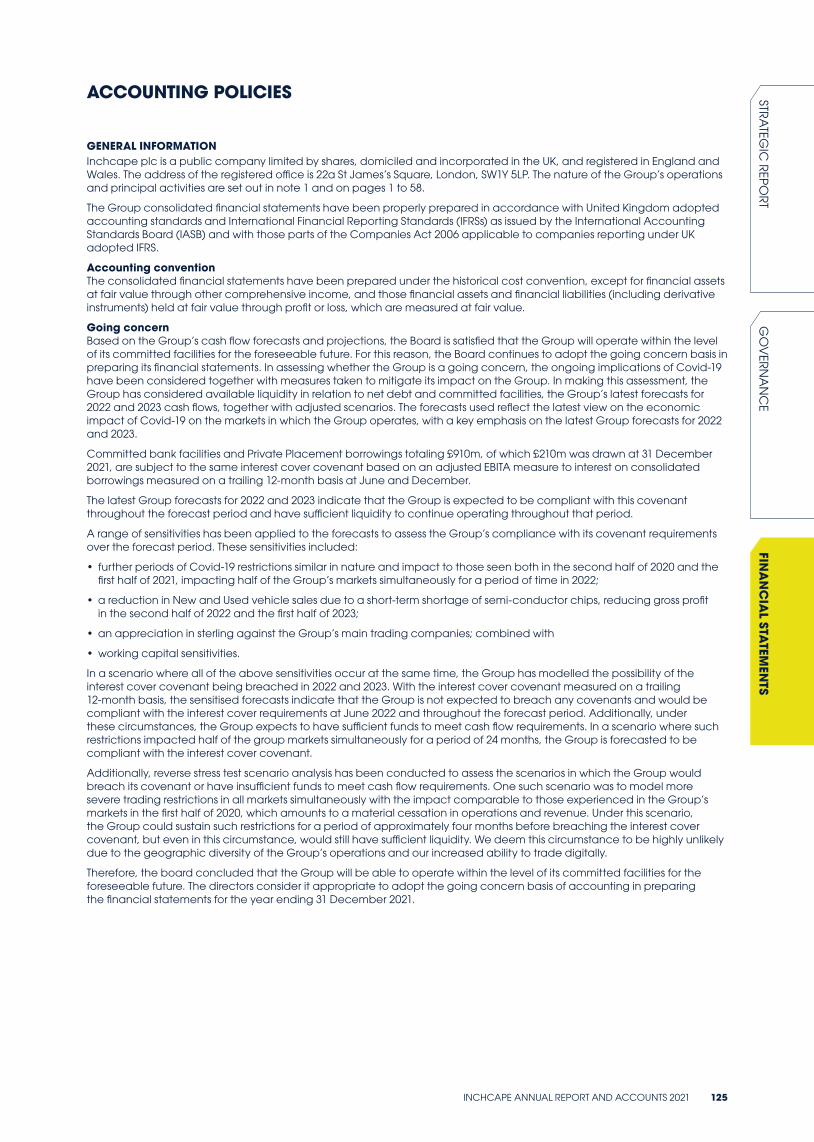
ACCOUNTING POLICIES
GENERAL INFORMATIONInchcape plc is a public company limited by shares, domiciled and incorporated in the UK, and registered in England and Wales. The address of the registered office is 22a St James’s Square, London, SW1Y 5LP. The nature of the Group’s operations and principal activities are set out in note 1 and on pages 1 to 58.
The Group consolidated financial statements have been properly prepared in accordance with United Kingdom adopted accounting standards and International Financial Reporting Standards (IFRSs) as issued by the International Accounting Standards Board (IASB) and with those parts of the Companies Act 2006 applicable to companies reporting under UK adopted IFRS.
Accounting conventionThe consolidated financial statements have been prepared under the historical cost convention, except for financial assets at fair value through other comprehensive income, and those financial assets and financial liabilities (including derivative instruments) held at fair value through profit or loss, which are measured at fair value.
Going concernBased on the Group’s cash flow forecasts and projections, the Board is satisfied that the Group will operate within the level of its committed facilities for the foreseeable future. For this reason, the Board continues to adopt the going concern basis in preparing its financial statements. In assessing whether the Group is a going concern, the ongoing implications of Covid-19 have been considered together with measures taken to mitigate its impact on the Group. In making this assessment, the Group has considered available liquidity in relation to net debt and committed facilities, the Group’s latest forecasts for 2022 and 2023 cash flows, together with adjusted scenarios. The forecasts used reflect the latest view on the economic impact of Covid-19 on the markets in which the Group operates, with a key emphasis on the latest Group forecasts for 2022 and 2023.
Committed bank facilities and Private Placement borrowings totaling £910m, of which £210m was drawn at 31 December 2021, are subject to the same interest cover covenant based on an adjusted EBITA measure to interest on consolidated borrowings measured on a trailing 12-month basis at June and December.
The latest Group forecasts for 2022 and 2023 indicate that the Group is expected to be compliant with this covenant throughout the forecast period and have sufficient liquidity to continue operating throughout that period.
A range of sensitivities has been applied to the forecasts to assess the Group’s compliance with its covenant requirements over the forecast period. These sensitivities included:
• further periods of Covid-19 restrictions similar in nature and impact to those seen both in the second half of 2020 and the first half of 2021, impacting half of the Group’s markets simultaneously for a period of time in 2022;
• a reduction in New and Used vehicle sales due to a short-term shortage of semi-conductor chips, reducing gross profit in the second half of 2022 and the first half of 2023;
• an appreciation in sterling against the Group’s main trading companies; combined with
• working capital sensitivities.
In a scenario where all of the above sensitivities occur at the same time, the Group has modelled the possibility of the interest cover covenant being breached in 2022 and 2023. With the interest cover covenant measured on a trailing 12-month basis, the sensitised forecasts indicate that the Group is not expected to breach any covenants and would be compliant with the interest cover requirements at June 2022 and throughout the forecast period. Additionally, under these circumstances, the Group expects to have sufficient funds to meet cash flow requirements. In a scenario where such restrictions impacted half of the group markets simultaneously for a period of 24 months, the Group is forecasted to be compliant with the interest cover covenant.
Additionally, reverse stress test scenario analysis has been conducted to assess the scenarios in which the Group would breach its covenant or have insufficient funds to meet cash flow requirements. One such scenario was to model more severe trading restrictions in all markets simultaneously with the impact comparable to those experienced in the Group’s markets in the first half of 2020, which amounts to a material cessation in operations and revenue. Under this scenario, the Group could sustain such restrictions for a period of approximately four months before breaching the interest cover covenant, but even in this circumstance, would still have sufficient liquidity. We deem this circumstance to be highly unlikely due to the geographic diversity of the Group’s operations and our increased ability to trade digitally.
Therefore, the board concluded that the Group will be able to operate within the level of its committed facilities for the foreseeable future. The directors consider it appropriate to adopt the going concern basis of accounting in preparing the financial statements for the year ending 31 December 2021.
INCHCAPE ANNUAL REPORT AND ACCOUNTS 2021 125
STRA
TEGIC
REPO
RTG
OV
ERN
AN
CE
FINA
NC
IAL STA
TEMEN
TS
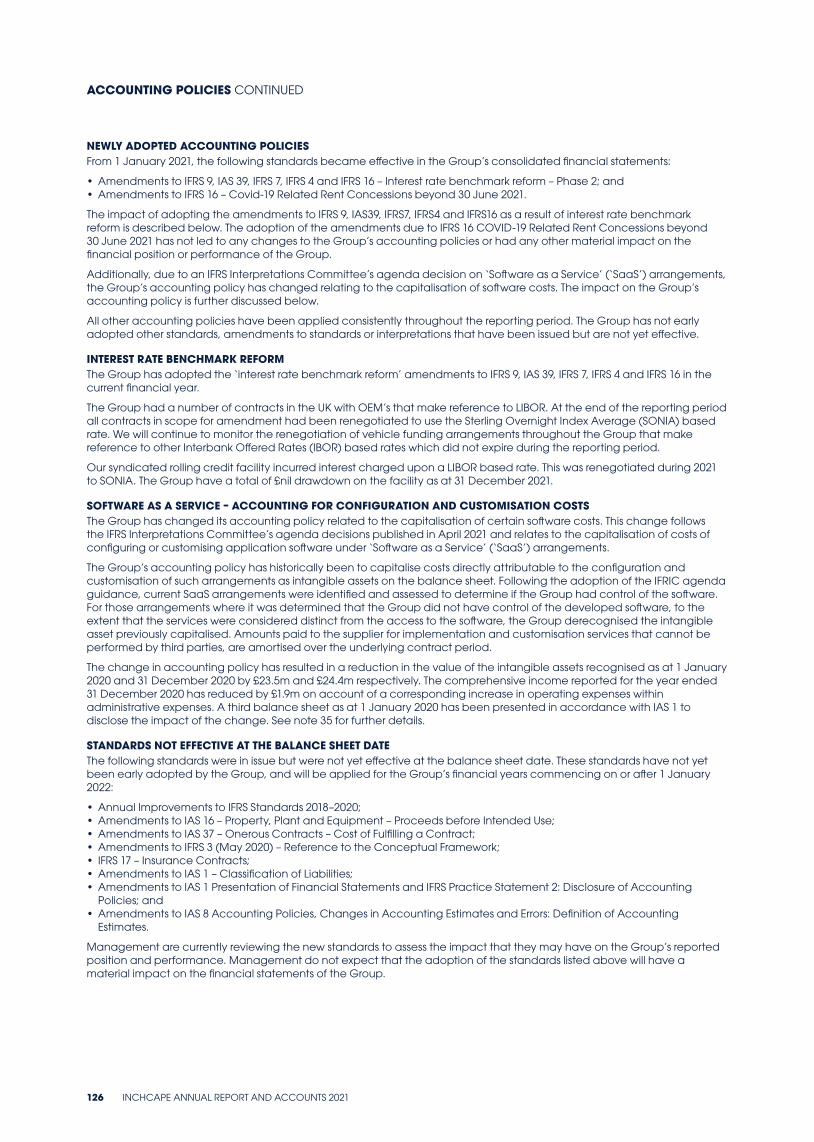
NEWLY ADOPTED ACCOUNTING POLICIESFrom 1 January 2021, the following standards became effective in the Group’s consolidated financial statements:
• Amendments to IFRS 9, IAS 39, IFRS 7, IFRS 4 and IFRS 16 – Interest rate benchmark reform – Phase 2; and• Amendments to IFRS 16 – Covid-19 Related Rent Concessions beyond 30 June 2021.
The impact of adopting the amendments to IFRS 9, IAS39, IFRS7, IFRS4 and IFRS16 as a result of interest rate benchmark reform is described below. The adoption of the amendments due to IFRS 16 COVID-19 Related Rent Concessions beyond 30 June 2021 has not led to any changes to the Group’s accounting policies or had any other material impact on the financial position or performance of the Group.
Additionally, due to an IFRS Interpretations Committee’s agenda decision on ‘Software as a Service’ (‘SaaS’) arrangements, the Group’s accounting policy has changed relating to the capitalisation of software costs. The impact on the Group’s accounting policy is further discussed below.
All other accounting policies have been applied consistently throughout the reporting period. The Group has not early adopted other standards, amendments to standards or interpretations that have been issued but are not yet effective.
INTEREST RATE BENCHMARK REFORM The Group has adopted the ‘interest rate benchmark reform’ amendments to IFRS 9, IAS 39, IFRS 7, IFRS 4 and IFRS 16 in the current financial year.
The Group had a number of contracts in the UK with OEM’s that make reference to LIBOR. At the end of the reporting period all contracts in scope for amendment had been renegotiated to use the Sterling Overnight Index Average (SONIA) based rate. We will continue to monitor the renegotiation of vehicle funding arrangements throughout the Group that make reference to other Interbank Offered Rates (IBOR) based rates which did not expire during the reporting period.
Our syndicated rolling credit facility incurred interest charged upon a LIBOR based rate. This was renegotiated during 2021 to SONIA. The Group have a total of £nil drawdown on the facility as at 31 December 2021.
SOFTWARE AS A SERVICE – ACCOUNTING FOR CONFIGURATION AND CUSTOMISATION COSTSThe Group has changed its accounting policy related to the capitalisation of certain software costs. This change follows the IFRS Interpretations Committee’s agenda decisions published in April 2021 and relates to the capitalisation of costs of configuring or customising application software under ‘Software as a Service’ (‘SaaS’) arrangements.
The Group’s accounting policy has historically been to capitalise costs directly attributable to the configuration and customisation of such arrangements as intangible assets on the balance sheet. Following the adoption of the IFRIC agenda guidance, current SaaS arrangements were identified and assessed to determine if the Group had control of the software. For those arrangements where it was determined that the Group did not have control of the developed software, to the extent that the services were considered distinct from the access to the software, the Group derecognised the intangible asset previously capitalised. Amounts paid to the supplier for implementation and customisation services that cannot be performed by third parties, are amortised over the underlying contract period.
The change in accounting policy has resulted in a reduction in the value of the intangible assets recognised as at 1 January 2020 and 31 December 2020 by £23.5m and £24.4m respectively. The comprehensive income reported for the year ended 31 December 2020 has reduced by £1.9m on account of a corresponding increase in operating expenses within administrative expenses. A third balance sheet as at 1 January 2020 has been presented in accordance with IAS 1 to disclose the impact of the change. See note 35 for further details.
STANDARDS NOT EFFECTIVE AT THE BALANCE SHEET DATEThe following standards were in issue but were not yet effective at the balance sheet date. These standards have not yet been early adopted by the Group, and will be applied for the Group’s financial years commencing on or after 1 January 2022:
• Annual Improvements to IFRS Standards 2018–2020;• Amendments to IAS 16 – Property, Plant and Equipment – Proceeds before Intended Use;• Amendments to IAS 37 – Onerous Contracts – Cost of Fulfilling a Contract;• Amendments to IFRS 3 (May 2020) – Reference to the Conceptual Framework;• IFRS 17 – Insurance Contracts;• Amendments to IAS 1 – Classification of Liabilities; • Amendments to IAS 1 Presentation of Financial Statements and IFRS Practice Statement 2: Disclosure of Accounting
Policies; and• Amendments to IAS 8 Accounting Policies, Changes in Accounting Estimates and Errors: Definition of Accounting
Estimates.
Management are currently reviewing the new standards to assess the impact that they may have on the Group’s reported position and performance. Management do not expect that the adoption of the standards listed above will have a material impact on the financial statements of the Group.
ACCOUNTING POLICIES CONTINUED
126 INCHCAPE ANNUAL REPORT AND ACCOUNTS 2021
BASIS OF CONSOLIDATIONThe consolidated financial statements comprise the financial statements of the parent company (Inchcape plc) and all of its subsidiary undertakings (defined as those where the Group has control), together with the Group’s share of the results of its joint ventures (defined as those where the Group has joint control) and associates (defined as those where the Group has significant influence but not control). The results of subsidiaries are consolidated and the Group’s share of results of its joint ventures and associates is equity accounted for as of the same reporting date as the parent company, using consistent accounting policies.
The results of newly acquired subsidiaries are consolidated using the acquisition method of accounting from the date on which control of the net assets and operations of the acquired company are effectively transferred to the Group. Similarly, the results of subsidiaries disposed of cease to be consolidated from the date on which control of the net assets and operations is transferred out of the Group.
The Group treats transactions with non-controlling interests as transactions with equity owners of the Group. For purchases from non-controlling interests, the difference between any consideration paid and the relevant share acquired of the carrying value of net assets of the subsidiary is recorded in equity. Gains or losses on disposals to non-controlling interests are also recorded in equity.
Investments in joint ventures and associates are accounted for using the equity method, whereby the Group’s share of post-acquisition profits or losses is recognised in the consolidated income statement, and its share of post-acquisition movements in shareholders’ equity is recognised in shareholders’ equity. If the Group’s share of losses in a joint venture or associate equals or exceeds its investment in the joint venture or associate, the Group does not recognise further losses, unless it has contractual obligations or made payments on behalf of the joint venture or associate.
Intercompany balances and transactions and any unrealised profits arising from intercompany transactions are eliminated in preparing the consolidated financial statements.
FOREIGN CURRENCY TRANSLATIONTransactions included in the results of each of the Group’s entities are measured using the currency of the primary economic environment in which the entity operates (the functional currency). The consolidated financial statements are presented in sterling, which is the functional currency of the parent company, Inchcape plc, and the presentation currency of the Group.
In the individual entities, transactions in foreign currencies are translated into the functional currency at the rates of exchange prevailing at the dates of the individual transactions. Monetary assets and liabilities denominated in foreign currencies are subsequently retranslated at the rate of exchange ruling at the end of the reporting period. All differences are taken to the consolidated income statement, except those exchange differences arising on long-term foreign currency borrowings that form part of a net investment in a foreign investment, which on consolidation are taken directly to other comprehensive income.
The assets and liabilities of foreign operations are translated into sterling at the rate of exchange ruling at the end of the reporting period. The income statements of foreign operations are translated into sterling at the average rates of exchange for the period. Exchange differences arising from 1 January 2004 are recognised as a separate component of shareholders’ equity. On disposal of a foreign operation, any cumulative exchange differences held in shareholders’ equity are transferred to the consolidated income statement.
REVENUE AND OTHER INCOMERevenue is measured at the fair value of consideration receivable, net of any discounts, rebates, trade allowances, incentives, or amounts collected on behalf of third parties. It is recognised to the extent that the transfer of promised goods or services to a customer has been satisfied and the revenue can be reliably measured. Revenue excludes sales-related taxes and intra-group transactions. In practice this means that:
Revenue from the sale of goods is recognised when the obligation to transfer the goods to the customer has been satisfied and the revenue can reliably be measured. The obligation to transfer goods to the customer is considered to have been satisfied when the vehicles or parts are invoiced and physically dispatched or collected.
Revenue from the rendering of services to the customer is considered to have been satisfied when the service has been undertaken.
Where the Group acts as an agent on behalf of a principal in relation to finance, insurance and similar products, the associated commission income is recognised within revenue in the period in which the related finance or insurance product is sold and receipt of payment can be assured.
Where a vehicle is sold to a leasing company and the Group undertakes to repurchase the vehicle for a specified value at a predetermined date, the sale is not recognised on the basis that the possibility of the buyback being exercised is highly likely. Consequently, such vehicles are retained within ‘property, plant and equipment’ in the consolidated statement of financial position at cost and are depreciated to their residual value over the life of the lease. The difference between the initial amounts received from the leasing company and the repurchase commitment is recognised as deferred income in the consolidated statement of financial position and is released to the consolidated income statement on a straight-line basis over the life of the lease. The repurchase commitment, which reflects the price at which the vehicle will be bought back, is held within ‘trade and other payables’, according to the date of the commitment.
INCHCAPE ANNUAL REPORT AND ACCOUNTS 2021 127
STRA
TEGIC
REPO
RTG
OV
ERN
AN
CE
FINA
NC
IAL STA
TEMEN
TS
Where a vehicle is sold subject to a buyback commitment and the possibility of the buyback being exercised by the customer is not highly likely as the buyback price set is below the expected market value, revenue is recognised in full when the vehicle is sold. However, an estimate of the value of the buyback payments is deducted from revenue and deferred to the balance sheet. Similarly, an estimate of the value of the vehicles to be returned is deducted from cost of sales and also deferred to the balance sheet. These balances are considered to be contract liabilities.
Where additional services are included in the sale of a vehicle to a customer as part of the total vehicle package (e.g. extended warranty, free servicing, roadside assistance, fuel coupons etc) and the Group is acting as a principal in the fulfilment of the service, the value of the additional services is separately identified, deducted from consideration receivable, recognised as deferred revenue on the balance sheet and subsequently recognised as revenue when the service is provided, or recognised on an input basis with reference to the amount of time elapsed under the contract to which the service relates. These balances are considered to be contract liabilities. The consideration allocated to additional services is based on the relative stand-alone selling price of the additional services within the contract. The value assigned to the additional service is set equal to the value of the additional service being provided, being the expected cost to the entity plus an appropriate profit margin.
Amounts relating to accrued income are balances primarily due from manufacturers in relation to volume / target related bonuses or commissions or warranty related where the work has been completed prior to being invoiced. Any amount previously recognised as accrued income is reclassified to trade receivables at the point at which it is invoiced to the customer.
Finance income is recognised when it is probable that the economic benefits will flow to the Group and the amount of income can be measured reliably. It is accrued on a time basis by reference to the principal outstanding and at the effective interest rate applicable.
Dividend income is recognised when the right to receive payment is established.
COST OF SALESCost of sales includes the expense relating to the estimated cost of self-insured product warranties offered to customers. These warranties form part of the package of goods and services provided to the customer when purchasing a vehicle and are not a separable product.
The Group receives income in the form of various incentives which are determined by our brand partners. The amount we receive is generally based on achieving specific objectives, such as a specified sales volume, as well as other objectives including maintaining brand partner standards which may include, but are not limited to, retail centre image and design requirements, customer satisfaction survey results and training standards. Where incentives are based on a specific sales volume or number of registrations, the related income is recognised as a reduction in cost of sales when it is reasonably certain that the income has been earned. This is generally the later of the date the related vehicles are sold or registered or when it is reasonably certain that the related target will be met. Where incentives are linked to retail centre image and design requirements, customer satisfaction survey results or training standards, they are recognised as a reduction in cost of sales when it is reasonably certain that the incentive will be received for the relevant period.
GOVERNMENT GRANTS AND ASSISTANCEGrants received from governments are recognised when there is reasonable assurance that the conditions associated with the grants have been complied with and the grants will be received. Grants for the reimbursement of operating expenditure are deducted from the related category of costs in the income statement. Once a government grant is recognised, any related deferred income is treated in accordance with IAS 20 ‘Accounting for Government Grants and Disclosure of Government Assistance’.
SHARE-BASED PAYMENTSThe Group operates various share-based award schemes. The fair value at the date at which the share-based awards are granted is recognised in the consolidated income statement (together with a corresponding credit in shareholders’ equity) on a straight-line basis over the vesting period, based on an estimate of the number of shares that will eventually vest. At the end of each reporting period, the Group revises its estimates of the number of awards that are expected to vest. The impact of any revision is recognised in the consolidated income statement with a corresponding adjustment to equity.
For equity-settled share-based awards, the services received from employees are measured by reference to the fair value of the awards granted. With the exception of the Group Save As You Earn scheme, the vesting of all share-based awards under all schemes is solely reliant upon non-market conditions, therefore no expense is recognised for awards that do not ultimately vest. Where an employee or the Company cancels an award, the charge for that award is recognised as an expense immediately, even though the award does not vest.
FINANCE COSTSBorrowing costs which are directly attributable to the acquisition, construction or production of a qualifying asset are capitalised as part of the cost of that asset from the first date on which the expenditure is incurred for the asset and until such time as the asset is ready for its intended use. A Group capitalisation rate is used to determine the magnitude of borrowing costs capitalised on each qualifying asset. This rate is the weighted average of Group borrowing costs, excluding those borrowings made specifically for the purpose of obtaining a qualifying asset.
All other borrowing costs are recognised as an expense in the period in which they are incurred.
ACCOUNTING POLICIES CONTINUED
128 INCHCAPE ANNUAL REPORT AND ACCOUNTS 2021
INCOME TAX The charge for current income tax is based on the results for the period as adjusted for items which are not taxed or are disallowed. It is calculated using tax rates that have been enacted or substantively enacted by the end of the reporting period.
The accounting standard covering uncertain tax positions, IFRIC 23 ‘Uncertainty over Income Tax Treatments’, was adopted by the Group from 1 January 2019. The Group recognises provisions for uncertain tax positions when it is not probable that a tax authority will accept an uncertain tax treatment used, or proposed to be used, in its income tax filings. Uncertain tax positions are assessed and measured using management’s estimate of the most likely outcome including an assessment of whether uncertain tax positions should be considered separately or as a group. The Group recognises interest on late paid taxes as part of financing costs, and any penalties, if applicable, as part of the income tax expense.
Deferred income tax is accounted for using the liability method in respect of temporary differences arising from differences between the tax bases of assets and liabilities and their carrying amounts in the consolidated financial statements.
Deferred tax liabilities are recognised for all taxable temporary differences and deferred tax assets are recognised to the extent that it is probable that taxable profits will be available against which deductible temporary differences can be utilised. Such assets and liabilities are not recognised if the temporary difference is due to goodwill arising on a business combination, or to an asset or liability, the initial recognition of which does not affect either taxable or accounting income.
Deferred tax liabilities are recognised for taxable temporary differences arising on investments in subsidiaries, joint ventures and associates, except where the Group is able to control the reversal of the temporary difference and it is probable that the temporary difference will not reverse in the foreseeable future.
Deferred tax is calculated at the tax rates that are expected to apply to the period when the asset is realised or the liability is settled using rates enacted or substantively enacted at the end of the reporting period. Deferred tax is charged or credited in the consolidated income statement, except when it relates to items credited or charged directly to shareholders’ equity, in which case the deferred tax is also dealt with in shareholders’ equity.
Deferred tax assets and liabilities are only offset where there is a legally enforceable right of offset and there is an intention to settle balances net.
The measurement of deferred tax liabilities and assets reflects the tax consequences that would follow from the manner in which the Group expects, at the end of the reporting period, to recover or settle the carrying amount of its assets and liabilities.
EXCEPTIONAL ITEMS The Group makes certain adjustments to the statutory profit measures in order to derive certain alternative performance measures. Certain items which are material are presented as exceptional items within their relevant consolidated income statement category. The separate reporting of exceptional items helps provide additional useful information regarding the Group’s business performance and is used by management to facilitate internal performance analysis.
Management applies an exceptional items policy that is regularly discussed and approved by the Audit Committee. The policy applied in identifying exceptional items is balanced when assessing gains and losses, clearly disclosed and applied consistently from one year to the next.
Exceptional items are deemed to be those items that, in the judgement of the Group, need to be disclosed separately by virtue of their nature, size or incidence. In determining the facts and circumstances, management considers key factors such as:
• where the same category of items recurs each year and in similar amounts (for example, restructuring costs), consideration is given as to whether such amounts should be included as part of underlying profit:
• where significant items are likely to be finalised over more than one year, the effect of such items is applied uniformly; and
• ensuring the treatment of favourable and unfavourable transactions are treated consistently.
Items that may be considered exceptional in nature include gains or losses on the disposal of businesses, restructuring of businesses, acquisition costs, asset impairments and the tax effects of these items. Any reversal of an amount previously recognised as an exceptional item would also be recognised as an exceptional item in a subsequent period.
BUSINESS COMBINATIONS AND GOODWILLThe acquisition of subsidiaries is accounted for using the acquisition method (at the point the Group gains control over a business as defined by IFRS 3). The cost of the acquisition is measured as the cash paid and the aggregate of the fair values, at the date of exchange, of other assets transferred, liabilities incurred or assumed, and equity instruments issued by the Group in exchange for control of the acquiree. The consideration transferred includes the fair value of any asset or liability resulting from a contingent consideration arrangement at the acquisition date.
Acquisition-related costs are expensed as incurred. The acquiree’s identifiable assets, liabilities and contingent liabilities that meet the conditions for recognition under IFRS 3 are recognised at their fair value at the acquisition date. The Group recognises any non-controlling interests in the acquiree on an acquisition-by-acquisition basis, either at fair value or at the non-controlling interests’ proportionate share of the recognised amounts of acquiree’s identifiable net assets.
Goodwill represents the excess of the cost of acquisition of a business combination over the Group’s share of the fair value of identifiable net assets of the business acquired at the date of acquisition. Goodwill is initially recognised at cost and is held in the functional currency of the acquired entity and revalued at the closing exchange rate at the end of each reporting period.
INCHCAPE ANNUAL REPORT AND ACCOUNTS 2021 129
STRA
TEGIC
REPO
RTG
OV
ERN
AN
CE
FINA
NC
IAL STA
TEMEN
TS
After initial recognition, goodwill is measured at cost less any accumulated impairment losses. At the date of acquisition, the goodwill is allocated to cash generating units for the purpose of impairment testing and is tested at least annually for impairment.
Gains and losses on disposal of a business include the carrying amount of goodwill relating to the business sold except for goodwill arising on business combinations on or before 31 December 1997 which has been deducted from shareholders’ equity and remains indefinitely in shareholders’ equity.
OTHER INTANGIBLE ASSETSIntangible assets, when acquired separately from a business (including computer software), are carried at cost less accumulated amortisation and impairment losses. Cost comprises the purchase price from third parties as well as internally generated development costs where relevant. Amortisation is provided on a straight-line basis to allocate the cost of the asset over its estimated useful life, which in the case of computer software is three to eight years. Amortisation is recognised in the consolidated income statement within ‘net operating expenses’. Software customisation and configuration costs relating to software not controlled by the Group are expensed over the period such services are received.
Intangible assets acquired as part of a business combination are capitalised separately from goodwill if the benefit of the intangible asset is obtained through contractual or other legal rights and the fair value can be measured reliably on initial recognition. The principal intangible assets are agreements with manufacturers for the distribution of new vehicles and parts, which represent the estimated value of distribution rights acquired in business combinations. Such agreements have varying terms and periods of renewal and have historically been renewed without substantial cost. The Group therefore expects these agreements to be renewed on a regular basis and accordingly no amortisation is charged on these assets. The Group assesses these distribution rights for impairment on an annual basis.
Other intangible assets acquired in a business combination may include order books and customer contracts. These intangible assets are amortised on a straight-line basis over their estimated useful life, which is generally less than a year.
PROPERTY, PLANT AND EQUIPMENTProperty, plant and equipment is stated at cost less accumulated depreciation and impairment losses. Cost comprises the purchase price and directly attributable costs of the asset and includes, where relevant, capitalised borrowing costs. Depreciation is based on cost less estimated residual value and is included within ‘net operating expenses’ in the consolidated income statement, with the exception of depreciation on ‘interest in leased vehicles’ which is charged to ‘cost of sales’. It is provided on a straight-line basis over the estimated useful life of the asset, except for freehold land which is not depreciated. For the following categories, the annual rates used are:
Freehold buildings and long leasehold buildings 2.0%
Short leasehold buildings shorter of lease term or useful life
Plant, machinery and equipment 5.0% – 33.3%
Interest in leased vehicles over the lease term
The residual values and useful lives of all assets are reviewed at least at the end of each reporting period and adjusted if necessary.
LEASESThe Group assesses whether a contract is, or contains a lease at inception of the contract. A lease conveys the right to direct the use and obtain substantially all of the economic benefits of an identified asset for a period of time in exchange for consideration.
THE GROUP AS A LESSEELease liabilities arising from a lease are initially measured on a present value basis. Lease liabilities include the net present value of the following lease payments:
• fixed payments (including in-substance fixed payments), less any lease incentives receivable;• variable lease payment that are based on an index or a rate, initially measured using the index or rate as at the
commencement date;• amounts expected to be payable by the Group under residual value guarantees;• the exercise price of a purchase option if the Group is reasonably certain to exercise that option; and• payments of penalties for terminating the lease, if the lease term reflects the Group exercising that option.
Lease payments to be made under reasonably certain extension options are also included in the measurement of the liability.
The lease payments are discounted using the interest rate implicit in the lease. If that rate cannot be readily determined, which is generally the case for leases in the Group, the lessee’s incremental borrowing rate is used, being the rate that the individual lessee would have to pay to borrow the funds necessary to obtain an asset of similar value to the right-of-use asset in a similar economic environment with similar terms, security and conditions.
To determine the incremental borrowing rate, the Group:
• uses a build-up approach that starts with a risk-free interest rate by market and currency; • applies a credit risk, based on yields of comparable entities, to the determined risk-free interest rate by market; and• where applicable, makes adjustments specific to the lease, e.g. term, country, currency and security.
ACCOUNTING POLICIES CONTINUED
130 INCHCAPE ANNUAL REPORT AND ACCOUNTS 2021
Lease liabilities are re-measured when there is a change in future lease payments arising from a change in an index or rate, if there is a change in the estimate of the amount expected to be payable under a residual value guarantee, or if there is a change in the assessment of whether a purchase, lease-term extension or termination option will be exercised. When lease liabilities are re-measured in this way, a corresponding adjustment is made to the carrying amount of the right-of-use asset or recorded in profit or loss if the carrying amount of the right-of-use asset has been reduced to zero.
Lease payments are allocated between principal and finance cost. The finance cost is charged to profit or loss over the lease period to produce a constant periodic rate of interest on the remaining balance of the liability for each period.
Right-of-use assets are recognised at the commencement date of the lease. Right-of-use assets comprising mainly land and buildings are measured at cost less accumulated depreciation and impairment losses. The costs include the amount of the initial measurement of the lease liability, any lease payments made at or before the commencement date less lease incentives received, any direct costs and an estimate of dismantling costs. The carrying amount is further adjusted for any remeasurement of the lease liability. Depreciation is expensed to the income statement on a straight-line basis over the lease term. The lease term includes the noncancellable period of lease together with any extension or termination options that are reasonably certain to be exercised.
Payments associated with short-term leases and all leases of low-value assets (under £5,000) are recognised on a straight-line basis as an expense in profit or loss. Short-term leases are leases with a lease term of 12 months or less. Low-value assets comprise largely small items of office equipment.
THE GROUP AS A LESSORLeases are classified as finance leases whenever the terms of the lease transfer substantially all the risk and rewards of ownership to the lessee. All other leases are classified as operating leases. Where the Group is an intermediate lessor, the sublease classification is assessed with reference to the head lease right-of-use asset. Amounts due from lessees under finance leases are recorded as receivables at the amount of the Group’s net investment in the lease. Finance lease income is allocated to accounting periods so as to reflect a constant periodic rate of return on the Group’s net investment in the lease. Rental income from operating leases is recognised on a straight-line basis over the lease term.
IMPAIRMENT OF NON-FINANCIAL ASSETSAssets that are subject to amortisation or depreciation are reviewed for impairment whenever events or circumstances indicate that the carrying amount may not be recoverable. Any impairment losses are included within ‘net operating expenses’ in the consolidated income statement.
In addition, goodwill is not subject to amortisation but is tested at least annually for impairment. An impairment loss is recognised for the amount by which the asset’s carrying amount exceeds its recoverable amount, the latter being the higher of the asset’s fair value less costs to sell and value in use. Value in use calculations are performed using cash flow projections, discounted at a pre-tax rate which reflects the asset specific risks and the time value of money.
Non-financial assets, other than goodwill, which have previously been impaired, are reviewed for possible reversal of the impairment at each reporting date.
INVENTORIESInventories are stated at the lower of cost and net realisable value. Cost comprises expenditure incurred in bringing inventories to their present location and condition. Net realisable value represents the estimated selling price less all estimated costs of completion and costs to be incurred in marketing, selling and distribution. Used vehicles are carried at the lower of cost or fair value less costs to sell, generally based on external market data available for used vehicles.
Vehicles held on consignment are included within inventories as the Group is considered to have the risks and rewards of ownership. The corresponding liability is included within ‘trade and other payables’.
Inventory can be held on deferred payment terms. All costs associated with this deferral are expensed in the period in which they are incurred.
An inventory provision is recognised in situations where net realisable value is likely to be less than cost (such as obsolescence, deterioration, fall in selling price). When calculating the provision, management considers the nature and condition of the inventory, as well as applying assumptions around anticipated saleability, determined on conditions that exist at the end of the reporting period. With the exception of parts, generally net realisable value adjustments are applied on an item-by-item basis.
TRADE RECEIVABLESTrade receivables are amounts due from customers for goods sold or services performed in the ordinary course of business. These are recognised as current assets if collection is due in one year or less. If collection is due in over a year, they are presented as non-current assets.
Trade receivables are recognised initially at fair value and subsequently measured at amortised cost using the effective interest method, less provision for impairment. A provision for impairment is established based on an expected credit loss model under IFRS 9. The amount of the provision is the difference between the asset’s carrying amount and the expected value of the amounts to be received.
INCHCAPE ANNUAL REPORT AND ACCOUNTS 2021 131
STRA
TEGIC
REPO
RTG
OV
ERN
AN
CE
FINA
NC
IAL STA
TEMEN
TS
The provision for impairment of receivables is based on lifetime expected credit losses. Lifetime expected credit losses are calculated by assessing historic credit loss experience, adjusted for factors specific to the receivable and company. The amount of the loss is recognised in the consolidated income statement within ‘net operating expenses’. When a trade receivable is not collectible, it is written off against the allowance account for trade receivables. Subsequent recoveries of amounts previously written off are credited against ‘net operating expenses’ in the consolidated income statement.
TRADE PAYABLESTrade payables are obligations to pay for goods or services that have been acquired in the ordinary course of business. These are classified as current liabilities if payment is due in one year or less. If payment is due at a later date, they are presented as non-current liabilities.
Trade payables are recognised initially at fair value and subsequently measured at amortised cost using the effective interest method.
Trade payables include the liability for vehicles held on consignment, with the corresponding asset included within inventories.
BORROWINGSBorrowings are recognised initially at fair value, net of transaction costs incurred, and are subsequently stated at amortised cost. Any difference between the proceeds (net of transaction costs) and the redemption value is recognised in the consolidated income statement over the period of the borrowings, using the effective interest method.
PENSIONS AND OTHER POST-RETIREMENT BENEFITSThe Group operates a number of retirement benefit schemes.
The major schemes are defined benefit pension funds with assets held separately from the Group. The cost of providing benefits under the plans is determined separately for each plan using the projected unit credit actuarial valuation method.
The current service cost and gains and losses on settlements and curtailments are included in ‘cost of sales’ or ‘net operating expenses’ in the consolidated income statement. Past service costs are similarly recognised in the consolidated income statement. Administrative scheme expenses associated with the plans are recorded within ‘net operating expenses’ when incurred, in line with IAS 19 (revised). Net interest income or interest cost relating to the funded defined benefit pension plans is included within ‘finance income’ or ‘finance costs’, as relevant, in the consolidated income statement.
Changes in the retirement benefit obligation or asset due to experience and changes in actuarial assumptions are included in the consolidated statement of comprehensive income, as actuarial gains and losses, in full in the period in which they arise.
Where scheme assets exceed the defined benefit obligation, a net asset is only recognised to the extent that an economic benefit is available to the Group, in accordance with the terms of the scheme and, where relevant, statutory requirements.
The Group’s contributions to defined contribution plans are charged to the consolidated income statement in the period to which the contributions relate.
The Group also has a liability in respect of past employees under post-retirement healthcare schemes which have been closed to new entrants. These schemes are accounted for on a similar basis to that for defined benefit pension plans in accordance with the advice of independent qualified actuaries.
PROVISIONSProvisions are recognised when the Group has a present obligation in respect of a past event, when it is more likely than not that an outflow of resources will be required to settle the obligation and where the amount can be reliably estimated. Provisions are discounted when the time value of money is considered to be material, using an appropriate risk-free rate on government bonds.
PRODUCT WARRANTY PROVISIONA product warranty provision corresponds to warranties provided as part of the sale of a vehicle and provide assurance to the customer that the product will work as sold. Provision is made for the expected cost of labour and parts based on historical claims experience and expected future trends.
LEASEHOLD PROPERTY PROVISIONA leasehold property provision is recognised when the Group is committed to certain leasehold premises for which it no longer has a commercial use. It is made to the extent of the estimated future net cost, excluding the lease liability already recognised under IFRS 16. A leasehold property provision is also recognised when there is future obligation relating to the maintenance of leasehold properties. The provision is based on management’s best estimate of the obligation which forms part of the Group’s unavoidable cost of meeting its obligations under the lease contracts.
LITIGATION PROVISIONA litigation provision is recognised when a litigation case is outstanding at the end of the reporting period and there is a likelihood that the legal claim will be settled.
ACCOUNTING POLICIES CONTINUED
132 INCHCAPE ANNUAL REPORT AND ACCOUNTS 2021
RESTRUCTURING PROVISIONA restructuring provision is recognised when a detailed formal plan for the restructuring has been developed and a valid expectation has been raised in those affected that it will carry out the restructuring by starting to implement the plan or announcing its main features to those affected by it. The measurement of a restructuring provision includes only the direct expenditures arising from the restructuring which are those amounts that are both necessarily entailed by the restructuring and not associated with ongoing activities of the Group.
DISPOSAL GROUP AND ASSETS HELD FOR SALE Where the Group is committed to a plan to sell and is actively marketing a business and disposal is expected within one year of the date of classification as held for sale, the assets and liabilities of the associated businesses are separately disclosed in the consolidated statement of financial position as a disposal group. Assets and liabilities are classified as assets held for sale if their carrying amount is to be recovered principally through a sale transaction rather than through continuing use. Both disposal groups and assets and liabilities held for sale are stated at the lower of their carrying amount and fair value less costs to sell.
SEGMENTAL REPORTINGSegment information is reported in accordance with IFRS 8 ‘Operating segments’, which requires segmental reporting to be presented on the same basis as the internal management reporting. The Group’s operating segments are countries or groups of countries and the market channels, Distribution and Retail. These operating segments are then aggregated into reporting segments to combine those with similar characteristics. The accounting policies of the reportable segments are the same as the Group’s accounting policies described in this note.
FINANCIAL INSTRUMENTSThe Group classifies its financial assets in the following categories: measured at amortised cost; measured at fair value through profit and loss; and measured at fair value through other comprehensive income. Classification and subsequent remeasurement depends on the Group’s business model for managing the financial asset and its cash flow characteristics. Assets that are held for collection of contractual cash flows, where those cash flows represent solely payments of principal and interest, are measured at amortised cost.
Measured at amortised cost includes non-derivative financial assets and liabilities with fixed or determinable payments that are not quoted in an active market. Financial assets are included in current assets, except where the maturity date is more than 12 months after the end of the reporting period. They are initially recorded at fair value and subsequently recorded at amortised cost. Financial liabilities are included in current liabilities, except where the maturity date is more than 12 months after the end of the reporting period.
Measured at fair value through profit and loss includes derivative financial assets and liabilities, which are further explained below. They are classified according to maturity date, within current and non-current assets and liabilities respectively.
Measured at fair value through other comprehensive income includes certain financial assets at fair value such as bonds and equity investments. These financial assets are included in current assets and liabilities, except where the maturity date is more than 12 months after the end of the reporting period. Financial assets at fair value through other comprehensive income are classified as non-current assets unless management intends to dispose of them within 12 months of the end of the reporting period and are held at fair value.
CASH AND CASH EQUIVALENTSCash and cash equivalents in the consolidated statement of financial position comprise cash at bank and in hand, short-term bank deposits and cash and cash equivalents included in disposal groups held for sale.
Short-term bank deposits have a maturity of less than three months from the date at which the investment is acquired.
In the consolidated statement of cash flows, cash and cash equivalents comprise cash and cash equivalents, as defined above, net of bank overdrafts.
OFFSETTING Netting in the consolidated statement of financial position only occurs to the extent that there is the legal ability and intention to settle net. As such, bank overdrafts are presented in current liabilities to the extent that there is no intention to offset with the cash balance.
DERIVATIVE FINANCIAL INSTRUMENTS An outline of the objectives, policies and strategies pursued by the Group in relation to its financial instruments is set out in note 24 to the consolidated financial statements.
Derivatives are initially recognised at fair value on the date a derivative contract is entered into and are subsequently re-measured at their fair value. The method of recognising the resulting gain or loss depends on whether the derivative is designated as a hedging instrument, and if so, the nature of the item being hedged. The Group designates certain derivatives as:
• hedges of the fair value of recognised assets or liabilities or a firm commitment (fair value hedge); or• hedges of a particular risk associated with a recognised asset or liability or a highly probable forecast transaction (cash
flow hedge).
INCHCAPE ANNUAL REPORT AND ACCOUNTS 2021 133
STRA
TEGIC
REPO
RTG
OV
ERN
AN
CE
FINA
NC
IAL STA
TEMEN
TS
FAIR VALUE HEDGEChanges in the fair value of derivatives that are designated and qualify as fair value hedges are recorded in the consolidated income statement, together with any changes in the fair value of the hedged asset or liability that are attributable to the hedged risk. The Group only applies fair value hedge accounting for hedging fixed interest risk on borrowings and future fixed amount currency liabilities (on its cross-currency interest rate swaps). The gain or loss relating to the effective portion of interest rate swaps hedging fixed rate borrowings and changes in the fair value of those borrowings is recognised in the consolidated income statement within ‘finance costs’. The gain or loss relating to the ineffective portion is also recognised in the consolidated income statement within ‘finance costs’.
CASH FLOW HEDGEFor cash flow hedges that meet the conditions for hedge accounting, the portion of the gains or losses on the hedging instrument that is determined to be an effective hedge is recognised directly in other comprehensive income and the ineffective portion is recognised within ‘net operating expenses’ in the consolidated income statement. When the hedged forecast transaction results in the recognition of a non-financial asset or liability then, at the time the asset or liability is recognised, the associated gains or losses that had previously been recognised in other comprehensive income are included in the initial measurement of the acquisition cost or other carrying amount of the asset or liability. For all other cash flow hedges, the gains or losses that are recognised in other comprehensive income are transferred to the consolidated income statement in the same period in which the hedged forecast transaction affects the consolidated income statement.
FINANCIAL ASSETS AT FAIR VALUE THROUGH OTHER COMPREHENSIVE INCOMEFinancial assets at fair value through other comprehensive income are primarily equity instruments that the Group has elected to recognise the changes in fair value of in other comprehensive income. They are recognised initially at fair value and are re-measured subsequently at fair value with gains and losses arising from changes in fair value recognised directly in equity and presented in the Group statement of comprehensive income. Cumulative gains and losses on equity instruments at fair value through other comprehensive income are not recycled to the Group income statement.
SHARE CAPITALOrdinary shares are classified as equity. Where the Group purchases the Group’s equity share capital (treasury shares), the consideration paid is deducted from shareholders’ equity until the shares are cancelled, reissued or disposed of. Where such shares are subsequently sold or reissued, any consideration received is included in shareholders’ equity.
DIVIDENDSFinal dividends proposed by the Board of Directors and unpaid at the year-end are not recognised in the consolidated financial statements until they have been approved by the shareholders at the Annual General Meeting. Interim dividends are recognised when they are paid.
CRITICAL ACCOUNTING JUDGEMENTS AND SOURCES OF ESTIMATION UNCERTAINTYThe preparation of financial statements in accordance with generally accepted accounting principles requires the use of estimates and assumptions that affect the reported amounts of assets and liabilities at the date of the financial statements and the reported amounts of revenues and expenses during the reporting period. Although these estimates are based on management’s best knowledge, actual results may ultimately differ from those estimates. The estimates and underlying assumptions are reviewed on an ongoing basis. The Directors have made a number of estimates and assumptions regarding the future, and made some significant judgements in applying the Group’s accounting policies. These are discussed below:
SOURCES OF ESTIMATION UNCERTAINTYThe key assumptions about the future, and other key sources of estimation uncertainties at the reporting period end that may have a significant risk of causing a material adjustment to the carrying amount of assets and liabilities within in the next period are discussed below:
IMPAIRMENT OF GOODWILL AND INDEFINITE LIFE INTANGIBLE ASSETSIn the year, an impairment charge of £12.9m against goodwill has been recognised in the income statement, offset by a reversal of £12.9m against indefinite life intangible assets. The most significant judgement that could materially impact the charge is in relation to the sensitivity of the assumptions applied to the value in use calculations performed over the Americas – Suzuki CGU groups.
Goodwill and other indefinite life intangible assets are tested at least annually for impairment. When an impairment review is carried out, the recoverable value is determined based on value in use calculations which require the use of estimates, including projected future cash flows (see note 11).
The value in use calculations mainly use cash flow projections based on five-year financial forecasts prepared by management. The key assumptions for these forecasts are those relating to volumes, revenue, gross margins, the level of working capital required to support trading, discount rates, long-term growth rate and capital expenditure. For CGU groups in the Americas & Africa reporting segment, cash flows after the five-year period are extrapolated for a further five years using declining growth rates which reduces the year five growth rate down to the long-term growth rate appropriate for each CGU or CGU group, to better reflect the medium-term growth expectations for those markets. A terminal value calculation is used to estimate the cash flows after year 10 using these long-term growth rates. For all other markets, a terminal value calculation is used to estimate the cash flows after year five.
ACCOUNTING POLICIES CONTINUED
134 INCHCAPE ANNUAL REPORT AND ACCOUNTS 2021
The assumptions used in the value in use calculations are based on past experience, recent trading and forecasts of operational performance in the relevant markets including the impact of Covid-19 and the UK trading arrangements with the European Union. They also reflect expectations about continuing relationships with key brand partners and the impact climate change may have on its operations. Whilst at this stage there is significant uncertainty regarding what the long-term impact of climate change initiatives may be on the markets in which we operate, the forecasts reflect our best estimate.
PENSIONS AND OTHER POST-RETIREMENT BENEFITS – ASSUMPTIONSPension and other post-retirement benefit liabilities are determined based on the actuarial assumptions detailed in note 5. A number of these assumptions require estimates to be made, including the rate of inflation and expected mortality rates. These assumptions are subject to a review on an annual basis and are determined in conjunction with an external actuary. The use of different assumptions could have a material effect on the value of the relevant liabilities and could result in a material change to amounts recognised in the income statement over time. Key assumptions and sensitivities for post-employment benefit obligations are disclosed in note 5.
PENSIONS – DISCOUNT RATEThe Group’s defined benefit obligations are discounted at a rate set by reference to market yields at the end of the reporting period on high quality corporate bonds. Significant judgement is required when setting the criteria for bonds to be included in the population from which the yield curve is derived. The most significant criteria considered for the selection of bonds include the issue size of the corporate bonds, quality of the bonds and the identification of outliers which are excluded. Key assumptions and sensitivities for post-employment benefit obligations are disclosed in note 5.
CRITICAL ACCOUNTING JUDGEMENTS
RIGHT-OF-USE ASSETS AND LEASE LIABILITIES – EXTENSION AND TERMINATION OPTIONSIn determining the lease term, management considers all facts and circumstances that create an economic incentive to exercise an extension option, or not exercise a termination option. Extension options (or periods after termination options) are only included in the lease term if the lease is reasonably certain to be extended (or not terminated).
The Group has several retail, distribution and office property lease contracts that include extension and termination options. The Group applies judgement in evaluating whether it is reasonably certain whether or not to exercise the option to renew or terminate the lease. All relevant factors are considered that create an economic incentive for it to exercise either the renewal or termination, including: whether there are significant penalties to terminate (or not extend); whether any leasehold improvements are expected to have a significant remaining value; historical lease durations; the importance of the underlying asset to the Group’s operations; and the costs and business disruption required to replace the leased asset.
The assessment is reviewed if a significant event or a significant change in circumstances occurs which affects this assessment and that is within the control of the lessee. Refer to note 13 for additional disclosures relating to leases.
EXCEPTIONAL ITEMSThe Directors believe that adjusted profit and earnings per share measures provide additional useful information to shareholders on the performance of the business. These measures are consistent with how business performance is measured internally by the Board and Executive Committee. The operating profit before exceptional items and profit before tax and exceptional items measures are not recognised profit measures under IFRS and may not be directly comparable with such profit measures used by other companies. The classification of exceptional items requires significant management judgement after considering the nature and intentions of a transaction.
In the current year, management has exercised judgement in respect of the treatment of accelerated amortisation that arose on existing software assets following a strategic decision to migrate existing ERP applications to a cloud-based solution. The decision resulted in a change in the estimated useful life of the existing ERP assets that materially increased the amortisation charge for the year. The incremental amortisation charge has been treated as an exceptional item in accordance with the Group’s policy. The Group’s definitions of exceptional items are outlined within the Group accounting policies and note 2 provides further details on current year exceptional items and their adherence to Group policy.
CLASSIFICATION OF VEHICLE FUNDING ARRANGEMENTS The Group finances the purchase of vehicles using vehicle funding facilities provided by various lenders including the captive finance companies associated with brand partners. In assessing whether the liabilities arising under these arrangements should be classified within trade and other payables rather than as an additional component of the Group’s net debt within borrowings, the Group considers a number of factors including whether the arrangement is a requirement of the relationship with the OEM, in relation to specific, separately identifiable vehicles held as inventory and whether payment terms are the shorter of the agreed terms of the arrangement or until the specific vehicle being funded is sold to the end customer. Each agreement entered into has its own terms and conditions and determining whether a new or renewed arrangement should be classified within trade and other payables requires significant management judgement. See also note 21.
ASSIGNMENT OF AN INDEFINITE USEFUL LIFE TO DISTRIBUTION AGREEMENTSThe Group’s principal intangible assets relate to agreements with manufacturers for the distribution of new vehicles and parts. These distribution agreements are assigned an indefinite useful life as though these agreements have limited terms, they have historically been renewed by the Group without substantial cost and the Group’s history shows that OEMs have not terminated our distribution agreements. Additionally, there are no known changes or events that would impact the vehicle distribution environments in which the Group has such assets recognised. The Group therefore expects these agreements to be renewed indefinitely and accordingly no amortisation is charged on these assets.
INCHCAPE ANNUAL REPORT AND ACCOUNTS 2021 135
STRA
TEGIC
REPO
RTG
OV
ERN
AN
CE
FINA
NC
IAL STA
TEMEN
TS
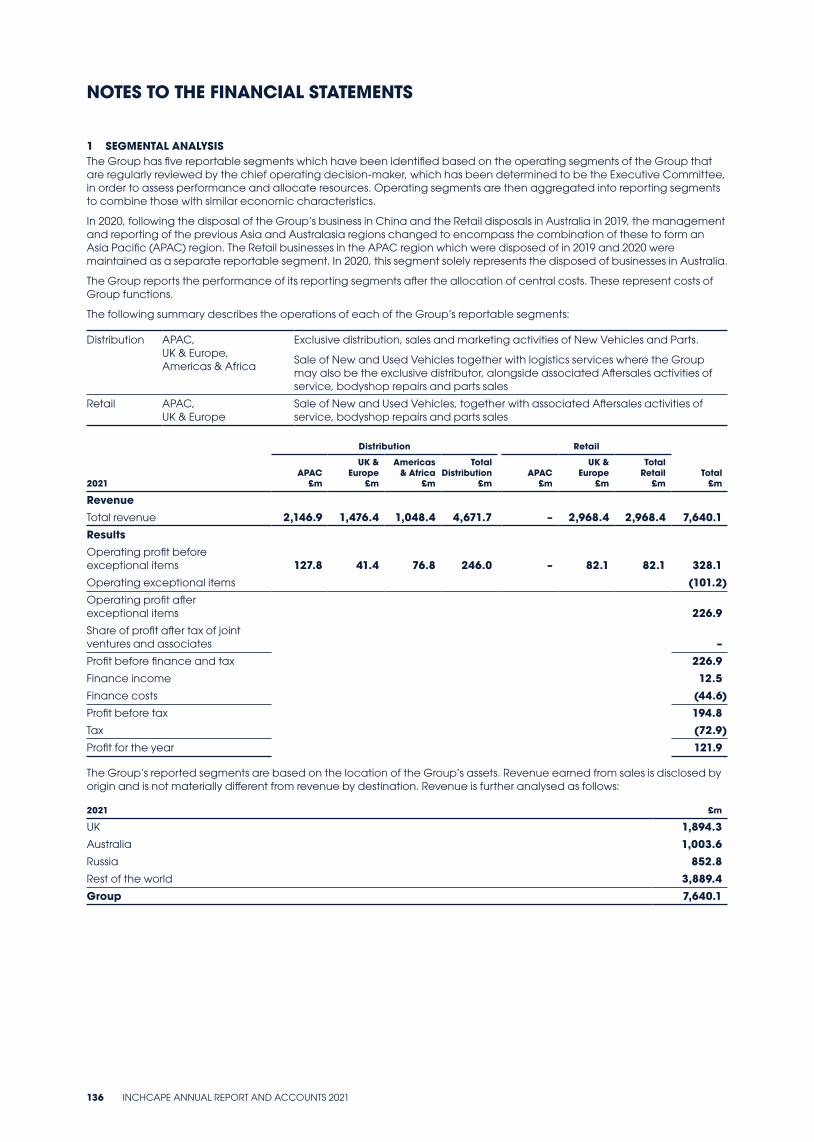
NOTES TO THE FINANCIAL STATEMENTS
1 SEGMENTAL ANALYSISThe Group has five reportable segments which have been identified based on the operating segments of the Group that are regularly reviewed by the chief operating decision-maker, which has been determined to be the Executive Committee, in order to assess performance and allocate resources. Operating segments are then aggregated into reporting segments to combine those with similar economic characteristics.
In 2020, following the disposal of the Group’s business in China and the Retail disposals in Australia in 2019, the management and reporting of the previous Asia and Australasia regions changed to encompass the combination of these to form an Asia Pacific (APAC) region. The Retail businesses in the APAC region which were disposed of in 2019 and 2020 were maintained as a separate reportable segment. In 2020, this segment solely represents the disposed of businesses in Australia.
The Group reports the performance of its reporting segments after the allocation of central costs. These represent costs of Group functions.
The following summary describes the operations of each of the Group’s reportable segments:
Distribution APAC,UK & Europe,Americas & Africa
Exclusive distribution, sales and marketing activities of New Vehicles and Parts.
Sale of New and Used Vehicles together with logistics services where the Group may also be the exclusive distributor, alongside associated Aftersales activities of service, bodyshop repairs and parts sales
Retail APAC, UK & Europe
Sale of New and Used Vehicles, together with associated Aftersales activities of service, bodyshop repairs and parts sales
Distribution Retail
2021 APAC
£m
UK & Europe
£m
Americas & Africa
£m
Total Distribution
£m APAC
£m
UK & Europe
£m
Total Retail
£m Total
£m
RevenueTotal revenue 2,146.9 1,476.4 1,048.4 4,671.7 – 2,968.4 2,968.4 7,640.1Results Operating profit before exceptional items 127.8 41.4 76.8 246.0 – 82.1 82.1 328.1Operating exceptional items (101.2)Operating profit after exceptional items 226.9Share of profit after tax of joint ventures and associates –Profit before finance and tax 226.9Finance income 12.5Finance costs (44.6)Profit before tax 194.8Tax (72.9)Profit for the year 121.9
The Group’s reported segments are based on the location of the Group’s assets. Revenue earned from sales is disclosed by origin and is not materially different from revenue by destination. Revenue is further analysed as follows:
2021 £m
UK 1,894.3Australia 1,003.6Russia 852.8Rest of the world 3,889.4Group 7,640.1
136 INCHCAPE ANNUAL REPORT AND ACCOUNTS 2021
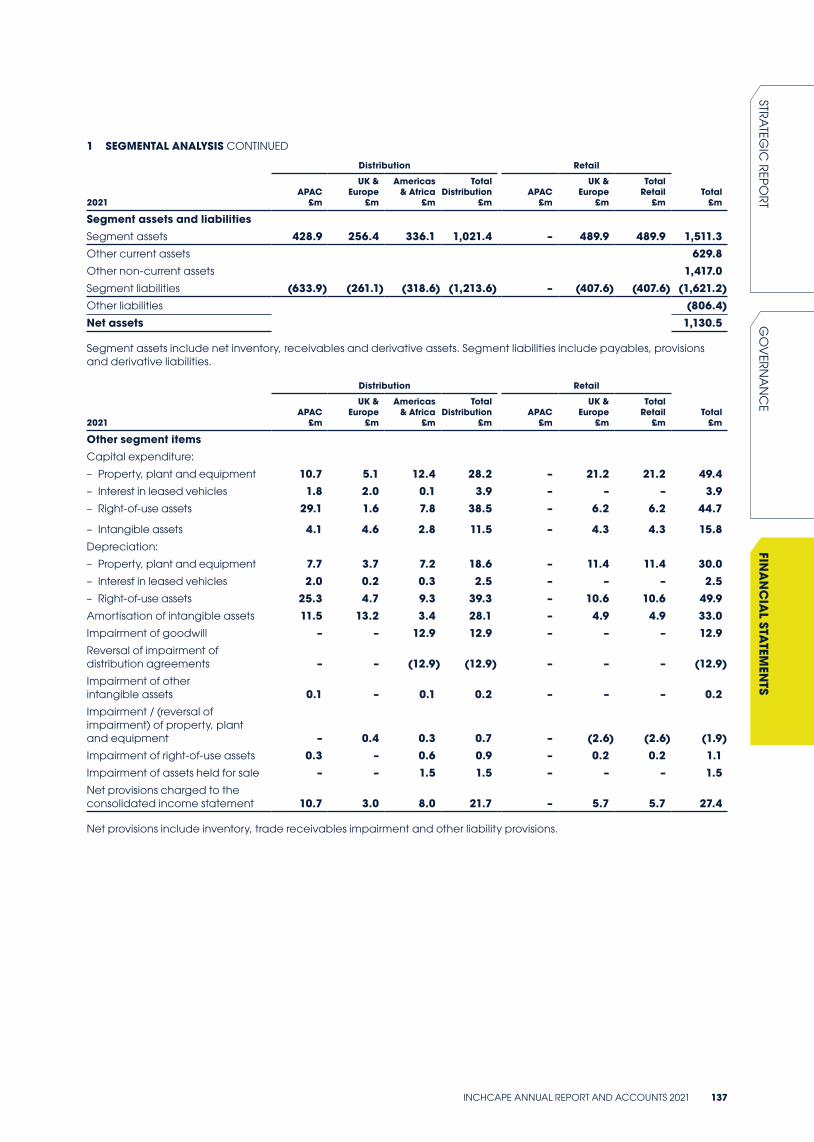
1 SEGMENTAL ANALYSIS CONTINUED
Distribution Retail
2021 APAC
£m
UK & Europe
£m
Americas & Africa
£m
Total Distribution
£m APAC
£m
UK & Europe
£m
Total Retail
£m Total
£m
Segment assets and liabilities Segment assets 428.9 256.4 336.1 1,021.4 – 489.9 489.9 1,511.3Other current assets 629.8Other non-current assets 1,417.0Segment liabilities (633.9) (261.1) (318.6) (1,213.6) – (407.6) (407.6) (1,621.2)Other liabilities (806.4)Net assets 1,130.5
Segment assets include net inventory, receivables and derivative assets. Segment liabilities include payables, provisions and derivative liabilities.
Distribution Retail
2021 APAC
£m
UK & Europe
£m
Americas & Africa
£m
Total Distribution
£m APAC
£m
UK & Europe
£m
Total Retail
£m Total
£m
Other segment items Capital expenditure:
– Property, plant and equipment 10.7 5.1 12.4 28.2 – 21.2 21.2 49.4 – Interest in leased vehicles 1.8 2.0 0.1 3.9 – – – 3.9 – Right-of-use assets 29.1 1.6 7.8 38.5 – 6.2 6.2 44.7
– Intangible assets 4.1 4.6 2.8 11.5 – 4.3 4.3 15.8Depreciation:
– Property, plant and equipment 7.7 3.7 7.2 18.6 – 11.4 11.4 30.0 – Interest in leased vehicles 2.0 0.2 0.3 2.5 – – – 2.5 – Right-of-use assets 25.3 4.7 9.3 39.3 – 10.6 10.6 49.9
Amortisation of intangible assets 11.5 13.2 3.4 28.1 – 4.9 4.9 33.0Impairment of goodwill – – 12.9 12.9 – – – 12.9Reversal of impairment of distribution agreements – – (12.9) (12.9) – – – (12.9)Impairment of other intangible assets 0.1 – 0.1 0.2 – – – 0.2Impairment / (reversal of impairment) of property, plant and equipment – 0.4 0.3 0.7 – (2.6) (2.6) (1.9)Impairment of right-of-use assets 0.3 – 0.6 0.9 – 0.2 0.2 1.1Impairment of assets held for sale – – 1.5 1.5 – – – 1.5Net provisions charged to the consolidated income statement 10.7 3.0 8.0 21.7 – 5.7 5.7 27.4
Net provisions include inventory, trade receivables impairment and other liability provisions.
INCHCAPE ANNUAL REPORT AND ACCOUNTS 2021 137
STRA
TEGIC
REPO
RTG
OV
ERN
AN
CE
FINA
NC
IAL STA
TEMEN
TS
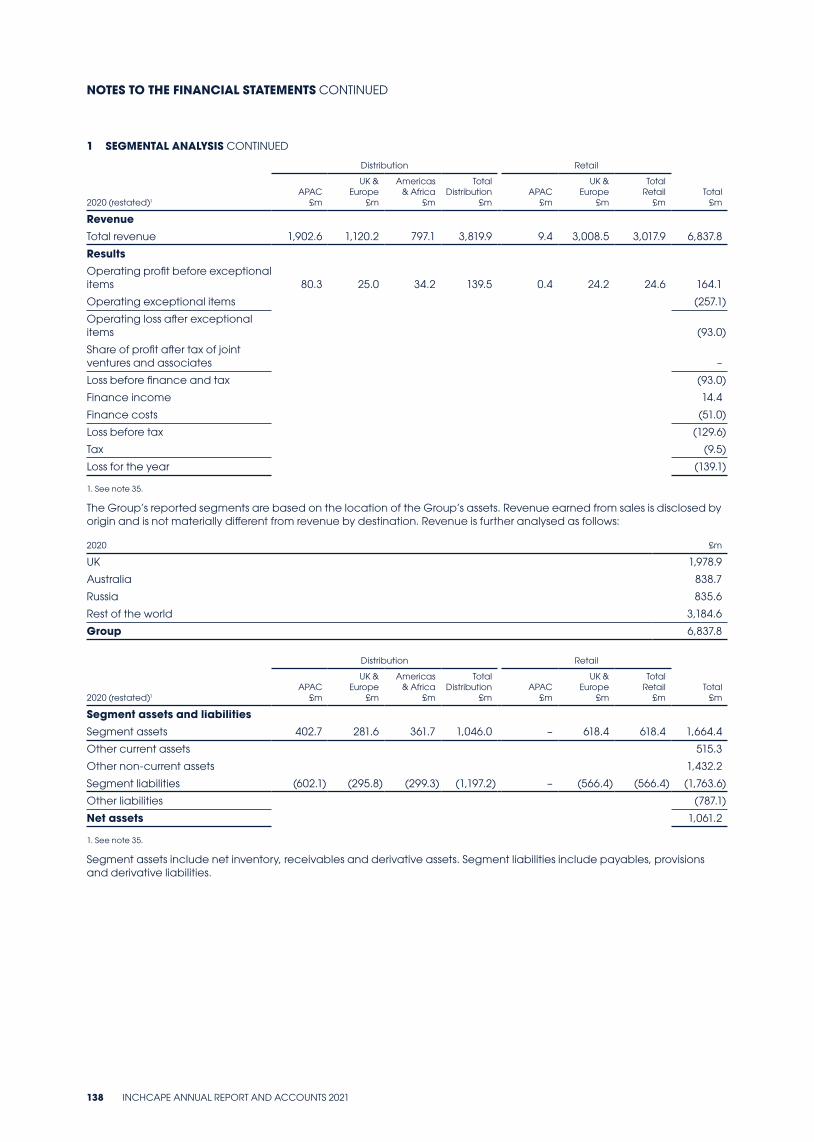
1 SEGMENTAL ANALYSIS CONTINUED
Distribution Retail
2020 (restated)1
APAC £m
UK & Europe
£m
Americas & Africa
£m
Total Distribution
£m APAC
£m
UK & Europe
£m
Total Retail
£m Total
£m
RevenueTotal revenue 1,902.6 1,120.2 797.1 3,819.9 9.4 3,008.5 3,017.9 6,837.8
Results
Operating profit before exceptional items 80.3 25.0 34.2 139.5 0.4 24.2 24.6 164.1
Operating exceptional items (257.1)
Operating loss after exceptional items (93.0)
Share of profit after tax of joint ventures and associates –
Loss before finance and tax (93.0)
Finance income 14.4
Finance costs (51.0)
Loss before tax (129.6)
Tax (9.5)
Loss for the year (139.1)
1. See note 35.
The Group’s reported segments are based on the location of the Group’s assets. Revenue earned from sales is disclosed by origin and is not materially different from revenue by destination. Revenue is further analysed as follows:
2020 £m
UK 1,978.9
Australia 838.7
Russia 835.6
Rest of the world 3,184.6
Group 6,837.8
Distribution Retail
2020 (restated)1
APAC £m
UK & Europe
£m
Americas & Africa
£m
Total Distribution
£m APAC
£m
UK & Europe
£m
Total Retail
£mTotal
£m
Segment assets and liabilities Segment assets 402.7 281.6 361.7 1,046.0 – 618.4 618.4 1,664.4
Other current assets 515.3
Other non-current assets 1,432.2
Segment liabilities (602.1) (295.8) (299.3) (1,197.2) – (566.4) (566.4) (1,763.6)
Other liabilities (787.1)
Net assets 1,061.2
1. See note 35.
Segment assets include net inventory, receivables and derivative assets. Segment liabilities include payables, provisions and derivative liabilities.
NOTES TO THE FINANCIAL STATEMENTS CONTINUED
138 INCHCAPE ANNUAL REPORT AND ACCOUNTS 2021
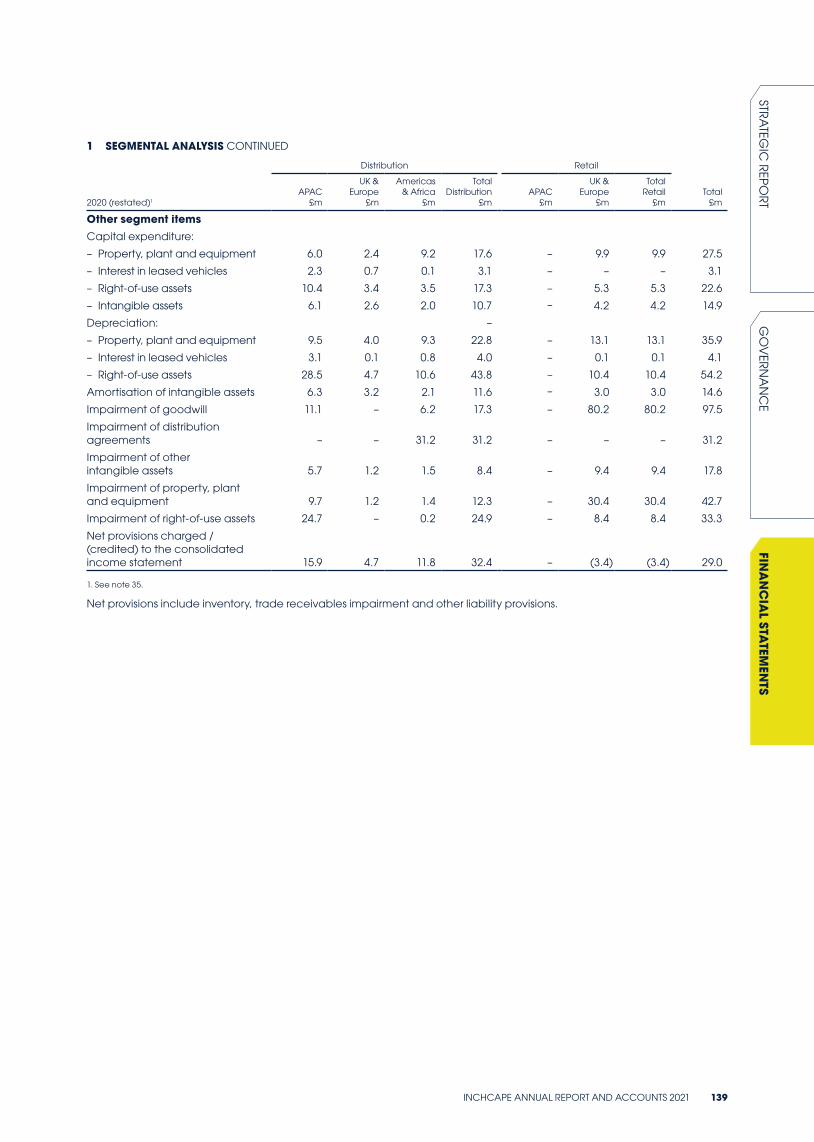
1 SEGMENTAL ANALYSIS CONTINUED
Distribution Retail
2020 (restated)1
APAC £m
UK & Europe
£m
Americas & Africa
£m
Total Distribution
£m APAC
£m
UK & Europe
£m
Total Retail
£mTotal
£m
Other segment items Capital expenditure:
– Property, plant and equipment 6.0 2.4 9.2 17.6 – 9.9 9.9 27.5
– Interest in leased vehicles 2.3 0.7 0.1 3.1 – – – 3.1
– Right-of-use assets 10.4 3.4 3.5 17.3 – 5.3 5.3 22.6
– Intangible assets 6.1 2.6 2.0 10.7 – 4.2 4.2 14.9
Depreciation: –
– Property, plant and equipment 9.5 4.0 9.3 22.8 – 13.1 13.1 35.9
– Interest in leased vehicles 3.1 0.1 0.8 4.0 – 0.1 0.1 4.1
– Right-of-use assets 28.5 4.7 10.6 43.8 – 10.4 10.4 54.2
Amortisation of intangible assets 6.3 3.2 2.1 11.6 – 3.0 3.0 14.6
Impairment of goodwill 11.1 – 6.2 17.3 – 80.2 80.2 97.5
Impairment of distribution agreements – – 31.2 31.2 – – – 31.2
Impairment of other intangible assets 5.7 1.2 1.5 8.4 – 9.4 9.4 17.8
Impairment of property, plant and equipment 9.7 1.2 1.4 12.3 – 30.4 30.4 42.7
Impairment of right-of-use assets 24.7 – 0.2 24.9 – 8.4 8.4 33.3
Net provisions charged / (credited) to the consolidated income statement 15.9 4.7 11.8 32.4 – (3.4) (3.4) 29.0
1. See note 35.
Net provisions include inventory, trade receivables impairment and other liability provisions.
INCHCAPE ANNUAL REPORT AND ACCOUNTS 2021 139
STRA
TEGIC
REPO
RTG
OV
ERN
AN
CE
FINA
NC
IAL STA
TEMEN
TS
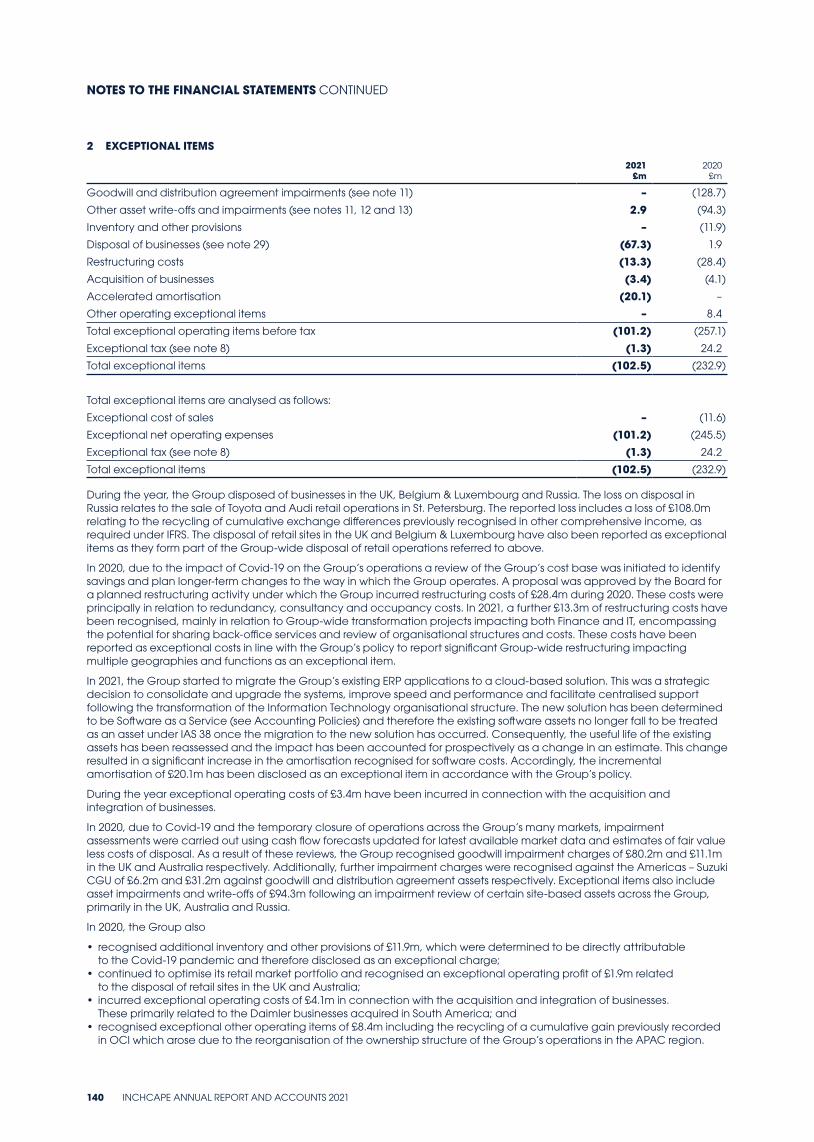
2 EXCEPTIONAL ITEMS
2021 £m
2020 £m
Goodwill and distribution agreement impairments (see note 11) – (128.7)
Other asset write-offs and impairments (see notes 11, 12 and 13) 2.9 (94.3)
Inventory and other provisions – (11.9)
Disposal of businesses (see note 29) (67.3) 1.9
Restructuring costs (13.3) (28.4)
Acquisition of businesses (3.4) (4.1)
Accelerated amortisation (20.1) –
Other operating exceptional items – 8.4
Total exceptional operating items before tax (101.2) (257.1)
Exceptional tax (see note 8) (1.3) 24.2
Total exceptional items (102.5) (232.9)
Total exceptional items are analysed as follows:
Exceptional cost of sales – (11.6)
Exceptional net operating expenses (101.2) (245.5)
Exceptional tax (see note 8) (1.3) 24.2
Total exceptional items (102.5) (232.9)
During the year, the Group disposed of businesses in the UK, Belgium & Luxembourg and Russia. The loss on disposal in Russia relates to the sale of Toyota and Audi retail operations in St. Petersburg. The reported loss includes a loss of £108.0m relating to the recycling of cumulative exchange differences previously recognised in other comprehensive income, as required under IFRS. The disposal of retail sites in the UK and Belgium & Luxembourg have also been reported as exceptional items as they form part of the Group-wide disposal of retail operations referred to above.
In 2020, due to the impact of Covid-19 on the Group’s operations a review of the Group’s cost base was initiated to identify savings and plan longer-term changes to the way in which the Group operates. A proposal was approved by the Board for a planned restructuring activity under which the Group incurred restructuring costs of £28.4m during 2020. These costs were principally in relation to redundancy, consultancy and occupancy costs. In 2021, a further £13.3m of restructuring costs have been recognised, mainly in relation to Group-wide transformation projects impacting both Finance and IT, encompassing the potential for sharing back-office services and review of organisational structures and costs. These costs have been reported as exceptional costs in line with the Group’s policy to report significant Group-wide restructuring impacting multiple geographies and functions as an exceptional item.
In 2021, the Group started to migrate the Group’s existing ERP applications to a cloud-based solution. This was a strategic decision to consolidate and upgrade the systems, improve speed and performance and facilitate centralised support following the transformation of the Information Technology organisational structure. The new solution has been determined to be Software as a Service (see Accounting Policies) and therefore the existing software assets no longer fall to be treated as an asset under IAS 38 once the migration to the new solution has occurred. Consequently, the useful life of the existing assets has been reassessed and the impact has been accounted for prospectively as a change in an estimate. This change resulted in a significant increase in the amortisation recognised for software costs. Accordingly, the incremental amortisation of £20.1m has been disclosed as an exceptional item in accordance with the Group’s policy.
During the year exceptional operating costs of £3.4m have been incurred in connection with the acquisition and integration of businesses.
In 2020, due to Covid-19 and the temporary closure of operations across the Group’s many markets, impairment assessments were carried out using cash flow forecasts updated for latest available market data and estimates of fair value less costs of disposal. As a result of these reviews, the Group recognised goodwill impairment charges of £80.2m and £11.1m in the UK and Australia respectively. Additionally, further impairment charges were recognised against the Americas – Suzuki CGU of £6.2m and £31.2m against goodwill and distribution agreement assets respectively. Exceptional items also include asset impairments and write-offs of £94.3m following an impairment review of certain site-based assets across the Group, primarily in the UK, Australia and Russia.
In 2020, the Group also
• recognised additional inventory and other provisions of £11.9m, which were determined to be directly attributable to the Covid-19 pandemic and therefore disclosed as an exceptional charge;
• continued to optimise its retail market portfolio and recognised an exceptional operating profit of £1.9m related to the disposal of retail sites in the UK and Australia;
• incurred exceptional operating costs of £4.1m in connection with the acquisition and integration of businesses. These primarily related to the Daimler businesses acquired in South America; and
• recognised exceptional other operating items of £8.4m including the recycling of a cumulative gain previously recorded in OCI which arose due to the reorganisation of the ownership structure of the Group’s operations in the APAC region.
NOTES TO THE FINANCIAL STATEMENTS CONTINUED
140 INCHCAPE ANNUAL REPORT AND ACCOUNTS 2021
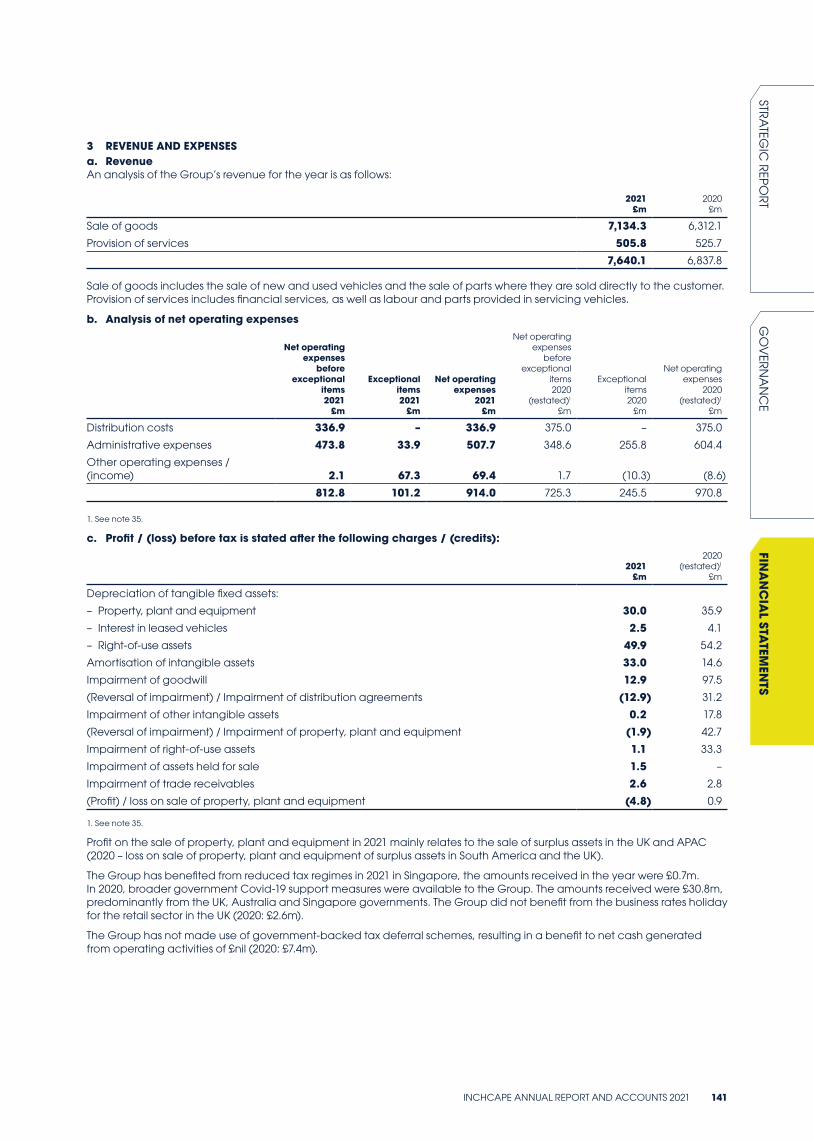
3 REVENUE AND EXPENSES a. Revenue An analysis of the Group’s revenue for the year is as follows:
2021 £m
2020 £m
Sale of goods 7,134.3 6,312.1
Provision of services 505.8 525.7
7,640.1 6,837.8
Sale of goods includes the sale of new and used vehicles and the sale of parts where they are sold directly to the customer. Provision of services includes financial services, as well as labour and parts provided in servicing vehicles.
b. Analysis of net operating expenses
Net operating expenses
before exceptional
items 2021
£m
Exceptional items 2021 £m
Net operating expenses
2021 £m
Net operating expenses
before exceptional
items 2020
(restated)1 £m
Exceptional items 2020
£m
Net operating expenses
2020(restated)1
£m
Distribution costs 336.9 – 336.9 375.0 – 375.0
Administrative expenses 473.8 33.9 507.7 348.6 255.8 604.4
Other operating expenses / (income) 2.1 67.3 69.4 1.7 (10.3) (8.6)
812.8 101.2 914.0 725.3 245.5 970.8
1. See note 35.
c. Profit / (loss) before tax is stated after the following charges / (credits):
2021 £m
2020(restated)1
£m
Depreciation of tangible fixed assets:
– Property, plant and equipment 30.0 35.9
– Interest in leased vehicles 2.5 4.1
– Right-of-use assets 49.9 54.2
Amortisation of intangible assets 33.0 14.6
Impairment of goodwill 12.9 97.5
(Reversal of impairment) / Impairment of distribution agreements (12.9) 31.2
Impairment of other intangible assets 0.2 17.8
(Reversal of impairment) / Impairment of property, plant and equipment (1.9) 42.7
Impairment of right-of-use assets 1.1 33.3
Impairment of assets held for sale 1.5 –
Impairment of trade receivables 2.6 2.8
(Profit) / loss on sale of property, plant and equipment (4.8) 0.9
1. See note 35.
Profit on the sale of property, plant and equipment in 2021 mainly relates to the sale of surplus assets in the UK and APAC (2020 – loss on sale of property, plant and equipment of surplus assets in South America and the UK).
The Group has benefited from reduced tax regimes in 2021 in Singapore, the amounts received in the year were £0.7m. In 2020, broader government Covid-19 support measures were available to the Group. The amounts received were £30.8m, predominantly from the UK, Australia and Singapore governments. The Group did not benefit from the business rates holiday for the retail sector in the UK (2020: £2.6m).
The Group has not made use of government-backed tax deferral schemes, resulting in a benefit to net cash generated from operating activities of £nil (2020: £7.4m).
INCHCAPE ANNUAL REPORT AND ACCOUNTS 2021 141
STRA
TEGIC
REPO
RTG
OV
ERN
AN
CE
FINA
NC
IAL STA
TEMEN
TS
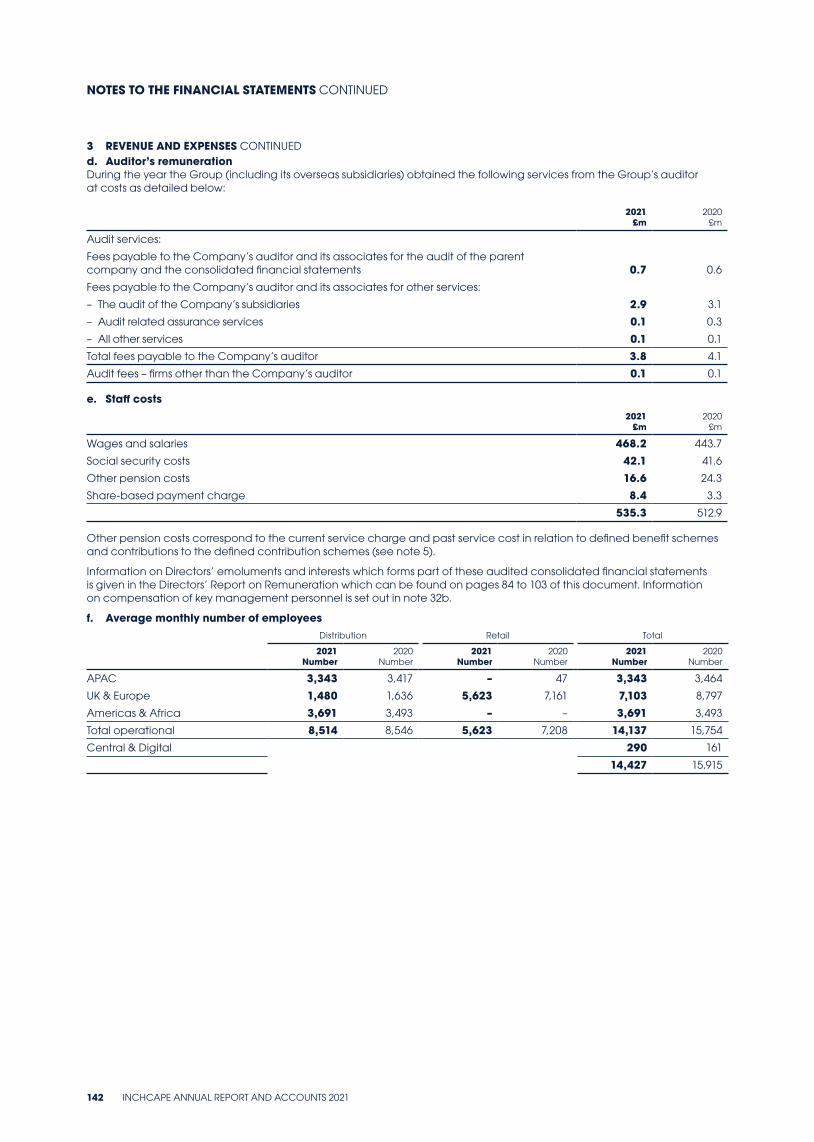
3 REVENUE AND EXPENSES CONTINUEDd. Auditor’s remunerationDuring the year the Group (including its overseas subsidiaries) obtained the following services from the Group’s auditor at costs as detailed below:
2021 £m
2020 £m
Audit services:
Fees payable to the Company’s auditor and its associates for the audit of the parent company and the consolidated financial statements 0.7 0.6
Fees payable to the Company’s auditor and its associates for other services:
– The audit of the Company’s subsidiaries 2.9 3.1
– Audit related assurance services 0.1 0.3
– All other services 0.1 0.1
Total fees payable to the Company’s auditor 3.8 4.1
Audit fees – firms other than the Company’s auditor 0.1 0.1
e. Staff costs 2021
£m 2020
£m
Wages and salaries 468.2 443.7
Social security costs 42.1 41.6
Other pension costs 16.6 24.3
Share-based payment charge 8.4 3.3
535.3 512.9
Other pension costs correspond to the current service charge and past service cost in relation to defined benefit schemes and contributions to the defined contribution schemes (see note 5).
Information on Directors’ emoluments and interests which forms part of these audited consolidated financial statements is given in the Directors’ Report on Remuneration which can be found on pages 84 to 103 of this document. Information on compensation of key management personnel is set out in note 32b.
f. Average monthly number of employeesDistribution Retail Total
2021 Number
2020 Number
2021 Number
2020 Number
2021 Number
2020 Number
APAC 3,343 3,417 – 47 3,343 3,464
UK & Europe 1,480 1,636 5,623 7,161 7,103 8,797
Americas & Africa 3,691 3,493 – – 3,691 3,493
Total operational 8,514 8,546 5,623 7,208 14,137 15,754
Central & Digital 290 161
14,427 15,915
NOTES TO THE FINANCIAL STATEMENTS CONTINUED
142 INCHCAPE ANNUAL REPORT AND ACCOUNTS 2021
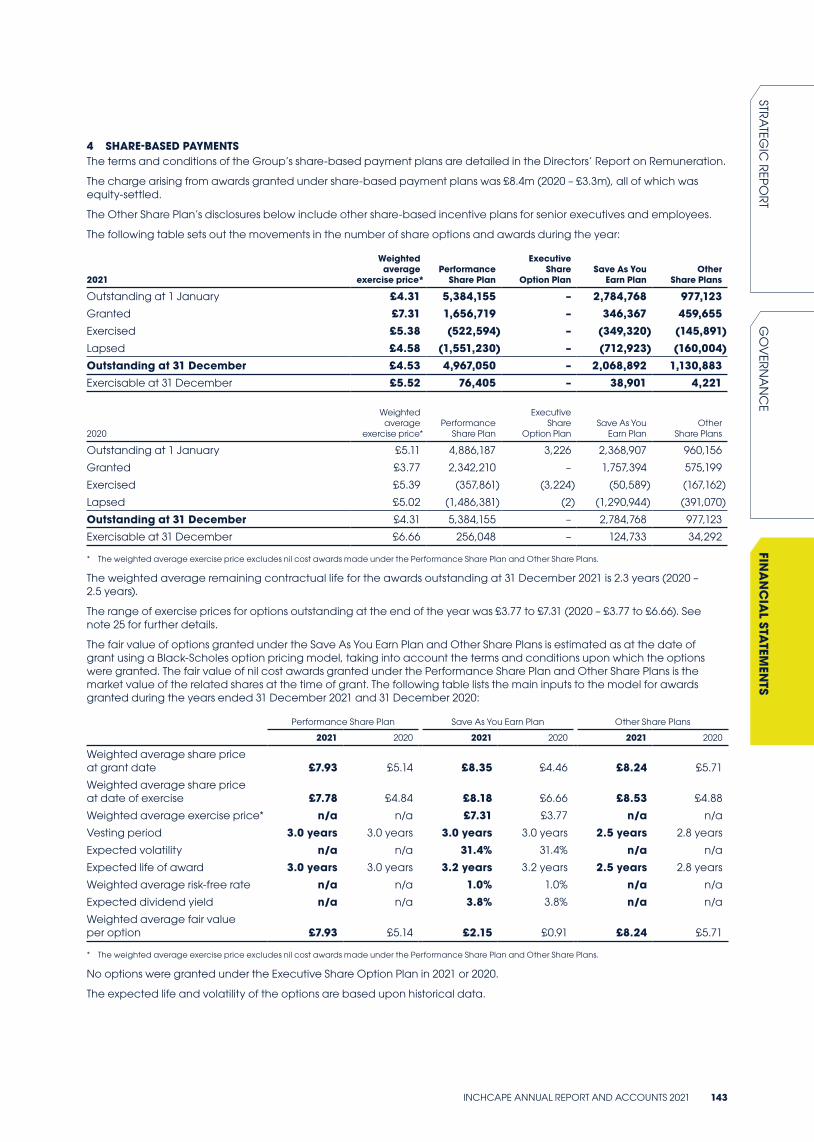
4 SHARE-BASED PAYMENTSThe terms and conditions of the Group’s share-based payment plans are detailed in the Directors’ Report on Remuneration.
The charge arising from awards granted under share-based payment plans was £8.4m (2020 – £3.3m), all of which was equity-settled.
The Other Share Plan’s disclosures below include other share-based incentive plans for senior executives and employees.
The following table sets out the movements in the number of share options and awards during the year:
2021
Weighted average
exercise price*Performance
Share Plan
Executive Share
Option PlanSave As You
Earn PlanOther
Share Plans
Outstanding at 1 January £4.31 5,384,155 – 2,784,768 977,123 Granted £7.31 1,656,719 – 346,367 459,655Exercised £5.38 (522,594) – (349,320) (145,891)Lapsed £4.58 (1,551,230) – (712,923) (160,004)Outstanding at 31 December £4.53 4,967,050 – 2,068,892 1,130,883Exercisable at 31 December £5.52 76,405 – 38,901 4,221
2020
Weighted average
exercise price*Performance
Share Plan
Executive Share
Option PlanSave As You
Earn PlanOther
Share Plans
Outstanding at 1 January £5.11 4,886,187 3,226 2,368,907 960,156
Granted £3.77 2,342,210 – 1,757,394 575,199
Exercised £5.39 (357,861) (3,224) (50,589) (167,162)
Lapsed £5.02 (1,486,381) (2) (1,290,944) (391,070)
Outstanding at 31 December £4.31 5,384,155 – 2,784,768 977,123
Exercisable at 31 December £6.66 256,048 – 124,733 34,292
* The weighted average exercise price excludes nil cost awards made under the Performance Share Plan and Other Share Plans.
The weighted average remaining contractual life for the awards outstanding at 31 December 2021 is 2.3 years (2020 – 2.5 years).
The range of exercise prices for options outstanding at the end of the year was £3.77 to £7.31 (2020 – £3.77 to £6.66). See note 25 for further details.
The fair value of options granted under the Save As You Earn Plan and Other Share Plans is estimated as at the date of grant using a Black-Scholes option pricing model, taking into account the terms and conditions upon which the options were granted. The fair value of nil cost awards granted under the Performance Share Plan and Other Share Plans is the market value of the related shares at the time of grant. The following table lists the main inputs to the model for awards granted during the years ended 31 December 2021 and 31 December 2020:
Performance Share Plan Save As You Earn Plan Other Share Plans
2021 2020 2021 2020 2021 2020
Weighted average share price at grant date £7.93 £5.14 £8.35 £4.46 £8.24 £5.71
Weighted average share price at date of exercise £7.78 £4.84 £8.18 £6.66 £8.53 £4.88
Weighted average exercise price* n/a n/a £7.31 £3.77 n/a n/a
Vesting period 3.0 years 3.0 years 3.0 years 3.0 years 2.5 years 2.8 years
Expected volatility n/a n/a 31.4% 31.4% n/a n/a
Expected life of award 3.0 years 3.0 years 3.2 years 3.2 years 2.5 years 2.8 years
Weighted average risk-free rate n/a n/a 1.0% 1.0% n/a n/a
Expected dividend yield n/a n/a 3.8% 3.8% n/a n/a
Weighted average fair value per option £7.93 £5.14 £2.15 £0.91 £8.24 £5.71
* The weighted average exercise price excludes nil cost awards made under the Performance Share Plan and Other Share Plans.
No options were granted under the Executive Share Option Plan in 2021 or 2020.
The expected life and volatility of the options are based upon historical data.
INCHCAPE ANNUAL REPORT AND ACCOUNTS 2021 143
STRA
TEGIC
REPO
RTG
OV
ERN
AN
CE
FINA
NC
IAL STA
TEMEN
TS

5 PENSIONS AND OTHER POST-RETIREMENT BENEFITSThe Group operates a number of pension and post-retirement benefit schemes for its employees in a number of its businesses, primarily in the UK.
a. UK schemes: benefits, governance, cash flow obligations and investmentsThe Inchcape Motors Pension Scheme (‘IMPS’) in the UK is the Group’s main defined benefit pension scheme. It is comprised of the Group, Motors, Normand and Cash+ sections. The Group, Motors and Normand sections provide benefits linked to the final salary of members, are closed to new members and largely closed to future benefit accrual.
The Cash+ section is a defined benefit cash balance scheme. Following a consultation process with relevant employees this section closed to future benefit accrual on 31 December 2020. From 1 January 2021 UK employees were offered membership of the Inchcape Retirement Savings Plan, a defined contribution workplace personal pension scheme, which is designed to comply with auto enrolment legislation.
The Group also operates the Inchcape Overseas Pension Scheme which is non-UK registered.
Benefit structureFinal salary schemes provide benefits to members in the form of a guaranteed level of pension payable for life. The level of benefits provided depends on final salary at retirement (or leaving date, if earlier) and length of service. The Group bears risks in relation to its final salary schemes, notably relating to investment performance, interest rates, inflation and members’ life expectancies. There is potential for these risks to harm the funding position of the schemes. If the schemes were to be in deficit then additional contributions may be required from the Group. A number of exercises have been undertaken to mitigate these key funding risks.
Cash balance schemes like Cash+ allow members to accrue a percentage of their earnings each year, which then grows to provide a lump sum payment on retirement. Members have accrued benefits under this scheme with effect from 1 January 2013 up to 31 December 2020. The Group underwrites the investment and interest rate risk to normal retirement age (65). Inflation and mortality risks associated with benefits are borne solely by the members.
Defined contribution schemes like the Inchcape Retirement Savings Plan, which commenced on 1 January 2021, see members’ individual accounts credited with employee and employer contributions which are then invested to provide a pension pot on retirement. The Group does not underwrite investment, or other risks for this plan.
GovernanceOur UK schemes are registered with HM Revenue and Customs (“HMRC”) and comply fully with the regulatory framework published by the UK Pensions Regulator.
IMPS is established under trust law and has a trustee board that runs the scheme in accordance with the Trust Deed and Rules and relevant legislation. The trustee board comprises an independent sole trustee company appointed by the Group. As part of good governance, the Group reviewed the provision of trustee services to IMPS and after a formal tender process it was decided to move to a Sole Trustee model from June 2021. The Trustee is required to act in the best interest of the members and have responsibility for the scheme’s governance. The Trustee consults with the Group over decisions relating to matters such as funding and investments.
The Inchcape Retirement Savings Plan (a workplace personal pension scheme) has an external pension provider with its own governance committee.
The Group also has some minor unfunded arrangements relating to post-retirement health and medical plans in respect of past employees.
NOTES TO THE FINANCIAL STATEMENTS CONTINUED
144 INCHCAPE ANNUAL REPORT AND ACCOUNTS 2021
5 PENSIONS AND OTHER POST-RETIREMENT BENEFITS CONTINUEDScheme specific cash obligation/investment detailInchcape Motors Pension SchemeGroup, Motors and Normand sections (closed sections)The Group considers two measures of the pension deficit. The accounting position is shown on the Group balance sheet. The funding position, calculated at the triennial actuarial valuation, is used to agree contributions made to IMPS. The Trustee has finalised the latest actuarial valuations as at 5 April 2019 for the four sections of IMPS. As part of the valuation process the Trustee and Group have agreed future levels of contributions required to be made by the Group to IMPS.
The last completed actuarial valuations for the Group, Motors and Normand sections were carried out at 5 April 2019 on a market-related basis and determined in accordance with the advice of the Scheme Actuary based on the defined accrued benefit method. The actuarial valuation determined that the duration of the liabilities was approximately 17 years and that an aggregate deficit of £18.3m existed . The Group currently contributes £0.6m p.a. towards the administrative costs of running these sections. For the Normand section, the Group also currently pays deficit reduction contributions of £1.2m p.a., rising by 3.0% p.a. up until 5 April 2025 (at which point the funding shortfall is expected to be eliminated).
During 2021, the Trustee, after taking expert advice and consulting with the Group, partially de-risked the investment strategy on the Group and Motors section by selling certain growth assets with the proceeds being used to increase the matching assets. Each section’s investment strategy sees it holding a proportion of its assets in matching assets (broadly 84% for the Group section, 60% for the Motors section and 46% for the Normand section) with the remainder in growth assets. The matching assets are invested in a liability-driven investment solution complemented with absolute return bonds. They are expected to hedge inflation and interest rate risk in a capitally efficient manner. The growth assets are invested in assets that are expected to grow at rates significantly faster than each section’s liabilities and include equities, diversified growth funds and property.
Cash+ section (closed section)This scheme is a defined benefit scheme under which members accrued benefits up until 31 December 2020. The latest actuarial valuation was carried out at 5 April 2019 on a market-related basis and determined in accordance with the advice of the Scheme Actuary based on the projected unit method. The valuation showed a funding deficit of £17.6m, with the Trustee expecting the shortfall to be removed by deficit recovery contributions and returns on the assets held. Under the agreed Schedule of Contributions the Group will contribute approximately £2.8m p.a. in deficit recovery contributions up until 5 April 2028 (at which point the funding shortfall is expected to be eliminated) and £0.2m p.a. towards the administrative costs of running the scheme.
The investment strategy is to be 60% invested in diversified growth funds which are designed to grow at a rate significantly faster than the liabilities, whilst spreading investment risk across a broad spectrum of asset classes. The remaining 40% is split equally between multi-factor equities and emerging market multi-asset funds.
Inchcape Overseas Pension Scheme (closed section)This scheme is managed from Guernsey and is subject to regulations similar to the UK. It is therefore reported under the United Kingdom in this note. The latest triennial actuarial valuation for this scheme was carried out at 31 March 2018 and determined in accordance with the advice of the Scheme Actuary based on the projected unit credit method. The actuarial valuation determined that the duration of the liabilities was approximately 12 years and that the scheme was approximately 77% funded on a prudent funding basis. To make good the funding deficit of £16.2m, it has been agreed that deficit contributions of £1.5m p.a. will be paid by means of an annual lump sum for 10 years, ending with the payment due in July 2029. The first payment at this new level was paid on 1 July 2020. Additional contributions in respect of expenses of £0.2m per annum will also be made. The 31 March 2021 triennial actuarial valuation is currently ongoing.
b. Overseas schemesThere are a number of smaller defined benefit schemes overseas, the most significant being the Inchcape Motors Limited Retirement Scheme in Hong Kong. In general, these schemes offer a lump sum on retirement with no further obligation to the employee and assets are held in trust in separately administered funds. These schemes are typically subject to triennial valuations. The overseas defined contribution schemes are principally linked to local statutory arrangements.
c. Defined contribution plansThe total expense recognised in the consolidated income statement is £14.5m (2020 – £5.9m). There are no outstanding contributions at 31 December 2021 (2020 – nil).
d. Defined benefit plansAs the Group’s principal defined benefit schemes are in the UK, these have been reported separately from the overseas schemes. For the purposes of reporting, actuarial updates have been obtained for the Group’s material schemes and these updates are reflected in the amounts reported in the following tables.
INCHCAPE ANNUAL REPORT AND ACCOUNTS 2021 145
STRA
TEGIC
REPO
RTG
OV
ERN
AN
CE
FINA
NC
IAL STA
TEMEN
TS
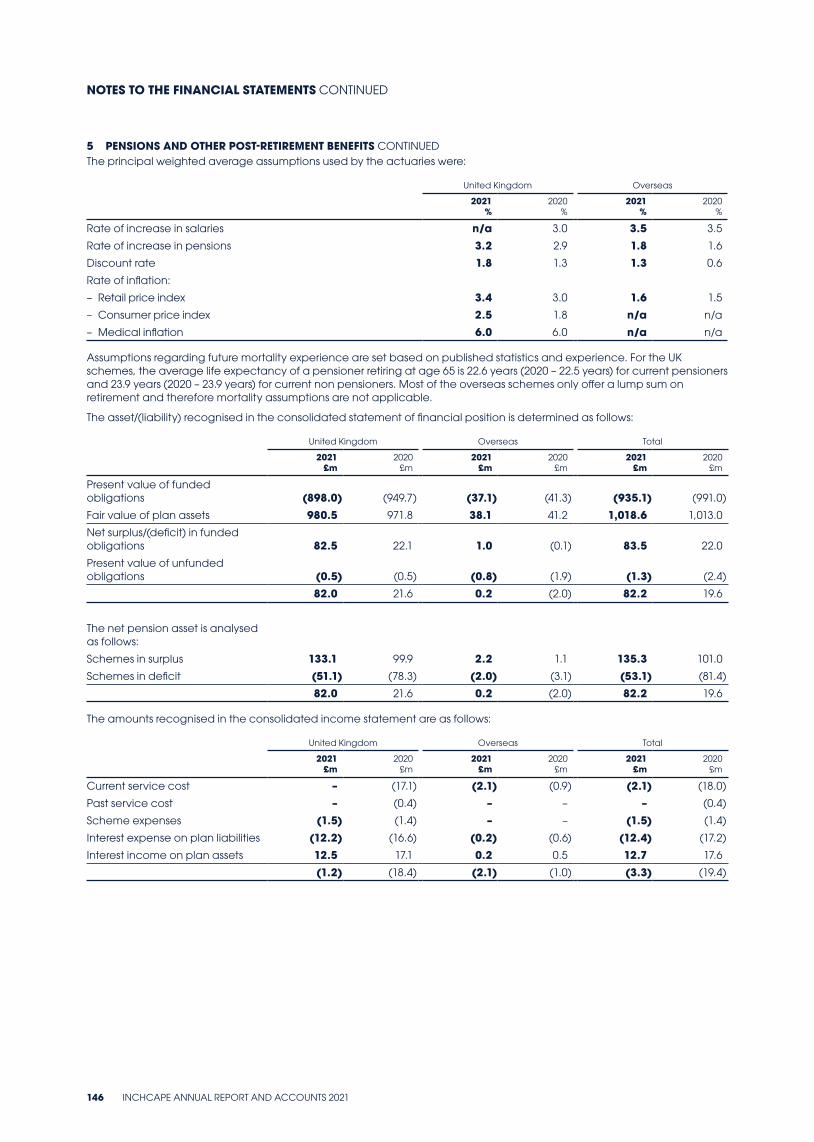
5 PENSIONS AND OTHER POST-RETIREMENT BENEFITS CONTINUEDThe principal weighted average assumptions used by the actuaries were:
United Kingdom Overseas
2021 %
2020 %
2021 %
2020 %
Rate of increase in salaries n/a 3.0 3.5 3.5
Rate of increase in pensions 3.2 2.9 1.8 1.6
Discount rate 1.8 1.3 1.3 0.6
Rate of inflation:
– Retail price index 3.4 3.0 1.6 1.5
– Consumer price index 2.5 1.8 n/a n/a
– Medical inflation 6.0 6.0 n/a n/a
Assumptions regarding future mortality experience are set based on published statistics and experience. For the UK schemes, the average life expectancy of a pensioner retiring at age 65 is 22.6 years (2020 – 22.5 years) for current pensioners and 23.9 years (2020 – 23.9 years) for current non pensioners. Most of the overseas schemes only offer a lump sum on retirement and therefore mortality assumptions are not applicable.
The asset/(liability) recognised in the consolidated statement of financial position is determined as follows:
United Kingdom Overseas Total
2021 £m
2020 £m
2021 £m
2020 £m
2021 £m
2020 £m
Present value of funded obligations (898.0) (949.7) (37.1) (41.3) (935.1) (991.0)
Fair value of plan assets 980.5 971.8 38.1 41.2 1,018.6 1,013.0
Net surplus/(deficit) in funded obligations 82.5 22.1 1.0 (0.1) 83.5 22.0
Present value of unfunded obligations (0.5) (0.5) (0.8) (1.9) (1.3) (2.4)
82.0 21.6 0.2 (2.0) 82.2 19.6
The net pension asset is analysed as follows:
Schemes in surplus 133.1 99.9 2.2 1.1 135.3 101.0
Schemes in deficit (51.1) (78.3) (2.0) (3.1) (53.1) (81.4)
82.0 21.6 0.2 (2.0) 82.2 19.6
The amounts recognised in the consolidated income statement are as follows:
United Kingdom Overseas Total
2021
£m2020
£m2021
£m2020
£m2021
£m2020
£m
Current service cost – (17.1) (2.1) (0.9) (2.1) (18.0)
Past service cost – (0.4) – – – (0.4)
Scheme expenses (1.5) (1.4) – – (1.5) (1.4)
Interest expense on plan liabilities (12.2) (16.6) (0.2) (0.6) (12.4) (17.2)
Interest income on plan assets 12.5 17.1 0.2 0.5 12.7 17.6
(1.2) (18.4) (2.1) (1.0) (3.3) (19.4)
NOTES TO THE FINANCIAL STATEMENTS CONTINUED
146 INCHCAPE ANNUAL REPORT AND ACCOUNTS 2021
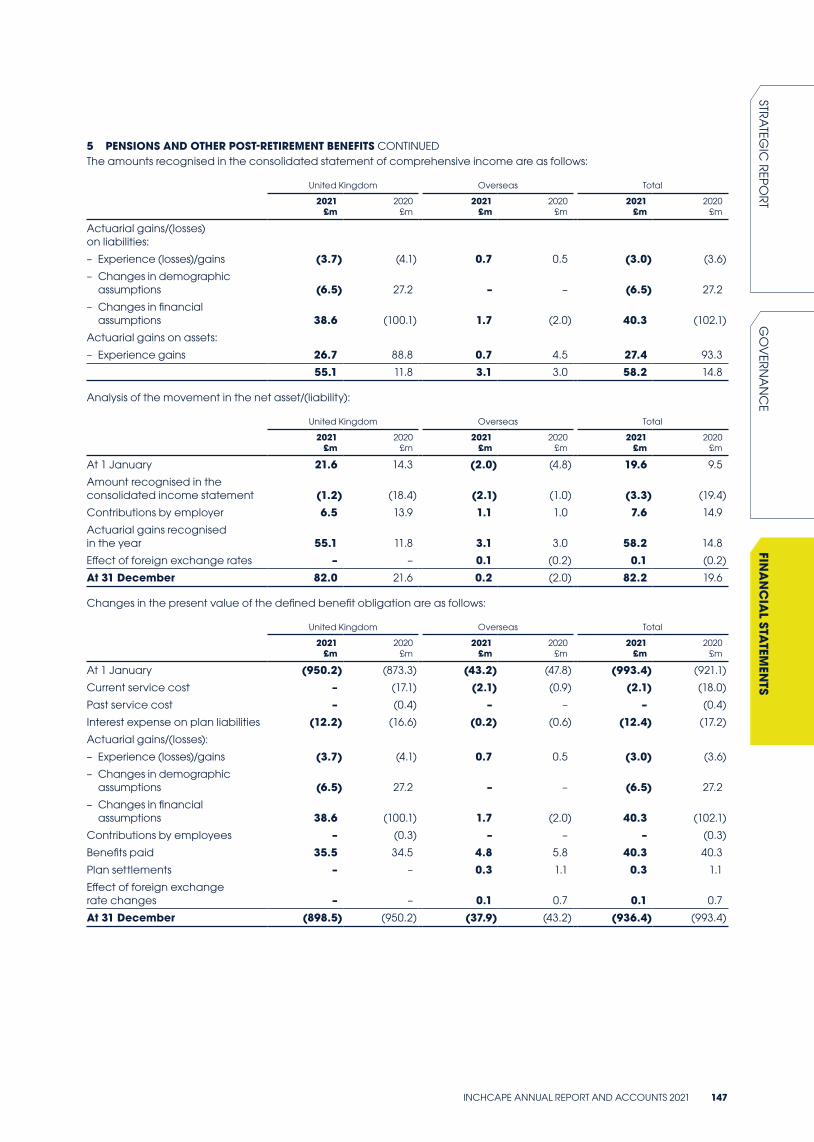
5 PENSIONS AND OTHER POST-RETIREMENT BENEFITS CONTINUEDThe amounts recognised in the consolidated statement of comprehensive income are as follows:
United Kingdom Overseas Total
2021 £m
2020 £m
2021 £m
2020 £m
2021 £m
2020 £m
Actuarial gains/(losses) on liabilities:
– Experience (losses)/gains (3.7) (4.1) 0.7 0.5 (3.0) (3.6)
– Changes in demographic assumptions (6.5) 27.2 – – (6.5) 27.2
– Changes in financial assumptions 38.6 (100.1) 1.7 (2.0) 40.3 (102.1)
Actuarial gains on assets:
– Experience gains 26.7 88.8 0.7 4.5 27.4 93.3
55.1 11.8 3.1 3.0 58.2 14.8
Analysis of the movement in the net asset/(liability):
United Kingdom Overseas Total
2021 £m
2020 £m
2021 £m
2020 £m
2021 £m
2020 £m
At 1 January 21.6 14.3 (2.0) (4.8) 19.6 9.5
Amount recognised in the consolidated income statement (1.2) (18.4) (2.1) (1.0) (3.3) (19.4)
Contributions by employer 6.5 13.9 1.1 1.0 7.6 14.9
Actuarial gains recognised in the year 55.1 11.8 3.1 3.0 58.2 14.8
Effect of foreign exchange rates – – 0.1 (0.2) 0.1 (0.2)
At 31 December 82.0 21.6 0.2 (2.0) 82.2 19.6
Changes in the present value of the defined benefit obligation are as follows:
United Kingdom Overseas Total
2021 £m
2020 £m
2021 £m
2020 £m
2021 £m
2020 £m
At 1 January (950.2) (873.3) (43.2) (47.8) (993.4) (921.1)
Current service cost – (17.1) (2.1) (0.9) (2.1) (18.0)
Past service cost – (0.4) – – – (0.4)
Interest expense on plan liabilities (12.2) (16.6) (0.2) (0.6) (12.4) (17.2)
Actuarial gains/(losses):
– Experience (losses)/gains (3.7) (4.1) 0.7 0.5 (3.0) (3.6)
– Changes in demographic assumptions (6.5) 27.2 – – (6.5) 27.2
– Changes in financial assumptions 38.6 (100.1) 1.7 (2.0) 40.3 (102.1)
Contributions by employees – (0.3) – – – (0.3)
Benefits paid 35.5 34.5 4.8 5.8 40.3 40.3
Plan settlements – – 0.3 1.1 0.3 1.1
Effect of foreign exchange rate changes – – 0.1 0.7 0.1 0.7
At 31 December (898.5) (950.2) (37.9) (43.2) (936.4) (993.4)
INCHCAPE ANNUAL REPORT AND ACCOUNTS 2021 147
STRA
TEGIC
REPO
RTG
OV
ERN
AN
CE
FINA
NC
IAL STA
TEMEN
TS
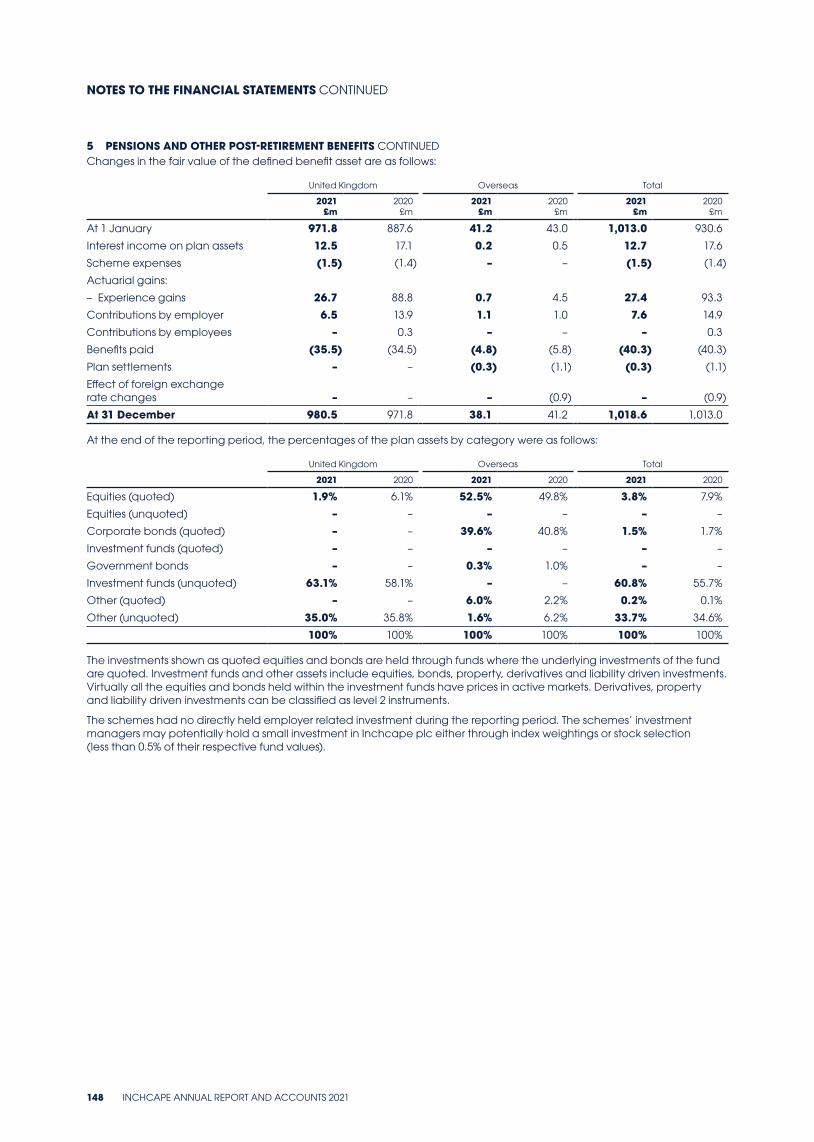
5 PENSIONS AND OTHER POST-RETIREMENT BENEFITS CONTINUEDChanges in the fair value of the defined benefit asset are as follows:
United Kingdom Overseas Total
2021 £m
2020 £m
2021 £m
2020 £m
2021 £m
2020 £m
At 1 January 971.8 887.6 41.2 43.0 1,013.0 930.6
Interest income on plan assets 12.5 17.1 0.2 0.5 12.7 17.6
Scheme expenses (1.5) (1.4) – – (1.5) (1.4)
Actuarial gains:
– Experience gains 26.7 88.8 0.7 4.5 27.4 93.3
Contributions by employer 6.5 13.9 1.1 1.0 7.6 14.9
Contributions by employees – 0.3 – – – 0.3
Benefits paid (35.5) (34.5) (4.8) (5.8) (40.3) (40.3)
Plan settlements – – (0.3) (1.1) (0.3) (1.1)
Effect of foreign exchange rate changes – – – (0.9) – (0.9)
At 31 December 980.5 971.8 38.1 41.2 1,018.6 1,013.0
At the end of the reporting period, the percentages of the plan assets by category were as follows:
United Kingdom Overseas Total
2021 2020 2021 2020 2021 2020
Equities (quoted) 1.9% 6.1% 52.5% 49.8% 3.8% 7.9%
Equities (unquoted) – – – – – –
Corporate bonds (quoted) – – 39.6% 40.8% 1.5% 1.7%
Investment funds (quoted) – – – – – –
Government bonds – – 0.3% 1.0% – –
Investment funds (unquoted) 63.1% 58.1% – – 60.8% 55.7%
Other (quoted) – – 6.0% 2.2% 0.2% 0.1%
Other (unquoted) 35.0% 35.8% 1.6% 6.2% 33.7% 34.6%
100% 100% 100% 100% 100% 100%
The investments shown as quoted equities and bonds are held through funds where the underlying investments of the fund are quoted. Investment funds and other assets include equities, bonds, property, derivatives and liability driven investments. Virtually all the equities and bonds held within the investment funds have prices in active markets. Derivatives, property and liability driven investments can be classified as level 2 instruments.
The schemes had no directly held employer related investment during the reporting period. The schemes’ investment managers may potentially hold a small investment in Inchcape plc either through index weightings or stock selection (less than 0.5% of their respective fund values).
NOTES TO THE FINANCIAL STATEMENTS CONTINUED
148 INCHCAPE ANNUAL REPORT AND ACCOUNTS 2021
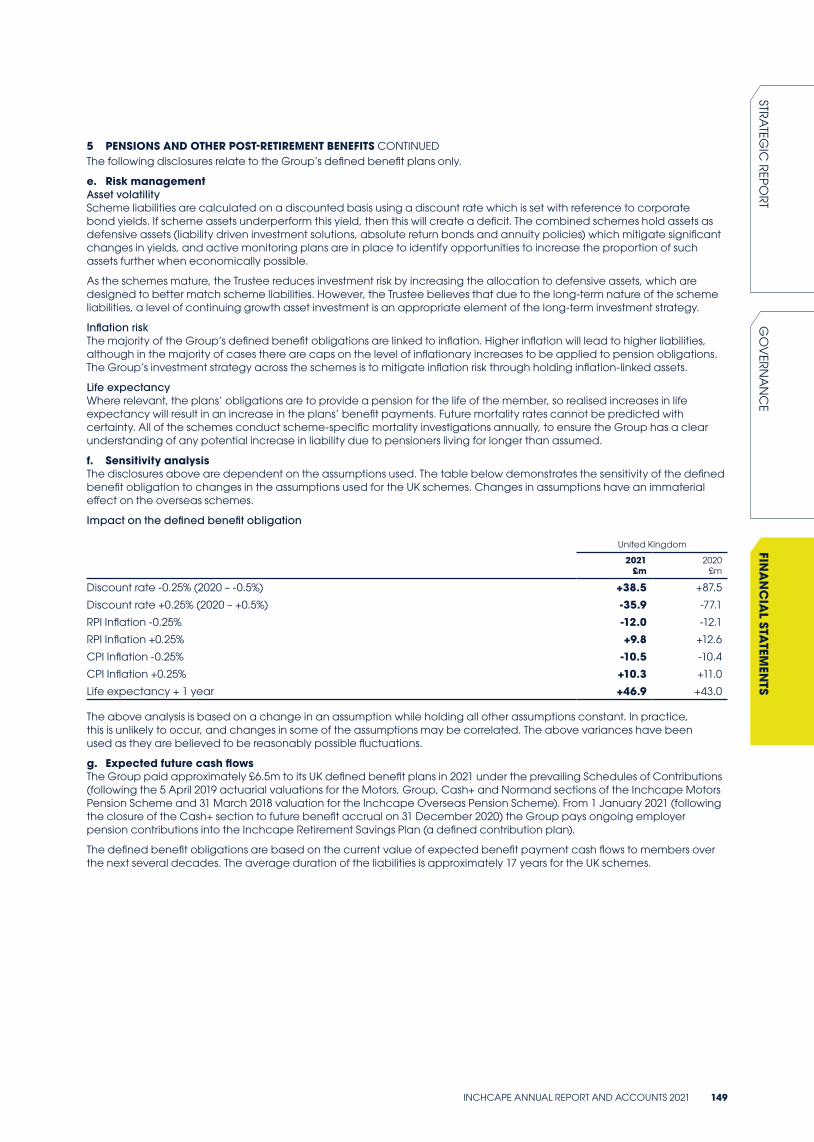
5 PENSIONS AND OTHER POST-RETIREMENT BENEFITS CONTINUEDThe following disclosures relate to the Group’s defined benefit plans only.
e. Risk managementAsset volatilityScheme liabilities are calculated on a discounted basis using a discount rate which is set with reference to corporate bond yields. If scheme assets underperform this yield, then this will create a deficit. The combined schemes hold assets as defensive assets (liability driven investment solutions, absolute return bonds and annuity policies) which mitigate significant changes in yields, and active monitoring plans are in place to identify opportunities to increase the proportion of such assets further when economically possible.
As the schemes mature, the Trustee reduces investment risk by increasing the allocation to defensive assets, which are designed to better match scheme liabilities. However, the Trustee believes that due to the long-term nature of the scheme liabilities, a level of continuing growth asset investment is an appropriate element of the long-term investment strategy.
Inflation riskThe majority of the Group’s defined benefit obligations are linked to inflation. Higher inflation will lead to higher liabilities, although in the majority of cases there are caps on the level of inflationary increases to be applied to pension obligations. The Group’s investment strategy across the schemes is to mitigate inflation risk through holding inflation-linked assets.
Life expectancyWhere relevant, the plans’ obligations are to provide a pension for the life of the member, so realised increases in life expectancy will result in an increase in the plans’ benefit payments. Future mortality rates cannot be predicted with certainty. All of the schemes conduct scheme-specific mortality investigations annually, to ensure the Group has a clear understanding of any potential increase in liability due to pensioners living for longer than assumed.
f. Sensitivity analysisThe disclosures above are dependent on the assumptions used. The table below demonstrates the sensitivity of the defined benefit obligation to changes in the assumptions used for the UK schemes. Changes in assumptions have an immaterial effect on the overseas schemes.
Impact on the defined benefit obligation
United Kingdom
2021 £m
2020 £m
Discount rate -0.25% (2020 – -0.5%) +38.5 +87.5
Discount rate +0.25% (2020 – +0.5%) -35.9 -77.1
RPI Inflation -0.25% -12.0 -12.1
RPI Inflation +0.25% +9.8 +12.6
CPI Inflation -0.25% -10.5 -10.4
CPI Inflation +0.25% +10.3 +11.0
Life expectancy + 1 year +46.9 +43.0
The above analysis is based on a change in an assumption while holding all other assumptions constant. In practice, this is unlikely to occur, and changes in some of the assumptions may be correlated. The above variances have been used as they are believed to be reasonably possible fluctuations.
g. Expected future cash flowsThe Group paid approximately £6.5m to its UK defined benefit plans in 2021 under the prevailing Schedules of Contributions (following the 5 April 2019 actuarial valuations for the Motors, Group, Cash+ and Normand sections of the Inchcape Motors Pension Scheme and 31 March 2018 valuation for the Inchcape Overseas Pension Scheme). From 1 January 2021 (following the closure of the Cash+ section to future benefit accrual on 31 December 2020) the Group pays ongoing employer pension contributions into the Inchcape Retirement Savings Plan (a defined contribution plan).
The defined benefit obligations are based on the current value of expected benefit payment cash flows to members over the next several decades. The average duration of the liabilities is approximately 17 years for the UK schemes.
INCHCAPE ANNUAL REPORT AND ACCOUNTS 2021 149
STRA
TEGIC
REPO
RTG
OV
ERN
AN
CE
FINA
NC
IAL STA
TEMEN
TS
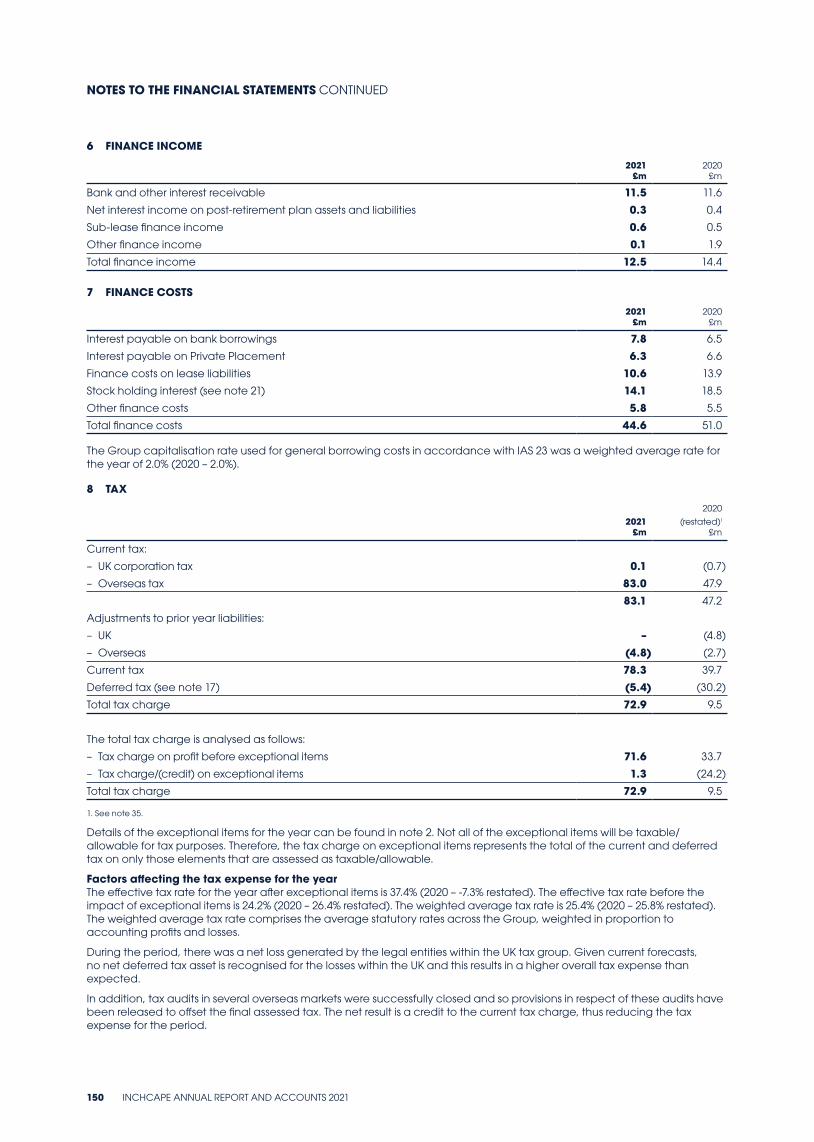
6 FINANCE INCOME
2021 £m
2020 £m
Bank and other interest receivable 11.5 11.6
Net interest income on post-retirement plan assets and liabilities 0.3 0.4
Sub-lease finance income 0.6 0.5
Other finance income 0.1 1.9
Total finance income 12.5 14.4
7 FINANCE COSTS
2021 £m
2020 £m
Interest payable on bank borrowings 7.8 6.5
Interest payable on Private Placement 6.3 6.6
Finance costs on lease liabilities 10.6 13.9
Stock holding interest (see note 21) 14.1 18.5
Other finance costs 5.8 5.5
Total finance costs 44.6 51.0
The Group capitalisation rate used for general borrowing costs in accordance with IAS 23 was a weighted average rate for the year of 2.0% (2020 – 2.0%).
8 TAX
2021 £m
2020
(restated)! £m
Current tax:
– UK corporation tax 0.1 (0.7)
– Overseas tax 83.0 47.9
83.1 47.2
Adjustments to prior year liabilities:
– UK – (4.8)
– Overseas (4.8) (2.7)
Current tax 78.3 39.7
Deferred tax (see note 17) (5.4) (30.2)
Total tax charge 72.9 9.5
The total tax charge is analysed as follows:
– Tax charge on profit before exceptional items 71.6 33.7
– Tax charge/(credit) on exceptional items 1.3 (24.2)
Total tax charge 72.9 9.5
1. See note 35.
Details of the exceptional items for the year can be found in note 2. Not all of the exceptional items will be taxable/allowable for tax purposes. Therefore, the tax charge on exceptional items represents the total of the current and deferred tax on only those elements that are assessed as taxable/allowable.
Factors affecting the tax expense for the yearThe effective tax rate for the year after exceptional items is 37.4% (2020 – -7.3% restated). The effective tax rate before the impact of exceptional items is 24.2% (2020 – 26.4% restated). The weighted average tax rate is 25.4% (2020 – 25.8% restated). The weighted average tax rate comprises the average statutory rates across the Group, weighted in proportion to accounting profits and losses.
During the period, there was a net loss generated by the legal entities within the UK tax group. Given current forecasts, no net deferred tax asset is recognised for the losses within the UK and this results in a higher overall tax expense than expected.
In addition, tax audits in several overseas markets were successfully closed and so provisions in respect of these audits have been released to offset the final assessed tax. The net result is a credit to the current tax charge, thus reducing the tax expense for the period.
NOTES TO THE FINANCIAL STATEMENTS CONTINUED
150 INCHCAPE ANNUAL REPORT AND ACCOUNTS 2021
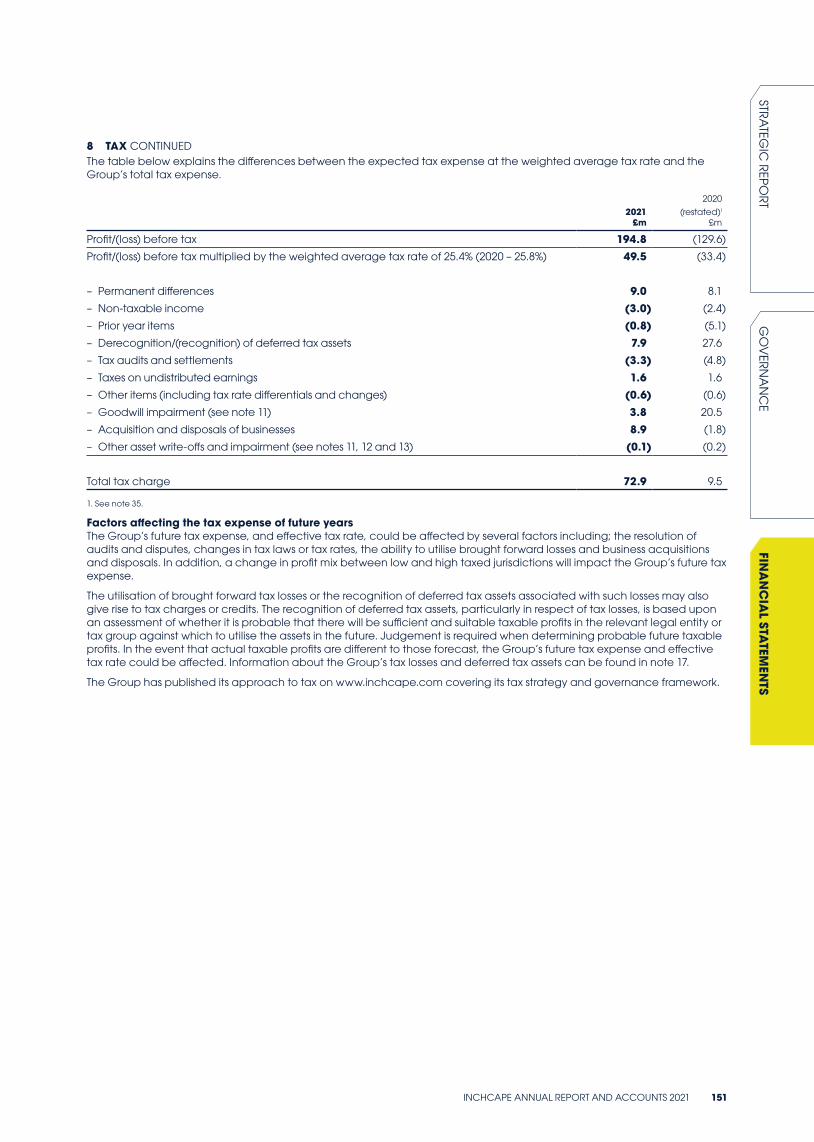
8 TAX CONTINUEDThe table below explains the differences between the expected tax expense at the weighted average tax rate and the Group’s total tax expense.
2021 £m
2020
(restated)! £m
Profit/(loss) before tax 194.8 (129.6)
Profit/(loss) before tax multiplied by the weighted average tax rate of 25.4% (2020 – 25.8%) 49.5 (33.4)
– Permanent differences 9.0 8.1
– Non-taxable income (3.0) (2.4)
– Prior year items (0.8) (5.1)
– Derecognition/(recognition) of deferred tax assets 7.9 27.6
– Tax audits and settlements (3.3) (4.8)
– Taxes on undistributed earnings 1.6 1.6
– Other items (including tax rate differentials and changes) (0.6) (0.6)
– Goodwill impairment (see note 11) 3.8 20.5
– Acquisition and disposals of businesses 8.9 (1.8)
– Other asset write-offs and impairment (see notes 11, 12 and 13) (0.1) (0.2)
Total tax charge 72.9 9.5
1. See note 35.
Factors affecting the tax expense of future yearsThe Group’s future tax expense, and effective tax rate, could be affected by several factors including; the resolution of audits and disputes, changes in tax laws or tax rates, the ability to utilise brought forward losses and business acquisitions and disposals. In addition, a change in profit mix between low and high taxed jurisdictions will impact the Group’s future tax expense.
The utilisation of brought forward tax losses or the recognition of deferred tax assets associated with such losses may also give rise to tax charges or credits. The recognition of deferred tax assets, particularly in respect of tax losses, is based upon an assessment of whether it is probable that there will be sufficient and suitable taxable profits in the relevant legal entity or tax group against which to utilise the assets in the future. Judgement is required when determining probable future taxable profits. In the event that actual taxable profits are different to those forecast, the Group’s future tax expense and effective tax rate could be affected. Information about the Group’s tax losses and deferred tax assets can be found in note 17.
The Group has published its approach to tax on www.inchcape.com covering its tax strategy and governance framework.
INCHCAPE ANNUAL REPORT AND ACCOUNTS 2021 151
STRA
TEGIC
REPO
RTG
OV
ERN
AN
CE
FINA
NC
IAL STA
TEMEN
TS
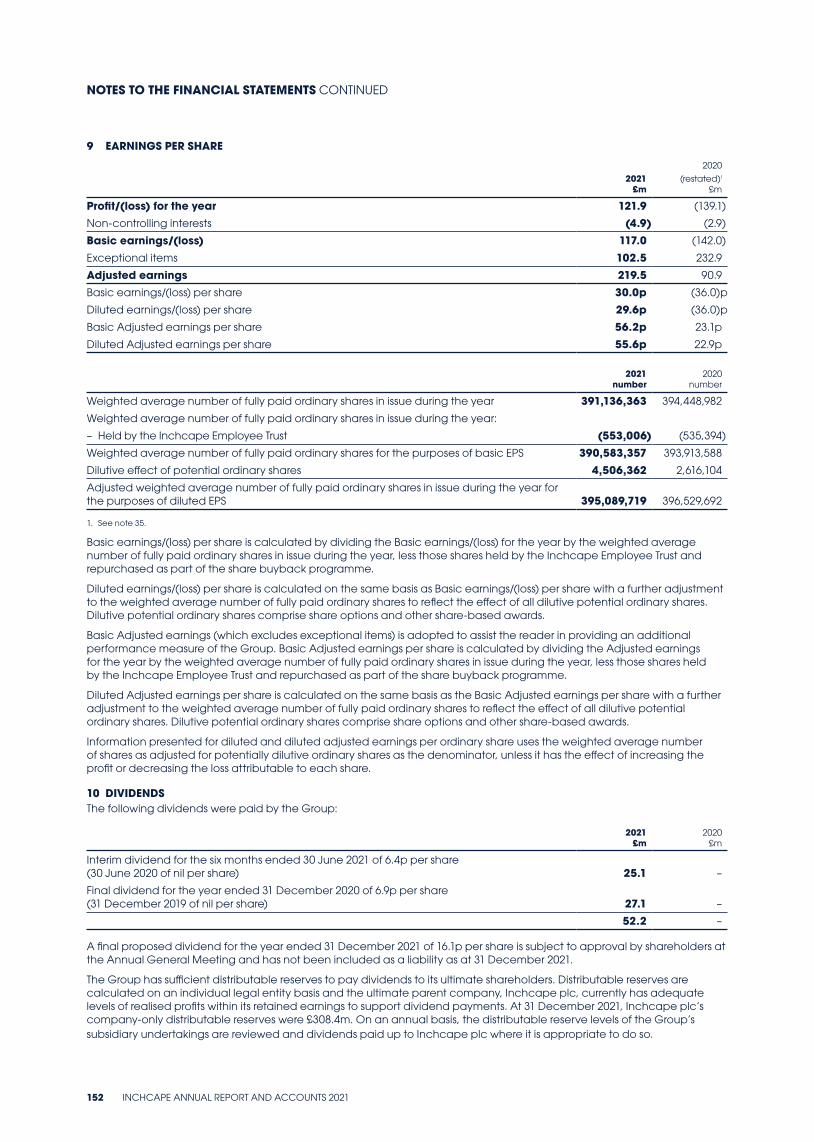
9 EARNINGS PER SHARE
2021 £m
2020
(restated)! £m
Profit/(loss) for the year 121.9 (139.1)
Non-controlling interests (4.9) (2.9)
Basic earnings/(loss) 117.0 (142.0)
Exceptional items 102.5 232.9
Adjusted earnings 219.5 90.9
Basic earnings/(loss) per share 30.0p (36.0)p
Diluted earnings/(loss) per share 29.6p (36.0)p
Basic Adjusted earnings per share 56.2p 23.1p
Diluted Adjusted earnings per share 55.6p 22.9p
2021 number
2020 number
Weighted average number of fully paid ordinary shares in issue during the year 391,136,363 394,448,982
Weighted average number of fully paid ordinary shares in issue during the year:
– Held by the Inchcape Employee Trust (553,006) (535,394)
Weighted average number of fully paid ordinary shares for the purposes of basic EPS 390,583,357 393,913,588
Dilutive effect of potential ordinary shares 4,506,362 2,616,104
Adjusted weighted average number of fully paid ordinary shares in issue during the year for the purposes of diluted EPS 395,089,719 396,529,692
1. See note 35.
Basic earnings/(loss) per share is calculated by dividing the Basic earnings/(loss) for the year by the weighted average number of fully paid ordinary shares in issue during the year, less those shares held by the Inchcape Employee Trust and repurchased as part of the share buyback programme.
Diluted earnings/(loss) per share is calculated on the same basis as Basic earnings/(loss) per share with a further adjustment to the weighted average number of fully paid ordinary shares to reflect the effect of all dilutive potential ordinary shares. Dilutive potential ordinary shares comprise share options and other share-based awards.
Basic Adjusted earnings (which excludes exceptional items) is adopted to assist the reader in providing an additional performance measure of the Group. Basic Adjusted earnings per share is calculated by dividing the Adjusted earnings for the year by the weighted average number of fully paid ordinary shares in issue during the year, less those shares held by the Inchcape Employee Trust and repurchased as part of the share buyback programme.
Diluted Adjusted earnings per share is calculated on the same basis as the Basic Adjusted earnings per share with a further adjustment to the weighted average number of fully paid ordinary shares to reflect the effect of all dilutive potential ordinary shares. Dilutive potential ordinary shares comprise share options and other share-based awards.
Information presented for diluted and diluted adjusted earnings per ordinary share uses the weighted average number of shares as adjusted for potentially dilutive ordinary shares as the denominator, unless it has the effect of increasing the profit or decreasing the loss attributable to each share.
10 DIVIDENDSThe following dividends were paid by the Group:
2021 £m
2020 £m
Interim dividend for the six months ended 30 June 2021 of 6.4p per share (30 June 2020 of nil per share) 25.1 –
Final dividend for the year ended 31 December 2020 of 6.9p per share (31 December 2019 of nil per share) 27.1 –
52.2 –
A final proposed dividend for the year ended 31 December 2021 of 16.1p per share is subject to approval by shareholders at the Annual General Meeting and has not been included as a liability as at 31 December 2021.
The Group has sufficient distributable reserves to pay dividends to its ultimate shareholders. Distributable reserves are calculated on an individual legal entity basis and the ultimate parent company, Inchcape plc, currently has adequate levels of realised profits within its retained earnings to support dividend payments. At 31 December 2021, Inchcape plc’s company-only distributable reserves were £308.4m. On an annual basis, the distributable reserve levels of the Group’s subsidiary undertakings are reviewed and dividends paid up to Inchcape plc where it is appropriate to do so.
NOTES TO THE FINANCIAL STATEMENTS CONTINUED
152 INCHCAPE ANNUAL REPORT AND ACCOUNTS 2021
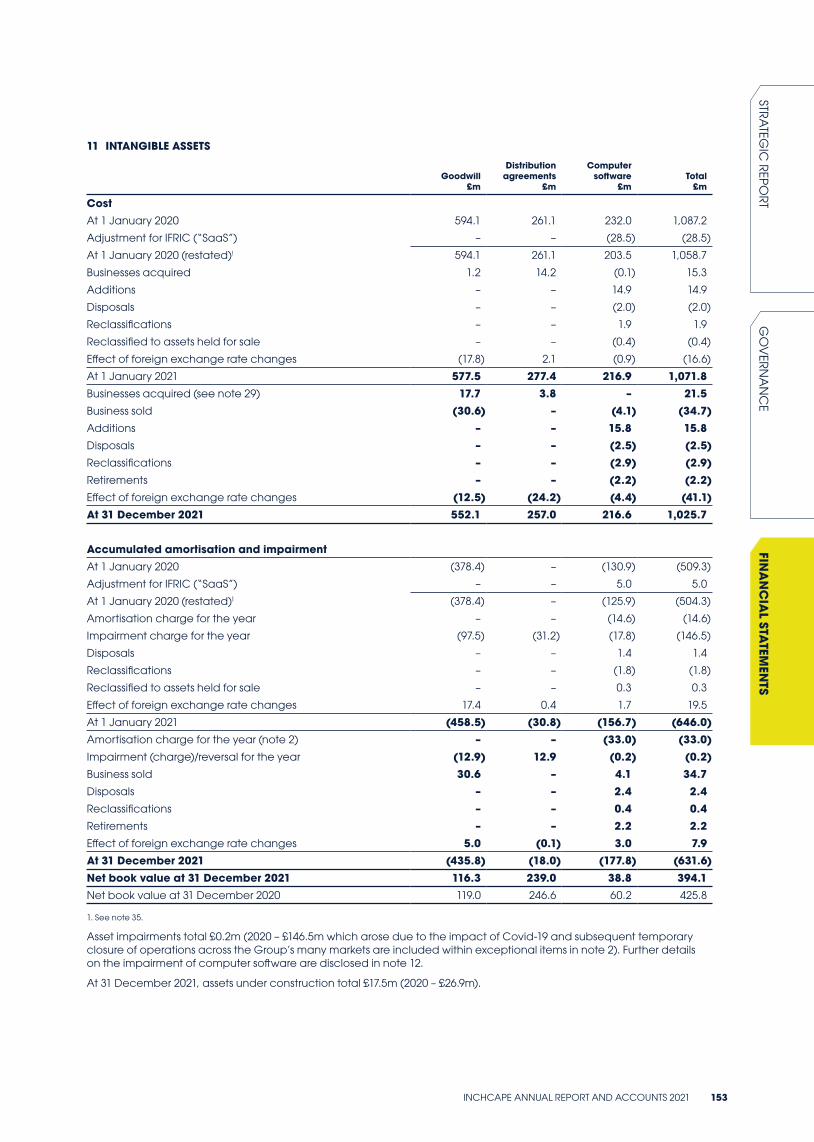
11 INTANGIBLE ASSETS
Goodwill £m
Distribution agreements
£m
Computer software
£m Total
£m
CostAt 1 January 2020 594.1 261.1 232.0 1,087.2
Adjustment for IFRIC (“SaaS”) – – (28.5) (28.5)
At 1 January 2020 (restated)! 594.1 261.1 203.5 1,058.7
Businesses acquired 1.2 14.2 (0.1) 15.3
Additions – – 14.9 14.9
Disposals – – (2.0) (2.0)
Reclassifications – – 1.9 1.9
Reclassified to assets held for sale – – (0.4) (0.4)
Effect of foreign exchange rate changes (17.8) 2.1 (0.9) (16.6)
At 1 January 2021 577.5 277.4 216.9 1,071.8Businesses acquired (see note 29) 17.7 3.8 – 21.5Business sold (30.6) – (4.1) (34.7)Additions – – 15.8 15.8Disposals – – (2.5) (2.5)Reclassifications – – (2.9) (2.9)Retirements – – (2.2) (2.2)Effect of foreign exchange rate changes (12.5) (24.2) (4.4) (41.1)At 31 December 2021 552.1 257.0 216.6 1,025.7
Accumulated amortisation and impairmentAt 1 January 2020 (378.4) – (130.9) (509.3)
Adjustment for IFRIC (“SaaS”) – – 5.0 5.0
At 1 January 2020 (restated)1 (378.4) – (125.9) (504.3)
Amortisation charge for the year – – (14.6) (14.6)
Impairment charge for the year (97.5) (31.2) (17.8) (146.5)
Disposals – – 1.4 1.4
Reclassifications – – (1.8) (1.8)
Reclassified to assets held for sale – – 0.3 0.3
Effect of foreign exchange rate changes 17.4 0.4 1.7 19.5
At 1 January 2021 (458.5) (30.8) (156.7) (646.0)Amortisation charge for the year (note 2) – – (33.0) (33.0)Impairment (charge)/reversal for the year (12.9) 12.9 (0.2) (0.2)Business sold 30.6 – 4.1 34.7Disposals – – 2.4 2.4Reclassifications – – 0.4 0.4Retirements – – 2.2 2.2Effect of foreign exchange rate changes 5.0 (0.1) 3.0 7.9At 31 December 2021 (435.8) (18.0) (177.8) (631.6)Net book value at 31 December 2021 116.3 239.0 38.8 394.1Net book value at 31 December 2020 119.0 246.6 60.2 425.8
1. See note 35.
Asset impairments total £0.2m (2020 – £146.5m which arose due to the impact of Covid-19 and subsequent temporary closure of operations across the Group’s many markets are included within exceptional items in note 2). Further details on the impairment of computer software are disclosed in note 12.
At 31 December 2021, assets under construction total £17.5m (2020 – £26.9m).
INCHCAPE ANNUAL REPORT AND ACCOUNTS 2021 153
STRA
TEGIC
REPO
RTG
OV
ERN
AN
CE
FINA
NC
IAL STA
TEMEN
TS
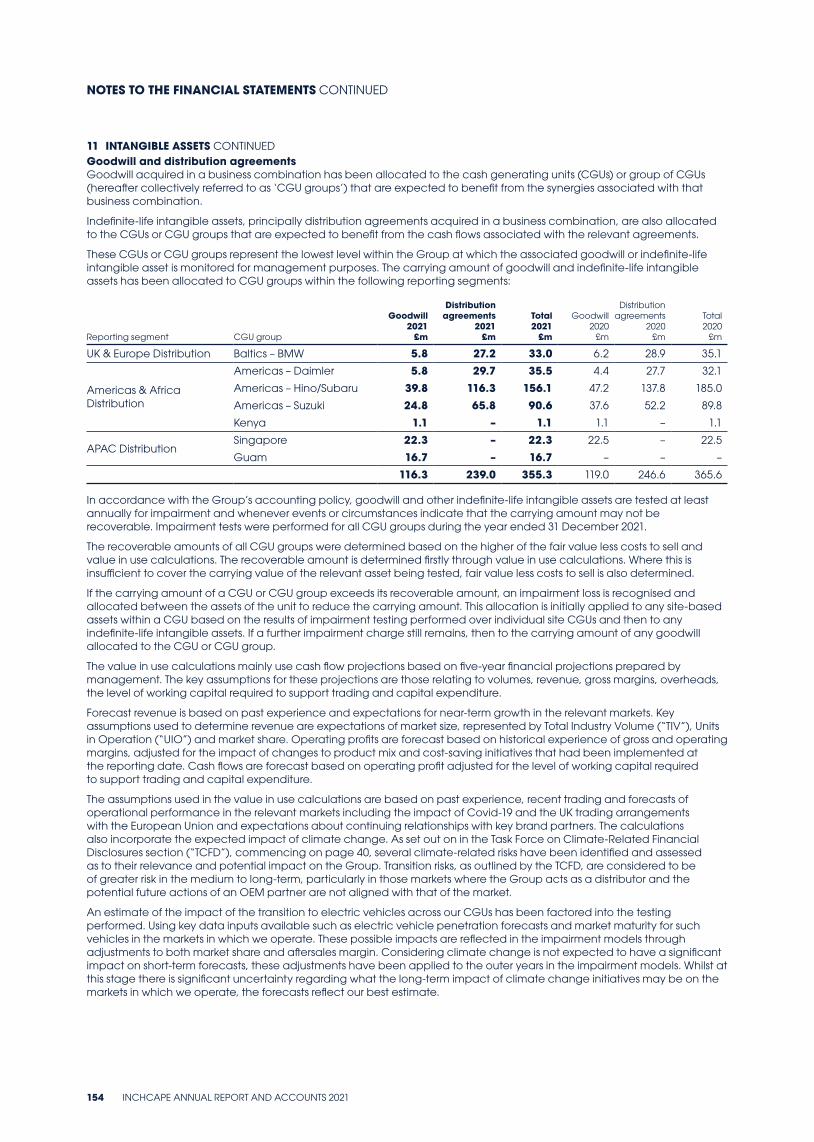
11 INTANGIBLE ASSETS CONTINUEDGoodwill and distribution agreements Goodwill acquired in a business combination has been allocated to the cash generating units (CGUs) or group of CGUs (hereafter collectively referred to as ‘CGU groups’) that are expected to benefit from the synergies associated with that business combination.
Indefinite-life intangible assets, principally distribution agreements acquired in a business combination, are also allocated to the CGUs or CGU groups that are expected to benefit from the cash flows associated with the relevant agreements.
These CGUs or CGU groups represent the lowest level within the Group at which the associated goodwill or indefinite-life intangible asset is monitored for management purposes. The carrying amount of goodwill and indefinite-life intangible assets has been allocated to CGU groups within the following reporting segments:
Reporting segment CGU group
Goodwill 2021
£m
Distribution agreements
2021 £m
Total 2021
£m
Goodwill 2020
£m
Distribution agreements
2020 £m
Total 2020
£m
UK & Europe Distribution Baltics – BMW 5.8 27.2 33.0 6.2 28.9 35.1
Americas & Africa Distribution
Americas – Daimler 5.8 29.7 35.5 4.4 27.7 32.1
Americas – Hino/Subaru 39.8 116.3 156.1 47.2 137.8 185.0
Americas – Suzuki 24.8 65.8 90.6 37.6 52.2 89.8
Kenya 1.1 – 1.1 1.1 – 1.1
APAC DistributionSingapore 22.3 – 22.3 22.5 – 22.5
Guam 16.7 – 16.7 – – –
116.3 239.0 355.3 119.0 246.6 365.6
In accordance with the Group’s accounting policy, goodwill and other indefinite-life intangible assets are tested at least annually for impairment and whenever events or circumstances indicate that the carrying amount may not be recoverable. Impairment tests were performed for all CGU groups during the year ended 31 December 2021.
The recoverable amounts of all CGU groups were determined based on the higher of the fair value less costs to sell and value in use calculations. The recoverable amount is determined firstly through value in use calculations. Where this is insufficient to cover the carrying value of the relevant asset being tested, fair value less costs to sell is also determined.
If the carrying amount of a CGU or CGU group exceeds its recoverable amount, an impairment loss is recognised and allocated between the assets of the unit to reduce the carrying amount. This allocation is initially applied to any site-based assets within a CGU based on the results of impairment testing performed over individual site CGUs and then to any indefinite-life intangible assets. If a further impairment charge still remains, then to the carrying amount of any goodwill allocated to the CGU or CGU group.
The value in use calculations mainly use cash flow projections based on five-year financial projections prepared by management. The key assumptions for these projections are those relating to volumes, revenue, gross margins, overheads, the level of working capital required to support trading and capital expenditure.
Forecast revenue is based on past experience and expectations for near-term growth in the relevant markets. Key assumptions used to determine revenue are expectations of market size, represented by Total Industry Volume (“TIV”), Units in Operation (“UIO”) and market share. Operating profits are forecast based on historical experience of gross and operating margins, adjusted for the impact of changes to product mix and cost-saving initiatives that had been implemented at the reporting date. Cash flows are forecast based on operating profit adjusted for the level of working capital required to support trading and capital expenditure.
The assumptions used in the value in use calculations are based on past experience, recent trading and forecasts of operational performance in the relevant markets including the impact of Covid-19 and the UK trading arrangements with the European Union and expectations about continuing relationships with key brand partners. The calculations also incorporate the expected impact of climate change. As set out on in the Task Force on Climate-Related Financial Disclosures section (“TCFD”), commencing on page 40, several climate-related risks have been identified and assessed as to their relevance and potential impact on the Group. Transition risks, as outlined by the TCFD, are considered to be of greater risk in the medium to long-term, particularly in those markets where the Group acts as a distributor and the potential future actions of an OEM partner are not aligned with that of the market.
An estimate of the impact of the transition to electric vehicles across our CGUs has been factored into the testing performed. Using key data inputs available such as electric vehicle penetration forecasts and market maturity for such vehicles in the markets in which we operate. These possible impacts are reflected in the impairment models through adjustments to both market share and aftersales margin. Considering climate change is not expected to have a significant impact on short-term forecasts, these adjustments have been applied to the outer years in the impairment models. Whilst at this stage there is significant uncertainty regarding what the long-term impact of climate change initiatives may be on the markets in which we operate, the forecasts reflect our best estimate.
NOTES TO THE FINANCIAL STATEMENTS CONTINUED
154 INCHCAPE ANNUAL REPORT AND ACCOUNTS 2021
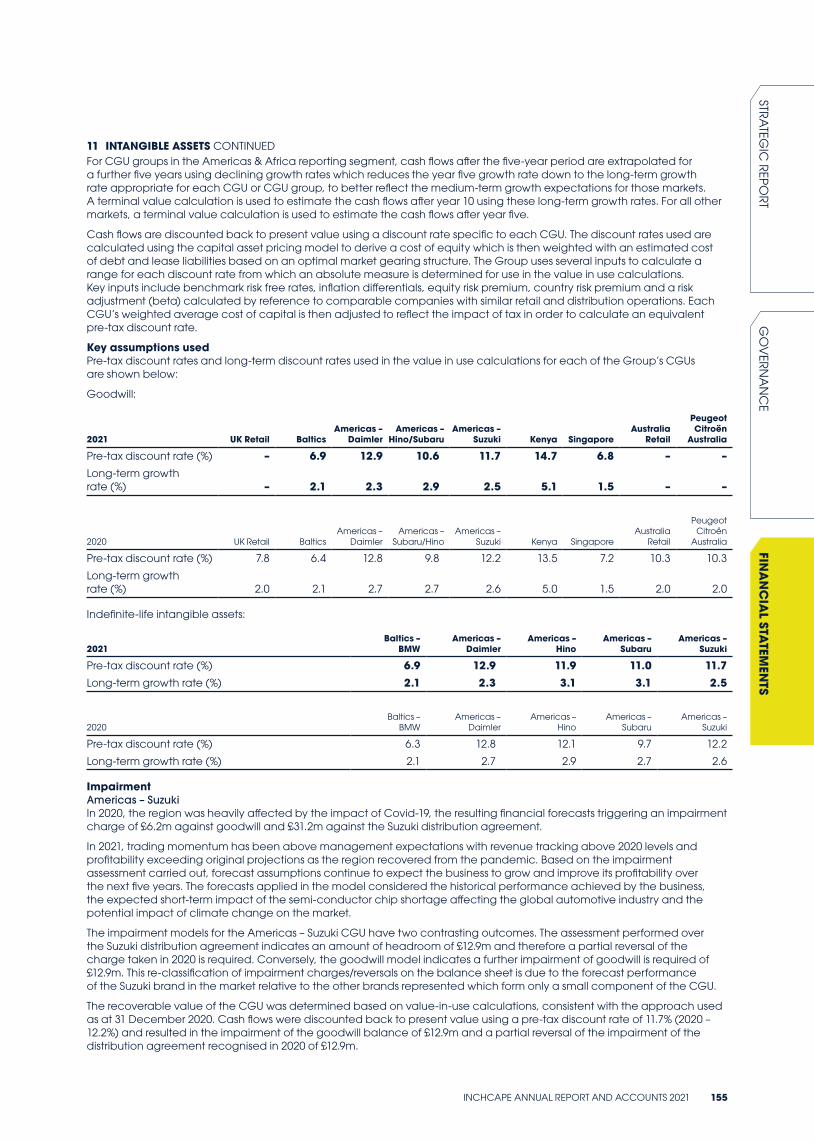
11 INTANGIBLE ASSETS CONTINUEDFor CGU groups in the Americas & Africa reporting segment, cash flows after the five-year period are extrapolated for a further five years using declining growth rates which reduces the year five growth rate down to the long-term growth rate appropriate for each CGU or CGU group, to better reflect the medium-term growth expectations for those markets. A terminal value calculation is used to estimate the cash flows after year 10 using these long-term growth rates. For all other markets, a terminal value calculation is used to estimate the cash flows after year five.
Cash flows are discounted back to present value using a discount rate specific to each CGU. The discount rates used are calculated using the capital asset pricing model to derive a cost of equity which is then weighted with an estimated cost of debt and lease liabilities based on an optimal market gearing structure. The Group uses several inputs to calculate a range for each discount rate from which an absolute measure is determined for use in the value in use calculations. Key inputs include benchmark risk free rates, inflation differentials, equity risk premium, country risk premium and a risk adjustment (beta) calculated by reference to comparable companies with similar retail and distribution operations. Each CGU’s weighted average cost of capital is then adjusted to reflect the impact of tax in order to calculate an equivalent pre-tax discount rate.
Key assumptions usedPre-tax discount rates and long-term discount rates used in the value in use calculations for each of the Group’s CGUs are shown below:
Goodwill:
2021 UK Retail BalticsAmericas –
DaimlerAmericas –
Hino/SubaruAmericas –
Suzuki Kenya SingaporeAustralia
Retail
Peugeot Citroën
Australia
Pre-tax discount rate (%) – 6.9 12.9 10.6 11.7 14.7 6.8 – –Long-term growth rate (%) – 2.1 2.3 2.9 2.5 5.1 1.5 – –
2020 UK Retail BalticsAmericas –
DaimlerAmericas –
Subaru/HinoAmericas –
Suzuki Kenya SingaporeAustralia
Retail
Peugeot Citroën
Australia
Pre-tax discount rate (%) 7.8 6.4 12.8 9.8 12.2 13.5 7.2 10.3 10.3
Long-term growth rate (%) 2.0 2.1 2.7 2.7 2.6 5.0 1.5 2.0 2.0
Indefinite-life intangible assets:
2021Baltics –
BMWAmericas –
DaimlerAmericas –
HinoAmericas –
SubaruAmericas –
Suzuki
Pre-tax discount rate (%) 6.9 12.9 11.9 11.0 11.7Long-term growth rate (%) 2.1 2.3 3.1 3.1 2.5
2020Baltics –
BMWAmericas –
DaimlerAmericas –
HinoAmericas –
SubaruAmericas –
Suzuki
Pre-tax discount rate (%) 6.3 12.8 12.1 9.7 12.2
Long-term growth rate (%) 2.1 2.7 2.9 2.7 2.6
ImpairmentAmericas – SuzukiIn 2020, the region was heavily affected by the impact of Covid-19, the resulting financial forecasts triggering an impairment charge of £6.2m against goodwill and £31.2m against the Suzuki distribution agreement.
In 2021, trading momentum has been above management expectations with revenue tracking above 2020 levels and profitability exceeding original projections as the region recovered from the pandemic. Based on the impairment assessment carried out, forecast assumptions continue to expect the business to grow and improve its profitability over the next five years. The forecasts applied in the model considered the historical performance achieved by the business, the expected short-term impact of the semi-conductor chip shortage affecting the global automotive industry and the potential impact of climate change on the market.
The impairment models for the Americas – Suzuki CGU have two contrasting outcomes. The assessment performed over the Suzuki distribution agreement indicates an amount of headroom of £12.9m and therefore a partial reversal of the charge taken in 2020 is required. Conversely, the goodwill model indicates a further impairment of goodwill is required of £12.9m. This re-classification of impairment charges/reversals on the balance sheet is due to the forecast performance of the Suzuki brand in the market relative to the other brands represented which form only a small component of the CGU.
The recoverable value of the CGU was determined based on value-in-use calculations, consistent with the approach used as at 31 December 2020. Cash flows were discounted back to present value using a pre-tax discount rate of 11.7% (2020 – 12.2%) and resulted in the impairment of the goodwill balance of £12.9m and a partial reversal of the impairment of the distribution agreement recognised in 2020 of £12.9m.
INCHCAPE ANNUAL REPORT AND ACCOUNTS 2021 155
STRA
TEGIC
REPO
RTG
OV
ERN
AN
CE
FINA
NC
IAL STA
TEMEN
TS
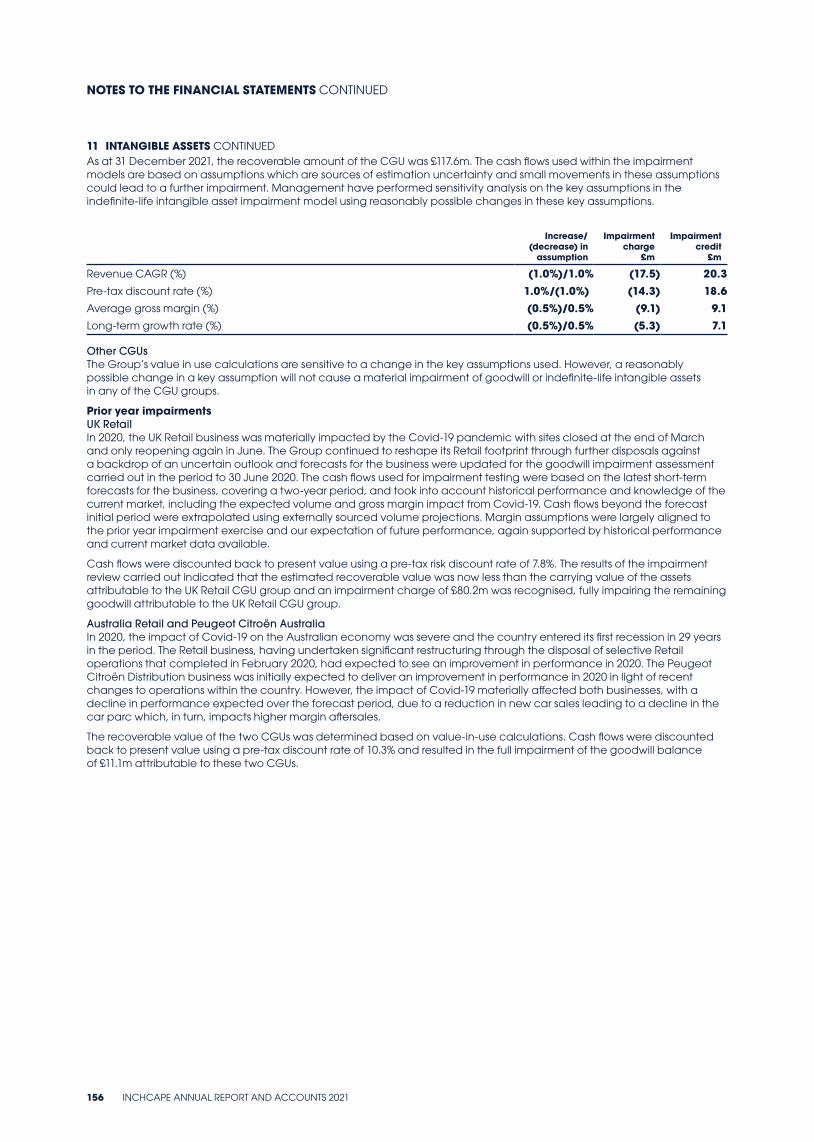
11 INTANGIBLE ASSETS CONTINUEDAs at 31 December 2021, the recoverable amount of the CGU was £117.6m. The cash flows used within the impairment models are based on assumptions which are sources of estimation uncertainty and small movements in these assumptions could lead to a further impairment. Management have performed sensitivity analysis on the key assumptions in the indefinite-life intangible asset impairment model using reasonably possible changes in these key assumptions.
Increase/(decrease) in
assumption
Impairment charge
£m
Impairment credit
£m
Revenue CAGR (%) (1.0%)/1.0% (17.5) 20.3Pre-tax discount rate (%) 1.0%/(1.0%) (14.3) 18.6Average gross margin (%) (0.5%)/0.5% (9.1) 9.1Long-term growth rate (%) (0.5%)/0.5% (5.3) 7.1
Other CGUsThe Group’s value in use calculations are sensitive to a change in the key assumptions used. However, a reasonably possible change in a key assumption will not cause a material impairment of goodwill or indefinite-life intangible assets in any of the CGU groups.
Prior year impairmentsUK Retail In 2020, the UK Retail business was materially impacted by the Covid-19 pandemic with sites closed at the end of March and only reopening again in June. The Group continued to reshape its Retail footprint through further disposals against a backdrop of an uncertain outlook and forecasts for the business were updated for the goodwill impairment assessment carried out in the period to 30 June 2020. The cash flows used for impairment testing were based on the latest short-term forecasts for the business, covering a two-year period, and took into account historical performance and knowledge of the current market, including the expected volume and gross margin impact from Covid-19. Cash flows beyond the forecast initial period were extrapolated using externally sourced volume projections. Margin assumptions were largely aligned to the prior year impairment exercise and our expectation of future performance, again supported by historical performance and current market data available.
Cash flows were discounted back to present value using a pre-tax risk discount rate of 7.8%. The results of the impairment review carried out indicated that the estimated recoverable value was now less than the carrying value of the assets attributable to the UK Retail CGU group and an impairment charge of £80.2m was recognised, fully impairing the remaining goodwill attributable to the UK Retail CGU group.
Australia Retail and Peugeot Citroën AustraliaIn 2020, the impact of Covid-19 on the Australian economy was severe and the country entered its first recession in 29 years in the period. The Retail business, having undertaken significant restructuring through the disposal of selective Retail operations that completed in February 2020, had expected to see an improvement in performance in 2020. The Peugeot Citroën Distribution business was initially expected to deliver an improvement in performance in 2020 in light of recent changes to operations within the country. However, the impact of Covid-19 materially affected both businesses, with a decline in performance expected over the forecast period, due to a reduction in new car sales leading to a decline in the car parc which, in turn, impacts higher margin aftersales.
The recoverable value of the two CGUs was determined based on value-in-use calculations. Cash flows were discounted back to present value using a pre-tax discount rate of 10.3% and resulted in the full impairment of the goodwill balance of £11.1m attributable to these two CGUs.
NOTES TO THE FINANCIAL STATEMENTS CONTINUED
156 INCHCAPE ANNUAL REPORT AND ACCOUNTS 2021
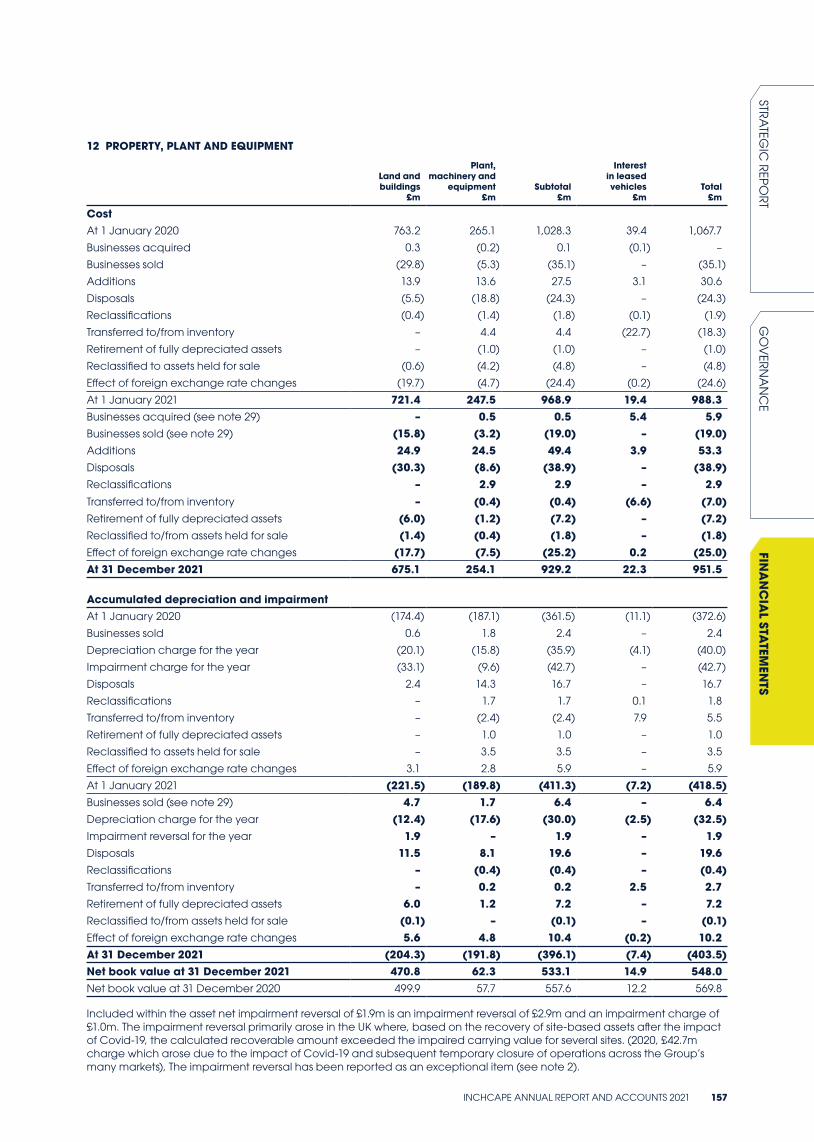
12 PROPERTY, PLANT AND EQUIPMENT
Land and buildings
£m
Plant, machinery and
equipment £m
Subtotal £m
Interest in leased vehicles
£mTotal
£m
CostAt 1 January 2020 763.2 265.1 1,028.3 39.4 1,067.7
Businesses acquired 0.3 (0.2) 0.1 (0.1) –
Businesses sold (29.8) (5.3) (35.1) – (35.1)
Additions 13.9 13.6 27.5 3.1 30.6
Disposals (5.5) (18.8) (24.3) – (24.3)
Reclassifications (0.4) (1.4) (1.8) (0.1) (1.9)
Transferred to/from inventory – 4.4 4.4 (22.7) (18.3)
Retirement of fully depreciated assets – (1.0) (1.0) – (1.0)
Reclassified to assets held for sale (0.6) (4.2) (4.8) – (4.8)
Effect of foreign exchange rate changes (19.7) (4.7) (24.4) (0.2) (24.6)
At 1 January 2021 721.4 247.5 968.9 19.4 988.3Businesses acquired (see note 29) – 0.5 0.5 5.4 5.9Businesses sold (see note 29) (15.8) (3.2) (19.0) – (19.0)Additions 24.9 24.5 49.4 3.9 53.3Disposals (30.3) (8.6) (38.9) – (38.9)Reclassifications – 2.9 2.9 – 2.9Transferred to/from inventory – (0.4) (0.4) (6.6) (7.0)Retirement of fully depreciated assets (6.0) (1.2) (7.2) – (7.2)Reclassified to/from assets held for sale (1.4) (0.4) (1.8) – (1.8)Effect of foreign exchange rate changes (17.7) (7.5) (25.2) 0.2 (25.0)At 31 December 2021 675.1 254.1 929.2 22.3 951.5
Accumulated depreciation and impairmentAt 1 January 2020 (174.4) (187.1) (361.5) (11.1) (372.6)
Businesses sold 0.6 1.8 2.4 – 2.4
Depreciation charge for the year (20.1) (15.8) (35.9) (4.1) (40.0)
Impairment charge for the year (33.1) (9.6) (42.7) – (42.7)
Disposals 2.4 14.3 16.7 – 16.7
Reclassifications – 1.7 1.7 0.1 1.8
Transferred to/from inventory – (2.4) (2.4) 7.9 5.5
Retirement of fully depreciated assets – 1.0 1.0 – 1.0
Reclassified to assets held for sale – 3.5 3.5 – 3.5
Effect of foreign exchange rate changes 3.1 2.8 5.9 – 5.9
At 1 January 2021 (221.5) (189.8) (411.3) (7.2) (418.5)Businesses sold (see note 29) 4.7 1.7 6.4 – 6.4Depreciation charge for the year (12.4) (17.6) (30.0) (2.5) (32.5)Impairment reversal for the year 1.9 – 1.9 – 1.9Disposals 11.5 8.1 19.6 – 19.6Reclassifications – (0.4) (0.4) – (0.4)Transferred to/from inventory – 0.2 0.2 2.5 2.7Retirement of fully depreciated assets 6.0 1.2 7.2 – 7.2Reclassified to/from assets held for sale (0.1) – (0.1) – (0.1)Effect of foreign exchange rate changes 5.6 4.8 10.4 (0.2) 10.2At 31 December 2021 (204.3) (191.8) (396.1) (7.4) (403.5)Net book value at 31 December 2021 470.8 62.3 533.1 14.9 548.0Net book value at 31 December 2020 499.9 57.7 557.6 12.2 569.8
Included within the asset net impairment reversal of £1.9m is an impairment reversal of £2.9m and an impairment charge of £1.0m. The impairment reversal primarily arose in the UK where, based on the recovery of site-based assets after the impact of Covid-19, the calculated recoverable amount exceeded the impaired carrying value for several sites. (2020, £42.7m charge which arose due to the impact of Covid-19 and subsequent temporary closure of operations across the Group’s many markets), The impairment reversal has been reported as an exceptional item (see note 2).
INCHCAPE ANNUAL REPORT AND ACCOUNTS 2021 157
STRA
TEGIC
REPO
RTG
OV
ERN
AN
CE
FINA
NC
IAL STA
TEMEN
TS
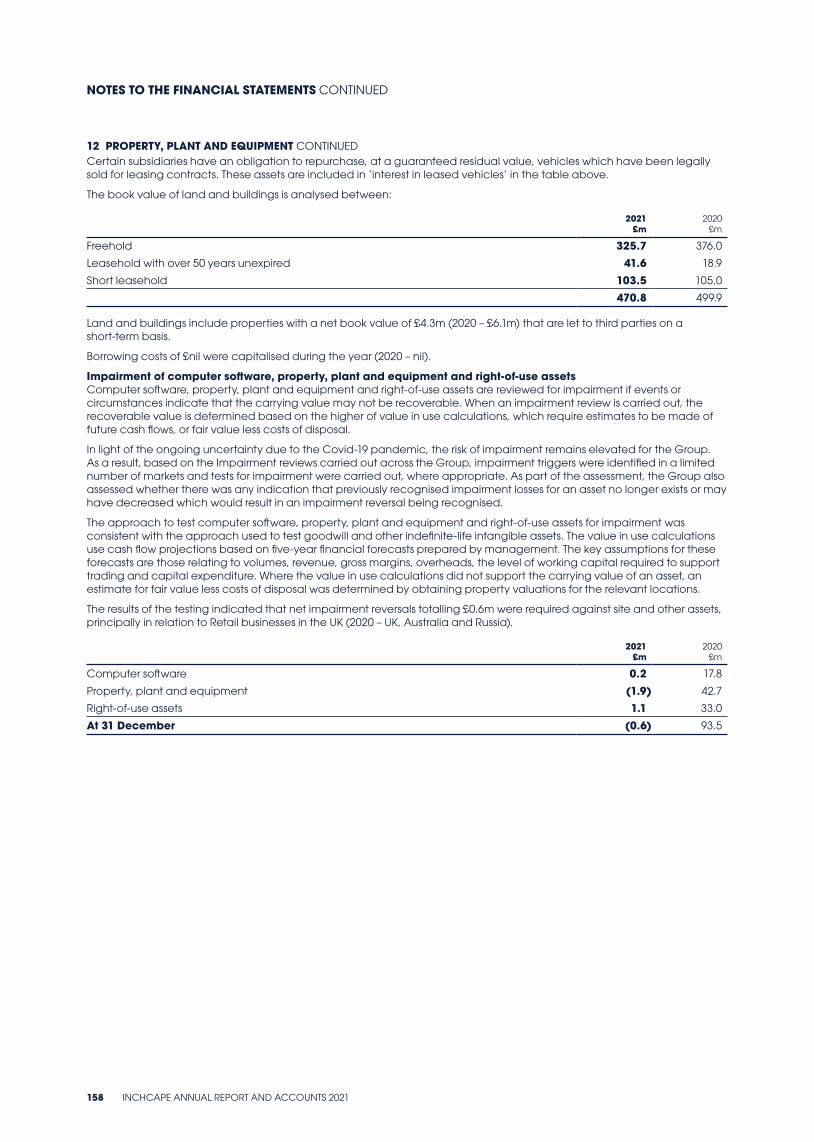
12 PROPERTY, PLANT AND EQUIPMENT CONTINUEDCertain subsidiaries have an obligation to repurchase, at a guaranteed residual value, vehicles which have been legally sold for leasing contracts. These assets are included in ‘interest in leased vehicles’ in the table above.
The book value of land and buildings is analysed between:
2021 £m
2020 £m
Freehold 325.7 376.0
Leasehold with over 50 years unexpired 41.6 18.9
Short leasehold 103.5 105.0
470.8 499.9
Land and buildings include properties with a net book value of £4.3m (2020 – £6.1m) that are let to third parties on a short-term basis.
Borrowing costs of £nil were capitalised during the year (2020 – nil).
Impairment of computer software, property, plant and equipment and right-of-use assets Computer software, property, plant and equipment and right-of-use assets are reviewed for impairment if events or circumstances indicate that the carrying value may not be recoverable. When an impairment review is carried out, the recoverable value is determined based on the higher of value in use calculations, which require estimates to be made of future cash flows, or fair value less costs of disposal.
In light of the ongoing uncertainty due to the Covid-19 pandemic, the risk of impairment remains elevated for the Group. As a result, based on the Impairment reviews carried out across the Group, impairment triggers were identified in a limited number of markets and tests for impairment were carried out, where appropriate. As part of the assessment, the Group also assessed whether there was any indication that previously recognised impairment losses for an asset no longer exists or may have decreased which would result in an impairment reversal being recognised.
The approach to test computer software, property, plant and equipment and right-of-use assets for impairment was consistent with the approach used to test goodwill and other indefinite-life intangible assets. The value in use calculations use cash flow projections based on five-year financial forecasts prepared by management. The key assumptions for these forecasts are those relating to volumes, revenue, gross margins, overheads, the level of working capital required to support trading and capital expenditure. Where the value in use calculations did not support the carrying value of an asset, an estimate for fair value less costs of disposal was determined by obtaining property valuations for the relevant locations.
The results of the testing indicated that net impairment reversals totalling £0.6m were required against site and other assets, principally in relation to Retail businesses in the UK (2020 – UK, Australia and Russia).
2021 £m
2020 £m
Computer software 0.2 17.8
Property, plant and equipment (1.9) 42.7
Right-of-use assets 1.1 33.0
At 31 December (0.6) 93.5
NOTES TO THE FINANCIAL STATEMENTS CONTINUED
158 INCHCAPE ANNUAL REPORT AND ACCOUNTS 2021
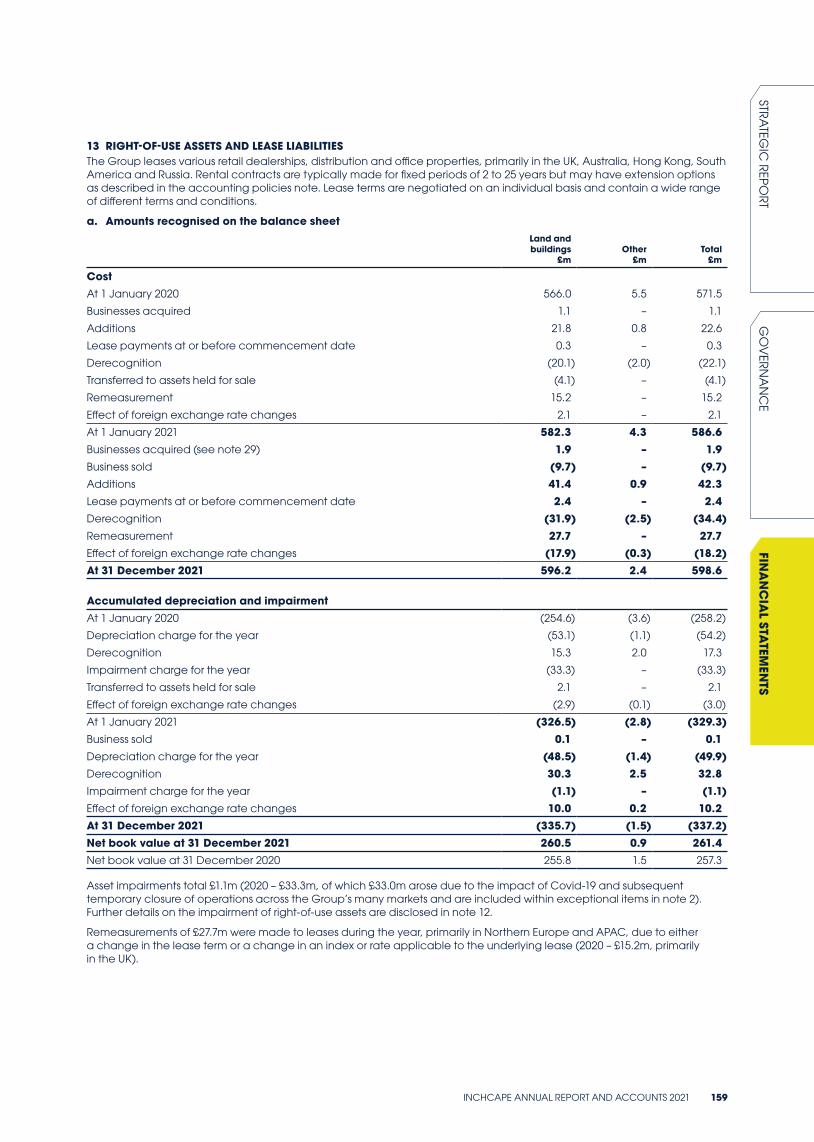
13 RIGHT-OF-USE ASSETS AND LEASE LIABILITIESThe Group leases various retail dealerships, distribution and office properties, primarily in the UK, Australia, Hong Kong, South America and Russia. Rental contracts are typically made for fixed periods of 2 to 25 years but may have extension options as described in the accounting policies note. Lease terms are negotiated on an individual basis and contain a wide range of different terms and conditions.
a. Amounts recognised on the balance sheetLand and buildings
£mOther
£mTotal
£m
CostAt 1 January 2020 566.0 5.5 571.5
Businesses acquired 1.1 – 1.1
Additions 21.8 0.8 22.6
Lease payments at or before commencement date 0.3 – 0.3
Derecognition (20.1) (2.0) (22.1)
Transferred to assets held for sale (4.1) – (4.1)
Remeasurement 15.2 – 15.2
Effect of foreign exchange rate changes 2.1 – 2.1
At 1 January 2021 582.3 4.3 586.6Businesses acquired (see note 29) 1.9 – 1.9Business sold (9.7) – (9.7)Additions 41.4 0.9 42.3Lease payments at or before commencement date 2.4 – 2.4Derecognition (31.9) (2.5) (34.4)Remeasurement 27.7 – 27.7Effect of foreign exchange rate changes (17.9) (0.3) (18.2)At 31 December 2021 596.2 2.4 598.6
Accumulated depreciation and impairmentAt 1 January 2020 (254.6) (3.6) (258.2)
Depreciation charge for the year (53.1) (1.1) (54.2)
Derecognition 15.3 2.0 17.3
Impairment charge for the year (33.3) – (33.3)
Transferred to assets held for sale 2.1 – 2.1
Effect of foreign exchange rate changes (2.9) (0.1) (3.0)
At 1 January 2021 (326.5) (2.8) (329.3)Business sold 0.1 – 0.1Depreciation charge for the year (48.5) (1.4) (49.9)Derecognition 30.3 2.5 32.8Impairment charge for the year (1.1) – (1.1)Effect of foreign exchange rate changes 10.0 0.2 10.2At 31 December 2021 (335.7) (1.5) (337.2)Net book value at 31 December 2021 260.5 0.9 261.4Net book value at 31 December 2020 255.8 1.5 257.3
Asset impairments total £1.1m (2020 – £33.3m, of which £33.0m arose due to the impact of Covid-19 and subsequent temporary closure of operations across the Group’s many markets and are included within exceptional items in note 2). Further details on the impairment of right-of-use assets are disclosed in note 12.
Remeasurements of £27.7m were made to leases during the year, primarily in Northern Europe and APAC, due to either a change in the lease term or a change in an index or rate applicable to the underlying lease (2020 – £15.2m, primarily in the UK).
INCHCAPE ANNUAL REPORT AND ACCOUNTS 2021 159
STRA
TEGIC
REPO
RTG
OV
ERN
AN
CE
FINA
NC
IAL STA
TEMEN
TS
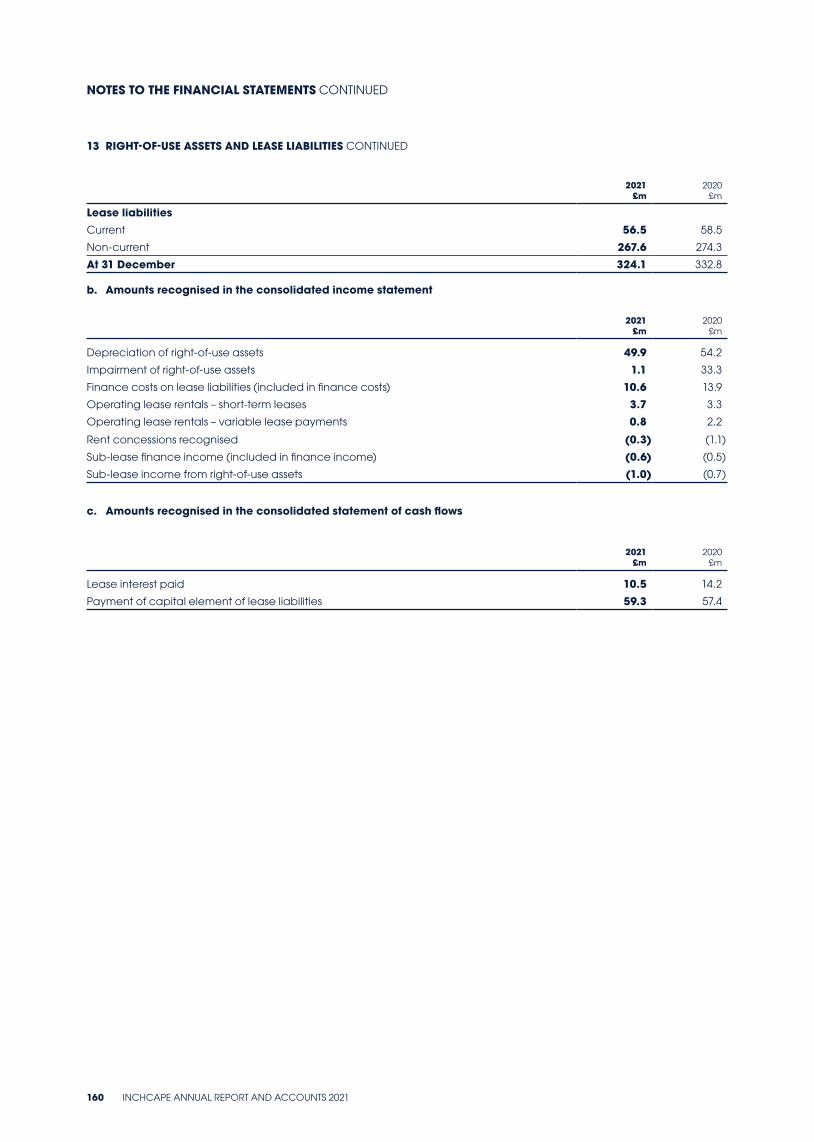
13 RIGHT-OF-USE ASSETS AND LEASE LIABILITIES CONTINUED
2021 £m
2020 £m
Lease liabilitiesCurrent 56.5 58.5
Non-current 267.6 274.3
At 31 December 324.1 332.8
b. Amounts recognised in the consolidated income statement
2021 £m
2020 £m
Depreciation of right-of-use assets 49.9 54.2
Impairment of right-of-use assets 1.1 33.3
Finance costs on lease liabilities (included in finance costs) 10.6 13.9
Operating lease rentals – short-term leases 3.7 3.3
Operating lease rentals – variable lease payments 0.8 2.2
Rent concessions recognised (0.3) (1.1)
Sub-lease finance income (included in finance income) (0.6) (0.5)
Sub-lease income from right-of-use assets (1.0) (0.7)
c. Amounts recognised in the consolidated statement of cash flows
2021 £m
2020 £m
Lease interest paid 10.5 14.2
Payment of capital element of lease liabilities 59.3 57.4
NOTES TO THE FINANCIAL STATEMENTS CONTINUED
160 INCHCAPE ANNUAL REPORT AND ACCOUNTS 2021
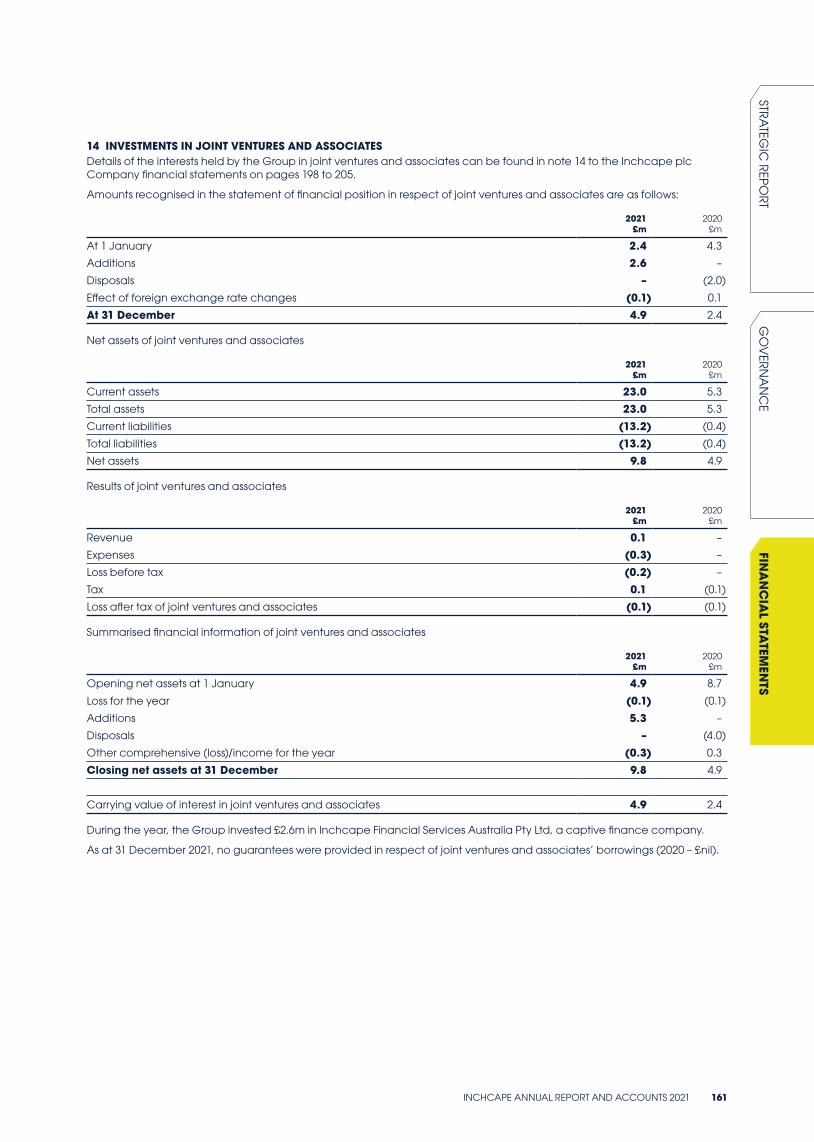
14 INVESTMENTS IN JOINT VENTURES AND ASSOCIATESDetails of the interests held by the Group in joint ventures and associates can be found in note 14 to the Inchcape plc Company financial statements on pages 198 to 205.
Amounts recognised in the statement of financial position in respect of joint ventures and associates are as follows:
2021 £m
2020 £m
At 1 January 2.4 4.3
Additions 2.6 –
Disposals – (2.0)
Effect of foreign exchange rate changes (0.1) 0.1
At 31 December 4.9 2.4
Net assets of joint ventures and associates
2021 £m
2020 £m
Current assets 23.0 5.3
Total assets 23.0 5.3
Current liabilities (13.2) (0.4)
Total liabilities (13.2) (0.4)
Net assets 9.8 4.9
Results of joint ventures and associates
2021 £m
2020 £m
Revenue 0.1 –
Expenses (0.3) –
Loss before tax (0.2) –
Tax 0.1 (0.1)
Loss after tax of joint ventures and associates (0.1) (0.1)
Summarised financial information of joint ventures and associates
2021 £m
2020 £m
Opening net assets at 1 January 4.9 8.7
Loss for the year (0.1) (0.1)
Additions 5.3 –
Disposals – (4.0)
Other comprehensive (loss)/income for the year (0.3) 0.3
Closing net assets at 31 December 9.8 4.9
Carrying value of interest in joint ventures and associates 4.9 2.4
During the year, the Group invested £2.6m in Inchcape Financial Services Australia Pty Ltd, a captive finance company.
As at 31 December 2021, no guarantees were provided in respect of joint ventures and associates’ borrowings (2020 – £nil).
INCHCAPE ANNUAL REPORT AND ACCOUNTS 2021 161
STRA
TEGIC
REPO
RTG
OV
ERN
AN
CE
FINA
NC
IAL STA
TEMEN
TS
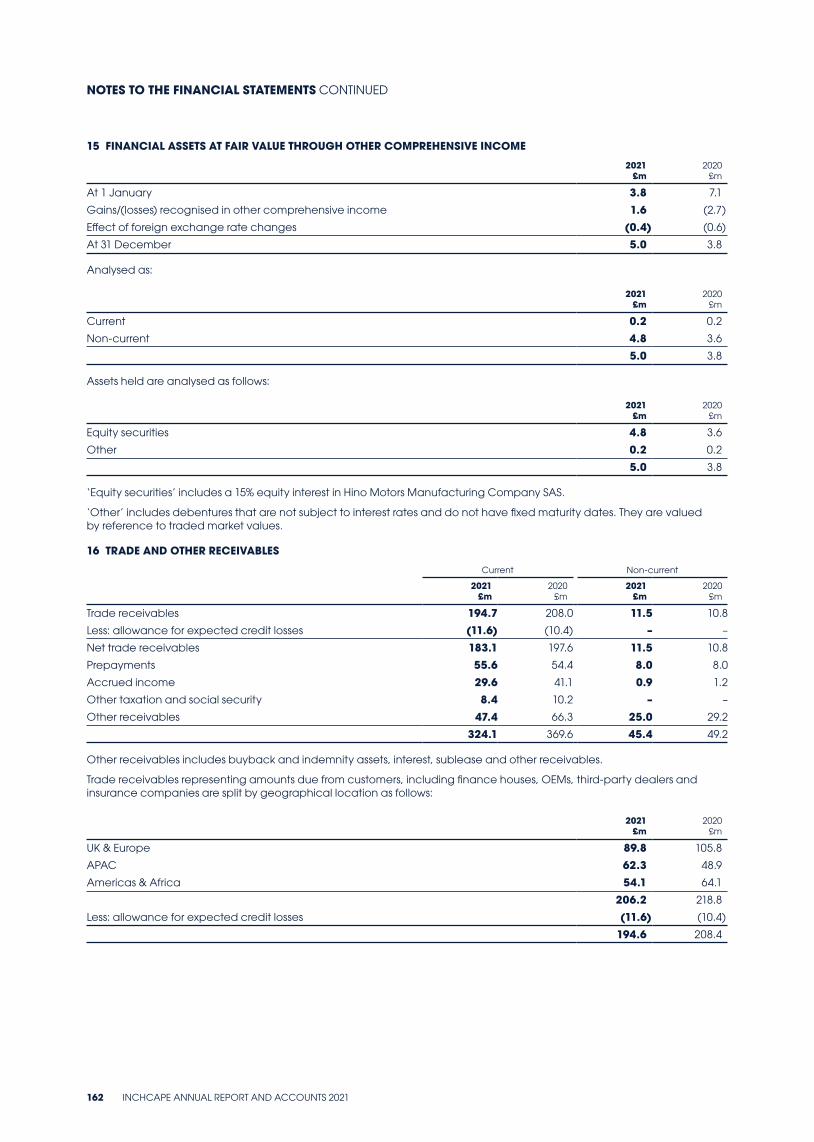
15 FINANCIAL ASSETS AT FAIR VALUE THROUGH OTHER COMPREHENSIVE INCOME
2021 £m
2020 £m
At 1 January 3.8 7.1
Gains/(losses) recognised in other comprehensive income 1.6 (2.7)
Effect of foreign exchange rate changes (0.4) (0.6)
At 31 December 5.0 3.8
Analysed as:
2021 £m
2020 £m
Current 0.2 0.2
Non-current 4.8 3.6
5.0 3.8
Assets held are analysed as follows:
2021 £m
2020 £m
Equity securities 4.8 3.6
Other 0.2 0.2
5.0 3.8
‘Equity securities’ includes a 15% equity interest in Hino Motors Manufacturing Company SAS.
‘Other’ includes debentures that are not subject to interest rates and do not have fixed maturity dates. They are valued by reference to traded market values.
16 TRADE AND OTHER RECEIVABLES
Current Non-current
2021 £m
2020 £m
2021 £m
2020 £m
Trade receivables 194.7 208.0 11.5 10.8
Less: allowance for expected credit losses (11.6) (10.4) – –
Net trade receivables 183.1 197.6 11.5 10.8
Prepayments 55.6 54.4 8.0 8.0
Accrued income 29.6 41.1 0.9 1.2
Other taxation and social security 8.4 10.2 – –
Other receivables 47.4 66.3 25.0 29.2
324.1 369.6 45.4 49.2
Other receivables includes buyback and indemnity assets, interest, sublease and other receivables.
Trade receivables representing amounts due from customers, including finance houses, OEMs, third-party dealers and insurance companies are split by geographical location as follows:
2021 £m
2020 £m
UK & Europe 89.8 105.8
APAC 62.3 48.9
Americas & Africa 54.1 64.1
206.2 218.8
Less: allowance for expected credit losses (11.6) (10.4)
194.6 208.4
NOTES TO THE FINANCIAL STATEMENTS CONTINUED
162 INCHCAPE ANNUAL REPORT AND ACCOUNTS 2021

16 TRADE AND OTHER RECEIVABLES CONTINUED
At 31 December, the analysis of trade receivables is as follows:
2021Total
£mCurrent
£m0 – 30 days
£m30 – 90 days
£m> 90 days
£m
Gross trade receivables 206.2 102.0 48.0 19.8 36.4Expected credit loss allowance (11.6) (0.2) (0.3) (0.5) (10.6)Net carrying amount 194.6 101.8 47.7 19.3 25.8
2020Total
£mCurrent
£m0 – 30 days
£m30 – 90 days
£m> 90 days
£m
Gross trade receivables 218.8 118.4 43.6 20.8 36.0
Expected credit loss allowance (10.4) (0.1) (0.4) (0.8) (9.1)
Net carrying amount 208.4 118.3 43.2 20.0 26.9
Movements in the allowance for expected credit losses were as follows:
2021 £m
2020 £m
At 1 January (10.4) (8.7)
Charge for the year (2.6) (2.8)
Amounts written off 0.4 0.6
Business sold 0.1 –
Unused amounts reversed 0.2 0.4
Effect of foreign exchange rate changes 0.7 0.1
At 31 December (11.6) (10.4)
The expected credit loss for accrued income is immaterial (2020: immaterial).
Trade receivables are non-interest bearing and are generally on credit terms of 30 to 60 days. Trade receivables are only written off where there is no reasonable expectation of recovery.
The concentration of credit risk with respect to trade receivables is very limited due to the Group’s broad customer base across a number of geographic regions and the default loss percentage incurred by the Group has customarily been low even if there have been significant changes in economic conditions experienced in markets in which the Group operates. Trade receivables include amounts due from a number of finance houses in respect of vehicles sold to customers on finance arranged through the Group. An independent credit rating agency is used to assess the credit standing of each finance house. Limits for the maximum outstanding with each finance house are set accordingly.
As a consequence, the risk associated with trade receivable balances past due but not impaired is not expected to be significant and as such does not contribute to a significant allowance for expected credit losses of receivables being recognised.
The allowance for expected credit losses for trade receivables and accrued income is based on an expected credit loss model that calculates the expected loss applicable to the receivable balance over its lifetime. For the Group, the simplified approach under IFRS 9 is applied to all trade receivables and accrued income. Under this approach, the provision required against receivables is calculated by considering the cash shortfall that would be incurred in various default scenarios for prescribed future periods. Default rates are calculated initially by Inchcape’s markets considering historical loss experience and applied to trade receivables within a provision matrix. The matrix approach allows application of different default rates to different groups of customers with similar characteristics. These groups will be determined by a number of factors including: the nature of the customer, the payment method selected and where relevant, the sector in which they operate. The characteristics used to determine the groupings of receivables are the factors that have the greatest impact on the likelihood of default. The rate of default increases once the balance is 30 days past due and subsequently in 30-day increments.
Management considers the carrying amount of trade and other receivables to approximate to their fair value. Long-term receivables have been discounted where the time value of money is considered to be material.
INCHCAPE ANNUAL REPORT AND ACCOUNTS 2021 163
STRA
TEGIC
REPO
RTG
OV
ERN
AN
CE
FINA
NC
IAL STA
TEMEN
TS
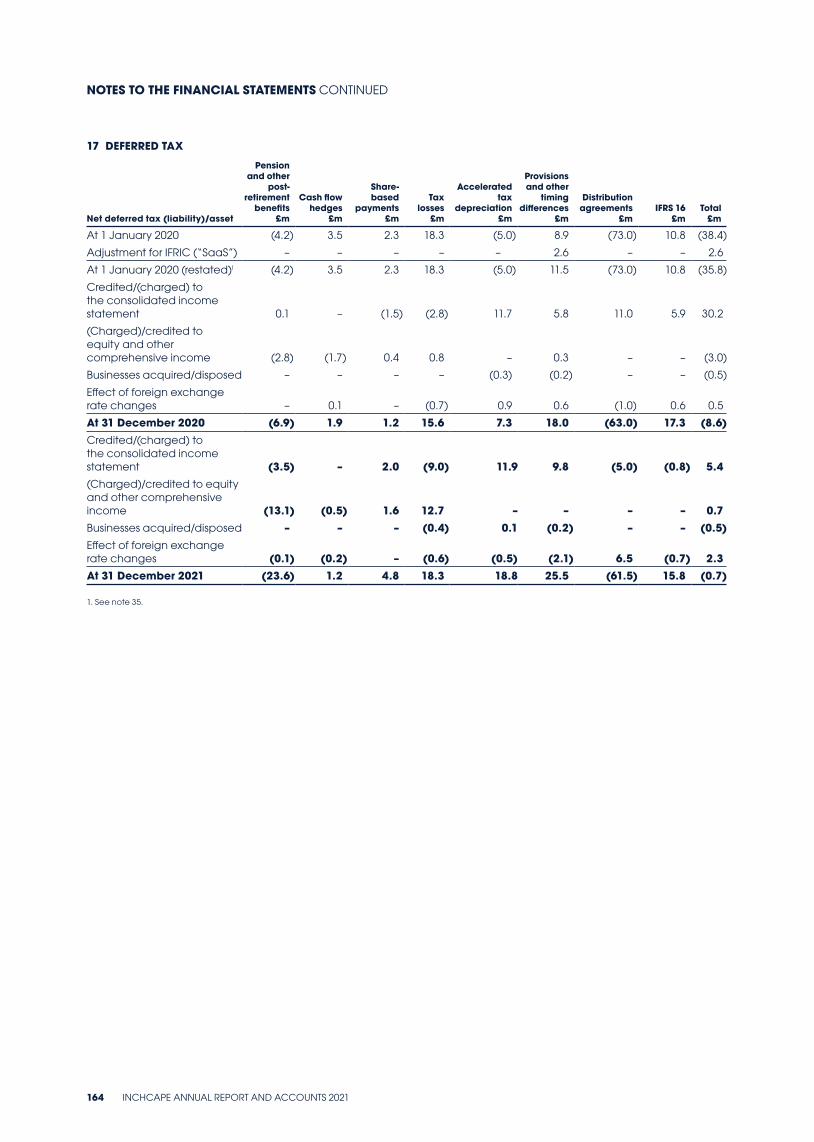
17 DEFERRED TAX
Net deferred tax (liability)/asset
Pension and other
post-retirement
benefits £m
Cash flow hedges
£m
Share-based
payments £m
Tax losses
£m
Accelerated tax
depreciation £m
Provisions and other
timing differences
£m
Distribution agreements
£mIFRS 16
£mTotal
£m
At 1 January 2020 (4.2) 3.5 2.3 18.3 (5.0) 8.9 (73.0) 10.8 (38.4)
Adjustment for IFRIC (“SaaS”) – – – – – 2.6 – – 2.6
At 1 January 2020 (restated)! (4.2) 3.5 2.3 18.3 (5.0) 11.5 (73.0) 10.8 (35.8)
Credited/(charged) to the consolidated income statement 0.1 – (1.5) (2.8) 11.7 5.8 11.0 5.9 30.2
(Charged)/credited to equity and other comprehensive income (2.8) (1.7) 0.4 0.8 – 0.3 – – (3.0)
Businesses acquired/disposed – – – – (0.3) (0.2) – – (0.5)
Effect of foreign exchange rate changes – 0.1 – (0.7) 0.9 0.6 (1.0) 0.6 0.5
At 31 December 2020 (6.9) 1.9 1.2 15.6 7.3 18.0 (63.0) 17.3 (8.6)Credited/(charged) to the consolidated income statement (3.5) – 2.0 (9.0) 11.9 9.8 (5.0) (0.8) 5.4(Charged)/credited to equity and other comprehensive income (13.1) (0.5) 1.6 12.7 – – – – 0.7Businesses acquired/disposed – – – (0.4) 0.1 (0.2) – – (0.5)Effect of foreign exchange rate changes (0.1) (0.2) – (0.6) (0.5) (2.1) 6.5 (0.7) 2.3At 31 December 2021 (23.6) 1.2 4.8 18.3 18.8 25.5 (61.5) 15.8 (0.7)
1. See note 35.
NOTES TO THE FINANCIAL STATEMENTS CONTINUED
164 INCHCAPE ANNUAL REPORT AND ACCOUNTS 2021
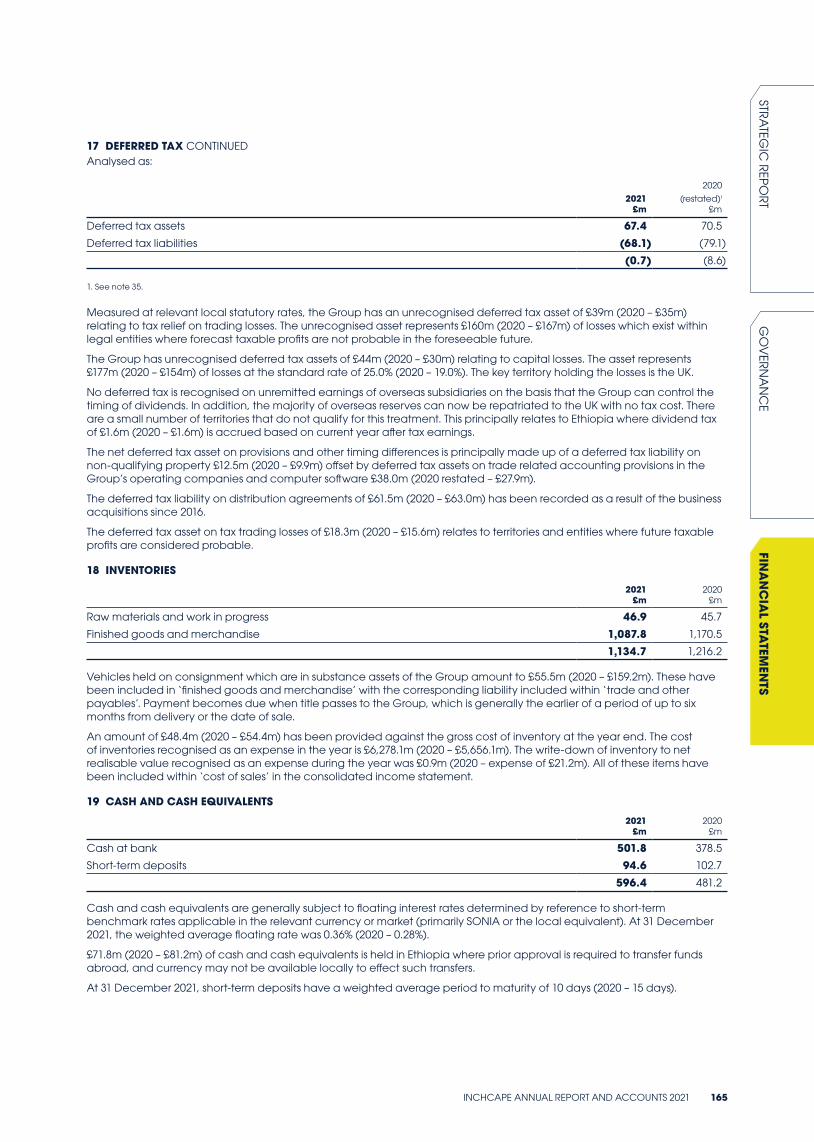
17 DEFERRED TAX CONTINUEDAnalysed as:
2021 £m
2020
(restated)! £m
Deferred tax assets 67.4 70.5
Deferred tax liabilities (68.1) (79.1)
(0.7) (8.6)
1. See note 35.
Measured at relevant local statutory rates, the Group has an unrecognised deferred tax asset of £39m (2020 – £35m) relating to tax relief on trading losses. The unrecognised asset represents £160m (2020 – £167m) of losses which exist within legal entities where forecast taxable profits are not probable in the foreseeable future.
The Group has unrecognised deferred tax assets of £44m (2020 – £30m) relating to capital losses. The asset represents £177m (2020 – £154m) of losses at the standard rate of 25.0% (2020 – 19.0%). The key territory holding the losses is the UK.
No deferred tax is recognised on unremitted earnings of overseas subsidiaries on the basis that the Group can control the timing of dividends. In addition, the majority of overseas reserves can now be repatriated to the UK with no tax cost. There are a small number of territories that do not qualify for this treatment. This principally relates to Ethiopia where dividend tax of £1.6m (2020 – £1.6m) is accrued based on current year after tax earnings.
The net deferred tax asset on provisions and other timing differences is principally made up of a deferred tax liability on non-qualifying property £12.5m (2020 – £9.9m) offset by deferred tax assets on trade related accounting provisions in the Group’s operating companies and computer software £38.0m (2020 restated – £27.9m).
The deferred tax liability on distribution agreements of £61.5m (2020 – £63.0m) has been recorded as a result of the business acquisitions since 2016.
The deferred tax asset on tax trading losses of £18.3m (2020 – £15.6m) relates to territories and entities where future taxable profits are considered probable.
18 INVENTORIES
2021 £m
2020 £m
Raw materials and work in progress 46.9 45.7
Finished goods and merchandise 1,087.8 1,170.5
1,134.7 1,216.2
Vehicles held on consignment which are in substance assets of the Group amount to £55.5m (2020 – £159.2m). These have been included in ‘finished goods and merchandise’ with the corresponding liability included within ‘trade and other payables’. Payment becomes due when title passes to the Group, which is generally the earlier of a period of up to six months from delivery or the date of sale.
An amount of £48.4m (2020 – £54.4m) has been provided against the gross cost of inventory at the year end. The cost of inventories recognised as an expense in the year is £6,278.1m (2020 – £5,656.1m). The write-down of inventory to net realisable value recognised as an expense during the year was £0.9m (2020 – expense of £21.2m). All of these items have been included within ‘cost of sales’ in the consolidated income statement.
19 CASH AND CASH EQUIVALENTS
2021 £m
2020 £m
Cash at bank 501.8 378.5
Short-term deposits 94.6 102.7
596.4 481.2
Cash and cash equivalents are generally subject to floating interest rates determined by reference to short-term benchmark rates applicable in the relevant currency or market (primarily SONIA or the local equivalent). At 31 December 2021, the weighted average floating rate was 0.36% (2020 – 0.28%).
£71.8m (2020 – £81.2m) of cash and cash equivalents is held in Ethiopia where prior approval is required to transfer funds abroad, and currency may not be available locally to effect such transfers.
At 31 December 2021, short-term deposits have a weighted average period to maturity of 10 days (2020 – 15 days).
INCHCAPE ANNUAL REPORT AND ACCOUNTS 2021 165
STRA
TEGIC
REPO
RTG
OV
ERN
AN
CE
FINA
NC
IAL STA
TEMEN
TS
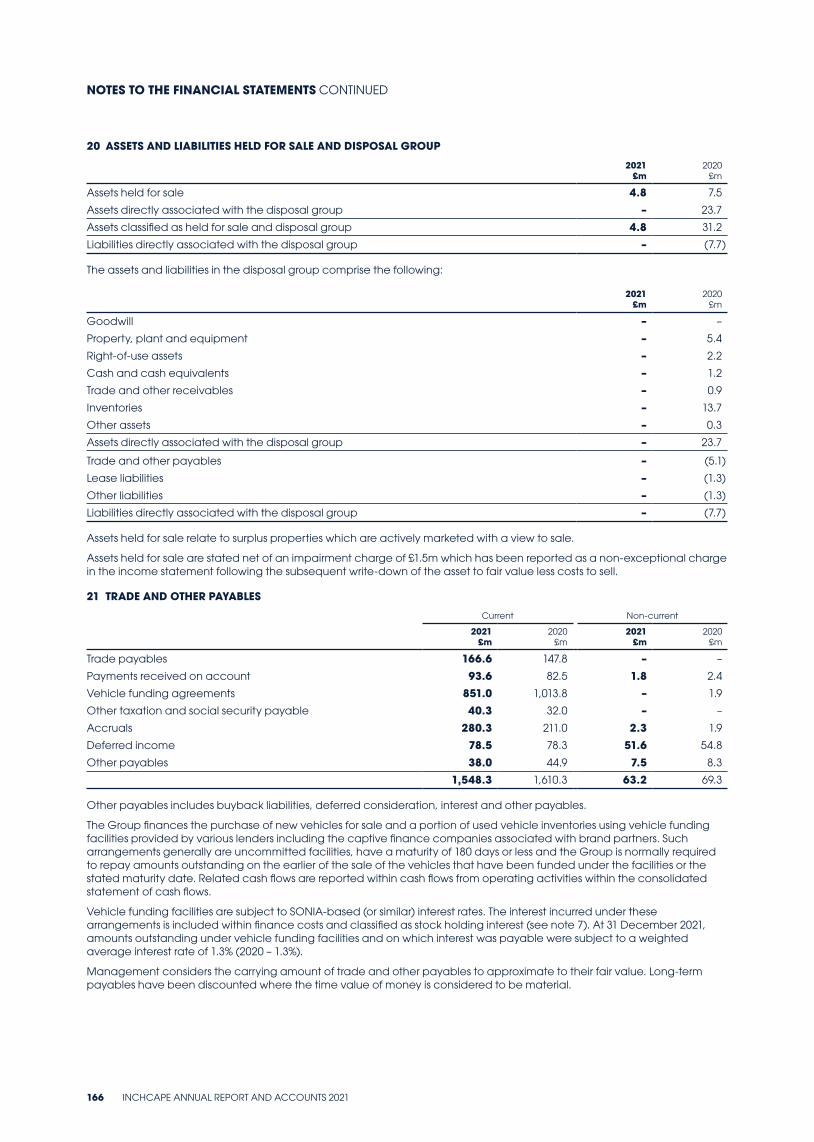
20 ASSETS AND LIABILITIES HELD FOR SALE AND DISPOSAL GROUP
2021 £m
2020 £m
Assets held for sale 4.8 7.5
Assets directly associated with the disposal group – 23.7
Assets classified as held for sale and disposal group 4.8 31.2
Liabilities directly associated with the disposal group – (7.7)
The assets and liabilities in the disposal group comprise the following:
2021 £m
2020 £m
Goodwill – –
Property, plant and equipment – 5.4
Right-of-use assets – 2.2
Cash and cash equivalents – 1.2
Trade and other receivables – 0.9
Inventories – 13.7
Other assets – 0.3
Assets directly associated with the disposal group – 23.7
Trade and other payables – (5.1)
Lease liabilities – (1.3)
Other liabilities – (1.3)
Liabilities directly associated with the disposal group – (7.7)
Assets held for sale relate to surplus properties which are actively marketed with a view to sale.
Assets held for sale are stated net of an impairment charge of £1.5m which has been reported as a non-exceptional charge in the income statement following the subsequent write-down of the asset to fair value less costs to sell.
21 TRADE AND OTHER PAYABLES
Current Non-current
2021 £m
2020 £m
2021 £m
2020 £m
Trade payables 166.6 147.8 – –
Payments received on account 93.6 82.5 1.8 2.4
Vehicle funding agreements 851.0 1,013.8 – 1.9
Other taxation and social security payable 40.3 32.0 – –
Accruals 280.3 211.0 2.3 1.9
Deferred income 78.5 78.3 51.6 54.8
Other payables 38.0 44.9 7.5 8.3
1,548.3 1,610.3 63.2 69.3
Other payables includes buyback liabilities, deferred consideration, interest and other payables.
The Group finances the purchase of new vehicles for sale and a portion of used vehicle inventories using vehicle funding facilities provided by various lenders including the captive finance companies associated with brand partners. Such arrangements generally are uncommitted facilities, have a maturity of 180 days or less and the Group is normally required to repay amounts outstanding on the earlier of the sale of the vehicles that have been funded under the facilities or the stated maturity date. Related cash flows are reported within cash flows from operating activities within the consolidated statement of cash flows.
Vehicle funding facilities are subject to SONIA-based (or similar) interest rates. The interest incurred under these arrangements is included within finance costs and classified as stock holding interest (see note 7). At 31 December 2021, amounts outstanding under vehicle funding facilities and on which interest was payable were subject to a weighted average interest rate of 1.3% (2020 – 1.3%).
Management considers the carrying amount of trade and other payables to approximate to their fair value. Long-term payables have been discounted where the time value of money is considered to be material.
NOTES TO THE FINANCIAL STATEMENTS CONTINUED
166 INCHCAPE ANNUAL REPORT AND ACCOUNTS 2021
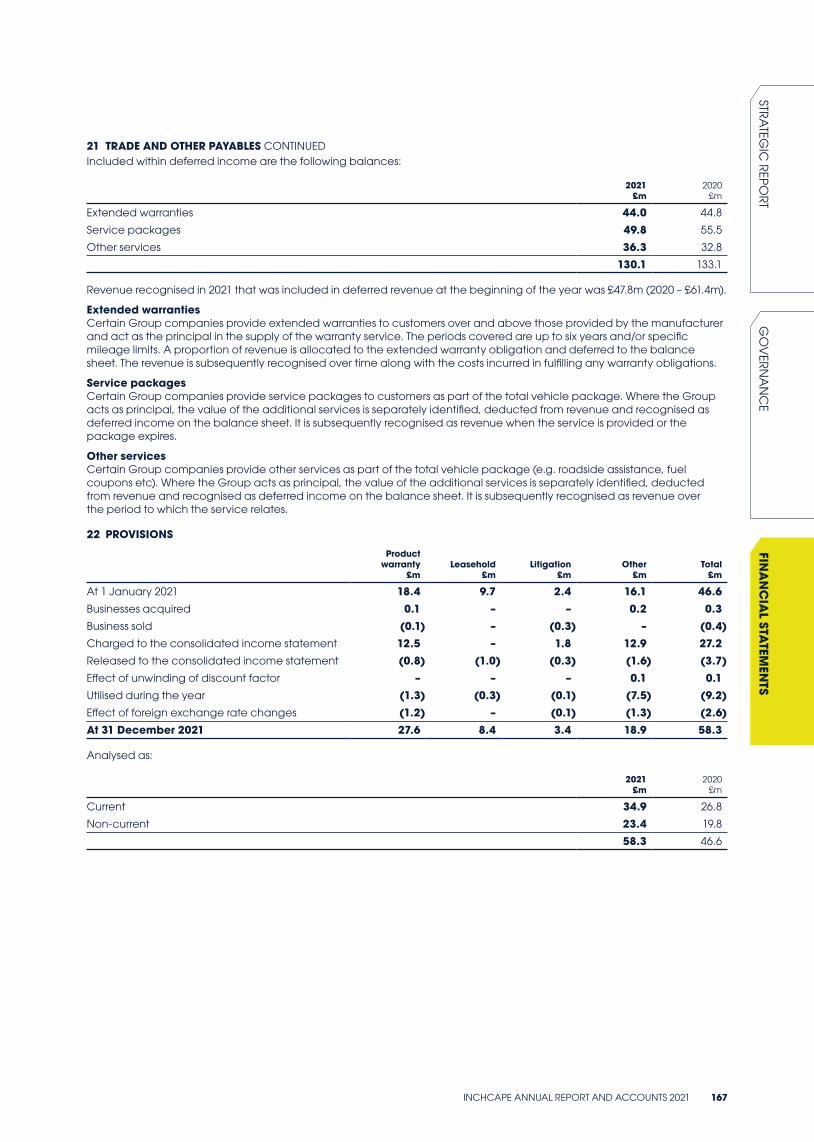
21 TRADE AND OTHER PAYABLES CONTINUEDIncluded within deferred income are the following balances:
2021 £m
2020 £m
Extended warranties 44.0 44.8
Service packages 49.8 55.5
Other services 36.3 32.8
130.1 133.1
Revenue recognised in 2021 that was included in deferred revenue at the beginning of the year was £47.8m (2020 – £61.4m).
Extended warrantiesCertain Group companies provide extended warranties to customers over and above those provided by the manufacturer and act as the principal in the supply of the warranty service. The periods covered are up to six years and/or specific mileage limits. A proportion of revenue is allocated to the extended warranty obligation and deferred to the balance sheet. The revenue is subsequently recognised over time along with the costs incurred in fulfilling any warranty obligations.
Service packagesCertain Group companies provide service packages to customers as part of the total vehicle package. Where the Group acts as principal, the value of the additional services is separately identified, deducted from revenue and recognised as deferred income on the balance sheet. It is subsequently recognised as revenue when the service is provided or the package expires.
Other servicesCertain Group companies provide other services as part of the total vehicle package (e.g. roadside assistance, fuel coupons etc). Where the Group acts as principal, the value of the additional services is separately identified, deducted from revenue and recognised as deferred income on the balance sheet. It is subsequently recognised as revenue over the period to which the service relates.
22 PROVISIONS
Product warranty
£mLeasehold
£mLitigation
£mOther
£mTotal £m
At 1 January 2021 18.4 9.7 2.4 16.1 46.6 Businesses acquired 0.1 – – 0.2 0.3Business sold (0.1) – (0.3) – (0.4)Charged to the consolidated income statement 12.5 – 1.8 12.9 27.2Released to the consolidated income statement (0.8) (1.0) (0.3) (1.6) (3.7)Effect of unwinding of discount factor – – – 0.1 0.1Utilised during the year (1.3) (0.3) (0.1) (7.5) (9.2)Effect of foreign exchange rate changes (1.2) – (0.1) (1.3) (2.6)At 31 December 2021 27.6 8.4 3.4 18.9 58.3
Analysed as:
2021 £m
2020 £m
Current 34.9 26.8
Non-current 23.4 19.8
58.3 46.6
INCHCAPE ANNUAL REPORT AND ACCOUNTS 2021 167
STRA
TEGIC
REPO
RTG
OV
ERN
AN
CE
FINA
NC
IAL STA
TEMEN
TS
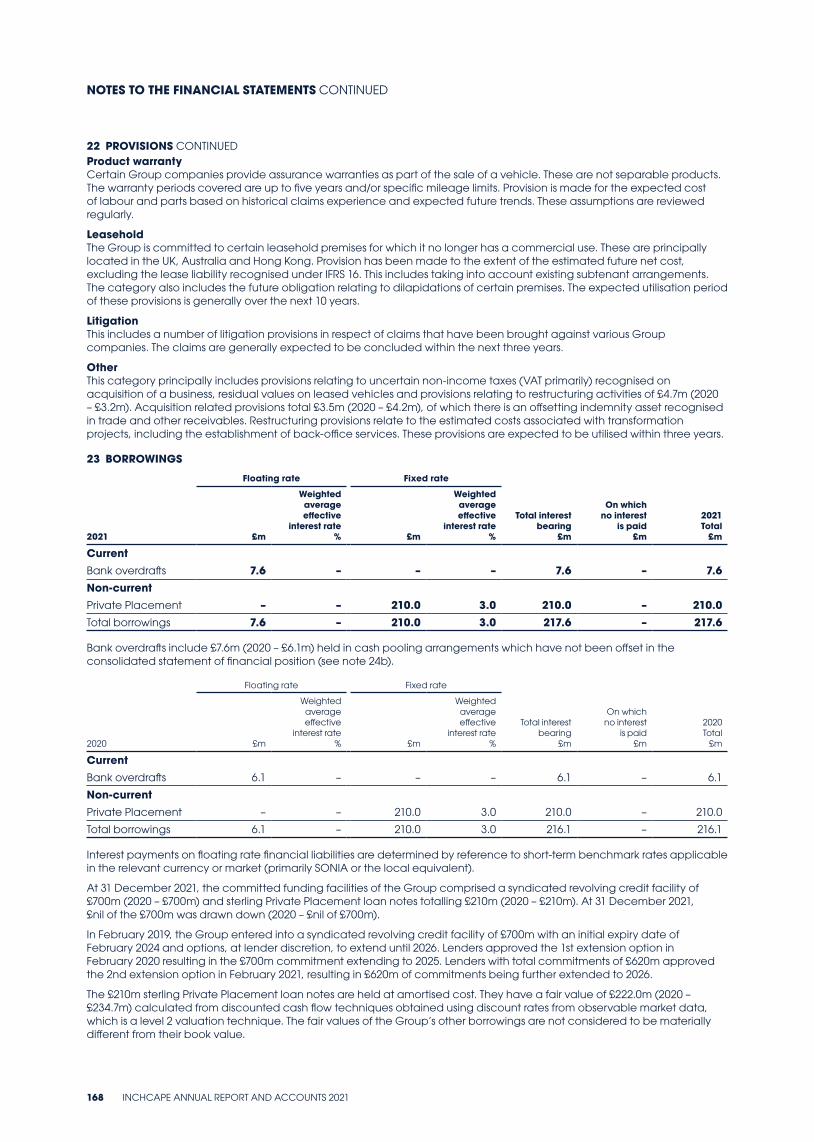
22 PROVISIONS CONTINUEDProduct warrantyCertain Group companies provide assurance warranties as part of the sale of a vehicle. These are not separable products. The warranty periods covered are up to five years and/or specific mileage limits. Provision is made for the expected cost of labour and parts based on historical claims experience and expected future trends. These assumptions are reviewed regularly.
LeaseholdThe Group is committed to certain leasehold premises for which it no longer has a commercial use. These are principally located in the UK, Australia and Hong Kong. Provision has been made to the extent of the estimated future net cost, excluding the lease liability recognised under IFRS 16. This includes taking into account existing subtenant arrangements. The category also includes the future obligation relating to dilapidations of certain premises. The expected utilisation period of these provisions is generally over the next 10 years.
LitigationThis includes a number of litigation provisions in respect of claims that have been brought against various Group companies. The claims are generally expected to be concluded within the next three years.
OtherThis category principally includes provisions relating to uncertain non-income taxes (VAT primarily) recognised on acquisition of a business, residual values on leased vehicles and provisions relating to restructuring activities of £4.7m (2020 – £3.2m). Acquisition related provisions total £3.5m (2020 – £4.2m), of which there is an offsetting indemnity asset recognised in trade and other receivables. Restructuring provisions relate to the estimated costs associated with transformation projects, including the establishment of back-office services. These provisions are expected to be utilised within three years.
23 BORROWINGS
Floating rate Fixed rate
2021 £m
Weighted average effective
interest rate % £m
Weighted average effective
interest rate %
Total interest bearing
£m
On which no interest
is paid £m
2021 Total
£m
CurrentBank overdrafts 7.6 – – – 7.6 – 7.6Non-currentPrivate Placement – – 210.0 3.0 210.0 – 210.0Total borrowings 7.6 – 210.0 3.0 217.6 – 217.6
Bank overdrafts include £7.6m (2020 – £6.1m) held in cash pooling arrangements which have not been offset in the consolidated statement of financial position (see note 24b).
Floating rate Fixed rate
2020 £m
Weighted average effective
interest rate % £m
Weighted average effective
interest rate %
Total interest bearing
£m
On which no interest
is paid £m
2020 Total
£m
CurrentBank overdrafts 6.1 – – – 6.1 – 6.1
Non-currentPrivate Placement – – 210.0 3.0 210.0 – 210.0
Total borrowings 6.1 – 210.0 3.0 216.1 – 216.1
Interest payments on floating rate financial liabilities are determined by reference to short-term benchmark rates applicable in the relevant currency or market (primarily SONIA or the local equivalent).
At 31 December 2021, the committed funding facilities of the Group comprised a syndicated revolving credit facility of £700m (2020 – £700m) and sterling Private Placement loan notes totalling £210m (2020 – £210m). At 31 December 2021, £nil of the £700m was drawn down (2020 – £nil of £700m).
In February 2019, the Group entered into a syndicated revolving credit facility of £700m with an initial expiry date of February 2024 and options, at lender discretion, to extend until 2026. Lenders approved the 1st extension option in February 2020 resulting in the £700m commitment extending to 2025. Lenders with total commitments of £620m approved the 2nd extension option in February 2021, resulting in £620m of commitments being further extended to 2026.
The £210m sterling Private Placement loan notes are held at amortised cost. They have a fair value of £222.0m (2020 – £234.7m) calculated from discounted cash flow techniques obtained using discount rates from observable market data, which is a level 2 valuation technique. The fair values of the Group’s other borrowings are not considered to be materially different from their book value.
NOTES TO THE FINANCIAL STATEMENTS CONTINUED
168 INCHCAPE ANNUAL REPORT AND ACCOUNTS 2021
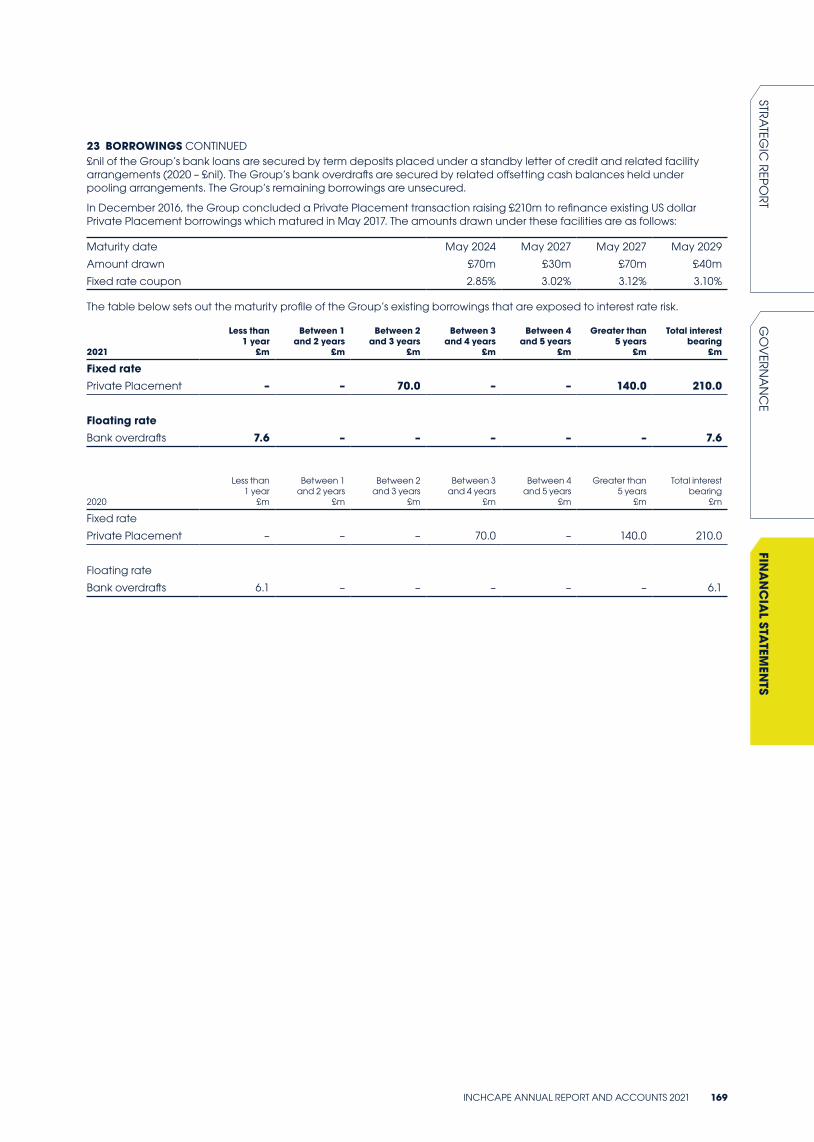
23 BORROWINGS CONTINUED£nil of the Group’s bank loans are secured by term deposits placed under a standby letter of credit and related facility arrangements (2020 – £nil). The Group’s bank overdrafts are secured by related offsetting cash balances held under pooling arrangements. The Group’s remaining borrowings are unsecured.
In December 2016, the Group concluded a Private Placement transaction raising £210m to refinance existing US dollar Private Placement borrowings which matured in May 2017. The amounts drawn under these facilities are as follows:
Maturity date May 2024 May 2027 May 2027 May 2029
Amount drawn £70m £30m £70m £40m
Fixed rate coupon 2.85% 3.02% 3.12% 3.10%
The table below sets out the maturity profile of the Group’s existing borrowings that are exposed to interest rate risk.
2021
Less than 1 year
£m
Between 1 and 2 years
£m
Between 2 and 3 years
£m
Between 3 and 4 years
£m
Between 4 and 5 years
£m
Greater than 5 years
£m
Total interest bearing
£m
Fixed ratePrivate Placement – – 70.0 – – 140.0 210.0
Floating rateBank overdrafts 7.6 – – – – – 7.6
2020
Less than 1 year
£m
Between 1 and 2 years
£m
Between 2 and 3 years
£m
Between 3 and 4 years
£m
Between 4 and 5 years
£m
Greater than 5 years
£m
Total interest bearing
£m
Fixed rate
Private Placement – – – 70.0 – 140.0 210.0
Floating rate
Bank overdrafts 6.1 – – – – – 6.1
INCHCAPE ANNUAL REPORT AND ACCOUNTS 2021 169
STRA
TEGIC
REPO
RTG
OV
ERN
AN
CE
FINA
NC
IAL STA
TEMEN
TS
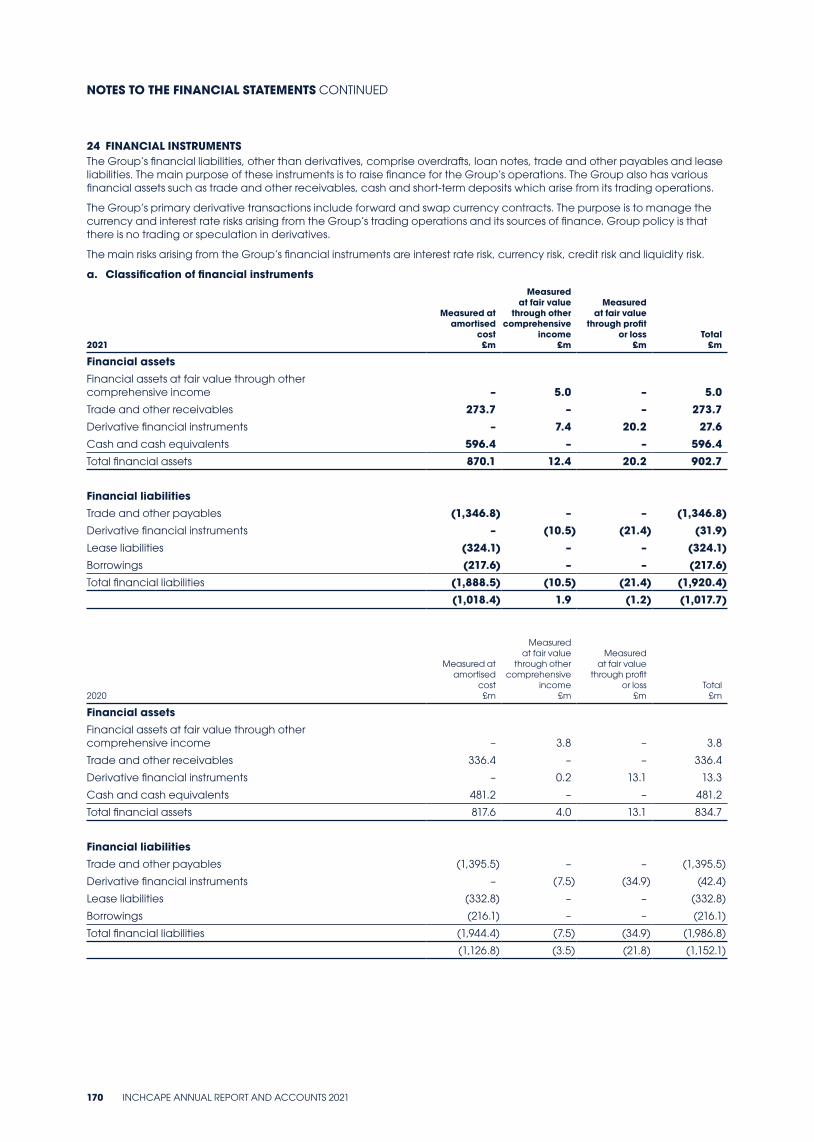
24 FINANCIAL INSTRUMENTSThe Group’s financial liabilities, other than derivatives, comprise overdrafts, loan notes, trade and other payables and lease liabilities. The main purpose of these instruments is to raise finance for the Group’s operations. The Group also has various financial assets such as trade and other receivables, cash and short-term deposits which arise from its trading operations.
The Group’s primary derivative transactions include forward and swap currency contracts. The purpose is to manage the currency and interest rate risks arising from the Group’s trading operations and its sources of finance. Group policy is that there is no trading or speculation in derivatives.
The main risks arising from the Group’s financial instruments are interest rate risk, currency risk, credit risk and liquidity risk.
a. Classification of financial instruments
2021
Measured at amortised
cost £m
Measured at fair value
through other comprehensive
income £m
Measured at fair value
through profit or loss
£m Total
£m
Financial assetsFinancial assets at fair value through other comprehensive income – 5.0 – 5.0Trade and other receivables 273.7 – – 273.7Derivative financial instruments – 7.4 20.2 27.6Cash and cash equivalents 596.4 – – 596.4Total financial assets 870.1 12.4 20.2 902.7
Financial liabilitiesTrade and other payables (1,346.8) – – (1,346.8)Derivative financial instruments – (10.5) (21.4) (31.9)Lease liabilities (324.1) – – (324.1)Borrowings (217.6) – – (217.6)Total financial liabilities (1,888.5) (10.5) (21.4) (1,920.4)
(1,018.4) 1.9 (1.2) (1,017.7)
2020
Measured at amortised
cost £m
Measured at fair value
through other comprehensive
income £m
Measured at fair value
through profit or loss
£m Total
£m
Financial assetsFinancial assets at fair value through other comprehensive income – 3.8 – 3.8
Trade and other receivables 336.4 – – 336.4
Derivative financial instruments – 0.2 13.1 13.3
Cash and cash equivalents 481.2 – – 481.2
Total financial assets 817.6 4.0 13.1 834.7
Financial liabilitiesTrade and other payables (1,395.5) – – (1,395.5)
Derivative financial instruments – (7.5) (34.9) (42.4)
Lease liabilities (332.8) – – (332.8)
Borrowings (216.1) – – (216.1)
Total financial liabilities (1,944.4) (7.5) (34.9) (1,986.8)
(1,126.8) (3.5) (21.8) (1,152.1)
NOTES TO THE FINANCIAL STATEMENTS CONTINUED
170 INCHCAPE ANNUAL REPORT AND ACCOUNTS 2021
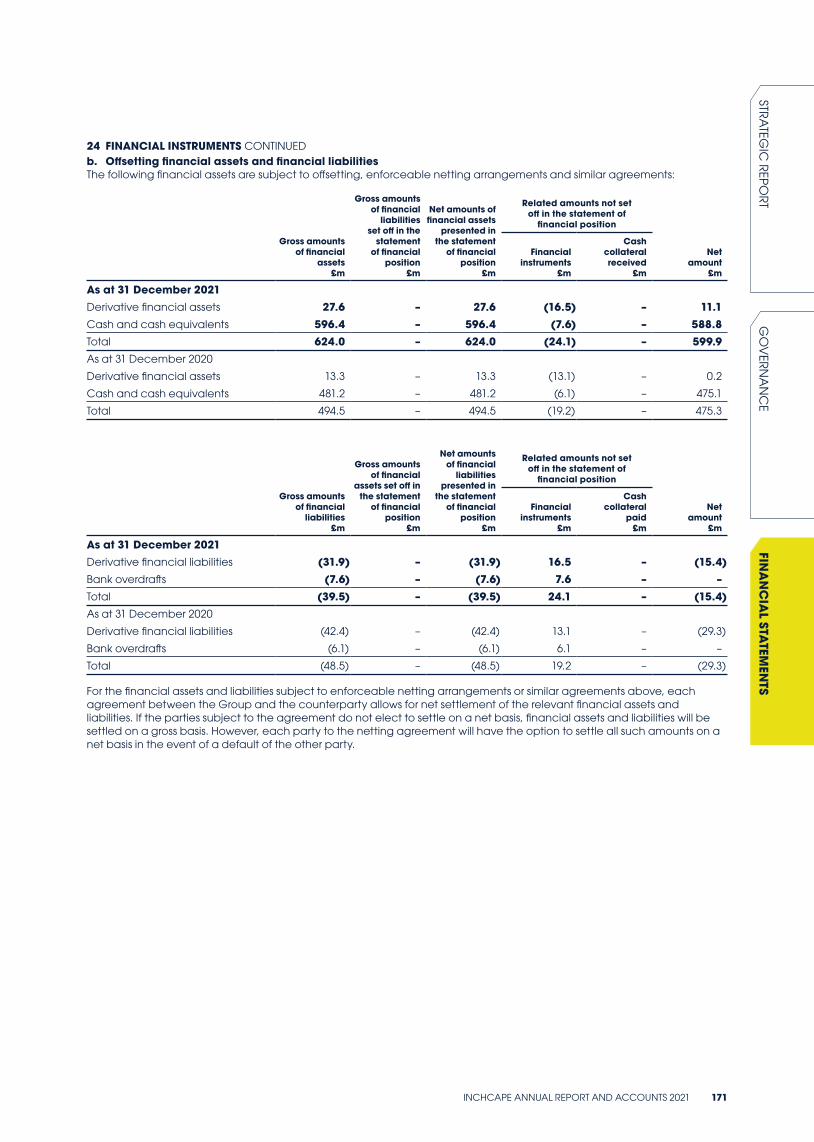
24 FINANCIAL INSTRUMENTS CONTINUEDb. Offsetting financial assets and financial liabilitiesThe following financial assets are subject to offsetting, enforceable netting arrangements and similar agreements:
Gross amounts of financial
assets £m
Gross amounts of financial
liabilities set off in the
statement of financial
position £m
Net amounts of financial assets
presented in the statement
of financial position
£m
Related amounts not set off in the statement of
financial position
Net amount
£m
Financial instruments
£m
Cash collateral received
£m
As at 31 December 2021Derivative financial assets 27.6 – 27.6 (16.5) – 11.1Cash and cash equivalents 596.4 – 596.4 (7.6) – 588.8Total 624.0 – 624.0 (24.1) – 599.9As at 31 December 2020
Derivative financial assets 13.3 – 13.3 (13.1) – 0.2
Cash and cash equivalents 481.2 – 481.2 (6.1) – 475.1
Total 494.5 – 494.5 (19.2) – 475.3
Gross amounts of financial
liabilities £m
Gross amounts of financial
assets set off in the statement
of financial position
£m
Net amounts of financial
liabilities presented in
the statement of financial
position £m
Related amounts not set off in the statement of
financial position
Net amount
£m
Financial instruments
£m
Cash collateral
paid £m
As at 31 December 2021Derivative financial liabilities (31.9) – (31.9) 16.5 – (15.4)Bank overdrafts (7.6) – (7.6) 7.6 – –Total (39.5) – (39.5) 24.1 – (15.4)As at 31 December 2020
Derivative financial liabilities (42.4) – (42.4) 13.1 – (29.3)
Bank overdrafts (6.1) – (6.1) 6.1 – –
Total (48.5) – (48.5) 19.2 – (29.3)
For the financial assets and liabilities subject to enforceable netting arrangements or similar agreements above, each agreement between the Group and the counterparty allows for net settlement of the relevant financial assets and liabilities. If the parties subject to the agreement do not elect to settle on a net basis, financial assets and liabilities will be settled on a gross basis. However, each party to the netting agreement will have the option to settle all such amounts on a net basis in the event of a default of the other party.
INCHCAPE ANNUAL REPORT AND ACCOUNTS 2021 171
STRA
TEGIC
REPO
RTG
OV
ERN
AN
CE
FINA
NC
IAL STA
TEMEN
TS
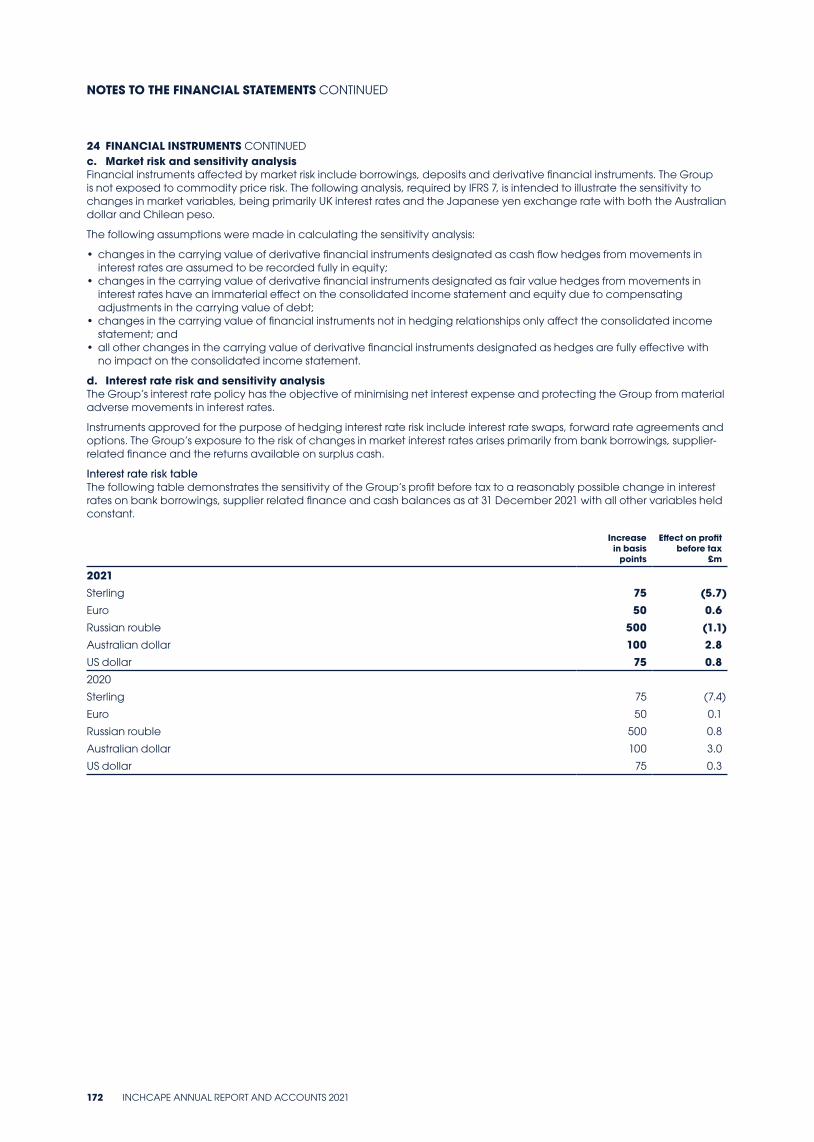
24 FINANCIAL INSTRUMENTS CONTINUEDc. Market risk and sensitivity analysisFinancial instruments affected by market risk include borrowings, deposits and derivative financial instruments. The Group is not exposed to commodity price risk. The following analysis, required by IFRS 7, is intended to illustrate the sensitivity to changes in market variables, being primarily UK interest rates and the Japanese yen exchange rate with both the Australian dollar and Chilean peso.
The following assumptions were made in calculating the sensitivity analysis:
• changes in the carrying value of derivative financial instruments designated as cash flow hedges from movements in interest rates are assumed to be recorded fully in equity;
• changes in the carrying value of derivative financial instruments designated as fair value hedges from movements in interest rates have an immaterial effect on the consolidated income statement and equity due to compensating adjustments in the carrying value of debt;
• changes in the carrying value of financial instruments not in hedging relationships only affect the consolidated income statement; and
• all other changes in the carrying value of derivative financial instruments designated as hedges are fully effective with no impact on the consolidated income statement.
d. Interest rate risk and sensitivity analysisThe Group’s interest rate policy has the objective of minimising net interest expense and protecting the Group from material adverse movements in interest rates.
Instruments approved for the purpose of hedging interest rate risk include interest rate swaps, forward rate agreements and options. The Group’s exposure to the risk of changes in market interest rates arises primarily from bank borrowings, supplier-related finance and the returns available on surplus cash.
Interest rate risk tableThe following table demonstrates the sensitivity of the Group’s profit before tax to a reasonably possible change in interest rates on bank borrowings, supplier related finance and cash balances as at 31 December 2021 with all other variables held constant.
Increase in basis
points
Effect on profit before tax
£m
2021Sterling 75 (5.7)Euro 50 0.6Russian rouble 500 (1.1)Australian dollar 100 2.8US dollar 75 0.82020
Sterling 75 (7.4)
Euro 50 0.1
Russian rouble 500 0.8
Australian dollar 100 3.0
US dollar 75 0.3
NOTES TO THE FINANCIAL STATEMENTS CONTINUED
172 INCHCAPE ANNUAL REPORT AND ACCOUNTS 2021
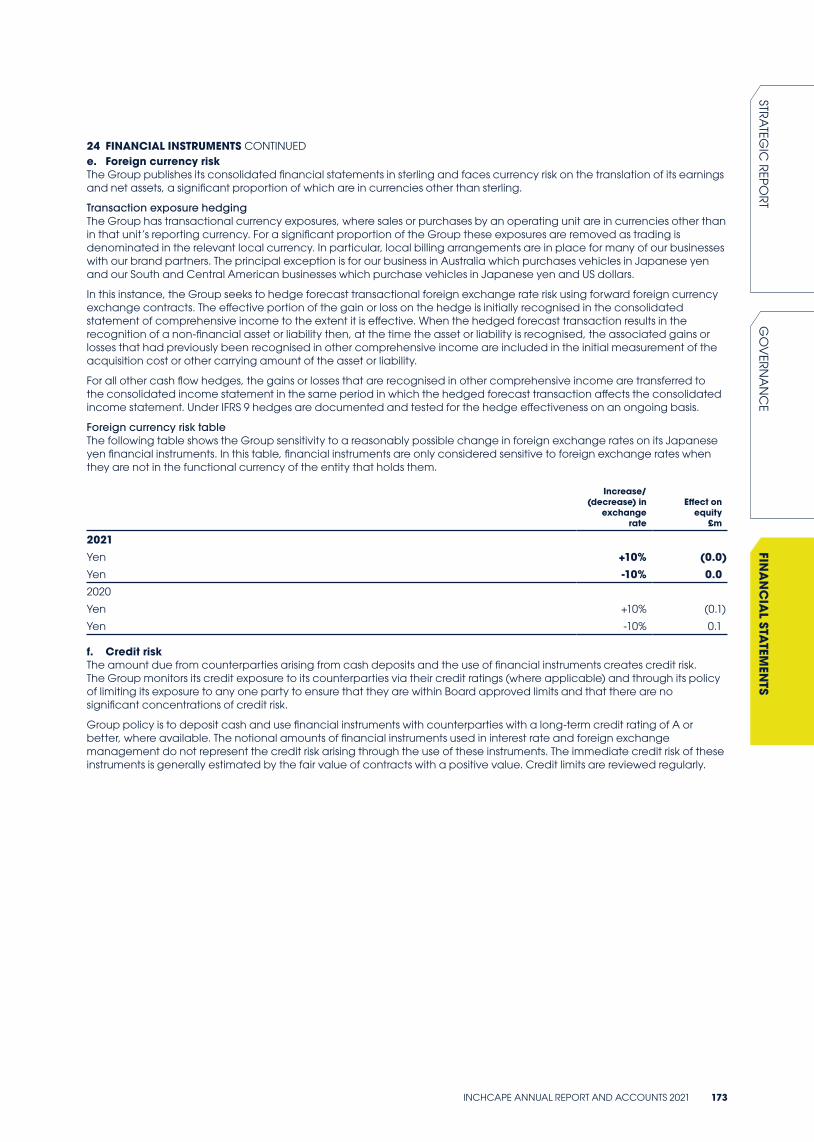
24 FINANCIAL INSTRUMENTS CONTINUEDe. Foreign currency riskThe Group publishes its consolidated financial statements in sterling and faces currency risk on the translation of its earnings and net assets, a significant proportion of which are in currencies other than sterling.
Transaction exposure hedgingThe Group has transactional currency exposures, where sales or purchases by an operating unit are in currencies other than in that unit’s reporting currency. For a significant proportion of the Group these exposures are removed as trading is denominated in the relevant local currency. In particular, local billing arrangements are in place for many of our businesses with our brand partners. The principal exception is for our business in Australia which purchases vehicles in Japanese yen and our South and Central American businesses which purchase vehicles in Japanese yen and US dollars.
In this instance, the Group seeks to hedge forecast transactional foreign exchange rate risk using forward foreign currency exchange contracts. The effective portion of the gain or loss on the hedge is initially recognised in the consolidated statement of comprehensive income to the extent it is effective. When the hedged forecast transaction results in the recognition of a non-financial asset or liability then, at the time the asset or liability is recognised, the associated gains or losses that had previously been recognised in other comprehensive income are included in the initial measurement of the acquisition cost or other carrying amount of the asset or liability.
For all other cash flow hedges, the gains or losses that are recognised in other comprehensive income are transferred to the consolidated income statement in the same period in which the hedged forecast transaction affects the consolidated income statement. Under IFRS 9 hedges are documented and tested for the hedge effectiveness on an ongoing basis.
Foreign currency risk tableThe following table shows the Group sensitivity to a reasonably possible change in foreign exchange rates on its Japanese yen financial instruments. In this table, financial instruments are only considered sensitive to foreign exchange rates when they are not in the functional currency of the entity that holds them.
Increase/(decrease) in
exchange rate
Effect on equity
£m
2021Yen +10% (0.0)Yen -10% 0.02020
Yen +10% (0.1)
Yen -10% 0.1
f. Credit riskThe amount due from counterparties arising from cash deposits and the use of financial instruments creates credit risk. The Group monitors its credit exposure to its counterparties via their credit ratings (where applicable) and through its policy of limiting its exposure to any one party to ensure that they are within Board approved limits and that there are no significant concentrations of credit risk.
Group policy is to deposit cash and use financial instruments with counterparties with a long-term credit rating of A or better, where available. The notional amounts of financial instruments used in interest rate and foreign exchange management do not represent the credit risk arising through the use of these instruments. The immediate credit risk of these instruments is generally estimated by the fair value of contracts with a positive value. Credit limits are reviewed regularly.
INCHCAPE ANNUAL REPORT AND ACCOUNTS 2021 173
STRA
TEGIC
REPO
RTG
OV
ERN
AN
CE
FINA
NC
IAL STA
TEMEN
TS
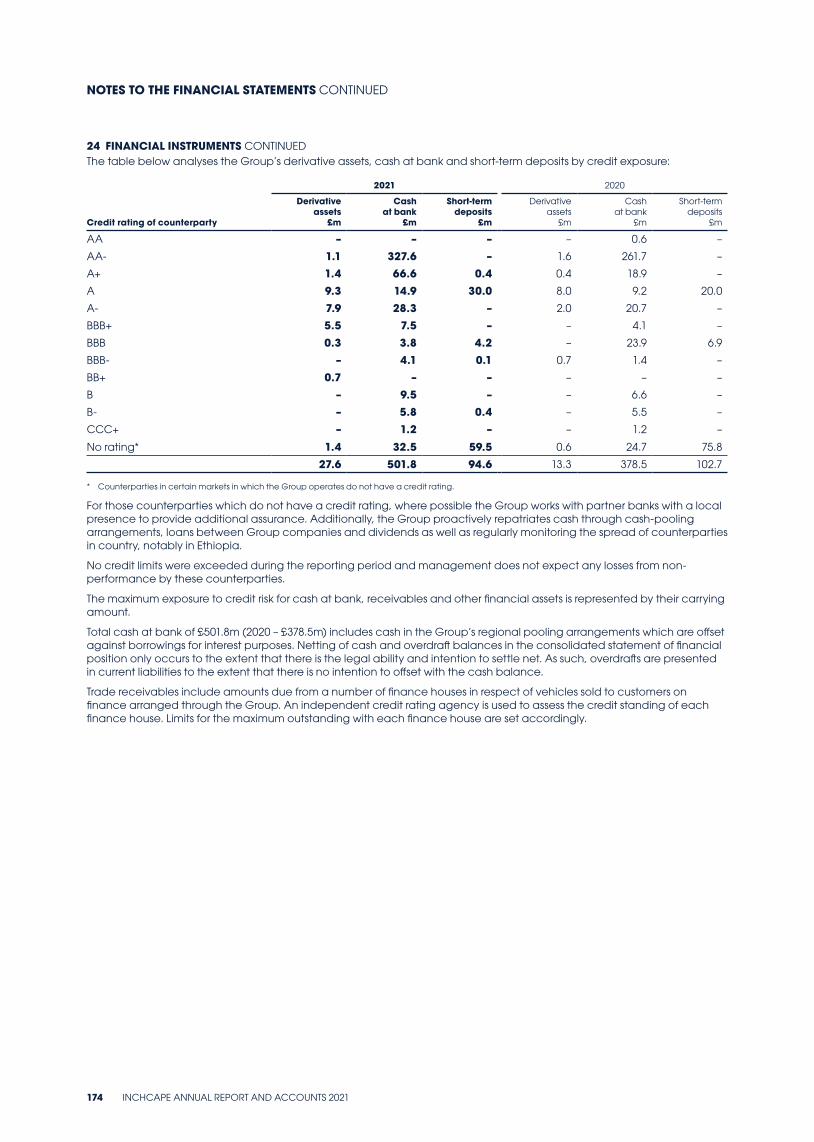
24 FINANCIAL INSTRUMENTS CONTINUEDThe table below analyses the Group’s derivative assets, cash at bank and short-term deposits by credit exposure:
2021 2020
Credit rating of counterparty
Derivative assets
£m
Cash at bank
£m
Short-term deposits
£m
Derivative assets
£m
Cash at bank
£m
Short-term deposits
£m
AA – – – – 0.6 –
AA- 1.1 327.6 – 1.6 261.7 –
A+ 1.4 66.6 0.4 0.4 18.9 –
A 9.3 14.9 30.0 8.0 9.2 20.0
A- 7.9 28.3 – 2.0 20.7 –
BBB+ 5.5 7.5 – – 4.1 –
BBB 0.3 3.8 4.2 – 23.9 6.9
BBB- – 4.1 0.1 0.7 1.4 –
BB+ 0.7 – – – – –
B – 9.5 – – 6.6 –
B- – 5.8 0.4 – 5.5 –
CCC+ – 1.2 – – 1.2 –
No rating* 1.4 32.5 59.5 0.6 24.7 75.8
27.6 501.8 94.6 13.3 378.5 102.7
* Counterparties in certain markets in which the Group operates do not have a credit rating.
For those counterparties which do not have a credit rating, where possible the Group works with partner banks with a local presence to provide additional assurance. Additionally, the Group proactively repatriates cash through cash-pooling arrangements, loans between Group companies and dividends as well as regularly monitoring the spread of counterparties in country, notably in Ethiopia.
No credit limits were exceeded during the reporting period and management does not expect any losses from non-performance by these counterparties.
The maximum exposure to credit risk for cash at bank, receivables and other financial assets is represented by their carrying amount.
Total cash at bank of £501.8m (2020 – £378.5m) includes cash in the Group’s regional pooling arrangements which are offset against borrowings for interest purposes. Netting of cash and overdraft balances in the consolidated statement of financial position only occurs to the extent that there is the legal ability and intention to settle net. As such, overdrafts are presented in current liabilities to the extent that there is no intention to offset with the cash balance.
Trade receivables include amounts due from a number of finance houses in respect of vehicles sold to customers on finance arranged through the Group. An independent credit rating agency is used to assess the credit standing of each finance house. Limits for the maximum outstanding with each finance house are set accordingly.
NOTES TO THE FINANCIAL STATEMENTS CONTINUED
174 INCHCAPE ANNUAL REPORT AND ACCOUNTS 2021

24 FINANCIAL INSTRUMENTS CONTINUEDg. Liquidity riskPrudent liquidity risk management includes maintaining sufficient cash and marketable securities, the availability of funding through an adequate amount of committed credit facilities and the ability to close out market positions. Due to the dynamic nature of the underlying businesses, Group Treasury aims to maintain flexibility in funding by keeping committed credit lines available.
The table below summarises the maturity profile of the Group’s financial assets and liabilities at 31 December 2021 based on contractual expected undiscounted cash flows:
2021
Less than 3 months
£m
Between 3 to 12
months £m
Between 1 to 5 years
£m
Greater than 5 years
£mTotal
£m
Financial assetsCash and cash equivalents 593.1 3.3 – – 596.4Trade and other receivables 200.2 45.5 26.3 6.0 278.0Financial assets at fair value through other comprehensive income – 0.2 – 4.8 5.0Derivative financial instruments 1,097.4 1,135.0 126.5 – 2,358.9
1,890.7 1,184.0 152.8 10.8 3,238.3Financial liabilitiesInterest bearing loans and borrowings (7.6) (6.3) (90.1) (144.1) (248.1)Lease liabilities (17.0) (48.0) (170.2) (149.8) (385.0)Trade and other payables (1,085.0) (249.8) (11.7) (0.3) (1,346.8)Derivative financial instruments (1,099.7) (1,145.4) (124.4) – (2,369.5)
(2,209.3) (1,449.5) (396.4) (294.2) (4,349.4)Net outflows (318.6) (265.5) (243.6) (283.4) (1,111.1)
2020
Less than 3 months
£m
Between 3 to 12
months £m
Between 1 to 5 years
£m
Greater than 5 years
£mTotal
£m
Financial assetsCash and cash equivalents 473.7 7.5 – – 481.2
Trade and other receivables 227.8 70.1 31.9 6.6 336.4
Financial assets at fair value through other comprehensive income 0.2 – – 3.6 3.8
Derivative financial instruments¹ 1,052.3 716.6 2.1 – 1,771.0
1,754.0 794.2 34.0 10.2 2,592.4
Financial liabilitiesInterest bearing loans and borrowings (6.1) (6.3) (92.1) (148.5) (253.0)
Lease liabilities (17.7) (49.8) (174.4) (171.5) (413.4)
Trade and other payables (1,140.9) (241.3) (12.9) (0.4) (1,395.5)
Derivative financial instruments¹ (1,063.8) (734.5) (2.1) – (1,800.4)
(2,228.5) (1,031.9) (281.5) (320.4) (3,862.3)
Net outflows (474.5) (237.7) (247.5) (310.2) (1,269.9)
1. Derivative financial instruments line items have been restated to disclose the gross undiscounted cash flows.
INCHCAPE ANNUAL REPORT AND ACCOUNTS 2021 175
STRA
TEGIC
REPO
RTG
OV
ERN
AN
CE
FINA
NC
IAL STA
TEMEN
TS
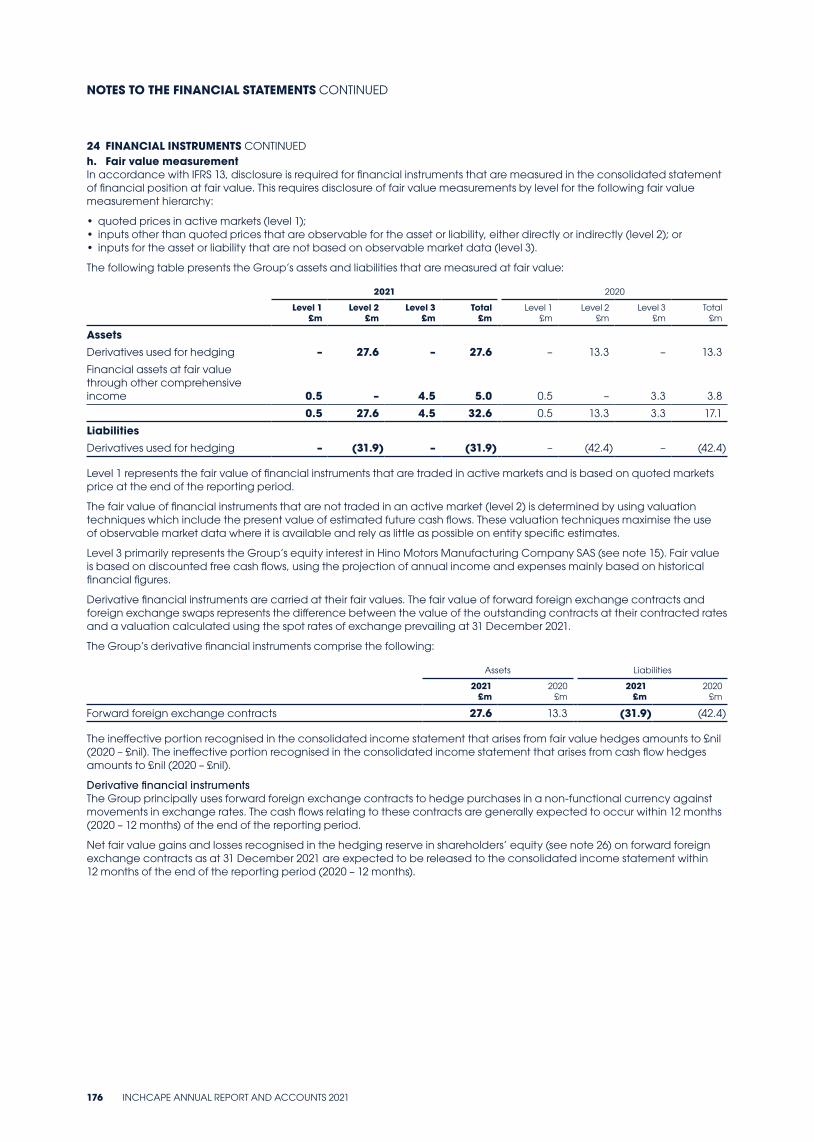
24 FINANCIAL INSTRUMENTS CONTINUEDh. Fair value measurementIn accordance with IFRS 13, disclosure is required for financial instruments that are measured in the consolidated statement of financial position at fair value. This requires disclosure of fair value measurements by level for the following fair value measurement hierarchy:
• quoted prices in active markets (level 1);• inputs other than quoted prices that are observable for the asset or liability, either directly or indirectly (level 2); or• inputs for the asset or liability that are not based on observable market data (level 3).
The following table presents the Group’s assets and liabilities that are measured at fair value:
2021 2020
Level 1 £m
Level 2 £m
Level 3 £m
Total £m
Level 1 £m
Level 2 £m
Level 3 £m
Total £m
AssetsDerivatives used for hedging – 27.6 – 27.6 – 13.3 – 13.3
Financial assets at fair value through other comprehensive income 0.5 – 4.5 5.0 0.5 – 3.3 3.8
0.5 27.6 4.5 32.6 0.5 13.3 3.3 17.1
LiabilitiesDerivatives used for hedging – (31.9) – (31.9) – (42.4) – (42.4)
Level 1 represents the fair value of financial instruments that are traded in active markets and is based on quoted markets price at the end of the reporting period.
The fair value of financial instruments that are not traded in an active market (level 2) is determined by using valuation techniques which include the present value of estimated future cash flows. These valuation techniques maximise the use of observable market data where it is available and rely as little as possible on entity specific estimates.
Level 3 primarily represents the Group’s equity interest in Hino Motors Manufacturing Company SAS (see note 15). Fair value is based on discounted free cash flows, using the projection of annual income and expenses mainly based on historical financial figures.
Derivative financial instruments are carried at their fair values. The fair value of forward foreign exchange contracts and foreign exchange swaps represents the difference between the value of the outstanding contracts at their contracted rates and a valuation calculated using the spot rates of exchange prevailing at 31 December 2021.
The Group’s derivative financial instruments comprise the following:
Assets Liabilities
2021 £m
2020 £m
2021 £m
2020 £m
Forward foreign exchange contracts 27.6 13.3 (31.9) (42.4)
The ineffective portion recognised in the consolidated income statement that arises from fair value hedges amounts to £nil (2020 – £nil). The ineffective portion recognised in the consolidated income statement that arises from cash flow hedges amounts to £nil (2020 – £nil).
Derivative financial instrumentsThe Group principally uses forward foreign exchange contracts to hedge purchases in a non-functional currency against movements in exchange rates. The cash flows relating to these contracts are generally expected to occur within 12 months (2020 – 12 months) of the end of the reporting period.
Net fair value gains and losses recognised in the hedging reserve in shareholders’ equity (see note 26) on forward foreign exchange contracts as at 31 December 2021 are expected to be released to the consolidated income statement within 12 months of the end of the reporting period (2020 – 12 months).
NOTES TO THE FINANCIAL STATEMENTS CONTINUED
176 INCHCAPE ANNUAL REPORT AND ACCOUNTS 2021
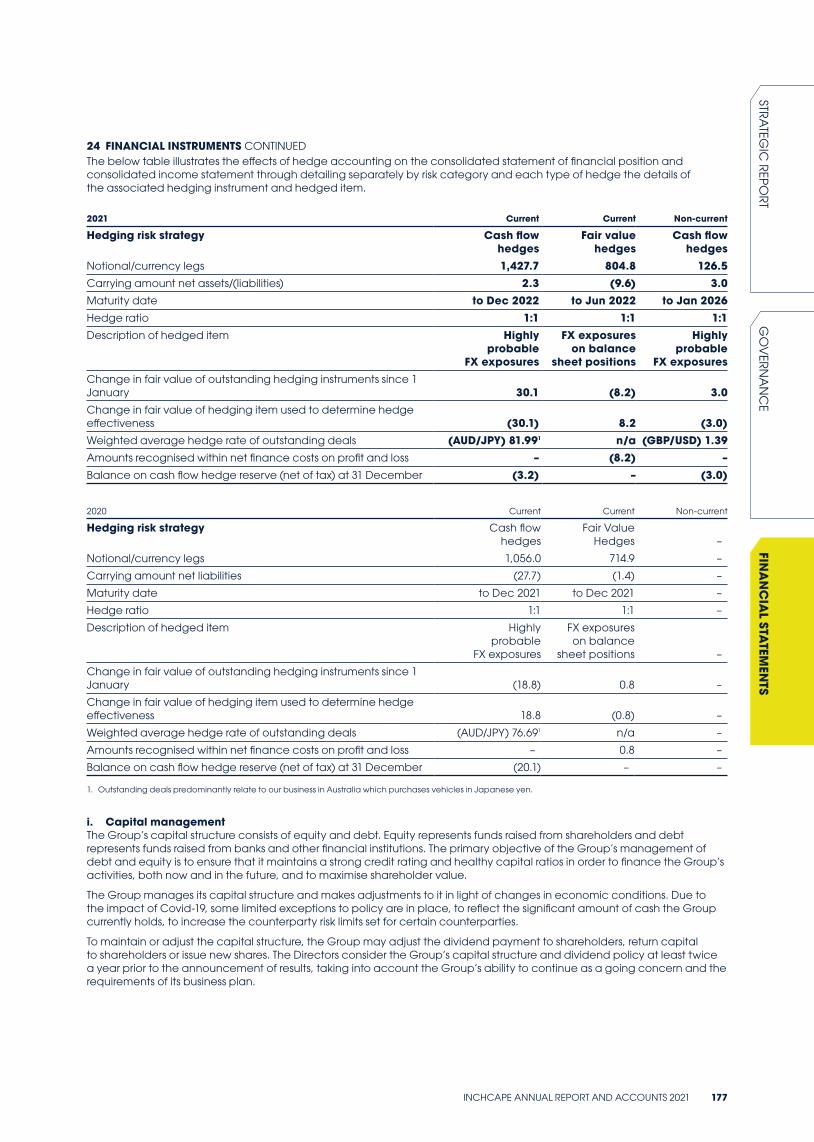
24 FINANCIAL INSTRUMENTS CONTINUEDThe below table illustrates the effects of hedge accounting on the consolidated statement of financial position and consolidated income statement through detailing separately by risk category and each type of hedge the details of the associated hedging instrument and hedged item.
2021 Current Current Non-current
Hedging risk strategy Cash flow hedges
Fair value hedges
Cash flow hedges
Notional/currency legs 1,427.7 804.8 126.5Carrying amount net assets/(liabilities) 2.3 (9.6) 3.0Maturity date to Dec 2022 to Jun 2022 to Jan 2026Hedge ratio 1:1 1:1 1:1Description of hedged item Highly
probable FX exposures
FX exposures on balance
sheet positions
Highly probable
FX exposuresChange in fair value of outstanding hedging instruments since 1 January 30.1 (8.2) 3.0Change in fair value of hedging item used to determine hedge effectiveness (30.1) 8.2 (3.0)Weighted average hedge rate of outstanding deals (AUD/JPY) 81.991 n/a (GBP/USD) 1.39Amounts recognised within net finance costs on profit and loss – (8.2) –Balance on cash flow hedge reserve (net of tax) at 31 December (3.2) – (3.0)
2020 Current Current Non-current
Hedging risk strategy Cash flow hedges
Fair Value Hedges –
Notional/currency legs 1,056.0 714.9 –
Carrying amount net liabilities (27.7) (1.4) –
Maturity date to Dec 2021 to Dec 2021 –
Hedge ratio 1:1 1:1 –
Description of hedged item Highly probable
FX exposures
FX exposures on balance
sheet positions –
Change in fair value of outstanding hedging instruments since 1 January (18.8) 0.8 –
Change in fair value of hedging item used to determine hedge effectiveness 18.8 (0.8) –
Weighted average hedge rate of outstanding deals (AUD/JPY) 76.691 n/a –
Amounts recognised within net finance costs on profit and loss – 0.8 –
Balance on cash flow hedge reserve (net of tax) at 31 December (20.1) – –
1. Outstanding deals predominantly relate to our business in Australia which purchases vehicles in Japanese yen.
i. Capital managementThe Group’s capital structure consists of equity and debt. Equity represents funds raised from shareholders and debt represents funds raised from banks and other financial institutions. The primary objective of the Group’s management of debt and equity is to ensure that it maintains a strong credit rating and healthy capital ratios in order to finance the Group’s activities, both now and in the future, and to maximise shareholder value.
The Group manages its capital structure and makes adjustments to it in light of changes in economic conditions. Due to the impact of Covid-19, some limited exceptions to policy are in place, to reflect the significant amount of cash the Group currently holds, to increase the counterparty risk limits set for certain counterparties.
To maintain or adjust the capital structure, the Group may adjust the dividend payment to shareholders, return capital to shareholders or issue new shares. The Directors consider the Group’s capital structure and dividend policy at least twice a year prior to the announcement of results, taking into account the Group’s ability to continue as a going concern and the requirements of its business plan.
INCHCAPE ANNUAL REPORT AND ACCOUNTS 2021 177
STRA
TEGIC
REPO
RTG
OV
ERN
AN
CE
FINA
NC
IAL STA
TEMEN
TS
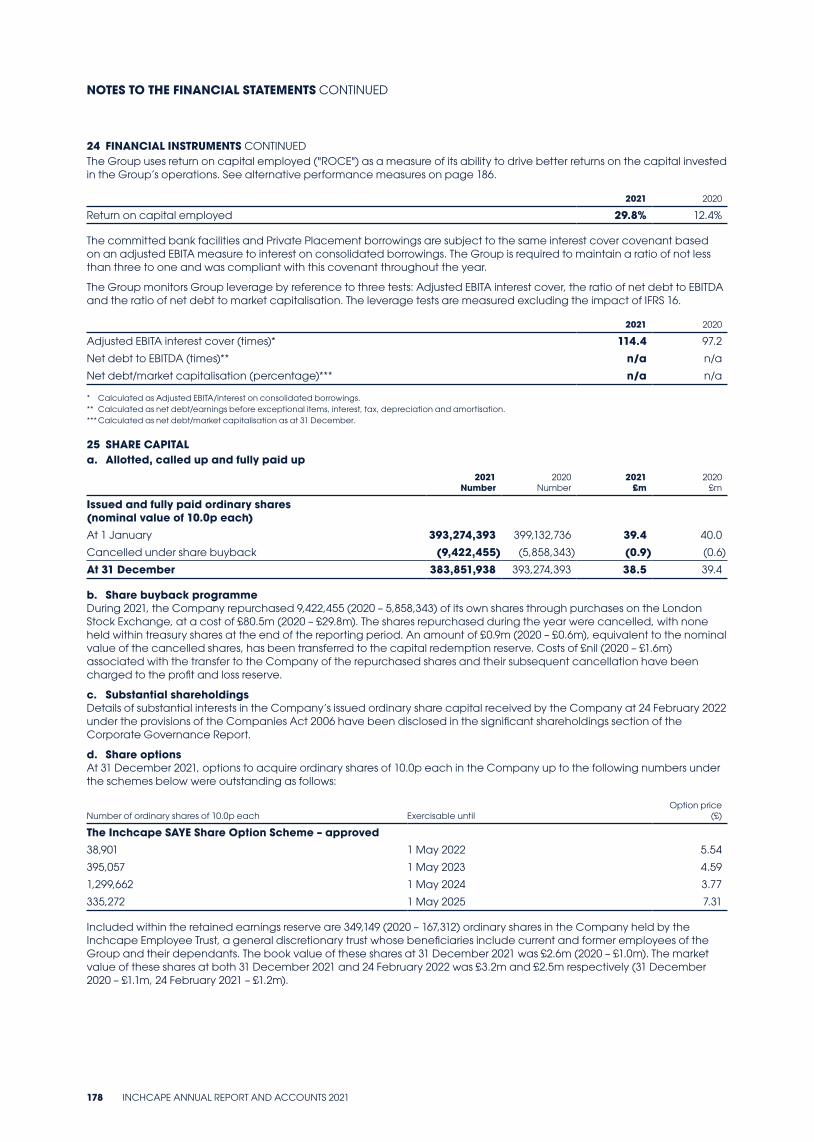
24 FINANCIAL INSTRUMENTS CONTINUEDThe Group uses return on capital employed ("ROCE") as a measure of its ability to drive better returns on the capital invested in the Group’s operations. See alternative performance measures on page 186.
2021 2020
Return on capital employed 29.8% 12.4%
The committed bank facilities and Private Placement borrowings are subject to the same interest cover covenant based on an adjusted EBITA measure to interest on consolidated borrowings. The Group is required to maintain a ratio of not less than three to one and was compliant with this covenant throughout the year.
The Group monitors Group leverage by reference to three tests: Adjusted EBITA interest cover, the ratio of net debt to EBITDA and the ratio of net debt to market capitalisation. The leverage tests are measured excluding the impact of IFRS 16.
2021 2020
Adjusted EBITA interest cover (times)* 114.4 97.2
Net debt to EBITDA (times)** n/a n/a
Net debt/market capitalisation (percentage)*** n/a n/a
* Calculated as Adjusted EBITA/interest on consolidated borrowings.** Calculated as net debt/earnings before exceptional items, interest, tax, depreciation and amortisation.*** Calculated as net debt/market capitalisation as at 31 December.
25 SHARE CAPITALa. Allotted, called up and fully paid up
2021 Number
2020 Number
2021 £m
2020 £m
Issued and fully paid ordinary shares (nominal value of 10.0p each)At 1 January 393,274,393 399,132,736 39.4 40.0
Cancelled under share buyback (9,422,455) (5,858,343) (0.9) (0.6)
At 31 December 383,851,938 393,274,393 38.5 39.4
b. Share buyback programmeDuring 2021, the Company repurchased 9,422,455 (2020 – 5,858,343) of its own shares through purchases on the London Stock Exchange, at a cost of £80.5m (2020 – £29.8m). The shares repurchased during the year were cancelled, with none held within treasury shares at the end of the reporting period. An amount of £0.9m (2020 – £0.6m), equivalent to the nominal value of the cancelled shares, has been transferred to the capital redemption reserve. Costs of £nil (2020 – £1.6m) associated with the transfer to the Company of the repurchased shares and their subsequent cancellation have been charged to the profit and loss reserve.
c. Substantial shareholdingsDetails of substantial interests in the Company’s issued ordinary share capital received by the Company at 24 February 2022 under the provisions of the Companies Act 2006 have been disclosed in the significant shareholdings section of the Corporate Governance Report.
d. Share optionsAt 31 December 2021, options to acquire ordinary shares of 10.0p each in the Company up to the following numbers under the schemes below were outstanding as follows:
Number of ordinary shares of 10.0p each Exercisable untilOption price
(£)
The Inchcape SAYE Share Option Scheme – approved38,901 1 May 2022 5.54
395,057 1 May 2023 4.59
1,299,662 1 May 2024 3.77
335,272 1 May 2025 7.31
Included within the retained earnings reserve are 349,149 (2020 – 167,312) ordinary shares in the Company held by the Inchcape Employee Trust, a general discretionary trust whose beneficiaries include current and former employees of the Group and their dependants. The book value of these shares at 31 December 2021 was £2.6m (2020 – £1.0m). The market value of these shares at both 31 December 2021 and 24 February 2022 was £3.2m and £2.5m respectively (31 December 2020 – £1.1m, 24 February 2021 – £1.2m).
NOTES TO THE FINANCIAL STATEMENTS CONTINUED
178 INCHCAPE ANNUAL REPORT AND ACCOUNTS 2021
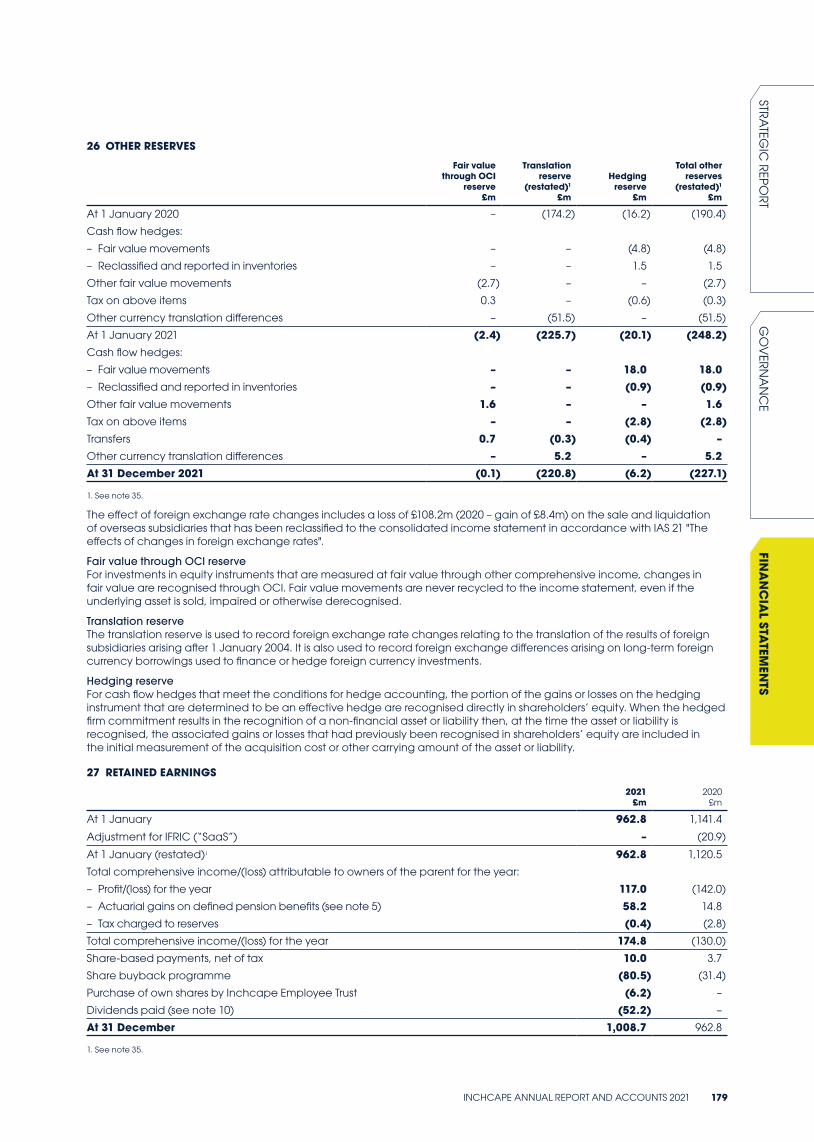
26 OTHER RESERVES
Fair value through OCI
reserve £m
Translation reserve
(restated)1 £m
Hedging reserve
£m
Total other reserves
(restated)1 £m
At 1 January 2020 – (174.2) (16.2) (190.4)
Cash flow hedges:
– Fair value movements – – (4.8) (4.8)
– Reclassified and reported in inventories – – 1.5 1.5
Other fair value movements (2.7) – – (2.7)
Tax on above items 0.3 – (0.6) (0.3)
Other currency translation differences – (51.5) – (51.5)
At 1 January 2021 (2.4) (225.7) (20.1) (248.2)Cash flow hedges:
– Fair value movements – – 18.0 18.0 – Reclassified and reported in inventories – – (0.9) (0.9)
Other fair value movements 1.6 – – 1.6Tax on above items – – (2.8) (2.8)Transfers 0.7 (0.3) (0.4) –Other currency translation differences – 5.2 – 5.2At 31 December 2021 (0.1) (220.8) (6.2) (227.1)
1. See note 35.
The effect of foreign exchange rate changes includes a loss of £108.2m (2020 – gain of £8.4m) on the sale and liquidation of overseas subsidiaries that has been reclassified to the consolidated income statement in accordance with IAS 21 "The effects of changes in foreign exchange rates".
Fair value through OCI reserveFor investments in equity instruments that are measured at fair value through other comprehensive income, changes in fair value are recognised through OCI. Fair value movements are never recycled to the income statement, even if the underlying asset is sold, impaired or otherwise derecognised.
Translation reserveThe translation reserve is used to record foreign exchange rate changes relating to the translation of the results of foreign subsidiaries arising after 1 January 2004. It is also used to record foreign exchange differences arising on long-term foreign currency borrowings used to finance or hedge foreign currency investments.
Hedging reserveFor cash flow hedges that meet the conditions for hedge accounting, the portion of the gains or losses on the hedging instrument that are determined to be an effective hedge are recognised directly in shareholders’ equity. When the hedged firm commitment results in the recognition of a non-financial asset or liability then, at the time the asset or liability is recognised, the associated gains or losses that had previously been recognised in shareholders’ equity are included in the initial measurement of the acquisition cost or other carrying amount of the asset or liability.
27 RETAINED EARNINGS
2021 £m
2020 £m
At 1 January 962.8 1,141.4
Adjustment for IFRIC (“SaaS”) – (20.9)
At 1 January (restated)1 962.8 1,120.5
Total comprehensive income/(loss) attributable to owners of the parent for the year:
– Profit/(loss) for the year 117.0 (142.0)
– Actuarial gains on defined pension benefits (see note 5) 58.2 14.8
– Tax charged to reserves (0.4) (2.8)
Total comprehensive income/(loss) for the year 174.8 (130.0)
Share-based payments, net of tax 10.0 3.7
Share buyback programme (80.5) (31.4)
Purchase of own shares by Inchcape Employee Trust (6.2) –
Dividends paid (see note 10) (52.2) –
At 31 December 1,008.7 962.8
1. See note 35.
INCHCAPE ANNUAL REPORT AND ACCOUNTS 2021 179
STRA
TEGIC
REPO
RTG
OV
ERN
AN
CE
FINA
NC
IAL STA
TEMEN
TS
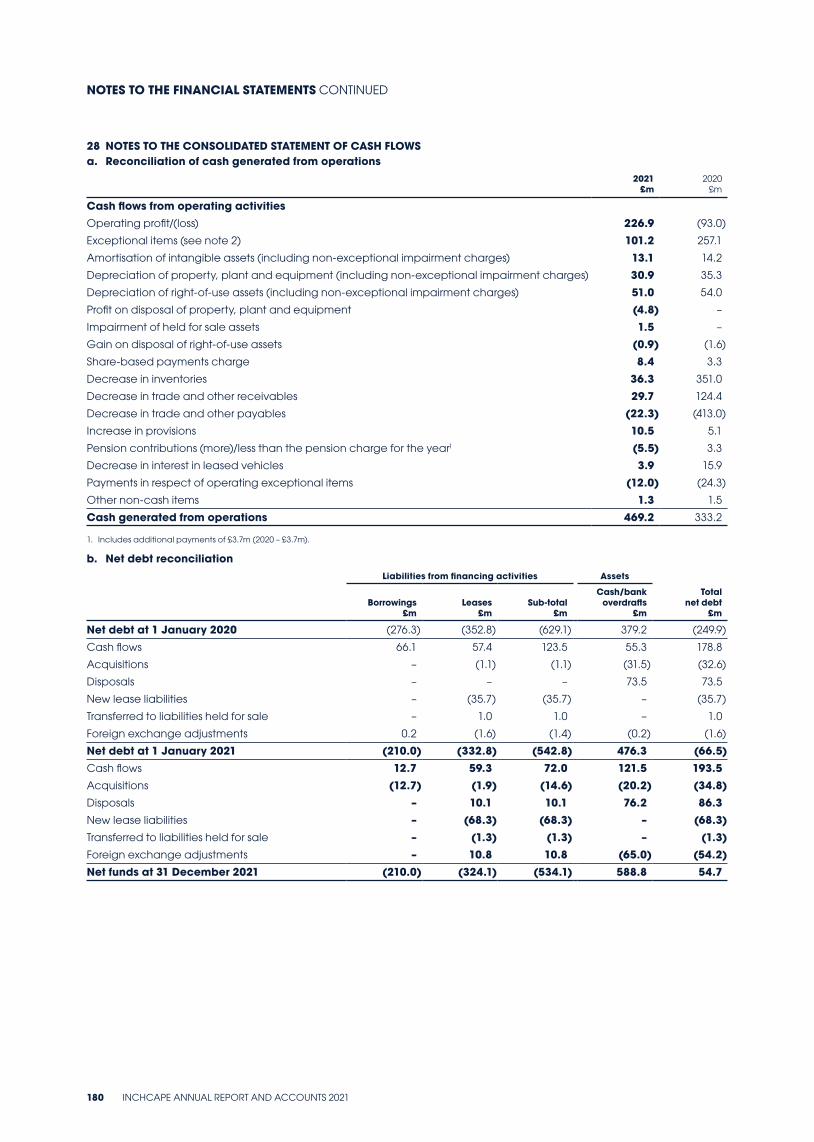
28 NOTES TO THE CONSOLIDATED STATEMENT OF CASH FLOWSa. Reconciliation of cash generated from operations
2021 £m
2020 £m
Cash flows from operating activities Operating profit/(loss) 226.9 (93.0)
Exceptional items (see note 2) 101.2 257.1
Amortisation of intangible assets (including non-exceptional impairment charges) 13.1 14.2
Depreciation of property, plant and equipment (including non-exceptional impairment charges) 30.9 35.3
Depreciation of right-of-use assets (including non-exceptional impairment charges) 51.0 54.0
Profit on disposal of property, plant and equipment (4.8) –
Impairment of held for sale assets 1.5 –
Gain on disposal of right-of-use assets (0.9) (1.6)
Share-based payments charge 8.4 3.3
Decrease in inventories 36.3 351.0
Decrease in trade and other receivables 29.7 124.4
Decrease in trade and other payables (22.3) (413.0)
Increase in provisions 10.5 5.1
Pension contributions (more)/less than the pension charge for the year1 (5.5) 3.3
Decrease in interest in leased vehicles 3.9 15.9
Payments in respect of operating exceptional items (12.0) (24.3)
Other non-cash items 1.3 1.5
Cash generated from operations 469.2 333.2
1. Includes additional payments of £3.7m (2020 – £3.7m).
b. Net debt reconciliationLiabilities from financing activities Assets
Borrowings £m
Leases £m
Sub-total £m
Cash/bank overdrafts
£m
Total net debt
£m
Net debt at 1 January 2020 (276.3) (352.8) (629.1) 379.2 (249.9)
Cash flows 66.1 57.4 123.5 55.3 178.8
Acquisitions – (1.1) (1.1) (31.5) (32.6)
Disposals – – – 73.5 73.5
New lease liabilities – (35.7) (35.7) – (35.7)
Transferred to liabilities held for sale – 1.0 1.0 – 1.0
Foreign exchange adjustments 0.2 (1.6) (1.4) (0.2) (1.6)
Net debt at 1 January 2021 (210.0) (332.8) (542.8) 476.3 (66.5)Cash flows 12.7 59.3 72.0 121.5 193.5Acquisitions (12.7) (1.9) (14.6) (20.2) (34.8)Disposals – 10.1 10.1 76.2 86.3New lease liabilities – (68.3) (68.3) – (68.3)Transferred to liabilities held for sale – (1.3) (1.3) – (1.3)Foreign exchange adjustments – 10.8 10.8 (65.0) (54.2)Net funds at 31 December 2021 (210.0) (324.1) (534.1) 588.8 54.7
NOTES TO THE FINANCIAL STATEMENTS CONTINUED
180 INCHCAPE ANNUAL REPORT AND ACCOUNTS 2021
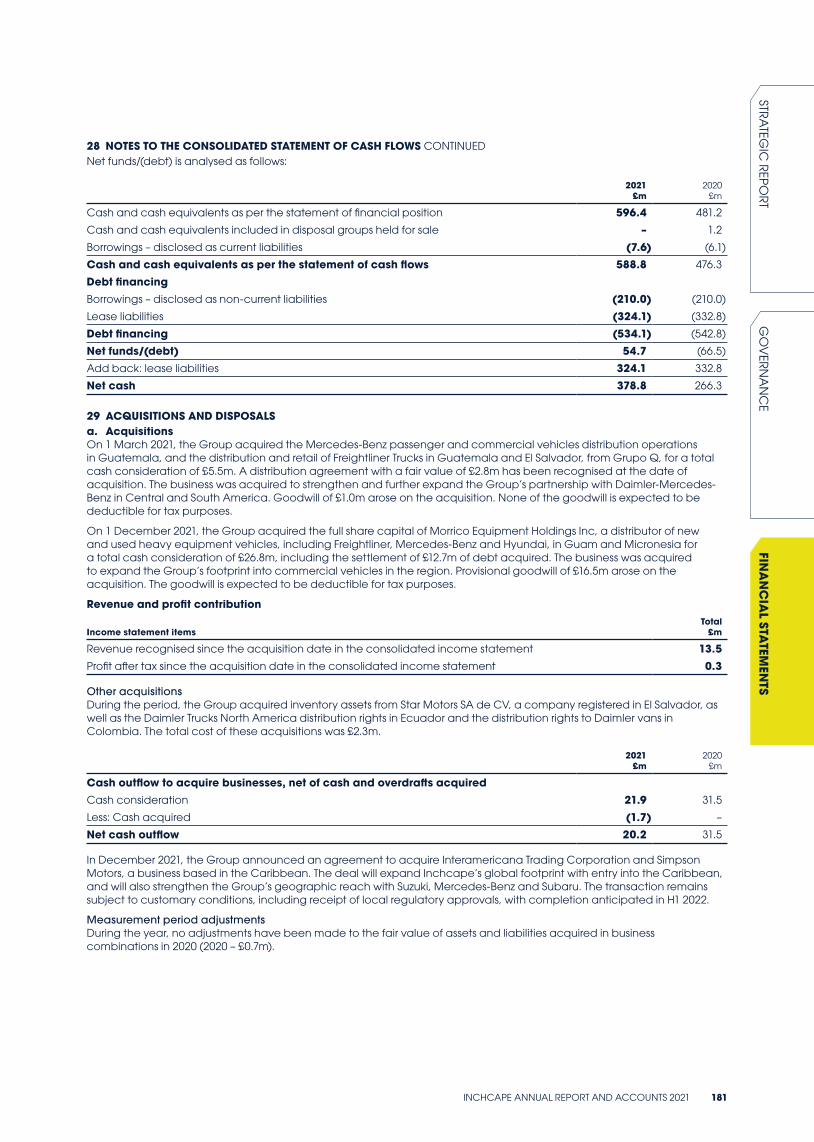
28 NOTES TO THE CONSOLIDATED STATEMENT OF CASH FLOWS CONTINUEDNet funds/(debt) is analysed as follows:
2021 £m
2020 £m
Cash and cash equivalents as per the statement of financial position 596.4 481.2
Cash and cash equivalents included in disposal groups held for sale – 1.2
Borrowings – disclosed as current liabilities (7.6) (6.1)
Cash and cash equivalents as per the statement of cash flows 588.8 476.3
Debt financingBorrowings – disclosed as non-current liabilities (210.0) (210.0)
Lease liabilities (324.1) (332.8)
Debt financing (534.1) (542.8)
Net funds/(debt) 54.7 (66.5)
Add back: lease liabilities 324.1 332.8
Net cash 378.8 266.3
29 ACQUISITIONS AND DISPOSALSa. AcquisitionsOn 1 March 2021, the Group acquired the Mercedes-Benz passenger and commercial vehicles distribution operations in Guatemala, and the distribution and retail of Freightliner Trucks in Guatemala and El Salvador, from Grupo Q, for a total cash consideration of £5.5m. A distribution agreement with a fair value of £2.8m has been recognised at the date of acquisition. The business was acquired to strengthen and further expand the Group’s partnership with Daimler-Mercedes-Benz in Central and South America. Goodwill of £1.0m arose on the acquisition. None of the goodwill is expected to be deductible for tax purposes.
On 1 December 2021, the Group acquired the full share capital of Morrico Equipment Holdings Inc, a distributor of new and used heavy equipment vehicles, including Freightliner, Mercedes-Benz and Hyundai, in Guam and Micronesia for a total cash consideration of £26.8m, including the settlement of £12.7m of debt acquired. The business was acquired to expand the Group’s footprint into commercial vehicles in the region. Provisional goodwill of £16.5m arose on the acquisition. The goodwill is expected to be deductible for tax purposes.
Revenue and profit contribution
Income statement itemsTotal
£m
Revenue recognised since the acquisition date in the consolidated income statement 13.5Profit after tax since the acquisition date in the consolidated income statement 0.3
Other acquisitionsDuring the period, the Group acquired inventory assets from Star Motors SA de CV, a company registered in El Salvador, as well as the Daimler Trucks North America distribution rights in Ecuador and the distribution rights to Daimler vans in Colombia. The total cost of these acquisitions was £2.3m.
2021 £m
2020 £m
Cash outflow to acquire businesses, net of cash and overdrafts acquiredCash consideration 21.9 31.5
Less: Cash acquired (1.7) –
Net cash outflow 20.2 31.5
In December 2021, the Group announced an agreement to acquire Interamericana Trading Corporation and Simpson Motors, a business based in the Caribbean. The deal will expand Inchcape’s global footprint with entry into the Caribbean, and will also strengthen the Group’s geographic reach with Suzuki, Mercedes-Benz and Subaru. The transaction remains subject to customary conditions, including receipt of local regulatory approvals, with completion anticipated in H1 2022.
Measurement period adjustmentsDuring the year, no adjustments have been made to the fair value of assets and liabilities acquired in business combinations in 2020 (2020 – £0.7m).
INCHCAPE ANNUAL REPORT AND ACCOUNTS 2021 181
STRA
TEGIC
REPO
RTG
OV
ERN
AN
CE
FINA
NC
IAL STA
TEMEN
TS
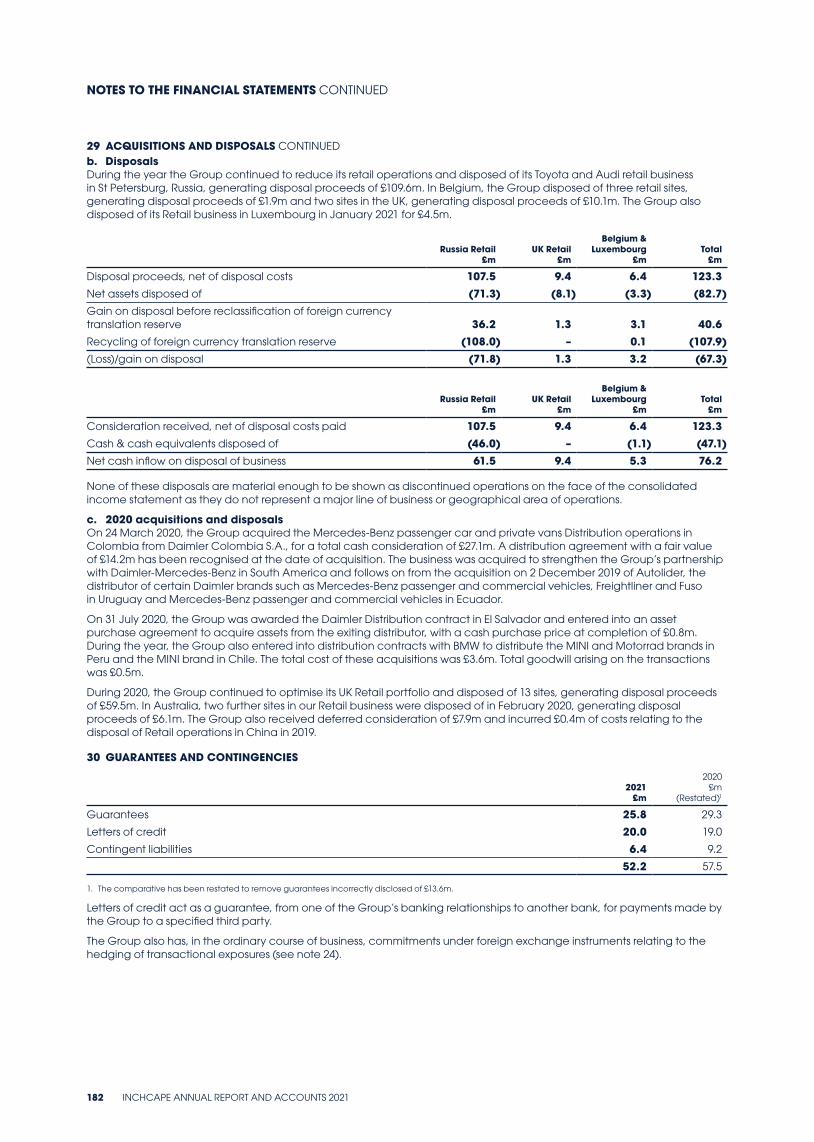
29 ACQUISITIONS AND DISPOSALS CONTINUEDb. DisposalsDuring the year the Group continued to reduce its retail operations and disposed of its Toyota and Audi retail business in St Petersburg, Russia, generating disposal proceeds of £109.6m. In Belgium, the Group disposed of three retail sites, generating disposal proceeds of £1.9m and two sites in the UK, generating disposal proceeds of £10.1m. The Group also disposed of its Retail business in Luxembourg in January 2021 for £4.5m.
Russia Retail £m
UK Retail £m
Belgium & Luxembourg
£m Total
£m
Disposal proceeds, net of disposal costs 107.5 9.4 6.4 123.3Net assets disposed of (71.3) (8.1) (3.3) (82.7)Gain on disposal before reclassification of foreign currency translation reserve 36.2 1.3 3.1 40.6Recycling of foreign currency translation reserve (108.0) – 0.1 (107.9)(Loss)/gain on disposal (71.8) 1.3 3.2 (67.3)
Russia Retail £m
UK Retail £m
Belgium & Luxembourg
£m Total
£m
Consideration received, net of disposal costs paid 107.5 9.4 6.4 123.3Cash & cash equivalents disposed of (46.0) – (1.1) (47.1)Net cash inflow on disposal of business 61.5 9.4 5.3 76.2
None of these disposals are material enough to be shown as discontinued operations on the face of the consolidated income statement as they do not represent a major line of business or geographical area of operations.
c. 2020 acquisitions and disposalsOn 24 March 2020, the Group acquired the Mercedes-Benz passenger car and private vans Distribution operations in Colombia from Daimler Colombia S.A., for a total cash consideration of £27.1m. A distribution agreement with a fair value of £14.2m has been recognised at the date of acquisition. The business was acquired to strengthen the Group’s partnership with Daimler-Mercedes-Benz in South America and follows on from the acquisition on 2 December 2019 of Autolider, the distributor of certain Daimler brands such as Mercedes-Benz passenger and commercial vehicles, Freightliner and Fuso in Uruguay and Mercedes-Benz passenger and commercial vehicles in Ecuador.
On 31 July 2020, the Group was awarded the Daimler Distribution contract in El Salvador and entered into an asset purchase agreement to acquire assets from the exiting distributor, with a cash purchase price at completion of £0.8m. During the year, the Group also entered into distribution contracts with BMW to distribute the MINI and Motorrad brands in Peru and the MINI brand in Chile. The total cost of these acquisitions was £3.6m. Total goodwill arising on the transactions was £0.5m.
During 2020, the Group continued to optimise its UK Retail portfolio and disposed of 13 sites, generating disposal proceeds of £59.5m. In Australia, two further sites in our Retail business were disposed of in February 2020, generating disposal proceeds of £6.1m. The Group also received deferred consideration of £7.9m and incurred £0.4m of costs relating to the disposal of Retail operations in China in 2019.
30 GUARANTEES AND CONTINGENCIES
2021 £m
2020 £m
(Restated)1
Guarantees 25.8 29.3
Letters of credit 20.0 19.0
Contingent liabilities 6.4 9.2
52.2 57.5
1. The comparative has been restated to remove guarantees incorrectly disclosed of £13.6m.
Letters of credit act as a guarantee, from one of the Group’s banking relationships to another bank, for payments made by the Group to a specified third party.
The Group also has, in the ordinary course of business, commitments under foreign exchange instruments relating to the hedging of transactional exposures (see note 24).
NOTES TO THE FINANCIAL STATEMENTS CONTINUED
182 INCHCAPE ANNUAL REPORT AND ACCOUNTS 2021
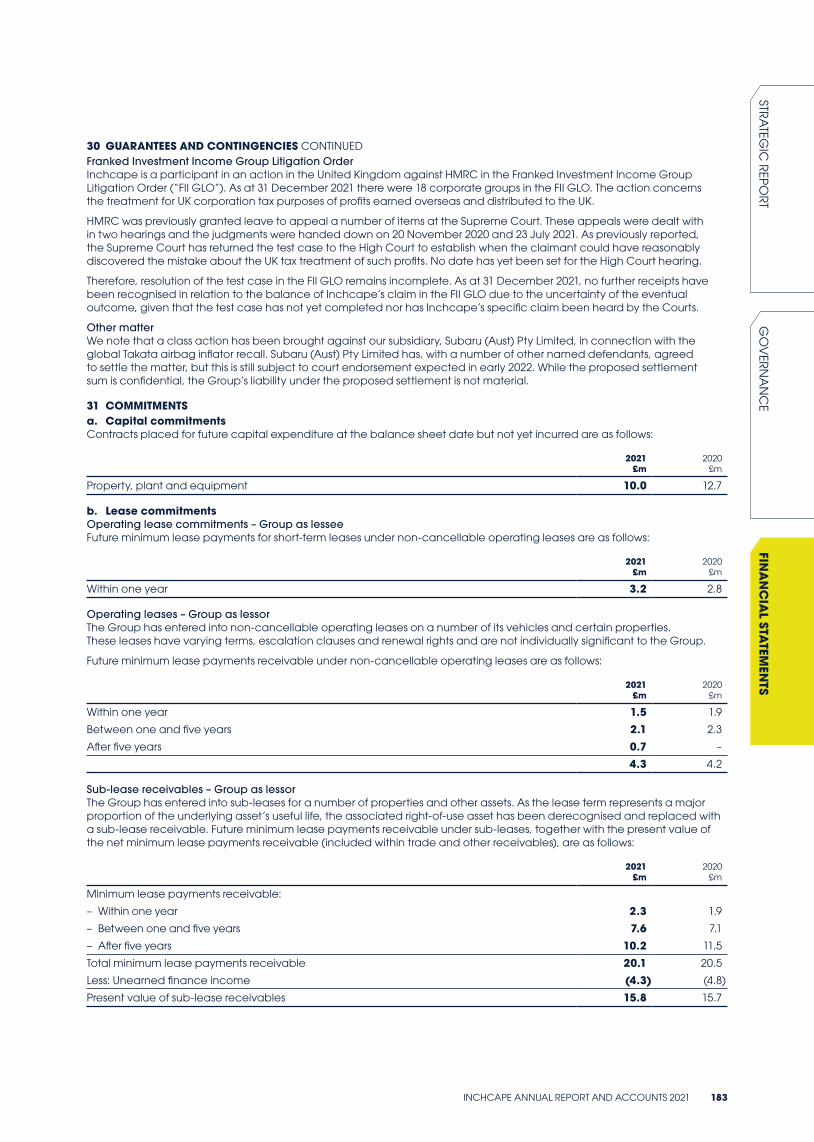
30 GUARANTEES AND CONTINGENCIES CONTINUEDFranked Investment Income Group Litigation OrderInchcape is a participant in an action in the United Kingdom against HMRC in the Franked Investment Income Group Litigation Order (“FII GLO”). As at 31 December 2021 there were 18 corporate groups in the FII GLO. The action concerns the treatment for UK corporation tax purposes of profits earned overseas and distributed to the UK.
HMRC was previously granted leave to appeal a number of items at the Supreme Court. These appeals were dealt with in two hearings and the judgments were handed down on 20 November 2020 and 23 July 2021. As previously reported, the Supreme Court has returned the test case to the High Court to establish when the claimant could have reasonably discovered the mistake about the UK tax treatment of such profits. No date has yet been set for the High Court hearing.
Therefore, resolution of the test case in the FII GLO remains incomplete. As at 31 December 2021, no further receipts have been recognised in relation to the balance of Inchcape’s claim in the FII GLO due to the uncertainty of the eventual outcome, given that the test case has not yet completed nor has Inchcape’s specific claim been heard by the Courts.
Other matterWe note that a class action has been brought against our subsidiary, Subaru (Aust) Pty Limited, in connection with the global Takata airbag inflator recall. Subaru (Aust) Pty Limited has, with a number of other named defendants, agreed to settle the matter, but this is still subject to court endorsement expected in early 2022. While the proposed settlement sum is confidential, the Group’s liability under the proposed settlement is not material.
31 COMMITMENTSa. Capital commitmentsContracts placed for future capital expenditure at the balance sheet date but not yet incurred are as follows:
2021 £m
2020 £m
Property, plant and equipment 10.0 12.7
b. Lease commitmentsOperating lease commitments – Group as lesseeFuture minimum lease payments for short-term leases under non-cancellable operating leases are as follows:
2021 £m
2020 £m
Within one year 3.2 2.8
Operating leases – Group as lessorThe Group has entered into non-cancellable operating leases on a number of its vehicles and certain properties. These leases have varying terms, escalation clauses and renewal rights and are not individually significant to the Group.
Future minimum lease payments receivable under non-cancellable operating leases are as follows:
2021 £m
2020 £m
Within one year 1.5 1.9
Between one and five years 2.1 2.3
After five years 0.7 –
4.3 4.2
Sub-lease receivables – Group as lessorThe Group has entered into sub-leases for a number of properties and other assets. As the lease term represents a major proportion of the underlying asset’s useful life, the associated right-of-use asset has been derecognised and replaced with a sub-lease receivable. Future minimum lease payments receivable under sub-leases, together with the present value of the net minimum lease payments receivable (included within trade and other receivables), are as follows:
2021 £m
2020 £m
Minimum lease payments receivable:
– Within one year 2.3 1.9
– Between one and five years 7.6 7.1
– After five years 10.2 11.5
Total minimum lease payments receivable 20.1 20.5
Less: Unearned finance income (4.3) (4.8)
Present value of sub-lease receivables 15.8 15.7
INCHCAPE ANNUAL REPORT AND ACCOUNTS 2021 183
STRA
TEGIC
REPO
RTG
OV
ERN
AN
CE
FINA
NC
IAL STA
TEMEN
TS
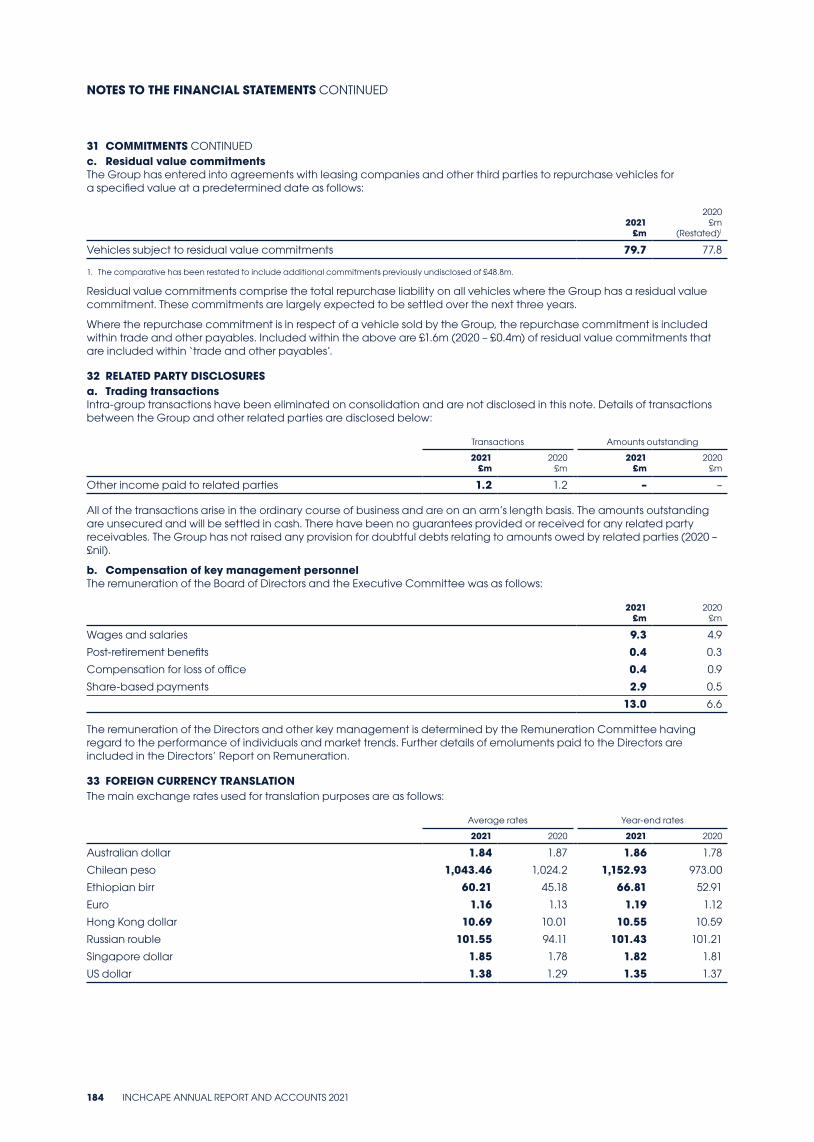
31 COMMITMENTS CONTINUEDc. Residual value commitmentsThe Group has entered into agreements with leasing companies and other third parties to repurchase vehicles for a specified value at a predetermined date as follows:
2021 £m
2020 £m
(Restated)1
Vehicles subject to residual value commitments 79.7 77.8
1. The comparative has been restated to include additional commitments previously undisclosed of £48.8m.
Residual value commitments comprise the total repurchase liability on all vehicles where the Group has a residual value commitment. These commitments are largely expected to be settled over the next three years.
Where the repurchase commitment is in respect of a vehicle sold by the Group, the repurchase commitment is included within trade and other payables. Included within the above are £1.6m (2020 – £0.4m) of residual value commitments that are included within ‘trade and other payables’.
32 RELATED PARTY DISCLOSURESa. Trading transactionsIntra-group transactions have been eliminated on consolidation and are not disclosed in this note. Details of transactions between the Group and other related parties are disclosed below:
Transactions Amounts outstanding
2021 £m
2020 £m
2021 £m
2020 £m
Other income paid to related parties 1.2 1.2 – –
All of the transactions arise in the ordinary course of business and are on an arm’s length basis. The amounts outstanding are unsecured and will be settled in cash. There have been no guarantees provided or received for any related party receivables. The Group has not raised any provision for doubtful debts relating to amounts owed by related parties (2020 – £nil).
b. Compensation of key management personnelThe remuneration of the Board of Directors and the Executive Committee was as follows:
2021 £m
2020 £m
Wages and salaries 9.3 4.9
Post-retirement benefits 0.4 0.3
Compensation for loss of office 0.4 0.9
Share-based payments 2.9 0.5
13.0 6.6
The remuneration of the Directors and other key management is determined by the Remuneration Committee having regard to the performance of individuals and market trends. Further details of emoluments paid to the Directors are included in the Directors’ Report on Remuneration.
33 FOREIGN CURRENCY TRANSLATIONThe main exchange rates used for translation purposes are as follows:
Average rates Year-end rates
2021 2020 2021 2020
Australian dollar 1.84 1.87 1.86 1.78
Chilean peso 1,043.46 1,024.2 1,152.93 973.00
Ethiopian birr 60.21 45.18 66.81 52.91
Euro 1.16 1.13 1.19 1.12
Hong Kong dollar 10.69 10.01 10.55 10.59
Russian rouble 101.55 94.11 101.43 101.21
Singapore dollar 1.85 1.78 1.82 1.81
US dollar 1.38 1.29 1.35 1.37
NOTES TO THE FINANCIAL STATEMENTS CONTINUED
184 INCHCAPE ANNUAL REPORT AND ACCOUNTS 2021
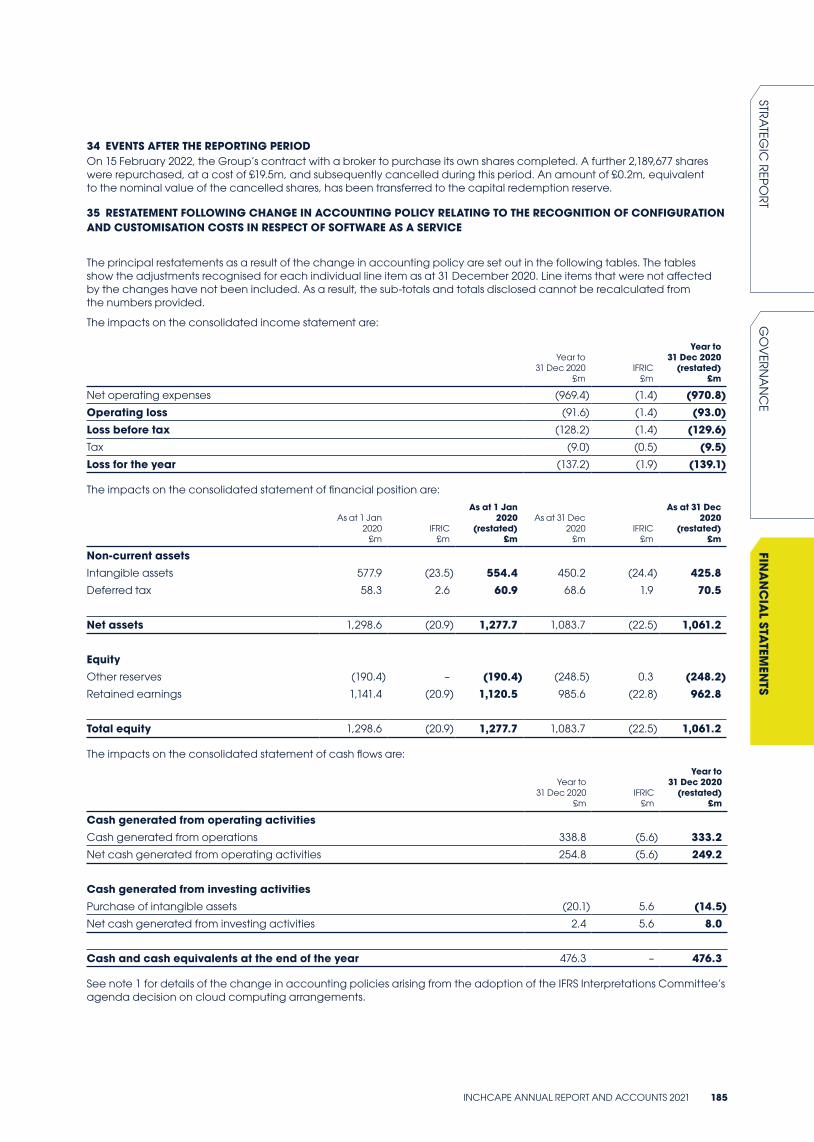
34 EVENTS AFTER THE REPORTING PERIODOn 15 February 2022, the Group’s contract with a broker to purchase its own shares completed. A further 2,189,677 shares were repurchased, at a cost of £19.5m, and subsequently cancelled during this period. An amount of £0.2m, equivalent to the nominal value of the cancelled shares, has been transferred to the capital redemption reserve.
35 RESTATEMENT FOLLOWING CHANGE IN ACCOUNTING POLICY RELATING TO THE RECOGNITION OF CONFIGURATION AND CUSTOMISATION COSTS IN RESPECT OF SOFTWARE AS A SERVICE
The principal restatements as a result of the change in accounting policy are set out in the following tables. The tables show the adjustments recognised for each individual line item as at 31 December 2020. Line items that were not affected by the changes have not been included. As a result, the sub-totals and totals disclosed cannot be recalculated from the numbers provided.
The impacts on the consolidated income statement are:
Year to 31 Dec 2020
£m
IFRIC
£m
Year to 31 Dec 2020
(restated) £m
Net operating expenses (969.4) (1.4) (970.8)Operating loss (91.6) (1.4) (93.0)Loss before tax (128.2) (1.4) (129.6)Tax (9.0) (0.5) (9.5)Loss for the year (137.2) (1.9) (139.1)
The impacts on the consolidated statement of financial position are:
As at 1 Jan 2020
£mIFRIC
£m
As at 1 Jan 2020
(restated) £m
As at 31 Dec 2020
£mIFRIC
£m
As at 31 Dec2020
(restated)£m
Non-current assetsIntangible assets 577.9 (23.5) 554.4 450.2 (24.4) 425.8Deferred tax 58.3 2.6 60.9 68.6 1.9 70.5
Net assets 1,298.6 (20.9) 1,277.7 1,083.7 (22.5) 1,061.2
EquityOther reserves (190.4) – (190.4) (248.5) 0.3 (248.2)Retained earnings 1,141.4 (20.9) 1,120.5 985.6 (22.8) 962.8
Total equity 1,298.6 (20.9) 1,277.7 1,083.7 (22.5) 1,061.2
The impacts on the consolidated statement of cash flows are:
Year to 31 Dec 2020
£m
IFRIC
£m
Year to 31 Dec 2020
(restated) £m
Cash generated from operating activitiesCash generated from operations 338.8 (5.6) 333.2Net cash generated from operating activities 254.8 (5.6) 249.2
Cash generated from investing activitiesPurchase of intangible assets (20.1) 5.6 (14.5)Net cash generated from investing activities 2.4 5.6 8.0
Cash and cash equivalents at the end of the year 476.3 – 476.3
See note 1 for details of the change in accounting policies arising from the adoption of the IFRS Interpretations Committee’s agenda decision on cloud computing arrangements.
INCHCAPE ANNUAL REPORT AND ACCOUNTS 2021 185
STRA
TEGIC
REPO
RTG
OV
ERN
AN
CE
FINA
NC
IAL STA
TEMEN
TS
ALTERNATIVE PERFORMANCE MEASURES (APMS)The Group assesses its performance using a variety of alternative performance measures which are not defined under International Financial Reporting Standards. These provide insight into how the Board and Executive Committee monitor the Group’s strategic and financial performance, and provide useful information on the trends, performance and position of the Group.
The Group’s income statement and segmental analysis identify separately adjusted measures and exceptional items. These adjusted measures reflect adjustments to IFRS measures. The Directors consider these adjusted measures to be an informative additional measure of the ongoing trading performance of the Group. Adjusted results are stated before exceptional items.
Exceptional items can include gains or losses on the disposal of businesses, restructuring of businesses, acquisition costs, asset impairments and the tax effects of these items. Exceptional items excluded from adjusted results can evolve from one financial period to the next depending on the nature of exceptional items or one off type activities.
Constant currencySome comparative performance measures are translated at constant exchange rates, called ‘constant currency’ measures. This restates the prior period results at a common exchange rate to the current period and therefore excludes the impact of changes in exchange rates used for translation.
Performance measure Definition Why we measure it
Gross profit before exceptional items
Gross profit before exceptional items. Refer to the consolidated income statement.
A key metric of the direct profit contribution from the Group’s revenue streams (e.g. Vehicles and Aftersales).
Operating profit before exceptional items
Operating profit before exceptional items. Refer to the consolidated income statement.
A key metric of the Group’s business performance.
Operating margin Operating profit (before exceptional items) divided by revenue.
A key metric of operational efficiency, ensuring that we are leveraging global scale to translate sales growth into profit.
Profit before tax and exceptional items
Represents the profit made after operating and interest expense excluding the impact of exceptional items and before tax is charged. Refer to consolidated income statement.
A key driver of delivering sustainable and growing earnings to shareholders.
Exceptional items Items that are charged or credited in the consolidated income statement which are material and non-recurring in nature. Refer to note 2.
The separate reporting of exceptional items helps provide additional useful information regarding the Group’s business performance and is consistent with the way that financial performance is measured by the Board and the Executive Committee.
Net capital expenditure
Cash outflows from the purchase of property, plant and equipment and intangible assets less the proceeds from the disposal of property, plant and equipment and intangible assets.
A measure of the net amount invested in operational facilities in the period.
Free cash flow Net cash flows from operating activities, before exceptional cash flows, less normalised net capital expenditure and dividends paid to non-controlling interests.
A key driver of the Group’s ability to ‘Invest to Accelerate Growth’ and to make distributions to shareholders.
Return on capital employed (ROCE)
Operating profit (before exceptional items) divided by the average of opening and closing capital employed, where capital employed is defined as net assets add net debt/less net funds.
ROCE is a measure of the Group’s ability to drive better returns for investors on the capital we invest.
Net funds/(debt) Cash and cash equivalents less borrowings and lease liabilities adjusted for the fair value of derivatives that hedge interest rate or currency risk on borrowings. Refer to note 28.
A measure of the Group’s net indebtedness that provides an indicator of the overall balance sheet strength.
Net cash Cash and cash equivalents less borrowings adjusted for the fair value of derivatives that hedge interest rate or currency risk on borrowings and before the incremental impact of IFRS 16 lease liabilities. Refer to note 28.
A measure of the Group’s net indebtedness that provides an indicator of the overall balance sheet strength and is widely used by external parties.
Constant currency % change
Presentation of reported results compared to prior period translated using constant rates of exchange.
A measure of business performance which excludes the impact of changes in exchange rates used for translation.
Organic growth Organic growth is defined as sales growth in operations that have been open for at least a year at constant foreign exchange rate.
A measure of underlying business performance which excludes the impact of acquisition and disposals in the period.
ALTERNATIVE PERFORMANCE MEASURES
186 INCHCAPE ANNUAL REPORT AND ACCOUNTS 2021
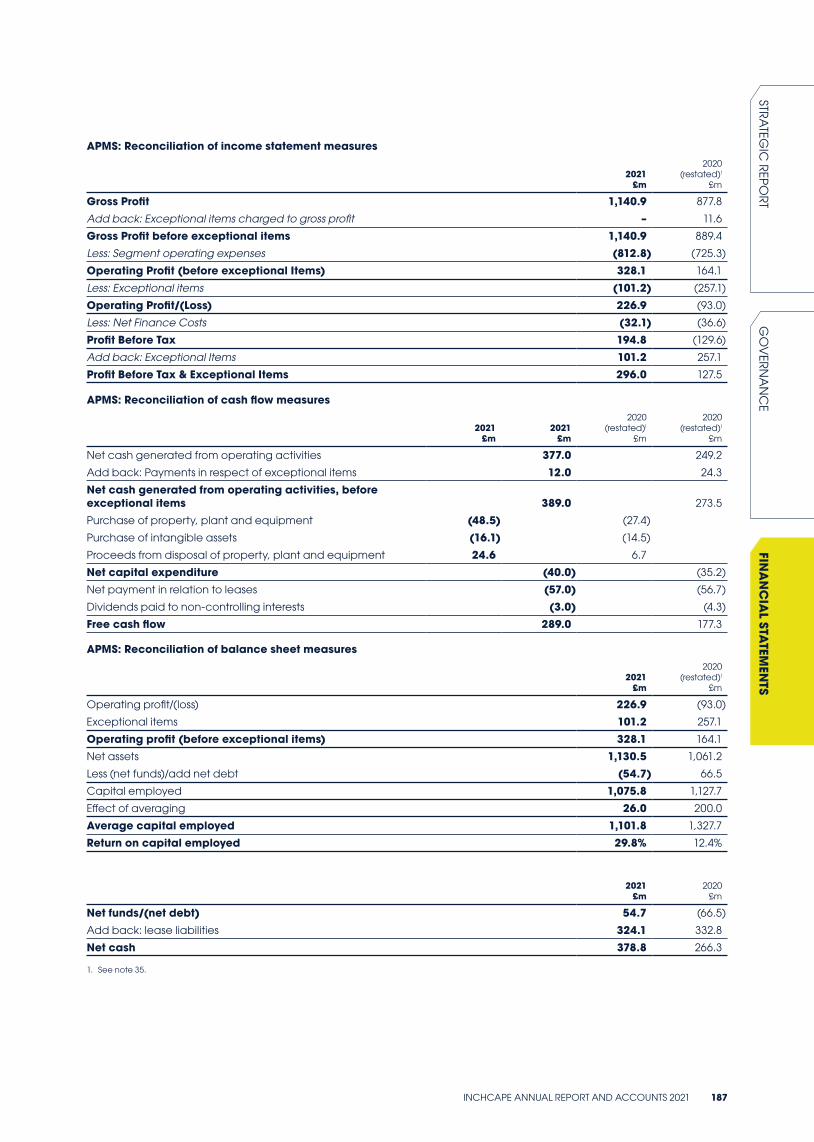
APMS: Reconciliation of income statement measures
2021 £m
2020(restated)!
£m
Gross Profit 1,140.9 877.8
Add back: Exceptional items charged to gross profit – 11.6
Gross Profit before exceptional items 1,140.9 889.4
Less: Segment operating expenses (812.8) (725.3)
Operating Profit (before exceptional Items) 328.1 164.1
Less: Exceptional items (101.2) (257.1)
Operating Profit/(Loss) 226.9 (93.0)
Less: Net Finance Costs (32.1) (36.6)
Profit Before Tax 194.8 (129.6)
Add back: Exceptional Items 101.2 257.1
Profit Before Tax & Exceptional Items 296.0 127.5
APMS: Reconciliation of cash flow measures
2021 £m
2021 £m
2020 (restated)!
£m
2020 (restated)!
£m
Net cash generated from operating activities 377.0 249.2
Add back: Payments in respect of exceptional items 12.0 24.3
Net cash generated from operating activities, before exceptional items 389.0 273.5
Purchase of property, plant and equipment (48.5) (27.4)
Purchase of intangible assets (16.1) (14.5)
Proceeds from disposal of property, plant and equipment 24.6 6.7
Net capital expenditure (40.0) (35.2)
Net payment in relation to leases (57.0) (56.7)
Dividends paid to non-controlling interests (3.0) (4.3)
Free cash flow 289.0 177.3
APMS: Reconciliation of balance sheet measures
2021 £m
2020 (restated)!
£m
Operating profit/(loss) 226.9 (93.0)
Exceptional items 101.2 257.1
Operating profit (before exceptional items) 328.1 164.1
Net assets 1,130.5 1,061.2
Less (net funds)/add net debt (54.7) 66.5
Capital employed 1,075.8 1,127.7
Effect of averaging 26.0 200.0
Average capital employed 1,101.8 1,327.7
Return on capital employed 29.8% 12.4%
2021 £m
2020 £m
Net funds/(net debt) 54.7 (66.5)
Add back: lease liabilities 324.1 332.8
Net cash 378.8 266.3
1. See note 35.
INCHCAPE ANNUAL REPORT AND ACCOUNTS 2021 187
STRA
TEGIC
REPO
RTG
OV
ERN
AN
CE
FINA
NC
IAL STA
TEMEN
TS
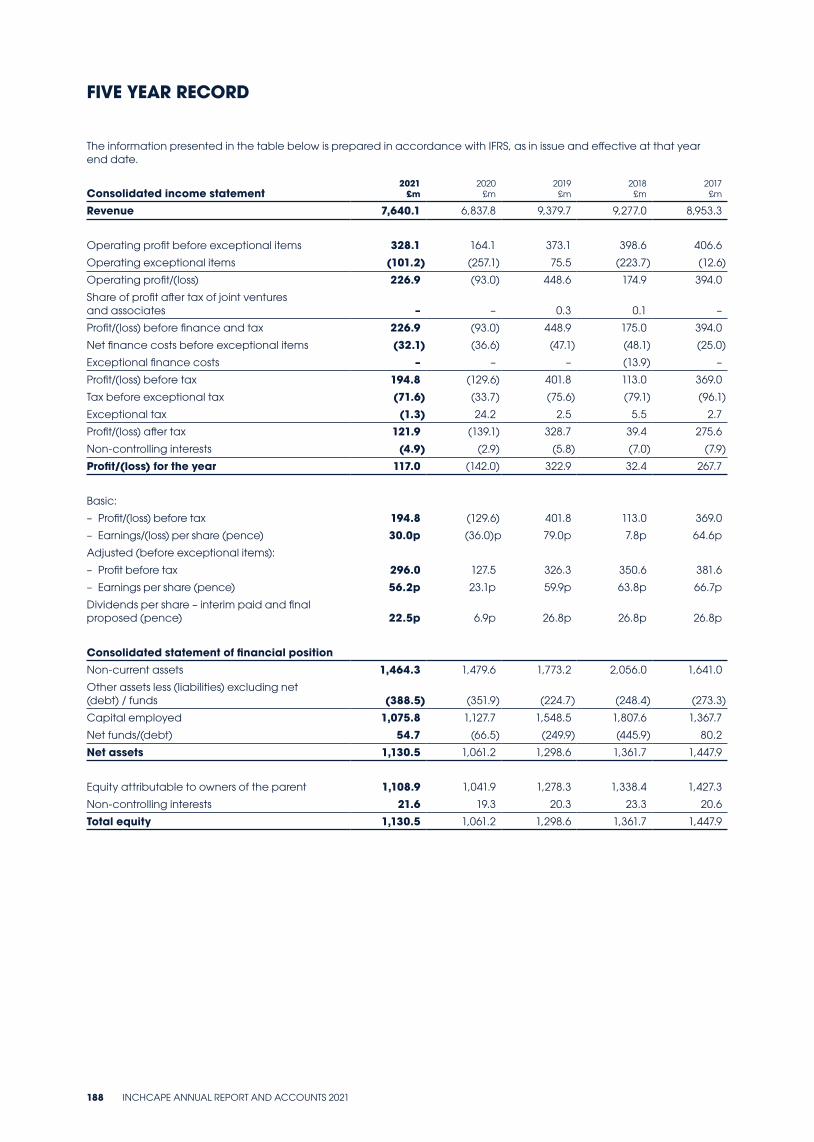
The information presented in the table below is prepared in accordance with IFRS, as in issue and effective at that year end date.
Consolidated income statement2021
£m 2020
£m 2019
£m 2018
£m 2017
£m
Revenue 7,640.1 6,837.8 9,379.7 9,277.0 8,953.3
Operating profit before exceptional items 328.1 164.1 373.1 398.6 406.6
Operating exceptional items (101.2) (257.1) 75.5 (223.7) (12.6)
Operating profit/(loss) 226.9 (93.0) 448.6 174.9 394.0
Share of profit after tax of joint ventures and associates – – 0.3 0.1 –
Profit/(loss) before finance and tax 226.9 (93.0) 448.9 175.0 394.0
Net finance costs before exceptional items (32.1) (36.6) (47.1) (48.1) (25.0)
Exceptional finance costs – – – (13.9) –
Profit/(loss) before tax 194.8 (129.6) 401.8 113.0 369.0
Tax before exceptional tax (71.6) (33.7) (75.6) (79.1) (96.1)
Exceptional tax (1.3) 24.2 2.5 5.5 2.7
Profit/(loss) after tax 121.9 (139.1) 328.7 39.4 275.6
Non-controlling interests (4.9) (2.9) (5.8) (7.0) (7.9)
Profit/(loss) for the year 117.0 (142.0) 322.9 32.4 267.7
Basic:
– Profit/(loss) before tax 194.8 (129.6) 401.8 113.0 369.0
– Earnings/(loss) per share (pence) 30.0p (36.0)p 79.0p 7.8p 64.6p
Adjusted (before exceptional items):
– Profit before tax 296.0 127.5 326.3 350.6 381.6
– Earnings per share (pence) 56.2p 23.1p 59.9p 63.8p 66.7p
Dividends per share – interim paid and final proposed (pence) 22.5p 6.9p 26.8p 26.8p 26.8p
Consolidated statement of financial positionNon-current assets 1,464.3 1,479.6 1,773.2 2,056.0 1,641.0
Other assets less (liabilities) excluding net (debt) / funds (388.5) (351.9) (224.7) (248.4) (273.3)
Capital employed 1,075.8 1,127.7 1,548.5 1,807.6 1,367.7
Net funds/(debt) 54.7 (66.5) (249.9) (445.9) 80.2
Net assets 1,130.5 1,061.2 1,298.6 1,361.7 1,447.9
Equity attributable to owners of the parent 1,108.9 1,041.9 1,278.3 1,338.4 1,427.3
Non-controlling interests 21.6 19.3 20.3 23.3 20.6
Total equity 1,130.5 1,061.2 1,298.6 1,361.7 1,447.9
FIVE YEAR RECORD
188 INCHCAPE ANNUAL REPORT AND ACCOUNTS 2021
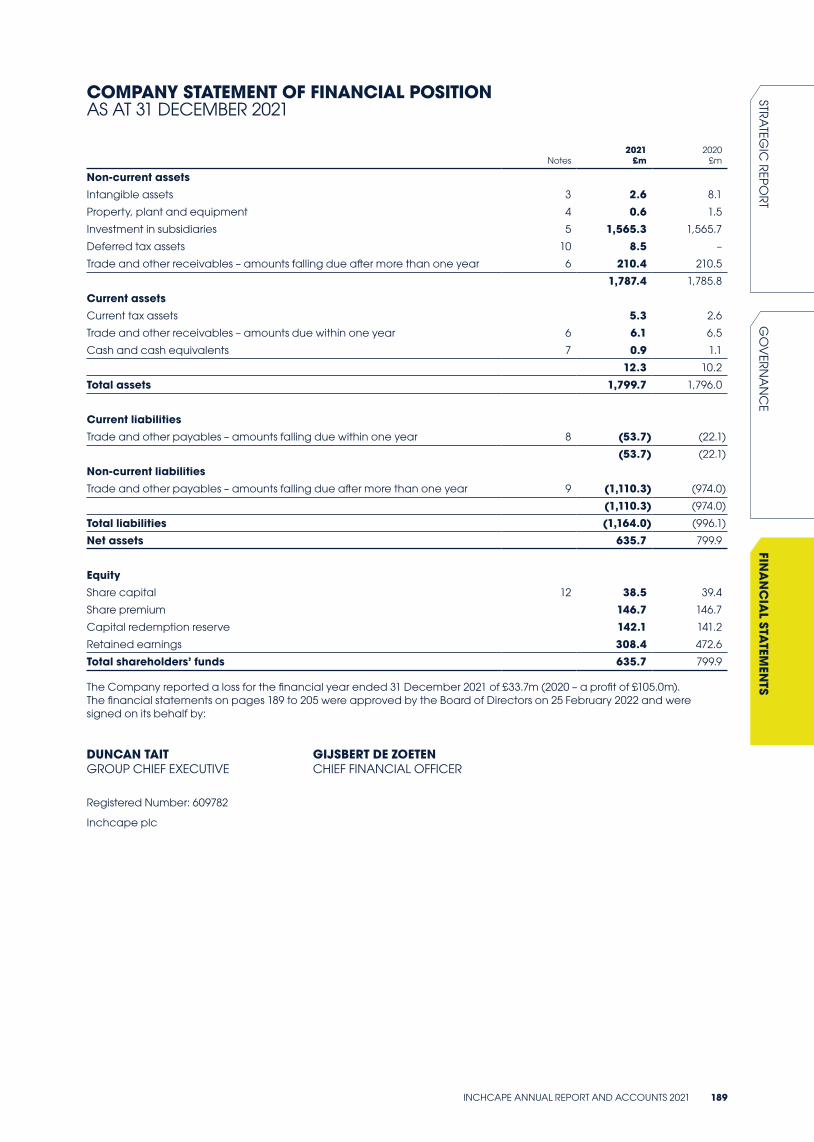
Notes2021
£m2020
£m
Non-current assetsIntangible assets 3 2.6 8.1
Property, plant and equipment 4 0.6 1.5
Investment in subsidiaries 5 1,565.3 1,565.7
Deferred tax assets 10 8.5 –
Trade and other receivables – amounts falling due after more than one year 6 210.4 210.5
1,787.4 1,785.8
Current assetsCurrent tax assets 5.3 2.6
Trade and other receivables – amounts due within one year 6 6.1 6.5
Cash and cash equivalents 7 0.9 1.1
12.3 10.2
Total assets 1,799.7 1,796.0
Current liabilitiesTrade and other payables – amounts falling due within one year 8 (53.7) (22.1)
(53.7) (22.1)
Non-current liabilitiesTrade and other payables – amounts falling due after more than one year 9 (1,110.3) (974.0)
(1,110.3) (974.0)
Total liabilities (1,164.0) (996.1)
Net assets 635.7 799.9
EquityShare capital 12 38.5 39.4
Share premium 146.7 146.7
Capital redemption reserve 142.1 141.2
Retained earnings 308.4 472.6
Total shareholders’ funds 635.7 799.9
The Company reported a loss for the financial year ended 31 December 2021 of £33.7m (2020 – a profit of £105.0m). The financial statements on pages 189 to 205 were approved by the Board of Directors on 25 February 2022 and were signed on its behalf by:
DUNCAN TAIT GIJSBERT DE ZOETENGROUP CHIEF EXECUTIVE CHIEF FINANCIAL OFFICER
Registered Number: 609782
Inchcape plc
COMPANY STATEMENT OF FINANCIAL POSITION AS AT 31 DECEMBER 2021
INCHCAPE ANNUAL REPORT AND ACCOUNTS 2021 189
STRA
TEGIC
REPO
RTG
OV
ERN
AN
CE
FINA
NC
IAL STA
TEMEN
TS
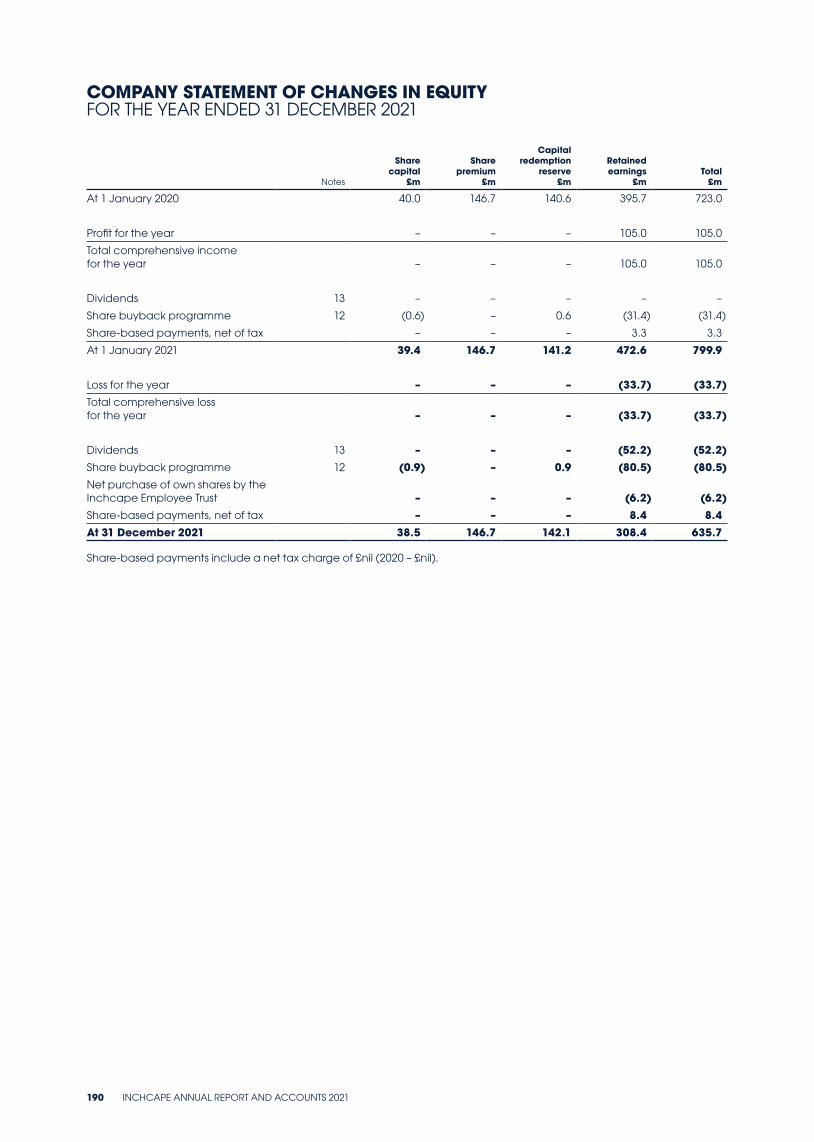
Notes
Share capital
£m
Share premium
£m
Capital redemption
reserve £m
Retained earnings
£mTotal
£m
At 1 January 2020 40.0 146.7 140.6 395.7 723.0
Profit for the year – – – 105.0 105.0
Total comprehensive income for the year – – – 105.0 105.0
Dividends 13 – – – – –
Share buyback programme 12 (0.6) – 0.6 (31.4) (31.4)
Share-based payments, net of tax – – – 3.3 3.3
At 1 January 2021 39.4 146.7 141.2 472.6 799.9
Loss for the year – – – (33.7) (33.7)Total comprehensive loss for the year – – – (33.7) (33.7)
Dividends 13 – – – (52.2) (52.2)Share buyback programme 12 (0.9) – 0.9 (80.5) (80.5)Net purchase of own shares by the Inchcape Employee Trust – – – (6.2) (6.2)Share-based payments, net of tax – – – 8.4 8.4At 31 December 2021 38.5 146.7 142.1 308.4 635.7
Share-based payments include a net tax charge of £nil (2020 – £nil).
COMPANY STATEMENT OF CHANGES IN EQUITY FOR THE YEAR ENDED 31 DECEMBER 2021
190 INCHCAPE ANNUAL REPORT AND ACCOUNTS 2021
GENERAL INFORMATIONThese financial statements are prepared for Inchcape plc (the Company) for the year ended 31 December 2021. The Company is the ultimate parent entity of the Inchcape Group (the Group) and acts as the holding company of the Group.
BASIS OF PREPARATIONThese financial statements were prepared in accordance with Financial Reporting Standard 101 Reduced Disclosure Framework (FRS 101).
The financial statements are prepared under the historical cost convention in accordance with the Companies Act 2006. As permitted by Section 408 of the Companies Act 2006, no separate profit and loss account or statement of comprehensive income is presented for the Company.
The Company does not have any critical accounting judgements. The valuation of the Company’s investments is a key source of estimation uncertainty. The Company’s net assets were lower than its market capitalisation on 31 December 2021 and the estimates of the recoverable amounts of the individual investments were in excess of their carrying values. As a result, no impairment has been reflected. Other sources of estimation uncertainty most applicable to the Company do not give rise to a significant risk of material adjustment to the carrying value of the Company’s assets and liabilities.
The Directors of Inchcape plc manage the Group’s risks at a group level rather than an individual business unit or company level. Further information on these risks and uncertainties, in the context of the Group as a whole, are included within the Group disclosures on pages 48 to 56.
The following exemptions from the requirements of IFRS have been applied in the preparation of these financial statements, in accordance with FRS 101:
• Paragraphs 45(b) and 46 to 52 of IFRS 2, ‘Share-based payment’ (details of the number and weighted average exercise price of share options, and how the fair value of goods and services received was determined)
• IFRS 7, ‘Financial Instruments: Disclosures’• Paragraphs 91 to 99 of IFRS 13, ‘Fair value measurement’ (disclosure of valuation techniques and inputs used for fair value
measurement of assets and liabilities)• Paragraph 38 of IAS 1, ‘Presentation of financial statements’ comparative information requirements in respect of:
– paragraph 73(e) of IAS 16, ‘Property, plant and equipment’; – paragraph 118(e) of IAS 38, ‘Intangible assets’ (reconciliations between the carrying amount at the beginning and
end of the period)• The following paragraphs of IAS 1, ‘Presentation of financial statements’:
– 10(d) (statement of cash flows), – 10(f) (a statement of financial position as at the beginning of the preceding period when an entity applies an
accounting policy retrospectively or makes a retrospective restatement of items in its financial statements, or when it reclassifies items in its financial statements),
– 16 (statement of compliance with all IFRS), – 38A (requirement for minimum of two primary statements, including cash flow statements), – 38B-D (additional comparative information), – 40A-D (requirements for a third statement of financial position), – 111 (cash flow statement information), and – 134-136 (capital management disclosures)
• IAS 7, ‘Statement of cash flows’• Paragraph 30 and 31 of IAS 8, ‘Accounting policies, changes in accounting estimates and errors’ (requirement for
the disclosure of information when an entity has not applied a new IFRS that has been issued but is not yet effective)• Paragraph 17 of IAS 24, ‘Related party disclosures’ (key management compensation)• The requirements in IAS 24, ‘Related party disclosures’ to disclose related party transactions entered into between
two or more members of a group.
ACCOUNTING POLICIES
INCHCAPE ANNUAL REPORT AND ACCOUNTS 2021 191
STRA
TEGIC
REPO
RTG
OV
ERN
AN
CE
FINA
NC
IAL STA
TEMEN
TS
ACCOUNTING POLICIES CONTINUED
GOING CONCERNHaving assessed the principal risks and the other matters discussed in connection with the viability statement, the Directors have considered it appropriate to adopt the going concern basis of accounting in preparing the financial statements, as described in the Directors’ Report of the consolidated Group Financial Statements.
FOREIGN CURRENCIESTransactions in foreign currencies are translated into the functional currency at the rates of exchange prevailing at the dates of the individual transactions. Monetary assets and liabilities in foreign currencies are translated into sterling at closing rates of exchange and differences are taken to the income statement.
FINANCE COSTSFinance costs consist of interest payable on the Private Placement borrowing. Costs are recognised as an expense, calculated using the effective interest rate method, in the period in which they are incurred.
INVESTMENTSInvestments in subsidiaries are stated at cost, less provisions for impairment.
IMPAIRMENTThe Company’s accounting policies in respect of impairment of property, plant and equipment, intangible assets and financial assets are consistent with those of the Group. The carrying values of investments in subsidiary undertakings are reviewed at each reporting date to determine whether there is any indication of impairment. If any such indication exists, then the asset’s recoverable amount is estimated.
The Company’s impairment policies in relation to financial assets are consistent with those of the Group, with additional consideration given to amounts owed by Group undertakings. Any provision for impairment of receivables is based on lifetime expected credit losses. Lifetime expected credit losses are calculated by assessing historical credit loss experience, adjusted for factors specific to the receivable and company.
OTHER INTANGIBLE ASSETSIntangible assets, when acquired separately from a business (including computer software), are carried at cost less accumulated amortisation and impairment losses. Costs comprise purchase price from third parties as well as internally generated development costs where relevant. Amortisation is provided on a straight-line basis to allocate the cost of the asset over its estimated useful life, which in the case of computer software is between five and eight years. Software customisation and configuration costs relating to software not controlled by the Group are expensed over the period such services are received.
PROPERTY, PLANT AND EQUIPMENTProperty, plant and equipment is stated at cost less accumulated depreciation and impairment losses. Cost comprises the purchase price and directly attributable costs of the asset and includes, where relevant, capitalised borrowing costs. Depreciation is provided on a straight-line basis to allocate the cost of the asset over its estimated useful life, which in the case of computer hardware is five years.
DEFERRED TAXDeferred income tax is accounted for using the liability method in respect of temporary differences arising from differences between the tax bases of assets and liabilities and their carrying amounts in the financial statements.
Deferred tax liabilities are recognised for all taxable temporary differences and deferred tax assets are recognised to the extent that it is probable that taxable profits will be available against which deductible temporary differences can be utilised. Such assets and liabilities are not recognised if the temporary difference is due to goodwill arising on a business combination, or to an asset or liability, the initial recognition of which does not affect either taxable or accounting income.
Deferred tax liabilities are recognised for taxable temporary differences arising on investments in subsidiaries, except where the Company is able to control the reversal of the temporary difference and it is probable that the temporary difference will not reverse in the foreseeable future.
Deferred tax is calculated at the tax rates that are expected to apply to the period when the asset is realised or the liability is settled using rates enacted or substantively enacted at the end of the reporting period. Deferred tax is charged or credited in the income statement, except when it relates to items credited or charged directly to shareholders’ equity, in which case the deferred tax is also dealt with in shareholders’ equity.
Deferred tax assets and liabilities are only offset where there is a legally enforceable right of offset and there is an intention to settle balances net.
192 INCHCAPE ANNUAL REPORT AND ACCOUNTS 2021
SHARE CAPITALOrdinary shares are classified as equity.
Where the Company purchases its own equity share capital (treasury shares), the consideration paid is deducted from shareholders’ funds until the shares are cancelled, reissued or disposed of. Where such shares are subsequently sold or reissued, any consideration received is included in shareholders’ funds.
DIVIDENDSFinal dividends proposed by the Board of Directors and unpaid at the year-end are not recognised in the financial statements until they have been approved by the shareholders at the Annual General Meeting. Interim dividends are recognised when they are paid.
SHARE-BASED PAYMENTSThe Company operates various share-based award schemes. The fair value at the date at which the share-based awards are granted is recognised in the income statement (together with a corresponding credit in shareholders’ equity) on a straight-line basis over the vesting period, based on an estimate of the number of shares that will eventually vest. At the end of each reporting period, the Company revises its estimates of the number of awards that are expected to vest. The impact of any revision is recognised in the income statement with a corresponding adjustment to equity.
For equity-settled share-based awards, the services received from employees are measured by reference to the fair value of the awards granted. With the exception of the Save As You Earn scheme, the vesting of all share-based awards under all schemes is solely reliant upon non-market conditions, therefore no expense is recognised for awards that do not ultimately vest. Where an employee cancels a Save As You Earn award, the charge for that award is recognised as an expense immediately, even though the award does not vest.
The issue of shares by the Company to employees of its subsidiaries represents additional capital contributions. When these costs are recharged to the subsidiary undertaking, the investment balance is reduced accordingly.
FINANCIAL INSTRUMENTSThe Company’s policies on the recognition, measurement and presentation of financial instruments under IFRS 7 are the same as those set out in the Group’s accounting policies on pages 125 to 135.
INCHCAPE ANNUAL REPORT AND ACCOUNTS 2021 193
STRA
TEGIC
REPO
RTG
OV
ERN
AN
CE
FINA
NC
IAL STA
TEMEN
TS
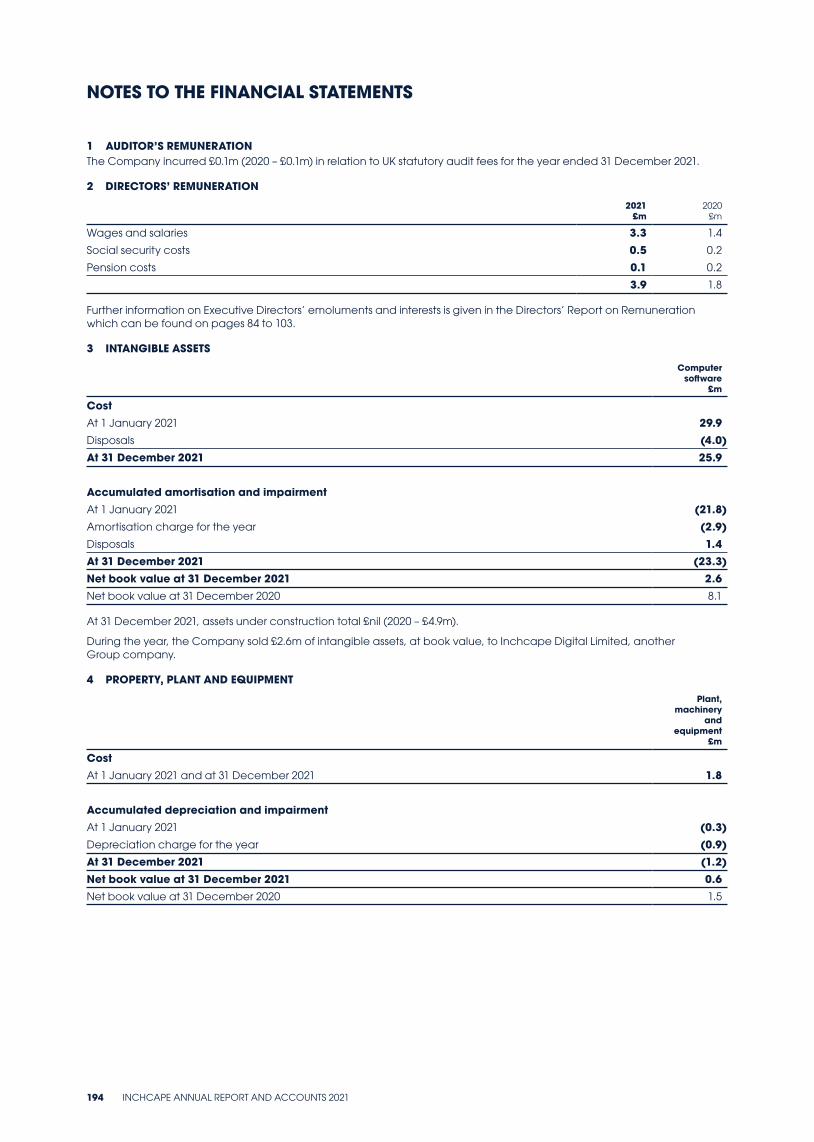
NOTES TO THE FINANCIAL STATEMENTS
1 AUDITOR’S REMUNERATIONThe Company incurred £0.1m (2020 – £0.1m) in relation to UK statutory audit fees for the year ended 31 December 2021.
2 DIRECTORS’ REMUNERATION
2021 £m
2020 £m
Wages and salaries 3.3 1.4
Social security costs 0.5 0.2
Pension costs 0.1 0.2
3.9 1.8
Further information on Executive Directors’ emoluments and interests is given in the Directors’ Report on Remuneration which can be found on pages 84 to 103.
3 INTANGIBLE ASSETS
Computer software
£m
CostAt 1 January 2021 29.9Disposals (4.0)At 31 December 2021 25.9
Accumulated amortisation and impairmentAt 1 January 2021 (21.8)Amortisation charge for the year (2.9)Disposals 1.4At 31 December 2021 (23.3)Net book value at 31 December 2021 2.6Net book value at 31 December 2020 8.1
At 31 December 2021, assets under construction total £nil (2020 – £4.9m).
During the year, the Company sold £2.6m of intangible assets, at book value, to Inchcape Digital Limited, another Group company.
4 PROPERTY, PLANT AND EQUIPMENT
Plant, machinery
and equipment
£m
CostAt 1 January 2021 and at 31 December 2021 1.8
Accumulated depreciation and impairmentAt 1 January 2021 (0.3)Depreciation charge for the year (0.9)At 31 December 2021 (1.2)Net book value at 31 December 2021 0.6Net book value at 31 December 2020 1.5
194 INCHCAPE ANNUAL REPORT AND ACCOUNTS 2021
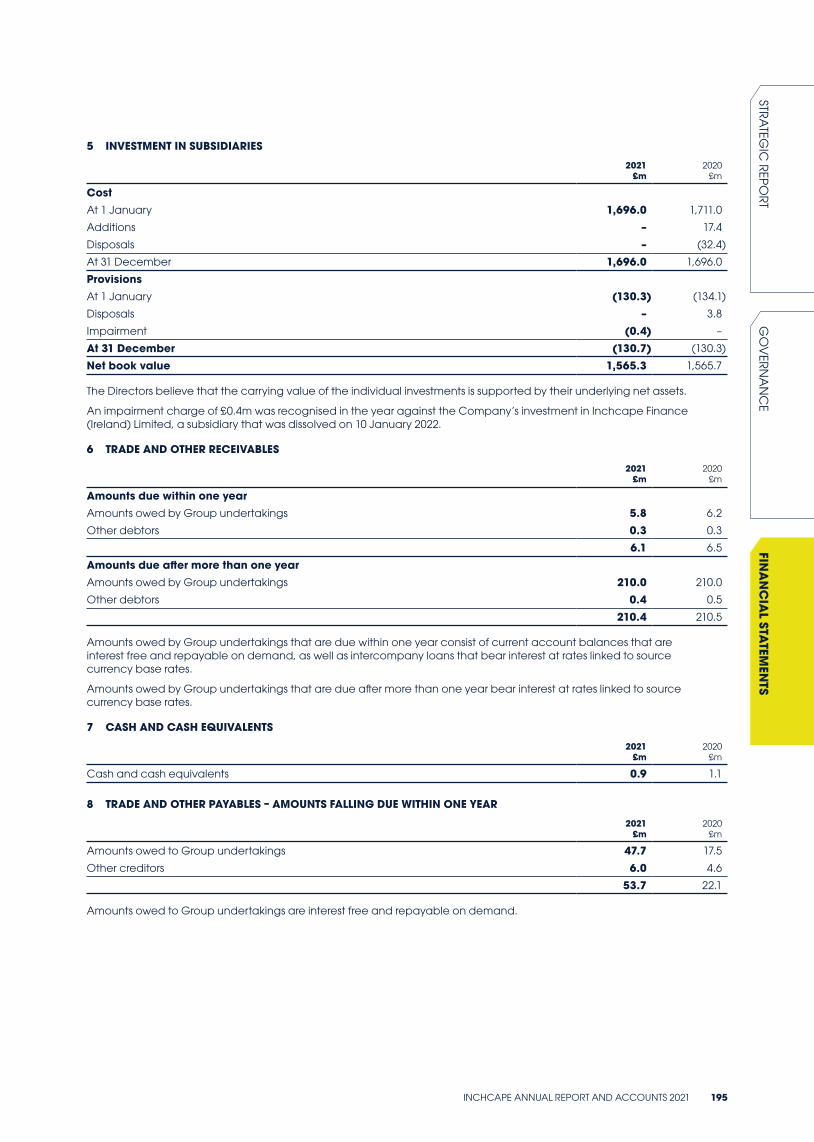
5 INVESTMENT IN SUBSIDIARIES
2021 £m
2020 £m
CostAt 1 January 1,696.0 1,711.0
Additions – 17.4
Disposals – (32.4)
At 31 December 1,696.0 1,696.0
ProvisionsAt 1 January (130.3) (134.1)
Disposals – 3.8
Impairment (0.4) –
At 31 December (130.7) (130.3)
Net book value 1,565.3 1,565.7
The Directors believe that the carrying value of the individual investments is supported by their underlying net assets.
An impairment charge of £0.4m was recognised in the year against the Company’s investment in Inchcape Finance (Ireland) Limited, a subsidiary that was dissolved on 10 January 2022.
6 TRADE AND OTHER RECEIVABLES
2021 £m
2020 £m
Amounts due within one yearAmounts owed by Group undertakings 5.8 6.2
Other debtors 0.3 0.3
6.1 6.5
Amounts due after more than one yearAmounts owed by Group undertakings 210.0 210.0
Other debtors 0.4 0.5
210.4 210.5
Amounts owed by Group undertakings that are due within one year consist of current account balances that are interest free and repayable on demand, as well as intercompany loans that bear interest at rates linked to source currency base rates.
Amounts owed by Group undertakings that are due after more than one year bear interest at rates linked to source currency base rates.
7 CASH AND CASH EQUIVALENTS
2021 £m
2020 £m
Cash and cash equivalents 0.9 1.1
8 TRADE AND OTHER PAYABLES – AMOUNTS FALLING DUE WITHIN ONE YEAR
2021 £m
2020 £m
Amounts owed to Group undertakings 47.7 17.5
Other creditors 6.0 4.6
53.7 22.1
Amounts owed to Group undertakings are interest free and repayable on demand.
INCHCAPE ANNUAL REPORT AND ACCOUNTS 2021 195
STRA
TEGIC
REPO
RTG
OV
ERN
AN
CE
FINA
NC
IAL STA
TEMEN
TS
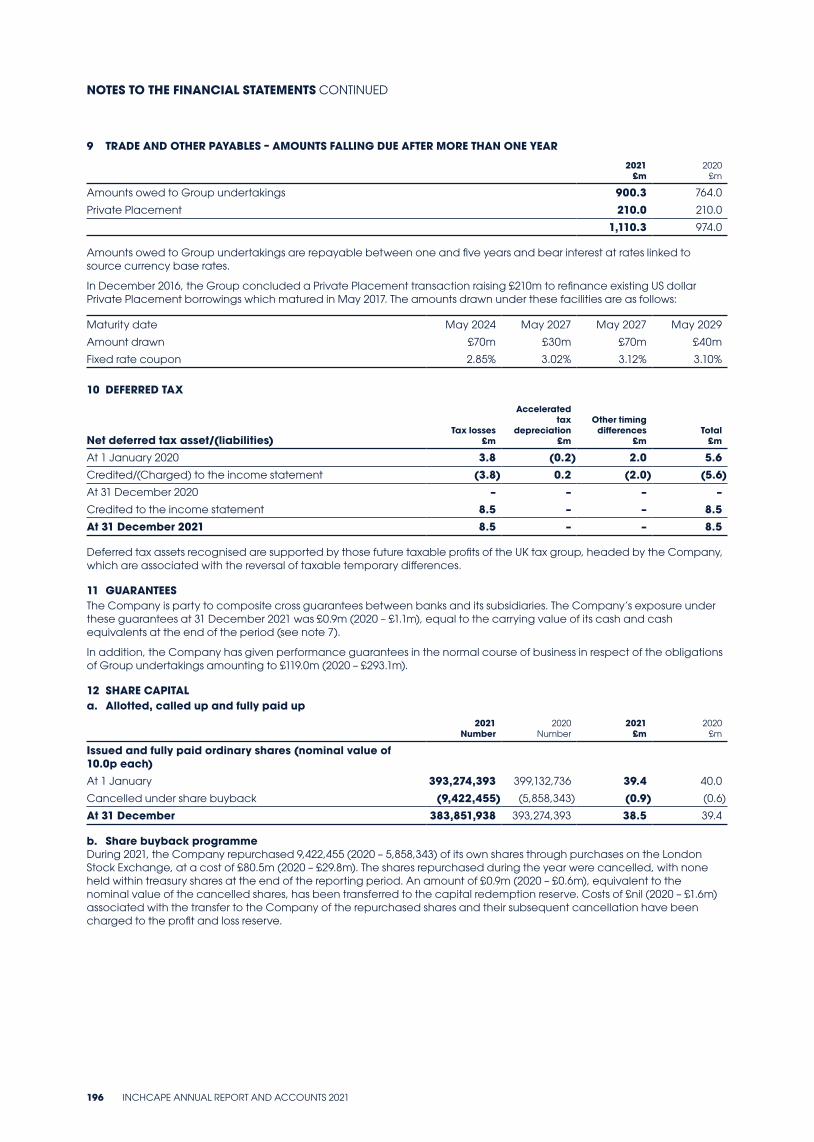
9 TRADE AND OTHER PAYABLES – AMOUNTS FALLING DUE AFTER MORE THAN ONE YEAR
2021 £m
2020 £m
Amounts owed to Group undertakings 900.3 764.0
Private Placement 210.0 210.0
1,110.3 974.0
Amounts owed to Group undertakings are repayable between one and five years and bear interest at rates linked to source currency base rates.
In December 2016, the Group concluded a Private Placement transaction raising £210m to refinance existing US dollar Private Placement borrowings which matured in May 2017. The amounts drawn under these facilities are as follows:
Maturity date May 2024 May 2027 May 2027 May 2029
Amount drawn £70m £30m £70m £40m
Fixed rate coupon 2.85% 3.02% 3.12% 3.10%
10 DEFERRED TAX
Net deferred tax asset/(liabilities)Tax losses
£m
Accelerated tax
depreciation £m
Other timing differences
£mTotal
£m
At 1 January 2020 3.8 (0.2) 2.0 5.6Credited/(Charged) to the income statement (3.8) 0.2 (2.0) (5.6)At 31 December 2020 – – – –Credited to the income statement 8.5 – – 8.5At 31 December 2021 8.5 – – 8.5
Deferred tax assets recognised are supported by those future taxable profits of the UK tax group, headed by the Company, which are associated with the reversal of taxable temporary differences.
11 GUARANTEESThe Company is party to composite cross guarantees between banks and its subsidiaries. The Company’s exposure under these guarantees at 31 December 2021 was £0.9m (2020 – £1.1m), equal to the carrying value of its cash and cash equivalents at the end of the period (see note 7).
In addition, the Company has given performance guarantees in the normal course of business in respect of the obligations of Group undertakings amounting to £119.0m (2020 – £293.1m).
12 SHARE CAPITAL a. Allotted, called up and fully paid up
2021 Number
2020 Number
2021 £m
2020 £m
Issued and fully paid ordinary shares (nominal value of 10.0p each)At 1 January 393,274,393 399,132,736 39.4 40.0
Cancelled under share buyback (9,422,455) (5,858,343) (0.9) (0.6)
At 31 December 383,851,938 393,274,393 38.5 39.4
b. Share buyback programmeDuring 2021, the Company repurchased 9,422,455 (2020 – 5,858,343) of its own shares through purchases on the London Stock Exchange, at a cost of £80.5m (2020 – £29.8m). The shares repurchased during the year were cancelled, with none held within treasury shares at the end of the reporting period. An amount of £0.9m (2020 – £0.6m), equivalent to the nominal value of the cancelled shares, has been transferred to the capital redemption reserve. Costs of £nil (2020 – £1.6m) associated with the transfer to the Company of the repurchased shares and their subsequent cancellation have been charged to the profit and loss reserve.
NOTES TO THE FINANCIAL STATEMENTS CONTINUED
196 INCHCAPE ANNUAL REPORT AND ACCOUNTS 2021
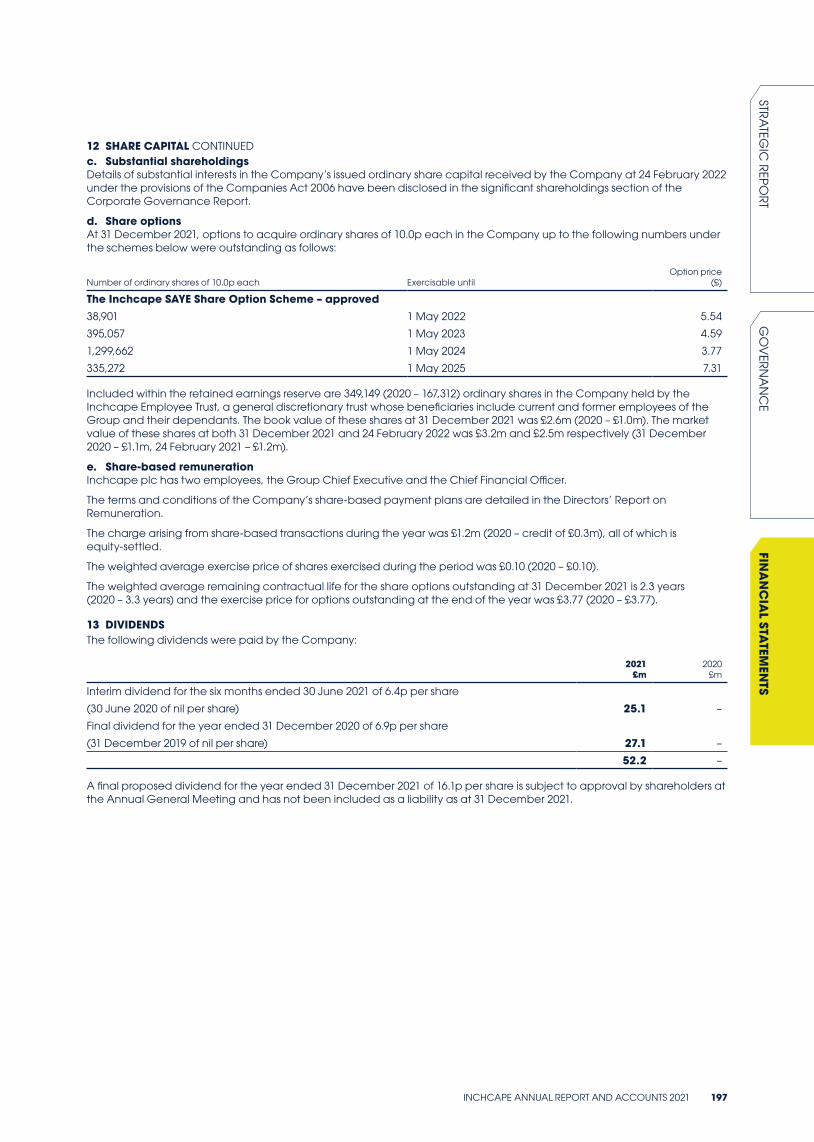
12 SHARE CAPITAL CONTINUEDc. Substantial shareholdingsDetails of substantial interests in the Company’s issued ordinary share capital received by the Company at 24 February 2022 under the provisions of the Companies Act 2006 have been disclosed in the significant shareholdings section of the Corporate Governance Report.
d. Share optionsAt 31 December 2021, options to acquire ordinary shares of 10.0p each in the Company up to the following numbers under the schemes below were outstanding as follows:
Number of ordinary shares of 10.0p each Exercisable untilOption price
(£)
The Inchcape SAYE Share Option Scheme – approved38,901 1 May 2022 5.54
395,057 1 May 2023 4.59
1,299,662 1 May 2024 3.77
335,272 1 May 2025 7.31
Included within the retained earnings reserve are 349,149 (2020 – 167,312) ordinary shares in the Company held by the Inchcape Employee Trust, a general discretionary trust whose beneficiaries include current and former employees of the Group and their dependants. The book value of these shares at 31 December 2021 was £2.6m (2020 – £1.0m). The market value of these shares at both 31 December 2021 and 24 February 2022 was £3.2m and £2.5m respectively (31 December 2020 – £1.1m, 24 February 2021 – £1.2m).
e. Share-based remunerationInchcape plc has two employees, the Group Chief Executive and the Chief Financial Officer.
The terms and conditions of the Company’s share-based payment plans are detailed in the Directors’ Report on Remuneration.
The charge arising from share-based transactions during the year was £1.2m (2020 – credit of £0.3m), all of which is equity-settled.
The weighted average exercise price of shares exercised during the period was £0.10 (2020 – £0.10).
The weighted average remaining contractual life for the share options outstanding at 31 December 2021 is 2.3 years (2020 – 3.3 years) and the exercise price for options outstanding at the end of the year was £3.77 (2020 – £3.77).
13 DIVIDENDSThe following dividends were paid by the Company:
2021 £m
2020 £m
Interim dividend for the six months ended 30 June 2021 of 6.4p per share
(30 June 2020 of nil per share) 25.1 –
Final dividend for the year ended 31 December 2020 of 6.9p per share
(31 December 2019 of nil per share) 27.1 –
52.2 –
A final proposed dividend for the year ended 31 December 2021 of 16.1p per share is subject to approval by shareholders at the Annual General Meeting and has not been included as a liability as at 31 December 2021.
INCHCAPE ANNUAL REPORT AND ACCOUNTS 2021 197
STRA
TEGIC
REPO
RTG
OV
ERN
AN
CE
FINA
NC
IAL STA
TEMEN
TS
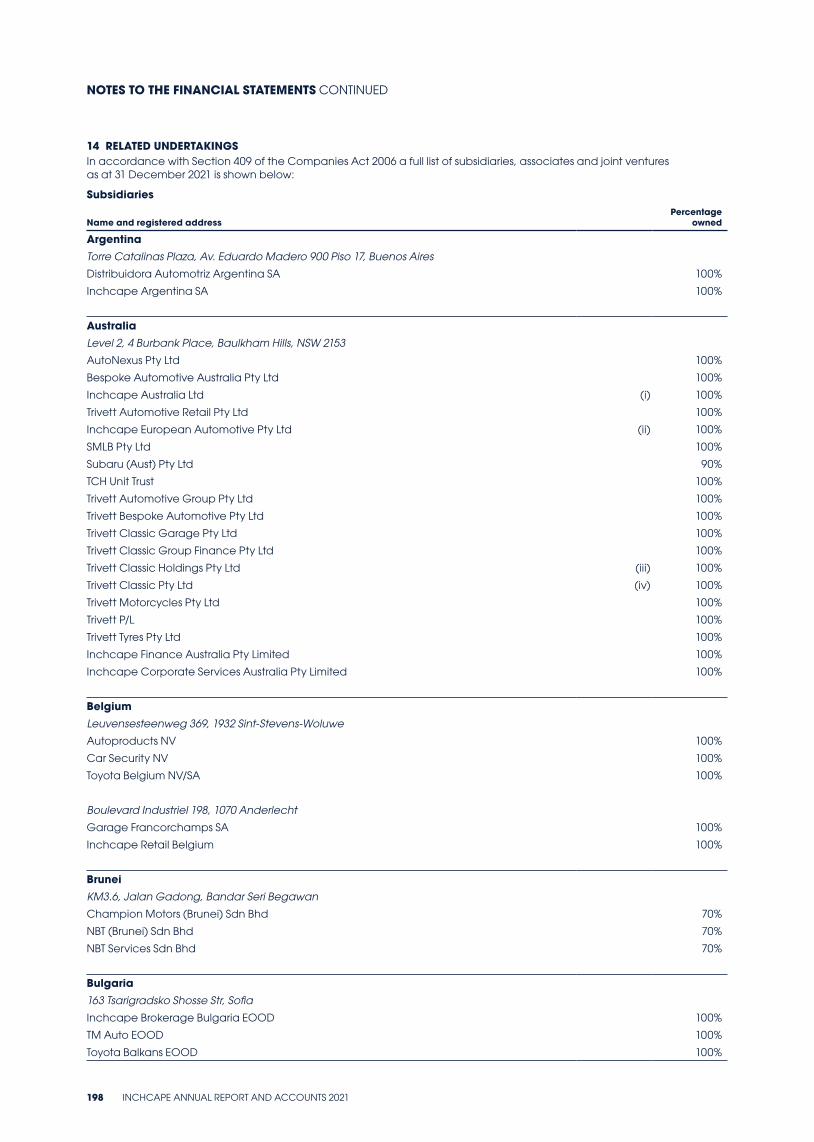
14 RELATED UNDERTAKINGSIn accordance with Section 409 of the Companies Act 2006 a full list of subsidiaries, associates and joint ventures as at 31 December 2021 is shown below:
Subsidiaries
Name and registered address Percentage
owned
ArgentinaTorre Catalinas Plaza, Av. Eduardo Madero 900 Piso 17, Buenos Aires
Distribuidora Automotriz Argentina SA 100%
Inchcape Argentina SA 100%
AustraliaLevel 2, 4 Burbank Place, Baulkham Hills, NSW 2153
AutoNexus Pty Ltd 100%
Bespoke Automotive Australia Pty Ltd 100%
Inchcape Australia Ltd (i) 100%
Trivett Automotive Retail Pty Ltd 100%
Inchcape European Automotive Pty Ltd (ii) 100%
SMLB Pty Ltd 100%
Subaru (Aust) Pty Ltd 90%
TCH Unit Trust 100%
Trivett Automotive Group Pty Ltd 100%
Trivett Bespoke Automotive Pty Ltd 100%
Trivett Classic Garage Pty Ltd 100%
Trivett Classic Group Finance Pty Ltd 100%
Trivett Classic Holdings Pty Ltd (iii) 100%
Trivett Classic Pty Ltd (iv) 100%
Trivett Motorcycles Pty Ltd 100%
Trivett P/L 100%
Trivett Tyres Pty Ltd 100%
Inchcape Finance Australia Pty Limited 100%
Inchcape Corporate Services Australia Pty Limited 100%
BelgiumLeuvensesteenweg 369, 1932 Sint-Stevens-Woluwe
Autoproducts NV 100%
Car Security NV 100%
Toyota Belgium NV/SA 100%
Boulevard Industriel 198, 1070 Anderlecht
Garage Francorchamps SA 100%
Inchcape Retail Belgium 100%
BruneiKM3.6, Jalan Gadong, Bandar Seri Begawan
Champion Motors (Brunei) Sdn Bhd 70%
NBT (Brunei) Sdn Bhd 70%
NBT Services Sdn Bhd 70%
Bulgaria163 Tsarigradsko Shosse Str, Sofia
Inchcape Brokerage Bulgaria EOOD 100%
TM Auto EOOD 100%
Toyota Balkans EOOD 100%
NOTES TO THE FINANCIAL STATEMENTS CONTINUED
198 INCHCAPE ANNUAL REPORT AND ACCOUNTS 2021
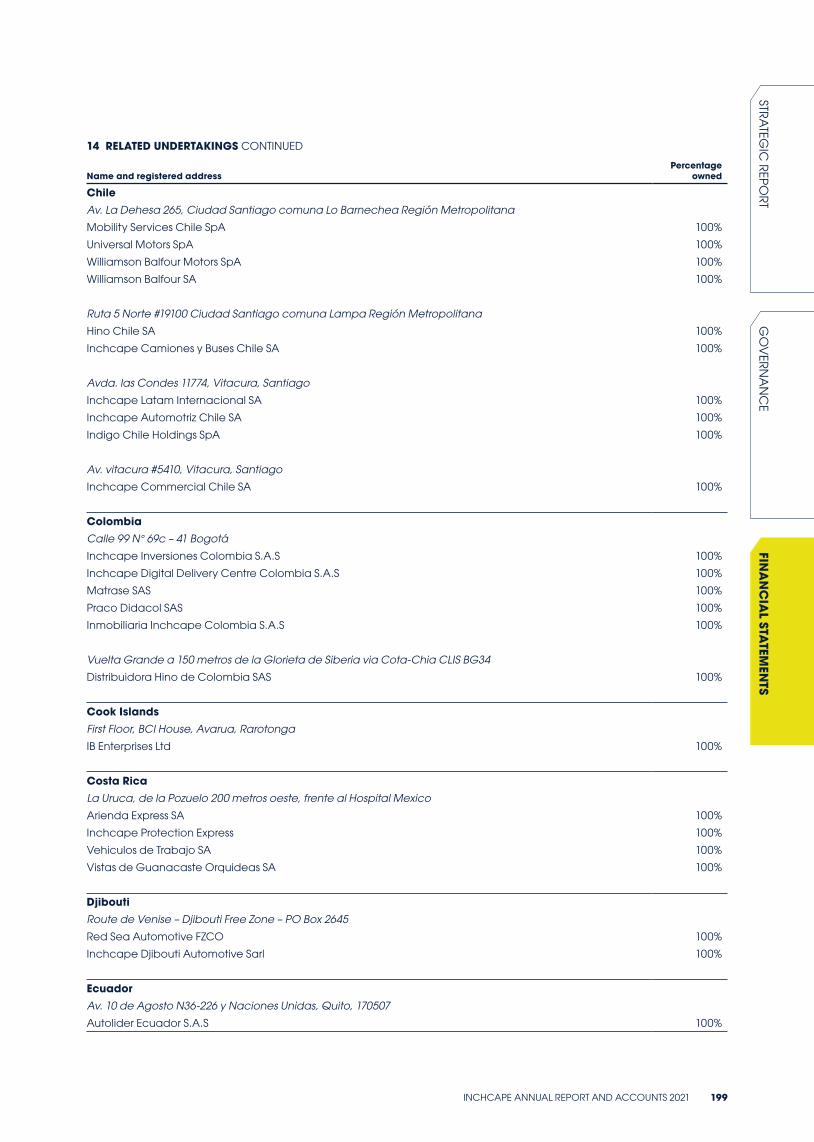
14 RELATED UNDERTAKINGS CONTINUED
Name and registered addressPercentage
owned
ChileAv. La Dehesa 265, Ciudad Santiago comuna Lo Barnechea Región Metropolitana
Mobility Services Chile SpA 100%
Universal Motors SpA 100%
Williamson Balfour Motors SpA 100%
Williamson Balfour SA 100%
Ruta 5 Norte #19100 Ciudad Santiago comuna Lampa Región Metropolitana
Hino Chile SA 100%
Inchcape Camiones y Buses Chile SA 100%
Avda. las Condes 11774, Vitacura, Santiago
Inchcape Latam Internacional SA 100%
Inchcape Automotriz Chile SA 100%
Indigo Chile Holdings SpA 100%
Av. vitacura #5410, Vitacura, Santiago
Inchcape Commercial Chile SA 100%
ColombiaCalle 99 N° 69c – 41 Bogotá
Inchcape Inversiones Colombia S.A.S 100%
Inchcape Digital Delivery Centre Colombia S.A.S 100%
Matrase SAS 100%
Praco Didacol SAS 100%
Inmobiliaria Inchcape Colombia S.A.S 100%
Vuelta Grande a 150 metros de la Glorieta de Siberia via Cota-Chia CLIS BG34
Distribuidora Hino de Colombia SAS 100%
Cook IslandsFirst Floor, BCI House, Avarua, Rarotonga
IB Enterprises Ltd 100%
Costa RicaLa Uruca, de la Pozuelo 200 metros oeste, frente al Hospital Mexico
Arienda Express SA 100%
Inchcape Protection Express 100%
Vehiculos de Trabajo SA 100%
Vistas de Guanacaste Orquideas SA 100%
DjiboutiRoute de Venise – Djibouti Free Zone – PO Box 2645
Red Sea Automotive FZCO 100%
Inchcape Djibouti Automotive Sarl 100%
EcuadorAv. 10 de Agosto N36-226 y Naciones Unidas, Quito, 170507
Autolider Ecuador S.A.S 100%
INCHCAPE ANNUAL REPORT AND ACCOUNTS 2021 199
STRA
TEGIC
REPO
RTG
OV
ERN
AN
CE
FINA
NC
IAL STA
TEMEN
TS
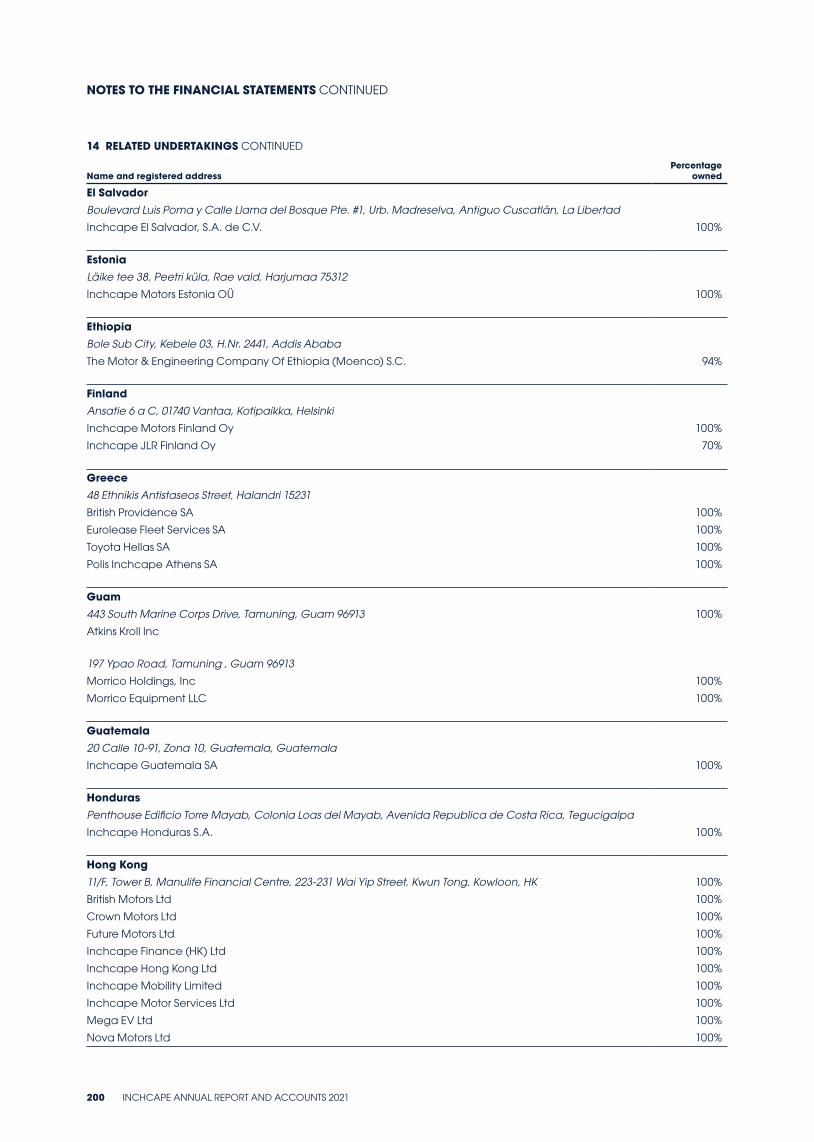
14 RELATED UNDERTAKINGS CONTINUED
Name and registered addressPercentage
owned
El SalvadorBoulevard Luis Poma y Calle Llama del Bosque Pte. #1, Urb. Madreselva, Antiguo Cuscatlán, La Libertad
Inchcape El Salvador, S.A. de C.V. 100%
EstoniaLäike tee 38, Peetri küla, Rae vald, Harjumaa 75312
Inchcape Motors Estonia OÜ 100%
EthiopiaBole Sub City, Kebele 03, H.Nr. 2441, Addis Ababa
The Motor & Engineering Company Of Ethiopia (Moenco) S.C. 94%
FinlandAnsatie 6 a C, 01740 Vantaa, Kotipaikka, Helsinki
Inchcape Motors Finland Oy 100%
Inchcape JLR Finland Oy 70%
Greece48 Ethnikis Antistaseos Street, Halandri 15231
British Providence SA 100%
Eurolease Fleet Services SA 100%
Toyota Hellas SA 100%
Polis Inchcape Athens SA 100%
Guam443 South Marine Corps Drive, Tamuning, Guam 96913 100%
Atkins Kroll Inc
197 Ypao Road, Tamuning , Guam 96913
Morrico Holdings, Inc 100%
Morrico Equipment LLC 100%
Guatemala20 Calle 10-91, Zona 10, Guatemala, Guatemala
Inchcape Guatemala SA 100%
HondurasPenthouse Edificio Torre Mayab, Colonia Loas del Mayab, Avenida Republica de Costa Rica, Tegucigalpa
Inchcape Honduras S.A. 100%
Hong Kong11/F, Tower B, Manulife Financial Centre, 223-231 Wai Yip Street, Kwun Tong, Kowloon, HK 100%
British Motors Ltd 100%
Crown Motors Ltd 100%
Future Motors Ltd 100%
Inchcape Finance (HK) Ltd 100%
Inchcape Hong Kong Ltd 100%
Inchcape Mobility Limited 100%
Inchcape Motor Services Ltd 100%
Mega EV Ltd 100%
Nova Motors Ltd 100%
NOTES TO THE FINANCIAL STATEMENTS CONTINUED
200 INCHCAPE ANNUAL REPORT AND ACCOUNTS 2021
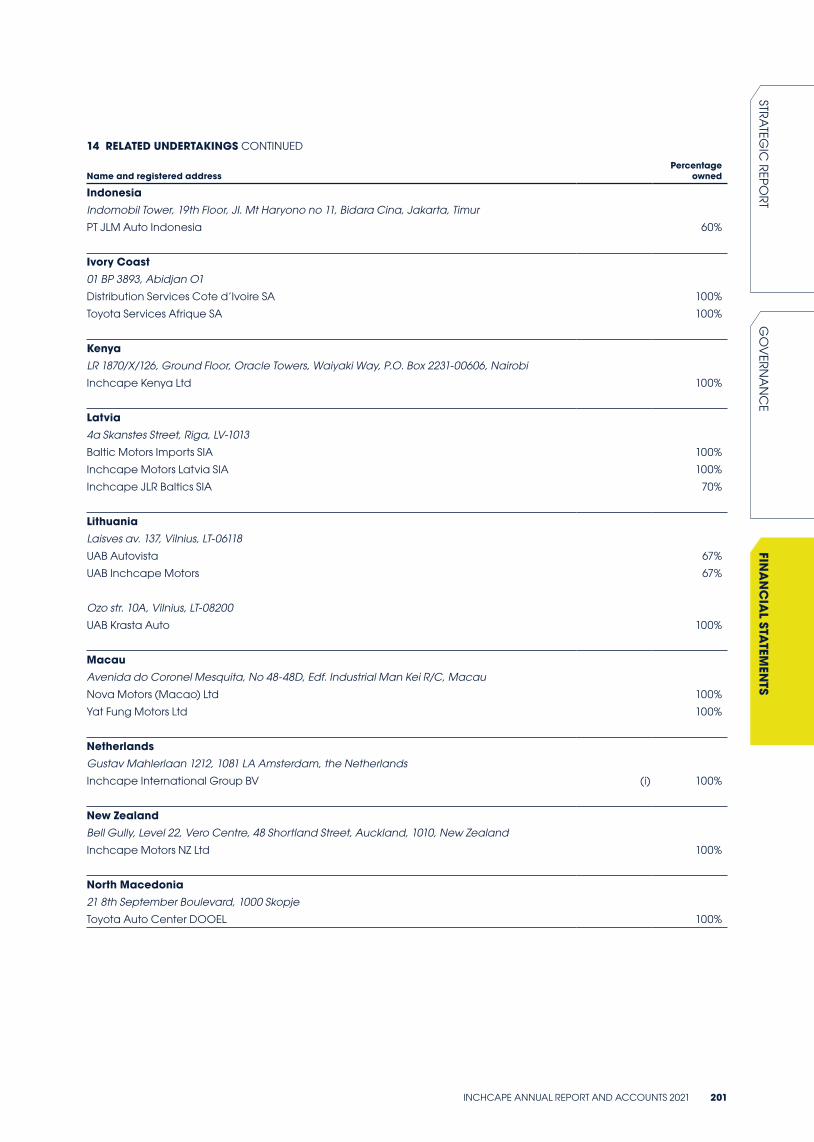
14 RELATED UNDERTAKINGS CONTINUED
Name and registered addressPercentage
owned
IndonesiaIndomobil Tower, 19th Floor, JI. Mt Haryono no 11, Bidara Cina, Jakarta, Timur
PT JLM Auto Indonesia 60%
Ivory Coast01 BP 3893, Abidjan O1
Distribution Services Cote d’Ivoire SA 100%
Toyota Services Afrique SA 100%
KenyaLR 1870/X/126, Ground Floor, Oracle Towers, Waiyaki Way, P.O. Box 2231-00606, Nairobi
Inchcape Kenya Ltd 100%
Latvia4a Skanstes Street, Riga, LV-1013
Baltic Motors Imports SIA 100%
Inchcape Motors Latvia SIA 100%
Inchcape JLR Baltics SIA 70%
LithuaniaLaisves av. 137, Vilnius, LT-06118
UAB Autovista 67%
UAB Inchcape Motors 67%
Ozo str. 10A, Vilnius, LT-08200
UAB Krasta Auto 100%
MacauAvenida do Coronel Mesquita, No 48-48D, Edf. Industrial Man Kei R/C, Macau
Nova Motors (Macao) Ltd 100%
Yat Fung Motors Ltd 100%
NetherlandsGustav Mahlerlaan 1212, 1081 LA Amsterdam, the Netherlands
Inchcape International Group BV (i) 100%
New ZealandBell Gully, Level 22, Vero Centre, 48 Shortland Street, Auckland, 1010, New Zealand
Inchcape Motors NZ Ltd 100%
North Macedonia21 8th September Boulevard, 1000 Skopje
Toyota Auto Center DOOEL 100%
INCHCAPE ANNUAL REPORT AND ACCOUNTS 2021 201
STRA
TEGIC
REPO
RTG
OV
ERN
AN
CE
FINA
NC
IAL STA
TEMEN
TS
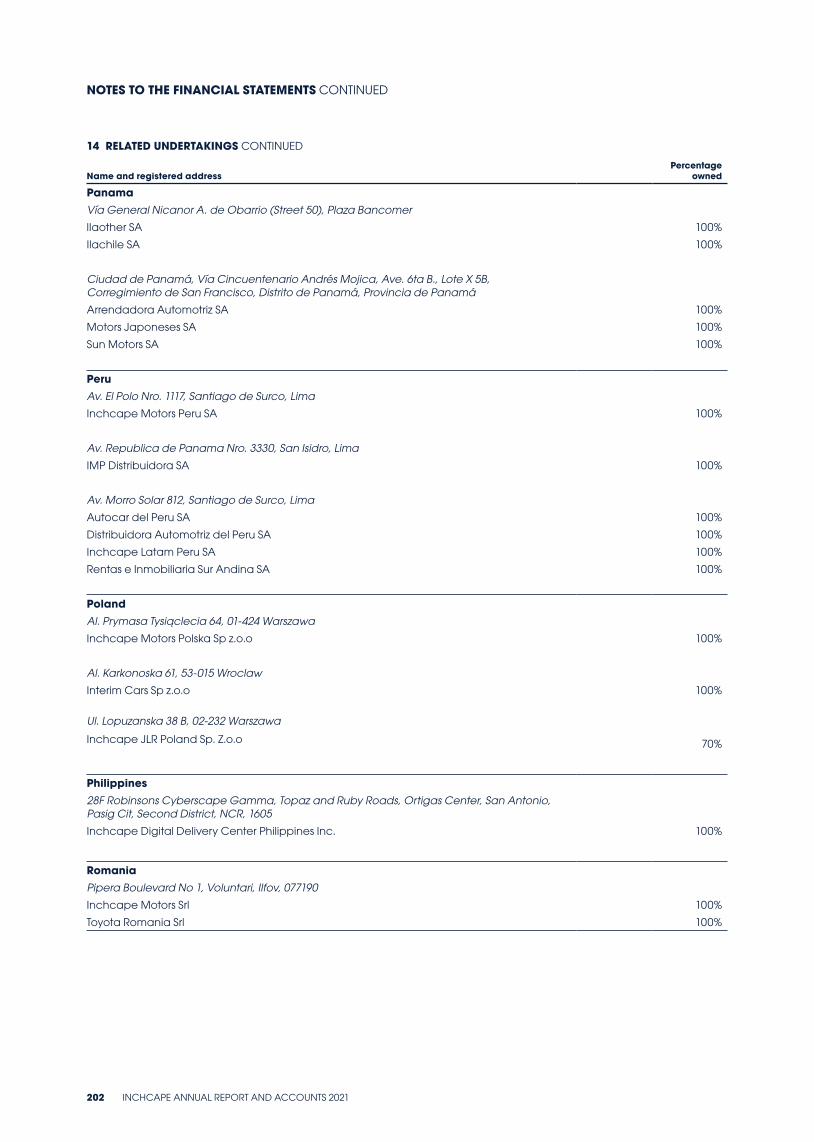
14 RELATED UNDERTAKINGS CONTINUED
Name and registered address Percentage
owned
PanamaVía General Nicanor A. de Obarrio (Street 50), Plaza Bancomer
lIaother SA 100%
Ilachile SA 100%
Ciudad de Panamá, Vía Cincuentenario Andrés Mojica, Ave. 6ta B., Lote X 5B, Corregimiento de San Francisco, Distrito de Panamá, Provincia de Panamá
Arrendadora Automotriz SA 100%
Motors Japoneses SA 100%
Sun Motors SA 100%
PeruAv. El Polo Nro. 1117, Santiago de Surco, Lima
Inchcape Motors Peru SA 100%
Av. Republica de Panama Nro. 3330, San Isidro, Lima
IMP Distribuidora SA 100%
Av. Morro Solar 812, Santiago de Surco, Lima
Autocar del Peru SA 100%
Distribuidora Automotriz del Peru SA 100%
Inchcape Latam Peru SA 100%
Rentas e Inmobiliaria Sur Andina SA 100%
PolandAl. Prymasa Tysiąclecia 64, 01-424 Warszawa
Inchcape Motors Polska Sp z.o.o 100%
Al. Karkonoska 61, 53-015 Wroclaw
Interim Cars Sp z.o.o 100%
Ul. Lopuzanska 38 B, 02-232 Warszawa
Inchcape JLR Poland Sp. Z.o.o 70%
Philippines28F Robinsons Cyberscape Gamma, Topaz and Ruby Roads, Ortigas Center, San Antonio, Pasig Cit, Second District, NCR, 1605
Inchcape Digital Delivery Center Philippines Inc. 100%
RomaniaPipera Boulevard No 1, Voluntari, Ilfov, 077190
Inchcape Motors Srl 100%
Toyota Romania Srl 100%
NOTES TO THE FINANCIAL STATEMENTS CONTINUED
202 INCHCAPE ANNUAL REPORT AND ACCOUNTS 2021
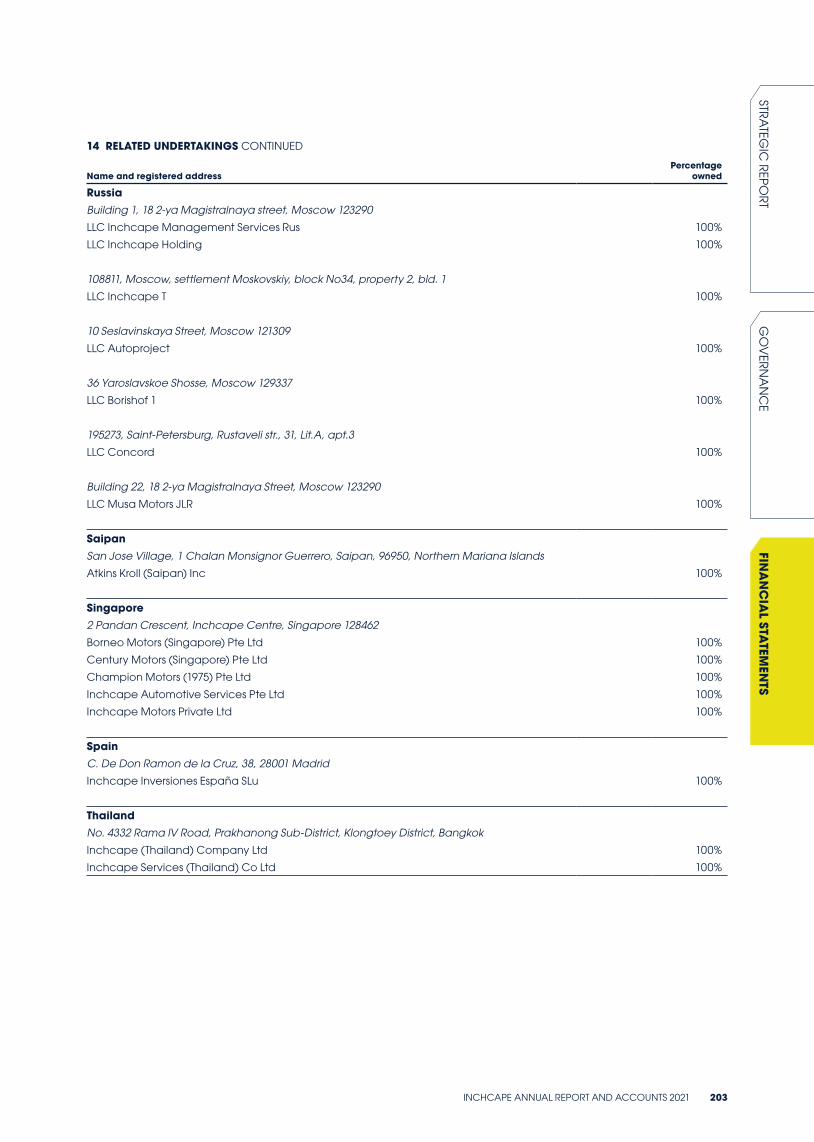
14 RELATED UNDERTAKINGS CONTINUED
Name and registered address Percentage
owned
RussiaBuilding 1, 18 2-ya Magistralnaya street, Moscow 123290
LLC Inchcape Management Services Rus 100%
LLC Inchcape Holding 100%
108811, Moscow, settlement Moskovskiy, block No34, property 2, bld. 1
LLC Inchcape T 100%
10 Seslavinskaya Street, Moscow 121309
LLC Autoproject 100%
36 Yaroslavskoe Shosse, Moscow 129337
LLC Borishof 1 100%
195273, Saint-Petersburg, Rustaveli str., 31, Lit.A, apt.3
LLC Concord 100%
Building 22, 18 2-ya Magistralnaya Street, Moscow 123290
LLC Musa Motors JLR 100%
SaipanSan Jose Village, 1 Chalan Monsignor Guerrero, Saipan, 96950, Northern Mariana Islands
Atkins Kroll (Saipan) Inc 100%
Singapore2 Pandan Crescent, Inchcape Centre, Singapore 128462
Borneo Motors (Singapore) Pte Ltd 100%
Century Motors (Singapore) Pte Ltd 100%
Champion Motors (1975) Pte Ltd 100%
Inchcape Automotive Services Pte Ltd 100%
Inchcape Motors Private Ltd 100%
SpainC. De Don Ramon de la Cruz, 38, 28001 Madrid
Inchcape Inversiones España SLu 100%
ThailandNo. 4332 Rama IV Road, Prakhanong Sub-District, Klongtoey District, Bangkok
Inchcape (Thailand) Company Ltd 100%
Inchcape Services (Thailand) Co Ltd 100%
INCHCAPE ANNUAL REPORT AND ACCOUNTS 2021 203
STRA
TEGIC
REPO
RTG
OV
ERN
AN
CE
FINA
NC
IAL STA
TEMEN
TS
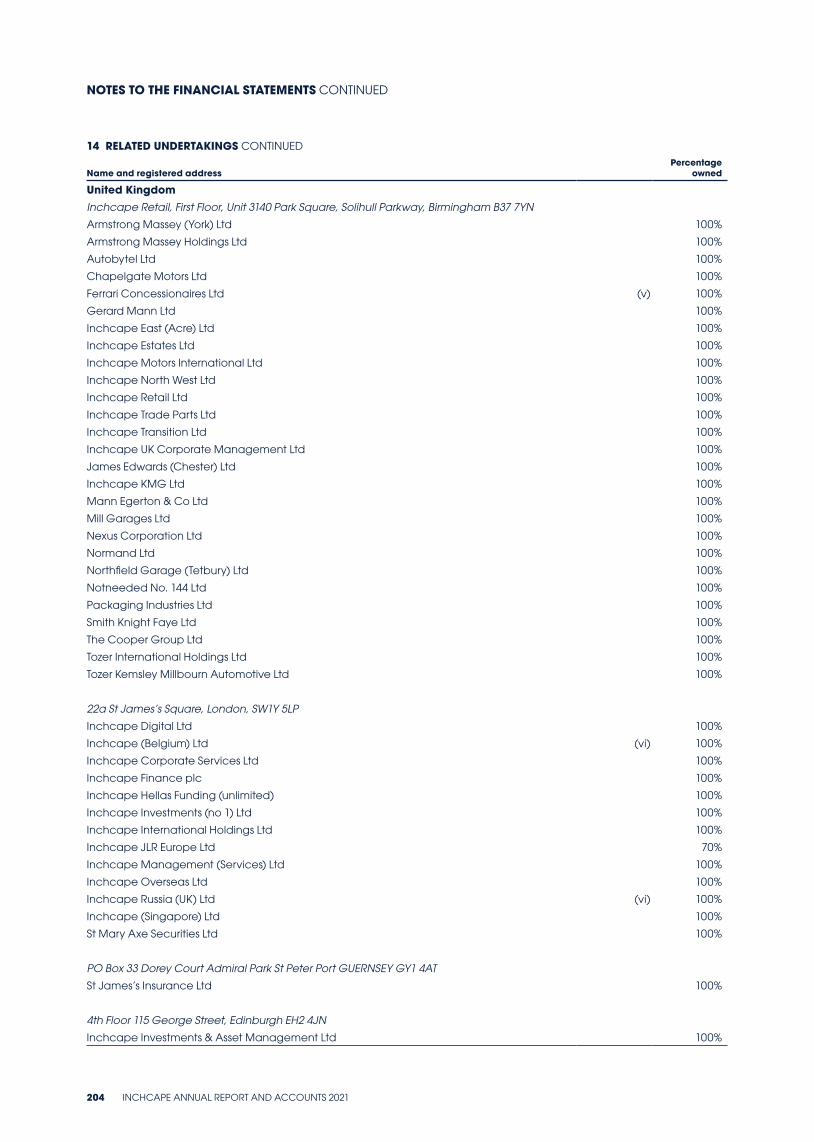
14 RELATED UNDERTAKINGS CONTINUED
Name and registered address Percentage
owned
United KingdomInchcape Retail, First Floor, Unit 3140 Park Square, Solihull Parkway, Birmingham B37 7YN
Armstrong Massey (York) Ltd 100%
Armstrong Massey Holdings Ltd 100%
Autobytel Ltd 100%
Chapelgate Motors Ltd 100%
Ferrari Concessionaires Ltd (v) 100%
Gerard Mann Ltd 100%
Inchcape East (Acre) Ltd 100%
Inchcape Estates Ltd 100%
Inchcape Motors International Ltd 100%
Inchcape North West Ltd 100%
Inchcape Retail Ltd 100%
Inchcape Trade Parts Ltd 100%
Inchcape Transition Ltd 100%
Inchcape UK Corporate Management Ltd 100%
James Edwards (Chester) Ltd 100%
Inchcape KMG Ltd 100%
Mann Egerton & Co Ltd 100%
Mill Garages Ltd 100%
Nexus Corporation Ltd 100%
Normand Ltd 100%
Northfield Garage (Tetbury) Ltd 100%
Notneeded No. 144 Ltd 100%
Packaging Industries Ltd 100%
Smith Knight Faye Ltd 100%
The Cooper Group Ltd 100%
Tozer International Holdings Ltd 100%
Tozer Kemsley Millbourn Automotive Ltd 100%
22a St James’s Square, London, SW1Y 5LP
Inchcape Digital Ltd 100%
Inchcape (Belgium) Ltd (vi) 100%
Inchcape Corporate Services Ltd 100%
Inchcape Finance plc 100%
Inchcape Hellas Funding (unlimited) 100%
Inchcape Investments (no 1) Ltd 100%
Inchcape International Holdings Ltd 100%
Inchcape JLR Europe Ltd 70%
Inchcape Management (Services) Ltd 100%
Inchcape Overseas Ltd 100%
Inchcape Russia (UK) Ltd (vi) 100%
Inchcape (Singapore) Ltd 100%
St Mary Axe Securities Ltd 100%
PO Box 33 Dorey Court Admiral Park St Peter Port GUERNSEY GY1 4AT
St James’s Insurance Ltd 100%
4th Floor 115 George Street, Edinburgh EH2 4JN
Inchcape Investments & Asset Management Ltd 100%
NOTES TO THE FINANCIAL STATEMENTS CONTINUED
204 INCHCAPE ANNUAL REPORT AND ACCOUNTS 2021
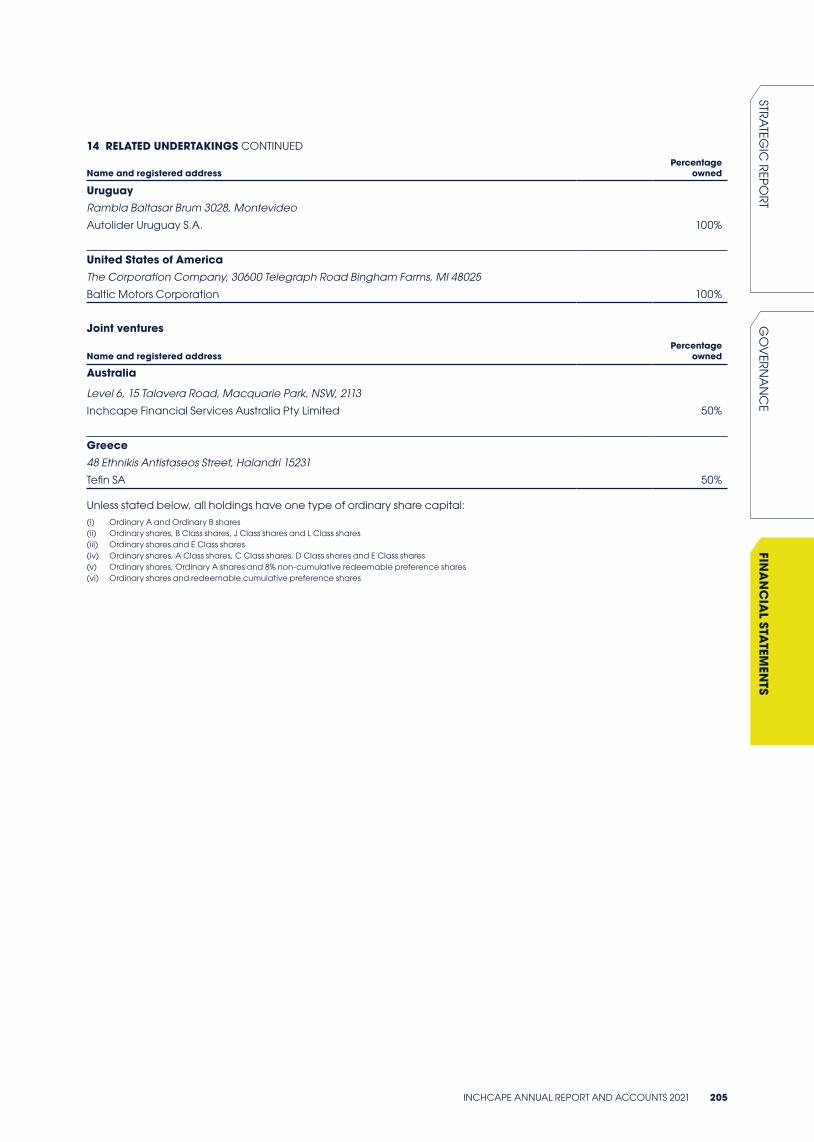
14 RELATED UNDERTAKINGS CONTINUED
Name and registered address Percentage
owned
UruguayRambla Baltasar Brum 3028, Montevideo
Autolider Uruguay S.A. 100%
United States of AmericaThe Corporation Company, 30600 Telegraph Road Bingham Farms, MI 48025
Baltic Motors Corporation 100%
Joint ventures
Name and registered address Percentage
owned
Australia
Level 6, 15 Talavera Road, Macquarie Park, NSW, 2113
Inchcape Financial Services Australia Pty Limited 50%
Greece48 Ethnikis Antistaseos Street, Halandri 15231
Tefin SA 50%
Unless stated below, all holdings have one type of ordinary share capital:(i) Ordinary A and Ordinary B shares(ii) Ordinary shares, B Class shares, J Class shares and L Class shares(iii) Ordinary shares and E Class shares(iv) Ordinary shares, A Class shares, C Class shares, D Class shares and E Class shares(v) Ordinary shares, Ordinary A shares and 8% non-cumulative redeemable preference shares(vi) Ordinary shares and redeemable cumulative preference shares
INCHCAPE ANNUAL REPORT AND ACCOUNTS 2021 205
STRA
TEGIC
REPO
RTG
OV
ERN
AN
CE
FINA
NC
IAL STA
TEMEN
TS
SHAREHOLDER INFORMATION
REGISTERED OFFICEInchcape plc22a St James’s Square London SW1Y 5LP Tel: +44 (0) 20 7546 0022 Fax: +44 (0) 20 7546 0010 Registered number: 609782 Registered in England and Wales
ADVISORSIndependent AuditorDeloitte LLP Chartered Accountants and Statutory Auditor
SHARE REGISTRARSComputershare Investor Services PLC Registrar’s Department, The Pavilions Bridgwater Road Bristol BS99 7NH Tel: +44 (0) 370 707 1076
SOLICITORSHerbert Smith Freehills
CORPORATE BROKERSJefferies Hoare Govett JP Morgan Cazenove
INCHCAPE ISAInchcape has established a Corporate Individual Savings Account (ISA). This is managed by Equiniti Financial Services Limited, Aspect House, Spencer Road, Lancing, West Sussex BN99 6DA Tel: 0870 300 0430
International callers:Tel: +44 121 441 7560 More information is available at www.shareview.com
FINANCIAL CALENDARAnnual General Meeting19 May 2022
Announcement of 2022 Interim Results28 July 2022
206 INCHCAPE ANNUAL REPORT AND ACCOUNTS 2021

This Report is printed on Essential Silk and Essential Offset both of which are derived from sustainable sources. The manufacturing paper mill and printer are registered to the Environmental Management System ISO 14001 and are Forest Stewardship Council (FSC) chain-of-custody certified. The inks used are all vegetable oil based.
Design and production
Note: Spine set to 12.5mm. Please adjust if necessary

INC
HC
APE A
NN
UAL REPO
RT AN
D A
CC
OU
NTS 2021
INCHCAPE PLC22A ST JAMES’S SQUARELONDON SW1Y 5LPT +44 (0) 20 7546 0022
WWW.INCHCAPE.COMREGISTERED NUMBER 609782