ofcost-effective dsm. the market imperfecti.onsare
TRANSCRIPT

.ofcost-effective DSM. The market imperfecti.onsare .oftencharacterized as barriers thatprevent energy services markets from functioning in a competitive manner. Seme .ofthecommonly-cited barriers to econemically efficient levels .ofDSM are described in Table6-7.21.
Rather than initially assert ,that markets werk in a C()mpetitive manner .or exhibitsignificant faihJies,:p;YCS~clJDCs sheuld frrst strive to account fer all the cestsandbenefits that:Cifeinv~lvedin ,undertaking a DSM pregram. Such an accounting sheuld beused in.a~mpr~h~nsiv~test~uchas,the TRC .orSocietal Cest test and sheuld includeestimates .ofindirectc9sts(~stsin,\terms .oftime lest, hassle, and-fer commercial.andindustrial custemers--the value of any lest productien) and the impact .ofquality changescaused by the DSM pregram. If,' after a full accounting .ofcosts and benefits is made,the LDC erPT.J~stillestimateslarge net benefits frem the DSMpregrams,th.enit weuldbe, apprepria~te ,serie~~IYcon~ider implementing the pregrams~ If the programs havelarge rate impacts as m~llredby the RIM, PUCs .orLDCs sheuld examine whether thedesign .ofthe.pr()~l"3.Dls.~ .bestructured te make participants pay fer a larger share .ofthe progl"3.Dl's'eostS,(see. Ch.~p~F;7).25 The conside~tien eL~arket ,imperfectiens,especially envireJlmental~J(lFI1lalities,may, hewever, lead to programs with net benefitsbut unayeiclableratejmpat;ts.;Fl1~er, some programs that fail the RIM test may bepursued fer public policy objectives ether than ecOnemicefficiency. As a result, theremay be ins~~, where a PUC.,.or.LDCwill feel confident pursuing a DSM pregram thatfails.JheRIM ,,~st~'·.,'
6A.4 Alternatives to the Standard Benefit-Cest Tests
Althellghthes~daf(:i,ij~n,efj,t...cost tests are widely used, .other energy industryparticipants, mestlyeconemists,'have proposed alternative tests that focus en total value.ornet eccmg,.rni,cbe",~~fi,l,tsJ,N,E.13}in,anattempt te develep a mere accurate"measure elthenet benefits' .oLutffiiy])~:Mprograms. As part .of a conservatien plan, CennecticutNatural Gas (1988)sponsg~.the\Verk .ofan econemist that develeped a set .oftests thatfocused en changes in'utility profits, tetal social costs, and participant ,benefits; the sum.ofwhich measures changes in total social welfare. Later, Hebbs (1991) defmed a "mestvalue" test ClJldCifglled,tViltiJshelild beu~ips~~,()f thes~~~tes~;;~~Jltly, mere
24 It should be noted that the last two market barriers (environmentalextemalities ,and federal governmentR&.Dpriorities) cited in Table 6-7, althougbpotentiallysignific,an~.maynot cause theJW1ic~pantS'vaIue line todeviate from th~irmarketdemaIld curve.~, the impact of ex~ties ~~, fed~.~&D ~ts .affectsociety at large.
2S Any 'DSM program' that bas a sigilifieant rate impact onprice-senSitive cUstoxl1er classes should also beexamined to see what the resulting margin impacts are from the additional lost sales.
147

Table 6-7. Barriers to an Economically Efficient Market in Energy Efficiency
Barrier 1:Informetion Gap •••••••••••••••••••••••
Barrier 2:PaybecklUnciflrtainty Gap
'Berrier 3::Third Party, Transactions ••••• ',' ••.•.
Barrier 4:leck ClfCapital •••...•
Barrier 5:Utility Regulation Imbalanca
Barrier 6:Environmental Externlllities
Barrier?:FederlllGovernli1ent Policies
Credible information on the performance ofenergy-related technologies is often lacking.Availabla information is often not well understoodand is sometimes unreliable.
Paybac!< pariod1!require.d bycl)nsumers fO,rinvestm~ntll in~nergyefficiency ere generally
.•,'much shOrter thei! tho.~ ,eqJiredfor utility •cOmpany in"estmetlts., The gaPmayr,eflectthe. tenden,cY ,of,cons~merst,o perc,eive "',euncertainties of tUture demarid;,fuef prices. andthe parformance'ofDSM measuresto·begreaterthan, thO,lutility:sperceptionl)tthe same",unciflrtaintie".
Consumers often must use, the energytech!l?logies. ~elec~edbylandlords anc;lothers.This leads to ~n emphasis ontirstcost ratherthal'llifa-cycle ;cost.
". -\M!lny custo"':';'rs"bo~1:I residential andco'lnmercial. lack enough cash or cradit ','(considaringthecompeting demands on' their!inancilll resources) to pay the cepitalco~~ of "making long-run cost-effective efficiency'investments.
~,treditionlll rate reguletlon in most~~tesencourages utilities to inc'rease8all'is,' impaltingan implicit bias toward pursuing supply-sideoptions.
In IIlmost all states, the prices that consulTlers'pay for fuels. including electricity. do not fullyreflilc~ ifill,enll!!onmen~,1 a lld s,ocilll cO!'tsassociilted1iJith fuel prOduction. conversion.,transportation ,and<use •.
• - - ',_ ''' -; ,i _.'-- '_:.: ·~--::ti:,·_·'-~·:.·_;c','; __,,'., ~-. C',: ,\-';Traditionally. ~he Fedl!rai GovernlTlont has ',proVided greater support for energy productiontl:lan for en~rgy effi,ciencYi both with respect totax policies and R&D. '
i'.'
pra.ctical:variations of value ,or ,NEB tests have been proposed. Braithwaith and Caves(1993) 'sp'OnsortheirownNEBtest. Their NEB test adds at least threeadditionaIdimensions to the staridard'teStS:"(1) it allows, flexibility' regarding assumptions on:'·thedegree of failure in the market for DSM products, (2) it considers the full impact of pricechanges caused by utility QSM programs on nonParticipants, and (3) it, considers the
148

added value provided to program participants from "snapback." Similar to the NEB testis the Value test sponsored by Chamberlin and Herm~ (1993). The Value test appearsto incorporate the NEB test, and, further, allows for the consideration of benefits that theutility DSM program provides to free riders. Although no PUC has yet adopted eitherthe NEB or Value test for gas DSM program evaluation, the NEB/Value tests holdpromise as being a more general framework for the analysis of DSM programs. Evenenvironmental or other externalities could be added to the test to give it a societalperspective. The NEB/Value tests explicitly consider the degree of market imperfections,which, as has already been noted, are a crucial factor in the ongoing debate over whichstandard test is best. The NEB/Value tests do require more assumptions and data: explicitassumptions must be made regarding the degree of market imperfections and data ondemand elasticities, snapback, and the characteristics of free riders is needed. These dataand assumptions will, however, become increasingly important in the evaluation of DSMprograms and the NEB/Value tests allows for an analysis using them.
149

150

Chapter 7
Gas DSM Technologiesand Programs
7.1 Overview
This chapter describes common load-shape objectives for gas utilities and the structureof U.S. gas demand in the residential and commercial sectors, reviews the potential for·demand-side management (DSM) for gas utilities as suggested by r~nt assessments,identifies efficiency and fuel-substitution measures available for promotion in DSMprograms, and discusses issues of DSM program design and implementation.
7.2 Load-Shape Objectives
In cont~m.platingdemand-side interventions, gas utilities should define .their load shapeobjectives. Figure 7-1 illustrates six common load-shape objectives and gas end-usetec~pologies (as well as supply and capacity options) that can meet these objectives(Samsa 1993).1 Conservation and load building respectively reduce or increase gas loadsthroughout the year. Seasonal load reduction and valley filling load shapes respectivelylower or raise loads on a seasonal basis. Peak clipping and peak load shifting focusmainly on reducirlgpeak-<iaydemand rather~anene~gYsavings.~d-shape objectivesof individual loCal distribution companies (LDCs)·Willvary dePending on their existingsystem load factor. Some LDCs may prefer to focus on peak clipping andJoad shiftingin order to reduce pipeline demand charges. Other gas utilities believe they can reduceaverage gas purchase costs by improving system load factor so they may propose loadbuildin9pr()grams (such as cogenerati()n).toincr~ Pase loads or valley filling programs(such as gas cooling) to increase off-season utilization. This chapter focuses ontechnologies and programs for meeting three of the six load-shape objectives:conservation, seasonal load reduction, and valley filling.
I Many gas, technologies do not produce impacts that fit neatly into. these load shape. categories, but insteadthey span several categories.
151

figure 7-1. Utility load Shape Objectives
Res/Com Water HeatersForced Convection OVensInfrilred Deep Fat FryersFiber 'BurnerS .Regenerative Burners
Natural Gas VehiclesFuel CellsRadiant BurnersVacuum FurnacesCombined Cycle
Conservation
Res/Com FurnacesGas Heat PumpsAbsorption Coo6nglHeating .
Seasonal load Reduction
load Building
Gas Heat. Pumps.Cooling'& DehumidificationAbsorption. Coo6nglHeatingElecbic j.)eaking TurbinesGasCofiril'lg
Peak Clipping
(Storag.e DeliverabRity)
Peak load Shifting
Source: Samsa 1993
152

7.3 Gas Usage in Residential and Commercial Sectors
The structure ..•of gas ~igure 7"~."'.~":i.fl~~irJenti~IS.~f?torGasConsumptionend-use demand by<BlJilrJingIYP~/.(l~~O)· .provides an initialreference point fordetermining whereefforts to improve gasefficiency can best befocused. 2 More thanthree-quarters ofresidential gas MuIll-F8nily
consumption occurs insingle-family dwellings(see Figure 7-2).There is much more . MoblIeHomeadiversity of gasFon slIl1'lP ti .0fl by 4000
building··type .irfthecommercial sector, _IIA_
with mercantile/serviceand educationcategories showing the highest levels, followed by office, warehouse, lodging, healthcare, and assembly categories at roughly comparable levels· (see Figure 7-3).
Figure 7-4 compares the end-use distribution of gas cons~mption in the residential andcommercial sectors,·'shPVY'Il."asa percentage of each· sector's total. Space heatingdominates in both sectors: 70% of residential and more than50% of commercial. Waterheating is the next most important end-use, accounting fori3.~% and 15% respectively ofresidential and commercial sector gas use. Process heat represents 12% of commercialsector gas consumption and cooking represents 10%. The:pr~ominance of space heatingin the overall demand scheme for natural gas in the U.S.jsillustrated in Figure 7-5,which plots monthly gas Use by sector. The, highlyseasQnal nature of residential gasdemand has a significant effect on gas system load factors as evidenced by the fact thatwinter peaks in January are more than twi<;ethe summer minimum monthly load in Juneon a national basis.
2 The stru.ctureof end-use gasdemandfor.anindividualutilitymaYdi\'c~rgeisignifi~tly from the nationalpattern.
IS3

Figure 7-3. U.S ..Commercial, SectQr Gas GonSLilnptioO by Buildiog,Function('1989)
Mecantlleand service
Education
Offlce........
Wareh0us8.....
Lodging ,
Health Care
Assembly
Other
Food Service
Food Sales
Public Order and Safety
o 50 100 150 200 250 300350" 400, 450
Million DTh
Figure 7-4. End-Use Shares for Gas)n U.S. Residential and Commercial
80%
70%
60%
/0 ~ldentIal,' ••'. ',I,~CommercU!l •
40%
30:1;
20%
10%
0%Spece " Weier'· COOking Clothes Spece Process CegenerehonOlherHeeling Heeling Drying Cooling Heel
_ AliA IIll17end,-, IIUI.I111111
OVerall, gasdefuandin the residential sector is significantly greater thaneommercialsector demand (4.5 billion DTh vs. 2.8 billion DTh), with significant regional variations
154

Figure 7-5. U.S. Monthly Natural Gas Consumption by Sector (199J )
(Billion cubic ft)2 .500 -.-- --- ..----- ..-- ..-.---.- ..--.--- - - -.- -.-.- .
--- Residential~ Commercial---...- Industrial
--- Elec Utilities-i!l-- Total
1.500 .-.-.-- ....--.-
2.000
1,000
.. _._-_ _-_._._-_._----_._-----._~---_.__ __ ---..-..-.-..-..-.-.- -.-.- -.--- - --
oJon Feb Mar Apr May Jun Jul Aug Sep Oct Nov Dee
Source: EIA 1993
(see Figure 7-6).3 The relative shares of residential and commercial sectors in the overallgas market do not appear to result from climate severity, but from a host of other marketconditions.
. 3 Residential consumption is higher than commercial consumption in all census regions except for the Pacific(i.e., Hawaii and Alaska).
155

figure 1-6. Residential and Commercial Gas Consumption by U.S. CensusRegion
1.000 1.200 1.400800600400200
Mid-Atlantic
New "England
o
~ Commercial
o Residential
E. N. Central
S. Atlantic
E.S. Central
W. S. Central
Mountain
West Coast
Pacific
W. N. Central
Source: ELl'. 1992Billion cubic feel
7.4 Opportupities for Increasing Gas End"JJse Efficiellcy
7.4.1 Practical Constraints on Achieving Technical Energy Savings Potential
Energy savings that are achievable for gas utilities through programs aimed at increasingcustomer energy efficiency are constrained by a number of factors. The question ofachievable energy savings potentials sometimes stirs controversy, to a large extentbecause of semantics. It is useful to distinguish three different types of "energyconservation potentials" cited in the literature.
• Technical potential is an estimate of possible energy savings based on theassumption that existing appliances, equipment, building shell measures, andother processes are replaced with the most efficient commercially availablealternatives, regardless of cost, without any significant change in lifestyle oroutput.
156

fi911.re1-1...Economic .and Achievable Electricity Conservation. Potential inNew York State
40%
35%
30%
25%
20%
15%
10%
5%
0%Economic Potential(%of 1986.Elec.Sales)
• Market Forces.& A.rst-TIerSiandards
••. Revisions to CUmlnt. Codes ,& ~ards
IllIWI ~tandard8 on Addi~1ona1~'#S•• UtllityConservation Programs
Achievable Potential('" of.Proj~~?()()8.B~c. Sale,s)
• Economic porential is an estimate or the portion of technical potential thatwould be achieved if all energy-efficient options were adopted andaQ.existingequipment were; replaced whenever it is cost-effective to do So', .based onprespecified eConomiccriteria~'without regard to constraints such as market.acCeptancearid'rate impactS~ .... . '.' ,.. "'i'"
'I,i.·.··.··,. .i ,._._ ...........•.
Program 'llChievaJiie iloteTitial is an estimate' of the portion of economicpotential that.would beachieYedjf all cost-effective,energy-efficientoptions
,~.:...•. :';.: .:;.::: ; : : >.:~, :..' :; ·.·;..·.::.: ··.';:I::,~·.>:.:::··.;·.;···.;:.i·-·'t·::.··;····,·.· .•.... ; :.:;.~: ..• ::..: :.._::.. ::: :.: .. ;.;:.:................... .." ",
promoted .through u~litY'])S~progl1UJlswe~ .adopted,~](cluding.~y·energy-ef~ciency ~ains.acl1ievedthr0ugh.ll?rmall11arketforces •.and comp~ance withellergy codes and standards.' .
Each tYPeofconservati0llpotential ~escril>e4above is.a subset of .the.onethat precedesit, whicbnecessarily.resultsiirdiminishingo'pportlJniti~ thatcan be captured by utilityDSM programs. Figure. 7-7 .illustrates this phenomen9n,calculated. for electric utilities
157

in New York state (Nadel and Tress 1990). The left bar shows tlleeconoll1icpotentialat 34% of current electricity sales. Achievable potential. (which includes savingsachieved through standards.and market forces), as depicted in the right bar, is somewhatlower. at 28% .of a future y~'s sales. In this study, the achievable savings that couldbe captured by utility DSMprograms is about 14%, or about three-fifths lower than theeconomic p<:>tential(ona percentage of sales basis). It is critical to distinguish amongthesedifIerent typesofpotehtials when reviewing and comparing studies of conservationpotential.' . .
!Results of Gas DSM Potential Studies
!if,x'(:)~l!DSMpotential studies in the residential and;;i~.ieas utility service territories. •.Appendix B, Q~rlying.assumptionsused in estimating potential
n4icated (see above for defmitions) as.well as-uses considered. The savings. potential is0!~current gas sales (not including transport8~estimating economic potential and typically
..3'mitheresidential sector and 13 to 40 measures'-"', .:..; .... : -:.'
With one exception,Jthesesfudiessuggest that, in percentage terms, thepotentialJor gasDSMsavings is greater in the residential sector than in the comm~rcial.sector. For the
" i"·~esig~n~alsegtor,··econ()JIlicsa.ying~.PO~ntial~"I'llIlge;~~QmS%i·t()4'7,%,withzmbstistudiesfinding around 25%. For the commercial sector, economic savings potentials range from8~ ..to 73%, ~ith. most studicrsfinding elf. .0uQ.d 15:%.....•. .. '.'.... . .. " ', ',' ,', ,', ,-",' ' " .' .
..~;::~.,,:,'. ,v:·~· " .··..·.··:.':i'i-· ... :.... ':.::,<',' •......-.>',,:><";,;<.:: .. ,'.::
.A..'few. of tp..estu.q~es.also. assessed..·.<ecpnpl1licJu~.hsvv~~c:hing':.P9tential....·• __switching fromelectrlcityt() gCiSatthe end~se,p#mClrily:;~;~va.1l~,K.rl:Hirlg:stra~~yJorthe gas utility.The economic fuel-switching potential vvClS~still1~@i>Wibehigh.~r}nthe commercialsector (2% to 49%) than in the residential sector (2% to 7%), primarily through the, promotion of commercial gas cooling ~hQQl9gics to bQ()stsumm~r gas sales." '. .., .. " -.. , . , < .,.' , .> -.... ,;.. .. '; .,..~. '. ,. : . . .; "
. ·.A~Qidedcosts.·use.9..jn ·sCreCnin~.the'leEhriQ19giesif,q(estima#ng.economic savingsJ>Q~ntial__cp-guably..•.the ll 1pst.iIIlPOJ;tan.i.~~~le.in •..m~..iscr~ning ;;.process-varied.considerably' among the' studies depending .•on:.!~sulflti()~iIIleth()(),c:xtent of seasonaldifferentiation, estimated gas commodity cost escalation rates, and' time horizon (seeAppendix B)~ Itis quite difficult togem~raJizefroll1.th~gas. saY,ingspotc:ntialsresultsbeca•.•se of methodologicaldiffer~ncesamong stpdi~sa.s.vvFllas the.diverse .structures ofgas .•.•se am()ngindividual LDCs .• Nevertheless, thestl1dicss\l~~st the scale of the DSMresource that may be available in U.S. gas utility service territories.
158

YI>
"01
POle
mi•
•Te
chni
c"Economic
4o,,"
11
11-2
0""
124-32""",1
32%
Pr<>
grem
Ach
ieva
ble
Fuel
Swilc
hir>
O-7%,
enur
ee.yi
ewed
III
2nd
Ule
aCon
eide
red;
Spa"
"H
aalln
g)(
)(26
""X
XX
I)(
Spa"
"Coo
fina
Wat
arH
aatin
gX
14""
XX
IX
Coo
king
XCIO
lhee
Ory
ln;
XX
Table1-1.
ResidentialD
SM
PotentialforSelectedGas
lWlities
-2%
3613
XX
X XX:
X X
IX X
8'11>
X
X X X x:,
-e,%
40
17-2
0'"
Bro
okly
nU
nionIN
atlo
ndfU
alG
eeG
M
X X X X
·lIe " 70
1B-le
%
VI>
"01
POle
ntla
lTe
chni
cal
Econ
omic
Pr<>
gram
Ach
leva
b'kj
Fuel
Swltc
hin;
'M
eeeu
r••
Rev
iew
ed('1
ndU•••
Con
aide
red:
Spac
eH
eltln
gSp
ace
Coo
llr>O
WeI
erH
eatin
gCoo
king
Clo
thee
Ory
lr>O
Pro.
.,..
Haa
tO
ther
Table1-2.
Com
mercia'iD
SMPdfential
forSelected~G
asUtilities

impact of Standards
The potential DSM savings available to an individual gas LDC are determined.to a greatextent by the unique combination of existing building stock and equipment characteristics,weather severity', energy prices, and other factors unique to ',a servi£eterritory.However, ,existing .and•impending federaLefficiency standards, for gas appliances andheating, ventilating and air copditioning (HVAC) equipment are ~ajor considerations forevery'gas LDCattemP:9ri~'to 'assess its achievCibleDSM potential. These standards raisethe floor of efficiencY~Je~els.ofgas equipment available on the market, and, over timethrough equiplllent .•repla¢ement and installations. in new construction, they increaseaverage stock efficiency as well.Table 7-3 summarizes ll1inimum efficiency levels and timetables for.instituting andupdating standards' for·sel~ted gas appliances '.and equipment used in residential andcommercial applications.4, '••At the state and local levels, energy standards for'buildings.and/orenergy-using equipment"have also been promulgated ,as voluntary guidelines oras mandatory regulation~, WithCorrespondingimplications for gas tJtilityDSM.prog~effortS withiii,those jurisdictionS. ..
. ,. . ,
Utility DSM programs can accel~ra,tethese changes in the existing buildingstpck throughretrofit programs ;that piomote~ly retirement of less efficient·applian~'and replaCe~emwithapplian~tQaicomplf minimally with the standard. DSM pro~iams canal~focus on appliances and equipIDent that exceed the standard, promoting. tpese .in theretrofit, .replacement, and~ew construction markets.
impact of Previous Retrofits
Another significant factor affec:tfuggas DSM potential is the extent to which customershave taken previous actions or u~lities have promoted, efforts to,raise the efficiency ,ofgas use. Generally each'successiveDSM measure implemented gives diminishing returns,where interactions an.tqllgl1leasures<makethe combined savings)ess than the sum ,of theindividual savings. Early programs to redtJce',energy use in homes were conducted inthe 1970s and 1980s under the auspices of'the Residential Conservation Servi~; thesewere mainly focused on building shell measures to reduce home. heating and coolingloads. Likewise, electric utiliti~ .with overlapping service territories may'have alreadyinstalled building shell measures in customers'homes, or other measures that might
4 National standardswere established by the National Appllmce Energy Conservation Act of 1987(NAECA) with timetables for various residential applimces md HVAC equipment; the Energy Policy Act of1992 extended efficiency standards to cover commercial HVAC equipment md water heaters.
160

Table 7-3. Federal Energy-Efficiency Stanc:tards ,levels and Timetables forSelected Gas Appliances and Equipment
ResidentialFurnacesBoiler.sWater"HeatersClothes DryersRanges and Ovans
CommercialFurnaces & Boilers
(> = 225 kBtuh)Water Heaters
7,B%,AFUEBO%'AFUE54%EF2.67Ibs/kWhn/a
80%77%
199219921990
1994 h~st.)·1996 (ast.)
1994
> ....•....•• /' ",'-.- -., .•....•.. , .. " - ., .' .. , .. , , : -.'
d~i{c~~hedJI~d
200220021995nfa
2000
Notes:
AFUE = Annual Fuel Utilization Efficiency
EF •••·Energy Factor.
RGSidentifwaterhetater E,F.dependent on. storage tank size; listed value for 4O~gallon tank.Unitsfofclothes dryer efficiency levelare.lbs. of clothes/energy input (in kWh).~ange and.,oven levels have not yet been mandated by DOE,Commercial unit heaters not covered in standard.
Commercial water heater standard listed is for storage tanks larger than tOO gels.
S()urce: Geller ,and Nadelt99.2
affect the. savings potential for gas, such as night-setback thermostats or .low-flowshowerheads.
161

Time-Dependent End-Use Efficiency Opponunities,
Studies of CQl,lservationpotential often ignore the time dimension associated with anypractical effort to capture identified savings. Some measures will only be cost-effectiveor even possible at .the design stage fo.rnew buildingsorattheti.m~. of. a majorremodeling' or equipment replacement. These opportunities are time-dependent in thesense that they occur only when customerS are making equipment replacement decisions ..·LDCs evaluating.de ll1 and-sideopportunities must account for the extended time periodsrequired for theset~s of DSM programs to. have a significant cUll1ulativ~impact. Forexample, a study of gasPSM potentiaLin New York conducted by the.American Councilfoi ..an Energy-Efficient:Economy found that .40 to 50% of, the. savings opportunities inthe residential sector were achievable through replacement programs; only the remainderwere achievable in the short-term through retrofit programs. For thecornll1ercial sector,a smaller percenta.ge (Le., 20%) of the program achievable sector.savings.were tied tolong-term replacement programs (Nadel etal. 1993b).
Persistence of Savings
Another practical issue relevant to the time dynamics of DSM prog~s is.the persistenceof energy savings ..•..Persi~tence.has .e.IIl~rged as a.si~~ificant> con~I'Il'anl0ng DSMpractitioners (Vine 1992).. J:lrevious studies.o{.persistence have.tended to focus ontechnical measure lifetime although both technology and human behavior affectpersistence (Jeppesen and King 1993).
Table 7-4 lists factors that influenCe the persistence of DSM measures and programs,many of which are behaviorally-oriented (Hirst and Reed 1991).5 Among the behavioralissues, the rebound effect (also known as "snap-back"or "take-back") can be particularlyimport.ant(i.e., vvhen. customers. increase:' their arnenity Jeveljn '.response to. loweredenergy bills from installation ofDSM measures). The opposite response can also occur,kno~n as the surge effect wher~ customers,b,ecausethejrawareness of energy-efficiencyissues' is raised through participation in the program, alter their behavior to lower theirenergy use or to invest further in DSM measures on their own. A number of strategieshave been proposed to ensure the persistence of energy savings, including measurementand verification plans, program design, operations and maintenance, and buildingcommissioning (Vine 1992).
5 Note that program persistence includes all the measure persistence factors as well.
162

Table 1-4. Factors Influencing the Persistence of. Energy Savings
Technical lifetimeMeasure installationMeasure perforrncBnceor efficiency
'i~ecayMeasQjre,operation (behavior)Measur,~maintenance, repair,
~()m01i~sioningMeasure failureMeasure removalChanges in the building stock (i.e.,
renoVations, remodels,alterations, additions)
Occupancy changes (turnover inoccupants; changes inoccupancyhours:and.numberofoccupants)
Rebound (snap-back, take-back) .effectsSurge effect (additionalmE!asures-
added by customer after initialprogram participation)
Replacement effect (replacing efficiencymeasures with lessor moreefficient measures)
Energy use by control group
(a) Program persistence factots a.lso il!.clude.measure persistence factors.
Source: Misuriello and Hopkins 1992
Summary -.ofPractica[· Constraints
Energy~ffiCiency ••standards, previous 'government and./electric· .utilifirc()hservatipnprograms, time-dependent savings opportunities, and issues' related to the petsistence ofsavings are important factors that must be accounted for in assessing the savings potentialthat can actually be achieved by gas utility DSM programs. _Empirical ~vidence from.electric utility DSM experience shows a significant gap between the economic potentialfor energy effiCiency and savings reductions that have been achi~ved in utility DSMprograms.
Table 7-5 compares the performance ofthebestU. S..electric Utility'DSMprograms inthe commerCial and industrial sectors by end u~ in terms.of overall sayings"'achievedagainst the size of the economic resource theywere exploiting (Nadel and TreSs .1990).Although several of the .electric end-use categories are not directly applicable to .gasutilities (nor can one assume that LDe DSMprograms will exactly parallel those of
163

Table 1-5. Economic Potential 'Is. Actual Savings from Best ElectricCommercial and Industrial (C&I) DSM Programs
UghtingHVACMotorsNew constructionMultiple end-use retrofits
Source: Nedelend Trelllil1990
60% of lighting use51% of commercial
HVAC use17% of motor use50% or more45% in the commercial
sector
25% of lighting use11%of A/C '&heat pump
use5% of motor use30%18-23% in commercial
buildings
electric utilities), the general point is that the most successful utility DSM programs arecapturing somewhat less than halfofthe oost--effeetlveresource suggested by economicpotential studies... Numerous .factors .contribute to this· difference.· Aggregate marketpenetration levels for a utility DSM program are very depel14enton tbeprogram 's abilityto actually influence individual customer decision-making, DSM program budget andmanpo\Ver levels, aJ1~'~u~d~~ ..st()C~aJ1~~~igm~pt r~l~sem~nt t1J~~~~r.~~;., Cicroalsavings<arebften .lower 'tlWl'engmeermg estimales.. Filially ,while recognizing that thesize of DSM resource that can be captured by utility DSM programs is substantiallysmaller than is suggested by economic DSM potentialstudi~~,ul1explgited.cost-effectiveDSM resources most likely exist in most gas utility service territories. The next sectionsfOCUSon ~94-use ef~ci~9cy andfuel ..switching options·tha.tcan be prgmotedbygas LDCsthroug~.utility DSM ,progrmns.
7.4.2 Gas EfficienCY¥easures
The studies of DSM potential described above clearly suggest that many individual DSMmeasures and strategies have been considered by gas LDCs. Table 7-6 lists broadcategories ofDSM,llleas u resforLDCs--equipment,.buiIdingshell, ••distribution for the~ ..conditionmg .systelll,HVAc; system. control, ,and water heating control-andiJldicates•their applicability to the residential and commercial sectors. ,.•A more detaileddescri,PtiC)fiofgas-fired .equipment lJleasures and their relative efficiencies is presentedin. {\ppendixD .. Measures hold promise for gas savings depending on the demand forthe end-use service and the current efficiency of consumption (base-line), both of which
164

Table 7-6. Gas Efficiency Measures
Equipment Measures
Shell Measures;l~~.QY~.!·§;B~/~D!YJ~~~;9::;>i,:<:;;,,'f::~::i;}~:.'Infiliratlon"'rediJ"ctlo'n .:l·M1i!~,pl~fp!ne·:Wi~.i!9~~tUi;~~.. .(ow~emlssiviiY~'argori'gas~
steam.i·lf~m:a¢..~)·f~~:!r~rmQ~~.t~~i4~~m~r.it~rtl:1:~i;..c.·k.c ·;;;:·\;(~I:~:;~::;::::.:::•.:·<";'" '>'N';;'. Boiierwateriemperaturim'o'dulation . . "·x· ··,:;X·,.En~·rgy·rn.anaije.n.~~I~y.s.tei1j:; '. ':."':::"';";.::..':;';:; ... .HvAc $upply~air 'temperai,irere'iefcontrol'
., ;'t·.:
Water Heating Control Mea~iJres,:.w@tf!.r;:ti~~!~l~a~kjh~lJlllt!(jij~:~:;i.::... .g: ,..:::':::.",. 'Wate'r 'h'eattii,deniiincf'contr'oUer"" d, , ,.,.,
.:·A'e~;~t~~:~Jtir.te~#~.f~i~f~/!1P~~I~ti9n]gf~'\ :;Ho.rizq~:(8,:~:_xis·:cr~~~'::W_~~~~t;l\r:t;~:~;~{~~~:~~~l..,.;.,.>v~j~?:{;::~~~i·:~i:~~::;;;~::>::,~:';:}:: ..
Low':'flow"·showe'r'heacts and~fa'ucets· ,.
are site-specific. Local climate, construction practice, and structure of the economy helpdictate the technical feasibility of DSM measures. Also, many gas efficiency measures
165

will have already been implemented throughDth~relectric utility, water utility, DrgDvernmentprograms, Dr by nDrmal.market adDptiDn.of technDlogies.
7.4.3 Efficiency Measure CDst-Effectiveness
The benefits .of high-efficiency gas equipment have t~.becomPar~t~thecDst incurred(irany) in determining cost-effectiveness. It is~Y9P~tIle.~pe()fmis primer tDC()mprehensivelyanalYzetheecQnomicsDf th~}J).~H"~iI1~;a.RgM~~()PS'i HDwever,key consideratiDnsJDr econDmicscreening .of technOlogi~s are.9J~1l§~,.f()nDwed. by anexample .of .onecost-effectiveness index commonly u~.inprep;uingsupply curves ofconserved energy. 6
lfi,ghefficiencyequipment measures usually involve tradeoffs~e~~?'~igherfirst costthan some conventional alternative .on the .one hand and. ~ee;r~y.~sti~Yings .over thelifetime of the .J11easure.onthe. .other.. The appropriatec()s~ t()a.ttpPll~to.the measurefor ·.thepurposes .of the econp.I1'l~c:..a.nalysis..depend•..9n ..the.situap()n..(•.If the measure isunder consideratiDn when equipment is being replaced Dr selected for use in newconstruction, then the appropriate cost is the differen~bet\Veenth~fOstiofthe efficientteChnDlogyand .•the conventiDnaltechnDIDgYim~tw()\lld.othe(Wi.~pe~l(X;ted .. If aswndard..prescripes some minimum efficiency' level, ..Ute;Pth~a.RP~()pria~cost is thedifference between the DSM measure's cost and theoost .of a teehllDIDgythat simplycomplies with the standard. If the measure is to bejnstalled inpl~ce()f equipment thatstill ~a.susefuLlife(Le., in. a retrDfit situatiDn), then the>fulLcDstDfthemeasure isapprDpriate to use in the economic analysis.
;{ '.
Inte.nsity of use .of equipment is a key;partun.~te.··r·th. 'at ...o..n..·v.e.·s\!yeconpmicanalysis .., .'"',......' '.'.'. ....'.''.' .',','.'. .. '.' ... .'...' '. '. .. ...'.' .' .... .... .~"~.,:,..:..'V~.,~ ':' C," >:.," .',,:":': ,',','',",':
E{ficiency gains in equipment perfDI:Jl1an~.;~~e~~¥a.s IJl()ne;tarygains .Dnlyif theequipment .operates enDugh to generate savings .over time. For instance, installing ahigh-efficiency furnace in Miami may nDtreapelloughsavings during the relatively shortand mild heating seasDn to justify the increased expenditure;hDwever iiniMissoula,sufficient savings may accrue .overthe wintert~justifY.lhe fUma~.~nDmicanalysisalso depends .on: the differential between conventiDnaland DSMmeas\lree{ficiencies;the incremental cost .of a DSM measure; and f\l~lprices.l~.~u9iJ1g th.~.intensity .ofequipment use through .otherDSM Drconsef'Ya.~()nacti()ns canM'f~tJhe attractiveness.of any subsequent investment in efficient equipment. Heating and cooling IDadsfor spaceconditiDningare affected by weather, building constructiDn,building .operatinghours andconditions,· and/otheruses/of energy· inthe6uilding.Domestic· andserV'iee hot·water
'·A completepreseotationof the standard tests used innSM progrtim screening (Le.followmgteChnologyscreening and aggregation of technologies into DSM programs) can be found in Chapter 6.
166

heating, cooking, ,andclothes drying demandsvary by building useand function and canbe altered by DSMactivities.
figure 7-8. Supply Curve, of. Saved Gas in CommercialSector. for ,long Is.land lighting Company
10
8
30
CCG is formally·
20Cumulative Savings as a Per~nl of Sector Consumption__ .....1_
2
oo
A convenient index for'ranking' ;and'screening"DSM "measures is thecost ,of, conserved gas(CCO). This index isused' to' constructsupply curves ofconserved,energy, withthe' CeG on the"ve~tical ,'axis and~ravingson thehorizontalaiis. :Art:example ,of .such' a"supply curve of ,conserved gas prepared for a New York LDC is shown in Figure 7~8.defined as, . '" , ,
Incremental DSM ..Cost·xCRFCost of Conserved Gas == -------'------ Period Savings
where CRF'is the,capital recovery. factor used for amortizing the initial investment intoa periodic payment,' analogous !pa, mOl1ga.~epayment.7 The CCO is typically calculatedbased on annual gas savings, but could in principle be calculated on a seasonal basis.
A principal advantage of the cost of conserved energy is that it is expressed in dollarsper unit energy.and. therefore. can be dit:~tly compared to tl}ecostof the fuel displaced(either at the applicable.retail rate or avoided cost). Future energy cost expectations are
7 CapitaIrecovery factor'·b:: d/(l - (1 + dJA_,,), where d is the discOunt rate and " is the measure lifetimein appropriate •time units,USWllly years.
167

also exogenous. A disadvantage.Jsthat CCO inits.pure form ignores the capacityimpacts of DSM measures. although this limitation can.be mitigated ·somewhat.8
Cost-Effectiveness Calculations for High-Efficiency Gas Furnace
This example shows stylized cost-effectiveness calculations for...",.high ..~fficiency(condensing) gasfumace.in a typical U.S. residence..i\-.lltility nU~~t~rform thiscalculation in initial DSM technology economic screeniIlg'()r ijn~nstrUcting ..a supplycurve of conserved gas for the purpose of assessing economic.savingsi>OtentiaI. Whilewe do not intend to show all the possible intricacies of a heating equipment replacementdecision, this example presents the method and some()f the sensitivities..to inputassumptions, in simplified terms.
(1) Located in a.mid-Atlantic state, this single~familY dweUl11g.with thermalcharacteristics typical of existing homes. in the region has.aheatipgJoad of 65MMBtlI/yrbasf>.d~?GRIdatl (Holtberg et aI. 1993). The existing 75"000 BtuIhr ,furnace needs to .'be' replaced, and the homeQ~~r is ..ch()()sjJ1g.between aconventi~nalf11~a~Just.~~tin~theNAE~A stan4ar~,s.(AFUE.7~%) and ahigh-effieiencycoritlensmg'Jfurriaee(AFUE ;.;.'92%), il>oth•With3~year expectedlif~times.~e 1ir~t.()ptionwillcost$2,()O().instaUed~liM~Jl1~~Ildoption costs$2,400. Assume that the utility uses a 6% rem diScountrate .• The cost-effectiveness of choosing the high-efficiency furnace over the NAECA-conforming.fufnaceis ·.as.follows:
Savings = Heating Load x (1 1)AFUE,IM AFUEee•
::;65. x" '("'0.·.17'8 2..) =•.12.7 D1'hlyr''0.92' ,. ' ,
CaPita.l RecoJli-/Factor = 0.06 =0.07261 ...;(1 + 0.06)-30 '
8 One way is to calculate a separate index based on the capacity savings alone so that the denominator isannual peaJcsavings instead .of energy savings. Another approach is to incorporate the capacity cost. savings intothe CCE by subtracting the annual capacity cost savings from the amortized investment cost to yield .a compositeindex.
168

Cost 01" Conserved Gas '= (2400 - 2000) x 0.0726 = $2.3/DTh~ 12.7
The CCG can,now be compared to the price of gas for this customer class (as ameans of testingDSM measure cost-effectiveness from the recipient's perspective)or to the appropriate gas avoided cost (for a societal ,or utility perspective); thesocietal ,or utility ,perspectivescustQrnarlly include program administration costs(see Chapter 4). Because gas tariffs for residential customers are generally higherthan assumed here, the high-efficiency furnace appears to be cost-effective fromthe recipient's point Qfview.
(2) Now,suppo~jth~home is located, itl an()ther, region with different buildingpractices 'and ~qcal clim~te,aqd "a~ompanying 'change in heating load .• , The(heatipg load,'equIpbe lowe~b~use,()fawa.rmerclimare ()rbecauseth.ehome hasJlighert~erm~integrity; energy standards in D'laJ1Yjurisdictions require newhom'e.~tQpei,b-uiJt',~ith,higher thermal integrity than~xi~tinghomes.,~ssuming"allotl1erfactorsr~ma,inJhe,same,·. ~e.f0st of conserved gas.forth ese'generallQCat,ionswould be:' , ,
,!..ocatiQD
:N'ewEnglanc\, Pacific'G9~stSouthW~l' "
1004530
$1.5$3.3$5.0
This. hypothetical,,·situation ,illustrates, the "point. that the intensity of"use (i.e.,","h~ting load) is' a key fac,tor in DSMmeasure cost-effectiveness.
(3) Consider whether to retire the existing furnace early and install the,.high-efficiency furnace in its place. In this case, weare ,comparing the efficiency ofthe existing furnace to,tbat of thehigh-efficiencyfurnace.Ex.isting gas furnacesin u.s. homes have an average AFUE of around 65%. In the mid-Atlanticregion with its heating load of 65 MMBtu/yr, we find annual savings of 29.3DTh/yr from using the high-efficiency furnace. However, the cost in thissituation is the full measure cost, i.e., $2,400. The resulting CCG is $5.9/DTh,which is higher than typical gas avoided cost estimates or residential customers'gas prices, so this application of a high-efficiency furnace does not appear cost-effective. However, the economics would be somewhat more attractive in a moresevere l1eatingclimate.
169

(4) Different assumptions regarding furnace lifetime or consumer discount rate havean effect on DSM measure cost-effectiveness. Changes in these assumptionsbased on the scenario in (1) result in the fonowing:
Real discount rate doubled to 12%:Real discount rate halved to 3%:FurnaceJifetime halved to 15 Years:
CCG =$3.9/DThCeG =$1.6/DThCCG =$3.2/DTh
7.5 Opportunities for End-Use Fuel-Substitution
Righ-efficiencygascand eleCtric equipment cansubSutl1tefor one another in manyapplications. LikeotherDSM measures, 'equipmentchoices'involving ,a substitution ofonef\!el source for another can' be evaluated as potential'r>SM'resource"opportunities interms ,of their'potential advantages'tocustotners',',utlllties'(Ooth ,gas,.'and,electric) andsociety.9 •., This: section focuses', on fuel-switChing'between""gas and electricity in theiesidentialand i:omm'erciat seCtors. As'sessing thements of fuel~substitution is morecomplicated than assessing an intra-fuel technology'"choicej' additional technical,economic, and other issues tllatsh()uld 1!eg>nsicl~redby utiliti~s andgQCs are identifiedand discussed brieflY. Thepolicyhnplieationsof end-use fuel-substifution are discussedin Chapter 8. ,', ,C
Figure 7-9 displays the current market shares (on an energy value basis) for natural gas,electricity", and other fuels in the residential and commerciaI:isectors~:'Natural gas has alarger share of energy consumI>tio~<thanelectricity in the r~~i~~titia1'septor(rough1y45%vs. 30%) whereas natural gas and electricity usage are comparable in the commercialsector. These, relative shares reflect the differences;in.the,two 'sectors in the servicesdemanded, the equipment providing thoseservires,:and a host, ofeoonomic and otherconsiderations historically affecting consumer choice.
Table '].,.7highlights additional technical, economic, 'and other issues that should beconsidered in evaluating fue};.·switchingDSM opportunities.
9 Each individual application has to be evaluated carefully to account for the particular circumstances. i.e .•the characteristics of the technology/fuel combination that is being replaced or compared to the one underconsideration. the relative cost of fuels. etc•.
170

figure 7-9. fuel Market Share in the U.S. Residential and CommercialSectors (1990)
50%
45%
40%
10%
5%
0%Coal
o Residential
~ Commercial
Solar'!
Wood
Source; Hellberg 1lI11f.'1lIl3','
Table '1...7.· Issues ,to Consider inAnalyzingf!uel.,.SubstitutionOpportunities
Technical
'Economic ",
,.
Relativeiisiteahdsource~nerg\fefficiencyRelative~iskof savings, performance degradatiOnParCl~iticelec,tricity consumptionof;some gas',equipmentlqadsnC!peimpa(!tsof gas<CI,r- d,el~ctrictechnologies on eachutility
RelatiVegas'and i el~ctriCtariffS, 'Relative gas and electric, avoided,costsRelative risk of price volatility and uncertaintyAccess to gas service, including hook-up •and line' extensioncosts
Other Space, noise, and aestheticsEnvironmental impacts and tradeoffs
171

Technical
ED Relative site and source energy efficiency of technologies using each .fuel: Byconvention,~nergy efficiencies of equipment or processes in buildings are.givenat the end use (Le. site) level, that is, at the point wheretl1~fuel is converted intoa service such as heat, motive power,etc.{(Ultimate cOrisllmers.•pf energy willprimarily be concerned with this measuI"f{of efficienc;y ••(15 it directly affectsoperating costs they incur. However, muc~.of the origj11a1energyvalue of thefuel is lost in resource extraction, processiI1~,iand tran5pOrtatiQnto the point ofend use. Source energy efficiency takes accc:)untofa111~sses.fromthe fuel sourceto the service. One aspect of a societal anal~~s is full fu71-cycle analysis, whicharrives at a source energy efficiency by taking the proollc;t.of the efficiencies atevery step in the cycle.
·•··.·.•·.i.··· ..••···.·•··..·..··.···.·,<';
For natural gas, losses incurred in thesyste,IDup totbeipoint of end.use havebeen estimated to be ..about 9% >nationally.<~oran 19~t).{.For electricity, theweigh~'average losses incuITe(}itt..t.hesystenlupto.We·l?<?itt~.of.enduse basedon the 'current national generating mix are estimated between 65% and 75%(Electric Power Research Institute (EPRI) 1992c; M01"al1.1~92).J\ctualvaluesforagClrtic.u~ uti1i~ .\Vill.~~~~u~tc:cjly..be.Biff~r~~t~~m.tpe~.n~~~~~r~verages.L6sses' ineleetric' generatl6n, transnusSIonaJid'dlstilbution also have cOnsiderablevari~tionwithamllient .:1elllperatureiiOnhot .days,generatof'{heatJates rise
"'because condenser temperaturesrise,andtransfofifier and line losses increase. Afurther subtlety~J1.th7el~w(;ity~~q~isthatth¥'~verage gen~ratiol)fuel mix evenfor agiv~p.utility ma.ynot '1l¥.th~best. basis-Jor estimating source energyefficiency.••..A·moresophisticatedrandpotentially·more accurate representation ofsoutce.energy.··efficiency·. would ··ta1re••into·acal1.lnt the most likely electricitygeneration source(s) to serve the end use in question. For instance, the lossesassociated with a hOL~ater hea~r.H~pltil1g.()Il,~more.orl~s.~nstant annualbasis may best;~r'mres¥n~byab~IQadplant; Jor an air conditioneroperating il).asummer peakinguti1ityservi~.territory, they may best berepresel)t~,byapeakingp1ant. .•Insome circumstances, one might be able todraw such distinctions on the natural gas side as well. This point is relevant forconsidering environmental impacts as well.
In sum, source energy efficiency is the product of the site energy efficiency of thedevice under consideration and the efficiency of the entire fuel-cyc1eup to thepoint of end use.
Relative risk of savings peifonnance degradation: Fuel-substitution DSMtheoretically provides more reliable savings for utilities than intra-fuel DSMbecause it effectively solves problems of savings persistence and snap-back.
172

Economic
However, depending on the application, unanticipated user behavior could in factlead to savings degradation. .Utilities will .need to exPeriment with fuel-substitution DSM to verify that actual savings ,.meet expectations for highreliability .
Parasitic electricity consumption of some gas equipment: Some gas equipmentandapplicmces use. electricity for ignition,. venting fans, . etc., and thisconsumption needs to be ·accounted for explicitly in any energy use or economiccomparison.
Load •.shape·impacts ofga.r:and electric tec1miJlogieso~eachutility: Making achoice between technologies has an effectonilbad pattems~The technologyselected wiUcreate additionalloaci on one utility;thetechnolo~ythat is displaced··represents cmabsence of load on the utility th~t.wouldhave. served it. The load-shape·in'lpacts of the competing.technologies will likely be different and shouldbe properly valued in estimates of avoided.cOst.
,Relative gas and electricity tarit/S:In'orderforprograffiparticipants to calculatebill savings arid fOftheutilities who are respectively l?sing and gaining customersto calculate. revenue·'impactsJr?m /a-DSM .1>rogram,..theitariffsof both utilitiesmust be addressed 'in the economic assessment including all applicable seasonalor time-of-use rates and demand reservation charges.
Relative gas and electricity·avoidedcosts: The difference . in avoided costsbetween the two utilities on an energy .services basis isairey measure of thepotential societal economic benefits of switching from .one fuel source to the'other.
Relative iiskofprlce volatility and uncenainty: Different fuelspose varying pricerisks to ratepayers. Because electricity is typicanygeneratedfrom a variety offuelsourceS,the impactofaprice'change for anyone fuel will tend to bedampened in. the overailelectricity'price.· . However, both electricity and gasutilities are subject to other regulatory .and market risks that can translate intoprice changes, and expectations of these changes should be incorporated into fuel-switching analyses. ,.
Access to gas service, including line extension and hook-up fees for electricity togas switches: Some DSM programs promoting the substitution of gas in place ofelectricity may be collstrained by lack of access togas for spme otherwise eligible
173

cu~tomers. Line extension and hook-up costs .should be considered In theeconomic analysis of these measures.
Other Factors.,. : ...•... ,
SP(lCt!.>llOise,.(1n4.~~t!zetics:Compeppg ~lectric and'gasequipment can havedifferent space requirements, both for size and location (i.e., interior, exterior,near an exterior wall, close to the point of end use, etc .) Noise and aestheticscan be.an. is.sue.for "sol11e.eqlliprpentin•some circumstances, .,Ilecessitatingspecialcopsiderati(mand ..lJlitigation,••
::', : " : ':. ":. : :".: .. : .... ",~EnvjrQnnzentCll.i11lPtgtsand tr~eojJs: Environmeiltal consequeIl~sof energy usear.e.·a grm.vingpublic,.,Gopcem~....•.'.J&nd,;"water,.,and..,air·pollutipIl~temming fromenergy consumptiQn,sandegrade Jlllmana,nd,~sY~te.mhec1.lth..Comparing end-use technologies with this concern in mind should take into account the type offuel consumed (and all its attendant impacts occurring throughout the fuel-cycleup to the point of end use), the end-use efficiency of the technology (Le.~,howmuch fuel it consumes), the on-site impacts from installation and operation of thetechnology, andtixmpg·.of.th.eimpactsQ!uripgth.e.da.Yan~frol11seasonto season.Idpaily,.,.(lPC?JwouldJ~HPt; f()reIl~ironl11tm~ il11pacts0f •.mcmufacturing anddisposing.of.th.~,enq-ll~!techn()logyasweU '(L~., \lPStream.•and downstreamimpagts) (E~ectric:Jlower.~eseaI'chJnstitute(EPRI) 19Q2c).
Generally for electric and gas equipment used in the commercial and residentialsectors,. ,air pollutantemissionsfr()mthe(:()mbusponoffossil fuels are the areaofgrea,.te st(:()ncern.The 4lir' pollutants often cite4include.carbon dioxide (COJ,sulfur dioxide(SOJ, nitrogen ()xiqes(NOJ,carbon lJlonoxide(CO), nitrous oxide(N20), volatile organic compounds (VOCs), methane (CR.), chlorofluorocarbons(CFCs),IO total suspend particulates (TSP), and air toxics including mercury,heavy"IIletals,radioactive g~sand ·particles., Air emissions <:anbe classified bywhether01ey .are jmplicated. dppr<XJucing,globalimpacts(as\\'lth CO2, CR.,CFc;s, .andN20 iIlglobalclil11~techange), regional impacts(~with S02 and NOxin acid rain), orlQCal impacts (as with NOll, VOCs,and particulates). PowerplanLemi~sions.of. S()2,NOx,and.C02havebeen a primary concern ofenvironmental regulators and ..morer~ntly, .state PUCs. (;oal- •and oil-basedgeneration produces relatively higher levels of S02 and CO2;gas-based generationproduces relatively higher levels of NOx• For gas-fired end-use equipment, NOx
10 CFCs are not a combustion product but are used ili refrigeration equipment and as a thermal insulationmaterial.
174

emISSIonsare the major concern although CO and N02 and, occasionally,particulate emissions from unvented equipment can contribute to indoor air qualityconcerns.
Air emissions at the power plant can be accounted for in a number of ways. Oneapproach is to use an average fuel-mixconsi<ieringtheperformance of plants(Le., .heat rate) and ..the,presenceofanyemissions '.•controls (e.g., selectivecatalytic reduction for NOxol flue ..gas;desulfprizationfor SO:z).A refinement of
.. this approach is to distinguish,theffiix;~ofgeneratiol1resources by season because.thelevebofdemandand·availabilityofsomeresources(e.g., hydro) often variesseaSonally. The>seasonal,average,generationfuel.,mix~based emission rateswould;thenberpaired with:seasonalloaq iimpactsof the ehd-usetechnology underconsideratiomto arrive at the;end...use emissionsimpactr.A second approach is to'consider·thechang~s .10 air 'emissions:'that wouidoccuraf the margin from;eliminating'or'adding;theelectric'end~use;technologYreither!asa:mIX. of marginal),plants·orias,cl single:,margil1alplant(e.g.;comtnIs.tion' turbine). Whichever. .approachisiused to accountfortheemissionsof;e1ectricpower' plants serving.electricend-usetechnologies,' ..thegeographic>locationortheemitting plants andthe timing of emissions of certain pollutants.can be critiCal to·assessing local airquality impacts, a concern in many:U.S.•,urbanair~sheds.
For gas end-use technologies, the principal air emissions take place on site. 11Because LDC residential ~d commercial customers'.ate mainly located in urbanareas, NOx emissions from their gas-fired equipment and appliances cancontribute to smogproblems;dependil1g on the coincidence of smog episOdesandthe.useofthe.equipment.For instance,gas cooling technologies'emissions may
..'behighlycoil1cident with urbansmog;because maIlycitiesexperience.their worstsmog during"the hottest summer 'weather~'
Another.issue for air emissions impacts from end.,;useitechnologiesistheevolutionof environmen~l regulation at the federal, state, and lOCallevels. '.Changes inenvironmental regulation may alter expectations of future emissions, especiallyfrom power plants. In some cases, regulations may effectively preclude sometechnologies from being marketed and could be incorporated"as sensitivities in ananalysis. At the federal level, the recently enacted Clean Air Act Amendmentswin .significantly;.alterthe S02 and NOxemissionsin' some electric utility service.,territories. '.Li1cewise,arecentJederalcommitmentto reduceU.S.greenh9use gasemissions to.1990 levels by the year 2000 islikely to have an impact on electricutility resource portfolios in the future. As an. example at the loCal level,
II CH.emissions;as loSses along the pathway from production to' end use are the primary off-site emissions.
175

environmental regulators with jurisdiction over air quality in the Los Angeles areahave enacted strict controls over emissions from a variety of sources, includingbut not limited to power plants. Other urban areas may consider similar actions.
Finall¥, several statePUCs haye>adopted or are. considering assigningenvironmental.extemality cost values iwresidualemissions (Le., those not alreadycovered ,by,,existing .regulations) fOfusein benefit,,:,cost.analysesof resourcedecisions made by theiI'regulate(tutility;companieS. ,Exreroalltycost values (alsoknown as "adders"~ forindivi.duahpollutants ,arelbased,onanestimate of the costof ..damage caused by the.poll\ltants~ ..Adders.derivedfrom·thisfdamage functionapproach are scientificallY·and.ethicallyrdifficult:.tp:.deteanine,lsomost PUCs areusing.a.proxyapproach;thatassignsthe .cost of some known control method fora gi'venpollutant., .•Extemality:.cost values (g~nerally.given.indollars per unit ofpollutant ;emiUed)are;multiplied.by.agiven',technology~ s·emissions to arrive atthe'extemality.·.costpenaltyforthat te,chnology.•.··Todate, extern,ality cost valuesare only beingmsedby utilities in selecting new resources,. although they couldinprinciple.a1so ;be ..'used. in system :operation .and plant. retirement decisions aswelL •Exhibit 5,,:,Ipresents;extemalityeostvalues'and the'ways in which they arebeing used'in •some jurisdictions.
7.5.1 ··Fuel,.SwitchingMeasures Between Electricity and Gas
This section provides.anoverview oLgas ..technologies.thatcould·be substituted forelectric technologies in residential and commercial applicati()ns;"Many of the equipment.measures .for increasing·•.gas efficiency listed in 'Fable7.•6 are 'also caJldidatemeasures forfuel-switching from electricity to gas. Tableol'l.,.Slists·some'ofthe releyant technologiesfor switching from electricity to gas and gas to electricity, respectively, indicating theirapplicability in the residential and commercial sectors. A more detailed description ofthese technologies and their efficiencies is included in Appendix D.
7.5.2 Fuel-SwitchingMeasureCost-Effectiveness
A comprehensive economic analysisoffuel-switchingoptions is beyond the scope of this. primer because of the many quantitative and qualitative factors thaLshould be considered'and because' of the wide variabilitY the values of options indifferent parts of the U.S.·Instead, an example illustrating one method for aSsessing the economic merit of fuel-switching is presented. For the societal or utility perspective, assessing the cost-effectiveness of fuel-switChing measures requires gas and electricity avoided costestimates. There is less consensus~utthe methods for estimating gas .avoided coststhan about methods for avoided electricity costs (see Chapter 5). Therefore, in this
176

Table 1-8. fuel-Switching Measures Between Electricity ,and Gas"
..........<... .;. ,.' .;:;">/':;,' •.. '~"..' ;....,.:.'./
Commercial
Gas to Electric Measures;ereifif~9i~tqAijp¥~p~t~~i~fi~~f'(P1Jffi~;'~i~'~;;"!,!::,,,., ....::':::i':X •...........I:lectri'cheafpurrip water'he'ater'" . XRefrigerationhea'tre~rairn:i:: •.. . .OzonateCflaundering system
",X',,',x'XX
• Measures listed here are in addition to the gall efficiency measures listed in Table 7-6.
example, ,fuel-switchingcost-effectivenessjsicaIc~lated ,i. ~ ,tel11ls of a/threshold gasavoided 'cost; actual gas avoided costs lower than the threshold value would indicate thata gas technology is the economicaIly preferable choice. In other words, given anuncertain gas avoided cost, the break-even avoided cost for gas explicitly shows what gasavoided costs would hayeto beilL~elation to)~Ie(;tricityavoided ..fOsts for a technologyto be c6st.:effective. If gas avoidedC()stsare well determined, other methods for fuel-substitution economic analysis could be employed. Like the cost of conserved gaseconomic indica,tor used,.in the p~viouseJ{ample, ..f11el-substituti9n .cost-effectiyeness isusefulptimarily,. in technology '.screeriifig~" The, break -even avoided gasC()st .is derivedalgebraically in Appendix C:'" . , . . ,
Break-Even Cost Calculation for ElectricjoGa.fF'uelSubstitution";.
This example shows a sample break-even gas avoided Cost calculation for a com.mercialgas cooling application.12 The break-even gas avoided cost is the threshold below whichgas avoided costs would have to be in order for a DSM measure to be cost-effective. Thebuilding is 50,000 square feet with a cooling load of 2,100 MMBth/year (U.S. averagecooling load for commercial buildings in this size category per GRI). The building is
12 The method can be similarly applied in a gas-to-electric fuel-substitutioD case.
177

served.by a 125 ton electric, water-cooled, reciprocating chiller with a seasonal COP of3.5; the chiller. consumes 175,850 kWh annually.
The prOposed alternative cooling system is a gas engine-driven, water-cooled chiller ofthe same size with a seasonal COP of 1.4; the chiller consumes 1,500 DTh/yr. The gaschiller has a lifetime of 15 years an initial cost of $8OO/ton.•·.•.FOI. this •example, weassume that the maintenance costs are 0.9C/ton-hour higher for the'gas chiller than theelectric chiller. With electric avoided costs of$.047/kWhforenergyand'$65/kW/yr fordemand, the annual avoided electricity cost from switchilig these two technologies(ignoring parasitic electricity use of the gas chiller) is $16,429.
As presented in Appendix C, the break-even gas.avoided COSt(BGAC) is (in simplifiedform for this example)BGAC •• Incremental Cost x CRE' - A1I1JIUd Ekctric Avoided Cost -.4nmltlllncremenmIMaintenance Cost
4. AIUJUQI GasU~
A .capita1..recoveryfactor(GRF)of,lO.3,%isused,.whichannualizestheinitialinvestmentbased on a 15-year lifetime and a 6% real discount rate. For equipment replacement atthe..end ..of the. usef4J life. of.tpe .electric.chiller "the incremental cost is the differencebetween a new .eleetricchiller .(@ $6QO/ton)cmdthe gas chiller (@$8OQ/ton). Thisresults in,
BGAC, $25,OOO'x.l03--$16,429- $1,575 =$8.2IDTh,>' '15.00" ....'..., .'.,....
If the....actual.'. gas avoided costs are 10we17than $8.2/DTh,: then- repiacingthe electricchiller "withthe g~'. chiller under' these drc~I1lstanceswould.be.·advaIltageous.
Suppose that the electric chiller was displaced before the end of its useful life. In thisinstance, the incrementalcostpf the ,gas chiller ,is thefuUco~t, Le.,$l00,OOO. ,Thisproduces a break-even gas avoided cost of $3.0/DTh. In order for this gas coolingapplication to be cost-effective, .avoidedgas .cQStswould have to ..be lower than thisamount.
178

7.6 Issues in Gas.DSM.Program Design and Imp1ementati()n
Thissecti()n.s\lmmClri~s issues that arise vvh~ngas\ltilities implement DSMprogramsand .high}ights lessons. learned from •..•.th~. ex~ri~n~ of.gas.and electric.' utilities indesigning,. deliVering, and .evaluating PSM programs.
7.6.1 DSM.Program .•Design
DSMp{ogramsmatch.end-use tec;11n0logies,c~~tom~fsegments,andprogram deliveryl1lechaJlisl1l~.(Hirst i128~a).•.••~even¥~tra~gic.appr~hestoDSM.program. design are.'.p()ssible, but it is .instructive to identifytw() ends of thespectr\Jm: "bottom..•up" and "top-.down."
<, •...... .. .....•..... ,. .. " .. .. .••. "','< c·" :.' .. : .... :.,' ,,_ ...•
In.the.bottom~p~approClch,a.utilitystWtswithi a.SOI1lP~~hensiveset()fiDSM.measures.aJl~'rn~tppdicall,y~r~Q~th~11l produ~iIlga~hoItljstofth~ ~stm~~H·es..Scr~ning isO@DperfOI'J11ed.usiqg b()th qualitative .aJlg.q\laJl~t~Jiye.cri~ri.a. <QQe.gasI,.DCused thefOllowiIlg•.•.q~itativecri~ria::> l1larket'P9~~tial,~liaJ>ifitY ,lpad •.•sl1~pe<objectives,customer objectives, net impact of utWty,a~¥()Il,.eJ~t~C9st~ffectiyelleSS,~d balanceamong customer segments (Synergic Resources Corporation (SRC) 1991). Quantitative.cri~riaof~nincl,~ge itpem\lltip!~;~em~[JJ/C9sttestsiffisCHSse4'Wiqhapter6,isetatsome.•~~es~old l~vel(~ ..gplB/c;.ra.ti()g.f~ter. tp~j.2)~ ..9~MprQgra.J1lscrre.tllell.~~t. aroundrn~llfes •tlla.tp~stpecri~~,withJlieID~ur~s~·~~ka,ged "individucilly.pf •togetherfor. s~ificmCU"ketsegl1lents. .. '. . .
"', _... .. .0 :::",'_,,',,' """".'.'_ .,,', .....•...... ::., " .. ".,., .. :., .. ,. ".,', •
IH.tl1~t()p-d()wn.•appr()a.c~'~lltility;pegill~;with stl1l,tegic:ll1crr~tanc1ly~is,}igentifyingPSMpfogra.nlopPQrtUJ:liti~~.thatcouI9. ~ti~fya..s,ehof~()rporat~ Qbjectiy~ fo,r.pSM.
.. ' •. '.- ,',', .. :":"" : ::" >. ",', :'," >':, <: :.-.,:. "', : : : :,_..::•.-:: :.:.' , 'i".i (:,:.!,:;" ',.,' ..'-, -:,:: >' : :" .' :: :. ,::> .",> ..'f" 'o;: ..'~:. -,.,' .:':., ,', " " ;.,.; " .•,' ,.,." ,',_ :.'" .,',.:,:., ••",',: • _. ~.. • _ ..•....•... , _0 .. :' , .. ,_ .. "':' " _, '._ .. ',' _:~. :
.Th~()bjecpves.J1lightinclude: •.~llhancil1g.~~~t()I1l~r~~i~,PI"oI1lQtingequitYa.m()ng allcustomer classes, incr~illg.systern Ioadt~st()r, .i"etaillingelasticcustomer-s, Ipi.nimizingrate increases, and maximiiing customer :PartiCipation.Applicable DSM measures arethen mapped onto these program concepts and subjected to economic screening.
Program [)esign .Qptions
TJtiIiti~shave;..at their di~.sal ••a variety Qf~esignflP.tionsorapproaches f()rinducingch~~esincustomerenergy useJsee Ta.ple}79).. '.fypes .pf DSMprograms include:info~ati(>n, ..innQvative;. rates . and prici.ng,~epa.~,lo~s,~l1lpre,b~nsive directipsta1.Iation,~rform.ance.contracting, and' competitiye•.•bidding. (Nad~11992).
179

Information programs---brochures, advertising, bill inserts and energy audits-seek tomotivate and inform customers about the benefits of increasing energy efficiency. Rebateprograms offer anywhere from some.n6minal fraction up to,,the full'DSM:,measure cost(provided it is below the avoided costce~g)'Ldan programs usually offer Io\\, or zerointerest loans to facilitate energy conservation 'investment on the part of the customer.When given a choice, most customers prefer rebates over loans of equivalent value.Direct install programs provide a turnkey operation for c,ustomers()ff~ring_ acomprehensive range of services that typically includes' financing, ,audits, 'measureinstallation, and follow-up operations ,and '.maintenance" of installe<l"lIleasures.Performance contracting programs usrthird":Party privatefll1lls,al.sokn?\V~asenergyservice companies (ESCOs),to delivc:rDSM:services to the utility'scustomers.l3SCOs
, :usuallycompete on the 'basis of qualifications to 'provide 'these services,',and arecompensated by the utility for energy or capacity savings delivered. Bidding'programsare similar,to performance contrac,tingex~~, that the,,selectionpr~ss is Illorecomplex
-arid formalized,andbidders,themsrlvespr~poseapayment scheIl1e.Ex~ri~~,ce with'DSM:. bidding<byelectricutiliti~ has~ho\\,nthatthis~ ()fprograJl1is most ~:pplicableto the commercial and industrialsector:s' .For mostLj)Cs'tflemajority.ofDSM0:pportunities,arein.theresidential~tor; ,for this reason;'DSM15idding 'may not be aparticularly attractive program design option.. ,
Each'Of these,pro~rammechanis~shas'd1ffere~tc,haracte~stics .•••iIt eligible,cllstomerpartiCipation,.sa~gs,andcost. ,VerY~eneraicomParisonsa.m0~g the.DS,~tpf()grammechanisms are given<in.Table 7-9," drawn primarily fr?xnel~tri.cutilit}r-e~:perience.This table also highlights three common measuresofDSMprogram success:participation rate, savings :per customer, and Pti!ity C()st:perunit sa~g~ .. <~~present,fmanciaJin~ntives intheJOI·m•.,?f"rel>a~h~vebee~,.r:rhapsthe.'m?st ixnpo~t. ~lementof DSl\1programsin movingc~st()m~rsto\Var~inc~~ingeffic,iencyin theirIacilities and'homes. Overtime, it is like~y thatth~r~.will'beincreasin~emphasis' on DSM programdeSigns that maximize cost contributions from the'customer. - ..
Rate Impacts
Utilities and regulators must balance the benefits from aggressiveenergyooefficiencyinitiatives with competitiveness and ,~onParticipant impacts in setting goals for DSM>program design..MinimiziI1grateiJ1l~ts of DSM :pro~rams is 3. lDajorcon cernof gasutilities: A starting point for nlinirnizUl grate impaCts is to base rates onmargin~ costs.The benefitofmax:ginai-cost-baseci ra~is that they imProve the energy used~!sions ofall customers, not just the ones who participate in a DSM program. Cost-based rates,including additional seasonal differentiation where appropriate, should reduce thedifference between prices and avoided costs and reduce the revenue loss and associatedrate impacts of some DSM programs.
180

Table 7-9. Summary of Strengths and Weaknes.ses of Diff.erent ProgramApproaches
load-·Managemen~
loan
.Perl~~;;'~':COhtracting
Comprehensive IDirectInstallation
moderate(can be highoverlong-terml moderate high high
'moderate-high
Another strategy for mitigating the ·effec.ts:ofrate· impacts is to allocate the cost of DSMprograms~nlY'tod~-ses of customers. 'that ••~offeredthepro~l'aIIls.'Assuming that aprograinis being offered tocustomeis with relatively inelastic demands, stich a strategywould....m.jn.im....ize l..c>.a..d...los~. from. p..rice-elCiStic.cu.s...tomer....s. .10...w... h..o._.ch()O.se. altemativ. e fuelsor sef\1iCeproviders..See. ~ecti()n 9.5 Jorexanipl~s of. the impacts. of a}teIllCitiveDSMprogram cost allocation approaches.
Another strategy f~f'miti~ating rate imPCictsistorecover thebulkofDSMprogram costsfrom partiCipants.·· Sevetal'utilities have'developed mr·energyservices charge tariff inorder to market and deliver DSM programs in a manner that can be.collsidered ."subsidy-free" (Cicchetti and Hogan 1989; Cicchetti and Moran 1992); participants pay for the fullcost oftheDSMalthotigh· the utility, by selling" it as a service, essentially provideS thenecessary capital and may take on some risk of nonperformance. Such a strategy intheory refiloves barriers to caPital but does not saddleo()nparticipants \Vith rebatefOstsand lost revenues as is the case with more conventional, utility reb~te programs. Althoughactual experience is limited with energy service charge program designs, initialevaluations suggest that the energy services approach tends to dampen program
181

Exhibit 7-1. A Joint Gas-Electric DSM Program Designed to Mi~igate RateImpacts
Southern California Gas (SCG).Cll'ldSouthernCalifornia Edison (SCE) aredeveloping a pilot DSM program that involve!';.joint-deliv~ry ..'Nhere their serviceterritories overlap. The Total Energy Efficiency Management (TEEM) program was'conceived as·awayfor bOth utilitiest() achieve joint economies while pro'fidil)g. customers with .amore comprehensive assessment of savings available in t~.eirfacilities. The economies derive Jirincipally from two aspects of thep}(lgram: (1)saving on p.rQgr~madministration costs by operating one joint program rath.l;lr.thantwo separate, simi.lar prograrl'lsand; .(2) shi.fting the financing of. the DSMmeasuresfrom the utility to participating customers and third parties without recourse toratepayers or.s.hareholders of the.sponsoring utilities. This second feature. addresses.the concern over potential rate impacts from utility DSM. "
TEEM is designed to provide .commercial and industrial customers with "fuel-blindR information and assistance.on energy conservation. The services offeredthrough the'pr~gram .include p.r~ject.iden~ifi(;ation, engineering, con~tru(;~ion,monitoring and maintenance, and project financing. The utilities play mainly afacilitation role in the program, matching up customers Wi.th.technical and financialresources. It is envisioned that energy service companies (ESCOskwillassume aprimary role in the delivery of the program's services.
A novel aspect of the TEEM program is its financing. Cust9.m@(~.are.giventhree options for funding DSM investments identified in the earlier phases of the..·.Plioj~ct".cycle:.·(l)i'.pCln,a.r:r;angementdn,.which,;rEEM.makes1pr,ogram.,par:ticipantsaware of local lending institutions and ESCOswho may wish to provide debtfinancing, (2) energy service charges on monthly bills with customers bearingperformancerisk,oncethe'projecthasbeen .demonstrated to deliver savings :altheexpegtedle",el,aod (3) .energYis~rvicecharges.on. mc)Othlytlill.si'Nithtbecustomer
..' bearinq,no. peqorrp~nc~,riskbut. sh~ri?gmeasyr~ds.CI",i.nQs""it,h i..~!hlr,d.party,~."'«' ---',, (><' .,,<: ,",'--> ">~ -,",',: .'-',,'.'-,':, '.'. -',' ,".,",-,','',' ,',".:',',.-:.-:; ,",-':' -:"':::,,:.,''.',,: :', " -,',,',,'-.,',.,' - : ,,",: ',', .': ',:
·Prograrn~ost.s· are t~ b~.~nanced through a•.3.%."marketiQpfee.charged toESCOsandother trade allies catiyirig oUt the program for targeting '~usiomers andother utility staff time used in program marketing, a 1% processirigfee'fol' plaCingenergy service charges on customer bills under financing option 112, and a 3% fee forbearing"performil.ncl;lrisk under financiogoption 113. In.this, way ,th.eT:EEM .programis designed to,becoTl'leself-sustaining~t a threshold .level of participation.
Source: Occhionero 1993
participation .~tes .••.h1 ~rtainmarket sectors. Resolying'this. dra'Ybaclc is a majorchallenge for utilities and DSM advocates.
182

Exhibit 7-1 describes a pilot DSM program, undertaken jointly by Southern CaliforniaGas Company and Southern California Edison, that is designed to mitigate potential rateimpacts using the energy services charge framework.
Market Niches
Achieving widespread DSM program participation ....•among all customer segments isanother way of mitigating the potential equity im~£~ ()fl)SM-related rateincreases.This requires segmentation of customers into app~priate .niarket niches. Utilities canthen target marketing, services, and incentives to captUre otherwise difficult or otherwiseunattainable DSM opportunities within /customer clas~.s. For instance, low-incomecustomers may respond very differently toinfor.m~~oniand incentives than typicalresidential customers,.so reaching each group wiJlreql.lirea different approach.
Market ...Transfonnarion
Utility DSM prograJlls have traditionally focusedon)cu~tomer service and resourceacquisition objectives.DSM proponents have .proposedi~a#ret transformation i activitiesin order to accelerate the shift towards energy-efficient prOducts and services. Markettransformation can involve ~ly introduction, accelerated adoption, or expansion of the.ultimate penetration of energy..;efficieri~technologies (Nilsson 1992). A distingujshingfeature of market transformation strategies is that utilities attempt to work directly withand influence "upstream" market actors (e.g., equipment manufacturers, builders) in.aconcerted fashion.
~chlegel et al. (1993) have developed a conceptual fuunewof'k for gauging markettransformation strategiesalopgtwo dimensions: which market actors ar~ affected and theIPechanisms through wpich thea~tors"~havi()r is altered (see Table 7-10). Market actorsinclude utility customers, trade allies (e.'g.,. dealers, distributors,contracto~s, engineeringand architecture firms, etc.), and manufacturers.' The mechariislllsthat change behaviorinclude altered options, incentives, education, and moral suasion. For any customerclass, end use, or technology, the mode of market transformation is likely to vary.
The Super Efficient Refrigerator Program (SERP), also known as the "Golden Carrot"program, is an example ofa DSM market transformation program. A consortium ofenvironmental, utility, and government.agencies instituted a competition offering abounty of guaranteed multi-million doHar refrigerator sales and a sharing of developmentrisk.. The competition asks appliance manufacturers to develop and market refrigeratorsthat exceed the energy-efficiency levels of federal standards by a specified amount, withthe hope that losing manufacturers will feel compeHed to offer comparable products to
183

Tabl
e7-
10.
Exam
ples
ofM
arke
fTra
nsfo
rmat
ion
Stra
tegi
es
,•.Ho~B4ihiiliiota,anged.
Change
InActors'O
ptlons
Ch.ng.
InActors'
Incentives
Change
InKnowledge
'Education'
Change
InNormll,
VlIlluelll,or
Attitudes
'Moral
Suasion'
-
Scur••:SC
hIogGllIlaf,
1993
.c::uiltiiriMli'B:
-increalllnG
aVllllabllltyof
efficient
equipm
ent
"iJnnolnol'lew
technologies
tomllrll:et
-Codes
ami.tm
ndards
.
-Changing
.mllrltetavallabllftyof
efficient
equipm
ent
-Permanent
flnanclallncentlws
-Oettingcostomer
totek.ethurucilal
"flretiteP"
with
otherstep.
following
-Ceu~lng.customer
torepllrchils.
.technology
dll4ltosllltlsfllCtOry
lI11perklncll':
••.••••.'•••.
-~.Idng
ciustomenl
moreIIlwlIlreofthe
rlllngllofefficlent
options
-Changlng,custom
erpercllptlons
of.thO.
coets
of.efficiency
-l:hllll1O
ln9·whlllt
custom
erspereelve
b\il"normel"
bel:ulVlor
-Changlno
whetdlllllierestock
byi:ha"olng~theirperception
ofcosto,,",r
prefer.ncllll
-Building
marll:et
Infrestructu
•••b
ydirectly
orIndirectly
Increasing;dem8l1if
-Forcing
nonplllrtlclplllnts
tochllnoli'
behavior
toremlin
competitive
-Chlllnging
whllt
dilltnblltoreorderor
pushbyehlllnging
perceived
demand
e!3lllldlng
en"efficient
delller"nlchil
-Msklng
deelenlIIwllreof
cuetam
llrprefllrenclls
"Informing
deelenlof
thechlrootenetic.
ofefficient
equipm
ent
IInd
theoption.
fC?r.!IriergylIervice.
'
-ChllnglnjJattitudes
andVlllu••of
.:blllinellllc,wnenl
.~C
hlllnoing
trade
allyperceptions
of"normal"
behavior
-Codelll•.lIlndIItenderdll
-Oolde".
ClIlrrotappl'Oech
,SER
",-Chlllnglt1gefficiency
mix
bychenglng
percelWd
demand
-Chlllnging
shipments
toerea
by.chenglrlg
perceived
reIII
r/Vfldllmlllnd
eAc:icelllretlngtrensftlon
tonew
Federal
IItlllndllrdS
-MlllklnilmlllnuflllCturenlIIIwlllreofwhet
prllductllllllraneeded
Inthemlllrll:lltpluclI

those of the lone winner. Similar types of efforts are now being planned for. otherappliances (e.g., packaged air conditioners).
Another example of a.market tran.sf0rmationprogram was conducted by Ontario Hydroto transform.the marketsharef?rbigh-effi.ciency motors from 5%. to 40% through acombination?f education and iricentivesapplied.strategically tlfroughout the market chainfrom manufacturers to' vendors to custOmers.
The DSM efforts of gas utilities in Wisconsin offer an interesting eXampleof(pos~iblyinadvertent) market transformation for a gas appliance. Following years of gas utilitiesconducting DS:M .prognuns ...to ~rom?tepulse' ~mbustion .furnaces .for ..•.residentialcusto~ers,'thi'stechnology becameth~ norm,'achic:ving '.up 109() % 'oftfiegas furnacemarket(Ka.~landKihm 1992) .••.'A study of the.diffusionofth~se'high:.efficiency gasfumaces.conduded that the indirect eff~tS'of thC:l)SJ\II,pf()gtainsmayhav~ outstrippedthe·directeffe<:ts (Le., purchases' ~adeasa resulr,ofa·u.~lity'.incentiv~)bY' a.Jl1arginof3tol(Schlegelet at 1992). However 'i~~tl~ -it'~Ppears. that.th~ ~~ketfor theseproducts in ",isconsin mat be regressing "(tho~ghnationcmyshiPrnents'of ;thesetumaCes,are·growing).\"·' ' ' -
--Market· "transformation programs pose particular""challenges'.inpf?~i~\1aluation.Changes in the focus and methods of current program evaluation practice Will almostcertainly berequired. Unlesscurr~ntrnethods for~e~rminil1gn~t savings from DSMprogramsevolve,~tilitiescouldbe~n31i~oo for-successful market-transfornpng>efforts,ess~ntially by obscuring>thedefinition of nonparticipants (Prahl and Schlegel 1993) .
Free Riders
Fieeriders'·ateiparticipants· in',DSMprogram~~W~O'W~uld-ha~vei'instaUea;'th~/measureanyway.without >anyinducement.from the utility. ",••-Measures.with. already "~Mh,marketshare~orqukkpaybacks oftenlead to ,highfreeridetihip vvhenpromoledthrough. pSMprograms' (Nadel 1992). ,Free riders donot diminish the savings accruing to soclety, butthey do. influence the savings •.attributable to the program and. therefore the,,oost-effectiveness of the program from the utility perspective. DSM program deSigncan helpto .minimize ,free ridership by offering rebates on only the highest effi~ency DSMmeasures with longer customer paybacks and/or those products with a low marketpenetration.
185

7.6.2 DSM Pregram Delivery
The details efputting ti\pSMpregram "e.n the street"· are highly specific to.anYpregramand peyend files~pe efthisprilller .. :Hewever,twei~sues are particularly relevant froma. reg~late!ypetspec,tiyeaIld are.J>peflydiscus,sed: ..thecost ef adnrlnistering. DSMprograms and the potential fer jeintgas utjlity/~lectricutility DSM pr().gramdelivery.
DSMA(Jministranve ·.Costs.. .. ""': ,; .. ·.·i
~eJl'lc:tim~neglecte4h1BSMPOtelltiai~ .studi~Clfe.the:indirc;.<;tcOstsincurreqbyutilitiesin,admmi~teriqg,BSMprpgranls.Admi,nist.rative costs •.could·incIllCle...an y:Qrall. cf thefeMewpg:<l)pr().gr;,~JRPJaIlQJng,q~lg9,anaJysi~,an.d eValuatioq;(2)activitiesdesigned, to.re,a~h:cust9m~r~~.•briqgiB;lg>theIlliqto:,.th,~,pregl1lIJlanddelivering~nri~ such as"mar:k~Hqg,,~u~its,app!i~tion, pr~ssiqg" andbidrevie\V~; ,(3) in~~tions ..anc:iquality~q~()~;<4),,~taff. r~.QIi~lll~nt,:.pla~Ill~nt'~lllpeu~~(>n, :,.d~yelePIllent,~ning, andtransportatien; (5) data collectien, reporting, recerd keeping, andaccoul1tin.g;and (6)overhead costs such as effice space and equipment, vehicles, and legal fees (Berry 1989).ManY9f?!l1~~fitems could appear.,en th.el~gers, ef, utility departrnentsether '.than theI>SM PFQgram·
Alilllitt-.cl'riclti(malstirveYPY:Qaklq~g~1iatienal,Laberatery '.(Q~).().felectric: utilityD~~p};~gra.IJlSfO!lIl(lth~tthecostefadnUni~te$1g DSMprogranls ()Il~v~ra.g~",{typicaIIyexpressed as a fractien ef the direct measure cost-was between 10% and 35% (Berry1989)Y Nadel feund that administrative costs added a cost premium ef 36% onaverage, ever and abeve the direct measure costs to. the utility in a study ()f 46.NorthAmerican electric utilities (Nadel 1990). Anether study by Jeskew and Marren feundaq~,iqt~t.ra~Y~'cp;~~j.hthe{tcUl~~,pf 7%...70,%'frem .ten ,U.S. electric:•~tilities.' ()verallD~MRf()gran1,~ffeTtS(J()~lceYlan d l\farr el1 ,l992).Tl1er~..are no.standardiz¢a~~ntingmethoclsJcrf~ppning,()n iDS¥progpun admjnist.ratien,costs,so.~me;.ofthey~ationshqYVI'\~bev~.'i~'J:1().doubtduetowhatis.and,is. l1 otincludedin these,coIDPu.ta.U(lns. Ingen~@l;P~Mpro~ra.m,costswiU vary .aC£QrdingtomanYJactersillclucfu1g:(l)stige efprqgraJl14evelepIllent; (2) target mgketsegrnent;(3) mcrrketpell~trationgoal; (4)teclmology; .and(5) types of ~rvicesandleJ:",incentives being.offered., For instance, aCOIllPX;ehensivepregram, that. invelved .making site..audits, .arrnnging for. measure
13 In this study, the programs with the lowest administrative overhead are commercial lighting programs, inthe range of 10% to 15% of direct measure costs; multiple measures programs, including audits and incentivesfor commercial customers, display higher administrative costs, in the range of 25% to 35%. ResidentialweatherizatioD programs average administrative costs around 20%. Pilot programs of all types can haveadministrative costs over 100%.
186

installation and financing, and doing follow-up verification will entail much greaterprogram administration resources thana standardized rebate program.
Jointly Delivered GaslElecrric DSM Programs
DSMprogramsdelivered jointly by, electric and gas ,utilities with overlapping serviceterritories hold the promise of reducing not only the administrative costs of runningseparate yet similar DSM programs but also reducing customer confusion aboutcompeting utility programs (Nadel 1992). Market segments thaI focus on "lostoppOrtunity" resources (e.g.". new construction) or segments·mwhich it is difficult todesign cost-effective programs (e.g., low-income housing) •.have been suggested asparticularly promising areas for joint DSM program delivery (Buckley, 1992).14Amutually agreed upon method for ,cos,t-allocation.'atnong utilities iwould be a criticalprerequisite to any such cooperative effort.
·"Energy service companies (ESC0s) are viewed as,anappropriate'vehicleby which jointgas-electricutility programs could .be delivered.. 'By acting'as the joinfagent of the twoutilities, an £SCO can help to reduce customer confusion aboufthe DSM program andprovide some measure of objectivity on the best fuel for a given application, followingagreed upon criteria; and .'procedures..·''.Therole'of .£SCOs' in.providing.:utility 'energyservicesbas-'evolved 'significantly since the early days-ofcperformaricecontracting to'inclUde:DSMbidding,standardoffers for DSM;andvarious partnerships with utilitiesin theirDSMprogramefforts.(WolcottandGoldman-1992)~·.loint utility DSMprogramdelivery would fit. easily into the evolving psCO industry.
7.6.3 DSM Program Evaluation
'Evaluation has.emerged "as'a key component of·successful- DSM,programs,.·'providingcritical feedback to the program design process.>Initiallyconsigned to a minor role inutility DSM .efforts, '.its importancei'hasgrown With the advent of -DSM asa majorresource 'in electric utilities' .portfolios, and especially with more' recent state'regulatoryinitiatives to grant utilityshareholder.incentives based on measured performance ofDSMprograms. The 'audience "forDSM program .evaluations can include utility staff,ratepayers,PUCs, intervenors in utility regulatory proceedings, and others in the energyservices industry.
14 "Lost opportunities" occur in new construction (both cOmmercial and residential) when DSM measuresthat are most cost-effective (or even only possible) at the design stage, but not later, are omitted.
1117

The core purposes of:pSM program evaluation are: (1) description and characterization,(2) measurement, and (3) optimization of programs.
Description and characterization involve detailing: the operatian .of a program,the market reached and the market that remains, ..the interactian .of DSM measures·withbehavj()r,thepSM resour~that remains to be captlUed, and the reasons farpragram reslll ts .
Measureme~is made ..of:energysavingsattribpt4ble to ·the pragram, demand, impacts (inCllldipgqaincidentpeakloadreductions),utility anc:Jsoqietalcosts, andpersisteJ;l~of)savings .
..Evaluatians.are also expectedta provide the basis for QptimiziTJ,gprograms. Theydo this by identifying: bottlenecksinprogramoperati(;m, problems in programgaals (especially if gaals are nat shared throughaut the utility), the features thatworked.welljo, programs, barriers to participation, barriers ta .persistence .ofsavings,··.andmeasllres that may"nat be perfarming as.well .as·.expected (Kushler,et al.1992)~·
Two.'b.road.categaries Of;evaluatian..serve thesepwposes: impact and ,.proqess. Impacteval1Jatiansexamine the effects ofa:program, '.including·;·theqJJanti~tive ;documentatianof the.programJs CQstsandbenefits, the rate .of participation .and measure adoption, the
,',"performance .•.of the DSMtechnalogies, Land.ithe.energy .'anc:J.loadimpacts. Processevaluations estimate how.well 'a:program'has been implemented, including the efficiency.of service delivery, the effectiveness .of promotional strategies, and the level .of custamersatisfactian (Electric Pawer Research Institute (EPRI) 1992d).lS
Impact evaluatian seeks to determine which savings are attributable ta a program. The'crux of the challenge far impact evaluators.is ta~comparewhathappenedto,programparticipants ,with .what, would .'have '.happened.·.ta participants. if the •pragram had 'natexisted" (Hirst andiReed 1991).. This invalves.determining.two types·of savings: gross(.or.total) savings.of the participants and net 'savings... Figure 7-10 shows .'the distinctionbetween .gross savings, which are relatively· easily measured, and net savings, whichrequire use of sophisticated sampling and statistical methods to determine the "baseline"energy consumption .of a comparative or control group in contrast to the programparticipants.
A number of approaches are used within each of these types of evaluation. Impactevaluations use engineering methods, statistical methods (often in cOlljunction-with
IS Market evaluation is subsumed in process evaluation in this framework although some define it distinctly.
188

customer billing records), surveys (qualitative and/or quantitative and administered bymail, by phone, in person, or through. site.visits), and metering... Process evaluationsemploy program information, surveys, in-depth interviews, and' observation or casestudies (Electric Power Research Institute (EPRI) .1 99 2)..••••.For both impact and processevaluations, many of these methods are applied incOlJ,ltifuation,depending on the needsand constraints of the situation. Excellent meUl()(lolQgl~reviews)~ be found in (Hirstand Reed 1991) for DSMevaluation ,in general; in (E1ectric.PowerResearch Institute(EPRI) 1991b) for impact evaluation; and in (Electric Power Research Institute (EPRI)1992e) for process evaluation.
Some of the key issues in DSM program evaluation arei4entifi~inTable7-11. These.issues are not just relevan~to.program eval\1ationbut totl!e ,~dabili~()fQSM as a utili~resource. Each of these topics deserves an entire volume (some.a1ready have one);interested readers should refer to (Kushler et al. 1992}for,.adiscussionof severalevaluation topics listed in Table 7-11. .Exhibit7-2descril>es'a.'?OIYlJ?rehensi'V~.,multi-yearDSM program evaluation (Gas Evaluation·'andMo~it0ring.~ttldy()!G.EMS).that1s beingundertaken cooperatively by several New EItglandgas utUities a.ndwasjnitiated byBoston Gas. . '.. .
189

Table 7-11. Key Issues in Program Evaluation
::~q~li.PP9Qi!~~::~ti~~t~~fi*a~QQf:i;~~):,1~~,i:i,.'... Roie'ofbehaviorinevaiuation" .Timeliriessofinformation andfee'dback:Presentation. of .resultS' ClaritY,.honesty , .and objectivityMeasuring cl.lstome(value . . .Determining participant costs
load savings and load shape impactsPersistence of savingsLimits. to measurementPeflli'Jg~ith.LJngel't;!inty. ..,:fIi12xirni;Zirtg,pr7ci~ion·versus mirtirTIizingt>ias~ssessing mar~~lt(anSformati()nQualitVassurance; confirmation, and validationVerification versus evaluation of program savings
ipp.!i!:ffi~atiQ~9t~·gtgQraT~iti.Predicted versusmeiisuredAvoiding lost opportunities and cream skimmingIntegration of impact evaluation and process evaluation
.O~~~~:,.'. '.:" '.., :.....•The role of process evaluationComparability of results (across programs, utility services territories, states, andcountries)Generalizing results from metered subsamples to larger populationsIncorporating environmental externalitiesDefinition of key DSM program evaluation termsR&D needs for measuring technology performance
Adapted from Kushler et al. 1992
190

Exhibit 7-2. A Cooperative DSM Evaluation Study in New England
The Gas Evaluation and Monitoring Study (GEMS) is a cooperative. multi-year effort of 11 gasutilities in four New England states to treck the performance of each company's OSM programs. Thestudy. spearheaded by Boston Gas. was conceivad as a way to economize on expensive data gatheringend analysis by cost-sharing and transferring data and results among the perticipeting LOCs. The study iscurrently in progress. initially focusing on the residential and multi-family sectors while evaluation plans forthe commercial and indulltrial sectors are being formulated.
GEMS has three elements: impact and process evaluations, and end-use metering of customerfacilities (which supports impact evaluation). The main objective of the impact evaluation component of thestudy is to produce estimates of net gall saving. from OSM measures. Net savings are developed using acombination of end-use meterad data. survey responses, and monthly billingdata.
A central feature of the GEMS analysis ill tha use of end-use metered data collected from arendom semple of customers for estimeting ·gross'" sevings. These date are collected on en hourly besisto track gas consumption both before and after installation of OSM meesures. The chenge in gasconsumption is then corrected for confounding veriebles in order to isolete the impact ettributable to theOSM meesures. Trensferebility of these data among the cooperating LOCs is a major component of theevaluation design.
For estimating the net savings in residential buildings. a combination of techniques is beingemployed including:
•• stratified sampling by housing type. geographical location, and time of OSM measureinstallation;
•• cross-sectional analysis (i.e•• comparisons across a variety of dwellings at one point in time)and pooled time series/cross-sectionelanalysis (i.e., comparisons before and after OSMmeasure installation among various dwellings)
•• ·matched-pair'" analysis for multi-family buildings; participant buildings are compared to acontrol building within the same complex
Specific issues the process evaluation is dasigned to address include:
•• progress toward implementetion goals•• effectivaness of marketing strategi.es•• appropriateness of program design in reaching the target market•• adequacy of data compilation for supporting program management, evaluation, and
regulatory needs•• reasons that customers choose to participate or not•• attributes and short-comings of the progrem•• satisfaction of customers. trade allies, vendors. and utility staff•• changes to the program that would improve implementation success•• explanations for free-riders, free-drivers. persistence of savings, end snap-back effects
Source: Greenblett 1993
191

192

· Chapter 8
End-Use Fuel Substitution
8.1 Overview
This chapterfocu~ onnaturalgasl~lectricity sector. rivalries in end-use,l1l~kets. TheinterfuelsubStituti~njssu~ addressed include the regUlatory treatment of:
CD electricitY:togasend-useruelcon"ersion;• gas tgelectii~ity end~l1~conversi{)n;
~as:vs.,electricity end-llseselecti<>n;and '.,', , " 'V ,
~.J'U"~gulat~vs.reguICltedfuels in end-use markets (e.g., oij t()gas .end-useconve.rsionor .selection). '
Fuel-sWitChingissu~s:'relaied.to transportation .end-use.markets (e.g., Jl~ .6fll~tural gas"orelectrlcity to rePlace·gasoline in automotive vehi£les) .and,industrial.cllstolllers withmulti-fuel capability are not addressed.! The discussion 'cilsodoes riot inCludefuel choiceissuesthatari~ in~~regulation of wholesale electric generationmarkets,{e.g., valueof fuel,~iversity).· ," ..
'OPPOrlullitiesfore~d~llse .fuel,.~ubstit1ltionoccur.wheryver fuelcompetitioll, f()f an enduse~urs .. ,'1bellatlJraLgasandylectricitysectorsC(mllX7teJor ;the ~<ienti,al spaceheati.ng,,\Vater.heating,.~king, .anddJ:ying equipm. entl1lar~ets.i11l1l.anypar;ts,of the.Co~ntry.. Stl11egl~oVer Tarketsl1CU'e.,oc(;urJorsiUWarcomm.ercial.se.ctor encfjlses andcertain Industrial :processes. "Competition is only natural. in,,()ur~~~tyibecausebusinesses are built upon differences in product characteristics and priCes. Nonetheless,the competition between these two sectors has been and continues to be profoundlyinfluenced by federal and state regUlation.
With the advent of IRP and the explicit consideration of pSMas,a." sllP~ly sUbstitlJte,"PUCs haveericouragedutilities (priIilarllY,electricutiliti~)to interv,eneln0re~ftivyly inend-use markets"Pro~neritsof fuel substitution argue that these.wterv~ntions shouldnot be de factorestrictedtohi~h~refficiency products using the same fuel, but thatutilities ,should identify and r~mmend (if neces~) cost-effective,Iuer'substitutionopportunitiesfortlleircustomers as part of their IRP processes.• opJ>On~~tsargue thatmandatory fuel substitution, in effect, requires one utility to subsidize competitors' sales
J However, the develop~ent of electric. and gas vehicle markets will be signific.antlyimpacted by thepolic.ies and4ecisioDS made by state PUCs, energy planning agendes, and local governments, partic.ularly thetreatment of utility oompanyinvestments. in retail automobile refueling facilities.
193

(Le., competing opposite fuel utility) at the expense of its remaining customers (Kahn1991b).
For regulators, a central issue is whether the efficient selection of fuels in certain end-usemar~ets by consumers ~l beiIllproved ~ou~~ 'an' ~.pla~min~ p~~ssthat explicitly.considers fuel substitutionop~on~ oI"~hether~wrent99lityPracticesr~ult in a bettersocial outcOme. At a 'nlinimum, Controversies over 'fuel substitution policies may resultin some PUCs reviewing theifJX>lici~ ..on.promoti(>nal Pldlcti~. and DSM programimplementation in order to insu~ ~t e~ting .utility D~~p~o~f3JIlsare not introducingundesirable distortions into consumer's .mel.choice decisions. ThegasiJ}.pustry has raised~ncerns. that el~tfi9 lltili~ DSM progt;amS h~ve. the .effect .of C;Il~1¥'lgjng customers toadopt electric technologies when gas options would be. moi~.e.c:oIl9Jllically efficient. Inpractice, policies on promotional practices and DSM implementation (where applicable)are..... ;n..,..ot....al.ways. consi.,ste...nt,. eitller w...jtbm .a...uti.·lily.. or. (especially)b.e.tw.ecn ~mpetingutili4es·.ln.~l1le·~s,'~~UG .Il1ayn~ tolllll>o8e restfictions\(e.g., ·.liniiting·the scopeor. size,~f rebates) ~(to mandaten~Wa~tiVity .. ··· ' .. ;. ". . .... ..... .. .
Aprimaryobj~tiv~' (jfthis chapter is to identify policy approaches.olJif11el stibsrltution,mandatory or otherwise, that are available to state regulators. We describe types of fuels~bstituti9n prog~s, r~vie\VtI1e argul1lents~t hay~.been rai~ Qy.prpJX>n.entsand".9P:P9n~n.tsint!tc"' fuel,~llbstitutiondebate.~,pr~nt •...caSe:.•~~pi~ which' •..summ~ the,exJ>erienceof eight ,State.PVCs onthis!ssuc:" and disc~~s maj()f policy, andpr()g~matic.issuesth.at .re~ulatorsarelilcely.to~Ilfrollt .if.they •.ad<ir~s.end~use ..fuel .•subs.titutiondin~c~~.. It is dear th~t diffeijng. state p<>ljti~envif(mments and sociaJ.goalSmay dictatedifferent approa<?hes. ,. .,
o.
8.2 Types of Fuel Substitution Programs
~.thel)~oMestsense,. f1,lelsubstitutionprograms.are <lpmand-side management (DSM)programs desi~me<ltp influence.the. efficjellcYand timing ,of customers.' .demand for gasorc;lectrisitY,.l9 shav~J.Jeak loads, .,.to.fill>yalleysiJ).thelltility's Joa,d..curve,and to lowercustomers'. bills .•...Fuel.substitution ..triestoachieye.theseg<>als by substituting energy-using"ef.}.uipmentof one. energy with a colllpeting energy source (CPUC 1992d)3 Fuelsubstitu,tipil.progranls ,promote or .•provide an .incentive for efficiency improvementsassociated with the fuel conversion.
2 The CPUC has limited "energy source" to utility-suppliedele.ctricity and natumlgas but noted that thisstipulation may be broadened as the analytical constraints for evaluating unregulated alternative fuels becomeless restrictive.
194

1& GasJiJelsukstitl4tion programsprcunote the customer's choice of gas servicefo[.anappliaJlce,groupof appljan~,or building rather than"the choice ofSeiviceJrom.a. differentenergysource'l11~ programs increase customers'usage of natural gas and decrease..,us.age()f,an.alternative .fuel.
411 Electric fuel substitl4tion programs promote the customer's choice of electricservice for an appliance, group of applliu1~s, orb.uilding rather than thechoice of a different fuel. These prograrns increase customers' electric usageand decrease.us.age of utility-supplied natural gas (CPUC ,1922d).
•..... - , .........• ", ',.,' .......•... ,....... '.
It is" useful to distinguish' two aspects of fuel choice, which are related to thecircumstances and timing of customerdecisionin3.king: "conversion"and "fuel'._ .. .•. ' ( ..................•....... ",<> .. « .. _.1 ...•.•.• -, _'_." ._.,_ ...•...•........_> ......•..•....•••.•.•...................••....•............ _._•...••. > .....•................._....•......_...•.•..,.......... _.:(._ .selection." "Conversion"C'refers to situations in whi~h customers discontinue the use ofan existing appliancetllai uses one kind of energy source and switch to an appliance thatuses a competing energy source. The conversion may be either from. electricity tonatural gas or vice versa' ahd typically occurs at the time ,of equipment' replacement."Fuel selection" refers to situations in which customers are selecting new appliances',rather than feplacing existing ones~'Fuel selection'OCCurswhenever new buildings areconstructed and, ih some caSes,'when existing buildings are remodeled or new end usesare added. These concepts of "conversion" and "'fuel selection" apply throughout thebuilding sector in residences, businesses, and industries.
Approaches that PUCsadopt towards fuel substitution are often influenced by the context,in" which 'these"piograms are proposed by utilities. In' revieWing fuel substitutionproposals,'many'iegulatorswill consider ~oth existing promononalpractices policies andthe :exteilt to:'lwhich'c6rl1i>etiiigutilities are actively involved in end:"use markets asindicated by their DSMproghuns~ -Some PUCs have used' promotional practice andDSM policies .as the' baSis for determining -cost recOvery' treatment because fuelsubstitution programs -typically have varying load shape impacts and objectives for eachutility (e.g., conservation, peak-clipping, valley-filling, load-building). For example, inapproving an IRP plan submitted by Atlanta Gas Light, the Georgia PSC found that thecost of DSM programs that result in more efficient and effective use of either electricity
., or ,gas could be reCOveredthrough a cost recovery rider. CoSts of fuel substitutionprogriuns -judged by thePSC to be primarily load-building in character, because theywould result in increased revenues for the gas utility, were not eligible for recoverythrough the rider; instead, they were treated as a promotional expense and reviewedduring the utility's rate case (Georgia Public Service Commission 1993b).3 Assessing theactual load shape impact(s) and objective(s) of fuel substitution programs is important for
) Th~ Georgia PSC categorized each DSMprogram proposed by Atlanta Gas .Light as either beingconservation or load-building for cost recovery purposes.
195

PUCs because of the~iffere~tfinancial impacts on utilityishareholders. Some mayregard . these definitional issues ··~.·<hair-splitting,but. they. can •..•help PUCs developconsistent policies and treatment for DSM programs that have different financial impactson utility shareholders and ratepayers. .
8.3 Fuel Substitution Debate
The debate on fuel substitution and fuel choice is often couched in ideological terms-thevirtues and evils of competition, concerns ,about hindering. or correcting market forces,and warnings for and against ~gulatory interference in customers' equipment ,selectionchoices. Often, proponents and,oppOnents seem to be"Jalldrig,past each other becausethey are addressing v.erydifferent questions in $OrneCCI$e5(see Tables 8-:-1and 8-2).
ProPonents of electric~i<rgasfuel s~bstitution argue that:
A, key fCittonale for in~grated reso1Jfce planning , addressing. problems ofineffic~ent resqurce allocation ,caused either ,by market imperfections or pricesignals' ,that do not reflect societal costs~requires that fuel substitutionopportunities be considered by utilities as a potentialleast-cost option.
In,certain end uses, there are major opportunities torequce customer's utility billssignifiC3JlUy,by replacing electric equipment at the end ,ofits useful life ,with newgas':frred '~uipinent. O~n, these"opportunitiesari~ ,because the existing stock
, 'of buildings anq equipment refleclS ch.oicesth~(were made under very differentconditions 'and expectations of ab~lute, ,anci,relative pnces of electricity and gas.'For example, in the Pacific Northwest, a ,life-cycle cost. analysis found thatelectric 'water heating equipment should' be replaced by gas water heatingequipment (WSEO 1993).,
,For other end uses (e.g., space conditionmg), proponents argue that' there aresignificant opportunities for "win-Win" situations for bpth electric and g~ utilitiesto reduce overall costs and environmental impacts. For eXaIllple, gas aircOnditioning can reduce summer electric peak loads while providing a valley-filling option for winter-peaking gas utilities. Load reduction due to end-use fuelsubstitution can also red,uce emissions of SOl[and CO2 for coal- and oil-basedel~tric utilities.
Fuel switching can often reduce electric load cost effectively and should beincluded in electric utility DSM programs. From a DSM planning perspective,fuel substitution options have certain advantagesbecau~, in many situations,
196

Table 8-1. Typical Arguments Jor fue.1Substitutipn
Resources:
Environment:
Utility BillS: ,
Company Impact:
Competition:
.$igl1ifjcantmarketbarriei"S currently.prevent the efficient useofe'J~rgy .. Fuel substitution is needed to efficiently allocatefossil fuel resources. .
Fuel substitution reduces environmental emissions fromelectric generation.
.Fuel.•substituti.on canproyide the ,I~ast-co~~mergy service toall ratepayers. in certain end .u~e.s.•.
Fuel substit~tion canr.educ~e.lectric peak load. In somecircumstances, both utilities benefit. .
Fuel.substiWtionefficiemly allocates'market share betweenelectric generating capacity and gas capacity.
Table 8~2.TypiC~I' Objection.s to fuel Substitution
Resources:
Environment:
Utility Bills:
Company Impact:
Competition:
,.Mar~~tb~rri~rs .don't pre"erl1:the.efficient~seofenergy.The m'ark,etalre~dyallocates'.I"espurces efficiently.
Utility "'egulation is not a proper place for environmentalregulation;· environmental benefits offOel substitution areoften ove.rstated.•
,'.' " ", ,"
The greater ullcertahl-r.! and potential volatility in .future gascommodity costs compared to electric rates means thatexpected savings from fuel conversion are problematic.
A fuel substitution programWiII,retardthegrowth/marketsn~reoftheutility Ipsing the, customer.
It is preferable to rely on competition rather than governmentregulation.in regard to customer's fuel choices.
demand reducnonsare quite reliable and "persistence of savings" is not an issue,particularly if the electrical equipment has been removed.
197

Opponents of electric-te-gas end-use fuel substitution argue that:
The underlying rationale forutilityDSMprograms is flawed in this context. Therationale typically' given isthatmarke~,barriers and imperfections justifyinterventions into end-use markets to increase the efficiency of energy use andprovide a boost f()r th~ creation ofalarg~rmarket for high;-efficiency.productsthat are often underdeveloped. However, thereis no evidence demonstrating thatthere are significant market barriers in the fuel choice market. In fact, gas has'substantial maiket ...sh.arein many con~ted~~d uses and currentfy •there .is anactive market among competing energy sources.
Requiring el~tric~tiliti~s topr()lilote fu~{~~b~titutionis' fundamentally differentthan other types of electric DSM because it results in a lowered long-term marketshare for the electric utilityconducting(,theprogram.
~!;<!~~f,~,~,...~!~tri8.,~~!J~e~'!~i.,~~~P?n:~~tr.e~;~!8m~!J.~~~~~~(·~ .'?ti1er fuelsourceSn1oves too far in the (firection ofeentraIiZOO,governmental control overspecific markets andi~1cwti.--COJl.l~titiv~~.Jtj~.ll;1.~u!~~le. to ask<a utilityJO giveits customers financial assistance to induce them.to iWitch.their patronage to itscompetitors'~.9rering the. costs. btraisin~ the price of its,own ..products.Rel~~yep~~s!ir·~g~aIldel~tricr:egula.~"seryices already provide the propersignal's for customers to make efficienf fuel 'choice decisions. It is preferable torely .,oI)C()mpetition,among different. suppliers ofcompeting,·fu~ls to .best serveconsumer.interests. ,.'Th.istypeofcompetition,provides incentives for suppliers ofequipment and appliances to refmetheirgOOds and keep prices competitive.There is no ~vi~ence tha.tmanaged competition is needed or will.improve energyefficiency. '.. . . . .
In light oithe controversy about interfuel competition issues, this candid statement fromthe Strategic Planning Manager for. the Dlinois..Department of Energy and NaturalResources accurately' reflects the initial reaction of many regulatory agencies to fuelsubstitution:
Like a bad dream, we have pushed the thought of confronting interfuel competition issues into a~ ..£PJ'T.1ergf,·theJllip<>.~~plam1ingp~~, .Jh~I11in.()isfl.t})li(;Util,i,ti~.A.9t lU;~y.sug~ests thattheStatCwide Plan is to be a joint gas/electric plan, but because we cOuld not cOnceive of how wewould resolve interfuel policy issues (or perhaps because we could perceive the resolution all tooweJI) ,the planning pJ"OCeSSwas bifurcated from. the lltart.ba$edon arguments of administrative andmethodological necessity.
While I continue to believe that a truly integrated planning process incorporating both gas andelectricity is methodologically and administratively complex, it is increasingly clear that soon theissues must be addressed. Complexities notwithstanding, the correct way to address them is
198

through an integrated plan. However, for a variety of reasons, the correct way is not likely tobe the way cliosen, at least inthe'nearterm. (Jensen 1991).
One aspect .ofthe dilemma f.orregulat.ors iO SQrting .outinterfuel competiti.on issues is thatrepresentatives ofthe ..gas ..and electric industries.often present starkly c.ontrasting views.The f.ollQWingstylized summaries attempt to refl€1Ctclaims .often f.ound in the ,trade press,j.ournals, .";m~..h~ng rooms:
Many iJ:).v.olvedin the gas industry believe:
ReplaciJ:).ggcu,f9r~l€1Ctriceqw.pm~nt andapp~~in certain end uses.representssound econ.omicangenvircmmentalpolicy f()rc\J.stomers, the nati.on, and even theutility sect.or. H.owever, the competitive situati.on currently fav.ors the electricin4ustrybecause electticutilip.~are g~nera).ly.)arger than gas LDCsin rate base,staff, and number .of cust.omers.·-i¥.oreoyer, .Dlaj.or·.'eq~ipment manufacturersderive the vast maj.ority .of their revenues (85%) from electrical equipment andthus may tend t.obe m.ore responsive t.o electric utilities. Furtherm.ore, access t.o~1€1Ctricityi,s m()re~icJ~pread~ClJl.gas,.a:igh~.ffici~ncygasequiplJlentgenera1lyhas higher initial'· cost thancorrespOoding'- electric equipJll~nt. ..This costdifferential. fav.ors the electric utility industry, even th.ough lower gasprices .often.makes gas preferable.opa life-eycle c.ost basis. However, l.ow gas av.oided costsmean. U1at;U1~net.benefits .,.of.gasDSM .are •.smaller, justifying ·,·l.owercust.omerincentivesJ.orgas.The·.offering ofc~st.omerincentives f.or~igh-efficiency electricequipment'distortsthe marketplace and adding gas DSM> will n.ot correct thisdist.orti.on. Even with gas DSM, electric equipment and appliances subsidized byan electric.utilityDSMpr.ogramwill u~ually .end up. in 'a •d.ominant positi.on.Regulat.ory interventi.on is needed t.oassurea true. "level playing field .••
Many inv.olved in the. eJ,€1Ctti~~tiIityjndustry belieye:
Electric utilities have an obligation t.oServe all electric end-use cust.omers whilethegas,industry'sim.ore.-flexible.service· .obligati.on.oftenpr.ovides them with ac.ompetitive advantage. ·The best available electric techn.ol.ogies rate as well as .orbetterthaJ);competing products. Thiscpmpetiti.on provides incentives f.orcompeting :suppliersofequipment and .appliancest.o refine their goods. Thebenefits .ofinterfuel competiti.on· (e.g., .additi.onalch.oices f.or cust.omers) farexceed the potentialsocietalgains.of mandated fuelsubstituti.on. M.oreover,requicingelectIic utilities t.o pay financial incentives t.o cust.omers t.o switch t.o.other fuel s.ources is anti-competitive and runs counter t.outility regulat.ors' basicjustificati.on f.oiDSM, which isJ.o c.orrect market imperfecti.ons.
199

Fuel substitution raises manYtough questionsJor regulators, which include: Is currentfuel selection economically efficient, or are there substantial marketbarriers/imperfections? Are there significant societal benefits to be realized from end-usefuel substitution? How does one judge from a societal perspective whaffuel use is moreeconomically efficient? Do we need .to develop newtegulatory approaches either tocompensate· for failure in oUt gas 'and electncmarketSortoassure .that there areconsistent policies regarding utility interventions in end-use markets? .For' example,-isfuel choice being unduly influenced by utility financial incentives to dev~lopers orfavorable line extension or hook-up policies1H market barriers or imperfections existin fuel choice markets, are they large enough to compensate for the efficiency losses thatinevitablyoccurfr()mreguIa~fyinterventiori9Jfregwation is desirable~do commissionshave. the' authority to.intervene intheroelchoice' market?
In the next section, weexcunmetbe ptoeeotiral and analytic approaches that various state;PUCshaveused toaddress'thesequesnons.
Table 8-3..Vermont .POblicServiceBoard(PSB):Asse~singFu~1 SubstitutionOpportunities .
. ... .
1. ··When mightfuel.switchingbecosfeffectiVe? ThePSS·.aslkeathat potentialend~use.opportunities, be.·identified,and.thatassumptionsa.bout future relativefuelp.ric:es,measlJreJives, risiks,.andreliCibility be made explicit. and folded intothe analysis. .
2. For cases where cosf ..effective fuel switching. is .likely , are there marketi>arriersth'atreQuire interyention?
3. Where barriers exist, what interventions are necessary to overcome them(e.g., information':anly,loans,or direct investment)7
4. Who .is the.rnostappropriate entity. to, .assist in overcoming .eachbarrier?
5. Jf some form ofJinancial incentive frOm the.utility is necessary, what is theappropriateincentiv~ and prograrndesign for.each meaSlJre..ty~?
6. If a utility encourages customers to switch to an alternative··fuel, should italso pay for otherDSM measures associated With that end use? Also, if DSMcannot be guaranteed in conjunction with fuel switching, is society better offkeeping the end use as an efficient electric end use?
7. Should a utility be allowed to develop programsforcost':effective fuelswitching from nonregulated fuels.to electricity?
Source: Reeb end Cowert 1992; Vermont Public Service Board (PSBI 199111
200

8.4 Case Studies: .Experiences with(Fuel Substitution Programs
A review.efthe experiencesefvaneusregulatorycommissiens that have addressed fuelsubsti~tien issues.provides .a.~seful feundatien fer understanding alternative.appreaches.PUCsin.fivestates-Verment, Wisconsin, Califernia, Oregen and New Yerk-haveencouraged orcondened fuel substitutien andhavedevelepedproceduresfer it. '.Fuelsubstitutien is currentlybeing.addn:s~ in·lNevada,:Maine,and .ether states•••withoutre5()lutien..losome s~tes·(e.g., Geo~gia), electric.utili9es arechallepging conmrissieneffe~~()imw~. fuel substitutien.Programs. In manY's~~,PIJCs ha'V~netdevelopedexplicit positions en the issue and necomnrissien~approVed.fuelsubstitutienpregramsare being conducted.
InVerment,' thestatecemmissien mandated fuelsubstitutieneven theughthe. electricutilityindtlstry\Vas unwiping. .ffia.relatiyely.shert time,theYerment Publk SeIVice.Bp~d {VermontPS13).()rder~. its.regulate(i.elc:ctrlSi~tilities toC()nsider fuel substitutionas a "demcwd-sidemeasufe and.•to..previde ..,in~J)tives.Jerfuelsllbstitutien jf it. wasbenefiCial.te.society. Mereover , the Yerment.PSB>Withstooda legal:challengefrem theutilities, which''Wasre5()lved by the passage .ofstate legislatien affirming the VermontPSB's authority tOl1Jand(ite fuel substitutien. Th~col1Jnrissien' s decisiensen fuelsubstitutien.w~r~.'base(J.onthe.f611.o~g ..policy principles:
'."." :.:.::. . .............•
(l)Cest~ffecti"efuel SWitchirag~h01.ildJJe!d~ntifiedaPdactiyelypursued byutilities .as.part .of their •IRPProces~,
(2) Utilities sh.ould seek to spend as little as possible .on fuel substitution.opportunities"but"inustbe willingto·payt.o acquire these resources ifnecessary. when they are mere' Cost-effective than expenditures foralternative supply resources ~ and Cewart 1992).
In carrying eut.thisdecisien,theVermentPSB asked utilities t.o address a set .ofquestiensin p~der tesystematically analyze fuel substituti.on .opportunities.which, inVerment, arem.ostly. to. unregu~tedfiJ~I~,.andbettetunde~tand thel~vel.of utilityinvelvement\Vhichw~ m.ost(ippropnate (~!apl~8-3). S~veral electric utilities wereparticularly upSetby the Vermont PSB"sdecisi.onbut haveProposedprogIClJ1ls'which theyassert comply with the Board's· ()rder.TheVermontPSB and utilities are currentlyaddressing several th.ornyimplementatien issues,such as how fuel substitutien costs.andriskssheuld be allocated am.ongutility companies (see Exhibit 8-1).
Geoigiapreyides an()therexample.of a state.commissien proCeedingaleng an aggressivepath institutiilg fuel substitutienpoli(:ies. Electric utility executives.as irate as these inVerment, resisted the .Geqrgia.Public SeIVice•.Cemmissien's .directiens to.consider fuel
201

Exhibit 8-1. The Vermont PSBMandates Fuel Substitution
In Vermont, the Public Service Baard (Vermant PSB) has histaricallyinterpreted a 1973 state land-use law requiring·the best available technalagy farefficient. use .orrecavery afenergy"ta require the installatian .of equipment thatminimizes life-cycle. cast irrespective aUuelused."ermant'slargest utilities havepravided rt)s.idential.custamersvvithinfarmati.gl'l an fuel~ubs.titutian since .the '..mid-.1980s..andJimiteds'tate. finaQ~illg h~si.be~n~vaiiabletg~ssist.custam~.rs.wha""ant ta~witch from.ele~tricityta prapane,pil, .wa.aef,•.an~ n~tljral .gas fgr space .andwaterheating. Switching ta natural gas in Vermant has been relativelvl!mited as it isnat widely available (Raaband Cawart1992).· . '," .
The Vermant PSB "expressed its view that fuel switching'shauld bej'atwa-way street in the cantext .of integrated resaurce planning URP),and shauld beeV'aluatedan tbe basispf tatal sacietal.casts and..benefits"(VermantPublic ServiceBaard199.o). . .•.... •..• .•...•.. <' ••..••.. ' .i , .
In 1990, the. Vermant eSBprdered utilitiestainvestin .•.efficiencyprClgrarnsthatarecomprehensive,incl~(jingaiming at cost-effective savings fram .....ecgnp,micalfuel switc~ing.· Ceritral VermpntPublic Service (CVPS) and several nanutilityarganizatiansanemptedta·implement. thearderthraugh·camplexsenlementneggtiatians.This re~ultedinafTIatiantacampeIC\lPS ta acquire cast-effectiveenergy efficiency resawces:: CVPS appasedth's' .matian~r)(jchallengef;lthe. PSB'slegal autharity ta .orderaNtilio/ ta pfferf.ina.Qcia~,assist••nce.taits custamersfarcast-effective fuel substitutian. After further investigatian, the Vermant PSB .orderedCVPS and other parties to analyze the. ll1 erits.of specificf~el.~~bstitution measuresand.filewithln 45 days a plan for theac9uisitian.af thaseenergyefficiency resaurcesfound to be cost effective. CVPS appe.aledto the Vermant Supreme Court butwithdrew its appeal after state legislatian was passed in 1991 which affirmed the~.ard'sjuri.sdic,tion;.A settlefT'lel1twas.rl:!achl:!d"",iththe nonutility .parties in which.c.:.\lPS~gre~d,togffer ;:),comprl:!hel1sJvefuel.s~bstitutianaucfit,.ta. Pfgvide informationan the _.castsand bene,fJtsof f~el sljbstitution, afld tO~E!lp secure ll1arket-basedfinancing for. cost-effective f~el ..substitutian .(VerrnontP~blic Service Board 1991 b).
Since early '1991, five 'of Vermant'slargest electric utilities have included fuelsubstitution campanents in their DSM programs. Burlingtan Electric Department (BED)and Washington EI.ectricCoapafferfinancial incentives ta.custamer$for fuelswitching. CVSP, Gre.enMaufltain Pa"",er,and CU.Chave cammined .to helpillgcustamE!rssecure cal1v~ntionalpapk laaps..The raughly .15% cast-eftectivenessadvantage applied tg .pSMfa.rit.sgreCiterfle.xi~mty and lawerepvironrnental.impacthas bf:!enapplied ta fuel. substitutian pragrams ••[)isputes abaut custamer incentivelevels still remain to be resolved. .
The Vermant PSBhas resalved a disagreement between BEDand VermantGas Systems (VGS) aver whoshauld. pay far a substantial amaunt .ofweatherizatianinstalled concurrently. with fuel.slJbstitution installatians. The. baardcancluded.thatVGS should pay because it benefited fram the impraved efficiency .oncethe custamerswitchE!dtonatural.gas, .and the remaining BEDcust9Il1er$\lVa~ldhave na<funherinterest .oncethey had paid for the. canversian. The board has alsa approv.edprocedures authorizing utilities ta recaver investments in ather types .of DSMpragrams fram custamers wha subsequently switch fuel (Raab and Cawart 1992).

Exhibit 8-2. The Georgia PSC Mandates Fuel Substitution. but GeorgiaPower Objects
The Georgia legislature passed the Integrated Resource Planning Act inMarch, 1991 (Georgia Official Code 1992). In December, 1991, the GeorgiaPublic
>Service Commission promulgated rules implementing the Act (GAPSC1991).· Thehearil"lgsion the.rulE!svvere ~I;)tlycont~sted, with Georgia Power and .i. SavannahElectric&./Povver Compap}'(b()th .0V\(ne~by .the SOllt~ernCompCllny,()bJecting to",,~?y .0f.t?~reF~rn""ended fjling req,:,if~ments~•.•Th~tY"0. companies .••Y"efe.vehementlyoppose~ to<~?rprovisions r~~ardingfuel.substitution. Bo.th~ompanie~~lIbmittedtheirfirstintegfatedresourceplansonJanuary 10, 199~.. Neither cOrnpanyi?cludedan assessment.offuelsubstitution .opportunities initsintegtated resource plan.
[he. tvvo cQmpanies.nol only questioned.the jurisdiction of.the .commissionbutalsoiJrgu~d. thCitthe teffT' "fiJcilities vvNc,",oPE!rat~on alternativ~sourcesofe.l"le...rgy" jn the rule refer.'s.to supply resources<only...a1lhough..sev..era.I.inte.rvenorsargued that the term is Used:in reference to "other ..Jtemand-sideoPti.~ns".andincludes such options. Both utility companies subsequently fil~d for a waiver fiomthe fuel substitution assessment requirement of the rule. Both requests for a waiverwere deni~~,.ar~ the. co""panies V\(E!.re.order~d to.developinfarmati~l"l. andperlormevaluations of end-use fuel substitution for potential DSM mea~(Jres,the details ofwhich were to be dealt with in the subsequent certification documents (GAPSC1992).
11'1.SeptembE!r.1~92, each company refiledits.applicadQn.for.certification •ofDSMprQgriJms ..thatit hadil"lithJlly.submitteetjnJanuaryialoog witlJ its integratedrfilsou,rceplan.pur~ual"ltto the .rule..Both.compal"li.e~.Ylfj:thetrewtheibulkof tlJeircornrnerciCilal"l~.•il"ldu~trial del'l"land-side.programs, stating theiril"ltent,to file them at a:llltE!qirnE!' ••N.eittlercornpany~ul>mittedal"l analysis of potential fuel substitution.DSMmeasures. In its orders granting certificates for the primarily residential DSMprograms of(~eC)rgiaPowerand Savannah Electric, the coml'l"lission (l)acknowledgedthefCi.ilureafboth ·c o l1'lpaniest() .fll"yassessthepotentialofful:llsubstitution, (2)stated in the body of the Georgia Power Order that "Georgia.PC)\lVershouldcontinueto ass.es.s.this.pC).tel'ltial,.and~hCl".be requir~dt()il"lclude,theresults of its assessmentin its 1'1E!~JRgfilin.g~ar;td,(3) put il"lmotion.action tgresolve ..issuessurrounding thelevel.ofincentives.fol" fuel.•prol'l"l()tion.programs,. bu,t,diet I"lotfurther address fuelsubsdtution •.in·.t.heordering Jal"lguage'ineither orgef(GAPSC .·.1~93a).
Subsequently, the Georgia Commission addressed .theissu.e of fuelsubstituti()n in~.t'antaGas.Pght Co.'s ·IRPfiling(G~I;'SC .1993b). The Commissionappears to have Jesolvetfthe.fuE!1.substitution.issue in its Augu,st1993 letter Order inReconsideration in that case by (1) distinguishing between load building (self-promotion). and..conservation (pr()motion ..of programs vvhichreduce load, includingswitchingto.a c(>l)'lpetitpr'sproduct) in bpth industries,· (2) treating. conservation asDSl\Ilvvith~pecial.cost recovery and treating load building as nQrmaLbusinessexpense, (3) specifying thatDSMincentives are only. for efficiency il1'lprovementsabove and beyond code, and (4) balancing t~ecu~tomer rebates.offered by the .twoindu~tries based 1;)1'1.savings to the indiv,idual utilities.. There has beenl')() experience yet under this ruling.
203

substitution in their DSM programs. In an August 1993Order, the Georgia .cQmmissioninstituted policies designed to ensure balanced competition between the·electric and gasutilities (see F:xJUbit8-2).
The CalifomiaPublic Utilities .commission (CPUC)has mandated that fuel substitutionbe considered. asa natural.element ofDSM.California'sutilities (incl~din~the nation'slargest •~mbined utilit)'.andthenati~n's ·l~gest aIl~lectri~ .~~ty)di~Il()t~bject. TheCPUC,~mc~ iIlitiaUydevelo~ ..~.diformali7~i.tI1e StanAAtd.ec()n()l11ic.~~tsthat areu~by mClJlY.rUC~in eVa1~ting the.costeffecti,,~ness .ofDSMpfPgrclnls , has reviseditssW)dard.procedurc:s maJluaLtospecifically treatfueL.substitution./Califomia utilitieshavebe~un to proposefuelsubstitutionprogrclnlsunderthenew guidelines .(see Exhibit8-3). Thesenewguideline~.~ern~re r~strictivet~an thecriteriaforoth~rDSMprogramsand . serve· the .intendedPufpose of Jim~ting.the .amount ..of ratepayer.-funded fuelsu.bs;tittitionthat·WillOCCUI'.
204

Table 8-4. Wisconsin's Revised Interfuel Substitution Principles
1. Total. tec~nical .costs plus quantified environmental externalities. should beusedt()evaluate.fue.talternativesto determine which end uses are servedat the.'owest.co.stto. society by fuels.prenergy sources other than.~~~ .
2. Resource options involving fuel switching or use of o.therenergy sourcesmay have revenue requirement and customer service benefits for anelectric utility.
3. .Electr'iCutilities .cancapturethos~bem~fits, but they should pay no morethan is necessary to get cusiomer~ to t~ke action.
4. If the supplier of the other fuel or energy source is providing incentives totake. the action, the electric utility may st)owthatit is unnecessary toprovide' further incentives,. or some partial. incentive.lTlay .bejustified .. Theprinciple to be applied.isthat'enough .must be provided to induce the~ction, but no more .thim.that,whatever the source.
5. EI.ectricutilities n')ust.giye CleClltaccurate,andcurrentinformati.on tocustomers on the benefi~s andcosts.of fu~l.substitution, or any otherenergy use question for which information is available. Inparticular,electric utility Cidvertising,.prog"amliterature,· and presentations shoul~sJ>edficallyaddresstheavailability of incentives foduel substitution ofenergy sources other than. electricity •
6. Gas utilities should pay a fair share of the incentive to encourage interfuelsubstitution.
7. The application ofthese prinCiples should be periodically .reviewed on acase-by-case .biJsis.
8. Combined. electric. and.gas utilities. should coordinate their programs.
The Wisconsin Public Service Commission (PSC) has also urged consideration of fuelsubstitution. as DSM since around 1989.. But the Wisconsin PSChasstopped short ofmandating consideration of fuel substitution programs. It has focused much of itsattention on customer rights to choose,specific:allY addressing balanced incentives andmaking available full and unbiased information developedjointly.by the relevant utilities.The Wisconsin PSC has issued a set of fuel substitution principles to guide thedevelopment of utility fuel substitution DSM programs in Wisconsin (see Exhibit 8-4).
205

Exhibit 8-4. The Wisconsin PSC Stops Short of Mandating fuel Substitution
The Wisconsin Public.Service Corllmission .(PSC) has urQed Wisconsin's utilities topursue fuel substitution, has provided interfuel SlJbstitutiollprinciple.~ .as.Quidance, and hasapproved fuel substitution measures proposed by vario~s utility companies. In September1992, the PSC mandated a fuel substitution measure, only as a joint utility pilot project.
The Wisconsin PSC addressed fuel substitution directly in its 1989 Order approvingAdvance Plan 5 (the Wisconsin utility companies' fifth biennial integrated resource plan) withthe following statements: .
The commission finds that substituting altemate fuels or energy sourcasfor electricity is likely toproduce resource benefits to an electric utility.... It is not consistent with least-cost planning tod~ny these benefits to ratElpaye~ ...•.• ltis ~easonable 8nd.eCJuitable~hat .electric utilities andvendors of other fuals pay fair shares of incentives for fuelllJ",itching •••• Utilities which assumethe role of energy advisor to customers have an obligation to provide information that is correctand complete on interfuel substitution, as well es other energy issues .... Electric utilities shallfollow thllil'ltllrfuel substitution principle!ienached.~.'(Wisconsin eSC1.989)~
•. ' .... , ...>.... :....•. :.: ....: ',:.::' .:'<:,';
G~nerally~peaking, .\/\Iisconsin's smaller, combined ..utilities. did some .fuel substitutionDSM and theone large>alhelectriccompany didn't· "v .•' ..••.•••••• " .
In early 1990, the PSC ~pened.an Investigatioll int0.methods .for .~valuatinQ natural gassales promotion and allocating the costs of programs that cause fuel substitution. In October1991 ~the PSC ordered gas .utilities to use the TAC test and the Jotal technical. cost test whereregulatedfuelsaresubstituted for each other (Wisconsin PSC 1991) •. !heTAC and totaltechnical cost tests are identical except for the exclusion of DSMprogramcosts from the totaltechnical cost test,
In..September1992,theWisconsin PSC r.ev.isedits interfuel subStitution principles inits Advclr!ce.Plan 6.order, strengthening .itspo~itiononfuel substitution ",(Wisconsin PSC 1992).The commission's eight principles address: the criteria tor evaluation,,'criteria for designingcustomer incentives. customer information, sharing of program costs, and coordination ofp~9grCilTlsbycornbin~d e.lectric an~gas .utili~ies (~eeTab.le8-4) •. orhePSC specified that thesoCietal cost test is to be used for evaluating competing fuel sou~ces.and that·the Comlnissionfinds interfuel substitution to be a cost-effective demand-side option. Every major utility's plancOlltains.end uses for which electrical eQuip~ent can bereplaced.with natural gas as a leastcost energy service.· . . ...• '., ",'"
The PSC again focused on customer rights to choose using full, complete, andunbiased information developed jointly by the relevant utilities; the commission stopped shortof requiring utilities. to institute .fuel substitution programs. HO\IVe~er,~hePSCorderedWisconsin Gas Company and Wisconsin Electric Power Company (WEPCO) to embark on apilot effort to cooperatively develop a fuel substitution program but only to test the efficacy ofslJ(;~ a.neffort .. lJle. PSC>prai~ed.thecurrent>practice.oLsome Wisconsin utilities. of allocatingfuel substitution program costs. The commission encouraged balancing customer incentivesfor electric technologies with those for gas technologies and, in order to help achieve this,limited .the. incentives ele~tric utilities may offer .. It a.lsosuggested employee incentives. to helpchange corporate cultures. ." ... . . .
Wisconsin Gas and WEPCO have responded to the commission's direction to develop ajoint pilot .program, '..In March 1993, they announcedagreementona joint pilot program topromote. hybrid •cooling units .to .customers •as an option to. total. electric units. .The units willuse gas during the electric peak to reduce, electricity demand and will be eligible for therespective electric and gas rebates (Thomas 1993).
206

Table, 8-5. ,Madison Gas. & Electric Approach to, Evaluating Fuel Subs,titution~~~.- '
1. Select low annual load factor electric options
2. See if conversion of gas passes or comes close to passing participant test.
3.Perlorm electric revenue requirements test to scr~en option.
4. If option'passes, perform electric nonparticipant test to be sure rate impact islower than rate of inflation or some other acceptable proxy.
5. Perform ,gas'nonparticip~nt test to assess value to. gas utility.
6. If option passes "5, "see if total value (benefit) indicated in "5'"+ "3'" isenoughtci move the market (pass the participant test).
7. If yes, set minimal needed incentive.
8. Assign up to five years' marginal gas revenue (NPV) to rebate. Take remainderneeded from electricity revenue in "3." Any good promotional program shouldpay back in\fiv~ ,years or less.
Source: Hcibbie"992 " '
Madison, Gas .~,Electric:,a,c().pbil1edutility"h~,m~cletl1ese·Prmciples operational byfC>c:llsing,on options that ,~e,cost -effective,andatful.Cti.v.~.to,th,ecustomer (Le., relativelyshort payback with high reliability, convenience, and comfort level), have a low annualelectric load factor, and could be converted into. high annual load faCtorgas options (seeTable 8-5).
The Oregon pu'C, iikethe'Wisconsin PSC,bas,urgeditsregula~\1tilities to,considerfuel substitution as an element of DSM and adopted principles to guide the practice buthas stopped short of mandating fuel substitution programs. In colltrastto WiscOl1sin,noOregon utilities have proposed fuel substitution programs (see Exhibit 8-5). In Oregon,there ,are nocombina,tionutilities, .whi9h,may co?tribute to the,lack of activity,;•combinedelectriclgas utilities ,.bave, taken th~' lead in proposing fuel substitution programs inWisconsin. '. ' ' .
New York, provides an ~xaIllple,of a state.,PUC;,that has relied •on an ad h()Ca.pproachwhich bas, led to the developmeiltof sev.eral,cost-effective,.fu~lsubstitution ptograms.The New York Public Seryice..c0mmission (l'M!SC) staff has,enco,llraged fuelsubstitution, and some New York utilities have im.plementedfuelsubstituti()nprograms.Until recently, the NYPSC had not promulgated rules and has not issued general ordersor adopted principles regarding fuel substitution. The NYPSC has not required any utility
2f17

ExhibitS-5. The OregonPUC Invites fuel Substitution; No One Accepts
The Oregon Public Utility Commission (PUC) has issued standards forevaluating fuel substitution progrClrns.filed.for approval by its regulated.utiHties andhas publicly stated its "observations" on the subject. No Oregon utility has filed forapproval.ofsuch a program.
In March 1990, the Commission's staff formed an advisory group .thatincluded major stakeholders toexarnine potential fuel substitution" opportunities. With
. :thE!advi~()ry grpup' sover~ight,the~taff~ of. the Corrarrai~siol'1al'ldthe·()regonDepartment of Energye.valuatedthec()st eff.ecpvenessof·iconvertingelectric waterheaters to natural gas systems and of converting elec~ic f()rc~d-air furnaces to eitherheat pumps or natural gas heating plants. In a•.•August 1991 rep7brftothePUC, thePUC/DOEstaffs f()u"d mat: (1lthe.fo.I'1~EJrsions~ppear tP.b~••~()~t.effe.ctiv~,in mostcases, (2) electric utilitiesshoulde"aluC1teresid.el'}tiaIJ~eL.~up~Jitutionasa..resource intheir least-cost plans, (3) utilities should compare fuel substitution 'with otherresources on the basis of total resource costs including environmerital.costs, and (4).the PUCsh()uld.adop~ stal'1cjardsfe>nainedinthe reponJ()r evaluating utility activitiesthatpromot~ ·fue.lsubstituti()~ (()r~gon f'UC 1~91al. •... :.'. In October '1991 , the Oregon PUC'issue.d.a let!~'r;'~#ppting standards that
require a utility sponsoring a program promoting fuel substiWtif;ml:letween electricityand natural gas to demonstrate that:
• the program is economical in terms of a resource cost comparisonb~t"VEle~.~I.ElRtr!c;~J.al'l~~C1s.~Elr"ic.e<>..•...'. .•..' ....•....•.........the fuel substitution is not occurring rapidly enough without the program
• existing 5LJ.~~ornersof. thespo~soril'l~ .utility "ViII.~enefjt• . the program prornote~only fuel. s~~~tituti()nthatis cost effective• energy efficiency 'is aggressively pursued as part of the program (Oregon
PUC1991b).ThePUCencouraged .reasonablefuel sW'itchingprogram proposals bvany
utility-natural gas or electric, invited utilities to file joint programs, and al.soinvitedproposals to minimize financial disincentives and provide financial incentives.
A~.().f.March, 1993, 1'1.09regonutility had applied to the commission forapproval of' a fuel substitution program.
to, SOnc1Hctsucha program but has•.•approY~fuels\1bstit\1ijpn: .,PWgrclJ1ls1Pfoposedbyindividuaiutilities as part of the companies' long-range DSM planning r~uirements.Several combination utilities and one gas-only utility are currently offering electric-ta-gasfuel substitution ProgrclJ1ls,.and som~of thesepwgraIlls .are'lui~larg~. In J993, based~I,l.staffrecommenda~ol,ls,the. N~§£got mO,re.~ffiPly involv~l)y()rdering that anyfu~l.~pbstitutionprogram mustPasstl1~'fRC test,~uch<prog~ms mustbe'.offered to allcJjstp)11ers,.•and. conside~ti.()nl1lustbe~;~iven •.to sharing costs and. benefits with the.affected .alternate fuel suppliers (see E,iliibit 8-6).
208

Exhibit 8-6. Easing into Fuel Substitution in New York",
The New York Public Service Commission (NYPSC) has not developed formalpolicies or guidelines on fuel substitution, but' its a,cticmsapproving utility companies'fuel substitution programs beginning in 1989 form a de facto policy ofencouragement. " , ,",' ,< ' "" '" ", , '",'
Although the NYPSChad previously promotedtheus~6f natural gas ingeneral, a gas air conditi~n~r,program~rOposedbx ConsolidatedE~isonjn 19.89wasthe first f~,elsubstitutioripro~ramiJPJlroved by,therSC.Jhis,wa~ a major •milestoneas thepro~ra~Tepresented,a' $10' to '1,4 mil!ionapnual.invest.rnen~bY the utility .Si~ce thenj' tO~Qlsland lighting ,Com~any(Ro~hest~r Gas andEl,ectric Corporation,Brooklyn Union GasC0.rnpany,andNational,Fuel Gas Distribution Corporation havealso instituted ,fllel-substitutionD§Mprograms;
Although it is stil,l noto~ician'(pr~mbting',ormandatingfuels~bstit~tionprograms" theN~w Yor~,PSC',is.increasjhg'its"ilifluence ~ndcontrol, in"this .are,a. In arec~nt[)SM proceeding" the ••PSC§taffencourfgedm~ 'contin~ed impleme~tation, andexpansionofJuel substitufipn pro~ramsi~ln~tances where, they would assure more'efficientuse,'of the state'~ energy',resource~1;:rhe PSC.acc:epted,the"sP(!~lfi~recommendation of its,staff and.did not approve ,any 1'994 fuelswitchingJ>rograrnsunless the' utility submits a,satisfactory pl.anforcoordinati~g efforts and allocatingcosts, and benefits with affected alte,rnate fuel suppliers by January 1 19'94'(NYPSC1992).
Maryland has had limited opportunity to address 'fuel substitution iss'uesdifeetly. TheMaryland Public Service Commission has not issued generic orders on the subject. Ithas ,carefully set its DSMpolicy"tobefuet~blind,on;thegrounds' Jhat'1.there',may bebenefits to customers from competition among alternative energy suppliers. Oneuncontested fuel substitution program has ~een~pproved for ~altimoreGas and ElectricCompany., The Maryland •,PSCrli~~ so manYcommissions ar?und the country, expectsto be dealing more directly with the fuel substitution issue in the near future (see Exhibit8~7).
Nevada, Florida, Massachu~etts'J{hode Island, and other states have addressed fuelsubstitution issues sporadically ,during the last several years with,' relatively littleresolution. In Florida, electricutl1ities wereinitially ordered toerigage' in fuelsubstitution strategies, but ,the commission backed awayftomthis positioriin>responseto a challenge to' its authority. The District of Colmnbia specifically prohibits DSMprograms that involve fuel substitution, denying fecoveryof the cost of programs thatresult in even incidental fuel switching. Some states, including Kansas, Mississippi, andArkansas, have recently begun to address the issue. '•A number of PUCs have rules ororders that deal with the fuel substitution issue less directly, requiring their regulatedutilities to consider fuel substitution as part of integrated resource planning. Often sucha mandate gets lost in the intricacies of the planning process or is too recent to have been
209

Exhibit 8-1. Maryland's Approach: '"Fuel-Blind" DSM
" The MarylandPublicService,Fommission (Maryland PSqhasnot dealt withfuel substitutiqn C)nagenElJicbasis. IngeneJal,Maryland'~pSl\!lprogJams ,are, fuelblind, offering incentives for enhanced efficiency of either electricqr,gas.applianc::esput inc;lllding nqi~centi"ejC)rJhe ~,eIElctiC)n.C)fqne fuel.C)"e(.theC)ttler., .,In,1991, theMaryland PSCapprC)veda fuelsubstitutiC)n prC)g~amprC)pC)sed.6YBaltimC)re\~c:ls ~ndEIElctri~(BG~i:), i.JlvC)l"ingr~patEt,i,t().pr()mC)te,'.cpmm~(c::ial.gaSa~rC()nditiC)ning. TheapprC)"edreb~teis "$,~()g,,PElrde,fElrred,kWC)ffered .tC)QewgCJ.s~~~'.C;ggd~iC)llingcustgmerspl!.l~ cJC)lIar..f()tdC)'Ic:lrJl'latctliQ,gC)f.Elngin~erirlgfeasibllity~~lldY cC)sts up tc)$15,O,Og.", Th'is,isJthel;arnej~R~rltiv'El()ffElred under.~~&i:·s.cC)rnrner.c::iaJcgC)lstC)ragepmgram. In additiC)n, a lC)wer gClS.Cliq~C)nd.itiC)girlgriilte\IVa~ apprgvEld.
~s a, cC)mbinati,C)nutility, ;~G,~~':s,purpps,e, i,n C)ffering '.thEl'Program, was tC)shiftalmos,pheentire tElmper~turEl-sfitQ~jtive'~u.rnmer, load from the Elle,c::triC::"peak".t0,thenatured,gas, ,"valleY," ,therepyimpfiQJ,ig" .JC)iildfiilc::tors"gn bom ,its "ga,sCJ.ncJ,el,~ctricSy~ternS1 "TechnC)IC)"iEl~Elligibl,efQrth,e .fuel~lJb~tiWtiC)l'l.prqgram jare:, ,1.1Jdirec;tgas~fire,cJ3absorptiC)n ,'.c::lliUerswith, int~grated boilers"(2), indirec~gas-f,rEldabsorption.,chil.ler,s,withseparateiC)rl-site,boiler~;.(~) igaseggine-qri"enctlillers,. ,clncJ,14),gas~fired~El~ic;c.antdehllmicJification systems ..,.I,n.its ,prppqsal ,totheM,aryl,and,PSC,I3G&E,notedmat.gas aircQl1ditiolJirlg.wasil1crea~ingly ,becorning.ec;c:morniC::iillIy;a~ractive fC)rcustC)mers with large cC)C)lingneeds and special uses for waste heat altholigtlthetechnology was still less efficient than today's electric cooling systems. Other'benefitSiof,the.programicited"iby:theutilitYincluded,.itspotential;toreduce ',',"Chlorofluorocarbons (CFC's) and offer customers additional energy service options'Baltimore G,as and Electric,1990).,'
, - ",
incQrpQrat¢. into.Practice. ".:How~verColorad()' s,~~perie,ncejs anexcq>tion; the Colorado~ublic Service' C()mrnis~ion ,has !stimulated, irnpr()Ved•efficiency throllgh.,fi1el substitutionby relying on DSM bidding plus one large collaboration with the Public ServiceCompany of Colorado (PSCo) and local governments (see Exhibit 8-8).
In July 1992, the Washington State Energy-Qffice il1itiateda project with sev~ral of thestate's largest electric, and ga.s-onlyutilities to develop a collaborative model forcoordinating gas and electric" \Jtility ,integrated" resource. planning-also referred .to as"fuel blind" IRP .,The ,study, still underway, ,will soon .issue ,rep()rts oncost -effectiveopp()rtunitiesand regulatory, financial, or .other. barriers to improve efficiency from:
ED line extensionp()liciesGIl. joint trenching., cogeneration facility siting• district heating and ,cooling.
210
• fuel substitution or fuel choice• pipelinecapa,city sharing• fuel cells

Exhibit ,8-8. Colorado:"A Utility DSM Bidding Program .Reveals fuelSubstitution Opportunities
The CDIDradDPublic Service CDmmissiDnenacted IRP rules in 1992 whichrequire that fuel substitutiDn be cDnsidered.byutilitie,s in their integratedresDurceplans. A bidding prDcess established by the PSC in 1988 prDduced many fuelsubstitutiDn propDsals.
Public ,ServiceCDmpany DfCDIQradD(PSCD),a cDmbinedutility,js:the majDr•~upplier.'9fn~~lJral,Q(i,san(jelectricity, in qploradD.PSCD initia~ed·(ipilDt' DSMpiddingprDgram ,inmid-1989 for 2 MWdoll()we~ by a~O-MWsolicitation fDr DSM in l~te1990. '.Tl1e!50-MW.,biddin#prDgram. attracted~3,pr()PDsals tDt a iing.131,••M\y"Dfv.'hich Dne.-third(43 M\J\I)\\IereC:DnversiDnsDf,~Iectricheating ,andcDOling to. natural'oasandsteatn.PSCDavirarded thi.rtY~twDcDntra,cts tDtaling 55.2 MW,'Df which 40%(21.5.MW) invDlvedfuel substitutiDn(Chi and Finleon'1993).
TfJeslJccess \of PSCo's DSM biddingprDgram, including verificatiDn DfoverJhree-quarters Df the cDntracted pilDt demand reductiDn, ShDWSthat there. i!)alarge. amDunt Df electricity being cDnsumed in applicatiDns where natural gas use appearsto. be mDre eCDnDmicallyefficient frDm a sDcietal pDint Df view. Because the aVDidedCDStSunderlying the bid Dffer have nDt ye~been fDrrn~lly established, PSC() a~d theCDIDradoCDmmissionstaff agreed to. SIDWthe prDCeSSby placi'ng ill capDn fuel',substitutiDn in a secDnd 50-MW DSM sDlicitatiDn issued in mid-1992, fDr which bidsare currently being evaluated. The 30%-Df-demand~r:educ:ti(>ncaponfUl:!1substitutiDnyvasaccePte,d9Y, the cDmmissiDnar'ld isapparently~asedDn,concemsabDut:rn,eCiS,lJresth~tre~u~eden,a,~~,DnDnlyt~.~"""inter peal<,e(Juity, (indthe~(i.ctthiltfuelsubstitution Didioare relatively mDre attractive. financially to. the utility'ttlanother'.types Df DSMbids(i:e., c()nservati()ri)gi~ericuthintra1:emaki.ig. ", ",...
In additiDn to.the DSM bidding prDgr~m, the. CDIDrad?CDmmissiDnhaswDrked cDDperativelywith PSCD.,andtheapprDpriate IDcal gDvernments tDIDwenhepeak·electricitydemandDf the neWOenver ,Internatio.nal Airpo.rtbyselectingnaturalgas,chillers inste(id o.felectricchillers ...The city andcountyare,buildiQg ,a ne.W .internatiDnal,airPDrtn~arDenver,scheduled to. o.p~nirl.Dec.emb~r1,993'.Th~,,~irpDrtwas initially designed~D,a peak IDadDf 90.MW Df,\\IhiC:h'7.3,WiVYwasfDrelec~ricchillers. Gas chillers were considered but wDuldhave CDStan'sxtra $2;4 milliDn~ Theextra mDney was nDt budgeted even thDUgh it wo.uld have paid back the investmentin five to' six years 'frDm IDwerDperating CDStS•
.When •••PSCD.became aware of the.oppDrtunity to cDst-effectivelyavDid 7.3MW Dfpei)k,IDad, there was little, time to effect a changejntheCiirPDrt designwithoutdelaying the opening. TheCglDr,ado .CommissiDnprDyided.special treatmenttQ authDrizetheutility to.prDvide a $1.5 mi,l.liDnrebate to. the,c:itya.~(j cDuntyt()rselecting gas chillers instead()f electric chiUersand investing an extra $O.~ milliDn.PSCDpaid $200 per kW to. aVDid7.3 MW Df peak pDwer, saving almDst $1 milliDn
; during the next ten years (Alvarez 1993)..
211

Many states have avoided addressing fuel substitution altogether although it is likely thatthesePUCs 'will soon beconftonted with the issue, because of the attention andcontroversy generated by fuel substitution.
8.5 MajofPolicy and Program Issues
Inthissection,we·discuss six policy and programmatic issuesthafstate regulators arelikely to confront if they choose to address fuel'substit':l~on ~~ciesexpliCitly. Theseinclude: (1) ,.altemative aPPmaches to incorporati.ngfuelchoice,effiCiency q. an IRPp~ss,', :<2)~nomicand, 0ther~teria ,that caIl~u~to,eY~~te ,fU~l,substitutionprOgrams"(3) debates Qyer "~t~.vs.~better"efficj~q.cyoptions; ..,,(4)cost~ocation andresponsibility, (5) customer equity.,issues,Clild (6) treatment .of iunregtllated fuels.(Technical considerations .related to analysis of fuel substitution options are disCussedinSection 7~5).
8.5.1 APProa.chestoJncorporating Fuel Choice •Efficiency in an.IRpProcess
There are three fundamental approaches available to ·state PUCs· that ,choose to addressfuel choiceselectiQnexplicitly as part of an IRPprocess. These approaches "derive fromhow.PpCs, •.~te .or colll~inethree ..,majorfunctions: ,(1) ,settitlg•scx,:ial.c:riteria, (2)teClwca1IycomparlIlg,and'selectlftg al~a~v~, •.and. (3) deyelQping a resource plan.
One option is· for a •PIJCto haveelectric,gas,orcombinationutilities.propose fuelsubstitution criteria as part of their resource plan preparation. This approach essentially~lllbint:Sall. threefu,nctions' (criteria setting,alternativecotnparlson/ selection, and plandev~~oPlilent)~toa single proce~s..This .n~pr()ba~ly'~~n tile m()st eomllum approachandbas,~n~utilizedin Vermont, q~rgia,Clild New Yprk. .
A second alternative is for a PUC to presetfueLchoice criteriafor ..natural gas and/orelectric·utility companies to use in their .planning processes. The companies then usethese criteria to compare and select among fuel substitution programs and to prepare theirreso\lrce',i»lans.',The criterion would be reviewed less frequently than t,he,evaluation ofalternatives, which tak~ pla~regularly. , The, California and, 0regPIlhave set fuelsubstitution .criteria.in seParately .~tablished proceedings. Other PUGs (e.g., Nevada)have opened dockets for this purpose but have either abandoned the effort or have notyet n:a~hed,consensus:, TheWisconsill PSC t:S~lished.~~l s~~s~tuti~ncriteria as partof its IRP plan review' process. The evolution of adhoC'dedsionmaking' into formalizedguidelines on fuel substitution, as in Wisconsin, is a path that many other PUCs couldfollow.
212

Table 8-6. Regulatory Approaches to .FuelSelection,- -: .-.,. 3.:;
#1 Utility Selects fueland paanstoats Own Criteria (Utility Designed)
Pros Provides frequent opportunity to review criteriaAUo\iVsfle?Cibility.forutilitytP ~()rnpare.all fuel-substitutionopportunities in any.specific settingCa.nbe.initiated relatively quickly by commission ordervvithsimpler hearing 'than #2 or #3, if'any
Cons Commi~sion.review of.fuel comparison and utility plan is~Prnpl.icate(Jbv limited .analysisof alternative criteri~i unlessappr()lJri~$El.·an~lvtical..requirements ..are prescribed
.#2 UtilityiSelectsru~I'!rlcj Plans to Preset .:Criteria(Utility. Designed toCommission:5tandi'"ds): ' '/" , ,,
Pros It Allows planning to knownc.riteriaAllows. independentschedLlling of criteria reviewAllow~ flexibilityfor.lltility to compare an fuel substitution()pportun!ties in.a'fly spe9ific:settirlg
Cons Requires longer, two-step process to initiate than #1 but shorter(or in least less contentious) than #3
413' .UtilityPlanst():prest!tCriter!~anqFu~tereferences(Cornmission Designed)
Pros
Cons
,a.llowsplanning to knowncri,eria .......\Allows independent sche(Julingofcritg3ri.a reviewGuarantees generally efficient fuel use
limits flexibility for utilitY to create new, more efficient fuelsubstitution programs
A third option is for a PUC or state legislature to predetermine preferable fuel choices.Utilities. would then develop their. resourf7plans Vlithin.the.fuel choice ~onstraintsimposed by..the·commission..Such.an approach has beenused , n()tably in restrictions oro\jtright bans' on electric resistanceheapng mSOlne ..parts of.the. country . However ,government~ificationsregarding fuel Use.are notin favor in thelJ.S .••and we havefound no instances of states considering thi~;approachto resolve controversies about fuelsubstitution. '
Table 8-6 summarizes themajor implications for regulators of these three approaches for
213

addressing fuel choice selection. The three approaches are presented as.idealized conceptsalthough, inpractice,.PUCs willhciveto fashion processes that serve their specific needs.
8.5.2 Selection Criteria for Evaluating Fuel Substitution Programs
In thinking about' the criteria that should be used.tOCl11al:yzefuel substitution programs,it is useful. to.focus 011..~ditionalicpnsiderations for.asses~g this type of program incontrast to other DSM programs...Fuel ...sub~tit1Jti()PPrograms involve the additionalconsiderations of multiple fuels, often more than one regulated utility company, andcomplexity in accountingfor net environmental impacts. '.A few PUCshave consideredand accounted forfueFshifts 0tits ide theco l11PaIlYimplementing a DSM program in aqualitative fashion when evaluating' the proposed' program. However, with fuelsubstitution pI'()gran1s,itis esse~~al..·.thllteval\lati0ll.criteria. be applied to the affectedutility companies in combination as well as individ~ly. .
Table 8-7 illustrates criteria that.can be.\lsed individuallY'or in combination to evaluatefuel substitution •programs. The table also shows the relevant figure of merit (Le.,apprdpriate ecbnomictest)thafcan be utilized to. conduct the analysis as well as theelements involved for a particular criterion. It is important to recognize that the criteriau~ •.to. eval~te.fu~I~\lbstit1J~on ..pr~graI1ls are ..similar to those used in resourceintegration of demand-slpeand ,supply-side alternatives.(see .Section3.1).
The Societal and Total ResourceCost/<TR9> tests have been favored .asthe primaryan31ytlc3.Itools among PUCs that hive addressed fuel substitution directly. California'sStandard Practice 1\.fanual,'whichprovidesg\iidelines for analyzing DSM programs,offers one rationale for' this choice:'
F91'fuel.su.bstituti9npro~,.the .TRCtest ~ .then~t effect of the impacts from the fuelnot chosen versus the impactS from the fu~l.tMt is.chosen.as a.result of the program. mc (andSocietal··Cost)testresultsforfuelsubstituti6n'pr()~'should be viewedaS'ai·measure of theeconomic efficiency implications of the total energy supply system (gas and electric) (CPUC andCEC 1981) •.,
Forfuel. sub~titl1ti()npr<>gran1.s"either .theUtility <:ost.test or Ratepayer ;lfnpactMeasure(RIM)~lmaYbe app~ed~.jlffected u~litiesindividually orin cornbination~:H0\Vever,r~ults .from the .t\y<>tests appl~~ <41diyidually.to each .cOInPan.y~avetob~. interpretedquiteca.\i~ously.gorexaIllple, ~~lts fr<>mthe UtilityCost~tJor ~h companyprovide little useful information because by their very nature, fuel substitlJpon programswill change the number of customers of both the electric and gas companies for the
214

Table 8-7, Potential Criteria That Can Be Used to Evaluate Fuel SubstitutionPrograms
Criterion
. optimize source energy use
optimize customer utility bills
op~,mizetotal, customer costs
optimize customer soCietalcosts
miniiTIizecustomer ,.ateincreClseS
minimize impact on DSM'nonparticipating customers
achieve other specific socialgoals
Elements ....
erergyconsumed byutility
utility bills only
all private. costs
private costs plusexternalities
utility ,rates
utility rates
e,g., remove marketbarriers, maximize~()n~lJmer ~~oice,C0?tf;()1pollution,minimizeunemployment, orprotect a utilitycompany's marketshare
',c_'_" .... ,," •. ,., •. , .•..•. ,.
AgursofMerit
total source energy
Utility Cost test
Total Resource Costtest
Societal test
Nonpar-ticipanttest
Nonparticipant test
relevant end use,4 The Utility Cost test results for the affected utility' companies incom~i~ation will give, an indipati0 llof .the,change in ~verage. cOI11bined,el1~rgybills, butsuch,in,fo,rmation,;sh,ould be u,sed cautiously if customers of th,e,two com"pan,l,',es are not inoverlappingseNice t~rritories, The RIM test applied separately 'to each companyprovides useful information for allocating costs among the affected utility companies.Revi~wing the combined results of th.e,RIMtest. forbotl. af'fec,ted comp(Ulies in
4 The Utility Cost test' indicates changes in average custoDler bills, only so long ,as number of customers isapproximately the same with and without the DSM program.
215

combination is useful in assessing average net rate increases or decreases and for judgingtheir' s6cialacceptability.
8.5.3 Promoting "Best" vs "Better" Efficiency Options
Ano,ther",as,.,pect of the fu.el,s.ubstituti..ondebate involves ..d.iffering interpretations ofproviding ·least-cost·energy services'Witl1inend-use markets...Some analysts' have arguedthat "the goal of IRP should be to put the least-cost energy service in place for every enduse." Efficiency options that hav~ the lowest economic life-cyclecosts to customers andsociety (Le., "best". option) shouldbe promoted through utility DSMprog~s (Kaul andKihm 1992).5. Within an end use,if a fuel substitution option is deterrililu:d to be morecost effective 'than other DSM options, then it should be pursued so that consumersreceive theml3JC.il11Hmbenefit from utility interventionsjn end..use.mCifkets.(Raab1991).
The contrasting view is that PUC policies should allow utilities to promote DSM optionsthat are .more economically efficient than the customer'scurrelltuSefor retrofitapplications and more efficient than minimum standards for new applications (Le., the"better~ .og~p~) ..... In this apprOCich,fjnancial ince~tive~ ar~,typical1yavailable tocustomers to upgrade high-efficiency equipmentor ..,~pplian~'lI~ing~ither fuel.Arguments for this approach are that it offers customers more choices and limits thepotential inefficiencies that may arise from judgments of regulatory bodies.
Both the "better" and "best" approaches are being applied. Wisconsin, for example,allows incentives for the promotion ofa.hyappliances that exceed a commission-specifiedminimum efficiency standard.)'ermonholl the other hand, requires that utilities lookonly to the "most efficient energy use.on the market today. "
The "best" approach requires PUCs to specify the least-cost energy servi~ for every enduse. The "better" approach requires PUCs to balance incentives offered to customers by .g~an~.elecm~~plities joprder.to i~~urethClt .•tl1~•.~111~p~()~js ~().t.a.rtifi~i~ly tiltedtoward one company and fuel. In some end uses and sectors, this balancing can be quitechallenging.
In ~nd-useI1lClfketswhere market.barriersandim~rfectionsl11ight been<l~Jlljc(e.g., newconstruction wh~re end users.are not the.ultimate decisionl11a.kersdetermining equipment
5 In most cases, thereisa miSl'natchbetween lifecycle costs of alternative technologies seen by users and thecosts incurred by the respective utilities to serve the same end use. For example, the economics of gasabsorption chillers in large office buildings (in Wisconsin) are marginal compared to electric screw orabsorption chillers from ,customers' perspectives (i.e., 10 to 12 year simple payback) but provide significantavoided capacity benefits to a summer-peaking electric utility.
216

fuel choices), PUCs .l1aveto.be especially .vigilant that equipment!applian~ .fuel choiceis not bein~ undulYaIld.unfairly influ~nced by utility,financial incentives to ,builders ordevelope~sC)rJav0rable line .extension and.hookup policies. Instead, fuel ch.oi ceshouldbe determined on the basis of technologies and fuels that have the lowest overall life-cycle economic costs to customers and society.
8.5.4 Joint DSM Programs: Cost Allocation
Some DSM advocates argue th~t PUCs should reqUire electric utilities .to aggressively. cpu;rsue~st~effective fuel switcmng and..haveelectricratepayers fUlancesuch conversions(Ch~miCk 1991; Boonin 1991; Raab ~d Cowart 1992)~pthers maintain that ~"aturalgas
« utifiu es ,shpuldprom.ole arid pay for incentives to encourage the u~ of riatu~ gas andthat~lectrlc utility Companiesshould promote and pay for in~ritivesto enCouragethe use•.or:electricity because this ariing~ment maintains' the"furidamenW.forces of competition, .on "whicha market system is based (Flaim 1992; Tempchin and White 1993).
- : ,' ..•..............• ,' .', .. ',' ..' ',' ,,',.-.'. ', .. '... . '
These perspectives represent the ideological pOlesin the end-use fuel substitution debateand.)llustrate the, point that DSM program coordinatjon, and cost. ~ocatipn among.cOmpeiliig utilities' ison~ of. the most contentious pi;ogrnm design and implementation'As~ues~"•Some obsefversargtje tha, electric and g~.Jltilities should develop,and pay forprQg~m's jointly if both b:enefit;;but only after Correctingg~ pricing (Chamberlin and.,".~aib~rry 1991). Even iffueLsubstitu.4on prog~sare.considered t~ be ecilIiomicallyefficient or otherwiSedesirable; it is diffi,cultlor regulators to force join~DSM.programs"or iey~n,coordinated' DSM.programs .~etween cOmpetingutilities. nis' also,idifficult to"allOCate progriun costs among'cOmpetingutilities in a fair and efficient m~ner. Unlike'single fuel DSM. programs," ~el. s\lb~tifutioil.programs introduce a new set .of utility. sh~eholders apd nonparticipclQ,ts.'· . '.
" Id~ly, customers or groups that benefit from a fuelsubstituticnIprogriun 'should pay thebulk of the associated costs, preferably in direct proportion to the benefits that theyrepeive (Flaim 1992). Foreexample, if a llu'ge proportion of the benefi~ accrue toprograpl pcuticipants, it WQ,u~d'~ ..desirable to have·participants pay for' the' programthrough an energy serviceschafg~ or,tO reconsider the'l,evel of the:il.l,centiv~payment.If such changes to program design 'are' not possible or significantly affect 'programparticipation, then program costs can be allocated to equalize the rate impacts as muchas possible. However, certain societal benefits, such as reduced externalities, are not aseasy to allocate among the electric utility and the natural gas company and theirrespective ratepayers (Weinstein and Pheifenberger 1992).
The debate has been clouded by those searching for a general approach that encompassesall DSM programs. As a practical matter, the cost allocation problem may be separated
217

into four general categories based on the balance, of utility revenue impacts. Eachcategory reflects a different set of utility company and custom~r interests.6 The issue ofwho pays the DSM program costs, and, especiallY the contentious, issue, of who pays thec~stomer ,incentive portion of program Costs, is best addressed separately for each ofthese four categories.
Both Companies' Net Revenues Potentially Increase
,For some fuel substitution options, the customers of both utilities could bellefit. Thishappens in a gas conversion' progiam when the gas comPany's revenues from its addedsales are rtlore than its costs to provide these8ales and when the costs avoided by the
•·eleetrlc cOnrpanyare moretban its revenues would have been froJlltheav6id~ sales., Forexample" signific,ant benefits ~f some types of gas equipment convetsions, such asconversion to gas air conditioning for a summer peaking electric utilitY,' o~n occur onthe electric side (Kaul' and Klhm J992). ,In this situation, there js an opportunity for thetwo utilities both to promote the same fuel substitution and to share in payirigcustomerincentives without hd:U1l1ing,customers of either utility.
One economic rationale for this sharing is for the two compames to pay proportionallyto 'their pOtential revenue' impactS' ori- the nonparticipating customers." For example,oortsider amowfication to thefuelsubstitution program exa:n'iple iri Figure 6-4of Chapter,6 in 'which the P10grani becoIries a wid-Win situationby' changing th~ electric ~company' saverage price' to:b~ slightly lower .thani~Costs for the particular sates diat are avoided. 7inihis siwation, bothcompaIrles' would'experience an increase ~nnet revenues beforecOnsidering, program ,costs and cu'stemler iricentives. The fuel'substitutipn wouldpo~ntially/add about $4.4 million to th~gaS company's revenues and $1:7 mil~on to theelectric company's revenues. If the-resPonsibility for paying, for pro~ran1costs and 'customer incentives were then allocated proportionately to this potential r~venue impacton nonparticipating customers, the gas company would pay 72 % and the electricCompany would pay 28%.',' " "
The computatio,n of tl.rls cost allocation' is shown in Table 8-8 and is somewhat similar, to an approach' used by'Northem States Power, a combined utilitY, to determiIiehow fuel, substitutio,nprogram costs would be allocated to electric and gas ratepayersQ{aul and
6 The customers who change fuel by participating in the DSMprogram benefit in all four circumstances.
'."F()r various businessconsid~~tioos beyolld simpleshareholl;iereconomics, some el~tric, utility executivesmight stiMnot C90sider this situation as a ",wD1."
2111

Table 8-8. Rateqmpact-Basedlncentive Allocation for "Win-Win'" FuelSubstitution
Example: a DSM program replacing electric chillers with gas ebsorptionchillers (see Pchibn~-~ andFigure 6-4 in Ch8pter'~f ••••.•C ••.,\ .. '.... ··'{C·"·· ";.' .;C.··"h? .".' .
-,.Y:.· : "',:::~::~:{:~,~::':'-.;;::;-,::::<:,:::',',:),:';:, >'.;:~_. -:-.':(:>'.,:'~~:~:::-:;» ':::/"'::',:io:npafticij;ants' _;::N~np8.rt;~ipenu~. ". ..c;·':<J.:;.....Combined. . ....•.'. Gas COl'flpanv . .Electr;c COrt)Plllny
1.
2.
3.
4.
5.
6.
7.
Avoided SupplyCOl,ltMeasurlll Cost .(extra cosfof gaschillers)'.fIlet Sl:!cJ~t81..BenefIt BeforeProgram Cost~andCUlltornlllrIncentives. n. + 2.JUtility SalesJmpactNetof LostRevenue R~c~VIll.~Net Utility RevenueImpact BeforeProgram Costs andCustomerIncentives 11. +4.1MaximumA"'ail~6Ie forProgramCOsls;andCustWT\~r,:..In~e~tives (s~meas 5;]' .1/;'
Fair Share of'.Actual ProgramCosts andCustomerIncentives 1
$12.736.575
$(2.500.000)
$10.236,575
($6,581.052)
$6,151.523
$6.155.523
($4.141.756)
$8,562.779
$4.421.023
$4.421,023
>72%
$16.878.331
($15.143,831)
$1.734.500
$1.734.500
28%
Calculated by dividing values in row 6 for gas and electric company by combined value
Kihm 1992).8
A sharing 'approach ;~erierally works ill this situation because the shareholders of bothutilities are likely to benefit '[roin the fuel substitution, depending on the regulatory
8 However, for the NSP case, short-term rate impacts were used instead oflong-term. Rate impactconcerns were so dominant that incentives were capped at a level that insured that no rate inc~ ()CCurred.foreither gas or electric customers.
219

treatment of lost sales. The.nonparti~i,pa.tingcustomers.of both utilities may also benefit,depending on the level of incentives nt~ooed.
Only Gas Company Net' keveni4es Potentially 'Increase
For ,'some fuel stibstitution,programs, gas company"net revenues will increase whileel~mc,. company ,net revenues decrease. This happens when, customers switch fromelectricity to gas and the gas company's revenues rise more than its costs rise while theelectric company's revenues decrease more than its co§~ .d ee :re4lSe'For example,conversion to gas air conditioning for an electric utility with average summer rates wellabove marginal costs might result, in little benefit on the,el~tr:itside. When thissituation occurs, there is no easy economic rationale for Ute,t\VQ'utilities to share inpaying program costs.9 The customers who change fuels still benefit, but to whic~cpmpany should they be associated with:-the .electric companythey are leaving or thegas company they are joining? Under these circumstances, joint participation of the twoqtiliti~s is more difficult, and allocatiQfiof costs is contentious,.
,',Only Electric Company Net Revenues Potentially Increase
It is also possible that a fuel substitutiofioption causes electriccolYll>anYnet revenues toincrease while gas company net revenues decrease. This happenswhen customers switchfrom gas to electricity, and the electric company's revenu~.Ji~ Illore than its costs rise,while the gas company's revenues decrease more than its CostSdecrease. The impacts onthe affected utilities are similar to those in the previous case.
Both Companies' ,Net ReYf?llues1)ecreQS.f?
Regulators might mandate some fuel substitution programs that produce societal benefits~Y~n.~()~~~,.~~,.n~tI"~veIl\l~~,(),!RB~..~mRa.n!~ m~~hl~q~[~~,'I'1M~"I!·a~ffi~s.,.ina gasconversion program when the gas company's costs rise faster then its revenues rise, andthe electric company's revenues decrease more than its costs decrease. This is morelikely to occur when the societal cost test is used, and program costs exceed net resourceben~fits ,.(excl\ldin~)externClllti~s).,',.In sUfh.:.,a(;aSe,\tl,1er,e.islittle ,guidaIlce,on how toall~teprognuncqsts •Cllthollghfairness.WOllid,suggest ,an,,allocation.,that '.equalizes thenet revenue impacts to the greatest degree possible.
. ..........•... -
II The fuel substitution example presented in Figure 6-4 in Chapter 6 illustrates this situation.
220

8.5.5 Customer Equity Issues
Balancin~ equity amongcustc>mershas always been a .centraifocus .ofutility regulation.Fuel substitution 'pro~ramsof~n raiseaddi~()nal, customer .~uity issue~, such .as theavailability .of gas service to electric ~l1st()m~rs.and.no.ncoincident ~rvice territories.Natural. gas' customers ~d electricity~ust~111er.~are,,?ftenlar~ely ,buLnQt~xactly, thesamepeople .•"Isit.~uitable fo.rth~ customerstolle .fOnsideredtpe.same? Is it~cceptableto ignore" the,sittiatioll.of even ,a.few electric,customers, who,,'donot have.n~tural gascivailable.orconilected1 .' . .
The problem .of non~incident jurisdictional, poundarieS complicates program design,.. implemeritation, and cost allocation even for cOmbinedutilities: "For example, BaltimoreGas and Electric (BG&E) offers a program that replaCeseleCtricchillers with commercial
; 'gas iUi:.:conditioningequipment; The program is offered to all electric customers withinthe utiii~'s electric Service territory. However; BG&E's 'gasseririce temtoryis smaller,arid some ofBG&E's'electric customers receiye natural gas from Washington Gas LightCompany; ""Washington "GasLight lias .appli'e.dto.'the Maryland' PSC .for approval to.conduct an almost identiciilpro.gcimtO BG~' s but Witha larger incentiv~. Uapproved,.customers served Join~y by BG&E and WaShington.GaSwho respQridto tlie Commercialgas ait'-conditiomng'p:rogriunswo.uld.:applytoBG&E for its Incentive and toWashingto.nGasf.or the additional mcentive payment. EnCouraging .or requiring util,itiesto developfuel"substitutionpro.gramsjo.mtlyis anotheroptio.n that regulators maYcOnsiderif seriousimplementation problems arise 'm ·"co.ordinated"pro.grams that are .offered~parately byelectric arid gas utilities. 'Electric, gas, ahd combined utilities in severiUregions .oftheU.S. (e.g., California, New York, and Wisconsin) are jointly developing pilot fuelsubstitution programs.
8.5.6 Treatment dfUI1regula~Fuels
In regulating utilities, state PUCs have always had to consider the impacts .of theirpolicies on unregulated energy service providers. Changes in the rates of any fuelpotentially affect the competitio.n amo.ng competing energy sources. Similarly, DSMprograms that provide financial incentives to.purchase high-efficiency gas .or electricequipment may also affect the overall end-use market share and fuel mix amo.ng gas,electric, and unregulated fuels for that type of equipment. On occasion, fuel oil or
221

propane dealers have intervened in regulatory proceedings to argue that they would beadversely affected by a particular DSM program. to
pepending oil the availability of gas ,serviCe,eval\lation of fuel substitution opportunitiesin certain enduses (e~g., space heatirig) mayalSo'involve comparison between electricityand 'unregula~ fuels such as oU, propane, and wood. For example, in Vermont only,about' 15% of :the ~omes and businesSes current,ly have access to,natural gas, and fuel"'substitution ispriinaruy conveJ:"siopfrOIDelectricity to unregulated fuels. In this context,several issues arose when eiectric utilities were ordered by the Vermont Public ServiceBoard (PSB) as part of their IRP plan to evaluate all potential fuel substitutionopporttmities. CQncernswere ~se;d by utili~~ regarding: (l)"free riders" in the sensetha;tih~re Wasalr~dysignifiQaritfuelswitching away from residential eiectriq,space heatas ' '~"reStIll 'of ria,~ral .Inar~~t'forces, 'limited· financing provided by ,the state, andinformation provided by utilities,' (2) appropriateness of applying existing environmentalextem~itY ,credits' for 'DS1\.{'to, fuel substitution because of localized impacts fromconsumption, ofal~niative, fuels, anAOt risk m, the form of poteijtial price, volatilityfrom. increased ~llanceo~,' u~~gllfated ,fu~~s. Other parties raised con~rns about
,potential "lost opportunities" .th~( outweigh' ~y soCietal benefits from, conversion'when~yer conv?rsion of dectrlc ~nd:pses.to uni~gulated fuels occurs without Concurrentinstalla,tionofci.:i~t~ffectlveweailieriZatiop'm~ures ana efficient:new applianCes. In theface ofth~',C()ncerns,' the yermont ~PSBdeCided tht;ltfuel ,switching shq1,lldonly berequired when th'ere is strO'ng'evidence that it is' cost 'effeCtive, and that the incrementalben~fitSof a fuel switching ,measure ,mustex~ the benefits from a nonfuel-switchingDSM meaSure by 'at least 10% to 'be eligible for utility-assisted financing' (Raab and, Cowart 1992). " '!, ,
Despite the extra complexity and uncertainty that unregulated fuels add to the evaluationof fuel substitution, these fuels play an important role in competing with natural gas andelectricity in some communities and cannot be ign()fe4.in these circumstan,~s .
. '.' .......•. " '.. .. .:.: " .....• ..
10 During the late 1970s and 1980s, many regions and states (e.g., New England, New York, Florida)adopted policies to reduce their oil dependence both in electricity generation and end-use consumption. PUCactions were often intended to implement these policies.
222

8.6 .Summary
Fuel substitution.complicates the regulatory process by adding another dimension of"integration" to integrated resource planning (IRP). IRP was. originally created tointegrate risk and uncertainty considerations into electric utility capital budgeting and tointegrate demand-side opportunities into power plant decisions. During the past decade,IRP has achieved this goal in many states. In most cases, it has not integrated planning,fornattiral gas.with.planning 'for electricity.
Tapl¢8-9 provides an ovemeWof the.cUfI'entlegal and/or administrative status of fuelsubstitution policies in variOU~!States,including our summary of the apparent motivation,the underlying regulatpry$trategy,. and the primary evaluation criterion. It should beclear from the precedingdisc~ssion that there is no "right" answer or single course forfuel substitution policies.E1ectricutilities and industry associations (Le., Edison Electric, Ins~tute) . have . vigOrously .ppposedfuel. substitution .pr~~~ms perceived to be~mMdatory"cu.tl,1oughsom~electric utilities are willing tcflookat fuel substitutionOpPOrtunitieson a case"by...-casebasis. Not 'surprisingly, combination utilities have beenin' the forefront of trying out 'fuel substitution programs. In several states (e.g.,WilShington,Oregon), regulatory.agenciesand.otherinterested stakeho~dersare pursuinginrioyative strategies that allow~lectric an~gas utilities to look for areas where there aremutual benefitS to cooperation. In Califomia,So\lptern Califofilia.J3disonand Southerntallfomia Gas Company arejointly developing a "tuel-neutral".DSM program withoutregulatory mandate.l'he.progriunis targeted at large commercial customers and is beingpilot ..tested in one·geographic .region.....•Likewise, Consolidated.Edison and BrooklynUnion Gas havedevelo~.Clj()int program to proIll0te gas cooling, which has beenunderway for over a year~Similarprograms are being developed by electric and gasutilities in several other stl~ ..•'fheseeffo~arethe exception, buttlley do suggest thatit is possible to create ."win;.win" situations even in the interfuel-competition arena.
Based on the experiences of PUCs and utilities that have Cllreadyaddressed fuelsubstltution,the following elements are a starting point for PUCs seeking to develop, explicit policies on cost-effective fuel substitution:
• The societal efficiency of fuel substitution ultimately depends on the relative costsand performance of respective gas and electric end-use. technologies and the.relative prices of both· electric and gas service. To the extent possible, gas andelectric rates should reflect the same relationship to long-run marginal costs.
• For utilities that assume the role of energy advisor to customers, PUCs should..".?i\\,~g.~qr~J.h~tg>mPfelleIl~iveJJ.pJ.lynbi~U1j"qrm~ti.()n~,proyidf4.J() custQmerson
competing end-use equipment and technologies.
223

Table 8-9. Status of State PUC Approaches to fuel Substitution
,,';, :·.~pproach to~,.:::;':~ DSM'
VT Conslderllltlon Optimize UtllityRoquinld Social Cost Design
OA Conllderllltlon lnot UtIll.ty DesignRequi/'lld edd/'lls8lldl
CA Conllderllltlon Environmentlll Utllity DeeignRequi!'lld ~lIcy to I'\JC
Stonderds
Encouraged
lnotaddreleedl
Encourogedlone iI'I
progrenl
lnoteddressedl
Encouraged lafewln place I
Encouraged. :lUlled' on coatsevoldedloneIn progrellBl
Best'TechnOlogy
BetterTec~logy .
BetterTechnology-
Must Not~nlllI~Enargy;MuatDeerea ••Private Coote;Must NotIncreallePonotion
DoeeltOptimizeSc!cletlll ~ste
lnotodd/'llIl~I.
DoeeitoptilnizePrivste •.Costll
DoeeltOptlmlzeSocietal Costs
Does ItOptimizeSocietlll Costs
.' UtIll.ty Delign'to'·PSCStoodsrds
l!lOt $pplll'llntl Utility De~ignto I'\JCStooderde
CUstomerTrelltrnont .
1.!lOt,,~plI"'ntl Utllity DelignConelderationEncouraged
cOnllderiltiOn"'.Eneour.gea· :'
...ConslderllltlonEnCouroged
WI
OR
Me Substitution. Allowed
EfficientUtIlityOperllltlon
UtIlity Delign Does It.OptimlZeUtility Bins
BetterTechnology
lnotapplicablel
CO SubstitutionAllowed
lnot applll'llntJ UtIlity/Contractor D8.iQn
,noteddrel.edl
,not applicablel
FL Policy orderedand thon
.. Lreecllicled
NV ActiveDocket/NoResolution
.MA DiBCuIsedWithoutResolution
RI DlsculI80dWIthOutResolution
224

pues should ensure that all DSM incentives offered by utilities are fairlybalanced between competing fuel technologies and competing companies.
Gas and electric utilities should be strongly encouraged to evaluate fuelsubstitution opportunities as part of their IRP or DSM planning processes. Thiswill involve identifying and analyzing potential options to determine whether theymight be cost effective (and under what assumptions) and assessing the extent towhich market barriers exist and the types of intervention necessary to overcomebarriers. If a fuel substitution program is deemed appropriate, the programshould, to the extent possible, be developed cooperatively by gas and electricutilities, including methods to share program costs..
The regulatory and ratemaking framework should be structured so that electric orgas utilities are no worse off fmancially as a result of supporting cost-effectivefuel substitution.
22S

226
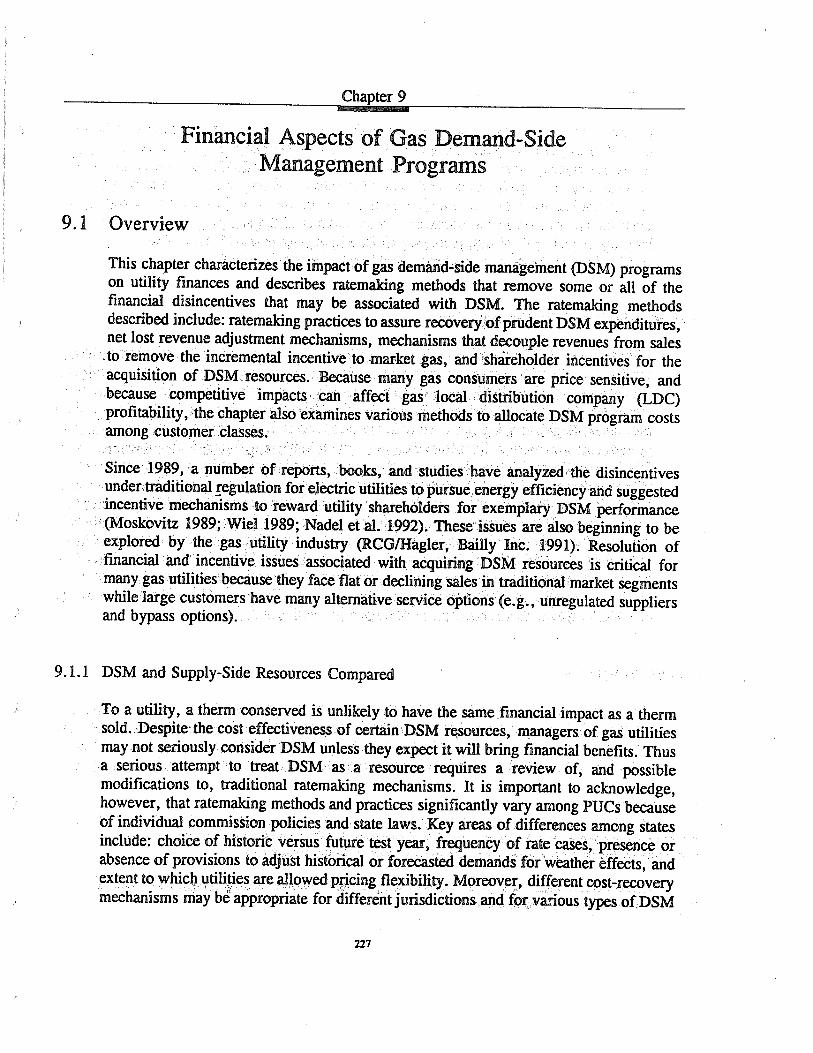
Chapter 9
Financial Aspects of Gas ,Demand-SideManagement Programs
9.1 Overview
This chapter characterizes the impact of gas demarid-sidemanigement (I)SM) programson utility finances and describes ratemaking methods that remove some or all of thefinancial disincentives that may be associated with D~,M., The ratemaking"methodsdescribed include: ratemaking practices to assurerecovery;ofprudent DSM expenditures,net lost revenue adjustmentmechanisms, mechanisms that decouple revenues from •salesto remove the incremental incentive to market "gas, ,and"shareholder incentives for theacquisition of DSM ••resources. ".Becausemany gas consumers ,are price sensitive, andbecause competitive 'impacts·,catl affect >gas:Ioealdistril:mtion .'company (LDC)profitability ,thechapteralsoexamines various methods to allocate DSM program costsamongcusto~eiclasses:
Since1989,anumberofrePorts,.books, .and studies have analyZed>thedisincentivesundertra.ditional !egulation foielectric utilitiestopursueenergYef~ciencyand suggestedincentive' mechanisms,to reward 'utility shareholders .for.exemplary DSM performance(Moskovitz 1989;Wiel1989;Nadel etal.1992).Theseissllesarealso beginning to beexplored by the gas utility industry '(ReG/Hagler,' .Bailly Inc. 1991); Resolution offinancial, and ',incentive issues associated with acquiring ,'DSM' resources .is critical formany gas utilities because they face flat or declining~es intraditionalmaiket segmentswhile large customers have many altemativeservice options (e.g. , unregulated suppliersand bypass options).
9.1.1 DSM and Supply-Side Resources Compared
To a utility, athermconserved is unlikely to have the'samefmancialimpact as a therm.,sold..Despite,thecost effectivene~sofcertain' DSM resources, >managers of gas utilitiesmaynotseriously>consider DSM unless they expect it will bring financial benefits. Thusa serious attempt to treat DSMas a resource requires a review of,' and possiblemodifications to, traditional ratemaking mechanisms. It is important to acknowledge,however, that ratemaking methods and practices significantly vary among PUCsbecauseof individual commission policies and state laws. Key areas of differences among statesinclude: choice of hist0ricversus~uturetest year, frequen~y of rate~s,presence orabsence of provisions to adjust historical or forecasted demands for 'weather effects, ,and,ext~ntto wpic~ H,p.li!iesaI"eallowedpRciIlgflexibility. Moreove~, different cost-rC90verymeChanismsmay be appropriate for different jurisdictions and fox;vClrioustypesofDSM
227

programs and may change overtime depending ontheleveland ,rate of change in DSMexpenditures (RCG/Hagler, Baillylnc. 1991). Many of the ratemaking changes necessaryto remove financial disincentives associated with utility-funded DSM programs are moreevolutionary than revolutionary and some of the changes have already been employed byother jurisdictions or by the same jurisdiction at an earlier time. In the electric industry,three main forms of disincentives have been noted, and they apply generally to the gasindustry as well: (1) failure to recover all DSM program costs, (2) loss of net revenues,and (3) loss of t'plaIlcialopportunity(Reid·and Chamberlin,1990).
Failure. to Recover DSMProgram,Costs.
AlthO\lgh ga.s.LI)C~have 10ngbecIlCiproviders.of gas procurement and .distributionservice~,LPC D~MpI'Qgrams represent a:relativelynew servi~;thus, I)SMprogrambudgets>~e nol a .tJ;4iditionalpaxt.ofLDCs' ••requ~sted .revenue requirements ..'This may.lead a .PUCto .col1~iderrequ:ests(()rr~overy of DSM.e~penditures .outside .of generalrate cases. Regulatory lag (Le., delay in the recovery of costsbecause.·>oftheregulatoryprocess) may increase utility reluctance to invest in DSM, particularly in situations where. DSM.expenditures haveb~n!significa.nt1yincreased:and. the utility perceives that the riskofunder ..r~very Aisihigh}.:qSMprogranlsrep~nt. Cl new~typeofutility..customerinteraction, so. there,js.littleexperi,ence· .()nwhic:ht()base ..forec:a.sts.·of DSM.program
.....participation ..•.pnderconventional,reguiation, expenses in excess of those' estimatedduri,ng.a .··"test,year, "·.··which..providethe· basis .Cor rates, .•might not be. recovered fromratepayerS.lJ se of a.future ~t Year ca.n.l1litigatethis problem, but some method ofquickly adjusting .rates .t()icov~rprogramcostsmay; be appropriate because the ultimatemark#acceptance ofa.DSMprogralll can be uncertain..Ways to address the uncertaintyof DSM program cost recovery are discussed in Section 9.2.
Net Lost Revenues
Despite a wide array. of ratemaking .practices,most gas utilities have .base rates set inrelatively infrequent (every .2t05 or more years) general rate cases and the commodityrates set morerfrequently inpUI'chased gas adjustment (pGA) clause proceedings.2 Mostutilities have a financial incentive to make incremental gas sales because many expenses
I DS¥ will. enb,ancefinancil;l}health if the .reduceddemand defelr$capacity-related projects that have theirown disallowance'.ri~. In ..other w0rds.,·the risk.ofl"eCOveryqf DSMexpendi¢ures should be evaluated incompm:iso~ to the.risks created by a scenario tIJ8t.excludesfOSt~ffectiy~ D~M.
",.< '.' ,,' "":. "., .. " ,'·7 '.' ": ' , ,'., :' " ':'., ,.:.: :._ :. '., " •.... .-. ' ..
2 ~~y gas LDCsbave been given limited pricing fleldbllit)' when providing transportation services tocustomers in competitive market Segments. .

inclu(iedinbaserates ..are invariant of short:-runchanges ill sales, .and any increases inunit Commoditycosts are covered by the PGA clause. Thus; incremental sales typicallyprovide a positive contribution to margin. Even in the longer term, the benefits of DSMinnxlllc~g .capacity costs maYnot olltyleig~ th~inc;renl~ntal revenue 10ss.<This rate-to-.c<>str,~l~p(mshipCflIliIllakegasl)SM:;.¥n3:~qve\lIlles.~<aiHtitity is giye llassurance thataU..or..roost of the lostma.rgin will be recoveredjn some.fashio ll .Ways to address.net lostreY~ll~esare discussed in Section 9.3. .., .... .
Loss of Financial Opportunity
Even if expenditures for DSM programs are recovered and if lost revenues are made upiI1~m.efashioll, DS1\.fDlay.~ot~eattra.cqy~ifjtm.~es the utili~ forego more profitableinvestments in supply-side resources.' Wh~ther ag~ LDC fav01"3.blyvi~ws.a capacity-or supply-related investment.depends on the available ()ptions, th.euquty'sal!tI1.orlzedrate..of return, amI tile PUC'sregulatoryproceduresfor the r~yeryof .sllPply-sideinv....e...stm.e.n..ts.....It.....m..ay b.e desrra.'b.Ie.....in som..e cases.t.oconsider po.sitiV..e ..fi..nancialin.. centivesf()fD§M mve~tIJ1eJj~··in.()r4~r.to .overcome real. or. percdve9 ••1Qssesin ••financialopportUl:jity.,PO§\tiY~in~l1tiyes.for· ~hareholders are. discussed ill.Secpon 9.4.
9.2 DSM rrog~aJ11<G6st~~9o~ery .Methods
Frorrl'the Perspective of energy utilities and PUCs considering investment in DSM, threecost recovery issues are critical, First, PUCs must decide whe.ther.to·base the level ofDSMexpenditures reflected·inrares on activity recorded during a fixed historical testYear,on~ctuarexpenditiJresastheyare made, or on ~xpendituresset for.a forecast test~ear: Secc)l~d,.t~ tlle~)(te~ttl1~tthe~e is a mismatch between the timing of the DSMe~pen9:imtt.·and·i~!~y~ry".iJ»{JSs ,must decide whether to aUowutilities to recoveraccrued 'interest. Third, on~.tbeaecision to recover DSM expenditures is made, PUCsor utilities'mustset'an amort.iZati6nperiod.
9.2.1 Timing of DSM Cost Recovery Proceedings
h1vestor..owned ,g~utilitiesoften, have two rate components, Which are authorized indifferenttypes ofregulatorypr<>c;eeclings.~,ra~aret~t in general rate cases andtypically. do not change"~tweengeneral rate. ~,ex~t for discounts to customersWho,have .CO.,)llpeptivealternatives.The frequency ()fgenerai rate ~can vary from... . . .. .
yearly to once every several years. The rate treatmentJor.gascommoditycosts typicallyis handled through a PGA clause, in which rates are adjusted more frequently (e.g.,
229

sometimes monthly). Chan~es to ~scomponent usually are automatic, subject to after-the-fact reasonableness,reViews;but states' handling ofPGA clauses varies widely (Bumset aLl991).
The type. of DS.M. e.x.pc··.ndifure..... can.'".al..··SOaffect ..the timing of. cos..t....·.r.·.ecovery.DSMexpc~dituresl1lay'brf'#>uPed'intoIourgeneral· cost.categories: pr6grnm admmistrativecosts incurred by 'the utility; utility-to--customer&cehtives;shareholderin~ntives, ifapplicable; and measurement and evaluation costS'./:There'are severiiIgeriefai'ways thatcommissions authorize cost recovery, as demonstrated below.
Conventional General Rate Cases" ':," .., ......• : " ".' ' : ". ..' , '.....•
'Tab~e 9-' ~DSM Costs Recovered through GeneralRate Cases '
.. .. . ......•. :. , .... ,,: ... , ..•. .. ., .. : .. " .. ',,',
Attention to DSM~udgeJs is simila.r tothat 'given other base-rate budgets;'tl1isappears fair and may decreaseadministrative costs.
Thf).'V$i.lity~~sgl'e~ter la~iWd~ill' theallocBtionof its budgets to particularprpgrams. ~n~ has a cost minif'T!izationincentive.'; '. '
Given uncertainty in utility resource " ,needs, ;tech l1 ologicalchange,and,: ,program p~r:ticipation, it is difficult to setforec~sted. DSM budgets fo~ a.ra,te·casecycle which may last for sev-eralyears orindefinitely; ,,' .
Pros
Cons
;A'utility'sI?SMprog~.. b\1d.getmay 'be reviewed,along with0the~n()nruel.~fJ>tnses'intheg~n~rill .rate'case. BudgetingDSM expendituresrequiresadjustments tohistoric-test-yeardata or the use ofaruture te8tyear.The level ,.of·proga <mparticipation ishard to'"forecast, .•.•'but it· determines' .a large part of theDSM budget,especially the costof utility-to-customer incentives. Thus, it is not uncommon for the utility to be subject to some post-rate:-case adjustments~';Fot;exarnple~'in California, .•'if the utility underspcnds' 'its DSMbudget or wishes toreaHocate budget monies among programs, it must seek regulatoryapproval throughan<adviee letter. In some caSes, utilities have been required to give backunspent monies. Table9;':lsummarlzes the advantages and disadvantages of using generalrate cases for DSM·cost. recoVery.
230

Forgas.uWities that.have the.oPPOrtunityto .earn .shareholderincentives .for. gas •.DSMprograIll ..•.•accomplishments, eaming$typically are pontingent .••on '.achievement ofmeasurable;:savings.CosVecovery for .th eseeamings.initially may require a supplementalproceecling to the ..geneGllrate ..case until such program..e.valuation.procedures. becomeroutine.
. ., ', ' .Recover.A.s !ou Go:UsingF'r~(/~,.aRateCase$ pr Deferred AtcQl4ll!i"g
Many commissions use frequent proceedings, deferred accounting, or both to allow foraccurate. recovery ()fJ.)~ld pr()gTClm<=()~ts(1iatiBllalAssociatio~ of ~~gulatory UtilityCommissioners (NARUS)~92f)·J?~uent ra~'~ specific onlYJg.t>~M~xpendituresare akin .to PGA clauSeS.because,.ratesarefrequently adjust~. in.bo~ ..types of
Exhibit ~-1.Rec~"erY ••ofl~(:r~mental .DSMCosts Through' a Rate Adder
.•.•...•....:In J.993. Thel.lli1'lo~~CC;mi01~"FeCommission (lCG} authorizedrateaddersfcir therel:~0"ery9fD~I\II.p,rogrClmC9Stsf9rtwo gas utilities in Illinois:' North Shore Gas Co.and The Peoples Gas light and Coke Co. (Peoples Gas). The adderallovved the utilityto recover the following DSM program costs:
• training and educating DSM personnel• .'efficiency seminars..• administration• advertising• collecting and evaluating data used for cost-benefit analyses1II energy audits• billings from corporate affiliates, consultants. contractors, a'1dotller
service· providers ..,• incentives. rebates. or subsidies to customers• energy conservation measures installed at customer premises• incremental tax Jiabilities
The utilities trackcostsir'lcurre~Jr'lthese salegori~s.whicll·ClIr~not alrea~yi.nclu.ded.in.e.?Cist.ing..ra.tes.'Every month.,an a.dderi.s.compute.d.to allg.as vo.I~.m.es,•..•,inCludif)ij·.trar1Sp()~-OnIYvOlumes.t()recovertotal·recorded.· co.sts: If the adderis.lessthana'.'$O.OOl1Dth thr~shold,the.·allowable costs are retained in adef~ •.•.edaccOlJnt
. 'until accrued costs reachihe threshold. The Ice retains the right to disallow cOStsthat were improperly recorded to the account, based on a review of .the utilities'programs.
"ClJrrent!y••D.~MC1cth/iti.esofferedb.y.thes.e utilities •.C1rerytostlypilot pr9grarnS.Pe(Jgl~s-~as;~which.has ananni.Jal thr(Ju~hput ofapproxima!ely 250 Bef, tlas n.otaccr(.ed enough costs yet to hit the adder threshold of $O;OOllDth. Net lost revenuesfrom reduced demand cannot be recovered through the rate adder.
231

proceedings. In this approa~h, a utility typically operates programs in conjunction withguidelines that h~vebeenapprovedingeneralrate cases or integrated reSource planning(IRP) investigatio~s. Actual expenses are not put into base rates. Instead, the utility isallowed to add the expenses to its.PGAaccount ot some oth.eraccount that r~ives rapidcost recovery (see Exliibit 9-1). Although expenses maybe recovered quickly, somePUCs (e.g., the lllipois Commerce Commission) still reserve the right to conductreasonableness reviews. Other states, such as Massachusetts and Wisconsin, effectivelypreapprove DSMprogram expenses; poor perf0 rDlaJlceb)' the utilit)' w~ primarilyinfluence future piogram authoriZations. Table 9-2 summarizes the major advantages anddisadvantages of frequent rate I~roceedings
Tablt(9-2~ Rec.~~eryofD~MExpenditu..resviafrequent Rate·Proceeding~.' ".
" :fh~utility isauthori~ed to.pursue.particular programs or objectives but isnofrequiredtohold toa certain budgetuntil the marketresponse isdetermined.
. ... ••.. . . 0··.· '.
It. J There.are fewinherent .cost minimizationincentives·because rapid.recovery is aform of cost-plus regulation; however,after-the-fact reasonableness reviewscan mitigate such behavior.
• ,PSMisgiven.special treatmflnt.Cons:
Pros:
Torni#gatethe,mismCitc~benveencurrent rates andcurrent·, DS~expenditures, atleast 13, J?~lC$have establiShedsome form ,"of"true-up," balanc-ing, or escrowaccounting toallow for theaccurate andtimely recovery ofgas DSM programcosts (NationalAssociation ofRegulatory UtilityCommissioners (NARUC) 1992). A deferred.account records expenses that are not yetrecovered in rates and can exist in several guises. They may be called deferred debit orcredit,ret()ncil~Roll,mern~l"and~lIl,trackin~,or. balancing .ClCCOu~ts~<Insomecases,differences·in.termin~l()g~ .•,~~present iIIlROrtan,t.•differences ill.pres~m1>~onsr~garding~v~~ and, tllUs,ti~bornebY .utility ll1anag e m e pt.F'ore~ple.,.a b~anc;ing accountis aspecialJorm .of adef~rred accountthatusuallyguaran~ reco~ery of costs subjectoIlly .to<prudencerevie'Ws.'fhus, .balancingaccountsare relatively.saie, and utilitiestypically report undercollections as assets much like accounts receivable. Other deferredaccounts, su~h as .mem~~~um or tracking a~unts, may I10t g\larantee recovery. Inthese. instances, a utili~ip~slargue forret()very in a sJ>efifie<i1>r~.~Il~and, even ifret()very is.granted, l1lay.oJjlyhave" one.s~ot" atreq>very(i;c., funire b~aJj~~ng,.accountprotection is not pr()yif.ied)! '
232

A deferred' account for DSM program costs,operates, idJI manner, very si~lar to PGAclauses operated in many states. A PUC may authorize a set of DSM programs but nota specifie level of spending.,Th~ PUCmayalso reserve. the right to review expensesbefore. a~th0rizing recovery. TolIleet ,th~seratemaldn~~oals, the PUC will set up adeferred, a"ccountthat allows certain, D,S"M expe,nses ,',t, o'be reco,rdedto the ,a,ccount.At.some"'later.' date,.'possiblYjJl ••conj_un~tion,.with. a,:review of the DSlv.tprogram'sperformaJlce,th~,commissioJl ~ .authorizen~cove1)'0fdollars.tecorded, to the.account.Utilities typically are allowed to'earn interest on the ·acci)li~tto'r~fl.ectth.etiIllevalue ofmoney. In some states, such as California, deferred accolintSearn only'the cost of short-termmo?e~. In other states, deferrecl.4lCfOuntsearn"the.utilities' ,approved cost of capital.The approp~a~ degreeofeal'llings, d~ds OJlthe,degreeof~i~lowance risk, faced by·tbeutility ~d.~e level offinanciaI incentive that ,the PNCwishesto give.th~ utility for]jS~endeavors.< Recovery is achievedibytalcingtb~balance 9f the.,~eeount andamortizing it over acertaillrate penOd. Iftlte account is~mortized",ithin(l)'ear, it maybe seen as aform of ex~nsing,.Iftheaccountis3fhortizyd overa periodt>ftime greaterthan one y~aJldeal'lls:~eutilitY'scost of capital, the account becomes a form ofratebasing (see' next section). -:
9.2:2 Expensing'versus .Ratebasing
Once a utility has made a DSM expenditure and recovery has been authorized, a generaldecision must be made about whether,.to ,tr~t it. ,as ,an e:x.penseor .as a ,long-terminvestment. The mechanics of either method are relatively simple in concept. Withexpensing, allowable expenditures are considered a component of revenue requirements.With ratebasing,theexpenditure is put into an asset account, which is depreciated oramortized over time. The •utility earns a return on.tbe;remainillg,balanceintheaccount. 3
Annual revenue requirements ass6ciated Withratebasing include the depreciation oramortization component, 'theteturnoompOnent,andanytaxesincurred"on the return.DSMexpenditures iinone,year Will affect revenue requirements for the life of thedepreciation or amortization. period chosen:
Ratebasing, which Spreads DSMprogram costs over a multi-year time period, isconsidered as 'a DSMcost recovery method hecauseDSM" measures typical1yprovideenergy savings over a multi-year period,Reasons for choosing ratebasing over expensinginclude: ·the timingoftberecovery in rates better matches the stream of benefits, theeconomic efficiency of prices ' 'are improved, rate impacts are mitigated, and, if the
3 The,appropria~ ,etum.forinvesmrentsin DSM sbm.lld~flect the risk BSS()Ci!ltedwiihtheinv~tment. Itmay be hard for PUCs to hold utilities at risk for nonperforming DSM investments. If this is the case, then theutility's risk on approved DSM investments is low. On the other hand, investments in DSM are not bondablelike supply-side investments and, thus, may require a higher return due to the necessity for equity financing.
233

authorized rate .ofretqrn isco.Ilsidered attractive to shareholders, the return provides anin~ntive to pursue DSM (Reid '1992).
Ownership of a DSM:measure iStypi<:aUYgiven !othe ..customer; thusJh~ physical DSMas.. set. cannot be consider.ed.ap.art of the utility's rate base.....in..a strict accounting sense.1I 0we yer,reguJatory agencies' that~vie\VDSM.as aresolll"cecan con~iger .th~portion of~e pSM Ill~ure paid for bythe.utijity! ~".a .reg~llllory.asset ..RegulCJ.toryas~ts may begiven .recoy~rytr~tmeQfthat. mak~the:m as'"fu.1cmc~allyattractive.as investments intraditional. utility assets. '
: ..,.,: :.: .•..... : '"
])C$pite.th.e..'ooncep~ ..atuacti~.I1·•.of,~~a.sin~pSld' it.~as •..••no.t..I>§n .very popularcompared to expensing, for \Vhat~Ppears.to~.~ver,alreasons.First,J'Il¥ly gas LDCs. consi4erthe certainandfun.r.~oyery.ot.:DS~ program expenditur~fs,.in9l11dingany,ac~ru~ interest, lobe.a t0I»I>PPrity'Wl1~th~rthe,~i(pe,ndituresar~.·ultimCJ.tely.expensed.or..•.ratebased;!ppearsretatiyelY llnimpopaitt..Sec.ond,,,under the ~sumptioll that a utility.. > .. .. :." ',.. ',' .. :.... ...' .. : ",:, ': :......', ',':.. . : ·:."f. : .. :, ." :'" : :'.:'," '. ,'. " ..:. ', :. :.. ', :: :.:'.: ::: :.. :".:: •. ', •... :,' ..: .:, _., .:.::.:.:'..f.~.::.',: .. :.. '.. ..', .: .. " .. ::.", ..:.... .." '" : '_J .•. , .. :. .. ..
onlyr~ives an..authori~r~Wrnth~~mat£h~,;i~ .••oost.of. caPital, LpCs may befinancially indifferent when choosing between expensillgan4ratepasing. Third, ..earningson ratebased DSM investments may be small relative to the net lost revenues caused byDSM programs. In three states where PUCs authorized enhanced rates of return for DSMinvestments-Kansas, Washington, and Montana-there isli.ttle. eviden~tl1at .gasutilitieshave vigorously pursued DSM programs as a result of ratebasing.
9.3 Accounting ..for N.etLostR~'Venu~s
DSM programs that redu~gasdernandlllaYIl,,"yea .negative fmancial.impact on gasutility earnings. Undermost adopted rate designs, ,'3, reduction. in sales .between generalrate cases will result inanear-:-term:reductioll incontributionto.margin.ln the .long run,\ltiljtiesmayavoidcosts .that.werefll$.~iI1 the .shortrun; however, prices may.be set sothat the DSM pro.gramstillcauses ar~uction inmargin .•Therefore,in:the short run andpossibly in the long run, gas utilities.usually experience.a negative:fmancial effect fromunforeseen reductions in demand. The term net lost revenues characterizes these marginimpacts. Whether DSM. programscau~rev.enue losses that harm the utiUtyfinanciallyd~pendson, .ofoourse, whetherth~neteffect .ofthe DSMprogram. is to increase ordecrease sales. If fuel.substitution programs are .considered.in·gas I;JU>,thenthe net effectof a. gas utility's DSMprogramsmay~. to increase sales, and earnings ,will increaserather than decrease. Ratemaking practices can also aff~t .themagnitude oflostrevenues.If marginal rates are set close to marginal costs, then net lost revenues will be small.Finally, there will be a lost revenue "problem" only to the exterifthat reduced demandis not incorporated into the demand,sused to set rates. Whether the demand forecast

incorporates the demand impacts ofDSM depends, in part, on whether the PUC setsrates using a historic or future test year.
9.3.1 ¥easuring Net,I..ostRevenueS
,As the,intro.dpction toiSf:Cti()n9.31Dlpli~,d~~g >Iletlost revenues :precisely isdifflfult; ••hmv~yer,betWeen~~riera1rn~~.1>ra~ti~t"definitiollscan~~,Dlade.U sually,net lost ,.revenue is 'de~ned "as"tI1e.,~ifferencebetW~ntlt,e inc~em~ntal.rerenue.impact ofa, f)~~ .program"andthei~~reDlental.Costjmpa.ct. ~ .~~ra~;estima~of infrementalreve.~ues requires. mlestimateof the.DS1dprograrn'sjID~apt on'pclrtifip~t billing'd~teiminants relatireto the;detexmin,cfuts.usedtoset ratesiIitl1elastg~netaIrate ,case.4'fhechan~einbini?~ dete~inants"times the applicai>le rates is, a measure ,of ,a DSM·~togram's, i~cremental·tevenueiDlpaft.Onthe.cost,·side, it would, be idealto use a'current estimate of theT0c.'s.avoiqed·cos~'1\saPractical matter; itls ,nio$tcommonto simply use the weighted average cost of gas (WACOG) of the I.:OC'sPGA as aproxy.5,6Defining net l?st reve~lles ~~y?ndithe nextrate ..case is mor~difficult to do (Etoet al.1993). Mariy of The.costs th~t;ar~c()nsideredfixedi? tl1 es l1 ort fll nmaybegin tobe affectedbYr~tili~:sDS1dpro~riuns'l\1ore iInp?rtantly;tfie billing de~rm.inants usedto'~et ratesbegintobeaf"f~tedbY'l:>Stvft>~ograIllsand,tl1Us; the revenues may no longer;be~"lost" to shareholdeii ., '.' ", ,- ,
If decoupling,is used as an approach to respond to net lost revenues (discussed' furtherbelow), there is no need to "measure" net lost revenues. Instead, the challenge becomesdetermining which cost accounts to include,in the~esb~~cing acp()unt.Those costsare then recovered by the I.:DC regardli:ssof the impact of DSMPrbgrams or otherfactors~at affect ~es.ln California, 'Where gas sales have, been?ecoupled fromreve~~.es;,the sales"ba:l~cing' accountco~ers. nearlY.a.ilgas I.:DCcosts'except purchasedgas costs,'piPel~ne demana charges, and eertairitran,sition costs. '
1Billing deteI1Dipantsar~,comppnents of demand used to compute bills. For~xample, if a,residentjat"""customer buys gas Jroma tariff with a cus.tomer charge and a .two--tierinverted block .rate design, ,the customer'sconsumption in any month will be made up of three billing determinants: its customer count and its first andsecond tier consumption.
oS If the DSM program participant is a tniliSport-only cuStomer; thentheI ..DCWill receive onlytransportation service revenues, and incremental costs will not include any purchaSed gas costs.
6Foc salescust6rrterS,itis cOni1'nt)nto~implifythecalcUla~()~bysettingnetlost revenues equal to theDSM program savings (in thenns) timeS the LDC's average base raili (m $/therm).
235

9.3.2 Historic and Future-Test-Year Ratemaking
Historic year ratemaking is still the norm in most states. According to a recent survey,only 10 PUCs in the U.S. allow for full future-test-year ratemaking for some or aU oftheir utilities (phillips 1988; National AssociationofReg~tory VtilitySomI11issioners(NARUC) 1992). There are several ways that the effects of DSM' programs can be
,,jpcorpora.te.dbyPPCs t~.atr,trlyontlistoric ..testYear~t First, a"kn~\\1n avdl1u2surable"•..dem~d adjustm~~~,cp~1Ci.I?e~detoincorp()ra~.tJle, effeqts pff:)SMpro$q1ffis in the,)1istori~tt:stY~ ..()ttl~rkn0wnand. D;l~1.ll:a~lechclJ1~~have.~n~~PteLt, f9r other,utili~ t>lld~etii~ms;f(lr~~'pl~,itisstaD.m~pp1Ciice f(lrgasptili~~.tqa~j~sttest-yeardtrman~~~9r~VtrB1~~.w~thel"-Yearcpnditi()nsanqe~~tr.(t,chaI.1gesin in4u§mal demand,whi.CAiPfte....Jl fluc~te significantly from Year.toY~JA.me. dCan.Gas AssQC..la.tio.o..1987b).Second, ..&..equentrntecases. could be conducted; \Yith.them,)heamooot Qf.·.D. SM notrefleclefl.~.theitest-year .demandsin any .giyenyear Wo~ld~slIl.# ..•Third,a.i~mn1ission,could auth0rire,.a ••netlost revenueadjpstmellt or revelllledecppplingm~.h.anism toeli.·minate the disincentives..for.utility DSMinvestme.n....ts........ . . .,J
.. i .. :: ·'C, ':::' .. ,,: : .. :, ':":: : :", ,',: ......• ' : : , ,," : :., :,.:."' .........•.
'., .. " .' .: '," " : : " .. ' : .....• " .. , ..•.... ,. ".",
A future test Year'~llat1Jrally inco~rate,~e effeC.~(lf\ltilitY::gS¥prog~~ on test-y~deIrnU,1ds.The potential for. netJ(lst~veIlues~tillexiSts,.,~~t0nly.to the ..e,xtent thatthefuture~test-y~ demand for~t 4~.l.lpt,a~upt~ly esti.ntateD.S.:M:prograIllimpacts.As with historical test year ratemaking: strategies 'can be ,Qsed<.(e.g.,frequent,{3.tecases,decoupling, or net lost revenue adjustment mechanisms) to mitigate net lost revenues ifthey.are ~ l1l a jorconcern.
. ''',',:., ::.. :. .. ': .
9.3 ..3 Net Lost. Revenue'Adju$tment Mechanisms.... .. .... ,", ':.' ',':'
A nUl1lb~rofPUCshave ~tte.D1ptedto.remoVedisincentiyestQ ))§~fbyadoptiqg net lostrevenue' adjustment .Il1~hamsms.7 gndertllis .approac,h". \l,tilftY'net~v~ll1J,eJossesassociated with specific DSM programs are estimated or measured and the utility isallowed to recover these losses in rates. Critics maintain that this approach does notremove the utility's incentive to increase gas sales, limits the type ofDSM activities thatcan be readily accommodated (compared to decoupling), and can lead to perverseincentives for the utility (Moskovitz et al. 1992).8 Proponents argue that net lost revenueadjustment mechanisms are workable, relatively easy to implement, and"represent a lessfundamental change in utility regulation than decoupling (Tempchin'1993).
7 States that have adopted. net lost. revenue adjustment mechanisms for.~l~tric utilities includeMassachusetts, Rhode. Island, Ohio, and Indiana. ' "' .
8 If,l.l,etJ ostrevenues are basedol,lestimare,d ~vwgs. theutili~.r CC)u1~.lJecrewardedtwice: once with assumedlost revenues and twice with rev~uesfrogl.therms that were not su~M1Y ~ved.
236

9.3.4 Revenue Decoupling Mechanisms
Revenue decoupling mechanisms (RDMs).are ratemaking approaches that make a utilityfmancially indifferent t.ochanges in ..sales. This ...approa<;h.can be applied t.o varyingdegrees. Far example, 27 LDCs in 11 states .or pr.ovinces l1ave•.some type .ofweathern.ormalizati.onprocedure (Marple 1991; Marple 1992).M.ost.oftheseweather adjustmentmechanisms are 1UJtfulldecoup~g mechanisms, but ,th~y d.oall.ow far revenues t.oberecoupechvhenweath~r-se?sitivecust.oli1ersexperi~n~,,~er-than-expeclP.d winters andfar revenues' t.obe.retumed .to.customers.afier col~~r-~ciJl-expected.""illters.
. '. . .... .. . ... . '... .. .... ... .. ...
.. .... ..• :."', .-. '-',:' .....•....•. ·.c. _._ • .. .......... -.. ,: -'. ::..... '<.:.-:-.< ...• , :.: -." :- ",,': .•..•... : ' -. .. .",: .. '.- < : ",.;,-,:»-.. '."
With ..a full dec().uplingmec.•hanism,.CJllLDC i~.auth.orlzedtQ.(;rea~asales balancing-. .. ". '-' .. ,.- .. ,';. .. .0': •. -.
account. Revenues intended to r~yercertainfixedCQstacCQp.nts(usually base rateaccounts) are. flawed thr.ough·the.balancingaccount mechanism. Actual ,revenues arecompared t.oth.o.seauthorizedin·thel~~t' ratecase()rattriti~nproceeding, and anydeviati.onsare l.ogeedt.o tfje~balancing'.a.cC<>ulltratherthcm:fl.owedlhr.ought.othe LDC'sincome statement. The end'resuit is that the LDC reports auth.o~ .•.t?v~nues.instead .ofactual revenues. Balances in the sales balancing acc.ountare am.ortized in future rates..Sales balaneing accountspr.otect the,LDCfr.om \tariatiollsinsales'Dufriotfromvariati.onsin base-rate expenses. Far example, the LDC is at risk far any increases in wages thatare n.otreflected in the revenues auth.orizedin the last rate case .orattriti.onproceeding.
Decouplinghasbeell a9.o.p tedfar electricutilities inseveral~tates, specifically as a wayt.oeliminate disincentives far DSM. Far 'gas LDCs, a ful1:R£:M,,:is ftrstad.opted by theCalif.orniaPllblicUtilities C.ommissi.on(CPUC) in 1978(Marnay aJ:ld~.omlles1992). TheCPUC's primary rati.onale far adapting decoupling far gas u.tilities.was t.o stabilizeearnings in response t.o sales variati.ons caused by wide fluctuations in the price andavailability .ofnatural gas, rather than t.oeliminate financial disincentives far gas DSM.Currently, the CPUC still regards decoupling as an appropriate response t.o demandfluctuati.ons caused by weather variability and, t.o a certain extent, alternative fuelcompetiti.on(see Exhibit 9-2). Since 1988, Calif.orniainvest.or-ownedLDC revenues arefully decoupled from sales far smaller gas "core: cust.omersand ar~partially decoupledfar larger "n.oncore" cust.omers. As a result, Calif.omia'sgas LDCs have been at risk farsome .orall .of the revenues allocated t.on.oncorecust.omers. Specifically, if sales d.on.otoccur asJ.orecaste(i, the utilities C3.IlJl.o!reco\.'e.. .all .of the lost margin fr.om .othercust.omers.or futurecustom~rs ...N.onC()recust.omti~~{primarilyindustt.jal,electric power,and wh.olesale)comprise about 20% .ofthe utility's margin and the CPUC has c.oncludedthat putting the utility at risk far n.oncbre sales will help keep utilities c.ompetitive withalternative fuels and bypass pipelines.
Decoupling mechanism~.have been h.otlydebated by severalPUCs and the pros and cansdiscussed at great length (see Table 9-3)~One.ofthe,challenges in designing effectivedecc>llplingmechani.~msis .tI1eway in whi£b",.Cll.lth.o~.b~-ra~revenue requirements
237

Exhibit 9-2. Revenue Decoupling for California's Gas Utilities
A full.decoupling, mechanism insula~es.utilities ,from all variation~ in sales, notjust those resulting from the implementation of DSM programs. B.ecauseo,f thevariability of gas demand ,in response to we.ather, decouplinQ can have a significant .impact on prices from year to year. Figure 9·1 shows annual fluctuations in SouthernCaUfornia·GasCompany',s sales balancing accounts known as its' core and noncore
. fixed cost accounts __from1, 988 to 1,993. Full balancing account protection is givenon fi",~d)C.ostsall()~ilte,~to ,the,core" b.utthe pr()tection ,is only partialfor noncoresales. Imbalances in.,the fi)C~dco.st accounts. primarily reP~esent fluctLJ~~io,.,ns in ,sales.In the noncore fixecfcostaccount, imbalances are also caused bythe'LbCdiscounting itsrates',These imbalances produced average rate impacts of over 10%, in certain years. During the time period 'shown,balancesin fixed cost accounts wereconsiderably larger than balances accrued.in"SoCal',s'PGA account. These 'unexpectedsales fluctuations have not been disaggregated systematically,but the ,available
".evidence .indicates that the,fllJctuaticmsare 'a~rib~~~ple to. unexpected variations invveathe.r,.ch,~nges,in the. economy, !~nd".,altem~li;'!erfy,elscomPelition, The impact ofunforecastep demand effects.of DSM is estim'ated,.to be small. comp~red to theseother factors. '
~ . ". ," .. :...... ." .. " ..:............ '.
Figure 9-1. Recent Sales .aalancingAccouni~c~ivity':'<S6utheI'OCa.lifomia G~s.C:ompany
10%
8%
6%4%
2%
0%Feb-93 -2%Nov-92Nov-SO Nov-91
Ending BalanceNov-88
Under/Over Collection ($ million)350
300
250 •
200150
100
50
o(50)
c:::JCore _Noncore Total as a Fraction of- Revenues (right scale)
238

Table 9-3. Decoupling
Pros
Cons
Makes thf!utilityindifferent to. incremental.sales,which provi~es impetus for implementing. DSMprograms effectively.Removes short-run incentives to market· gas·or gastransportation servicEls.ProvidE!sthe Uti!ityWith financial stability includingprotection f.rom.sai.es.\(ariations.caused by weather .
.,", .•.... " ........•...••.• '," ' :.: j ,', .. ':',::" ' ',' .. ,', <:.:,',', .•......•..•....~:.: ...• ...,'
Makes i?novativ~.rate~e~ign.eas.ier to implertlentbecaus.eerrors in ifor~gas,tedbilling determinants donot financially harm the utility.
ReQuiresfreQUEmttate cases, attrition, or "revenueper customer" like mechanism.Requires frequent, possibly large, year-to-yearvariations inJ;ates ' ./ .. .. ...• ..If applied toiildustrial markets, gives the utility aweak incentive to minimize unit costs; utility maylose market share needlessly;_Cancausec:roS$iSubsidies.CimoI19custgmerclasses iftheund~r<:.()II~c:~iol'l~ECilJsedbyon.eclas~ arereallocated to. other c'~sses.
.areadjustedonan ongoinghasis. Under.traditionaLtatemaking, the revenue requirementwas only an intermediate product of regulation andIateswere considered to be the finalproduct..:Decoupled . utilities essentially< are ·,guaranteed ·.their .authorized revenuesregardless of sales. Thus, decoupling requires one of the following: (1) frequent, future-year rate cases, (2) regular proceedings to adjust previously authorized revenues for;currenticonditions(thesecommonly areknownas.attritionproceedings), or (3) astreamlined or mechanical revenue adjustment process ·'like<the"revenue per customer"-proposal (Moskovitz.and Swofford·t992). 9..Such adjustments' to authorized base-raterevenues.are necessary to account for inflation and because some base-rate expenses area function of sales or customer growth. 10
9 The revenue··percustoiner approach normalizes base rate revenues to .thenuinber. of.cuStomers. Betweenrate cases, the utility is decoupled but its authorized base rate revenues are adjusted for customer growth at thepredetermined revenue-per-customer rate. The revenue per customer approach has been adopted for at least twoelectric utilities: Central Maine Power Co. and Puget Sound Power and Light Co.
JO Actual adjtiStments Ileed only to respond to c6st increases that are expected after takingmt() &ceo-untutility productivity improvements. ..-";
239

Weather and alternative fuels competition can affect gas .sales ..(and earnings) quitesignificantly, .and in relative terms, these are probably more important factors than any\lnfor~n demand changes f"nlmDS.M.Commissions that adopt decoupling mechanismsfor gas utilities .mustrecog~ •the potential for large annual rate changes (see Exhibit9-2). There are at least two ways toi1litigatethe potentially large rate impacts caused byfulldecouPUng.First, accJ.'Uedbamnces.coul4.be amortized over periods of time longerthan one year. However, longer amortization periods may provide a false sense ofsecurity, because it would only delay large rate impacts if a utility continues to recordunderco~ections;Also,i!a~tilitywantstobe able to report accrued revenues as current·reve9u~,the .amom14t$()n.period must be nvoyears or less (Financial AccountingStaiidards Board (FASB),1992). Second, a utility could attempt to separate the effect ofDSM from the other sources of sales variations and only allow the utility to adjust ratesfor over- .or under-collections. attributable to.DSM.n .
9.4 Shareholder Incentives Jor DSM
DSM cost recovery, decoupling;and net lost revenue adjustment mechanisms primarilyfocus onelimiIlatingregulatorydisincentivestothe promotion of DSM by gas utilities.Despite the availability ofd~~~mechanisIIl~'I>S:M is a new activity for gas utilities andmay still be perceived by gas utility managers to be less attractive than supply-sideinvestments. Thus, many DSM proponents argue that incentives to utility shareholders(or .man~gers)arenecessary ·Jor. the.following.reasons:
Shareholder incentives are.required to make utility management interested ingas DSM. iIt is likely that serious managementattentionwill only be givenwhen a utility's DSMprograms provide contribute .signifiCantly to profits(Moskovitz 1992)~ .
For.Ipanystates, disincentives__suchas uncertain costreoovery or the absenceof net 10strevenue'adjustmenL mechanisms__arestill apart>of:prevailingratemaking practices. Explicitshareholderincentives are one way to overcomesuch real· or perceived opportunity .costs .of pur~uing DSMprograms.
$ Incentives can be structured to reward exemplary performC!Jlceand to penalizethe utility for inadequate performance. Thus, incentives can provide anopportunity to make the utility not only purs\le DSM but pursue it effectively.
II At thi~ ~int., .h9we"er. the d~upling mechanism \\fill become complicated .and begin to 0P1f!l~like anet lost revenue adjustment mechanism.
240

904.1 Types af In~ntives
A~ afMay 1993, at l~t sevenPUCshadapproved'sharehalder .incentives for gasutilities..IZ There. are, three general types .af sharehalder incentives: incentive rates ofreturn, bounties, and shared savings.
Incenn'Ve Rates 'of Retum
All incenpye ~~ofrefurn probabIYistp~sifnplestilppi()Cicht()iJ1¢orpQ@~into existingregulation. Foi,DSMexpenditures that are capitalized ar amortizedwith,interest, a utilitycould eameitherahigher or lowerlilteofreturn, deJ>end~n9.()nme~uccessafits efferts.APPCwoulci rai~the,}Jtility' s"cillewoorate ,·cifreturri,if #Aida.superier jebimplementing itsDSM ,programsand,conve~sely, woUld<lovveritiifime i utility'sperformance wasjudged inadequate. The incentive rate of return could either be specifiedin advance and linked to particular accomplishments (similar tothe/.beunty approach),
i';;' Brit.~~~~.·p~;~yvrar~~;)~~" on 'm.,~f0~~f~St d~~rmi,~~p~!1~~i~:rtJS .•,~tebasingwas'dlScussediri more~detail in Section'9.2.2. ' " , "". ,.' "
Bounties
Bounties pay utijitiesforspecified achiev~m~ll~pased on apr~~t~B1ili1~feT1ll11ICl:.e.g.,X dollars forevelrmenn saved. Exhibit 9~~ldescribes aboti~ty.appr~achthath~ beenadopted. for BostOn'(ias.Themajer advantage of bou,nty,.ClPpr~achesis theiradIl1inistrativesimplicity; in addition,bounty approaches de n~tie<Iuireex'plicitforecasts-';~fgas.leng-run avoided costs (LRAes). This latter advantagei~v(lluabr~JerPUCs andHtili~~mat either have lim,ite.dexperien~ in develaping L~'Ss orb.elieve thCit(mereis,~y.~~~tial~ncertainty in their ferecast of long-term gas cel11mOditypriees'.Ii?yvrever, it';~~()~I~b~inQ~mat many·bounty approaches are initially' devel()pedby.estim~ting the.''.ll~t;;~~r~';valueofa portfolio of DSM programs,giventarg~tparticipati611levels.i~H~,~timatesi~f~as.;avoided costs are implicitly used to determinetl1el)gunty (see'~?iti~2~)·.Disadvanta.gesPf this appreach·ar e :the utility hasIlO incentive.to.minimizeDSM 'pregram costs and, because bounties are not directly. tied, to. a pregram's netbenefits, the bountymaYiexceed the ,value of the DSM pregram. '
,;;I}F,Commissionslnclude CalifOJ"l'lia.;·Iowa; Kansas. Massachusetts; Minnesota. J~ew Je~'y ••Wa,shington. andMontana. . .
241

Exhibit 9-3. DSM Shareholder Incentives: Massachusetts
Shareho,lder incentives hava beenapprovedfor five, of the eight invef$tor-owned gas distributioncompanies regulated by the Massachusetta Department of Public Utilities (DPU).Boston Gas's incentive isstructured,aul bounty. The utility earns no,incentive if ectual savings are less than 25 per,cent of,thetarget Ill11vingsof 451 billion Btu/yelllr (see Figure 9-2). Thec~rnpenyrecei"lIs, a,n incen~ve,of$5.6~permillion Btu saved if ectual sevings exceed the 25% minimum threshold level. The incentive payment at the100% target level of llilvings is .1.9 million, which is equivalent to 31 % of estimllted net resource benefitsprovided by these DSM programs. With thilll tlllrget incentive peyment, Boston Ges will increese its returnon equity by IIIbout 50 bllsis points. Boston GillSmust demonstrlllte IIIctual savings per melllsure IIIIldnumberof inflltallations of each meesure type before collecting IIny incentive peyment.
The incentive mechanisms for most other gas LOCs in Massachusetts have used III shared-savingsIIIJlprO~h,,81ld~,tility,lII"ltt~hClI~,II~c:IIIOr.cei~,I:Ib-,Clut5 to 7,*,<ofthe.~et re.,so~rce ~.nefit~pro\lide<f by theprograms for lIuperior parformanc~. "Few,LOCs actually' have received incentivepeyrnents yet because theincentiyellerelinkedto SClullllprogram performance; eoo the 'programs have been in place for only arelativelyshort,pori~. 7:.,', '" 'f , ,,',' ",' <.,'. •, '. ',' , ' <' ".'
In,M~ssltchUlJ.etts,bSM 'program ,cos~,sere.. rec:ovllrlldthro~gh eech •.•ti,lity'fI <::o,sto,f Gall "Adjustment Clause (CGAC). which essentially allows program costs to be expensed. Program costs arepreepproved:lIsepartoflhe procOeding.thllt authorizes the programs. Allowable costselso include net lostrevan\.les. incurr,ed ,as, II ra8\.11tof reducad 811Ies•.
Shared Savings Figure 9-2. Bounty Incentive for Boston Gas'sShareholders
o 50 100 150 2llO 250 300 350 400Annual Savings (billions of BTU per year)
\Tarj()lls.tyges.~fshared~~vi~gs"m~h~ismshave'~IJ1~rged~, .~eIllostpop~lartype ofSl1",areh,older, ,mce,ntiv,es,. for ,.el~~c uti1!ties.
"'~~ i~ ,s~edsa.villgs "mechanism", th,e, utilitytce9>Sa't;action (e.g.,~i,:!P"30%)' .of~enet,resour~eya ruepr()vided, ;by, ,a., DSMprogram. Net re8011rcevalue is computed asthe difference betweentotal program benefitsand costs. Totalbenefits typically areestimated bymultiplying estimated
TotalNetR~urceValue (thOuSands)
" 57,000
53.,000
$2,000
S1,OOO
I!llRatepayer Share of NetR~rce, Value
O ~ori Ga'. IncentivePayrllent
T .•TliAf'getSavings
242

(or measured) gas savings by the avoided cost of gas...Some PUCs..also include.the valueof avoided externality costs in their incentive mechanisms. Program costs typicallyinclude the utility's administrative costs, financial incentives .to customers, and DSMmeasure costs paid by the participating customer. Thus, netrespurce value.is analogousto the Total Resource Cost test. However, in some cases, th~Utility Cost~st. is used;that is, DSM measure costs.paid for by the participatingcustomerareexcbJdedfrom thedetermination of net resource value (Eto et al. 1992).
9.4.2 Scope of Incentives
Many PUCs that have offered in~ntives to utility shareholders .for acquiring DSMresources have limited them to certain' kinds of programs,~Often,incentive~ ar-etargetedat DSM programs that have "resource value" .and re~:fuce.the need fQr~~pply-sideresources. Programs that promote off-peak load building ()r load. buildiIlgvia fuelswitching typically.are not eligible. Several commissions.ha\,~ foundthat~~LI>Cs havesufficient financialoistrategic incentives to pursuefueLs1.lbstitutip~pr(.)~s without
,.. adqitionalfmanciat,.incentivesli..DSM""progmmsthat .~ p~irnarily•..•()ffere<ifor.equityreasons (e.g., direct assistance to low-income customers)orpr()gr¢lD1.s that providegen~ralprspecificipf(.)pll~ti.9n()n:p,~M.oPPRItt1niti.es.tQ~ustolllers.()ftenr~i\,e different..,kinds .()fm~f1ti~.etre.iliW~nh,f()r.~}(ampl~,jtj~pift,lcult to'reli~bly ..~tilllate ~vingsattri6utabl~ ..t() .informa.tion..~d "a.\ldit-type.prQ~s:. pn.eop~on .,.is .to .provide a.sharehOJcfie~;.pc~.nti"e.~~tis •.stiUctUred·.as••a;~~st-pi1.lS".ibount}'(e.:.~:·!.th~'utility receives- in~.llti\f~I~1.l~.to..~;fiXe<ipercent.(.)tprograt;J.l.:,~~~nd,itureSwitp'ia.(;Clp.ollpr()~raptcosts).This.aPl?i()~f~Ill~Y.b.~;~~ful jnth~;·~ .0(io~-incollle'oVe.ilth~~ti.op l?fPgraptswherethen,et.~.'1nef.itsar~,J1~gligiblebut the'pr(.)~ramisoff~re4 tc;> .ad,dress..~uity concerns.
',.," , -::..,: "'~..'>,. ,' :.:",'.:'::':. .••.,' :','" .::"";. . , .".0" ". .:::",.:',:.' <' ", ..:...::: '"" ', <:.< .•... :.. >,: : , ..::,.,:,,:~. ':: : '.'
Incentive mechanisms can reward or' penalize a utility's performance m accomplishingIRP andp~M goals. Defining appropriate performance measure, for ;oSM shareholderincenti,y~. hCiS b~n' a controversial issue; specifiCally,' there is'"debate over therelationship andlinkage between measurement and evaluation (M&E).<?f,programsavingscmdshar~voldetincentive payments. Often" this. deb~te has centeroo on whether DSMjncentiy~:p~yments should. be.bas¢ on Predeiermi~ed saVing~~.Qiparticipation-rate, estimates (ex arite) or on' the actUal'results of the DSM program (ex post).
Those who fav?r the ex ameapproach argue that: (1) the primary purpose of M&Estl1di~s~~duld'-petoJmpiov~pro~d~i~~ andr~urce.planniJ1~,· (2)~&~~tu~~~mvolvesighificant time lags,' aria the results are often subject to intetpretation, vJfiichciin
243

150%
1.0
0.0
1.5
-0.5
lead to contentious and figure 9-3. Illustrative Shareholder Incentive Paymentlengthy regulatory Mechanismproceedings andiricreased uncertaintiesregarding incentivepaym~nts, • (3). lo~g-term M&E studies areexpensive, and it is notfeasible to tieshareholder iricentivepayments to actual.measured savirigswhentheI>SM measureshave 10 to '15 yearlifetimes,' .. and (4).1:>~u~ the exame·appr~ach.is morestraigNfor\Vard .. and'lesS Ijslcy.than . an .t!.f ;po s t .. app{ oa c)h>~'> .•.•.•....•.•..•'.. ...... J.' . ...> < >~hareholders~receiv~.a 10\Vershcire.?fmenetbenefits, an. else~in~ ~Wlf· (Schlegelet at 1991; VYi~~sin Energ)'S(>nsetv~tio~ FOrporatfon1?93). In theff~r#~ipproach,the utility iSIJlacedatrisk'f~r~IRgramp~e~~ ..that are ~la~velxea$y.'t?Dleasure,such as..~ctrle\1ing.targetga.rti~pa.ti?n •.rate.S·For.e1C2JnIJle,•in ,ri~Hre'9-3, ..the utilityr~iyes ..ailm~~H"~ ifpartici~(ion J1l!es'~ .grea~rUtan, ore«l~to 75% of theforecas.tedtarg~~partici~~on.rates· ..'fhe.~tiJjty' s~g~are~ed~~:~participationlites faIfbelow 50% of target levels,>and there is a dead~bandrange, betWeen50 to 75%of the target participation rate, in which the utility does not earn an incentive. Typically,tl1~utility\ViUreceive. itssh~ of the .~~t~lle~tsforJh~.pwg~ 's. ex~te.d life cycle...over a one- to three-year·period while the aC'tiliilbenefltsate re31!~~.~ver •manYyearS:13In the ex ante approach, results of M&E studies would be used"to 'updateand modifyprespecified savings esti~teS only for future program years.':r..,i'::·:~,:,~f \!,:;':-:'.:;' "i' ',.,""',,::';'.'-~ ,.',,' ',",'-"'i '.i'·': .:~::':>:,,{ '"-';-,,
•. ' ". .. .. '.,' ,".... '. '," '." ," ', ..'....... ".< :: .'. ".:., : :.,.:.:.: '.!
.PropOnefttS,••6fth.e••eX.post.~PPI'8ach·argue~at:(i)l'aWg ·.sharehOld~r.c~h§e~t.i\res.basedonactua.1saviri~saslD~ur~~ver ti l1l egives tl1 e.utility.themaxil1luri1m~l1tive .~oacquirel~ng';lasting/p<>st-effecti~eDSMr~qr~,. and (2) i!.tpost apP1i)~Ij~s.J;eqU~ the riskthat ratepayers tate.wOTse()ffarter shareholder incentives .havebeen]j~tntaCtuaI savings-.are much lo\\,erilianexpe.cteij.Most .ex posfapproaclleSthatbave·l>eeifiiropOsed tie the
c ,.. ,_ ~._ •
.'.~~.WiliJies .tend tostl'()ogly favor acce1eratedpaymeots. of incentives ~ tJ:teybelieve~tI»~;p..'v.~rcomesthe-. _ "K-. . "_ _ .. . . . . . -...... . .. ~.~~iv~.risk ~.ttaecon.unissioowilliater "tak~ back". the slwebolder.·s.sIwe pf~e~x~.l>epefits.
-.. .' ,'. '; ~~ • i···IL. . ". ..' . . ". . .. '. . . • .'. -.' ,:... . . ,.' ,; :;. - .•. "
244

·s~~ehQld€fI" SCiviIlgs..to ~e actuat.prognun .savings as. estimated ..in ..an M&;E study. 14
·Wheq usin~ apiin~ntiv~~~hanisml>a~ on the ex post appr{;>ach,apanicularly .criticalissue is ih~time~riod31la intervals' qver~hich progranl savings are tQ ~.p1easured.At a minimum, benefits could ~. d~teI111inedba8(XjQnM&E studies pf first-year savings.The utility would then receive incentive payments based on the estimated' net presentvalue of life-cycle savings and a predetermined economic life for each measure. At thelimit, multi-year impact evaluations with test and controt.g~()JJP~,~()MJ4.~.required tomeasure savings over the actual economic lifetimes of the installed DSM measures; thisapproach may •beadI,J1inis~tiy(:lyblJfd~Il~IIleAA4(X)uld .i>e.e~~J}~iy~ in~p11s of theincremental value of information relativetothecldditional M&E costs'incurred.
- ' , .':. :""::.: ':.. <.: ' '.:.<,: ' :... . ' : :. : ::.:. '.":.: .. ::: .. ::.:." ..:: :.': ':,', ":'" ''''',', "':", ;,', : ":', :.: :', .: :: '" '".' .. " ' ,", ': :." .. ,'.,' .. " .. ': <. .."....
, .. ' ... ,:."'.: :.. :., .:. ',,' :',:,', .... :.:..... .•.. ,',':.... ,. . .
9.5AIlocaiioni.of,DSM:er()g~~rn,C()sts to"Classes()fCust()m~rSi
Cost' allocation is the process of assigning a utility',~revenuerequirement to broadcategories of customers known as customer classes. Cost allocation usually is anintermediate step in the ratemaking process because actual rates paid by individualcustomers are subject to the rate design chosen for each. cllstomerclass ..,In.reviewingalternative cost allocations, PUCs strive to meet their legal mandate, which is usually to.;set nl~fbatarf;.: ",just and ireasQnable,r .(Phillips19a~).Inp~tice, .~ttjngjust and···r~nablf;tra~h~. b~me [email protected]·ofbalan.c;ing~yet"al goalsj.nc~lIcijng'tI1~goals of~fficiencyandeqlljty.Efficiencyj.n,Yolves.maldngcustQrners pay.{oT:fbe .cos~they cause·Q[l<tl1e'g~.sys~I1l.Ec;Qnomists ·.attempt to .d(:finethegoal.pregiselybysaying that
".;~ffici~ncy is ID,l;pc,imizc::d·,wh(:n,prices. aI(: .set .ator ·as·clQ~ agjX>ssiQI(:tQmarginal costs ..,;pqlli~.;t orfairn(:Ss, .is·,the goalof~nsuring.~t.the b~n(:fits '.'of.th,e1,ltility system andincremental decisions made by the utility or PUC are shared by all~{Oftenjtheiability ofa cost allocation to meet equity goals is evaluated in terms of how it satisfies humanneeds or social justice goals or by how it affects specific customer classes relative to thestatus quo. 15
14 Thus, 'most ex post incentive mechanisms only protect ratepayers from the risk that DSM savings will beless t,bJu,1~xpecte4,tJncertainties~iated. with f11tw'eavoided costs~ alsoimpo~.t. Importaptly, ifsbareJlol!1er.jnccmtives.are,~,()D ..tJle p~nt :value of net beiJ.ents·over. the..program's ...life '1ycl~,.then~. y~~ve~tially absoft,ed.~. ~e riSk surrounding avoided cost estimates. An;aJ~mative ex postshareholder inc:entivelnec~SJl1 ~otdd~k»'c8tculate and pay ~bareholdei iI1ceD~ves.ove':·aprog~·s lifeusing actual avoided gas costs rather than forecasted avoided costs. ..... " .
.. .,." '.' ,..... ..' '.' .. .
15 f~i:~~~mI!J~,.a .~gu~toQr.~i~y ..~e.stg>s to,minjxqir.e.thenegatjrejDlpaCts •~f~c~~esondisadvantaged classes or will authorize programs to assist these customers in receiving and paying for utilityenergy services.
245

As with any decision regarding cost allocation, a PUCwill evaluate DSM.cost allocationproposals in tennsof theft ability to meclefficiency ,equity, and other ratem~king goals.Because debates about general allocation poliCies are far from resolveP, no prescriptiveguidCUlcecan 00 given for t,healloca~on ofDSMprogram costs. Instead" this sectiondiscusses allocation methOdsand their implications.
9.5~1Cost AllOc:auori'Methods
TIiereare se~nilaUocatio~methodsforassigningdirectDSM program costs.(see •Table9'-4). An important related allOcation'issue is how changes in gas demand resulting fromDSM programs affect allocation of base-rate revenue requirements in future rate cases.These ,metltods~dthe base-rate-revenue reallocation issue, are discussed b~e~y belo\\,.Readers who are intereSted 'in a more' detaileddiScussionofvariouscost·atIocationmethOdsshould refer to Centolella et al. (1993), which focuses on the DSM program costallocation,for· electric' utilities;:
Allocation by NumberiofCustomers'
Historically,somecollufiissionshave 3ll6catedigasDSM. costs based ortaweightedavetage of number of'customeri}6 This approach was uSedin'caSeswhete DSMprograms primarily or exclusively targeted smaller (residential)customets.17 'However,ag;DSM prograrns'becomemote,comprehensive·(Le.,are offered tocommetcial andindustrial customers)" thisapproaehbecomesunattractivebecause .the .allocation of costswill beul1likely,to niatchthe'aUocation;of benefits>provided by' the DSMprogram(Newman 1993).
16, Marketing Services, customer. information,andcust0fuer'relationsexpenditures frequently are allocated ona basis of weighte<JnulDber of customers. The weighting IDethOd'i~t)'piciUIYbased on the size.ofmeters and 'service lines.or •on .~~mer throughput and,thus, will' typically 'asSign&bre costs to larger customers '·,tJWi,would an uDweighted cUstomer count. '". .
17 Because resideJ;ltialcustomers historically have received almost all of the benefits of DSM programs'major problemswere.llot created whel1SG-909fof program'ic<>stsiwefe"81lbcatedtotheresiderttiilI2Iass wingthis·methoa.'
246

Table 9-4 Summary of Methods of Allocating DSM Program Costs
Number ,of Customers
Participating, CU$tomers
I» Costs are,considered tobeacustorne~costand all,ocated by number ,of customers ''accordingly. '
Costs are 'directly allocated Jopart;cipating ,customers.
I» Method is equivalent to an "energy services"charge.
Customers Offered theProgram
EXisting Vblumet'ric Ahocators
Exis~ing,D~rnandAlt91;ator
- Marginal c;o~t fflevenue~
• Costs of programs offered to a class aresolely allocated to that class; costs are notallpc.atedtoQonparticipating customercliil$~e,s.":,',:'>, ,,':,.:' ;-. ',,'- '.•,:<; '" , , "', ,Some or all DSM program costs are allocated'according to' each customerCl'ass' sper-thermsales or throughput.
I» Method is often equivalent to "equal centsper therm."
• Allocates some.or all DSM program costs inproportion to 'tti,e'allocators used to:~lIoc~tecapacity costs'.'" ' .. '
CI Method is usually used in conjunctic)o with,other allocation methods.
CI CoStSare added ,to ,the ,"residual revenue ,',,',requ,ir~m,~nt".~~d.are•••~llo<;ated'.ac~ordirip'ioth~ total 'marginal .cost revenue r~quirifrneht(capacity andcoinmodity-relatedrofeatfi,:class.
• Method is applicable only to PUCs usingmarginal-cost-based allocation methods.
247

Allocation to Program Parncipants.or Classes who are Offered the Programs
Up.c:i~rtlti~,1Jl(~tho(l,•the.C9s~ of .~.DSM prpgram ,are directly allocated to,.the classes orsubclasses of customers who .either participate in or are eligible for participation in aprogram; ..e.g., residential prpgramcosts are only allocated to the residential class. Thisappr()3.ch~sq¥ite pppular~d is used by .at least llPUCs;tliey favorit because itmiiu~C9ncemSth~t npnparti~pating ,classesare subsidizingDSM programs (NationalAssociation of Regulatory Utility Conunissjoners (NARUC) 1992).18 If program costsare solely allocated to participants, this type of allocation method is equivalent.to anenergy ,services 'charge' that fully charges the participating customer -for the co~t of theDSM measure.
Equal Cents ,Per-Thcnn
Broad allocations of DSM>program><cbsts, such as equal cents per therm or othervolumetric allocations are used because they are considered simple to implement or~\l~~~t~.J~ .~f:"pec~~pnthat" ~e progrcunprovid~ ~nefits ...to all ra~payers.~~l,a~yeJo.QtAera.U~~()n.~p~~h~,,;lIlequal-centS-per-therm allocation will tend toallocate more DSM prog~;£QstS",to"high load factor customers.
The equal-cents-per-therm methodmay'be implemented as an adder to the transportationCOl1lpone~~pf,all ....~~.,. or to the ,PGArate~ For utilities with si~lli~cant quantities ofC\lstg#,\~~7()\.Vlled~sRi~~~1l, ".'the,£h()i ceof the basis' for the adder can yieldsigmficanUy different resultS.~:;):'Ile.firstm~thod(adder applied to all rates) will allocatesome,DSM>C9S~,t()tran~p()r;t~nlycustoI1lers. Such a method has been adopted in Dlinoisfor allocating DSMprogramcosts at two gas LDCs (see Exhibit 9-1). The secondmethod (adder applied to sales only) allocates the DSM program costs only to gas salescusto@~rS()ftheLDCWlliletIanSPort-()nly customers are not allocated program costs.ov~~'-~;'Rr()ad,;~QIQWetqc-~~a)1()Cati()n is relatively popular among PUCs; 'at leastse\r~n'reI>OI1i11g"mat.th~y,u~~uch .a,m~tliodology.
18 Of the 51 PUCS (including the District of Columbia) surveyed in the 1992 NARUC survey on utilityregulatory policy, 29 PUCS either did not have gas DSM programs, were still undecided on their allocationpolicy, or did not report an answer. Thus, the 11 PUCS that rely on participating-class-based cost allocationmethod represent about 3S % of the 31 PUCS that responded.
248

Allocation According to Existing Capacity Alloctitors
Similar to the logic. used for volumetric ..allocations is the notion that .DS¥ .programsoffer a .certain amount of capacity benefits and, consequently, a portion .ofDSM programcosts ought. to be all~ted ina manner similar to. the. way existing LDC or. pipelinecapacity costsareall~ted.No one has proposed lQ CJ.llocatean ~ntire DSM programaccording to .thisllletlloo, ..bllt it ••has ..be.fn proW~ '.for Use in ~njunc~on. with otheran,~tion, ..J1lethods.ForeXample,ifagasDS¥ p~()gnUn.saved th~rmS apd I"educed peakda.Y,demand, the costs of the Rmgram .could beallOcate<l to custQ~er classes on the basisoftIleir annual throughplitandpeak~ydemands (~~wman 1993).
,..•................ :-- .. ::.... ..
Marginal-Cost-Based Allocation' A:fethotis",: - : ' .. -... -.: ':-:'.:'.' '.. ,: : >-:. - : .. -. -.: .. :..... . -. -, .. .. ...- .. -,
With marg.i.Jl.al-cost.-b.as&lal.··.loca.ti.onm..ethocis., n.:onga.s.··.re.venuereq.u.ireDlentS.·••are firstall.,.pea.....led a.·..·ccord..m·...g. ·.to.·.·..JDarg..l·n.cil.····.co..,s.ts. ·estimclted.· .fC>t...ea'ch maj<>.r.••..utili..·tY.function:
.",C()xnmoditY-relat¢d,trilnspo~pon, sWr.a.ge ,.distribuRo~'andcustomer~sts: Usua.ny, the'to~lu~Iityr7yellue r~uirement(l()eS ·n()t~ll3l.itl1e. f7venu7s that .~ouldacciue. undermarginal ..costpf1cin~, ..~.~Q·me .~~. of "rec<>tlcili(ltio~."..is necessary. The"m9st. common. ·•..fOnri.of.rec ..oncil.i.a..tio.rl'lskIi..o.wn. as eq.'..tial..pe~.centa..g.e.".0.f.m...ar.. ginal CQsts,(£p.M.C..>, whichm~ns thafan rt;sidua.l dollars arealIClCa~inproporti()#.JomaI'gipal ~strev~llues. Theresidual revenue requirement can also be allocated using the inverse of each class'sdemand elasticity. This type of method is commonly known as Ramsey pricing. At leasttwo states-California and MassaChusetts-use marginal costs iv.allocatingnongas. C()sts,although marginal cost allocation principles have not been extended to purchased gascosts.
'Under the~eJle~ 'fran1ewprk oID1arginale<>st .al1ocatipn approaches, •••there. :are .at leastthree ways·.toalloCatel)~M prOgramco~ts·.First, the. ~st()fp~oyidinguti1ity DSMservices can' be.,inAluded in themarginal.cp~tom~r :,.costs,which ~ .h~v~..~eeffect ofpredominantly .all~ting D~M prog1]lDlC()ststo smcill cust()lD ers(silllilClfto'tl1e "numberofcu~t()mers" .allocati?~lDeth()(}already d esc f1i>ed>.Sec<>nd,DS¥ progicmt ~.sts can beexcluded from the geneial nOllgas allocation and included in .m~,~(]A.. rate c011lponent.This is the method used in Massachusetts. Third, DSM progratn; costs can be' excludedfrom the PGA account or any of the marginal cost estimates. The DSM program costswill then, by default, fall into the ~idual revenue requirement and will be allocatedeither by EPMC or by inverse elasticities. California uses this third method inconjunction with EPMC. The logic behind a residual allocation using EPMC is that DSMrepresents an alternative to supply, and its costs should be allocated to customer classesin proportion tomarginalsupply",side costs.'
249

Reallocation of Base-Rate Expenses in FutUre Rate Cases
PUCs are obligated to. provide utilities with a reasonable opportunity to earn theirauthorized ...rates of return ..•As a practi~. matter, this .means that most commissionsallow, in the rate case, for the. adjustment of demands in reSponse to DSM programs. 19
Although the eff~t of tile rate. ca.se is to give the utility an opportunity to be made"whole, "mere may ¥ ~ignificant impaSts0n the rea}lgcation of base-rate. expenses toindivid~c~s!Ol11erslilsses' )Vhen consid~ring the u~ of the general allocation methodsdescn.·bed.·.ab9..'ve,it. isim.po.'._.rum·) to collSl..~.derthe. interaction.ofth~se m.ethod,~w..·.i. th changes. , ': . . ' .: .. : ,.: -.,"" '.' -. -'. -. "._:. :.-.-: -' .. c··.:·,··.:: · >._ ; ..-.:;: :'. ", ,':,:. _.": .-. , -. '::'.': .. ::.' .:::- .. ,...... . _,:.:: : ',": ' .. :-'. -. .-: ,': .. :. ,-,-.,: -. : -:. : ,:.:, : . . .
in the levels of the aijc)gltprsJorRthefcomp<>n~ntsof base-ICiterevenue ~equirements.For example, if a DSM' program reduCes the peak Sendout of a customer class, it isreasonable to expect that that class's allocation ofpeak-day costs should be reduced. Theimpact of such a reallocation on nonparticipatingcustoxners(J,epends to.agreat ex,tent onthe relationship of avoided capacity costs to the average (embedded) capacity costs. IfaVQided?()~ts ar~ 10w~~lativ~ toelI!b~d~.?psts, ..thenon.parti~jpating custQlllers (or.cla,ss.eS)may ~eadyer~IYaf(~tedevC?n if theY.4() not share ill .the direct <;Qstsof the.'I>SMpr. og.ram.. ,.lJecau.se."'th.ey. will l>e .all.oca._.'...too.·. m.•.Qf..,~...e.m..pedd.ed .capac:ity c:P~.fs,than they'would r~ive\Vimoutili~DS~~pl"ograin;'Cpnv~t~ly:·ifavoide9.costsare~~~ relativeto .'~rnbedded c:p~.~,tllerillonParticipatipgclClS~. ~ll,benefit b~use tll~tRta1 ..cost ofcapaSity i't'Wdr()p>py.mor~ ,ma.ll.th~>incr~inth~)16nparticipating class?,s ~rcentageall.....~ . .to.f. .,T.,...h..,~. e.f.fecto.'f....diffe.rc:nt.as.su.m..ptions .Ie.gard.ID.·g demand .all~tor~ is illustrated,iri~th~eJ(arDplepfesente<i illthe'.f?lloWmgsection. " ..
9.5.2 lliustrati6n of ]jifferent Cost Allocation Methods
Different cost allocation methods can affect participating and nonparticipating customer~hlSses in •si¥nifi~tly,. ~ifferent \VaYcs,.~cula.rIYc •.incaseSwllere DSM ..programe}(~nditllfes§lfelarge.!oillpslfCitethe issllesinvolveQ,,!th~~ lllethodsof allocating DSM.prQgram..costs.'.·.~e .show.n.for. a Ii.-.ypo.th¢..ti.·.Cat... ..LDC eon.dllCti.ng..-an agg..ressi.ve, .large-scale.,.residen~a.l.•P§;M. 'pr()grai1).'··.;pte...hypo.thetical L1:><'; •..has·.tlir~ ••~\ls~()Olerclasses:.·•••residentialcustom~rs .•mth'a 4(). ~rC¢rifl()a.4< factor. that ~iye bun~led •.service>fwmthe. utility~sales ana,tT'cU1 sRDrt ),co Ill merciallindustrial(SII)cust()rnei"S tllat receive bundled service,ana C/I cllst()IYlCrs.that are transport..only customers~ '
19 For states that practice historical test year ratemaking and dondt allowfot·adjustments in test year thermsto account for DSM program effects, a new rate case may not fully adjust for DSM if the demand effects ofDSM programs are growing over time.
250

Figure 9-4. Class Average Rates for a HypotheticallDC
D Gos Commodily Costs~ Tro,nsporl (non90s) Costs
Cli Transport LDCSystllfllC11SalesResidential
70
60
~50
J! 40IIIa:GlCl!.!II>
~
The LDC's costs areaggregated into twogeneral categories:commodity costs andnongascosts(Le., theLDC'smargin).20 Averagerates for residentialcustomers are$0.63/therm prior tothe utility DSMprogram, whichoccurs in part becauseof the class's low loadfactor (see Figure 9-4). Rates for C/Itransport customersare"the lowest($0.22/therm) and thellplity'~~ye~g~. ~,~e~fof its"entiresystenl"are $0.48/therm.
Assumethatthe<DSMprogram is/targeted only at th.e residential customer class andreduces 'residential'class:sa1es anddemand.by5 % annually and on '.a peak day at a costof$0.30/therm>t0the:utility .•DSM program expenditures are assumed ••t() 'be ratebasedand ' amortized •for' the .,·life·of the .program. ·Assume ,.that total avoided costs are'$0.45/therm consistingof$O. 30/thermiformarginalcommodity'~sts and$0.15/thermformarginalnongascosts. These avoided costs are, however, lower than averageresidential rates, sothereis'anet 'loss of revenues to the utility 'absenta' reallOcation ofcosts. Further,itiS'assuiDed;that,although participating customers may pay for some ofthe measure's costs on their own, they do' not contribute to the utility's DSMprogramcosts, other than their share of program costs allocated to their class.
As long as the LDC is made whole, there is, on average, a 0.5% decrease in bills anda one percent increase in rates regardless of the chosen allocation policy. However, billand rate impacts significantly vary among the three customer classes depending on thecost allocation method (i.e., costs allocated only to participating class, costs allocated to
:lll.Commoditycosts.ate allocated"to all sales customers, whilenongas costs are allocatedaccoroing to aweighting of peak day demand and average-year throughput.
251

all .customers on an equalcents per therm basis, andcosts allocated tocustomersthat~:)Uy. onlygas .•commodity ~rvi~)and .·.varying''.assumptionsregarding whether or notnongas costs arereallocated (see Table 9-5).21The impact of thesemethods.on class averagerates and bills is shown inFigure 9-5. On average,resid(:ntial customersreceiVe.···•••billi.~uctionsIaQging... froIl1i9.5 ·to3;~~.!·iwhich>~s>.10wer,thaIltheir 5%;r~~ced gas' .'usage' because rateincr~~~I~~~fed~offset 'fost' .margins ' (seeFigure 9-5a).
Table 9-5. Identification of AllocationMechanismsShown in figure 9-5
Change NongasAllocations in Responseto Change in Demand?
Only toParticipatingClass (ResidentialCI~s~t.. •.• . • . • • I.A. • • . . • II.AEqual Cents perTh:&rr:n •• • • • • • • . I.B. • • • • • • 11.8~q~~I.CentsperThermt05a,Ies.CystomersOnly I.C. • . • . ••. II.C
'The ~idellticUcustomer classreceiv~ .thehigh~t .b.ill reductions in the :,type "IT"alloqtion~,wl1ichchange .the.,nong~·;alIocak>rsk>.~fIectthe demand impacts of theDSMprogram.CII .s3I~cqstomeis ··(whoare' nonparticipants) •receive a rate reductiononly/ullder .•allocation'mechanism. I.'A,which alloca~. all DSM .program •costs .•to theparticipating.class· (be. ,residentiaL~u~tomers)and does not reallocatenongascosts (seeFigure 9-5b).With.other co~tallocationmethods,rateand. bill increases range from'0.05-2%.•C/ltI'an~rt-only.customers •(aIso.nonparticipants) receive a. rate reduction onlyun<ierallocation mechanismsl~Aand l.p (see.Figure 9~5c).Billsand rates increases fortransport-only '.'C/lcustom~rs .range from 1-3%. if .nongas.cost·allocators ·are changed.
21 In this.example, ··ifnongascosts are reallocated,. then~cJass's base..mteis adjusted to incorporatedemand impacts of DSM.
252

Figure 9-5. Impact of DSM Program on Average Rates and Bills UsingAlternative Allocation Methods
a. Residential5
3
D Change in Rate
~ Change in Bill
-1
-3
-5LA I.B I.C II.A 11.8 II.C
b. Commerciallindustrial Sales II~ 5 I0 Change in Rate & Bill IQ)g' )II)..c:U"ii::sc.:i -1
&!!! -3Q)
~ -5I.A 1.8 I.C ILA 11.8 II.C
c. Commerciallindustrial Transport I5 . D Change in Rate & Bill
3
-1
-)
-5 LA 1.8 I.C II.A 11.8 II.C
Allocation Mechanism (see accompanying table for description)
253

254

,'·,f'
References
Alexis, M. 1993. "Letters to the Editor: Debunking 'transfer losses'." The Electricity Journal. 6:5:3.June.
Alvarez, C. 1993. Presentation. NARUC eJnservarion Conunittee; 1993 Winter Meetings. March 2.
American Gas t\ssociati?n.1987~~"Co~JCW .GllS: Market Survey: 1987." Eig~th Annual Survey.Arlmgt6n, VA: Anlericim.Gas ~iation.
American Gas ;\ssociation. 1987b!(Gas ~te Fundm:nenUll~."Ar1ington,VA: American gas Association.
American Gas Association (AGA) 1992. "1992 Gas Facts: 1991 Data - A Statistical Record of the GasUtilityIndustry." ~Iingwn, V{\:The American Gas .i\ssociation..
American Gas Cooling Center (AGCC). 1992. "Natural Gas Cooling Equipment Guide." Arlington, VA:American9.as Cooling Center, ()ctober.
,~ak, M.J993 ..••L~g~ ~e~e.en.(jas Integrated.Reso~rce}>lanning Activities and Pipeline Costs."Unpublished driift:Detroit, MI: ANRPij>eIine CO. July 21.
Arthur Andersen & COmpany,and Cambridge Energy Research AsS()Ciates1988. Natural Gas Trends.
Atlanta Gas tight Company. 1992. "Inte~ttid R~urce Plan 1993-2002." Volume 1: The Plan.
Baltimore Gas liDd'EleCtric; 1990."l.etter· fnlm Baltimore Gas liDd Electric to the PUblic ServiceCommission ()f ¥ai}'land."l'l0veDlber. 29.
Bauer, D.C.,and J.H.Eto.E~92."'FutU.reDirecti6nS: Integrated:ResourcePllUlDing." Proceedings.ACEEE 1992 Summer Study on Energy Efficiency in Buildings. Volume 8. Integrated ResourcePlanning. Washington, DC:}\merican (J>uncil for an Energy-Efficient EconoD;ly(ACEEE).August.······ .•... '"., .' ,'. . . '.
Berry, L.1989. "The. Adrni~i.strativeC:OstsofEnergY.C:Onservationprograms." Oak Ridge, TN: OakRIdge NationalUboriltory (0:RNL).()!OO-/CON~294.November.
Bickle, L. W..1993." Supply}>l~ni~g iIl.tl1ePos~-Orderf\l() ••6~6.EnviroDIIlellt.".•p,.0ceetiin$s. Conferenceon NO/ural Gas Use; Stiitei?egu1iiiibn, and Market Dynamics in the Post 636IEnergy Policy ActEra·. CONf-93028~.Washington,. p£:NationaI Association of Regulatory UtilityCommissionerslDepartment ofEnerg)' ..p: f61-281. April 26-28.
Boonfu, D. 1992. "End-UseFuel:SWitCiillig:Is,ItFair?Yes~.It ..ls!" •The Electriciry Jqurnal. June.
Bradford, P. A. 1~92. "Ne"" York.State~erg}'. POliC}'lUl~Planning Goals Regarding l;faturaI Gas."Proceedings. Natural Gasliit~gr(JIea Resourc:ePlanning w,0rkihop ...New York state EnergyResearch and Development AuthoritY (NYSERDA). October 29 & 30.
255

Braithwait, S. D., D. W. Caves, and P. Hanser. 1993. "The Complete and Unabridged Measure ofDSMNet Benefits: What We've BeenMissing." Proceedings. 6th Nalional Demand-Side ManagementConference. Electric Power Research Institute (EPRI). pp.238-241. March.
Buckley, P. 1992. "Jointly-Delivered Electric/Gas DSM Programs." Proceedings. NARUC Subcommitteeon Gas lntegraled Resource Planning. November 15.
Bums, :R.E.,M ..Eif~, andP~ A. Na~ler. J~l.',:Curre~tPGA an4FJ\G Practi<:¢s:Implications forRatemaking in CompetitiveMIlrlcets."p>l ll mb us,.oIl: TheNati.onal~sWal9ry Research Institute(NRRI). NRRI 91-13. November. ',', '. ' ,
CalH"ormaPublic Utilities Commission (CPUC).'1991. ~Rille~g 88-o8..ont" Decision 91-11-025.November 6. '
ii;" .' .••... ~" ". . ,. f: ....California Public Utilities'·ComDUssion(CPUC). 19918. Decision 92-12-058. Investigation 86-06-005.
December 16.
California Public Utilities Commission (CPUC). 1992b. DeciSion 92-04-027. April.
california PI1blicUtilities &;lnrnissi~n (GPYC).1992c.l>ecision92.o7-025.R.yleJDaking '88-08-018. July1. "
California Public Utiliti~Commissi()n (CPUC).199U::'InterimOpiliirin onDSM Terms and Definitions,R\ll~, for Fu~l.~u~~titution and,New 8>nsh11ftionPrognlJ.DS.".D.e~i9n.92-1{}-()20...October 6.
California Pub~c Utiliti~ CommissioIl(C,pUC). 1993.Decisi!,n 93-06:-092. Application 92..:10-017. Jilly.
California Public Utilities Commission (CPUC) and CalifomiaE.iergy Cornttussion (CEC). 1987."~J10mic.AI1l1lysis. of, De~d-S!ge M~gement, Pf()graJJ:IS.~'StanJa.rdPractic:e Manual.P4t?o-87-006. DeCeIllqer. ,'", , '
. ".,' " . . . . .. ..... ". ... .'. ',' .
Cambridge Energy Research Assc)ciafus(CERA). 1992. "Unfinished Business: ~orth American GasStrategies After Order 636." November.
. . . . .•..... ,'" ,.. ,' ',.:,':... ..:..: '>.. ::::.. ' '. '.:'" ." . '.' ':' : , : ." ".. :........... ," . ;' . :.< '.. ,' « .: . •
Carillo,F. A. 1992.,~EstiIrulting.the Effects o(the Nati0 IllllA,ppli~ce EnergyC~nseJVation Act on anLDC's Peak Day." American ~ Associalion Forecasting Review. 3:9-19. April.
Caves, D.\V.199~. "GulfPo\VerT~iDlO ••y."9Uis~n~iates:¥adiso~;\\1.
Centolella, P. A.,S.A.I\fif:nick,D.'B.Bark0vifh,>C. Yap, and D.:B09~.19.~3 ... "Report on CostAllocation for Electric Utility Conservation and Load Management Programs." ScienceApplications .Intemational Corp..and Bark0vich & Yap. Prepared for the National Ass9ciation ofRegUlatory Utility Commissioners. March.
. ... . . . ... . .. ~. . ,. ,
Chamberlin,J:H., iUld~. M. Hef'!'"Jl"' 1993.~}\'hYAll"Good" ,:Ec9nomistsRej~t th~ RIM Test."Proceedings. 6th N.alional Demand-Side Ma";,,geITJent c.ont~rence. EPRI.pp.231-237. March24-26. ' . ,
256

Chamberlin, J. H.,mdE •.~. ¥ayberry. 1991. "End-Use Fuel-Switching: Is it Fair?" The ElectricityJournal. 4:8:38-43. October.
Chemick,P.1991.~,Least:-Co~t PI~gina MltIti-Fqel .Context." .Proceedings. N4RUC Forum on GasIntegrated Resourc:e.Planning. \y~gton,DC:NARUC.< GllSCOmmittee. and NARUCConservation Committee.
CJ:1i,.M.• and J.•Finl~p.· •.lg9.~r."Designiq~ I~l,J?valWltipn,mans for:qSM~id,9ing Programs: Lessons'Learned. a.t;~e ru.bJlc ~ervice.~~>,ofColo~o,. ".Pro"~edi"gs '61hlYa#onal Demand-Side
Managemenr. EPRI TR-I0202I. EPRi. Maich." ....', " ..... ,.... .,:, .•.... : ....•.. < .
• :.. ',>:,' '. .. ',:," ,:, ,".. .. .. '.- .. : ",.- :., •.•. : .. ',',o.... .. .•..•. ".,,, : ', •.........•. ,. ..
Cicche~ti,.C..~..,~1(iW.J.Iqg~.;198Q ..·t·~~~ijdWgUn~lffi~J~J)~inaIllk~ide. Optio~ in.Electric Utility. . Bidding Programs;" Public Uiiiiiies' Fonnightly. 123:12:9-20. June 8.
CiCchetti>',C~.•f,'ax)c(li.lC. Mq~.::').992""UtiI!ty )~~~rgy servipes."· R;gl4larory Incentives forDemand-Side Management. Berkeley, CA: American Council for an Energy-Efficient Economy(ACEEE).
:.'>:;:'_:............... -..•. ',::,-, .. :,:.'" ',.,:'<.>:; >:- -.........>,.::Connecticut Natural Gas Corporation 1988. Conservation Plan.
~l1Sl1IDer.E~~I'gy. ~un(;ilc:>f>.~erica •••;Rese&,ffib.•.Fo~datiOI;l.JCE9A/.R.F)., ·.1993.. "IncorporatingEnv,ifO~entaJ EXternal~!i~lntolJtilityPllUlJl.ing:, Seeking A"Cost~pffective·Means of AssuringEnviromDenblJQUaJity." EnvironmentalEXrernalititiesProjea. W~hington, DC. July.
Depart~ento(~1.1e~~i:;<B8E).1:9?O~1t~Imi8'J· SUPpq~I>flCume~t:,Ene•.gY9>~rvation Standards forConSunier Products: Disbwashers, Clothes Washers, and Clothes Drye~." Washington, DC:DOE. DOE/CE-0299P. December.
Duann,D. J., P.X:'N~gler, M. II~1l;7JnTlan,and(j.IYyuni. i~9Q~"G~~tolll~~:Strategy, Regulation,and Some Competitive Implications." Columbus, OH: TheNational Regulatory Research Institute.(NRRI).1:'lMJ f}9.•~4."Se.Ptem...ber.......,.."::".:- ",;.::"-.:.-','';-« ~ ':, .:.':..:,":.~"'(::;:'.... ....
'-, :, \ :", ',,'::":--':', ,' ..':",',,:. ':"", ,.," .." ':.,:.: :- ~ > ,', ',: ,'", " •. :: /,.,.•. ,. : <: : "" '-:. .. '.
Dutl, G. S. 199'0. "The Technology and Economics of !ligherEfijciencYS~idential Gas HeatingSysteIDS." Minneapolis, MN: Center for Energy and the Environment. CEUEITR90-3-SF.October.
:. :\~<::> '.:.': .,- ..:,',',"' ,' '" )~t
ECO Northwest. 1993. "Environmental Externalities and Electric Regulation'."-'Washington,DC: NationalAs~iationofRegula,toryCO~missic:>n~rs (NARUC)..September.
Electric row~rJlese&,ffibInstitute.(EP:RI),.)991a. "End-Use T~lmical ~mentgqi~~(Eo.d-pse TAG)."Volume 4:Fu1u!amenrci1sand Metho4f •.Palo Alto, CA.?repa~ed<~y BaraJcat& Chamberlin, Inc.CU-7222, Research Project 3084-5. April.
Electric Power li~l1~tit\1te~PRI).::l?-~lb.,~JmpactiEvaluation. ofD~~d-Side ManagementPrograms." Palo Alto, CA. Prepared by RCGillagler, Bailly, Inc. EPRI CU-7179s Vols. 1 and2~SepteIqber~.
257

!
Electric Power ReseuchInstitu~(EPlU).l,992c'''ComparingErbisSi~ofErid-UseTechnologies. " FinalReport. Palo Alto, CA. Piepared bySt l1l teBicDecisio~,GrOl.lp: EPRI TR-I0lS74, Rl. December.
,>.: ;
Electric Power ResearchInstitu~ (EPRI).199 2d ." Co mpariPg:EmissionsofEnd-Use T~hnologies." Palo"Alto; CA. Prepared by;~~gic Det~~i~ Group. ~"'l0ls.1~,ItevisionJ~ December.
Electric Power,Research Institu~ (EPRI). 1992e..",p,s¥Evaluation -::Silt.Steps for As~ing Programs. "Palo Alto, CA. Prepared byBaraka~ & chilp1~rlin, .Inc:EJ>~rCU-6?99s~, March.
Electric Power Research Institute (EPRI). 1992f. "DSM Process Evaluation: AGuidebook to CurrentPractice." Palo Alto, CA. Prepared by Charles River AsS9Cia~. TR-l00647 Research Project2981-2. May.'
Electric PowerR~rch Institute (EPRI), arid the NatioDM~und EI,ectncCooperative' Ass&iation. 1989."Heat PUmpManual."Spedal Report. EPRI EM:4110-~~rSecond Printing. September.
Energy Inf0l1llati.~nAdministration (EIA)· 1989. "G!?wt,I1in {Jnb~d~edNatural Ga!; T~rtationservice$:'t982-1987~ " Washingt0Il, DC:' National ;~nergylliformatioriCellter.OOEIEIA"{)S 15.MayI9."· ..';, ;.•.....,::," ...•• ;.;.;;,';..;'.; ;
Energy Inf0l1llati~n Admill,istration (EIA). 1992&•. ",eommer-cilll Buildings. Energy. CoDSllmption andExpenditures 1989;" DOEIEIA-<l318(89).Apnt '
Energy Information Administration (EIA). 1992b. "NalliHaGasAnhu8.l199J:,,·Washmgton,DC: EIA,Officeof Oil and Gas, t7.S. DepartIDent of Energy (DOE). D()Effl;L-\-<l131(91).DistributionCategory UC•.950. October." " .
Energy Information Administration (EIA). 1993a. "Household Energy Consumption and Expenditures1990." DO¥IEIA-<l321(9.<»,Feb~.
Energy Information AdriiliUsltation (EIA).1993b."M{)nth1jEri~rgyRe"iew." February.
Energy InformatioIl Administration (EIA). 1993c, "NatundGas 1992: Issu~ and trends." Washington,DC:OOEIEIA-<l560(92). pp. 60-68. March; ., .,
Energy Mana,g.emen,•t Associ,a~. (EMA). 1992..",In"!Cgra.te4,.Resou.rcePlannin,g,£1,0. r New York,'s Natural Gas. .' DistnBu,tlon Utilities." Energy Manage.meniASSociateS.June·,l,i.;~'/·'· .
... : .... ':':;:::. ,,' ,': ,"',,' ",', "'," ","', ",> ,'" , "" :' ", ",' '". ,', '" "
Eto, 1., S. Stoft, and T. Belden. 1993. "The Theory and Practice of Decoupling." Berkeley, CA:Lawrence Berkeley Laboratory. LBL-34555.
258

.Eto, I. H. 1990. "Overview of Analysis Tools for Integrated .Resource Planning." Berkeley, CA:Lawrence Berkeley Laboratory. LBL-2U92. March. .
Eto, I. H., A. Destribats, .andD..S£hultz.l~2."Sharing the Savings.~ Promote Energy Efficiency."Berkeley, CA: Lawrence Berkeley Laboratory:;LBL-318~2. Appl.
Federal'cEnergyRegulatory Co~~on(FERC). 1987~ <>ffl~r.No•.500' ,52 FR 30334. August 14.•. " " .:,.... .....-. ': .:...•,..•. '," .. ";:,, ", .•..::., ..> ", ,', ." ':i
Federal Energy RegUlatoryCoouni~on (FERC). 1988:Oider No. 497, 53 FIi 22139. Iune 14.
.·Fede®-.Energy R~fda~ry&~mi~onr~~C)·i999: ••0r0~l>to.S2~~
Fessler, D. W. 1993. "Selected Papers: Excerpt frou1 remarksofDaIlielWilliani Fessler, before theExecutive Enterpri~~s·Jl~i~qt 1AAuaI~!o~a ~~t1Iral,Ga&Confe reJ1ce ,SIlI1Francisco,March 16,1993. A,S'Citedin:paper by Tussing:" Proceedings. Conference on Nmural Gas Use,Stafe11egulption,antiMqr;ketDyTBiJ11}ics JnJhe Pl!st 636 /E,nerK?P9licy4f-1.~ra.p. H. April;¥':'2,8.· .... .• " .',. ·.r.... ·.· •...r·· .. . . ".....".. ..
~.. .. .:.. ...' .....' .... '.. '... .. .. ", , " ~.Financial Accounting StaDcWdSBoard (FASB). 1992: "IsSue91.-7, Accounting byRa~-Regulated Utilities
for the ~ffects of Certain Al~tive Revenue.Programs. " Minrpes of the Emerging Issues TaskForce (Ei1F)' New York, NY. 'May 21. . . .
'.' : : '.. '," .Flaim, T. 1992. "Who Should Pay to Promote Electric-to~aSF~l SWitching?" Proceedings. New York
.. State Natural ...Gis IntegraretllJ.i!S0urce !lo.nnJng,Work.fhtJIJ.. Oct4>ber29-30.; ; ~:,':-". .."""'" .',',,',',' " ';' ;»:, ,',--',',","">'",', >"" ,,',' ',',' ,'" " ,,,,,',:',::"'<" ",:': ","",:' ""::" ,"",", :"" ..: :'--'--; " .-; ..', '.,," '" ,,', ' '" ','" ' --<, "'--' ," ","',."" -- " ' '.
Gas Appliance Manufacturers Association (GAMA) 1992. Statistical Highlights: Ten Year Summary _1982-1921.. Ar~ir,l~~, 'VA,:
q~:A~lianceM~W'f~~i~fion(Q~A):J9~3'· ••cOrisuJDers'Direct91)'of Certified Efficiency. . .'Ratings for R.esi~enti~ij~tiJJgand. Wate~~~t:ffi~.Equip~t'''Arlinitpn, VA:GAMA. April.
Ga&ke,..I. S..1993'''I~es ~sed.By .~~~C.Order N().636,~dd.Ieirlny>Jica~i«:>nsforGRI."l?raft Report .. . H; Zinder & ASs02iates. Prepared foc,tl1e(Jas R~.IDs~~~~~(~~:)~~~gust. 9.'
Geller, H. S"an~ S.~. ,Nadel.•.'!~~2. "8>~Na~onalpffici~£X:~tan~JorLalJlPs, Motors,Showerbeads and FaucetS~imd COmmercial HVAC'Equipment" ProCeedings. ACEEE 1992Sumrrrer§tud{O~~nergy Eificjency .if! Buildingsf X?I~~:~vepunent.Nonproftt and PrivatePrograms. Washin~n.DC;:AJnerican .CounCiIforaal.iE6,ergy-EfficiCllt~omY (ACEEE).pp.6.71-6.82.August.· ." '" ..' " ... , ......................•.
Georgia OfficialCode. 1992. "Official Cod~ of Georgia." 46-3A,-let seq~passed March 1991, effectiveIanuary 1. . .
Georgia Public Service Commission (GAPSC). 1991. "Commission Rule 515-3-4." December 29.
Georgia Phblic Service CommisSioD(GAPSC): 1992. "AmendedOJ-tlerAl'pr~vingand Adopting IntegratedResource Planning Applicable to Georgia Power CoIiJpaDyuid' Amended Order Approving and

Adopting Integrated Resource PWming Applicable to Savannah Electric and Power Company."Docket No. 4131-U'and 4134-U. August31. .
Georgia Public Service Commission (GAPSC), 1993a.,"CertificateofPub~c Convenience and NecessityNo. GPC-I-DSM and Certificate ofPliblic Convenience and Necessity No. SW-1-DSM." DocketNo. 4132-U and 4135-U.Janwary Ii and 7.
".:: " ,•.r·..·.', : .•.......•...: ~.,<:> .. : > ,':,',', .',' .' ".--. ':< ~Georgia Public Service Commi~i()n (GAPSC): 1993b. "Ldter Order." Reconsideration of GPse Docket
No. 4267-U - Atlanta Gas f)8.hI CtH,nJHmY'sIntegrated Re.s0urce Plan. August 11.0'" ,'c.. ' ',', ,,',' ',"'.' . ". .- ..,-: -:.: " " " •...•
Goldman, C. A., andM:'E. I:I0Pkins~l~l."Surve)'of~tate :RegulatoryActivities oll~st""9>st Planningfor Gas Utilities." Washingtoxi;DC: Nati6nal ASsocjjuon of Ifeguiatory UtilItYCOmssioners(NARUC). LBL-30353. April.
Greenblatt, B. 1993. Boston,GlIS.~<lstori;MA.Personal cP",~'#llcilti()n .. -;
, " ",'" .... " " .. ,-".- ..... '.
Hanmlln'Jlhmn, M.,K.W; Costeii6, h: t'DWUiD, luld s.ijfibt6. 1991. "IriceIl~"eReguiation for LocalGas Distribution Companies Under Changing Industry Structure." Columbus, OH: NationalRegulatory Research ~tu, te",Q'lRRI).NRlU,91-10,.,~xn.be""",r",'•.. : ',_, .. :: /, .. '.' .. ,-,'.. ..', : "'," .-:e',. :.. ~·c ',','. -: •. ;".;'" < " , . '.' " c'. ' " ::', ' .. :"< '. 'M' , .. ::.',.>' ': :: .:,< ·~:·"'.····,y",:»·':.':.':, "..
Hatchei~b.B.•aridA. R. T~ilig~ii;992."S~:R,~gu.atOry~e.iges JortheNllti1ral Gas Industry inthe 19908and Beyond." Occasional Paper i115. Prepared for the National Regulatory ResearchInstitute (NRRI). NRRl 92-10. ?une.
Heaghney, K.J. 1992. "B~fore'th~PubliCService Co~~ioIl-Ni~glU'llMohawk Power Corporation."Direct Testimony. '
Heintz, F. O. 1993. "Reflections About State Policies in a Post.;(:)J.der636lEnergy Policy Act Era."P1;oceedings. Conference,on,~Q/Hrol~ f{~e, SIa,te,1l.~8.ultJt.io":,(J~/19rJce;t~~.!CZS ,in the Post636/Energy Pol,icy A,ct,,Era.C,'"O"NF':9302,',89,'W, ,ashili"",.",ito, D" , DC":N"a,'tio~ Associ"atibnof RegulatoryUtility 'Commissi(,ners/I)ep~~tofEn~rgy. p.'·064-07S:'Apl"i1 26. ' ".., ,
',..•.. ,_ .".,.c .... ,"."' ..... 1
Hemphill, R. 1989. "Reliability '~es in the Least CostProvi~iori of Natural GasPlllnni~g Process."Center for Regulatory StUdies. December 6~" .,. ', .'
Henken, :R. ~,99j. "H~ging with F~," E!eFc PerspeC!ives., ~ptemberIOctober.
Hiebert, L D.• R. C. Hemphill, and M. J. Mo~y. '1992. "Gas ReliabilitYWithin a Least-Cost PlanningFram~worlc.'"A .Working Paper Prepared for the 1UinoiS'DepQrtnie1il of Energy and NaturalResources. Revised December 29.
Hill. L. J. 1991. "Comparison of Methods to Integrate DSM and Supply Resources in Electric-UtilityPlanning." Oak Ridge, TN: Oak Ridge National Laboratory (ORNL).' ORNLICON-341.December.
Hirst. E. 1988a. "C~tin~ Viable, Utility. eonservllti0nlLc:wJ•Management Programs~" ~~rgy, TheInternational JouiiB;ai. 13:1:,33-44. ... . . ,

Hirst, E. 1988b. "Regulatory Responsibility for Utility Integrated Reso~ J.»1~g. ".Oak Ridge, TN:Oak Ridge National Laboratory (ORNL). ORNUCON-249. january.
Hirst, E. 1992a."Effects of Utility DSM Programs ()n Ris.k.:"Oak Ridge,'I:N: Oak Ridge NationalLaboratory (ORNL). ORNUCON-346. May.' .
Hirst, E.1992b .."A G()OdIntegrated.Reso~P~:.G1Iidelines forEI~~#cUtilities~d :I$:egulators."OakRidge, TN: Oak Ridge National La~I}'(ORNL):()~CON-354.December.
Hirst, E.,B. priver,andE.~lank.199t .. "Trial~y Fire: A Sensi~leIntegratedReso~~!8IlDing Rulefor Electric Utilltie$."BoUlder, CO:.Land andVVater F,Und()f the Rockies. DeCember.
Hirst, .E., C·...GoldlDall,.and.¥. E.lIo?ldn~ .. 1991."Inte~ ~esource Planning: Elcrctric and Gas. Utilities in the USA." Ulilitiespolicy. 1:2:172-186. JanUary.
Hirst, E., and J. Reed. 1991."HandbookofJ;:"llluationofU~it)''pSMPrograms.'' Oak Riqge, TN: OakRidge National Laboratory (ORNL). ORNUCON~3..36. Dece.inber.
....... > 'c' 'c' ,';\ :,.: /, c,., : ,..~':. ,":.:''';-,:', ',; ," .. .. .. ..
Hirst, E., and ~. Sch~eitz.er.. ~9~8. "p~~rtaintyin h<?~~:I~f,Dl.~~~:p!8IIDin~for Elec~~J]tilities. "Oak Ridge, TN: Oak'Ridge NatIOnalLaboratory (ORNL). O~Cq:N-272. December.
. .. .Hobbie, L. 1992."FueISwitc~g:A ~inning S~tegYJorCoreb~~~n lJtilities." p[oCf!edings.
Hobbs, B. F. 1991. "The "Most Value" Test: EcOno.mcE"ai~tiol'l of Electricity Demand-SideManagement Conside~g~~~r Vl,lliJe·".~ ffrff'J!.l0u,!",l. ..17:2:62.11:
HoItherg, P. D., T. J. Woods, M. L. Lihn, andA. B. Koklauner. 1993. "Baseline Projection Data Book."GRlBase!i"e Projection .oIP.S. E'Wg)' SYfJPly.anf1lJemand1o 2010•.Washington, DC: GasResearch InStitu.~ (GRi):Volulne 1. .,. .
.. .. ', ... " ' .. '.... "", .. ,.. ..
Hornby, R. 1991. "CaIculatillg the\Talue of Av"6idedGasR.eqriiremellts:Methods. and Results."Proceedings. National Conference on Inlegrared ResourCepumning. Washington, DC:NationalAssociatio~,of,Regulatory UtilityCo~~ioners (Nt\.ltug.pp. f~I-257.April 8.-:10.
~,' .. .... .... .. '-,':""":-'" -', .: '-', ',,'''.:.::'' ,:.. " ,' ·.c·.· ,,<,. :':,_,",,:. ",' , ',: ',: : ,.,:,.::: " ",.' ,,': , . ',',-.: :':0",',
IlIinoisColnmetceCoInmission (Icq~ '1993.."SuPPo~ HB1771:RepealRed~~t Natural Gas PlanningRequirements. " ' .'. ., ..
Jaffe, A. B., and J. P. K8It.1993."Oversight ofRe8UIatedUtilities'FbeISupply'CoritractS: AchievingMaxiDlumBenefi.t.FromCompetitive Natu,~ Gas antiEmission Allowance :Markets." Cambridge,MA: The EconomicSResource Group. April.
Jensen, V.R.. 1992."Remem~ring Reliability in 'GasIntegra~ ~esourcePlanning. "Proceedings. 1heNARUC Subcommilleeon Gas 11llegraredReSourcePlanning•.Novemi>er 15.
Jensen, V. R. 1991. "IUinois' Experience withh,ltegrated Re5()~Planning for}-DCS .••.Pr0ceedings.Third NARUC Narioluil Conference on lriie,griitiiJ. Ruoiirce Planning. p. 42-43. April 8.
-',' "', ..... :.," .. -.'... , ..... ,. ',', .... " ',.,,-' ... "" -";'
261

Jensen, V. R. 19,93. "Does Gas Integrated Resource Planning Still Make Sense'?" Presentation. NaturalGas Stminar. Denver, CO. May 20.
Jeppesen, J.C., md}4. J. KinS. ~993. "Effective Measure Life md Other Persistence Issues in DSMPrograms." Final Report.' Oaklmd, CA: Synergic Resources Corporation. SRC Report No.7729-R4. Jmuary 15.
Joskow,~. 1988."Testlrilony,Beforetbe SubcOmrIlitteeonEnergy arid Power mdtbe House Committeeon Energy m,f Commerce." March 31.
,- .. ..".. .... '. .. .. . .,'.~
J6sk()w",P~L.,'md D.B.M~n. 1992.••What DoesaNegawatt;~#I'yP>st'? E~idence from Utility. " Conservation Programs." The Energy Journal. 13:4:41-73. '
.. .. .
Kahri.:'A.E. 1991a."An Ecb noIl1ic8Ily·Rational, Jipproach "tQLeast-CosLPl~g." The ElectricityJournal. 4:5:11-20. 'rUne.
IGilin, A.E. 1991b. "RebuttaITestiDlonyB~foretheFlor1da. Public Setyjce ¢ompany in Tampa ElectricCompmy." Doc1a:t No. 91()88J-El. Filed Novemt>er2(). " " "
~, E. '1988.EiectrictJti~""f~nin~, dndRegulo.tion.Ari1eri~~i~wicilfor ,an Energy-EfficientEconomy. Berkeley, CA..
KaIui, E. 1989."ProllyPI,ilif Valuation MethOdsf6r Demand':SideUtility Planning." Energy, TheInternational JournaL 14:1:9-21.'.'
Kahn, E. 1992; "IntegratiIlg Market PrOcesses inioUtilit}rResource Planning." TheElectricity Journal.5:9:12-23. November.
':'." .,' ".:. .. .•........... ::.;.... :. ",::, ':c:,'. .: .. '. ., :>. ...• '.:: :.... '. .:•. :' .. : : '.: : , : , " .. ':." :. • .' : , -:' '." "'.
'Kaul, J., md S. KiIml. 1992. "Fuel Switching:WbYJt~hgul~,~ :p~ne, 'WhYl~Jsn't Done, and WaysRegulators Can Address It." Proceedings. Fourth NationalConfe,:enc~ on Integrated ResourcePUJ1UI!ng. Wasmngto!l' DC:l'lsti()!laI Association of Re~'at()ry Commissiollers, (l'JARUC). pp.478-483. September !~.
Klausing, T. A., W.G. Atterbury,D. prock11oVv,B. SwartZ, aridG.No';i.ko'w~. 1992. "GRI/YorkEngin~I>.,~v~n~~idential G~;!~~t Pump ••• Proceedings.l~~J",ertJtlI;o~lGas Researchelmference. Gas ReSearch InStitute tGRI). November 16-19. . .' ' ,
Kra~ •.r.,andJ ••E~:198~. ".Least-fllstPlanningHaJldbook fo'fPul>licUtilityCQmmi~ioners: Volume2 ,- ,The DexDan~Side:.,CoDce~hiaI:,aJld,.Methodological I~es." ••\yasIiWgton, DC: NationalAssociation of Regulatory Comxmssioners (N~UC). ~J..-~472. ~mber.
Krauss, W., M: Hewett, and. :M,S. Lobe~tein. 1992...••CO lDD1e rcialGas Space ,Heating Equipment:Opportunit~~ ,to Increase Energy Efi?ciency.•• Minneapolis, ~~: Center for Energy md theEnvironment. CEUErrR:91-3-cM: April.
Kretschmer,:R., K. 1993. "Gas~tCo.St PIIl~ni,ng:A Clear1..oser inminois." Presentation. AmericanGas AssociOl;on'Anmuil Conference. Washington, DC. October 12.
262

Kushler, M., K. Keating, J. Schlegel, md E. Vine. 1992. "The Purpose, Practice, 'md Profession ofDSMEvaluation: Current Trends, Future Challenges." Proceedings. ACEEE 1992 Summer Study onEnergy Efficiency in Buildings. "Volume. 7. Program Evaluation. Washington, DC:AmericanCouncil for m Energy-Effici~tEconomy (ACEEE).,pp.7.1-7.29. Au~.
L'Ecuyer, M., C.. Zoi,m~. J.. S.. Hoffman.. l~3 .• "The,potential ~LAdvmced ~esidential SpaceConditioning Technologies f()~Reducing Pollutio~~d Savil1gCo~mers Money. " Washington,DC: 'Office of Air md Radiation, U.S. Environmental Protection Agency. April.
4mon,R. 1993.••.Service tQ.Residential.Mark~." .Proce~illgs •.Co'terenceonNatur"tGq.r Use, StateRegultition,and Mtirkn DynamicsinPhe .Pl!st6J~/Ener-gylJoliCY ...4ctEra, .CONF-930289.Washington, DC:National Association of Regulatory Utility Cominissioners/Department ofEnergy.p.527-529. April 26-28.
Leme~,M., andL.Piessens. 1992. ~ColI1pllrison~ffutegrarea Res9l1fCC<Planni'c1gNaturalGas VersusElectric Utilities. "Proceedings. NARUC-DOEFourth Nationai ConferenceonIntegrated Resource'ktn"ing. Washington,DC:National~iation ofRe~atQry VtilityCo1DD1i~io~ers.(NARUC).September 13-16. . ' , .
Lobenstein, M. S., and'M. J. Hewett. 1991. "Commercial GasC(x,king Equipment: Opportunities toIncrease Energy Efficiepcy." ,.cglJElTR9! -1-fM •.'Decer.nber.
Makholm, J. 1993. "FERC Order No. 6361U1dlr1te~ratedResource Plan~i~g." h'o'ctiedings. Natural GasInt~grated R.esource.Planning ..Workshop..Nevv .York. ~ta~Energy ~e&earChandDevelopmentAutho.rity (NYSEIWA)and}\{~York.G~ .Group. OctQber,;l9-3().
Mamay, C., md G. A. Comnes. 1992. "California's ERAM Experience. Regulatory Incentives forDem(l.ntJ~~ideManagpnent·.Nadel,.<ReidmdWolC()tt, ,ed. American Council for mEnergy-Efficient EC()~()IllY(ACEEE):Bc:rk~ley,CA. pp. 39-62.
Marple, C. J. 1991. "Weather Normalization Clauses." Arlington, CA: American Gas Association. FA91-2. June.
Marple, C. J. 1992. "Weather Normalization: A Status Report." Arlington, VA: American GasAssociati()n.FA 92-2.SepteIIlber.
Massachusetts Department of J>ublicUtilities (npU) .. 1990. Decisio" D.p'. U. 9fJ-17/18/55.
Meier' A.. K., J. Wright1 and A.,H..Rosenfeld 1983,. Supplying Energy Through Greater Efficiency.University ofCaiifornia Press. Berkeley, CA.
Misuriello, H., and M. E. F. Hopkins. 1992. "Research Opportunities to Improve DSM Impact.Estimates."ResearchReport Series J. Washington, DC: The FlemiIlg Group.P~pared Jor theCalifornia Institute for.Energy Efficiency (ClEE).,March. .
Mitchell, J. S. 1993•••}tisk Management Flexibility ..with NYMEX N$tural q~Op~()ns."Natural Gas.9:11:1-7. June.
263

Moran, D. 1992. "Comparing Gas and Electric." News Digest of the American Gas Cooling Center(AGCC) Cool Tunes. 3:3:1-15. OctoberlNovember.
Moskovitz, D.1989. "Profits & Progress Through Least-Cost Planning. " Washington, DC: NationalAssociation of Regulatory Commissioners (NARUC).November.
Moskovitz, D. ·1992.. "Why. Regulatory Reform for DSM. " Regulatory Incemi vesfor Demand-SideManagemem. Nadel, Reidllnd Wolcott, ed. American Council for an :EnergyEfficient Economy(ACEEE):Berkeley,CA.pp.1-19. .
Moskovitz, D.,e. Harrington,aIld T. Austin. ·1992. "Weighing Decoupling vs. Lost Revenues:Regulatory Considerations." ..1he.Electricity Journal. 5:9:58-63. November.
Moskovitz, D., and G. B. Swofford. 1992. "Revenu~;.Customer Decoupling."Regulatory Incemivesfor DenJand-Side Managemem. Nadel,. Reid and Wolcott, ed. American.Council for an EnergyEfficient Economy (ACEEE): Berkeley, cA. pp. 63-77.
Nadel,· S.• 1990. "LessonS'I..earI1ed:AReview of Utility Experienee witbCoD~rvation and LoadManagement Programs for Commercial and Industrial Customers. " Washirigton, DC: AmericanCouncil for an Energy-Efficient Economy (ACEEE)~ Report 90-8. April.
Nadel, S. 1992. "Utility Deinand-SideMariagementExpenencemd P6tential -A Critical Review."Annual Review of Energy and the Environmem. 17:507-535.
Nadel, S.;D.Bourne, M;Sbepard,t. Rainer,andL.S~~.1993a. "Eri1ergU1~Iechnologies to ImproveEnergy Efficiency in the Residential & Commercial Sectors;" American Council for anEnergy-Efficient Economy Davis Energy Group E-Sou rce •P400-93-OO3.January.
Nadel,S., J. Eto, M. KeUey,andJ. Jordan. 1993b•."GasDSI\{llDdruel-~witching: Opportunities andExperiences." Draft Report. Washington,· DC: American Council for· an Energy-EfficientEconomy (ACEEE). February.
Nadel, S., M. Reid, and D. Wolcott 1992. Regulatory Incemives for Demand-5ide Managemem.ACEEEINYSERDA. Washington, DC.
Nadel, S., and H. B. Tress. 1990. "The AchievableConsetvation Potential in New York State FromUtility DelD1lDd-Side Ml!ffilgementPrograms~"FinalReport. Was~gtoJ1' DC: AmeriClUiCouncilfor an Energy-Efficient Economy (ACEEE). Report 90-18. 1064-EEED-AEP-88. November.
NARUC Staff Gas SubCommittee.1990. "Considerations for EValuatulgLocal Distribution cbJiJpany GasPurchasing Choices. " Washington,DC: National Association ofRegulatoryUtility Commissioners(NARUC). November 12.
National Association of Regulatory Utility Commissioners (NARUC). 1992. "Utility Regulatory Policy inthe United States and Canada: Compilation 1991-1992." Washington, DC.
National EConoMicResearcb Associates Inc. (NERA). 1977. "How to QuantifyMarginal Costs: Topic 4. "Prepared for the Electric Utility Rate Design Study. #23 NERA Topic 4. March 10.
264

Nati()~ Petroleum Council. 1992. "The Potential for Natural Gas in the United States." December.
National Regulatory Research Institute (NRRI). 1993. "A Synopsis of The Energy Policy Act of 1992:NeVIlTasks,for State Public, Utility, ,C()DlIIlissions." .Columbus,OH::NRRI. NRRI 93-7. June.
Natural Gas Council (NGC). 1993. "Gas Industry Initiates Reliability Planning Regions." Press Release.October 6.
New Jersey Natural Gas Company. 1993. "Incentive Ratemili~g Plan: Petition. Docket No. GR9305 J.Bef~re th,e,Sta~ofNew"JerseY Department ,of Envi~I1m~ta1 Protection. and Energy Board ofRegUlatory COimnisSioners.May. . . .,
New York PublifService Cooup.i~ion"(NYPSC)~1~2."prder c:oncep1ing 1~~3and.1994.Demand Side. PlanS andHlECA BusinesSPlans." Deeemrer 16.
Newman, P., and J. Kaul. 1992. "IRP for Gas." Proceedings. 4th National Conference on [RP.WashiIlgton, DC:National As5C.lCiation,of Regulatpry Vtility 9>JI.UDissioners(DepartmentofEnergy;
Newman, ,P~"C.. ..,1993~"..••h1tegrated Reso11rcePlanning .,Pri.rl~ipl~.,'.for .•Na,tu rld. Ga,s "DeJ;I1aDd-SideManagement 'Policies: How'not to Reinvent the Wheel. " .Staffmemo. Wiscpnsin Public UtilitiesCommission. .
.'Nilsson, H. 1992. "Market Transformation by TechnologyProCurementandDelOOnstrafion~"Pro"ceedings.'. ; . ACEEE 1992 Summer StUdy on Energy' Efficiency In Buildings. W~~gtOn, DC:American
Council for aDEnergy-Efficient Economy (ACEEE). August." .
O'Neill,R: P.;'C.S. Whitmore, and G. J.Mahrenh()Iz: 1992. "A C()mpari'sonof Electricity and NaturalGas Markets and Regulation in the USA." Ut!lities policy.~2Ci4,:,,227.July.
Occhionero, A.J. 1993. Southern CalifC)rniaGas Company.,Los Ang~les,Ci\., P~rsonal CommllJ!ication.~., ::.,:: '. . :,: .." : ,.......,...'.:> '.. ' .. " .. ': ".., >: ,'" ,' " ':', ..:. "', '" , ,... '.:.; .. ,.. ..', " .. ','" .. '," .. ,',.... .. "." .
Ontario Energy Board. 1991. "Report on Gas Integrated ReSourcePlarining.'; SciptJmber 16.
Oregon Public UtilityCoD1rr1iS!;i?~(ptiC).,1991a.~Let~rtoNa~ral Gas.~d ~lectricUtiIlties, Regulatedby the Public 'Utility COoimission." October 1.
Oregon Public tJtilityComlTlissi()n(PUC).1991b. "ODOE/OPlJC Fuel SWitdiirigAnalysis: Observations. 'and Policy Implications." Staff Report. August 6.
Paul, D. D.,'Y' J. Sheppard, G. R.\Vhitacre, R.D. Fischer, A. L. Rutz, ,D. W. Locklin,J. J. Crisafulli,(7. H.Stickford, J. G. MUCOlY,D.,K. Landstrom, S.('. Talber, A. R. Bullr, D. W. DeWertb,C:A. Farnsworth, R. .L.Lori~, .andJ.A.Pielsfh.1991."J\ssessDlent of Technology forIDlproving the Efficiency of Residential Gas W~ter lIeaters." Topical Report. Columbus, OH:Battelle. GRI-9110298. December.
265

Penney, D. S., .andJ. A. SmitbJr. 1987. "Determining an Optimal Gas System Peak Day Gas DemandCriterion Using Decision Analysis: The Recurrence Interval Study. "Proceedings. PSIG AnnualMeeting. October 22-23.
Peoples Gas Light and Coke Company. 1991. "Inaegrated Least Cost Plan." vol. 1 - Executive Summaryand Main Report. January.
Phillips, C. F. 1988. The Regulation of Public Utilities: Theory and Practice -Second Edition. PublicUtilities Reports,. Inc. Nlington, V1\. July.
Pindyck,R. S.,and D. LRu1>eDfeld1981.EconOmemcltlode#andEcolwmicForefllfts ..McGraw-Hill.2nd Edition. . . . ..
Pecino, M. c.1993."6rder 636 -SelectedJnmscript." Pr0ceetiing;. A(;AS~:&(JredForum of GasUtilityExecutives and the FinancialCommunity. Arlington, VA:American GasAssociation (AGA).May 3.
-." ..... ,....
Prahl;R..,lmd J. Sfhlegel. 19~3."EvllluatingMarke(f~forma.tlon. ';'Proceei#~gi:J.993 InternationalEnergy Program Evaluation Conference. August. . '0, ...
....... ,', ' .... ' ,', .'" -., .. : .....•.. " .. ,' ',' ',-: -':" : ..•.. -,.
.iPi.1blicService Comm;S§ionofWi~!;ISin. (l?SCW).. 1993: "Wo rle .Gr;ol.1pR.eport.()n1\{~~ GaSRegulationin Wisconsin.;' JUly." . . " ....
Raab, J.,and. ~~ ec)\vart ...1992. "F,uel..S~tc~gin Y~~t:}·~gIllatic~ers .tQId,eolqgjca1.Issues."'Pr0ceeain,gs.Fourth. flailo1UJl.·r:o.nft!7'~nce..i).n I"Je. gr4l.ed ]f:eso,~ce<l'lannin,g·· Washington,DC:National Association of Regtll.aory Villity. 9>rIlTi~oll~rs' ~~U9.
Raab, ..J., an~M:. Schvv~i~r .. 1992.. "PubH?~y?lvement .in.Inte~tedR.-e&9~PI31lDing:A Study ofDemand-Sid~ ¥anagement 8>~l,~~ra~ves." Oak Ri4g e ,TN: .g~Rillg~National Laboratory(ORNL)~ ORNilCON-344. February. . .
Rallb,P: 1991. "Lettert() the editor in replyto1he Electricity Journai 1991, 'End-Use Fuel-Switching:Is it Fair?' •• 4~8:38-43. October.
RCG/Hal:ler, B~lly ~R .. t99l :"Integrated.Planning, DSM EVU.~fi~~.~.;~d9>st Rec<l>,er,y}sS11esfor GasDistribution Utilities .••Prepared for thePlanning an~~lysisGroup, J,\.:Inepc:an-GasAssociation.
Reid, M. 199~..:.Ratebasing ofDSMfxpenditures." RegulatorylnCf!1YJVff.f0r.Demanti-Sidei4(Ut(Jgernent.. Nadel, Reid' and Wolcott, ed. Americ:aneou.ocil. for. an EllergyEffici~tEcpnomy' (ACEEE):
Berkeley, CA. pp. 79-124. . ..
Reid, M. W.,andJ. H.Chamberlin. 1990:."Fin~ncial ~centiv#.for PSMProgram,s: A Review andAnalysis o.fThree Mechanisms." Proceedings' ..A.9¥E 1990S,~§.tudyonEnergy Efficiencyin Bui14ings.. Volume~ •.Waslililgton, D«::AJnrpc:an ..Council. for an.~ne~~Y:Ffficient Economy(ACEEE). pp.5. 157-5.166. June.
Ruff, L. 1992. "Equity vs. Efficiency: Getting DSM Pricing Right." The Electricity Journal. 5:9:24-35.November.
266

Samsa. M•.1993. "New and Emerging Gas Technologies.". Proceedings. Natural Gas Seminar. PublicUtilities Commission of the State .of Colorado. May 18-20.
Samsa. M. E.• and W.F. Hederman. 1992.':'Gas Utility Resource Planning: How Far Does the ElectricAnalogy Go?" Public Utililies Fortnightly. p. 40-42. October 1.
Schlegel. 1., 9.Ed~ar.R.Prahl.M.Kushler.an4 D. N~.1993 •. ':'EyahJation.of DSM~hareholderIncentiveMechanisms." FinalReport.Madison. WI:WisconsinEnergy Co~rvation Corporation.lanuary 8.
,. . . ",' ,', ','
Schl~gel.l .• R. Prahl. W.DeForest. andM.KushIer.1992. "~Ms.rlcetsBeing Tnmsfo~ by DSMPrograms?" Proceedings. NARUC-DOEFourth' Nati~~ Conference on Integrated ResourcePkznni1}g.Sep~mber.13-16.
Schlegel.} ••j(P~.andM.Kushler .1991. "¥e&mrement in .tp.~Ag~'of~~tiyes." Proceedings. TheEvaluation Conference.
StQIl.H..,G.• L.l. (Jarver.G.A.lordan. W.,W.Price.R~ M. ~igley. R. S,SfC~.AAd,l. B. Tice. . 1989:feast-:Co~t.ElecmcJli;lity.~.~ni'J.g ..l.;Qb Wiley~~ns. Ne~ :¥o* ••NY.· .
• • ,', _, .. ;. '. '. ", . .0 ',., . • .
:.', .... ',.' ",':, . ,.. ', . :" ',. ":,':, "....., .':' ,,' ':. "" ," .:>, .... :::,.,', ',:. ;.: ..... ' ,', ' '::,::::. .... .: ',',:";,';";-" .. , >.:".
Stone & Webster.' 1989. "Methods to IDtegrateDemand and' Supply Options and an Evaluation of LeastCost Plll.DDjngModels."Englewoo4.CQ: PE-FGOk8Z~E27478 .•~pri1.
Stutz, 1.• G. McClain. R. Rosen. and D. Samuels. 1993. "Aligning'Rate])esignPoli~ies with IntegratedResolllCePlanning·"· \\,as.hing~~>n,:PC: Natiql}JllA.ssoc;illtiqnq~:Re~latoryqtili~ Commissioners(NARUC). , 92-047.· . .
Sutherland. :R.J •.1993..••EconQD1icEfficienc,y.•IRPs andLpng TeI1DContracts." Proceed~ngs.WestemEconomics Association Meetings. JUne 12. .
, /'_::-".:.: .-,' ,.','.. - ..,>';,:,, " 'I ..
SYnergic Resources Corporation (SRC).. 1991~"Sputhwest.(J~ CQlpOrationl~90So~them NevadaResource Plan." Revised Demand-Side Maiuigement plQn.slit ReportNo. 7618-R1.April .• " c· .. ', , ,", ..:..: ':."....... : :.;
Te.hiJi. R. s.1993. "Letters to th~Editor: DecouPling? Not So Fast. " TheEkarl,dty Journal. 6:2:2.March.
Tempchin. R. S.• and D. White. 1993. "The Slippery Slope ofl'uel Substitutiqn.7!M,glectricity Journal.p. 27-33. July. . ".
Thomas. 1. R. 1993. Personal Co~ri,unication. Let.~rto theWisconsinPSC •.March 17.
Tussing, A.R. 19~3.,••F\Uldament&llsofUtilityGas-Ac,q~~ition.Strategy for tpe1~~.(In§POWords orLess)." ProCeedings. ConferenCeon Natural Gas Use. Suite Regulation, and Market Dynamicsin l. he Post 636..lE.nergyPolicy Act Era. CONF-93OZ89.<»I..,. ashin8tQ.n•.DC.;Na~.·onal.. Assoc..... iation of
, >." ,., ..::: ,"-."" : ::.:' ' "" " ' '.:- ,:., .• (, <:"<'," .. .. ., , -,••.: <.: ::.:.,,:. ·c··"·-:·:·· '·-·: .. ', :,.., ,.:,< •. c'-,,::: <OJ_. ':','''',',':
Regulatory Utm~ CommisSionerslDepartment of En~gy.p 102-103.,.Appl.26-28.
267

U.S. Department of Energy (DOE) and the National Association of Regulatory Utility Commissioners(NARUC). 1993;"Conference on Natural Gas Use, State Regullltion, and Market Dynamics inthe Post 636/Energy Policy Act Era." Proceedings. CONF-930289. April 26-28.
Vermont Public Service Board (PSB). 1990. "Order in IRPDocket No. 5270. at 1-6 (emphasis inoriginal)." April 16.
VennontPublic Service Board (PSB). 1991a.' "Order re COmpliance Filing. "Docket no. 527D-CV-l and5270-CV-3;July 12.
Vermont Public Servicell~(pSll)., 1991b. "Stipulation on D~ign Principles and Program ElementsColJcemin~Fuel-SwitChing Programs." May 29. ' " ,
Vine, E. L. 1992. "Persistence of Energy Savings: What Do We KDoWahdHowC8n It Be Ensured'?"Pr0Cfetlin~s.ACEEEl992 SwnmerS~u4Y on EnergyEfficiencyin.BuUdi1J~s. Volume 7. ProgramEvaludtion. Washington, DC:American Council for an Energy.:Efficient Economy (ACEEE).pp.7.257-7.266. August.
Violette, D.'jandF.;Stem.l9?l.,,~ aI~on of Gas for Use'm Gas UtiIityIntegrated ResOurce Planning. "pfoce~in'gs. National Confere~ceon Integrated ResourcePlmming. Washington, DC:NationaiAssociation of Regulato!>, Utility Commissioners (N~UC). p.213-229. April 8-10.
Virginia StateCorPoratio~:Co:nfuissiol1.1991. Fi1UllO1'tler.'CasiNi£'PUJ::900053; In re: Priorities forAvaiUzhle Gas SUI'I'Ues.May 1.
~: . ,- . . _. ". ',:,: .• ' .." .' -. : : .. : .." _. ::. '_ .. " ;'_ .. .. : .. ':.": .. _. _. .. .. .. .. " _. _.:.... .. _: .. .. ::.... ..: .. " _" '"._ :'... // c '- _ ' .. ".'_...... c_ '. :: _.. .. .. _ -'.. :'.•
Walrod,] .1.992. "IDtegrate<fResOUrce Planning: The G8sH~Pump Option." XENJ;RGY Inc. Preparedfor the American Gas Cooling Center. October. "
Wang, X. '1993. Dan Hamblin &J\ssociateS. Conwliy,Ak.Petsonal Coomiw1ication~
WashingtoJiGas Light C<>' 1992. "Integrated Least Cost Plan." District,of Columbia Divisio~. Volumen of XII. FollDlll CaSe No; 834, Phase m. October I.' "
Washjngton Natural, Gas. 1992. "Least Cost Plan." Technical Analyst;'. Volume n. September.Washington State Energy Office (WSEO). 1993. "Fact Sheet: Puget Sound Fuel BtirldIntegrated Resource
PI~?jng P~~ject." WSEOContract, Number 93-03. M&l1tinMarietta/Oak Rid,s,e Nationall.llbomtories Contract #95X -03372V. '"
Washington Water Po\Ver COmpany (WWP). 1991. "Mans.~gNllturai GasResources, Optionsfor theFuture: Volume 1: Least Cost Plan, ExecutiveSuiriInary:" January. '
WashiB1gtonWafur Power COhtpallY (WWP). '1993.~1993Natural Gas InlegCated ReseurcePlan.". .... -
Weilistein,p.'M.,andJ.P .PJleifel11)erger. 1992. "Fuel Swi~hing and Demand-side Mallagement. " Public.ultiities Fonnightly. May' i.'. ", '
268

Western Area Power Administration (WAPA). 1993. "Integrated Resource Planning: Module 2."Proceedings. Loveland Area Office. May 10 and U.
White, K. 1981. "The Economics of Conservation." IEEE Transactions on Power Apparatus and Systems.vol. PAS-l00.pp. 4546-4552.
Wiel, S. 1989. "Making Electric Efficiency Profitable." Public Utilities Fortnightly. July 6.
Wiel, S. 1991. "The Electric Utility as Investment Bank for Energy Efficiency." The Electricity Journal.pp. 30-39. May.
Wisconsin Energy Conservation Corporation. 1993. "Evaluation of DSM Shareholder IncentiveMechanisms." Madison, WI: Wisconsin Energy Conservation Corporation. January 8.
Wisconsin Public Service Commission (pSC). 1989. "Findings of Fact, Conclusions of Law and Order."Docket 05-EP-5. April 6. .
Wisconsin Public Service Commission (PSC). 1991. "Findings of Fact, Conclusions of Law and Order. "Docket 05-Ul-10J. October 10.
Wisconsin Public Service Commission (pSC). 1992. "Findings of Fact, Conclusions of Law and Order."Docket 05-EP-6. September 15.
Wolcott, D. R., and C. A. Goldman. 1992. "Moving BeyondDemand-Side Bidding: AMore ConstructiveRole for Energy Service Companies." Proceedings. ACEEE 1992 Summer Study on EnergyEfficiency in Buildings. Volume 8. Integrated Resource Planning. Washington, DC:AmericanCouncil for an Energy-Efficient Economy (ACEEE). August.
269

270

Glossarv
Action Plan - A component of a utility's integrated resource plan, describing specific utility actions in the short-term (about two years) to meet supply- and demand-side objectives of the plan.
Annual Fuel Utilization Efficiency (AFUE) - Efficiency measure for gas heating equipment based on testingprocedures defined by the Department of Energy.
Avoided Cost - Incremental cost that a utility would incur to purchase gas supplies and capacity equivalent to thatsaved under a demand-sidemanagement (DSM) program. Components ofavoiged CO~tmay include energy,capacity, storage, transmission and distribution. Avoided cost has been used as a yardsticlc to assess and screen thecost-effectiveness of DSM programs and supply-side resources.
Base Load - As applied to gas, a given sendout of gas remaining fairly constant over a period of time; usually nottemperature sensitive.
Base Rates - Gas utility rates designed to cover nQngascosts. See also Purchased"Ga,r.AdjuslTTy!nI (pGA) Clauseand Nongas COSIS.
:Bd' - 1,00Q.00Q,OOQcubicfeet; billion cubic .feet.
:Bri.tish Thermal Unit (:Btu)~The amount of heat required to raise the temperature of one pound of pure water onedegree Fahrenheit understated conditions of pressure and temperature.
:Broker -A personacting~ an agentJora buyer or seller of gas in a transaction .. The broker does not assume titleto the g~.
:Burner-Tip - Generic term commonly used to indicate the ultimate point of consumption for natural gas.
:BuyouuBuydown - Th~ costs of contract realignment by a pipeline COQlPany. Specifically,theYJ"epresent thenegotiated costs of altering or walking away from cOntracts.
Bypass :-Constructionofaphysical connection between adargeend.1,lSer and.a supplier, other ~historicor~mmon suppliers, when the ~nomics dictate;. that;is.the systemsupplypri~o(the local utility supplier is higher'tlJan· the total price of off-system. supplies available through themaQcel.andsq>arate ~rt of the purchase .viathe alternative (bypass) delivery point.
Capacity, Peaking -The capabijity of facilities or equipment normally used to supply incremental ,gas underextreme demand conditions; sometimes available .only for a limited .number of days.at a maximum rate.
Captive Customer - Natural gas user who cannot readily leave or switch a system supplier due to physical oreconomic factors,availabilityofal~tive fuels, or lack offuel-switchingcapability .. See also Cor~;Cuslomer.
Casinghead Gas - Unprocessed natural gas containing natural gasoline and other liquid hydrocarbon vapors'produced.from oil sell,,' Synonyms; ,Wet· Gas. Assoda1edGas (but MImi wet ga.sora.sso~iared gas is, casingheadgas).
271

City Gate - Generally, a location at which gas changes ownership, from one party to another, neither of which isthe ultimate consumer. It should be noted, however, that the gas may change from one system to another at thispoint without changing ownership. ALro referred to as city gale station, town border station, or wholesale deliverypoint.
Combination Utility - A utility which supplies both gas and some other utility service (electricity, water, etc.).
Commodity Price - The current price for IIIsupply of DlIlturalgas, charged for each unit of gas supplies, asdetermined by market conditions or tariff.
Compression - Increasing 'the pressure of gas ina pipeline' by means of a mechanically drlven compressor stationto increase·.,flowcapacity.
Compressor Station - Any permanent combination of facilities which supplies the energy to move gas at increasedpressure from fields, in transmission lines orinto.storage.
Conservation Supply Curve - A graph showing the quantity of energy savings of individual efficiency measures'on the X-'axisand the totafcOst-per-uDit..of-energy,saved'onthe Y-axis.
Contract Demand (CD) - The maximum daily, monthly or annual quantity which the supplier agrees to furnish,or the pipeline agrees to transport, and for which the buyer or shipper agrees to pay a demand charge.
CoreCustomer.- Customer designation originally defined in Califomiato represent smaller customers withoutalternative fuel capability. Typi~lly made up of residential andsmallcommetcial classes.
, CostAllocation - Distribution of functionalizedfacility costs and operating expenses torilte classes or otheridentifiable customer groups on the basis of peak demand and energy use characteristics of the customer groups.Allocation may be calculated for historical or future periods and may be average or incremental for that period.
Cost-of-Service - Total cost of providing utility service to a system or to a customer group including operatingexpenses, depreciation, taxes, and aretUm on invested capital. ' .
Cream Skimming - Designing and implementing only a limited set of the most cost-effective DSMmeasures whiledisregarding 'other cost-effective opportunities. Cream skimming .becomes a'problem when 'lost opportunities arecreated inthc'process, which means'that itis either uneconomic and/odmpractical toretum at a later time to thatfacility toimplemei1t additional measureS that Werecost-effective at the time of the initial site audit. SeeaLroLostOpportunities.
Cubic,Foot (d') - The most common unit·of measurement of gas volume. !tis the amount of gas required' to. filla volume oCone cubic foot at a temperature of sixty degrees Fllhrei1heit(60°F) and at a pressure offourteen.andseventy-three hundredths pounds per square inch absolute (14.73 psia).
CUrtailment - A restriction Orinterruption of gas supplies or deliveries: Maybe caused by production shortages,pipeline capacity or operational constraints or a combiDllltionof operational factors.
CUShionGas - The gas required in a reservoir, used for storage of natural gas"so that reservoir pressure is suchthat the storage gas may be recovered. See aLro Working Gas.
272

Demand-8ide Bidding - A process in which a utility i~es a.request for proposals (RFP) to acquire DSM resourcesfrom energY.service companies (ESCOs) and custOmers, reviews proposals, and'negotiates contracts with winningbidders for a specified .amount of energy savings.
Demand-8ide Management (DSM) - Deliberate effort to decrease, shift or iIic~ energy demand' throughorganized. utility activities that affect the amo.untand timing of gas use..' " ,'. "
Design Day - A 24-hour period of demand whicbis used as a basis for planning gas capacity requiremen:ts.
DSM Potential
TeduU~ :potential-Est~te0f possible energy savings based 011'tileassumption tIult~~~ti#gapl'li8ilc¥,equipment, building shell measures, and industrial processes 'are .replllCedwith.the ,.•~st.~fficientcommercially available units, regardless of cost, without any.significanl 'change in lifestyle:orouiptit::
Economi~ P~tential -Estirrnlte of thatPortion of thb"TechnicalPotezltialthat would~u~~II1in~'~tall energy-efficient options will be adopted and all existing equipment will be replaced whenever it i~'Cost-e(fective .to do so based on.aprespecified OC9nomic.criteri ll ,without regard. tQ.constraints suqb as.marketac<:eptancearidrate impacts. . .' '1,;. . '. . . • <; ........•. " , •
Achievable Potential - EstuDate6£ llID()iintof energysavings t:hat~oula &ciIr if~iCrist~ffeCtive, energy-efficient opti()nspromot~ throughutilityD~Mpro~weread()Pted'A.chievable J>0tentialexqlud~ .th0 seefficiency gains that willbe achie"ed through notmallDlU'ke,tforces.and bye~siin~ or futlU'estandinls orCodes.··· ..•.. - ,'. . .. ' •.. " ' ,", .
Mar.ket Potenti.aI. -.~t~Dlate ofthe.l'()~ibl~ eper gy~~l.Vingsthatwould~ur~use.of n?n,naI,JD8rketIi. 0rces. <.i.e.,likely customer adoption over time of various actions without aDSM proSram.)~. . .'. ". . '. ,..' ' .•....... : . :.............. .: :.•...... ,:.. '.' : ':: , : , :.:.,." -: ..::., ',"'," : .. '.,:-:-::, . '.',,, ' ..
EconolllicCa.rrying C~e:Rate(ECCR) - .A..method ofall~tingcapacity cos~ o"ertime in'surh a way thattheaml\uu value staysconstazlt in ~ terms.-··· " " .' '. ' .
Econometric Model - A set of equations, developed through'regressiorl aIlaly~islilidother quantitative techniques,tbat Dla~emati~ly •represents. relationships .among.data.
oJ' ' '. "'. ,.. ",-'-."'-" ." '. ' '., "'. ,
Electric Fuel SUbsiitution-Progriun;;(~hichpiohiote;ffie~~to~' s..ch6ice.of b!ectric.serVi ee •{Qran appliance,group of appliances, or building rather than the choice of ~rVicefrom a different fuel. These programs increasecustomers' eh:ctric•.~ge an~ ~ec~ ,usag~ of an .alternative .fuel.
Energy"Efficiency options ~MeasUresor strategies that reduce energy CozlsuDlptionby SUbstitutingxOOre efficientequipment or operating practices without degrading services provided. .
EXteCnali.~es - Costandbenefitstha(~notaccoWJted for in.the market prices paidJoragood0~ service. Forexample; Costsof physical damage froxntbe presence of certain pOllutantsare negative environmentlil externalities.
Federal Enet;gy ~fl.ulf'tory Co~ission (FERC) -~ agen~y ()fthe DePartment of Energy(DOE)cltarged withregulation of mterstate sales and transportation of natUi-aIgas, wholesale electric rates, hydroelectric licensing andoil. pipeline rates.
273
.:'9.

Fmn Seniee - Service offered to customer!;,(regardless of Class of Services) under schedules or contracts whichanticipate no interruptions. The period of service may be for only a specified part of the year as in Off-PeakService. Certain firm service contracts may contain clauses which permit unexpected interruption in case the supplyto residential customers is threatened dUJingan elllergency. Compare 10 Interruptible Service and Off-Peak Service.
Force ~eure - An unexpected event or occurrence not within control of the parties to a contract which alters theapplication of the ~~ of a,contract; ,59D1etimesreferred to as "an act of God. " Examples include severe weather,war, strikes and other similar events. ' '
Free Driven - Customers who take recommended actions because of a DSM program but who do not hnpose '. cost()n the,pro8f!&Dl(~.g•• ~~Y 40~ot,cl~~ DlOlleWyincentives ~ffered by the program). Freedrive~ also includecustomem.that,~<:e tlte~(;()Dsi~tion of entqy efficiency innonprogram purchase decisions after theirparticipation in Iiutility p~ft, ", '
'~,J.Ud~ .' pSM program participants who would have undertaken DSM measures, even ,if there were no utilityDSMpio~, ,'" "',
, ..,' .'....... .. :': : .. ~.::~,,\ ,..
Gas FudSubstitu60n - Mo~ Which.pro~te the c\lSi()~r'~choice of natilialgas' sbrvice f()l,an,appliance.group of appliances, or building rather than the choice of service form a different energy Source. These programsincrease ~to~ ~~e of~~~~ l1Dc;ldefreasflusag~ptlUlaitemative fuel.
,GasInv~t41riC~~>(~I~).- A cbargeby;p~Pe1Aa~, ~forstm1ding ready to serv~salescus~mers. TheGas Inventory Charge IS desiped to prevent the ocCurTenceof take-or-pay liability by charging the customer forall the costs associated with maintainirig a gas supply. ' ,
GaS, Natunl,:.'i Il8turapy~~g~~8fhrd~x1llnd nonhydrocarbon gases found in Porous geologicformations beneath the earth's sUrface, often in association with petroleum. The pnncipal constituent is methane.
Associated - Free na~ gas' in "i~ate •contaCt. but not in,solution \\fithCi1ldeoil in the reservoir.
Dissolvecf - N~tuOllgIe ~" soluti~1lin crude oil.in ~e reservoir.
Dry - Gas whose water content has been reduCed by adcliydration process. GsS>conblining'little or nohydrocarbo~ co",~iaUY'J:ef9vera~!~ as liquid P,fO«!~chS~ifiedslD1l1lquantitiesof liquids are pen.nit~by varyingstatutori~finitionin ~~ sta,tes. ' " .,' .. ,'
Liquefied (LNG) - Natural gas which bas been liquefied by reducing its temperature to mmus260°F atatm()spheric pressure. It,u:emainsa liquid at -116OFlUld673 psig. In volume it occupies 1/600 of that ofthe 'Vapor. '
Liquids -Thoseliquidhy~n mixtures whicl1,are.Baseo~, at reservoir tempera.turesandpr.essures~ut ~ reco,,~rable I>Ycond~on or absorption. Natural gasoline and liquefied petroleum gases 'fall inthis category. " .
Noll8S§OCiaied-Free.na~gas notip contact ~tJ1, nor dissolved in, crude oil in th~reservoir.
Sour - Gas found in its natunll state, containing such amount of compounds of sulphurastriimake itimpractical to use, without purifying. because of its corrosive effect OD piping and equipment.
274

Sweet- Gas fo.undin its natural state, containing such snWl amount.of compounds of sulphur .th.atit canbe used without purifying, .with no..deleterious .effect on piping and equipment.
Wet. - Wet.natural gas is unprocessed natural gas.or partiallyp~ natural gas produced fromstratacontaining condensable hydrocarbons. The term is subject to varying legal definitions as specified by ce.rtainstate statutes. (The usual maximum allowable is 7Ibs./MMcfwater content and .02 gallonslMcf of NaturalGasoline).
Heating Degree.;Day -Ameasure of the ColdneSsoithe \\i~ther experienced, based on the extent toWhichthe dailyaverage temperature falls below a baseline temperature, usually 650 Fahrenheit. A daily average temperature usuallyrepresents the sum of the high and low readings divided by two.
Hydrocarbon - A chemical compound composed sOlelyof hydrogen and carbbll: The cOInpo'UIldShavinga smallnumber of carbon andhydrogenaton'ls.in.their .lDOlecules.re.usuaUygaseous; those with a .arger number ofatomsare liquid, and the compounds wiilitheJargest number of atoms.aie ..solid. . .. '
Incremental Cost - In economic analysis of DSM,' difference in price betweenanefflcient'tecl1nologYcirmeasureand the alternative standard technology.
Injection - The process of putting gas into a storage facility. Also called liquefaction whenth.e storage facility isa liquefied natural gas plant. !. , .. .
Thtegrated .ReS6ui"ce Pla.ming{lRP)·· - A planning process, used by regulated energy'utilities, to .assessacomprehensive set of supply- and demand-side options in order to create a resource mix that reliably satisfiescustomers' short-term and long-term energy service needs at the lowest total cost.
Interruptible Service - Low priority service offered to customers under schedules.or contracts.\Vlllch~ticipate~dpermit interruption on short notice, generally in peak-load seasons, by reason of the claim of firm service customersand higher Priority ~rs. C;llS.isa",ailable at any Hme of the Yearif the supply is sufficient and the supply sys~mis adequate. Synonym: Nonftrm. See also Noncore.
Interstate Pipeline - Natural gllSpipelineC()mpany that is~gaged.~llthetrlUl5p<>rtation,by pipe!ine,.ofllatural gasacross·sta~.l)(nmdaries,·and is subject. to .thejuriSdiction of the ·Federal·Energy Regulatory •.Commission. (FERe)Under the Natural Gas Act. . .
Linear Programmi~- AJDathematical ..method of solving problems by means of linear functions where thevariables involved are subject to coilstraints.
Line Pack, Gas I)eliv~ from.- That volume of gas delivered .to the .markets supplied by the .net change inpressure in the regular system of mains, transmission and/or distribution. For example, the change in the contentof.a pipeline brought about by the deviation from steady flow conditions. Synonym: Pipeline Fill.
Liquefaction - Any process in which gas is converted 'from the gaseous to the liquid phase.
Liquefied Natural Gas (LNG) - See Gas, Natural.
Load DurationCune - An arraYof dailypeak-daysendo~~Observed that is soiled from highest sendoutday tolowest to demonstrate both the peak requirements and the number of days they 'persist. .
275

Load Factor - The ratio, in percent" of average load of a customer" a group of customers, or an entire system, tothe maximum load. Load factor can be calculated over various time periods (e.g., monthly, annual).
Load FOrecasting - Projections of customer energy and peak. day demand requirements on either a short-term orlong-term basis.
Local Distribution Company (LDC) - A utility that purchases gas for resale to end-use customers and/or deliverscustomer's, ~as supplie,s~~ in.lc(J;Statepipelines to end7"users' facilities reducing pressure from pipeline levels toappropriate' delivery lev~ls. .
Looping - The construction of a second pipeline parallel to an existingpiJ>elille over the whole or any part of itslength, lllus~9~io.g th~'alplCi~ of~~tionoftbe system.
;C:,::,::, ',"'>:'::"'; .:',/.:. '.'. ".,,".', "'.'. ".~"' ", ',' "," ,'.,"Lost Opportunities ~Efficiency measures 'A'bichofferlong-liyed" cost-effective Slivings iliatare fleeting in nature.A lost opportunity occurs when Ii customer dOes not install an energy efficiency measure that is cost-effective at thetime, but who~ ~laIlatiol1is 11Dlik~lyto ~ cost-effe(:tive Jater.
Mcf - A unit of volume eqUal to a thousand cubic feet; see Cubic Foot.
MDQ - M~mum Daily ~titY'
Mi\mtu - A unit of heat equal to one oilllion ~ritisb thellDlll unilll(Blll). It is al59 approximatelyeqllival~nt to 1'000cubic feet of gas. ., , .
~-.MMd - 1,000,000 cubic feet; miIli~n cubic feet; see 'Cubic Foot.
MMth- 1,000,900 thenns; see 1herm.
Margin -Revenues minus incremental operating expenses over the time periodspe;cified ,See also /VongasCosts,Base Rates.
MuIti-AttnblJ~ .~~YS;S, - A method-which~i~wsforCC)mparison~f options in ,te~ of all attributes ••which 81'eof relevance to the decision maker(s).In IRP, common attributes are financial cost, environmenlal iI11pact,sociaiimpact and risk.
,.',,". .
Natural Gas Vehicle(NGV) - Maybe dedica~, "meaning that the ~ehicle,nms ,only on natural gas, or dual ..fuel,which means that the vehicle is equipped to operate on natural gas or gasoline.
Net Enem DemaDld .f0recas t -Tbe Gross EnergyD~lD!lDd Forecast less the effect of all DSM.
Net Lost Revenues - Utility lost revenues resulting from a DSM program net of avoided supply and capacity costsavings. May also be de~ed as the net margin ~t~faD.sM program. See also Margin. Lost Revenues.
Nomination - The scheduling of daily gas requirements.
NoncoreCllStomer-Custc:>lDer,designati()~ origjnallY.~finedin CaiiforWa ,W be customers that consume moretban250,000 therms per year .and~ve alte~ve fuelc:apa1:lility. Seealsof;ore Customer,.
276

Nong~Costs, - Gas, utility, expenses"net ,of purchased gas, cos,ts,and, often, pipeline demand charges. See alsoPurchased Gas AdjllStment Clause (pGA.) and ,Base Rates.
NonParticipants ~t -T~t ,use.dt() eVal uate ,tI1 ebenefits and costs of utilityDSM program from thepe~tiveof utility customers who do not parti£ipa~ iJ1the Pl'C)gram.,Also called Ralqiayer Impact ,Measure, (RIM) 'aiuJNo-Losers test. See also Total Resource Cost test.
ott-Peak service - Service made available on special sChedulesor contracts but oDJ.y~for IispeCifiedpart of the yearduring the off-peak season. .
OPen Access. -'The 'nondiserimiiultoij ~sS to mtenitatepipellne transportation serviCes. This' enables end-usecuStbDiers~e 6fiionof secUring the~.~wngBs supplies nth~ than'relYlng upOn local distribution companies.
Particlpan~' ~t ~'Test used to evalUate'the I>enefiis'iUia Costs of utility DSM program from the Perspective ofutility customers who participate in the program. See also Total Resource Cost test.
"P~ Day ;;The 24~hourday period of ~test toW gaSsendout assUminga specific'weather pl:lttCm.May be Usedtb rei)f(~seI1thistoricalactUal or projected "(budget)requirements. " "0 "
Peak-Day Curtailment - Curtailment imposed on a day-to-day basis during periods of extremely cold weather whende~ds~for g~ exceed th~.'iIiaximum«I&ilyd~Hverytapability ~f Iipipeline system.' ' '.. " .
. _.. . _ ". _. .. .. ..• -.-, ...• u ,.: ..•• <.; ..•...: ..: '-0 :._: .. c_ ••• ' •••• ' ••••••••••••• _ •••• : cO .- .• _,._,.;,.. .. • "e'. .. .
Peak Shaving ~The process"de~ppiying gas fora distribution sYstemfrt)DllUuilitiliilrysource (typiCallyoflinll~supply and higher cost) during PeriodSof maxiinum demand to avoid' ext:Cedingthe deniand
o
on the primary soUrceand to reduce wide fluctuations in gas takes. Syno~: Needle Peaking.
Pers~tence- .R~ferst? ~y ~~Iine in eneI¥y7~ving~ffec;tiyf:lless~~t~y tak~.plllCe()vera .conservatioJ)~re'slife. This is a fuIiction of bOth'consumer behavior and equipment degl'adation. . .
Pipeline - All parts of tho~ physi~ fac!lities throughwhicbgas islllo"ed in ~rta~on, .includingpi~"y~vesand other appurtenance attached 10pipe; compressor units, metering stations, regulator stations, delivery stations,holders and fabricated assemblies.
Program Evahiation- Activities~latedt6 the ~necti()n,amaysis~ iaridtepOrtingof data for purposes of measurmgprog l1llD }Blpac.tsfrom PliSt,existiIlg orpo~~illl pl'C)~iB1l>&Cts· A~tivities iJ)c!wie,.pl'C)g~m-specificevall1Slti9~as wen as activities which evaluate more generic isSuesWhich are televmt to moretliari one prognlin. ",.
,."i;::>', ',-' -,',"',<'. 'J>~i:·:',;>';:, ,,-,' ',','.,.....,',.. ,
ProJl~~ (C,H.).- A gas' ,the.molec;l1 le?fwhi~h. iscolDP()sed()f~ carbon and .eig~t.~ydl'C)genatows.~~~e,is present in most natural gas and is the fii'Stpfuduct i'efinedfrOm crude petroleum. I.t~asmany indus.trial~liI1dmay be used for heating and lighting. Contains approximately 2,500 Btu per cubic' foot.
PropW1e Ai~ - Propahe.xnxed with air andnatllfal gt.stoallow burning in & natural gas sys~into!lUJlP~~~ntnatural gas supplies for customers on peak days.
PurtbasedGas Acljw;tiDerii (PGA)CIaw;etRate,Pn)v~iont or Account - rate,~~t, orrate~rigIllechllllis~ that .anowsforfre«JlI~nt lI~tingofgas lIti1ityrates "tore~ect.chan~es iJ1Pur,c~gas~Sts.· •Usually!burnot'ahvays, ,incl~des.pipeijJl~ .de~d C~B:g~expenses in aa(iitionto. gas 'C()~ity cOsts••.•·•..". "o!"",. , ';
, ''''''. ,', " , , . . . .".. ',';'>f'
2n

Rate Base - The investment value established by Ii regulatory ~~()rity upon which a utility is permitted to earna specified rate of return. Genenilly, this represents the amount of property Usedand useful in public service.
Resenes,~nergY -Referstotlje ~ ()fnatmal lesOwpe, socIus ~ gas, ~tural gasliquids, PetroleuDl,coal,lignite, and energy available flOmWater power, and solar and geo~erinal energy.
.Estinlaied Po~tiaI.~<ui"al.~Resenes ..- •.;8.~fers.to an. estixnll~.of the remaining lUlturaIgas.in aspecified area which' are judged to be recovenble.·· . ", '
Estimated Pi'oved~a~,,~ Itesery~.:~~ti!"lltcxlqU1lD.til)'()f ~g~ wNcb~aly!!is ofgC?9l~gican~ en~~~$ datadC~ ••~d1 ~1lAlbl~~rtain~tohe. ~ye~ble .;iJl~e fU~~'.frOm kI.QWnoiland gaS'reservoirs, under aIlticiJjated economic'md cWient' operating' conditions. R:eSerVOirstb8t havedemo~tra~ the .ability tol»,rpdllCCby ei~er actu~tP~lJFti~~ o~Fnclusive foonation ~~. ~~ co~i~eredproved. . . . . . ....~'. ., .. .,," ",
SatW11Uon,APllli~ - RJitioof ~e~wn~rof 8J>e9i§c.~ pf ~pplilll1ces()r"9uipmeJ1t.tothe total~ulD~r .ofcustomers m that 'Class,expfeSsedu' a percentage ...For eXantple;'8~~.~eat satunltion refers to.the,fracti()n qfbomes and buildings with gas space beating.' ' , .
Sendout, .GaS .. TofaJgasP~~~r,p~i~iD,~J~arig i~~~fWag,egaS..eceip~),ornetwi~~ra~.(romunderground storage within a specified time interval, meaSUredat the point(s) of production and/or pureb8se, and/or~th~wal~adjus~ f.0rc~g~ iJl~~~~~~9U1lD.~,~~I~co~~,~gllS.saA~,.~Jl.c~ge geliveri~~.~llSused bycoIDp8DY.an~~~~ Jor~~: .~~~W,vaP~units.~~h.llS •.the~~.Btu'~,c~bic feet, etc~...••..•.
Sendout, Maximwn Day - The greatescairiua'tOtAJ gasscitd6ut~iTing in a sPecifled2 4-hourperiOd.
service Area - Territory in whicb~;lltility;SYStelD ij. required>~ibaStberight tospIJPly gasserviceto,l1ltima~customers."·······
smice Line or Pipe - The pipe which carries gas from the main to the customer's meter.
Shrinkag~ Natural Gas - The reduction in volume of wet natural gas due to the extniction of Some of itsconstituents, such as hydrocarbon Il rod uc. ts ,hydrogen sulfide, carbon dioxide, nitrogen, helium, lind water vapQr.
Societal Cost test - Costdete~i,,~ from a~ial~tive as oppoSed~a private perspective. AUexte~alitiesshould be included, if their' monetization is feasible. . .
~pot~ket(;as- Gas p~~ Under short-tenDa~~ts as av~lable on theepeD market. Prices &reset bymarket pressure of .sUpplyaDd demand. . ,
Sto~~.LocaI :.'fbe storage facilities, other tban •undt}rgroundstorage, tb8t are.an integral part of a distributionsysteim,'i.e., on the distribution side of the city gate.
Stor,age Mains - Those mains used primarily for inj~tion and withdrawal of gas to.and from underground storage.'J·'.· ..•···.i ~: , ,' ~ , :.,,::.".,' " '",'.' '",',","':"::;';i:i ':,>':'"~:,';'"""",',, .•

such as depleted ,oil ,or gas ,fieldsor sands sealed,on the top by an impermeable cap rock. The facilities also maYbe artificial or natural cavernS.
Aquifer Storage - The storage of gas underground in Porous and perlDeablerock stratum, the pore spaceofwhicb\VIlS,C?riginally"filled,withwater and in~hich the st()redgas is confined by suitable structure,~rJDeabilitY>~lUTiersand bydrostaticwater pressure..; . , '.'.' ........••..•.... ··0 - -.- --.-.-. •
..~ Gas - The total volume of gas which will mamtain the requir:edrate of delivery during an outputcYCle. "Also called Cushion Gas. . .
Curren~. Gas. - Thet()ta1,voluIDepf,~as",in a ,storage reservoir \\'~ch is in ex~ of the b~ gas~Also~,!Ilt!dWork:ing (;as. . -
Extraneous Gas - See Stored Gas, this section.
Foreign GaS ~See 'Stored Gas, this section .
. ~ativ~ Gas-'fbetbtlf vQiu.~e,of gas irJ.dige[loustothestriii~er~lVoir .
. 'Storage Reservoir - That part of the st~~ge zone hllvui ga'defi11edlimit of porosity 81ld/orPenIletlbilitywhich can effectively accept, retain, and deliver gas. " ,
Stored Gas - Gas'physically injeCted'mto a storage reservoir.
Ultimate Reservoir Capacity - The .total estimated volume of gas that could be contained instomge~rvoir when it is developed to the ,maxim~ desi~J>ressure.
Working Gas -Gas iD an underground storage field that is available for market. May also be calledCurrent Gas.
Take or Pay - The clause in a gas supply contract which specifies amount of gas required to be purchased whetheror not delivery is accepted by the purchaser. Some contracts contain a time period inwhich the buyer may take laterdelivery of the gas without penalty.
Tariff - A published volume of rate schedules and general terms and conditions under which a product or servicewill be supplied.
Tcf - 1,000,000,000,000 cubic feet; trillion cubic feet.
Thenn (th) - A unit of heating value equivalent to 100,000 British thermal units (Btu).
Total Resource Cost (TRC) test - Test used to evaluate the benefits and costs of utility DSM program from theperspective of all utility customers. Test excludes externality costs or benefits. See also Societal Cost test.
Trade Allies - Organizations (e.g., architects and engineering firms, building contractors, appliance manufacturersand dealers) that influence the energy-related decisions of customers whomight participate in utility DSM programs.
279

Transportation Gas - Gas purchased from a source other t1um the pipeline which delivers it. This gas is purchasedeither directly from the producer or through a broker and is used for either system supply or for specific end-usecustomers, depending on the transportation arrange~ts.
Unaccounted for-Gas -Th~difference between the total~8Savaiiablefromall,sources and the ,totalg~,accountedfor as sales, net interchange and company use. This difference includes leakage or other actuallosSes,discrepanciesdue, to me~r ,imu:curac;ies, variationsoftempe~andlor p~, .,andothervari~ts, Particularly due tomeasurements being m8de at diffe~nt· times. In cycle' billings, an amount of gas S\1pply used I>utn:9,~billed as ofthe end of a period. Compare Sendout, Gas. '.
Utility Cost'teSt ~TeStused to ev~ili..te thecl1angeintOtal costs to the utility (i.e., .the utilit)"srevenuerequirement) caused by a DSM program. See also Societal Cost test. See Nonpanicipanzs test, TotalResource Costtest.
Vaporization - Any process in which gas is converted from the liquid to thegase<>,usphase.
Weather Nonnalization - Methodfl)r~jUl;tmggas consu!DP~~l1to,removeth~ ~ffec,ts of weather, w~(:h usuallyinvolves estimation of the average aimUalteinperature in a typicai or "riorihaI" year based on' exaniination ofhistorical.weatherWita. The normal Year tem~rature is used to fOrecast utility~es revellue .under a procedurecalled Sales non::nalization. . . .' .
Weighted Average Cost of Gas (WACOG) - Theave~~e price ~i~f9r a,voluD}e ()fgaspurc:hasedfroD}a pipelinebased on the prices of individual volumes of gas that make up the tOtal quantity supplied. WACOG is sometimesequal to .the.total}>(3A,rate. §er- .a.Iso Purchased Gas Mjusrmenz.(fGA) Clause.
Withdrawal - The process of removing gas from a ~torage facilitY, making" it available fOl"'delivery into theconnecte4;i pipelines. VaPl)rizationis n~ to }IJake withdrawals form ,an LNG plant.
Working Gas - See Storage, Underground.
280

Appendix A
Major Federal Regulatory Policy Reforms on Unbundlingof Interstate Pipeline Transportation
'.
Dale
1983
8/83
8/83
5/84
Order/Cafe
Special Marlc:eiing Programs(SMPs)
Transco 4/83Cohllnbia 11/10/83Tenneco 11/20/83Panharidlerrrunldine 3'/19/84Texas· Eastern· 6/29/84EI··Paso~'8124184' ", .,~: C.;~:.<"
.Van~uSProdricers1983-85r;
FERCOrder:h9- BlWilCetCertificates to TranspOrt Gasfor. High Priority .Users
FERC Order 234-B· .;.'BlaDketCertificates to TranspOrt Gasfor Non-Priority Users",: .
FERC Order "380
281
Summary
Transco established first SMP as part of ratesettlem~t •....Under Indust~ Sales Program,Transcb J>~.and. ~tprices for gas. Producer-sUppliers and eligible entfusers who wished toparticiPll~collldthensell ..~as .to or by ~as. from thepro~;.Ipansco's SfvfP expanded in June 1983 toinclude COhtract Carriage Program (CCP). CCPallowed producers and end users to enter into directsales agreements with the pipeline company actingas transporter. Transco's two programs weremodels for all later SMPs. As of April 1985, morethan 30 SMPs l1ad been apJlffived. The pl'()gramswere aimed primarily at fuel~switchers, so captivecustomers could not purchase this market-pricedgas.
Allowed interstate pipeline companies to use blanketcertificates to transport gas for high priority endusers <I>rocess,feedst<>ek, commercial, essentialagricultilralusers, school, hospitals).
Allowed interstate pipeline companies to use blanketcertificates to transport gas for users covered byOrder 30, in effect creating a spot market of directsales from producers and other intrastate suppliersto industrial boiler fuel users. Gas could be sold andtransported fO~llPto 12() .daY~without pric>rapproval. Longeragreementfequired prior noticeand allowed for protest.
Required pipelines to remove variable costs fromminimum commodity bills; these costs representedup to 90 % of minimum commodity bill.

9/84 Extension of SMPs
." -.. ',', " .. , : "' .. " .. ~5/1 0/85 ~w:yland People '~CounBe!l
v; :FERC F.ind'&o. 84-10~95/10/85 Maryl~dPe()pi~'scp~C
v. FERC F. 2nd~o. &4-1090
10/85 FER,C Order 43~
•..... " .0 ..• ···,··· .....•. ;
6/23/87 Associated Gas. Distrlbutorset al. v. FERC, No. 85-1811
al ..
8n/87. fERC OrderJOO
Term ofSMPs extended for one year to 10/31/85.Conditions substantially eased:' purchases could bemade for gas originally priced at less than thesystem WACOO as long as the contract priceremained above that of NGPA Section 109 gas;reporting requirements reduced; .SMP gas could byused to serve up to 10 percent of the pipelineco~y's C<;»~ 1Dllfk~.·
Courts ruled SM~~ in ~urrent form illegal becausethey discrimina~against core customers.
,~~ 'rul,~ bJ~~CCf~ficate tnmsportation forend~~.illegalast!t~ conducted because itdiscriInUi~~llg~in~t'Ripeline company core~~~~)th~.tw0MWland People's Court cases,in effeCt, o~tia'wed"~YSpot market not open to allbuyers.
Issued in reSponse to Maryland People's Counselcases, allowed interstate pipelines to become "open-access" transporters for gas bought directly fromproducers. For open-access pipelines, Order wouldsepara~pipelin~' '~l'Chantand tnmsporta tionfunctiQ~. . '
' .. " '.. : ...' ...•., ..... -
U.S. Court ~f Appeals for D.C. Circuit remandedOrder 436. Strongly affirmed open-access~rtationandmte conditions of Order, butreY~',and .reDWlded.J,1ondiscriminatory accessand CoD"~t Demand (CD) reduction/conversion ongroun~ 'they agp~ate pi~linetake-or-payproblems.
Interim reSponse to Court's vacating Order 436.Readopted 436, with modifications including: (1)producers must offer to credit gas transported bypipeline against pipeline's take-or-pay liability; (2)pipelines may seek to recover take-or-paybuyout/buydown costs associated with past liability;(3) pipelines allowed to design future gas supplycharges to prevent further take-or-pay liability; and(4) eliminates CD reduction provision of Order 436.
282

2/5/88
4/2/92
FERC Order 490
FERC Order 636
Allowed sellers and purchasers to automaticallyabandon all first sales of natural gas under Section7(b) of the Natural Gas Act. upon 30 days' notice.where the underlying contract has either (1)expired. or (2) been terminated or modified bymutual agreement of the parties. Promoted open-access transportation by making possession of Order436/500 certificate a prerequisite for pipelines toabandon purchases unilaterally.
Mandates unbundling of basic pipeline merchantfunction and implements straight fixed-variable ratedesign. Unused LDC capacity claims released backto pipeline for brokering.
Source: Energy Infonnation Administration (EIA) 1989
283

284

Appendix B
Summary of Gas DSMPotential Studies
B.1 Overview
Tables B-1 and B-2 (see end of this Appendix) summarize results from recent DSMp()tential studies of various gas local distribution companies (LDCs). The studies includethe residentialandlor commercial sectors. ,In most cases, the studies wer~conducted byconsultants working.for'iLDCs, wblle,ID',one,case,,the project was jointly sponsored bya state research agency (New YorkState~ergyResearchandDevelopment.Authority)and a utility industry group (New York Gas Group). Inthis.appendix, we discuss theprocedures usedbyLBL in compiling information shown'inthevarious5co~umns ofTables B-1 and B-2, and provide an annotated description for .individuaFstudies. Keyfmdings and overall trends are discussed in more detail in section 7.2.
B.2 Field Definitions
Definitions used and explanatory information to interpretdata.presentciFin Tables B-1and B-2 are as follows:
Type ofPotemial -The definition and distinctions betWeen'technical, economic, andprogram 'achievableDSM p()tential a.redelinedio, cmaptet 7. In most cases, studies
,"estimated either "technical 'or economicpoteittial,'ialiliough 'there 'area' few exampleswhere more than one type of DSM potential was estimated. Based upon the review ofeach study, LBL calculated percentage savings for a particular sector (residential orcommercial) or end Use (e.'g.,spaceheating, water hearlng) where'possible.> In caseswhere it was nofpossible to estimate:percentage' savings byenduse~ 'tlIoSe"tfiatwerenonetheless included in the utility's overall sectoral results are indicated by an "X".
Decision rules used in calculating percentage savings varied~bytype of DSM p()tentialstudy and data' availability:
(1) For technical p()tential studies, percent savings are typically calculatedbasedonovemight savings potential divided by current (baSe)year gassales.
(2) Percentage savings were calculated in various ways for the economicp()tential't'sfudiesbecause of data availability problems in defining thebaseyear.Inonecase(SouthWestGCiS), percentage'savings were calculated

based on projected ~savings.and.forecast sales values ten years into theplanning period because these data were available. In several studies (theAmerican Council for an Energy Efficient Economy (ACEEE) study ofthree New York utilities and studies conducted by Energy Investment forthree Massachusetts utilities), percentage savings were calculated based onovernight replacement of all measures divided by recent (base) year sales.
It is important to note thatsuppressingthe time,d~cs in the calculation of percentagesavings will tend to overstate; savings potentiaI.somewhatbecausesavings that arerealized in the future (e.g., 10 years} are estimated relative to current year,rsales, ratherthan future year sales. For example, .ifgas'salesare growing at 2%/year, future yearsaleswillincrease>by22% in year ten, absent a DSMprogram.Ifthe DSM savingspotential were .estimated'at 15% of current year sales, the .savings would represent about12.3% of sales in year. ten.
Fuel Switching - Several studies included estimates of the potential for fuel switchingfrom electric equipment and appliances to high-efficiency gas equipment. A negative signindicates an increase in gas use as a result of fuel substitution..Percentage savings aretypically calculated based on their impact relative to current (base) year gas sales withintheC9rresponding: ~~or.
In addition to the efficiency of the existing building and equipment stock and the size ofheating and ·cooling .10Ci~S.(Wl1ic;l1ar~stronglY,i.nfluencedbyc;lilJlateseverity), thefoll()wlllg factors relC\teditp,tp~~~,Ill~thod()logy, anqJ,ceyiQput assumptions used inthe.studies thatmayaff~tthe lJlagnitudeofgasefficiency~()r.fueJ..switchingpotential aregiven inthe.tables:
Numb.erofMeasures Reyjeweil"'. The total nUlllberof individual measur:esconsidered intl)epotentialsw«;ly is reporte(lras.anindicato{.()f the studies'; comprehensiveness.
End Uses Considered - The end uses under which efficiency measures were covered.Differences among' utilities reflect variations in gas end uses that are significant forvarious LDCs, whether the focus of the study was on.fuet.substitution opportunities(e.g., space cooling), and possibly degree of comprehensiveness.
Avoif./edGas Costs - ThemagQitude of the DSMeconoITllc and achievable potential isinfluenced to some extent by the current or projected level. of avoided gas costs.Information on the utility's estimated avoided costs are differentiated by season: "year-round, " "winter, "and "summer." .• The "Basis of Costs" line indicates the time horizon,. .
.of the avoided cost forecast and whether the costs arel~veijzedor not. Where range of,avoided costs ar~ reported, .thestrepresent)tl1e initialyeC\f andJast year of the forecast
286

period. "Gas Escalation Rate" indicates the annual rate at which the winter gascommodity portion of avoided costs. is increasing.
The ACEEE study of three New York utilities and the WP Natural Gas study reportedlevelized av()idedcosts. The other utilities included yearly values of avoided costs overthe study time horizon in real or nominal terms:
o Orange and Rockland calculated real summer and winter avoided costs fortwenty years.
• Southwest·Gas reported a range of nominal avoided costs for different enduses over 20 years. Space heating values were used for "Winter, " andclothes drying values were used for "Year-round."
o Boston Gas reported real total avoided costs and measure life for each typeofI11eaSure.Average animal avoided cost for eachmeasure was calculated bydividing the totalavoided.costbymeasurelife.}$paceheating. measures wereassigned to' ~Winter"andwater heating.measures to "Vear-round."
• .CommonweaIth Gas and Bay State Gas reported.a range of average annualavoided costs based upon measurelifetime.CommonweaIth's.avoided costs.areinteaIdollars, while Bay State's •avoided .costs .are' in nominal dollars.Both companies reported space heatingvalues, which were used for "Winter,"and annual base load values, which were used for "Year-round."
• Southern California (SoCal)Gas reporteda20-year range of nominal avoidedcosts that.include environmental'extemalities.
• Atlanta Gas. Light reported ,avoided costs .in nominal dollars for a .ten-yearperiod.
Gas Escalation Rate:.. The assumed average annual rate.at··whichgas·commodity pricesare assumed to escalate over the analysis period, which is embedded in the avoided costcalculation.
Discount Rate - The rate used to present value future benefits and costs attributable toDSM programs.
Nets Measure Interactions - A "Yes" in this row indicates that the study accounted forthe interactive effects in determining savings per building when more than one measureis used in a building.
287

Externality Costs - A "Yes" in this row indicates that. th~ study included the costs ofenvironmental externalities in one or more of its screening tests.
Sensitivity Analysis - .Indicates whether the study analyzed changes inpoteiltial.savingsfrom varying critical inputs. For example, many studies evaluated potential savings levelsgiven a range of avoided costs, expected measure savings, and program costs;
B.3 Results
B. 3.1 Residential Sector
Technical Potential
The Orange & Rockland Utilities (ORU),Southwest.Gas (SWG){and WP Natural Gasstudies estima.ted theDSMtechnical potential in the residential sector at 24%, 32%, and36% respectively . While the aggregate estimateoftechtUcal pot~ntialare comparable forORU and SWG in the residential sector, the end use sector potential varies significantly,primarilybecause'.ofclimaticdifferences. ORU ,which isJocated.in New York state,reported .that 79 %of the estimated savings potential were from space heating measures,while Southwest Gas, which is located in Nevada, reported that 69% of the savingspotential were from water .heating .measures.
Orange & Rockland and WP Natural Gas estimates assume overnight adoption ofavailable measures.'> The study conducted forWP;NaturalGas,whose.service territoryspans across the states of Washington and Oregon, drewheavilyona 1990 WashingtonState Energy Office report that estimated savings associated with weatherizationmeasures.WP· Natural Gas also estimated· savings associated with· furnace upgrades.Eligible households in which measures could be installed were estimated based on a studyperformed for the state of Oregon. Technical potential was calculated by multiplying thenumber of measures .•(equal.to. the. number of homes) bythesavings-per-measure.
Southwest Gas reported savings for each year between 1991 and 2010. ·Percentagesavings are calculated based on 1997 savings divided by 1991 residential sales. The year1997· was selected because it is ..after the· program ramp up period. Southern CaliforniaGas and Atlanta Gas Light calculated technical potential for a range of measures, but didnot present results in aggregate.
288

Economic Potential
Estimates of the DSM economic potential varied substantially .among studies. TheAmerican Council for an Energy Efficient Economic study of three New York utilitiesrepresents the upper end \\jth savings ranging between 29-42%of (;urrent sales, assuminglevel!~ avoidedgasCOstS0f$2.5Q/Dth, and 44-48~.ofcurrent~es assuming avoidedcosts are inth~$4. OO/Dtli~g,~.l .Al>opt'halfoftb~saYings.are only cost-effective atthe.ti~e of~~ipment.repla~m~n~~ •.'fhe.A<;W;Estu.4y .•~sed a1llCtest to set the cost-~ffectiven~sthreshold(JJ}d.i.ri(;remen~m~urecostS.were incr~ by 50% to accountfqr.~.timated. prqgram .adl1lil)i~trative.C,<>s~.
.grange .an~Rockl3.nd's~stim~teot])S¥ econom.ic.pot~ntial at .15% is substantiallylower than the ACEEE study. At first glance, this large discrepancy is,surprising giventhat all of the utilities are located in New York. Several factors partially account forthe~Aifferences: (l)tl1e:1C~E~ studyincluded~ore irldividual ~~ures and additionalenciUs~s..•thaI1...th~ ORU~t~dy,·.(2)plUJ,red~ce.dits ~n~)JniC,potential to account forsavings attributable to codes and standards, and (3) ORU assumed measures would beimplemented gradually, while ACEEE assumed immediate implementation of measures.
SoCal Gas estimate of DSM economic potential is substantially lower, ranging between5-9%, of current sal~s (dependin~()l) th~.ba~YearuPOQ whicl1sayings ar~.Pliged).2Ofth~ JO~ ..ecollo~icpot~.ntial, w~~er h~tingand,.spa.~heating a(;(;ountedfor.'6()% and30%, respectively. One reason fOFtherelCitively 10\Vecon() I1l icpotentialis~outhernCalifornia's warm climate, which reduces space heat savings.
Percentage savings values were calculated for each utility as follows:
@I The ACEEE study of Long Island Lighting, Brooklyn Uni,on.(J~,aJ1dNational Fuel Gas - The economic potential value is based on overnightreplace l11 erlt,~fa!l m~sures .aJ1dI991~t()r. sales.
@I Southwest Gas - Savings potential is based on savings and sales in Year2000.Southwest Gas study does not explicitly account for measure interactions.
I}tshould'benoted thatthe ACEEE study is ,adraft repor(and that the utiliti~ don't necessarily endorsethe ACEEEfindirig's.
2 Economic potential for SoCal Gas ranges from 5% in 1994 to 9%. in 2010. TIleir report did not includesufficient information to calculate percentage savings in terms of savings divided by forecasted sales in year ten.
289

ED Orange and Rockland reported future savings, but future sales were notprovided. Accordingly, their economic potential is based on 2003 savings and1993 sales.
ED Boston Gas, Commonwealth.GCiS'and Ba~State Gas contracted separatelywith Energy Investment Inc.,to developestinlates ofp~;M ec<)nolllicpotential.For all three comPanies,. economicE<>ten~is b~on~vernight savings.The lower values reported forJ30sto~:'Gasi~dCoIll1119nweal,tI1',Gasrepresentsensitivity analysis which discOunts the~ngineering 'estfmate0fsa.vings-per-measure by 20%, while the higher vallie assUmes,100%of projected savings.For Bay State Gas, ~BL r~rtsthe ~verage .of savingsassocia~.with lowincome, single family~and'2;'plus family houses, all of which were close to32%.
• Atlanta GasLight caIculatedeeollotnic,notentialfora nlfge~fT~ures, butdid not present an aggrega,teestimate 'of savings for the service territory.
Program Achievable Potential
91'angeand Rockland reported' DSM program a~hievable p<>tential~f 5%,. bas('Aion75%market penetration evenly distributed.over 20 Years. The program achievable potentialis based on 2003 savings divided by 1993 sales.. ,
B.3.2 Commercial Sector
Technical Potential
The two utilities that ,.developed estimates ·'·of the DSM'· t&1Ulical potential in thecommercial sector reported lower values (9-16%) than their estimates for the residentialsector (32-36%).
Percentage savings values were calculated for each utility as follows:
ED Orange & Rockland assumes overnight adoption of available measures.
ED Southwest.Gas reported," savings for each year betvv~n 19,Ql:ian,d 2010.
Southwest Gas' technicci1potential is expressed as 1998 sa011gsqiYi(Jedpy1991 commercial sales. The year 1998 was selected because it follows theprogram ramp up period.
290

fill Southern California Gas and Atianta..Gas Light calculated technical potentialfor a range of measures, but did not pr~sent an aggregate estimate of savingsin their service territories.
Economic Potential
The DSM .economicpotentialran~edbetween.8-24% 0ftc>talcomni~rcial sector salesamong the nine utility case studies.. <savings potential~as. IllpreCC?mparableacrossutilities than those in the residential sector and typically focused on only three end uses(space heating, water heating, and cooking).
Percentage savings values were calculated for each utiIitYas follows:
The ACEEE. study .~f Long Island Lighting,' Brooklyn UniQfi Gas, andNational E~e1."Gasbased' econo~ic .Potentialvalue9n ovemi~ht 'replacement. of all measureS'and 1991 Sector'sales. The range or:5aVi;lgSrepOrted is basedon two avoidedoost 'va!ues:"The low valueassuni~ an avoide4: cost of$2.50/DTh, while th~ fiigh value assumeSan avoided co~tof $4~oo/DTh. Asfor the residential' sector analysis, the ACEEE study tis~ a TRC test to setthe cost~ffectivene~'s"thresholdand incremental measure costs were increasedby 50% to account f?r es~m~ted program administrative ,costs.
' .. , ' ............................•...... : : ': : ::'. '., , .. -
fill Southwest 'Gas" ·economicpOtential,<'which .·does.'iiot.acCount for measureinteractions, is based on savings and sales in 2000. .
• 0ran~eand R;oc~aI1d reIJOrtedflIturesavi?gs, 8utfuture sales were notproyide4...AcC()rd~~gl~,theireconomic.pot~ntiCllis~asf-don.2oo3 savings and1993~e~.They.~6.dedan 18% premium to.meas,llrecos~ to reflect averageprogram costs.' ' ,
fill ForBoston G¥,. 9pmmonw~th Gas, an~ BaYStateG¥, economic potentialis based on overnight 'savings. The lower values repo~ (or Boston Gas andCommonwealth Gas represent sensitivity analysis' ,which discounts theengineering estimate.of savings per measure .by20%, while.the higher valueassumes 100% of projected savings.
fill Southern California Gas' economic potential ranges from 8% of current salesin year 1994 to 14% of current sales in year 2010. Their report did notinclude sufficient information to calculate the intermediate ten-year value.
291

• Atla.ntaGas Light calculated economic potential for a range of measures, butdid not present consolidated savings estimates.
Program Achievable Potential
0nmge;wd Rockland reported DSMWogram achievab~epotentialof 5%, based on 75%inarketpenetration eyenlydistributed over 2() years. The prognUll achievabl~potentialis based oIl~903 savings divided by 1993 sales.
B.3.3 Fuel Switching: Residential a.ndCommercial Sectqrs
Six of the, elev~n DSM potepti~studies included~~timat,~s pfthe potelltial for fuel:~witching in, ,th~ tesidentialsecto.I;~ ,\Vhileflve., studiesipclud~ estimates in the,,'commerCial' sec~or.' , Only tJ1epotential, for ,~witching ,fiqril e\ectricity to gas weree~timai,ciJ,.,""l,'ntit, :e,''se stu",die,s. As in· thea;;~sslTlents,",of ~v,in,gsJrom,."efficiency,measures,different ~o(ft1elsWitcl1jng1?Pteptial" (e.g.,teCbQicaJ,<WnQmic" achievable) wereestimated iQt!1,eresJ>ecgvestudies. LB~ calclll~poIl;~f~!~Iltage impact relative to gassaI,~s•varied aino~g utilitie~ de~nding eOn,theavailal>ility.of delta:
...... '. .,., ". :: .. 0' " .......•.... ' '. '. '. :. '.: ; .• ," .. ":: ' .• " :: : '. :: .. ':,:"', .,: ":,':':,:> : .,:,: :':'" ',,: : •.: :,'''':, :,.,,:. . : : ,.,. : .. :'.: , :. ".: .. : :. : .....•.. '.. ...: :.: ...................•
'. .: C' :-
• ACEEEstudy oit.ollg' IsI~d :Li~htihg,Br<>okIyn'·briion'Gas, and NationalFuel (J~.~sume all,overnight change fr,omelectricity t().gas and,are based on1991 gaS-sales lev~ls. '.
• The Southwestq~ vallle is.~ased ,011 fu~.1.~\VitchiIlgpotentialin 2005, whichis,afterth,eirprogI"a.l1lraIllp-up~ri<>d.mtl1~resi"~9ti~~ector, it should benotedthat,.~pace cqqliIlg, whichdoe~ m)t~~sthe ~~Ctest, represents 96%of Southwest Gas' fuel switching pOtential. Th\.l~' this estimate of fuelswitching primarily represents a technical potential..
• cAtla.ntaGas Light - Value represents existing program fuel switchingpotenticil·
• Orange and Rockland examined fuel switching in their study, but did notreport any consolidated numbers.
292

Tabl
eB-1
.R
esid
entia
lD
SM
Pot
entia
lfo
rSel
ecte
dG
asU
tiliti
es
BroolUyn
Unlon
,W
PBooton
I<;;","rnonw~"lt
'.'"
'.~!I8(IIe..,
LlLC
OGoo
101IIlonolFuel
Or.nge
a.
Souttwv••t
Goo
N.Uxo!
G••
aee
Btiy
St818G••
80CoIa••
GoilLlghl
F*identio/
III
&121
111St121
Goo.
Rocklll!1d
(31
14180161
o.lBl
181
111
(81
(III
(11llc(21
,"
,,.........
Tvpe
01Pot.ntl••,
Tochnlcal
36"
32'lf.
24"
XX
Econom
ic24·41'lf.
34·41'lf.
21·44%
16"
26"
11·20
"24·32"
32"
6·9"
XPrOGr"",~chlevoble
6%",FUllSw
!tcl1('C
l~3"
-2"
·6"
X-a.
-2"
MO"w"
Koviowed
('162
6262
;,:2
2bN/A
23-2
02B
2826
fnd
U•••Conoidored:
1101
.
,Spoeo
Hooting
XX
XX
)(X
26%
XX
XX
.SplICeCooling
W.torH••ting
XX
XX
XX
14'lf.
XX
X)(
Co"ldrii!
)(X
XX
Clothoo
Drying
XX
XX
X
.'
,
A~oi~ed
Goo
Coot.
1111
"Ve.Nound
(SlOtt"
3.3:1-14.61
4•.10
3.02
2.110-3.61
3.110-12.116
4.63-11.611
1.60-
4.32
Wlmen.IO
thl
3.06-
6.22
6.2H
8.81
4.118
3.66-4.113
3.23-4.86
4.31-
16.40
3.63-1.118
1.39-
Summer{.lOthJ
1.61-3.41
20.811I
11I••1.of
Coote
.22yrrenoe
20yr
ronge
30yr
level
20yr
ronQ
e2O
yrrenoe
26yrrenoe
ll11yrrenoe
1.311-3.60
G••
E.co/.tion
R.te
4"10
"11I'1'
4"4"
10yrrenoe
.4'1'
Key
_umptione
..',
Oi.count
R.t.
6.0'"
6.0'"
6.0'"
10'1'
1I'lf.
1I'I'
10'1'
II"
9-12"
NetsMe••",elnter
.ctiono
Yea
Yea
v••••
V••••
No
No
Yea
Yea
Yea
V••
ext.rn.llty
Coot.
No
No
No
No
No
V••
No
NolY••••
V••
V••
Yea
Senoitlv/ty
"naly.i.
Yea
Yea
Yea
No
Yea
No
V••
Yea
V•••
Yea
Yea
,
(11.Econom
lcpotentialendfuelow
ilchlng
booedon
"vernight••vlng.~Iv!~edbV
11191••ctor
••1•••
121R
onge
o!econom
ic••ving.booedon
evoi~ed
coet.of
82.501OTH
AND84.001OTH
II!1dincrementalmo••••oCoot
+50
";,conOfio..,
'(31.Tochnlce/pot.nti~
be'sedon
ovornlght••ving
••nd1993eol
••;oc"",,mic
pot.ntlolbooedon
2003
••~ing.,1I!1d1,1193.01••;.chiov.ble
potontl.I
booedon
2013
.eving.
'''·14.IT
echnl~81
pOlentl81booedon
19111.evlng.
II!1d11191
••Iea;,eco~m
lcp"tonti81booed,on2000
••~ingilll!1d.81...
.,',"
'16.1FUIII.~wltchl"llbooedon
2005
technicolpotentlol
W·.ti'.,\:The
numberiepO
rt,ed
';ifl.ct.
potontl.fth~ip_,tl1o
TRC
(6IE~,~lc
pOl",:"I.1
booodon
overnl~ht••vlng.;
low,vol••••"'um
••20
"~I.counted
••ving.;
high
v8lua_um"
100'1'
of••vlng
••mE~OI10inlc
poteriil';lbooodon
ovornlght••vlng
••18IE"onO
,,!IC
potentialbooodon
1994
II!1d2
010
••vlng••
19'fl'iil,;onge
of~I.count
r.t••
Includ"
.00iet.l.
corp"r.te,
II!1dpOftlcipo"t
~i.co""t
r.t•••
11(Iipo.c..ntso••
rept_nu.tim
.led
•.•vlng.forth.t
e.nd
•.••••
,(111
Southw
••tGoo.B.V
Stet.Goo,SoCoI
Goo,andAtl.nt.
G••
light
used
noml~oI
.'.;
oilotl1or••••ed
rool••••
•Re81V
oluo
SourC8'l:Ned.1
1993,Or.ng.
e.Rocklll!1d
1993.Southw
••tG••
'991.
WAW.t.r
Pow.r'993;
WPN.t••aIG••
1993;Beeton'Geo
1990;Com
mon"".oIth
G••
1991;B.y
St.t.
G""
1991;SoCoI
Geo
1992;
Adont.G••
lIGht
1992.

Tabl
eB-
2.C
omm
erci
alD
SMPo
tent
ial
for
Sele
cted
Gas
Util
ities
..LlLC
ci,.
.,,.
tHai
:!!
----..
18-111'11>
16-16"
H-20,,"
10,.
8,.
l3-H'16
9-14'11>
8-23'16I"-23
"23"
6"-29."
.,49"
:!.,...'
x.
-6"
I-2"
40·
4040
HI
./.39
2021
-20
3036
I13
'.er••••:ItO
I;,
Sp_"'ootlll4l
XX
XX
X28'"
22'1'
XX
Xx
IX
S",_.Coollll4l
XX
XX
XWlIter"'olltlll4l
XX
XX
X6"
XX
XX
C"",,,1ng
xx
xx
xClom-
D,ylng
Ip,OC<IlIO
I"'"lit
8"I
X01""'.
XX
vOIded
GIS
Coelo
1111
YOer-,ound
'.lOlh'
3.32-14.61
3.02
2.10-3.61
3.110-12.96
4.113-1I.118
1.60-4.32
Wlnt••'.I01h'
3.06-6.22
6.2H
8.B7
3.68-4.113
3.23-4.86
4.37-16.40
3.63-7.118
',.38-
SumlM,I./Dlhl
1.61-3.47
20.88
8••1801
Cool.
22y'
,""""
20y,
,""""
20y"enoo
20yr
'8f1CIO
26yr,,,,,,,,,
ll1yr
'1InIIO
1.311-3.80
0••
EecalellonRelo
3.86"
8.64"
II,.
4'16
4"10y,
,""""
4"oy
"""umpllone
11.84"
DIGcountR.t.
6.0'"
6.0""
6.0""
0.0984
II
""I
10"
I8"
I."
NoloMo••uro
l"'Gractlono
v""
v•••
v•••
Y•••
No
Y-Y•
••Y•
••Y•
•v-
Externelily
Coo",
No
No
No
Ne
No
No
NoIY•••
Y•••
Y-Y•
•s.n.lllvllY
AnelyeIG
V••
V••
Y••
No
V••
Y•••
v•••
Y•••
Y••
v•••
111E
conomic
potentialand1'*
switching
b088don
ov.,night
.evlnge
dlvldodby
1991
••ctor
.eI••••
12'R
enoool
.conom
lce.vlnge
b088don
aveldod
cOOl801
82.60IOTH
AND$4.ooIOTH
and'"",.m
ental
1M"''''.
COIOI+60'1'eem
••lo.
13'T
.chnlcel
potonllalb&
8odon
ovornight.ovlng.
and11193."'
•••;.conom
lcpotentl'"
b088don
2003
.avlngo
and19113o"'•••;ochln.bl"
polentlolb088don
2013
oevlngo
14'T
.chnicol
pol."II'"
b088don
11198.evlng.
and19111•••••••;""onom
lcpotentl'"
b088don
2000
.evlnge
and•••••••
16'Fuoir•••••ltchlnllb.OIIOed'*'2006
lechnlc'"
pot.i1t1oieniI.~.
18'E
Conom
lcpot~llIl
b-.l
onovernight88vlll4l.;
1_V•••••.......,
••20"
dlacountod
•..,11I4l0:hith
val""_umoa
100"
ol••vIIl4lB.
17lE
conomic
pot."'l'"
b&8odon
overnight88vlll4l•.
f81Econom
icpot.ntilll
b088don
ll1l14and2010
••vIIl4lB.
Ill'T""'enoe
01~IGcount,lit••1nc1uda8.ocletlll,corperllt.,
e!1lIpor1lclpent
dttJcount,•••••
It01
Po,cent.t._",
"'llm
••od
.8YIngo
lorthat
end•••••;
1111
Southw
••••0••••BIIYSt.,.
0••,SoC'"
0•••andAllant.0••
LightU80dnominal
8'B;Ill'olhm
UIIlJd.,.oI••••
•RollVal""
Sour•••••:Nod••
111113,O<eno.IIIRockland
19113,
Southw
••10••
111111,W
AW
••••
P_",
18113;WPN••ur810••
111113;B••••on
0•••11190;Com
monW'."'1h
0•••111111;Bay
Slat.0•••111111;SoClIl
0•••1112:
All""'.
0•••L
ight
1982.

Appendix C
Calculating the Breakeven Avoided Cost of Gasfor DSM Measures
Lifecycle costs of electric versusg~ technologies cannot be calculated without a well-defined avoide4 costJor gas. However, since the other CQsts.requiredby such a Iifecycleanalysi~ can .be .specified, ·Jorexarnple,theca,.pi~ and .•operating •cost .'of bothtechnologies, the real discount rate, and the avoided cost of electricity, a bl'eakeven gasavoided cost can be calculated by determining the price of gas at which the Iifecycle costsof competing electric and gas. options are identi.cal. At this price, one would beindifferent (on economic grounds) to the choice of technology. Thus, if the actualavoided cost of gas is lower than the breakevcn price, 'then the gas technology would bemore cost-effective than the electric technology and vice versa. Whether the basetechnology is a gas or electric technology switching to the/other,.thej b~eak~yenavoidedcost is interpreted in the same way: as the gas avoided cost level below which the gastechnology is preferred, and above which the electric technology is preferred.
To better understand this concept, asimpIified algebraic derivation of the gas breakevenavoided cost is provided (adapted from Nadel et al. 1993b). The breakeven gas price isalways. calculated in .reference to·.the. Iifecycle.c.ostof anielectric. technology.comparedto. a.gas technology. For the tota1lif~ycle costs (LCC) of the competing base andalternative technologies (gas or ~lectric)tobeequal:
LCCbse = LCCQ/l' (C-l)
The totalJifecycle cost of each,option is thesumof the capital and installation costs of.each qptipn(CI), itsnonfuel operating and maintenance cost (OM),.its electricity cost(JjL), .an.dit~gas .cost (GS). That is:
Lec = CI + OM + EL + GS (C-2)
Since a societal perspective on the economics of fuel switching is desired, the costs ofelectricity and gas are evaluated using long-run avoided costs for both energy sources andfuture operating costs are present-valued using an appropriate real discount rate.
Of course, the gas cost is unknown, since it is the product of the quantity of gasconsumed (GQ) times the long-run avoided cost for gas (GAC) which is unknown.
295

GS = GQx GAC (C-3)
The breakeven gas price is based on the concept that, if the two lifecycle costs are equal,simple algebraic manipulation of the tenns will allow, one to solve for the unknownGAC. That is, substituting Equation (C-3) into Equation (C-2), and Equation (C-2) intoEquation (C-l)yields,
Clbse +, OMbse +ELbse +GQbse xGA(;;=CI~ +QMall t ELall + 'GQall x GAC
Then/ 'solving for GAC:
(C-4)
.,.. "
GAC =, (Cl all+ OM all+ EL all )- (Cl bse+ OM bse+ EL bs ) (C-5)GQbse- GQalI
·'Equa.tion(C-4)says,~iven that two options havedifferenf'nongas lifecycle costs, thepriceofgas:'1hat will make the totallifecyclecosts of the two options equivalent is justthis difference in nongas lifecycle costs divided by the difference in gas consumption.
A high breakeven gas price mean,sthat the gas technology will be generally cost-effectivecompared to the electric competitor. Conversely, if the gas breakeven cost is lower thanthe likely range of gas avoided costs, the electric technology would remain more cost-effective.than the gas,techriology.' Put another,way, undef.'this latter scenario' gas mustbe very cheap for tlie gas teehnologyto compete successfully<against the" electrictechnology. If the gas breakeven cost, for example, is negative, 'then theLgasalternativewill never be cost-effective at any gas price.
296

Appendix D
Gas DSM Technologies
D.l Overview
This appendix reyiews gas measures and technologies for energy efficiency and fuelsubstitution between electricity and gas. It isnotintended to be comprehensive, butrather to highlightpotentially attracti~egassavings opportunities for furtherinvestigation.'fhefocus is primarily on gas-flte(i'equipmentDleasures forthe fon~wingreasons.,First,equipment measu.res"are generlilly sgecific.W IlatUral'gasand'thusuniquely, relevant toLDCs, whereas other types of measures<that¥educeloadsfor space~heating'orcooling,or:water-heating, ,areiride~ndentofthe type0f~el consumed ,for meeting those loads.Second, many, PUC .and•..•utility '.staff are more' 'fcuTilliar-with·building shell..retrofitsbecause these measures have often been implemented through first-generation' gas utilityaudit programs, electri~ utility DSM programs, or government programs such as"ResidentialConservation Service or state 'building energy codes.
The measures includeth~sethat are~mmerciallyavailable, or likely to be marketed inthe near. future.. Because" ofthemyriad,>~hnologies, applications,·. operating'environments, .•••.and ,other ••site"specificvanables,.the •~rformance of. equipment isdescribe(i,.where possible •withgenerallragree<t upon measures. of efficiency'.,:Seasonalefficiencyindice~ determined in industry s~dardtestprocedures are relied upcmwhereavailable~although where such indices are not in luSe, other figures of.inerit' are used(e.g., savings as compared to some b~technology) as a way of comparing the relativeperformanCe of different' DSM measures.
This appendix approaches the sUbject'.of gaS efficiency measures 'and strategies at thelevel of technolo~y screening ,akinto the.levelat\Vhicha technicalp<>tentialassessmentwould be approached. "Obvio~sly,the ecOnori1ic~ofgas 'DSM ar~~riticaland Jl1anyofthe measure.s ~resented 'here, would not .lJaSs,cost-effectiveness< tests in particularcircumstances..•'One should,not interpret the focos on teChnicaleffieiei1cyas,a denial ofthe overriding importance of cost-effectiveness iinjudging the desirability' of thesetechnologies. However, a comprehensive economic analysis of each technology on anational scale is beyond the scope of this primer.
The first section'reviews gas efficiency measures, followed by ·electric..to-gas fuelsubstitution measures, and finishes with gas-to-electric fuel substitution measures.
I <Forsome types Of equipment, no such measures exist. Itfthose cases,savings estimates are based onliterature reviews, though caution is urged in extrapolating these estimates 'to other circumstances.
297

D.2 Gas Equipment Efficiency Measures
D.2.1 Residential Space Heating
A number of space heat!ng.techn0logies ,exist or are near commercialization for'improving .gas efficienqyin., residen~ •.(see Table D-l). The ••estimated .seasonalefficiency of existing gas warma.i1:.~and. hot water. (~ydronic) or steam.boilersin the.CUrrentli.S .housingstOG}c ~ges~t\y~n 60-68% (Dutt1990;liol~t>erg et ale19~3).~',fl'1isc:onvention~1l~tj~ l~kely.to~ofJh~.type tha.thas ae<>ntinuouslyburningpilot and in Whichew.ust .g~ .fr:Q.1p·combllstionare vented<usmg.thenaWraJ.buoyancy
. . .. .. . :.:: :::,' '.:" .•...... :: : : :.: :..... .' .:: ' ' : .:: :. '.'. .'
effect (aJSQ;kI1own.as"z~atIJlQsph~rjc".•.venting). A buoycp1CY·.driven .exJiaust processrequires high .stack U;mpera.wres (il}.the. neighborhgod of 300- 500°F) in. which asignificantportign of the heat.ofcoiJlbustion is lostto the outdoors.
This basic design has been imprgve911pon in a number .qf ways. .Gascan.be·saved byreplacing the pilot with an intermittent ignition device (lID) and by installing a damperin..the vent to .reduceh.eat 10sses\yhen the.burner is. not.operating, which improves theseasonaleffiqiencyof a unit.equim:d.withthesedevicesl,g·about 75%. By adding a fanorp()wer burner toinduceorfQr~l¥entg~,upthe stack, .Jnore.heatCClllb~~xtractedfrom theexhauststreaffi. and seaso~. effi.ci~ncyqanbefurth~rincrease9 ~~oynd 80%.TIle .m()st,"dramatic~fficiency JiJlProvements.ingas heating ..equipment. cQiJle.frommodifications toth~ combustion ;process ang/orextraction .of heatJrom thatpf.()cess.
Condensing furnaces and bOliers condenses()iJle.of th~ moisture. frolp. the flue gases inorder to extract part of the latent heat of water vapor that would otherwise be lost withth~•oth.erexhausted .'combustiollprooucts ..•..Sys~lps designed in .lhisw.ay.can .achieveseasonal efficiencies inexcess,of9Q% .. The ,dew. point of nawra.i gas .combustionProductsi,s ;l40°F andS() combll~tiqllg~ .must .t>.eiqooledto.this .level or .below forcondens;lq()n,to occur .. IUs,gif~lq1.11tJorb9il~rs to maintain ~1Il~ratures this Imv sincethe .rewJ;Ilw~teru;m~tures~e:Pften well·aboveJ4QoF and for this reaS()n,boilers areusually ofJhe neaI'congensing, type.N"eaI'-condensing systems .exhibit seasonalefficiencies around 82%.
Pulse combustion technology alters the steady flow of gas and air into the burner and. continuQ\lso~ration()f conventional burners to operating on CJ.series of periodic (60 to
2 Seasonal efficiency is determined by means of a DOE test procedure applied to residential centmlfurnaces. Called the Annual Fuel Utilization Efficiency, or AFUE, it differs from the maximum capacity steadystate or thermal efficiency in that it accounts for warm-up, cool-down and off-cycle losses. Off-cycle lossesinclude any standing pilot losses as well as room.air l~throllgb. the venting sysle)Ddueto air flow throughthe combustion cbamberanddraftdive~.,
298

Table D.-1. Residential Space and Water Heating Efficiencies
'. ,', ,' .•, •..,;.:••....<'/, .•/ ..,' ..•.....:-, " ", •- ',' . • .. ', .-'" .~ < •.... '. •.••. •• -"'." ._ .,.' ". ··no __ .. __._.
",-" " ./' "",' , '»;,'>,-, -:.:,.",",.",'..". '.' .. ," ,,' '., ... '--"'-. ''''-',''- .. -
Effici~~cv (i)
Residential. Space Heating
Typical Existing Furnaces/Boilers
110 end vent damperCondensing furnacesModulating furnaces
; Condensing hydronicboilersf\lear-condensingstaamboilars
~asengine heat pumps (heating only)
R.sidentlal. Water HeatingTypical Existing Storage Heaters
liD and vent damperr jacket insulation
Aue baffling and power ventingSubmerged combustion chamber and pO\Ner'venting
EI!"1inate c.enter flue and indirect beating
Pulse combustion.~ondensingCondensing unit
Instantaneous HeatersTypical MF combo SH/DHW boilers
Dedicated DHWboilerinMF
Souree.: I Hellberget aI. 1993• Dun 1990"GAMA 1993• Nadel 1993b• Klausing ot III. 1992'. Peullrt.lII. 1991
(AFUE)
6,0-68'752
85-963
924
84-913
824
120-1506
<,~F)54'
54-618
578668
72~,748
,'808
868,
704
40-454
654
70 tirnespefsecPIl9) ignitions thatary self-perpetuating. Very ..high heat transfercoe...ffi.cients .are a.chi.'eyed, l~ding to corresp<>ndingl.y .high....·..thennal and... seasonal~fficiellcies ..•P\1lse combustion systems can also be condensing,' an<ta<;hieveth.e seasonal.•efficiencies shown iriTable D-l.
Another alternative burner design is the modulating type. Burners used in furnaces andboilers are typically designed to fire at full capacity and track heating demand-by cycling
'>on and ofL 'Modulating systems operate 'the burner atless ·than full ;capacity ,thereby
299

producing savings by firing closer to the demand;· these systems can achieve seasonalefficiencies of 92 %. At present, only two-stage modulating type furnaces are available,which operate at low or high firing rates and achieve seasonal efficiencies around 90 % •
An emerging technology for gas space heating (as well as space cooling) is the gasengine heat pUmP (GEHP). GEHPs operate on the saxne vapor compression refrigerationcycle that electric heat pumps operate on .except. that the compressor is powered by anatural gas-r:u~ ..internal combusti()11eIl~e in-stead of an electric motor. GEHPs aretechnically attractive in the heating mode beca.lIse their efficiencies have been shown toexceed those of the technologies cited<aboveibased on direct-fued combustion heating.Waste heat recovered from the engine jacket and exhaust supplementing the vaporcompression cycle in the heating mode and vanable"'speedoperation both boost seasonalefficiency. Heat pump efficiency is subject to a number of factors, the most importantof which are the outdoor temperature regime and the indoor temperatu,resetpoints, butGEHPs have .realized heating mode seasonal efficiencies in field tests between 120-i 150%(Klausing et al~ 1992).
GEHPs were commercially introduced in Japan in 1987, where currently about 35,000units per year are being sold. In the U~S., GEHPsare nearing commercialization withone man.llfaGWJ;erexpected to bringsQmeresidential units to mar~tin.1994. Due tothe lack of field experience, concerns have been raised about likely maintenance burdensand the lack of infrastructure for servicing .this new technology.
GEHPs are discussed further in Sec;tion D.3.1 as a fuelsvvitching technology becausewhen operating in cooling mode, GEHPs would be displacing electric technologies in amarket that electricity currently dominates.
The National Appliance Energy Conservation Act of 1987 (NAECA) .requires a minimumseasonal efficiency (as measured by the Annual Fuel Utilization Efficiency, i.e., AFUE)of 78% for gas furnaces and 80% for gas boilers manufactured after 1992.3 Therefore,only the more advanced gas savings measures pertain to the space heating equipmentrepla~Jll~Dt .marketbeca.u.~Jbestaodard <.will.result in.DatlIrallY'"9CC u rringefficiencyimprovements up to these efficiency levels as existing equipment are replaced.
Anumberofoperational issuesClri~.with the advent of newer,<more efficient designs inflIrnaces andb?ilers. Pr?per venting of exhaust gases is p.articularl~ il11poi'tant, withspecific recommendations depending on vent pressures .•andwhether o(l1ot .condensationis expected. Condensing and near-condensing type units have experienced past problems
3B~~therating forfumaces is determined. by a slightly different test than for boilers, the standardspecifies a-roughly similar efficiency level for the two equipment types.
300

of corrosion of flue pipes and heat exchangers from aciqicC'X)ndensate.Th~se.problemshave been mitigated by the use of corrosion resistant materials such as high temperatureplastics, stainl~~Steel, Qrperamics, but are more ex~nsive .th anconventional materials....u~ for these system.compon~nts.,4With these'types of systems, .conden~te drains also'hClyeJgbe ins~~.and '.this. increases. total. installed.systelll C'X)st.(though.C'X)ndensingfurnaces are. often paired with air conditioners.and use.the.same.condensate drain, thus·savingcos~()vera1l). . . . . ." ...' . ,.
,.,"':' :.,< ..:....... ... :.- :.;.,:.::.. . :.: :: .. : ::?: - '.:,. " .:',:";""'::- -':."
In Some,cases, eiQ1er,localccKiesSpecify or manufacturer's.;r,ecommendthat outdoor air'be pro¥idc:d for combustion Withheating equipment located ind9Qrs. ,~use off-cycle19S~ hare been significantly re411CCdiP]1igh-efficiencyeqUip~ent, oversizing apparently,haS a l~~erenergy,pen~ty '~~ial#\vith it than with cOl}'yentionalunits. S Past design,pIilctice'oflJ,lanYexi~ting'fum",cesand boilers led to oversiiing relative ~ the loads they'served. wIth oversiZed'unitS, the~~~$sive cycling.Occllrs withatteQ4Mt' increasedstandby losseS, leading to degraded 'energy perf.ormance.• This conditiOIi'isexacerbatedby the later introduction of building shell measures to reduce heatirig loads. An~ditionalbenefit of I:eplacingan existing furpace or boile~with anew, energy efficient
, ,un!t, i,~jjheopportunity to more' closely match the capadty:to the load, thereby reaping,,'"adaitional ~fficiencyimprovementS. '
..: .. ..>: " ':".. : .:~.>;'>". ..-.. - ~ :."" .. < : ':
, Finally, while not specific to high-efficiency equipment, d1,1ctancipipmg heat l()sseswilldeCrease overall effiCiencyof the heating system and reduce the potential benefits fromiinplellleritatiQnof equipment efficiency measures and can lead to'moisture and indoor~ quaIity problems as,well. '
4}\rel atedI>roblemsometimes occurs when anold gasfumace sharing a.·flue with another combustionrdevi~(lffiisally a.wa~rhearter) i~rePlaced "Yitha.new, ~fficient.fumacethat"ents exha.ustgasesel~where,leaving the "OIphan" appliance With iDadequate stack conditions to properly vent its gases. This can causecorrosion in the existing flue and necessitate additional expense to correct the problem-a hidden cost of the newtechnology.
'S'An exception to. this is with condensing boiierunits where.oversiziDgmayin~~ rebJm watertemperamres and therebY-reduce condensation and the efficiency gains' associated with'~C' "
301

D.2.2 Residential Water Heating
Hot water loads areafuncnon of the volumetric~emandforhotwater, the inlet watertemperatw'e(which varies' by location and timeofy~), and the temperature 'setting(typicanyinthe range ofl10-149°:F). 'Storag~ ~ water heaters with 30- 60~allon tankand a standing pilot light dominate the 'U.S. imirket for residential gas water heating.Slightly over 50% of the residential-scale water heaters (Le. ,with heating Capacity lessthaJ1,~5~OOOBtuI~) soldeacl1 ~,~ in,the~t,d~de hay~ beeH~as~fired,(GClSAppliance~ufacturers As~ianon (G~)l~9;t~.!11~'.N.Al3CJ\stihdar~sr~u~all new gaswater heaters tohav~ anefficiencyof~gpr9Xillla~ly54% ,(as meas~~'by the EnergyF~tor)' ~hich variesisom~what depen~g,~n#ff*rlit~i7.e.6; l'eC~olo~iesf()J:improvingw~ter heater, efficiency •inclu~~: increasing j~c¥t'insulation,nD,'*d~~ei,damper,inCreased, nue. '.bafflin~••and ".powerye~tirig;"'iri\lltipl~ .flpes, -,.sub~erged' i.'c<>mbustionchaJ1lber,:pillse 'cOifibustlon, al!4ffOrtde~~~o~'~fV~e~~s ,(paul'et al. -'1991). Theefficiencies"of each of these ~~sign opiions_t~e·.shPwriiri 1"able,D-l. '
Ins~taneousot «tan1d~s".gasWatethea~tsCan;savegas~y·eliminati~gtJ1estandbylosses from the hot'water tank duringidlepeiioos. ".Tl1e ~vip~shayep~n',e~tiInated forversions with llDs to be in the range of 30-50% of total water heater gaS use dependingon,hot\Va~rdraw~t1antities (Nadelet al.l~9?,a), Clf~-:E~er.grFactors, ,are ,~stiInated tobea.r()und?2%(Nadeletal.199~b).Widelyu~ inE!1rCl~andJaP3Jl,i~stmtaneousgas •water .~~ters ha"e li.tt1emarket. sMl'e,in tl1~U.•S~b~to .,tl1ec~a11~n~eof locatingexhaust ventS near the unit and the' perception that'theyipossess ina4ffluateheatingcapability. Also, the current versions on the u.S. matket use pilot lightS and thereforeoffer significantly less savings than those quoted above.
In multifamily buildings where a central boiler provides both space and water heat,substantial energy savings can be produced by installing a dedicated high-efficiency boilerfor water heating alone. Savings for this measure depend highly on the particularcircumstances, but have been estimated to improve efficiency from 40% or 45-65%(Nadel et al. 1993b).
Measures to reduce hot water loads include low-flow faucets and shower heads,horizontal-axis clothes washers, and low-water-use dishwashers. A horizontal-axisclothes washer saves hot water by allowing the clothes drum to operate with roughly halfthe \Vateru~ for a comparClblY-~izedloadioa COIlventionalvertical~axisdothes washer.Potential gas water heat savings over a conventional unit are estimated to be 64% (Nadel
I ',' " ,'; •••...........•.•..•.....,,':.' ,':,',","">-:;:; ',"',',':,,,,;,,"', ;·"r: ',' .'". ".>;,;.::
IS Tbe Enefgy, F~~r$fu1es ,'lIl o,~enill"efficiency for w~~r beaters,\y~~e ,deliv~g6<t.3gallo~ of~otwater per day in II stanchrdtestProceclure.·. It takes into acCO~t ,llo"~ the effec,tiven ess ,of tbebJrri~r intransferring energy to the water dunng firing and standby losses wben the burner is not Opefa.ting.
302

et al. 1993a). Manufactured ,as either fr0llt or top loading, horizontal-axis clotheswashers are widely used in Europe but are reported to have only 5% or less of the U.S.market. DOE is purpo®d to be considering horizontal-axis technology for the 1999NAECA standard for clothes washers.
Low-water-use dishwashers save energy beyond those meeting the 1994NAECA standardprimarily through savings in hot water use of approximately 25% (Nadel et al. 1993a).DishWashers of this type are just beginning to enter the U.S. market.
0.2.3 Residential Cooking
Relatively little gas is consumed in residential gas range,s and',ovens, particularly sincethe NAECA standards stipulated new units equipped with an electrical connection usenonpiloted burner ignition. Most new residential gas ranges use nos as their ignition
......'. '·deviee,thoughiovenscommonlyuse·ahot·,surfaeeignition devicei(':'glo-bar~)that drawsclose to 400W of electricity while the burner is on. While replacing the glo-bar with anno in·th~OY~1lu~it ~ould save en~rgy, it is technically D()ta gas saying devi~ •., Otherd~ig~. opti?lls./o;r~\lcing,C()OkiIlggas use, inconve~.ti0llalIQ1lg~s ,and·oye,n includethermostatically controlled burners, insulati0 llandrepec;tive sUrf"acesfor the,range.and/oroven, reduced vent size,reduction of thermal mass,forced convection during cleaning,and use of an oven separator. Infrared burners for ranges have also been touted as a gassaving technology, but the claim has not been substantiated. usill~.,.,standa.rdtestprocedures. Given the small quantity of gas used for cooking, besides lIDs few of thesetec~nologies¥e vie,wedas attractive for increasing efficiency in this area (Nadel et al.1993b). ."
D.204 Residential,Cl0th,es Drying
'\Vhile gasappnClllc eshaye a relatively low Penetration in the,residential clothes dryingmarket, there are .anumber of pOtenticUlyattractive gas savings measures~ppIicable tothem (sho~nin'fable b~2).,,'As,wiU10thergas appliances using pilot lights, savings canbe achieved through replacement of pilots with nos (annual savings of about 30 thermshave been estimated for this measure) (Meier et al. 1983).
Automatic shutoff controls that are either temperature or moisture activated can producesavings of about 12% over conventional dryers that operate on a timer cycle and rely onuser guesswork to set the cycle duration (Nadel et al. 1993b).
A significant clothes drying load reduction measure is the use of a high spin speedwasher that reduces the water content of clothes from a typical 70-40%. Removing
303

Table D-2. Residential Clot,hes prying Savings
~ .. ,~- .., '.' .. . ' .. -.'
Technology
Residential Clothes DryingElectronic ignition
Automatic shutoff controlHigh spin-speed washer
Sources: I Meier et III. 19832 DOE .19~o, ..Nadel 1993a
Savings
30 therms/yr'12%240%3
,-,.:.,,-.;,-, :.' .... : '..,' .... : -.:.. :.: "
moisture from clo~esin tl1lS range by~pinrii~g .is f3jmore energy :~ff1cientthemthermaldrying. Gal!clothes drying savings have been demonstra~ inth.e range of 28- 47%from this tedinology (Nadel et al. 1993a). . ... . .
D.2.5 Commercial Space :Heatirig
Space heating requirements in the commercial sector are met by a variety of equipmenttypes fueled by natural gas. Figure D-1 shows the market share (by arumal gasconsumption) for unit heaters, boilers, packaged gas heating/electric cooling units, ductfurnaces and warm air furnaces. Unit heaters serve theJarge~tJ><:>rtionof the currentmarket for commercial heating applications, followed by hot water and steam boilers.l.'ogemer,mese twotypesof~u.ipwe,nt,m¥~ upn~ly thr~-quClIt~rsp(the commercialspaceh~tipgma.r~e,t~.so ()\1rdiscti~si(>D9f~\.litaQleener~ye,ffi~ie~cymeasures focuseson.these.~o types'ofequijnnellt. ...This :secti()11()Il commercicUspaCelje.ati~gequipmentand .measures draws e~tensively upQna detailed.study conducte4J>y (Krauss .etal .. 1992).
304

Figure D-1. Annual U.S. Com~ereial Gas Heating Share by Equipment Type
(ToIaI •• 13.3. Billion Them1s)
Boilers 34%
~~gElee. NC-Gas Heat 14%
Duet Furnaces8%
Warm AirFurnaces 7%
Unit Heaters 38%
Source: KrllU!lS 1992
Vnit Heaters. ,.,' .. '" ,'".". .. ,' :. :.: .. ,' :.:..... ".... " ..
'P'lS-flredllnit h~ters,.pr()vff1tW~ ,ai(1gr,~pa~heatipg,qr ,.means-.of/~fHl"llace'typically.sU~pendedabove ..the ~(X)r.oi,.woilc~~.il'h.eY. are, fi}os,tpftep"used,.III ,open.sPeces suchas.repair facilities~,\Varel1gpses,,()rw.I1¢~:aes.th~ticsare.not a large cpnCeJ:Jl',Umt .heaterscome in thr~.,}najor1)'pes: ..graYil)' yenttd,power vented, anc1separa~~mbustion.Gravity vented unit heaters are reported to..account for75-80%rofc.shipments.annually.Therefore, this type constitutes the conventional technology agcUnstwhich more energyefficient types are compared.
305

Table D-3. Commerci,al SPCiCEl and Water Heating Efficiencies
Technology
Commercial Space Heating
Efficiency (%)
Commercial
Conventional BoilerPulse Combustion Boiler
Condensing BoilerHW Boiler
BoilerBoiler
Typical Stand-Alone Water' Heater110, Power Burner Water Heater
50-81'86·95'95'
84-88'
62-64'80-83'90-95'
Sources: I Krauss et aI. 19922 Nadel 1993b
As shown in Table D-3, the seasonal efficiency of conventional unit heaters isar?und63%.7 Power vented and separated combustion unit heaters represent an'improvementillth~/~!l~~ffi~ienc.~ u1>~{)a,.r?,~n~.~Q;~~,,:p()~erv~ntedtypes make up onl)' 15-20%of arlnba.fsa}esofun}t Il~~t~, whil.esepara~'C<>mbustion types achieve 0nl)"about 5%of ,~~'(~pparently:~r:rmatll)' foii~o~~·~()ther th~"energyefficiency). A condensingpulse ll~.t heater i~ c6mIfiercicillX:'aYail~~lewith an AFUEpurported to be in the rangeof9Q.-95'%,',but.mth)ess .tl1~1~ 'of ~e national unit heater market due in part to alimiteO rcuig~"of~zes current1~ off~t~. .
~> ~,,'.~
7 Note that for these and other commercial heating equipment there are currently no industry-standard testprocedures for determining seasonal efficiency. The numbers quoted in this section are based upon testprocedures used for residential-type equipment.
306

Retrofit options for unit heaters include vent dampers, intermittent ignition devices, andsetback thermostats, with savings varying depending on the existing equipment, the usagepattern, and.local weather.
Boil~rs
FOtPuIp()se~ of unqers~dingenergy use ,of boilers" th~y canbe.classified bydistribution':medium, heat exchanger material, or burner type. The market trend istowards the g~eof hot\Va.teras the distribution.lIl~um forboilers in coll1mer~ialspaceheatit)g ~pp1i~pons,withestima~ '.as. high' as 95%in,.~e~collstruction ....'Hot waterboilers tend to 'have higher seasonal 'efficiencies than steam boilers beCause the formerhave.lowerr~tu!l1 wa,t~r.•temperatures and are often ..RetterCC)ntrolled..aJlq;matched to~6a.ds".Steatn.b.q~leI"~.are CJ.pparentlysold primarily for r~~?fi!~team.,heating;3.Ildprocess'applications. Cast iron heat exchangers fOn:nthe.?v~nvhe~IJ1fflgmajority of b?ilers soldin commercial sizes (i.e. above 200,000 Btu/hour output rating), with steel and copperheat exchanger-based boilers serving a relatively minor market segment. Among burnertypes, roughly half of the boilers sold for commercial heating applicatio~~.a.r~i~~~Ppedwith atmospheric burners and half with power burners. g Boilers with' power burnersoffereffi~ien(;y CJ.dy.3.Il~g~sP":~fa.tlJ1?spherisburners.tl1rou~h..~etter~ntrol.~f the fueltoairfCltio' in~.mbg~ti9n.3It(rt~uction j~ stahdb~ h~t .lo~~. 9
•.In Ia§ie,D-3,. the upperr3.Ilg~pfCOI1Y~:*#9IlaJ'b()il~r~tt1~iellcycompriseS.h()t w ate ['b~ilers \\1tl1po\V~iburners,,~hil~tl1e J()w~r.riWg~;~niprises .,.stea.IJ1..boileJ;~.\\ithatI11osphen9 ,"b;urners:•.•..Boilersequipped~ttl1con~ens.ing .or,near-c~nd~n~ingtechn()l~gy.are,co,mm~!cially.a.~ailableinefficiencie~"upwa.r~s..of 85% ..alS() shown in ..Table p-3. 'Currently ,these are onlynlanuf(ictufeq,as hot water; boilers.
Boiler retrofit fueasuresfor increasing efficiency inClude a nllmbefdf'options forimproving the control of the equipment. Reset devices provide better control of thewater temperature to match the heating load. Outdoor cutout~n~ols~~~t()ff ~eboilerwhen the outdoor temperature is above some set level, thus saving energy during thoseperi()<ls!n .•the swing seasons•(Sprin~aJld Fall) when; the boiler ~ould 0the~ise berugning in ~tMdby,mpqe. Therm()s~ticzoI1e, temperatur~ contr~ls 9aJlpr()<luge.savingsbYIl1()reclosely mee~ingthe diversified loads indistributed. wnes ratherthantr~ting thebuilding as, a .single ..(or few) zones. Thermostats often 31so provide nighttimetemperat~re,.setback capability. .
8Other bumertypesat-e available, orleof which we discuss later, but they coUectivelyholda small share ofthis 1Darket (2:-5%).
9 No standard test procedure exists for boilers in sizes above 300,000 BtuIh so the seasonal efficienciescited here are appcolliIDateand, for co~Jlarative ~urposes only.
307

·Boiler,energy use can be reduced,by employing'a inodular design approach in which anumber of smaller boilers are used instead one large one. Large boilers often have poorpart-load efficiencies, so savings accrue from operating smaller boilers closer to theirrated capacity where their efficiency is highest. These modular boilers are staged in sucha way to bring them online with heating demands. One NBS study showed the savingsfrom a modular system over a single boiler to range from 5-15% depending on thedegreeof ()versizing. As a retr0fitoption fortheD1()(jularboiler approach, a "front-end"bQiler'can,be,acIdedto meet sm~ler ,loads andstll.ged with. the l(lfger .existing boiler."'.: , ..'.. . . :..:. . .
General maintenariceof theaistributionsystem f()reducehot w~ter'or steam heat losses,also offers p()tentially,~st:-effective sayings potential, but isvef'jsire, specific.
!d0r,ethan ,a,~ird;()fallboilers sold are 'not listed as dedicated~as-fir¥' equipment, butrather are,dual fueled using either oil or gas. Many of these'aI"epurported to,use gas asthe primary, fuer ~andoil as .th,ebackup.
Other Equ,ipmeilt
,"Packag~ .~asheat\~~~e{~tri~~lingequipl1J~qt'cun:eni1Y.;Cons~Ilies •tI1e,third largest'porti()n-Rt~~ fo!sJia~~~Wtg (i.~.,14 %). ~'SseullitS .~~ typi~y ~uipped with IIDand PO\yervel1tiD:,g,~d".~.~yc~",~ffer!swer gaS:~\,i~gs?p~~y~itiesC9ni~ to othertypes,••()f gas",heatiJ1~,~uiPIl1e,~t.'",lIg\y ever ,yl1itS."u~~l1g':'pylse.~Il1bustion, technologypackaged, with lrigh::effi,ci~l1cY:ail'col1di~ol1ingare\lnaer d~velopmel1t. Also' gas heatpumps, described previously under residential~p~ce "heating ,measures, ••are underdevelopment for serving the same small commeicialmarket as combination gas/electric,pap~ged u ll itS(also known as unitary eqyipment) currently ~~rve.
10 Little market information is available for other commercial water beating system types.
308

figure D-2.. Annual Shares of fuel Consumptio •..•for Commerci.al WaterHeating in the.U.S. .
Natural Gas49%
Other 0:::1%
Fuel oil 4%
District Heat16%
Source: EIAi~~2
Electricity
31%
(Electric Power Research Institute (EPRI) 1992b).
¥aIlY ..srn.jiIIcgrn.rn.erciaI~pH?in~s.Rr.app1i~~9~s .in l~~er commercijiI.~uildings •withmodest demands for hot water employ equipment similar to that found in residenCes(i.e.,storage..type \Vater.~eaters), in\yhich case the efficiency II1~sures discussed. underresidential.~ater heatmg apply to these applications as well. IJ1stantaneouswater heaters(also described under residential water heating)· have potential application in thecommercijiI sector as well.
309

In large commercial hot water systems, a boiler and storagetaI1k configuration is typical,where the boiler heats the water in the storage tank directly or indirectly through a heatexchanger.!1 In such systems, the efficiency measures germane to commercial boilersused for space heating apply to those for water heating too. In some boiler/tank systems,the same boiler is used for both water heating and space heating. This can be inefficientwhen the . :;pilld, is being used exclusively to heat water. A gasconserving a stand-alone water heater, with savings
90% of both annual gasequipment, of which
Hewett 1991). At present,efficiency of commercial
;,.c:rj~~velopment through an industry-wide cooperative effortinvolvmg~I'~ •..•., ~~~~~ftl1e.gasand electric.utility industriesand the foodserviceindustry/;(~~~g ..~th~~).F,iF'0r.this reason, Table D-4 presentstypical savings over "standard""eqlliPn'ientpfci!ch.typeas reported in the literature.
';/<:<",' ·····.···.·.·.·>·>i,· .. ·:~:·.:·.· ..·...·.·:... ,- ' " ". ': :'. ',' ',' .:~'.: ' ', ".:~'.. ',', . . ','
TableD-4. Commercial Cooking Savings .
Commercial Cooking
Direct Convection OvenInfrared Fryers and Griddles
Powe~·B~f.ier;R~rl·geSources: 1 Nadel 1993b
2 lobllnstein and Hawett1991
Savings (%)
30-50'20-402242
Qne technologyforjmprovin~the efficiency of gas Usein ovens of all kinds is the directco~vecqo.n oven which circu1atesJlea~ air inside.the oven by means of a fan while
II Boilers made out of cast iron or steel are subject to corrosion if continuously exposed to fresh, oxidizedwater. Thus, such systems typically use indirect means of heating water in the storage tank.
310

reclaiming some of the heat from the flue gases. The savings for this measure over astandard .ovenare.estimated at.50% (Nadel et al. 1993.b).The market for these ovens isfairly strong already and so there may be limited opportunity for increasing theirpenetration (Lobenstein and Hewett 1991).
Ranges equipped. with power.burners instead of atmospheric burners can save anestimated 24% (L()benstein Cilld.Hew~tt 1991).
Infrared. fryers and griddles use.a technolp~y.that .transf~rs h~tdirectly. toth~ food bymeans ofelectiomagneti£ radiati()n. TlUstechnqlp&y.has...a savings .potential.estimatedin.theneighb()rhQO(lpf 3,<t40%.appli~(tik>f1)'er~·,a.nd20-40.% for gri~dles.(LobensteinandHewettJ991) .. Marketpenetrati.()hofthistechnologyappears tp qe}ow., 'Whilenotcurrently.available. pue top~cticalCQn.~l1ls,.-gpddles and fryers utilp:ing pulsecombustion technology offer Potentially.high}S(lviQgs. '
D.3 Electric toGas Fuel-Switching Measures
This.sectionp.rovides.an· overview of gas technologies. that could be substitlJted forel~tric techn()logiesinresidentialandcommercial applicatio~s.'Of course, many of thehigh-efficienc;ygasmeasures d.escribedpreviously arealso<candidate measures for fuel-switchingfroqI electricity togas,;.,The discussion will not duplicate presentatipn·.of thosetechnologies but focuses instead on technologies whose principle applicationwould be insubstituting for electricity.
D.3.1 Residential Space Cooling and Heating
Gas-~ngine .heat pumps, (GEHps).are .regarded by the gas industry. as .an importanttechnologyfo}",spacecooling {and heating}, an. end. use .in which electricity currentlydominates. Morepyer, over thr~-quarters ofnewsingl~7family dwellings••inthe.U.S. areequipped with air conditioning. Heating mode performance of GEHPs was discussed insection 7.4.2. Seasonal cooling mode efficiency of GEHPs has been demonstrated in therange of 90-120% (Klausing et al. 1992). On a site energy basis, the coolingperformance of GEHPs is below that of electric technologies {asmeasured by coefficientof perf0Illlan~),..althpl.lgh ona. source energy. b(lSis GEHPscompete with el~trictechnologies served by a national average power generation fuel mix (Walrod 1992).12
12 The distiDctioDbetvJeen'.s~reand source etler gyis that thela~r encompasses .the energy.con~ntof th~fuel consuD1ed to produce electricity •. Therefore the .GEHPs ope[llting in .cooling .~ are. eXpected to Just meetoulightlyexceed the eqUivalent of the 1993 NAECA standard in temis of total Source energy consumed of
311

One study showed that GEl:lPs'had the highest source energy efficiency over a range ofclimates of any competing air"sOurce technology (or combination of technologies)(L'Ecuyer et al. 1993).
Heat pumps in heating mode operate like an air conditioner in reverse: they extract heatfrom the outdoors and dump it ind()()rs. .'At very low tem~ratures, as the heat pumpefficiency decreases and the heat loss of the residence increases, some form of backupheating is required. ,With elec,tricheat pumps the backup heatin~ is electric resistance.Fora winter peaking utility\Yith .,~larg~residential heating load;ilii~ resistance,heating;fromneaL pumps, c:anbe~~h1Y,~inCide~t,with,. and ~,',significant,contributor to the.system.. 'peak.-' .'. '0. ne.fu....el.-sup.stitu.ti.on.a.pproachisto "replace.".··,theel~tiic.-h.eat.p..ump witha".gas>rornace, using>theh&lfpUlnp<exci~sivelyforairconditioning'1\n '.'alternatetechnology is to bundlegas;'firedheatiIlg coils as auxiliary heating witllelectric heatpumps (also known as the dual-fueFheat pump) instead of usingelecmc resistance as theauxiliary heating.13
Another measure for shifting rromelectricity to' natural' gas for ,residential heating isagas furnace or boiler replacing electric resistance heating. In a retrofit or replacementapplication of a gas warm-air furnace, the feasibility of such a conversion would dependgreatly on whether there •was 'existing ··ductworkfor· vvaim~ait>distribution,."Oron thefeatures, of the site·for installing ductWork:.'·Fora gas' hydronic>boiler:replacingelectricresistance baseboard 'heating, baSeboard hot water distribution systems are commerciallyavailable.
D.3.2 Residential Water Heating, Cooking and Clothes Drying
For these end uses the opportunities for switching from electric appliances to gasappliances are straightforward. •Options include g-ts storage water heaters that meet thefuture NAECA standard or have higher efficiencies that replace-electric:resistance storagewarer hearers and' gas iiangesor clothes dryers that can replaee'theirelectricappliancecounterparts.
minimumcomplying'electric heat pumps served by electricity generated using an average' fuel mix of electricutilities nationwide.
13 While this does provide some market for gas that otherwise would be served by electricity in aconventially configured elt)Ctricheat.pump, the, gas sales.from .theduel-fuel h~~ RumP.wOllld,C()JDe only duringcolder periOds,~h~,:, ~me gliSutilities elt~~~nce, ,their ~ghest ~Fcity,and co~ity cOs~, ,an~ could,leadtplower l()ad factors. (Jiven .tYPicalf1ite-makill8practice,'reyenues/pllid by ,these customers would not ~"ikelY}ocover cOsts.
312

There are. si~tions. in which special opportunities may.exist for. electric togas fuelswitching depending on particular equipment configurations for space and water heating.If, for example, there is a gas hydronicboiler serving space heating loads and an electricresistance storage water heater, the gas boiler can be connected to meet the water heatingload too, effectively converting the.water heater ~to a storage .tank. A gas hydronicboiler system serving both hot water and space~eat needs could also. be employed toreplace an electric resistance baseboard heat and storage water heater configuration.
D.3.3 Commercial Space Heating and Cooling
Electric boilers, electric resistance baseboard, air-source heat pumps, packaged electricresistance heating and compressive cooling are the primary electric technDlogies used fDrspace heating in the commercialsectDr. Gas heating,~~hnplogie~thatC()pI9potentiallyreplace these electric technolDgies include the gasbDilers~ discussed in SectiDn D.2.5under cDmmercial heating efficiency measures.
CDnsiderable attentiDn has been paid ~D e~3;Illining the potential for gas-fir~ cooling.·'teChnDIDgies··to. displace eiectnc .powered· cooling. . Gas utilities looking to improvesystem IDad factors regard gas cooling as an Dpportunity to increase gas usage in thetypically IDWIDad summer and swing· seasonperioos. Meeting space cooling ~DadsalSo.cDntributes signifiCaritly to. peak demands for some electric utilities. Thus shlfting from..electricity to.gas could be po·tentiallyadvan,i,ageous fDr bDth utilities.
Electric technDIDgies currently dominate the market fDr commercial space copling. Thiswas no't always the sitUation. PriDr· to' the 1960's and the advent of increasingly efficientelectric cooling technolDgies, ~as served a considerable share of this market. .In recentyears, gas cooling technDIDgies have eVDlved to the point where they 'can cDmPete withelectric cooling in many instances .
. There are three main technDIDgies fDr gas-fired cOoling: absorption, engine-driven vaporcDmpression,and deSiccant cooling. Gas engine-driven cooling teChnology 'Usethe samerefrigeratiDn cydeas electric vapor compressiDn machines but· substitute the electricmDtDr pOwering the cDmpressDr with a gas-frred engine. The gas engine drive hasimprDved part IDad perfDrmance because· Df the inherent variable speed capability Df thegas engine. SeasDnal COPs of gas engine chillers are currently as high as 1.6 to. 1.7(American Gas Cooling Center·(AGCC) 1992). WaSte heat frDm the engine jacket andexhaust· can be harnessed to. further increase the effective COP to. greater than 2.0depending Dn the amDunt of useable waste heat (American Gas Cooling Center (AGCC)1992). In the future, gas turbines are anticipated to. replace the reciprocating engines usedtoday fDr further efficiency gains.
313

T~QJe0-5. Efficiencies of c.ommerciaJ(;as C.ooling Equipment
Engine-Driven Vapor-CompressionChiller
with Heat Recovery
Absorption Chiller (direct & indirect)Single EffectDouble EffectTriple Effect
Desiccant Cooling System
1.62-1.71'
>2.0'
0.67 - 0.70'0.95.-1.,2'1.4-1.52
0:7-1.52
Sources: , AGCC 1992,2 EPRI1992
A~~rption cooling works on::a different refrigeration cycle from vapor compression,replacing the compressor with ,an abSC?rber~g~neritor and,~o working fluids.(i.e., theabsorbent and refrigerant). Absorption systems were the~iestcommercial gas-firedcooling technology. Absorption systems are classified by whether they utilize waste heat(indiFect) or bum fuel (direct) to power the g~nerator. 'They are also classified by thenumber of generators staged in the~bsorption.cycle as single-effect, double-effect, andtriple~effect.14 Higher efficienci~ are achieved with" the double- and ,tripie-effecttechnologies. Typical COPs of absorption machines are.s~owp in Table 0-5.
Desiccant cooling uses a substance with highly absorbent properties to' absorb watervapor and its associated latentheat" dehumidifying (and Warming) themit cpmes incon~ct With. This m may then be ,cOOled.by indirect andlor direct evapOrative coolingor by 'cOnventional m-conditiomng. .In contrast, vapor "compression and absorptioncooling systems provide dehumidification by cooling.air below the dew pOint, condensingwater vapor on the cooling coils. This latter process: can lead to overcooling in order toachieve the desired humidity level, thus necessitating reheating to maintain. desiredambient temperature level. Desiccant cooling is particularly suited to applications wherethe latent portion of the cooling load is high, such as in hot and humid climates inbuildings with high fresh. m requirements or in supermarkets, restaurants or sports
14 Triple-effect absorption chillers are not yet commercially available. At least one manufacturer has themunder development but they are not expected to be available on the market for several years.
314

facilities. Natural gas is used in the desiccant cooling process to generate heat to driveoff the collected I1loistureand regeD(~ratethedesiccarit for further. absorption. DesiccantcoolingsysteI1lshave approxi~te COPs in the 'raIlge .of.O.7 to 1.5 {Electric PowerResearCh Institute (EPRI) 1992a).lS Desiccants.ca.nbepaired with evaporative coolingsystems as a packaged "total" desiccant cooling system or in a hybrid desiccant/ ..vaporcompression (or absorption) system.
Gas cooling technologies can be configured together with d~fferentequipment dependingon the application and strategy, either as packaged or built-tip systems. Packaged heating.aIld.coolingsyst~I1ls>ar~ .comrp~rciaIlY.availabl~•.'in whic~. one .or both of the ••..spaceconditioning fun~tiOlls~tili~ .•gas .ins~.of ~lectI'icity,,eitherwithgas-[rredheating andelectric compressive cooling,. or.with' gas-firedl1eatiDg and gas engine-driven cooling.GEHPs fof sniallC.ofurtlercialaPRiicati6nsmeh.Uonea earlierareals.o.()ptions for fuel-substit\1tio,n.Gas'~d ele(;tric.~o,o.J.i*~eguipJllent~be c()I1llJinedtogether in the samecel1tralsystemang s~gedt~meeticpolingloadsin the mos.tc.ost-effec;tivemanner, tuned. t.o the local utility tariffs. . ,'.
Finally, though not strictly end-use fuel-switchingper se, gas-fired cogeneration systemscan be advantageously configured to utilize the waste heatfrom the electricity generatorprime mover put towards an absorption cooling (indirecfsystem), desiccant regeneration,or water heating..appli~ti.ol1.
Thiss.ection.d~s~ribes .scveralelectric.DSM options tha,tcould be substituted for gastechnol,ogies. .
D.4.1 Resid~ntial.Space.lleatillg'.- .' :-,C-, ••........... . ",: -.'-'.. -: .. ,.
. TheJll~ority()f .~lec;mc;lieatpuI1lpsS9ldiii;.the]J.S. u~outcloor air asthesour~of heat(.i.e., "air-sO~lT..·ce~.J..•..··.·:mec.tric.grou.nd.,.sourceh~tpumps{C3SaP) are alsoayailable thatdraw.h~t. out of~SoI1le·external..•M>ur~.Qf·heat other than••air, .•sllch as groundwater,surfacewa~r, ciiywat~J;,.store<:i.solar.energy, ..or the ground' itself. The advantage ofground-souf~ oyer alr"Cso.urcel1~t,.pump.sisth,e temperature constancy .oithe heatsource; U.S. groundwater temperalures range from about 42-77°f(Electric PowerResearch Institute (EPRI) and the National Rural Electric Cooperative Association 1989).
IS Calculating COP for desiccant systems is not strictly equivalent to the COP calculated for otherrefrigeration systemS.' "
315

On the other hand, air~sourceheat pumps s,ufferdegraded efficiency and capacity duringcold weather and must utilize supplementary ••heating, (typically. electric resistanceheating). The increased performance of GSHPs.coIll,es at a cost, however, as the firstcost of ground-source heat pumps is considerably higher than air-source types (L'Ecuyeret al. 1993).
DA.i Residential Water Heating
Elec.tric heat pump water heaters. are an opUo~ior 'e~ploitingthe effici~ncyadvantagesof vapor-compression .tf.Cl1nolog~forresid~ntial., water.heati~g.,l'h~tec.l~nology isfundamentallyno different than,that used(or~pace heati,n~and .coolin~excepfthat theseuhits()~rate onl~ in.the heatingm~e.En~rgyfactors forpnits now'onth~market arein the range of 1.5to 2.5, (OasApplian~~4U;lV~3;cturersJ\s~ociation(GA.MJ\) 1993). Atpresent, electric heat pump water heaters nave'less thanl %' of the.r~sidential waterheating market. '
D.4~3 .COITI.mercialWater Heating
Electric heat pump water heaters are also an option forgonullercia1'" wa.ter heatingapplications. COPs of2.0 to 5.0 are common in commercial applications (Electric PowerResearch Institute (EPRI) 1992b). ~ addition'vvith mi~or modification and c()nnections,they can provide useful space cooling asa by-prOduct of the process.
R.efrigeration heat reclaim isa related option for water heating because the heat rejectedfrom food storage refrigeration or air-conditioning systems can be reclaimed for waterheating. 16 The heat is reclaimed by mean~ of a heat exchanger connected to thecondenser of the "host" equipment. Large chillers and heat pumps are available withheat recovery features as a standard option. Whether·'·rerrigeranon 'heat· reclaim "'isdesirable or not will d~nd on the.Specificc~rcUlnstansesat the commercial facility. Alimiting factorof'.this t~of systemis tqattheheafis available only '~h~nthe hostequipment is operating, although storage andlor diversity' of host equipment .canmitigatethis'disadvantage'(Electric Power'Research Institute (EPRl) 1992b)~'A.,moregeneralizedform of the same concept is waste heat water heating which utilizes 'the unused heat fromfluid streams in commerCial fa.cilities, though 'these may not necessarily originate fromelectric equipment.
16 Because virtually all refrigeratiorAequipment is powered by electricitY. this is conside~.an electric fuel-switching option.
316

For commercial laundering, an ozonated system has been developed that significantlyreduces or even eliminates the need for hot water (Nadel et al. 1993a). Because thistechnology consumes electricity that would in most instances be displacing gas (given itsposition in the commercial water heating market) this is also a gas-to-electricity fuel-swit~hingoption. In this system, which also virtually eliminates the use of detergent, thewash water is saturated with ozone, a powerful oxidant that is widely used to disinfectdrinking and swimming pool water. The technology is currently in the prototype phase,but in two field demonstrations has reduced gas usage for hot water by 50-76%.
317

ORNL/SUB/95X-SH985C
Internal Distribution
1. ORNL Patent Office2. Central Research Office3. Document Reference Section4. Laboratory Records (HC)5-7. Laboratory Records Dept.8. Eric Hirst
External Distribution
9-18. OSTI, U.S. Department of Energy, P.O. Box 62, Oak Ridge, TN 3783119. Office of Assistant Manager for Energy Research and Development, DOE/ORO,
P.O. Box 2001 Oak Ridge, TN 37831-8600
318