observations of markarian 421 with the magic telescope
TRANSCRIPT

OBSERVATIONS OF MARKARIAN 421 WITH THE MAGIC TELESCOPE
J. Albert,1
E. Aliu,2
H. Anderhub,3
P. Antoranz,4
A. Armada,2
M. Asensio,4
C. Baixeras,5
J. A. Barrio,4
H. Bartko,6
D. Bastieri,7
J. Becker,8
W. Bednarek,9
K. Berger,1
C. Bigongiari,7
A. Biland,3
R. K. Bock,6,7
P. Bordas,10
V. Bosch-Ramon,10
T. Bretz,1
I. Britvitch,3
M. Camara,4
E. Carmona,6
A. Chilingarian,11
S. Ciprini,12
J. A. Coarasa,6
S. Commichau,3
J. L. Contreras,4
J. Cortina,2
V. Curtef,8
V. Danielyan,11
F. Dazzi,7
A. De Angelis,13
R. de los Reyes,4
B. De Lotto,13
E. Domingo-SantamarI´ıa,
2D. Dorner,
1M. Doro,
7
M. Errando,2
M. Fagiolini,14
D. Ferenc,15
E. Fernandez,2
R. Firpo,2
J. Flix,2
M. V. Fonseca,4
L. Font,5
M. Fuchs,6
N. Galante,6
M. Garczarczyk,6
M. Gaug,7
M. Giller,9
F. Goebel,6
D. Hakobyan,11
M. Hayashida,6
T. Hengstebeck,16
D. Hohne,1
J. Hose,6
C. C. Hsu,6
P. Jacon,9
T. Jogler,6
O. Kalekin,16
R. Kosyra,6
D. Kranich,3
R. Kritzer,1
M. Laatiaoui,6
A. Laille,15
P. Liebing,6
E. Lindfors,12
S. Lombardi,7
F. Longo,17
J. Lopez,2
M. Lopez,4
E. Lorenz,3,6
P. Majumdar,6
G. Maneva,18
K. Mannheim,1
O. Mansutti,13
M. Mariotti,7
M. MartI´ınez,
2D. Mazin,
6,19
C. Merck,6
M. Meucci,14
M. Meyer,1
J. M. Miranda,4
R. Mirzoyan,6
S. Mizobuchi,6
A. Moralejo,2
K. Nilsson,12
J. Ninkovic,6
E. Ona-Wilhelmi,2
R. Orduna,5
N. Otte,6
I. Oya,4
D. Paneque,6
R. Paoletti,14
J. M. Paredes,10
M. Pasanen,12
D. Pascoli,7
F. Pauss,3
R. Pegna,14
M. Persic,13,20
L. Peruzzo,7
A. Piccioli,14
M. Poller,1
E. Prandini,7
A. Raymers,11
W. Rhode,8
M. Ribo,10
J. Rico,2
M. Rissi,3
A. Robert,5
S. Rugamer,1
A. Saggion,7
A. Sanchez,5
P. Sartori,7
V. Scalzotto,7
V. Scapin,7
R. Schmitt,1
T. Schweizer,6
M. Shayduk,6,16
K. Shinozaki,6
S. N. Shore,21
N. Sidro,2
A. Sillanpaa,12
D. Sobczynska,9
A. Stamerra,14
L. S. Stark,3
L. Takalo,12
P. Temnikov,18
D. Tescaro,2
M. Teshima,6
N. Tonello,6
A. Torres,5
D. F. Torres,2,22
N. Turini,14
H. Vankov,18
V. Vitale,13
R. M. Wagner,6
T. Wibig,9
W. Wittek,6
R. Zanin,7
and J. Zapatero5
Received 2006 March 17; accepted 2007 March 13
ABSTRACT
The MAGIC telescope took data of very high energy �-ray emission from the blazar Markarian 421 (Mrk 421)between 2004 November and 2005 April. We present a combined analysis of data samples recorded under different ob-servational conditions, down to �-ray energies of 100 GeV. The flux was found to vary between 0.5 and 2 crab (inte-grated above 200 GeV), considered a low state when compared to known data. Although the flux varied day by day, noshort-term variabilitywas observed, although there is some indication that not all nights show an equally quiescent state.The results at higher energies were found to be consistent with previous observations. A clear correlation is observedbetween �-ray and X-ray fluxes, whereas no significant correlation between �-ray and optical data is seen. The spectralenergy distribution between 100 GeVand 3 TeV shows a clear deviation from a power law, more clearly and at lowerflux than previous observations at higher energies. The deviation persists after correcting for the effect of attenuation bythe extragalactic background light, and most likely is source-inherent. There is a rather clear indication of an inverseCompton peak around 100 GeV. The spectral energy distribution of Mrk 421 can be fitted by a one-zone synchrotronself-Compton model, suggesting once again a leptonic origin of the very high energy �-ray emission from this blazar.
Subject headinggs: BL Lacertae objects: individual (Markarian 421) — gamma rays: observations
Online material: color figure
1. INTRODUCTION
Mrk 421 (redshift z ¼ 0:030) is the closest known and, alongwith Mrk 501, the best studied TeV �-ray emitting blazar. It wasthe first extragalactic source detected in the TeV energy range
using imaging atmospheric Cerenkov telescopes (IACTs; Punchet al. 1992; Petry et al. 1996). Mrk 421 is currently the sourcewith the fastest observed flux variations among TeV �-ray emit-ters. So far it has shown flux variations larger than 1 order of mag-nitude and occasional flux doubling times as short as 15 minutes
A
1 Universitat Wurzburg, D-97074 Wurzburg, Germany.2 Institut de Fısica d’Altes Energies, E-08193 Bellaterra, Spain.3 ETH Zurich, CH-8093 Zurich, Switzerland.4 Universidad Complutense, E-28040 Madrid, Spain.5 Universitat Autonoma de Barcelona, E-08193 Bellaterra, Spain.6 Max-Planck-Institut fur Physik, D-80805 Munchen, Germany; mazin@
mppmu.mpg.de.7 Universita di Padova and INFN, I-35131 Padova, Italy.8 Universitat Dortmund, D-44227 Dortmund, Germany.9 University of xodz, PL-90236 Lodz, Poland.10 Universitat de Barcelona, E-08028 Barcelona, Spain.11 Yerevan Physics Institute, AM-375036 Yerevan, Armenia.
12 Tuorla Observatory, Turku University, FI-21500 Piikkio, Finland.13 Universita di Udine and INFN Trieste, I-33100 Udine, Italy.14 Universita di Siena and INFN Pisa, I-53100 Siena, Italy.15 University of California, Davis, CA 95616-8677.16 Humboldt-Universitat zu Berlin, D-12489 Berlin, Germany.17 Universita di Trieste and INFN Trieste, I-34100 Trieste, Italy.18 Institute for Nuclear Research and Nuclear Energy, BG-1784 Sofia, Bulgaria.19 Corresponding author.20 INAF/Osservatorio Astronomico and INFN Trieste, I-34131 Trieste, Italy.21 Universita di Pisa and INFN Pisa, I-56126 Pisa, Italy.22 Institut de Ciencies de l’Espai (CSIC-IEEC), E-08193 Bellaterra, Spain.
125
The Astrophysical Journal, 663:125Y138, 2007 July 1
# 2007. The American Astronomical Society. All rights reserved. Printed in U.S.A.
(Gaidos et al. 1996; Aharonian et al. 2002). Variations in the hard-ness of the TeV �-ray spectrumduring flares were reported by sev-eral groups (e.g., Krennrich et al. 2002; Aharonian et al. 2005).Simultaneous observations in the X-ray and GeVYTeV bandsshow strong evidence for flux correlation (Krawczynski et al.2001; Byazejowski et al. 2005).
Mrk 421 has been detected and studied in all accessible wave-lengths of the electromagnetic spectrum from radio waves to veryhigh energy (VHE) �-rays. The overall spectral energy distribu-tion (SED) shows a typical two-bump structure with the first peakin the keV energy range and the second maximum at GeVYTeVenergies. The SED is commonly interpreted as beamed, nonther-mal emission of synchrotron and inverse Compton radiation fromultrarelativistic electrons, accelerated by shocks moving alongthe jets at relativistic bulk speed. Simple one-zone synchrotronself-Compton (SSC) models (e.g., Coppi 1992; Costamante &Ghisellini 2002) describe the observational results satisfactorilywell. However, hadronic models (Mannheim et al. 1996; Muckeet al. 2003) can explain the observed features, too. Away to dis-tinguish between the different emissionmodels is to determine theposition of the second peak in the SED, using simultaneous time-resolved data over a broad energy range throughmultiwavelengthcampaigns. This requires providing data in the as yet unexploredgap in the SED.
The MAGIC telescope (Major Atmospheric Gamma ImagingCerenkov telescope; see Lorenz 2004), located on the CanaryIsland La Palma (2200 m above sea level, N28
�450, W17
�540),
completed its commissioning phase in early fall 2004. MAGICis currently the largest IACT, with a 17 m diameter tessellatedreflector dish consisting of 9640:5 ; 0:5m2 diamond-milled alu-minum mirrors. Together with the current configuration of theMAGIC camera with a trigger region of 2.0� diameter (Cortinaet al. 2005), this results in a trigger collection area for �-rays ofthe order of 105 m2, increasing with the zenith angle of the ob-servation. At present the accessible trigger energy range spansfrom 50 to 60 GeV (at small zenith angles) up to tens of TeV.The MAGIC telescope is focused to 10 km distance—the mostlikely position for a 50 GeVair shower. The accuracy in recon-structing the direction of incoming �-rays on an event-by-eventbasis, hereafter the �-ray point spread function (PSF), is about0.1�, slightly depending on the analysis.
The first physics observations in winter 2004Y2005 and inspring 2005 included observations of the well-established TeVblazar Mrk 421. In total, 19 nights of data were taken on thissource, the observation times per night ranging from 30 minutesup to 4 hr. Here we present the results from these observations,covering the energy range from 100 GeV to several TeV.We firstdescribe the data set and analysis techniques in x 2. In x 3, wepresent the results, and finally, in x 4, we compare our resultswith other observations and interpret them in terms of differentmodels.
2. OBSERVATIONS AND DATA ANALYSIS
The Mrk 421 data were taken between 2004 November and2005 April and divided into four samples, for reasons given be-low. Data taken before and after 2005 February were treated sep-arately, due to changes in the telescope hardware.Most of the datawere taken at small zenith angles (ZA < 30
�), i.e., at a low trigger
energy threshold. However, observations made during 1.5 hr ina common campaign with the H.E.S.S. telescope system (Mazinet al. 2005) in 2004 December were taken at 42
� < ZA < 55�.
There were also different observational modes: the standardmodefor MAGIC is the ON-OFF mode, with equal time given to track-ing the source in the center of the camera (ON) and tracking a skyregion near the source but with the source outside the field of view(OFF). This provides a robust estimate of the background. In ourobservations, we considered the �-ray signal from Mrk 421 to bestrong enough to obviate OFF observations, and we estimated thebackground level from the ON data (see below). In 2005 April,part of the data were taken in thewobblemode (Daum et al. 1997).In this mode, two sky directions, opposite and 0.4
�off the source,
were tracked alternately for 20 minutes each, which provides a si-multaneousmeasurement of signal and background. In the wobblemode there is a priori no need for additional OFF data.The observation criteria and some important parameters of the
four data samples are summarized in Table 1. For each data sam-ple a separate Monte Carlo (MC) set of �-ray events was sim-ulated (CORSIKA ver. 6.023; Knapp & Heck 2004; Majumdaret al. 2005), taking into account the zenith angle of observation,the observational mode, and the hardware setup of the telescope.The full data set corresponds to 29.0 hr ON-source observationtime. Runs with problems in the hardware or with unusual trig-ger rates were rejected in order to ensure a stable performanceand good atmospheric conditions. After removing these runs, theremaining observation time was 25.6 hr.For calibration, image cleaning, cut optimization, and energy
reconstruction the standard analysis techniques of the MAGICtelescope (Bretz 2005; Wagner et al. 2005; Gaug et al. 2005)were applied as shortly described below. The calibration of theraw data from theMAGIC camera uses a system consisting of fastand powerful LED pulsers emitting at three different wavelengthswith variable light intensity. Absolute calibration is obtained bycomparing the signal of the pixels with that obtained from a care-fully calibrated PIN diode and is cross-checked by analyzingmuonrings. The time resolution of the readout system has beenmeasuredto be about 700 ps for Cerenkov light flashes of 10 photoelectronsper pixel, reaching 200 ps at 100 photoelectrons. Calibration eventsare taken at 50 Hz, interlaced with normal data, using an externalcalibration trigger.The calibrated images are cleaned using so-called tail cuts:
pixels are retained only if their reconstructed charge signals arelarger than 10 photoelectrons. (‘‘core pixels’’) or if their charges
TABLE 1
Results of the Mrk 421 Data Using the ALPHA Approach
Sample
ON Time
(hr)
ZA Range
(deg) Mode
Ethresh
(GeV) Non NoA Nexcess �
I .................................. 4.63 9.3Y31.2 ON 150 3761 1878 � 32 1883 � 69 29.3
II ................................. 1.53 42.4Y55.0 ON 260 1086 674 � 25 413 � 41 10.1
III................................ 9.30 9.2Y27.5 ON 150 8083 4360 � 49 3723 � 102 38.9
IV ............................... 10.12 9.4Y32.4 Wobble 150 7740 4532 � 67 3208 � 111 29.1
Notes.—Samples I and II were recorded in 2004 November to 2005 January, while samples III and IV were taken in 2005 April. See text for details.
ALBERT ET AL.126 Vol. 663
are larger than 5 photoelectrons and they have at least one neigh-boring core pixel. The camera images are then reduced to imageparameters as in Hillas (1985), adding parameters describing theintensity concentration and asymmetry.
For �/hadron separation amultidimensional classification tech-nique based on the random forest (RF) method (Breiman 2001;Bock et al. 2004) was used. The RF method uses training data(randomly chosen data events and Monte Carlo �-rays, repre-senting background and signal) to find a set of classification treesin the space of image parameters. Multiple trees are combined toform a generalized predictor by taking the mean classificationfrom all trees. The predictor, called hadronness, spans a range be-tween 0 and 1 and characterizes the event images being less ormore hadronlike.
In our analysis, classical image shape parameters such asWIDTH, LENGTH, DIST, and SIZE were used as input param-eters. The cuts in hadronness for the �/hadron separation weretrained for each data set separately and were then chosen suchthat the overall cut efficiency forMC �-ray events remained about50%. The corresponding hadron suppression is about 90%Y99%,improving with increasing SIZE of the events.
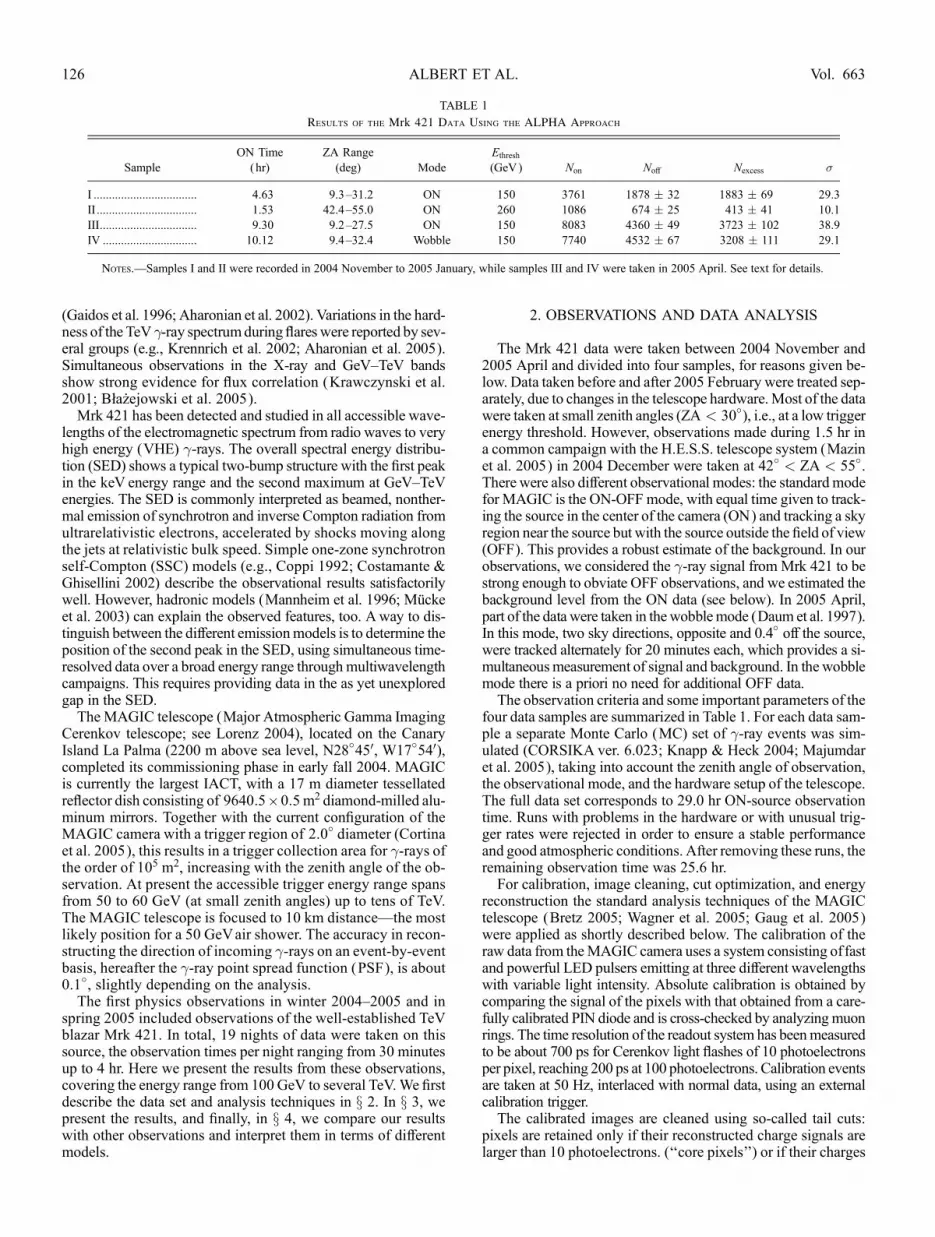
A critical variable not used in the RF classification tree isALPHA, the angle between the major image axis and the lineconnecting the center of gravity of the image with the source po-sition in the camera plane. In stand-alone IACTs, ALPHA is com-monly used, after all previously noted cuts, to extract the �-raysignal from the data and to estimate the level of background.For a point source, the ALPHA distribution of the �-like eventsis expected to peak at low values of ALPHA, whereas for back-ground events the distribution should be flat or slowly varyingwith ALPHA.
In the case of our ON-mode data, the background remainingafter �/hadron separation was estimated from the ALPHA distri-bution by performing a second-order polynomial fit (without alinear term) in the range between 30� and 90� where no contri-bution from �-ray events is expected (see Fig. 1). The signalwas then determined as the number of observed events in therangeALPHA < ALPHA0 exceeding the fit extrapolated to smallALPHA, where ALPHA0 is energy dependent and has a typical
value of 15�. The significance of an excess is then calculated ac-cording to equation (17) in Li & Ma (1983).
In the wobble mode, the ON (‘‘source’’) data are defined bycalculating image parameters with respect to the source position,whereas OFF data are obtained from the same events but withimage parameters calculated with respect to the position on theopposite side of the camera, the ‘‘antisource’’ position. In orderto avoid an unwanted contribution from �-ray events in the OFFsample and to guarantee the statistical independence between theON and the OFF samples in the signal region, the followingprocedure is applied: events withALPHAsource < ALPHA0 (withALPHAsource calculated with respect to the source position) areexcluded from the OFF sample, and events with ALPHAantisource <ALPHA0 (withALPHAantisource calculatedwith respect to the anti-source position) are excluded from the ON sample. This cut as-sures that the ALPHA distributions for ON and OFF events arestatistically independent for ALPHA < ALPHA0. The ALPHAapproach was used to determine the excess events for all four datasets (Table 1).
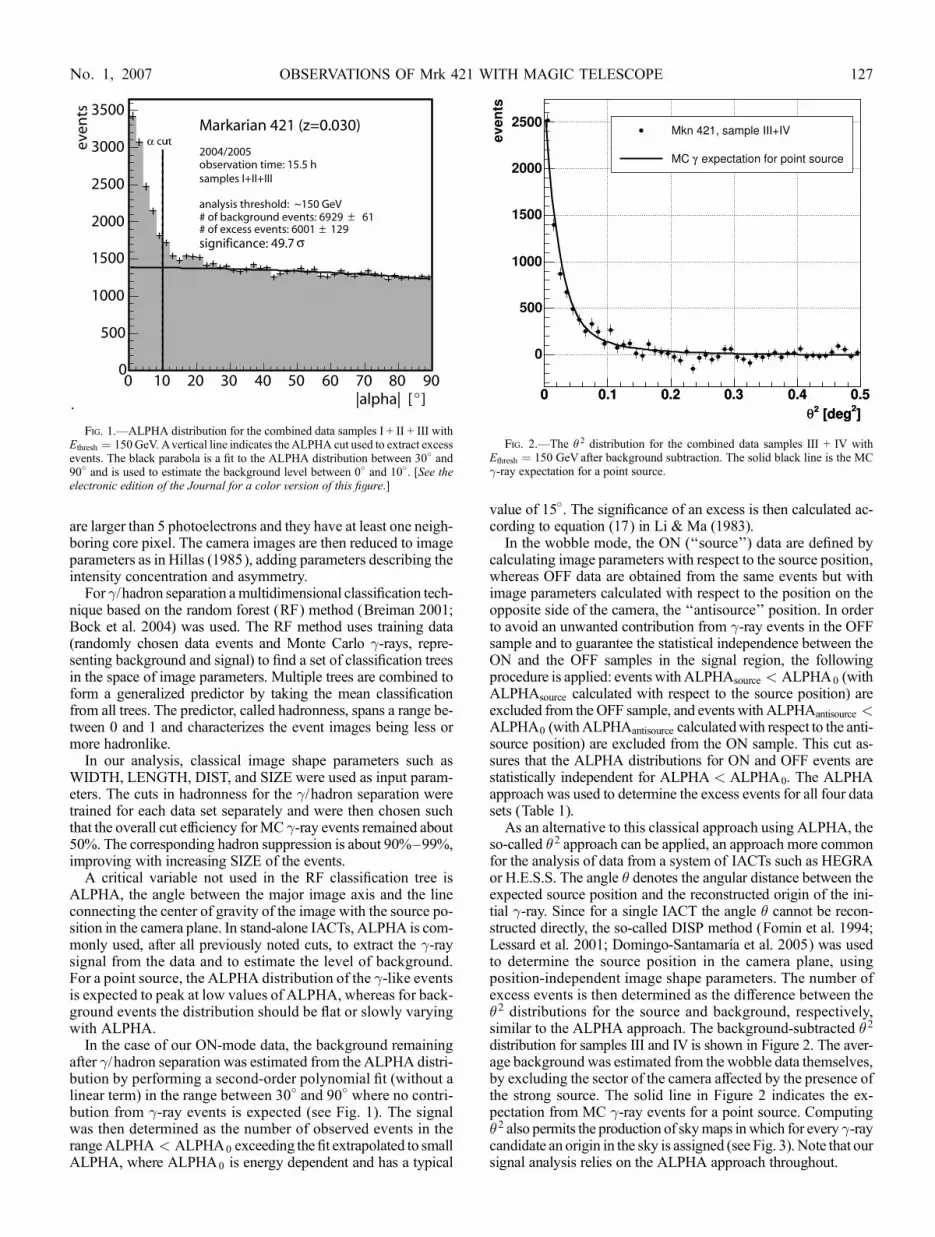
As an alternative to this classical approach using ALPHA, theso-called �2 approach can be applied, an approach more commonfor the analysis of data from a system of IACTs such as HEGRAor H.E.S.S. The angle � denotes the angular distance between theexpected source position and the reconstructed origin of the ini-tial �-ray. Since for a single IACT the angle � cannot be recon-structed directly, the so-called DISP method (Fomin et al. 1994;Lessard et al. 2001; Domingo-Santamarıa et al. 2005) was usedto determine the source position in the camera plane, usingposition-independent image shape parameters. The number ofexcess events is then determined as the difference between the�2 distributions for the source and background, respectively,similar to the ALPHA approach. The background-subtracted �2
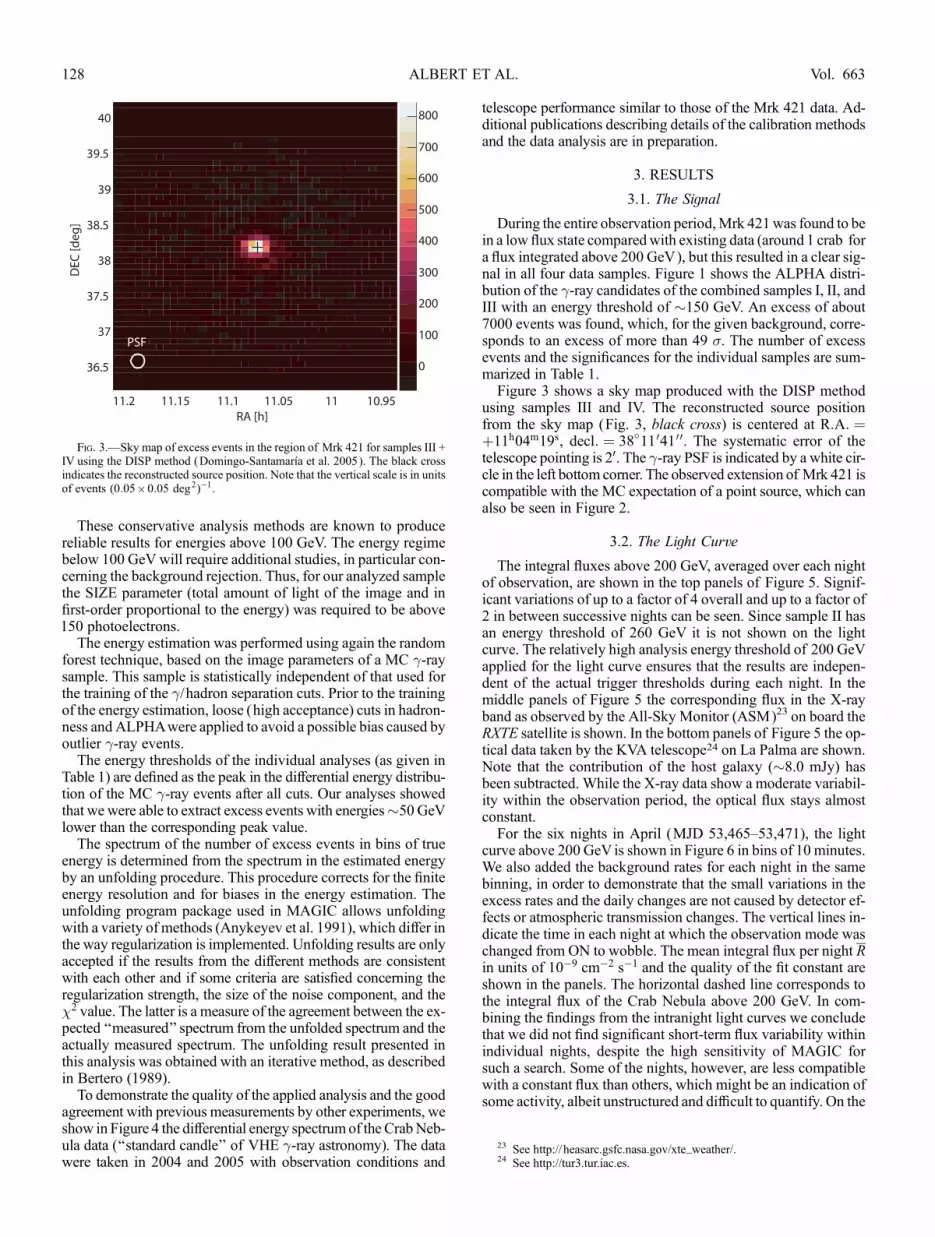
distribution for samples III and IV is shown in Figure 2. The aver-age background was estimated from the wobble data themselves,by excluding the sector of the camera affected by the presence ofthe strong source. The solid line in Figure 2 indicates the ex-pectation from MC �-ray events for a point source. Computing�2 also permits the production of skymaps inwhich for every �-raycandidate an origin in the sky is assigned (see Fig. 3). Note that oursignal analysis relies on the ALPHA approach throughout.
Fig. 1.—ALPHA distribution for the combined data samples I + II + III withEthresh ¼ 150GeV. Avertical line indicates the ALPHA cut used to extract excessevents. The black parabola is a fit to the ALPHA distribution between 30� and90� and is used to estimate the background level between 0� and 10�. [See theelectronic edition of the Journal for a color version of this figure.]
Fig. 2.—The � 2 distribution for the combined data samples III + IV withEthresh ¼ 150 GeV after background subtraction. The solid black line is the MC�-ray expectation for a point source.
OBSERVATIONS OF Mrk 421 WITH MAGIC TELESCOPE 127No. 1, 2007
These conservative analysis methods are known to producereliable results for energies above 100 GeV. The energy regimebelow 100 GeV will require additional studies, in particular con-cerning the background rejection. Thus, for our analyzed samplethe SIZE parameter (total amount of light of the image and infirst-order proportional to the energy) was required to be above150 photoelectrons.
The energy estimation was performed using again the randomforest technique, based on the image parameters of a MC �-raysample. This sample is statistically independent of that used forthe training of the �/hadron separation cuts. Prior to the trainingof the energy estimation, loose (high acceptance) cuts in hadron-ness and ALPHAwere applied to avoid a possible bias caused byoutlier �-ray events.
The energy thresholds of the individual analyses (as given inTable 1) are defined as the peak in the differential energy distribu-tion of the MC �-ray events after all cuts. Our analyses showedthat we were able to extract excess events with energies�50 GeVlower than the corresponding peak value.
The spectrum of the number of excess events in bins of trueenergy is determined from the spectrum in the estimated energyby an unfolding procedure. This procedure corrects for the finiteenergy resolution and for biases in the energy estimation. Theunfolding program package used in MAGIC allows unfoldingwith a variety of methods (Anykeyev et al. 1991), which differ inthe way regularization is implemented. Unfolding results are onlyaccepted if the results from the different methods are consistentwith each other and if some criteria are satisfied concerning theregularization strength, the size of the noise component, and the�2 value. The latter is a measure of the agreement between the ex-pected ‘‘measured’’ spectrum from the unfolded spectrum and theactually measured spectrum. The unfolding result presented inthis analysis was obtained with an iterative method, as describedin Bertero (1989).
To demonstrate the quality of the applied analysis and the goodagreement with previous measurements by other experiments, weshow in Figure 4 the differential energy spectrumof the CrabNeb-ula data (‘‘standard candle’’ of VHE �-ray astronomy). The datawere taken in 2004 and 2005 with observation conditions and
telescope performance similar to those of the Mrk 421 data. Ad-ditional publications describing details of the calibration methodsand the data analysis are in preparation.
3. RESULTS
3.1. The Signal
During the entire observation period,Mrk 421was found to bein a low flux state comparedwith existing data (around 1 crab fora flux integrated above 200 GeV), but this resulted in a clear sig-nal in all four data samples. Figure 1 shows the ALPHA distri-bution of the �-ray candidates of the combined samples I, II, andIII with an energy threshold of �150 GeV. An excess of about7000 events was found, which, for the given background, corre-sponds to an excess of more than 49 �. The number of excessevents and the significances for the individual samples are sum-marized in Table 1.Figure 3 shows a sky map produced with the DISP method
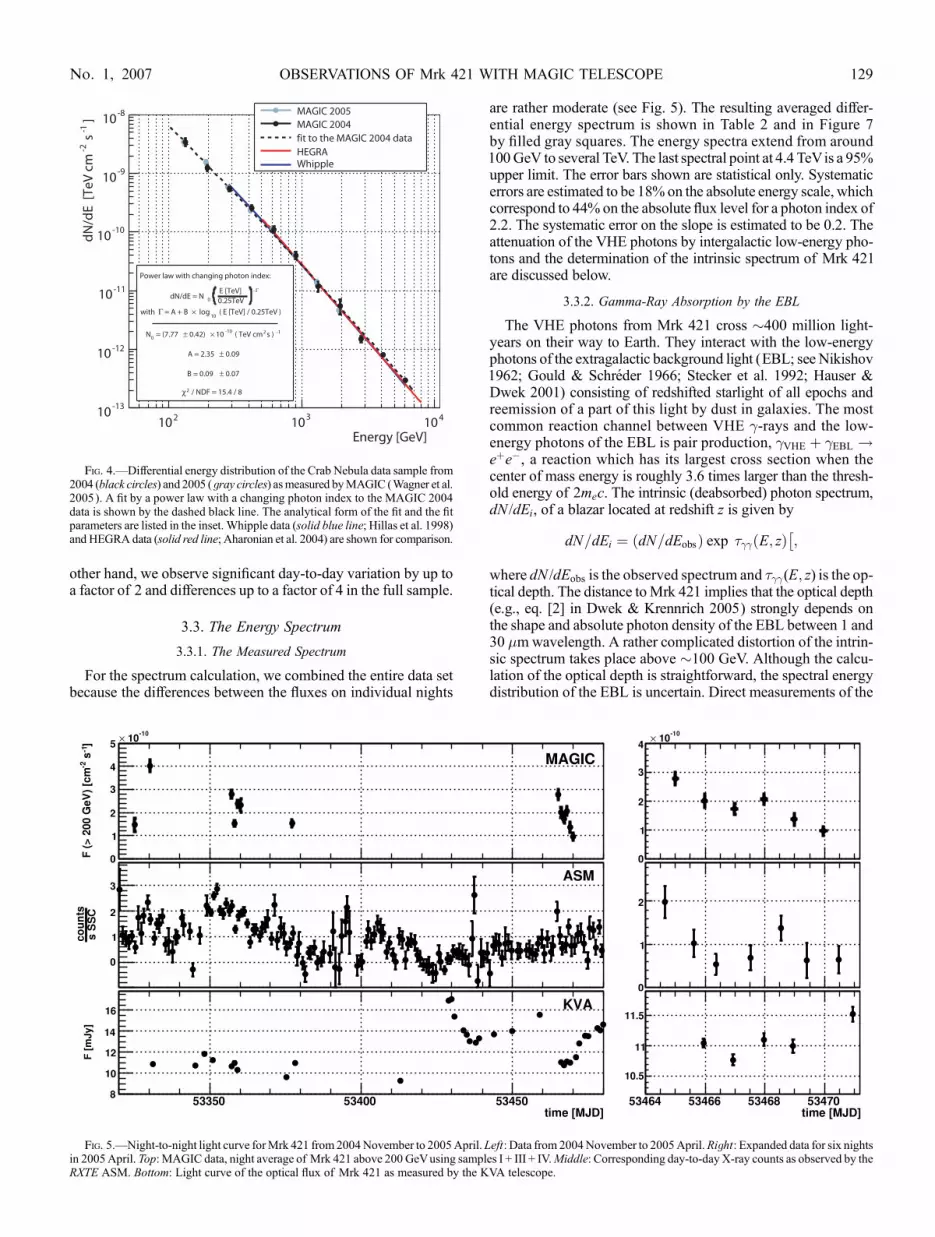
using samples III and IV. The reconstructed source positionfrom the sky map (Fig. 3, black cross) is centered at R:A: ¼þ11h04m19s, decl: ¼ 38�1104100. The systematic error of thetelescope pointing is 20. The �-ray PSF is indicated by a white cir-cle in the left bottom corner. The observed extension of Mrk 421 iscompatible with the MC expectation of a point source, which canalso be seen in Figure 2.
3.2. The Light Curve
The integral fluxes above 200 GeV, averaged over each nightof observation, are shown in the top panels of Figure 5. Signif-icant variations of up to a factor of 4 overall and up to a factor of2 in between successive nights can be seen. Since sample II hasan energy threshold of 260 GeV it is not shown on the lightcurve. The relatively high analysis energy threshold of 200 GeVapplied for the light curve ensures that the results are indepen-dent of the actual trigger thresholds during each night. In themiddle panels of Figure 5 the corresponding flux in the X-rayband as observed by the All-Sky Monitor (ASM)23 on board theRXTE satellite is shown. In the bottom panels of Figure 5 the op-tical data taken by the KVA telescope24 on La Palma are shown.Note that the contribution of the host galaxy (�8.0 mJy) hasbeen subtracted. While the X-ray data show a moderate variabil-ity within the observation period, the optical flux stays almostconstant.For the six nights in April (MJD 53,465Y53,471), the light
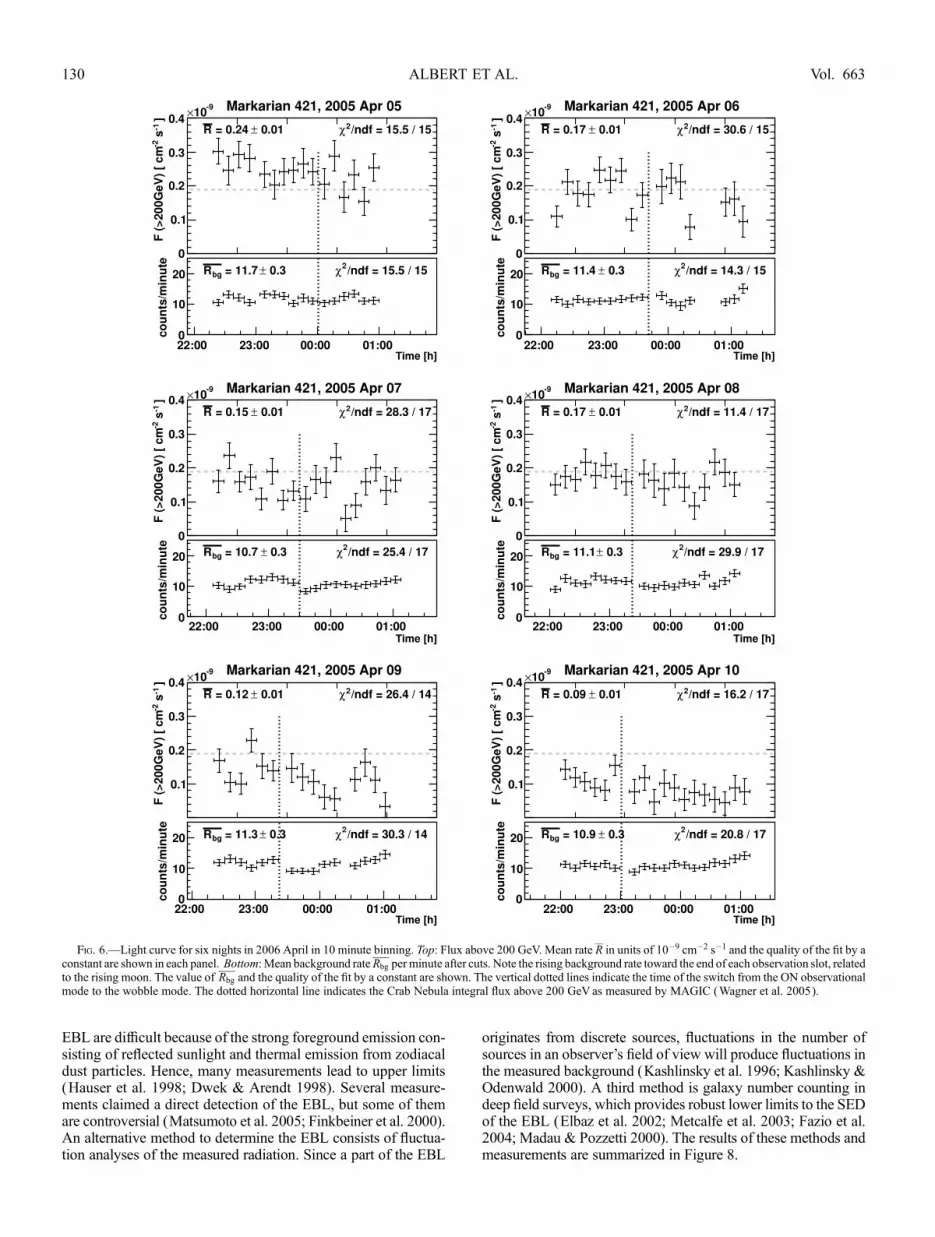
curve above 200 GeV is shown in Figure 6 in bins of 10 minutes.We also added the background rates for each night in the samebinning, in order to demonstrate that the small variations in theexcess rates and the daily changes are not caused by detector ef-fects or atmospheric transmission changes. The vertical lines in-dicate the time in each night at which the observation mode waschanged from ON to wobble. The mean integral flux per night Rin units of 10�9 cm�2 s�1 and the quality of the fit constant areshown in the panels. The horizontal dashed line corresponds tothe integral flux of the Crab Nebula above 200 GeV. In com-bining the findings from the intranight light curves we concludethat we did not find significant short-term flux variability withinindividual nights, despite the high sensitivity of MAGIC forsuch a search. Some of the nights, however, are less compatiblewith a constant flux than others, which might be an indication ofsome activity, albeit unstructured and difficult to quantify. On the
Fig. 3.—Sky map of excess events in the region of Mrk 421 for samples III +IV using the DISP method (Domingo-Santamarıa et al. 2005). The black crossindicates the reconstructed source position. Note that the vertical scale is in unitsof events (0:05 ; 0:05 deg2)�1.
23 See http:// heasarc.gsfc.nasa.gov/xte_weather/.24 See http://tur3.tur.iac.es.
ALBERT ET AL.128 Vol. 663
other hand, we observe significant day-to-day variation by up toa factor of 2 and differences up to a factor of 4 in the full sample.
3.3. The Energy Spectrum
3.3.1. The Measured Spectrum
For the spectrum calculation, we combined the entire data setbecause the differences between the fluxes on individual nights
are rather moderate (see Fig. 5). The resulting averaged differ-ential energy spectrum is shown in Table 2 and in Figure 7by filled gray squares. The energy spectra extend from around100GeV to several TeV. The last spectral point at 4.4 TeVis a 95%upper limit. The error bars shown are statistical only. Systematicerrors are estimated to be 18% on the absolute energy scale, whichcorrespond to 44% on the absolute flux level for a photon index of2.2. The systematic error on the slope is estimated to be 0.2. Theattenuation of the VHE photons by intergalactic low-energy pho-tons and the determination of the intrinsic spectrum of Mrk 421are discussed below.
3.3.2. Gamma-Ray Absorption by the EBL
The VHE photons from Mrk 421 cross �400 million light-years on their way to Earth. They interact with the low-energyphotons of the extragalactic background light (EBL; see Nikishov1962; Gould & Schreder 1966; Stecker et al. 1992; Hauser &Dwek 2001) consisting of redshifted starlight of all epochs andreemission of a part of this light by dust in galaxies. The mostcommon reaction channel between VHE �-rays and the low-energy photons of the EBL is pair production, �VHE þ �EBL !eþe�, a reaction which has its largest cross section when thecenter of mass energy is roughly 3.6 times larger than the thresh-old energy of 2mec. The intrinsic (deabsorbed) photon spectrum,dN /dEi, of a blazar located at redshift z is given by
dN=dEi ¼ dN=dEobsð Þ exp ��� E; zð Þ� �
;
where dN /dEobs is the observed spectrum and ���(E; z) is the op-tical depth. The distance toMrk 421 implies that the optical depth(e.g., eq. [2] in Dwek & Krennrich 2005) strongly depends onthe shape and absolute photon density of the EBL between 1 and30 �mwavelength. A rather complicated distortion of the intrin-sic spectrum takes place above �100 GeV. Although the calcu-lation of the optical depth is straightforward, the spectral energydistribution of the EBL is uncertain. Direct measurements of the
Fig. 5.—Night-to-night light curve forMrk 421 from 2004November to 2005April. Left: Data from 2004November to 2005April.Right: Expanded data for six nightsin 2005April. Top: MAGIC data, night average of Mrk 421 above 200 GeVusing samples I + III + IV.Middle: Corresponding day-to-day X-ray counts as observed by theRXTE ASM. Bottom: Light curve of the optical flux of Mrk 421 as measured by the KVA telescope.
Fig. 4.—Differential energy distribution of the Crab Nebula data sample from2004 (black circles) and 2005 (gray circles) asmeasured byMAGIC (Wagner et al.2005). A fit by a power law with a changing photon index to the MAGIC 2004data is shown by the dashed black line. The analytical form of the fit and the fitparameters are listed in the inset. Whipple data (solid blue line; Hillas et al. 1998)and HEGRAdata (solid red line; Aharonian et al. 2004) are shown for comparison.
OBSERVATIONS OF Mrk 421 WITH MAGIC TELESCOPE 129No. 1, 2007
EBL are difficult because of the strong foreground emission con-sisting of reflected sunlight and thermal emission from zodiacaldust particles. Hence, many measurements lead to upper limits(Hauser et al. 1998; Dwek & Arendt 1998). Several measure-ments claimed a direct detection of the EBL, but some of themare controversial (Matsumoto et al. 2005; Finkbeiner et al. 2000).An alternative method to determine the EBL consists of fluctua-tion analyses of the measured radiation. Since a part of the EBL
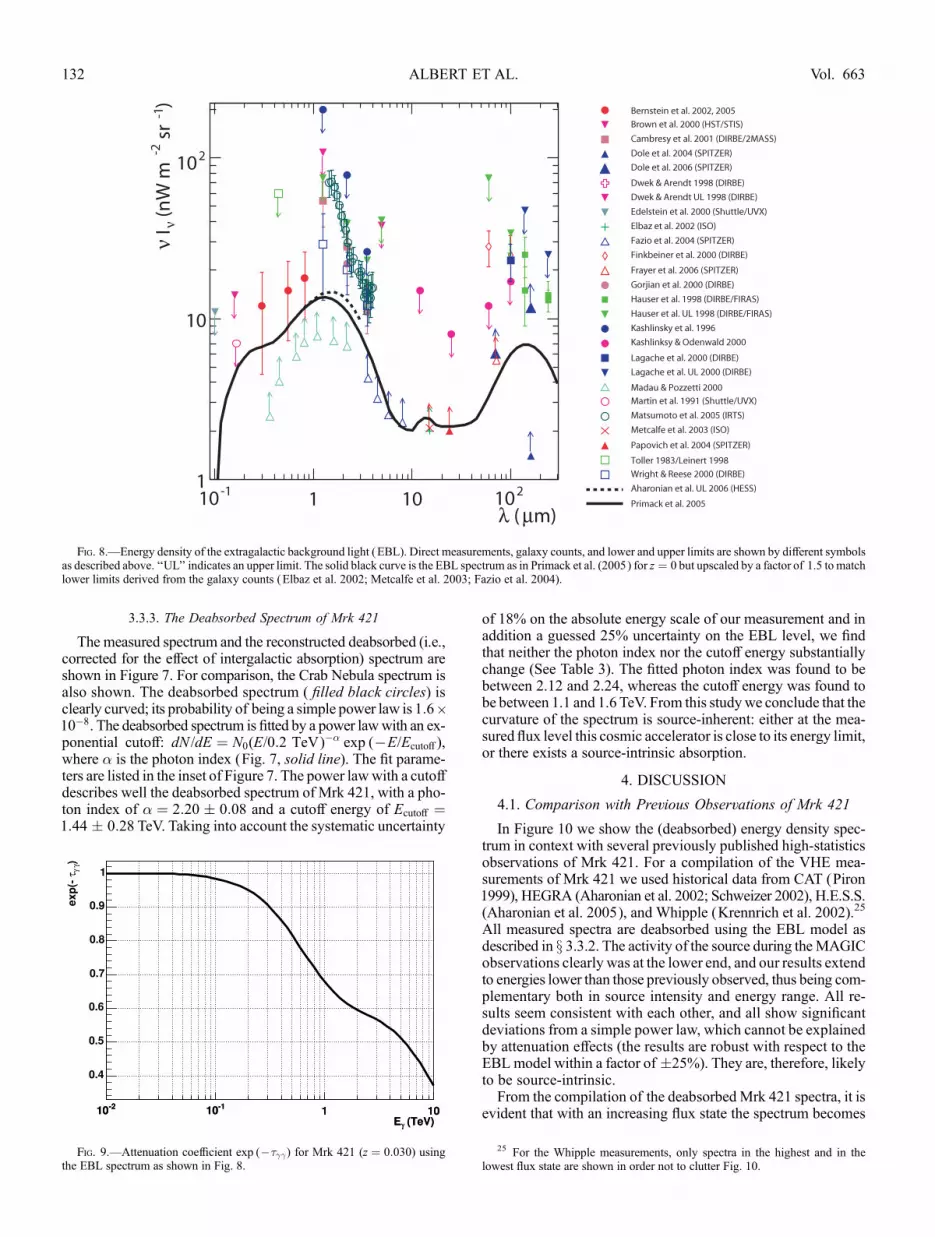
originates from discrete sources, fluctuations in the number ofsources in an observer’s field of view will produce fluctuations inthe measured background (Kashlinsky et al. 1996; Kashlinsky &Odenwald 2000). A third method is galaxy number counting indeep field surveys, which provides robust lower limits to the SEDof the EBL (Elbaz et al. 2002; Metcalfe et al. 2003; Fazio et al.2004; Madau & Pozzetti 2000). The results of these methods andmeasurements are summarized in Figure 8.
Fig. 6.—Light curve for six nights in 2006 April in 10 minute binning. Top: Flux above 200 GeV. Mean rate R in units of 10�9 cm�2 s�1 and the quality of the fit by aconstant are shown in each panel. Bottom: Mean background rateRbg per minute after cuts. Note the rising background rate toward the end of each observation slot, relatedto the rising moon. The value of Rbg and the quality of the fit by a constant are shown. The vertical dotted lines indicate the time of the switch from the ON observationalmode to the wobble mode. The dotted horizontal line indicates the Crab Nebula integral flux above 200 GeV as measured by MAGIC (Wagner et al. 2005).
ALBERT ET AL.130 Vol. 663

In principle, upper limits on theEBLcan also be determined fromobserved �-ray spectra frommedium- to high-redshift TeV blazars.Under assumptions that the reconstructed TeV blazar spectrum isnot too hard and does not have a pileup at high energies, the EBLlevel can be constrained (seeHauser&Dwek [2001] for a summaryand Aharonian et al. [2006] for the latest results). However, since
the measured spectrum of Mrk 421 is much softer that that ofMrk 501, which is located at similar redshift, the softness seems tobe intrinsic. In addition, the data in this paper extend up to 3 TeVonly (historical data of Mrk 421 extend up to 20 TeV), whichfurther weakens possible constraints from such a nearby source.We therefore do not try to constrain the EBL using this Mrk 421data set.
Instead, we adopt the recent model of Primack et al. (2005)scaled up by a factor of 1.5 (which is within the model uncer-tainties), to match lower limits set by the Spitzer mission andISOCAM in the range of 4Y15�m (Fazio et al. 2004; Elbaz et al.2002;Metcalfe et al. 2003). The resulting EBL spectrum is shownin Figure 8 by the black curve. This EBL spectrum agrees withalternativemodels (e.g., Kneiske et al. 2004; Pei et al. 1999; Blainet al. 1999; Stecker et al. 2006) which are designed to predict theEBL today. It is also very close to the upper limits inferred fromar-guments on active galactic nucleus spectra (Aharonian et al. 2006).Using this EBL spectrum and state-of-the-art cosmology (flat uni-verse, Hubble constant H0 ¼ 72 km s�1 Mpc�1, matter den-sity�m ¼ 0:3, and dark energy density�� ¼ 0:7) we calculatedthe optical depth ��� for Mrk 421. Thereby we used numericalintegration of equation (2) from Dwek & Krennrich (2005). Theattenuation coefficients exp (����) are shown as the function ofenergy of VHE �-rays in Figure 9. We note that the attenuationcoefficients are very similar to those from Stecker et al. (2006).
TABLE 2
Averaged Measured Differential Energy Spectrum of Mrk 421
Energy Bin (GeV)
Bin No.
Lower Bin
Limit
Mean
Energy
Upper Bin
Limit
Differential Flux dN=dE(photons [TeV cm2 s]�1)
1............ 108 134 167 (3.72 � 0.34) ; 10�9
2............ 167 208 259 (1.21 � 0.04) ; 10�9
3............ 259 321 402 (3.77 � 0.15) ; 10�10
4............ 402 498 623 (1.32 � 0.05) ; 10�10
5............ 623 770 965 (3.63 � 0.19) ; 10�11
6............ 965 1192 1497 (8.95 � 0.71) ; 10�12
7............ 1497 1845 2321 (2.26 � 0.27) ; 10�12
8............ 2321 2856 3598 (2.88 � 1.20) ; 10�13
9............ 3598 4429 5579 <1.10 ; 10�13
Notes.—Values are derived from the data set presented in this paper. Thelast point is a 95% upper limit.
Fig. 7.—Differential energy distribution for Mrk 421 averaged over the whole data sample. The measured energy spectrum is shown by the filled gray squares and thedeabsorbed spectrum by the filled black circles. The spectral point at the highest energy is a 95% upper limit. The gray shaded area corresponds to a systematic error from aslope error of �0.2 as quoted in the text. The solid black line indicates the best fit to the deabsorbed spectrum by a power law with exponential cutoff; its parameters arelisted in the inset. For comparison, the measured Crab Nebula spectrum (Wagner et al. 2005) is shown by the dotted gray line.
OBSERVATIONS OF Mrk 421 WITH MAGIC TELESCOPE 131No. 1, 2007
3.3.3. The Deabsorbed Spectrum of Mrk 421
The measured spectrum and the reconstructed deabsorbed (i.e.,corrected for the effect of intergalactic absorption) spectrum areshown in Figure 7. For comparison, the Crab Nebula spectrum isalso shown. The deabsorbed spectrum ( filled black circles) isclearly curved; its probability of being a simple power law is 1:6 ;10�8. The deabsorbed spectrum is fitted by a power lawwith an ex-ponential cutoff: dN /dE ¼ N0(E/0:2 TeV)�� exp (�E/EcutoA),where � is the photon index (Fig. 7, solid line). The fit parame-ters are listed in the inset of Figure 7. The power lawwith a cutoffdescribes well the deabsorbed spectrum of Mrk 421, with a pho-ton index of � ¼ 2:20 � 0:08 and a cutoff energy of EcutoA ¼1:44 � 0:28 TeV. Taking into account the systematic uncertainty
of 18% on the absolute energy scale of our measurement and inaddition a guessed 25% uncertainty on the EBL level, we findthat neither the photon index nor the cutoff energy substantiallychange (See Table 3). The fitted photon index was found to bebetween 2.12 and 2.24, whereas the cutoff energy was found tobe between 1.1 and 1.6 TeV. From this studywe conclude that thecurvature of the spectrum is source-inherent: either at the mea-sured flux level this cosmic accelerator is close to its energy limit,or there exists a source-intrinsic absorption.
4. DISCUSSION
4.1. Comparison with Previous Observations of Mrk 421
In Figure 10 we show the (deabsorbed) energy density spec-trum in context with several previously published high-statisticsobservations of Mrk 421. For a compilation of the VHE mea-surements of Mrk 421 we used historical data from CAT (Piron1999), HEGRA (Aharonian et al. 2002; Schweizer 2002), H.E.S.S.(Aharonian et al. 2005), and Whipple (Krennrich et al. 2002).25
All measured spectra are deabsorbed using the EBL model asdescribed in x 3.3.2. The activity of the source during theMAGICobservations clearly was at the lower end, and our results extendto energies lower than those previously observed, thus being com-plementary both in source intensity and energy range. All re-sults seem consistent with each other, and all show significantdeviations from a simple power law, which cannot be explainedby attenuation effects (the results are robust with respect to theEBLmodel within a factor of �25%). They are, therefore, likelyto be source-intrinsic.From the compilation of the deabsorbedMrk 421 spectra, it is
evident that with an increasing flux state the spectrum becomes
Fig. 8.—Energy density of the extragalactic background light (EBL). Direct measurements, galaxy counts, and lower and upper limits are shown by different symbolsas described above. ‘‘UL’’ indicates an upper limit. The solid black curve is the EBL spectrum as in Primack et al. (2005) for z ¼ 0 but upscaled by a factor of 1.5 to matchlower limits derived from the galaxy counts (Elbaz et al. 2002; Metcalfe et al. 2003; Fazio et al. 2004).
Fig. 9.—Attenuation coefficient exp (����) for Mrk 421 (z ¼ 0:030) usingthe EBL spectrum as shown in Fig. 8.
25 For the Whipple measurements, only spectra in the highest and in thelowest flux state are shown in order not to clutter Fig. 10.
ALBERT ET AL.132 Vol. 663
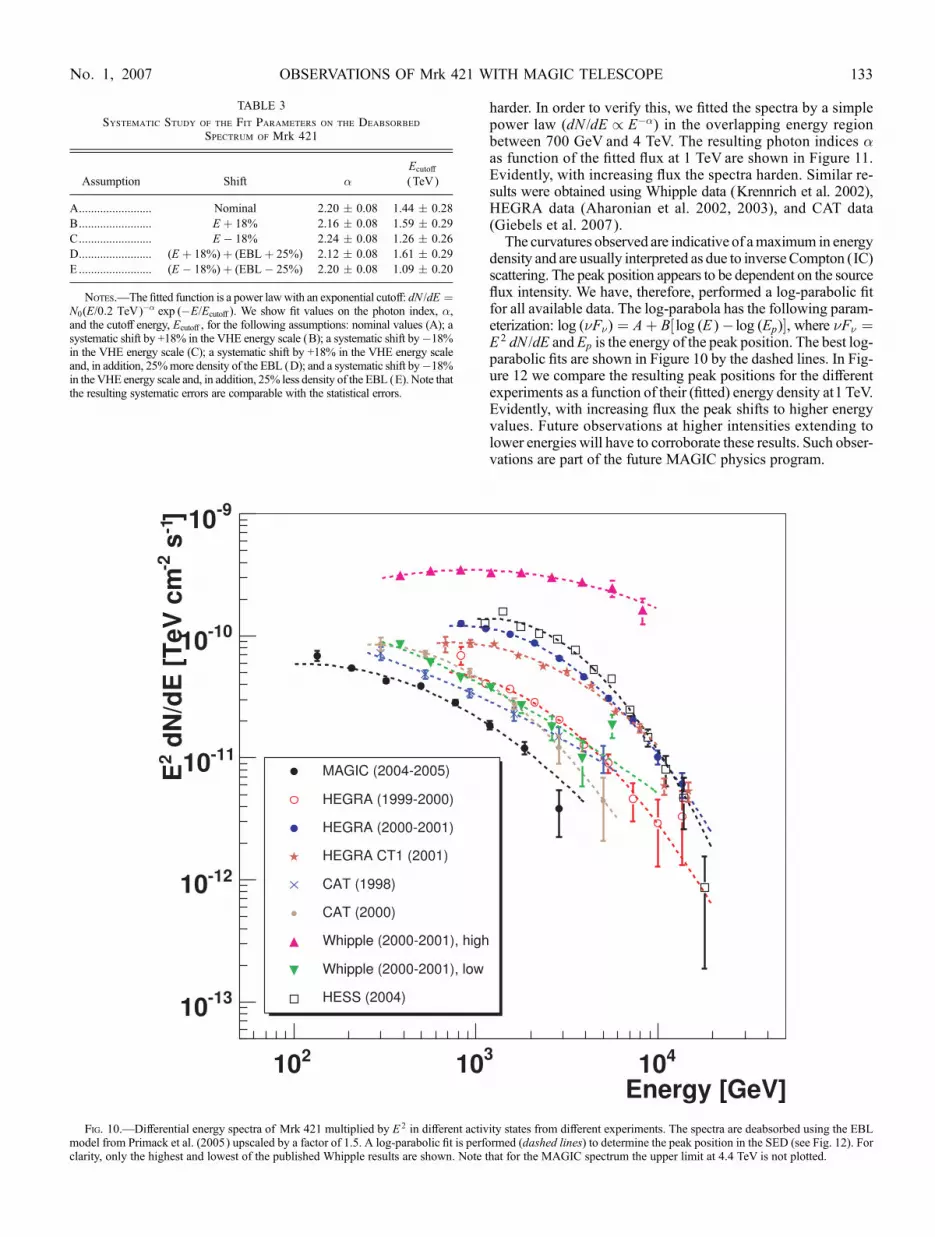
harder. In order to verify this, we fitted the spectra by a simplepower law (dN /dE / E��) in the overlapping energy regionbetween 700 GeV and 4 TeV. The resulting photon indices �as function of the fitted flux at 1 TeV are shown in Figure 11.Evidently, with increasing flux the spectra harden. Similar re-sults were obtained using Whipple data (Krennrich et al. 2002),HEGRA data (Aharonian et al. 2002, 2003), and CAT data(Giebels et al. 2007).
The curvatures observed are indicative of amaximum in energydensity and are usually interpreted as due to inverseCompton (IC)scattering. The peak position appears to be dependent on the sourceflux intensity. We have, therefore, performed a log-parabolic fitfor all available data. The log-parabola has the following param-eterization: log (�F�) ¼ Aþ B½ log (E )� log (Ep)�, where �F� ¼E 2 dN /dE and Ep is the energy of the peak position. The best log-parabolic fits are shown in Figure 10 by the dashed lines. In Fig-ure 12 we compare the resulting peak positions for the differentexperiments as a function of their (fitted) energy density at1 TeV.Evidently, with increasing flux the peak shifts to higher energyvalues. Future observations at higher intensities extending tolower energies will have to corroborate these results. Such obser-vations are part of the future MAGIC physics program.
TABLE 3
Systematic Study of the Fit Parameters on the Deabsorbed
Spectrum of Mrk 421
Assumption Shift �EcutoA
(TeV)
A........................ Nominal 2.20 � 0.08 1.44 � 0.28
B........................ E þ 18% 2.16 � 0.08 1.59 � 0.29
C........................ E � 18% 2.24 � 0.08 1.26 � 0.26
D........................ (E þ 18%)þ (EBLþ 25%) 2.12 � 0.08 1.61 � 0.29
E ........................ (E � 18%)þ (EBL� 25%) 2.20 � 0.08 1.09 � 0.20
Notes.—The fitted function is a power lawwith an exponential cutoff: dN /dE ¼N0(E/0:2 TeV)�� exp (�E/EcutoA). We show fit values on the photon index, �,and the cutoff energy, EcutoA, for the following assumptions: nominal values (A); asystematic shift by +18% in the VHE energy scale (B); a systematic shift by�18%in the VHE energy scale (C); a systematic shift by +18% in the VHE energy scaleand, in addition, 25%more density of the EBL (D); and a systematic shift by�18%in the VHE energy scale and, in addition, 25% less density of the EBL (E). Note thatthe resulting systematic errors are comparable with the statistical errors.
Fig. 10.—Differential energy spectra of Mrk 421 multiplied by E 2 in different activity states from different experiments. The spectra are deabsorbed using the EBLmodel from Primack et al. (2005) upscaled by a factor of 1.5. A log-parabolic fit is performed (dashed lines) to determine the peak position in the SED (see Fig. 12). Forclarity, only the highest and lowest of the published Whipple results are shown. Note that for the MAGIC spectrum the upper limit at 4.4 TeV is not plotted.
OBSERVATIONS OF Mrk 421 WITH MAGIC TELESCOPE 133No. 1, 2007
4.2. A Short Comment on the Light Curves
In the observation period between 2004 November and 2005April we observed night-to-night flux variations up to a factor of2 and amaximum flux change in the entire set of a factor of 4. Noshort-term flux variations well below 1 hr, as observed duringhigh flaring activity in previous experiments (Gaidos et al. 1996;Aharonian et al. 2002), were seen, although the sensitivity ofMAGIC would allow the detection of fast flares in the given fluxrange. Two equally likely explanations are that either we deal withlarge fluctuations, resulting in the absence of any fast flare duringthe observation period, or fast flaring is a feature that occurs onlywhen the source is very active. This calls for further high-statisticsand high-sensitivity studies when the source is in its low flux state.
4.3. Correlation Studies
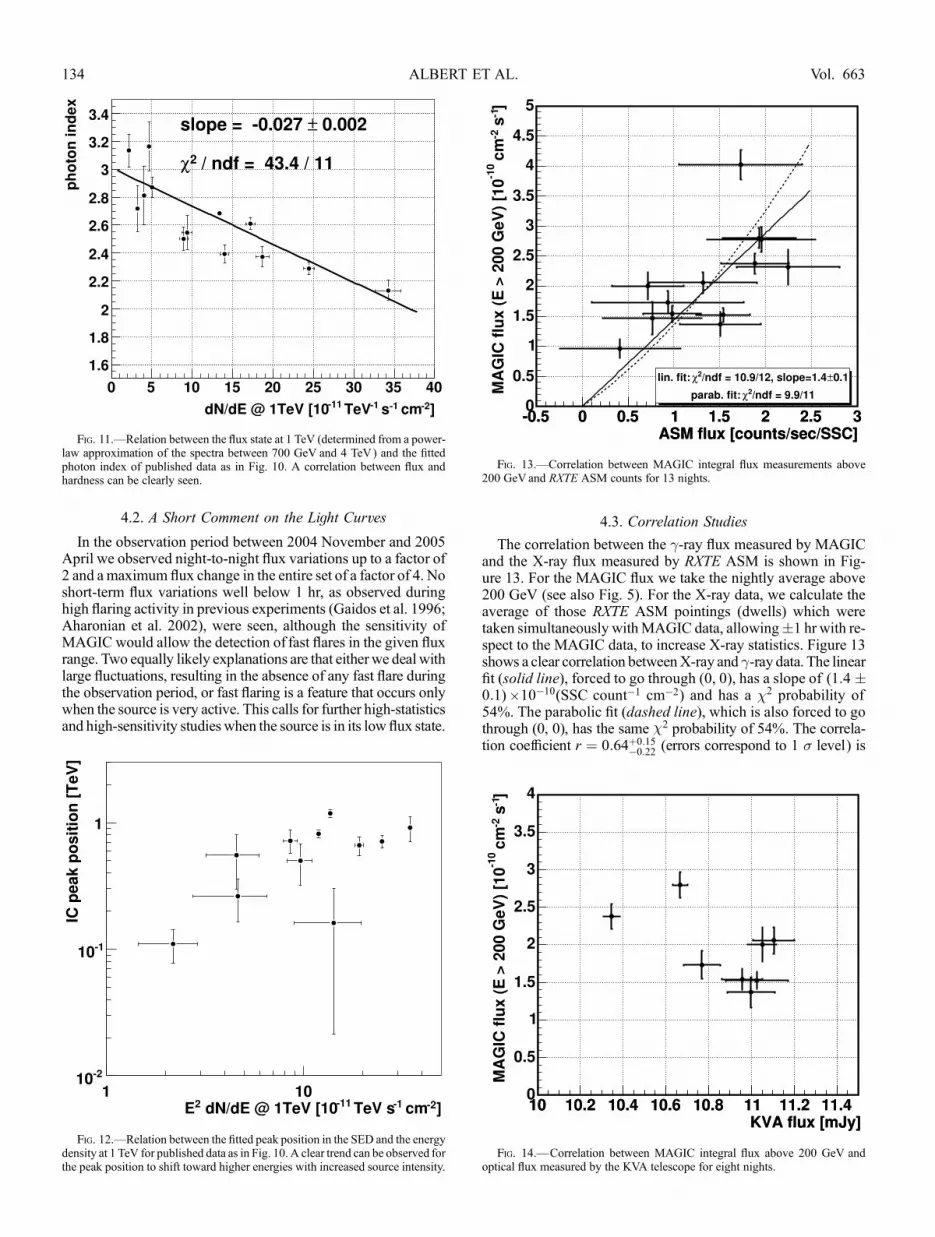
The correlation between the �-ray flux measured by MAGICand the X-ray flux measured by RXTE ASM is shown in Fig-ure 13. For the MAGIC flux we take the nightly average above200 GeV (see also Fig. 5). For the X-ray data, we calculate theaverage of those RXTE ASM pointings (dwells) which weretaken simultaneously withMAGIC data, allowing�1 hr with re-spect to the MAGIC data, to increase X-ray statistics. Figure 13shows a clear correlation betweenX-ray and �-ray data. The linearfit (solid line), forced to go through (0, 0), has a slope of (1:4 �0:1) ;10�10(SSC count�1 cm�2) and has a �2 probability of54%. The parabolic fit (dashed line), which is also forced to gothrough (0, 0), has the same �2 probability of 54%. The correla-tion coefficient r ¼ 0:64þ0:15
�0:22 (errors correspond to 1 � level) is
Fig. 11.—Relation between the flux state at 1 TeV (determined from a power-law approximation of the spectra between 700 GeV and 4 TeV) and the fittedphoton index of published data as in Fig. 10. A correlation between flux andhardness can be clearly seen.
Fig. 12.—Relation between the fitted peak position in the SED and the energydensity at 1 TeV for published data as in Fig. 10. A clear trend can be observed forthe peak position to shift toward higher energies with increased source intensity.
Fig. 13.—Correlation between MAGIC integral flux measurements above200 GeV and RXTE ASM counts for 13 nights.
Fig. 14.—Correlation between MAGIC integral flux above 200 GeV andoptical flux measured by the KVA telescope for eight nights.
ALBERT ET AL.134 Vol. 663
different from zero by 2.4 � (taking into account the nonlinearityof errors).
In Figure 14 the MAGIC �-ray flux above 200 GeV is showntogetherwith simultaneousKVAoptical data. The latter have beenaveraged over the MAGIC integration time. One can see a pos-sible �-ray/optical anticorrelation during the eight nights of simul-taneous observations; however, the correlation coefficient r ¼�0:59þ0:36
�0:22 is compatible with zero within 1.5 �.
4.4. Comparison with Models
Given the temporal correlation betweenX-ray and �-ray fluxes,it is reasonable to infer that the VHE �-ray radiation is dominatedby emission resulting from IC upscattering of the synchrotron
X-ray photons by their parent population of relativistic electrons.Such correlation can be modeled with a homogeneous synchro-tron self-Compton (SSC) model. Based on this model it is pos-sible to constrain the parameter space of the emission region andestimate its basic parameters, the Doppler factor,D, and the rest-frame magnetic field, B, of the emitting plasma in the relativisticjet. To this end we follow the procedure first devised by Bednarek& Protheroe (1997) for the Mrk 421 flare of 1994 May 16, sub-sequently improved by, e.g., Tavecchio et al. (1998), Bednarek &Protheroe (1999), Kataoka et al. (1999), and Katarzynski et al.(2003). Application of this method requires precise simultaneousmultiwavelength information. Since a synchrotron (X-ray) spec-trum simultaneous with theMAGIC observations is not available,
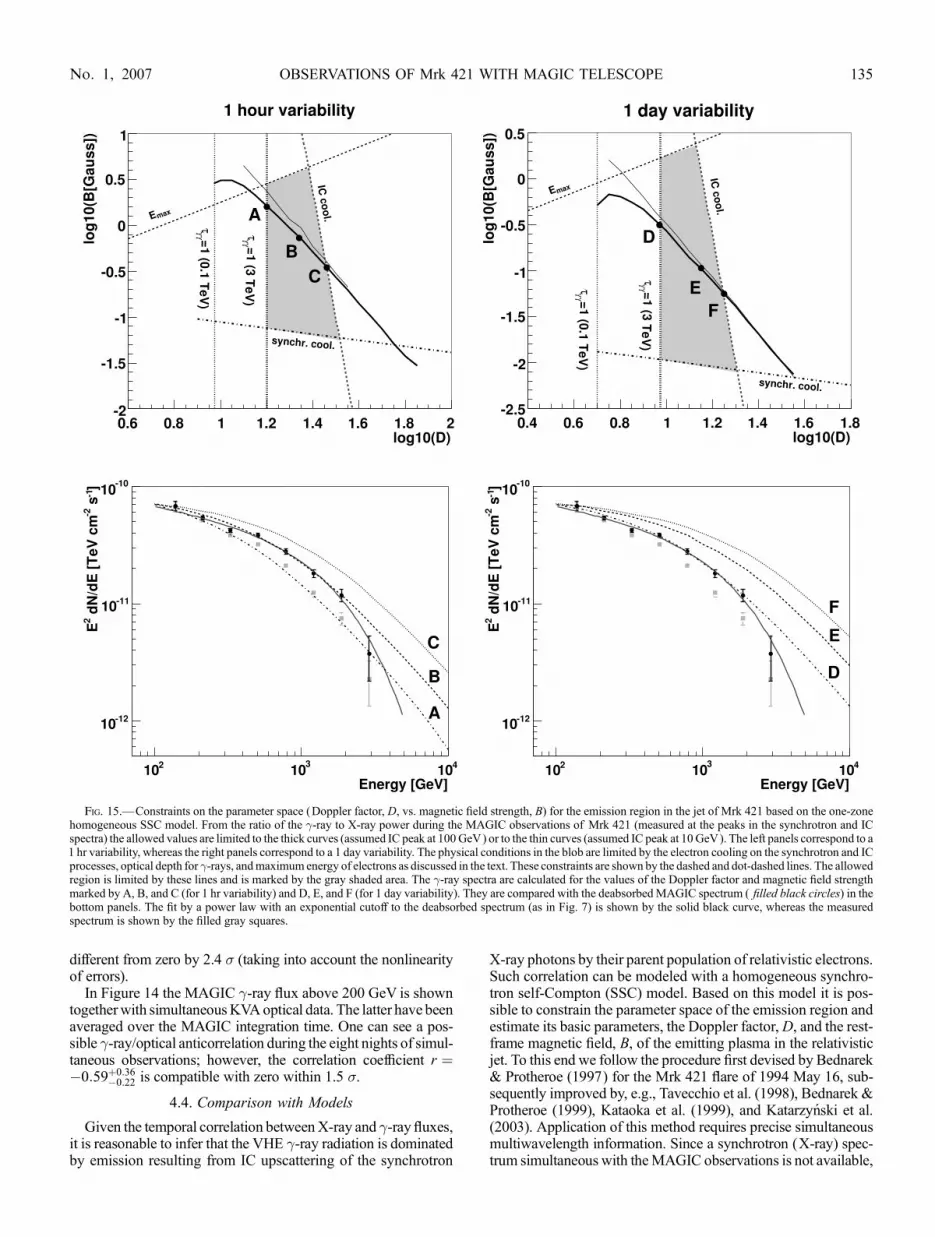
Fig. 15.—Constraints on the parameter space (Doppler factor, D, vs. magnetic field strength, B) for the emission region in the jet of Mrk 421 based on the one-zonehomogeneous SSC model. From the ratio of the �-ray to X-ray power during the MAGIC observations of Mrk 421 (measured at the peaks in the synchrotron and ICspectra) the allowed values are limited to the thick curves (assumed IC peak at 100GeV) or to the thin curves (assumed IC peak at 10 GeV). The left panels correspond to a1 hr variability, whereas the right panels correspond to a 1 day variability. The physical conditions in the blob are limited by the electron cooling on the synchrotron and ICprocesses, optical depth for �-rays, andmaximum energy of electrons as discussed in the text. These constraints are shown by the dashed and dot-dashed lines. The allowedregion is limited by these lines and is marked by the gray shaded area. The �-ray spectra are calculated for the values of the Doppler factor and magnetic field strengthmarked by A, B, and C (for 1 hr variability) and D, E, and F (for 1 day variability). They are compared with the deabsorbedMAGIC spectrum ( filled black circles) in thebottom panels. The fit by a power law with an exponential cutoff to the deabsorbed spectrum (as in Fig. 7) is shown by the solid black curve, whereas the measuredspectrum is shown by the filled gray squares.
OBSERVATIONS OF Mrk 421 WITH MAGIC TELESCOPE 135No. 1, 2007
we have to resort to previous X-ray observations arguing thatsimilar TeV �-ray states (IC emission) should correspond to sim-ilar X-ray states (synchrotron emission). In fact, similar�-ray spec-tra of Mrk 421 have already been observed several times—including the HEGRA observations in 1998 April (Aharonianet al. 1999) for which simultaneous BeppoSAX observations areavailable (Fossati et al. 2000;Massaro et al. 2004). Here we usethe X-ray spectra and parameterization, reported by Massaroet al. (2004) for 1998 April 21. It is also noticeable that the X-rayflux level between the simultaneous RXTE ASM data and theBeppoSAX data used here is very similar (see Fig. 16).
The low flux state MAGIC �-ray spectrum, reported here forenergies at �100 GeV, warrants a better investigation of thecrucial energy range where the IC peak is expected to occur thanin previous data sets. Following Bednarek & Protheroe (1997,1999) we then constrain the allowed parameters of the emissionregion (D and B) from the ratio of the �-ray power to the X-raypower, measured at their respective peak emission (see Fig. 15,top panels, thick curves). The radiation field density and theelectron spectrum, cospatial in the blob, were derived as a func-tion ofD and B for a blob radius assumed equal to the light travelcorresponding to the shortest reported variability timescale (forobservational arguments see Takahashi et al. 2000). We furtherconstrain the allowed parameter space by arguing that the syn-chrotron and IC cooling timescales should be shorter than the ob-served variability timescale. These conditions are fulfilled abovethe dot-dashed lines (for synchrotron cooling) and on the left ofthe dashed gray line (for the IC cooling) for the 1 hr (Fig. 15, topleft) and 1 day (Fig. 15, top right) variability timescales. Thecondition that the blob has to be transparent to the VHE �-raysleads to a further lower bound on D by requiring that the opticaldepth by pair production has to be lower than unity. The corre-sponding limits for photon energies of 100GeVand 3 TeV (whichdefine the energy range of MAGIC measurement) are shown inthe top panels of Figure 15 as thin and thick dotted lines, re-spectively. One last condition arises from comparing the max-imum energy of electrons, determined by the maximum energy
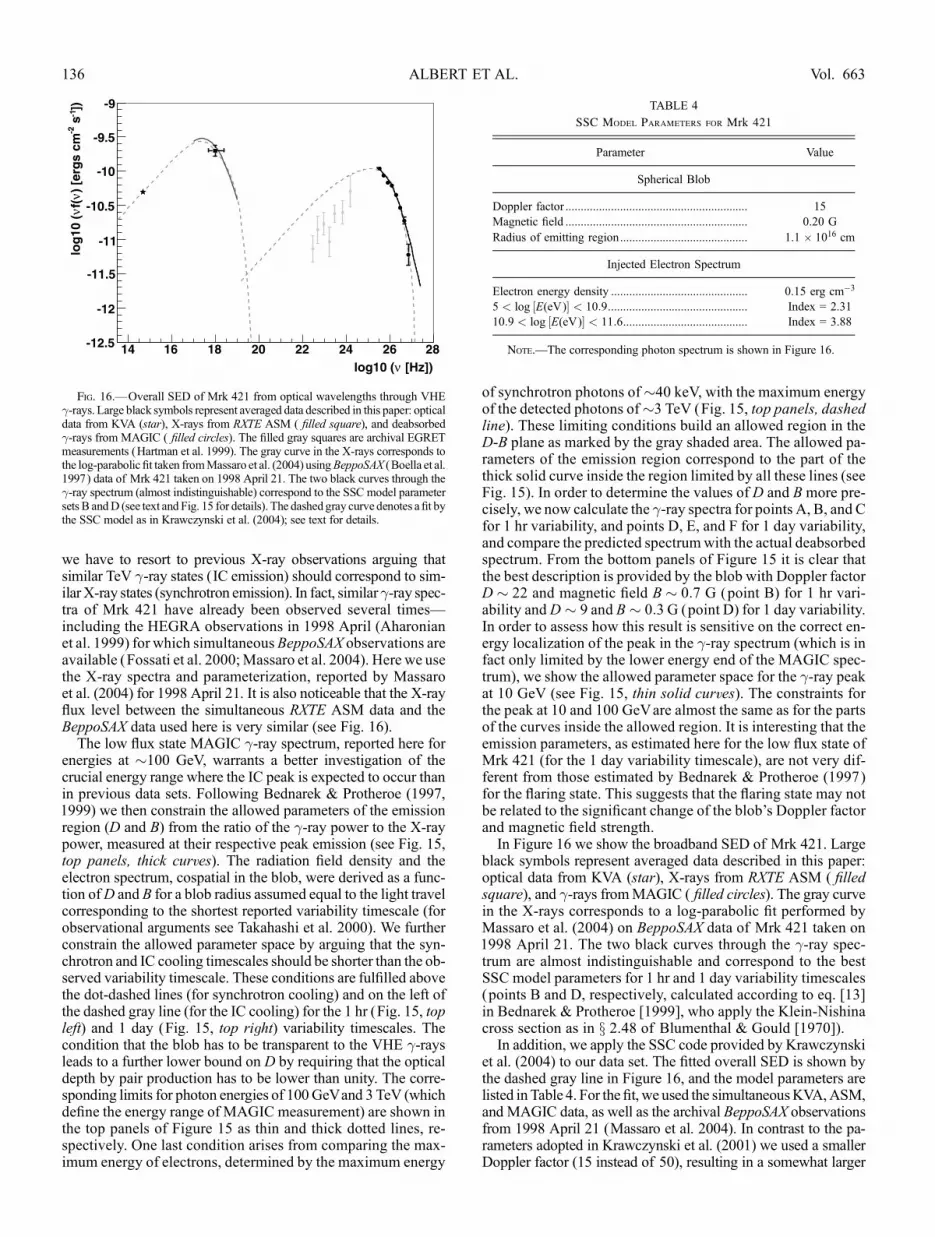
of synchrotron photons of�40 keV, with the maximum energyof the detected photons of�3 TeV (Fig. 15, top panels, dashedline). These limiting conditions build an allowed region in theD-B plane as marked by the gray shaded area. The allowed pa-rameters of the emission region correspond to the part of thethick solid curve inside the region limited by all these lines (seeFig. 15). In order to determine the values of D and B more pre-cisely, we now calculate the �-ray spectra for points A, B, and Cfor 1 hr variability, and points D, E, and F for 1 day variability,and compare the predicted spectrumwith the actual deabsorbedspectrum. From the bottom panels of Figure 15 it is clear thatthe best description is provided by the blob with Doppler factorD � 22 and magnetic field B � 0:7 G (point B) for 1 hr vari-ability andD � 9 and B � 0:3 G (point D) for 1 day variability.In order to assess how this result is sensitive on the correct en-ergy localization of the peak in the �-ray spectrum (which is infact only limited by the lower energy end of the MAGIC spec-trum), we show the allowed parameter space for the �-ray peakat 10 GeV (see Fig. 15, thin solid curves). The constraints forthe peak at 10 and 100 GeVare almost the same as for the partsof the curves inside the allowed region. It is interesting that theemission parameters, as estimated here for the low flux state ofMrk 421 (for the 1 day variability timescale), are not very dif-ferent from those estimated by Bednarek & Protheroe (1997)for the flaring state. This suggests that the flaring state may notbe related to the significant change of the blob’s Doppler factorand magnetic field strength.In Figure 16 we show the broadband SED of Mrk 421. Large
black symbols represent averaged data described in this paper:optical data from KVA (star), X-rays from RXTE ASM ( filledsquare), and �-rays fromMAGIC ( filled circles). The gray curvein the X-rays corresponds to a log-parabolic fit performed byMassaro et al. (2004) on BeppoSAX data of Mrk 421 taken on1998 April 21. The two black curves through the �-ray spec-trum are almost indistinguishable and correspond to the bestSSC model parameters for 1 hr and 1 day variability timescales(points B and D, respectively, calculated according to eq. [13]in Bednarek & Protheroe [1999], who apply the Klein-Nishinacross section as in x 2.48 of Blumenthal & Gould [1970]).In addition, we apply the SSC code provided by Krawczynski
et al. (2004) to our data set. The fitted overall SED is shown bythe dashed gray line in Figure 16, and the model parameters arelisted in Table 4. For the fit, we used the simultaneousKVA,ASM,and MAGIC data, as well as the archival BeppoSAX observationsfrom 1998 April 21 (Massaro et al. 2004). In contrast to the pa-rameters adopted in Krawczynski et al. (2001) we used a smallerDoppler factor (15 instead of 50), resulting in a somewhat larger
Fig. 16.—Overall SED of Mrk 421 from optical wavelengths through VHE�-rays. Large black symbols represent averaged data described in this paper: opticaldata from KVA (star), X-rays from RXTE ASM ( filled square), and deabsorbed�-rays from MAGIC ( filled circles). The filled gray squares are archival EGRETmeasurements (Hartman et al. 1999). The gray curve in the X-rays corresponds tothe log-parabolic fit taken fromMassaro et al. (2004) usingBeppoSAX (Boella et al.1997) data of Mrk 421 taken on 1998 April 21. The two black curves through the�-ray spectrum (almost indistinguishable) correspond to the SSC model parametersets B andD (see text and Fig. 15 for details). The dashed gray curve denotes a fit bythe SSC model as in Krawczynski et al. (2004); see text for details.
TABLE 4
SSC Model Parameters for Mrk 421
Parameter Value
Spherical Blob
Doppler factor ............................................................ 15
Magnetic field ............................................................ 0.20 G
Radius of emitting region.......................................... 1.1 ; 1016 cm
Injected Electron Spectrum
Electron energy density ............................................. 0.15 erg cm�3
5 < log ½E(eV)� < 10:9.............................................. Index = 2.31
10:9 < log ½E(eV)� < 11:6......................................... Index = 3.88
Note.—The corresponding photon spectrum is shown in Figure 16.
ALBERT ET AL.136 Vol. 663
emitting region (1:1 ; 1016 cm instead of 2:7 ; 1015 cm) and ahigher particle density (0.15 erg cm�3 instead of 0.01 erg cm�3).We note that the fitted values of magnetic field and Doppler factorare within the allowed range as defined above. Remarkably, thearchival EGRET data (Hartman et al. 1999) are somewhat belowthe fit, suggesting an IC peak around 100 GeV.
5. CONCLUDING REMARKS
Mrk 421 was observed with the MAGIC telescope duringseveral months in 2004 and 2005. Briefly, we have presented thefollowing:
1. First high-sensitivity observation down to �100 GeV.2. First observation of an IC peak at low flux.3. Absence of short flares below 1 hr duration despite suffi-
cient sensitivity.4. Flux variation up to a factor of 2 between consecutive
nights and up to a factor of 4 in the entire observation period.5. Confirmation of a source-inherent effect resulting in a
curved spectrum after deabsorption (for reasonable assumptionsconcerning the EBL) in case of low flux intensity.
6. Strong correlation between spectral hardness (photon in-dex between 700 GeVand 4 TeV) and flux intensity, obtained bycomparison of the deabsorbed energy spectra of various experi-ments covering different flux levels.
7. Clear trend for the peak position to shift toward higherenergies with increased source intensity, obtained by the samecomparison.
8. Confirmation of a significant correlation between X-ray andVHE �-ray intensity during a state of low to medium intensity.
9. Hint that different flaring states result from differences inelectron populations (electron spectrum) rather than from significantchange of the blob’s Doppler factor and magnetic field strength.
We add the following conclusions. The flux state was foundto be comparatively low, ranging in intensity between 0.5 and
2 crab when integrated above 200 GeV. While clear night-to-night variations were found, the intranight light curve, binned in10minute time intervals, does not show significant variations, al-though several nights are onlymarginally compatible with a con-stant flux. They do not show a discernible structure, however,and seem not to be associated with an overall flux different fromthat of perfectly quiescent nights. We note that MAGIC is sen-sitive enough to detect variabilities on the 10 minute timescale atsuch a low flux level. A clear correlation (r ¼ 0:64þ0:15
�0:22) betweenX-rays and �-rays was found, while no correlation was seen be-tween optical and �-rays. This supports a leptonic origin of the�-rays from Mrk 421. The energy spectrum resulting from thecombined MAGIC data, corrected for the extragalactic absorp-tion, suggests the presence of an IC peak at about 100 GeV. Thespectrum is clearly curved at energies above 1 TeV and can befitted by a power law with an exponential cutoff. The overall SEDobserved in the observed flux state can be well described by a ho-mogeneous SSC model provided that the emission region moveswith a Doppler factor�9 and its magnetic field strength is�0.3 Gfor a 1 day variability timescale. Surprisingly, these parametersdo not differ substantially from those estimated for the emissionregion of Mrk 421 during a strong flare (Bednarek & Protheroe1997). The fit with an alternative SSC code of Krawczynskiet al. (2001) leads to similar Doppler factor and magnetic fieldvalues.
We would like to thank the IAC for the excellent workingconditions at the Observatory de los Muchachos in La Palma.The support of the German BMBF and MPG, the Italian INFN,and the Spanish CICYT is gratefully acknowledged. This workwas also supported by ETH research grant TH 34/04 3 andPolish MNiI grant 1P03D01028. We also thank Dieter Hornsand Frank Krennrich for providing us with HEGRA, H.E.S.S.,and Whipple data.
REFERENCES
Aharonian, F., et al. 1999, A&A, 350, 757———. 2002, A&A, 393, 89———. 2003, A&A, 410, 813———. 2004, ApJ, 614, 897———. 2005, A&A, 437, 95———. 2006, Nature, 440, 1018Anykeyev, V. B., Spiridonov, A. A., & Zhigunov, V. P. 1991, Nucl. Instrum.Methods Phys. Res. A, 303, 350
Bednarek, W., & Protheroe, R. J. 1997, MNRAS, 292, 646———. 1999, MNRAS, 310, 577Bernstein, R. A., Freedman, W. L., & Madore, B. F. 2002a, ApJ, 571, 56———. 2002b, ApJ, 571, 85Bernstein, R. A., Freedman, W. L., & Madore, B. F. 2002c, ApJ, 571, 107———. 2005, ApJ, 632, 713Bertero, M. 1989, Advances in Electronics and Electron Physics (vol. 75; NewYork: Academic Press)
Blain, A. W., Jameson, A., Smail, I., Longair, M. S., Kneib, J.-P., & Ivison, R. J.1999, MNRAS, 309, 715
Byazejowski, H., et al. 2005, ApJ, 630, 130Blumenthal, G. R., & Gould, R. J. 1970, Rev. Mod. Phys., 42, 237Bock, R. K., et al. 2004, Nucl. Instrum. Methods Phys. Res. A, 516, 511Boella, G., Butler, R. C., Perola, G. C., Piro, L., Scarsi, L., & Bleeker, J. A. M.1997, A&AS, 122, 299
Breiman, L. 2001, Machine Learning, 45, 5Bretz, T., 2005, in AIP Conf. Proc. 745, High Energy Gamma-Ray Astronomy:2nd Int. Symp., ed. F. A. Aharonian, H. J. Volk, & D. Horns (New York:AIP), 730
Brown, T. M., Kimble, R. A., Ferguson, H. C., Gardner, J. P., Collins, N. R., &Hill, R. S. 2000, AJ, 120, 1153
Cambresy, L., Reach, W. T., Beichman, C. A., & Jarrett, T. H. 2001, ApJ, 555,563
Coppi, P. S. 1992, MNRAS, 258, 657
Cortina, J., et al. 2005, in Proc. 29th Int. Cosmic Ray Conf. (Pune), 5, 359Costamante, L., & Ghisellini, G. 2002, A&A, 384, 56Daum, A., et al. 1997, Astropart. Phys., 8, 1Dole, H., et al. 2004, ApJS, 154, 87———. 2006, A&A, 451, 417Domingo-Santamarıa, E., Flix, J., Rico, J., Scalzotto, V., & Wittek, W. 2005, inProc. 29th Int. Cosmic Ray Conf. (Pune), 5, 363
Dwek, E., & Arendt, R. G. 1998, ApJ, 508, L9Dwek, E., & Krennrich, F. 2005, ApJ, 618, 657Edelstein, J., Bowyer, S., & Lampton, M. 2000, ApJ, 539, 187Elbaz, D., Cesarsky, C. J., Chanial, P., Aussel, H., Franceschini, A., Fadda, D.,& Chary, R. R. 2002, A&A, 384, 848
Fazio, G. G., et al. 2004, ApJS, 154, 39Finkbeiner, D. P., Davis, M., & Schlegel, D. J. 2000, ApJ, 544, 81Fomin, V. P., Stepanian, A. A., Lamb, R. C., Lewis, D. A., Punch, M., &Weekes, T. C. 1994, Astropart. Phys., 2, 137
Fossati, G., et al. 2000, ApJ, 541, 166Frayer, D. T., et al. 2006, AJ, 131, 250Gaidos, J. A., et al. 1996, Nature, 383, 319Gaug, M., Bartko, H., Cortina, J., & Rico, J. 2005, in Proc. 29th Int. CosmicRay Conf. (Pune), 5, 375
Giebels, B., Dubus, G., & Khelifi, B. 2007, A&A, 462, 29Gorjian, V., Wright, E. L., & Chary, R. R. 2000, ApJ, 536, 550Gould, R. J., & Schreder, G. 1966, Phys. Rev. Lett., 16, 252Hartman, R. C., et al. 1999, ApJS, 123, 79Hauser, M. G., & Dwek, E. 2001, ARA&A, 39, 249Hauser, M. G., et al. 1998, ApJ, 508, 25Hillas, A. M. 1985, in Proc. 19th Int. Cosmic Ray Conf. (La Jolla), 3, 445Hillas, A. M., et al. 1998, ApJ, 503, 744Kashlinsky, A., Mather, J. C., Odenwald, S., & Hauser, M. G. 1996, ApJ, 470, 681Kashlinsky, A., & Odenwald. S. 2000, ApJ, 528, 74Kataoka, J., et al. 1999, ApJ, 514, 138
OBSERVATIONS OF Mrk 421 WITH MAGIC TELESCOPE 137No. 1, 2007
Katarzynski, K., Sol, H., & Kus, A. 2003, A&A, 410, 101Knapp, J., & Heck, D. 2004, EAS Simulation with CORSIKA: A Users Manual(Karlsruhe: Institut fur Kernphysik), http://www-ik.fzk.de/corsika /usersguide/corsika_tech.html
Kneiske, T. M., Bretz, T., Mannheim, K., & Hartmann, D. H. 2004, A&A, 413,807
Krawczynski, H., et al. 2001, ApJ, 559, 187———. 2004, ApJ, 601, 151Krennrich, F., et al. 2002, ApJ, 575, L9Lagache, G., Haffner, L. M., Reynolds, R. J., & Tufte, S. L. 2000, A&A, 354,247
Lessard, R.W., Buckley, J. H., Connaughton, V., &LeBohec, S. 2001,Astropart.Phys., 15, 1
Leinert, Ch., et al. 1998, A&AS, 127, 1Li, T.-P., & Ma, Y.-Q. 1983, ApJ, 272, 317Lorenz, E. 2004, NewA Rev., 48, 339Madau, P., & Pozzetti, L. 2000, MNRAS, 312, L9Majumdar, P., Moralejo, A., Bigongiari, C., Blanch, O., & Sobczynska, D.2005, in Proc. 29th Int. Cosmic Ray Conf. (Pune), 5, 203
Mannheim, K., Westerhoff, S., Meyer, H., & Fink, H.-H. 1996, A&A, 315, 77Martin, C., Hurwitz, M., & Bowyer, S. 1991, ApJ, 379, 549Massaro, E., Perri, M., Giommi, P., & Nesci, R. 2004, A&A, 413, 489Matsumoto, T., et al. 2005, ApJ, 626, 31
Mazin, D., Goebel, F., Horns, D., Rowell, G., Wagner, R. M., & Wagner, S.2005, in Proc. 29th Int. Cosmic Ray Conf. (Pune), 4, 331
Metcalfe, L., et al. 2003, A&A, 407, 791Mucke, A., Protheroe, R. J., Engel, R., Rachen, J. P., & Stanev, T. 2003,Astropart. Phys., 18, 593
Nikishov, A. I. 1962, Soviet Phys.YJETP, 14, 393Papovich, C., et al. 2004, ApJS, 154, 70Pei, Y. C., Fall, S. M., & Hauser, M. G. 1999, ApJ, 522, 604Petry, D., et al. 1996, A&A, 311, L13Piron, F., et al., 2001, A&A, 374, 895Primack, J. R., Bullock, J. S., & Somerville, R. S. 2005, in AIP Conf. Proc. 745,High Energy Gamma-Ray Astronomy: 2nd Int. Symp., ed. F. A. Aharonian,H. J. Volk, & D. Horns (New York: AIP), 23
Punch, M., et al. 1992, Nature, 358, 477Schweizer, T. 2002, Ph.D. thesis, Univ. Autonoma de Barcelona (http://wwwmagic.mppmu.mpg.de/publications / theses /ThomasS_thesis.ps.gz)
Stecker, F. W., De Jager, O. C., & Salamon, M. H. 1992, ApJ, 390, L49Stecker, F. W., Malkan, M. A., & Scully, S. T. 2006, ApJ, 648, 774Takahashi, T., et al. 2000, ApJ, 542, L105Tavecchio, F., Maraschi, L., & Ghisellini, G. 1998, ApJ, 509, 608Toller, G. N. 1983, ApJ, 266, L79Wagner, R. M., et al. 2005, in Proc. 29th Int. Cosmic Ray Conf. (Pune), 4, 163Wright, E. L., & Reese, E. D. 2000, ApJ, 545, 43
ALBERT ET AL.138