nutritionally driven differential gene expression leads to heterochronic brain development in...
TRANSCRIPT

Nutritionally Driven Differential Gene Expression Leadsto Heterochronic Brain Development in Honeybee CastesLıvia Maria Moda1,2, Joseana Vieira2, Anna Claudia Guimaraes Freire2, Vanessa Bonatti1,2, Ana
Durvalina Bomtorin1, Angel Roberto Barchuk2*, Zila Luz Paulino Simoes3
1 Departamento de Genetica, Universidade de Sao Paulo-FMRP, Ribeirao Preto, Sao Paulo, Brazil, 2 Departamento de Biologia Celular, Tecidual e do Desenvolvimento,
Instituto de Ciencias Biomedicas, Universidade Federal de Alfenas, UNIFAL-MG, Alfenas, Minas Gerais, Brazil, 3 Departamento de Biologia, Universidade de Sao Paulo-
FFCLRP, Ribeirao Preto, Sao Paulo, Brazil
Abstract
The differential feeding regimes experienced by the queen and worker larvae of the honeybee Apis mellifera shape acomplex endocrine response cascade that ultimately gives rise to differences in brain morphologies. Brain developmentanalyzed at the morphological level from the third (L3) through fifth (L5) larval instars revealed an asynchrony betweenqueens and workers. In the feeding phase of the last larval instar (L5F), two well-formed structures, pedunculi and calyces,are identifiable in the mushroom bodies of queens, both of which are not present in workers until a later phase (spinningphase, L5S). Genome-wide expression analyses and normalized transcript expression experiments monitoring specific genesrevealed that this differential brain development starts earlier, during L3. Analyzing brains from L3 through L5S1 larvae, weidentified 21 genes with caste-specific transcription patterns (e.g., APC-4, GlcAT-P, fax, kr-h1 and shot), which encodeproteins that are potentially involved in the development of brain tissues through controlling the cell proliferation rate(APC4, kr-h1) and fasciculation (GlcAT-P, fax, and shot). Shot, whose expression is known to be required for axon extensionand cell proliferation, was found to be transcribed at significantly higher levels in L4 queens compared with worker larvae.Moreover, the protein encoded by this gene was immunolocalized to the cytoplasm of cells near the antennal lobeneuropiles and proximal to the Kenyon cells in the brains of L4 queens. In conclusion, during the larval period, the brains ofqueens are larger and develop more rapidly than workers’ brains, which represents a developmental heterochronyreflecting the effect of the differential feeding regime of the two castes on nervous system development. Furthermore, thisdifferential development is characterized by caste-specific transcriptional profiles of a set of genes, thus pointing to a linkbetween differential nutrition and differential neurogenesis via genes that control cell proliferation and fasciculation.
Citation: Moda LM, Vieira J, Guimaraes Freire AC, Bonatti V, Bomtorin AD, et al. (2013) Nutritionally Driven Differential Gene Expression Leads to HeterochronicBrain Development in Honeybee Castes. PLoS ONE 8(5): e64815. doi:10.1371/journal.pone.0064815
Editor: Peter K. Dearden, University of Otago, New Zealand
Received December 3, 2012; Accepted April 16, 2013; Published May 30, 2013
Copyright: � 2013 Moda et al. This is an open-access article distributed under the terms of the Creative Commons Attribution License, which permitsunrestricted use, distribution, and reproduction in any medium, provided the original author and source are credited.
Funding: This work was funded by grants from Fundacao de Amparo a Pesquisa de Minas Gerais (FAPEMIG grant APQ-01714-10; http://www.fapemig.br/),Conselho Nacional de Desenvolvimento Cientıfico e Tecnologico (CNPq grants No 473748/2008-8; 473157/2010-1; http://www.cnpq.br/), and Financiadora deEstudos e Projetos (FINEP/PROINFRA 01/2008, LABSBIOEX UNIFAL-MG) to ARB; Fundacao de Amparo a Pesquisa do Estado de Sao Paulo (FAPESP grant 2005/03926-5; http://www.fapesp.br/) to ZLPS. JV was an undergraduate recipient of a fellowship from FAPEMIG; VB was an undergraduate recipient of a fellowshipfrom CNPq; ACGF was the recipient of a fellowship from CAPES (Coordenacao de Aperfeicoamento de Pessoal de Nıvel Superior; http://www.capes.gov.br/), andADB is supported by a FAPESP Doctoral fellowship (Proc. 2009/05675-0). LMRM was the recipient of a postdoctoral fellowship from FAPESP (2009/00810-7). Thefunders had no role in study design, data collection and analysis, decision to publish, or preparation of the manuscript.
Competing Interests: The authors have declared that no competing interests exist.
* E-mail: [email protected]
Introduction
In the honeybee Apis mellifera, females that are fed on copious
amounts of royal jelly throughout the larval development stages
become queens, while those that receive smaller quantities of a
mixture of glandular secretions, pollen and honey during the last
two larval stages become workers. This initial feeding stimulus
triggers a complex endogenous developmental program resulting
in marked morphological differences between females (the queen
and worker castes), representing one of the most famous examples
of phenotypic plasticity in animals (see [1,2]). Interestingly,
contrary to what might be expected, the ‘‘underfed’’ workers
exhibit a larger brain with more developed cognitive areas
compared with the queens [3], which allows them to accomplish
the variety of duties necessary to maintain a healthy colony,
including foraging, nursing, nest cleaning and protection [3,4]. In
the initial stages of development, however, the brains of queen
larvae appear to be larger than those of workers [5], implying that
a high nutritional input may serve to drive nervous system
development.
The adult insect brain exhibits a complex architecture
composed of millions of glial cells, neurons and their respective
tracts, forming structures known as neuropils that are organized to
produce optic lobe, antennal lobe, central complex and mushroom
bodies [6,7]. As no neurogenesis occurs in adult honeybees [7,8],
all of the cells composing the bee brain must have originated by
the end of post-embryonic development. Neuronal proliferation in
the honeybee mushroom bodies (the integrative centers of the
insect nervous system involved in learning and memory formation
and responsible for processing olfactory information) begins at the
first larval stage via symmetrical cell division in neuroblasts [9,10].
Furthermore, Roat and Landim [5] showed that the queen brain
presents a larger area corresponding to neuroblasts compared with
workers during the last larval stage and the first half of pupal
PLOS ONE | www.plosone.org 1 May 2013 | Volume 8 | Issue 5 | e64815

development. The enhanced differential neurogenesis favoring
worker brain development is therefore expected to occur during
the second half of the pupal period. Indeed, it has been observed
that queen brain suffers far more cell death during the last part of
pupal development than the worker brain [5,9,11,12], which helps
to explain the brain/body and mushroom body/brain size ratios
characteristic of adult workers [3].
The study of the impact of different diets on nervous system
development represents a broad area of biological research; most
of the published results on this topic come from experiments
conducted with rodents. For example, Matos et al. [13] showed
that maternal malnutrition results in learning deficits and a
predisposition to anxiety and depression in offspring, due to a
decreased number of hippocampal neurons, which are known to
proliferate during early life. Thus, the differential feeding regime
experienced by presumptive queen and worker larvae represents a
natural experiment and provides good model for the identification
of genes linking differential nutrition to differential nervous system
development. This model can therefore help to improve our
understanding of the molecular and cellular processes involved in
caste development in social insects as well as those related to the
outcomes of early-life malnutrition in other animal models.
Herein, we describe the morphological characteristics of the
honeybee brain as it develops during larval stages in both castes,
including the higher rate of cell proliferation in the brains of
queens. Additionally, we present a list of genes obtained via
oligonucleotide microarray hybridization that are differentially
expressed between queen and worker brains during the fourth
larval stage as well as the transcriptional profiles of ten genes
associated with neurogenesis: anaphase promoting complex 4 (APC-4),
galactosylgalactosylxylosylprotein 3-beta-glucuronosyltransferase P (GlcAT-P),
failed axon connection (fax), kruppel homolog –1 (kr-h1), short stop (shot),
ataxin-2 (atx-2), cryptocephal (crc), Ephrin Receptor (ephR), dachshund (dac),
and tetraspanin 5D (tsp5D). All but the first two genes were
previously identified through cDNA hybridization experiments as
being differentially expressed between castes in whole-body
preparations of fourth instar honeybee larvae (L4, [1]) or were
found to be expressed only in neurons during Drosophila
development (kr-h1, [14,15]), indicating that they might participate
in the differential brain morphogenesis between A. mellifera castes.
Using anti-shot in situ hybridization combined with immunostain-
ing, we demonstrate up-regulation of shot gene expression in queen
brains compared with those of workers. Our results point to shot as
a key player in the differential brain morphogenesis induced by
differential feeding in honeybee larvae.
Materials and Methods
Bees and BrainsA. mellifera larvae were collected from colonies (Africanized
hybrids) at the Experimental Apiary of the University of Sao Paulo
at Ribeirao Preto, Brazil. Larvae of the same age were obtained as
described in Barchuk et al. [16]. The developmental stages were
classified according to the criteria proposed by Michelette and
Soares [17] and Rembold et al. [18] (see Table 1).
Samples were obtained from third instar larvae (L3), fourth
instar larvae (L4), fifth instar, second feeding phase larvae (L5F2),
and first spinning phase larvae (L5S1) to be used for gene
transcription quantification. These samples consisted of 3 pools of
10 brains each, which were dissected under sterile 0.9% NaCl
solution. The brains were then immediately transferred to
TRIzolH reagent (Invitrogen) and frozen at 280uC until total
RNA isolation was performed. For whole-mount preparations, 10–
15 brains were dissected in ice cold sterile NaCl solution (0.9%)
and fixed.
Phalloidin/DAPI StainingBrain whole-mounts were prepared for phalloidin and DAPI
staining according to Ashburner [19], with some modifications.
Briefly, the brains were dissected in ice cold sterile NaCl solution
(0.9%), fixed in 1:1 formaldehyde (16%) and N-heptane (Merck)
for 1 day at 4uC and permeabilized in 0.5% Triton X-100 in PBS
(PBT). Subsequently, a 1:500 dilution of phalloidin (Rhodamine
Phalloidin Conjugate – Molecular Probes) was added to the
solution containing the brains, followed by incubation for 20
minutes and then several washes with phosphate buffered saline
with 0.1% Triton-X (PBT). This preparation allowed us to
visualize the track of axons. In the last wash, the brains were
incubated with DAPI (49,6-diamidino-2-phenylindole, dihydro-
chloride, 1:2,000; Sigma) for 4 minutes, washed with PBT,
mounted in 80% glycerol and analyzed using a Leica TCS-SP5
Scanning Confocal Microscope (Leica Microsystems).
Cell Proliferation Assay using EdUThe brains of L5 workers and of queens were dissected in sterile
0.9% NaCl, then incubated for 3 hours in a solution containing
culture medium (larval honeybee medium, LHB [20]) and 40 mM
5-ethynyl-29-deoxyuridine (EdU, Click-iT TM EdU Imaging Kits
– Invitrogen) at room temperature under constant gentle shaking.
The brains were then fixed in 1:1 formaldehyde (16%) and N-
heptane (Merck) for 30 min and subsequently transferred to the
Click-iT TM EdU Imaging Kit reaction mixture (43 mL 10X
reaction buffer; 38 mL distilled water; 20 mL copper sulfate;
1.2 mL Alexa Fluor 594; 50 mL reaction buffer additive), followed
by incubation for 30 min. The brains were washed 5 times for 5
minutes each with PBT 0.5%, and nuclei were then stained with
1:1,000 Hoechst for 30 minutes under shaking. Another 5 washes
were performed, and the brains were mounted in 80% glycerol
(Merck). The obtained images were analyzed using a Leica TCS-
SP5 confocal microscope (Leica Microsystems).
FISH - Fluorescent in situ HybridizationGeneration of FISH probes. Oligonucleotide probes were
generated from PCR amplicons that contained a T7 RNA
polymerase promoter at the 59 end. Transcription reactions were
performed using the FISH Tag RNA Kit (Invitrogen; [21]),
following the manufacturer’s suggested protocol. The amplified
fragment of the shot gene was 396 bp, and the following primer
sequences were employed (59 to 39):
Table 1. Developmental stages and characteristics of the A.mellifera larvae used in this work.
Devstage Characteristics
Hours afterhatching
L3 0.0015–0.004 g (W)/0.0013–0.007(Q) 35–55
L4 0.004–0.0248 g (W)/0.004–0.044 g (Q) 56–80(W)
L5F2 0.06–0.11 g (W)/0.09–0.18 g (Q) 95–105(W)
L5S1 Larval period after sealing (spinning) (W/Q) 115–130(W)
Modified from Michelette and Soares [17] and Rembold et al. [18]. L3 = thirdlarval instar; L4 = fourth larval instar; L5F2 = second feeding phase of the fifthlarval instar; L5S1 = first spinning stage of the fifth larval instar. Q = queens.W = workers.doi:10.1371/journal.pone.0064815.t001
Gene Expression and Neurogenesis in A. mellifera
PLOS ONE | www.plosone.org 2 May 2013 | Volume 8 | Issue 5 | e64815

Table 2. Characteristics of the primers used in the RT-qPCR assays.
Primer pairsPredictedgene Sense primer Antisense primer
Annealing
temp (6C)Fragmentlength (bp)
atx-2 GB18802 ACAACATCCCAACAGTCAC TGTAGGTCGCAAAGGTAATGG 60 162
APC-4 GB18982 TGGAGGAAGAAAGGGAGTGA TTGTTTCACGATAAGCGGATG 60 151
crc GB19338 GGAGATGTGGAAGCTTGTCA ATGGTTGTACTGGTTGTAAAGT 60 133
dac GB17219 GCACCTCAGTCACATGCAAT GACATGTTCGGGTTCACCTT 62 150
EphR GB12585 ACCAACGCAACCGTGATCC ATAGCGTGAGGCGTCTTCTT 60 152
Fax GB17380 TCAGCACGTGCTGGGTACT AACCGAATTGGGACACCTCT 60 140
Kr-h1 GB14867 GCACTGGCAGTGACAAGGAA GTGGAGTGTTATCGTAAGTAGCAA 60 76
shot GB17469 TTCAGGGAAACGGCTTGGAA GTGCCGACACCAGTCAGG 60 160
Tsp5D GB14751 CTGCGGCGTGCGGGATTA TTGTTACGCCCCTCGGAGT 60 129
GlcAT-P GB12549 GGATTGAAGTTCGAGCATCTG CTCTGATCCATTGTAAGCCAC 60 111
rp-49 AF441189 CGTCATATGTTGCCAACTGGT TTGAGCACGTTCAACAATGG 60 150
b-actin AB023025 TGCCAACACTGTCCTTTCTG AGAATTGACCCACCAATCCA 60 156
doi:10.1371/journal.pone.0064815.t002
Figure 1. Frontal view of the central neuropils in the 3rd and 4th larval instars of A. mellifera castes. Queen and worker brains arehighlighted with phalloidin (red) and DAPI (blue). In these stages, there are clusters of neuroblasts (N) on each side of the brain (A–D). Phalloidinstains axons from optic tubercles (OT), inter-tubercle tracts (iTT) and the antennal lobe (AL) (E–L). No morphological differences can be observedbetween the castes at the 3rd stage, whereas in the 4th stage, the peduncles (Pe) of mushroom bodies start to develop in queen brains (H, L).doi:10.1371/journal.pone.0064815.g001
Gene Expression and Neurogenesis in A. mellifera
PLOS ONE | www.plosone.org 3 May 2013 | Volume 8 | Issue 5 | e64815

shot (FWD) GGA GGA GTT GTT GTC GTG GT.
shot (REV) CGC CAA TCT TCC CAA CTA AA.
shot (T7+FWD) TAA TAC GAC TCA CTA TAG GGC GAG
GAG GAG TTG TTG TCG TGG T.
shot (T7+REV) TAA TAC GAC TCA CTA TAG GGC GAC
GCC AAT CTT CCC AAC TAA A.
Whole-mount FISH protocol. Our whole-mount FISH
protocol followed the method of Saunders & Cohen [22] for
Drosophila ovaries. Brains were dissected in Ringer saline (NaCl
0.17 M, KCl 0.01 M, CaCl2 0.003 M) and fixed for 20 minutes
using 1 mL N-Heptane, 160 mL HEPES (0.1 M HEPES –
pH 6.9; 2 mM MgSO4; 1 mM EGTA), 40 mL of 20% parafor-
maldehyde (PFA) and 20 mL DMSO. Then, the brains were
washed rapidly two times with 100% methanol and one time with
100% ethanol, then stored. The brains were rehydrated through a
series of washes using methanol/PBS+Tween-20, 0.1%, and fixed
again for 20 minutes using 80 mL of PBS+0.1% Tween-20, 100 mL
of 4% PFA, and 0.2 mL of 0.1% Triton X-100. After the post-
fixation step, 20 mg/mL proteinase-K was added to the solution
for 1 minute, and the samples were then pre-incubated in
hybridization solution at 45uC for 1 hour, followed by incubation
for 16 hours at 45uC with a fluorescent RNA probe under shaking
(hybridization solution: 25 mL formamide 50%; 10 mL 4x SSC;
500 mL 1x Denhardt’s solution; 2.5 mg heparin 50 mg/mL;
500 mL Yeast tRNA (Invitrogen); 500 mL salmon testes DNA
(Sigma).
ImmunocytochemistryFor anti-shot immunostaining, fixed brain whole-mounts were
washed 4 times in 0.5% PBT and incubated in a blocking solution
(5% goat serum and 0.1% BSA in PBS plus 0.5% Triton X-100)
for 1 h and for 16 h in a solution with 1:200 anti-shot mAbRod1
(Developmental Studies of Hybridoma Bank). An Alexa Fluor
488 goat anti-mouse antibody (Molecular probes) at a 1:200
dilution was used as the secondary antibody. The negative control
was incubated without the primary antibody (see Figure S1).
Washing steps were performed using 0.5% Triton X-100 in PBS,
and DAPI (49,6-diamidino-2-phenylindole, dihydrochloride, Sig-
ma) staining was conducted at room temperature for 4 min,
followed by another washing series in PBS with 0.5% Triton X-
100. The brains were then mounted in 80% glycerol and analyzed
using a Leica TCS-SP5 scanning confocal microscope (Leica
Microsystems). Quantification of nuclei in developing brains and
nuclei of proliferating cells was done using the plugin Particle
Figure 2. Frontal view of the central neuropils in the 5th larval instar of A. mellifera castes. Queen and worker brains during the L5F2 andL5F1 larval instars are highlighted with phalloidin (red) and DAPI (blue). In L5F2, there are calyces (Ca) of mushroom bodies visible in queen brains (E,I), which are not seen in workers until the S1 stage (H, L), as well as nerves forming at the antennal lobe in queen brains (G, K). The same structuresare less well developed in workers. N: neuroblasts, OT: optic tubercles, AL: antennal lobe, Ant n: antennal nerve, iTT: inter tubercle tracts.doi:10.1371/journal.pone.0064815.g002
Gene Expression and Neurogenesis in A. mellifera
PLOS ONE | www.plosone.org 4 May 2013 | Volume 8 | Issue 5 | e64815

Figure 3. Cell proliferation in brains of queen and worker honeybees. The queen brain shows a larger area of cell proliferation comparedwith the worker brain during the 5th instar. (A) A queen brain stained with EdU-Alexa fluor 594, showing increased cell proliferation in mushroombodies. (B) Details of cell proliferation in the mushroom bodies of queens. (C) A worker brain stained with EdU-Alexa fluor 594 (red) shows that it is
Gene Expression and Neurogenesis in A. mellifera
PLOS ONE | www.plosone.org 5 May 2013 | Volume 8 | Issue 5 | e64815

Analysis - Nucleus counter at ImageJ (W. S. Rasband, National
Institutes of Health, Bethesda, MD; http://rsbweb.nih.gov/ij/
plugins/itcn.html), with default parameters.
Quantification of Gene TranscriptionOligonucleotide microarray hybridization. Microarray
experiments were performed and are described according to the
Minimum Information About a Microarray Experiment (MIAME)
specifications [23], and the obtained data have been deposited in
the Gene Expression Omnibus database (GEO, at the NCBI
database) under accession number GSE39239.
Total RNA isolated from the brains of fourth larval stage queens
and workers was purified using the RNA Cleanup kit (RNeasy
Mini Kit, QIAGEN), and 1 mg of total RNA was then used for the
amplification procedure with the Amino Allyl MessageAmpTM II
aRNA Amplification Kit (Ambion). A 6 mg sample of amplified
RNA was subsequently labeled with Cy3 or Cy5 dye (RPN5661,
GE Healthcare). Two sets of labeled probes were then hybridized
to whole-genome oligonucleotide microarrays acquired from the
Functional Genomics Unit of the W.M. Keck Center at the
University of Illinois at Urbana-Champaign through Dr. Gene
Robinson. The slide design was based on the design of the INDAC
long oligo set for Drosophila melanogaster, including 12,915 unique
oligos (http://www.biotech.uiuc.edu/functionalgenomics). Prior
to pre-hybridization, each slide was UV cross-linked and plunged
into 0.2% SDS, washed with water, plunged into ethanol and
centrifuged at 2000 g for 3 min. Pre-hybridizations were carried
out for at least 45 min in a warm solution (42uC) containing 20%
Formamide, 10% Denhardt’s solution (50x), 33.2% SSC 20x,
0.1% SDS and 0.5% tRNA (10 mg/mL) and then rinsed in Milli-
Q water, plunged into isopropyl alcohol and dried via centrifu-
gation at 2000 g for 3 min. Hybridizations were carried out with
dye-swaps. The probes (in 60 mL of 49% formamide, 49% SSC
20x and 0.2% SDS) were preheated at 50uC for 3 min and then
transferred to slides and covered with lifter-slip cover glasses
(22660, 31.25 mL). The slides were subsequently placed in single-
slide hybridization chambers (CLS2551, Corning) and incubated
in a water bath to allow hybridization to occur for 17 h at 42uC.
The washing procedure included the following steps: 26SSC and
0.1% SDS; 26SSC; 0.16SSC; and Milli-Q water. Each washing
step was conducted for 3 min at room temperature, except for the
first step, which consisted of 10 sec at 42uC. The slides were dried
via centrifugation at 2000 g for 2 min and scanned using an Axon
Genepix 4000B scanner (Molecular Devices) with GenePixH Pro
6.0 software (Agilent Technologies, Santa Clara, CA) at a 10
micron resolution, during which Cy3 was excited with a green
laser (532 nm) and Cy5 with a red laser (635 nm).
Bioinformatics analysis. Images from hybridized slides
were processed using GenePixH Pro 6.0 software with the default
parameters. All normalizations and fold change calculations were
performed using functions of the Limma library of the R/
Bioconductor package (R Development Core Team, 2012,
[http://www.R-project.org]), as described in Barchuk et al. [1].
Briefly, the background was corrected by adding to the
background intensities a positive constant (offset correction = 50),
which restrains spurious variation in log-ratios, particularly at low
intensity spots. The ‘‘print-tip loess’’ normalization was used to
correct for within-array dye and spatial effects and single channel
normalization was used to facilitate comparison between arrays.
Subsequently, the log2 ratio (Queen’s sample intensity/Worker’s
sample intensity) was determined for each probe in each array.
After applying Bayesian statistics to shrink estimated standard
errors, we used the moderated t-statistic test for each gene.
Following statistical analyses (adjusted p,0.05; B.0) and removal
of values from spots with low intensity signals (compared to empty
spots), a list of 16 differentially represented transcript sequences
(DRTs) was obtained. All DRTs with Drosophila orthologs were
identified using the protein domains database Pfam (http://pfam.
sanger.ac.uk/search) and Gene Ontology analysis (http://www.
geneontology.org/).
All ten genes selected for RT-qPCR analysis were identified in
the honeybee genome (assembly version 4.0) available at the
Baylor College of Medicine website (http://www.hgsc.bcm.tmc.
edu/content/honey-bee-genome-project) and manually annotated
using the Artemis platform [24]. The characteristics of the
deduced amino acid sequences were assessed using tools available
at www.justbio.com, www.cbs.dtu.dk, www.expasy.ch and www.
ncbi.nlm.nih.gov/sites/gquery?itool = toolbar. Domains of pre-
dicted proteins were also identified using Pfam Search. The
primers for qPCR were designed using Primer 3 (Rozen, 2000,
Primer3 on the WWW for general users and for biologist
programmers; see Table 2) and Primer Express v2.0 (Applied
Biosystems).
Quantitative assays via Real-Time PCR (RT-
qPCR). Total RNA was isolated from each pooled sample (10
brains) using 500 mL of TRIzolH following the manufacturer’s
protocol (Invitrogen) and incubated in the presence of RNase-free
DNase (Promega) to eliminate contaminating DNA. First-strand
cDNA was synthesized via reverse transcription using 1 mg of total
RNA, SuperScript II reverse transcriptase and an oligo (dT 12–18)
primer (Invitrogen), as described by Nascimento et al. [25].
Comparisons of the gene transcription profiles between queens
and workers were conducted via real-time PCR using SYBRHGreen mix and the 7500 Real Time PCR System (Applied
mainly the cells in the mushroom bodies that are proliferating. (D) Details of the cell proliferation in the mushroom bodies of workers. Blue: Hoechststaining (to visualize nuclei); red: EdU-Alexa fluor 594 staining (EdU binds to DNA during cell division). (E, F) Quantification of nuclei in developingbrains (E) and nuclei of proliferating cells (F; p,0.05). L3, L4:3rd and 4th larval instars, respectively; L5F: fifth larval instar (feeding stage); L5S: fifth larvalinstar (spinning stage).doi:10.1371/journal.pone.0064815.g003
Figure 4. Scheme of the developmental timing of themushroom body neuropil regions in A. mellifera workers andqueens. During brain development, calyces and pedunculi appearearlier in queens, indicating that the queen brain develops more rapidlythan that of workers, affecting the synchronization of brain develop-ment between castes. L3, L4:3rd and 4th larval instars, respectively; L5F:fifth larval instar (feeding stage); L5S: fifth larval instar (spinning stage);blue arrows: queens; red arrows: workers.doi:10.1371/journal.pone.0064815.g004
Gene Expression and Neurogenesis in A. mellifera
PLOS ONE | www.plosone.org 6 May 2013 | Volume 8 | Issue 5 | e64815

Ta
ble
3.
Dif
fere
nti
ally
rep
rese
nte
dse
qu
en
ces
ob
tain
ed
via
mic
roar
ray
hyb
rid
izat
ion
of
sam
ple
sfr
om
the
bra
ins
of
L4w
ork
ers
and
qu
ee
ns
of
A.
mel
lifer
a,
clu
ste
red
by
Pfa
md
atab
ase
.
Off
icia
l_se
t_ID
Na
me
Fly
ba
se_
IDO
RF
(pb
)P
rod
uct
(aa
)S
caff
old
_ID
(Gro
up
)A
cce
ssio
nn
um
be
r(X
P_
)P
fam
Fo
ldch
an
ge
Q:
GB
11
70
6C
G3
31
96
81
96
27
31
6.2
66
23
96
1.2
PW
WP
sup
erf
amily
3.7
9
Q:
GB
12
02
1P
RD
om
ain
29
61
98
64
.27
39
60
29
.4SE
Tsu
pe
rfam
ily4
.64
Q:
GB
12
54
5a
-ca
ten
inC
G1
79
47
27
30
90
91
5.2
96
25
22
9.1
Vin
culin
fam
ily5
.28
Q:
GB
12
54
9G
lcA
T-P
CG
62
07
11
40
37
91
1.3
43
94
93
2.3
Gly
cosy
ltra
nsf
era
sefa
mily
A5
.55
Q:
GB
15
75
9So
diu
m-c
ou
ple
dm
on
oca
rbo
xyla
tetr
an
spo
rter
2-lik
e1
78
85
95
1.6
43
94
16
0.2
SSF
sup
erf
amily
5.5
7
Q:
GB
18
91
46
00
19
99
.21
11
21
92
7.2
zin
cri
bb
on
fam
ily5
.85
Q:
GB
18
98
2A
PC
4C
G3
27
07
21
75
72
4U
n.5
37
39
33
01
.3A
pc4
sup
erf
amily
3.3
6
Q:
GB
19
68
6g
md
CG
88
90
10
77
35
87
.26
39
51
64
.3N
AD
de
pe
nd
en
te
pim
era
se/d
eh
ydra
tase
fam
ily3
.34
Q:
GB
19
96
6Y
+La
min
oa
cid
tra
nsp
ort
er2-
like
14
67
48
81
5.2
13
95
23
9.4
Am
ino
acid
pe
rme
ase
3.7
5
W:
GB
10
93
1P
P2C
CG
17
74
69
90
32
9U
n.5
37
62
34
18
.2P
P2
C3
.80
W:
GB
11
87
55
58
18
5U
n.6
96
32
51
92
9.1
–4
.90
W:
GB
16
66
1A
rist
ale
ssR
ela
ted
Ho
meo
bo
xC
G2
81
97
53
25
01
4.2
31
12
13
39
.1H
om
eo
do
mai
nsu
pe
rfam
ily5
.39
W=
Wo
rke
r.Q
=Q
ue
en
.N
ame
=G
en
en
ame
.d
oi:1
0.1
37
1/j
ou
rnal
.po
ne
.00
64
81
5.t
00
3
Gene Expression and Neurogenesis in A. mellifera
PLOS ONE | www.plosone.org 7 May 2013 | Volume 8 | Issue 5 | e64815

Biosystems). The reactions were carried out in a 20 mL mixture
containing 10 mL of 2x SYBRH Green Master Mix (Applied
Biosystems), 0.8 mL of each 10 mM gene-specific forward and
reverse primer (Table 2) and 1 mL of the first-strand cDNA sample
diluted 1:5 in water. The PCR conditions were as follows: 50uCfor 2 min and 95uC for 10 min, followed by 40 cycles of 95uC for
15 s and 60uC or 62uC (dac) for 1 min. Each of the three pooled
samples was analyzed in triplicate, and the transcripts of the rp-49
(ribosomal protein 49) and b-actin genes were used as a reference
(geometrical means; [2,26,27]). PCR efficiency values (E) were
calculated from the slope obtained after running standard curves
using the formula E = 10(21/slope)21 (Table S1). The relative level
of each gene transcript was calculated using the 22DDCT method
(Applied Biosystems User Bulletin #2; [28]). Statistical analyses
were carried out with SigmaStat 3.1 software (Jandel Corporation,
San Rafael, CA, USA) using two-way ANOVA with two-tailed
probabilities, followed by the Holm-Sidak post hoc test. RT-qPCR
experiments were performed according to the Minimum Infor-
mation for Publication of Quantitative Real-Time PCR Experi-
ments (MIQE) guidelines [29].
Results
Differential Brain Morphogenesis During Larval CasteDevelopment in A. mellifera
Despite our understanding of the organization of the adult
honeybee brain, little is known about its development during larval
instars. To investigate morphological differences in A. mellifera
brains in the context of caste differentiation, we performed high-
resolution neuroanatomical studies of whole-mount preparations
of larval brains from the third to the middle of the fifth instar
(L5S1). This is a critical period in which larvae experience a caste-
specific hormonal environment as a result of the switch in the
feeding program [1,30].
In third instar larvae (L3), DAPI staining showed early clusters
of neuroblast nuclei on each side of the brain (Figure 1 A, B), and
phalloidin staining revealed axons projecting from the optic
tubercles, antennal lobes and inter tubercle tracts (Figure 1 E, F, I,
J). In this stage, no morphological differences were detected
between queens and workers. In fourth instar larvae (L4),
phalloidin staining showed the first sign of the formation of
mushroom body structures, i.e., the pedunculus, in the brain of
queen larvae (Figure 1 G, K), whereas this structure was still
absent in workers at this stage (Figure 1 H, L). As the mushroom
bodies continued to develop, the shape of the cluster of DAPI-
stained nuclei changed, becoming more organized in the apical
region of the brain (Figure 1 C, D). These clusters will
subsequently form the distinctive Kenyon cell population [10].
In addition, the neuropiles that form calyces became more
organized, first appearing during L5F2 in queens (Figures 2 E, I;
4). In workers, the development of these structures was delayed.
The formation of peduncles was detectable only in developmental
stage L5F2 (Figures 2 F, J; 4), and calyces appeared later, during
the early spinning stage, L5S1 (Figures 2 H, L; 4). Interestingly,
during this period of development, there were axon bundles
belonging to the antennal nerve observed in the antennal lobes of
queens (Figures 2 G, K; 4). We also showed that the queen brain
presented a larger area of cell proliferation compared with the
worker brain during the L5F2 developmental stage, as visualized
following EdU staining (Figure 3). In this stage, positive EdU
staining was observed in most of the mushroom bodies (and in the
whole brain) in the brains of queens (Figure 3 A, B), but only in the
center region of the mushroom bodies in workers’ brains
(Figure 3 C, D). Moreover, the mushroom bodies in the queen
brains showed a higher proportion of cell proliferation, as
Table 4. Characteristics of genes whose expression was analyzed by RT-qPCR.
Gene ORF (bp) Protein (aa) Mol Weight (kD) Pfam Accession number
GlcAT-P 1140 379 43.35 Glycosyltransferase family A XP_394932.3
APC4 2175 724 81.97 Apc4 superfamily XP_393301.3
tsp5D 918 306 29 Tetraspanin family XP_394297
dac 2346 781 83 SKI/SNO/DAC family XP_394482
fax 1176 391 44.7 Outer mitochondrial membrane transportcomplex protein
XP_393141
Glutathione S-transferase, C-terminal domain
crc 1074 357 41.3 bZIP transcription factor XP_393709
atx-2 2733 911 100.4 LsmAD domain XP_392675
EphR 2991 996 110 Ephrin receptor ligand binding domain XP_392034
GCC2 and GCC3
Fibronectin type III domain
Protein tyrosine kinase
SAM domain (Sterile alpha motif)
shot 15480 5159 581.3 Plectin repeat GB17469
Spectrin repeat
EF hand
Growth-Arrest-Specific Protein 2 Domain
Kr-h1 1500 500 56.8 C2H2 zinc finger NM_001242470 (Gene ID 100576395)
doi:10.1371/journal.pone.0064815.t004
Gene Expression and Neurogenesis in A. mellifera
PLOS ONE | www.plosone.org 8 May 2013 | Volume 8 | Issue 5 | e64815

Gene Expression and Neurogenesis in A. mellifera
PLOS ONE | www.plosone.org 9 May 2013 | Volume 8 | Issue 5 | e64815
indicated by the density of pink dots (Figure 3 B, D, F). Nuclei
quantification of whole brains showed increasing number of cells
from L3 to L5S1, and higher numbers in queens’ brains from L4
(Figure 3 E; see also Figure 4).
Differentially Expressed Transcripts in the Brains of L4Queens and Workers Revealed by OligonucleotideHybridization
Because the morphological differences between queen and
worker brains begin at L4 (see Table 1 and the previous section),
which is the developmental stage characterized by the greatest
Figure 5. Transcription profile of genes associated with neurogenesis in the brains of A. mellifera females of different castes. Theordinates represent the relative transcript levels assessed by RT-qPCR. The data were normalized to ribosomal protein-49. Three biological sampleswere analyzed in technical triplicates. L3, L4, L5F and L5S: larval stages; *: statistically significant differences between castes (two-way ANOVA,p,0.05); fax: failed axon connection; GlcAT-P: galactosylgalactosylxylosylprotein 3-beta-glucuronosyltransferase P; kr-h1: kruppel homolog –1; crc:cryptocephal; EphR: Ephrin Receptor; shot: short stop; APC-4: anaphase promoting complex 4; tsp5D: tetraspanin 5D; atx-2: ataxin-2; dac: dachshund.doi:10.1371/journal.pone.0064815.g005
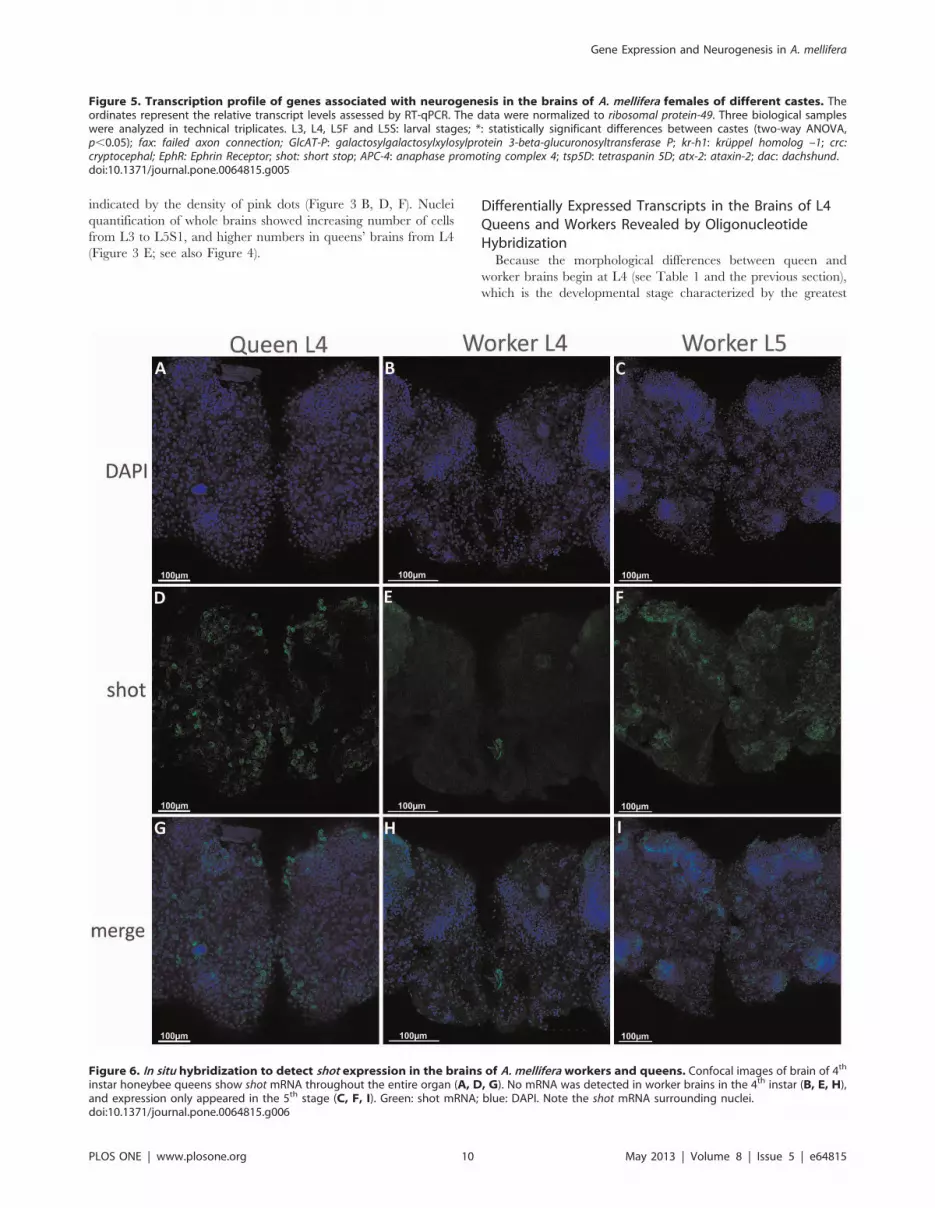
Figure 6. In situ hybridization to detect shot expression in the brains of A. mellifera workers and queens. Confocal images of brain of 4th
instar honeybee queens show shot mRNA throughout the entire organ (A, D, G). No mRNA was detected in worker brains in the 4th instar (B, E, H),and expression only appeared in the 5th stage (C, F, I). Green: shot mRNA; blue: DAPI. Note the shot mRNA surrounding nuclei.doi:10.1371/journal.pone.0064815.g006
Gene Expression and Neurogenesis in A. mellifera
PLOS ONE | www.plosone.org 10 May 2013 | Volume 8 | Issue 5 | e64815

Gene Expression and Neurogenesis in A. mellifera
PLOS ONE | www.plosone.org 11 May 2013 | Volume 8 | Issue 5 | e64815

differences in JH titers between castes [30], likely in a response to
the differential food intake [31] that occurs during larval
development, we performed oligonucleotide microarray hybrid-
ization analyses comparing RNA samples from the brains of
queens and workers during this post-embryonic stage. This
approach allowed us to identify genes associated with the
differential brain development detected between castes. Following
stringent statistical criteria (adjusted p,0.05; B.0; and removal of
values from spots with low intensity signals), we obtained a list of
16 differentially represented transcript sequences (DRTs) in
honeybee fourth instar larval brains, 12 of which were up-
regulated in queens and 4 in workers. Of these genes, 5 and 2,
respectively, have Drosophila melanogaster orthologs and represent
coding sequences (Table 3). Three DRTs in queens
(BB170027A10E09.5, BB170032B20H12.5, BB160007B10F02.5)
and one in workers (DB746346) did not match any known protein
coding gene in A. mellifera. Based on predicted functions and
functions demonstrated in other biological systems, the products of
the up-regulated transcripts found in queens are associated with
cell proliferation, fasciculation or interneuronal connections [e.g.,
GlcAT-P (GB12549), APC-4 (GB18982), dp (GB11706), a-Cat
(GB12545) and gmd (GB19686)]. The DRTs that were over-
represented in the worker brain samples are genes whose products
have been demonstrated to function during the development of
eye cells and GABAergic neurons [Aristaless Related Homeobox
(GB16661)] and in brain cells in response to stressors [PP2C
(GB10931)].
Transcriptional Profiling of Genes Associated withNeurogenesis During the Larval Development ofHoneybee Queens and Workers
Due to our interest in identifying genes underlying differential
brain development in response to differential feeding in honey-
bees, using RT-qPCR, we assessed the expression profiles of ten
genes linked to neurogenesis (Table 4) during larval development
(L3-L5S1, see Table 1 and ‘‘Bees and brains’’ from the M&M
Section). Some of these genes were identified in the oligonucle-
otide microarray hybridization analyses described above (GlcAT-P
and APC-4), while others were identified as differentially expressed
between castes via cDNA microarray hybridization analyses of the
whole bodies of fourth instar honeybee larvae, and are associated
with neurogenic processes (tsp5D, dac, fax, crc, atx-2, EphR and shot;
[1]) or are known to be linked to neurogenesis in different animal
models (kr-h1; [32,33]).
As shown in Figure 5, all ten genes were found to be transcribed
in the brains of queens and workers throughout the entire period
analyzed. Our results revealed three groups of expression patterns.
One was represented by the majority of the genes, which showed a
general increasing trend from the 3rd to the spinning stage of the
5th larval instar in both castes (fax, GlcAT-P, kr-h1, crc, EphR and
shot). Interestingly, crc was found to be expressed at an 8-fold
higher level in the heads than in the brains in both castes (data not
shown), supporting the idea that it plays specific roles in larval
head development [34]. The second group of expression profiles
corresponds to the APC-4 and tsp5D genes, which presented the
opposite trend, exhibiting decreasing transcription levels. The
third group included dac and atx-2, which showed the highest levels
in L4-L5F2. Five of the genes mentioned above (APC-4, fax, GlcAT-
P, kr-h1 and shot) were differentially transcribed between castes
(p,0.05) during at least one of the studied developmental stages,
all of which showed higher expression in queens.
The Shot Gene is Expressed Earlier and at Higher Levelsin the Brains of Queens
In addition to its higher transcription rate demonstrated via
RT-qPCR, using in situ hybridization, we were able to detect shot
gene transcripts in L4 brains of queens, but not in workers
(Figure 6 D, G, E, H), in which shot transcripts could only be
detected during L5F2 (Figure 6 F, I). Moreover, shot mRNA was
shown to be translated at a higher level in the brains of queens
than in workers (Figure 7). Anti-shot immunostaining (using the
mAbRod1 antibody) detected Shot protein in the cytoplasm of
cells near the antennal lobe neuropiles and proximal to the
Kenyon cells in the brains of L4 queens (co-localized with actin
filament bundles in some regions) (Figure 7 G, I), whereas no
positive images were obtained when workers’ brains were
processed (Figure 7 F, H).
Discussion
Heterochronic Larval Brain Development in HoneybeeCastes
Our results show that pedunculi, calyces, and antennal lobes are
more developed in queen than in worker larvae. Thus, because we
also demonstrated the occurrence of higher rates of cell
proliferation in queens, both processes, proliferation and fascicu-
lation, appear to be responsible for the observed differential
morphogenesis of female brains between honeybee castes. A larger
area corresponding to neuroblasts in the brains of queens than in
workers’ was also reported by Roat and Landim [5] based on the
examination of histological sections from the last stage of larval
development. Similarly, Groh and Roessler [35], reported
heterochronic shifts in the development of the olfactory centers
during pupal development for queens and workers. However, our
data not only show that the brains of queen larvae are more
developed, but also that brains of queens develop faster than those
of workers, thus representing a heterochronic reflex associated
with differential feeding leading to differential nervous system
development in female honeybees (Figure 4).
Patterns of Gene Transcription and their PutativeInvolvement in Differential Brain Development inHoneybee Castes
With the aim of identifying the molecular mediators of the
differential feeding regime related to the differential brain
morphogenesis observed between castes, we employed the
oligonucleotide microarray hybridization approach to compare
RNA samples from the brains of queens and workers at L4 and
RT-qPCR to determine the transcription profiles of selected genes
during the critical period of caste differentiation, from L3-L5,
which represents the majority of the larval phase [17,18]. A total of
24 genes (16 detected via microarray hybridization and 8 via
qPCR) showed significant levels of transcription during the larval
development of queens and workers, which suggests that their
Figure 7. Shot immunostaining during the 4th larval instar of A. mellifera castes. Triple labeling with DAPI (A, B), phalloidin staining (C, D)and anti-shot (mAbRod1; E, F). (G) Shot protein was immunolocalized to the cytoplasm of cells near the antennal lobe neuropiles (arrowhead) andproximal to the Kenyon cells in the brains of L4 queens (arrow). (H) As observed for mRNA, Shot protein was absent in worker brains in the 4th larvalinstar. Confocal plane of a queen brain (I) showing Shot staining in the cytoplasm of cells (arrows and arrowheads).doi:10.1371/journal.pone.0064815.g007
Gene Expression and Neurogenesis in A. mellifera
PLOS ONE | www.plosone.org 12 May 2013 | Volume 8 | Issue 5 | e64815

respective protein products participate in brain development in
honeybees.
PP2C, which was one of the genes up-regulated in the worker
brains (detected via microarray hybridization), belongs to a family
of phosphatase genes that are involved in the regulation of stress-
activated protein kinase cascades, which relay signals in response
to external stimuli [36]. In honeybees, the protein encoded by this
gene might intracellularly transduce the shift in the feeding regime
observed in worker larvae during the L3 stage (see [1]), thus
controlling the expression of downstream genes, resulting in a
restriction of worker brain development during the larval phase.
The other gene with a Drosophila ortholog that was up-regulated in
the worker brain is the predicted Aristaless-Related Homeobox (Al-
related) gene. In vertebrates, some members of the Aristaless family
(group II) are involved in optic system development [37] and in the
proliferation and differentiation of GABAergic neurons. Because
A. mellifera workers exhibit more facets in their compound eyes and
GABAergic neurons play essential roles in olfactory memory and
sensory integration, an up-regulation of Al-related proteins would
allow the development of nervous structures that are fundamental
for key skills in the adult bee, such as navigation and
communication.
Among the differentially expressed genes that were up-regulated
in the brains of queens, GlcAT-P (homolog of the mammalian
glucuronyltransferase b3gat1) and APC-4 deserve special attention.
GlcAT-P glucuronyltransferase activity is required for proteogly-
can and glycoprotein biosynthesis, which is important for the
development and function of the central and peripheral nervous
system [38]. In Drosophila, GlcAT-P is responsible for the growth of
peripheral nerves during larval development [39]. Our microarray
data showed that GlcAT-P was transcribed at a 5.55-fold higher
level in the brains of queens than in workers during the L4 stage
(Table 3). This result was confirmed by RT-qPCR, which also
showed higher levels of gene transcription in the brains of queens
throughout the larval period (p,0.05; Figure 5). The increased
GlcAT-P activity observed throughout larval development could
explain the greater and more rapid fasciculation observed in the
brains of queens. The other gene, APC4, which encodes a member
of the protein complex that regulates cell cycling and dendrite-
axon morphogenesis [40], is expressed at a 3.36–higher level in the
brains of queens. Interestingly, RT-qPCR confirmed this finding
and showed that this gene is transcribed at a higher level in the
brains of queens during the last larval instars (p,0.05 for L4 and
L5S1; Figure 5), when we could also detect more cell proliferation
in queen brains. The protein products of these two genes might be
involved in the mechanisms leading to the differential brain
development observed between honeybee castes through control-
ling the cell proliferation rate (APC4) and fasciculation (GlcAT-P).
Fax, which was one of the genes that showed an increasing
transcription profile and was differentially expressed between
castes, was initially characterized based on mutations that
enhanced Abelson tyrosine kinase (abl) mutant phenotypes [41].
Subsequent studies showed that Fax interacts with different
proteins involved in axon pathfinding [42]. The genomic sequence
of Amfax encodes a putative protein of ,45 kD, similar to two of
the largest and one of the first Fax protein variants found in D.
melanogaster [41]. However, the deduced amino acid sequence of
AmFax does not show stretches of hydrophobic amino acids, thus
indicating that it is unlikely to play a role in cell-cell interactions,
which are processes in which the D. melanogaster ortholog was
suggested to participate [41]. Like kr-h1, fax is up-regulated in the
brains of queens during the 5th larval instar, suggesting that it
participates in the differential brain morphogenesis observed
between castes, likely enhancing fasciculation and interneuronal
connections.
The Kr-h1 gene encodes a member of the zinc finger
transcription factor family implicated in neural morphogenesis
and the regulation of gene expression in response to ecdysteroids
[43,44]. The transcription profile of this gene in developing brains
shows low levels in both castes during L3-L4 and high levels only
in queens during the 5th larval instar, particularly in L5F2. In spite
of showing a negative correlation with neuronal morphogenesis in
developing D. melanogaster mushroom bodies [43], the observed
differential transcription of this gene suggests that Kr-h1 plays a
caste-specific role in brain morphogenesis during most of larval
development in honeybees. Because this developmental phase is
characterized by premetamorphic ecdysteroids peaks and kr-h1
expression has been suggested to be regulated by the ecdysone
signaling, the up-regulation of kr-h1 in the brains of queens may be
a response to the higher titers of ecdysteroids in this caste as a
consequence of differential feeding [1,30], thus contributing to
shaping the development of a larger brain queen larvae.
The Role of Shot Expression in the Differential LarvalBrain Development between Castes
The other gene that was differentially expressed between castes,
Shot, encodes cytoskeleton-associated proteins with binding sites for
F-actin and microtubules that is required for sensory and motor
axon extension in D. melanogaster [45,46]. The shot gene was initially
identified based on a mutation in which embryonic motoneurons
fail to reach their targets [47] and the correct axonal pathfinding
of mushroom body neurons does not occur [48], but it has also
been suggested to be involved in cell proliferation [49]. These
studies showed that clusters of neuroblasts homozygous for a
mutant form of shot exhibit significantly reduced cell numbers.
Because we observed higher rates of cell proliferation and
fasciculation in the brains of queens, the higher expression of
Amshot in fourth instar queen larvae, as indicated by RT-qPCR, in
situ hybridization and immunostaining, suggests that this gene is a
pivotal player in the gene expression cascade induced by
differential feeding in honeybees, which may underlie the
differential brain morphogenesis that occurs in castes of A. mellifera.
In conclusion, we showed that queen larvae develop larger
brains than worker larvae and that the queen brain develops more
rapidly than that of workers, thus representing a form of
developmental heterochrony, reflecting the effect of the differential
feeding regime of the two castes on nervous system development.
We also showed that this differential brain development is
characterized by caste-specific transcriptional profiles for a set of
genes (APC-4, GlcAT-P, fax, kr-h1 and shot), similar to the classically
proposed explanation for the brain/body weight ratio favoring
humans compared to chimpanzees [50,51]. In particular, based on
diverse experimental approaches, we showed that the shot gene is
more highly expressed in the brains of queens. These results point
to a link between differential nutrition and differential neurogen-
esis, via genes that control cell proliferation and fasciculation, thus
highlighting a biological question with more general, biomedical
implications. Since it has been previously demonstrated that
epigenetic events mediate variations in nutritional inputs leading
to bifurcating developmental trajectories in A. mellifera [52], we will
next address the methylation pattern of the found differentially
expressed genes, and conduct functional assays, especially to shed
light on the extent of the role of these genes in differential
neurogenesis.
Gene Expression and Neurogenesis in A. mellifera
PLOS ONE | www.plosone.org 13 May 2013 | Volume 8 | Issue 5 | e64815

Supporting Information
Figure S1 Negative control for the immunolocalization of Shot
(mAbRod1) in brains of honeybee queens at developmental stage
L4. (A) DAPI; (B): phalloidin/rhodamine; (C) incubated only with
the secondary antibody (Alexa-fluor 488); (D) merge.
(TIF)
Table S1 Slope, R2 and efficiencies values for each pair of
primers used.
(DOC)
Acknowledgments
We thank Luiz R. Aguiar for technical assistance in the experimental
apiary in Ribeirao Preto, Marcela A.F.B. Laure for help with dissections,
and Prof. Dr. Klaus Hartfelder for critically reading and commenting on a
previous version of this manuscript. Laser confocal microscopy was made
possible by the facility at FMRP-USP (FAPESP grant number 2004/
08868-0). The use of the slide scanner was kindly facilitated by Prof. Dr.
Eliana GM Lemos at UNESP.
Author Contributions
Conceived and designed the experiments: ARB LMM ZLPS. Performed
the experiments: LMM JV ACGF VB ADB ARB. Analyzed the data:
LMM JV ACGF VB ADB ARB ZLPS. Contributed reagents/materials/
analysis tools: ARB ZLPS. Wrote the paper: ARB LMM ADB ZLPS.
References
1. Barchuk AR, Cristino AS, Kucharski R, Costa LF, Simoes ZLP, et al. (2007)
Molecular determinants of caste differentiation in the highly eusocial honeybee
Apis mellifera. Bmc Developmental Biology 7.
2. Bomtorin AD, Barchuk AR, Moda LM, Paulino Simoes ZL (2012) Hox Gene
Expression Leads to Differential Hind Leg Development between Honeybee
Castes. Plos One 7.
3. Michener CD (1974) The social behavior of the bees. A comparative study. The
social behavior of the bees A comparative study: i–xii,1–404.
4. Fahrbach SE, Robinson GE (1996) Juvenile hormone, behavioral maturation,
and brain structure in the honey bee. Developmental Neuroscience 18.
5. Roat TC, Landim CdC (2008) Temporal and morphological differences in post-
embryonic differentiation of the mushroom bodies in the brain of workers,
queens, and drones of Apis mellifera (Hymenoptera, Apidae). Micron 39.
6. Boyan GS, Reichert H (2011) Mechanisms for complexity in the brain:
generating the insect central complex. Trends in Neurosciences 34.
7. Fahrbach SE (2006) Structure of the mushroom bodies of the insect brain.
Annual Review of Entomology 51.
8. Fahrbach SE, Strande JL, Robinson GE (1995) Neurogenesis is absent in the
brains of adult honey bees and does not explain behavioral neuroplasticity.
Neurosci Lett. Ireland. 145–148.
9. Malun D (1998) Early development of mushroom bodies in the brain of the
honeybee Apis mellifera as revealed by BrdU incorporation and ablation
experiments. Learning & Memory 5.
10. Farris SM, Robinson GE, Davis RL, Fahrbach SE (1999) Larval and pupal
development of the mushroom bodies in the honey bee, Apis mellifera. Journal
of Comparative Neurology 414.
11. Ganeshina O, Schafer S, Malun D (2000) Proliferation and programmed cell
death of neuronal precursors in the mushroom bodies of the honeybee. Journal
of Comparative Neurology 417.
12. Malun D, Moseleit AD, Grunewald B (2003) 20-hydroxyecdysone inhibits the
mitotic activity of neuronal precursors in the developing mushroom bodies of the
honeybee, Apis mellifera. Journal of Neurobiology 57.
13. Matos RJ, Orozco-Solis R, Lopes de Souza S, Manhaes-de-Castro R, Bolanos-
Jimenez F (2011) Nutrient restriction during early life reduces cell proliferation
in the hippocampus at adulthood but does not impair the neuronal
differentiation process of the new generated cells. Neuroscience. United States:
2011 IBRO. Published by Elsevier Ltd. 16–24.
14. Kraut R, Menon K, Zinn K (2001) A gain-of-function screen for genes
controlling motor axon guidance and synaptogenesis in Drosophila. Current
Biology 11.
15. Beck Y, Pecasse F, Richards G (2004) Kruppel-homolog is essential for the
coordination of regulatory gene hierarchies in early Drosophila development.
Dev Biol. United States. 64–75.
16. Barchuk AR, Bitondi MM, Simoes ZL (2002) Effects of juvenile hormone and
ecdysone on the timing of vitellogenin appearance in hemolymph of queen and
worker pupae of Apis mellifera. J Insect Sci 2: 1.
17. Michelette ERD, Soares AEE (1993) Characterization of preimaginal develop-
mental stages in africanized honey-bee workers (Apis-mellifera L). Apidologie 24:
431–440.
18. Rembold H, Kremer JP, Ulrich GM (1980) Characterization of post-embryonic
developmental stages of the female castes of the honey bee, Apis-mellifera L.
Apidologie 11: 29–38.
1 9 . A s h b u r n e r M ( 19 8 9 ) D r o s op h i l a . A l ab ora t o r y ha nd b o ok .
Drosophila A laboratory handbook: i-xliii, 1–1331.
20. Rachinsky A, Hartfelder K (1998) In vitro biosynthesis of juvenile hormone in
larval honey bees: Comparison of six media. In Vitro Cellular & Developmental
Biology-Animal 34.
21. Cox WG, Singer VL (2004) Fluorescent DNA hybridization probe preparation
using amine modification and reactive dye coupling. Biotechniques 36.
22. Saunders C, Cohen RS (1999) Double FISH and FISH-fluorescence
immunolocalization procedures for whole-mount Drosophila ovaries. Biotech-
niques 26.
23. Brazma A (2009) Minimum Information About a Microarray Experiment
(MIAME) - Successes, Failures, Challenges. Thescientificworldjournal 9: 420–
423.
24. Rutherford K, Parkhill J, Crook J, Horsnell T, Rice P, et al. (2000) Artemis:
sequence visualization and annotation. Bioinformatics 16: 944–945.
25. do Nascimento AM, Cuvillier-Hot V, Barchuk AR, Simoes ZLP, Hartfelder K
(2004) Honey bee (Apis mellifera) transferrin-gene structure and the role of
ecdysteroids in the developmental regulation of its expression. Insect
Biochemistry and Molecular Biology 34: 415–424.
26. Vandesompele J, De Preter K, Pattyn F, Poppe B, Van Roy N, et al. (2002)
Accurate normalization of real-time quantitative RT-PCR data by geometric
averaging of multiple internal control genes. Genome Biology 3.
27. Lourenco AP, Mackert A, Cristino AD, Simoes ZLP (2008) Validation of
reference genes for gene expression studies in the honey bee, Apis mellifera, by
quantitative real-time RT-PCR. Apidologie 39: 372–U333.
28. Livak KJ, Schmittgen TD (2001) Analysis of relative gene expression data using
real-time quantitative PCR and the 2(T)(-Delta Delta C) method. Methods 25.
29. Bustin SA, Benes V, Garson JA, Hellemans J, Huggett J, et al. (2009) The MIQE
Guidelines: Minimum Information for Publication of Quantitative Real-Time
PCR Experiments. Clinical Chemistry 55.
30. Hartfelder K, Engels W (1998) Social insect polymorphism: Hormonal
regulation of plasticity in development and reproduction in the honeybee.
Current Topics in Developmental Biology, Vol 40 40: 45–77.
31. Maestro JL, Cobo J, Belles X (2009) Target of Rapamycin (TOR) Mediates the
Transduction of Nutritional Signals into Juvenile Hormone Production. Journal
of Biological Chemistry 284.
32. Farris SM, Robinson GE, Fahrbach SE (2001) Experience- and age-related
outgrowth of intrinsic neurons in the mushroom bodies of the adult worker
honeybee. Journal of Neuroscience 21.
33. Farris SM, Sinakevitch I (2003) Development and evolution of the insect
mushroom bodies: towards the understanding of conserved developmental
mechanisms in a higher brain center. Arthropod Structure & Development 32.
34. Fristrom JW (1965) Development of the morphological mutant cryptocephal of
drosophila melanogaster. Genetics 52: 297–318.
35. Groh C, Roessler W (2008) Caste-specific postembryonic development of
primary and secondary olfactory centers in the female honeybee brain.
Arthropod Structure & Development 37.
36. Stern A, Privman E, Rasis M, Lavi S, Pupko T (2007) Evolution of the metazoan
protein phosphatase 2C superfamily. Journal of Molecular Evolution 64.
37. Meijlink F, Beverdam A, Brouwer A, Oosterveen TC, Ten Berge D (1999)
Vertebrate aristaless-related genes. International Journal of Developmental
Biology 43.
38. Yoshihara T, Sugihara K, Kizuka Y, Oka S, Asano M (2009) Learning/Memory
Impairment and Reduced Expression of the HNK-1 Carbohydrate in beta 4-
Galactosyltransferase-II-deficient Mice. Journal of Biological Chemistry 284.
39. Pandey R, Blanco J, Udolph G (2011) The Glucuronyltransferase GlcAT-P Is
Required for Stretch Growth of Peripheral Nerves in Drosophila. Plos One 6.
40. Yang Y, Kim AH, Bonni A (2010) The dynamic ubiquitin ligase duo: Cdh1-
APC and Cdc20-APC regulate neuronal morphogenesis and connectivity.
Current Opinion in Neurobiology 20.
41. Hill KK, Bedian V, Juang JL, Hoffmann FM (1995) Genetic interactions
between the drosophila abelson (abl) tyrosine kinase and failed axon connections
(fax), a novel protein in axon bundles. Genetics 141.
42. Liebl EC, Forsthoefel DJ, Franco LS, Sample SH, Hess JE, et al. (2000) Dosage-
sensitive, reciprocal genetic interactions between the Abl tyrosine kinase and the
putative GEF trio reveal trio’s role in axon pathfinding. Neuron 26.
Gene Expression and Neurogenesis in A. mellifera
PLOS ONE | www.plosone.org 14 May 2013 | Volume 8 | Issue 5 | e64815

43. Shi L, Lin S, Grinberg Y, Beck Y, Grozinger CM, et al. (2007) Roles of
Drosophila Kruppel-Homolog 1 in neuronal morphogenesis. DevelopmentalNeurobiology 67.
44. Grozinger CM, Robinson GE (2007) Endocrine modulation of a pheromone-
responsive gene in the honey bee brain. Journal of Comparative Physiology a-Neuroethology Sensory Neural and Behavioral Physiology 193.
45. Lee S, Harris KL, Whitington PM, Kolodziej PA (2000) short stop is allelic tokakapo, and encodes rod-like cytoskeletal-associated proteins required for axon
extension. Journal of Neuroscience 20.
46. Lee S, Kolodziej PA (2002) Short Stop provides an essential link between F-actinand microtubules during axon extension. Development 129.
47. Vanvactor D, Sink H, Fambrough D, Tsoo R, Goodman CS (1993) Genes thatcontrol neuromuscular specificity in Drosophila. Cell 73.
48. Lee T, Luo L (1999) Mosaic analysis with a repressible cell marker for studies of
gene function in neuronal morphogenesis. Neuron. United States. 451–461.
49. Reuter JE, Nardine TM, Penton A, Billuart P, Scott EK, et al. (2003) A mosaic
genetic screen for genes necessary for Drosophila mushroom body neuronal
morphogenesis. Development 130.
50. King MC, Wilson AC (1975) Evolution at two levels in humans and
chimpanzees. Science 188: 107–116.
51. Enard W, Khaitovich P, Klose J, Zollner S, Heissig F, et al. (2002) Intra- and
interspecific variation in primate gene expression patterns. Science 296.
52. Kucharski R, Maleszka J, Foret S, Maleszka R (2008) Nutritional control of
reproductive status in honeybees via DNA methylation. Science 319: 1827–
1830.
Gene Expression and Neurogenesis in A. mellifera
PLOS ONE | www.plosone.org 15 May 2013 | Volume 8 | Issue 5 | e64815