numerical flow analysis in a pelton turbine bucket
TRANSCRIPT

Seediscussions,stats,andauthorprofilesforthispublicationat:https://www.researchgate.net/publication/37424341
NumericalFlowAnalysisinaPeltonTurbineBucket
ARTICLE·JANUARY2004
Source:OAI
CITATIONS
11
READS
79
8AUTHORS,INCLUDING:
MohamedFarhat
ÉcolePolytechniqueFédéraledeLausanne
166PUBLICATIONS874CITATIONS
SEEPROFILE
FrançoisAvellan
ÉcolePolytechniqueFédéraledeLausanne
284PUBLICATIONS1,760CITATIONS
SEEPROFILE
MarioValle
SwissNationalSupercomputingCentre
39PUBLICATIONS662CITATIONS
SEEPROFILE
JeanM.Favre
SwissNationalSupercomputingCentre
31PUBLICATIONS188CITATIONS
SEEPROFILE
Availablefrom:MarioValle
Retrievedon:04February2016

22nd IAHR Symposium on Hydraulic Machinery and Systems June 29 – July 2, 2004 Stockholm – Sweden
1 (13)
Numerical Flow Analysis in a Pelton Turbine Bucket
Author Firm / Institution City, Country Lecturer (x)
Alexandre Perrig Mohamed Farhat François Avellan Etienne Parkinson Hélène Garcin Claude Bissel Mario Valle Jean Favre
Laboratory for Hydraulic Machines Swiss Federal Institute of Technology VA TECH HYDRO Swiss Center for Scientific Computing
Lausanne, Switzerland Vevey, Switzerland Manno, Switzerland
x
Abstract
The flow in the Pelton turbine bucket is three-dimensional, unsteady, turbulent, features a free surface, and is influenced by the rotation-induced forces. It is therefore difficult to investigate how the energy transfer takes place between the water flow and the buckets inner surface. The analysis of experimentally validated CFD results provides the opportunity to have a deep insight of the flow in the buckets. This paper presents the numerical investigations of the flow in a single bucket along a bucket period for an operating point close to the best efficiency of a 4-jet Pelton turbine model. The time history of the successive events occurring during the bucket period is first briefly presented. Then, the comparison of the pressure fields and the torque contribution for 5 different zones in the bucket is carried out. Significant discrepancies between the bucket pressure and torque distribution appear, highlighting that the regions, that are the most loaded in terms of mechanical strain, do not contribute the most to the bucket torque. This seems not to be related to the radial location of the bucket zones, but to the flow patterns, that are driven by the bucket design, and operating conditions. This study shows that an analysis of the bucket pressure and torque fields is paramount to quantitatively assess the effective energy transfer in the bucket.
Résumé
L’écoulement dans les turbines Pelton est tridimensionnel, turbulent, présente une surface libre, et est influencé par les forces induites par la rotation de la roue. Il est donc difficile d’étudier de quelle façon se déroule le transfert d’énergie entre les nappes d’eau et la surface intérieure de l’auget. Les résultats numériques validés expérimentalement offre alors la possibilité d'analyser finement l’écoulement dans les augets. Ce papier présente l’étude numérique de l’écoulement sur une période dans un auget d’un modèle réduit de turbine Pelton à 4 injecteurs, pour un point de fonctionnement proche du point de meilleur rendement.
paper_IAHR2004_perrig
22nd IAHR Symposium on Hydraulic Machinery and Systems June 29 – July 2, 2004 Stockholm – Sweden
2 (13)
L'évolution temporelle des phénomènes qui se succèdent au cours de la période de travail de l’auget est présentée brièvement. Ensuite, une comparaison des champs de pression et de la distribution des contributions au couple de cinq zones de l’auget est faite. D’importantes différences entre les distributions de pression et de couple sont visibles, montrant que les zones les plus chargées ne sont pas celles qui contribuent le plus au couple résultant. Ceci ne semble pas être lié à la position radiale des différentes zones, mais plutôt à la forme de l’écoulement donc au tracé de l’auget aux conditions de fonctionnement. Cette étude fait apparaître la nécessité d'analyser les champs de pression et leur contribution au couple résultant de l’auget pour juger quantitativement le transfert d’énergie dans l’auget.
Introduction
The present study has been initiated within the framework of CFD simulation of the free surface flow in Pelton turbines. Most of the numerical studies carried out so far focused on non-moving buckets. The first simulations of the three-dimensional unsteady free-surface flow were done by Hana (Ref. 1), Janetsky (Ref. 2), and Mack (Ref. 3), albeit with no experimental validations. Kvicinsky (Ref. 4, Ref. 6) validated CFD computations based on the two-phase homogeneous model on a flat plate and on a static bucket, while Parkinson demonstrated the ability of that model to correctly predict the velocity profiles in a free jet (Ref. 9), and was the first to report the unsteady pressure field in a rotating bucket (Ref. 7, Ref. 8). Regarding experiments on rotating machines, Kvicinsky instrumented a Pelton turbine model to measure the instantaneous pressure field in the inner surface of the buckets. An extensive range of operating points was documented (Ref. 4, Ref. 6). Bachmann (Ref. 11) conducted flow visualizations, and explained the flow pattern in and around a Pelton turbine model. The high accuracy of the numerical results (Ref .7, Ref. 8, and Ref. 10) allows using CFD as a tool for analyzing and predicting the physics of the flow in the Pelton turbine buckets. The following paper presents the comparison of the pressure field and resulting torque distribution for different zones of the bucket inner surface during a bucket period. First, the test case and the assumptions made for the CFD simulation are presented. Then, the methodology used for the zone resulting torque calculation is described. The temporal evolution of the flow distribution in the bucket is analysed. The results are discussed for each zone, pointing out that the zones that are the most loaded in terms of normal stress do not necessarily contribute the most to the resulting torque.
Test Case
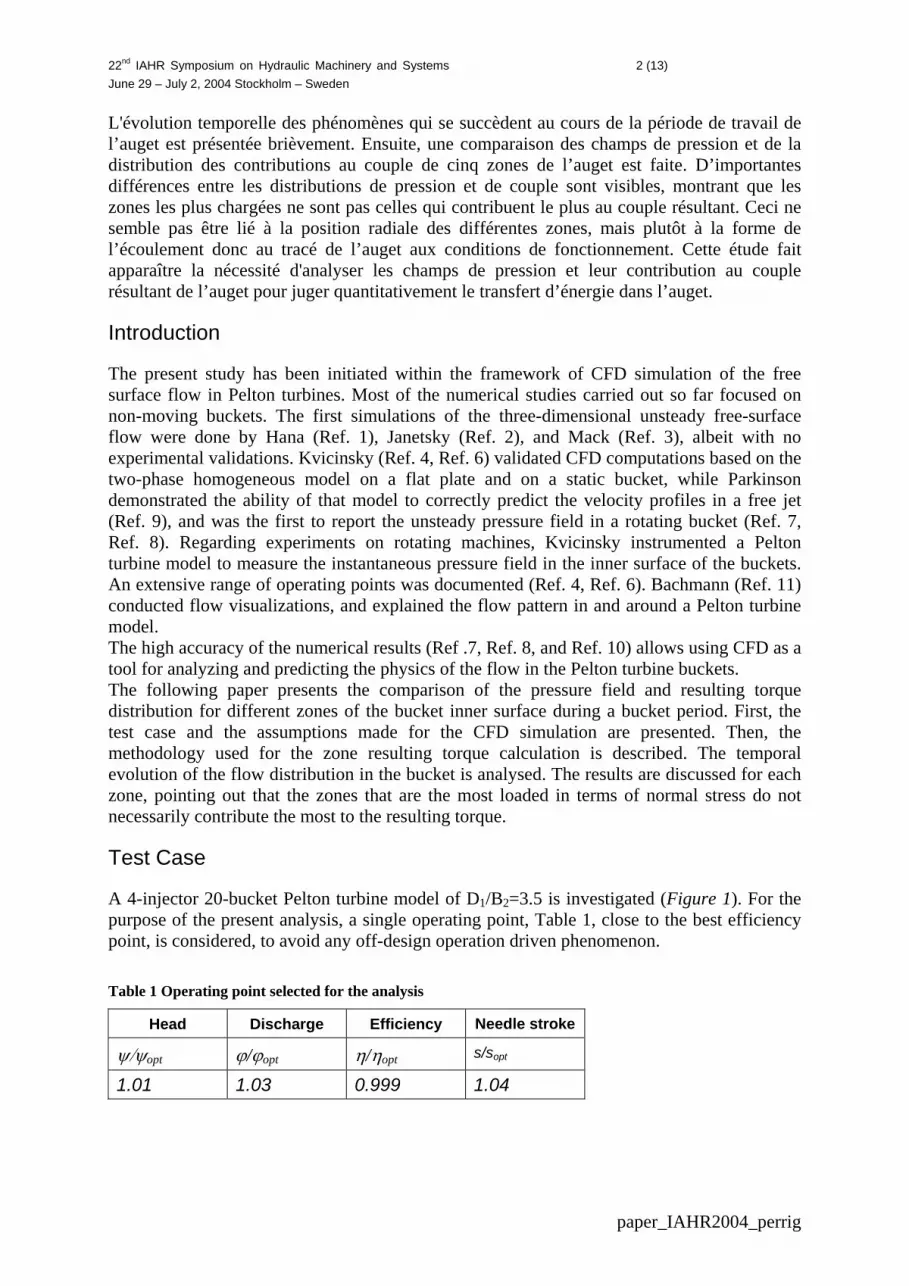
A 4-injector 20-bucket Pelton turbine model of D1/B2=3.5 is investigated (Figure 1). For the purpose of the present analysis, a single operating point, Table 1, close to the best efficiency point, is considered, to avoid any off-design operation driven phenomenon. Table 1 Operating point selected for the analysis
Head Discharge Efficiency Needle stroke
ψ/ψopt ϕ/ϕopt η/ηopt s/sopt
1.01 1.03 0.999 1.04
paper_IAHR2004_perrig

22nd IAHR Symposium on Hydraulic Machinery and Systems June 29 – July 2, 2004 Stockholm – Sweden
3 (13)
CFD Set up The incoming jet is assumed to be ideal with a constant velocity profile determined from the head and discharge conditions, and the flow relative to the splitter to be symmetrical. No casing is taken into account and the pressure surrounding the Pelton turbine is considered as constant. The numerical simulation of the flow is carried out with a RANS commercial code, featuring a two-phase homogeneous model and a correction for the free surface to minimize numerical diffusion at the air-water interface, an approach that proved to achieve good agreement with the experimental results (Ref. 7, Ref. 8, and Ref. 10). All the forces acting on the flow are modeled, including gravity, and surface tension. The computational domain is divided in two sub-domains, i.e. a stator with a dummy injector, and a rotor. By assuming periodic flow, one quarter of the runner only is simulated.
Figure 1 CAD model of the 20-bucket and 4-injector Pelton turbine. The unstructured mesh of the computational space domain is made of 2.4 million elements. A transient rotor-stator interface is set between the two sub-domains. The simulation is performed until the runner and bucket torques become periodic and the mass flow conservation throughout the computation domain is achieved.
Analysis
Methodology In the following sections, the results are presented over one period for one bucket, Tj, i.e. 90° in the case of a 4-injector turbine. All discussed data (torques, pressure, discharges, and visualizations) stem from the same bucket. From the aforementioned assumptions, only half of the bucket is considered, and divided in 5 zones, referred as zones 1 to 5, according to Kvicinsky (Ref. 4, Ref. 6). The zones are numbered according to the order in which each zone
paper_IAHR2004_perrig

22nd IAHR Symposium on Hydraulic Machinery and Systems June 29 – July 2, 2004 Stockholm – Sweden
4 (13)
is successively loaded (see Figure 2). A brief description of the successive events occurring during the bucket period is provided first through the bucket flow visualizations (Figure 5), and second from the discharge time evolution (Figure 3). The local pressure and torque fields are then discussed zone by zone. For the pressure discussion, a reference location is chosen for each zone, labeled C1 to C5, representative of the zone pressure field. The torque contribution of each zone is determined as follows. Each zone “i” is divided in “m” elementary surfaces Ai,k of normal vector ,i kn . The local surface normal force, acting on element “k”,
,i kNf , is calculated from the pressure field:
, , , ,i kN i k i k i kf p A n= (1) The local surface normal is projected on the local peripheral velocity at the radial location of element “k”, providing the effective force acting on element “k”, which generates the torque along the rotation axis direction:
, ,
,,
,i k i k
i kR R
i k
Ui kf f
U
⎛ ⎞⎜= ⋅⎜⎝ ⎠
U⎟⎟
(2)
From the radial location of element “k”, kr , the elementary torque contribution of element “k”,
, can be determined. The torque contribution of surface “i” is therefore expressed as: kt
( ,, ,1 1
i k
m m
i i k i k Rk k
T t r f= =
= = ×∑ ∑ ) . (3)
In order to assess the effect of the radial location of the zones, the normal force acting on each zone is also calculated:
,1
i
m
Rk
i kRF f=
= ∑ (4)
The local bucket torque contribution is normalized by the maximum value of the bucket torque, and the normal force by an equivalent normal force defined as:
max
1
2eqR
TFD
= (5)
paper_IAHR2004_perrig

22nd IAHR Symposium on Hydraulic Machinery and Systems June 29 – July 2, 2004 Stockholm – Sweden
5 (13)
Figure 2 View of the 5 bucket zones (1 to 5) and the pressure probes locations (C1 to C5) Flow survey The sequence of events during the bucket period is divided in 5 main steps (Ref. 11).
a) 0°-15° At 0°, the jet encounters the splitter tip, and the cutout lips of the bucket. Until 15°, the splitter penetrates the jet, and from 15°, the bucket begins to receive the full jet. The main flow moves from the cutout region on a radial direction towards the root, reaching zones 1 and 2. The flow regime evolutes from the jet impact to the sheet flow (see Figure 5 a).
b) 15°-30° The bucket is fed by the full jet from 15°, until the following bucket tip impacts the jet. From that instant, the jet is progressively cut, and from 30° (1/3Tj), completely separated from the injector. The separated jet remains attached to the back surface of the preceding bucket, because of the higher velocity of the water than that of the bucket that creates a low-pressure zone (Ref.11). From 30°, the water sheet flow is established in the bucket, and covers most of zone 1, 2, 3 and 4. The first particles of water leave the bucket close to the root, in zone 4.
c) 30°-45° The cut piece of the jet becomes more and more distorted, and continues to move backwards until the bucket is exclusively fed from zone 3. The water sheet in the bucket flows laterally from the runner with a counter rotation, and leaves the runner from zone 4 and 5 simultaneously.
d) 45°-70° The last drops of water enter the bucket in zone 3, while the outgoing discharge reaches its maximum. Most of the water moves in radial outward direction, leaving the bucket from zone 5, closely to the lateral edges of the cutout, in a more and more circumferential direction.
paper_IAHR2004_perrig

22nd IAHR Symposium on Hydraulic Machinery and Systems June 29 – July 2, 2004 Stockholm – Sweden
6 (13)
e) 70°-90° The last drops of water leave the bucket exclusively from zone 5, until the next jet encounters the bucket at 90° (Tj), and the cycle starts again. The evacuating process is not completely achieved at that instant. The outflow discharge ϕ_out* appears to never reach a null value (Figure 3). The discharge and its radial component decrease do not cease completely, resulting in a line of droplets visible along the entire runner periphery, even in the case of a one-jet machine (Ref. 11). The flow conservation throughout its travel in the bucket achieved by the simulation is excellent, as shown by Figure 3.
0.00
0.05
0.10
0.150 10 20 30 40 50 60 70 80
0 1/9 2/9 3/9 4/9 5/9 6/9 7/9 8/9 1
B
90
ucket angular position [T/Tj]
Bucket angular position [°]
ϕ∗ [-
]
outflow
inflow
Figure 3 Discharges entering and leaving the bucket Pressure and torque discussion (Figure 4 and 5) Zone1 Between 0° and 15°, the pressure at C1, Cp1, increases about at the same rate as the discharge ϕ*(inflow). Cp1 reaches its maximum when the full jet enters the bucket, and starts to decrease thereafter, as the jet is cut and moves backwards to the bucket root, and does not impact zone 1 anymore. At 30° (1/3Tj), the signal exhibits a change in slopes, and remains constant until past 45° (1/2Tj), as the separated jet starts to feed the bucket in zone 3 and the flow regime changes from the jet to the sheet flow. From 45° (1/2Tj), Cp1 vanishes, as no more water travels on zone 1.
Zone 1 torque contribution, T1, accounts for 21% of the maximum bucket torque. Its maximum is reached, as Cp1, when the bucket receives the full jet. Most of T1 stems from the direct impact of the jet during the first fractions of the bucket period, i.e. 0° to 20° (0-2/9Tj). T1 decreases slowly as the flow regime in zone 1 progressively changes from direct jet impact to water sheet flow. T1 vanishes at 55° (5/8Tj), when no more water flows in zone 1.
paper_IAHR2004_perrig

22nd IAHR Symposium on Hydraulic Machinery and Systems June 29 – July 2, 2004 Stockholm – Sweden
7 (13)
Zone 2 Cp2 rises shortly before Cp1 reaches its maximum, close to 15°, and attains its maximum value between 25° and 30° (1/3Tj), as the water particles entered during the full jet reach zone 2. The flow is already in transition from direct impact and water sheet. Cp2 decreases from that moment, but lasts until 70° (3/4Tj), because the water entered in zone 3 tends to flow outwards in the direction of the cutout. The signal shrinks as the feeding process stops.
T2 increases at a faster rate than T1, and contributes to more than 41% of the maximum bucket torque, T*. The torque contribution stems from both the direct impact of the circumferential edges of the jet during the signal rise, and the long lasting water sheet flow transiting by zone 2 during the second half of the bucket period. T2 represents the highest contribution of all zones, from 12° to 70°, i.e. more than 2/3 of the bucket period. Zone 2 is the intersection point of the bucket flow trajectories, and receives almost all the water particles, from the first one to the last one that enters the bucket, i.e. stemming from zone 1 and zone 3.
Zone 3 Cp3 reaches its maximum value shortly after Cp2, at 30° (1/3Tj), when the bucket torque, T*, is close to its maximum. Cp3 starts to decrease after that moment. An inflexion point is visible on the negative slope of Cp3, at 45° (1/2Tj), as the remaining portion of the jet starts to enter the bucket in zone 3. The signal drops as the jet separates from the back surface of the preceding bucket and the last particles of water enter the bucket.
T3 accounts for 16% of the maximum bucket torque, whereas Cp3 represents more than 70% of Cp2. This can be explained by the orientation of the bucket surface, and because zone 3 receives water that already exchanged its energy in zones 1 and 2 between 15° and 35°. The radius of application of the normal force seems not to be related to this, as shown by Figure 4. T3 also exhibits a change in slope, showing the regime change from the water sheet flow to the direct impact of the last portion of the jet. Nevertheless, T3 continues to decrease, because the remaining portion of the jet momentum is very low, as it lost kinetic energy creating the depression at the bucket back and in deformation, and because the discharge is less than 50% of its peak value.
Zone 4 Cp4 presents about the same shape as Cp3, but with no inflexion point, less amplitude, and a shorter signal. The signal disappears past 70° (7/9Tj). Zone 4 only receives water sheet flow.
T4, while it looks similar to T3, is slightly shorter, and presents smaller amplitude, contributing to less than 14.5% of the maximum bucket torque. A conjunction of two phenomena is responsible for that: (1) the surface normal vectors are not optimally oriented as far as torque transmission is considered, and (2) the flow has already exchanged energy in zones 1, 2, and 3. T4 vanishes shortly after 65°. The short signal stems from the fact that the flow tends to bypass zone 4 and flow directly towards zone 5, as portrayed in Figure 5(a). As for zone 3, the radius of application seems not to be related (Figure 4).
paper_IAHR2004_perrig

22nd IAHR Symposium on Hydraulic Machinery and Systems June 29 – July 2, 2004 Stockholm – Sweden
8 (13)
Zone 5 Cp5 starts at 30° (1/3Tj), reaches its maximum at 45° (1/2Tj), and then decreases very slowly. It is interesting to note that Cp5 exhibits the same shape as the outflow discharge ϕ*(outflow) (Figure 3). This again proves that the main flow leaves the bucket from zone 5 (Ref. 11).
T5 displays the same amplitude as T3 and T4, but lasts twice as long, ranging from 20° to 85°, and quasi never comes to an end. It is interesting to note that its peak value represents 13% of the maximum bucket torque value, almost as much as zone 4, but with a 15° phase shift.
Conclusion
A pressure field analysis highlights the evolution of the flow distribution in the bucket: the flow in the bucket balances back and forth, flowing from zone 1 to zone 2 and from zone 2 to zone 3, 4 and 5 in a counterclockwise pattern (Ref. 11). However, the pressure field shows the regions that are the most loaded in terms of normal stress, but does not give real information about the energy transfer in the bucket. The torque contribution of the different bucket regions highlights the effective momentum transfer between the flow and the bucket throughout the bucket period. Zone 1 and zone 2 contribute the most to the bucket torque, because these two regions receive the direct impact of the jet at the beginning of the bucket period, when the kinetic energy of the flow is at its maximum. Zone 2 contributions exhibits the longest and tallest pressure signal, lasting more than 2/3 of the bucket period, and accounts for more than 40% of the bucket torque. Zone 2 can be considered as a focus region, which collects all the water particles transiting in the bucket. T* max is reached at 30° (1/3Tj), when the contributions of zone 2, 3 and 4 are at their respective maximum. The first flow particles, arrived with the highest kinetic energy are leaving the bucket at that instant. The jet entering the bucket in region 3 only has 25% of the momentum of the full jet received in zone 1 between 10° and 20°(1/9 and 2/9Tj). It also appears that the last particles entered in zone 3 barely do not contribute anymore to the bucket torque, and that they bypass zone 4 and leave the bucket from zone 5 (Figure 5 (right)). Zones 3, and 4 are far more loaded than zone 5, but zone 5 surpasses all the other regions in terms of torque contribution duration, accounting for more than 2/3 of the bucket period. The radius of application of the location, where the momentum change occurs, does not seem to play a significant role in the resulting bucket torque. The most critical point is the jet energy, the surface orientation, and the trajectories of the water particles.
Perspectives
The previous analysis highlights the zones where most of the bucket torque is built up, but still does not embrace the effective energy transfer occurring in the buckets. An energy balance along the water particles trajectories is needed. For that, a conservation of momentum, including all the forces acting on the flow, from the rotation induced forces and the gravity to the surface tension should be performed, using a Lagrangian flow particle tracking method. Also, the CFD set up should be enhanced. The assumptions made for the calculation could be improved. As a matter of fact, the incoming flow jet is far from being an ideal jet: it is well known that jets stemming from real Pelton turbine facilities distributors and injectors exhibit an asymmetrical dispersion, and that their shape is defined from secondary flow fields (Ref. 8, Ref. 9).
paper_IAHR2004_perrig

22nd IAHR Symposium on Hydraulic Machinery and Systems June 29 – July 2, 2004 Stockholm – Sweden
9 (13)
0
0.05
0.1
0.15
0.2
0.250 10 20 30 40 50 60 70 80 90
Cp [-
]
Cp1
Cp2
Cp3 Cp4
Cp5
Bucket angular position [°]
0
0.1
0.2
0.3
0.4
0.5
T1
T2
T3
T4 T5
Loca
l tor
que
T* i [-]
0
0.05
0.1
0.15
0.2
0 1/9 2/9 3/9 4/9 5/9 6/9 7/9 8/9 1
Bucket angular position [T/Tj]
Nor
mal
forc
e F* N
i [-]
F1
F2
F3 F4 F5
Figure 4 (Top) Local pressure; (Center) Local torque; (Bottom) Local normal force
paper_IAHR2004_perrig

22nd IAHR Symposium on Hydraulic Machinery and Systems June 29 – July 2, 2004 Stockholm – Sweden
10 (13)
Angular Position Top View Side View Pressure-Torque
Comparison Angular
Pos.
0
0°
19 jT
10°
29 jT
20°
39 jT
30°
49 jT
40°
Figure 5(a) Flow patterns in the bucket (0-4/9Tj); (Left) View from top; (Center) View from the side; (Right) Normalized pressure (left bucket side) and torque fields (right bucket side);. Dark blue is 0, green is 0.5, and red is 1.
paper_IAHR2004_perrig

22nd IAHR Symposium on Hydraulic Machinery and Systems June 29 – July 2, 2004 Stockholm – Sweden
11 (13)
Angular Position Top View Side View Pressure-Torque
Comparison Angular
Pos.
59 jT
50°
69 jT
60°
79 jT
70°
89 jT
80°
jT
90°
Figure 5(b) Flow patterns in the bucket (5/9Tj-Tj); (Left) View from top; (Center) View from the side; (Right) Normalized pressure (left bucket side) and torque fields (right bucket side). Dark blue is 0, green is 0.5, and red is 1.
paper_IAHR2004_perrig

22nd IAHR Symposium on Hydraulic Machinery and Systems June 29 – July 2, 2004 Stockholm – Sweden
12 (13)
Nomenclature
Term Symbol Units Term Symbol Units
Bucket inner width B2 m Reference
speed 0 2U E= m.s-1
Pressure coefficient
atmp pCpEρ
−=
- Jet average
speed 00.98jetU U= m.s-1
Normalized pressure coefficient max
* CpCpCp
= - Peripheral velocity
11 2
DU ω= m.s-1
Nozzle diameter D0 m
Local peripheral velocity
m mU Rω= m.s-1
Pelton diameter D1 m Number of jets jz -
Specific Hydraulic energy E J.kg-1
Pressure p Pa
Discharge coefficient
22
14j
QBz U
ϕπ
= -
Flow Rate Q m3.s-1
Instantaneous discharge coefficient
( )22
1
*( )
4j
Q tt
Bz Uϕ
π=
-
Needle stroke s m
Energy coefficient 2
1
2EU
ψ = -
Jet angular period 360
jj
Tz
°= °
Density ρ kg.m-3
Normalized local torque
*
maxi
TTT
= Angular
velocity ω rad.s-1
Acknowledgments
The authors would like to thank particularly the staff members of EPFL Laboratory for Hydraulic Machines for their help. They are also particularly grateful to Dr Djordje Maric, and Dr Marie-Christine Sawley from CSCS Manno for their outstanding support. The present paper reports for the research project founded by VATECH Hydro and CTI, the Swiss Federal Commission for Technology and Innovation, contract award N° 6139.EKS.
paper_IAHR2004_perrig

22nd IAHR Symposium on Hydraulic Machinery and Systems June 29 – July 2, 2004 Stockholm – Sweden
13 (13)
References
Ref. 1 Hana M., “A discussion on numerical simulation in Pelton turbines”, Proceedings of the 19th IAHR Symposium, Singapore, 9-11 September 1998
Ref. 2 Janetzky B., Ein Verfahren zur Berechnung instationärer Strömungen mit freier Oberfläsche, Ph.D. thesis, Institut für Strömungsmechanik und Hydraulische Strömungmaschinen, Universität Stuttgart, 2001
Ref. 3 Mack R., Moser W., Numerical investigations of the flow in a Pelton turbine, Proceedings of the of XXIst IAHR Symposium on Hydraulic Machinery and Systems, September 9-12, 2002, Lausanne, Switzerland
Ref. 4 Kvicinsky S., “Méthode d’analyse des écoulements 3D à surface libre: application aux turbines Pelton”, PhD Thesis, Swiss Federal Institute of Technology, Lausanne, Switzerland, 2002
Ref. 5 Kvicinsky S., Longatte F., Avellan F., Kueny J-L., “Free surface flows: experimental validation of the Volume of Fluid (VOF) method in the plane wall case”, Proceedings of the 3rd ASME/JSME, 1999, San Francisco, USA
Ref. 6 Kvicinsky S., Kueny J-L., Avellan F., Parkinson E., “Experimental and numerical analysis of free surface flows in a rotating bucket”, Proceedings of the XXIst IAHR Symposium on Hydraulic Machinery and Systems, September 9-12, 2002, Lausanne, Switzerland, pp. 359-364
Ref. 7 Parkinson P., Garcin H., Bissel C., Muggli F., Braune A., “Description of Pelton flow patterns with computational flow simulations”, Hydro 2002: Development, Management, Performances, November 4-7, 2002, Kiris, Turkey
Ref. 8 Parkinson E., Vullioud G., Geppert L., Keck H., “Analysis of Pelton turbine flow patterns for improved runner-component interaction”, Hydropower & Dams, Issue Five, 2002
Ref. 9 Parkinson E., Garcin H., Vullioud G., Zhang Z., Muggli F., Casartelli E., “Experimental and numerical investigations of the free jet flow at a model nozzle of a Pelton turbine”, Proceedings of the XXIst IAHR Symposium on Hydraulic Machinery and Systems, September 9-12, 2002, Lausanne, Switzerland, pp. 347-352
Ref. 10 Sick M., Keck H., Parkinson E., Vullioud G., “New challenges in Pelton research”, Hydro 2000, Bern, Switzerland
Ref. 11 Bachmann P., Schärer Ch., Staubli T., Vullioud G., “Experimental flow studies on a 1-jet model turbine Pelton”, Proceedings of 15th IAHR Symposium on Modern Technology in Hydraulic Energy Production, September 11-14, 1990, Belgrade, Yugoslavia, pp. 1-13
paper_IAHR2004_perrig