nucleon resonances in Ï photoproduction
TRANSCRIPT
arX
iv:n
ucl-
th/0
0060
57v3
13
Nov
200
0
nucl-th/0006057
Nucleon resonances in ω photoproduction
Yongseok Oh,a∗ Alexander I. Titov,b† and T.-S. H. Lee c‡
a Institute of Physics, Academia Sinica, Nankang, Taipei 11529, Taiwanb Bogoliubov Laboratory of Theoretical Physics, JINR, Dubna 141980, Russia
c Physics Division, Argonne National Laboratory, Argonne, Illinois 60439
Abstract
The role of the nucleon resonances (N∗) in ω photoproduction is investi-
gated by using the resonance parameters predicted by Capstick and Roberts
[Phys. Rev. D 46, 2864 (1992); 49, 4570 (1994)]. In contrast with the previ-
ous investigations based on the SU(6) × O(3) limit of the constituent quark
model, the employed N∗ → γN and N∗ → ωN amplitudes include the con-
figuration mixing effects due to the residual quark-quark interactions. The
contributions from the nucleon resonances are found to be significant relative
to the non-resonant amplitudes in changing the differential cross sections at
large scattering angles and various spin observables. In particular, we suggest
that a crucial test of our predictions can be made by measuring the parity
asymmetry and beam-target double asymmetry at forward scattering angles.
The dominant contributions are found to be from N 32
+(1910), a missing res-
onance, and N 32
−(1960) which is identified as the D13(2080) of the Particle
Data Group.
PACS number(s): 13.88.+e, 13.60.Le, 14.20.Gk, 25.20.Lj
Typeset using REVTEX
∗E-mail address: [email protected], Address after Aug. 1, 2000: Institute of Physics and
Applied Physics, Yonsei University, Seoul 120-749, Korea
†E-mail address: [email protected]
‡E-mail address: [email protected]
1
I. INTRODUCTION
The constituent quark models predict a much richer nucleon excitation spectrum thanwhat have been observed in pion-nucleon scattering [1]. This has been attributed to thepossibility that a lot of the predicted nucleon resonances (N∗) could couple weakly to theπN channel. Therefore it is necessary to search for the nucleon excitations in other reac-tions to resolve the so-called “missing resonance problem.” Electromagnetic production ofvector mesons (ω, ρ, φ) is one of such reactions and is being investigated experimentally,e.g., at Thomas Jefferson National Accelerator Facility, ELSA-SAPHIR of Bonn, GRAALof Grenoble, and LEPS of SPring-8.
The role of the nucleon excitations in vector meson photoproduction was studied recentlyby Zhao et al. [2–4] using an effective Lagrangian method within the SU(6)×O(3) constituentquark model. With the meson-quark coupling parameters adjusted to fit the existing data,they found that the single polarization observables are sensitive to the nucleon resonances.
We are motivated by the predictions by Capstick and Roberts [5,6]. They started witha constituent quark model which accounts for the configuration mixing due to the residualquark-quark interactions [7]. The predicted baryon wave functions are considerably differentfrom those of the SU(6) × O(3) model employed by Zhao et al. in Refs. [2–4]. The secondfeature of the predictions from Refs. [5,6] is that the meson decays are calculated from thecorrelated wave functions by using the 3P0 model [8]. Thus it would be interesting to seehow these predictions differ from those of Refs. [2–4] and can be tested against the data ofvector meson photoproduction.
We will focus on ω photoproduction in this work, simply because its non-resonant reactionmechanisms are much better understood. It was fairly well established [9–13] already duringthe years around 1970 that this reaction is dominated by diffractive processes at high energiesand by one-pion exchange at low energies. The diffractive part can be described by thePomeron exchange model. The calculation of the one-pion exchange amplitude has beenrecently revived by Friman and Soyeur [14]. It is therefore reasonable to follow the earliertheoretical analyses [11] and assume that the non-resonant amplitude of ω photoproductioncan be calculated from these two well-established mechanisms with some refinements. Theresulting model then can be a starting point for investigating the N∗ effects. This approachis similar to the previous investigation by Zhao et al. [2,3].
In Sec. II, we give explicit expressions for the non-resonant amplitudes employed in ourcalculations. The calculations of resonant amplitudes from Refs. [5,6] are detailed in Sec. IIIand the results are presented in Sec. IV. Section V is devoted to discussing possible futuredevelopments.
II. NON-RESONANT AMPLITUDES
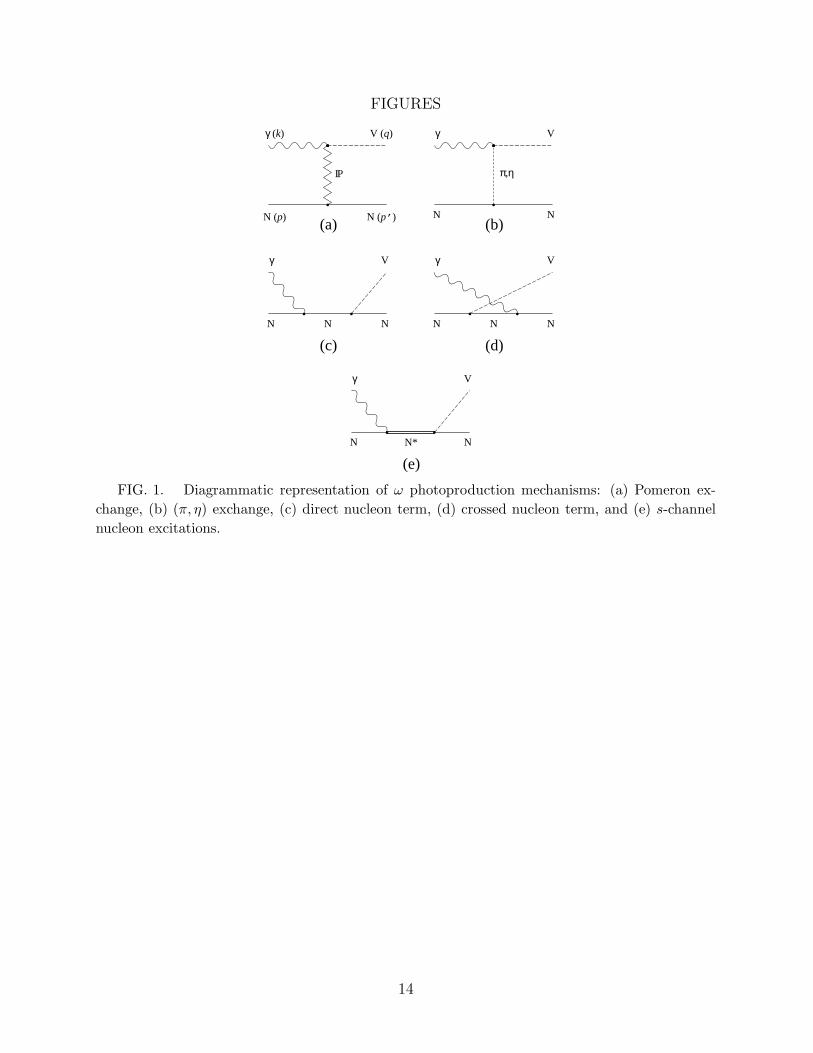
We assume that the non-resonant amplitude is due to the Pomeron exchange [Fig. 1(a)],pseudoscalar-meson exchange [Fig. 1(b)], and the direct and crossed nucleon terms [Figs. 1(c)and 1(d)]. The four-momenta of the incoming photon, outgoing ω, initial nucleon, and finalnucleon are denoted as k, q, p, and p′ respectively, which defines t = (p − p′)2 = (q − k)2,s ≡ W 2 = (p + k)2, and the ω production angle θ by cos θ ≡ k · q/|k||q|.
2
We choose the convention [15] that the scattering amplitude T is related to the S-matrixby
Sfi = δfi − i(2π)4δ4(k + p − q − p′)Tfi (1)
with
Tfi =1
(2π)6
1√
2Eω(q)
√
MN
EN (p′)Ifi
1√
2|k|
√
MN
EN(p), (2)
where Eα(p) =√
M2α + p2 with Mα denoting the mass of the particle α. The invariant
amplitude can be written as
Ifi = Ibgfi + IN∗
fi , (3)
where the nonresonant (background) amplitude is
Ibgfi = IP
fi + Ipsfi + IN
fi (4)
with IPfi, Ips
fi , and INfi denoting the amplitudes due to the Pomeron exchange, pseudoscalar-
meson exchange, and direct and crossed nucleon terms, respectively. The nucleon excitationterm IN∗
fi will be given in Sec. III.For the Pomeron exchange, which governs the total cross sections and differential cross
sections at low |t| in the high energy region, we follow the Donnachie-Landshoff model [16],which gives [17,18]
IPfi = iM0(s, t) um
f(p′)ε∗µ(ω) {k/gµν − kµγν} εν(γ)umi
(p), (5)
where εµ(ω) and εν(γ) are the polarization vectors of the ω meson and photon, respectively,and um(p) is the Dirac spinor of the nucleon with momentum p and spin projection m. ThePomeron exchange is described by the following Regge parameterization
M0(s, t) = CV F1(t) FV (t)
(
s
s0
)αP (t)−1
exp
{
−iπ
2[αP (t) − 1]
}
, (6)
where F1(t) is the isoscalar electromagnetic form factor of the nucleon and FV (t) is the formfactor for the vector-meson–photon–Pomeron coupling. We also follow Ref. [16] to write
F1(t) =4M2
N − 2.8t
(4M2N − t)(1 − t/t0)2
,
FV (t) =1
1 − t/M2V
2µ20
2µ20 + M2
V − t, (7)
where t0 = 0.7 GeV2. The Pomeron trajectory is known to be αP (t) = 1.08+0.25 t. (See alsoRef. [19]) The strength factor CV reads CV = 12
√4παemβ2
0/fV with the vector meson decayconstant fV (= 17.05 for the ω meson) and αem = e2/4π. By fitting all of the total cross
3
section data for ω, ρ, and φ photoproduction at high energies, the remaining parameters ofthe model are determined: µ2
0 = 1.1 GeV2, β0 = 2.05 GeV−1, and s0 = 4 GeV2.The pseudoscalar-meson exchange amplitude can be calculated from the following effec-
tive Lagrangians,
Lωγϕ =egωγϕ
MVǫµναβ∂µων∂αAβ ϕ,
LϕNN = −igπNNNγ5τ3Nπ0 − igηNN Nγ5Nη, (8)
where ϕ = (π0, η) and Aβ is the photon field. The resulting invariant amplitude is
Ipsfi = −
∑
ϕ=π,η
iFϕNN (t)Fωγϕ(t)
t − M2ϕ
egωγϕgϕNN
MV
umf(p′)γ5umi
(p) εµναβqµkαε∗ν(ω)εβ(γ). (9)
In the above, we have followed Ref. [14] to include the following form factors to dress theϕNN and ωγϕ vertices,
FϕNN(t) =Λ2
ϕ − M2ϕ
Λ2ϕ − t
, Fωγϕ(t) =Λ2
ωγϕ − M2ϕ
Λ2ωγϕ − t
. (10)
We use g2πNN/4π = 14 for the πNN coupling constant. The ηNN coupling constant is not
well determined [20]. Here we use g2ηNN/4π = 0.99 which is obtained from making use of
the SU(3) symmetry relation [21] together with a recent value of F/D = 0.575 [22]. Thecoupling constants gωγϕ can be estimated through the decay widths of ω → γπ and ω → γη[23] which lead to gωγπ = 1.823 and gωγη = 0.416. The cutoff parameters Λϕ and Λωγϕ inEq. (10) will be specified in Sec. IV.
We evaluate the direct and crossed nucleon amplitudes shown in Fig. 1(c) and 1(d) fromthe following interaction Lagrangians,
LγNN = −eN
(
γµ1 + τ3
2Aµ − κN
2MN
σµν∂νAµ
)
N,
LωNN = −gωNN N
(
γµωµ − κω
2MN
σµν∂νωµ
)
N, (11)
with the anomalous magnetic moment of the nucleon κp(n) = 1.79 (−1.91). There aresome uncertainties in choosing the ωNN coupling constants. In this work, we considergωNN = 7.0 ∼ 11.0 and κω ≈ 0, which are determined in a study of πN scattering and pionphotoproduction [24]. The resulting invariant amplitude reads
INfi = um
f(p′)εµ∗(ω)Mµνε
ν(γ)umi(p), (12)
where
Mµν = −egωNN
[
Γωµ(q)
6p + 6k + MN
s − M2N
Γγν(k)FN(s) + Γγ
ν(k)6p − 6q + MN
u − M2N
Γωµ(q)FN(u)
]
(13)
with
4
Γωµ(q) = γµ − i
κω
2MN
σµαqα, Γγν(k) = γν + i
κp
2MN
σνβkβ, (14)
and s = (p + k)2, u = (p − q)2. Here we have followed Ref. [25] to include a form factor
FN(r) =Λ4
N
Λ4N − (r − M2
N )2(15)
with r = s or t. The cutoff parameter ΛN will be specified later in Sec. IV.The amplitude (13) is not gauge-invariant because of the form factors FN(s) and FN(u).
(Note that the terminology “gauge invariance” here only means the “current conservation”conditions Mµνk
ν = qµMµν = 0 as considered in most investigations.) To restore thegauge invariance, we follow Ref. [26] and modify the amplitude Mµν by using the projectionoperator Pµν = gµν − kµqν/k · q;
Mµν → Pµµ′Mµ′ν′
Pν′ν , (16)
which leads to the following modifications in evaluating the amplitude (13):
Γωµ(q) → Γω
µ(q) − 1
k · qkµq · Γω(q),
Γγν(k) → Γγ
ν(k) − 1
k · q qνk · Γγ(k). (17)
The above prescription is certainly very phenomenological, while it is similar to other ac-cepted approaches in literature. Perhaps a more rigorous approach can be developed byextending the work for pseudoscalar meson production [25] to the present case of vectormeson production. This is however beyond the scope of this investigation. For our presentexploratory purposes, the prescription defined by Eqs. (16) and (17) is sufficient.
III. RESONANT AMPLITUDE
In order to estimate the nucleon resonance contributions we make use of the quark modelpredictions on the resonance photo-excitation γN → N∗ and the resonance decay N∗ → ωNreported in Refs. [5,6] using a relativised quark model. The resonant amplitude is illustratedin Fig. 1(e). The crossed N∗ amplitude, similar to Fig. 1(d), cannot be calculated from theinformations available in Refs. [5,6] and are not considered in this work. Here we followRef. [24] and write the resonant amplitude in the center of mass frame as [in the conventiondefined by Eqs. (1) and (2)]
IN∗
mf ,mω ,mi,λγ(q,k) =
∑
J,MJ
MN∗→N ′ω(q; mf , mω; J, MJ)MγN→N∗(k; mi, λγ; J, MJ)√
s − MJR + i
2ΓJ(s)
, (18)
where MJR is the mass of a N∗ with spin quantum numbers (J, MJ), and mi , mf , λγ, and mω
are the spin projections of the initial nucleon, final nucleon, incoming photon, and outgoingω meson, respectively. Here we neglect the effect due to the nonresonant mechanisms on the
5
N∗ decay amplitudes and the shift of the resonance position. Then the resonance mass MJR
and the N∗ decay amplitudes MN∗→γN,ωN can be identified with the quark model predictionsof Refs. [5,6], as discussed in Refs. [24,27]. We however do not have information about thetotal decay width ΓJ(s) for most of the N∗’s considered here. For simplicity, we assume thatits energy-dependence is similar to the width of the N∗ → πN decay within the oscillatorconstituent quark model. Following Ref. [27] and neglecting the real part of the mass shift,we then have
ΓJ(s) = ΓJ0
ρ(kπ)
ρ(k0π)
(
kπ
k0π
)2Lπ
exp[
2(k20π − k2
π)/Λ2]
, (19)
where Lπ is the orbital angular momentum of the considered πN state and
ρ(k) =kENEπ
EN + Eπ
. (20)
In the above equations, kπ(≡ |kπ|) is the pion momentum at energy√
s while k0π is evaluatedat
√s = MJ
R. Our choice of the total average width ΓJ0 and cutoff parameter Λ for Eq. (19)
will be specified in Sec. IV.By setting the photon momentum in the z-direction, the N∗ → γN amplitudes in Eq.
(18) can be calculated from the helicity amplitudes Aλ listed in Ref. [5] from
MγN→N∗(k; mi, λγ; J, MJ) =√
2k AMJδM
J,λγ+mi
f(k,k0), (21)
where k0 is the photon momentum at the resonance position, i.e. at√
s = MJR, and the
factor f(k,k0) was introduced to evaluate the amplitude in the region where the photonmomentum is off the resonant momentum k0. To be consistent with the form factor of thetotal decay width (19), we set f(k,k0) = exp[(k2
0 − k2)/Λ2].The N∗ → ωN amplitude takes the following form [28]
MN∗→N ′ω(q; mf , mω; J, MJ) = 2π
√
2MJR
MN |q0|∑
L,mL
S,mS
〈L mL S mS|J mJ〉
×〈1 mω12mf |S mS〉YLm
L(q) G(L, S) (|q|/|q0|)L f(q,q0), (22)
where G(L, S)’s are listed in Refs. [6,28], and q0 is the ω meson momentum at√
s = MJR.
Here we also include the extrapolation factor f(q,q0) = exp[(q20 − q2)/Λ2] like that for the
N∗ → γN vertex in Eq. (21).In this study, we consider 12 positive parity and 10 negative parity nucleon resonances
up to spin-9/2. The resonance masses MJR, the transition amplitudes AM
J, and G(L, S)
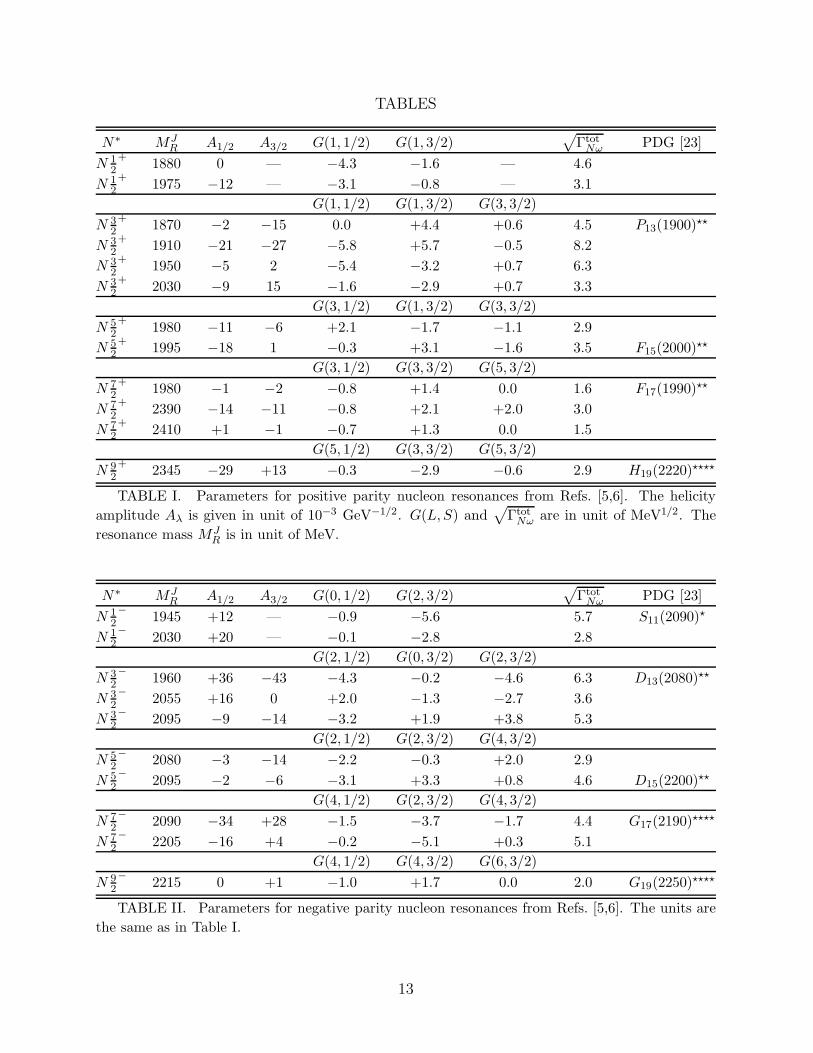
needed to evaluate Eqs. (18)-(22) are taken from Refs. [5,6] and are listed in Tables I andII. Three of them were seen in the πN channel with four-star rating, five of them withtwo-star rating, and one of them with one-star rating. These N∗’s are indicated in the lastcolumn (PDG) of Tables I and II. Clearly the majority of the predicted N∗’s are “missing”so far. Here we should also mention that we are not able to account for the resonances withits predicted masses less than the ωN threshold, since their decay vertex functions with anoff-shell momentum are not available in Refs. [5,6].
6
IV. RESULTS AND DISCUSSIONS
The model defined in Secs. II and III involves some free parameters which must bespecified. The Pomeron exchange model parameters, as given explicitly in Sec. II, are takenfrom a global fit to the total cross sections of ω, ρ, and φ photoproduction at high energiesand will not be adjusted in this study. The Pomeron exchange becomes weak at low energies,as shown by the dot-dashed curves in Fig. 2. We therefore will determine the parameters ofthe other amplitudes mainly by considering the data at low energies.
The pseudoscalar-meson exchange amplitude in Eq. (9) depends on the cutoff parametersΛπ(η) and Λωγπ(η) of Eq. (10). The η exchange is very weak for any choice of its cutoffparameters. For definiteness, we choose Λη = 1.0 GeV and Λωγη = 0.9 GeV as determinedin a study [29] of φ photoproduction. At low energies, the π exchange completely dominatesthe cross sections at forward angles. Its cutoff parameters Λπ and Λωγπ thus can be fixed byfitting the forward cross section data. Our best fit is obtained by setting Λπ = 0.6 GeV andΛωγπ = 0.7 GeV. These values are slightly different from those of Ref. [14]. The resultingcontributions from the pseudoscalar-meson exchange are the dashed curves in Fig. 2.
The resonant amplitude defined by Eqs. (18)-(22) depends on the oscillator parameterΛ and the averaged total width ΓJ
0 . We find that our results are rather insensitive to thecutoff Λ in the range Λ = 0.5 ∼ 1.0 GeV. We take the value Λ = 1 GeV which is the value ofthe standard harmonic oscillator constituent quark model [1]. For the averaged total widthΓJ
0 , we are guided by the widths listed by the Particle Data Group [23]. For the N∗’s whichhave been observed and listed in the last column (PDG) of Tables I and II, their widths areall very large in the range of about 200 ∼ 400 MeV [23,30]. The other N∗’s considered inour calculations are expected to have similar large widths. We therefore choose the averageof the values listed by PDG and set ΓJ
0 = 300 MeV for all N∗’s included in our calculation.The resulting N∗ contributions are the dotted curves in Fig. 2.
With the pseudoscalar-meson exchange and resonant amplitudes fixed by the above pro-cedure, the parameters for the direct and crossed nucleon amplitude [Eqs. (12)-(15)] arethen adjusted to fit the data. Here we consider gωNN = 7 ∼ 11 and κω = 0 as determinedin a study of πN scattering and γN → πN reaction [24]. This range of ωNN coupling con-stant is very close to gωNN = 10.35 determined [31] recently from fitting the nucleon-nucleonscattering data. Thus the only free parameter in the fit is the cutoff parameter ΛN of theform factor in Eq. (15). It turns out that the contributions from the direct and crossednucleon terms are backward peaked, and ΛN can be fairly well determined by total crosssections at backward scattering angles. Our best fits are obtained from setting ΛN = 0.5GeV with gωNN = 10.35 and κω = 0. The corresponding contributions from the direct andcrossed nucleon terms are the dot-dot-dashed curves in Fig. 2.
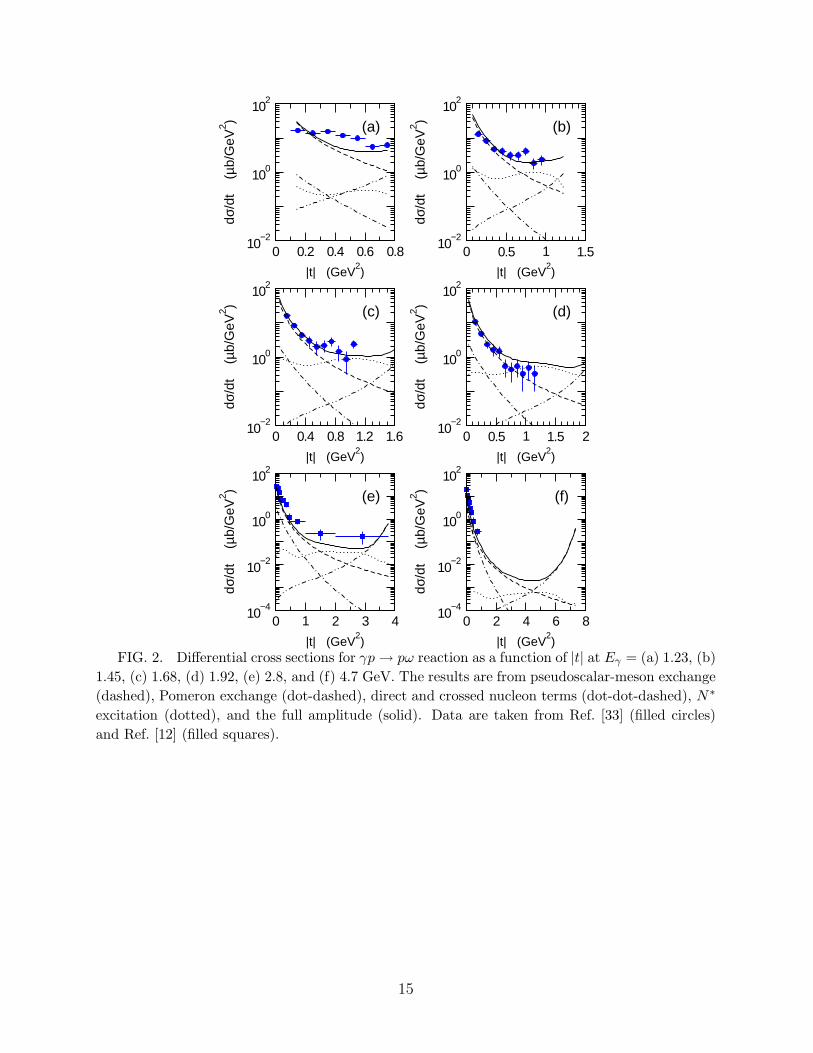
Our full calculations including all amplitudes illustrated in Fig. 1 are the solid curves inFig. 2. The data can be described to a very large extent in the considered energy region Eγ ≤5 GeV. It is clear that the contributions due to the N∗ excitations (dotted curves) and thedirect and crossed nucleon terms (dot-dot-dashed curves) help bring the agreement with thedata at large angles. The forward angle cross sections are mainly due to the interplay betweenthe pseudoscalar-meson exchange (dashed curves) and the Pomeron exchange (dot-dashedcurves). The main problem here is in reproducing the data at Eγ = 1.23 GeV. This perhapsindicates that the off-shell contributions from N∗’s below ωN threshold are important at
7
very low energies. These sub-threshold N∗’s cannot be calculated from the informationsavailable so far within the model of Refs. [5,6] and are neglected in our calculations. Theinvestigation of this possibility is however beyond the scope of this work. The quality of ourfit is comparable to that of Zhao et al. [2].
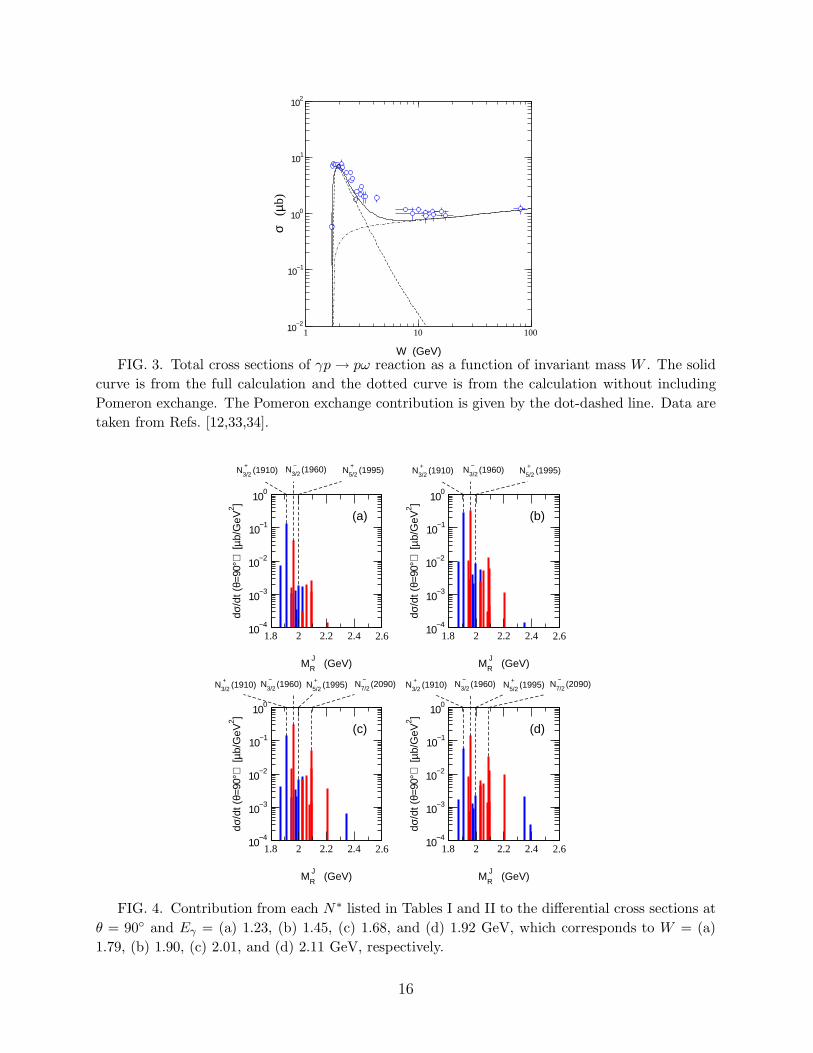
It is important to note here that various cutoff parameters determined above also fix thehigh energy behavior of our predictions. Thus the accuracy of our model must be tested byexamining whether we are able to describe the total cross sections from threshold to veryhigh energies. Our prediction (solid curves) are compared with the available data in Fig. 3.We see that our model indeed can reproduce the data very well except in the region closeto W = 5 GeV where the Pomeron exchange (dot-dashed curve) and the sum of the otheramplitudes (dashed curve) are comparable. It is interesting to note here that if we increasethe Pomeron exchange strength CV of Eq. (6) by about 10%, the total cross section datacan be much better described without too much changes in describing the low energy data.However, the Pomeron exchange parameters are constrained by a global fit to all of data forρ, ω, and φ photoproduction, and therefore such a change is not desirable. Instead, we mustexplore other mechanisms, such as the absorption effects due to the intermediate Nρ stateas discussed in Ref. [10]. Since the N∗ excitations considered here are in the region W ≤ 2.5GeV, we need not to resolve the problem in this transition region near W = 5 GeV.
To have a better understanding of the resonance contributions, we compare in Fig. 4 thecontributions from the considered N∗’s to the differential cross sections at θ = 90◦. Herethe N∗ states listed in Tables I and II can be identified by its mass MJ
R. As also indicated
in Fig. 4, the contributions from N 32
+(1910) and N 3
2
−(1960) are the largest at all energies.
From Tables I and II, we see that the N 32
+(1910) is a missing resonance, while N 3
2
−(1960)
is identified by Capstick [32] as a two star resonance D13(2080) of PDG. In the study ofZhao et al. [2,3], they found that F15(2000) dominates. This resonance is identified with
N 52
+(1995) in Table I and is found to be not so strong in our calculation, as also indicated
in Fig. 4. This significant difference between the two calculations is not surprising sincethe employed quark models are rather different. In particular, our predictions include theconfiguration mixing effects due to residual quark-quark interactions.
In Fig. 4 we also see that the relative importance between different resonances dependon the photon energy. As expected from the resonance part expression (18), the highermass resonances become more important as the photon energy increases from 1.23 GeV(W = 1.79 GeV) to 1.92 GeV (W = 2.11 GeV). For example, we also indicate in Fig. 4 that
the contribution from N 72
−(2090), identified in Table II with G17(2190) of PDG, becomes
comparable to that of N 32
+(1910) at W = 2.11 GeV.
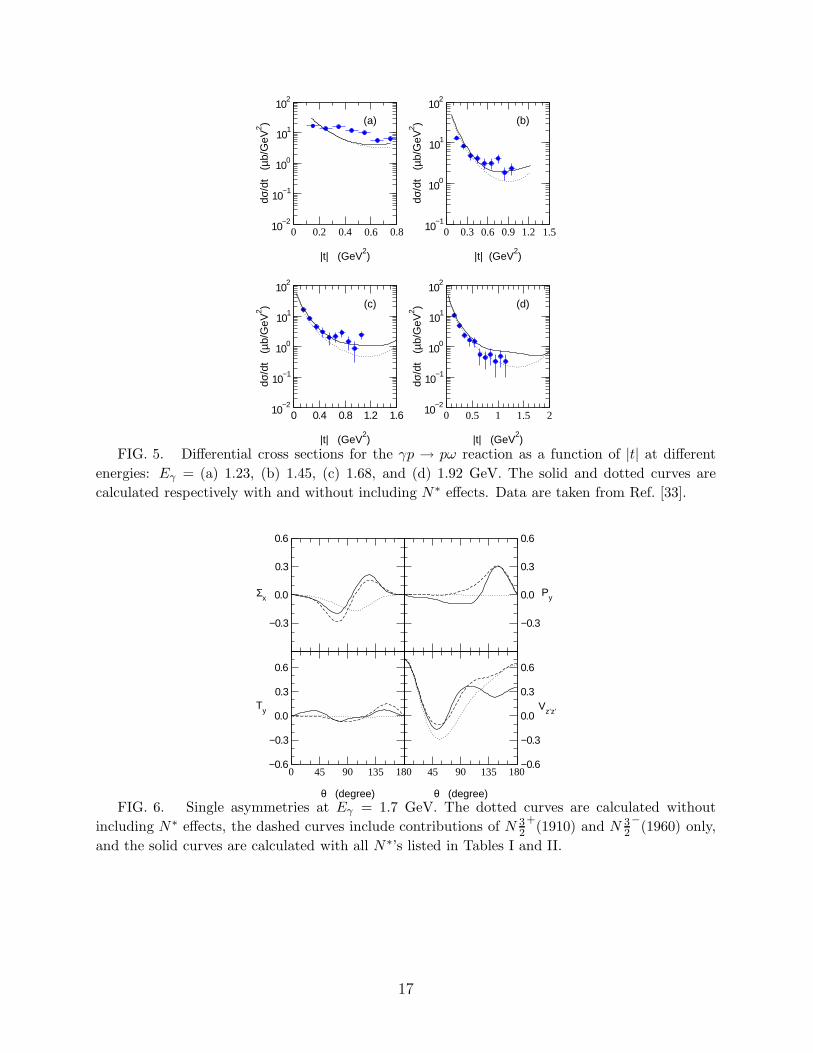
The total resonance effects are shown in Fig. 5. The solid curves are from our full calcu-lations, while the dotted curves are from the calculations without including N∗ excitations.The results shown in Fig. 5 indicate that it is rather difficult to test our predictions byconsidering only the angular distributions, since the N∗’s influence is mainly in the largescattering angle region where accurate measurements are perhaps still difficult. On the otherhand, the forward cross sections seem to be dominated by the well-understood pseudoscalar-meson exchange (less-understood η exchange is negligibly small here) and Pomeron exchange.Therefore, one can use this well-controlled background to examine the N∗ contributions byexploiting the interference effects in the spin observables.
8
We first examine the spin observables discussed in Refs. [2,3]. Our predictions for pho-ton asymmetry (Σx), target asymmetry (Ty), recoil nucleon asymmetry (Py), and tensorpolarization (Vz′z′) are shown in Fig. 6. These single polarization observables are calculatedaccording to the definitions given, e.g., in Refs. [26,35]. We see that the N∗ excitationscan change the predictions from the dotted curves to solid curves. The dashed curves areobtained when only the N 3
2
+(1910) and N 3
2
−(1960) are included in calculating the resonant
part of the amplitude. Our predictions are significantly different from those of Refs. [2,3]. Asmentioned above, this is perhaps mainly due to the differences between the employed quarkmodels. Nevertheless, we confirm their conclusion that the single polarization observablesare sensitive to the N∗ excitations but mostly at large scattering angles. The vector asym-metry Vy has also been investigated, but is not presented here since it is almost impossibleto access experimentally [36].
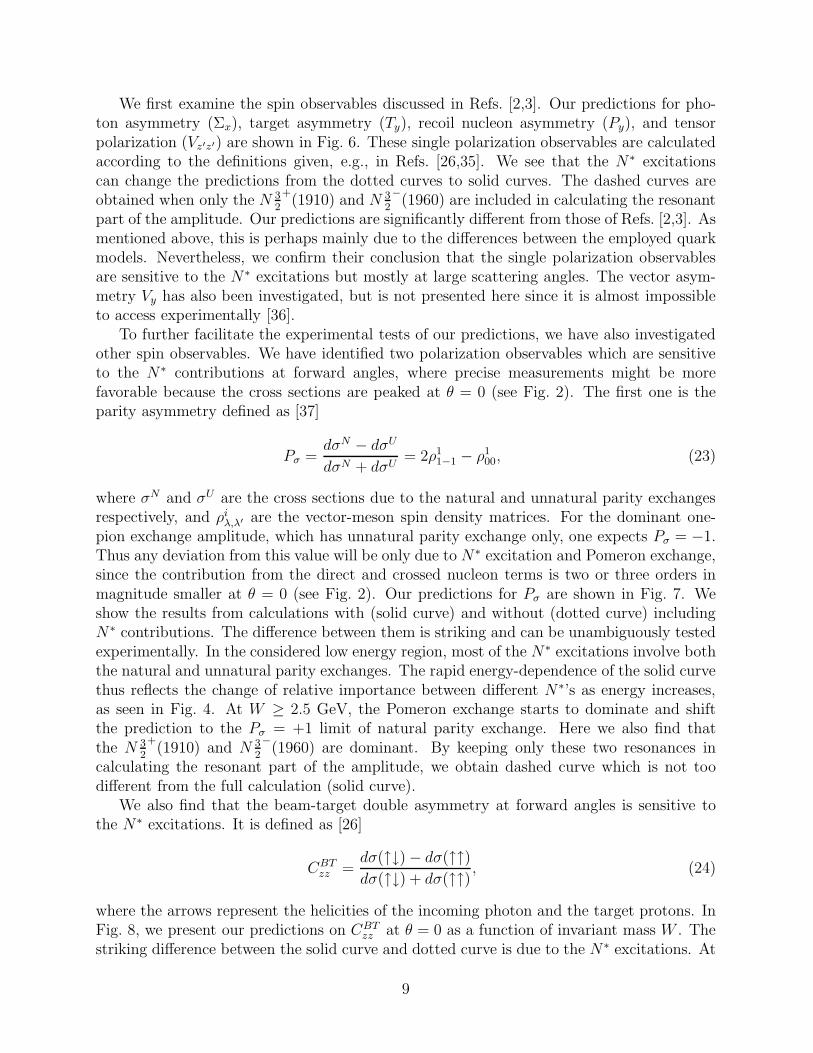
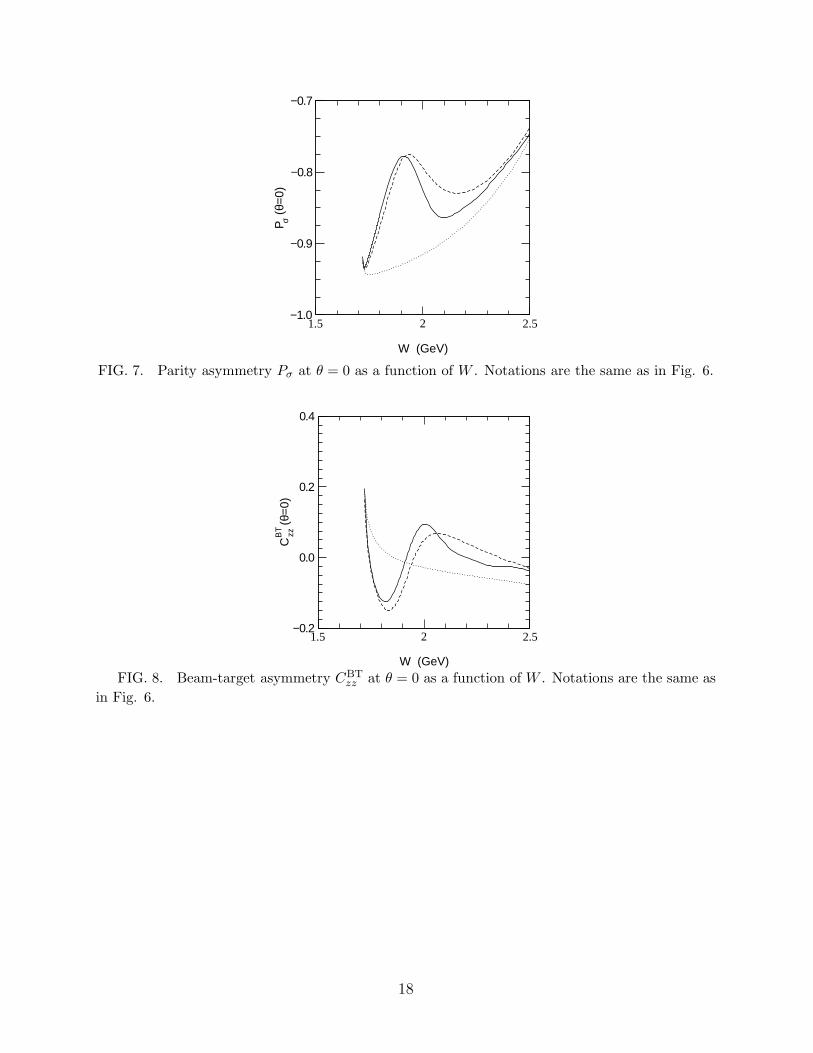
To further facilitate the experimental tests of our predictions, we have also investigatedother spin observables. We have identified two polarization observables which are sensitiveto the N∗ contributions at forward angles, where precise measurements might be morefavorable because the cross sections are peaked at θ = 0 (see Fig. 2). The first one is theparity asymmetry defined as [37]
Pσ =dσN − dσU
dσN + dσU= 2ρ1
1−1 − ρ100, (23)
where σN and σU are the cross sections due to the natural and unnatural parity exchangesrespectively, and ρi
λ,λ′ are the vector-meson spin density matrices. For the dominant one-pion exchange amplitude, which has unnatural parity exchange only, one expects Pσ = −1.Thus any deviation from this value will be only due to N∗ excitation and Pomeron exchange,since the contribution from the direct and crossed nucleon terms is two or three orders inmagnitude smaller at θ = 0 (see Fig. 2). Our predictions for Pσ are shown in Fig. 7. Weshow the results from calculations with (solid curve) and without (dotted curve) includingN∗ contributions. The difference between them is striking and can be unambiguously testedexperimentally. In the considered low energy region, most of the N∗ excitations involve boththe natural and unnatural parity exchanges. The rapid energy-dependence of the solid curvethus reflects the change of relative importance between different N∗’s as energy increases,as seen in Fig. 4. At W ≥ 2.5 GeV, the Pomeron exchange starts to dominate and shiftthe prediction to the Pσ = +1 limit of natural parity exchange. Here we also find thatthe N 3
2
+(1910) and N 3
2
−(1960) are dominant. By keeping only these two resonances in
calculating the resonant part of the amplitude, we obtain dashed curve which is not toodifferent from the full calculation (solid curve).
We also find that the beam-target double asymmetry at forward angles is sensitive tothe N∗ excitations. It is defined as [26]
CBTzz =
dσ(↑↓) − dσ(↑↑)dσ(↑↓) + dσ(↑↑) , (24)
where the arrows represent the helicities of the incoming photon and the target protons. InFig. 8, we present our predictions on CBT
zz at θ = 0 as a function of invariant mass W . Thestriking difference between the solid curve and dotted curve is due to the N∗ excitations. At
9
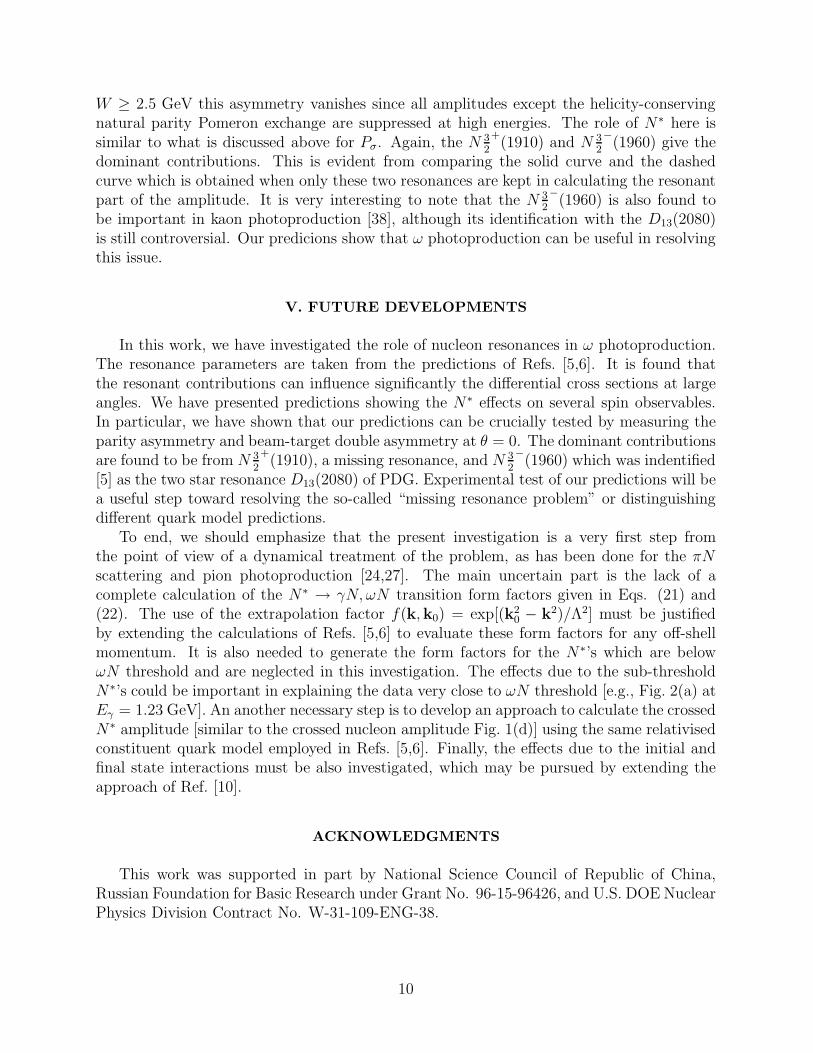
W ≥ 2.5 GeV this asymmetry vanishes since all amplitudes except the helicity-conservingnatural parity Pomeron exchange are suppressed at high energies. The role of N∗ here issimilar to what is discussed above for Pσ. Again, the N 3
2
+(1910) and N 3
2
−(1960) give the
dominant contributions. This is evident from comparing the solid curve and the dashedcurve which is obtained when only these two resonances are kept in calculating the resonantpart of the amplitude. It is very interesting to note that the N 3
2
−(1960) is also found to
be important in kaon photoproduction [38], although its identification with the D13(2080)is still controversial. Our predicions show that ω photoproduction can be useful in resolvingthis issue.
V. FUTURE DEVELOPMENTS
In this work, we have investigated the role of nucleon resonances in ω photoproduction.The resonance parameters are taken from the predictions of Refs. [5,6]. It is found thatthe resonant contributions can influence significantly the differential cross sections at largeangles. We have presented predictions showing the N∗ effects on several spin observables.In particular, we have shown that our predictions can be crucially tested by measuring theparity asymmetry and beam-target double asymmetry at θ = 0. The dominant contributionsare found to be from N 3
2
+(1910), a missing resonance, and N 3
2
−(1960) which was indentified
[5] as the two star resonance D13(2080) of PDG. Experimental test of our predictions will bea useful step toward resolving the so-called “missing resonance problem” or distinguishingdifferent quark model predictions.
To end, we should emphasize that the present investigation is a very first step fromthe point of view of a dynamical treatment of the problem, as has been done for the πNscattering and pion photoproduction [24,27]. The main uncertain part is the lack of acomplete calculation of the N∗ → γN, ωN transition form factors given in Eqs. (21) and(22). The use of the extrapolation factor f(k,k0) = exp[(k2
0 − k2)/Λ2] must be justifiedby extending the calculations of Refs. [5,6] to evaluate these form factors for any off-shellmomentum. It is also needed to generate the form factors for the N∗’s which are belowωN threshold and are neglected in this investigation. The effects due to the sub-thresholdN∗’s could be important in explaining the data very close to ωN threshold [e.g., Fig. 2(a) atEγ = 1.23 GeV]. An another necessary step is to develop an approach to calculate the crossedN∗ amplitude [similar to the crossed nucleon amplitude Fig. 1(d)] using the same relativisedconstituent quark model employed in Refs. [5,6]. Finally, the effects due to the initial andfinal state interactions must be also investigated, which may be pursued by extending theapproach of Ref. [10].
ACKNOWLEDGMENTS
This work was supported in part by National Science Council of Republic of China,Russian Foundation for Basic Research under Grant No. 96-15-96426, and U.S. DOE NuclearPhysics Division Contract No. W-31-109-ENG-38.
10
REFERENCES
[1] N. Isgur and G. Karl, Phys. Lett. 72B, 109 (1977); Phys. Rev. D 18, 4187 (1978); 19,2653 (1979), 23, 817(E) (1981); R. Koniuk and N. Isgur, ibid. 21, 1868 (1980).
[2] Q. Zhao, Z. Li, and C. Bennhold, Phys. Lett. B 436, 42 (1998); Phys. Rev. C 58, 2393(1998).
[3] Q. Zhao, Talk at 8th International Conference on Hadron Spectroscopy, Beijing, China,Aug. 1999, nucl-th/9909060.
[4] Q. Zhao, J.-P. Didelez, M. Guidal, and B. Saghai, Nucl. Phys. A660, 323 (1999).[5] S. Capstick, Phys. Rev. D 46, 2864 (1992).[6] S. Capstick and W. Roberts, Phys. Rev. D 49, 4570 (1994).[7] S. Godfrey and N. Isgur, Phys. Rev. D 32, 189 (1985); S. Capstick and N. Isgur, ibid.
34, 2809 (1986).[8] See, for example, A. Le Yaouanc, L. Oliver, O. Pene, and J. C. Raynal, Hadron Tran-
sitions in the Quark Model (Gordon and Breach, New York, 1988).[9] Aachen-Berlin-Bonn-Hamburg-Heidelberg-Munich Collaboration, R. Erbe et al., Phys.
Rev. 175, 1669 (1968)[10] K. Schilling and F. Storim, Nucl. Phys. B7, 559 (1968).[11] H. Fraas, Nucl. Phys. B36, 191 (1972).[12] J. Ballam et al., Phys. Rev. D 7, 3150 (1973);[13] P. Joos et al., Nucl. Phys. B122, 365 (1977).[14] B. Friman and M. Soyeur, Nucl. Phys. A600, 477 (1996).[15] J. D. Bjorkin and S. D. Drell, Relativistic Quantum Fields (McGraw-Hill, 1964).[16] A. Donnachie and P. V. Landshoff, Nucl. Phys. B244, 322 (1984); B267, 690 (1986);
Phys. Lett. B 185, 403 (1987); 296, 227 (1992).[17] J.-M. Laget and R. Mendez-Galain, Nucl. Phys. A581, 397 (1995).[18] M. A. Pichowsky and T.-S. H. Lee, Phys. Rev. D 56, 1644 (1997).[19] J.-R. Cudell, K. Kang, and S. K. Kim, Phys. Lett. B 395, 311 (1997).[20] L. Tiator, C. Bennhold, and S. S. Kamalov, Nucl. Phys. A580, 455 (1994).[21] J. J. de Swart, Rev. Mod. Phys. 35, 916 (1963).[22] F. E. Close and R. G. Roberts, Phys. Lett. B 316, 165 (1993).[23] Particle Data Group, C. Caso, et al., Eur. Phys. J. C 3, 1 (1998).[24] T. Sato and T.-S. H. Lee, Phys. Rev. C 54, 2660 (1996).[25] H. Haberzettl, C. Bennhold, T. Mart, and T. Feuster, Phys. Rev. C 58, 40 (1998).[26] A. I. Titov, Y. Oh, S. N. Yang, and T. Morii, Phys. Rev. C 58, 2429 (1998).[27] T. Yoshimoto, T. Sato, M. Arima, and T.-S. H. Lee, Phys. Rev. C 61, 065203 (2000).[28] S. Capstick, private communications.[29] A. I. Titov, T.-S. H. Lee, H. Toki, and O. Streltsova, Phys. Rev. C 60, 035205 (1999).[30] D. M. Manley and E. M. Saleski, Phys. Rev. D 45, 4002 (1992).[31] Th. A. Rijken, V. G. J. Stoks, and Y. Yamamoto, Phys. Rev. C 59, 21 (1999).[32] S. Capstick, Phys. Rev. D 46, 1965 (1992).[33] F. J. Klein, Ph.D. thesis, Bonn Univ. (1996); SAPHIR Collaboration, F. J. Klein et al.,
πN Newslett. 14, 141 (1998).[34] J. Ballam et al., Phys. Lett. 30B, 421 (1969); AHHM Collaboration, W. Struczinski et
11
al., Nucl. Phys. B108, 45 (1976); D. P. Barber et al., Z. Phys. C 26, 343 (1984); ZEUSCollaboration, M. Derrick et al., ibid. 73, 73 (1996).
[35] M. Pichowsky, C. Savkli, and F. Tabakin, Phys. Rev. C 53, 593 (1996).[36] W. M. Kloet, W.-T. Chiang, and F. Tabakin, Phys. Rev. C 58, 1086 (1998).[37] K. Schilling, P. Seyboth, and G. Wolf, Nucl. Phys. B15, 397 (1970).[38] T. Mart and C. Bennhold, Phys. Rev. C 61, 012201 (1999).
12
TABLES
N∗ MJR A1/2 A3/2 G(1, 1/2) G(1, 3/2)
√
ΓtotNω PDG [23]
N 12
+1880 0 — −4.3 −1.6 — 4.6
N 12
+1975 −12 — −3.1 −0.8 — 3.1
G(1, 1/2) G(1, 3/2) G(3, 3/2)
N 32
+1870 −2 −15 0.0 +4.4 +0.6 4.5 P13(1900)
⋆⋆
N 32+
1910 −21 −27 −5.8 +5.7 −0.5 8.2
N 32
+1950 −5 2 −5.4 −3.2 +0.7 6.3
N 32+
2030 −9 15 −1.6 −2.9 +0.7 3.3
G(3, 1/2) G(1, 3/2) G(3, 3/2)
N 52
+1980 −11 −6 +2.1 −1.7 −1.1 2.9
N 52+
1995 −18 1 −0.3 +3.1 −1.6 3.5 F15(2000)⋆⋆
G(3, 1/2) G(3, 3/2) G(5, 3/2)
N 72
+1980 −1 −2 −0.8 +1.4 0.0 1.6 F17(1990)
⋆⋆
N 72
+2390 −14 −11 −0.8 +2.1 +2.0 3.0
N 72
+2410 +1 −1 −0.7 +1.3 0.0 1.5
G(5, 1/2) G(3, 3/2) G(5, 3/2)
N 92
+2345 −29 +13 −0.3 −2.9 −0.6 2.9 H19(2220)
⋆⋆⋆⋆
TABLE I. Parameters for positive parity nucleon resonances from Refs. [5,6]. The helicity
amplitude Aλ is given in unit of 10−3 GeV−1/2. G(L,S) and√
ΓtotNω are in unit of MeV1/2. The
resonance mass MJR is in unit of MeV.
N∗ MJR A1/2 A3/2 G(0, 1/2) G(2, 3/2)
√
ΓtotNω PDG [23]
N 12
−1945 +12 — −0.9 −5.6 5.7 S11(2090)
⋆
N 12−
2030 +20 — −0.1 −2.8 2.8
G(2, 1/2) G(0, 3/2) G(2, 3/2)
N 32
−1960 +36 −43 −4.3 −0.2 −4.6 6.3 D13(2080)
⋆⋆
N 32−
2055 +16 0 +2.0 −1.3 −2.7 3.6
N 32
−2095 −9 −14 −3.2 +1.9 +3.8 5.3
G(2, 1/2) G(2, 3/2) G(4, 3/2)
N 52−
2080 −3 −14 −2.2 −0.3 +2.0 2.9
N 52
−2095 −2 −6 −3.1 +3.3 +0.8 4.6 D15(2200)
⋆⋆
G(4, 1/2) G(2, 3/2) G(4, 3/2)
N 72
−2090 −34 +28 −1.5 −3.7 −1.7 4.4 G17(2190)
⋆⋆⋆⋆
N 72
−2205 −16 +4 −0.2 −5.1 +0.3 5.1
G(4, 1/2) G(4, 3/2) G(6, 3/2)
N 92
−2215 0 +1 −1.0 +1.7 0.0 2.0 G19(2250)
⋆⋆⋆⋆
TABLE II. Parameters for negative parity nucleon resonances from Refs. [5,6]. The units are
the same as in Table I.
13
FIGURES
γ (k) V (q)
N (p) N (p’)
PI
(a)
γ V
N N
π,η
(b)
γ V
N NN
(c)
γ V
N NN
(d)
γ V
N NN*
(e)
FIG. 1. Diagrammatic representation of ω photoproduction mechanisms: (a) Pomeron ex-
change, (b) (π, η) exchange, (c) direct nucleon term, (d) crossed nucleon term, and (e) s-channel
nucleon excitations.
14
0 1 2 3 4|t| (GeV
2)
10−4
10−2
100
102
dσ/d
t (
µb/G
eV2 )
0 0.4 0.8 1.2 1.6|t| (GeV
2)
10−2
100
102
dσ/d
t (
µb/G
eV2 )
0 0.2 0.4 0.6 0.8|t| (GeV
2)
10−2
100
102
dσ/d
t (
µb/G
eV2 )
0 2 4 6 8|t| (GeV
2)
10−4
10−2
100
102
dσ/d
t (
µb/G
eV2 )
0 0.5 1 1.5 2|t| (GeV
2)
10−2
100
102
dσ/d
t (
µb/G
eV2 )
0 0.5 1 1.5|t| (GeV
2)
10−2
100
102
dσ/d
t (
µb/G
eV2 )(a)
(c)
(e)
(b)
(d)
(f)
FIG. 2. Differential cross sections for γp → pω reaction as a function of |t| at Eγ = (a) 1.23, (b)
1.45, (c) 1.68, (d) 1.92, (e) 2.8, and (f) 4.7 GeV. The results are from pseudoscalar-meson exchange
(dashed), Pomeron exchange (dot-dashed), direct and crossed nucleon terms (dot-dot-dashed), N∗
excitation (dotted), and the full amplitude (solid). Data are taken from Ref. [33] (filled circles)
and Ref. [12] (filled squares).
15
1 10 100
W (GeV)
10−2
10−1
100
101
102
σ (
µb)
FIG. 3. Total cross sections of γp → pω reaction as a function of invariant mass W . The solid
curve is from the full calculation and the dotted curve is from the calculation without including
Pomeron exchange. The Pomeron exchange contribution is given by the dot-dashed line. Data are
taken from Refs. [12,33,34].
1.8 2 2.2 2.4 2.6
MRJ (GeV)
10−4
10−3
10−2
10−1
100
dσ/d
t (θ=
90°)
[µb
/GeV
2 ]
1.8 2 2.2 2.4 2.6
MRJ (GeV)
10−4
10−3
10−2
10−1
100
dσ/d
t (θ=
90°)
[µb
/GeV
2 ]
N3/2+ (1910) N3/2
− (1960) N5/2
+ (1995)
1.8 2 2.2 2.4 2.6
MRJ (GeV)
10−4
10−3
10−2
10−1
100
dσ/d
t (θ=
90°)
[µb
/GeV
2 ]
1.8 2 2.2 2.4 2.6
MRJ (GeV)
10−4
10−3
10−2
10−1
100
dσ/d
t (θ=
90°)
[µb
/GeV
2 ]
(a) (b)
(c) (d)
N3/2+ (1910) N3/2
− (1960) N5/2
+ (1995)
N3/2+ (1910) N3/2
− (1960) N5/2
+ (1995) N7/2
− (2090) N3/2
+ (1910) N3/2
− (1960) N5/2
+ (1995) N7/2
− (2090)
FIG. 4. Contribution from each N∗ listed in Tables I and II to the differential cross sections at
θ = 90◦ and Eγ = (a) 1.23, (b) 1.45, (c) 1.68, and (d) 1.92 GeV, which corresponds to W = (a)
1.79, (b) 1.90, (c) 2.01, and (d) 2.11 GeV, respectively.
16
0 0.4 0.8 1.2 1.6
|t| (GeV2)
10−2
10−1
100
101
102
dσ/d
t (
µb/G
eV2 )
0 0.2 0.4 0.6 0.8
|t| (GeV2)
10−2
10−1
100
101
102
dσ/d
t (
µb/G
eV2 )
0 0.5 1 1.5 2
|t| (GeV2)
10−2
10−1
100
101
102
dσ/d
t (
µb/G
eV2 )
0 0.3 0.6 0.9 1.2 1.5
|t| (GeV2)
10−1
100
101
102
dσ/d
t (
µb/G
eV2 )(a) (b)
(c) (d)
FIG. 5. Differential cross sections for the γp → pω reaction as a function of |t| at different
energies: Eγ = (a) 1.23, (b) 1.45, (c) 1.68, and (d) 1.92 GeV. The solid and dotted curves are
calculated respectively with and without including N∗ effects. Data are taken from Ref. [33].
0 45 90 135 180
θ (degree)
−0.6
−0.3
0.0
0.3
0.6
Ty
−0.3
0.0
0.3
0.6
Σx
45 90 135 180
θ (degree)
−0.6
−0.3
0.0
0.3
0.6
Vz’z’
−0.3
0.0
0.3
0.6
Py
FIG. 6. Single asymmetries at Eγ = 1.7 GeV. The dotted curves are calculated without
including N∗ effects, the dashed curves include contributions of N 32
+(1910) and N 3
2
−(1960) only,
and the solid curves are calculated with all N∗’s listed in Tables I and II.
17
1.5 2 2.5
W (GeV)
−1.0
−0.9
−0.8
−0.7
P σ (θ=
0)
FIG. 7. Parity asymmetry Pσ at θ = 0 as a function of W . Notations are the same as in Fig. 6.
1.5 2 2.5
W (GeV)
−0.2
0.0
0.2
0.4
CB
T zz (
θ=0)
FIG. 8. Beam-target asymmetry CBTzz at θ = 0 as a function of W . Notations are the same as
in Fig. 6.
18