northern indiana public service company llc 2021 ... - in.gov
TRANSCRIPT
Northern Indiana Public Service Company LLC
Northern Indiana Public Service Company LLC
2021 Integrated Resource Plan
November 15, 2021
2021 INTEGRATEDRESOURCE PLAN
SUMMARY
NIPSCO
NIPSCO.com

479,000 NORTHERN INDIANA HOMES AND BUSINESSES IN
20 COUNTIES DEPEND ON NIPSCOEACH DAY FOR SAFE, RELIABLE
AND AFFORDABLE ENERGY
2

BACKGROUNDThree years after announcing our electric generation transition plan, branded “Your Energy, Your Future,” NIPSCO is proud to serve Northern Indiana families and businesses with safe and reliable energy every day. Our company’s customer-centric “Your Energy, Your Future” initiative includes the electric generation transition plan at NIPSCO, and is our balanced approach to deliver lower-cost, sustainable and reliable energy for future generations. NIPSCO presents this plan to the Indiana Utility Regulatory Commission (IURC) every three years.
Since NIPSCO introduced our plan in 2018, we debuted two operating wind farms and have begun transitioning our employees to new roles after the retirement of two coal-fired units at R.M. Schahfer Generating Station in Wheatfield, Indiana. We look forward to soon adding 12 more renewable projects that are currently in development and projected to be operational by the end of 2023.
As we evolve alongside our communities and the changing energy landscape, we use a forward-looking analysis framework to create an Integrated Resource Plan (IRP), which establishes a road map for near-term electric portfolio decisions and our long-term vision. Our process involves a comprehensive analysis of our future energy mix, informed by valuable input from numerous stakeholders including customers, regulators, and local community leaders.
NIPSCO’s industry-leading plan creates a vision for the future that keeps our customers’ best interests at the forefront. It is consistent with our goal to transition to the best cost and cleaner electric supply mix while maintaining reliability, diversity and flexibility for the technology and market changes on the horizon.
______________________________________________
YOUR ENERGYYOUR FUTURE
3

ABOUT THE 2021INTEGRATED RESOURCE PLANOur IRP charts a path to best meet the energy needs of our customers for the next 20 years, and it is updated every three years. The 2021 plan reflects the dynamic changes taking place in the electric industry, the changing needs and behaviors of our customers, and the subsequent evolving policy and market rules.
Our 2021 IRP captures this evolving environment and creates a highly flexible plan that achieves the following:
• Refines the window to retire all remaining coal-fired generation to between 2026 and 2028, with our largest plant retired by 2023
• Retires aging gas peaker units between 2025 and 2028
• Replaces retired generation resources with a diverse, flexible, and scalable mix of incremental resources, including short-term contracted capacity resources, expanded demand side management programs, solar, large battery energy storage, and new gas peaking resources
• Explores potential hydrogen generation pilots and emerging energy storage technologies on the path toward further decarbonization of the generation portfolio
• Continues on the trajectory of reducing carbon emissions* from generation by 90% (from a 2005 baseline) by 2030 identified in the 2018 IRP and illuminates the pathway for further emissions reductions
* NIPSCO may sell in the future and has previously sold the Renewable Energy Credits from renewable generation to a third party.
4
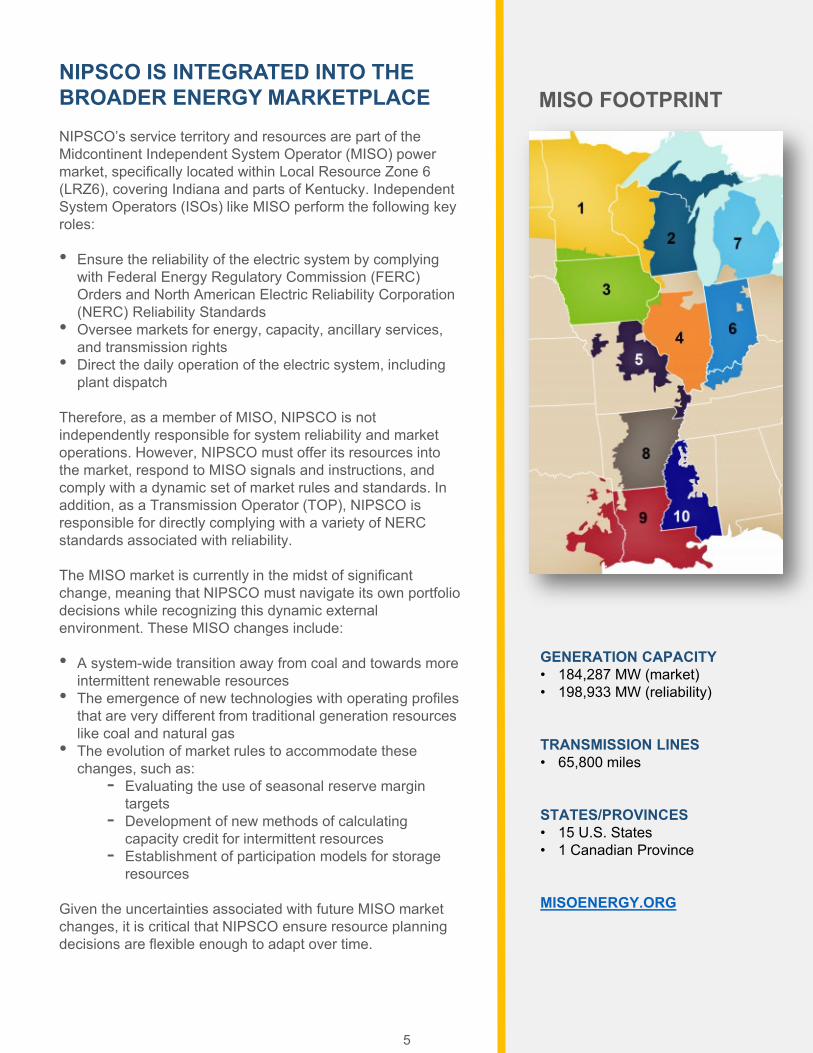
NIPSCO IS INTEGRATED INTO THE BROADER ENERGY MARKETPLACENIPSCO’s service territory and resources are part of the Midcontinent Independent System Operator (MISO) power market, specifically located within Local Resource Zone 6 (LRZ6), covering Indiana and parts of Kentucky. Independent System Operators (ISOs) like MISO perform the following key roles:
• Ensure the reliability of the electric system by complying with Federal Energy Regulatory Commission (FERC) Orders and North American Electric Reliability Corporation (NERC) Reliability Standards
• Oversee markets for energy, capacity, ancillary services, and transmission rights
• Direct the daily operation of the electric system, including plant dispatch
Therefore, as a member of MISO, NIPSCO is not independently responsible for system reliability and market operations. However, NIPSCO must offer its resources into the market, respond to MISO signals and instructions, and comply with a dynamic set of market rules and standards. In addition, as a Transmission Operator (TOP), NIPSCO is responsible for directly complying with a variety of NERC standards associated with reliability.
The MISO market is currently in the midst of significant change, meaning that NIPSCO must navigate its own portfolio decisions while recognizing this dynamic external environment. These MISO changes include:
• A system-wide transition away from coal and towards more intermittent renewable resources
• The emergence of new technologies with operating profiles that are very different from traditional generation resources like coal and natural gas
• The evolution of market rules to accommodate these changes, such as:
- Evaluating the use of seasonal reserve margin targets
- Development of new methods of calculating capacity credit for intermittent resources
- Establishment of participation models for storage resources
Given the uncertainties associated with future MISO market changes, it is critical that NIPSCO ensure resource planning decisions are flexible enough to adapt over time.
5
MISO FOOTPRINT
GENERATION CAPACITY• 184,287 MW (market)• 198,933 MW (reliability)
TRANSMISSION LINES• 65,800 miles
STATES/PROVINCES• 15 U.S. States• 1 Canadian Province
MISOENERGY.ORG
NIPSCO’s 2021 INTEGRATED RESOURCE PLAN APPROACHResource planning is a complex undertaking, one that must address the inherent uncertainties and risks that exist in the evolving electric industry landscape. In the 2021 IRP, several key planning themes shaped the way NIPSCO approached the development of its preferred plan and the supporting analysis. These included a focus on:
• Long-Term Planning With Intermittent Resources, particularly associated with understanding the system reliability implications of a portfolio that will have significant intermittent resources
• Carbon Emissions and Environmental Policy Trends, including assessment of diverse portfolio options in the context of increased policy conversations that push for 100% decarbonization of the power sector by the middle of the next decade
• Flexibility & Adaptability of the Portfolio to meet evolving MISO rules and state and federal energy and environmental policy changes
Using in-depth data, modeling and risk-based analysis provided by internal and external subject matter experts, NIPSCO’s IRP projects future energy and capacity needs and evaluates available options to meet those needs.
The 2021 IRP also introduced an enhanced evaluation of the reliability of NIPSCO’s portfolio to better understand the implications of a resource mix with significant intermittent resources, particularly in light of the MISO market evolution and NIPSCO’s operational responsibilities. NIPSCO’s expanded analysis incorporated both economic and non-economic assessments of reliability.
NIPSCO’s 2021 IRP is based on the best available information at the time this IRP is filed. Changes that affect our plan may arise, which is why it’s important for us to remain flexible and adaptable as we continually evaluate current market conditions, the evolution of technology—particularly energy storage and hydrogen-based technology —and demand side resources, as well as changing laws and environmental regulations.
6

ENGAGING CUSTOMER AND PUBLIC STAKEHOLDERSIndiana’s energy future is everyone’s concern. That’s why any discussion of resource planning for the future must bring all stakeholders into the conversation. We engaged stakeholder groups and individuals in a variety of ways throughout the entirety of the planning process.
NIPSCO initiated stakeholder advisory outreach for its 2021 IRP in March when we hosted a virtual public meeting and launched a web page for interested stakeholders to follow the progress. Given the ongoing COVID-19 pandemic, public stakeholder meetings and stakeholder interactions were entirely virtual during this planning cycle. Four additional virtual public meetings followed in May, July, September and October. NIPSCO also hosted a virtual technical webinar to discuss the reliability assessments. Each of these public stakeholder meetings had over 100 registered participants and garnered a high level of stakeholder participation. Members of our executive leadership team and several of our subject matter experts attended each meeting to hear feedback and answer questions.
Throughout the IRP process, stakeholders were also invited to meet with us on a one-on-one basis to discuss key concerns and perspectives. NIPSCO met with several stakeholders in virtual one-on-one settings and exchanged written correspondence with several others. Each interaction provided a forum for discussion and feedback related to the many components of the IRP. Valuable discussions arose in several key areas, including load forecasting calculations, energy efficiency program analysis, generation portfolio modeling techniques, and reliability assessment considerations.
Stakeholder feedback gained throughout the process was used to inform and improve the final plan. A summary of the meeting materials, including presentations and stakeholder questions, is available at NIPSCO.com/IRP.
7
5VIRTUAL PUBLIC
MEETINGS
1TECHNICAL WEBINAR
MORE THAN100
REGISTERED PARTICIPANTS
PROCESS ENABLESSTAKEHOLDER
SUPPORTED PLAN

FORECASTING FUTURE CUSTOMER DEMANDProjecting customers’ energy needs is a key component of the IRP process, and several enhancements to the development of the demand forecast were implemented in the 2021 IRP. For the first time, the IRP demand forecast incorporates an Industrial Service Structure tariff, known as Rate 831, and its subsequent impact on large industrial customer load. Approved in 2019, this new industrial service structure tariff gives certain large industrial customers the option to procure most of their energy and capacity needs on their own.
Leveraging NIPSCO’s load forecasting tools, we developed monthly net energy and peak load projections to evaluate seasonal energy peak periods throughout the plan horizon. This was done through an econometric analysis of customer count, energy usage per customer, and customer class-level load factor data, along with detailed analysis of the impact of changes in customer behavior on load requirements.
New to 2021, NIPSCO forecasted the impact of customer owned distributed energy resources (DER) and Electric Vehicles (EV) on load across a range of adoption scenarios. NIPSCO’s final forecasts combined the baseline econometric load projections with the DER and EV analysis across planning scenarios to capture a range of future load growth outcomes.
LOAD FORECAST HIGHLIGHTS
8
PEAK LOAD
NIPSCO’s 2021 IRP load forecast expects near-term summer peaks to be around 2,300 MW and winter peaks to be around 1,600 MW
Peak load expectations are over 600 MW lower than those from the 2018 IRP due to a new industrial service tariff, although interruptible demand response supply resources from industrial customers are also down.
EVs
The load forecast includes a range of electric vehicle penetration scenarios, representing between approximately 10 to 80 MW of peak load impact and up to 8% of total sales over the long-term
DERs
The load forecast scenarios suggest that customer-owned distributed energy resources have the potential to reduce summer peak loads between 40 to 160 MW over the long-term.
NEW GENERATION FACILITIES
PROJECTINSTALLEDCAPACITY
(MW)COUNTY IN SERVICE
ROSEWATER WIND 102MW WHITE COMPLETE
JORDAN CREEK WIND* 400MW BENTON
WARREN COMPLETE
INDIANA CROSSROADS
WIND300MW WHITE 2021
DUNNS BRIDGE SOLAR I 265MW JASPER 2022
BRICKYARD SOLAR* 200MW BOONE 2022
GREENSBORO SOLAR*
100MW+30MW
BATTERYHENRY 2022
INDIANA CROSSROADS
SOLAR200 MW WHITE 2022
GREEN RIVER SOLAR* 200MW
BRECKINRIDGE & MEADE
(KENTUCKY)2023
DUNNS BRIDGE SOLAR II
435MW+75MW
BATTERYJASPER 2023
CAVALRY SOLAR
200MW+60MW
BATTERYWHITE 2023
GIBSONSOLAR* 280MW GIBSON 2023
FAIRBANKSSOLAR 250MW SULLIVAN 2023
INDIANACROSSROADS II
WIND*204 MW WHITE 2023
ELLIOT SOLAR 200 MW GIBSON 2023
9
CURRENT FACILITIES
GENERATION FACILITIES
INSTALLED CAPACITY
(MW)FUEL COUNTY
MICHIGANCITY
RETIRING 2026-2028
469MW COAL LAPORTE
R.M.SCHAHFERRETIRING 2021/2023
1,780MW COAL JASPER
R.M. SCHAHFERRETIRING 2025-2028
155MW NATURAL GAS JASPER
SUGAR CREEK 535MW NATURAL
GAS VIGO
NORWAY HYDRO 7.2MW WATER WHITE
OAKDALE HYDRO 9.2MW WATER CARROLL
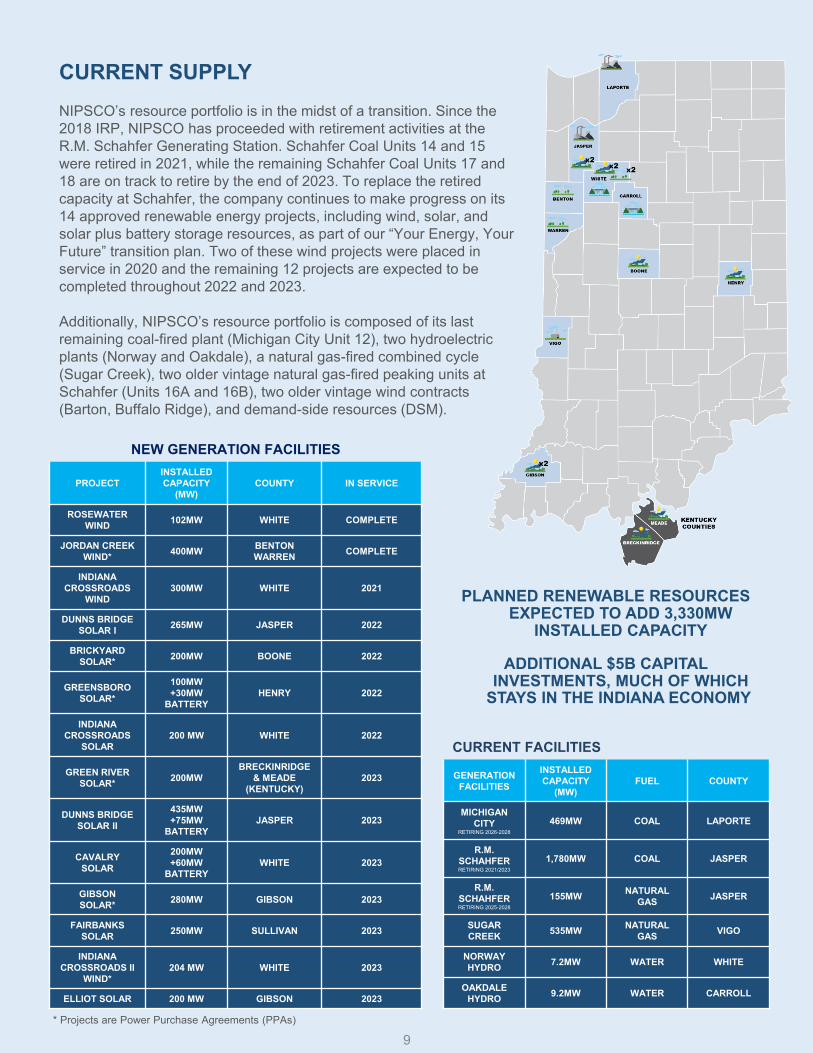
CURRENT SUPPLYNIPSCO’s resource portfolio is in the midst of a transition. Since the 2018 IRP, NIPSCO has proceeded with retirement activities at the R.M. Schahfer Generating Station. Schahfer Coal Units 14 and 15 were retired in 2021, while the remaining Schahfer Coal Units 17 and 18 are on track to retire by the end of 2023. To replace the retired capacity at Schahfer, the company continues to make progress on its 14 approved renewable energy projects, including wind, solar, and solar plus battery storage resources, as part of our “Your Energy, Your Future” transition plan. Two of these wind projects were placed in service in 2020 and the remaining 12 projects are expected to be completed throughout 2022 and 2023.
Additionally, NIPSCO’s resource portfolio is composed of its last remaining coal-fired plant (Michigan City Unit 12), two hydroelectric plants (Norway and Oakdale), a natural gas-fired combined cycle (Sugar Creek), two older vintage natural gas-fired peaking units at Schahfer (Units 16A and 16B), two older vintage wind contracts (Barton, Buffalo Ridge), and demand-side resources (DSM).
PLANNED RENEWABLE RESOURCES EXPECTED TO ADD 3,330MW
INSTALLED CAPACITY
ADDITIONAL $5B CAPITAL INVESTMENTS, MUCH OF WHICH
STAYS IN THE INDIANA ECONOMY
* Projects are Power Purchase Agreements (PPAs)
10
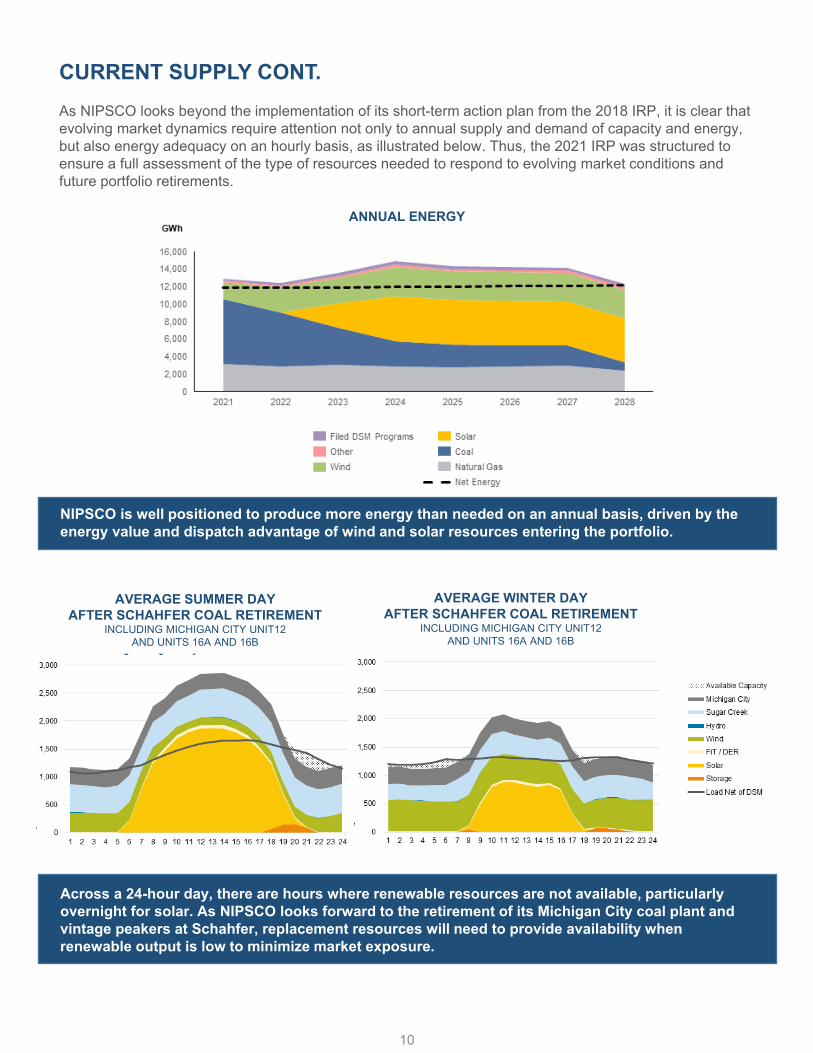
CURRENT SUPPLY CONT.As NIPSCO looks beyond the implementation of its short-term action plan from the 2018 IRP, it is clear that evolving market dynamics require attention not only to annual supply and demand of capacity and energy, but also energy adequacy on an hourly basis, as illustrated below. Thus, the 2021 IRP was structured to ensure a full assessment of the type of resources needed to respond to evolving market conditions and future portfolio retirements.
NIPSCO is well positioned to produce more energy than needed on an annual basis, driven by the energy value and dispatch advantage of wind and solar resources entering the portfolio.
Across a 24-hour day, there are hours where renewable resources are not available, particularly overnight for solar. As NIPSCO looks forward to the retirement of its Michigan City coal plant and vintage peakers at Schahfer, replacement resources will need to provide availability when renewable output is low to minimize market exposure.
ANNUAL ENERGY
AVERAGE SUMMER DAYAFTER SCHAHFER COAL RETIREMENT
INCLUDING MICHIGAN CITY UNIT12 AND UNITS 16A AND 16B
AVERAGE WINTER DAYAFTER SCHAHFER COAL RETIREMENT
INCLUDING MICHIGAN CITY UNIT12 AND UNITS 16A AND 16B
ANALYZING FUTURE SUPPLY OPTIONS – RFPNIPSCO conducted three separate Requests for Proposals (RFP) events covering all-sources to help inform the 2021 IRP planning process and to gain information on available, actionable projects with real costs from the marketplace. All energy technology companies were eligible to participate, and for the 2021 RFP, NIPSCO received 182 proposals— representing 78 individual projects with more than 15 gigawatts (GW) of installed capacity (ICAP). In concert with the core IRP analysis, RFP screening criteria included energy source availability, technical feasibility, commercial availability, economic attractiveness and environmental compatibility.
DEMAND SIDE MANAGEMENT AND ENERGY EFFICIENCYDSM programs and energy efficiency measures have been an integral part of the NIPSCO supply mix. Promoting energy efficiency is not only good for customers, but it can play an important role in helping ensure that we can meet future energy needs. Consequently, the assessment of DSM and energy efficiency programs is a core component of the IRP process. NIPSCO offers a variety of programs to help residential and business customers save energy. The programs are tailored to customers and designed to help ensure energy savings.
Since 2010, NIPSCO customers have saved more than 1.3 million megawatt hours of electricity by participating in the range of energy efficiency programs offered by NIPSCO. Technologies continue to change, and it’s important that we constantly evaluate our offerings. We regularly track and report on program performance, which helps to inform and improve future program filings and customer offerings. The 2021 IRP included a robust assessment of future DSM programs through a Market Potential Study and rigorous portfolio analysis of the various options.
ENHANCED RELIABILITY ASSESSMENTThe ongoing energy transition is requiring the considerations of system reliability impacts within the resource planning process as new resources like solar, wind and storage have different operational characteristics from traditional thermal resources like coal and natural gas. NIPSCO has incorporated several expanded elements and enhancements to the core IRP economic analysis to capture resource planning and power markets operating with more intermittent resources. NIPSCO engaged a third-party expert to perform a reliability assessment to better understand the ability of potential replacement resources to support the continued reliable operation of the system. The assessment involved series of system analyses to quantify the performance of potential replacement resources against an independently developed set of reliability criteria and measures. The results of the assessment were incorporated into the analysis to inform portfolio evaluation and the Preferred Plan.
11
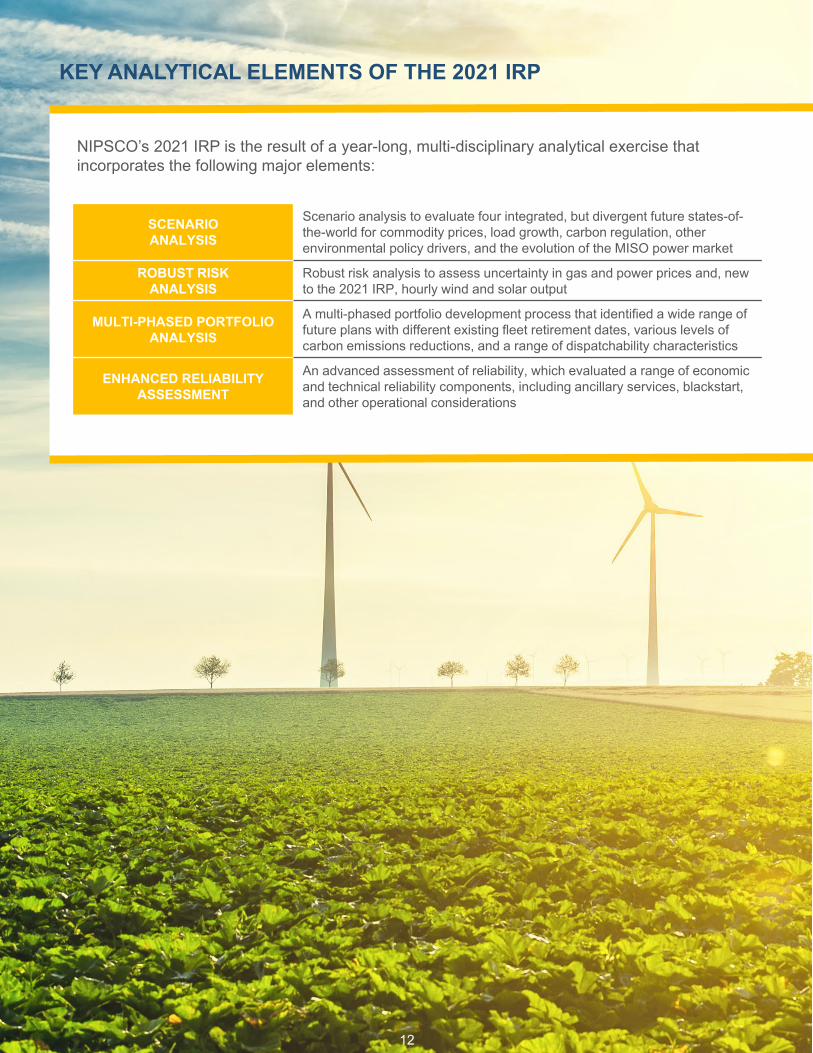
KEY ANALYTICAL ELEMENTS OF THE 2021 IRP
12
SCENARIOANALYSIS
Scenario analysis to evaluate four integrated, but divergent future states-of-the-world for commodity prices, load growth, carbon regulation, other environmental policy drivers, and the evolution of the MISO power market
ROBUST RISKANALYSIS
Robust risk analysis to assess uncertainty in gas and power prices and, new to the 2021 IRP, hourly wind and solar output
MULTI-PHASED PORTFOLIO ANALYSIS
A multi-phased portfolio development process that identified a wide range of future plans with different existing fleet retirement dates, various levels of carbon emissions reductions, and a range of dispatchability characteristics
ENHANCED RELIABILITY ASSESSMENT
An advanced assessment of reliability, which evaluated a range of economic and technical reliability components, including ancillary services, blackstart, and other operational considerations
NIPSCO’s 2021 IRP is the result of a year-long, multi-disciplinary analytical exercise that incorporates the following major elements:

PREFERRED PORTFOLIO AND NEXT STEPSConsistent with previous analyses, NIPSCO’s 2021 IRP has determined that early retirement of coal is still cost-effective for customers. Accordingly, NIPSCO has refined the retirement timing of Michigan City Generating Station Unit 12 to occur between 2026 and 2028. The precise timing of the retirement will be influenced by system reliability impacts, federal/state regulatory policy direction, MISO market rules evolution and securing the replacement resources.
NIPSCO operates two vintage gas peaking units – Units 16A and 16B – at the Schahfer Generating Station. Given the operational condition and age of the units, the analysis pointed to retiring 16A and 16B between 2025 and 2028.
The flexibility in the retirement timing of the peaking units along with Michigan City 12 allows NIPSCO to optimize the decision. NIPSCO will pursue cost-effective resources that cover the capacity needs for both facilities, although the units do not have to retire at the same time.
To replace the retiring resources, NIPSCO has identified a preferred pathway that balances all of NIPSCO’s major planning objectives, while preserving flexibility in an environment of market, technology, and policy uncertainty. In the near-term, replacement options include a diverse, flexible, and scalable mix of incremental resources, including DSM resources, distributed energy resources, solar, stand-alone energy storage, and upgrades to existing facilities at the Sugar Creek Generating Station. The plan also calls for a natural gas peaking unit to replace existing vintage gas peaking units at Schahfer and support system reliability and resiliency, as well as upgrades to the transmission system to enhance the electric generation transition.
Over the longer term, additional solar and wind capacity may be added if environmental policy makes it more economic than competing resources, and additional storage capacity may be added as further technology, policy, and reliability diligence is performed. New peaking capacity may be hydrogen-enabled as options are explored further. Hydrogen pilot projects and long-term hydrogen conversion pathways may be explored for Sugar Creek as policy and technology evolves.
13
NIPSCO'S 2021 IRP AFFIRMS THE COMPANY'S CUSTOMER-CENTRIC "YOUR ENERGY, YOU FUTURE" ELECTRIC
GENERATION TRANSITION TO LOWER-COST AND RELIABLE ENERGY FOR OUR CUSTOMERS IN THE YEARS TO COME.
PREFERRED PORTFOLIO AND NEXT STEPS CONT.This pathway does not alter the company’s previously stated goal of a 90% reduction in carbon emissions (from a 2005 baseline) by 2030.
NIPSCO’s 2021 IRP outlines refinements to the timeline of our future generation plans, and it enables flexibility to adapt to evolving technologies, policies and market rules while providing additional time for research and further refinement to our long-term energy strategy – NIPSCO will continue to update its future energy strategy in the next IRP. This 2021 IRP affirms the company’s customer-centric “Your Energy, Your Future” electric generation transition to lower-cost and reliable energy for our customers in the years to come. Learn more about the “Your Energy, Your Future” plans at NIPSCO.com/future. More information about NIPSCO’s electric supply strategies and the IRP process can be found at NIPSCO.com/IRP.
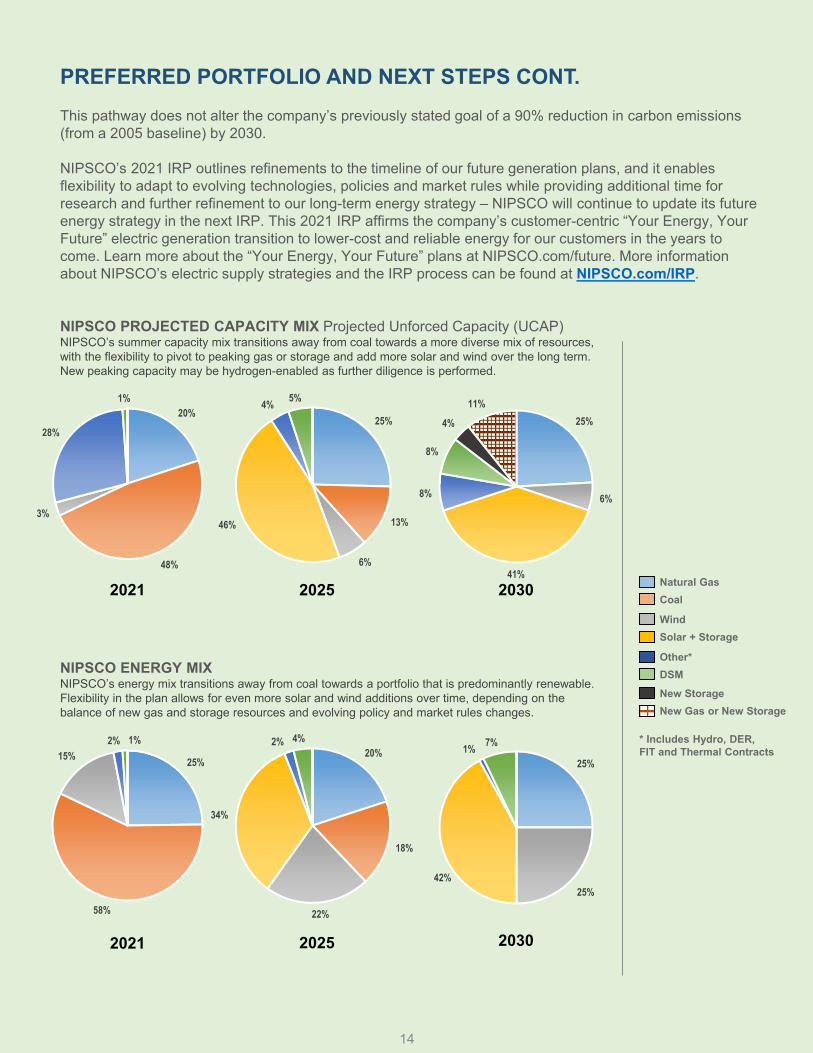
NIPSCO PROJECTED CAPACITY MIX Projected Unforced Capacity (UCAP)NIPSCO’s summer capacity mix transitions away from coal towards a more diverse mix of resources,with the flexibility to pivot to peaking gas or storage and add more solar and wind over the long term.New peaking capacity may be hydrogen-enabled as further diligence is performed.
NIPSCO ENERGY MIXNIPSCO’s energy mix transitions away from coal towards a portfolio that is predominantly renewable.Flexibility in the plan allows for even more solar and wind additions over time, depending on thebalance of new gas and storage resources and evolving policy and market rules changes.
14
Wind
Natural Gas
Other*
Coal
Solar + Storage
DSMNew StorageNew Gas or New Storage
2021 2025 2030
25%
6%
41%
8%
8%
4%
11%20%
48%
3%
28%
1%
25%
13%
6%
46%
4% 5%
25%
25%42%
1% 7%
25%
58%
15%2% 1%
20%
18%
22%
34%
2% 4%
203020252021
* Includes Hydro, DER,FIT and Thermal Contracts
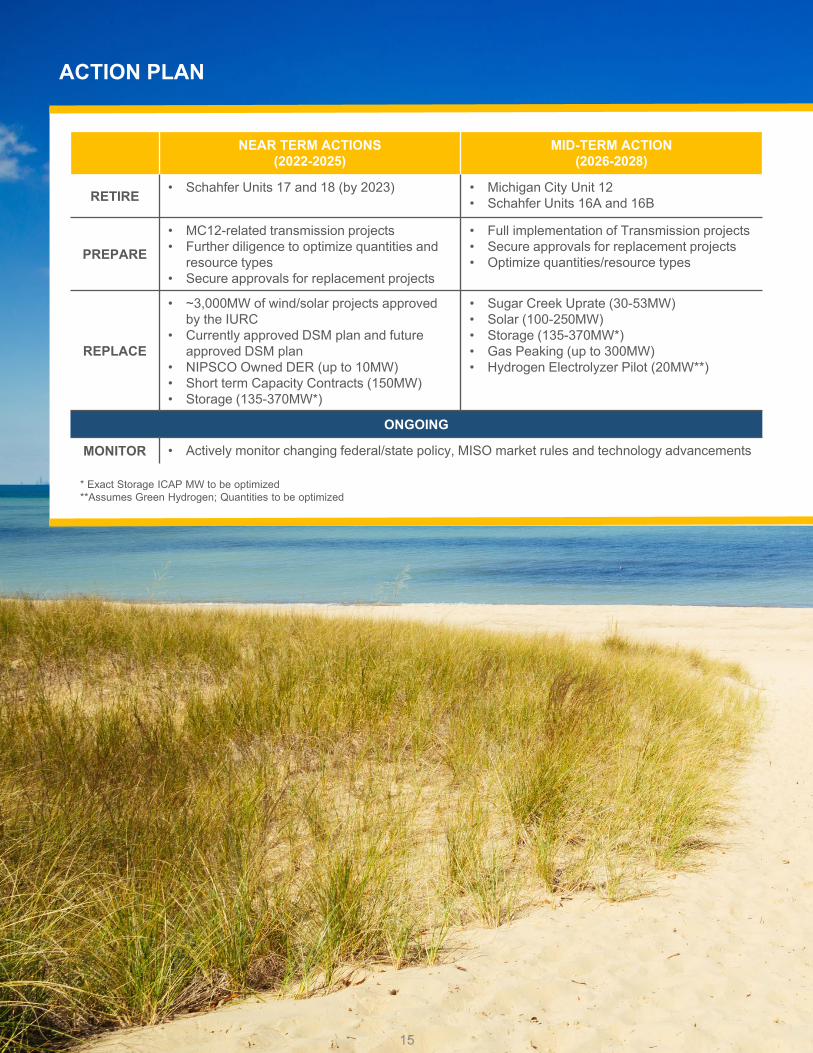
ACTION PLAN
15
NEAR TERM ACTIONS(2022-2025)
MID-TERM ACTION(2026-2028)
RETIRE • Schahfer Units 17 and 18 (by 2023) • Michigan City Unit 12 • Schahfer Units 16A and 16B
PREPARE
• MC12-related transmission projects• Further diligence to optimize quantities and
resource types• Secure approvals for replacement projects
• Full implementation of Transmission projects• Secure approvals for replacement projects• Optimize quantities/resource types
REPLACE
• ~3,000MW of wind/solar projects approved by the IURC
• Currently approved DSM plan and future approved DSM plan
• NIPSCO Owned DER (up to 10MW)• Short term Capacity Contracts (150MW)• Storage (135-370MW*)
• Sugar Creek Uprate (30-53MW)• Solar (100-250MW)• Storage (135-370MW*)• Gas Peaking (up to 300MW)• Hydrogen Electrolyzer Pilot (20MW**)
ONGOING
MONITOR • Actively monitor changing federal/state policy, MISO market rules and technology advancements
* Exact Storage ICAP MW to be optimized **Assumes Green Hydrogen; Quantities to be optimized
Northern Indiana Public Service Company LLC i
Table of Contents
Section 1. Integrated Resource Plan ...........................................................................................1
1.1 Short Term Action Plan ..................................................................................1
1.2 Plan Summary .................................................................................................3
1.3 Emerging Issues ..............................................................................................4
1.3.1 Market Rules Uncertainty ...................................................................4
1.3.2 Policy Uncertainty ..............................................................................5
1.3.3 Technology Uncertainty ......................................................................5
Section 2. Planning for the Future ..............................................................................................6
2.1 IRP Public Advisory Process ..........................................................................6
2.1.1 Stakeholder Meeting 1 ........................................................................6
2.1.2 Stakeholder Meeting 2 ........................................................................7
2.1.3 Stakeholder Meeting 3 ........................................................................7
2.1.4 Stakeholder Meeting 4 ........................................................................8
2.1.5 Technical Webinar ..............................................................................8
2.1.6 Stakeholder Meeting 5 ........................................................................8
2.1.7 One-on-one Stakeholder Meetings .....................................................9
2.2 IRP Planning Process ......................................................................................9
2.2.1 Contemporary Issues .........................................................................10
2.2.2 2018 IRP Feedback and 2021 Process Improvement Efforts ...........11
2.2.3 Equitable Transition ..........................................................................12
2.3 Resource Planning Approach ........................................................................12
Section 3. Energy and Demand Forecast ..................................................................................25
3.1 Introduction and Major Highlights of the Forecast .......................................25
3.2 Forecasting Methodology Overview.............................................................25
3.3 Base Customer Count, Electric Energy, and Peak Demand Forecast ...........26
3.3.1 Data Gathering, Weather Normalization, and Econometric Modeling ...........................................................................................26
3.3.2 New Industrial Service Structure ......................................................30
3.3.3 Customer Count Forecast ..................................................................30
3.3.4 Sales per Customer and Total Electric Sales Forecast ......................32
Northern Indiana Public Service Company LLC ii
3.3.5 Peak Load Forecast Development ....................................................32
3.4 Electric Vehicles ...........................................................................................34
3.4.1 Methodology Overview ....................................................................34
3.4.2 Core Data Source Inputs ...................................................................34
3.4.3 Light Duty Vehicles ..........................................................................36
3.4.4 Transit Vehicles ................................................................................41
3.4.5 Medium Duty Vehicles .....................................................................42
3.4.6 Heavy Duty Vehicles ........................................................................43
3.4.7 Electric Vehicle Forecast Results .....................................................43
3.5 Distributed Energy Resources.......................................................................46
3.5.1 PenDER Model Description .............................................................46
3.5.2 Key Input Assumptions.....................................................................47
3.5.3 DER Forecast Results .......................................................................50
3.6 Scenario Analysis..........................................................................................52
3.6.1 Economic Variables ..........................................................................53
3.6.2 Electric Vehicles ...............................................................................53
3.6.3 Distributed Energy Resources...........................................................53
3.6.4 Other Electrification ..........................................................................54
3.6.5 Industrial Load Risk ..........................................................................54
3.6.6 Scenario Results ................................................................................54
3.7 Detailed Forecast Results ..............................................................................56
Section 4. Supply-Side Resources ............................................................................................67
4.1 Existing Resources ........................................................................................67
4.1.1 Michigan City ...................................................................................68
4.1.2 Schahfer ............................................................................................68
4.1.3 Sugar Creek .......................................................................................69
4.1.4 Norway Hydro and Oakdale Hydro (NIPSCO-Owned Supply Resources) .........................................................................................70
4.1.5 NIPSCO Wind Purchase Power Agreements and Joint Venture ......71
4.1.6 Total Resource Summary ..................................................................72
4.2 Fuel, Energy, and Capacity Procurement Strategy for Existing Resources ..74
4.2.1 Coal Procurement and Inventory Management Practices .................74
4.2.2 Natural Gas Procurement and Management .....................................78
Northern Indiana Public Service Company LLC iii
4.2.3 Electric Generation Gas Supply Request for Proposal Process ........78
4.3 Planned Resource Summary .........................................................................79
4.3.1 Planned Wind Resources ..................................................................79
4.3.2 Planned Solar and Solar + Storage Resources ..................................80
4.4 MISO Wholesale Electricity Market ............................................................84
4.4.1 Operations Management and Dispatch Implications ........................84
4.5 Resource Adequacy and Current Supply-Demand Balance .........................84
4.6 Future Resource Options...............................................................................85
4.6.1 Request for Proposal .........................................................................85
4.6.2 Incorporation of the RFP Results into the IRP .................................88
4.6.3 Tranche Development .......................................................................89
4.6.4 Renewable Resource Tax Incentives and Tax Equity Partnership ...91
4.6.5 Sugar Creek Uprate Opportunity ......................................................93
4.6.6 Distributed Energy Resources...........................................................93
4.6.7 Emerging Technologies ....................................................................96
4.6.8 Carbon Capture, Utilization, and Storage .......................................107
4.6.9 Small Modular Reactors .................................................................111
Section 5. Demand-Side Resources ........................................................................................112
5.1 Existing Resources ......................................................................................112
5.1.1 Existing Energy Efficiency Resources ............................................112
5.1.2 Existing Demand Response Resources ...........................................120
5.2 DSM MPS ...................................................................................................121
5.2.1 DSM MPS – Purpose and Key Objectives .....................................121
5.2.2 Impact of Opt-out Customers ..........................................................121
5.2.3 Modeling Framework......................................................................121
5.2.4 Key Assumptions That Impact Energy Efficiency Potential ..........122
5.2.5 Energy Efficiency Measures & Potential ........................................124
5.2.6 DR Potential ....................................................................................131
5.3 Future Resource Options.............................................................................133
5.3.1 Energy Efficiency Bundles .............................................................133
5.3.2 DR Bundles .....................................................................................140
5.4 Consistency between IRP and Energy Efficiency Plans .............................141
Northern Indiana Public Service Company LLC iv
Section 6. Transmission and Distribution System ..................................................................144
6.1 Transmission System Planning ...................................................................144
6.1.1 Transmission System Planning Criteria and Guidelines .................144
6.1.2 North American Electric Reliability Corporation ...........................144
6.1.3 Midcontinent Independent System Operator, Inc. ..........................145
6.1.4 Market Participants .........................................................................146
6.1.5 Customer Driven Development Projects ........................................146
6.1.6 NIPSCO Transmission System Capital Projects.............................146
6.1.7 Electric Infrastructure Modernization Plan .....................................147
6.2 Distribution System Planning .....................................................................148
6.2.1 Evolving Technologies and System Capabilities ............................151
Section 7. Environmental Considerations ..............................................................................152
7.1 Environmental Sustainability ......................................................................152
7.2 Environmental Compliance Plan Development ..........................................153
7.3 Environmental Regulations .........................................................................154
7.3.1 Solid Waste Management ...............................................................154
7.3.2 Clean Water Act ..............................................................................154
7.3.3 Effluent Limitations Guidelines ......................................................154
7.3.4 Clean Air Act ..................................................................................154
7.3.5 Emission Allowance Inventory and Procurement ...........................155
7.4 Climate-Related Considerations .................................................................156
Section 8. Managing Risk and Uncertainty ............................................................................157
8.1 Introduction & Process Overview ...............................................................157
8.2 Reference Case Market Drivers and Assumptions .....................................158
8.2.1 Natural Gas Prices...........................................................................158
8.2.2 Coal Prices ......................................................................................166
8.2.3 Carbon Policy and Prices ................................................................168
8.2.4 MISO Energy and Capacity Prices .................................................170
8.3 Defining Risk and Uncertainty Drivers and Scenario and Stochastic Treatment ...............................................................................................................176
8.4 IRP Scenarios ..............................................................................................178
8.4.1 Scenario Overview ..........................................................................178
8.4.2 Status Quo Extended Scenario ........................................................179
Northern Indiana Public Service Company LLC v
8.4.3 Aggressive Environmental Regulation Scenario ............................182
8.4.4 Economy-Wide Decarbonization Scenario .....................................185
8.4.5 Scenario Comparisons ....................................................................188
8.5 Stochastic Input Development ....................................................................198
8.5.1 Input Data Development .................................................................199
8.5.2 Statistical and Fundamental Analysis .............................................200
8.5.1 Final Stochastic Input Development ...............................................205
Section 9. Portfolio Analysis ..................................................................................................207
9.1 Existing Fleet Analysis ...............................................................................207
9.1.1 Process Overview ............................................................................207
9.1.2 Existing Fleet Analysis Methodology .............................................208
9.1.3 Identification of Existing Fleet Portfolios .......................................208
9.1.4 Existing Fleet Cost Assumptions ....................................................209
9.1.5 Identification of Least-Cost Replacement Capacity .......................210
9.1.6 Evaluation of Each Existing Fleet Portfolio – Scorecard Metrics ..212
9.1.7 Evaluation of Each Existing Fleet Portfolio – Results ....................214
9.1.8 Existing Fleet Analysis Scorecard Summary ..................................218
9.1.9 Preferred Existing Fleet Portfolio ...................................................219
9.2 Replacement Analysis .................................................................................221
9.2.1 Process Overview ............................................................................221
9.2.2 Identification of Replacement Resource Concepts .........................222
9.2.3 Development of Specific Replacement Portfolios ..........................223
9.2.4 Evaluation of Each Replacement Portfolio – Scorecard Metrics ....227
9.2.5 Evaluation of Replacement Portfolios – Core Analysis Results .....229
9.2.6 Sub-Hourly Modeling with Ancillary Services ..............................237
9.2.7 Non-Economic Reliability Assessment ..........................................246
9.3 Preferred Replacement Portfolio .................................................................257
9.3.1 Preferred Portfolio Summary ..........................................................259
9.3.2 Financial Impact ..............................................................................260
9.3.3 Developments That Will Shape NIPSCO’s Preferred Portfolio Implementation ...............................................................................261
9.4 Short-Term Action Plan ..............................................................................264
9.5 Conclusion ..................................................................................................265
Northern Indiana Public Service Company LLC vi
Section 10. Customer Engagement ..........................................................................................266
10.1 Enhancing Customer Engagement ..............................................................268
10.1.1 Leveraging Customer and Stakeholder Feedback ...........................268
10.1.2 Customer Education – Your Energy, Your Future .........................269
10.1.3 NIPSCO’s Customer Workshop Series ..........................................270
10.2 Community Partnerships .............................................................................270
10.2.1 Community Advisory Panels ..........................................................270
10.2.2 Partners For Clean Air ....................................................................271
10.3 Customer Programs .....................................................................................271
10.3.1 Feed-in Tariff ..................................................................................271
10.3.2 Net Metering ...................................................................................273
10.3.3 Green Power Rider Program ...........................................................274
10.3.4 Transportation Decarbonization: DC Fast charging stations & IDEM Grant ...............................................................................................276
10.3.5 Advanced Metering Infrastructure ..................................................277
10.4 Corporate Development and Community Support .....................................277
10.4.1 Supporting Economic Growth ........................................................277
10.4.2 Supplier Diversity ...........................................................................277
10.4.3 Workforce Development .................................................................278
10.4.4 Corporate Citizenship .....................................................................279
10.4.5 Volunteerism ...................................................................................280
Section 11. Compliance with Proposed Rule ...........................................................................281
Northern Indiana Public Service Company LLC vii
ACRONYMS AND ABBREVIATIONS
A
AC
ACE
Air Conditioning
Affordable Clean Energy
ACP
ACS
AEO
AER
Alternative Compliance Payment
American Community Survey 2019
Annual Energy Outlook (from EIA)
Aggressive Environmental Regulation Scenario
ASHP Air Source Heat Pumps
AMI Advanced Metering Infrastructure
A/S Ancillary Services
ATC Around-the-Clock
B
BEV
BNEF
BPM
Battery Electric Vehicles
Bloomberg New Energy Finance
Business Practice Manual
C
C&I Commercial and Industrial
CAA Clean Air Act – EPA issued initial rules in 1970
CAGR Compound Annual Growth Rate
CAIR
CapEx
CAP
CAPP
CATF
CC
Clean Air Interstate Rule
Capital Expenditures
Community Advisory Panel
Central Appalachia
Clean Air Task Force
Combined Cycle
CCGT Combined Cycle Gas Turbine
CCR Coal Combustion Residuals – EPA issued rules June 2010
CCS Carbon Capture and Sequestration or Carbon Capture and Storage
CCUS Carbon capture, utilization, and storage
CDD Cooling Degree Days
CEPP
CF
Clean Electricity Performance Program
Capacity Factor
CO2
Company
Carbon Dioxide
Northern Indiana Public Service Company LLC
CONE Cost of New Entry
CPCN Certificate of Public Convenience and Necessity
Northern Indiana Public Service Company LLC viii
CRA Charles River Associates (IRP Consultant)
CT
CWA
Combustion Turbine
Clean Water Act
D
DA
DER
Distribution Automation
Distributed Energy Resource
DG
DG Statute
DOE
Distributed Generation
Indiana Code Ch. 8‐1‐40
U.S. Department of Energy
DR
DRR1
Demand Response
Demand Resource Type 1
DSM
DSM Statute
Demand-Side Management
Ind. Code § 8‐1‐8.5‐10
E
EDG
EDR
Excess Distributed Generation
Emergency Demand Response
EE Energy Efficiency
EIA
EISA
Energy Information Administration of the U.S. Department of Energy
Energy Independence and Security Act of 2009
ELCC
ELG
Effective Load Carrying Capability
National Effluent Limitation Guidelines
EM&V
EOR
Evaluation, Measurement and Verification
Enhanced Oil Recovery
EPA
ESOP
U.S. Environmental Protection Agency
Energy Storage Operations
ESP
ESR
Electrostatic Precipitator
Electric Storage Resources
EV
EWD
Electric Vehicles
Economy-Wide Decarbonization Scenario
F
FERC Federal Energy Regulatory Commission
FGD Flue Gas Desulfurization
G
GDS
GDS Team
GDS Associates, Inc.
GDS and Demand Side Analytics
Northern Indiana Public Service Company LLC ix
GHG
GPCM
GPR
Green House Gas
Gas Pipeline Competition Model
Green Power Rider
H
H2 Hydrogen
HDD
HDV Heating Degree Days
Heavy-Duty Vehicle
Hg Mercury
HRSG
HSPF
Heat Recovery Steam Generator
Heating Seasonal Performance Factor
HVAC Heating, Ventilation, and Air Conditioning
I
IA
ICAP
IDEM
IEA
Interconnection Agreement
Installed Capacity
Indiana Department of Environmental Management
International Energy Agency
IEEE Institute of Electrical and Electronics Engineers
IGCC
ILB
IMEP
Integrated Gas Combined Cycle
Illinois Basin
Interregional Market Efficiency Project
IQW Income Qualified Weatherization
IRP
IRP Rule
Integrated Resource Planning
170 IAC 4-7 Guidelines for Electric Utility Integrated Resource Plans
ISO
ITC
Independent System Operator
Investment Tax Credit
IURC/Commission Indiana Utility Regulatory Commission
K
kWh Kilowatt hour
J
JA
JOA
Junior Achievement
Joint Operating Agreement
L
LCOE Levelized Cost of Electricity/Energy
Northern Indiana Public Service Company LLC x
LCOH
LDV
LED
LLF
Levelized Cost of Hydrogen
Light-Duty Passenger Vehicle
Light Emitting Diode
Line Loss Factors
LMR Load Modifying Resource
LMP Locational Marginal Pricing
LNB Low NOx Burner
LNG Liquefied Natural Gas
LOLE
LRZ 6
Loss of Load Expectation
MISO Load Resource Zone 6
M
MAP Maximum Achievable Potential
MDV Medium-Duty Vehicle
MFDI
Michigan City
Michigan City 12
Multi Family Direct Install
Michigan City Generating Station
Michigan City Unit 12
MISO Midcontinent Independent System Operator, Inc.
MOSEP
MPS
CRA’s Moment Simulation Energy Price
Market Potential Study
MTEP MISO Transmission Expansion Planning
MW Megawatt
N
NAAQS
NAPP
NBV
NDC
National Ambient Air Quality Standard – EPA issued rules January 2013
Northern Appalachian
Net Book Value
Net Demonstrated Capacity
NERC
NETL
North American Electric Reliability Corporation (formerly Council)
National Energy Technology Laboratory
NG
NGF
Natural Gas
CRA’s Natural Gas Fundamentals Market Model
NIPSCO Northern Indiana Public Service Company LLC
NOx Nitrogen Oxides
NPDES National Pollutant Discharge Elimination System
NPV
NPVRR
NSRDB
Net Present Value
Net Present Value of Revenue Requirements
National Solar Radiation Database
NREL
NTG
National Renewable Energy Laboratory
Net To Gross
NYMEX New York Mercantile Exchange
Northern Indiana Public Service Company LLC xi
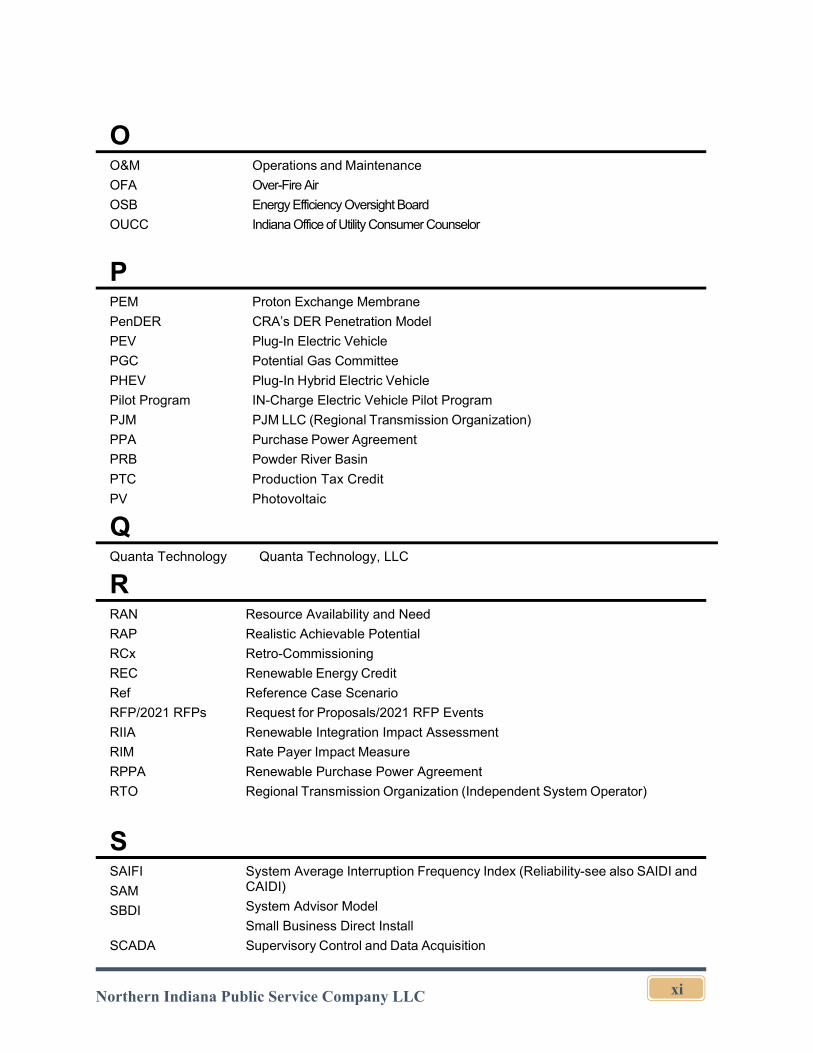
O
O&M
OFA
OSB
OUCC
Operations and Maintenance
Over-Fire Air
Energy Efficiency Oversight Board
Indiana Office of Utility Consumer Counselor
P
PEM
PenDER
PEV
PGC
Proton Exchange Membrane
CRA’s DER Penetration Model
Plug-In Electric Vehicle
Potential Gas Committee
PHEV
Pilot Program
Plug-In Hybrid Electric Vehicle
IN-Charge Electric Vehicle Pilot Program
PJM PJM LLC (Regional Transmission Organization)
PPA
PRB
Purchase Power Agreement
Powder River Basin
PTC
PV
Production Tax Credit
Photovoltaic
Q
Quanta Technology Quanta Technology, LLC
R
RAN
RAP
RCx
Resource Availability and Need
Realistic Achievable Potential
Retro-Commissioning
REC
Ref
Renewable Energy Credit
Reference Case Scenario
RFP/2021 RFPs Request for Proposals/2021 RFP Events
RIIA
RIM
RPPA
Renewable Integration Impact Assessment
Rate Payer Impact Measure
Renewable Purchase Power Agreement
RTO Regional Transmission Organization (Independent System Operator)
S
SAIFI
SAM
SBDI
System Average Interruption Frequency Index (Reliability-see also SAIDI and CAIDI)
System Advisor Model
Small Business Direct Install
SCADA Supervisory Control and Data Acquisition
Northern Indiana Public Service Company LLC xii
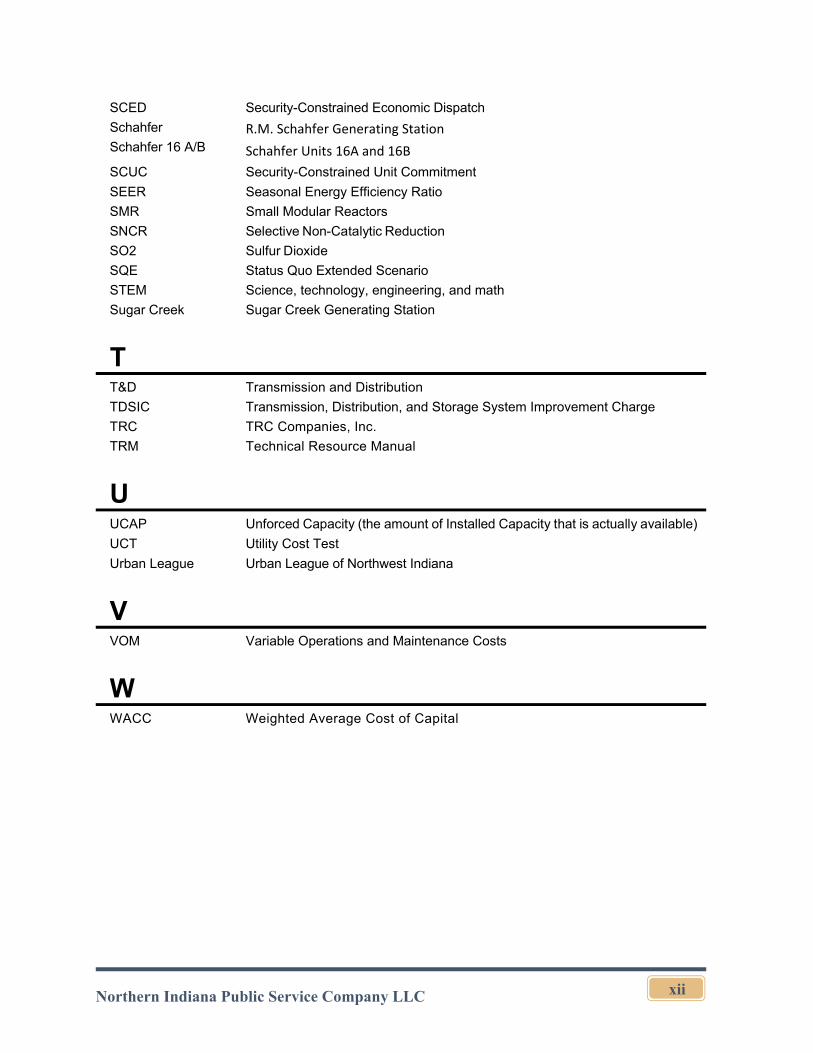
SCED Security-Constrained Economic Dispatch
Schahfer
Schahfer 16 A/B R.M. Schahfer Generating Station
Schahfer Units 16A and 16B
SCUC
SEER
Security-Constrained Unit Commitment
Seasonal Energy Efficiency Ratio
SMR Small Modular Reactors
SNCR Selective Non-Catalytic Reduction
SO2
SQE
Sulfur Dioxide
Status Quo Extended Scenario
STEM
Sugar Creek
Science, technology, engineering, and math
Sugar Creek Generating Station
T
T&D
TDSIC
Transmission and Distribution
Transmission, Distribution, and Storage System Improvement Charge
TRC
TRM
TRC Companies, Inc.
Technical Resource Manual
U
UCAP Unforced Capacity (the amount of Installed Capacity that is actually available)
UCT Utility Cost Test
Urban League Urban League of Northwest Indiana
V
VOM Variable Operations and Maintenance Costs
W
WACC
Weighted Average Cost of Capital
Northern Indiana Public Service Company LLC
1
Section 1. Integrated Resource Plan
1.1 Short Term Action Plan
Northern Indiana Public Service Company LLC has developed a short-term action plan in this 2021 IRP that ensures NIPSCO can confidently provide the least cost, cleanest supply portfolio available while maintaining reliability, diversity and flexibility during a time of transition within NIPSCO’s own resource portfolio and dynamic change in the overall energy industry.
As previously planned, NIPSCO will complete the retirement and shutdown of Schahfer Units 17 and 18 by the end of 2023 and continue activities associated with the implementation of transmission system reliability upgrades. NIPSCO will continue to complete and place in service wind, solar, and solar plus storage replacement resources previously approved by the Commission for the scheduled 2023 retirement of all coal units at Schahfer.
Beyond the activities associated with the retirement of the Schahfer coal units, NIPSCO’s short-term action plan focuses on maintaining flexibility for retirement of additional units and replacement with new resources. Consistent with previous analyses, early retirement of coal units is still cost-effective for customers, and NIPSCO has refined the retirement timing of Michigan City to occur between 2026 and 2028. Additionally, NIPSCO’s two vintage gas peaking units (Schahfer 16A/B) will also retire between 2025 and 2028. Flexibility in timing allows NIPSCO to optimize the retirement dates of Michigan City and Schahfer 16A/B, pursuing cost-effective resources that fulfill emerging capacity needs.
The robust response to the 2021 RFPs (discussed in more detail in Section 4) indicates that there is a diverse set of resources and projects to meet NIPSCO supply needs over the near term. NIPSCO will select replacement projects/bids through the 2021 RFPs evaluation process, prioritizing capacity-advantaged resources that address our reliability requirements, including thermal contracts, storage, and gas peaking resources. NIPSCO will also engage with bidders on emerging technology resources, such as long-duration energy storage and hydrogen technologies, to pursue pilots and inform how such technologies can be deployed by NIPSCO to achieve further decarbonization of the generation portfolio over the long term. Additionally, NIPSCO will further study strategically-sited NIPSCO-owned DER opportunities with the potential to defer substation and other distribution system investment (discussed further in Section 4).
NIPSCO will make the necessary regulatory filings with the Commission and continue to monitor federal and state policy, MISO market trends, and emerging technologies, while staying actively engaged with project developers and asset owners to maintain flexibility and optionality. If necessary, NIPSCO may conduct future RFPs to identify preferred resources to replace Michigan City 12 and Schahfer 16A/B.
Northern Indiana Public Service Company LLC
2
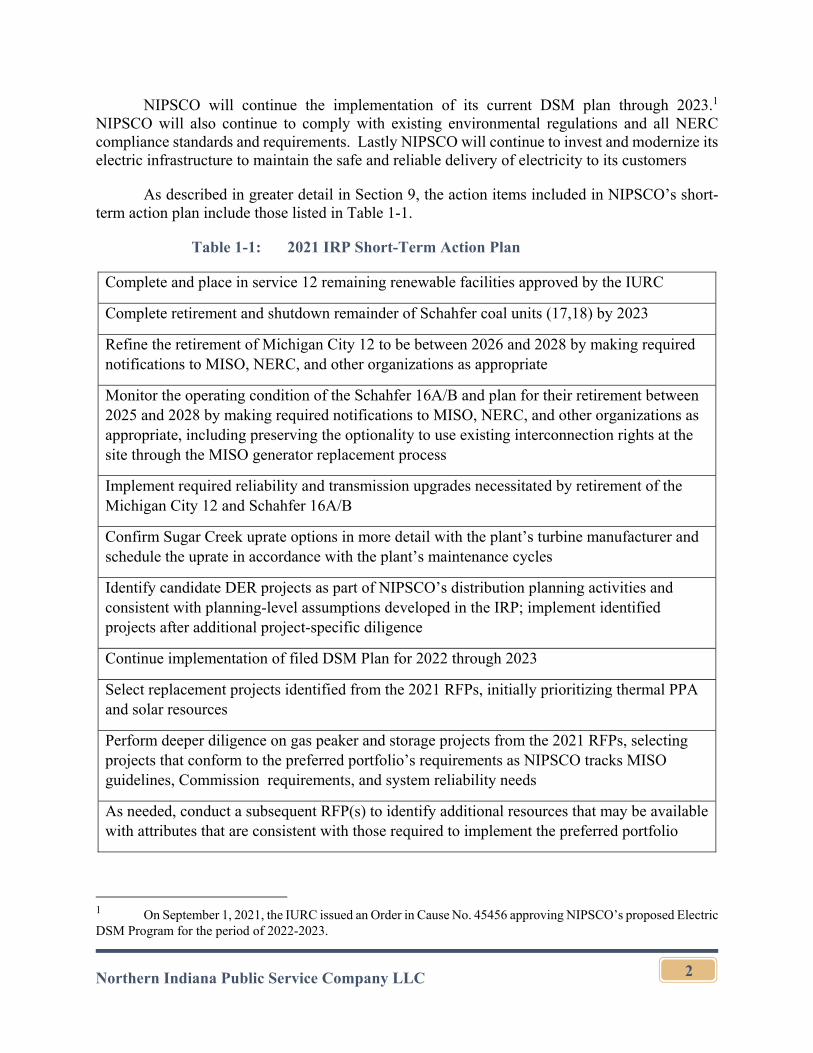
NIPSCO will continue the implementation of its current DSM plan through 2023.1 NIPSCO will also continue to comply with existing environmental regulations and all NERC compliance standards and requirements. Lastly NIPSCO will continue to invest and modernize its electric infrastructure to maintain the safe and reliable delivery of electricity to its customers
As described in greater detail in Section 9, the action items included in NIPSCO’s short-term action plan include those listed in Table 1-1.
Table 1-1: 2021 IRP Short-Term Action Plan
Complete and place in service 12 remaining renewable facilities approved by the IURC
Complete retirement and shutdown remainder of Schahfer coal units (17,18) by 2023
Refine the retirement of Michigan City 12 to be between 2026 and 2028 by making required notifications to MISO, NERC, and other organizations as appropriate
Monitor the operating condition of the Schahfer 16A/B and plan for their retirement between 2025 and 2028 by making required notifications to MISO, NERC, and other organizations as appropriate, including preserving the optionality to use existing interconnection rights at the site through the MISO generator replacement process
Implement required reliability and transmission upgrades necessitated by retirement of the Michigan City 12 and Schahfer 16A/B
Confirm Sugar Creek uprate options in more detail with the plant’s turbine manufacturer and schedule the uprate in accordance with the plant’s maintenance cycles
Identify candidate DER projects as part of NIPSCO’s distribution planning activities and consistent with planning-level assumptions developed in the IRP; implement identified projects after additional project-specific diligence
Continue implementation of filed DSM Plan for 2022 through 2023
Select replacement projects identified from the 2021 RFPs, initially prioritizing thermal PPA and solar resources
Perform deeper diligence on gas peaker and storage projects from the 2021 RFPs, selecting projects that conform to the preferred portfolio’s requirements as NIPSCO tracks MISO guidelines, Commission requirements, and system reliability needs
As needed, conduct a subsequent RFP(s) to identify additional resources that may be available with attributes that are consistent with those required to implement the preferred portfolio
1 On September 1, 2021, the IURC issued an Order in Cause No. 45456 approving NIPSCO’s proposed Electric DSM Program for the period of 2022-2023.
Northern Indiana Public Service Company LLC
3
Explore potential pilot projects from the RFP associated with emerging technologies, such as long duration storage and hydrogen
File CPCN(s) and other necessary approvals for selected replacement projects
Procure short-term capacity as needed from the MISO market or through short-term bilateral capacity transactions
Continue to actively monitor technology and MISO market trends, while staying engaged with project developers and asset owners to understand landscape
Perform additional reliability analysis within the NIPSCO system as needed to ensure evolving portfolio meets all reliability needs and requirements
Comply with NERC, EPA, and other regulations
Continue planned investments in infrastructure modernization to maintain the safe and reliable delivery of energy services
1.2 Plan Summary
NIPSCO’s preferred portfolio pathway preserves flexibility and our ability to adapt to expected changes in environmental regulations, federal and state energy policy, and other market forces, while providing additional time for further research, refinement and confirmation of our long-term energy plans. The plan was developed to ensure that a reliable, compliant, flexible, diverse and affordable supply will continue to be available to meet future customer needs. NIPSCO carefully planned and considered the impacts to its employees, the environment and the local economy of the communities NIPSCO serves (property tax, supplier spend, employee base) as the plans were developed.
This preferred plan was developed through substantial quantitative and qualitative analyses that capture the ever evolving energy landscape to allow NIPSCO to remain flexible in a time of uncertainty. NIPSCO completed an analysis to evaluate the retirement timing of its remaining existing generating fleet relative to viable alternatives (See Section 9). NIPSCO utilized the 2021 RFP solicitations to identify the best combination of supply- and demand-side resources to meet its capacity needs.
The 2021 RFPs provided NIPSCO insight into the most relevant types of resources available to meet customer needs and their prices (See Section 4). NIPSCO performed both the existing fleet and replacement analyses using robust scenario and risk-based (stochastic) analyses that capture the flexibility and adaptability of the portfolio among changing market rules; carbon emissions and regulations/incentives in an uncertain policy future; and system reliability implications of a portfolio with significant intermittent resources. NIPSCO also performed an enhanced reliability assessment to understand the reliability implications of potential resource
Northern Indiana Public Service Company LLC
4
additions to the NIPSCO portfolio and incorporated the results into the final scoring to create the optimal plan.
It is important to note that the IRP is a snapshot in time, and while it establishes a direction for NIPSCO, it is subject to change as the energy landscape continues to evolve. NIPSCO will continue to engage its stakeholders and be transparent in its decisions following submission of this 2021 IRP.
NIPSCO’s supply strategy for the next 20 years is expected to:
Phase out 100% of its coal emissions by the 2026-2028 time period based on the ultimate retirement timing date for Michigan City;
Replace retired generation resources with a diverse, flexible, and scalable mix of incremental resources, including short-term capacity contracts, solar, large energy storage, and gas peaking resources;
Seek to advance NIPSCO’s knowledge and understanding of future hydrogen pilots and other emerging storage technologies identified as potential pathways toward further decarbonization of the generation portfolio in the long term;
Remain on the CO2 emission reduction pathway identified in the 2018 IRP, with the opportunity to further reduce emissions based on technology advances; and
Continue the Company’s commitment to energy efficiency and demand response by executing DSM plans.
1.3 Emerging Issues
NIPSCO’s preferred plan follows a diverse and flexible supply strategy, with a mix of market purchases and different low variable cost generation resources, to provide the best balanced mitigation against marker rules, policy, and technology uncertainty.
1.3.1 Market Rules Uncertainty
At the outset of its 2021 IRP process, NIPSCO identified several regulatory developments at the MISO level that could impact portfolio performance. While MISO has advanced policy development and proposed tariff revisions in many areas over the last year, several areas of uncertainty remain, requiring NIPSCO to ensure portfolio decisions are flexible enough to adapt to the changing market rules environment. These include:
Ongoing activities associated with RAN framework and the pending implementation of a seasonal capacity construct;
MISO’s transition to an ELCC methodology to assess capacity credit for wind and solar resources over time and by season;
Northern Indiana Public Service Company LLC
5
MISO’s ongoing RIIA study, which may highlight new emerging reliability issues and potential market design responses;
MISO’s implementation of market rules associated with FERC Order 841, which requires ISOs and RTOs to establish a participation model for storage resources in energy, capacity, and ancillary services markets.
1.3.2 Policy Uncertainty
As of the time of the development of NIPSCO’s 2021 IRP preferred portfolio, federal policymakers were debating significant changes to energy and environmental policy, and debates on such policy topics will continue at the federal and state level. Major policy uncertainties that could impact the ultimate direction of NIPSCO’s preferred plan include:
The potential implementation of a stand-alone storage ITC;
The potential implementation of a hydrogen PTC or other federal incentives for hydrogen development;
The potential implementation of a carbon tax, clean energy standard or CEPP that could impact the relative economics of different generating resource types.
1.3.3 Technology Uncertainty
As the power sector continues to navigate a period of significant change, NIPSCO expects that technology evolution will be rapid, requiring regular review of the supply-side resource marketplace and flexibility in the preferred portfolio. Going forward, NIPSCO expects power sector technology evolution to continue to impact both short-term procurement activities and long-term resource decisions. In particular, NIPSCO will continue to monitor the following:
Stand-alone storage resource costs, efficiencies, and operational parameters, such as cycle limits, depth of discharge specifications, and ongoing expenses;
Grid-forming inverter technology that could provide reliability benefits, such as blackstart, fast frequency response, and inertial response, to NIPSCO’s system as it becomes more inverter-based;
Hydrogen production developments, particularly associated with electrolysis of water with clean electricity sources (“green hydrogen”) and the costs and capabilities of turbines and other thermal resources to burn hydrogen or blend hydrogen with natural gas;
CCUS costs and sequestration opportunities, particularly associated with the Sugar Creek facility;
Northern Indiana Public Service Company LLC
6
Long-duration storage technologies, including gravity storage, and their associated costs, efficiencies, and other value drivers; and
Other technologies that may emerge over the long term, including small modular reactors and other nuclear technology.
Section 2. Planning for the Future
2.1 IRP Public Advisory Process
NIPSCO’s 2021 IRP stakeholder process focused on continuing to increase transparency around its planning process and enhance public involvement through extensive stakeholder interactions. At each stakeholder meeting, NIPSCO provided information on the processes and assumptions involved in the development of the IRP and solicited relevant input for consideration. Furthermore, to facilitate stakeholder outreach and ongoing communications, NIPSCO maintained a web page on its website with current information about the IRP. NIPSCO posted all meeting agendas, presentations, meeting notes and other relevant documents to the web page.
As part of the IRP process NIPSCO conducted an RFP solicitation to identify the most viable capacity resources currently available in the market place to best meet customer needs. NIPSCO sought input from stakeholders regarding the approach and design of the All-Source RFP to ensure a robust and transparent process that yielded the desired results.
Stakeholders were invited to meet with NIPSCO throughout the IRP process to discuss key issues, concerns and perspectives. NIPSCO extended an invitation to participate in the stakeholder process to the Commissioners and Commission staff, the OUCC and stakeholders that participated in previous IRP public advisory processes. NIPSCO’s executive leadership and its subject matter experts attended each public advisory meeting. In the section that follows, NIPSCO provides an overview of its stakeholder process. A more comprehensive accounting of stakeholder meetings, presentations and meeting notes is included in Appendix A.
As part of the 2021 IRP process, NIPSCO hosted five virtual public advisory meetings plus one virtual technical webinar, which was focused on the additional reliability analysis that NIPSCO introduced in this IRP. For all meetings, NIPSCO posted an open invitation on its website for any party wishing to register.
In addition to the public advisory meetings, NIPSCO participated in a number of one-on-one meetings with individual stakeholders to address specific concerns and issues that were raised as a result of information presented and discussed at the public advisory meetings. NIPSCO also corresponded with individual stakeholders on a variety of issues throughout the process.
2.1.1 Stakeholder Meeting 1
NIPSCO’s first stakeholder meeting was held virtually on March 19, 2021. In this first meeting, NIPSCO set the stage for the 2021 IRP. An update on the progress of the 2018 Short Term Action Plan and the ongoing generation transition plan was discussed. NIPSCO then outlined
Northern Indiana Public Service Company LLC
7
the fundamental pillars of NIPSCO’s long-term resource planning strategy, which includes producing a plan that is reliable, compliant, flexible, diverse, and affordable. Process improvements from the 2018 IRP were then discussed in detail, including the approach to reliability. NIPSCO then walked through the resource planning approach for 2021, which is structurally similar to the 2018 process with changes and enhancements.
NIPSCO provided an in depth discussion on key assumptions used in the 2021 IRP, including commodity prices and the load forecast, which included impacts from EVs and DERs. NIPSCO then walked through the treatment of uncertainty and introduced scenario concepts. Finally, NIPSCO concluded with the stakeholder advisory meeting road map and indicated a RFP would be conducted in conjunction with the 2021 IRP. The meeting presentation (including the agenda), notes (including questions/responses), and registered participants for Meeting 1 are included in Appendix A.
2.1.2 Stakeholder Meeting 2
NIPSCO’s second stakeholder meeting was held virtually on May 20, 2021. In this second meeting, NIPSCO provided an overview of the resource planning process and provided an update on NIPSCO’s response to stakeholder feedback received since the first meeting. NIPSCO then provided an overview of the major considerations that are taken into account while performing a long-term planning exercise with intermittent resources. NIPSCO outlined the MISO functions and various roles, then introduced major regulatory changes related to MISO market operations since the 2018 IRP. NIPSCO then provided an overview of NIPSCO’s environmental impact targets, outlined the environmental controls present on NIPSCO’s generation fleet, and summarized how the 2018 IRP’s preferred portfolio addressed specific environmental compliance requirements.
NIPSCO then provided an overview of how the 2021 IRP will perform both scenario and stochastic analysis. The four planning scenarios were re-introduced and each of the key variables drivers within each scenario was expanded on in depth. NIPSCO then provided a summary of the major stochastic variable inputs, including a detailed discussion on how renewable generation uncertainty would be incorporated in the 2021 IRP.
NIPSCO also provided an overview of NIPSCO’s RFP, including specifics of each bid event, the range of capacity being requested, duration expectations, and other details. The evaluation criteria, logistics, and timing were also discussed. The meeting presentation (including the agenda), stakeholder presentations, notes (including questions / responses), and registered participants for Meeting 2 are included in Appendix A.
2.1.3 Stakeholder Meeting 3
NIPSCO’s third stakeholder meeting was held virtually on July 13, 2021. In this third stakeholder meeting, NIPSCO provided an overview of the resource planning process and progress since the second stakeholder meeting. NIPSCO then shared an in-depth overview of DSM resource modeling, methodology, and how these resources are considered in the IRP. NIPSCO also introduced supply-side DER options being considered in the IRP. NIPSCO then provided an
Northern Indiana Public Service Company LLC
8
overview of the 2021 RFP Results. NIPSCO and the RFP manager, CRA, provided an overview of the proposals received and a summary of the pricing. NIPSCO also explained how the RFP results would be integrated into the IRP analysis and important next steps for both the IRP and RFP processes. The presentation (including the agenda), notes (including questions / responses), and registered participants for Meeting 3 are included in Appendix A.
2.1.4 Stakeholder Meeting 4
NIPSCO’s fourth stakeholder meeting was held virtually on September 21, 2021. In this fourth meeting, NIPSCO reviewed the overall IRP process and reminded stakeholders of the various inputs and assumptions discussed during previous meetings, including key planning themes, NIPSCO’s integrated scorecard, scenario and stochastic inputs, and supply and demand resource options. NIPSCO then provided an overview of its supply-demand balance and its portfolio energy position on an annual and hourly basis, followed by a detailed review of the preliminary findings from the portfolio modeling.
NIPSCO explained the rationale for conducting a two-stage portfolio analysis and reviewed detailed results for the existing fleet and replacement analyses. These results included portfolio optimization outcomes, revenue requirement projections, scenario cost ranges, stochastic analysis results, and other major metrics on NIPSCO’s integrated scorecard associated with environmental sustainability, reliability, and social and economic impacts. NIPSCO also reviewed preliminary findings from its sub-hourly ancillary services analysis and outlined the key elements of the ongoing technical reliability assessment. The presentation (including the agenda), notes (including questions / responses), and registered participants for Meeting 4 are included in Appendix A.
2.1.5 Technical Webinar
NIPSCO held a technical webinar on October 12, 2021. The technical webinar focused on the enhanced reliability considerations in the 2021 IRP, providing a forum for stakeholder questions. NIPSCO reviewed its approach to reliability in this IRP, which considers both the economic and non-economic aspects of reliability. During the meeting, NIPSCO and CRA presented the economic analysis of sub-hourly energy and ancillary services value, and Quanta Technology reviewed the non-economic reliability assessment performed for all replacement portfolios. NIPSCO, CRA, and Quanta Technology responded to stakeholder questions. The presentation (including the agenda), notes (including questions / responses), and registered participants for the Technical Webinar are included in Appendix A.
2.1.6 Stakeholder Meeting 5
NIPSCO’s fifth stakeholder meeting was held virtually on October 21, 2021. In this fifth meeting, NIPSCO reviewed the public advisory process, resource planning activities, existing fleet and replacement analyses, and the reliability assessment presented in the October 12th Technical Webinar. NIPSCO also responded to stakeholder feedback related to DSM topics and alternative customer cost summaries. NIPSCO then reviewed its preferred resource plan and preliminary action plan and responded to stakeholder questions and feedback. The meeting presentation
Northern Indiana Public Service Company LLC
9
(including the agenda), notes (including questions / responses), and registered participants for Meeting 5 are included in Appendix A.
2.1.7 One-on-one Stakeholder Meetings
NIPSCO held a number of one-on-one meetings with its stakeholders throughout the public advisory process. Generally, the meetings related to either (1) clarifications, (2) additional information regarding the RFP solicitation, or (3) providing additional data. Information relating to the stakeholder requests can be found in the presentation included in Appendix A (Slides 48 through 52) and Appendix A(Slides 11 through 23).
NIPSCO’s 2021 IRP is the result of analysis performed by NIPSCO that includes consideration of stakeholder input. NIPSCO has made a good-faith effort to be open and transparent regarding input assumptions and modeling results. NIPSCO appreciates the participation of its stakeholders, including the Commission staff, the OUCC, NIPSCO’s largest industrial customers and community action groups, all of which participated extensively throughout the IRP development process. NIPSCO’s stakeholders and Commission staff provided valuable feedback throughout the process, which has been considered and incorporated as applicable. The written feedback NIPSCO received, as well as the Company’s responses, is included in Appendix A. Despite best efforts to address and resolve all input from stakeholders, there were instances wherein NIPSCO still incorporated, for example, methodologies that were not supported by all stakeholders.
2.2 IRP Planning Process
NIPSCO’s 2021 IRP is in compliance with the Commission’s IRP Rule. A matrix showing NIPSCO’s compliance with each section of the IRP Rule (providing a reference to the appropriate Section(s) of the IRP) is included in Section 11: Compliance with Proposed Rule.
Long term resource planning requires addressing risks and uncertainties and for NIPSCO, the first step in this process is to identify objectives and metrics. Next NIPSCO develops market perspectives for key variables such as customer demand and commodity prices. This involves the creation of distinct thematic “states-of-the-world” that represent potential future operating environments for NIPSCO. Then NIPSCO constructs integrated resource portfolio strategies and performs detailed modeling and analysis to evaluate the performance of various resource portfolios across a range of potential futures as well as a distribution of key stochastic variables. NIPSCO’s goal is to develop a resource plan that is reliable, compliant with all regulations, diverse, flexible and affordable for customers with careful consideration of all stakeholder viewpoints.
The long-term strategic plan identifies expected energy and demand needs over a 20-year horizon and recommends a potential resource portfolio to meet those needs. The short-term strategic plan identifies the steps NIPSCO will take over the next three years to implement the long-term strategic plan.
NIPSCO recognizes future economic and environmental changes are difficult to accurately predict. While the 2021 IRP addresses a wide range of plausible market conditions and portfolio
Northern Indiana Public Service Company LLC
10
strategies, new information is evaluated and incorporated as it becomes available as part of NIPSCO’s commitment to continuous planning.
NIPSCO’s IRP team included experts from key areas of NIPSCO and its affiliate NiSource Corporate Services Company. The following energy consultants also provided input:
GDS 1850 Parkway Place, Suite800 Marietta, GA 30067
Developed DSM measures inputs for a long-term DSM forecast
CRA 200 Clarendon Street Boston, MA 02116
Provided fundamental long term commodity price forecasts and performed portfolio modeling and analysis. A separate division of CRA provided assistance in administering the All-Source RFP and evaluating the responses.
Demand Side Analytics 691 John Wesley Dobbs Ave NE Suite V3 Atlanta, GA 30312
Provided assistance with analyzing demand response measures and opportunities
Quanta Technology 4020 Westchase Blvd., Suite 300 Raleigh, NC 27607
Provided technical reliability assessment of replacement portfolio options
2.2.1 Contemporary Issues
NIPSCO also participated in the Commission’s IRP Contemporary Issues Technical Conferences that occurred since NIPSCO completed its last IRP. Dates and topics discussed included:
Date Topics April 15, 2019 Load shapes and planning
Utilizing data bases Long-term planning and procurement Integration of DERs NIPSCO’s IRP/RFP and preliminary lessons learned Life cycle analysis of GHG emissions and resource planning
August 25, 2020 Benefits of RTOs Resource adequacy Implications of changing resource mix Transmission planning DERs
September 24, 2020 Renewable integration models All-source competitive solicitation Grid-interactive efficient buildings
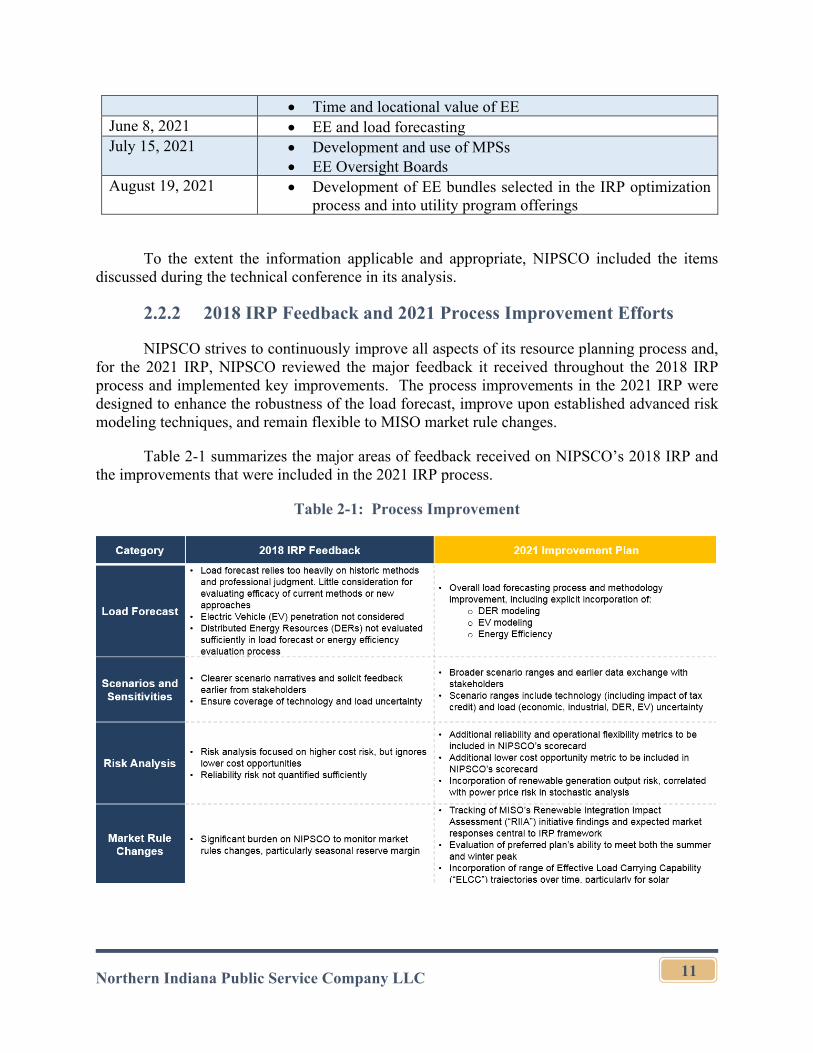
Northern Indiana Public Service Company LLC
11
Time and locational value of EE June 8, 2021 EE and load forecasting July 15, 2021 Development and use of MPSs
EE Oversight Boards August 19, 2021 Development of EE bundles selected in the IRP optimization
process and into utility program offerings
To the extent the information applicable and appropriate, NIPSCO included the items discussed during the technical conference in its analysis.
2.2.2 2018 IRP Feedback and 2021 Process Improvement Efforts
NIPSCO strives to continuously improve all aspects of its resource planning process and, for the 2021 IRP, NIPSCO reviewed the major feedback it received throughout the 2018 IRP process and implemented key improvements. The process improvements in the 2021 IRP were designed to enhance the robustness of the load forecast, improve upon established advanced risk modeling techniques, and remain flexible to MISO market rule changes.
Table 2-1 summarizes the major areas of feedback received on NIPSCO’s 2018 IRP and the improvements that were included in the 2021 IRP process.
Table 2-1: Process Improvement
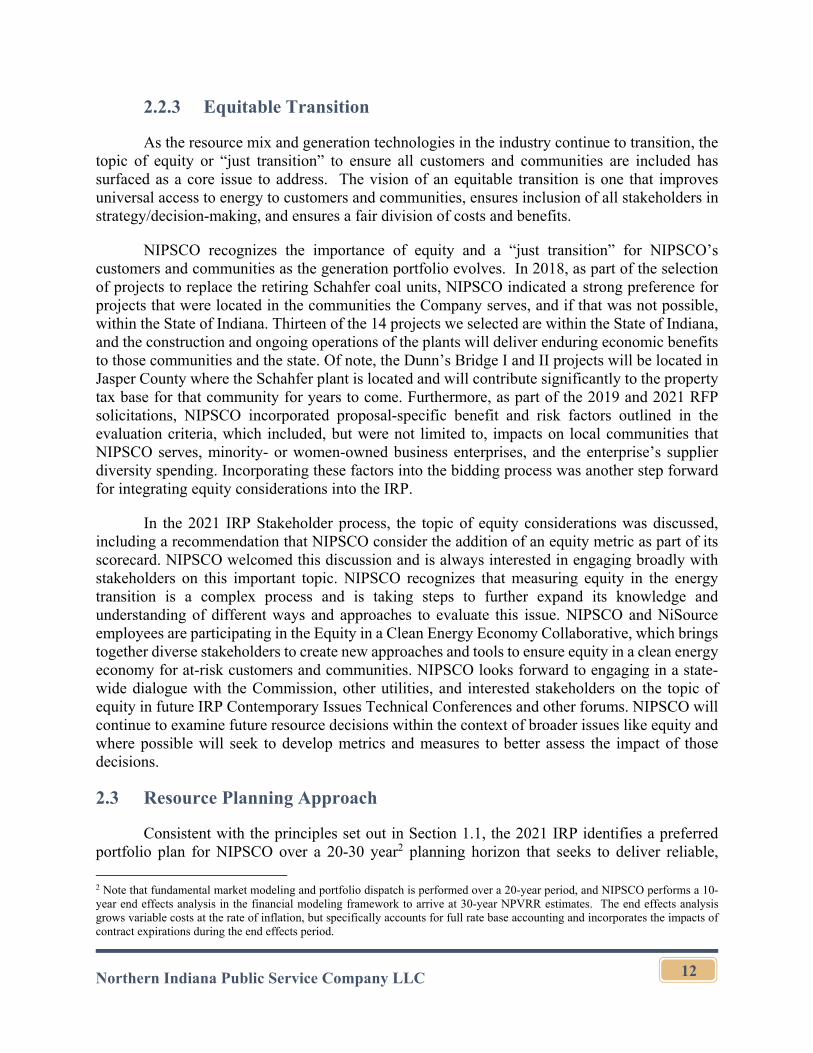
Northern Indiana Public Service Company LLC
12
2.2.3 Equitable Transition
As the resource mix and generation technologies in the industry continue to transition, the topic of equity or “just transition” to ensure all customers and communities are included has surfaced as a core issue to address. The vision of an equitable transition is one that improves universal access to energy to customers and communities, ensures inclusion of all stakeholders in strategy/decision-making, and ensures a fair division of costs and benefits.
NIPSCO recognizes the importance of equity and a “just transition” for NIPSCO’s customers and communities as the generation portfolio evolves. In 2018, as part of the selection of projects to replace the retiring Schahfer coal units, NIPSCO indicated a strong preference for projects that were located in the communities the Company serves, and if that was not possible, within the State of Indiana. Thirteen of the 14 projects we selected are within the State of Indiana, and the construction and ongoing operations of the plants will deliver enduring economic benefits to those communities and the state. Of note, the Dunn’s Bridge I and II projects will be located in Jasper County where the Schahfer plant is located and will contribute significantly to the property tax base for that community for years to come. Furthermore, as part of the 2019 and 2021 RFP solicitations, NIPSCO incorporated proposal-specific benefit and risk factors outlined in the evaluation criteria, which included, but were not limited to, impacts on local communities that NIPSCO serves, minority- or women-owned business enterprises, and the enterprise’s supplier diversity spending. Incorporating these factors into the bidding process was another step forward for integrating equity considerations into the IRP.
In the 2021 IRP Stakeholder process, the topic of equity considerations was discussed, including a recommendation that NIPSCO consider the addition of an equity metric as part of its scorecard. NIPSCO welcomed this discussion and is always interested in engaging broadly with stakeholders on this important topic. NIPSCO recognizes that measuring equity in the energy transition is a complex process and is taking steps to further expand its knowledge and understanding of different ways and approaches to evaluate this issue. NIPSCO and NiSource employees are participating in the Equity in a Clean Energy Economy Collaborative, which brings together diverse stakeholders to create new approaches and tools to ensure equity in a clean energy economy for at-risk customers and communities. NIPSCO looks forward to engaging in a state-wide dialogue with the Commission, other utilities, and interested stakeholders on the topic of equity in future IRP Contemporary Issues Technical Conferences and other forums. NIPSCO will continue to examine future resource decisions within the context of broader issues like equity and where possible will seek to develop metrics and measures to better assess the impact of those decisions.
2.3 Resource Planning Approach
Consistent with the principles set out in Section 1.1, the 2021 IRP identifies a preferred portfolio plan for NIPSCO over a 20-30 year2 planning horizon that seeks to deliver reliable,
2 Note that fundamental market modeling and portfolio dispatch is performed over a 20-year period, and NIPSCO performs a 10-year end effects analysis in the financial modeling framework to arrive at 30-year NPVRR estimates. The end effects analysis grows variable costs at the rate of inflation, but specifically accounts for full rate base accounting and incorporates the impacts of contract expirations during the end effects period.
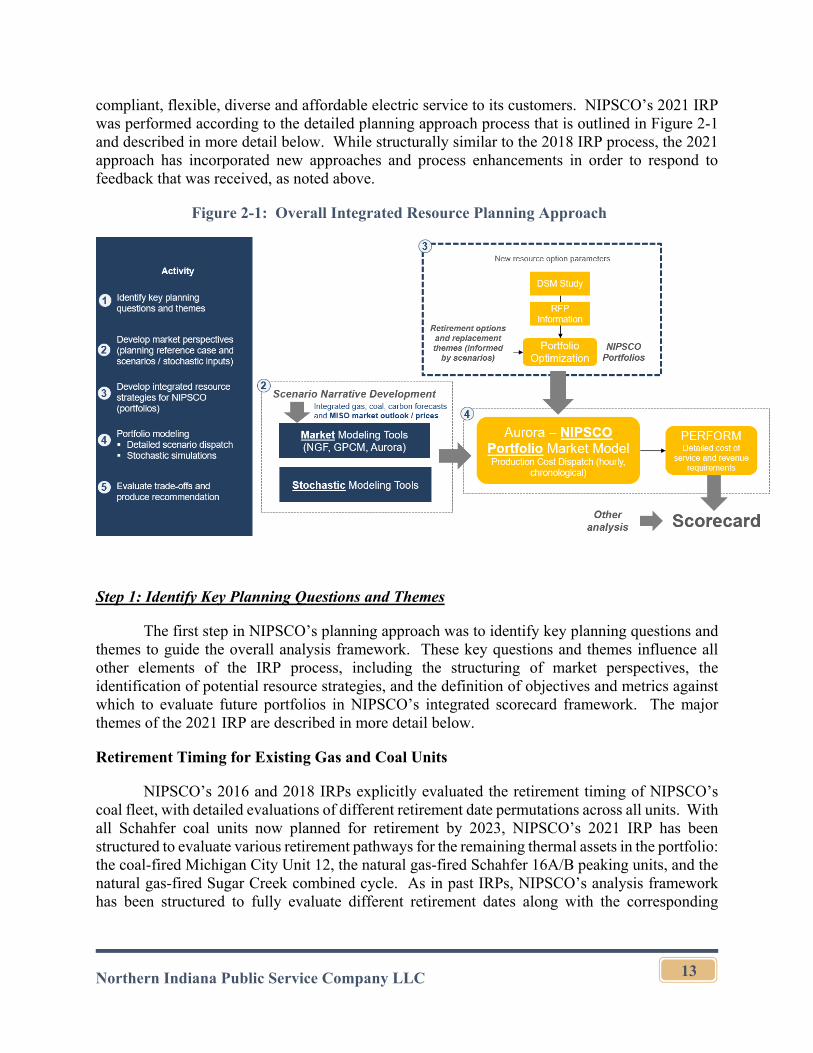
Northern Indiana Public Service Company LLC
13
compliant, flexible, diverse and affordable electric service to its customers. NIPSCO’s 2021 IRP was performed according to the detailed planning approach process that is outlined in Figure 2-1 and described in more detail below. While structurally similar to the 2018 IRP process, the 2021 approach has incorporated new approaches and process enhancements in order to respond to feedback that was received, as noted above.
Figure 2-1: Overall Integrated Resource Planning Approach
Step 1: Identify Key Planning Questions and Themes
The first step in NIPSCO’s planning approach was to identify key planning questions and themes to guide the overall analysis framework. These key questions and themes influence all other elements of the IRP process, including the structuring of market perspectives, the identification of potential resource strategies, and the definition of objectives and metrics against which to evaluate future portfolios in NIPSCO’s integrated scorecard framework. The major themes of the 2021 IRP are described in more detail below.
Retirement Timing for Existing Gas and Coal Units
NIPSCO’s 2016 and 2018 IRPs explicitly evaluated the retirement timing of NIPSCO’s coal fleet, with detailed evaluations of different retirement date permutations across all units. With all Schahfer coal units now planned for retirement by 2023, NIPSCO’s 2021 IRP has been structured to evaluate various retirement pathways for the remaining thermal assets in the portfolio: the coal-fired Michigan City Unit 12, the natural gas-fired Schahfer 16A/B peaking units, and the natural gas-fired Sugar Creek combined cycle. As in past IRPs, NIPSCO’s analysis framework has been structured to fully evaluate different retirement dates along with the corresponding
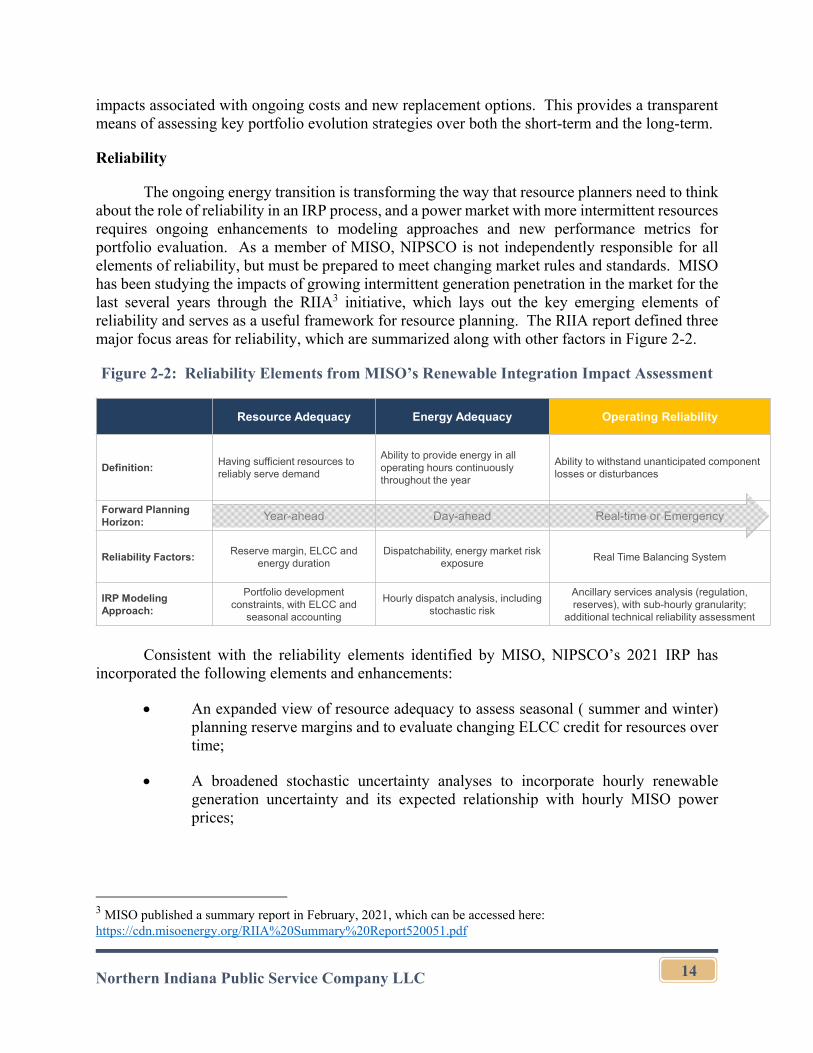
Northern Indiana Public Service Company LLC
14
impacts associated with ongoing costs and new replacement options. This provides a transparent means of assessing key portfolio evolution strategies over both the short-term and the long-term.
Reliability
The ongoing energy transition is transforming the way that resource planners need to think about the role of reliability in an IRP process, and a power market with more intermittent resources requires ongoing enhancements to modeling approaches and new performance metrics for portfolio evaluation. As a member of MISO, NIPSCO is not independently responsible for all elements of reliability, but must be prepared to meet changing market rules and standards. MISO has been studying the impacts of growing intermittent generation penetration in the market for the last several years through the RIIA3 initiative, which lays out the key emerging elements of reliability and serves as a useful framework for resource planning. The RIIA report defined three major focus areas for reliability, which are summarized along with other factors in Figure 2-2.
Figure 2-2: Reliability Elements from MISO’s Renewable Integration Impact Assessment
Consistent with the reliability elements identified by MISO, NIPSCO’s 2021 IRP has incorporated the following elements and enhancements:
An expanded view of resource adequacy to assess seasonal ( summer and winter) planning reserve margins and to evaluate changing ELCC credit for resources over time;
A broadened stochastic uncertainty analyses to incorporate hourly renewable generation uncertainty and its expected relationship with hourly MISO power prices;
3 MISO published a summary report in February, 2021, which can be accessed here: https://cdn.misoenergy.org/RIIA%20Summary%20Report520051.pdf
Resource Adequacy Energy Adequacy Operating Reliability
Definition:Having sufficient resources to reliably serve demand
Ability to provide energy in all operating hours continuously throughout the year
Ability to withstand unanticipated component losses or disturbances
Forward Planning Horizon: Year-ahead Day-ahead Real-time or Emergency
Reliability Factors:Reserve margin, ELCC and
energy durationDispatchability, energy market risk
exposureReal Time Balancing System
IRP Modeling Approach:
Portfolio development constraints, with ELCC and
seasonal accounting
Hourly dispatch analysis, including stochastic risk
Ancillary services analysis (regulation, reserves), with sub-hourly granularity;
additional technical reliability assessment
Northern Indiana Public Service Company LLC
15
A sub-hourly ancillary services analysis to assess the potential value for fast response resources such as CTs and energy storage and solar plus storage in the energy, regulation, and reserves markets over time;
An additional technical reliability assessment to evaluate resources and portfolios against key reliability standards and metrics that are unable to be quantified in the IRP’s core economic analysis; and
Incorporation of new scorecard metrics that develop reliability scores and assess broader perspectives of tail risk.
Flexibility and Adaptability of the Portfolio
A key element of NIPSCO’s 2018 IRP was flexibility. The preferred plan specifically incorporated expectations that NIPSCO would regularly evaluate new resource options, track technology change, and adapt to market rules and policy evolution. And NIPSCO’s implementation of its short-term action plan did exactly that by; (i) conducting an additional set of RFPs to secure additional projects beyond those selected in 2018; (ii) adjusting NIPSCO’s procurement strategy to integrate storage into certain solar projects; and (iii) evolving the analytical tools used in IRP studies to incorporate broader risks and market considerations in the 2020 portfolio analysis and now in this 2021 IRP.
The 2021 IRP has been structured around these same principles in the following ways:
NIPSCO identified key regulatory developments early in the planning process to ensure market scenarios and portfolios were constructed to be flexible to imminent changes. These included:
o MISO’s RAN framework and the pending implementation of a seasonal capacity construct;
o In 2021, the Indiana General Assembly passed House Enrolled Act 1520, a three-year Forward Looking Resource Adequacy Requirement
o MISO’s transition to an ELCC methodology to assess capacity credit for wind and solar resources over time and by season;
o FERC Order 2222, which enables DERs to participate fully in wholesale markets; and
o FERC Order 841, which requires ISOs such as MISO to establish a participation model for electric storage resources in energy, capacity, and ancillary services markets.
NIPSCO conducted RFP events to solicit actionable resource offers of all types and duration and specifically requested information on emerging technologies to understand likely technology trends in the coming decade;
Northern Indiana Public Service Company LLC
16
NIPSCO deployed a portfolio construction process that did not rely solely on least cost optimization, but assessed a wide range of strategies to understand tradeoffs and identify the attractiveness of different pathways under different states-of-the-world for commodity prices, environmental policy, and MISO market evolution.
Carbon Emissions and Environmental Policy
NIPSCO’s 2018 IRP laid out a plan to significantly reduce carbon emissions by 2030 through the retirement of its coal fleet and replacement with predominantly renewable resources. Meanwhile, federal energy and environmental policy proposals have outlined several means of achieving ambitious carbon emission reductions from the power sector through a number of mechanisms, including extension of tax credits, a clean energy standard, and programs to provide grants or impose penalties on utilities based on their future clean energy expansion plans. Given NIPSCO’s desire to use the 2021 IRP to assess a range of environmental policy futures and a range of potential portfolio strategies, the following considerations have been made:
Expansion of NIPSCO’s IRP planning scenarios to incorporate a range of environmental policy outcomes, including two distinct net-zero emission constructs: one based on the implementation of a carbon tax or cap-and-trade mechanism and one based on the implementation of a series of policy incentives and clean energy standard mechanisms.
Development of net-zero portfolio concepts for NIPSCO that incorporate long-term options to retire or retrofit all fossil resources in the portfolio.
Scorecard Definition
With these key planning questions and themes identified, NIPSCO worked to define a series of scorecard objectives and indicators against which to measure portfolio options. The scorecard is a means of reporting key metrics for different portfolio options to transparently review tradeoffs and relative performance. It does not produce a single score or ranking of portfolios, but serves as a tool to facilitate decision-making
For its 2021 IRP scorecard, NIPSCO identified five major planning objectives and multiple metrics within nine key indicator categories, as summarized in Figure 2-3. The objectives include Affordability; Rate Stability; Environmental Sustainability; Reliable, Flexible, and Resilient Supply; and Positive Social and Economic Impacts. These are similar to those used in the 2018 IRP, with the following key modifications:
Based on stakeholder feedback, the Rate Stability objective was expanded to assess different measures of cost risk and a new measure for lower cost opportunity.
The reliability-focused objective was refined to incorporate new measures of technical reliability and an additional review of economic opportunities in the sub-hourly ancillary services markets.
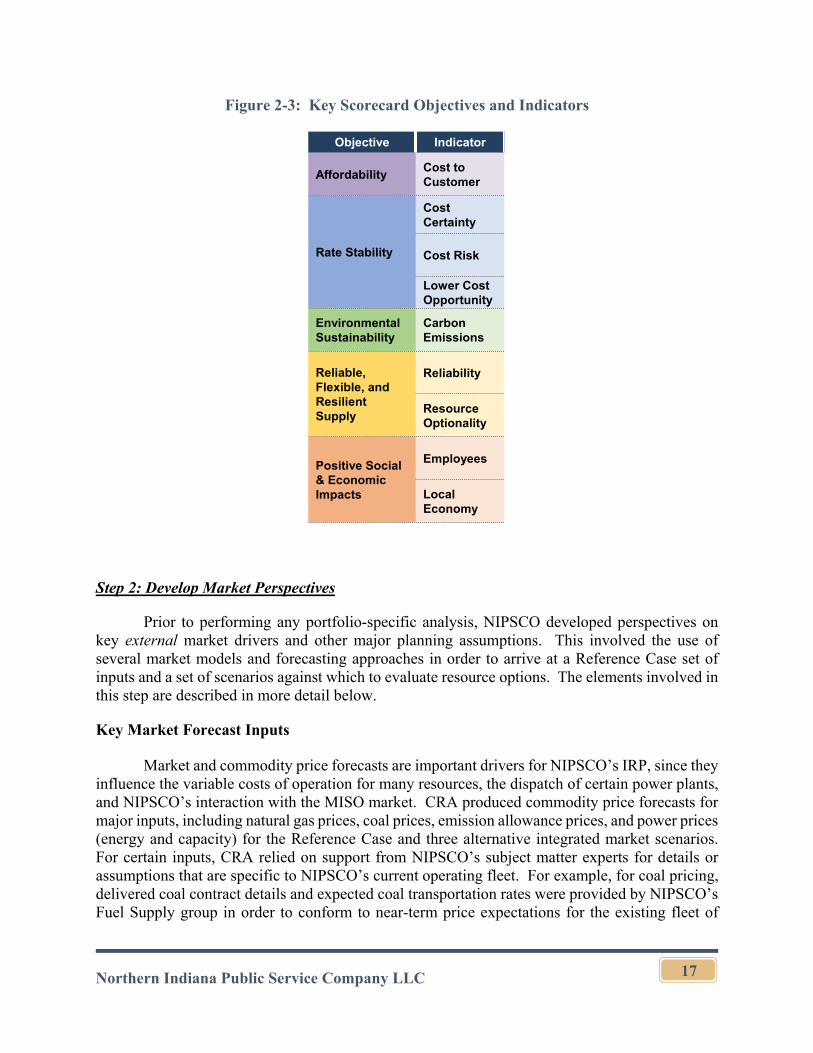
Northern Indiana Public Service Company LLC
17
Figure 2-3: Key Scorecard Objectives and Indicators
Step 2: Develop Market Perspectives
Prior to performing any portfolio-specific analysis, NIPSCO developed perspectives on key external market drivers and other major planning assumptions. This involved the use of several market models and forecasting approaches in order to arrive at a Reference Case set of inputs and a set of scenarios against which to evaluate resource options. The elements involved in this step are described in more detail below.
Key Market Forecast Inputs
Market and commodity price forecasts are important drivers for NIPSCO’s IRP, since they influence the variable costs of operation for many resources, the dispatch of certain power plants, and NIPSCO’s interaction with the MISO market. CRA produced commodity price forecasts for major inputs, including natural gas prices, coal prices, emission allowance prices, and power prices (energy and capacity) for the Reference Case and three alternative integrated market scenarios. For certain inputs, CRA relied on support from NIPSCO’s subject matter experts for details or assumptions that are specific to NIPSCO’s current operating fleet. For example, for coal pricing, delivered coal contract details and expected coal transportation rates were provided by NIPSCO’s Fuel Supply group in order to conform to near-term price expectations for the existing fleet of
Objective Indicator
AffordabilityCost to Customer
Rate Stability
Cost Certainty
Cost Risk
Lower Cost Opportunity
Environmental Sustainability
Carbon Emissions
Reliable, Flexible, and Resilient Supply
Reliability
Resource Optionality
Positive Social & Economic Impacts
Employees
Local Economy
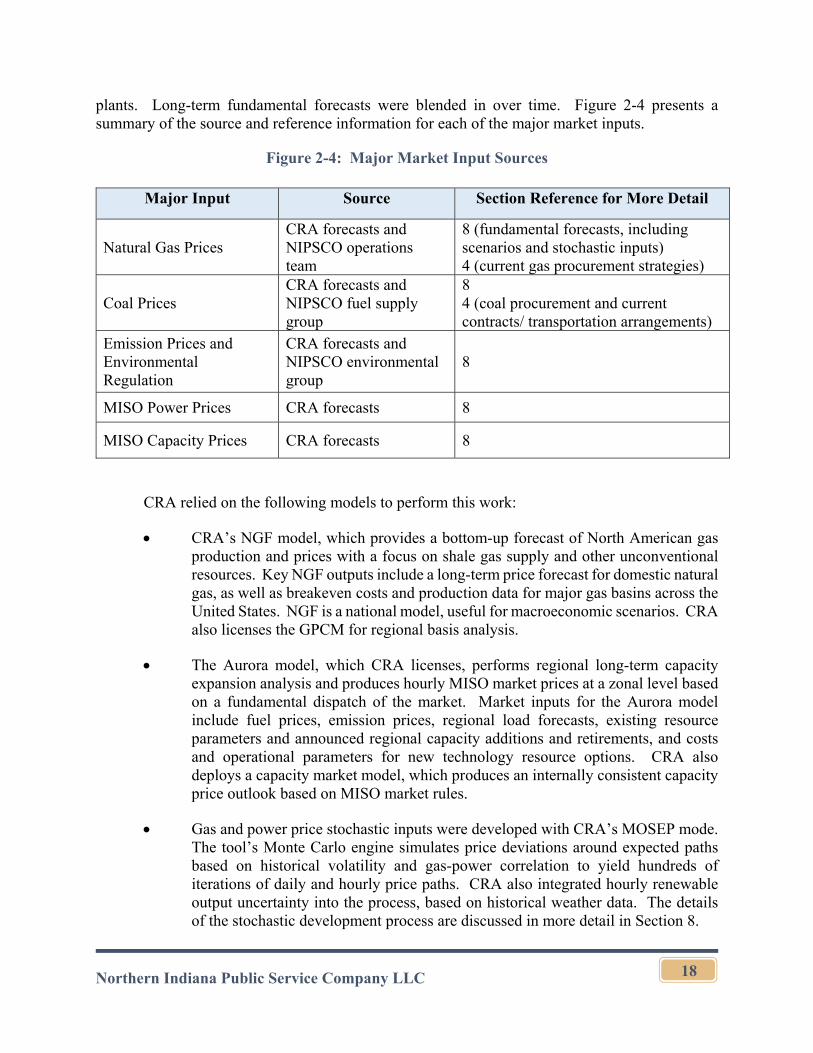
Northern Indiana Public Service Company LLC
18
plants. Long-term fundamental forecasts were blended in over time. Figure 2-4 presents a summary of the source and reference information for each of the major market inputs.
Figure 2-4: Major Market Input Sources
Major Input Source Section Reference for More Detail
Natural Gas Prices CRA forecasts and NIPSCO operations team
8 (fundamental forecasts, including scenarios and stochastic inputs) 4 (current gas procurement strategies)
Coal Prices CRA forecasts and NIPSCO fuel supply group
8 4 (coal procurement and current contracts/ transportation arrangements)
Emission Prices and Environmental Regulation
CRA forecasts and NIPSCO environmental group
8
MISO Power Prices CRA forecasts 8
MISO Capacity Prices CRA forecasts 8
CRA relied on the following models to perform this work:
CRA’s NGF model, which provides a bottom-up forecast of North American gas production and prices with a focus on shale gas supply and other unconventional resources. Key NGF outputs include a long-term price forecast for domestic natural gas, as well as breakeven costs and production data for major gas basins across the United States. NGF is a national model, useful for macroeconomic scenarios. CRA also licenses the GPCM for regional basis analysis.
The Aurora model, which CRA licenses, performs regional long-term capacity expansion analysis and produces hourly MISO market prices at a zonal level based on a fundamental dispatch of the market. Market inputs for the Aurora model include fuel prices, emission prices, regional load forecasts, existing resource parameters and announced regional capacity additions and retirements, and costs and operational parameters for new technology resource options. CRA also deploys a capacity market model, which produces an internally consistent capacity price outlook based on MISO market rules.
Gas and power price stochastic inputs were developed with CRA’s MOSEP mode. The tool’s Monte Carlo engine simulates price deviations around expected paths based on historical volatility and gas-power correlation to yield hundreds of iterations of daily and hourly price paths. CRA also integrated hourly renewable output uncertainty into the process, based on historical weather data. The details of the stochastic development process are discussed in more detail in Section 8.
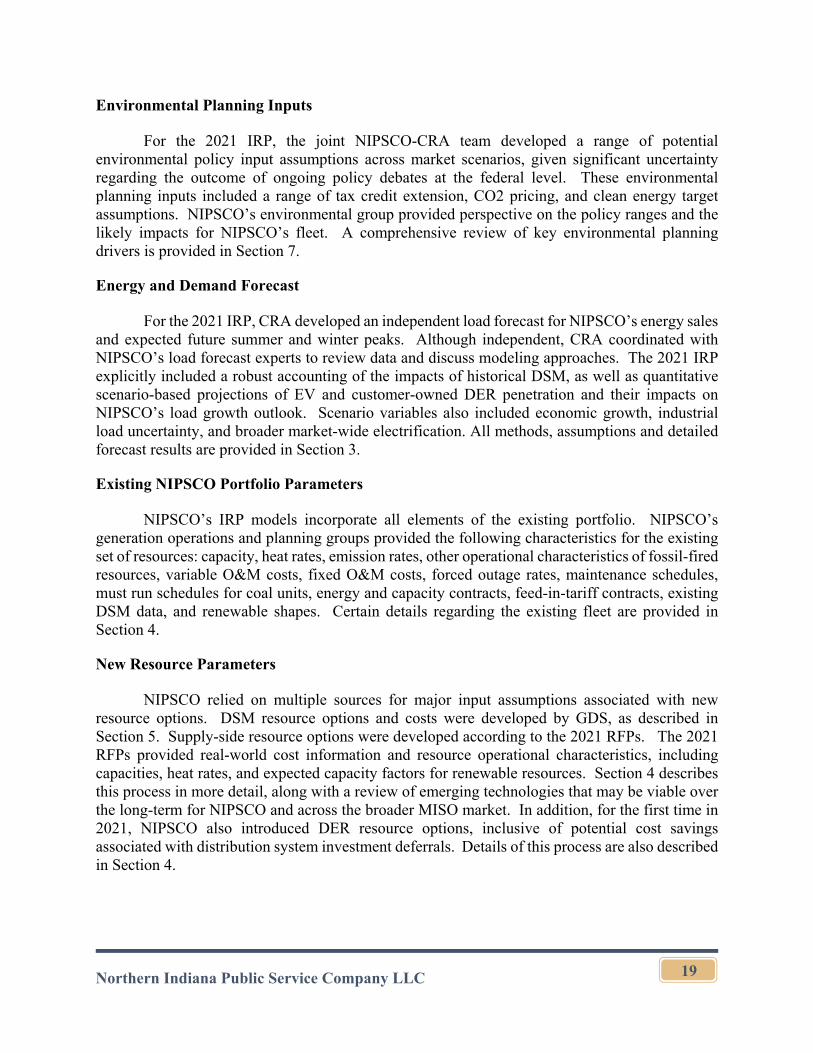
Northern Indiana Public Service Company LLC
19
Environmental Planning Inputs
For the 2021 IRP, the joint NIPSCO-CRA team developed a range of potential environmental policy input assumptions across market scenarios, given significant uncertainty regarding the outcome of ongoing policy debates at the federal level. These environmental planning inputs included a range of tax credit extension, CO2 pricing, and clean energy target assumptions. NIPSCO’s environmental group provided perspective on the policy ranges and the likely impacts for NIPSCO’s fleet. A comprehensive review of key environmental planning drivers is provided in Section 7.
Energy and Demand Forecast
For the 2021 IRP, CRA developed an independent load forecast for NIPSCO’s energy sales and expected future summer and winter peaks. Although independent, CRA coordinated with NIPSCO’s load forecast experts to review data and discuss modeling approaches. The 2021 IRP explicitly included a robust accounting of the impacts of historical DSM, as well as quantitative scenario-based projections of EV and customer-owned DER penetration and their impacts on NIPSCO’s load growth outlook. Scenario variables also included economic growth, industrial load uncertainty, and broader market-wide electrification. All methods, assumptions and detailed forecast results are provided in Section 3.
Existing NIPSCO Portfolio Parameters
NIPSCO’s IRP models incorporate all elements of the existing portfolio. NIPSCO’s generation operations and planning groups provided the following characteristics for the existing set of resources: capacity, heat rates, emission rates, other operational characteristics of fossil-fired resources, variable O&M costs, fixed O&M costs, forced outage rates, maintenance schedules, must run schedules for coal units, energy and capacity contracts, feed-in-tariff contracts, existing DSM data, and renewable shapes. Certain details regarding the existing fleet are provided in Section 4.
New Resource Parameters
NIPSCO relied on multiple sources for major input assumptions associated with new resource options. DSM resource options and costs were developed by GDS, as described in Section 5. Supply-side resource options were developed according to the 2021 RFPs. The 2021 RFPs provided real-world cost information and resource operational characteristics, including capacities, heat rates, and expected capacity factors for renewable resources. Section 4 describes this process in more detail, along with a review of emerging technologies that may be viable over the long-term for NIPSCO and across the broader MISO market. In addition, for the first time in 2021, NIPSCO also introduced DER resource options, inclusive of potential cost savings associated with distribution system investment deferrals. Details of this process are also described in Section 4.
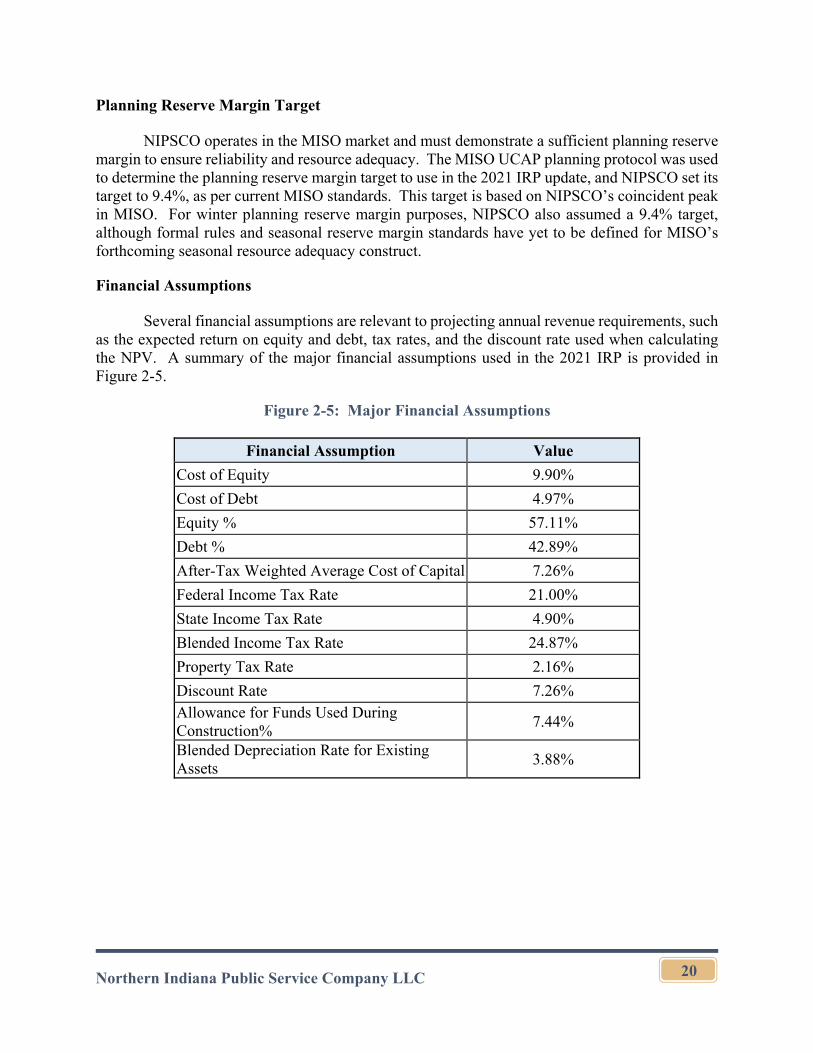
Northern Indiana Public Service Company LLC
20
Planning Reserve Margin Target
NIPSCO operates in the MISO market and must demonstrate a sufficient planning reserve margin to ensure reliability and resource adequacy. The MISO UCAP planning protocol was used to determine the planning reserve margin target to use in the 2021 IRP update, and NIPSCO set its target to 9.4%, as per current MISO standards. This target is based on NIPSCO’s coincident peak in MISO. For winter planning reserve margin purposes, NIPSCO also assumed a 9.4% target, although formal rules and seasonal reserve margin standards have yet to be defined for MISO’s forthcoming seasonal resource adequacy construct.
Financial Assumptions
Several financial assumptions are relevant to projecting annual revenue requirements, such as the expected return on equity and debt, tax rates, and the discount rate used when calculating the NPV. A summary of the major financial assumptions used in the 2021 IRP is provided in Figure 2-5.
Figure 2-5: Major Financial Assumptions
Financial Assumption Value
Cost of Equity 9.90%
Cost of Debt 4.97%
Equity % 57.11%
Debt % 42.89%
After-Tax Weighted Average Cost of Capital 7.26%
Federal Income Tax Rate 21.00%
State Income Tax Rate 4.90%
Blended Income Tax Rate 24.87%
Property Tax Rate 2.16%
Discount Rate 7.26% Allowance for Funds Used During Construction%
7.44%
Blended Depreciation Rate for Existing Assets
3.88%
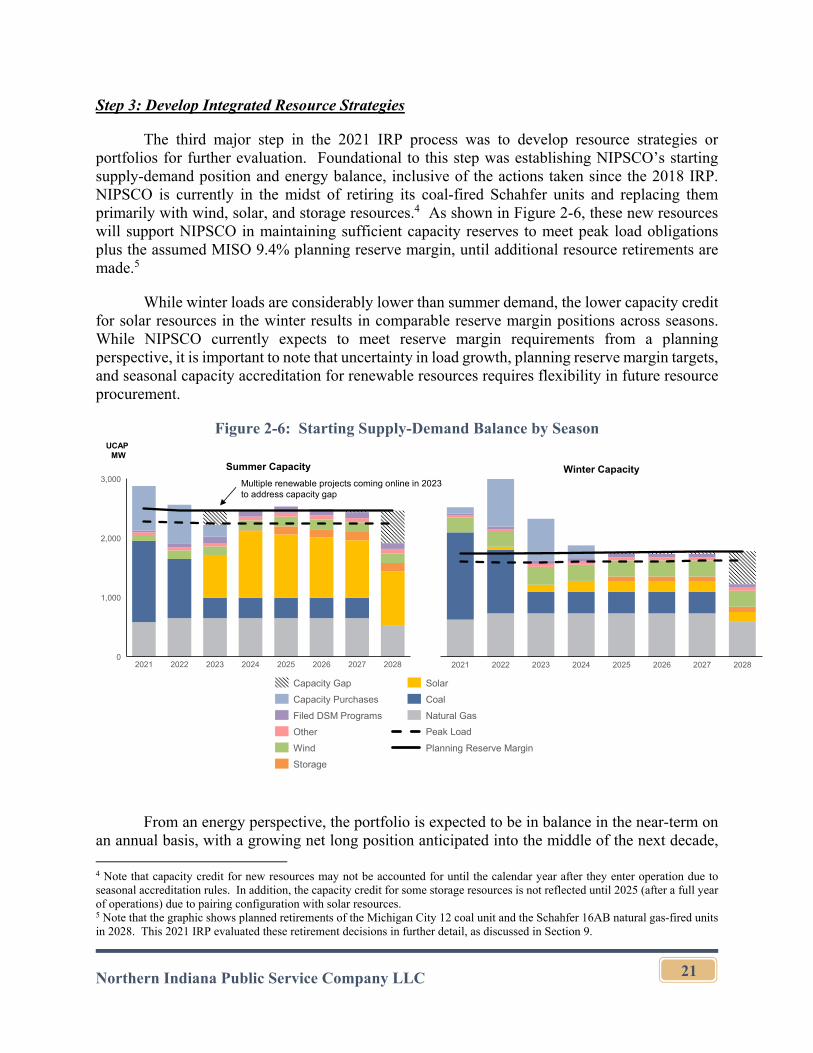
Northern Indiana Public Service Company LLC
21
Step 3: Develop Integrated Resource Strategies
The third major step in the 2021 IRP process was to develop resource strategies or portfolios for further evaluation. Foundational to this step was establishing NIPSCO’s starting supply-demand position and energy balance, inclusive of the actions taken since the 2018 IRP. NIPSCO is currently in the midst of retiring its coal-fired Schahfer units and replacing them primarily with wind, solar, and storage resources.4 As shown in Figure 2-6, these new resources will support NIPSCO in maintaining sufficient capacity reserves to meet peak load obligations plus the assumed MISO 9.4% planning reserve margin, until additional resource retirements are made.5
While winter loads are considerably lower than summer demand, the lower capacity credit for solar resources in the winter results in comparable reserve margin positions across seasons. While NIPSCO currently expects to meet reserve margin requirements from a planning perspective, it is important to note that uncertainty in load growth, planning reserve margin targets, and seasonal capacity accreditation for renewable resources requires flexibility in future resource procurement.
Figure 2-6: Starting Supply-Demand Balance by Season
From an energy perspective, the portfolio is expected to be in balance in the near-term on an annual basis, with a growing net long position anticipated into the middle of the next decade, 4 Note that capacity credit for new resources may not be accounted for until the calendar year after they enter operation due to seasonal accreditation rules. In addition, the capacity credit for some storage resources is not reflected until 2025 (after a full year of operations) due to pairing configuration with solar resources. 5 Note that the graphic shows planned retirements of the Michigan City 12 coal unit and the Schahfer 16AB natural gas-fired units in 2028. This 2021 IRP evaluated these retirement decisions in further detail, as discussed in Section 9.
1,000
0
2,000
3,000
202420232021 2022 2025 2026 2027 2028
Summer Capacity
20282021 2022 20262023 2024 2025 2027
Winter Capacity
UCAP MW
Multiple renewable projects coming online in 2023 to address capacity gap
Capacity Purchases
Capacity Gap
Wind
Other
Filed DSM Programs
Storage
Solar
Coal
Natural Gas
Peak Load
Planning Reserve Margin
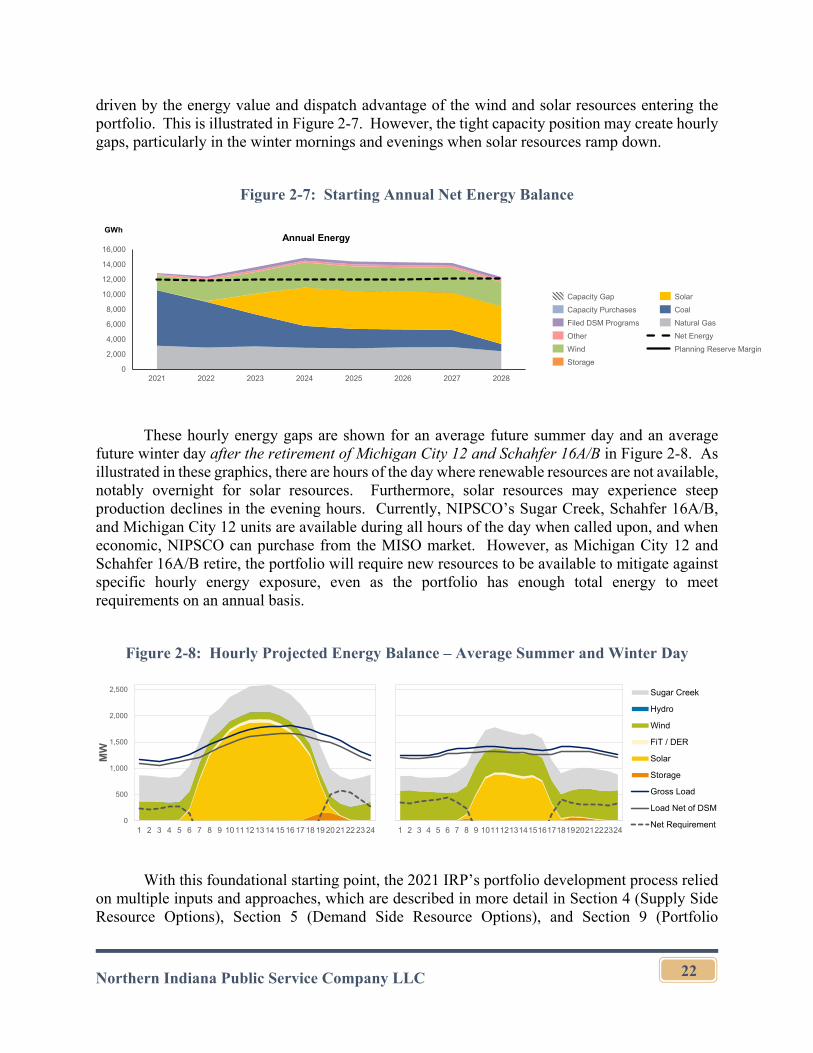
Northern Indiana Public Service Company LLC
22
driven by the energy value and dispatch advantage of the wind and solar resources entering the portfolio. This is illustrated in Figure 2-7. However, the tight capacity position may create hourly gaps, particularly in the winter mornings and evenings when solar resources ramp down.
Figure 2-7: Starting Annual Net Energy Balance
These hourly energy gaps are shown for an average future summer day and an average
future winter day after the retirement of Michigan City 12 and Schahfer 16A/B in Figure 2-8. As illustrated in these graphics, there are hours of the day where renewable resources are not available, notably overnight for solar resources. Furthermore, solar resources may experience steep production declines in the evening hours. Currently, NIPSCO’s Sugar Creek, Schahfer 16A/B, and Michigan City 12 units are available during all hours of the day when called upon, and when economic, NIPSCO can purchase from the MISO market. However, as Michigan City 12 and Schahfer 16A/B retire, the portfolio will require new resources to be available to mitigate against specific hourly energy exposure, even as the portfolio has enough total energy to meet requirements on an annual basis.
Figure 2-8: Hourly Projected Energy Balance – Average Summer and Winter Day
With this foundational starting point, the 2021 IRP’s portfolio development process relied on multiple inputs and approaches, which are described in more detail in Section 4 (Supply Side Resource Options), Section 5 (Demand Side Resource Options), and Section 9 (Portfolio
Capacity Purchases
Capacity Gap
Wind
Other
Filed DSM Programs
Storage
Solar
Coal
Natural Gas
Net Energy
Planning Reserve Margin
Annual EnergyGWh
0
2,000
4,000
6,000
8,000
10,000
12,000
14,000
16,000
2021 2022 2023 2024 2025 2026 2027 2028
Steep ramping needs
0
500
1,000
1,500
2,000
2,500
1 2 3 4 5 6 7 8 9 10 11 12 13 14 15 16 17 18 19 20 21 22 23 24
MW
1 2 3 4 5 6 7 8 9 101112131415161718192021222324
Sugar Creek
Hydro
Wind
FiT / DER
Solar
Storage
Gross Load
Load Net of DSM
Net Requirement
Northern Indiana Public Service Company LLC
23
Analysis). In the context of the major themes identified in step one and the starting supply-demand balance noted above, NIPSCO believes that the dynamic planning environment requires an advanced two-stage portfolio development approach to first assess the existing fleet and to then evaluate replacement options, rather than a traditional approach that relies solely on the deployment of single least cost optimization runs. While portfolio optimization analysis for both supply side and demand side resources with the Aurora model’s portfolio optimization tool was a critical part of the portfolio development process, NIPSCO’s approach to portfolio construction does not rely solely on this one framework. This is due to three major considerations:
Retirement analyses are difficult to perform in standard least cost optimization planning models, since capital and maintenance budgets vary based on expected end-of-life date. Most optimization frameworks are not set up to dynamically adjust current and future budgets in a single optimization pass, so NIPSCO evaluates the economic implications of various retirement concepts independently, with least cost optimization techniques used to identify replacement resource options for each existing fleet pathways.
Least cost is not the only metric in NIPSCO’s integrated scorecard, so determining portfolios solely through least cost optimization runs could fail to evaluate portfolios that are lower risk or provide other valuable attributes for customers (including environmental sustainability, reliability, or positive social and economic impacts). For example, in the 2021 IRP, NIPSCO has explicitly evaluated the costs of net zero carbon emission concepts and has assessed a range of different replacement themes with different reliability attributes. Such portfolios would not be feasibly identified or evaluated through single-round optimization runs.
The approach supports transparency of results. If NIPSCO were to rely solely on optimized portfolios, it would be difficult to evaluate how much higher cost other options might be, leaving stakeholders a limited set of outputs to review, particularly if unable to perform optimization simulations on their own. Overall, NIPSCO’s approach in this 2021 IRP has allowed for the evaluation of 17 different portfolio concepts to transparently present the landscape of future options.
Step 4: Portfolio Modeling
After detailed portfolios were constructed, each of them was evaluated in CRA’s suite of resource planning tools, namely Aurora and a utility financial model known as PERFORM. The Aurora model performs an hourly, chronological dispatch of NIPSCO’s portfolio within the MISO power market, accounting for all variable costs of operation, all contracts or PPAs, and all economic purchases and sales with the surrounding market. Aurora produces projections of asset-level dispatch and the total variable costs associated with serving load. It also produces estimates for other key metrics, such as carbon dioxide emissions over time and capacity and generation by fuel type. CRA also deployed its ESOP model to evaluate sub-hourly energy and ancillary services value, as described in more detail in Section 8.

Northern Indiana Public Service Company LLC
24
The Aurora output is then used by CRA’s PERFORM model to build a full annual revenue requirement, inclusive of capital investments, fixed operating and maintenance costs, and financial accounting of depreciation, taxes, and utility return on investment. The PERFORM model produces annual and net present value estimates of revenue requirements. The full set of portfolio modeling is undertaken for all portfolio options for the Reference Case, each individual integrated market scenario, and a full stochastic distribution of potential outcomes associated with select commodity prices and hourly renewable generation.
Step 5: Evaluate Tradeoffs and Produce Recommendations
The final step in NIPSCO’s IRP process is to evaluate the various portfolios with an integrated scorecard and produce recommendations for a preferred plan. As discussed in Step 1, NIPSCO identified several planning objectives for its scorecard. In this step, metrics were recorded against all key planning criteria, and tradeoffs were evaluated. Ultimately, NIPSCO management is responsible for selecting the preferred portfolio based on an assessment of all options and scorecard metrics. This process and the preferred portfolio selection is described in Section 9.
Northern Indiana Public Service Company LLC
25
Section 3. Energy and Demand Forecast
3.1 Introduction and Major Highlights of the Forecast
This section provides an overview of NIPSCO’s load forecast. For the 2021 IRP, NIPSCO expanded its relationship with CRA to produce a load forecast by customer class, including residential, commercial, small industrial and large industrial customers.6 This entailed an econometric core load forecast, plus projections for EV and DER penetration throughout the service territory. Major highlights of the forecast include:
NIPSCO’s energy sales are projected to grow at a CAGR of approximately 0.2% over the next 20 years. Summer peak load is projected to decline at a CAGR of 0.2%, while winter peak load is projected to increase at a CAGR of 0.2%.
Residential and commercial customer counts are projected to grow at CAGRs of 0.5% and 0.8%, respectively, with the small industrial customer count projected to grow at a rate of 0.3% per year. Residential and commercial sales are projected to grow at slower rates than customer counts, while small industrial and large firm industrial sales are projected to decline.
EV growth has the potential to add between approximately 150 to 1,000 GWh to the sales forecast and between 10 and 80 MW to peak load.
Customer-owned DERs have the potential to reduce the sales forecast by approximately 125 to 450 GWh, while reducing summer peak load by between approximately 40 and 160 MW and winter peak load by up to 100 MW.
NIPSCO’s scenario analysis provides a broad range of potential load growth outcomes based on uncertainty regarding future economic growth, EV and DER penetration, other electrification, and potential industrial load migration.
3.2 Forecasting Methodology Overview
For the 2021 IRP, NIPSCO has made several enhancements to its load forecasting methodology, which are discussed in detail in this section. The overall load forecasting methodology includes five key steps, which are illustrated in Figure 3-1 and described as follows:
Data Gathering: Compilation of historical data, including historical energy consumption and number of customers by class, historical demand side management program impacts, Moody’s macroeconomic variables (such as state-level data on number of households, employment, and personal income), and
6 Additionally, railroad, street lighting, public authority and company use energy forecasts are incorporated in the total energy forecast. However, the load forecast for these customer classes has been projected using a simple moving average assumption based on historical data, rather than a regression estimation method.
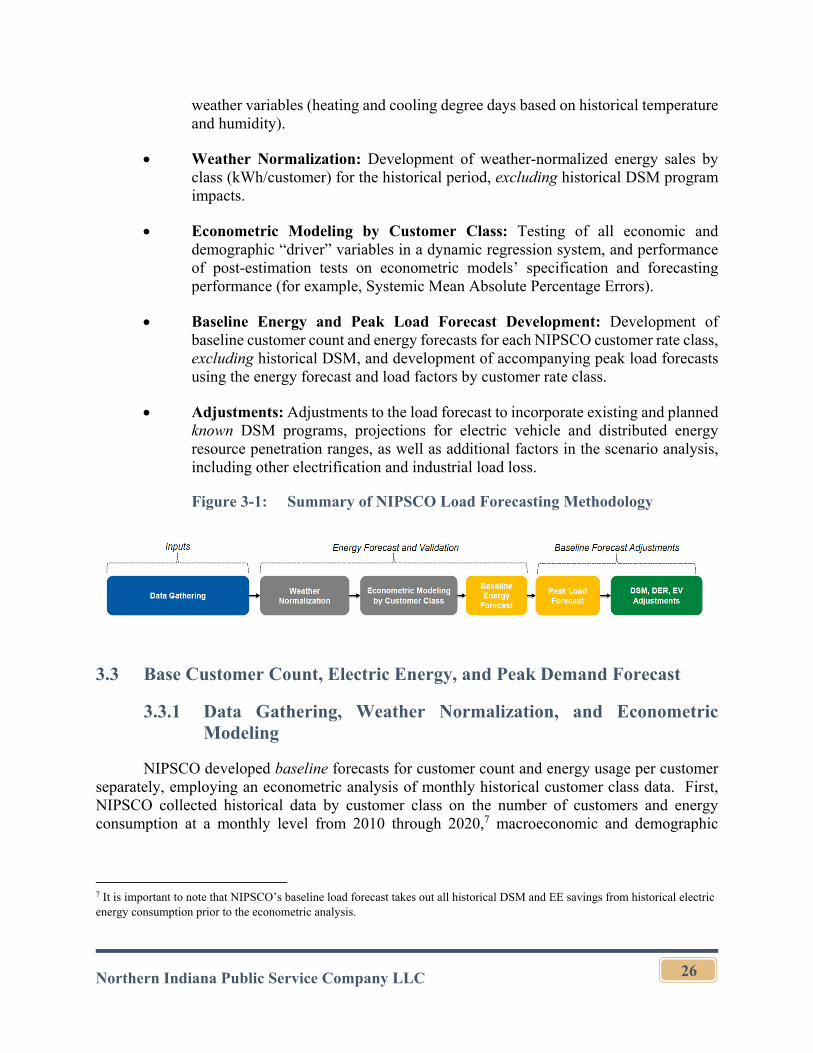
Northern Indiana Public Service Company LLC
26
weather variables (heating and cooling degree days based on historical temperature and humidity).
Weather Normalization: Development of weather-normalized energy sales by class (kWh/customer) for the historical period, excluding historical DSM program impacts.
Econometric Modeling by Customer Class: Testing of all economic and demographic “driver” variables in a dynamic regression system, and performance of post-estimation tests on econometric models’ specification and forecasting performance (for example, Systemic Mean Absolute Percentage Errors).
Baseline Energy and Peak Load Forecast Development: Development of baseline customer count and energy forecasts for each NIPSCO customer rate class, excluding historical DSM, and development of accompanying peak load forecasts using the energy forecast and load factors by customer rate class.
Adjustments: Adjustments to the load forecast to incorporate existing and planned known DSM programs, projections for electric vehicle and distributed energy resource penetration ranges, as well as additional factors in the scenario analysis, including other electrification and industrial load loss.
Figure 3-1: Summary of NIPSCO Load Forecasting Methodology
3.3 Base Customer Count, Electric Energy, and Peak Demand Forecast
3.3.1 Data Gathering, Weather Normalization, and Econometric Modeling
NIPSCO developed baseline forecasts for customer count and energy usage per customer separately, employing an econometric analysis of monthly historical customer class data. First, NIPSCO collected historical data by customer class on the number of customers and energy consumption at a monthly level from 2010 through 2020,7 macroeconomic and demographic
7 It is important to note that NIPSCO’s baseline load forecast takes out all historical DSM and EE savings from historical electric energy consumption prior to the econometric analysis.
Northern Indiana Public Service Company LLC
27
indicators for the region from Moody’s Analytics,8 weather data (heating and cooling degree days based on historical temperature and humidity) from the National Oceanic and Atmospheric Administration, and information regarding NIPSCO’s historical DSM and EE program savings.
After constructing datasets for each customer class, NIPSCO developed econometric regression models for forecasting the number of customers for each customer class, controlling for key drivers. These key variables are regional economic and demographic factors, including household counts (for residential and commercial) and employment in the manufacturing sector (for industrial) and dummy variables that control for seasonal and annual impacts. Specifically, the following variables were used in the development of the customer count model:
The number of households is the key variable used to forecast residential and commercial customer count.9
For the small industrial sector forecast, regional historical employment in the manufacturing sector is used as the key variable.10
Finally, dummy variables control for factors that cannot be controlled with any other variable in regression equations that is not associated with regional economic or demographic factors, such as monthly seasonality.
A representation of the estimated regression model for the customer count forecast is presented in Equation 3-1.
Equation 3-1: Regression Equation for Customer Count Forecast
b b X b θ
Where =customer class (residential, commercial and small industrial) = month
= constant term number of customers in a given customer class i in month t
= Macroeconomic variable (e.g., number of households for residential and commercial classes in a given month i)
8 Note that the final IRP load forecast was based on economic data from Moody’s as of April, 2021. NIPSCO presented preliminary load forecasts based on earlier vintage Moody’s data in its first public stakeholder meeting in March, 2021. Therefore, very minor differences in customer count and load growth rates are present in the final numbers relative to the preliminary data that was initially reviewed in the first stakeholder meeting. 9 The expected coefficient on the number of households variable is positive for both residential and commercial customer classes suggesting that an increase in the number of households is associated with an increase in the number of residential and commercial customers in NIPSCO territory. 10 The expected coefficient on the manufacturing employment variable is positive for the small industrial customer class, suggesting that an increase in employment in manufacturing is associated with an increase in the number of small industrial customer count in NIPSCO territory.
Northern Indiana Public Service Company LLC
28
, , . . = Estimated coefficients (slopes) for each variable included in the regression model.
= time dummies
= random error term
Similarly, NIPSCO developed econometric regression models for predicting energy sales11 for each customer class that would control for key drivers for energy consumption including weather and regional economic and demographic drivers. Specifically, key variables for the residential, commercial and small industrial class regression equations included the average class-specific monthly retail rate, heating and cooling degree days, real personal income (for residential), employment in the manufacturing sector (for commercial and small industrial), and dummy variables that control for seasonal impacts on energy consumption. The following variables were used in the development of the electric energy sales per customer model:
The average retail rate controls for the impact of the cost of electric energy on the amount of electricity consumption in each customer class.12
Heating and cooling degree day variables control for the impact of weather on electricity consumption. Particularly, residential and commercial sectors are responsive to outside temperature because a significant portion of electricity consumption is used for air conditioning, and to a lesser extent space heating, for these two customer classes.13
Demographic variables (i.e., real personal income and employment in the manufacturing sector) control for the impact of regional economic factors on electricity consumption.14
Dummy variables control for factors that cannot be controlled with any other variable in regression equations such as monthly seasonality that is not associated with weather.
11 The electric energy forecast is predicted for energy consumption per customer, which is the ratio of total energy consumption by total number of customers in a specific customer class in a given month (i.e., residential energy use per customer (MWh/customer) is calculated as total residential energy consumption (MWh) in a given month divided by the total number of residential customers in that month). 12 The expected coefficient on the average monthly retail rate variable is negative, suggesting that an increase in average retail rate is associated with a lower amount of electricity consumption. 13 The expected coefficients on heating degree days and cooling degree days suggest that (i) an increase in the number of heating degree days is associated with higher electricity consumption, specifically due to space heating; and (ii) an increase in the number of cooling degree days is associated with higher electricity consumption, specifically due to space cooling. 14 The expected coefficient on real personal income and employment in the manufacturing class is positive, suggesting that (i) an increase in regional real personal income is associated with higher electric energy consumption due to an increase in wealth (e.g., larger homes, increase in number of home appliances); and (ii) an increase in employment is associated with higher electric energy consumption due to an increase in commercial and industrial economic activity.
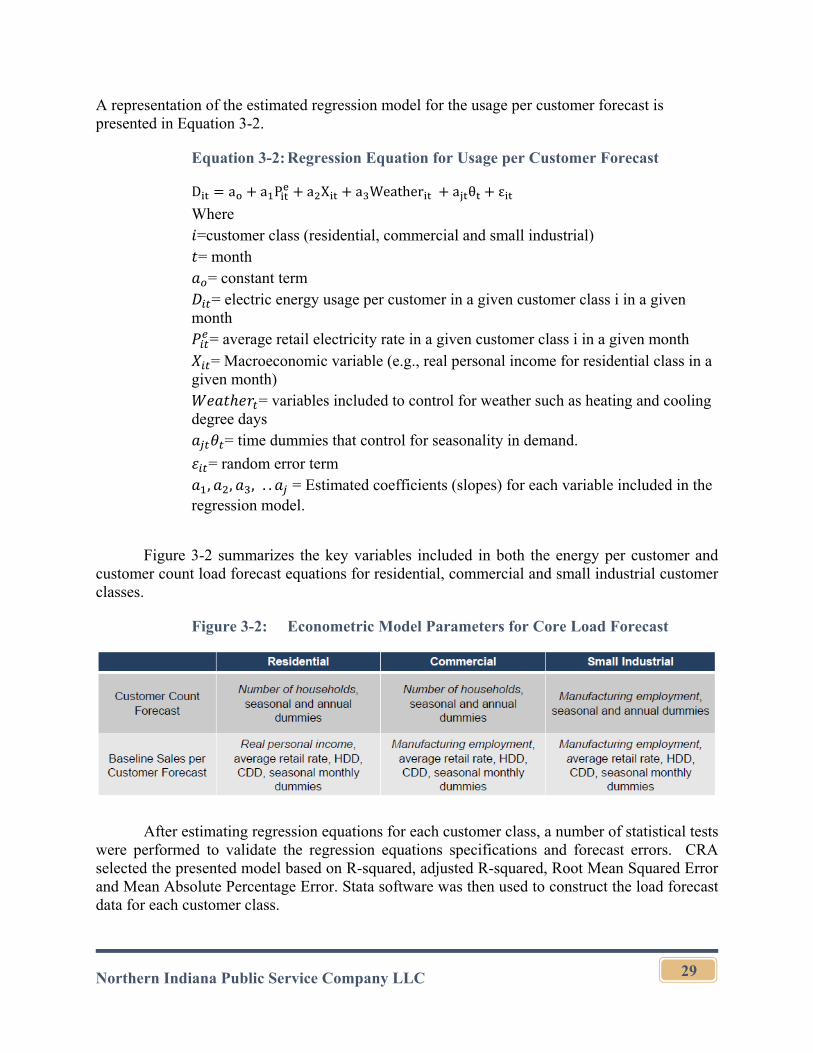
Northern Indiana Public Service Company LLC
29
A representation of the estimated regression model for the usage per customer forecast is presented in Equation 3-2.
Equation 3-2: Regression Equation for Usage per Customer Forecast
D a a P a X a Weather a θ ε
Where =customer class (residential, commercial and small industrial) = month
= constant term = electric energy usage per customer in a given customer class i in a given
month = average retail electricity rate in a given customer class i in a given month = Macroeconomic variable (e.g., real personal income for residential class in a
given month) = variables included to control for weather such as heating and cooling
degree days = time dummies that control for seasonality in demand.
= random error term , , , . . = Estimated coefficients (slopes) for each variable included in the
regression model.
Figure 3-2 summarizes the key variables included in both the energy per customer and customer count load forecast equations for residential, commercial and small industrial customer classes.
Figure 3-2: Econometric Model Parameters for Core Load Forecast
After estimating regression equations for each customer class, a number of statistical tests were performed to validate the regression equations specifications and forecast errors. CRA selected the presented model based on R-squared, adjusted R-squared, Root Mean Squared Error and Mean Absolute Percentage Error. Stata software was then used to construct the load forecast data for each customer class.
Northern Indiana Public Service Company LLC
30
3.3.2 New Industrial Service Structure
The 2021 IRP incorporates NIPSCO’s new industrial service tariff, known as Rate 831, and its subsequent impact on industrial load. This new industrial service tariff was included in the settlement agreement in Cause No. 45159, approved by the Commission in 2019 and it gives certain large industrial customers the option to secure their own energy and capacity needs. For IRP planning purposes, NIPSCO’s load forecast for the large industrial customer class includes Rate 832, Rate 833, and Rate 831 (Tier 1 energy only) customers.15
3.3.3 Customer Count Forecast
Historical customer count data indicates that approximately 87% of NIPSCO customers are residential class with a historical CAGR of 0.4% between 2010 and 2019. The commercial class makes up about 12% of NIPSCO customers, and the small industrial class makes up about 0.4% of NIPSCO customers. The CAGR between 2010 and 2019 for commercial and small industrial is 0.6% and minus 1.4%, respectively.
Figure 3-3 presents NIPSCO’s projected customer count for the Residential class, and Figure 3-4 presents NIPSCO’s projected customer count for the Commercial and Small Industrial customer classes (green line for commercial and blue line for small industrial).
The CAGR is also calculated for each customer class projection between 2021 and 2040 in order to provide an understanding on the future growth trends for NIPSCO’s customer count growth trends. NIPSCO’s forecast projects residential and commercial CAGRs of 0.5% and 0.8%, respectively. The small industrial customer class growth rate is projected to be slower, at 0.3% through 2040.
15 Note that hourly historical meter data for each individual industrial customer is analyzed when developing the load forecast for the large industrial customer class that NIPSCO services. The energy consumption of industrial customers under Tiers 2 and 3 on Rate 831 is excluded from the load forecast because this load is not served by NIPSCO.
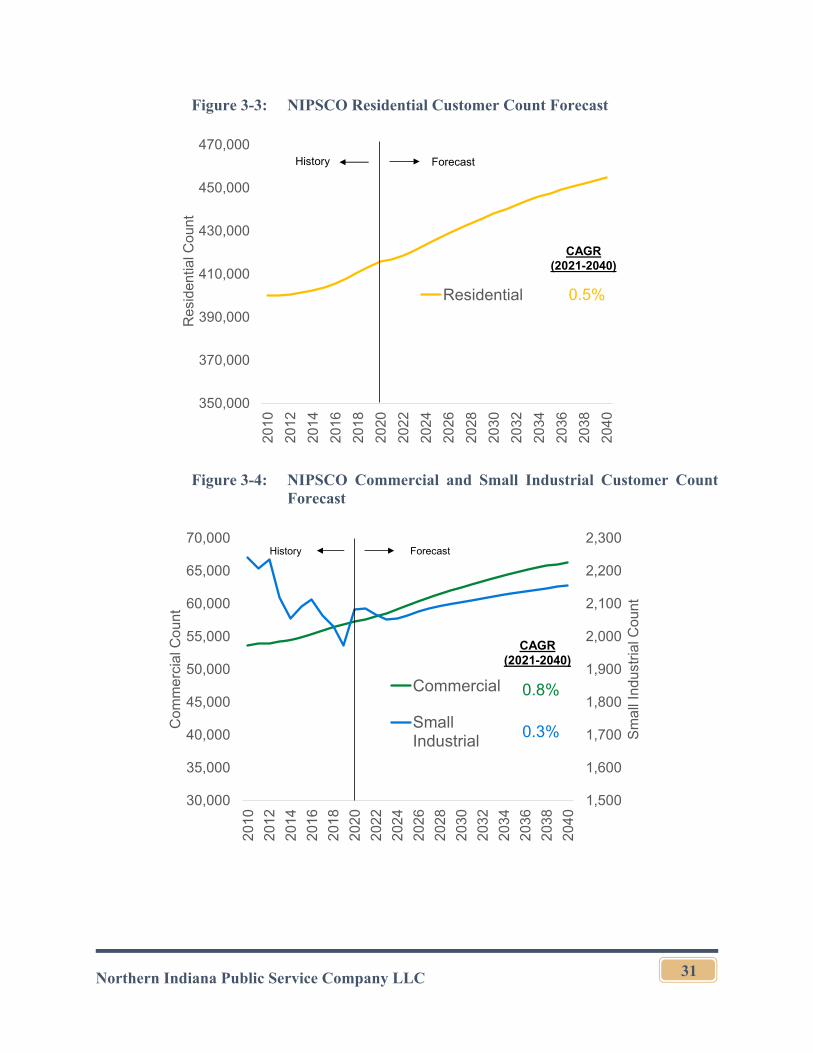
Northern Indiana Public Service Company LLC
31
Figure 3-3: NIPSCO Residential Customer Count Forecast
Figure 3-4: NIPSCO Commercial and Small Industrial Customer Count Forecast
350,000
370,000
390,000
410,000
430,000
450,000
470,000
2010
2012
2014
2016
2018
2020
2022
2024
2026
2028
2030
2032
2034
2036
2038
2040
Res
iden
tial C
ount
Residential
History Forecast
CAGR (2021-2040)
0.5%
1,500
1,600
1,700
1,800
1,900
2,000
2,100
2,200
2,300
30,000
35,000
40,000
45,000
50,000
55,000
60,000
65,000
70,000
201
0
201
2
201
4
201
6
201
8
202
0
202
2
202
4
202
6
202
8
203
0
203
2
203
4
203
6
203
8
204
0
Sm
all
Ind
ustr
ial C
ount
Com
me
rcia
l Co
unt
Commercial
SmallIndustrial
CAGR (2021-2040)
0.8%
0.3%
History Forecast
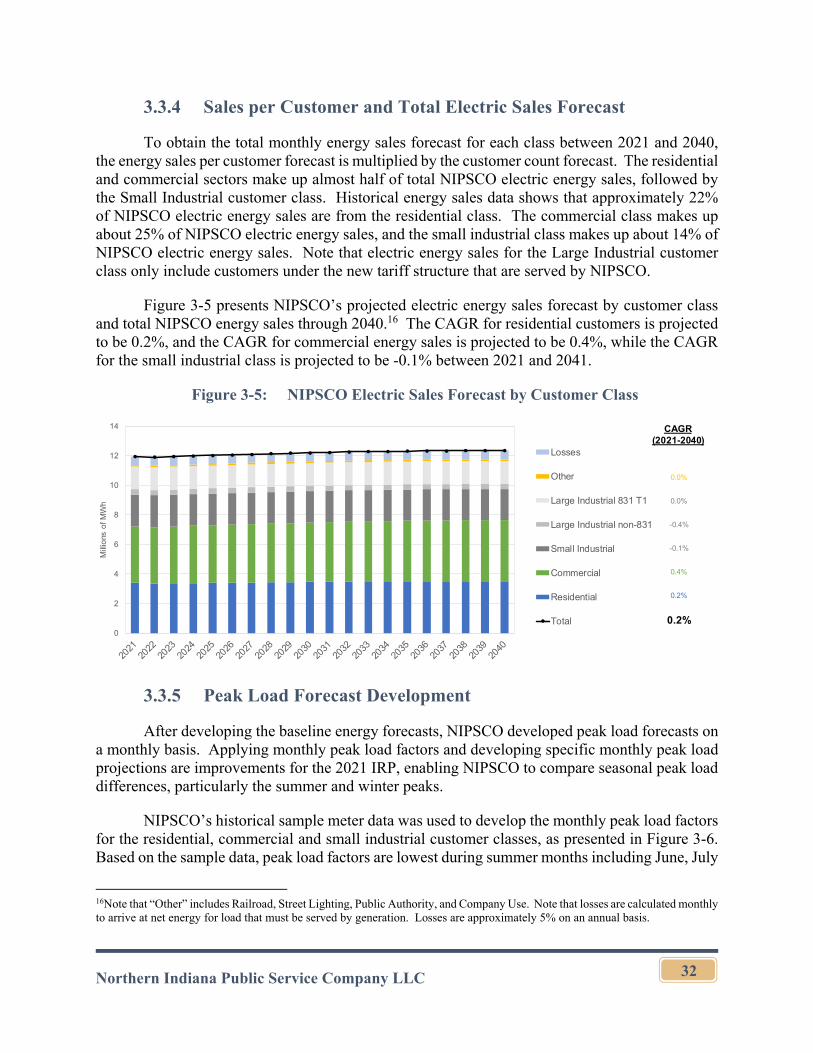
Northern Indiana Public Service Company LLC
32
3.3.4 Sales per Customer and Total Electric Sales Forecast
To obtain the total monthly energy sales forecast for each class between 2021 and 2040, the energy sales per customer forecast is multiplied by the customer count forecast. The residential and commercial sectors make up almost half of total NIPSCO electric energy sales, followed by the Small Industrial customer class. Historical energy sales data shows that approximately 22% of NIPSCO electric energy sales are from the residential class. The commercial class makes up about 25% of NIPSCO electric energy sales, and the small industrial class makes up about 14% of NIPSCO electric energy sales. Note that electric energy sales for the Large Industrial customer class only include customers under the new tariff structure that are served by NIPSCO.
Figure 3-5 presents NIPSCO’s projected electric energy sales forecast by customer class and total NIPSCO energy sales through 2040.16 The CAGR for residential customers is projected to be 0.2%, and the CAGR for commercial energy sales is projected to be 0.4%, while the CAGR for the small industrial class is projected to be -0.1% between 2021 and 2041.
Figure 3-5: NIPSCO Electric Sales Forecast by Customer Class
3.3.5 Peak Load Forecast Development
After developing the baseline energy forecasts, NIPSCO developed peak load forecasts on a monthly basis. Applying monthly peak load factors and developing specific monthly peak load projections are improvements for the 2021 IRP, enabling NIPSCO to compare seasonal peak load differences, particularly the summer and winter peaks.
NIPSCO’s historical sample meter data was used to develop the monthly peak load factors for the residential, commercial and small industrial customer classes, as presented in Figure 3-6. Based on the sample data, peak load factors are lowest during summer months including June, July
16Note that “Other” includes Railroad, Street Lighting, Public Authority, and Company Use. Note that losses are calculated monthly to arrive at net energy for load that must be served by generation. Losses are approximately 5% on an annual basis.
0.0%
0.0%
-0.4%
-0.1%
0.4%
0.2%
0.2%0
2
4
6
8
10
12
14
Mill
ions
of
MW
h
Losses
Other
Large Industrial 831 T1
Large Industrial non-831
Small Industrial
Commercial
Residential
Total
CAGR (2021-2040)
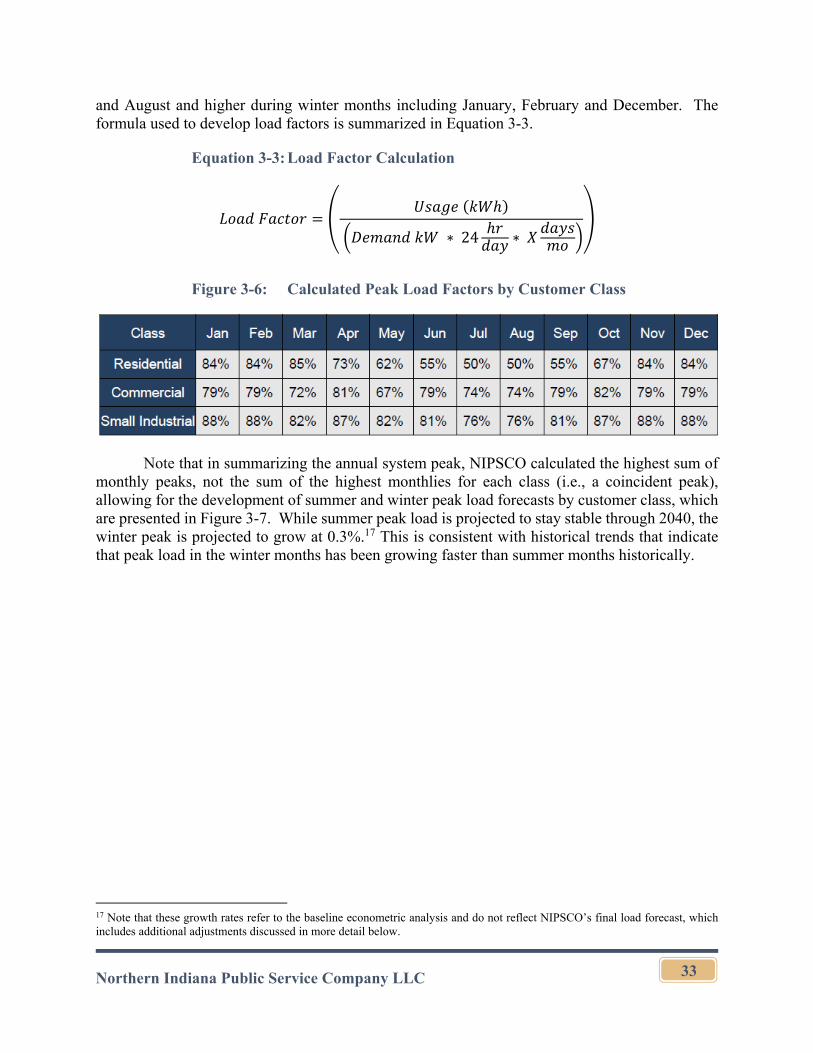
Northern Indiana Public Service Company LLC
33
and August and higher during winter months including January, February and December. The formula used to develop load factors is summarized in Equation 3-3.
Equation 3-3: Load Factor Calculation
∗ 24 ∗
Figure 3-6: Calculated Peak Load Factors by Customer Class
Note that in summarizing the annual system peak, NIPSCO calculated the highest sum of monthly peaks, not the sum of the highest monthlies for each class (i.e., a coincident peak), allowing for the development of summer and winter peak load forecasts by customer class, which are presented in Figure 3-7. While summer peak load is projected to stay stable through 2040, the winter peak is projected to grow at 0.3%.17 This is consistent with historical trends that indicate that peak load in the winter months has been growing faster than summer months historically.
17 Note that these growth rates refer to the baseline econometric analysis and do not reflect NIPSCO’s final load forecast, which includes additional adjustments discussed in more detail below.
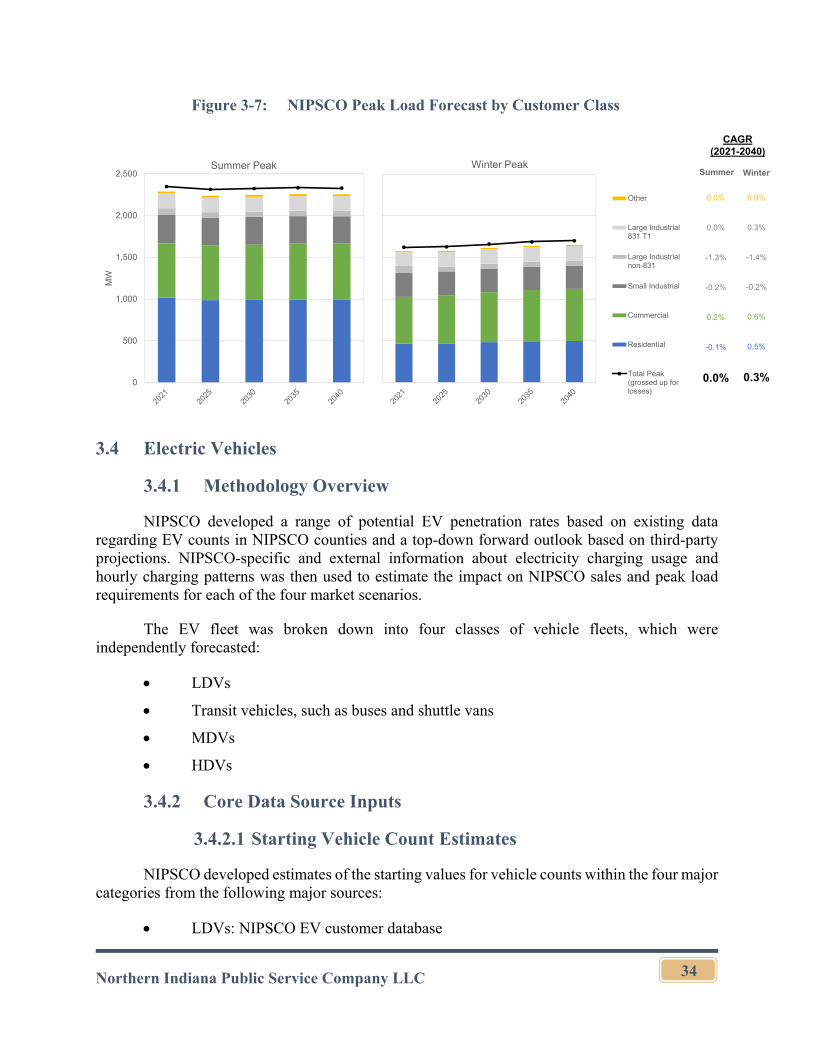
Northern Indiana Public Service Company LLC
34
Figure 3-7: NIPSCO Peak Load Forecast by Customer Class
3.4 Electric Vehicles
3.4.1 Methodology Overview
NIPSCO developed a range of potential EV penetration rates based on existing data regarding EV counts in NIPSCO counties and a top-down forward outlook based on third-party projections. NIPSCO-specific and external information about electricity charging usage and hourly charging patterns was then used to estimate the impact on NIPSCO sales and peak load requirements for each of the four market scenarios.
The EV fleet was broken down into four classes of vehicle fleets, which were independently forecasted:
LDVs
Transit vehicles, such as buses and shuttle vans
MDVs
HDVs
3.4.2 Core Data Source Inputs
3.4.2.1 Starting Vehicle Count Estimates
NIPSCO developed estimates of the starting values for vehicle counts within the four major categories from the following major sources:
LDVs: NIPSCO EV customer database
CAGR (2021-2040)
0.0%
0.3%
-1.4%
-0.2%
0.6%
0.5%
0.3%
0.0%
0.0%
-1.3%
-0.2%
0.2%
-0.1%
0.0%
WinterSummer
0
500
1,000
1,500
2,000
2,500
MW
Summer Peak Winter Peak
Other
Large Industrial831 T1
Large Industrialnon-831
Small Industrial
Commercial
Residential
Total Peak(grossed up forlosses)
Northern Indiana Public Service Company LLC
35
Transit/MDV/HDV: National Transit Database, with estimates for the total vehicle counts in NIPSCO’s territory
3.4.2.2 Vehicle Count Growth Rate Projections
To develop future projections for EV growth, NIPSCO largely relied on the EV forecasts for MISO LRZ 6 from the 2021 MTEP process. NIPSCO deduced EV sales CAGR from the three MTEP Futures scenarios and mapped them to Low, Medium, and High scenarios. These assumptions are provided in Table 3-1. NIPSCO also used public information from Bloomberg New Energy Finance for the heavy-duty vehicle sector.
Table 3-1: Electric Vehicle Sales CAGR by Scenario
2020-2024 2025-2029 2030-2034 2035-2040 Low 33% 15% 11% 11% Med 49% 21% 16% 15% High 59% 30% 21% 15%
To determine the energy impact of the EV fleet, NIPSCO relied on a range of sources by vehicle class as documented in Table 3-2:
For LDVs, the electricity demand per mile was determined from the 2019 EPA Automotive Trends Report for common vehicle model types: 0.28 kWh/mi for BEV and 0.075 kWh/mi for PHEV (assuming around one-third of the time PHEVs charge from the electric grid).
For transit vehicles, MDVs, and HDVs, NREL, DOE, and specific vehicle data sources were used to estimate electricity demand per mile over time.
Efficiency improvements over time were assumed, driven by a variety of factors, such as vehicle light-weighting, improvements in passenger driving behavior to maximize fuel economy, and others. A generic long-term improvement rate in kWh/mi efficiency was assumed at 0.5% per year, with faster near-term efficiency improvement in the Medium and High scenarios.18
18 Electric Power Research Institute. Environmental Assessment of a Full Electric Transportation Portfolio Volume 1 Background, Methodology, and Best Practices. September 2015. 3002006875. https://www.eenews.net/assets/2015/09/18/document_cw_01.pdf. Based on U.S. Energy Information Administration Annual Energy Outlook, 2013
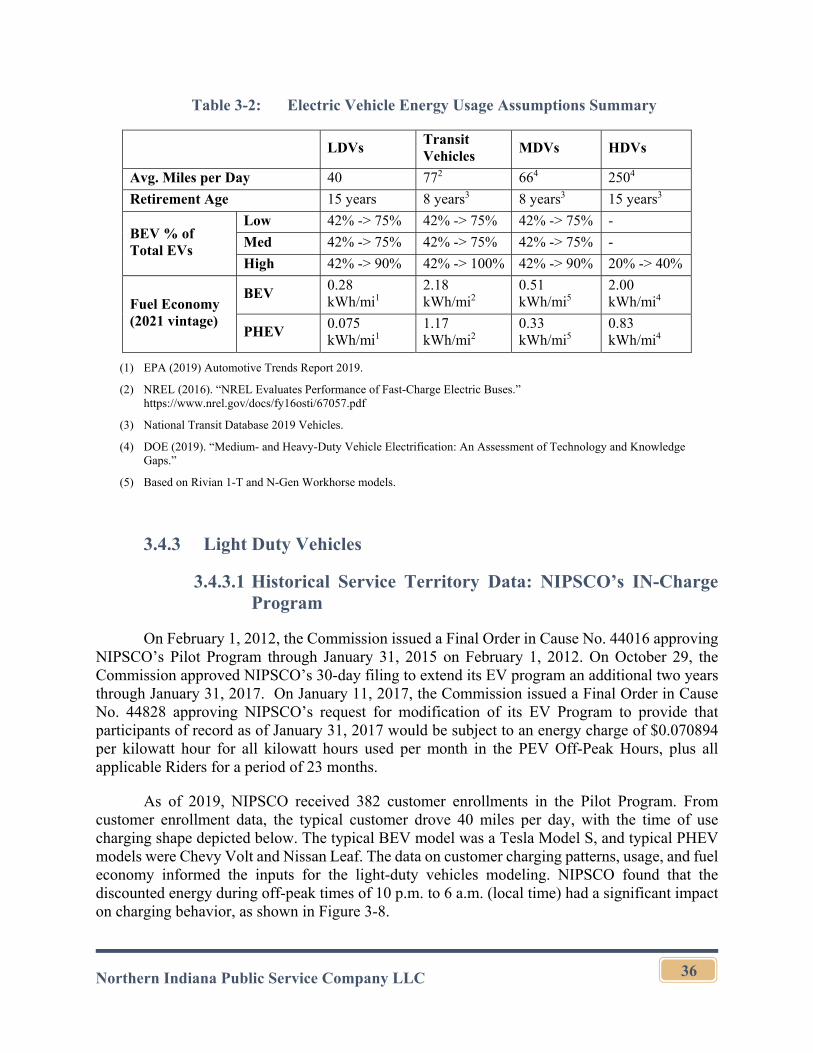
Northern Indiana Public Service Company LLC
36
Table 3-2: Electric Vehicle Energy Usage Assumptions Summary
LDVs Transit Vehicles
MDVs HDVs
Avg. Miles per Day 40 772 664 2504
Retirement Age 15 years 8 years3 8 years3 15 years3
BEV % of Total EVs
Low 42% -> 75% 42% -> 75% 42% -> 75% -
Med 42% -> 75% 42% -> 75% 42% -> 75% -
High 42% -> 90% 42% -> 100% 42% -> 90% 20% -> 40%
Fuel Economy (2021 vintage)
BEV 0.28 kWh/mi1
2.18 kWh/mi2
0.51 kWh/mi5
2.00 kWh/mi4
PHEV 0.075 kWh/mi1
1.17 kWh/mi2
0.33 kWh/mi5
0.83 kWh/mi4
(1) EPA (2019) Automotive Trends Report 2019.
(2) NREL (2016). “NREL Evaluates Performance of Fast-Charge Electric Buses.” https://www.nrel.gov/docs/fy16osti/67057.pdf
(3) National Transit Database 2019 Vehicles.
(4) DOE (2019). “Medium- and Heavy-Duty Vehicle Electrification: An Assessment of Technology and Knowledge Gaps.”
(5) Based on Rivian 1-T and N-Gen Workhorse models.
3.4.3 Light Duty Vehicles
3.4.3.1 Historical Service Territory Data: NIPSCO’s IN-Charge Program
On February 1, 2012, the Commission issued a Final Order in Cause No. 44016 approving NIPSCO’s Pilot Program through January 31, 2015 on February 1, 2012. On October 29, the Commission approved NIPSCO’s 30-day filing to extend its EV program an additional two years through January 31, 2017. On January 11, 2017, the Commission issued a Final Order in Cause No. 44828 approving NIPSCO’s request for modification of its EV Program to provide that participants of record as of January 31, 2017 would be subject to an energy charge of $0.070894 per kilowatt hour for all kilowatt hours used per month in the PEV Off-Peak Hours, plus all applicable Riders for a period of 23 months.
As of 2019, NIPSCO received 382 customer enrollments in the Pilot Program. From customer enrollment data, the typical customer drove 40 miles per day, with the time of use charging shape depicted below. The typical BEV model was a Tesla Model S, and typical PHEV models were Chevy Volt and Nissan Leaf. The data on customer charging patterns, usage, and fuel economy informed the inputs for the light-duty vehicles modeling. NIPSCO found that the discounted energy during off-peak times of 10 p.m. to 6 a.m. (local time) had a significant impact on charging behavior, as shown in Figure 3-8.
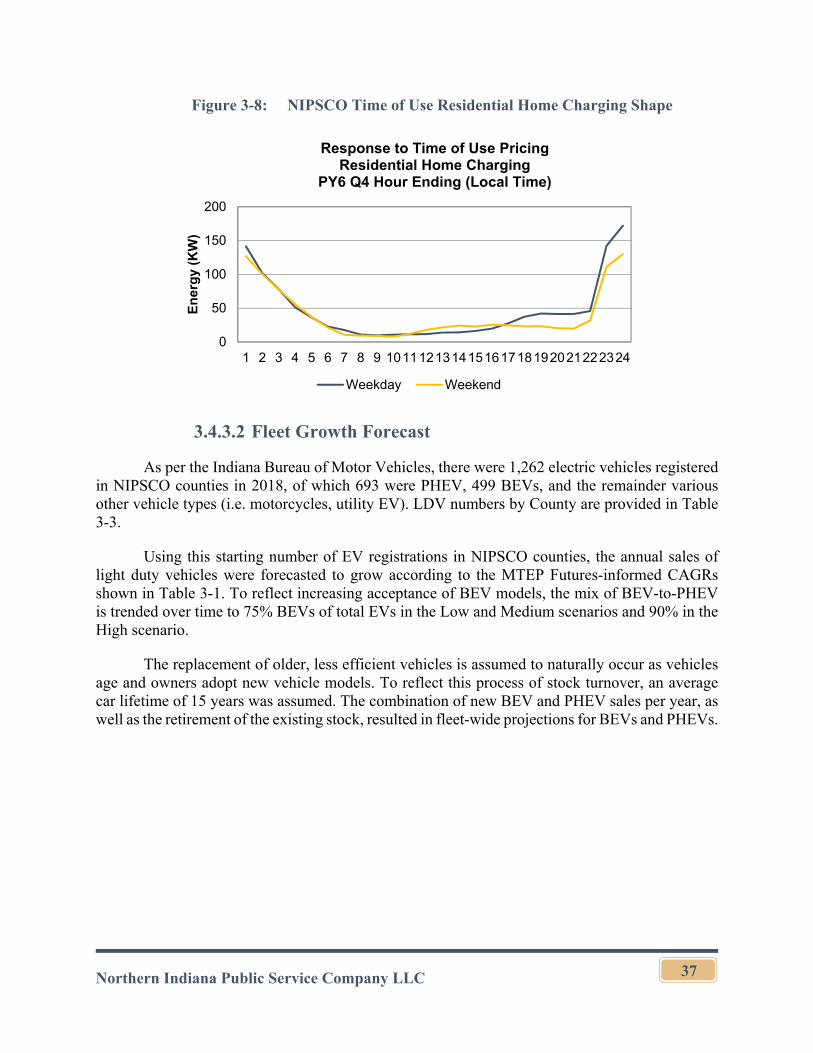
Northern Indiana Public Service Company LLC
37
Figure 3-8: NIPSCO Time of Use Residential Home Charging Shape
3.4.3.2 Fleet Growth Forecast
As per the Indiana Bureau of Motor Vehicles, there were 1,262 electric vehicles registered in NIPSCO counties in 2018, of which 693 were PHEV, 499 BEVs, and the remainder various other vehicle types (i.e. motorcycles, utility EV). LDV numbers by County are provided in Table 3-3.
Using this starting number of EV registrations in NIPSCO counties, the annual sales of light duty vehicles were forecasted to grow according to the MTEP Futures-informed CAGRs shown in Table 3-1. To reflect increasing acceptance of BEV models, the mix of BEV-to-PHEV is trended over time to 75% BEVs of total EVs in the Low and Medium scenarios and 90% in the High scenario.
The replacement of older, less efficient vehicles is assumed to naturally occur as vehicles age and owners adopt new vehicle models. To reflect this process of stock turnover, an average car lifetime of 15 years was assumed. The combination of new BEV and PHEV sales per year, as well as the retirement of the existing stock, resulted in fleet-wide projections for BEVs and PHEVs.
0
50
100
150
200
1 2 3 4 5 6 7 8 9 101112131415161718192021222324
En
erg
y (K
W)
Response to Time of Use PricingResidential Home Charging
PY6 Q4 Hour Ending (Local Time)
Weekday Weekend
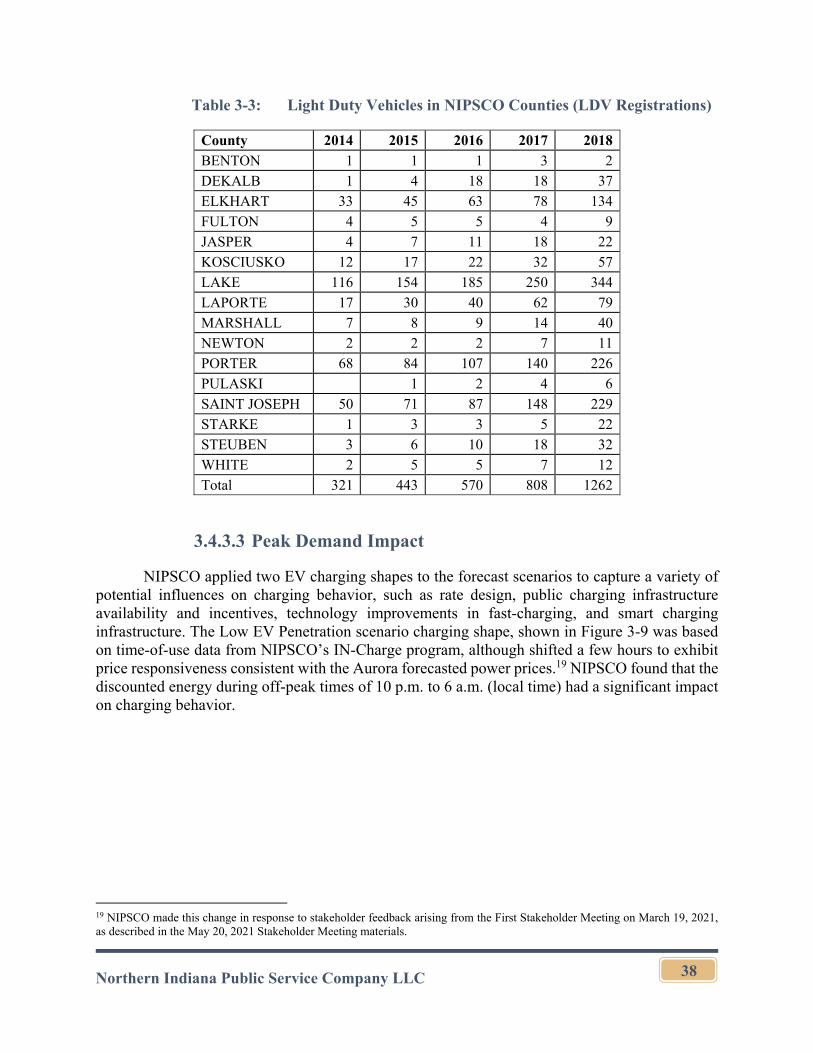
Northern Indiana Public Service Company LLC
38
Table 3-3: Light Duty Vehicles in NIPSCO Counties (LDV Registrations)
County 2014 2015 2016 2017 2018
BENTON 1 1 1 3 2
DEKALB 1 4 18 18 37
ELKHART 33 45 63 78 134
FULTON 4 5 5 4 9
JASPER 4 7 11 18 22
KOSCIUSKO 12 17 22 32 57
LAKE 116 154 185 250 344
LAPORTE 17 30 40 62 79
MARSHALL 7 8 9 14 40
NEWTON 2 2 2 7 11
PORTER 68 84 107 140 226
PULASKI 1 2 4 6
SAINT JOSEPH 50 71 87 148 229
STARKE 1 3 3 5 22
STEUBEN 3 6 10 18 32
WHITE 2 5 5 7 12
Total 321 443 570 808 1262
3.4.3.3 Peak Demand Impact
NIPSCO applied two EV charging shapes to the forecast scenarios to capture a variety of potential influences on charging behavior, such as rate design, public charging infrastructure availability and incentives, technology improvements in fast-charging, and smart charging infrastructure. The Low EV Penetration scenario charging shape, shown in Figure 3-9 was based on time-of-use data from NIPSCO’s IN-Charge program, although shifted a few hours to exhibit price responsiveness consistent with the Aurora forecasted power prices.19 NIPSCO found that the discounted energy during off-peak times of 10 p.m. to 6 a.m. (local time) had a significant impact on charging behavior.
19 NIPSCO made this change in response to stakeholder feedback arising from the First Stakeholder Meeting on March 19, 2021, as described in the May 20, 2021 Stakeholder Meeting materials.
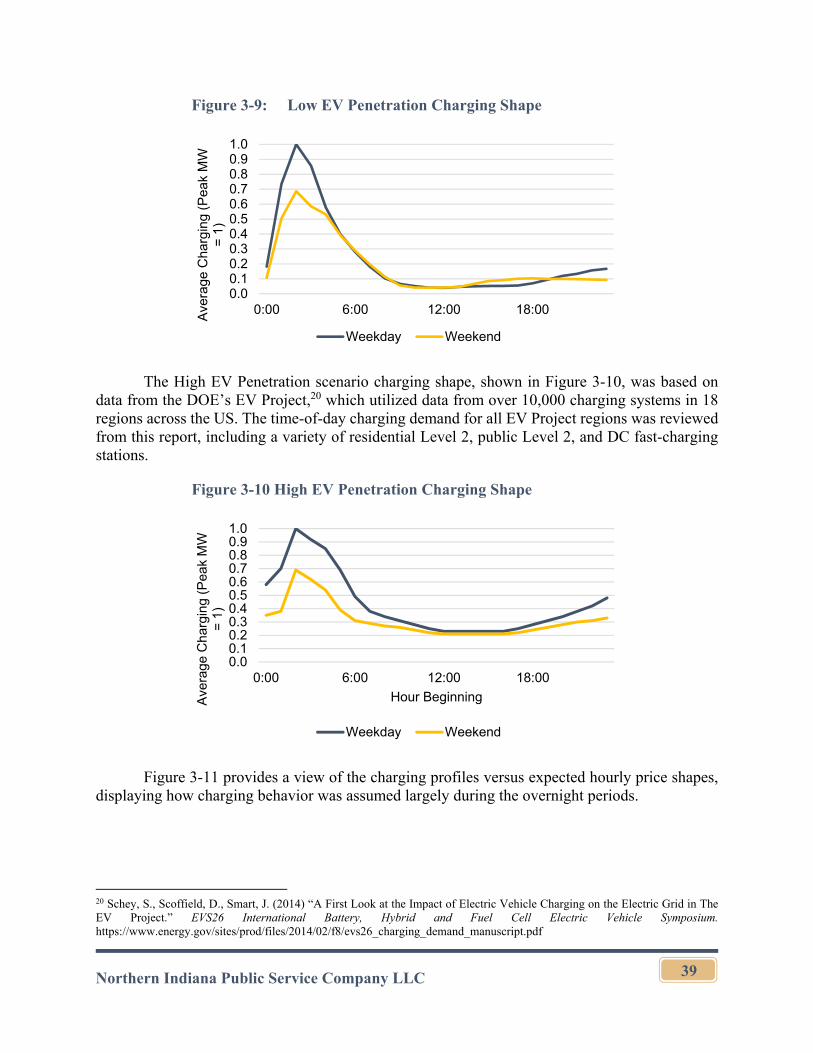
Northern Indiana Public Service Company LLC
39
Figure 3-9: Low EV Penetration Charging Shape
The High EV Penetration scenario charging shape, shown in Figure 3-10, was based on data from the DOE’s EV Project,20 which utilized data from over 10,000 charging systems in 18 regions across the US. The time-of-day charging demand for all EV Project regions was reviewed from this report, including a variety of residential Level 2, public Level 2, and DC fast-charging stations.
Figure 3-10 High EV Penetration Charging Shape
Figure 3-11 provides a view of the charging profiles versus expected hourly price shapes, displaying how charging behavior was assumed largely during the overnight periods.
20 Schey, S., Scoffield, D., Smart, J. (2014) “A First Look at the Impact of Electric Vehicle Charging on the Electric Grid in The EV Project.” EVS26 International Battery, Hybrid and Fuel Cell Electric Vehicle Symposium. https://www.energy.gov/sites/prod/files/2014/02/f8/evs26_charging_demand_manuscript.pdf
0.00.10.20.30.40.50.60.70.80.91.0
0:00 6:00 12:00 18:00Ave
rage
Cha
rgin
g (P
eak
MW
=
1)
Weekday Weekend
0.00.10.20.30.40.50.60.70.80.91.0
0:00 6:00 12:00 18:00
Ave
rage
Cha
rgin
g (P
eak
MW
=
1)
Hour Beginning
Weekday Weekend
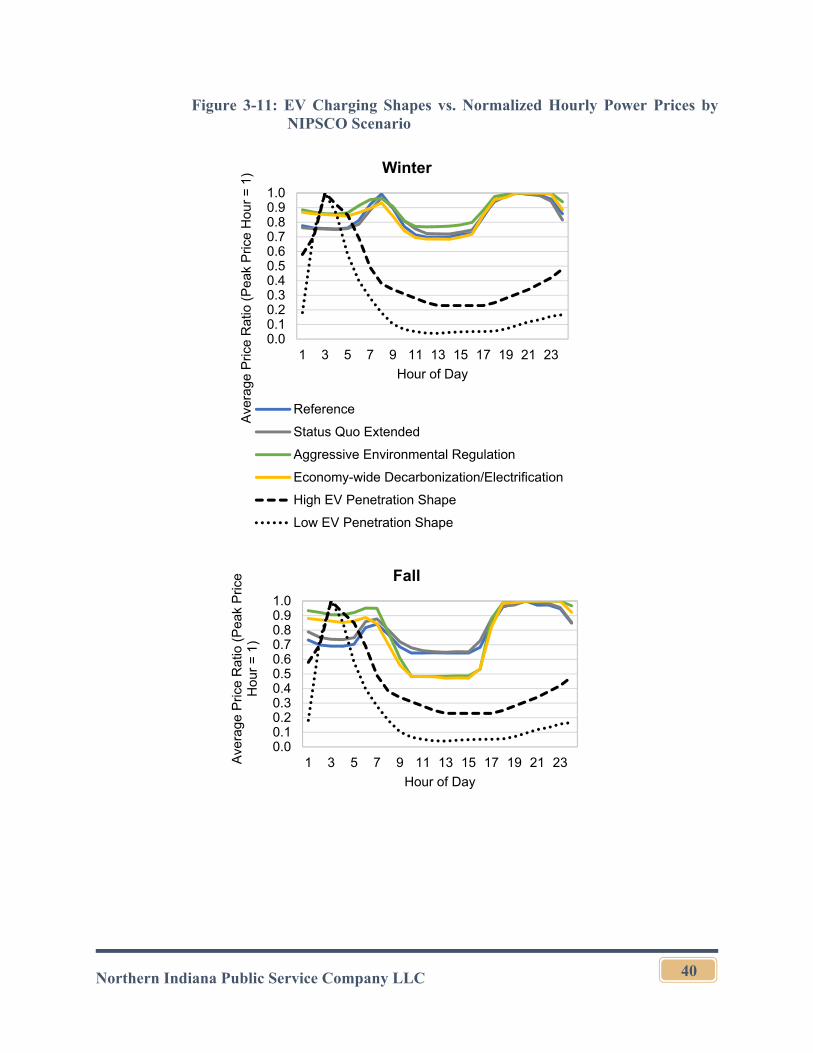
Northern Indiana Public Service Company LLC
40
Figure 3-11: EV Charging Shapes vs. Normalized Hourly Power Prices by NIPSCO Scenario
0.00.10.20.30.40.50.60.70.80.91.0
1 3 5 7 9 11 13 15 17 19 21 23
Ave
rage
Pric
e R
atio
(P
eak
Pric
e H
our
= 1
)
Hour of Day
Winter
Reference
Status Quo Extended
Aggressive Environmental Regulation
Economy-wide Decarbonization/Electrification
High EV Penetration Shape
Low EV Penetration Shape
0.00.10.20.30.40.50.60.70.80.91.0
1 3 5 7 9 11 13 15 17 19 21 23Ave
rage
Pric
e R
atio
(P
eak
Pric
e H
our
= 1
)
Hour of Day
Fall
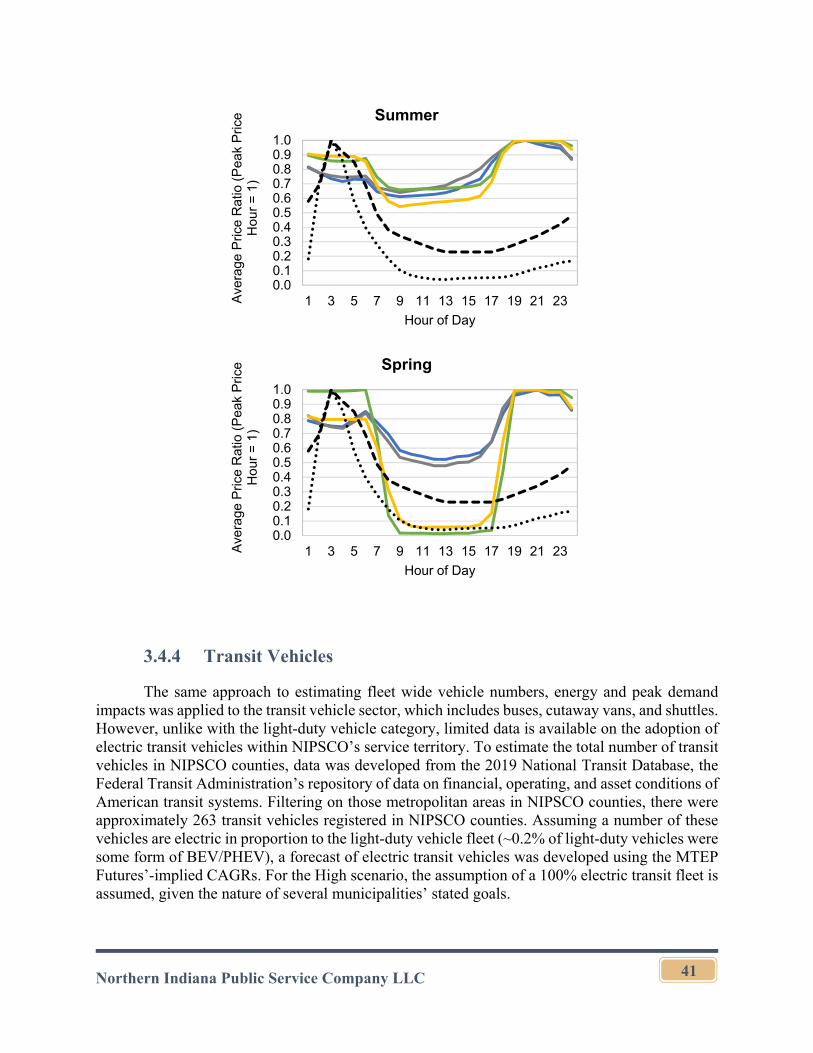
Northern Indiana Public Service Company LLC
41
3.4.4 Transit Vehicles
The same approach to estimating fleet wide vehicle numbers, energy and peak demand impacts was applied to the transit vehicle sector, which includes buses, cutaway vans, and shuttles. However, unlike with the light-duty vehicle category, limited data is available on the adoption of electric transit vehicles within NIPSCO’s service territory. To estimate the total number of transit vehicles in NIPSCO counties, data was developed from the 2019 National Transit Database, the Federal Transit Administration’s repository of data on financial, operating, and asset conditions of American transit systems. Filtering on those metropolitan areas in NIPSCO counties, there were approximately 263 transit vehicles registered in NIPSCO counties. Assuming a number of these vehicles are electric in proportion to the light-duty vehicle fleet (~0.2% of light-duty vehicles were some form of BEV/PHEV), a forecast of electric transit vehicles was developed using the MTEP Futures’-implied CAGRs. For the High scenario, the assumption of a 100% electric transit fleet is assumed, given the nature of several municipalities’ stated goals.
0.00.10.20.30.40.50.60.70.80.91.0
1 3 5 7 9 11 13 15 17 19 21 23Ave
rage
Pric
e R
atio
(P
eak
Pric
e H
our
= 1
)
Hour of Day
Summer
0.00.10.20.30.40.50.60.70.80.91.0
1 3 5 7 9 11 13 15 17 19 21 23Ave
rage
Pric
e R
atio
(P
eak
Pric
e H
our
= 1
)
Hour of Day
Spring
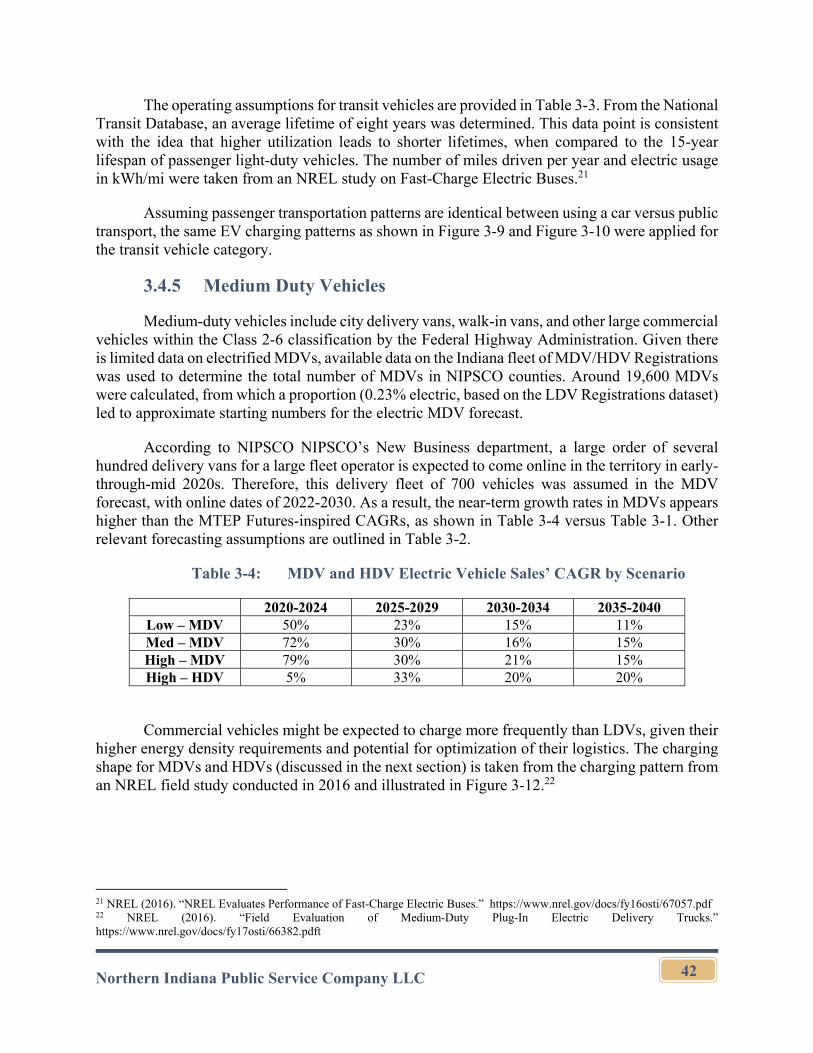
Northern Indiana Public Service Company LLC
42
The operating assumptions for transit vehicles are provided in Table 3-3. From the National Transit Database, an average lifetime of eight years was determined. This data point is consistent with the idea that higher utilization leads to shorter lifetimes, when compared to the 15-year lifespan of passenger light-duty vehicles. The number of miles driven per year and electric usage in kWh/mi were taken from an NREL study on Fast-Charge Electric Buses.21
Assuming passenger transportation patterns are identical between using a car versus public transport, the same EV charging patterns as shown in Figure 3-9 and Figure 3-10 were applied for the transit vehicle category.
3.4.5 Medium Duty Vehicles
Medium-duty vehicles include city delivery vans, walk-in vans, and other large commercial vehicles within the Class 2-6 classification by the Federal Highway Administration. Given there is limited data on electrified MDVs, available data on the Indiana fleet of MDV/HDV Registrations was used to determine the total number of MDVs in NIPSCO counties. Around 19,600 MDVs were calculated, from which a proportion (0.23% electric, based on the LDV Registrations dataset) led to approximate starting numbers for the electric MDV forecast.
According to NIPSCO NIPSCO’s New Business department, a large order of several hundred delivery vans for a large fleet operator is expected to come online in the territory in early-through-mid 2020s. Therefore, this delivery fleet of 700 vehicles was assumed in the MDV forecast, with online dates of 2022-2030. As a result, the near-term growth rates in MDVs appears higher than the MTEP Futures-inspired CAGRs, as shown in Table 3-4 versus Table 3-1. Other relevant forecasting assumptions are outlined in Table 3-2.
Table 3-4: MDV and HDV Electric Vehicle Sales’ CAGR by Scenario
2020-2024 2025-2029 2030-2034 2035-2040 Low – MDV 50% 23% 15% 11% Med – MDV 72% 30% 16% 15% High – MDV 79% 30% 21% 15% High – HDV 5% 33% 20% 20%
Commercial vehicles might be expected to charge more frequently than LDVs, given their higher energy density requirements and potential for optimization of their logistics. The charging shape for MDVs and HDVs (discussed in the next section) is taken from the charging pattern from an NREL field study conducted in 2016 and illustrated in Figure 3-12.22
21 NREL (2016). “NREL Evaluates Performance of Fast-Charge Electric Buses.” https://www.nrel.gov/docs/fy16osti/67057.pdf 22 NREL (2016). “Field Evaluation of Medium-Duty Plug-In Electric Delivery Trucks.” https://www.nrel.gov/docs/fy17osti/66382.pdft
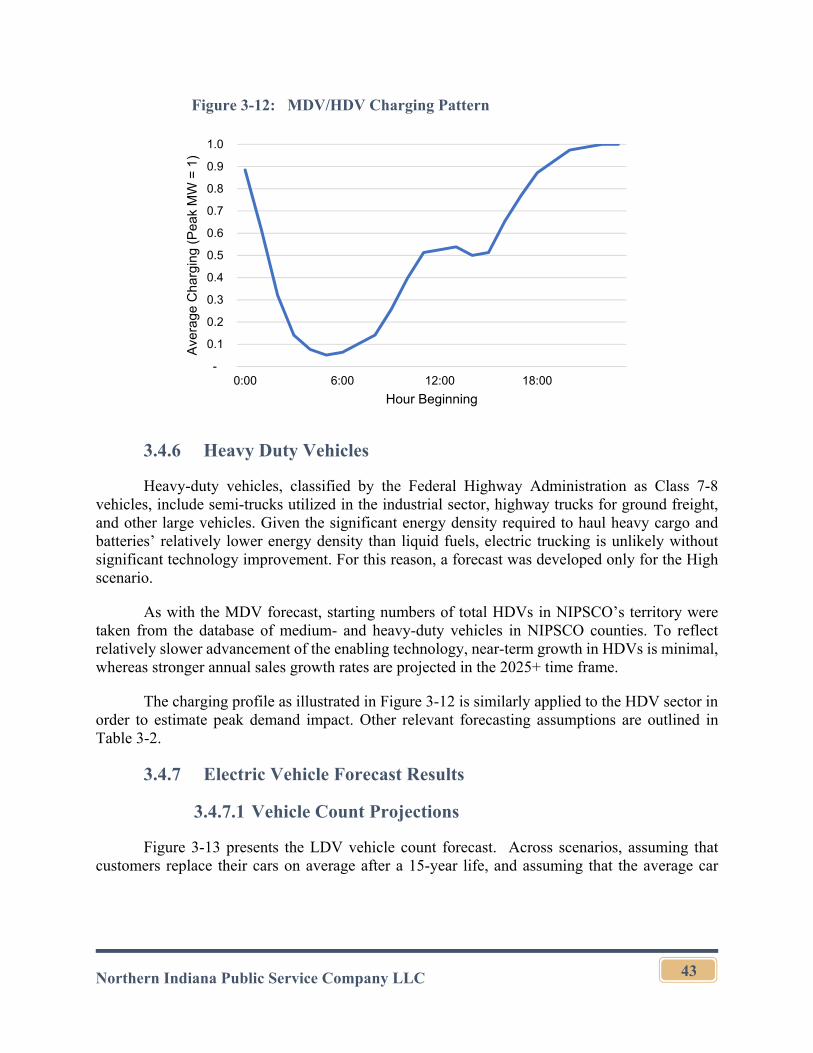
Northern Indiana Public Service Company LLC
43
Figure 3-12: MDV/HDV Charging Pattern
3.4.6 Heavy Duty Vehicles
Heavy-duty vehicles, classified by the Federal Highway Administration as Class 7-8 vehicles, include semi-trucks utilized in the industrial sector, highway trucks for ground freight, and other large vehicles. Given the significant energy density required to haul heavy cargo and batteries’ relatively lower energy density than liquid fuels, electric trucking is unlikely without significant technology improvement. For this reason, a forecast was developed only for the High scenario.
As with the MDV forecast, starting numbers of total HDVs in NIPSCO’s territory were taken from the database of medium- and heavy-duty vehicles in NIPSCO counties. To reflect relatively slower advancement of the enabling technology, near-term growth in HDVs is minimal, whereas stronger annual sales growth rates are projected in the 2025+ time frame.
The charging profile as illustrated in Figure 3-12 is similarly applied to the HDV sector in order to estimate peak demand impact. Other relevant forecasting assumptions are outlined in Table 3-2.
3.4.7 Electric Vehicle Forecast Results
3.4.7.1 Vehicle Count Projections
Figure 3-13 presents the LDV vehicle count forecast. Across scenarios, assuming that customers replace their cars on average after a 15-year life, and assuming that the average car
-
0.1
0.2
0.3
0.4
0.5
0.6
0.7
0.8
0.9
1.0
0:00 6:00 12:00 18:00
Ave
rage
Cha
rgin
g (P
eak
MW
= 1
)
Hour Beginning
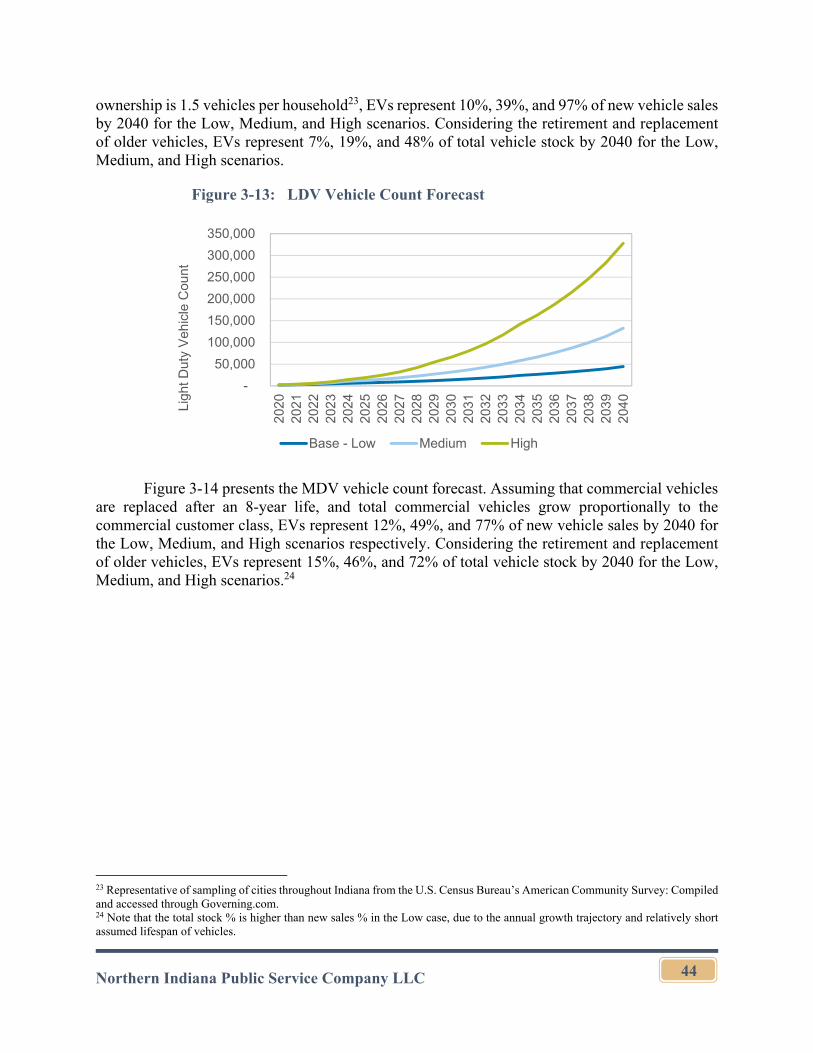
Northern Indiana Public Service Company LLC
44
ownership is 1.5 vehicles per household23, EVs represent 10%, 39%, and 97% of new vehicle sales by 2040 for the Low, Medium, and High scenarios. Considering the retirement and replacement of older vehicles, EVs represent 7%, 19%, and 48% of total vehicle stock by 2040 for the Low, Medium, and High scenarios.
Figure 3-13: LDV Vehicle Count Forecast
Figure 3-14 presents the MDV vehicle count forecast. Assuming that commercial vehicles are replaced after an 8-year life, and total commercial vehicles grow proportionally to the commercial customer class, EVs represent 12%, 49%, and 77% of new vehicle sales by 2040 for the Low, Medium, and High scenarios respectively. Considering the retirement and replacement of older vehicles, EVs represent 15%, 46%, and 72% of total vehicle stock by 2040 for the Low, Medium, and High scenarios.24
23 Representative of sampling of cities throughout Indiana from the U.S. Census Bureau’s American Community Survey: Compiled and accessed through Governing.com. 24 Note that the total stock % is higher than new sales % in the Low case, due to the annual growth trajectory and relatively short assumed lifespan of vehicles.
-
50,000
100,000
150,000
200,000
250,000
300,000
350,000
2020
2021
2022
2023
2024
2025
2026
2027
2028
2029
2030
2031
2032
2033
2034
2035
2036
2037
2038
2039
2040Li
ght D
uty
Veh
icle
Cou
nt
Base - Low Medium High
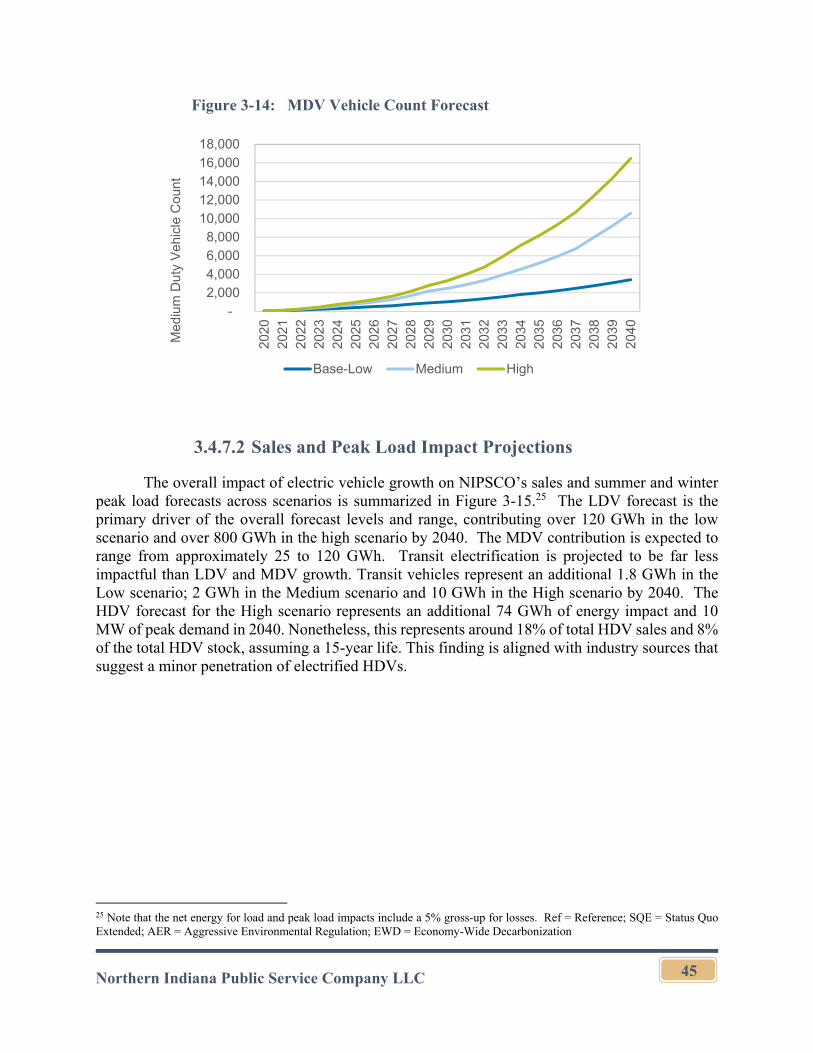
Northern Indiana Public Service Company LLC
45
Figure 3-14: MDV Vehicle Count Forecast
3.4.7.2 Sales and Peak Load Impact Projections
The overall impact of electric vehicle growth on NIPSCO’s sales and summer and winter peak load forecasts across scenarios is summarized in Figure 3-15.25 The LDV forecast is the primary driver of the overall forecast levels and range, contributing over 120 GWh in the low scenario and over 800 GWh in the high scenario by 2040. The MDV contribution is expected to range from approximately 25 to 120 GWh. Transit electrification is projected to be far less impactful than LDV and MDV growth. Transit vehicles represent an additional 1.8 GWh in the Low scenario; 2 GWh in the Medium scenario and 10 GWh in the High scenario by 2040. The HDV forecast for the High scenario represents an additional 74 GWh of energy impact and 10 MW of peak demand in 2040. Nonetheless, this represents around 18% of total HDV sales and 8% of the total HDV stock, assuming a 15-year life. This finding is aligned with industry sources that suggest a minor penetration of electrified HDVs.
25 Note that the net energy for load and peak load impacts include a 5% gross-up for losses. Ref = Reference; SQE = Status Quo Extended; AER = Aggressive Environmental Regulation; EWD = Economy-Wide Decarbonization
-
2,000 4,000
6,000
8,000 10,000
12,000 14,000
16,000
18,000
2020
2021
2022
2023
2024
2025
2026
2027
2028
2029
2030
2031
2032
2033
2034
2035
2036
2037
2038
2039
2040
Med
ium
Dut
y V
ehic
le C
ount
Base-Low Medium High
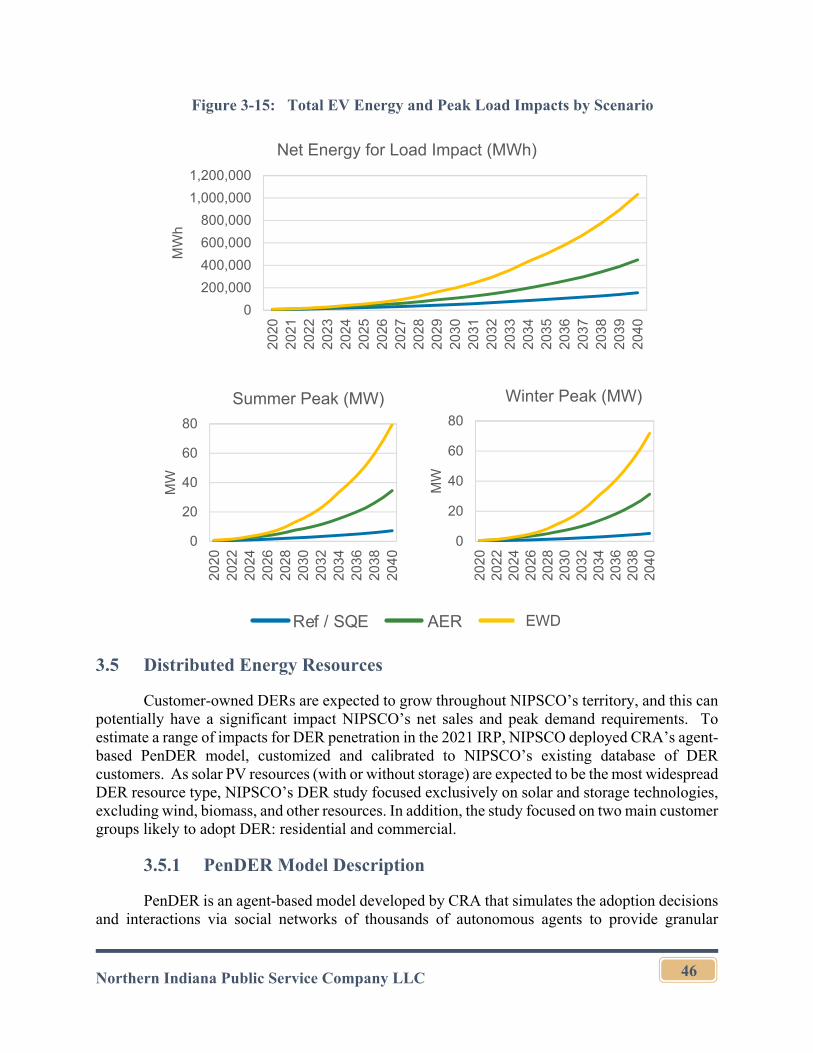
Northern Indiana Public Service Company LLC
46
Figure 3-15: Total EV Energy and Peak Load Impacts by Scenario
3.5 Distributed Energy Resources
Customer-owned DERs are expected to grow throughout NIPSCO’s territory, and this can potentially have a significant impact NIPSCO’s net sales and peak demand requirements. To estimate a range of impacts for DER penetration in the 2021 IRP, NIPSCO deployed CRA’s agent-based PenDER model, customized and calibrated to NIPSCO’s existing database of DER customers. As solar PV resources (with or without storage) are expected to be the most widespread DER resource type, NIPSCO’s DER study focused exclusively on solar and storage technologies, excluding wind, biomass, and other resources. In addition, the study focused on two main customer groups likely to adopt DER: residential and commercial.
3.5.1 PenDER Model Description
PenDER is an agent-based model developed by CRA that simulates the adoption decisions and interactions via social networks of thousands of autonomous agents to provide granular
0
200,000
400,000
600,000
800,000
1,000,000
1,200,000
2020
2021
2022
2023
2024
2025
2026
2027
2028
2029
2030
2031
2032
2033
2034
2035
2036
2037
2038
2039
2040
MW
h
Net Energy for Load Impact (MWh)
0
20
40
60
80
2020
2022
2024
2026
2028
2030
2032
2034
2036
2038
2040
MW
Summer Peak (MW)
0
20
40
60
80
2020
2022
2024
2026
2028
2030
2032
2034
2036
2038
2040
MW
Winter Peak (MW)
Ref / SQE AER EDEEWD
Northern Indiana Public Service Company LLC
47
forecasting of DER adoption. Techno-economic variables and demographic characteristics of the simulated agents contribute to an individual agent’s probability to adopt DER based on an economic review of retail rate expectations, the costs of installing DER, and potential financial incentives.
The techno-economic variables deployed in the PenDER modeling for NIPSCO’s 2021 IRP include:
The capital cost of a solar PV system, inclusive of expected ITC benefits
Solar capacity factor and solar system lifetime expectations
Retail rates (for net metering) and wholesale rates projections
Assumptions for customer discount rate
Demographic data from the ACS for NIPSCO counties to estimate agents’ household incomes
The combination of the techno-economic variables and agent income levels are then used to develop a calculation of payback period and household budget in order to assess the probability of DER adoption through a calibrated logit probability function.
While economics plays an important role in the decision to install DER, the personal propensity and communal influences to adopt new technology also play a role, as described through the Bass diffusion model of technology forecasting.26 Therefore, the simulated agents are randomly assigned a “Bass innovation index,” representing their personal propensity on a scale of early adopters to laggards of new technology. Relationships between agents are modeled through “social networks,” with an average size of 13 agents belonging to one network. As more agents in one’s network adopt DER, the more likely a given agent will also adopt.
Ultimately, an agent’s decision to adopt DER is influenced by the combination of techno-economic factors (through payback period and household budget) as well as personal and communal influences (through personal preferences and network effects).
3.5.2 Key Input Assumptions
The techno-economic input assumptions for PenDER used in NIPSCO’s 2021 IRP are summarized in Table 3-5 and Table 3-6 and as follows:
Solar System Characteristics: Data from the Net Metering program enrollment provided information regarding the average size of DER solar systems currently installed on NIPSCO’s system, which was approximately 8 kW for residential
26 See Bass, F (1969). “A New Product Growth for Model Consumer Durables.” Management Science. 15 (5): 215-227
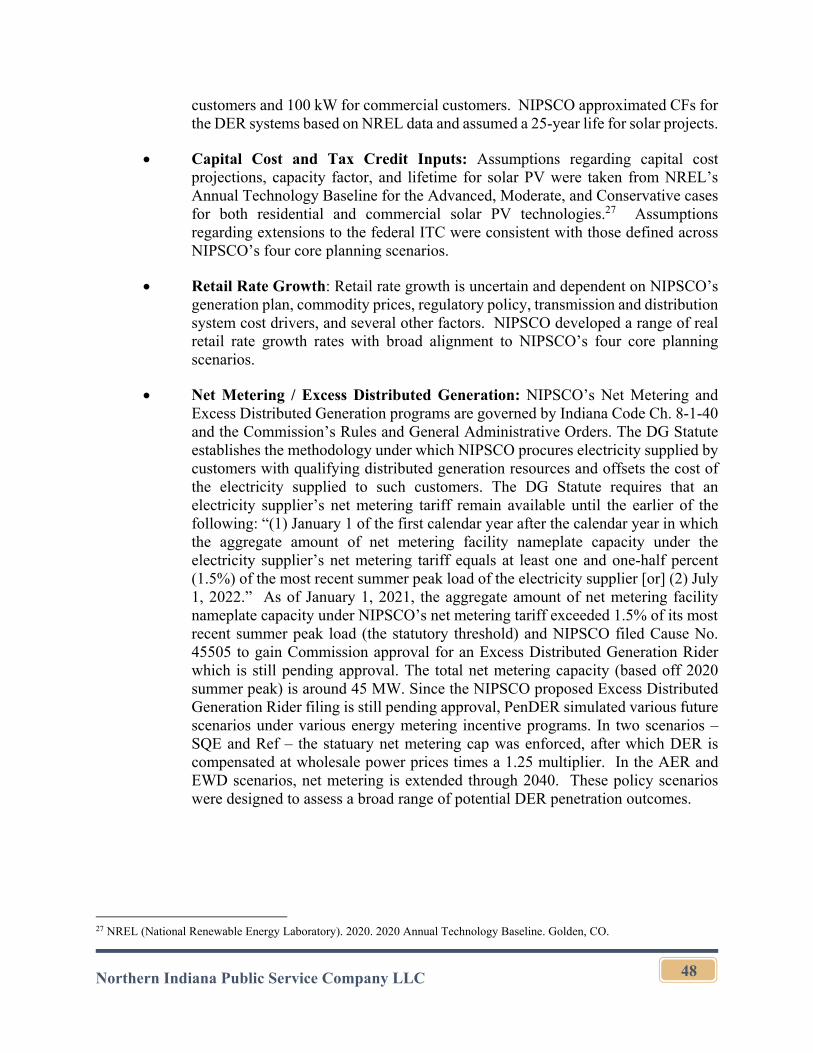
Northern Indiana Public Service Company LLC
48
customers and 100 kW for commercial customers. NIPSCO approximated CFs for the DER systems based on NREL data and assumed a 25-year life for solar projects.
Capital Cost and Tax Credit Inputs: Assumptions regarding capital cost projections, capacity factor, and lifetime for solar PV were taken from NREL’s Annual Technology Baseline for the Advanced, Moderate, and Conservative cases for both residential and commercial solar PV technologies.27 Assumptions regarding extensions to the federal ITC were consistent with those defined across NIPSCO’s four core planning scenarios.
Retail Rate Growth: Retail rate growth is uncertain and dependent on NIPSCO’s generation plan, commodity prices, regulatory policy, transmission and distribution system cost drivers, and several other factors. NIPSCO developed a range of real retail rate growth rates with broad alignment to NIPSCO’s four core planning scenarios.
Net Metering / Excess Distributed Generation: NIPSCO’s Net Metering and Excess Distributed Generation programs are governed by Indiana Code Ch. 8-1-40 and the Commission’s Rules and General Administrative Orders. The DG Statute establishes the methodology under which NIPSCO procures electricity supplied by customers with qualifying distributed generation resources and offsets the cost of the electricity supplied to such customers. The DG Statute requires that an electricity supplier’s net metering tariff remain available until the earlier of the following: “(1) January 1 of the first calendar year after the calendar year in which the aggregate amount of net metering facility nameplate capacity under the electricity supplier’s net metering tariff equals at least one and one-half percent (1.5%) of the most recent summer peak load of the electricity supplier [or] (2) July 1, 2022.” As of January 1, 2021, the aggregate amount of net metering facility nameplate capacity under NIPSCO’s net metering tariff exceeded 1.5% of its most recent summer peak load (the statutory threshold) and NIPSCO filed Cause No. 45505 to gain Commission approval for an Excess Distributed Generation Rider which is still pending approval. The total net metering capacity (based off 2020 summer peak) is around 45 MW. Since the NIPSCO proposed Excess Distributed Generation Rider filing is still pending approval, PenDER simulated various future scenarios under various energy metering incentive programs. In two scenarios –SQE and Ref – the statuary net metering cap was enforced, after which DER is compensated at wholesale power prices times a 1.25 multiplier. In the AER and EWD scenarios, net metering is extended through 2040. These policy scenarios were designed to assess a broad range of potential DER penetration outcomes.
27 NREL (National Renewable Energy Laboratory). 2020. 2020 Annual Technology Baseline. Golden, CO.
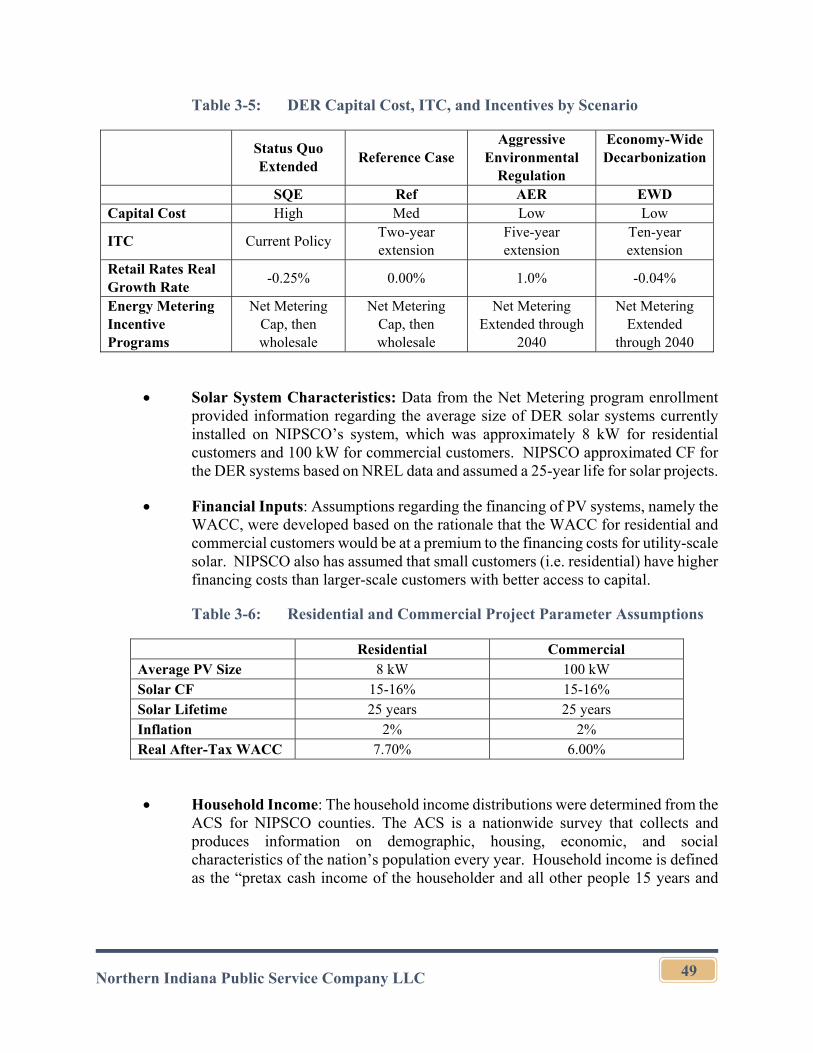
Northern Indiana Public Service Company LLC
49
Table 3-5: DER Capital Cost, ITC, and Incentives by Scenario
Status Quo Extended
Reference Case Aggressive
Environmental Regulation
Economy-Wide Decarbonization
SQE Ref AER EWD Capital Cost High Med Low Low
ITC Current Policy Two-year extension
Five-year extension
Ten-year extension
Retail Rates Real Growth Rate
-0.25% 0.00% 1.0% -0.04%
Energy Metering Incentive Programs
Net Metering Cap, then wholesale
Net Metering Cap, then wholesale
Net Metering Extended through
2040
Net Metering Extended
through 2040
Solar System Characteristics: Data from the Net Metering program enrollment provided information regarding the average size of DER solar systems currently installed on NIPSCO’s system, which was approximately 8 kW for residential customers and 100 kW for commercial customers. NIPSCO approximated CF for the DER systems based on NREL data and assumed a 25-year life for solar projects.
Financial Inputs: Assumptions regarding the financing of PV systems, namely the WACC, were developed based on the rationale that the WACC for residential and commercial customers would be at a premium to the financing costs for utility-scale solar. NIPSCO also has assumed that small customers (i.e. residential) have higher financing costs than larger-scale customers with better access to capital.
Table 3-6: Residential and Commercial Project Parameter Assumptions
Residential Commercial Average PV Size 8 kW 100 kW Solar CF 15-16% 15-16% Solar Lifetime 25 years 25 years Inflation 2% 2% Real After-Tax WACC 7.70% 6.00%
Household Income: The household income distributions were determined from the ACS for NIPSCO counties. The ACS is a nationwide survey that collects and produces information on demographic, housing, economic, and social characteristics of the nation’s population every year. Household income is defined as the “pretax cash income of the householder and all other people 15 years and
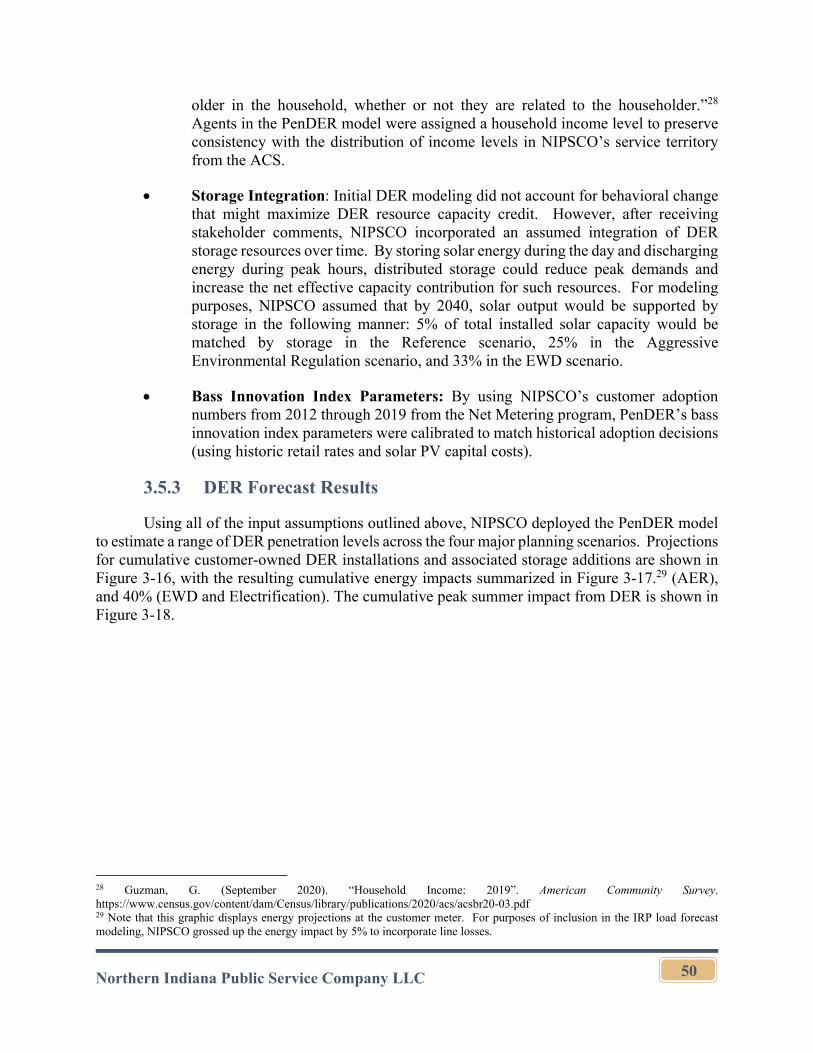
Northern Indiana Public Service Company LLC
50
older in the household, whether or not they are related to the householder.”28 Agents in the PenDER model were assigned a household income level to preserve consistency with the distribution of income levels in NIPSCO’s service territory from the ACS.
Storage Integration: Initial DER modeling did not account for behavioral change that might maximize DER resource capacity credit. However, after receiving stakeholder comments, NIPSCO incorporated an assumed integration of DER storage resources over time. By storing solar energy during the day and discharging energy during peak hours, distributed storage could reduce peak demands and increase the net effective capacity contribution for such resources. For modeling purposes, NIPSCO assumed that by 2040, solar output would be supported by storage in the following manner: 5% of total installed solar capacity would be matched by storage in the Reference scenario, 25% in the Aggressive Environmental Regulation scenario, and 33% in the EWD scenario.
Bass Innovation Index Parameters: By using NIPSCO’s customer adoption numbers from 2012 through 2019 from the Net Metering program, PenDER’s bass innovation index parameters were calibrated to match historical adoption decisions (using historic retail rates and solar PV capital costs).
3.5.3 DER Forecast Results
Using all of the input assumptions outlined above, NIPSCO deployed the PenDER model to estimate a range of DER penetration levels across the four major planning scenarios. Projections for cumulative customer-owned DER installations and associated storage additions are shown in Figure 3-16, with the resulting cumulative energy impacts summarized in Figure 3-17.29 (AER), and 40% (EWD and Electrification). The cumulative peak summer impact from DER is shown in Figure 3-18.
28 Guzman, G. (September 2020). “Household Income: 2019”. American Community Survey. https://www.census.gov/content/dam/Census/library/publications/2020/acs/acsbr20-03.pdf 29 Note that this graphic displays energy projections at the customer meter. For purposes of inclusion in the IRP load forecast modeling, NIPSCO grossed up the energy impact by 5% to incorporate line losses.
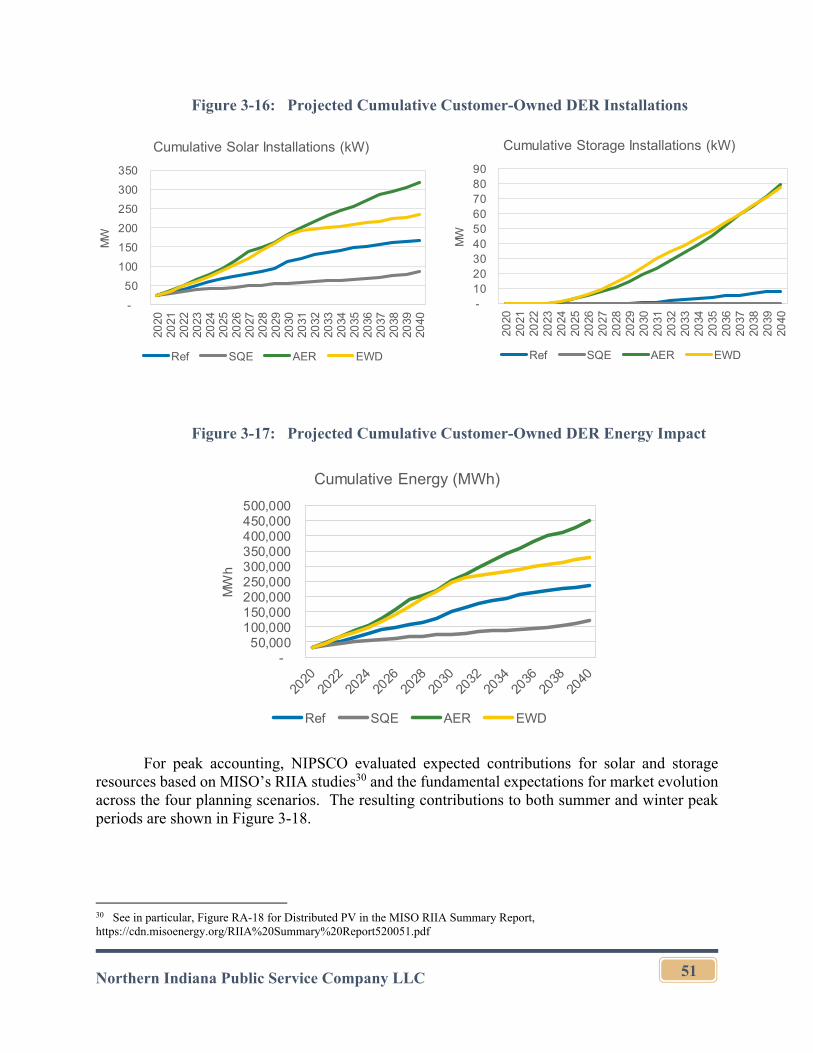
Northern Indiana Public Service Company LLC
51
Figure 3-16: Projected Cumulative Customer-Owned DER Installations
Figure 3-17: Projected Cumulative Customer-Owned DER Energy Impact
For peak accounting, NIPSCO evaluated expected contributions for solar and storage resources based on MISO’s RIIA studies30 and the fundamental expectations for market evolution across the four planning scenarios. The resulting contributions to both summer and winter peak periods are shown in Figure 3-18.
30 See in particular, Figure RA-18 for Distributed PV in the MISO RIIA Summary Report, https://cdn.misoenergy.org/RIIA%20Summary%20Report520051.pdf
-
50
100
150
200
250
300
35020
2020
2120
2220
2320
2420
2520
2620
2720
2820
2920
3020
3120
3220
3320
3420
3520
3620
3720
3820
3920
40
MW
Cumulative Solar Installations (kW)
Ref SQE AER EWD
- 10 20 30 40 50 60 70 80 90
2020
2021
2022
2023
2024
2025
2026
2027
2028
2029
2030
2031
2032
2033
2034
2035
2036
2037
2038
2039
2040
MW
Cumulative Storage Installations (kW)
Ref SQE AER EWD
- 50,000
100,000 150,000 200,000 250,000 300,000 350,000 400,000 450,000 500,000
MW
h
Cumulative Energy (MWh)
Ref SQE AER EWD
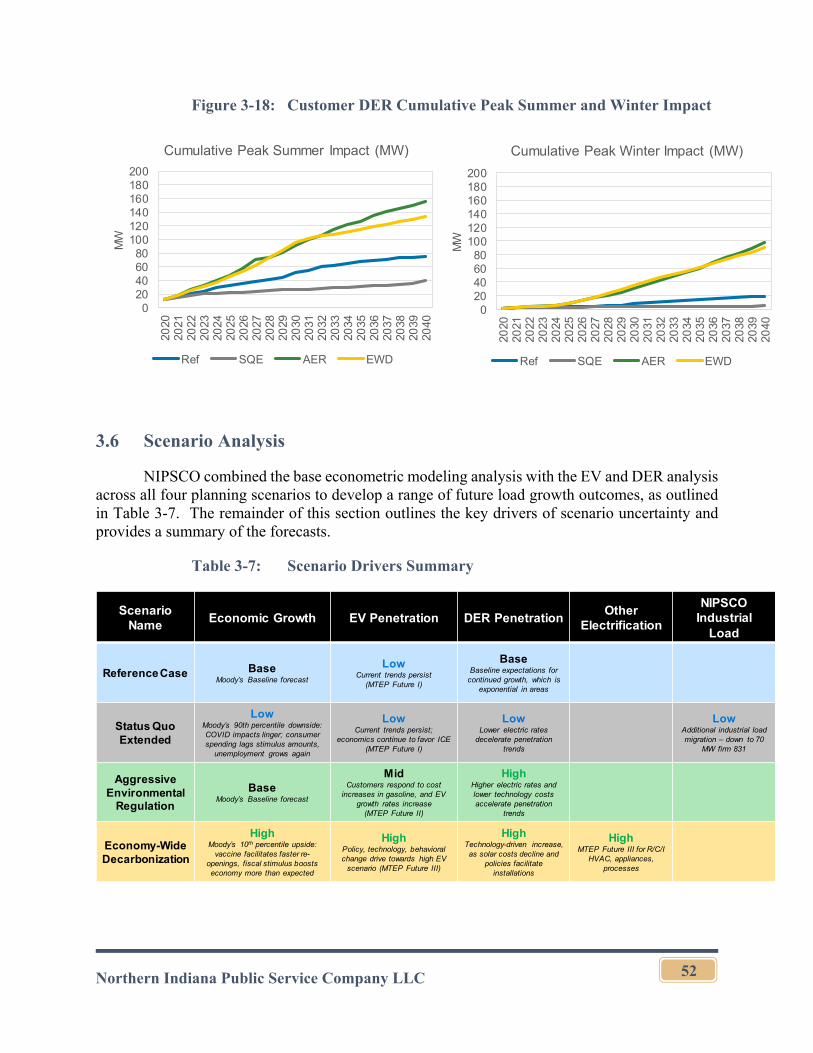
Northern Indiana Public Service Company LLC
52
Figure 3-18: Customer DER Cumulative Peak Summer and Winter Impact
3.6 Scenario Analysis
NIPSCO combined the base econometric modeling analysis with the EV and DER analysis across all four planning scenarios to develop a range of future load growth outcomes, as outlined in Table 3-7. The remainder of this section outlines the key drivers of scenario uncertainty and provides a summary of the forecasts.
Table 3-7: Scenario Drivers Summary
020406080
100120140160180200
2020
2021
2022
2023
2024
2025
2026
2027
2028
2029
2030
2031
2032
2033
2034
2035
2036
2037
2038
2039
2040
MW
Cumulative Peak Summer Impact (MW)
Ref SQE AER EWD
020406080
100120140160180200
2020
2021
2022
2023
2024
2025
2026
2027
2028
2029
2030
2031
2032
2033
2034
2035
2036
2037
2038
2039
2040
MW
Cumulative Peak Winter Impact (MW)
Ref SQE AER EWD
Scenario Name
Economic Growth EV Penetration DER PenetrationOther
Electrification
NIPSCO Industrial
Load
Reference Case BaseMoody’s Baseline forecast
LowCurrent trends persist
(MTEP Future I)
BaseBaseline expectations for
continued growth, which is exponential in areas
Status Quo Extended
LowMoody’s 90th percentile downside: COVID impacts linger; consumer spending lags stimulus amounts,
unemployment grows again
LowCurrent trends persist;
economics continue to favor ICE (MTEP Future I)
LowLower electric rates
decelerate penetration trends
LowAdditional industrial load migration – down to 70
MW firm 831
Aggressive Environmental
Regulation
BaseMoody’s Baseline forecast
MidCustomers respond to cost
increases in gasoline, and EV growth rates increase
(MTEP Future II)
HighHigher electric rates and lower technology costs accelerate penetration
trends
Economy-Wide Decarbonization
HighMoody’s 10th percentile upside:
vaccine facilitates faster re-openings, fiscal stimulus boosts economy more than expected
HighPolicy, technology, behavioral change drive towards high EV
scenario (MTEP Future III)
HighTechnology-driven increase, as solar costs decline and
policies facilitate installations
HighMTEP Future III for R/C/I
HVAC, appliances, processes
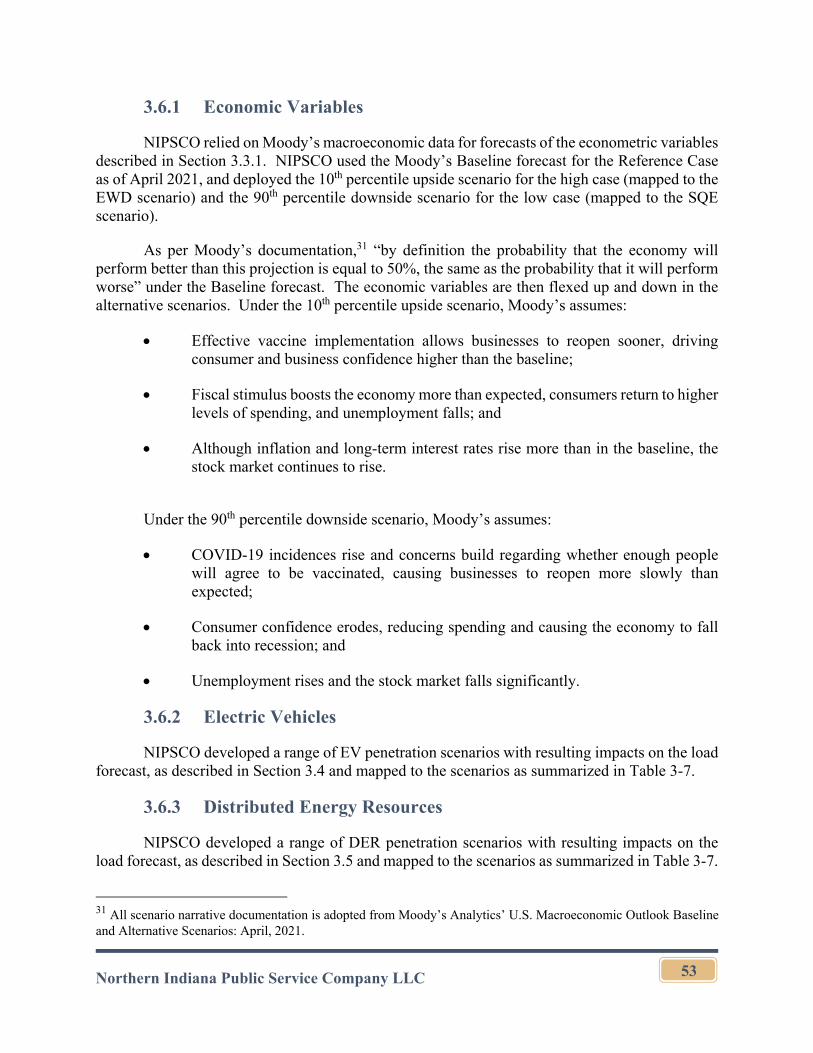
Northern Indiana Public Service Company LLC
53
3.6.1 Economic Variables
NIPSCO relied on Moody’s macroeconomic data for forecasts of the econometric variables described in Section 3.3.1. NIPSCO used the Moody’s Baseline forecast for the Reference Case as of April 2021, and deployed the 10th percentile upside scenario for the high case (mapped to the EWD scenario) and the 90th percentile downside scenario for the low case (mapped to the SQE scenario).
As per Moody’s documentation,31 “by definition the probability that the economy will perform better than this projection is equal to 50%, the same as the probability that it will perform worse” under the Baseline forecast. The economic variables are then flexed up and down in the alternative scenarios. Under the 10th percentile upside scenario, Moody’s assumes:
Effective vaccine implementation allows businesses to reopen sooner, driving consumer and business confidence higher than the baseline;
Fiscal stimulus boosts the economy more than expected, consumers return to higher levels of spending, and unemployment falls; and
Although inflation and long-term interest rates rise more than in the baseline, the stock market continues to rise.
Under the 90th percentile downside scenario, Moody’s assumes:
COVID-19 incidences rise and concerns build regarding whether enough people will agree to be vaccinated, causing businesses to reopen more slowly than expected;
Consumer confidence erodes, reducing spending and causing the economy to fall back into recession; and
Unemployment rises and the stock market falls significantly.
3.6.2 Electric Vehicles
NIPSCO developed a range of EV penetration scenarios with resulting impacts on the load forecast, as described in Section 3.4 and mapped to the scenarios as summarized in Table 3-7.
3.6.3 Distributed Energy Resources
NIPSCO developed a range of DER penetration scenarios with resulting impacts on the load forecast, as described in Section 3.5 and mapped to the scenarios as summarized in Table 3-7.
31 All scenario narrative documentation is adopted from Moody’s Analytics’ U.S. Macroeconomic Outlook Baseline and Alternative Scenarios: April, 2021.
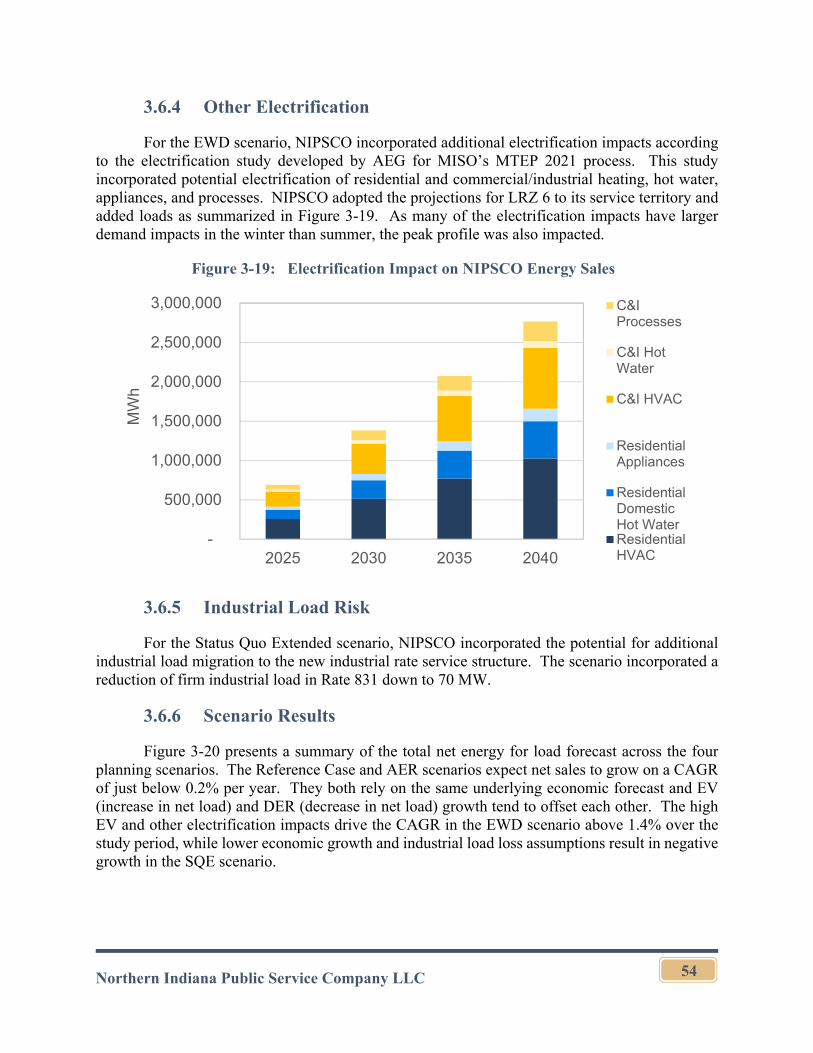
Northern Indiana Public Service Company LLC
54
3.6.4 Other Electrification
For the EWD scenario, NIPSCO incorporated additional electrification impacts according to the electrification study developed by AEG for MISO’s MTEP 2021 process. This study incorporated potential electrification of residential and commercial/industrial heating, hot water, appliances, and processes. NIPSCO adopted the projections for LRZ 6 to its service territory and added loads as summarized in Figure 3-19. As many of the electrification impacts have larger demand impacts in the winter than summer, the peak profile was also impacted.
Figure 3-19: Electrification Impact on NIPSCO Energy Sales
3.6.5 Industrial Load Risk
For the Status Quo Extended scenario, NIPSCO incorporated the potential for additional industrial load migration to the new industrial rate service structure. The scenario incorporated a reduction of firm industrial load in Rate 831 down to 70 MW.
3.6.6 Scenario Results
Figure 3-20 presents a summary of the total net energy for load forecast across the four planning scenarios. The Reference Case and AER scenarios expect net sales to grow on a CAGR of just below 0.2% per year. They both rely on the same underlying economic forecast and EV (increase in net load) and DER (decrease in net load) growth tend to offset each other. The high EV and other electrification impacts drive the CAGR in the EWD scenario above 1.4% over the study period, while lower economic growth and industrial load loss assumptions result in negative growth in the SQE scenario.
-
500,000
1,000,000
1,500,000
2,000,000
2,500,000
3,000,000
2025 2030 2035 2040
MW
h
C&IProcesses
C&I HotWater
C&I HVAC
ResidentialAppliances
ResidentialDomesticHot WaterResidentialHVAC
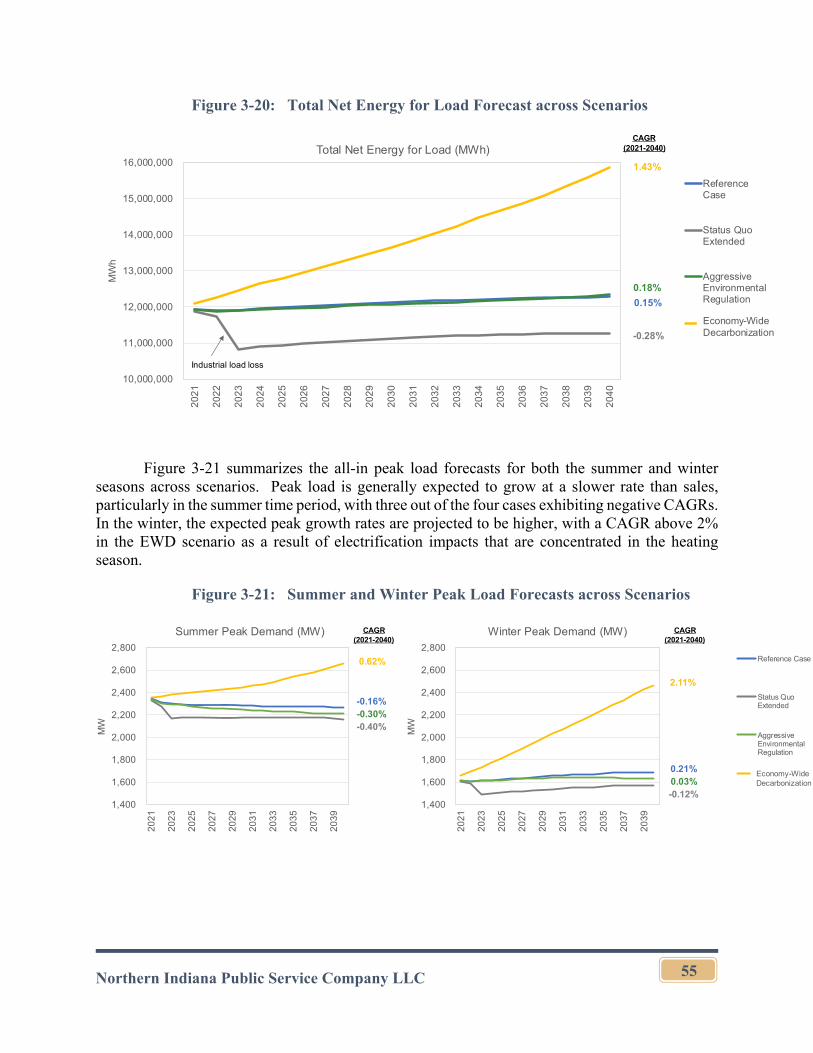
Northern Indiana Public Service Company LLC
55
Figure 3-20: Total Net Energy for Load Forecast across Scenarios
Figure 3-21 summarizes the all-in peak load forecasts for both the summer and winter seasons across scenarios. Peak load is generally expected to grow at a slower rate than sales, particularly in the summer time period, with three out of the four cases exhibiting negative CAGRs. In the winter, the expected peak growth rates are projected to be higher, with a CAGR above 2% in the EWD scenario as a result of electrification impacts that are concentrated in the heating season.
Figure 3-21: Summer and Winter Peak Load Forecasts across Scenarios
10,000,000
11,000,000
12,000,000
13,000,000
14,000,000
15,000,000
16,000,000
20
21
20
22
20
23
20
24
20
25
20
26
20
27
20
28
20
29
20
30
20
31
20
32
20
33
20
34
20
35
20
36
20
37
20
38
20
39
20
40
MW
h
Total Net Energy for Load (MWh)
ReferenceCase
Status QuoExtended
AggressiveEnvironmentalRegulation
Economy-wide DecarbandElectrification
CAGR (2021-2040)
1.43%
0.18%
0.15%
-0.28%
Industrial load loss
Economy-Wide Decarbonization
1,400
1,600
1,800
2,000
2,200
2,400
2,600
2,800
20
21
20
23
20
25
20
27
20
29
20
31
20
33
20
35
20
37
20
39
MW
Summer Peak Demand (MW)
1,400
1,600
1,800
2,000
2,200
2,400
2,600
2,800
20
21
20
23
20
25
20
27
20
29
20
31
20
33
20
35
20
37
20
39
MW
Winter Peak Demand (MW)
Reference Case
Status QuoExtended
AggressiveEnvironmentalRegulation
Economy-wideDecarb andElectrification
2.11%
0.03%0.21%
-0.12%
CAGR(2021-2040)
0.62%
-0.30%-0.16%
-0.40%
CAGR(2021-2040)
Economy-Wide Decarbonization
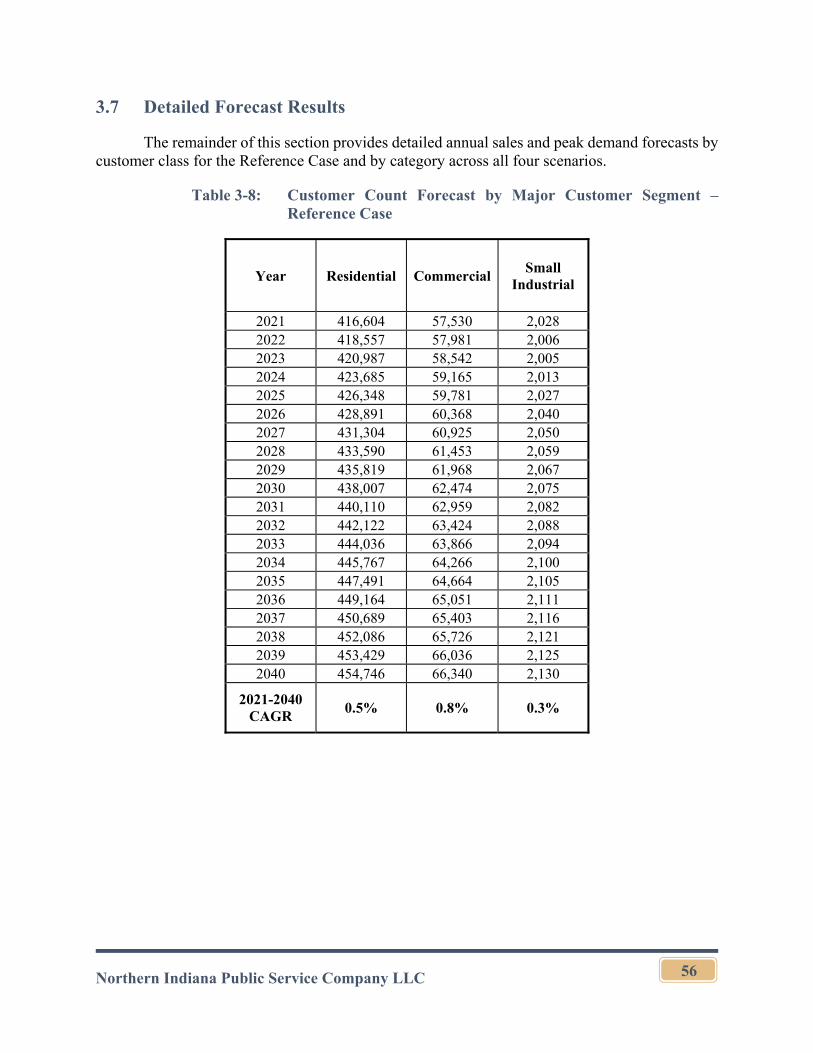
Northern Indiana Public Service Company LLC
56
3.7 Detailed Forecast Results
The remainder of this section provides detailed annual sales and peak demand forecasts by customer class for the Reference Case and by category across all four scenarios.
Table 3-8: Customer Count Forecast by Major Customer Segment – Reference Case
Year Residential Commercial Small
Industrial
2021 416,604 57,530 2,028 2022 418,557 57,981 2,006 2023 420,987 58,542 2,005 2024 423,685 59,165 2,013 2025 426,348 59,781 2,027 2026 428,891 60,368 2,040 2027 431,304 60,925 2,050 2028 433,590 61,453 2,059 2029 435,819 61,968 2,067 2030 438,007 62,474 2,075 2031 440,110 62,959 2,082 2032 442,122 63,424 2,088 2033 444,036 63,866 2,094 2034 445,767 64,266 2,100 2035 447,491 64,664 2,105 2036 449,164 65,051 2,111 2037 450,689 65,403 2,116 2038 452,086 65,726 2,121 2039 453,429 66,036 2,125 2040 454,746 66,340 2,130
2021-2040 CAGR
0.5% 0.8% 0.3%
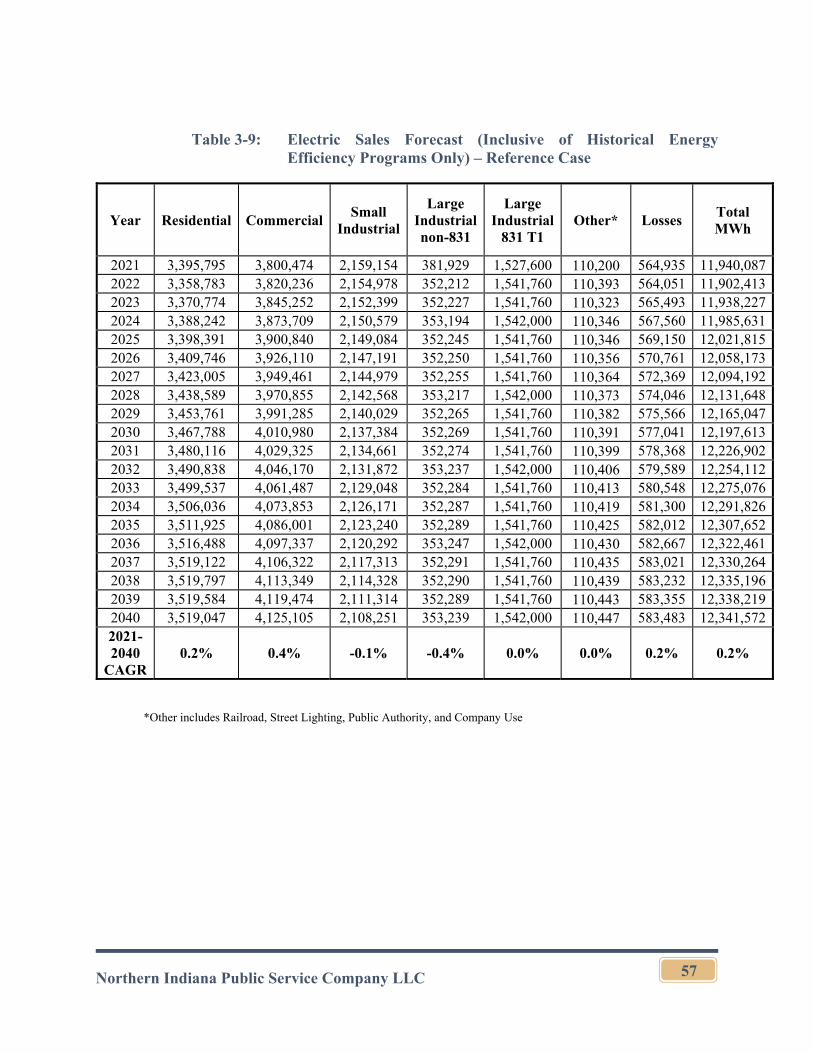
Northern Indiana Public Service Company LLC
57
Table 3-9: Electric Sales Forecast (Inclusive of Historical Energy Efficiency Programs Only) – Reference Case
Year Residential Commercial Small
Industrial
Large Industrial non-831
Large Industrial
831 T1 Other* Losses
Total MWh
2021 3,395,795 3,800,474 2,159,154 381,929 1,527,600 110,200 564,935 11,940,087 2022 3,358,783 3,820,236 2,154,978 352,212 1,541,760 110,393 564,051 11,902,413 2023 3,370,774 3,845,252 2,152,399 352,227 1,541,760 110,323 565,493 11,938,227 2024 3,388,242 3,873,709 2,150,579 353,194 1,542,000 110,346 567,560 11,985,631 2025 3,398,391 3,900,840 2,149,084 352,245 1,541,760 110,346 569,150 12,021,815 2026 3,409,746 3,926,110 2,147,191 352,250 1,541,760 110,356 570,761 12,058,173 2027 3,423,005 3,949,461 2,144,979 352,255 1,541,760 110,364 572,369 12,094,192 2028 3,438,589 3,970,855 2,142,568 353,217 1,542,000 110,373 574,046 12,131,648 2029 3,453,761 3,991,285 2,140,029 352,265 1,541,760 110,382 575,566 12,165,047 2030 3,467,788 4,010,980 2,137,384 352,269 1,541,760 110,391 577,041 12,197,613 2031 3,480,116 4,029,325 2,134,661 352,274 1,541,760 110,399 578,368 12,226,902 2032 3,490,838 4,046,170 2,131,872 353,237 1,542,000 110,406 579,589 12,254,112 2033 3,499,537 4,061,487 2,129,048 352,284 1,541,760 110,413 580,548 12,275,076 2034 3,506,036 4,073,853 2,126,171 352,287 1,541,760 110,419 581,300 12,291,826 2035 3,511,925 4,086,001 2,123,240 352,289 1,541,760 110,425 582,012 12,307,652 2036 3,516,488 4,097,337 2,120,292 353,247 1,542,000 110,430 582,667 12,322,461 2037 3,519,122 4,106,322 2,117,313 352,291 1,541,760 110,435 583,021 12,330,264 2038 3,519,797 4,113,349 2,114,328 352,290 1,541,760 110,439 583,232 12,335,196 2039 3,519,584 4,119,474 2,111,314 352,289 1,541,760 110,443 583,355 12,338,219 2040 3,519,047 4,125,105 2,108,251 353,239 1,542,000 110,447 583,483 12,341,572 2021-2040
CAGR 0.2% 0.4% -0.1% -0.4% 0.0% 0.0% 0.2% 0.2%
*Other includes Railroad, Street Lighting, Public Authority, and Company Use
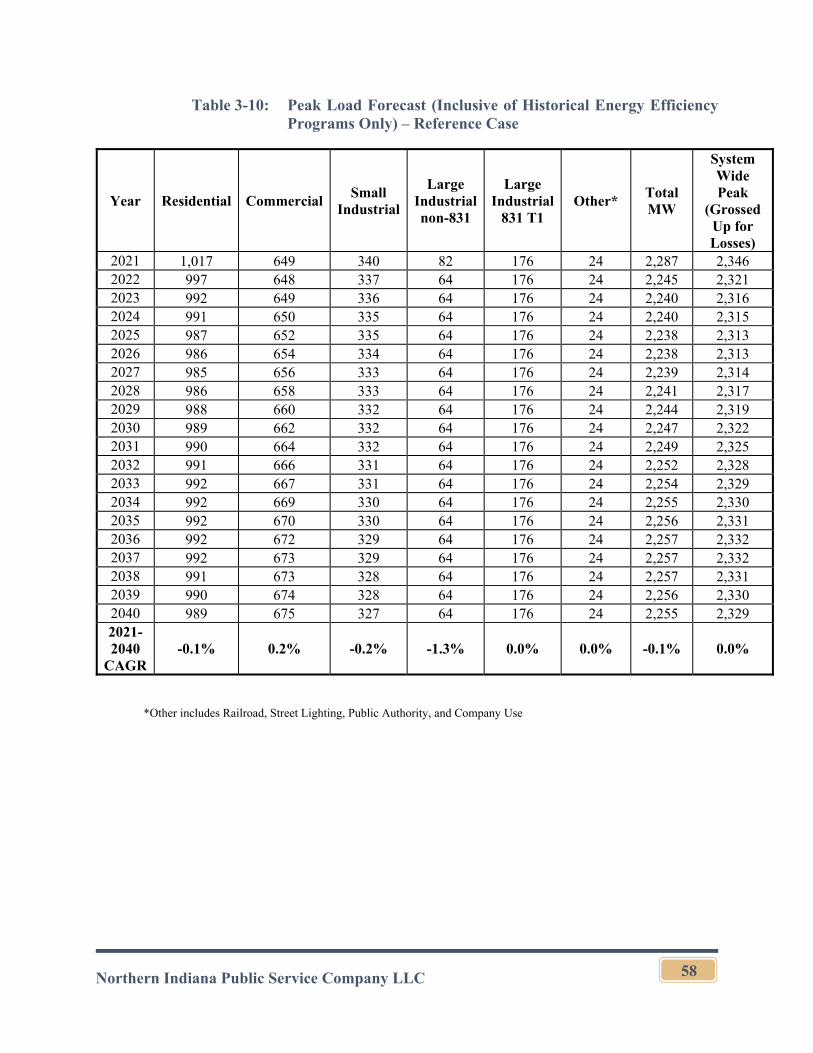
Northern Indiana Public Service Company LLC
58
Table 3-10: Peak Load Forecast (Inclusive of Historical Energy Efficiency Programs Only) – Reference Case
Year Residential Commercial Small
Industrial
Large Industrial non-831
Large Industrial
831 T1 Other*
Total MW
System Wide Peak
(Grossed Up for Losses)
2021 1,017 649 340 82 176 24 2,287 2,346 2022 997 648 337 64 176 24 2,245 2,321 2023 992 649 336 64 176 24 2,240 2,316 2024 991 650 335 64 176 24 2,240 2,315 2025 987 652 335 64 176 24 2,238 2,313 2026 986 654 334 64 176 24 2,238 2,313 2027 985 656 333 64 176 24 2,239 2,314 2028 986 658 333 64 176 24 2,241 2,317 2029 988 660 332 64 176 24 2,244 2,319 2030 989 662 332 64 176 24 2,247 2,322 2031 990 664 332 64 176 24 2,249 2,325 2032 991 666 331 64 176 24 2,252 2,328 2033 992 667 331 64 176 24 2,254 2,329 2034 992 669 330 64 176 24 2,255 2,330 2035 992 670 330 64 176 24 2,256 2,331 2036 992 672 329 64 176 24 2,257 2,332 2037 992 673 329 64 176 24 2,257 2,332 2038 991 673 328 64 176 24 2,257 2,331 2039 990 674 328 64 176 24 2,256 2,330 2040 989 675 327 64 176 24 2,255 2,329 2021-2040
CAGR -0.1% 0.2% -0.2% -1.3% 0.0% 0.0% -0.1% 0.0%
*Other includes Railroad, Street Lighting, Public Authority, and Company Use
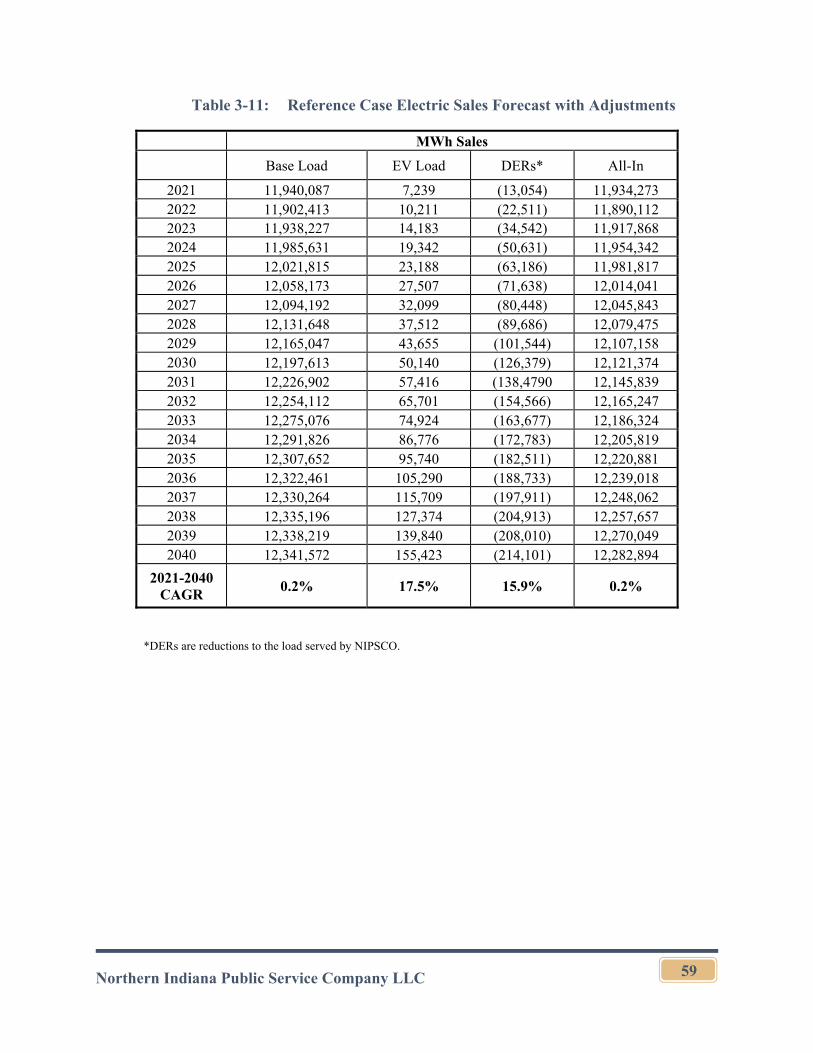
Northern Indiana Public Service Company LLC
59
Table 3-11: Reference Case Electric Sales Forecast with Adjustments
MWh Sales Base Load EV Load DERs* All-In
2021 11,940,087 7,239 (13,054) 11,934,273 2022 11,902,413 10,211 (22,511) 11,890,112 2023 11,938,227 14,183 (34,542) 11,917,868 2024 11,985,631 19,342 (50,631) 11,954,342 2025 12,021,815 23,188 (63,186) 11,981,817 2026 12,058,173 27,507 (71,638) 12,014,041 2027 12,094,192 32,099 (80,448) 12,045,843 2028 12,131,648 37,512 (89,686) 12,079,475 2029 12,165,047 43,655 (101,544) 12,107,158 2030 12,197,613 50,140 (126,379) 12,121,374 2031 12,226,902 57,416 (138,4790 12,145,839 2032 12,254,112 65,701 (154,566) 12,165,247 2033 12,275,076 74,924 (163,677) 12,186,324 2034 12,291,826 86,776 (172,783) 12,205,819 2035 12,307,652 95,740 (182,511) 12,220,881 2036 12,322,461 105,290 (188,733) 12,239,018 2037 12,330,264 115,709 (197,911) 12,248,062 2038 12,335,196 127,374 (204,913) 12,257,657 2039 12,338,219 139,840 (208,010) 12,270,049 2040 12,341,572 155,423 (214,101) 12,282,894
2021-2040 CAGR
0.2% 17.5% 15.9% 0.2%
*DERs are reductions to the load served by NIPSCO.
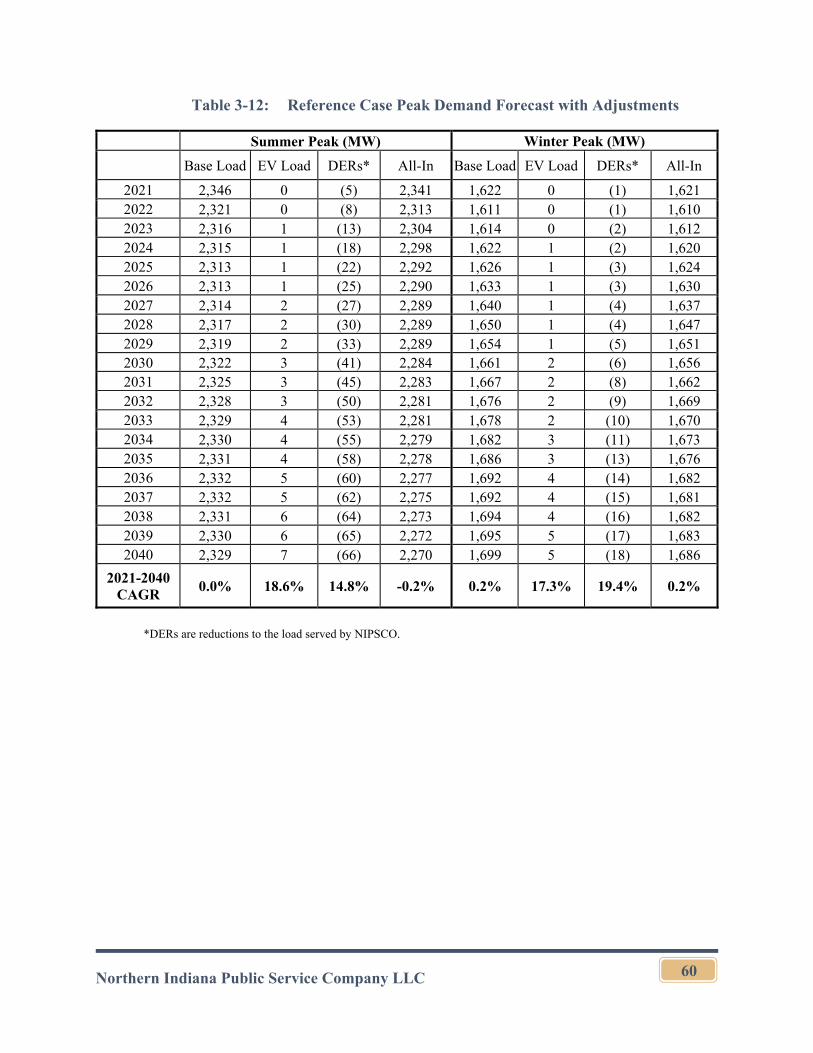
Northern Indiana Public Service Company LLC
60
Table 3-12: Reference Case Peak Demand Forecast with Adjustments
Summer Peak (MW) Winter Peak (MW) Base Load EV Load DERs* All-In Base Load EV Load DERs* All-In
2021 2,346 0 (5) 2,341 1,622 0 (1) 1,621 2022 2,321 0 (8) 2,313 1,611 0 (1) 1,610 2023 2,316 1 (13) 2,304 1,614 0 (2) 1,612 2024 2,315 1 (18) 2,298 1,622 1 (2) 1,620 2025 2,313 1 (22) 2,292 1,626 1 (3) 1,624 2026 2,313 1 (25) 2,290 1,633 1 (3) 1,630 2027 2,314 2 (27) 2,289 1,640 1 (4) 1,637 2028 2,317 2 (30) 2,289 1,650 1 (4) 1,647 2029 2,319 2 (33) 2,289 1,654 1 (5) 1,651 2030 2,322 3 (41) 2,284 1,661 2 (6) 1,656 2031 2,325 3 (45) 2,283 1,667 2 (8) 1,662 2032 2,328 3 (50) 2,281 1,676 2 (9) 1,669 2033 2,329 4 (53) 2,281 1,678 2 (10) 1,670 2034 2,330 4 (55) 2,279 1,682 3 (11) 1,673 2035 2,331 4 (58) 2,278 1,686 3 (13) 1,676 2036 2,332 5 (60) 2,277 1,692 4 (14) 1,682 2037 2,332 5 (62) 2,275 1,692 4 (15) 1,681 2038 2,331 6 (64) 2,273 1,694 4 (16) 1,682 2039 2,330 6 (65) 2,272 1,695 5 (17) 1,683 2040 2,329 7 (66) 2,270 1,699 5 (18) 1,686
2021-2040 CAGR
0.0% 18.6% 14.8% -0.2% 0.2% 17.3% 19.4% 0.2%
*DERs are reductions to the load served by NIPSCO.
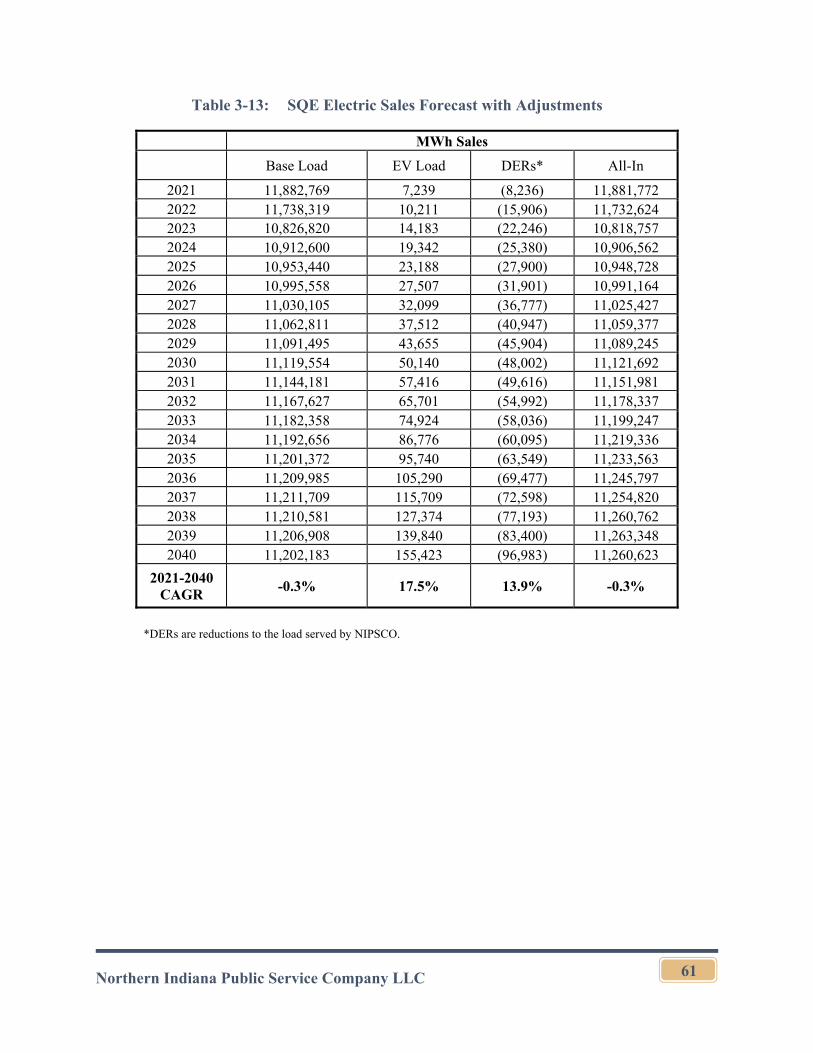
Northern Indiana Public Service Company LLC
61
Table 3-13: SQE Electric Sales Forecast with Adjustments
MWh Sales Base Load EV Load DERs* All-In
2021 11,882,769 7,239 (8,236) 11,881,772 2022 11,738,319 10,211 (15,906) 11,732,624 2023 10,826,820 14,183 (22,246) 10,818,757 2024 10,912,600 19,342 (25,380) 10,906,562 2025 10,953,440 23,188 (27,900) 10,948,728 2026 10,995,558 27,507 (31,901) 10,991,164 2027 11,030,105 32,099 (36,777) 11,025,427 2028 11,062,811 37,512 (40,947) 11,059,377 2029 11,091,495 43,655 (45,904) 11,089,245 2030 11,119,554 50,140 (48,002) 11,121,692 2031 11,144,181 57,416 (49,616) 11,151,981 2032 11,167,627 65,701 (54,992) 11,178,337 2033 11,182,358 74,924 (58,036) 11,199,247 2034 11,192,656 86,776 (60,095) 11,219,336 2035 11,201,372 95,740 (63,549) 11,233,563 2036 11,209,985 105,290 (69,477) 11,245,797 2037 11,211,709 115,709 (72,598) 11,254,820 2038 11,210,581 127,374 (77,193) 11,260,762 2039 11,206,908 139,840 (83,400) 11,263,348 2040 11,202,183 155,423 (96,983) 11,260,623
2021-2040 CAGR
-0.3% 17.5% 13.9% -0.3%
*DERs are reductions to the load served by NIPSCO.
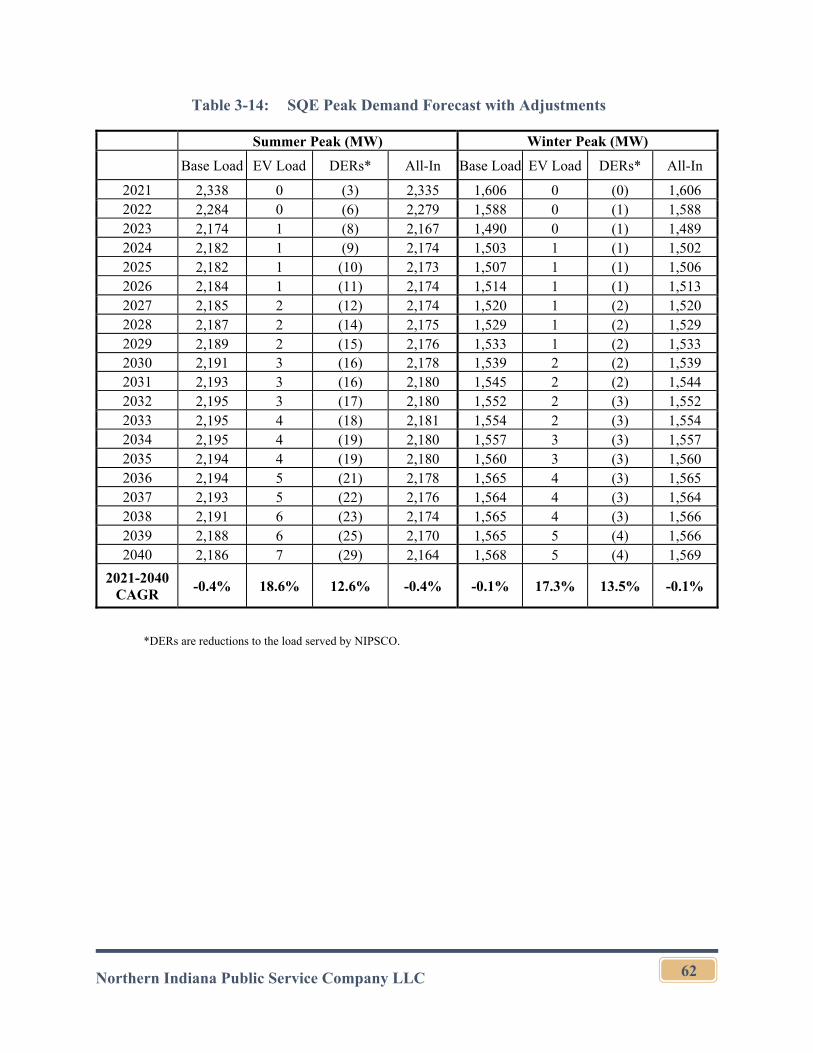
Northern Indiana Public Service Company LLC
62
Table 3-14: SQE Peak Demand Forecast with Adjustments
Summer Peak (MW) Winter Peak (MW) Base Load EV Load DERs* All-In Base Load EV Load DERs* All-In
2021 2,338 0 (3) 2,335 1,606 0 (0) 1,606 2022 2,284 0 (6) 2,279 1,588 0 (1) 1,588 2023 2,174 1 (8) 2,167 1,490 0 (1) 1,489 2024 2,182 1 (9) 2,174 1,503 1 (1) 1,502 2025 2,182 1 (10) 2,173 1,507 1 (1) 1,506 2026 2,184 1 (11) 2,174 1,514 1 (1) 1,513 2027 2,185 2 (12) 2,174 1,520 1 (2) 1,520 2028 2,187 2 (14) 2,175 1,529 1 (2) 1,529 2029 2,189 2 (15) 2,176 1,533 1 (2) 1,533 2030 2,191 3 (16) 2,178 1,539 2 (2) 1,539 2031 2,193 3 (16) 2,180 1,545 2 (2) 1,544 2032 2,195 3 (17) 2,180 1,552 2 (3) 1,552 2033 2,195 4 (18) 2,181 1,554 2 (3) 1,554 2034 2,195 4 (19) 2,180 1,557 3 (3) 1,557 2035 2,194 4 (19) 2,180 1,560 3 (3) 1,560 2036 2,194 5 (21) 2,178 1,565 4 (3) 1,565 2037 2,193 5 (22) 2,176 1,564 4 (3) 1,564 2038 2,191 6 (23) 2,174 1,565 4 (3) 1,566 2039 2,188 6 (25) 2,170 1,565 5 (4) 1,566 2040 2,186 7 (29) 2,164 1,568 5 (4) 1,569
2021-2040 CAGR
-0.4% 18.6% 12.6% -0.4% -0.1% 17.3% 13.5% -0.1%
*DERs are reductions to the load served by NIPSCO.
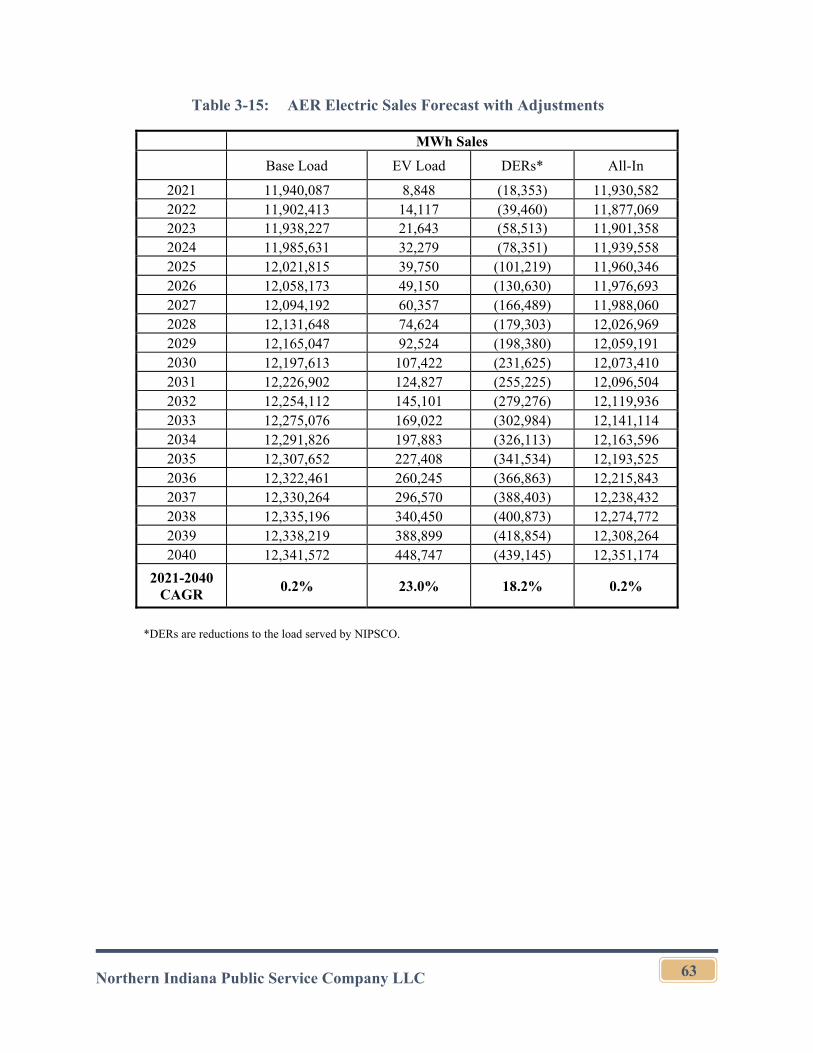
Northern Indiana Public Service Company LLC
63
Table 3-15: AER Electric Sales Forecast with Adjustments
MWh Sales Base Load EV Load DERs* All-In
2021 11,940,087 8,848 (18,353) 11,930,582 2022 11,902,413 14,117 (39,460) 11,877,069 2023 11,938,227 21,643 (58,513) 11,901,358 2024 11,985,631 32,279 (78,351) 11,939,558 2025 12,021,815 39,750 (101,219) 11,960,346 2026 12,058,173 49,150 (130,630) 11,976,693 2027 12,094,192 60,357 (166,489) 11,988,060 2028 12,131,648 74,624 (179,303) 12,026,969 2029 12,165,047 92,524 (198,380) 12,059,191 2030 12,197,613 107,422 (231,625) 12,073,410 2031 12,226,902 124,827 (255,225) 12,096,504 2032 12,254,112 145,101 (279,276) 12,119,936 2033 12,275,076 169,022 (302,984) 12,141,114 2034 12,291,826 197,883 (326,113) 12,163,596 2035 12,307,652 227,408 (341,534) 12,193,525 2036 12,322,461 260,245 (366,863) 12,215,843 2037 12,330,264 296,570 (388,403) 12,238,432 2038 12,335,196 340,450 (400,873) 12,274,772 2039 12,338,219 388,899 (418,854) 12,308,264 2040 12,341,572 448,747 (439,145) 12,351,174
2021-2040 CAGR
0.2% 23.0% 18.2% 0.2%
*DERs are reductions to the load served by NIPSCO.
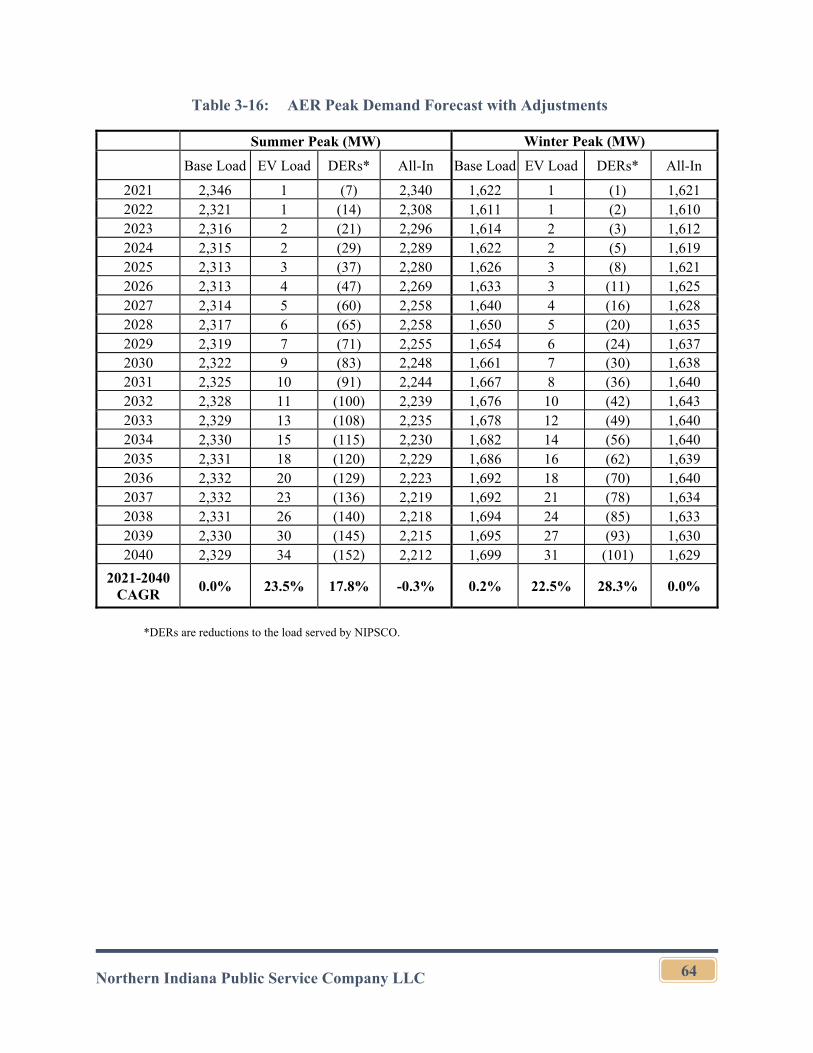
Northern Indiana Public Service Company LLC
64
Table 3-16: AER Peak Demand Forecast with Adjustments
Summer Peak (MW) Winter Peak (MW) Base Load EV Load DERs* All-In Base Load EV Load DERs* All-In
2021 2,346 1 (7) 2,340 1,622 1 (1) 1,621 2022 2,321 1 (14) 2,308 1,611 1 (2) 1,610 2023 2,316 2 (21) 2,296 1,614 2 (3) 1,612 2024 2,315 2 (29) 2,289 1,622 2 (5) 1,619 2025 2,313 3 (37) 2,280 1,626 3 (8) 1,621 2026 2,313 4 (47) 2,269 1,633 3 (11) 1,625 2027 2,314 5 (60) 2,258 1,640 4 (16) 1,628 2028 2,317 6 (65) 2,258 1,650 5 (20) 1,635 2029 2,319 7 (71) 2,255 1,654 6 (24) 1,637 2030 2,322 9 (83) 2,248 1,661 7 (30) 1,638 2031 2,325 10 (91) 2,244 1,667 8 (36) 1,640 2032 2,328 11 (100) 2,239 1,676 10 (42) 1,643 2033 2,329 13 (108) 2,235 1,678 12 (49) 1,640 2034 2,330 15 (115) 2,230 1,682 14 (56) 1,640 2035 2,331 18 (120) 2,229 1,686 16 (62) 1,639 2036 2,332 20 (129) 2,223 1,692 18 (70) 1,640 2037 2,332 23 (136) 2,219 1,692 21 (78) 1,634 2038 2,331 26 (140) 2,218 1,694 24 (85) 1,633 2039 2,330 30 (145) 2,215 1,695 27 (93) 1,630 2040 2,329 34 (152) 2,212 1,699 31 (101) 1,629
2021-2040 CAGR
0.0% 23.5% 17.8% -0.3% 0.2% 22.5% 28.3% 0.0%
*DERs are reductions to the load served by NIPSCO.
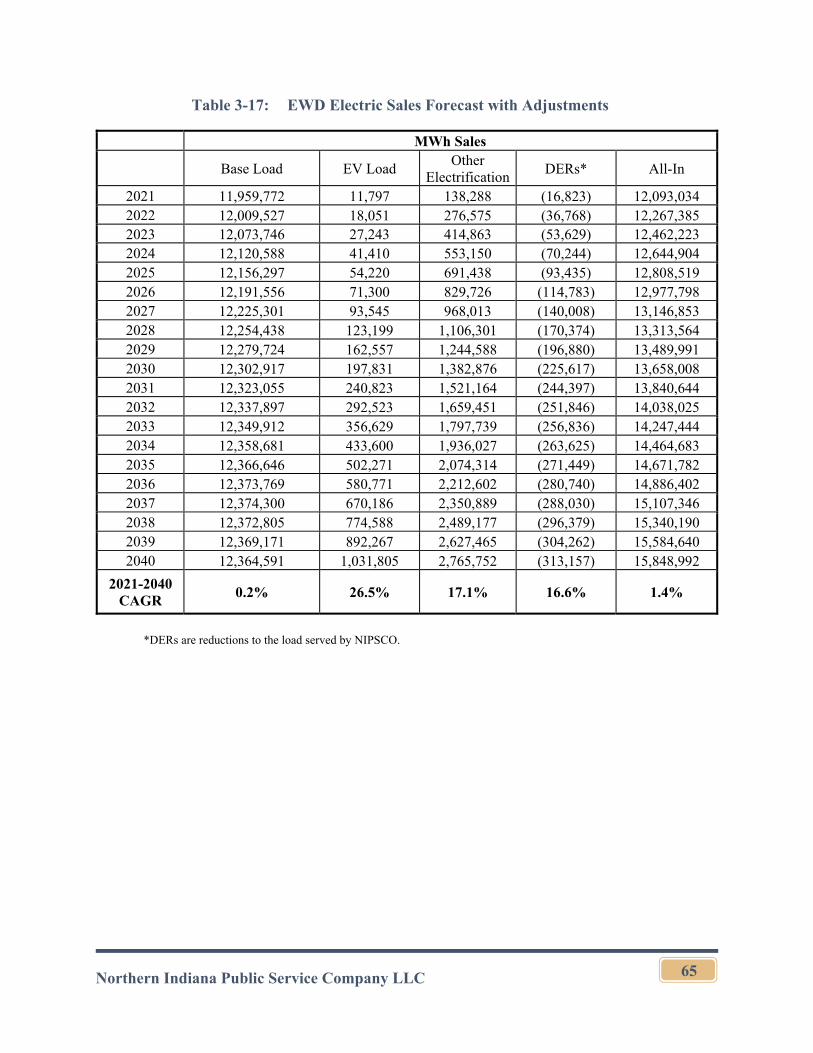
Northern Indiana Public Service Company LLC
65
Table 3-17: EWD Electric Sales Forecast with Adjustments
MWh Sales
Base Load EV Load Other
Electrification DERs* All-In
2021 11,959,772 11,797 138,288 (16,823) 12,093,034 2022 12,009,527 18,051 276,575 (36,768) 12,267,385 2023 12,073,746 27,243 414,863 (53,629) 12,462,223 2024 12,120,588 41,410 553,150 (70,244) 12,644,904 2025 12,156,297 54,220 691,438 (93,435) 12,808,519 2026 12,191,556 71,300 829,726 (114,783) 12,977,798 2027 12,225,301 93,545 968,013 (140,008) 13,146,853 2028 12,254,438 123,199 1,106,301 (170,374) 13,313,564 2029 12,279,724 162,557 1,244,588 (196,880) 13,489,991 2030 12,302,917 197,831 1,382,876 (225,617) 13,658,008 2031 12,323,055 240,823 1,521,164 (244,397) 13,840,644 2032 12,337,897 292,523 1,659,451 (251,846) 14,038,025 2033 12,349,912 356,629 1,797,739 (256,836) 14,247,444 2034 12,358,681 433,600 1,936,027 (263,625) 14,464,683 2035 12,366,646 502,271 2,074,314 (271,449) 14,671,782 2036 12,373,769 580,771 2,212,602 (280,740) 14,886,402 2037 12,374,300 670,186 2,350,889 (288,030) 15,107,346 2038 12,372,805 774,588 2,489,177 (296,379) 15,340,190 2039 12,369,171 892,267 2,627,465 (304,262) 15,584,640 2040 12,364,591 1,031,805 2,765,752 (313,157) 15,848,992
2021-2040 CAGR
0.2% 26.5% 17.1% 16.6% 1.4%
*DERs are reductions to the load served by NIPSCO.
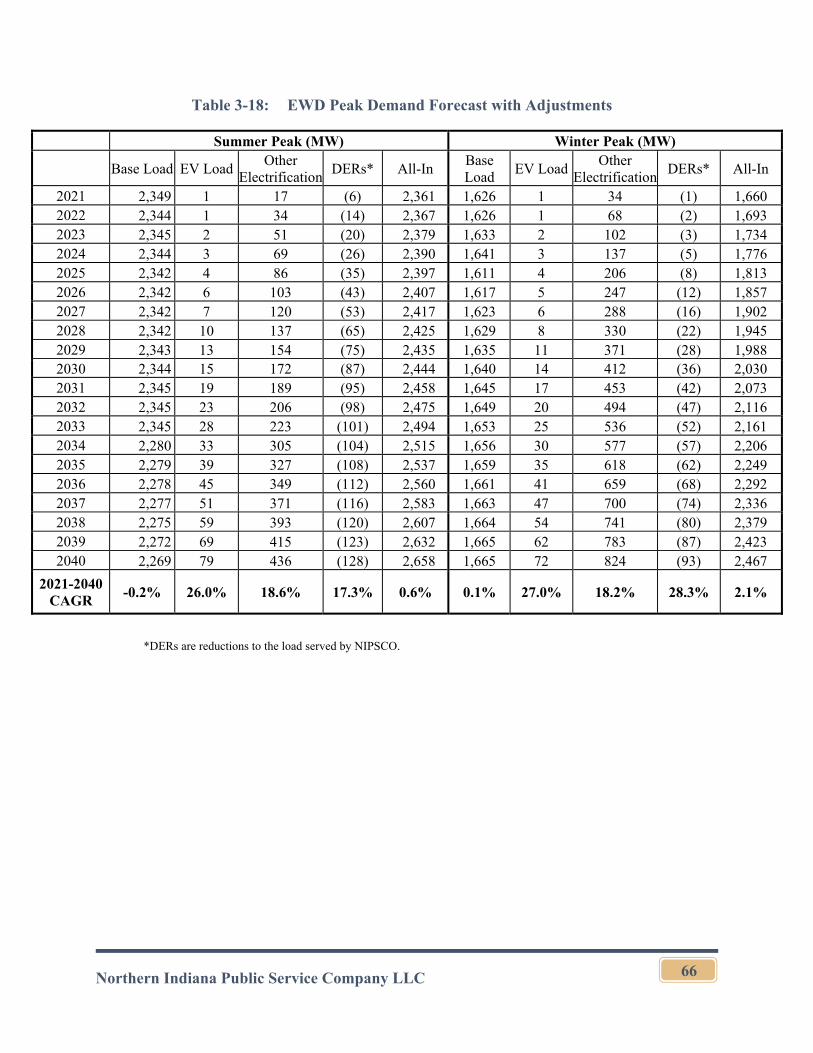
Northern Indiana Public Service Company LLC
66
Table 3-18: EWD Peak Demand Forecast with Adjustments
Summer Peak (MW) Winter Peak (MW)
Base Load EV Load Other
ElectrificationDERs* All-In
Base Load
EV Load Other
ElectrificationDERs* All-In
2021 2,349 1 17 (6) 2,361 1,626 1 34 (1) 1,660 2022 2,344 1 34 (14) 2,367 1,626 1 68 (2) 1,693 2023 2,345 2 51 (20) 2,379 1,633 2 102 (3) 1,734 2024 2,344 3 69 (26) 2,390 1,641 3 137 (5) 1,776 2025 2,342 4 86 (35) 2,397 1,611 4 206 (8) 1,813 2026 2,342 6 103 (43) 2,407 1,617 5 247 (12) 1,857 2027 2,342 7 120 (53) 2,417 1,623 6 288 (16) 1,902 2028 2,342 10 137 (65) 2,425 1,629 8 330 (22) 1,945 2029 2,343 13 154 (75) 2,435 1,635 11 371 (28) 1,988 2030 2,344 15 172 (87) 2,444 1,640 14 412 (36) 2,030 2031 2,345 19 189 (95) 2,458 1,645 17 453 (42) 2,073 2032 2,345 23 206 (98) 2,475 1,649 20 494 (47) 2,116 2033 2,345 28 223 (101) 2,494 1,653 25 536 (52) 2,161 2034 2,280 33 305 (104) 2,515 1,656 30 577 (57) 2,206 2035 2,279 39 327 (108) 2,537 1,659 35 618 (62) 2,249 2036 2,278 45 349 (112) 2,560 1,661 41 659 (68) 2,292 2037 2,277 51 371 (116) 2,583 1,663 47 700 (74) 2,336 2038 2,275 59 393 (120) 2,607 1,664 54 741 (80) 2,379 2039 2,272 69 415 (123) 2,632 1,665 62 783 (87) 2,423 2040 2,269 79 436 (128) 2,658 1,665 72 824 (93) 2,467
2021-2040 CAGR
-0.2% 26.0% 18.6% 17.3% 0.6% 0.1% 27.0% 18.2% 28.3% 2.1%
*DERs are reductions to the load served by NIPSCO.
Northern Indiana Public Service Company LLC
67
Section 4. Supply-Side Resources
NIPSCO’s generation fleet is in the midst of a transition as with much of the electric industry. NIPSCO is committed to make every reasonable effort to acquire fuel and generate or purchase power or both so as to provide electricity to its retail customers at the lowest cost reasonably possible. Consistent with this objective and as set forth in the 2018 IRP, NIPSCO continues to execute on the generation plan to retire coal generation and replace it with a mix of renewable resources. NIPSCO’s supply-side resources are comprised of the existing coal and natural gas units, renewable generation currently in-service and planned to be in-service, and a mix of future resource options.
4.1 Existing Resources
NIPSCO has a variety of generation resources to meet its customers’ forecast capacity and energy needs. Not only do these resources need to meet the principles set out in Section 1, they must operate within MISO, the Regional Transmission Organization, and subject to NERC standards. NIPSCO has registered with NERC as a Distribution Provider, Generator Owner, Generator Operator, Load Serving Entity, Purchasing-Selling Entity, Resource Planner and Transmission Planner. NIPSCO is registered as a Balancing Authority, Transmission Operator and Transmission Owner in MISO. Each Registered Entity is subject to compliance with applicable NERC and Regional Reliability Organization Reliability standards approved by FERC. In NIPSCO’s case, its Regional Reliability Organization is ReliabilityFirst.
NIPSCO-owned generating resources consist of coal, natural gas and hydro units. Additionally NIPSCO meets it customer needs with 4 wind purchase power agreements. The total NDC of the existing resources is 2,491 MW across multiple generation sites, including Schahfer (Units 16A, 16B, 17 and 18), Michigan City (Unit 12), Sugar Creek and two hydroelectric generating sites near Monticello, Indiana (Norway Hydro and Oakdale Hydro). Of the total capacity, 48% is from coal-fired units, 28% is from natural gas-fired units and 24% is from wind and hydroelectric generation units. Table 4-1 provides a summary of the current generating facilities operated by NIPSCO.
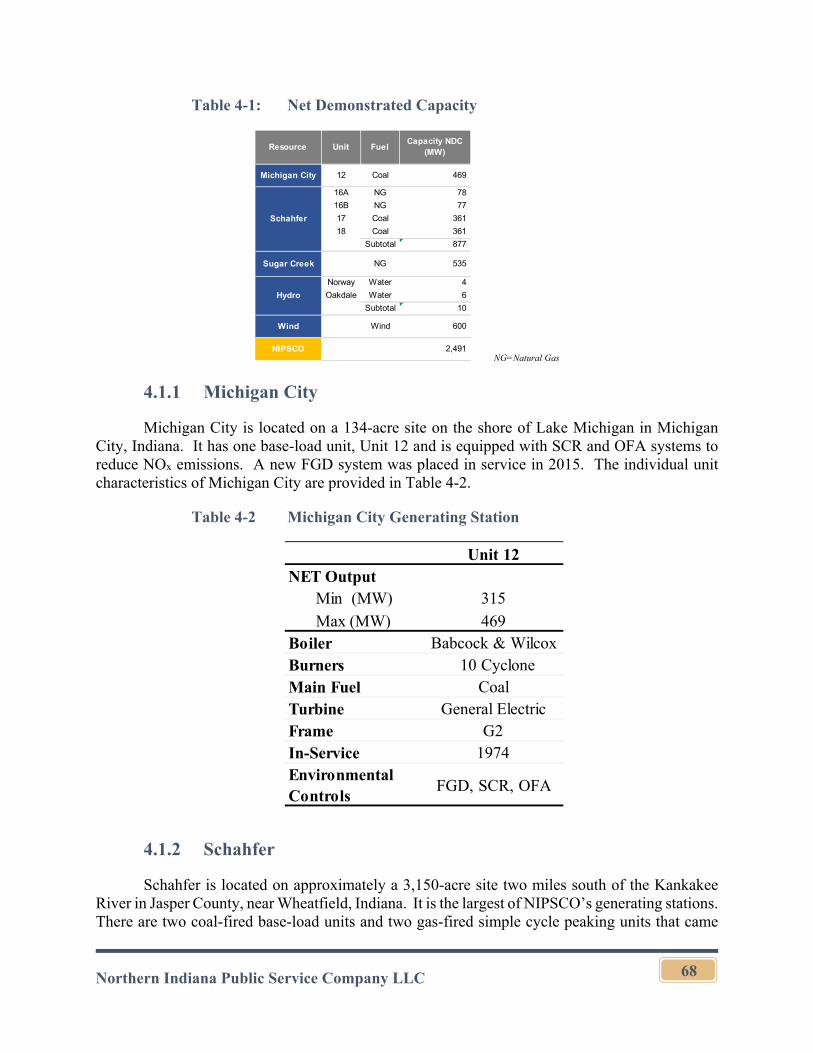
Northern Indiana Public Service Company LLC
68
Table 4-1: Net Demonstrated Capacity
NG=Natural Gas
4.1.1 Michigan City
Michigan City is located on a 134-acre site on the shore of Lake Michigan in Michigan City, Indiana. It has one base-load unit, Unit 12 and is equipped with SCR and OFA systems to reduce NOx emissions. A new FGD system was placed in service in 2015. The individual unit characteristics of Michigan City are provided in Table 4-2.
Table 4-2 Michigan City Generating Station
4.1.2 Schahfer
Schahfer is located on approximately a 3,150-acre site two miles south of the Kankakee River in Jasper County, near Wheatfield, Indiana. It is the largest of NIPSCO’s generating stations. There are two coal-fired base-load units and two gas-fired simple cycle peaking units that came
Resource Unit FuelCapacity NDC
(MW)
Michigan City 12 Coal 469
16A NG 78
16B NG 77
17 Coal 361
18 Coal 361
Subtotal 877
Sugar Creek NG 535
Norway Water 4
Oakdale Water 6
Subtotal 10
Wind Wind 600
NIPSCO 2,491
Schahfer
Hydro
Unit 12NET Output Min (MW) 315
Max (MW) 469Boiler Babcock & WilcoxBurners 10 CycloneMain Fuel CoalTurbine General ElectricFrame G2In-Service 1974Environmental Controls
FGD, SCR, OFA
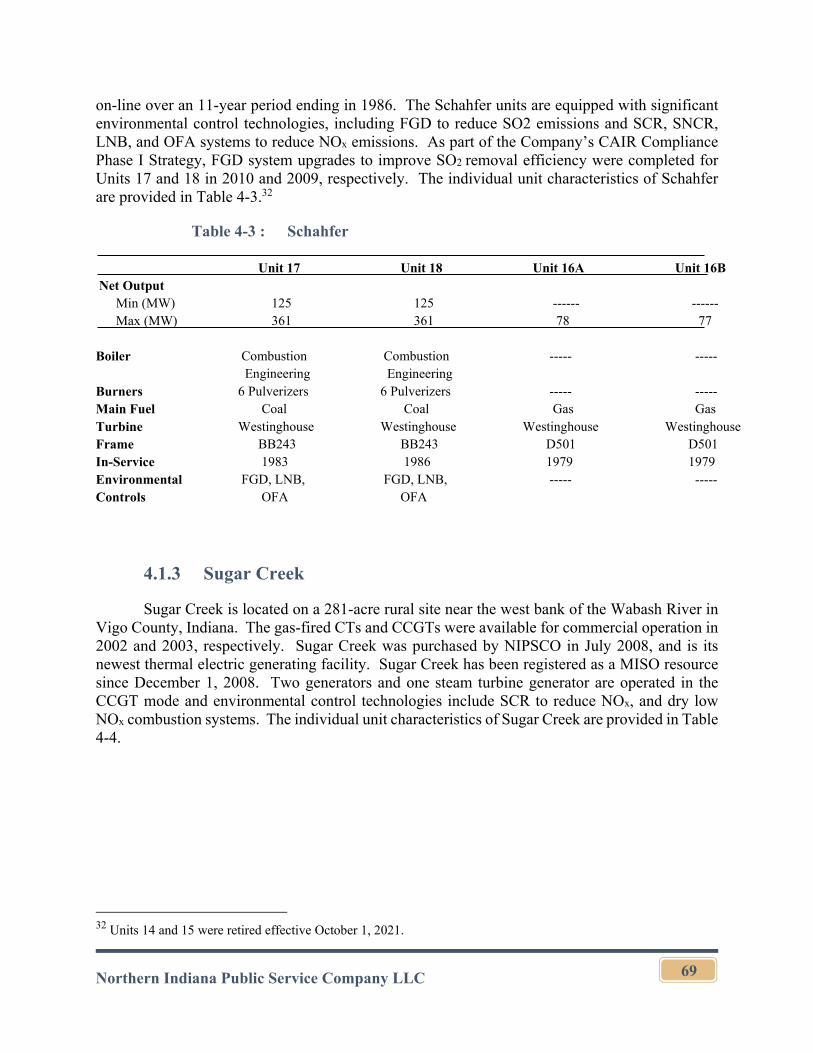
Northern Indiana Public Service Company LLC
69
on-line over an 11-year period ending in 1986. The Schahfer units are equipped with significant environmental control technologies, including FGD to reduce SO2 emissions and SCR, SNCR, LNB, and OFA systems to reduce NOx emissions. As part of the Company’s CAIR Compliance Phase I Strategy, FGD system upgrades to improve SO2 removal efficiency were completed for Units 17 and 18 in 2010 and 2009, respectively. The individual unit characteristics of Schahfer are provided in Table 4-3.32
Table 4-3 : Schahfer
Net Output Min (MW) Max (MW) Boiler Burners Main Fuel Turbine Frame In-Service Environmental Controls
Unit 17 125 361 Combustion Engineering 6 Pulverizers Coal Westinghouse BB243 1983 FGD, LNB, OFA
Unit 18 125 361 Combustion Engineering 6 Pulverizers Coal Westinghouse BB243 1986 FGD, LNB, OFA
Unit 16A ------ 78 ----- ----- Gas Westinghouse D501 1979 -----
Unit 16B ------ 77 ----- ----- Gas Westinghouse D501 1979 -----
4.1.3 Sugar Creek
Sugar Creek is located on a 281-acre rural site near the west bank of the Wabash River in Vigo County, Indiana. The gas-fired CTs and CCGTs were available for commercial operation in 2002 and 2003, respectively. Sugar Creek was purchased by NIPSCO in July 2008, and is its newest thermal electric generating facility. Sugar Creek has been registered as a MISO resource since December 1, 2008. Two generators and one steam turbine generator are operated in the CCGT mode and environmental control technologies include SCR to reduce NOx, and dry low NOx combustion systems. The individual unit characteristics of Sugar Creek are provided in Table 4-4.
32 Units 14 and 15 were retired effective October 1, 2021.
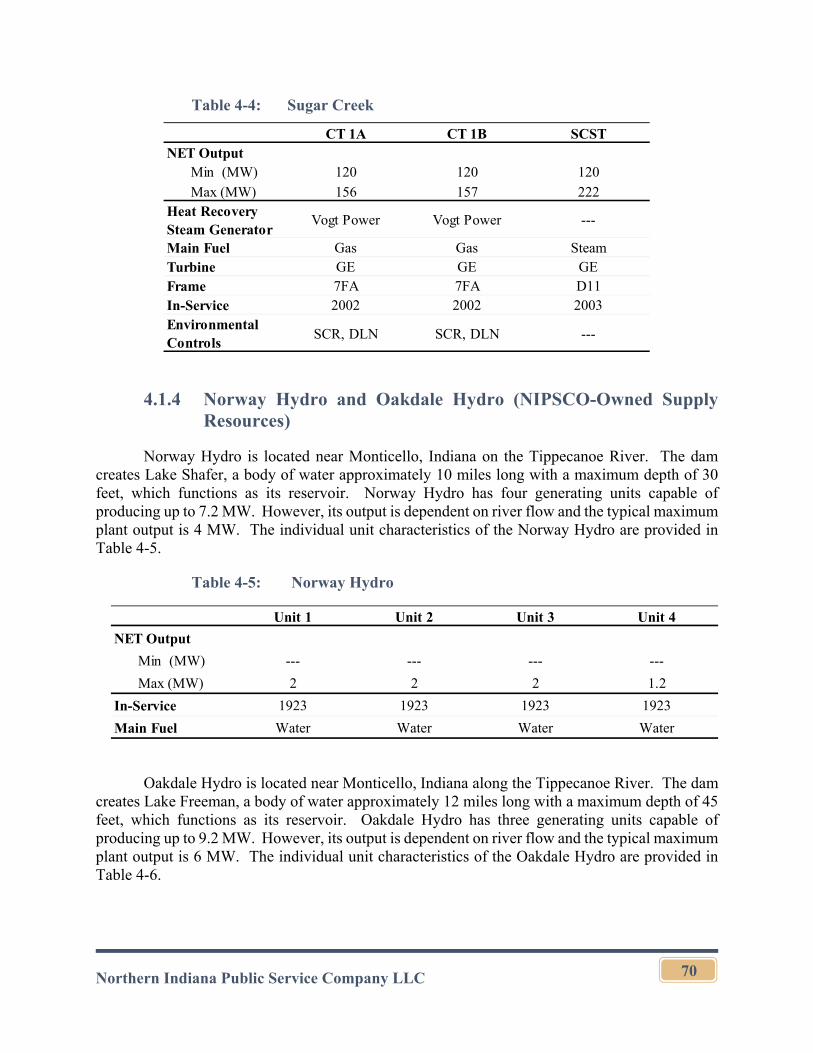
Northern Indiana Public Service Company LLC
70
Table 4-4: Sugar Creek
4.1.4 Norway Hydro and Oakdale Hydro (NIPSCO-Owned Supply Resources)
Norway Hydro is located near Monticello, Indiana on the Tippecanoe River. The dam creates Lake Shafer, a body of water approximately 10 miles long with a maximum depth of 30 feet, which functions as its reservoir. Norway Hydro has four generating units capable of producing up to 7.2 MW. However, its output is dependent on river flow and the typical maximum plant output is 4 MW. The individual unit characteristics of the Norway Hydro are provided in Table 4-5.
Table 4-5: Norway Hydro
Oakdale Hydro is located near Monticello, Indiana along the Tippecanoe River. The dam creates Lake Freeman, a body of water approximately 12 miles long with a maximum depth of 45 feet, which functions as its reservoir. Oakdale Hydro has three generating units capable of producing up to 9.2 MW. However, its output is dependent on river flow and the typical maximum plant output is 6 MW. The individual unit characteristics of the Oakdale Hydro are provided in Table 4-6.
CT 1A CT 1B SCSTNET Output Min (MW) 120 120 120
Max (MW) 156 157 222Heat Recovery Steam Generator
Vogt Power Vogt Power ---
Main Fuel Gas Gas SteamTurbine GE GE GEFrame 7FA 7FA D11In-Service 2002 2002 2003Environmental Controls
SCR, DLN SCR, DLN ---
Unit 1 Unit 2 Unit 3 Unit 4
NET Output
Min (MW) --- --- --- ---
Max (MW) 2 2 2 1.2
In-Service 1923 1923 1923 1923
Main Fuel Water Water Water Water
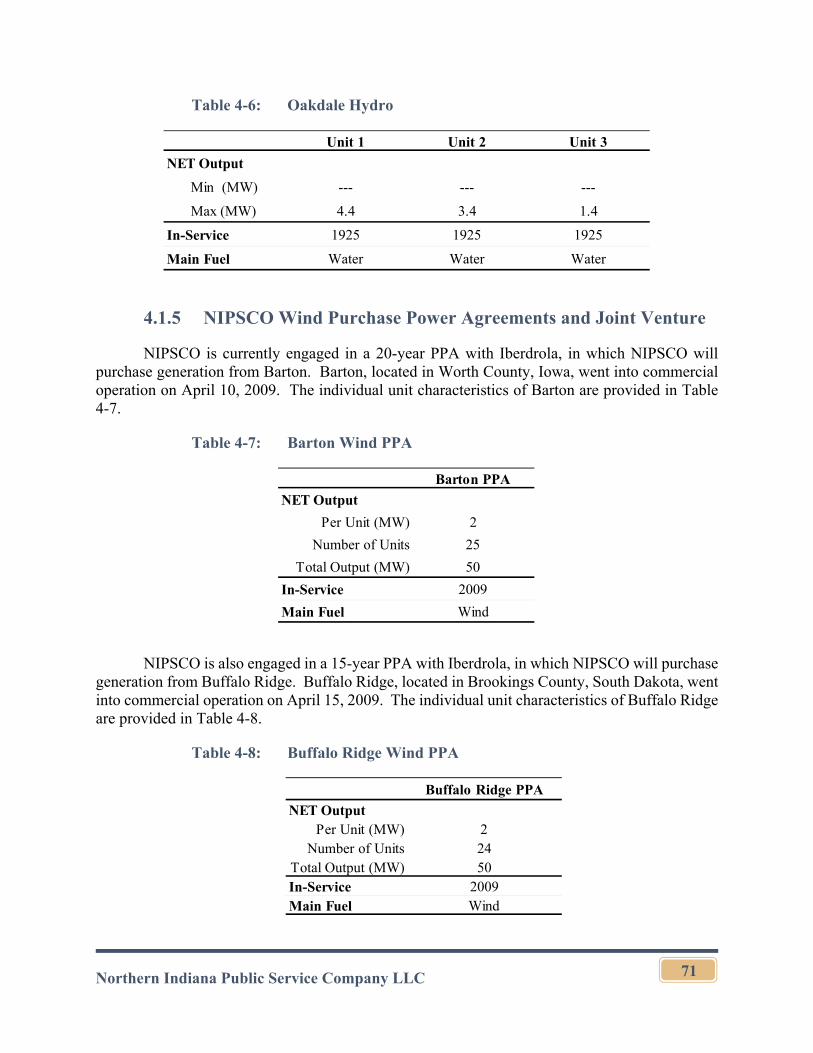
Northern Indiana Public Service Company LLC
71
Table 4-6: Oakdale Hydro
4.1.5 NIPSCO Wind Purchase Power Agreements and Joint Venture
NIPSCO is currently engaged in a 20-year PPA with Iberdrola, in which NIPSCO will purchase generation from Barton. Barton, located in Worth County, Iowa, went into commercial operation on April 10, 2009. The individual unit characteristics of Barton are provided in Table 4-7.
Table 4-7: Barton Wind PPA
NIPSCO is also engaged in a 15-year PPA with Iberdrola, in which NIPSCO will purchase generation from Buffalo Ridge. Buffalo Ridge, located in Brookings County, South Dakota, went into commercial operation on April 15, 2009. The individual unit characteristics of Buffalo Ridge are provided in Table 4-8.
Table 4-8: Buffalo Ridge Wind PPA
Unit 1 Unit 2 Unit 3
NET Output
Min (MW) --- --- ---
Max (MW) 4.4 3.4 1.4
In-Service 1925 1925 1925
Main Fuel Water Water Water
Barton PPA
NET Output
Per Unit (MW) 2
Number of Units 25
Total Output (MW) 50
In-Service 2009
Main Fuel Wind
Buffalo Ridge PPA
NET OutputPer Unit (MW) 2
Number of Units 24Total Output (MW) 50In-Service 2009Main Fuel Wind
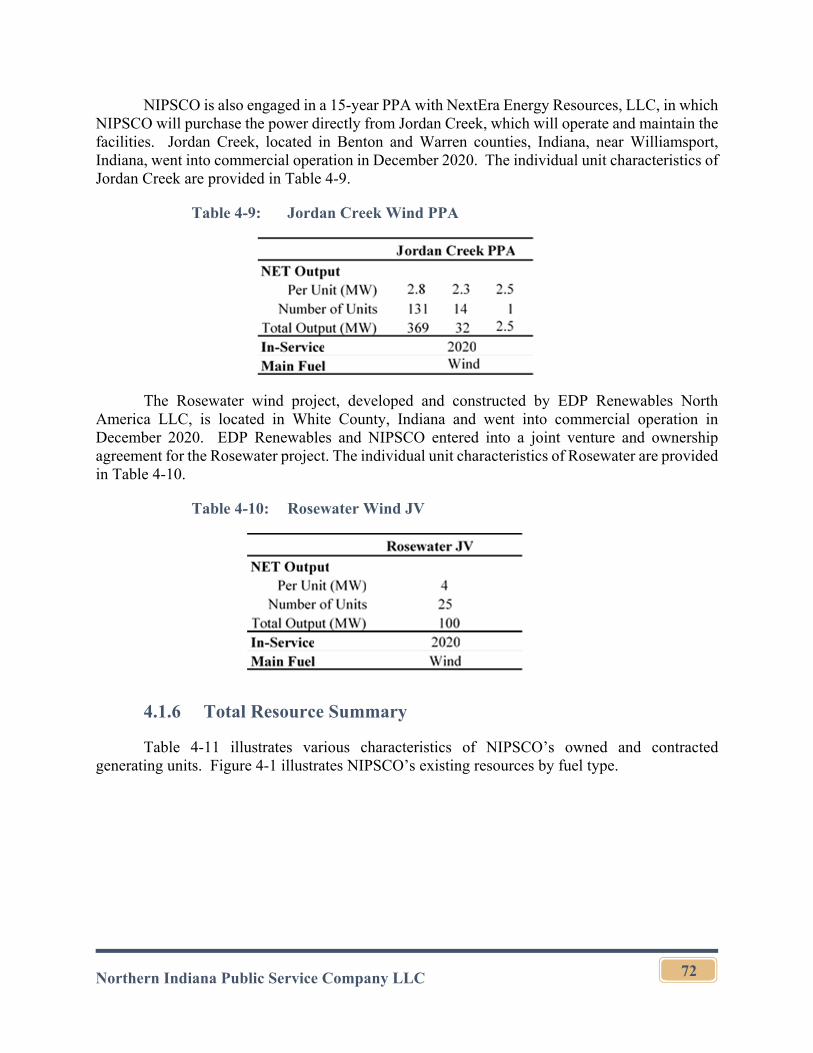
Northern Indiana Public Service Company LLC
72
NIPSCO is also engaged in a 15-year PPA with NextEra Energy Resources, LLC, in which NIPSCO will purchase the power directly from Jordan Creek, which will operate and maintain the facilities. Jordan Creek, located in Benton and Warren counties, Indiana, near Williamsport, Indiana, went into commercial operation in December 2020. The individual unit characteristics of Jordan Creek are provided in Table 4-9.
Table 4-9: Jordan Creek Wind PPA
The Rosewater wind project, developed and constructed by EDP Renewables North
America LLC, is located in White County, Indiana and went into commercial operation in December 2020. EDP Renewables and NIPSCO entered into a joint venture and ownership agreement for the Rosewater project. The individual unit characteristics of Rosewater are provided in Table 4-10.
Table 4-10: Rosewater Wind JV
4.1.6 Total Resource Summary
Table 4-11 illustrates various characteristics of NIPSCO’s owned and contracted generating units. Figure 4-1 illustrates NIPSCO’s existing resources by fuel type.
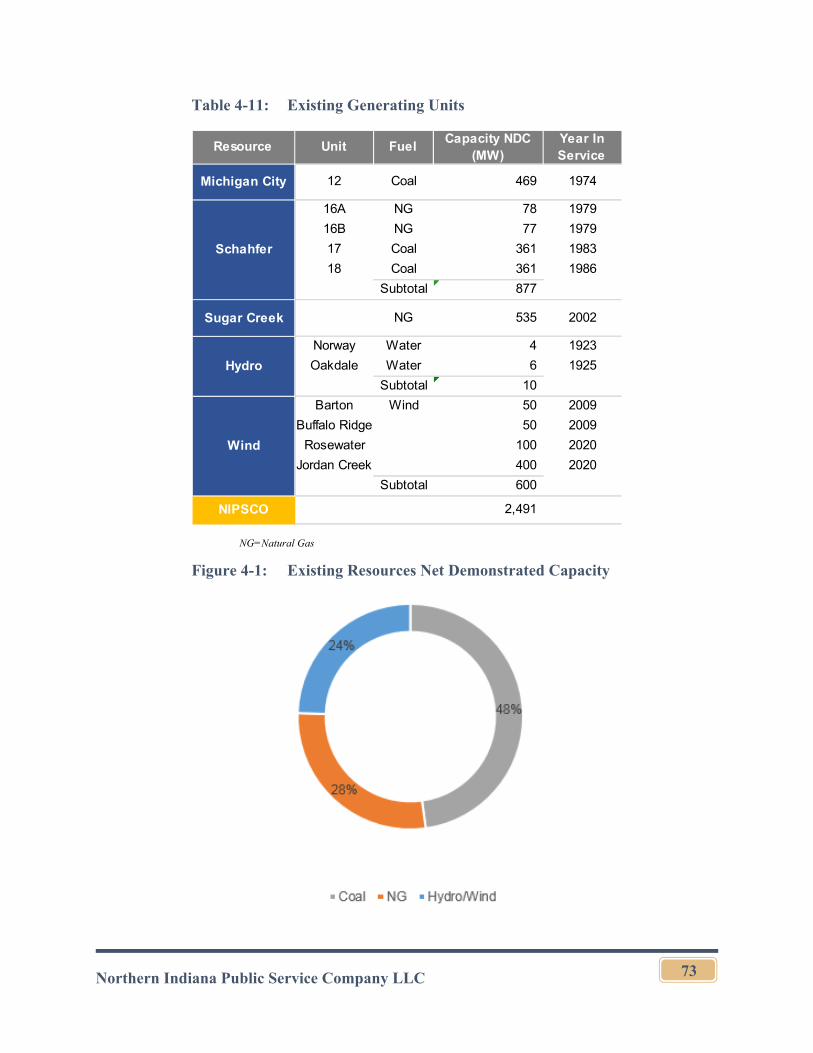
Northern Indiana Public Service Company LLC
73
Table 4-11: Existing Generating Units
NG=Natural Gas
Figure 4-1: Existing Resources Net Demonstrated Capacity
Resource Unit FuelCapacity NDC
(MW)Year In Service
Michigan City 12 Coal 469 1974
16A NG 78 1979
16B NG 77 1979
17 Coal 361 1983
18 Coal 361 1986
Subtotal 877
Sugar Creek NG 535 2002
Norway Water 4 1923
Oakdale Water 6 1925
Subtotal 10
Barton Wind 50 2009
Buffalo Ridge 50 2009
Rosewater 100 2020
Jordan Creek 400 2020
Subtotal 600
NIPSCO 2,491
Schahfer
Hydro
Wind
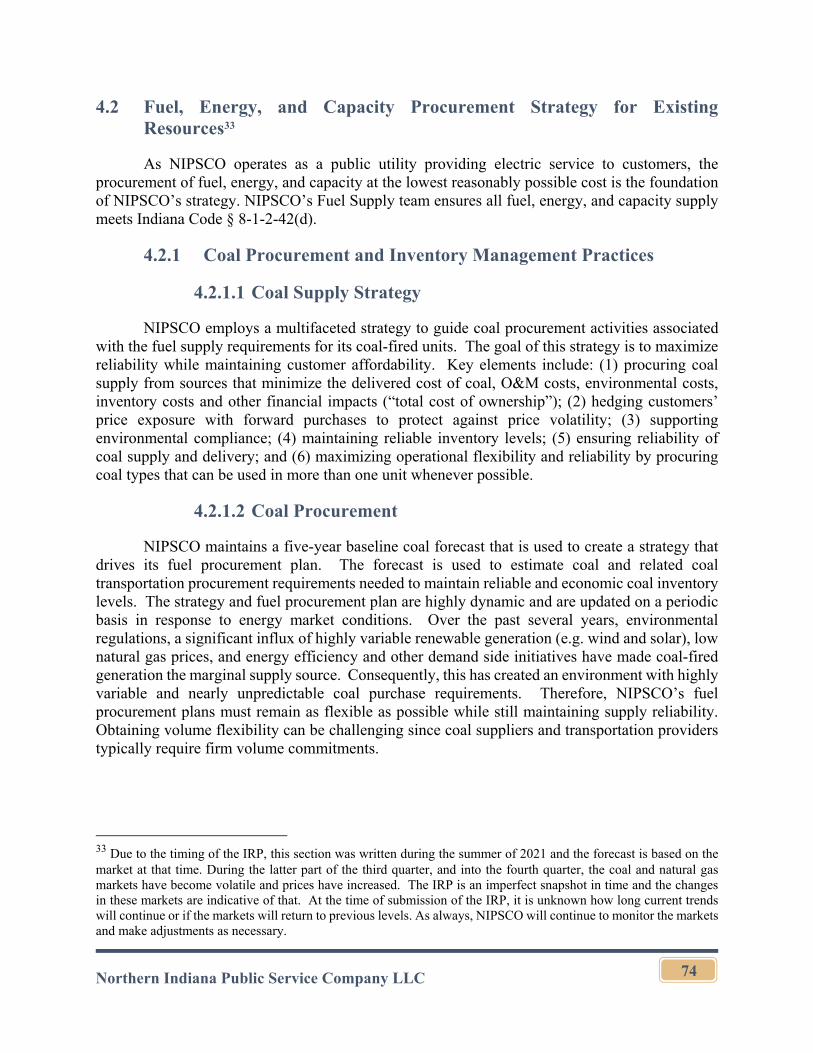
Northern Indiana Public Service Company LLC
74
4.2 Fuel, Energy, and Capacity Procurement Strategy for Existing Resources33
As NIPSCO operates as a public utility providing electric service to customers, the procurement of fuel, energy, and capacity at the lowest reasonably possible cost is the foundation of NIPSCO’s strategy. NIPSCO’s Fuel Supply team ensures all fuel, energy, and capacity supply meets Indiana Code § 8-1-2-42(d).
4.2.1 Coal Procurement and Inventory Management Practices
4.2.1.1 Coal Supply Strategy
NIPSCO employs a multifaceted strategy to guide coal procurement activities associated with the fuel supply requirements for its coal-fired units. The goal of this strategy is to maximize reliability while maintaining customer affordability. Key elements include: (1) procuring coal supply from sources that minimize the delivered cost of coal, O&M costs, environmental costs, inventory costs and other financial impacts (“total cost of ownership”); (2) hedging customers’ price exposure with forward purchases to protect against price volatility; (3) supporting environmental compliance; (4) maintaining reliable inventory levels; (5) ensuring reliability of coal supply and delivery; and (6) maximizing operational flexibility and reliability by procuring coal types that can be used in more than one unit whenever possible.
4.2.1.2 Coal Procurement
NIPSCO maintains a five-year baseline coal forecast that is used to create a strategy that drives its fuel procurement plan. The forecast is used to estimate coal and related coal transportation procurement requirements needed to maintain reliable and economic coal inventory levels. The strategy and fuel procurement plan are highly dynamic and are updated on a periodic basis in response to energy market conditions. Over the past several years, environmental regulations, a significant influx of highly variable renewable generation (e.g. wind and solar), low natural gas prices, and energy efficiency and other demand side initiatives have made coal-fired generation the marginal supply source. Consequently, this has created an environment with highly variable and nearly unpredictable coal purchase requirements. Therefore, NIPSCO’s fuel procurement plans must remain as flexible as possible while still maintaining supply reliability. Obtaining volume flexibility can be challenging since coal suppliers and transportation providers typically require firm volume commitments.
33 Due to the timing of the IRP, this section was written during the summer of 2021 and the forecast is based on the market at that time. During the latter part of the third quarter, and into the fourth quarter, the coal and natural gas markets have become volatile and prices have increased. The IRP is an imperfect snapshot in time and the changes in these markets are indicative of that. At the time of submission of the IRP, it is unknown how long current trends will continue or if the markets will return to previous levels. As always, NIPSCO will continue to monitor the markets and make adjustments as necessary.
Northern Indiana Public Service Company LLC
75
4.2.1.3 Coal Pricing Outlook
Coal competes for a share of the energy market against other fuels (natural gas, nuclear, and oil), renewable energy sources (biomass, hydro, wind, and solar) and energy efficiency programs. Specifically, energy market supply and demand generally set the market price of these competing sources. Also, coal prices are influenced by the supply and demand balance in domestic, international, and metallurgical coal markets, coal production costs, transport costs, and environmental compliance considerations. Over the last decade, energy market dynamics have been heavily influenced by the increased exploration and production of North American shale oil and gas resources and have fundamentally altered the price spread between coal and natural gas. Lower production costs and highly efficient natural gas extraction processes (horizontal drilling and fracking) have kept natural gas a competitive fuel when used in high efficiency, CCGT units. In addition, increases in wet gas production to gather petroleum liquids further increase natural gas supply when oil prices rise. These market dynamics displaced a significant amount of coal-fired electric generation and have kept coal prices relatively low. Decreased coal demand and higher mining costs driven by government regulations have adversely impacted coal producers’ margins and profits causing a number of producer bankruptcies over the last few years. The restructuring of coal companies’ debt and other costs through the bankruptcy process has allowed some of these coal companies to continue coal production in this competitive environment. Class I railroads have also realized that their rates must be rationalized to allow coal to compete in this environment. Supply has been reduced and any significant increase in demand could result in coal price volatility. However, several factors may limit the upside for coal prices. The first factor is the cost to produce electricity from coal has increased significantly due to stringent environmental regulations placed on coal-fired electric generation. A second factor is the continuation of coal-fired generation retirements which will continue to reduce coal demand in the long run. Lastly, the increased competitiveness of natural gas generation and renewables will also limit demand for coal if coal prices spike in the long run.
The competitive energy market has also driven a shift in coal supply regions. Specifically, the relatively high cost to produce coal in the Central Appalachian regions and low coal prices have resulted in declining coal production and this has increased market share of the lower cost ILB region. Even with its higher sulfur content, ILB coal has become an export resource, and its use has increased domestically as utilities have installed FGDs to meet tighter SO2 limits and other emission standards. Some utilities in the southeast are now using ILB coal that replaced higher cost Columbian and Central Appalachia coal.
The PRB in Wyoming and Montana is the largest coal producing basin in the United States. PRB coal has a lower heat content than coals mined in other basins; however, some utilities have units designed to efficiently utilize lower cost PRB coal and over the last 20 years, a number of utilities retrofitted older coal units to use PRB coal in a blend with either Central Appalachian, ILB, or NAPP coals to reduce their overall fuel costs and lower SO2 emissions. Asian demand for PRB coal has also grown as Japan and China have built new, high efficiency coal units and new coal plants are being built in Korea and Taiwan as well as they prepare to meet their future electricity demand.
Northern Indiana Public Service Company LLC
76
In general, most export tonnage originates from Central Appalachian and NAPP coal regions for metallurgical and steam coal markets abroad. Coal suppliers rely on international markets to offset losses in domestic markets; however, the pressure to reduce coal use worldwide will likely reduce international demand in the long run as well.
Overall, these fundamentals are bearish for long-term coal demand. Notwithstanding, NIPSCO will continue to monitor market dynamics and coal prices and incorporate in its procurement strategies.
4.2.1.4 NIPSCO Coal Pricing Outlook
NIPSCO currently procures coal from three geographic regions in the United States: the PRB, the ILB, and the NAPP region. Domestic demand for coal has continued to trend lower over the last several years; therefore, prices have remained relatively low and stable. NAPP coal and ILB coal market pricing over the last several years has been relatively flat. Pricing for PRB coal has remained low over the last several years and is close to the marginal cost of production.
Domestic and international coal prices have increased during 2021 as the economic recovery from the 2020 pandemic has caused a surge in demand. Export dynamics can drive pricing modestly higher for some coal types (e.g. NAPP and ILB) when global demand increases as well; however, the long-term trends for both demand and pricing are bearish.
4.2.1.5 Coal and Issues of Environmental Compliance
Depending on the manner and extent of current and future environmental regulations, NIPSCO’s coal purchasing strategy will continue to evolve in a manner that meets current and future environmental requirements.
4.2.1.6 Maintenance of Coal Inventory Levels
NIPSCO has an ongoing strategy to maintain stable coal inventories and reviews inventory targets levels annually. NIPSCO may make adjustments in anticipation of changes in supply availability relative to demand, transportation constraints, and unit consumption. NIPSCO may modify target inventory levels on a unit-by-unit basis depending on the unit consumption, delivery rates, reliability of coal supply, and station coal handling operations. Adequate inventories are essential to maintaining generation reliability. Uncertainty in consumption rates and variability in delivery performance generally require higher levels of inventory to insure reasonably adequate reliability.
4.2.1.7 Forecast of Coal Delivery and Transportation Pricing
To ensure the delivery of fuel in a timely and cost-effective manner, NIPSCO negotiates and executes transportation contracts that consider current and future coal supply commitments. All fuel procurement options are compared on a delivered cost basis, which includes a complete evaluation of all potential logistical issues.
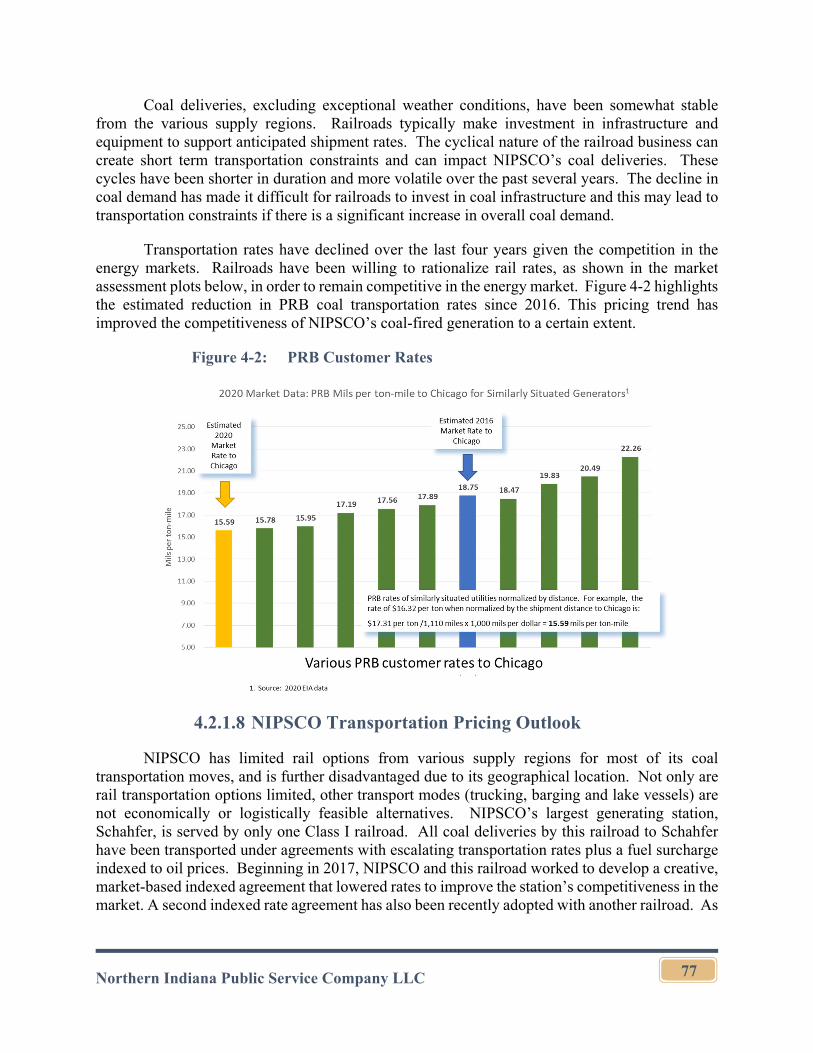
Northern Indiana Public Service Company LLC
77
Coal deliveries, excluding exceptional weather conditions, have been somewhat stable from the various supply regions. Railroads typically make investment in infrastructure and equipment to support anticipated shipment rates. The cyclical nature of the railroad business can create short term transportation constraints and can impact NIPSCO’s coal deliveries. These cycles have been shorter in duration and more volatile over the past several years. The decline in coal demand has made it difficult for railroads to invest in coal infrastructure and this may lead to transportation constraints if there is a significant increase in overall coal demand.
Transportation rates have declined over the last four years given the competition in the energy markets. Railroads have been willing to rationalize rail rates, as shown in the market assessment plots below, in order to remain competitive in the energy market. Figure 4-2 highlights the estimated reduction in PRB coal transportation rates since 2016. This pricing trend has improved the competitiveness of NIPSCO’s coal-fired generation to a certain extent.
Figure 4-2: PRB Customer Rates
4.2.1.8 NIPSCO Transportation Pricing Outlook
NIPSCO has limited rail options from various supply regions for most of its coal transportation moves, and is further disadvantaged due to its geographical location. Not only are rail transportation options limited, other transport modes (trucking, barging and lake vessels) are not economically or logistically feasible alternatives. NIPSCO’s largest generating station, Schahfer, is served by only one Class I railroad. All coal deliveries by this railroad to Schahfer have been transported under agreements with escalating transportation rates plus a fuel surcharge indexed to oil prices. Beginning in 2017, NIPSCO and this railroad worked to develop a creative, market-based indexed agreement that lowered rates to improve the station’s competitiveness in the market. A second indexed rate agreement has also been recently adopted with another railroad. As
Northern Indiana Public Service Company LLC
78
stated above, energy markets have forced a rationalization of coal pricing and associated transportation costs. NIPSCO expects this dynamic to continue for the foreseeable future.
As a result of these changes in the energy markets and agreement structures, NIPSCO’s PRB and ILB coal transportation rates though 2020 have reduced by nearly 25%-50% since 2017. Fuel surcharges continue to fluctuate with the changes in oil prices. Transportation pricing is expected to remain soft as long as energy prices stay low and relatively flat over the next five years. Increases in fuel charges could lead to modest transportation cost increases if oil prices trend higher.
4.2.1.9 Coal Contractual Flexibility, Deliverability and Procurement
Contract terms for coal and coal transportation agreements range between one to five years in duration. Spot coal purchases are made on an as-needed basis to manage inventory fluctuations. Fuel blending strategies can be adjusted to conserve a particular type of coal if supply problems are experienced. In addition, coal suppliers and railroads have been more amenable to providing some volume flexibility including lower minimum volume obligations or elimination of minimum volume obligations entirely. This flexibility has supported NIPSCO’s inventory management efforts.
4.2.2 Natural Gas Procurement and Management
NIPSCO currently procures natural gas for its CCGT generating station using a natural gas supply contract with an energy manager that delivers to the interstate pipeline interconnect at the station, or other locations along the interstate pipeline upon request of NIPSCO for balancing purposes. NIPSCO currently holds firm capacity on Midwestern Gas Transmission Company interstate pipeline and releases the capacity to the energy manager. The contract has provisions to purchase next day and intraday firm gas supplies to serve the daily needs of the facility. NIPSCO nominates and balances the gas supply needs of the CCGT generating station. A portion of the gas supply for Sugar Creek is financially hedged with the intention of smoothing out market price swings over a specific time period. The volatility mitigation plan consists of purchasing monthly NYMEX Henry Hub natural gas contracts that settle at expiration.
The coal units and CTs at NIPSCO are located within the NIPSCO natural gas local distribution company service territory. NIPSCO maintains a separate contract for firm delivered natural gas supply and energy management for these units. The contract has provisions to nominate next-day usage based on the expected usage of each generating station. The actual usage is balanced daily and balancing is the responsibility of the energy manager.
4.2.3 Electric Generation Gas Supply Request for Proposal Process
NIPSCO conducts two separate RFPs for the electric generation firm natural gas supply, one for the Sugar Creek facility and a separate one for the coal units and CTs. The RFP process may be done on a seasonal or annual basis depending on the current contract length and supplier agreement. The process includes qualifying potential suppliers, customizing the RFP based on
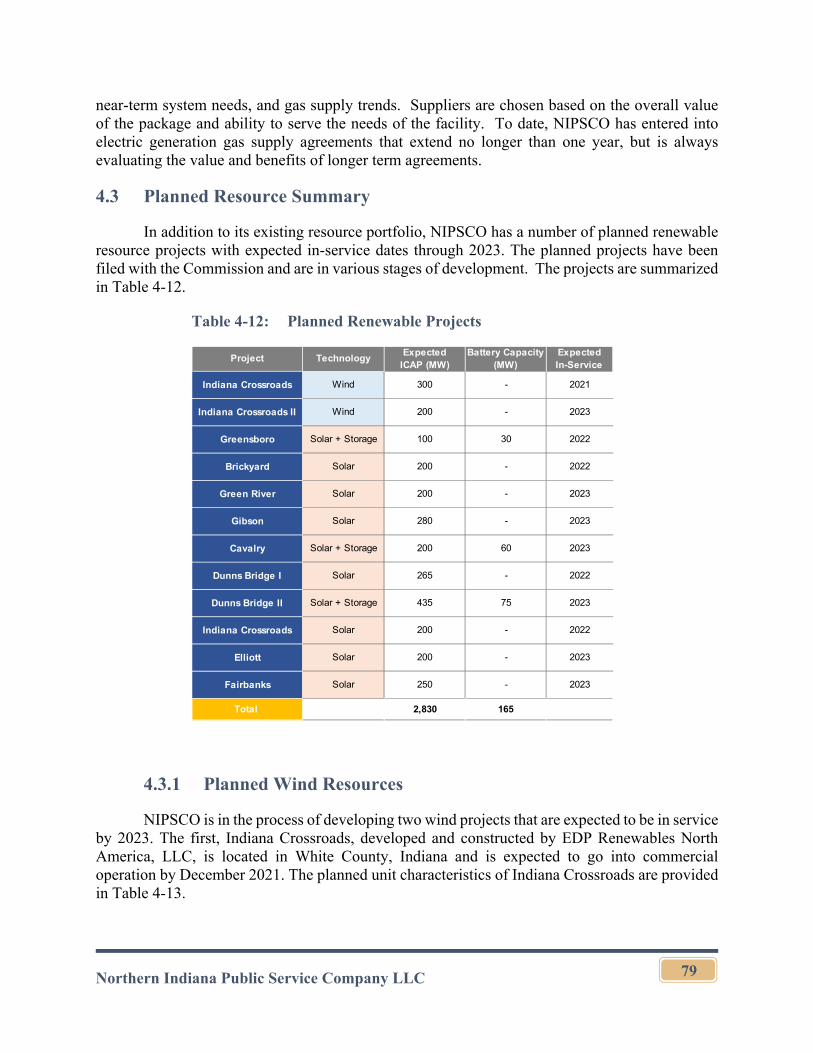
Northern Indiana Public Service Company LLC
79
near-term system needs, and gas supply trends. Suppliers are chosen based on the overall value of the package and ability to serve the needs of the facility. To date, NIPSCO has entered into electric generation gas supply agreements that extend no longer than one year, but is always evaluating the value and benefits of longer term agreements.
4.3 Planned Resource Summary
In addition to its existing resource portfolio, NIPSCO has a number of planned renewable resource projects with expected in-service dates through 2023. The planned projects have been filed with the Commission and are in various stages of development. The projects are summarized in Table 4-12.
Table 4-12: Planned Renewable Projects
4.3.1 Planned Wind Resources
NIPSCO is in the process of developing two wind projects that are expected to be in service by 2023. The first, Indiana Crossroads, developed and constructed by EDP Renewables North America, LLC, is located in White County, Indiana and is expected to go into commercial operation by December 2021. The planned unit characteristics of Indiana Crossroads are provided in Table 4-13.
Project TechnologyExpected
ICAP (MW)Battery Capacity
(MW)Expected In-Service
Indiana Crossroads Wind 300 - 2021
Indiana Crossroads II Wind 200 - 2023
Greensboro Solar + Storage 100 30 2022
Brickyard Solar 200 - 2022
Green River Solar 200 - 2023
Gibson Solar 280 - 2023
Cavalry Solar + Storage 200 60 2023
Dunns Bridge I Solar 265 - 2022
Dunns Bridge II Solar + Storage 435 75 2023
Indiana Crossroads Solar 200 - 2022
Elliott Solar 200 - 2023
Fairbanks Solar 250 - 2023
Total 2,830 165
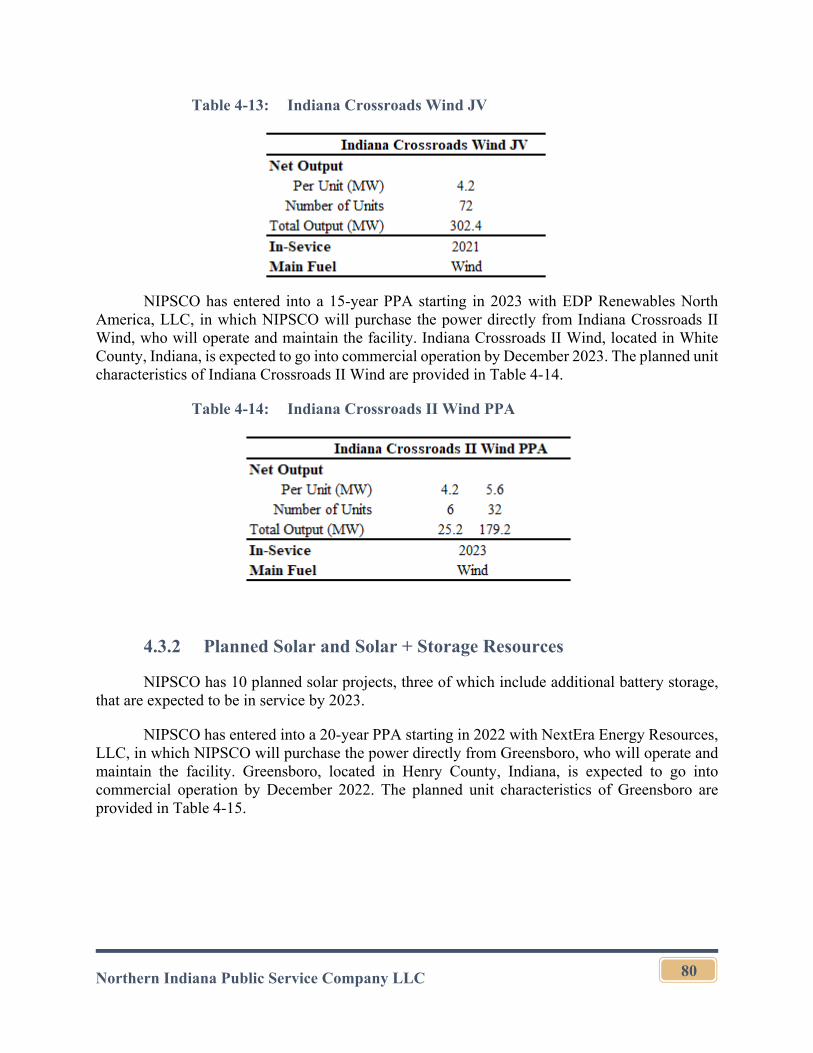
Northern Indiana Public Service Company LLC
80
Table 4-13: Indiana Crossroads Wind JV
NIPSCO has entered into a 15-year PPA starting in 2023 with EDP Renewables North America, LLC, in which NIPSCO will purchase the power directly from Indiana Crossroads II Wind, who will operate and maintain the facility. Indiana Crossroads II Wind, located in White County, Indiana, is expected to go into commercial operation by December 2023. The planned unit characteristics of Indiana Crossroads II Wind are provided in Table 4-14.
Table 4-14: Indiana Crossroads II Wind PPA
4.3.2 Planned Solar and Solar + Storage Resources
NIPSCO has 10 planned solar projects, three of which include additional battery storage, that are expected to be in service by 2023.
NIPSCO has entered into a 20-year PPA starting in 2022 with NextEra Energy Resources, LLC, in which NIPSCO will purchase the power directly from Greensboro, who will operate and maintain the facility. Greensboro, located in Henry County, Indiana, is expected to go into commercial operation by December 2022. The planned unit characteristics of Greensboro are provided in Table 4-15.
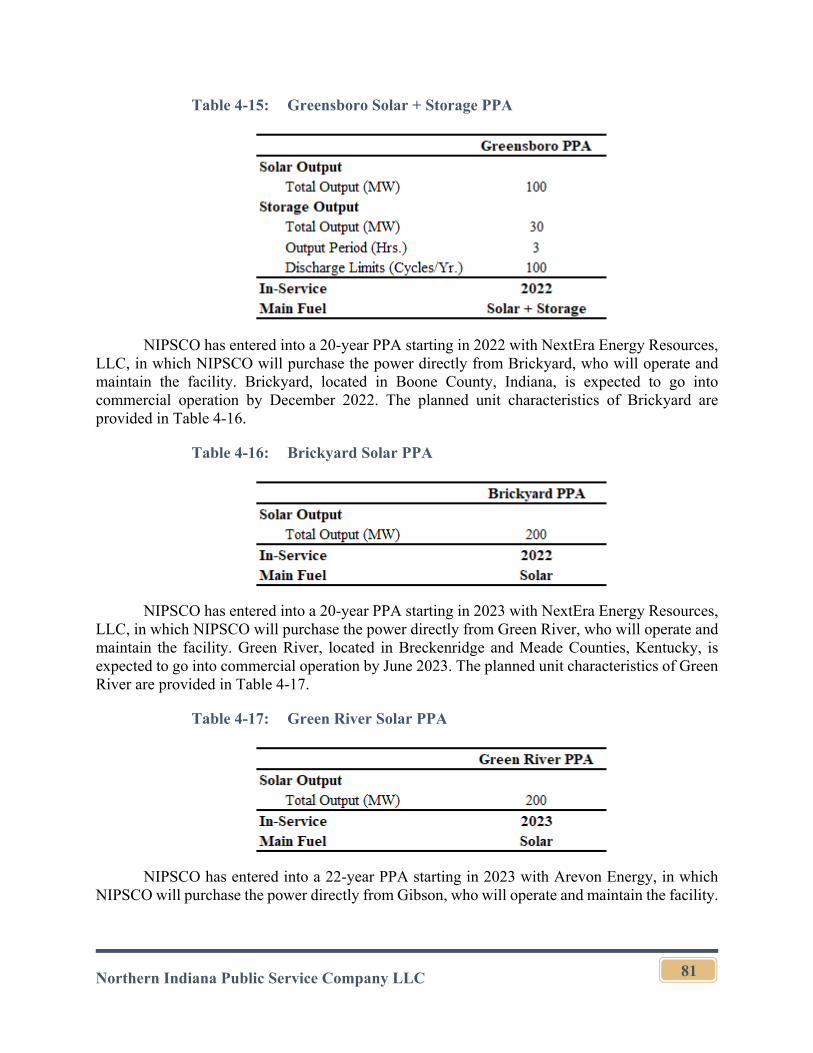
Northern Indiana Public Service Company LLC
81
Table 4-15: Greensboro Solar + Storage PPA
NIPSCO has entered into a 20-year PPA starting in 2022 with NextEra Energy Resources, LLC, in which NIPSCO will purchase the power directly from Brickyard, who will operate and maintain the facility. Brickyard, located in Boone County, Indiana, is expected to go into commercial operation by December 2022. The planned unit characteristics of Brickyard are provided in Table 4-16.
Table 4-16: Brickyard Solar PPA
NIPSCO has entered into a 20-year PPA starting in 2023 with NextEra Energy Resources, LLC, in which NIPSCO will purchase the power directly from Green River, who will operate and maintain the facility. Green River, located in Breckenridge and Meade Counties, Kentucky, is expected to go into commercial operation by June 2023. The planned unit characteristics of Green River are provided in Table 4-17.
Table 4-17: Green River Solar PPA
NIPSCO has entered into a 22-year PPA starting in 2023 with Arevon Energy, in which NIPSCO will purchase the power directly from Gibson, who will operate and maintain the facility.
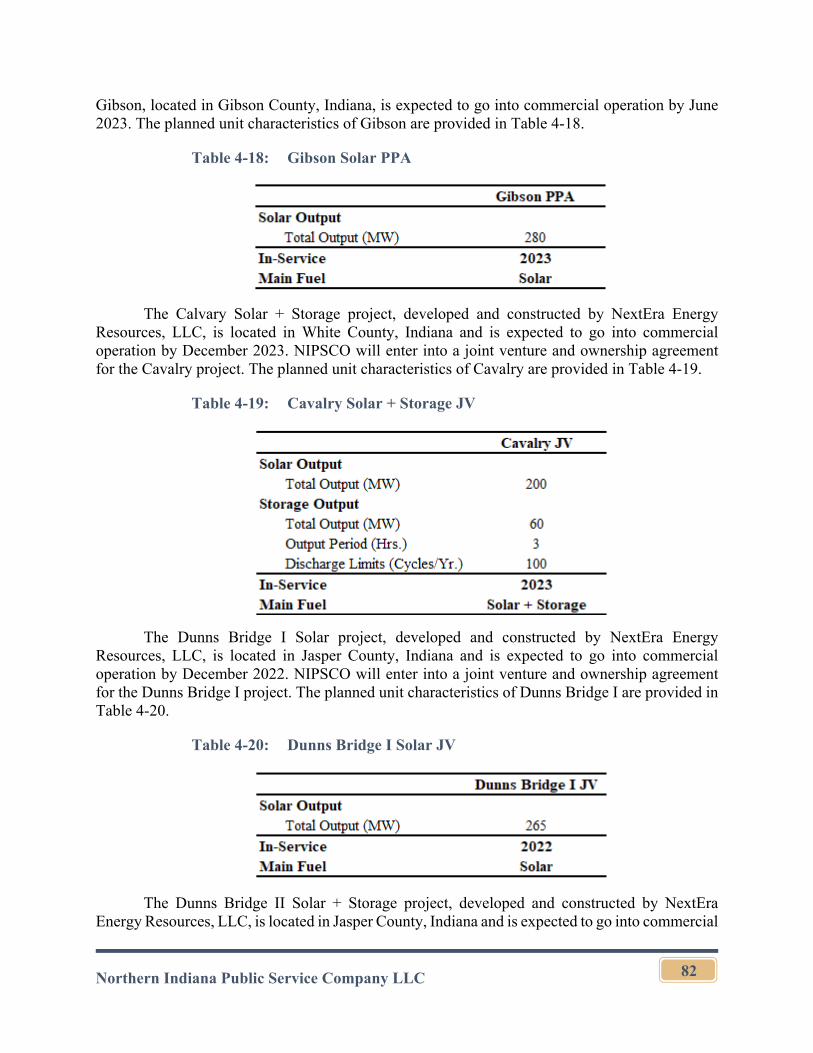
Northern Indiana Public Service Company LLC
82
Gibson, located in Gibson County, Indiana, is expected to go into commercial operation by June 2023. The planned unit characteristics of Gibson are provided in Table 4-18.
Table 4-18: Gibson Solar PPA
The Calvary Solar + Storage project, developed and constructed by NextEra Energy Resources, LLC, is located in White County, Indiana and is expected to go into commercial operation by December 2023. NIPSCO will enter into a joint venture and ownership agreement for the Cavalry project. The planned unit characteristics of Cavalry are provided in Table 4-19.
Table 4-19: Cavalry Solar + Storage JV
The Dunns Bridge I Solar project, developed and constructed by NextEra Energy Resources, LLC, is located in Jasper County, Indiana and is expected to go into commercial operation by December 2022. NIPSCO will enter into a joint venture and ownership agreement for the Dunns Bridge I project. The planned unit characteristics of Dunns Bridge I are provided in Table 4-20.
Table 4-20: Dunns Bridge I Solar JV
The Dunns Bridge II Solar + Storage project, developed and constructed by NextEra Energy Resources, LLC, is located in Jasper County, Indiana and is expected to go into commercial
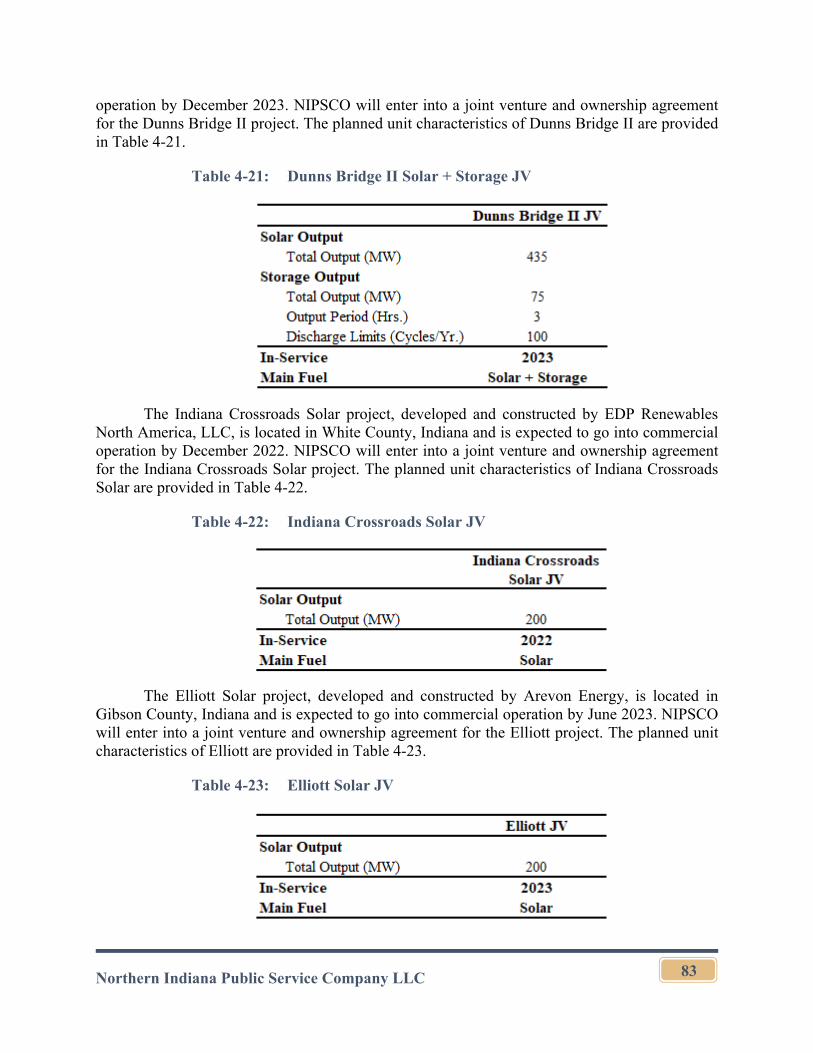
Northern Indiana Public Service Company LLC
83
operation by December 2023. NIPSCO will enter into a joint venture and ownership agreement for the Dunns Bridge II project. The planned unit characteristics of Dunns Bridge II are provided in Table 4-21.
Table 4-21: Dunns Bridge II Solar + Storage JV
The Indiana Crossroads Solar project, developed and constructed by EDP Renewables North America, LLC, is located in White County, Indiana and is expected to go into commercial operation by December 2022. NIPSCO will enter into a joint venture and ownership agreement for the Indiana Crossroads Solar project. The planned unit characteristics of Indiana Crossroads Solar are provided in Table 4-22.
Table 4-22: Indiana Crossroads Solar JV
The Elliott Solar project, developed and constructed by Arevon Energy, is located in Gibson County, Indiana and is expected to go into commercial operation by June 2023. NIPSCO will enter into a joint venture and ownership agreement for the Elliott project. The planned unit characteristics of Elliott are provided in Table 4-23.
Table 4-23: Elliott Solar JV
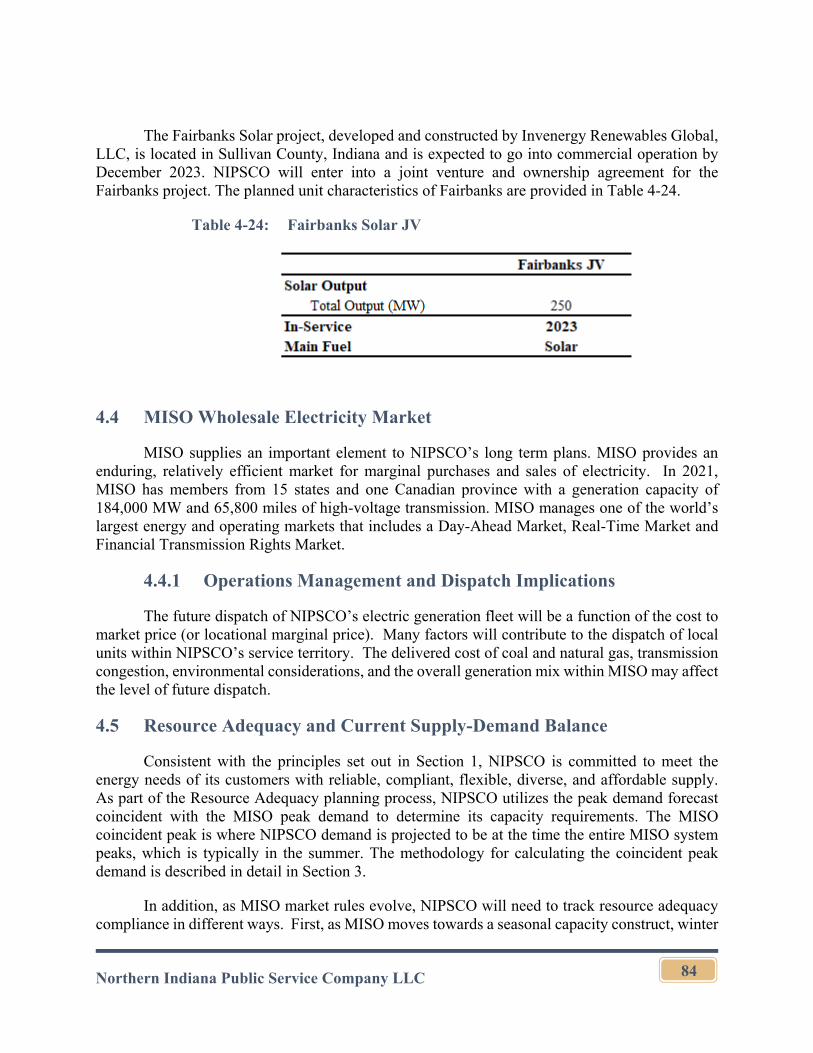
Northern Indiana Public Service Company LLC
84
The Fairbanks Solar project, developed and constructed by Invenergy Renewables Global, LLC, is located in Sullivan County, Indiana and is expected to go into commercial operation by December 2023. NIPSCO will enter into a joint venture and ownership agreement for the Fairbanks project. The planned unit characteristics of Fairbanks are provided in Table 4-24.
Table 4-24: Fairbanks Solar JV
4.4 MISO Wholesale Electricity Market
MISO supplies an important element to NIPSCO’s long term plans. MISO provides an enduring, relatively efficient market for marginal purchases and sales of electricity. In 2021, MISO has members from 15 states and one Canadian province with a generation capacity of 184,000 MW and 65,800 miles of high-voltage transmission. MISO manages one of the world’s largest energy and operating markets that includes a Day-Ahead Market, Real-Time Market and Financial Transmission Rights Market.
4.4.1 Operations Management and Dispatch Implications
The future dispatch of NIPSCO’s electric generation fleet will be a function of the cost to market price (or locational marginal price). Many factors will contribute to the dispatch of local units within NIPSCO’s service territory. The delivered cost of coal and natural gas, transmission congestion, environmental considerations, and the overall generation mix within MISO may affect the level of future dispatch.
4.5 Resource Adequacy and Current Supply-Demand Balance
Consistent with the principles set out in Section 1, NIPSCO is committed to meet the energy needs of its customers with reliable, compliant, flexible, diverse, and affordable supply. As part of the Resource Adequacy planning process, NIPSCO utilizes the peak demand forecast coincident with the MISO peak demand to determine its capacity requirements. The MISO coincident peak is where NIPSCO demand is projected to be at the time the entire MISO system peaks, which is typically in the summer. The methodology for calculating the coincident peak demand is described in detail in Section 3.
In addition, as MISO market rules evolve, NIPSCO will need to track resource adequacy compliance in different ways. First, as MISO moves towards a seasonal capacity construct, winter
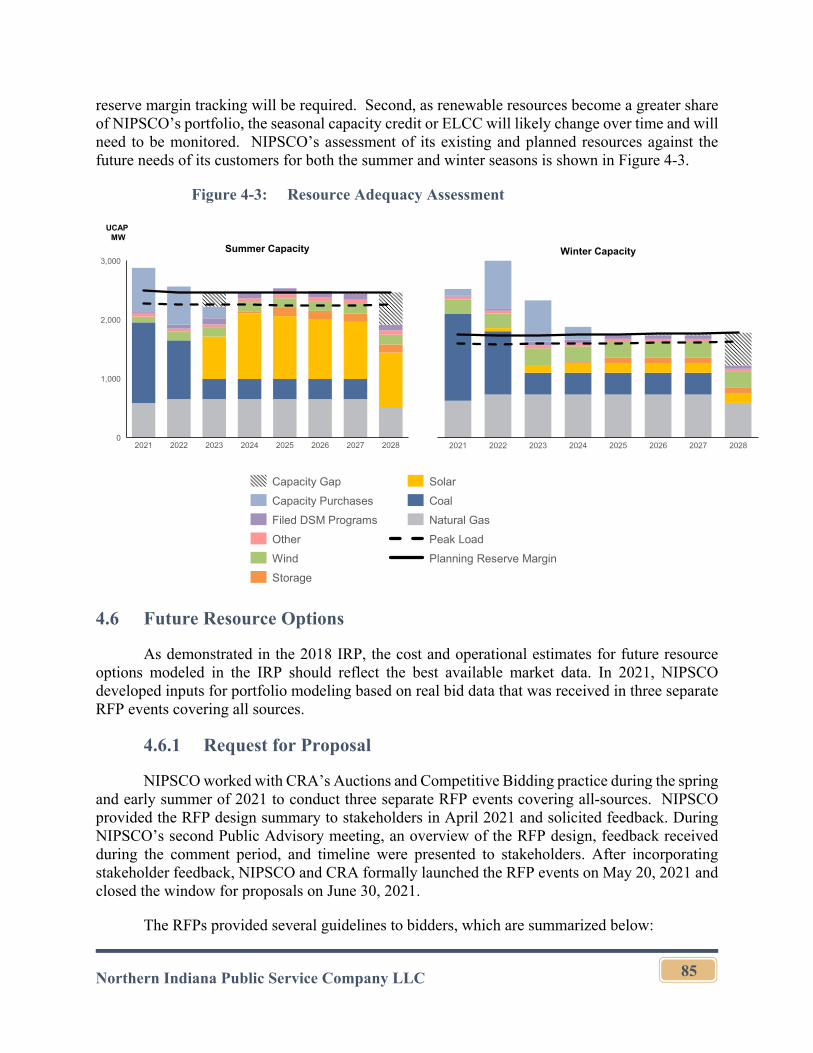
Northern Indiana Public Service Company LLC
85
reserve margin tracking will be required. Second, as renewable resources become a greater share of NIPSCO’s portfolio, the seasonal capacity credit or ELCC will likely change over time and will need to be monitored. NIPSCO’s assessment of its existing and planned resources against the future needs of its customers for both the summer and winter seasons is shown in Figure 4-3.
Figure 4-3: Resource Adequacy Assessment
4.6 Future Resource Options
As demonstrated in the 2018 IRP, the cost and operational estimates for future resource options modeled in the IRP should reflect the best available market data. In 2021, NIPSCO developed inputs for portfolio modeling based on real bid data that was received in three separate RFP events covering all sources.
4.6.1 Request for Proposal
NIPSCO worked with CRA’s Auctions and Competitive Bidding practice during the spring and early summer of 2021 to conduct three separate RFP events covering all-sources. NIPSCO provided the RFP design summary to stakeholders in April 2021 and solicited feedback. During NIPSCO’s second Public Advisory meeting, an overview of the RFP design, feedback received during the comment period, and timeline were presented to stakeholders. After incorporating stakeholder feedback, NIPSCO and CRA formally launched the RFP events on May 20, 2021 and closed the window for proposals on June 30, 2021.
The RFPs provided several guidelines to bidders, which are summarized below:
1,000
0
2,000
3,000
202420232021 2022 2025 2026 2027 2028
Summer Capacity
20282021 2022 20262023 2024 2025 2027
Winter Capacity
UCAP MW
Capacity Purchases
Capacity Gap
Wind
Other
Filed DSM Programs
Storage
Solar
Coal
Natural Gas
Peak Load
Planning Reserve Margin
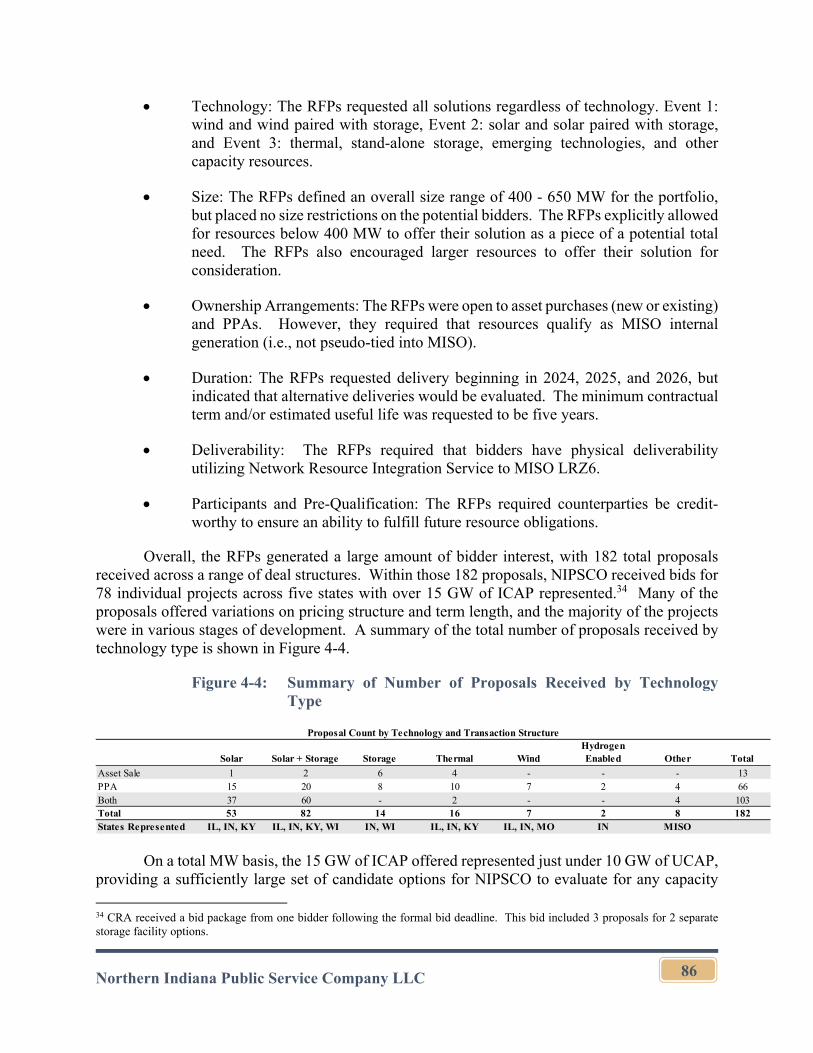
Northern Indiana Public Service Company LLC
86
Technology: The RFPs requested all solutions regardless of technology. Event 1: wind and wind paired with storage, Event 2: solar and solar paired with storage, and Event 3: thermal, stand-alone storage, emerging technologies, and other capacity resources.
Size: The RFPs defined an overall size range of 400 - 650 MW for the portfolio, but placed no size restrictions on the potential bidders. The RFPs explicitly allowed for resources below 400 MW to offer their solution as a piece of a potential total need. The RFPs also encouraged larger resources to offer their solution for consideration.
Ownership Arrangements: The RFPs were open to asset purchases (new or existing) and PPAs. However, they required that resources qualify as MISO internal generation (i.e., not pseudo-tied into MISO).
Duration: The RFPs requested delivery beginning in 2024, 2025, and 2026, but indicated that alternative deliveries would be evaluated. The minimum contractual term and/or estimated useful life was requested to be five years.
Deliverability: The RFPs required that bidders have physical deliverability utilizing Network Resource Integration Service to MISO LRZ6.
Participants and Pre-Qualification: The RFPs required counterparties be credit-worthy to ensure an ability to fulfill future resource obligations.
Overall, the RFPs generated a large amount of bidder interest, with 182 total proposals received across a range of deal structures. Within those 182 proposals, NIPSCO received bids for 78 individual projects across five states with over 15 GW of ICAP represented.34 Many of the proposals offered variations on pricing structure and term length, and the majority of the projects were in various stages of development. A summary of the total number of proposals received by technology type is shown in Figure 4-4.
Figure 4-4: Summary of Number of Proposals Received by Technology Type
On a total MW basis, the 15 GW of ICAP offered represented just under 10 GW of UCAP, providing a sufficiently large set of candidate options for NIPSCO to evaluate for any capacity
34 CRA received a bid package from one bidder following the formal bid deadline. This bid included 3 proposals for 2 separate storage facility options.
Solar Solar + Storage Storage Thermal WindHydrogen Enabled Other Total
Asset Sale 1 2 6 4 - - - 13PPA 15 20 8 10 7 2 4 66Both 37 60 - 2 - - 4 103Total 53 82 14 16 7 2 8 182States Represented IL, IN, KY IL, IN, KY, WI IN, WI IL, IN, KY IL, IN, MO IN MISO
Proposal Count by Technology and Transaction Structure
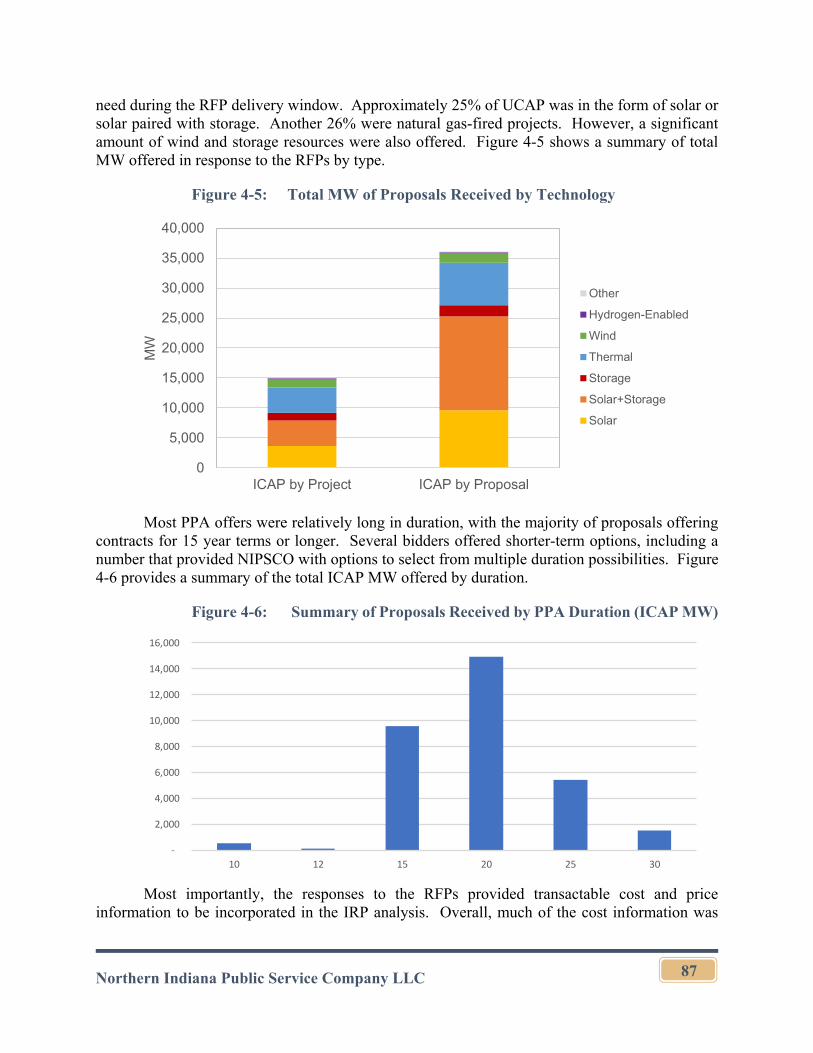
Northern Indiana Public Service Company LLC
87
need during the RFP delivery window. Approximately 25% of UCAP was in the form of solar or solar paired with storage. Another 26% were natural gas-fired projects. However, a significant amount of wind and storage resources were also offered. Figure 4-5 shows a summary of total MW offered in response to the RFPs by type.
Figure 4-5: Total MW of Proposals Received by Technology
Most PPA offers were relatively long in duration, with the majority of proposals offering contracts for 15 year terms or longer. Several bidders offered shorter-term options, including a number that provided NIPSCO with options to select from multiple duration possibilities. Figure 4-6 provides a summary of the total ICAP MW offered by duration.
Figure 4-6: Summary of Proposals Received by PPA Duration (ICAP MW)
Most importantly, the responses to the RFPs provided transactable cost and price information to be incorporated in the IRP analysis. Overall, much of the cost information was
0
5,000
10,000
15,000
20,000
25,000
30,000
35,000
40,000
ICAP by Project ICAP by Proposal
MW
Other
Hydrogen-Enabled
Wind
Thermal
Storage
Solar+Storage
Solar
‐
2,000
4,000
6,000
8,000
10,000
12,000
14,000
16,000
10 12 15 20 25 30
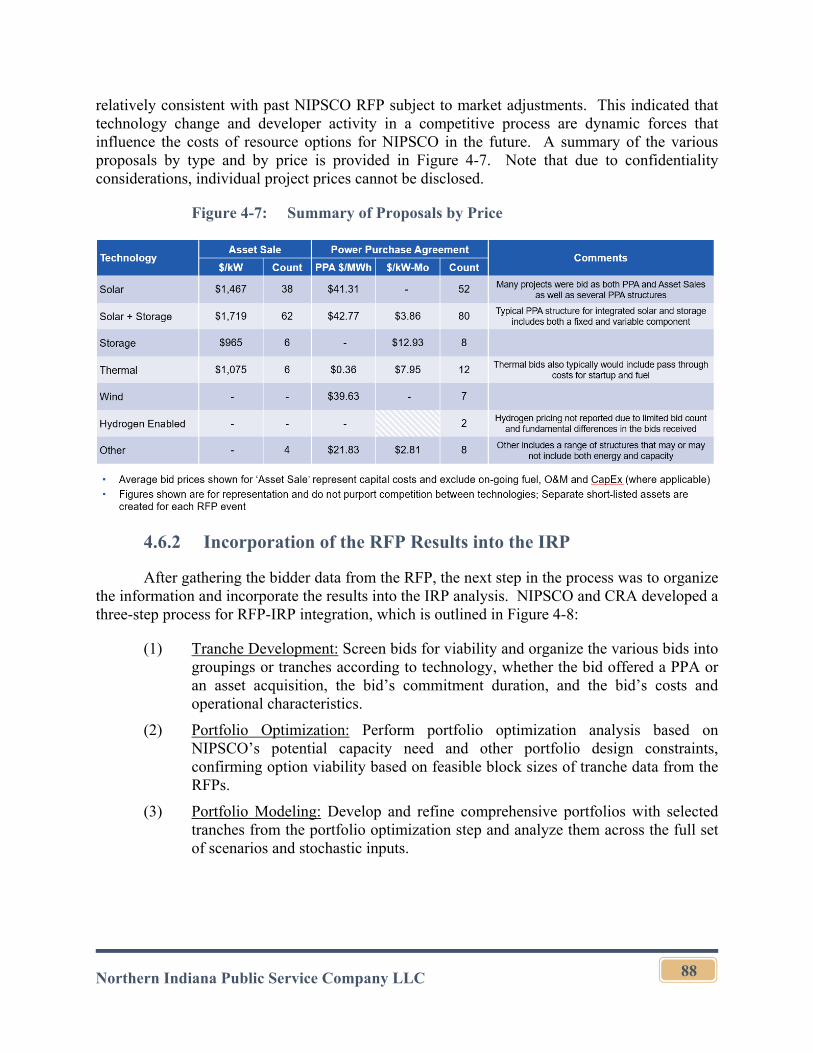
Northern Indiana Public Service Company LLC
88
relatively consistent with past NIPSCO RFP subject to market adjustments. This indicated that technology change and developer activity in a competitive process are dynamic forces that influence the costs of resource options for NIPSCO in the future. A summary of the various proposals by type and by price is provided in Figure 4-7. Note that due to confidentiality considerations, individual project prices cannot be disclosed.
Figure 4-7: Summary of Proposals by Price
4.6.2 Incorporation of the RFP Results into the IRP
After gathering the bidder data from the RFP, the next step in the process was to organize the information and incorporate the results into the IRP analysis. NIPSCO and CRA developed a three-step process for RFP-IRP integration, which is outlined in Figure 4-8:
(1) Tranche Development: Screen bids for viability and organize the various bids into groupings or tranches according to technology, whether the bid offered a PPA or an asset acquisition, the bid’s commitment duration, and the bid’s costs and operational characteristics.
(2) Portfolio Optimization: Perform portfolio optimization analysis based on NIPSCO’s potential capacity need and other portfolio design constraints, confirming option viability based on feasible block sizes of tranche data from the RFPs.
(3) Portfolio Modeling: Develop and refine comprehensive portfolios with selected tranches from the portfolio optimization step and analyze them across the full set of scenarios and stochastic inputs.
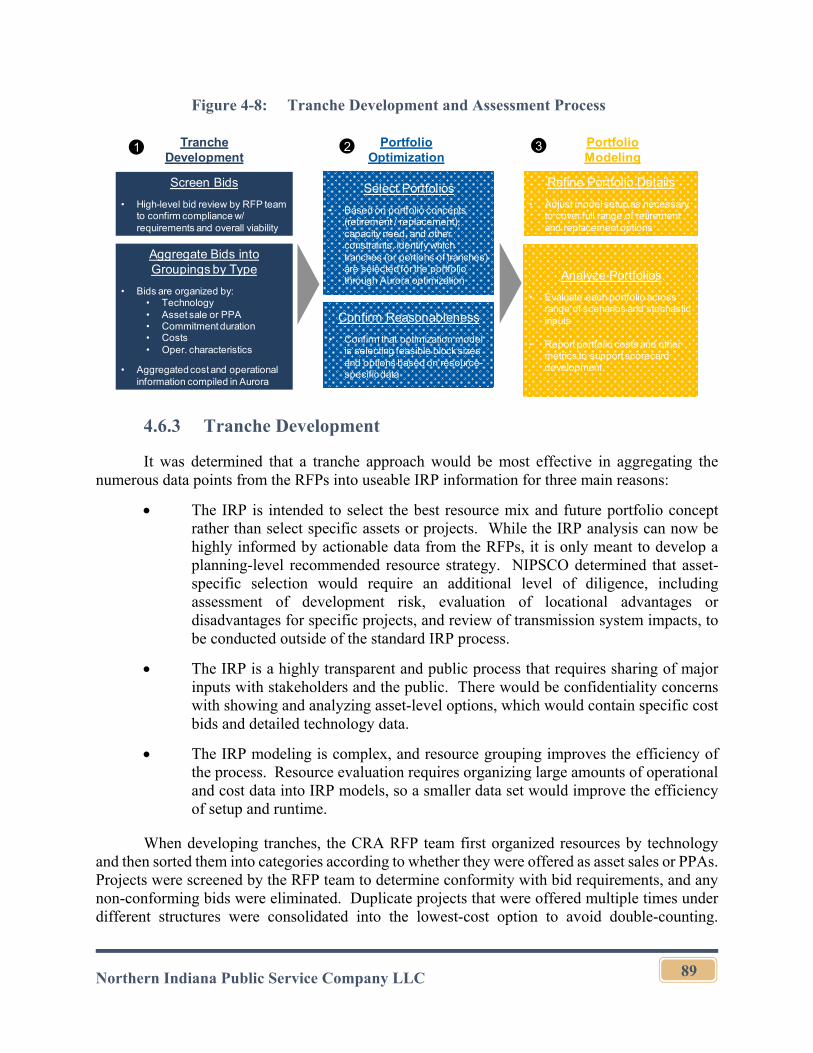
Northern Indiana Public Service Company LLC
89
Figure 4-8: Tranche Development and Assessment Process
4.6.3 Tranche Development
It was determined that a tranche approach would be most effective in aggregating the numerous data points from the RFPs into useable IRP information for three main reasons:
The IRP is intended to select the best resource mix and future portfolio concept rather than select specific assets or projects. While the IRP analysis can now be highly informed by actionable data from the RFPs, it is only meant to develop a planning-level recommended resource strategy. NIPSCO determined that asset-specific selection would require an additional level of diligence, including assessment of development risk, evaluation of locational advantages or disadvantages for specific projects, and review of transmission system impacts, to be conducted outside of the standard IRP process.
The IRP is a highly transparent and public process that requires sharing of major inputs with stakeholders and the public. There would be confidentiality concerns with showing and analyzing asset-level options, which would contain specific cost bids and detailed technology data.
The IRP modeling is complex, and resource grouping improves the efficiency of the process. Resource evaluation requires organizing large amounts of operational and cost data into IRP models, so a smaller data set would improve the efficiency of setup and runtime.
When developing tranches, the CRA RFP team first organized resources by technology and then sorted them into categories according to whether they were offered as asset sales or PPAs. Projects were screened by the RFP team to determine conformity with bid requirements, and any non-conforming bids were eliminated. Duplicate projects that were offered multiple times under different structures were consolidated into the lowest-cost option to avoid double-counting.
Screen Bids
• High-level bid review by RFP team to confirm compliance w/ requirements and overall viability
Select Portfolios
• Based on portfolio concepts (retirement / replacement), capacity need, and other constraints, identify which tranches (or portions of tranches) are selected for the portfolio through Aurora optimization
Tranche Development
Portfolio Optimization
Portfolio Modeling
1 2 3
Refine Portfolio Details
• Adjust model setup as necessary to cover full range of retirement and replacement options
Confirm Reasonableness
• Confirm that optimization model is selecting feasible block sizes and options based on resource-specific data
Aggregate Bids into Groupings by Type
• Bids are organized by:• Technology• Asset sale or PPA• Commitment duration• Costs• Oper. characteristics
• Aggregated cost and operational information compiled in Aurora
Analyze Portfolios
• Evaluate each portfolio across range of scenarios and stochastic inputs
• Report portfolio costs and other metrics to support scorecard development
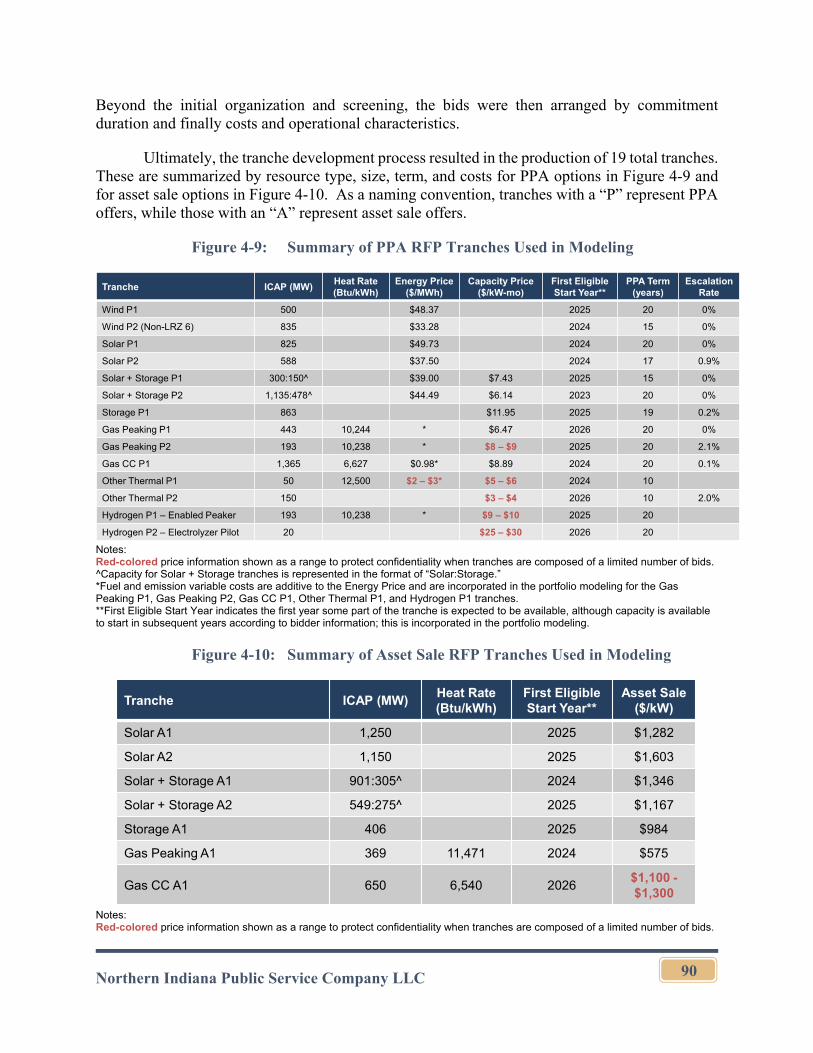
Northern Indiana Public Service Company LLC
90
Beyond the initial organization and screening, the bids were then arranged by commitment duration and finally costs and operational characteristics.
Ultimately, the tranche development process resulted in the production of 19 total tranches. These are summarized by resource type, size, term, and costs for PPA options in Figure 4-9 and for asset sale options in Figure 4-10. As a naming convention, tranches with a “P” represent PPA offers, while those with an “A” represent asset sale offers.
Figure 4-9: Summary of PPA RFP Tranches Used in Modeling
Notes: Red-colored price information shown as a range to protect confidentiality when tranches are composed of a limited number of bids. ^Capacity for Solar + Storage tranches is represented in the format of “Solar:Storage.” *Fuel and emission variable costs are additive to the Energy Price and are incorporated in the portfolio modeling for the Gas Peaking P1, Gas Peaking P2, Gas CC P1, Other Thermal P1, and Hydrogen P1 tranches. **First Eligible Start Year indicates the first year some part of the tranche is expected to be available, although capacity is available to start in subsequent years according to bidder information; this is incorporated in the portfolio modeling.
Figure 4-10: Summary of Asset Sale RFP Tranches Used in Modeling
Notes: Red-colored price information shown as a range to protect confidentiality when tranches are composed of a limited number of bids.
Tranche ICAP (MW)Heat Rate (Btu/kWh)
Energy Price ($/MWh)
Capacity Price ($/kW-mo)
First Eligible Start Year**
PPA Term (years)
Escalation Rate
Wind P1 500 $48.37 2025 20 0%
Wind P2 (Non-LRZ 6) 835 $33.28 2024 15 0%
Solar P1 825 $49.73 2024 20 0%
Solar P2 588 $37.50 2024 17 0.9%
Solar + Storage P1 300:150^ $39.00 $7.43 2025 15 0%
Solar + Storage P2 1,135:478^ $44.49 $6.14 2023 20 0%
Storage P1 863 $11.95 2025 19 0.2%
Gas Peaking P1 443 10,244 * $6.47 2026 20 0%
Gas Peaking P2 193 10,238 * $8 – $9 2025 20 2.1%
Gas CC P1 1,365 6,627 $0.98* $8.89 2024 20 0.1%
Other Thermal P1 50 12,500 $2 – $3* $5 – $6 2024 10
Other Thermal P2 150 $3 – $4 2026 10 2.0%
Hydrogen P1 – Enabled Peaker 193 10,238 * $9 – $10 2025 20
Hydrogen P2 – Electrolyzer Pilot 20 $25 – $30 2026 20
Tranche ICAP (MW)Heat Rate (Btu/kWh)
First Eligible Start Year**
Asset Sale ($/kW)
Solar A1 1,250 2025 $1,282
Solar A2 1,150 2025 $1,603
Solar + Storage A1 901:305^ 2024 $1,346
Solar + Storage A2 549:275^ 2025 $1,167
Storage A1 406 2025 $984
Gas Peaking A1 369 11,471 2024 $575
Gas CC A1 650 6,540 2026$1,100 -$1,300
Northern Indiana Public Service Company LLC
91
^Capacity for Solar + Storage tranches is represented in the format of “Solar:Storage.” **First Eligible Start Year indicates the first year some part of the tranche is expected to be available, although capacity is available to start in subsequent years according to bidder information; this is incorporated in the portfolio modeling.
4.6.4 Renewable Resource Tax Incentives and Tax Equity Partnership
Federal tax incentives are currently in place for renewable and paired renewable/storage resources. Resources are eligible for a PTC or an investment tax credit ITC. The PTC provides a credit of $25/ MWh35 for all generation produced by the facility, and the ITC provides a credit as a portion of the total cost of the facility. It is generally advantageous for wind resources to take the PTC, due to their high capacity factors, and solar resources to take the ITC.
The tax incentives are currently in the midst of a phase-out, with the implications on IRP modeling assumptions of current law summarized in Figure 4-11. However, NIPSCO’s scenario analysis incorporates different assumptions for extensions over time (see details in Section 8). In order to qualify for the credits, projects need to begin construction by a certain date and be put into service by a certain date. The start of construction deadline can be met as long as certain equipment purchases and development costs have been “safe harbored” by federal tax authorities.36 The safe harbor for beginning of construction is investment of at least 5% of the total project cost on or before the specified date.
35 This value is indexed to inflation. 36 Note that in May 2020 the Internal Revenue Service issued guidance to extend PTC and ITC deadlines in light of potential construction delays and supply chain disruptions associated with the COVID-19 pandemic. In-service date deadlines for 2020 and 2021 PTC projects have been extended by one year, while certain ITC spend schedules were extended by several months. Thus, a wind project safe harbored in 2017 with 80% of the total PTC could potentially still enter into service in 2022. However, given that all RFP wind bids were PPAs, NIPSCO assumes that all tax credit eligibility assumptions are embedded in PPA prices.
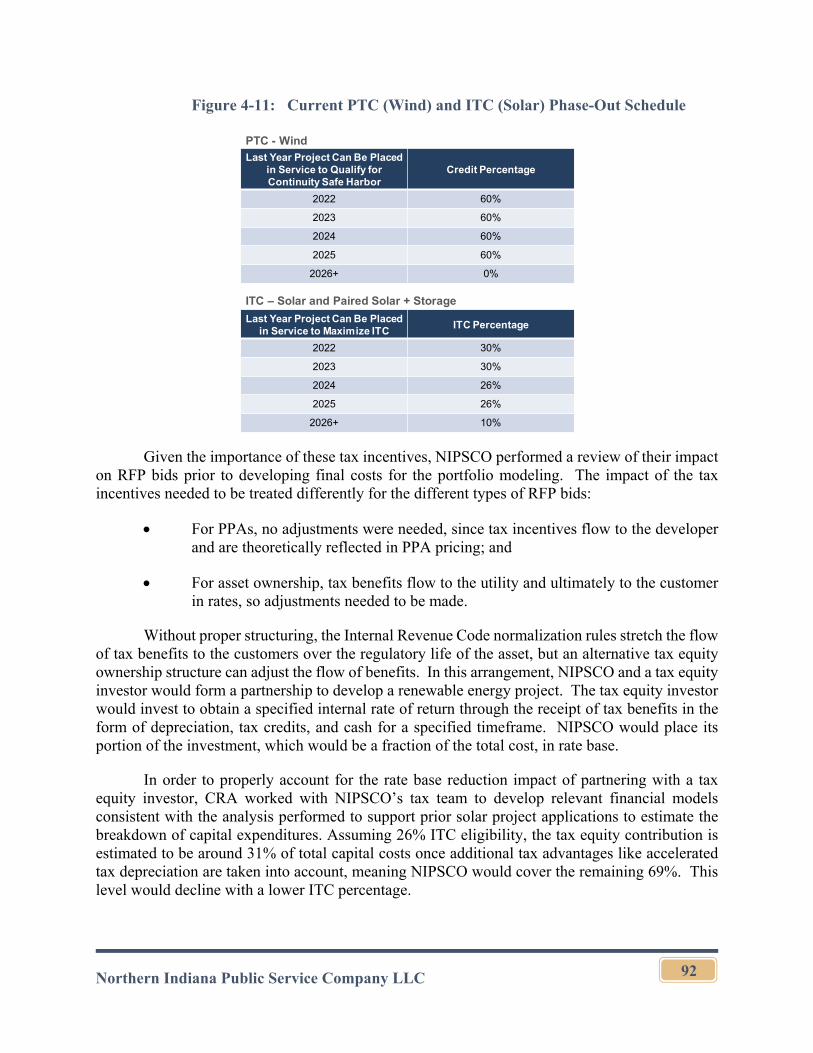
Northern Indiana Public Service Company LLC
92
Figure 4-11: Current PTC (Wind) and ITC (Solar) Phase-Out Schedule
Given the importance of these tax incentives, NIPSCO performed a review of their impact on RFP bids prior to developing final costs for the portfolio modeling. The impact of the tax incentives needed to be treated differently for the different types of RFP bids:
For PPAs, no adjustments were needed, since tax incentives flow to the developer and are theoretically reflected in PPA pricing; and
For asset ownership, tax benefits flow to the utility and ultimately to the customer in rates, so adjustments needed to be made.
Without proper structuring, the Internal Revenue Code normalization rules stretch the flow of tax benefits to the customers over the regulatory life of the asset, but an alternative tax equity ownership structure can adjust the flow of benefits. In this arrangement, NIPSCO and a tax equity investor would form a partnership to develop a renewable energy project. The tax equity investor would invest to obtain a specified internal rate of return through the receipt of tax benefits in the form of depreciation, tax credits, and cash for a specified timeframe. NIPSCO would place its portion of the investment, which would be a fraction of the total cost, in rate base.
In order to properly account for the rate base reduction impact of partnering with a tax equity investor, CRA worked with NIPSCO’s tax team to develop relevant financial models consistent with the analysis performed to support prior solar project applications to estimate the breakdown of capital expenditures. Assuming 26% ITC eligibility, the tax equity contribution is estimated to be around 31% of total capital costs once additional tax advantages like accelerated tax depreciation are taken into account, meaning NIPSCO would cover the remaining 69%. This level would decline with a lower ITC percentage.
Last Year Project Can Be Placed in Service to Qualify for Continuity Safe Harbor
Credit Percentage
2022 60%
2023 60%
2024 60%
2025 60%
2026+ 0%
Last Year Project Can Be Placed in Service to Maximize ITC
ITC Percentage
2022 30%
2023 30%
2024 26%
2025 26%
2026+ 10%
PTC - Wind
ITC – Solar and Paired Solar + Storage
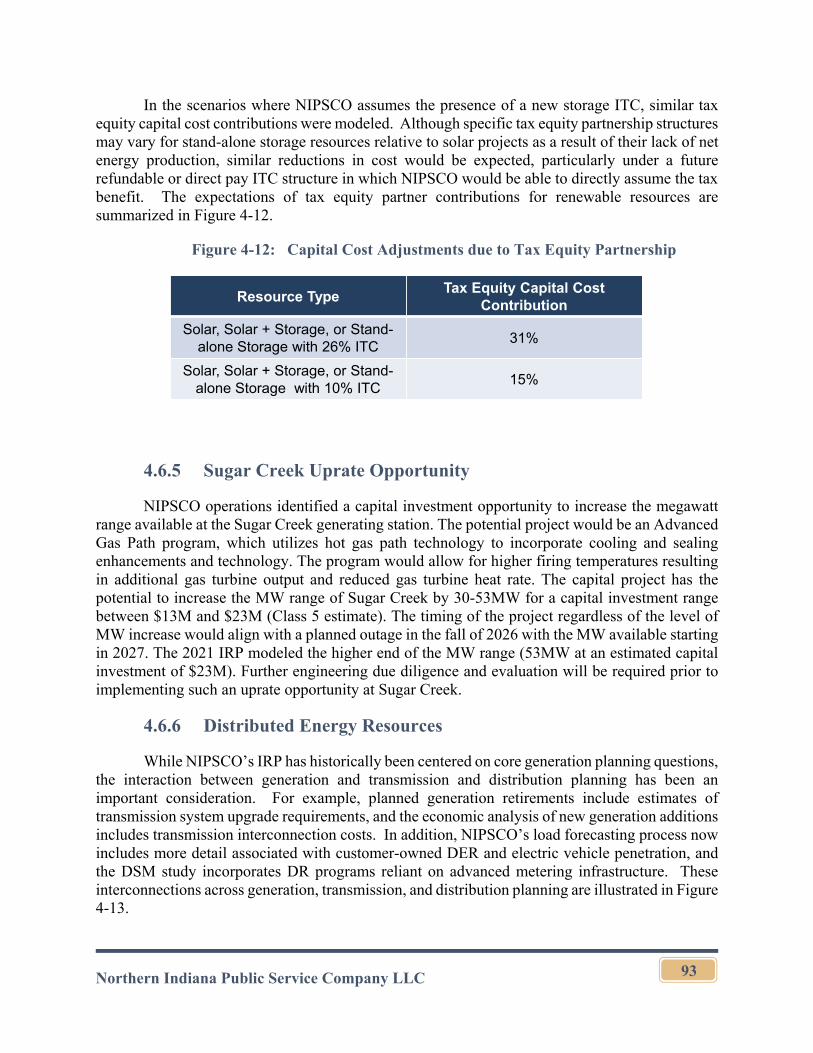
Northern Indiana Public Service Company LLC
93
In the scenarios where NIPSCO assumes the presence of a new storage ITC, similar tax equity capital cost contributions were modeled. Although specific tax equity partnership structures may vary for stand-alone storage resources relative to solar projects as a result of their lack of net energy production, similar reductions in cost would be expected, particularly under a future refundable or direct pay ITC structure in which NIPSCO would be able to directly assume the tax benefit. The expectations of tax equity partner contributions for renewable resources are summarized in Figure 4-12.
Figure 4-12: Capital Cost Adjustments due to Tax Equity Partnership
4.6.5 Sugar Creek Uprate Opportunity
NIPSCO operations identified a capital investment opportunity to increase the megawatt range available at the Sugar Creek generating station. The potential project would be an Advanced Gas Path program, which utilizes hot gas path technology to incorporate cooling and sealing enhancements and technology. The program would allow for higher firing temperatures resulting in additional gas turbine output and reduced gas turbine heat rate. The capital project has the potential to increase the MW range of Sugar Creek by 30-53MW for a capital investment range between $13M and $23M (Class 5 estimate). The timing of the project regardless of the level of MW increase would align with a planned outage in the fall of 2026 with the MW available starting in 2027. The 2021 IRP modeled the higher end of the MW range (53MW at an estimated capital investment of $23M). Further engineering due diligence and evaluation will be required prior to implementing such an uprate opportunity at Sugar Creek.
4.6.6 Distributed Energy Resources
While NIPSCO’s IRP has historically been centered on core generation planning questions, the interaction between generation and transmission and distribution planning has been an important consideration. For example, planned generation retirements include estimates of transmission system upgrade requirements, and the economic analysis of new generation additions includes transmission interconnection costs. In addition, NIPSCO’s load forecasting process now includes more detail associated with customer-owned DER and electric vehicle penetration, and the DSM study incorporates DR programs reliant on advanced metering infrastructure. These interconnections across generation, transmission, and distribution planning are illustrated in Figure 4-13.
Resource TypeTax Equity Capital Cost
Contribution
Solar, Solar + Storage, or Stand-alone Storage with 26% ITC
31%
Solar, Solar + Storage, or Stand-alone Storage with 10% ITC
15%
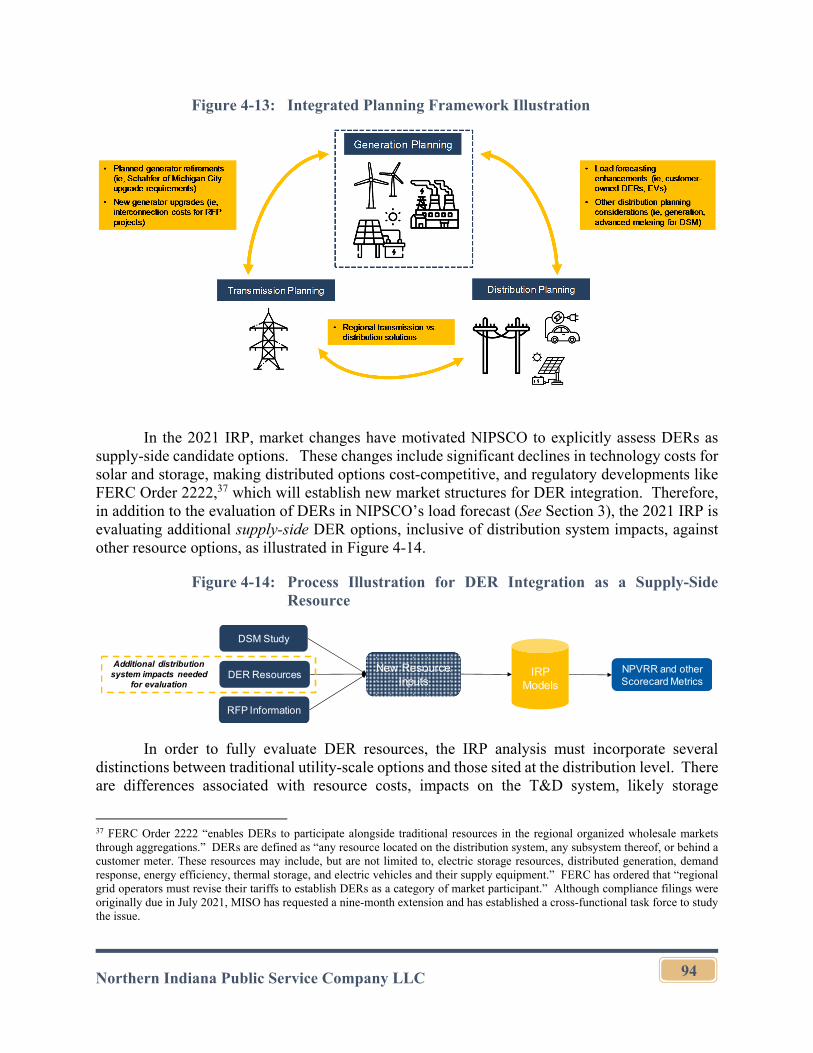
Northern Indiana Public Service Company LLC
94
Figure 4-13: Integrated Planning Framework Illustration
In the 2021 IRP, market changes have motivated NIPSCO to explicitly assess DERs as supply-side candidate options. These changes include significant declines in technology costs for solar and storage, making distributed options cost-competitive, and regulatory developments like FERC Order 2222,37 which will establish new market structures for DER integration. Therefore, in addition to the evaluation of DERs in NIPSCO’s load forecast (See Section 3), the 2021 IRP is evaluating additional supply-side DER options, inclusive of distribution system impacts, against other resource options, as illustrated in Figure 4-14.
Figure 4-14: Process Illustration for DER Integration as a Supply-Side Resource
In order to fully evaluate DER resources, the IRP analysis must incorporate several distinctions between traditional utility-scale options and those sited at the distribution level. There are differences associated with resource costs, impacts on the T&D system, likely storage
37 FERC Order 2222 “enables DERs to participate alongside traditional resources in the regional organized wholesale markets through aggregations.” DERs are defined as “any resource located on the distribution system, any subsystem thereof, or behind a customer meter. These resources may include, but are not limited to, electric storage resources, distributed generation, demand response, energy efficiency, thermal storage, and electric vehicles and their supply equipment.” FERC has ordered that “regional grid operators must revise their tariffs to establish DERs as a category of market participant.” Although compliance filings were originally due in July 2021, MISO has requested a nine-month extension and has established a cross-functional task force to study the issue.
New Resource Inputs
IRP Models
DSM Study
DER ResourcesAdditional distribution
system impacts needed for evaluation
NPVRR and other Scorecard Metrics
RFP Information
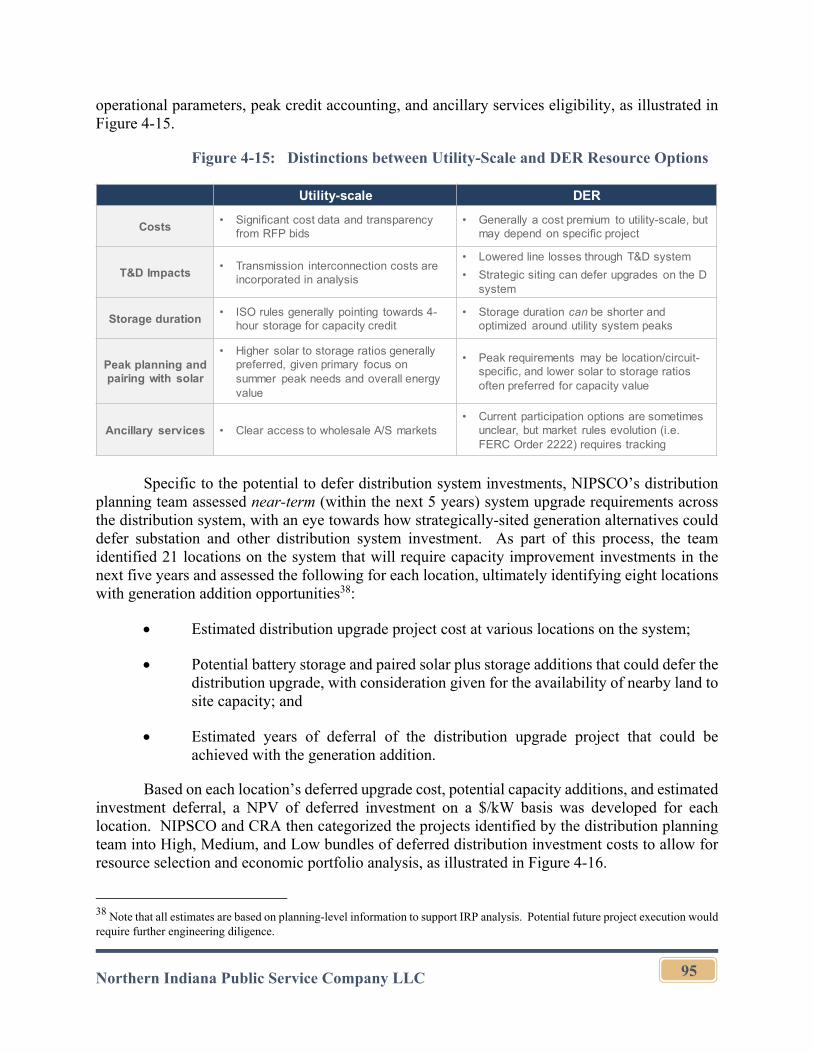
Northern Indiana Public Service Company LLC
95
operational parameters, peak credit accounting, and ancillary services eligibility, as illustrated in Figure 4-15.
Figure 4-15: Distinctions between Utility-Scale and DER Resource Options
Specific to the potential to defer distribution system investments, NIPSCO’s distribution planning team assessed near-term (within the next 5 years) system upgrade requirements across the distribution system, with an eye towards how strategically-sited generation alternatives could defer substation and other distribution system investment. As part of this process, the team identified 21 locations on the system that will require capacity improvement investments in the next five years and assessed the following for each location, ultimately identifying eight locations with generation addition opportunities38:
Estimated distribution upgrade project cost at various locations on the system;
Potential battery storage and paired solar plus storage additions that could defer the distribution upgrade, with consideration given for the availability of nearby land to site capacity; and
Estimated years of deferral of the distribution upgrade project that could be achieved with the generation addition.
Based on each location’s deferred upgrade cost, potential capacity additions, and estimated investment deferral, a NPV of deferred investment on a $/kW basis was developed for each location. NIPSCO and CRA then categorized the projects identified by the distribution planning team into High, Medium, and Low bundles of deferred distribution investment costs to allow for resource selection and economic portfolio analysis, as illustrated in Figure 4-16.
38 Note that all estimates are based on planning-level information to support IRP analysis. Potential future project execution would require further engineering diligence.
Utility-scale DER
Costs• Significant cost data and transparency
from RFP bids• Generally a cost premium to utility-scale, but
may depend on specific project
T&D Impacts• Transmission interconnection costs are
incorporated in analysis
• Lowered line losses through T&D system
• Strategic siting can defer upgrades on the D system
Storage duration• ISO rules generally pointing towards 4-
hour storage for capacity credit• Storage duration can be shorter and
optimized around utility system peaks
Peak planning and pairing with solar
• Higher solar to storage ratios generally preferred, given primary focus on summer peak needs and overall energy value
• Peak requirements may be location/circuit-specific, and lower solar to storage ratios often preferred for capacity value
Ancillary services • Clear access to wholesale A/S markets• Current participation options are sometimes
unclear, but market rules evolution (i.e. FERC Order 2222) requires tracking
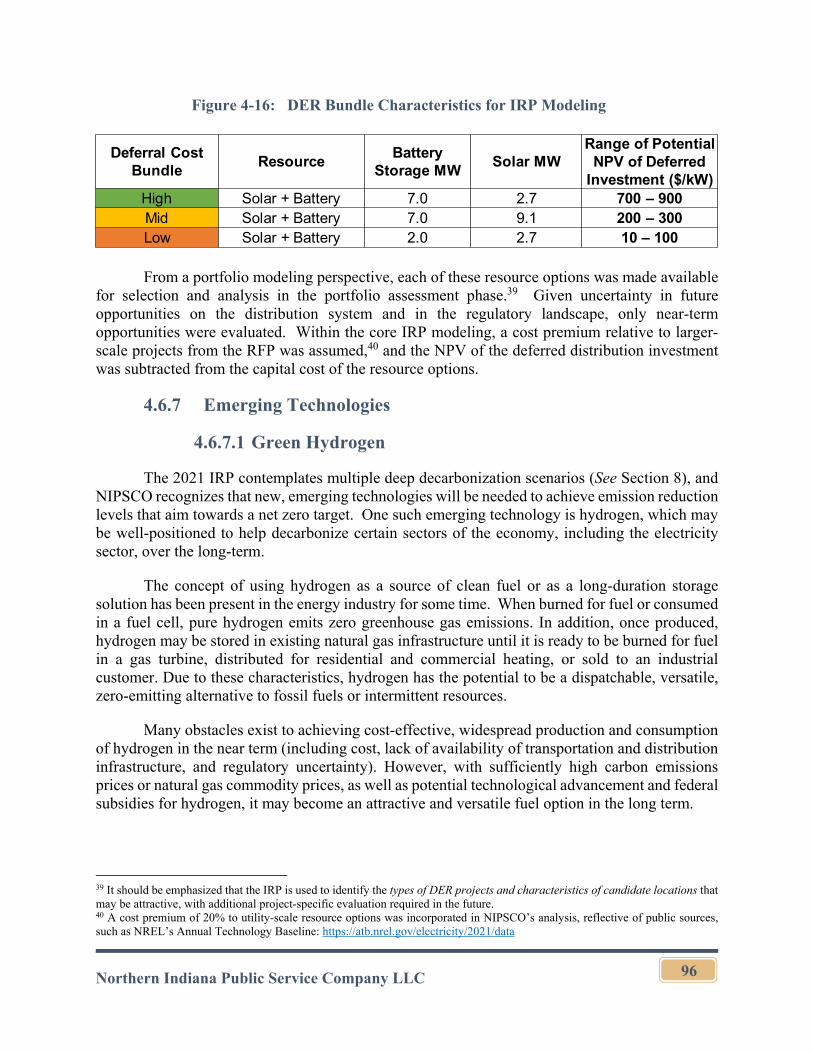
Northern Indiana Public Service Company LLC
96
Figure 4-16: DER Bundle Characteristics for IRP Modeling
From a portfolio modeling perspective, each of these resource options was made available for selection and analysis in the portfolio assessment phase.39 Given uncertainty in future opportunities on the distribution system and in the regulatory landscape, only near-term opportunities were evaluated. Within the core IRP modeling, a cost premium relative to larger-scale projects from the RFP was assumed,40 and the NPV of the deferred distribution investment was subtracted from the capital cost of the resource options.
4.6.7 Emerging Technologies
4.6.7.1 Green Hydrogen
The 2021 IRP contemplates multiple deep decarbonization scenarios (See Section 8), and NIPSCO recognizes that new, emerging technologies will be needed to achieve emission reduction levels that aim towards a net zero target. One such emerging technology is hydrogen, which may be well-positioned to help decarbonize certain sectors of the economy, including the electricity sector, over the long-term.
The concept of using hydrogen as a source of clean fuel or as a long-duration storage solution has been present in the energy industry for some time. When burned for fuel or consumed in a fuel cell, pure hydrogen emits zero greenhouse gas emissions. In addition, once produced, hydrogen may be stored in existing natural gas infrastructure until it is ready to be burned for fuel in a gas turbine, distributed for residential and commercial heating, or sold to an industrial customer. Due to these characteristics, hydrogen has the potential to be a dispatchable, versatile, zero-emitting alternative to fossil fuels or intermittent resources.
Many obstacles exist to achieving cost-effective, widespread production and consumption of hydrogen in the near term (including cost, lack of availability of transportation and distribution infrastructure, and regulatory uncertainty). However, with sufficiently high carbon emissions prices or natural gas commodity prices, as well as potential technological advancement and federal subsidies for hydrogen, it may become an attractive and versatile fuel option in the long term.
39 It should be emphasized that the IRP is used to identify the types of DER projects and characteristics of candidate locations that may be attractive, with additional project-specific evaluation required in the future. 40 A cost premium of 20% to utility-scale resource options was incorporated in NIPSCO’s analysis, reflective of public sources, such as NREL’s Annual Technology Baseline: https://atb.nrel.gov/electricity/2021/data
Deferral Cost Bundle
ResourceBattery
Storage MWSolar MW
Range of Potential NPV of Deferred
Investment ($/kW)High Solar + Battery 7.0 2.7 700 – 900Mid Solar + Battery 7.0 9.1 200 – 300 Low Solar + Battery 2.0 2.7 10 – 100
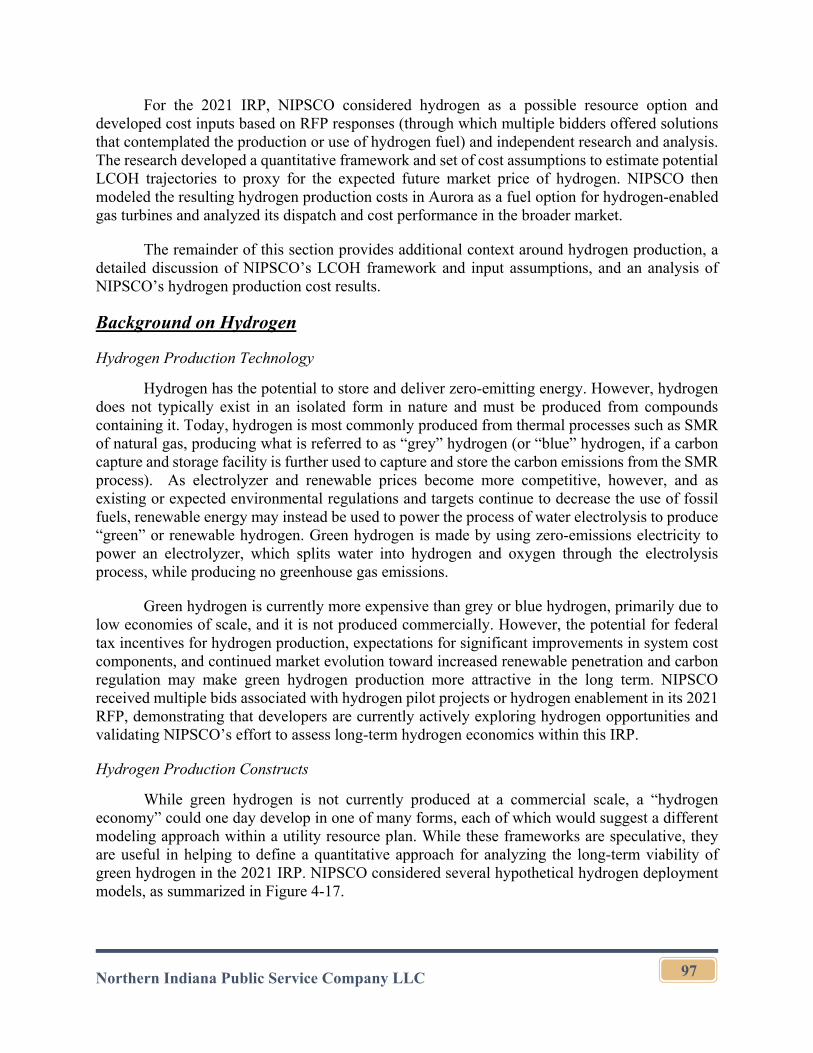
Northern Indiana Public Service Company LLC
97
For the 2021 IRP, NIPSCO considered hydrogen as a possible resource option and developed cost inputs based on RFP responses (through which multiple bidders offered solutions that contemplated the production or use of hydrogen fuel) and independent research and analysis. The research developed a quantitative framework and set of cost assumptions to estimate potential LCOH trajectories to proxy for the expected future market price of hydrogen. NIPSCO then modeled the resulting hydrogen production costs in Aurora as a fuel option for hydrogen-enabled gas turbines and analyzed its dispatch and cost performance in the broader market.
The remainder of this section provides additional context around hydrogen production, a detailed discussion of NIPSCO’s LCOH framework and input assumptions, and an analysis of NIPSCO’s hydrogen production cost results.
Background on Hydrogen
Hydrogen Production Technology
Hydrogen has the potential to store and deliver zero-emitting energy. However, hydrogen does not typically exist in an isolated form in nature and must be produced from compounds containing it. Today, hydrogen is most commonly produced from thermal processes such as SMR of natural gas, producing what is referred to as “grey” hydrogen (or “blue” hydrogen, if a carbon capture and storage facility is further used to capture and store the carbon emissions from the SMR process). As electrolyzer and renewable prices become more competitive, however, and as existing or expected environmental regulations and targets continue to decrease the use of fossil fuels, renewable energy may instead be used to power the process of water electrolysis to produce “green” or renewable hydrogen. Green hydrogen is made by using zero-emissions electricity to power an electrolyzer, which splits water into hydrogen and oxygen through the electrolysis process, while producing no greenhouse gas emissions.
Green hydrogen is currently more expensive than grey or blue hydrogen, primarily due to low economies of scale, and it is not produced commercially. However, the potential for federal tax incentives for hydrogen production, expectations for significant improvements in system cost components, and continued market evolution toward increased renewable penetration and carbon regulation may make green hydrogen production more attractive in the long term. NIPSCO received multiple bids associated with hydrogen pilot projects or hydrogen enablement in its 2021 RFP, demonstrating that developers are currently actively exploring hydrogen opportunities and validating NIPSCO’s effort to assess long-term hydrogen economics within this IRP.
Hydrogen Production Constructs
While green hydrogen is not currently produced at a commercial scale, a “hydrogen economy” could one day develop in one of many forms, each of which would suggest a different modeling approach within a utility resource plan. While these frameworks are speculative, they are useful in helping to define a quantitative approach for analyzing the long-term viability of green hydrogen in the 2021 IRP. NIPSCO considered several hypothetical hydrogen deployment models, as summarized in Figure 4-17.
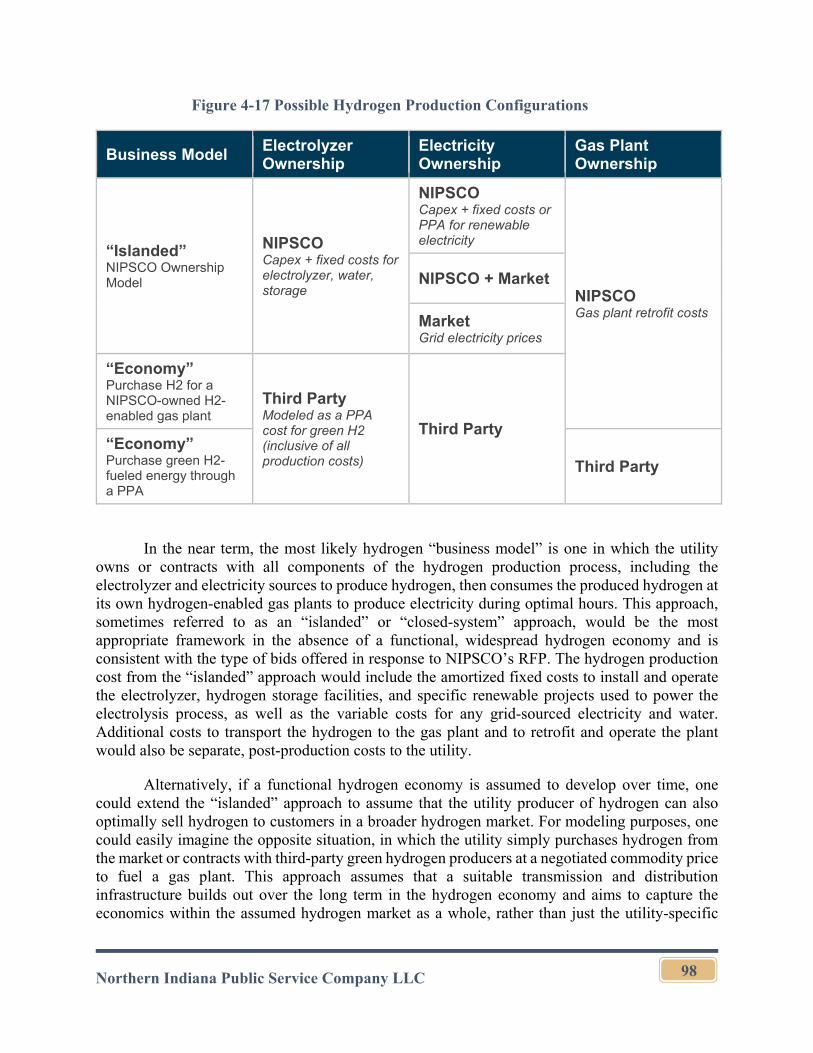
Northern Indiana Public Service Company LLC
98
Figure 4-17 Possible Hydrogen Production Configurations
Business Model Electrolyzer Ownership
Electricity Ownership
Gas Plant Ownership
“Islanded” NIPSCO Ownership Model
NIPSCO Capex + fixed costs for electrolyzer, water, storage
NIPSCO Capex + fixed costs or PPA for renewable electricity
NIPSCO Gas plant retrofit costs
NIPSCO + Market
Market Grid electricity prices
“Economy” Purchase H2 for a NIPSCO-owned H2-enabled gas plant
Third Party Modeled as a PPA cost for green H2 (inclusive of all production costs)
Third Party “Economy” Purchase green H2-fueled energy through a PPA
Third Party
In the near term, the most likely hydrogen “business model” is one in which the utility owns or contracts with all components of the hydrogen production process, including the electrolyzer and electricity sources to produce hydrogen, then consumes the produced hydrogen at its own hydrogen-enabled gas plants to produce electricity during optimal hours. This approach, sometimes referred to as an “islanded” or “closed-system” approach, would be the most appropriate framework in the absence of a functional, widespread hydrogen economy and is consistent with the type of bids offered in response to NIPSCO’s RFP. The hydrogen production cost from the “islanded” approach would include the amortized fixed costs to install and operate the electrolyzer, hydrogen storage facilities, and specific renewable projects used to power the electrolysis process, as well as the variable costs for any grid-sourced electricity and water. Additional costs to transport the hydrogen to the gas plant and to retrofit and operate the plant would also be separate, post-production costs to the utility.
Alternatively, if a functional hydrogen economy is assumed to develop over time, one could extend the “islanded” approach to assume that the utility producer of hydrogen can also optimally sell hydrogen to customers in a broader hydrogen market. For modeling purposes, one could easily imagine the opposite situation, in which the utility simply purchases hydrogen from the market or contracts with third-party green hydrogen producers at a negotiated commodity price to fuel a gas plant. This approach assumes that a suitable transmission and distribution infrastructure builds out over the long term in the hydrogen economy and aims to capture the economics within the assumed hydrogen market as a whole, rather than just the utility-specific
Northern Indiana Public Service Company LLC
99
power generation assets that would “feed” the electrolyzer. The assumed market commodity price of hydrogen would be an all-in cost, including the fixed and variable costs of production. NIPSCO used the latter framework as the basis for its long-term economic analysis.
Hydrogen Modeling Input Assumptions Development
Hydrogen Production Cost Components
To transparently build up a long-term price trajectory for green hydrogen production, NIPSCO developed a set of input assumptions for each of the cost components. Production costs were assumed to include electrolyzer capital and fixed O&M costs, electricity, and water. All data was drawn from public sources and was adjusted for MISO LRZ 6-specific hydrogen production costs based on local renewable capacity factors and power prices.
Electrolyzer CapEx
Electrolyzer costs are expected to drop significantly over the next twenty years, primarily due to economies of scale and competition from global manufacturers. It is projected that economies of scale will play a noticeable role in lowering overall balance of plant costs, where cost savings between 15-45% can be achieved through increasing annual electrolyzer production. Furthermore, larger electrolyzer systems tend to cost less than smaller systems on a $/kW basis. This $/kW cost difference can range from 33-56%, dependent on future production levels.41 To develop long-term cost assumptions for electrolyzer capital costs, CRA and NIPSCO conducted a literature review of historical and forecast electrolyzer CapEx estimates. Most data were pulled from a database published by Glenk et al. (2019),42 which included only original sources of data found in journal articles, industry data, publicly available reports, and interviews with industry sources, and excluded literature that did not provide clear cost estimates or methodologies for producing cost estimates. CRA then developed a potential trajectory for electrolyzer capital costs that achieved long-term estimates recently published by the IEA,43 BNEF,44 and Bank of America-Merrill Lynch. The cost estimates for the PEM electrolyzer technology are summarized in Figure 4-18.45
41 Ahmad Mayyas et. al, “Manufacturing Cost Analysis for Proton Exchange Membrane Water Electrolyzers” National Renewable Energy Laboratory 2019. https://www.nrel.gov/docs/fy19osti/72740.pdf 42 Gunther Glenk and Stefan Reichelstein. “Economics of converting renewable power to hydrogen.” In: Nature Energy 4.3 (2019), pp.216-222. 43 IEA. The Future of Hydrogen. 2019. https://www.iea.org/reports/the-future-of-hydrogen 44 BNEF. Hydrogen: The Economics of Production from Renewables. 2019. 45 PEM systems are capable of operating at high pressures, obviating the need for compression.
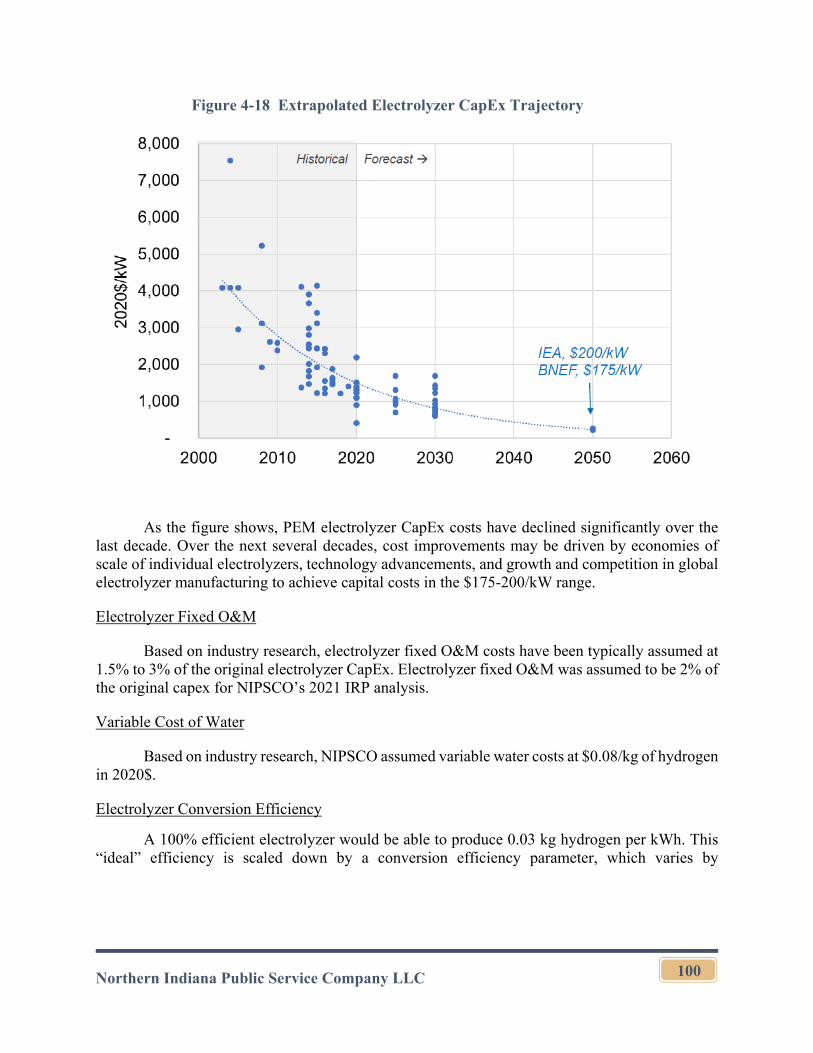
Northern Indiana Public Service Company LLC
100
Figure 4-18 Extrapolated Electrolyzer CapEx Trajectory
As the figure shows, PEM electrolyzer CapEx costs have declined significantly over the last decade. Over the next several decades, cost improvements may be driven by economies of scale of individual electrolyzers, technology advancements, and growth and competition in global electrolyzer manufacturing to achieve capital costs in the $175-200/kW range.
Electrolyzer Fixed O&M
Based on industry research, electrolyzer fixed O&M costs have been typically assumed at 1.5% to 3% of the original electrolyzer CapEx. Electrolyzer fixed O&M was assumed to be 2% of the original capex for NIPSCO’s 2021 IRP analysis.
Variable Cost of Water
Based on industry research, NIPSCO assumed variable water costs at $0.08/kg of hydrogen in 2020$.
Electrolyzer Conversion Efficiency
A 100% efficient electrolyzer would be able to produce 0.03 kg hydrogen per kWh. This “ideal” efficiency is scaled down by a conversion efficiency parameter, which varies by
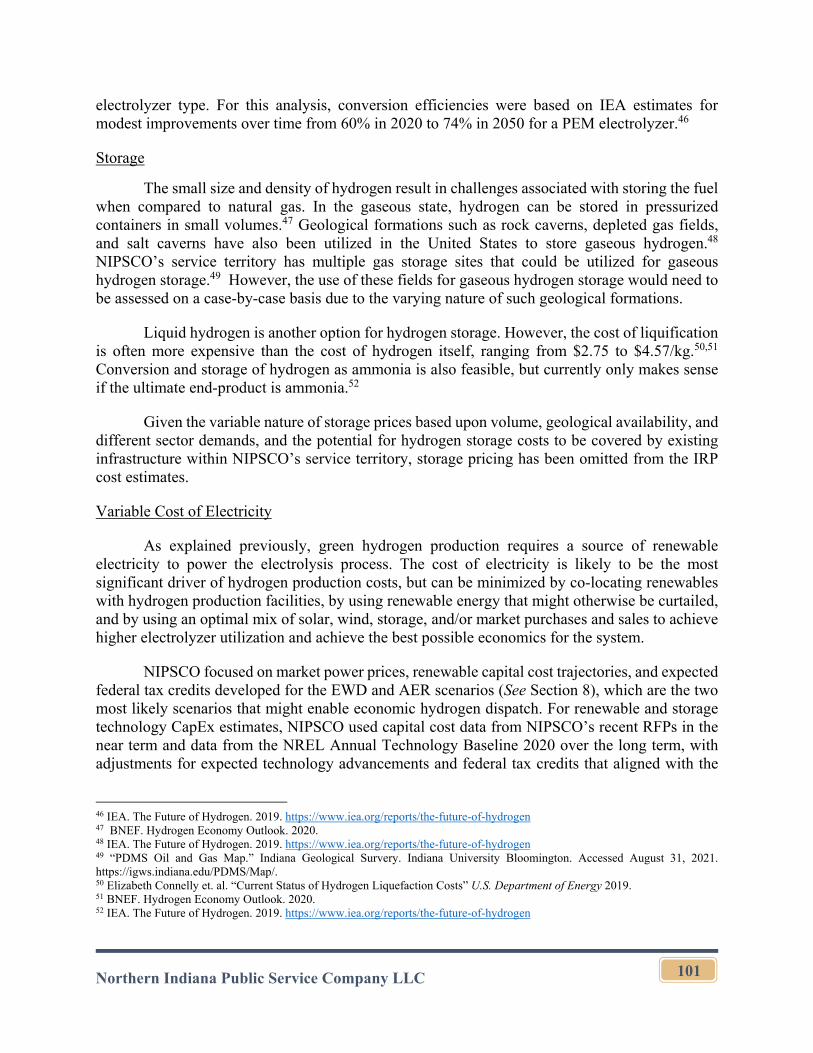
Northern Indiana Public Service Company LLC
101
electrolyzer type. For this analysis, conversion efficiencies were based on IEA estimates for modest improvements over time from 60% in 2020 to 74% in 2050 for a PEM electrolyzer.46
Storage
The small size and density of hydrogen result in challenges associated with storing the fuel when compared to natural gas. In the gaseous state, hydrogen can be stored in pressurized containers in small volumes.47 Geological formations such as rock caverns, depleted gas fields, and salt caverns have also been utilized in the United States to store gaseous hydrogen.48 NIPSCO’s service territory has multiple gas storage sites that could be utilized for gaseous hydrogen storage.49 However, the use of these fields for gaseous hydrogen storage would need to be assessed on a case-by-case basis due to the varying nature of such geological formations.
Liquid hydrogen is another option for hydrogen storage. However, the cost of liquification is often more expensive than the cost of hydrogen itself, ranging from $2.75 to $4.57/kg.50,51 Conversion and storage of hydrogen as ammonia is also feasible, but currently only makes sense if the ultimate end-product is ammonia.52
Given the variable nature of storage prices based upon volume, geological availability, and different sector demands, and the potential for hydrogen storage costs to be covered by existing infrastructure within NIPSCO’s service territory, storage pricing has been omitted from the IRP cost estimates.
Variable Cost of Electricity
As explained previously, green hydrogen production requires a source of renewable electricity to power the electrolysis process. The cost of electricity is likely to be the most significant driver of hydrogen production costs, but can be minimized by co-locating renewables with hydrogen production facilities, by using renewable energy that might otherwise be curtailed, and by using an optimal mix of solar, wind, storage, and/or market purchases and sales to achieve higher electrolyzer utilization and achieve the best possible economics for the system.
NIPSCO focused on market power prices, renewable capital cost trajectories, and expected federal tax credits developed for the EWD and AER scenarios (See Section 8), which are the two most likely scenarios that might enable economic hydrogen dispatch. For renewable and storage technology CapEx estimates, NIPSCO used capital cost data from NIPSCO’s recent RFPs in the near term and data from the NREL Annual Technology Baseline 2020 over the long term, with adjustments for expected technology advancements and federal tax credits that aligned with the
46 IEA. The Future of Hydrogen. 2019. https://www.iea.org/reports/the-future-of-hydrogen 47 BNEF. Hydrogen Economy Outlook. 2020. 48 IEA. The Future of Hydrogen. 2019. https://www.iea.org/reports/the-future-of-hydrogen 49 “PDMS Oil and Gas Map.” Indiana Geological Survery. Indiana University Bloomington. Accessed August 31, 2021. https://igws.indiana.edu/PDMS/Map/. 50 Elizabeth Connelly et. al. “Current Status of Hydrogen Liquefaction Costs” U.S. Department of Energy 2019. 51 BNEF. Hydrogen Economy Outlook. 2020. 52 IEA. The Future of Hydrogen. 2019. https://www.iea.org/reports/the-future-of-hydrogen
Northern Indiana Public Service Company LLC
102
IRP scenario narratives (See Section 8). For wholesale market power prices, NIPSCO used the EWD and AER scenario power price trajectories developed for the 2021 IRP scenario analysis.53
To develop long-term cost of electricity assumptions, NIPSCO determined the LCOE of various configurations of renewable generation, including standalone solar; standalone wind; market electricity purchases; and optimized hybrid combinations of solar, wind, 4-hour battery storage, and market purchases and/or sales.
For the standalone renewable configurations, NIPSCO determined the LCOE of the renewables including amortized capital and fixed operating costs and congestion cost estimates. These estimates are shown in Figure 4-19: S
Figure 4-19: Standalone Wind and Solar LCOE by IRP Scenario
In addition to standalone renewable LCOEs, NIPSCO also considered hybrid configurations to address the possibility that better economics and higher electrolyzer utilization targets could be achieved by combining the hourly production profiles of wind and solar, incorporating battery storage, and/or optimally purchasing electricity from the wholesale power market during the lowest-priced hours.54 To analyze the economics of such a configuration, NIPSCO developed an optimization tool to determine the least-cost capacity mix of solar, wind, battery storage, and hourly market purchases and sales when assuming a fixed “target” electrolyzer 53 Section 8 of this report summarizes NIPSCO’s MISO market scenario assumptions and modeling outcomes. As noted in that section, new technologies such as hydrogen are likely needed to achieve deep decarbonization. However, the two scenarios have very different power price outcomes based on different assumptions regarding carbon emission regulation. 54 Without hybrid configurations, devoted standalone solar or standalone wind resources would need to be significantly “overbuilt” above the size of the electrolyzer. Standalone wind would need to be overbuilt to approximately 3 times the size of the electrolyzer to achieve a utilization of 80 percent. The maximum achievable electrolyzer utilization with standalone solar is only 55 percent due to zero nighttime energy from solar plants, and would require overbuilding solar to at least 800 times the size of the electrolyzer. Hourly solar and wind capacity factor data for this analysis was based on data from NIPSCO’s planned standalone solar and wind resources.
-
10
20
30
40
50
60
2020
$/M
Wh
AER Wind
AER Solar
EWD Wind
EWD Solar
Northern Indiana Public Service Company LLC
103
utilization of 80 percent. The optimization model took as inputs hourly solar and wind generation, hourly battery storage dispatch, capital and fixed costs of the renewables, and hourly wholesale market prices. The optimization model then aimed to minimize capital and fixed costs of the wind, solar, and battery components plus the costs of any market purchases while achieving at least an 80 percent electrolyzer utilization.55
Based on the optimization analysis, NIPSCO determined that the least-cost source of electricity to power the electrolyzer and achieve an 80 percent utilization in the EWD case was to purchase all power from the market during optimal hours. In the AER case, the least-cost source of electricity was a mix of optimal hourly market power purchases and solar generation.
For the resulting optimized hybrid renewable configurations, NIPSCO then determined a final hybrid LCOE that included the LCOE of the preferred renewable portfolio and any cost of purchasing wholesale power during optimal hours.
4.6.7.2 Developing Hydrogen Costs for the 2021 IRP
Several bidders in the 2021 RFP discussed the topic of hydrogen production and consumption in electric generating resources, and multiple bidders offered projects associated with either electrolysis-based hydrogen production (in the form of a small-scale pilot program) or enablement of natural gas turbines to burn the fuel. Such bidder interest confirmed the viability of the technology and prompted NIPSCO to develop hydrogen cost projections over time for use in the IRP portfolio modeling. In order to develop cost projections, NIPSCO (i) used bidder-provided information for near-term cost benchmarking associated with both hydrogen production and the additional costs required to enable the fuel to be consumed in natural gas turbines and (ii) developed long-term LCOH trajectories based on the information and inputs described above.
Levelized Cost of Hydrogen over Time
NIPSCO’s LCOH projections were based on assumptions for the levelized cost of an electrolyzer, the variable costs associated with water, and the LCOE of renewables (potentially combined with optimal hourly net market purchases as discussed above). For IRP portfolio modeling purposes, the hydrogen cost was then included as the fuel component of the dispatch cost for a hydrogen-enabled gas plant, allowing the resource type to compete with other options, including as a fuel alternative (with different fuel and emissions costs) versus natural gas.
Given significant uncertainty regarding the future costs of electrolysis and electricity, support for hydrogen production in the form of a federal subsidy program might be required to achieve cost-competitiveness and achieve significant decarbonization, particularly in the AER and EWD market scenarios. Although at the time of the development of major input assumptions for this IRP no hydrogen subsidy legislation had passed the U.S. Congress, several proposals were under consideration, and NIPSCO has incorporated an assumed $0.50/kg subsidy sensitivity in the AER and EWD scenarios for IRP portfolio modeling.
55 An alternative approach to the one described here could be to instead optimize the size of the electrolyzer to achieve a sufficiently high utilization to achieve the best possible economics.
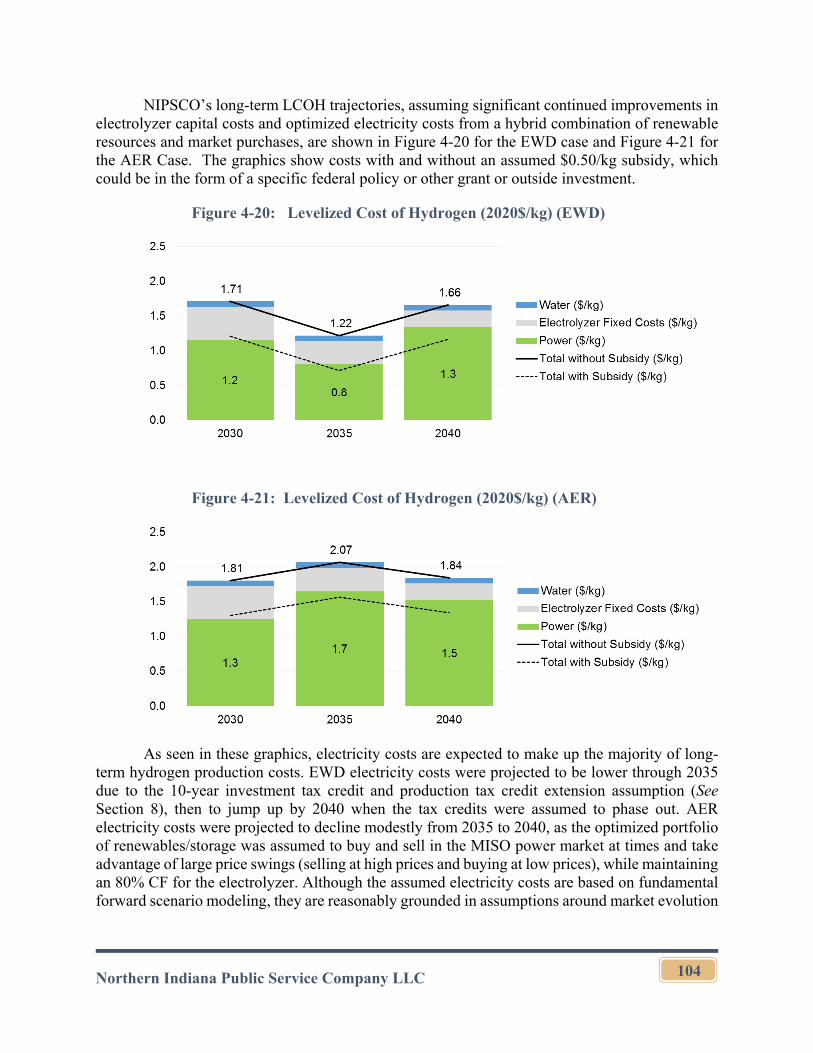
Northern Indiana Public Service Company LLC
104
NIPSCO’s long-term LCOH trajectories, assuming significant continued improvements in electrolyzer capital costs and optimized electricity costs from a hybrid combination of renewable resources and market purchases, are shown in Figure 4-20 for the EWD case and Figure 4-21 for the AER Case. The graphics show costs with and without an assumed $0.50/kg subsidy, which could be in the form of a specific federal policy or other grant or outside investment.
Figure 4-20: Levelized Cost of Hydrogen (2020$/kg) (EWD)
Figure 4-21: Levelized Cost of Hydrogen (2020$/kg) (AER)
As seen in these graphics, electricity costs are expected to make up the majority of long-term hydrogen production costs. EWD electricity costs were projected to be lower through 2035 due to the 10-year investment tax credit and production tax credit extension assumption (See Section 8), then to jump up by 2040 when the tax credits were assumed to phase out. AER electricity costs were projected to decline modestly from 2035 to 2040, as the optimized portfolio of renewables/storage was assumed to buy and sell in the MISO power market at times and take advantage of large price swings (selling at high prices and buying at low prices), while maintaining an 80% CF for the electrolyzer. Although the assumed electricity costs are based on fundamental forward scenario modeling, they are reasonably grounded in assumptions around market evolution
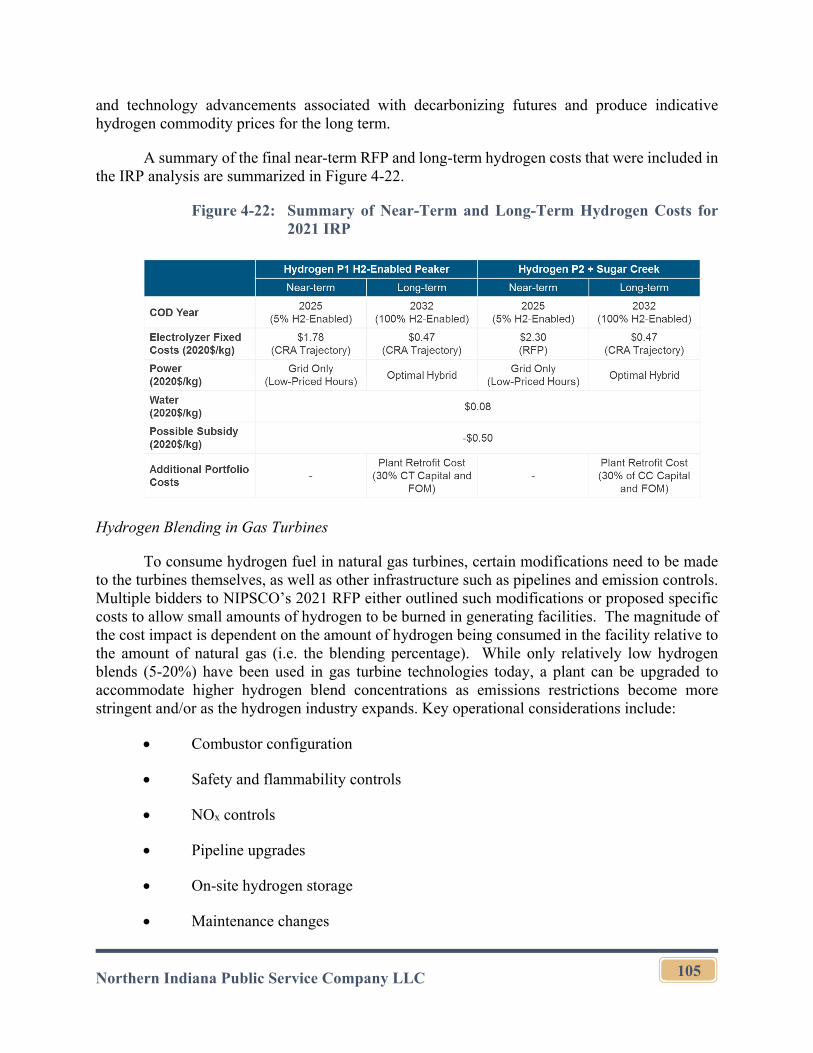
Northern Indiana Public Service Company LLC
105
and technology advancements associated with decarbonizing futures and produce indicative hydrogen commodity prices for the long term.
A summary of the final near-term RFP and long-term hydrogen costs that were included in the IRP analysis are summarized in Figure 4-22.
Figure 4-22: Summary of Near-Term and Long-Term Hydrogen Costs for 2021 IRP
Hydrogen Blending in Gas Turbines
To consume hydrogen fuel in natural gas turbines, certain modifications need to be made to the turbines themselves, as well as other infrastructure such as pipelines and emission controls. Multiple bidders to NIPSCO’s 2021 RFP either outlined such modifications or proposed specific costs to allow small amounts of hydrogen to be burned in generating facilities. The magnitude of the cost impact is dependent on the amount of hydrogen being consumed in the facility relative to the amount of natural gas (i.e. the blending percentage). While only relatively low hydrogen blends (5-20%) have been used in gas turbine technologies today, a plant can be upgraded to accommodate higher hydrogen blend concentrations as emissions restrictions become more stringent and/or as the hydrogen industry expands. Key operational considerations include:
Combustor configuration
Safety and flammability controls
NOx controls
Pipeline upgrades
On-site hydrogen storage
Maintenance changes
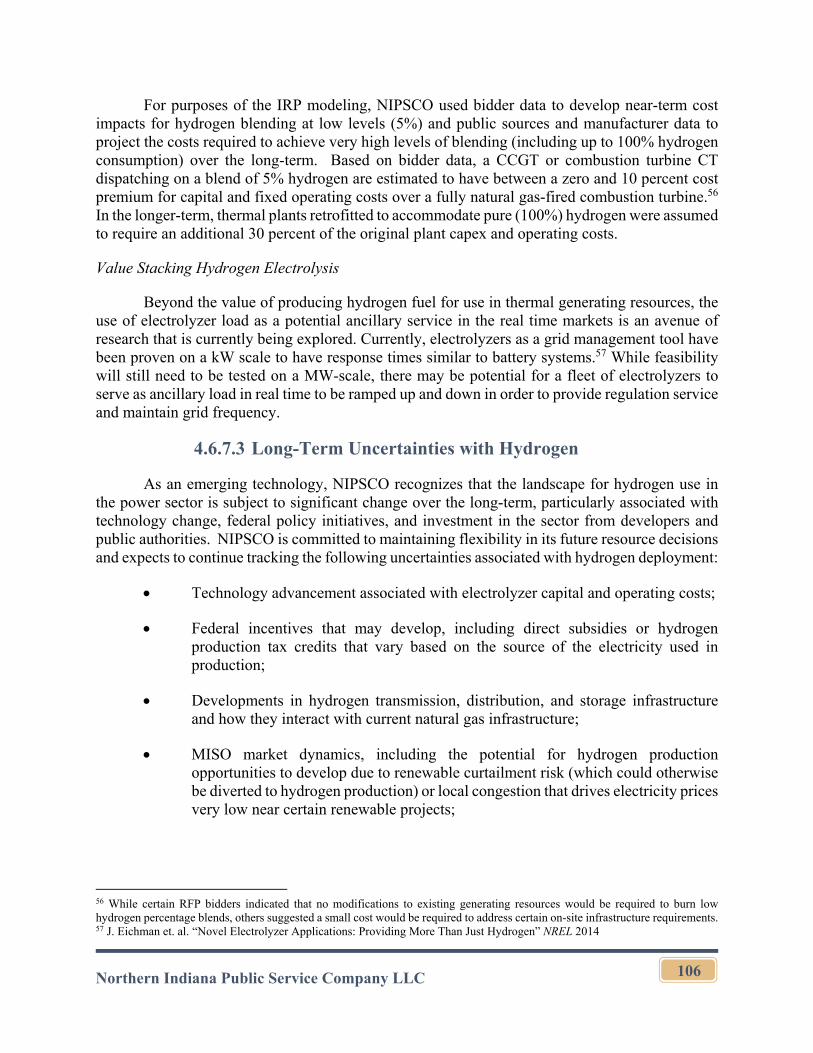
Northern Indiana Public Service Company LLC
106
For purposes of the IRP modeling, NIPSCO used bidder data to develop near-term cost impacts for hydrogen blending at low levels (5%) and public sources and manufacturer data to project the costs required to achieve very high levels of blending (including up to 100% hydrogen consumption) over the long-term. Based on bidder data, a CCGT or combustion turbine CT dispatching on a blend of 5% hydrogen are estimated to have between a zero and 10 percent cost premium for capital and fixed operating costs over a fully natural gas-fired combustion turbine.56 In the longer-term, thermal plants retrofitted to accommodate pure (100%) hydrogen were assumed to require an additional 30 percent of the original plant capex and operating costs.
Value Stacking Hydrogen Electrolysis
Beyond the value of producing hydrogen fuel for use in thermal generating resources, the use of electrolyzer load as a potential ancillary service in the real time markets is an avenue of research that is currently being explored. Currently, electrolyzers as a grid management tool have been proven on a kW scale to have response times similar to battery systems.57 While feasibility will still need to be tested on a MW-scale, there may be potential for a fleet of electrolyzers to serve as ancillary load in real time to be ramped up and down in order to provide regulation service and maintain grid frequency.
4.6.7.3 Long-Term Uncertainties with Hydrogen
As an emerging technology, NIPSCO recognizes that the landscape for hydrogen use in the power sector is subject to significant change over the long-term, particularly associated with technology change, federal policy initiatives, and investment in the sector from developers and public authorities. NIPSCO is committed to maintaining flexibility in its future resource decisions and expects to continue tracking the following uncertainties associated with hydrogen deployment:
Technology advancement associated with electrolyzer capital and operating costs;
Federal incentives that may develop, including direct subsidies or hydrogen production tax credits that vary based on the source of the electricity used in production;
Developments in hydrogen transmission, distribution, and storage infrastructure and how they interact with current natural gas infrastructure;
MISO market dynamics, including the potential for hydrogen production opportunities to develop due to renewable curtailment risk (which could otherwise be diverted to hydrogen production) or local congestion that drives electricity prices very low near certain renewable projects;
56 While certain RFP bidders indicated that no modifications to existing generating resources would be required to burn low hydrogen percentage blends, others suggested a small cost would be required to address certain on-site infrastructure requirements. 57 J. Eichman et. al. “Novel Electrolyzer Applications: Providing More Than Just Hydrogen” NREL 2014
Northern Indiana Public Service Company LLC
107
Broader carbon emission reduction policies, which could put a price on carbon or incentivize the use of clean energy sources such as hydrogen; and
The price of natural gas, which remains a competing fuel for hydrogen.
4.6.8 Carbon Capture, Utilization, and Storage
Another emerging technology that may be positioned to support the decarbonization of the electricity sector is CCUS. Broadly, this technology refers to processes that (i) capture and separate CO2 directly from a fossil fuel (such as from coal in an IGCC process) or the flue gas of an electric power plant post-combustion or other point-source emission stream of CO2; (ii) purify, compress, and transport the CO2; and (iii) utilize (such as in an EOR process) or sequester the CO2 underground in saline reservoirs or unused coal seams.
NIPSCO’s RFP did not generate any bids related to CCUS, so specific portfolio modeling has not been performed for this technology. However, the MISO market scenario analysis incorporated CCUS technology as a plausible generation resource option under scenarios with significant carbon reduction trajectories (See Section 8), and it remains a potentially feasible option for the Sugar Creek combined cycle over the long-term. As a result, NIPSCO plans to continue to assess CCUS technology in the future, particularly as a long-term means of achieving a net zero emission profile. The remainder of this section provides an overview of the technology, potential cost ranges, and federal policy support considerations.
4.6.8.1 CCUS Technology Overview
CCUS is an emissions reduction technology that can be applied to electricity generation processes, such as fossil fuel combustion or gasification. To minimize the costs of transportation and sequestration, a relatively pure stream of CO2 must first be separated from a mixture of gases, such as flue gas or synthetic gas or “syngas” (in the case of an IGCC process). There are multiple technologies available to capture CO2, although the most common application involves chemical absorption via ionic liquid solvent, such as compounds of ethanolamines.58 In this example, CO2 would be absorbed by the solvent and regenerated as a relatively pure stream at a higher temperature. As a result, a heat source is required and may be provided from redirecting steam from electric generating turbines or by burning natural gas.
The CO2 is then compressed to a high-pressure stream and transported for sequestration. CO2 can be stored underground as a supercritical fluid at temperatures in excess of 88 degrees Fahrenheit and pressures in excess of 1,057 pounds per square inch.59 The most suitable storage locations include saline formations and oil and gas reservoirs. Retrofitting a power plant for CO2 removal through chemical absorption may include, but not limited to, the installation of absorber-stripper columns, heat exchanger, compression and drying system, and piping.60 The energy
58 IEA 2021, “About CCUS: Principal Technologies.” https://www.iea.org/reports/about-ccus 59 This temperature and pressure define CO2’s critical point. NETL Carbon Capture Storage FAQs. https://netl.doe.gov/coal/carbon-storage/faqs/carbon-storage-faqs 60 National Energy Technology Laboratory 2013, Cost and Performance of Retrofitting NGCC Units for Carbon Capture. DOE/NETL-2018/1896. https://netl.doe.gov/projects/files/CostPerformanceRetrofittingNGCCforCarbonCapture_040119.pdf
Northern Indiana Public Service Company LLC
108
penalty associated with the heat source and auxiliary loads (including energy to compress CO2) are typically quoted with CCUS technology parameters.
4.6.8.2 CCUS Cost Estimates
Since the 2021 RFP did not yield any CCUS projects, NIPSCO-specific portfolio analysis of the technology was not performed. However, in order to develop perspective on long-run CCUS costs to be used in the MISO market scenario analysis (See Section 8) and to approximate the potential cost and operational impacts of a CCUS retrofit to the existing Sugar Creek combined cycle, CRA and NIPSCO performed a review of third-party estimates. Overall, costs for CCUS projects fall within the following three categories:
Capturing CO2 at the source of emission and compressing or liquifying it for transport61;
Transporting the CO2 via pipeline, ship, or truck, as appropriate; and
Sequestering the CO2 underground, including costs associated with injection, monitoring, and verification.
To develop planning-level cost estimates for use in the MISO market modeling and to approximate cost ranges for NIPSCO, a range of sources were reviewed, including the EIA Annual AEO, the Global CCS Institute, the NETL, and the CATF.62 From a high-level perspective, CRA’s MISO market analysis suggests that under a scenario with high carbon prices or a significant clean energy standard that aims to achieve deep decarbonization, CCUS can be competitive with other technologies like hydrogen, or new nuclear in 2035 and beyond, depending on plant-specific cost and locational considerations, and transportation infrastructure.
Across scenarios, the economics tended to favor coal CCS in the AER scenario (high gas prices, high carbon price), with more gas CCS projects likely to be economic in the EWD scenario (with lower gas prices and a clean energy standard with accompanying clean energy credit prices).63 The referenced studies and CRA’s MISO market analysis suggest that CCUS is likely to be cost-effective at CO2 prices between $50-150/ton, depending on future costs of fuel, technology advancement, and transportation requirements.
61 Capital expenditures are largely associated with an absorption tower, energy consumption requirements that are often represented through reductions in power output of the host facility, and compression costs. 62 Specific sources include the 2021 AEO (https://www.eia.gov/outlooks/aeo/assumptions/pdf/electricity.pdf), the Global CCS Institute’s Global Costs of Carbon Capture and Storage study (https://www.globalccsinstitute.com/archive/hub/publications/201688/global-ccs-cost-updatev4.pdf), NETL’s Economics of CCUS presentation by Tim Fout from November 2020, and CATF’s “Estimate of CO2 Capture Performance and Cost Parameters for Gulf Coast Power Fleet Modeling,” (https://www.catf.us/wp-content/uploads/2018/12/Estimate_of_CO2_Capture_Performance_and_Cost_Parameters.pdf) 63 See Section 8 of this report for more detail.
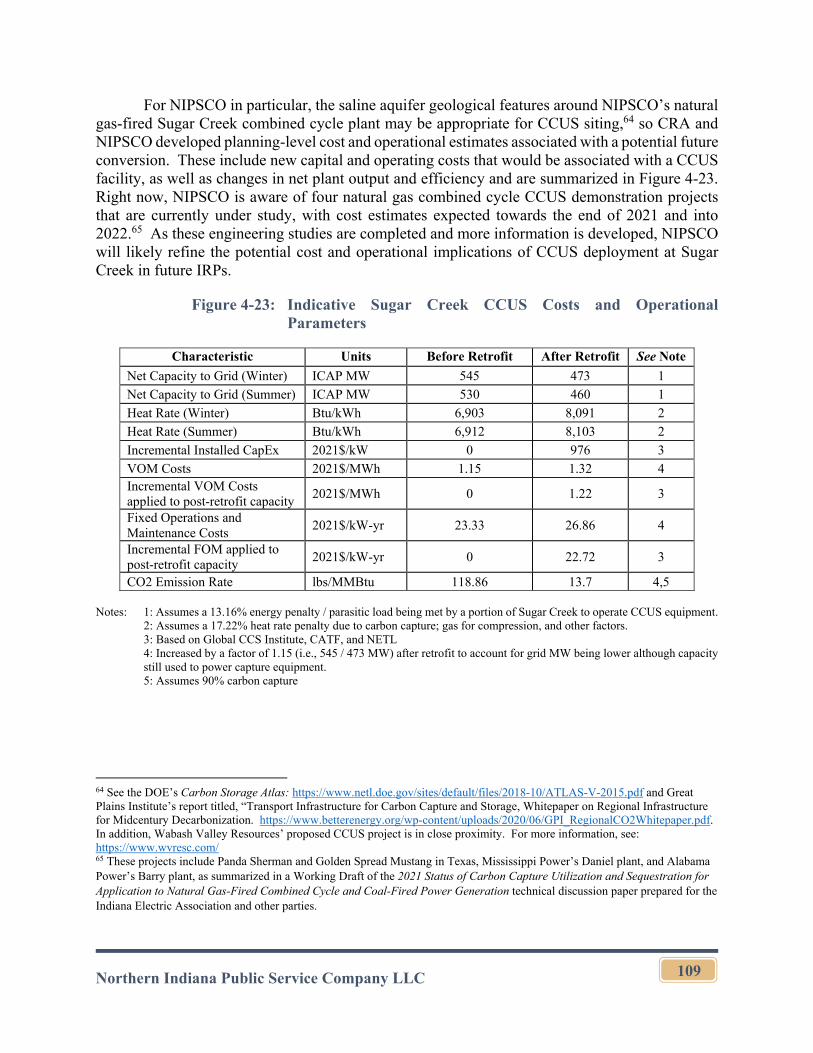
Northern Indiana Public Service Company LLC
109
For NIPSCO in particular, the saline aquifer geological features around NIPSCO’s natural gas-fired Sugar Creek combined cycle plant may be appropriate for CCUS siting,64 so CRA and NIPSCO developed planning-level cost and operational estimates associated with a potential future conversion. These include new capital and operating costs that would be associated with a CCUS facility, as well as changes in net plant output and efficiency and are summarized in Figure 4-23. Right now, NIPSCO is aware of four natural gas combined cycle CCUS demonstration projects that are currently under study, with cost estimates expected towards the end of 2021 and into 2022.65 As these engineering studies are completed and more information is developed, NIPSCO will likely refine the potential cost and operational implications of CCUS deployment at Sugar Creek in future IRPs.
Figure 4-23: Indicative Sugar Creek CCUS Costs and Operational Parameters
Characteristic Units Before Retrofit After Retrofit See Note
Net Capacity to Grid (Winter) ICAP MW 545 473 1
Net Capacity to Grid (Summer) ICAP MW 530 460 1
Heat Rate (Winter) Btu/kWh 6,903 8,091 2
Heat Rate (Summer) Btu/kWh 6,912 8,103 2
Incremental Installed CapEx 2021$/kW 0 976 3
VOM Costs 2021$/MWh 1.15 1.32 4 Incremental VOM Costs applied to post-retrofit capacity
2021$/MWh 0 1.22 3
Fixed Operations and Maintenance Costs
2021$/kW-yr 23.33 26.86 4
Incremental FOM applied to post-retrofit capacity
2021$/kW-yr 0 22.72 3
CO2 Emission Rate lbs/MMBtu 118.86 13.7 4,5 Notes: 1: Assumes a 13.16% energy penalty / parasitic load being met by a portion of Sugar Creek to operate CCUS equipment. 2: Assumes a 17.22% heat rate penalty due to carbon capture; gas for compression, and other factors.
3: Based on Global CCS Institute, CATF, and NETL 4: Increased by a factor of 1.15 (i.e., 545 / 473 MW) after retrofit to account for grid MW being lower although capacity still used to power capture equipment.
5: Assumes 90% carbon capture
64 See the DOE’s Carbon Storage Atlas: https://www.netl.doe.gov/sites/default/files/2018-10/ATLAS-V-2015.pdf and Great Plains Institute’s report titled, “Transport Infrastructure for Carbon Capture and Storage, Whitepaper on Regional Infrastructure for Midcentury Decarbonization. https://www.betterenergy.org/wp-content/uploads/2020/06/GPI_RegionalCO2Whitepaper.pdf. In addition, Wabash Valley Resources’ proposed CCUS project is in close proximity. For more information, see: https://www.wvresc.com/ 65 These projects include Panda Sherman and Golden Spread Mustang in Texas, Mississippi Power’s Daniel plant, and Alabama Power’s Barry plant, as summarized in a Working Draft of the 2021 Status of Carbon Capture Utilization and Sequestration for Application to Natural Gas-Fired Combined Cycle and Coal-Fired Power Generation technical discussion paper prepared for the Indiana Electric Association and other parties.
Northern Indiana Public Service Company LLC
110
4.6.8.3 CCUS Policy Support Considerations
The U.S. tax code currently offers a performance-based tax credit for eligible carbon capture and sequestration projects that securely store CO2 in geological formations or use CO2 for enhanced oil recovery. These incentives, known as the 45Q credits, award between $35-50 per sequestered ton of CO2 and are available for 12 years after the project enters into service. As of the time of the production of this report, Congress is also considering additional policy support for CCUS projects that could include increases to the 45Q credit value, direct payment of subsidies, longer construction windows to preserve credit eligibility, and other grants or direct support for demonstration or transportation projects. NIPSCO will continue to track CCUS policy activity along with broader federal environmental policy initiatives as it evaluates long-term decarbonization options in future IRPs.
4.6.8.4 Long Duration Storage
Although a large majority of storage bidders in the RFP offered four-hour duration lithium-ion battery storage technologies, longer duration storage technologies may become more viable over the long-term in order to balance diurnal variations in renewable energy resources as well as variations in demand from weekends (low demand) to weekdays (high demand). The technology can also provide needed capacity during longer duration weather events, such as snowstorms, extended cloud cover, or wind droughts that could last for several days.
The value of long-duration storage is likely to increase as intermittent renewable generation increases within the MISO footprint. In addition to energy arbitrage, some long-duration technologies may also be able to effectively offer additional ancillary services value, such as spinning reserve and regulation to the portfolio (See Section 9 for more detail on NIPSCO’s evaluation of ancillary services value in this IRP).
4.6.8.5 Long-Duration Storage in the RFP
While long-duration storage RFP bids were either non-competitive or unpriced (due to technology immaturity), multiple bidders offered information and perspectives on potential long-duration storage technologies. Technologies included:
Gravity storage, where large objects are lifted to charge and released to discharge. Such solutions are generally scalable, highly efficient, and have few limits on cycle frequency of depth of discharge, providing certain advantages over lithium-ion technology. One bidder proposed a gravity storage solution to use locally sourced material for the storage system objects, such as coal combustion residuals or other items that might otherwise be landfilled.
Flow batteries, which store energy in electrolyte reservoirs, transferring electrons back and forth between oxidation states causing charge and discharge. Electrolytes are dissolved in water and stored in two tanks connected by an iron selective membrane. These batteries can cycle frequently without degradation (contrary to lithium-ion), although their round-trip efficiency is usually lower.
Northern Indiana Public Service Company LLC
111
Compressed or liquefied air, where air or gas is compressed or liquefied during charging and expanded or evaporated during discharging. The component parts of these technologies are generally well understood, and it may be possible to use existing infrastructure, such as abandoned natural gas storage facilities, in a compressed air application. However, siting challenges may exist, and round-trip efficiencies are generally lower than other technologies.
Given the expectation that energy storage will be a part of NIPSCO’s long-term portfolio (See Section 9 for more information on the key outcomes of the portfolio analysis), NIPSCO will continuously evaluate the landscape of storage options, as technology advances and market conditions evolve. Although four-hour lithium-ion battery storage may comprise early additions to the portfolio, longer-duration options are likely to be considered in more detail in future IRPs.
4.6.9 Small Modular Reactors
SMRs are a new generation of nuclear fission technology utilizing smaller reactor designs, modular factory fabrication, and passive safety features. SMR can potentially provide a zero-carbon alternative for providing base-load electricity without CO2 emissions, and its siting flexibility and improved safety features potentially allow the technology to be sited closer to demand centers, reducing transmission investments. Key features of an SMR include:
Small physical footprints;
Limited on-site preparation, leading to faster construction time and scalability;
Siting flexibility including sites previously occupied by coal-fired plants; and
Passive safety features, allowing the reactor to safely shutdown in an emergency without requiring human interventions.
SMR is still in the early stages of development, and NIPSCO did not receive any bids related to this technology in the RFP, even in an unpriced informational fashion, as it did with other emerging technologies. In addition, there remain uncertainties regarding the cost, performance, and availability of the technology. As a result, NIPSCO has not evaluated SMR technology as a realistic resource option associated with the implementation of its preferred portfolio over the next several years. However, as the technology evolves and as potential demonstration projects are pursued in the coming years, NIPSCO will continue to monitor progress on SMRs. Depending on technology evolution, future IRPs may assess the resource in more detail, particularly as a long-term option to achieve decarbonization objectives well into the 2030s.
Northern Indiana Public Service Company LLC
112
Section 5. Demand-Side Resources
5.1 Existing Resources
5.1.1 Existing Energy Efficiency Resources
NIPSCO actively promotes energy conservation and efficiency to customers and works with its contractors to offer cost-effective energy efficiency programs. On September 1, 2021, the Commission issued a Final Order in Cause No. 45456 approving a Settlement Agreement among NIPSCO, the Indiana Utility Consumer Counselor, and the Citizens Action Coalition of Indiana, Inc. which included NIPSCO’s proposed EE programs for the period of January 1, 2022 through December 31, 2023 (the “2022-2023 Plan”). To support the continuation of its program offerings for the period 2022 through 2023, NIPSCO recommended, and its OSB approved, TRC as the vendor to continue implementing both its residential and C&I programs. The OSB also agreed that ILLUME Advising would continue as the EM&V vendor for both program years.
2022-2023 Residential Programs
Home Rebates
The Home Rebates program is designed to provide incentives to residential customers to replace inefficient HVAC equipment with energy-efficient alternatives. These measures will be paid per-unit installed, reimbursing customers for a portion of their cost. The program’s intent is to help remove the financial barrier associated with the initial cost of these energy-efficient alternatives. The program will promote premium efficiency air conditioners, air conditioner tune-ups, smart thermostats, ENERGY STAR® air purifiers, ENERGY STAR dehumidifiers, ENERGY STAR clothes dryers, ductless mini-split heat pumps, ENERGY STAR pool pumps, heat pumps and heat pump water heaters.
Lighting Products
The Lighting Products program is designed to increase the purchase and use of energy-efficient lighting products among NIPSCO’s residential electric customers. The program provides instant discounts by using upstream wholesale incentives to buy down the incremental costs on lighting products that meet the energy efficiency standards set by the DOE’s ENERGY STAR Program. ENERGY STAR specifications are an important external factor to certify the quality and efficiency of program measures. As the ENERGY STAR specifications change, program offerings are adjusted accordingly. These adjustments ensure that the program offers incentives for lighting products that meet the latest standards and highest quality of efficiency. General service lamps will not be included in this program. Other specialty, reflector and retrofit kits will be included in this program. As part of the Settlement Agreement approved in Cause No. 45456, if the EISA standards go into effect, adjustments will be made to the program through the EM&V process.
Northern Indiana Public Service Company LLC
113
Home Energy Analysis
The Home Energy Analysis program is designed to help eligible customers improve the efficiency and comfort of their homes, as well as deliver an immediate reduction in electricity (kWh) consumption and promote additional efficiency work. This program will provide homeowners with the direct installation of low-cost, energy-efficient measures followed by the delivery of a Comprehensive Home Assessment report to the customer. This program is unique in that it provides a whole home assessment leading to easy to achieve kWh savings opportunities.
Appliance Recycling
The Appliance Recycling program is designed to provide an incentive to residential customers who choose to recycle a qualifying primary or secondary working refrigerator and/or freezer, room air conditioner and dehumidifier. TRC will utilize a qualified subcontractor for the implementation of this program.
School Education
The School Education program is designed to produce electric savings by influencing fifth grade students and their families to focus on the efficient use of electricity. It will provide classroom instruction, posters, and activities aligned with national and state learning standards and energy education kits filled with energy-saving products and advice. Students will participate in an energy education presentation at school, learning about basic energy concepts through class lessons and activities. Students will also receive an energy education kit of quality, high-efficiency products and are instructed to install the energy-efficient products at home with their families as well as complete a worksheet. The experience at home will complete the learning cycle started at school.
Multi-Family Direct Install
The MFDI program is designed to provide a “one-stop shop” to multifamily building owners, managers, and tenants of multifamily units containing three or more residences receiving service from NIPSCO. With flexible and affordable options, the program will generate immediate energy savings and improvements in two distinct program phases. Phase I is a walkthrough assessment of each property, which is conducted to determine eligibility for direct installation services provided by the MFDI program, along with complementary incentive offers available through other NIPSCO programs. Property managers will be presented with an Energy Improvement Plan that prioritizes recommendations along with a proposal to provide the direct installation services outlined in Phase II. Phase II is an in-unit direct installation of energy-efficient devices at no-cost or low-cost to the tenant or landlord, such as LED light bulbs, low-flow showerheads, faucet aerators, pipe wrap, and programmable thermostats. Educational materials about home operation, maintenance, and behavior factors that may reduce energy consumption, will be provided to tenants in each living unit. TRC will utilize a qualified subcontractor for the implementation of this program.
Northern Indiana Public Service Company LLC
114
Home Energy Report
The Home Energy Report program (also known as the Behavioral program) is designed to encourage energy savings through behavioral modification. The program will provide customers with home energy reports that contain personalized information about their energy use and provide ongoing recommendations to make their homes more efficient. Customers will be randomly chosen to participate in the program and may opt-out if they do not wish to participate. The reports engage customers and drive them to take action to bring their energy usage in line with similar homes and encourage participation in other complimentary residential programs. The program will empower customers to understand their energy usage better and uses competition through neighbor comparisons to influence customers to act on this knowledge, resulting in changed behavior.
Residential New Construction
The Residential New Construction program is designed to increase awareness and understanding by home builders of the benefits of energy-efficient building practices, with a focus on capturing energy efficiency opportunities during the design and construction of single family homes. This program is designed to produce long-term, cost-effective savings as a result of the training they have received to achieve the various Home Energy Rating System tiers, along with strategies for incorporating the Silver, Gold, and Platinum designations into their marketing efforts to attract home buyers.
HomeLife EE Calculator
The HomeLife EE Calculator program is designed to offer NIPSCO’s residential customers an online “do-it-yourself” audit and an energy savings kit for carrying out this audit, at no cost to the customer. The audit tool will effectively: (1) identify low-cost/no-cost measures that a NIPSCO residential customer can easily implement to manage electric consumption; (2) allow eligible customers to request a free home energy kit; (3) educate customers about the variety of programs available to them through the residential energy efficiency portfolio; and (4) assist customers in finding qualified and experienced contractors through a network of trade allies.
Income Qualified Weatherization
The IQW program is designed to provide energy efficiency services to qualifying low-income households. For a household to be eligible to participate in the IQW program, the customer must be a NIPSCO residential customer with active service that receives Low-Income Home Energy Assistance, Temporary Assistance for Needy Families, Supplemental Security Income, or Supplemental Security Disability Income and has not received weatherization services in the past 10 years from the date of application. Qualifying participants receive the direct installation of no-cost EE measures and a Comprehensive Home Assessment to identify areas of the home where additional energy savings can be achieved to make the home more comfortable and reduce energy costs.
Northern Indiana Public Service Company LLC
115
Residential Online Marketplace
The Residential Online Marketplace program provides an online store for NIPSCO electric customers to purchase and install EE measures with an instant incentive applied at the time of purchase. The Residential Online Marketplace ensures only NIPSCO customers are eligible to purchase and limits are set on the quantities purchased to ensure timely installation.
Table 5-1 shows the projected energy savings (MWh) by year for each of the Residential programs66.
Table 5-1: 2022-2023 Projected Residential Energy Savings (MWh)
Residential Programs 2022 2023 2022-2023 Home Rebates 1,905 1,905 3,810 Lighting Products 11,500 11,500 23,000 Home Energy Analysis 384 384 768 Appliance Recycling 2,900 2,945 5,845 School Education 2,167 2,167 4,334 Multifamily Direct Install 1,502 1,502 3,004 Home Energy Report 23,120 23,444 46,564 Residential New Construction 886 886 1,772 Home Life EE Calculator 185 185 370 Income Qualified Weatherization 1,060 1,060 2,120 Residential Online Marketplace 630 909 1,539 Total Residential Programs 46,239 46,887 93,126
Table 5-2 shows the annual total program budget for each of the Residential programs. Program budget includes implementation costs, NIPSCO administration costs, NIPSCO marketing costs, and EM&V costs.67
Table 5-2: 2022-2023 Residential Program Budget
Residential Programs 2022 2023 Total
Home Rebates $ 698,494 $ 704,281 $ 1,402,775 Lighting Products $ 2,941,831 $ 2,976,763 $ 5,918,594 66 Table 5-1 represents incremental, gross savings at the meter from the plan approved by the Commission in Cause No. 45456. On a net basis, inclusive of measure life considerations, the annual, cumulative impacts modeled for IRP purposes are slightly different. In addition, at the time of the development of the DSM inputs for the IRP, slightly different adjustments were applied to the near-term DSM savings expectations, resulting in slightly different numbers used for IRP modeling purposes. However, given that these savings are part of the plan approved by the Commission, they were universally applied across all portfolios and do not impact comparisons across portfolio options. 67 In its Final Order, the Commission approved that NIPSCO (with OSB approval) is authorized to increase any individual program funding by up to 20% of the total program budget, even if this exceeds the overall 2022-2023 DSM Plan budget approved by the Commission. These budgets do not reflect the potential adjustment.
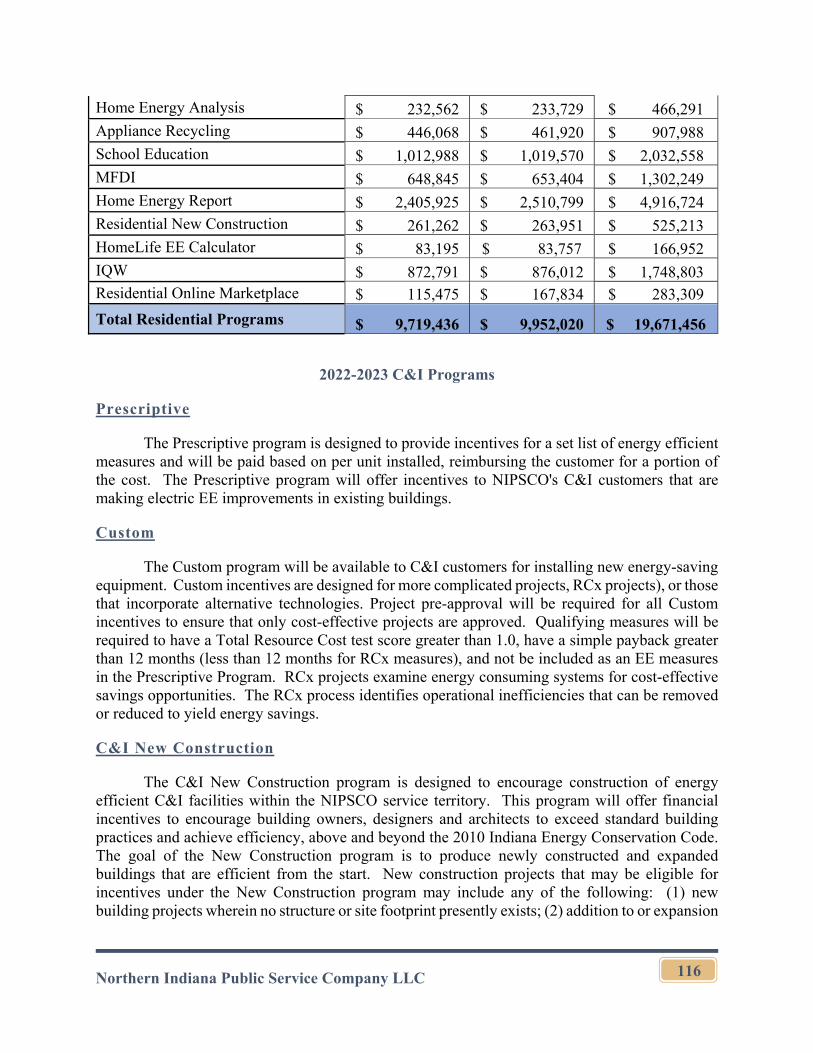
Northern Indiana Public Service Company LLC
116
Home Energy Analysis $ 232,562 $ 233,729 $ 466,291 Appliance Recycling $ 446,068 $ 461,920 $ 907,988 School Education $ 1,012,988 $ 1,019,570 $ 2,032,558 MFDI $ 648,845 $ 653,404 $ 1,302,249 Home Energy Report $ 2,405,925 $ 2,510,799 $ 4,916,724 Residential New Construction $ 261,262 $ 263,951 $ 525,213 HomeLife EE Calculator $ 83,195 $ 83,757 $ 166,952 IQW $ 872,791 $ 876,012 $ 1,748,803 Residential Online Marketplace $ 115,475 $ 167,834 $ 283,309
Total Residential Programs $ 9,719,436 $ 9,952,020 $ 19,671,456
2022-2023 C&I Programs
Prescriptive
The Prescriptive program is designed to provide incentives for a set list of energy efficient measures and will be paid based on per unit installed, reimbursing the customer for a portion of the cost. The Prescriptive program will offer incentives to NIPSCO's C&I customers that are making electric EE improvements in existing buildings.
Custom
The Custom program will be available to C&I customers for installing new energy-saving equipment. Custom incentives are designed for more complicated projects, RCx projects), or those that incorporate alternative technologies. Project pre-approval will be required for all Custom incentives to ensure that only cost-effective projects are approved. Qualifying measures will be required to have a Total Resource Cost test score greater than 1.0, have a simple payback greater than 12 months (less than 12 months for RCx measures), and not be included as an EE measures in the Prescriptive Program. RCx projects examine energy consuming systems for cost-effective savings opportunities. The RCx process identifies operational inefficiencies that can be removed or reduced to yield energy savings.
C&I New Construction
The C&I New Construction program is designed to encourage construction of energy efficient C&I facilities within the NIPSCO service territory. This program will offer financial incentives to encourage building owners, designers and architects to exceed standard building practices and achieve efficiency, above and beyond the 2010 Indiana Energy Conservation Code. The goal of the New Construction program is to produce newly constructed and expanded buildings that are efficient from the start. New construction projects that may be eligible for incentives under the New Construction program may include any of the following: (1) new building projects wherein no structure or site footprint presently exists; (2) addition to or expansion
Northern Indiana Public Service Company LLC
117
of an existing building or site footprint; and (3) a total “gut” rehabilitation for a change of purpose requiring replacement of all electrical and mechanical systems/equipment.
Small Business Direct Install
The SBDI program is designed to facilitate participation in the NIPSCO business EE program of small C&I customers that do not possess the in-house expertise or capital budget to develop and implement an energy efficiency plan. The SBDI program will offer a variety of ways for small businesses, with billing demands not exceeding 200 kW, to improve the efficiency of their existing facilities. Measures will be paid out on a per unit basis, much the same way as the Prescriptive program, but with slightly higher incentive rates in an effort to encourage energy efficient investment from these smaller commercial customers. Incentive payments to the approved trade allies will occur following measure implementation and submission of all required paperwork. If additional incentives are available through other programs, customers will be directed to the appropriate application.
C&I Online Marketplace
The C&I Online Marketplace program will provide an online store for NIPSCO electric customers to purchase and install EE measures with instant incentive applied at the time of purchase. The C&I Online Marketplace program will ensure only NIPSCO customers are eligible to purchase and limits are set on the quantities purchased to ensure timely installation.
Smart Energy Engagement
The Smart Energy Engagement program will provide NIPSCO customers with a tailored self-service platform when they opt-in to the program. The Smart Energy Engagement platform will provide customers with the knowledge and insights to make meaningful and energy efficient choices in their facilities. Through personalized energy efficiency suggestions, the program will provide uplift to other C&I programs while providing behavioral savings based upon the changes made at the facility outside of other commercial and industrial programs.
Table 5-3 shows the projected energy savings (MWh) by year for each of the C&I programs.68
68 Table 5-3 represents incremental, gross savings at the meter from the Final Order in Cause No. 45456. At the time of the IRP, slightly different adjustments were used for modeling but were universally applied.
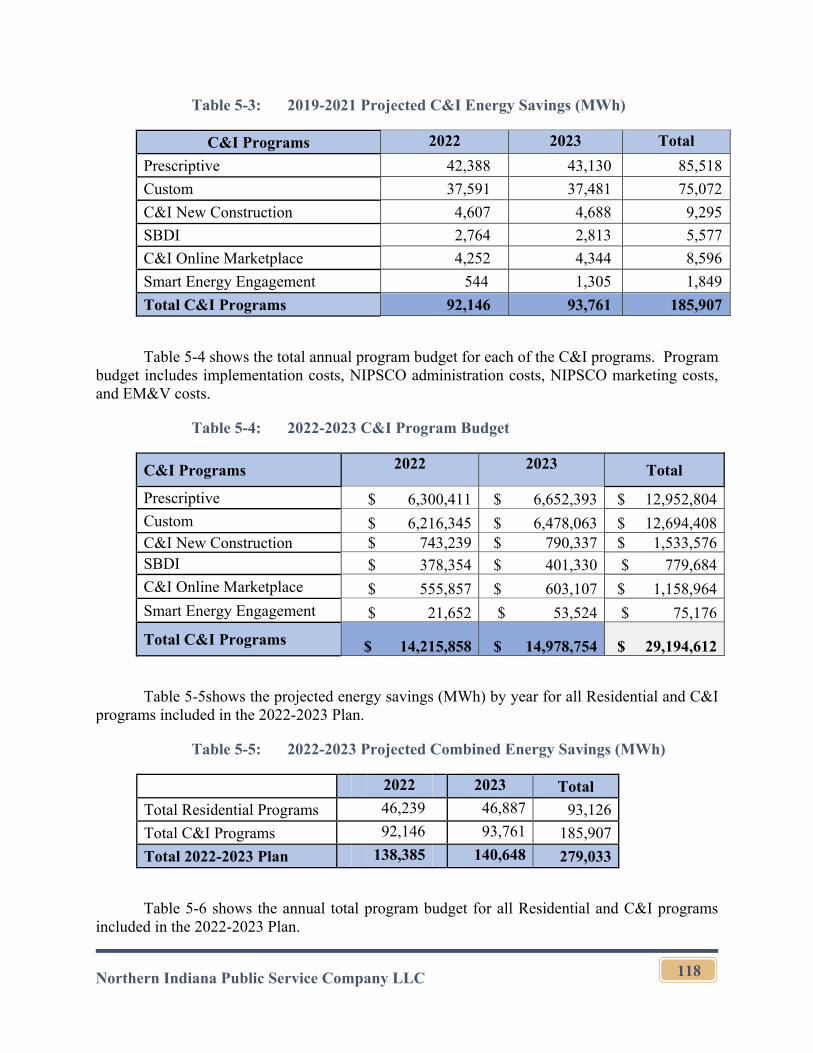
Northern Indiana Public Service Company LLC
118
Table 5-3: 2019-2021 Projected C&I Energy Savings (MWh)
C&I Programs 2022 2023 Total
Prescriptive 42,388 43,130 85,518
Custom 37,591 37,481 75,072
C&I New Construction 4,607 4,688 9,295
SBDI 2,764 2,813 5,577
C&I Online Marketplace 4,252 4,344 8,596
Smart Energy Engagement 544 1,305 1,849
Total C&I Programs 92,146 93,761 185,907
Table 5-4 shows the total annual program budget for each of the C&I programs. Program budget includes implementation costs, NIPSCO administration costs, NIPSCO marketing costs, and EM&V costs.
Table 5-4: 2022-2023 C&I Program Budget
C&I Programs 2022 2023 Total
Prescriptive $ 6,300,411 $ 6,652,393 $ 12,952,804 Custom $ 6,216,345 $ 6,478,063 $ 12,694,408 C&I New Construction $ 743,239 $ 790,337 $ 1,533,576 SBDI $ 378,354 $ 401,330 $ 779,684 C&I Online Marketplace $ 555,857 $ 603,107 $ 1,158,964 Smart Energy Engagement $ 21,652 $ 53,524 $ 75,176
Total C&I Programs $ 14,215,858 $ 14,978,754 $ 29,194,612
Table 5-5shows the projected energy savings (MWh) by year for all Residential and C&I programs included in the 2022-2023 Plan.
Table 5-5: 2022-2023 Projected Combined Energy Savings (MWh)
2022 2023 Total
Total Residential Programs 46,239 46,887 93,126
Total C&I Programs 92,146 93,761 185,907
Total 2022-2023 Plan 138,385 140,648 279,033
Table 5-6 shows the annual total program budget for all Residential and C&I programs included in the 2022-2023 Plan.
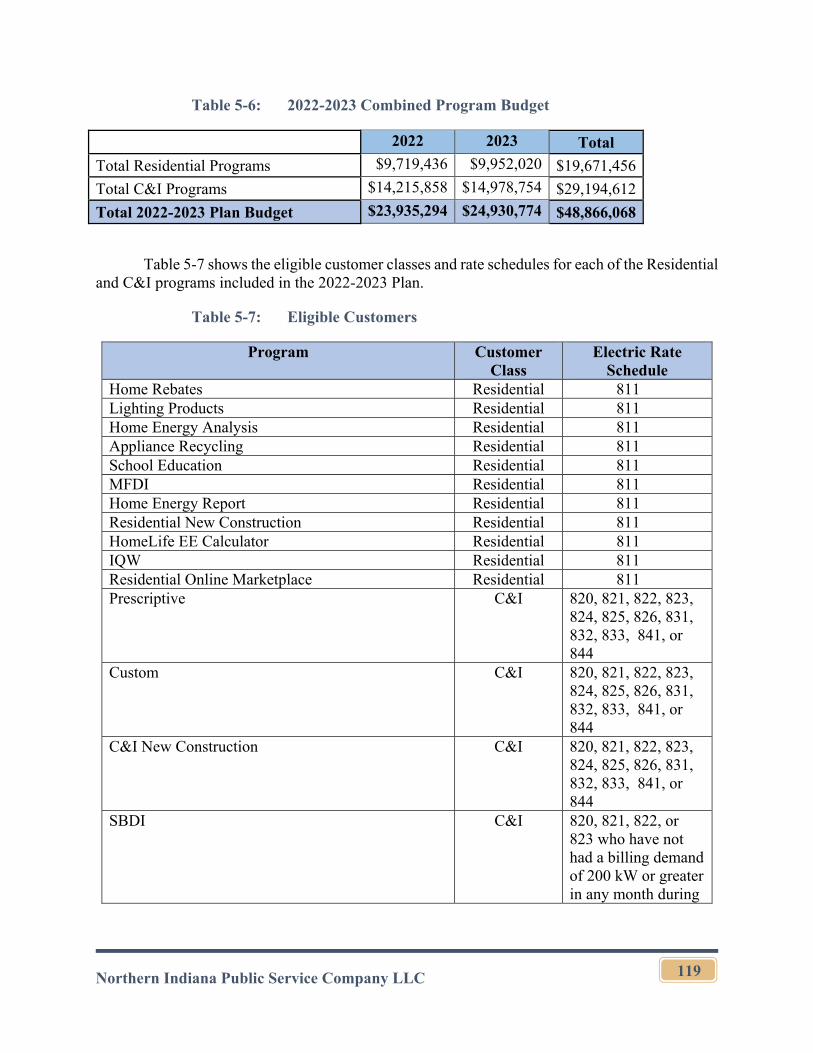
Northern Indiana Public Service Company LLC
119
Table 5-6: 2022-2023 Combined Program Budget
2022 2023 Total
Total Residential Programs $9,719,436 $9,952,020 $19,671,456
Total C&I Programs $14,215,858 $14,978,754 $29,194,612
Total 2022-2023 Plan Budget $23,935,294 $24,930,774 $48,866,068
Table 5-7 shows the eligible customer classes and rate schedules for each of the Residential and C&I programs included in the 2022-2023 Plan.
Table 5-7: Eligible Customers
Program Customer Class
Electric Rate Schedule
Home Rebates Residential 811 Lighting Products Residential 811 Home Energy Analysis Residential 811 Appliance Recycling Residential 811 School Education Residential 811 MFDI Residential 811 Home Energy Report Residential 811 Residential New Construction Residential 811 HomeLife EE Calculator Residential 811 IQW Residential 811 Residential Online Marketplace Residential 811 Prescriptive C&I 820, 821, 822, 823,
824, 825, 826, 831, 832, 833, 841, or 844
Custom C&I 820, 821, 822, 823, 824, 825, 826, 831, 832, 833, 841, or 844
C&I New Construction C&I 820, 821, 822, 823, 824, 825, 826, 831, 832, 833, 841, or 844
SBDI C&I 820, 821, 822, or 823 who have not had a billing demand of 200 kW or greater in any month during
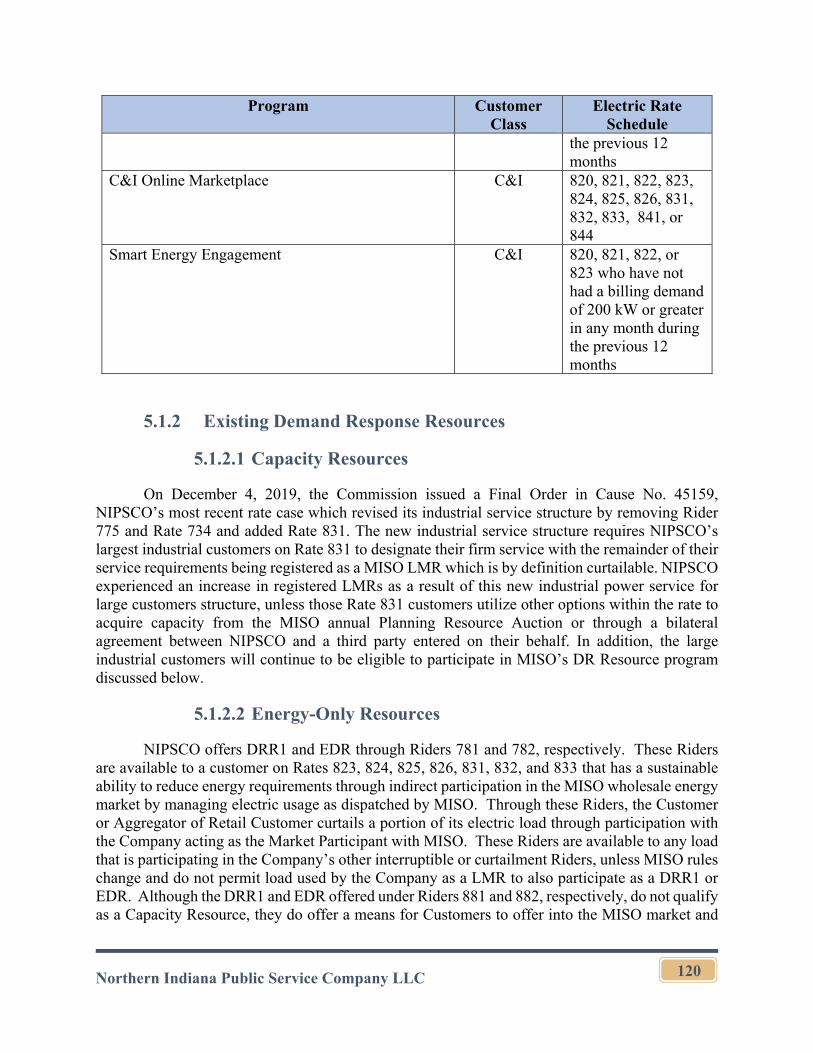
Northern Indiana Public Service Company LLC
120
Program Customer Class
Electric Rate Schedule
the previous 12 months
C&I Online Marketplace C&I 820, 821, 822, 823, 824, 825, 826, 831, 832, 833, 841, or 844
Smart Energy Engagement C&I 820, 821, 822, or 823 who have not had a billing demand of 200 kW or greater in any month during the previous 12 months
5.1.2 Existing Demand Response Resources
5.1.2.1 Capacity Resources
On December 4, 2019, the Commission issued a Final Order in Cause No. 45159, NIPSCO’s most recent rate case which revised its industrial service structure by removing Rider 775 and Rate 734 and added Rate 831. The new industrial service structure requires NIPSCO’s largest industrial customers on Rate 831 to designate their firm service with the remainder of their service requirements being registered as a MISO LMR which is by definition curtailable. NIPSCO experienced an increase in registered LMRs as a result of this new industrial power service for large customers structure, unless those Rate 831 customers utilize other options within the rate to acquire capacity from the MISO annual Planning Resource Auction or through a bilateral agreement between NIPSCO and a third party entered on their behalf. In addition, the large industrial customers will continue to be eligible to participate in MISO’s DR Resource program discussed below.
5.1.2.2 Energy-Only Resources
NIPSCO offers DRR1 and EDR through Riders 781 and 782, respectively. These Riders are available to a customer on Rates 823, 824, 825, 826, 831, 832, and 833 that has a sustainable ability to reduce energy requirements through indirect participation in the MISO wholesale energy market by managing electric usage as dispatched by MISO. Through these Riders, the Customer or Aggregator of Retail Customer curtails a portion of its electric load through participation with the Company acting as the Market Participant with MISO. These Riders are available to any load that is participating in the Company’s other interruptible or curtailment Riders, unless MISO rules change and do not permit load used by the Company as a LMR to also participate as a DRR1 or EDR. Although the DRR1 and EDR offered under Riders 881 and 882, respectively, do not qualify as a Capacity Resource, they do offer a means for Customers to offer into the MISO market and
Northern Indiana Public Service Company LLC
121
to be paid for the portion of their electric load curtailed. This provides economic benefit to the customers participating in these Riders and for other NIPSCO customers through an overall lower electric system demand, which can avoid purchased power or the need for higher cost generation resources to be committed through the MISO market. Currently, NIPSCO has one customer participating in Rider 881 as DRR1. No customers are participating in Rider 882 as EDR.
5.2 DSM MPS
5.2.1 DSM MPS – Purpose and Key Objectives
To support the IRP and DSM planning for NIPSCO, NIPSCO contracted with the GDS Team to conduct a DSM MPS (a copy of which is included in Appendix B). The DSM MPS provides an update of DSM program costs and savings for a 20-year time horizon (2024-2043).69 The study included primary market research and a comprehensive review of current programs, historical savings, and projected energy savings opportunities in order to develop estimates of technical, economic, and achievable potential. Separate estimates of energy efficiency and demand response potential were developed. The effort was highly collaborative, as the GDS Team worked closely with the NIPSCO OSB to produce reliable estimates of future savings potential, using the best available information and best practices for developing market potential savings estimates.
5.2.2 Impact of Opt-out Customers
The GDS Team reviewed the latest information available from NIPSCO related to energy efficiency program participation, measure and program savings data, results of NIPSCO’s 2016 MPS, NIPSCO’s electric load and customer forecasts, NIPSCO load research data, electric avoided costs, program evaluation reports, and NIPSCO’s 2022-2023 Plan. NIPSCO requested that GDS prepare its base case DSM market potential assuming that C&I electric customers, who had opted out of NIPSCO’s energy efficiency programs prior to January 1, 2017, would be excluded from the DSM MPS. In Indiana, commercial or industrial customers with a peak load greater than 1 MW are eligible to opt out of utility-based electric energy efficiency programs. In the NIPSCO service area, approximately 16% of commercial kWh sales have opted out of utility-based electric energy efficiency programs, while roughly 80% of industrial kWh sales have opted out.
5.2.3 Modeling Framework
The GDS Team used its energy efficiency and DR planning models to prepare the DSM MPS. These models allow the user to develop forecasts of measure and program costs, participants, kWh and kW savings, savings of other fuels, and benefit/cost ratios over the planning horizon. These models are transparent and all formulas, model inputs and model outputs can be viewed by the model user.
69 Near term (2022-2023) savings in the IRP are informed by NIPSCO’s currently approved DSM Plan. Based on discussions with the NIPSCO OSB it was agreed that the DSM MPS would be used to inform the remaining years of the IRP.
Northern Indiana Public Service Company LLC
122
5.2.4 Key Assumptions That Impact Energy Efficiency Potential
The GDS Team updated several input assumptions during the process of preparing the DSM MPS. The changes made for a few of these input assumptions are discussed below.
5.2.4.1 Updated NIPSCO Load Forecast, Avoided Cost Forecast and General Planning Assumptions
NIPSCO provided the GDS Team with its latest electric load forecast for 2020 through 2040. Following discussions with NIPSCO, CRA, and the NIPSCO OSB, it was agreed that the original NIPSCO forecast included implied assumptions about future EE based on historical DSM performance. GDS coordinated with NIPSCO to add these historical impacts back into the MPS forecast to avoid any potential over-counting of future energy efficiency potential in the NIPSCO service area.70 The GDS Team then extended the NIPSCO load forecast through the year 2043. GDS used this new load forecast to calculate the percent of electric MWH sales and peak demand saved each year by DSM programs. NIPSCO’s new load forecast projects that total MWH sales to ultimate customers will only increase 0.3% per year, on average, through the year 2048.
NIPSCO also provided GDS with updated planning assumptions for the general inflation rate, escalation rates for NIPSCO electric rates, the utility discount rate, line losses by class of service, and the planning reserve margin.71 GDS used these assumptions to develop the 2021 MPS.
5.2.4.2 NIPSCO DSM Assumptions for Measure Costs, Savings, Useful Lives, and Market/Equipment Characteristics
GDS reviewed the assumptions for measure costs, savings, and useful lives included in prior NIPSCO DSM plans, as well as the 2019 DSM Savings, and updated these assumptions where appropriate. GDS utilized data specific to NIPSCO when it was available and current. GDS used the most recent NIPSCO evaluation report findings (as well as NIPSCO program planning documents), the 2015 Indiana TRM, the Illinois TRM, and the Michigan Energy Measures Database to inform a large portion of the data requirements. Evaluation report findings, NIPSCO program planning assumptions, and the Indiana TRM were leveraged to the extent feasible. Additional data sources were only used if these sources either did not address a certain measure or contained outdated information. Building energy simulation modeling results formed the basis for most heating and cooling end use measure savings, primarily in the residential sector. The NREL Energy Measures Database also served as a key data source in developing measure cost estimates.
70 NIPSCO and the GDS Team also coordinated with CRA to confirm that the modified sales forecast used in the MPS closely aligned with the NIPSCO sales forecast used in the 2022 IRP, and that both made adjustments to remove any embedded assumptions about future DSM program impacts. 71 NIPSCO provided the GDS Team with both average and peak line loss factors. The GDS Team used the peak LLFs to adjust savings at the meter to the generator-level. NIPSCO has not conducted a marginal versus average line loss study, but the use of the peak LLF for DSM impacts is used as a proxy for the marginal LLF. The peak residential line loss used in the analysis was 4.11%. The peak commercial and industrial LLF were 3.76% and 2.41% respectively.
Northern Indiana Public Service Company LLC
123
Additional source documents included American Council for an Energy-Efficient Economy research reports, covering topics like emerging technologies.
In addition to measure assumption development, the GDS Team engaged in primary market research to collect updated equipment penetration, saturation, and efficiency characteristics, as well as customer willingness to participate in program offerings data, across select end-uses/technologies. GDS conducted a combination of online/mail surveys, as well as a limited amount of on-site follow up site visits, to conduct the research. The resulting data was used to develop updated estimates of baseline and efficient equipment saturation estimates in the market potential study and to develop expected long-term adoption rates for energy efficiency over the study horizon.
5.2.4.3 Federal Appliance and Equipment Efficiency Standards
The DOE develops and implements federal appliance and equipment standards to improve energy efficiency, saving consumers energy and money. This DOE program was initially authorized to develop, revise, and implement minimum energy efficiency standards by the federal Energy Policy and Conservation Act in 1975. Several subsequent legislative amendments have required regular updates to these standards and have expanded the list of products covered by the standards. The DOE is currently required to periodically review standards and test procedures for more than 60 products, representing about 90% of home energy use, 60% of commercial building energy use, and 30% of industrial energy use.
By law, the DOE is expected to review each national appliance standard every six years and publish either a proposed rule to update the standard or determine that no change to the existing standard is needed. As of March 2021, DOE has missed legal deadlines for twenty-eight product standards since 2016.72 Given these delays in future standard updates, the initial start year of 2024 for this analysis, and that the analysis is not intended to predict how or when energy codes and standards will change over time, there are only limited known improvements to federal codes and standards to reasonably account for in this analysis.
The primary adjustment in this analysis impacts residential screw-based lighting. Although DOE did issue a final rule stating that the EISA backstop has not been triggered and adopted a narrow definition of general service lighting, based on discussion with NIPSCO program administrators and the NIPSCO OSB, the base case analysis for the 2021 MPS severely limited the future potential for residential lighting throughout the analysis timeframe. The base case assumes only a limited number of direct-install screw-based lighting opportunities for standard, specialty, and reflector bulbs over the analysis period.
Although not exhaustive, other key adjustments include:
72 Missed Deadlines for Appliance Standards. Prepared by the Appliance Standards Awareness Project. Updated March 2021.
Northern Indiana Public Service Company LLC
124
The baseline efficiency for ASHP is anticipated to improve to 15 SEER/8.8 HSPF in 2023. As the new standards allow for a sell-through period, the baseline efficiency is assumed to be the new federal standard beginning in 2024.
The baseline efficiency for split system central AC systems is anticipated to improve to 14 SEER in 2023. As the new standards allow for a sell-through period, the baseline efficiency is assumed to be the new federal standard, beginning in 2024.
DOE established the first national standards for pool pumps in 2017, becoming effective in 2021. The new standards cut energy use for in-ground pool pumps by approximately 70% and can be met by switching from single-speed to variable-speed pool pumps.
In 2019, the DOE made new standards effective for residential, portable and whole-home dehumidifiers. The new standards are based on a new metric, the integrated energy factor, and improve the test procedure to better reflect the actual energy consumption of dehumidifiers in the home. The new standards range from 1.30 L/kWh for small dehumidifiers up to 2.8 L/kWh for larger capacity dehumidifiers.
In July 2019, the DOE made new standards effective for more efficient furnace fan/motors. The standards are expected to improve efficiency by approximately 45% over the current baselines. To date, many furnaces are equipped with standard induction motors, which operate at about 60-65% efficiency. The new standard creates a shift to electronically commutated motors.
DOE established new standards for pre-rinse spray valves, setting maximum flow rates between 1.0 and 1.28 gallons per minute. The new standards took effect in early 2019 and were reflected in the analysis
5.2.5 Energy Efficiency Measures & Potential
5.2.5.1 Measures Considered
For the residential sector, there were 182 unique electric energy efficiency measures included in the energy efficiency potential analysis. Table 5-8 provides a summary of the types of measures included for each end use in the residential sector. The measure list was developed based on a review of current NIPSCO programs, the Indiana TRM, other regional TRMs, and industry documents related to emerging technologies. The residential measures were then further broken out to include permutations across housing type (single-family vs. multifamily) and income type (income-qualified vs. market rate).
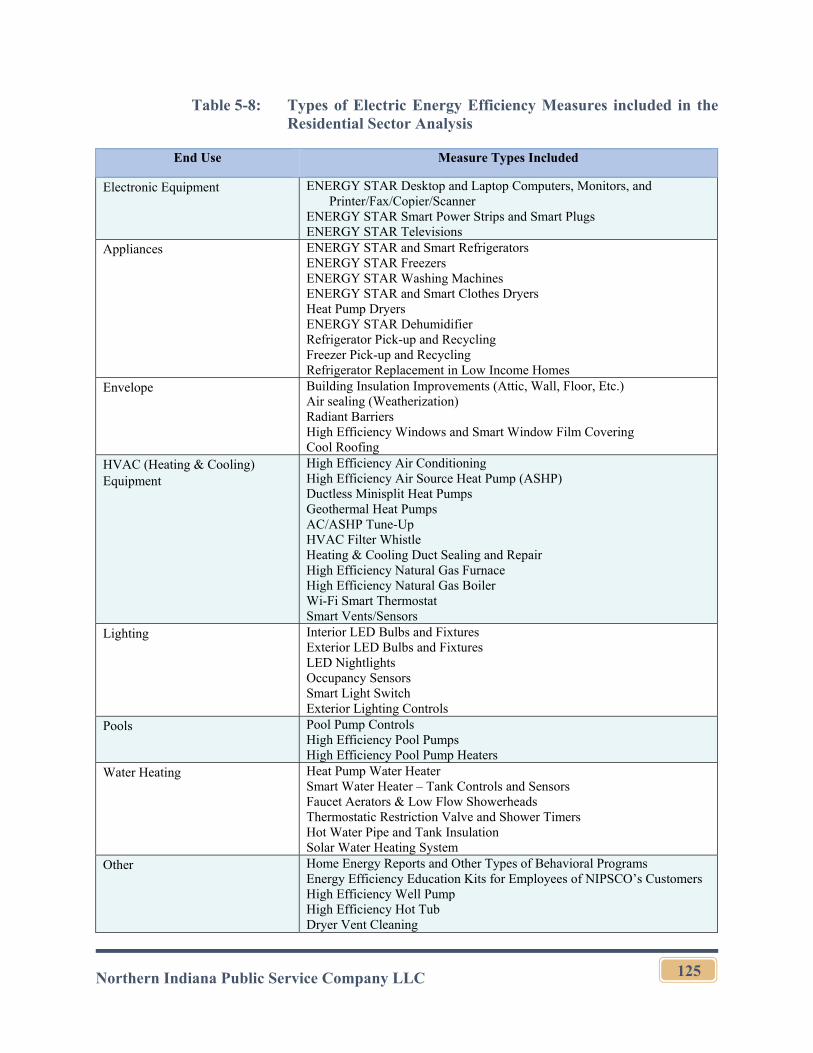
Northern Indiana Public Service Company LLC
125
Table 5-8: Types of Electric Energy Efficiency Measures included in the Residential Sector Analysis
End Use Measure Types Included
Electronic Equipment ENERGY STAR Desktop and Laptop Computers, Monitors, and Printer/Fax/Copier/Scanner
ENERGY STAR Smart Power Strips and Smart Plugs ENERGY STAR Televisions
Appliances ENERGY STAR and Smart Refrigerators ENERGY STAR Freezers ENERGY STAR Washing Machines ENERGY STAR and Smart Clothes Dryers Heat Pump Dryers ENERGY STAR Dehumidifier Refrigerator Pick-up and Recycling Freezer Pick-up and Recycling Refrigerator Replacement in Low Income Homes
Envelope Building Insulation Improvements (Attic, Wall, Floor, Etc.) Air sealing (Weatherization) Radiant Barriers High Efficiency Windows and Smart Window Film Covering Cool Roofing
HVAC (Heating & Cooling) Equipment
High Efficiency Air Conditioning High Efficiency Air Source Heat Pump (ASHP) Ductless Minisplit Heat Pumps Geothermal Heat Pumps AC/ASHP Tune-Up HVAC Filter Whistle Heating & Cooling Duct Sealing and Repair High Efficiency Natural Gas Furnace High Efficiency Natural Gas Boiler Wi-Fi Smart Thermostat Smart Vents/Sensors
Lighting Interior LED Bulbs and Fixtures Exterior LED Bulbs and Fixtures LED Nightlights Occupancy Sensors Smart Light Switch Exterior Lighting Controls
Pools Pool Pump Controls High Efficiency Pool Pumps High Efficiency Pool Pump Heaters
Water Heating Heat Pump Water Heater Smart Water Heater – Tank Controls and Sensors Faucet Aerators & Low Flow Showerheads Thermostatic Restriction Valve and Shower Timers Hot Water Pipe and Tank Insulation Solar Water Heating System
Other Home Energy Reports and Other Types of Behavioral Programs Energy Efficiency Education Kits for Employees of NIPSCO’s Customers High Efficiency Well Pump High Efficiency Hot Tub Dryer Vent Cleaning
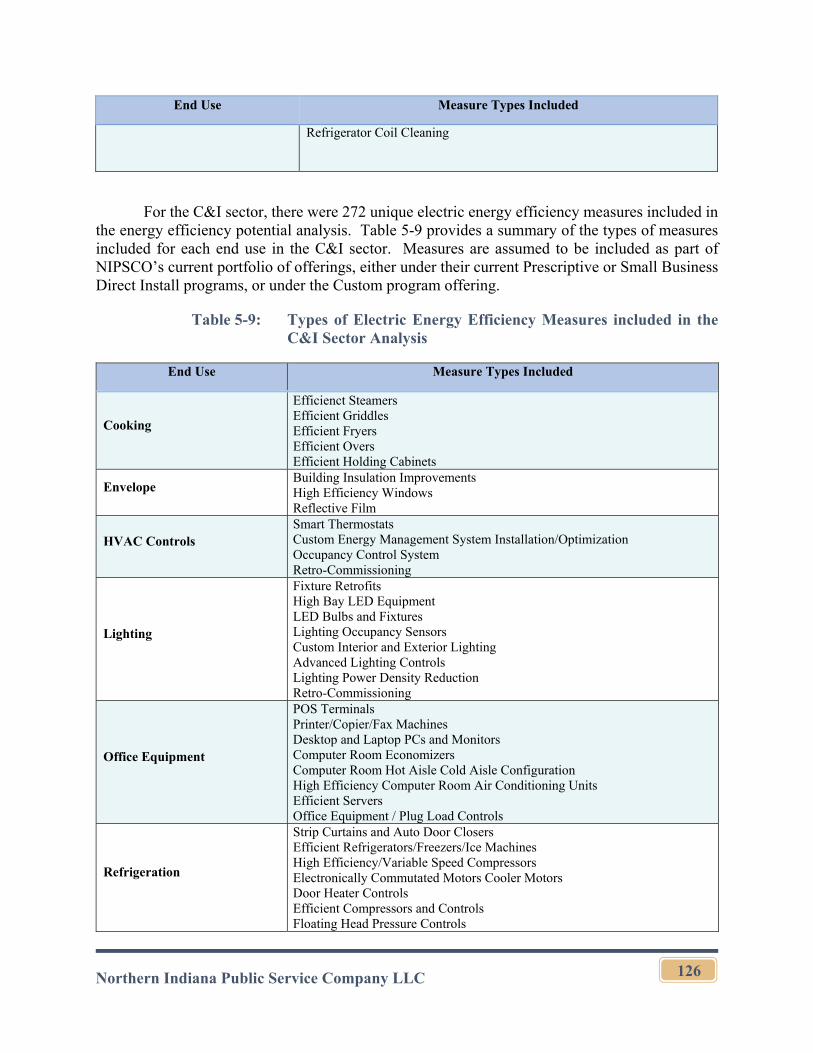
Northern Indiana Public Service Company LLC
126
End Use Measure Types Included
Refrigerator Coil Cleaning
For the C&I sector, there were 272 unique electric energy efficiency measures included in the energy efficiency potential analysis. Table 5-9 provides a summary of the types of measures included for each end use in the C&I sector. Measures are assumed to be included as part of NIPSCO’s current portfolio of offerings, either under their current Prescriptive or Small Business Direct Install programs, or under the Custom program offering.
Table 5-9: Types of Electric Energy Efficiency Measures included in the C&I Sector Analysis
End Use Measure Types Included
Cooking
Efficienct Steamers Efficient Griddles Efficient Fryers Efficient Overs Efficient Holding Cabinets
Envelope Building Insulation Improvements High Efficiency Windows Reflective Film
HVAC Controls Smart Thermostats Custom Energy Management System Installation/Optimization Occupancy Control System Retro-Commissioning
Lighting
Fixture Retrofits High Bay LED Equipment LED Bulbs and Fixtures Lighting Occupancy Sensors Custom Interior and Exterior Lighting Advanced Lighting Controls Lighting Power Density Reduction Retro-Commissioning
Office Equipment
POS Terminals Printer/Copier/Fax Machines Desktop and Laptop PCs and Monitors Computer Room Economizers Computer Room Hot Aisle Cold Aisle Configuration High Efficiency Computer Room Air Conditioning Units Efficient Servers Office Equipment / Plug Load Controls
Refrigeration
Strip Curtains and Auto Door Closers Efficient Refrigerators/Freezers/Ice Machines High Efficiency/Variable Speed Compressors Electronically Commutated Motors Cooler Motors Door Heater Controls Efficient Compressors and Controls Floating Head Pressure Controls
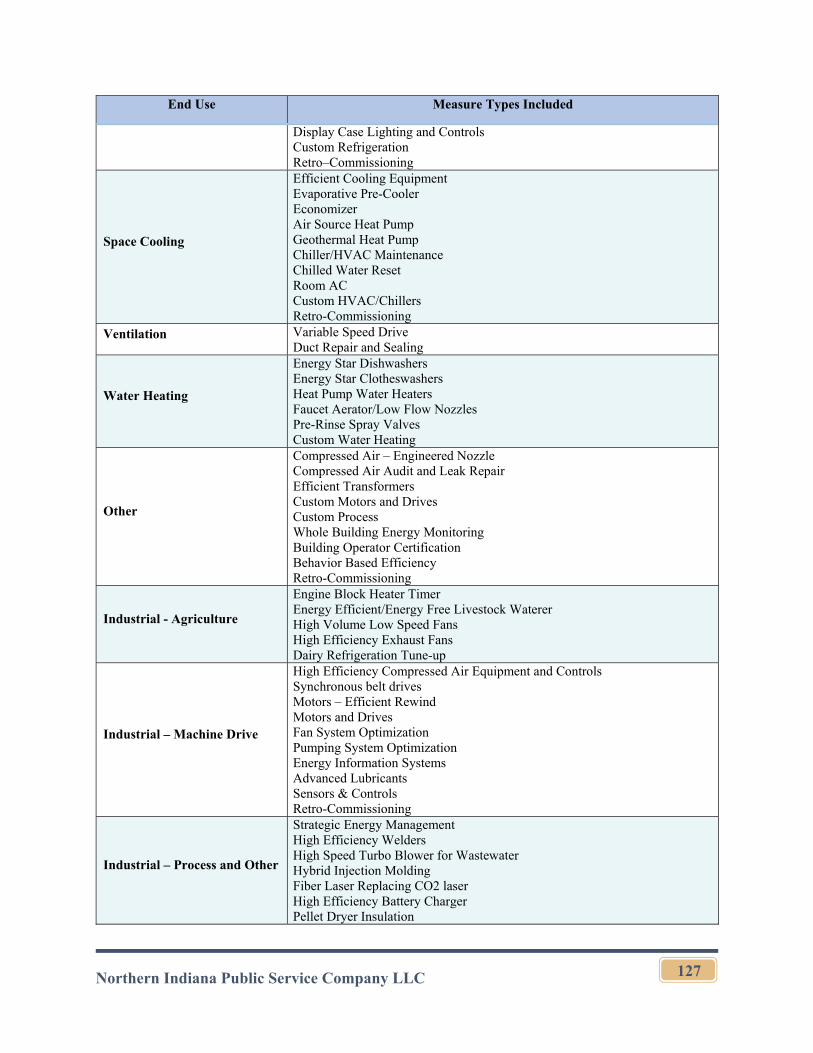
Northern Indiana Public Service Company LLC
127
End Use Measure Types Included
Display Case Lighting and Controls Custom Refrigeration Retro–Commissioning
Space Cooling
Efficient Cooling Equipment Evaporative Pre-Cooler Economizer Air Source Heat Pump Geothermal Heat Pump Chiller/HVAC Maintenance Chilled Water Reset Room AC Custom HVAC/Chillers Retro-Commissioning
Ventilation Variable Speed Drive Duct Repair and Sealing
Water Heating
Energy Star Dishwashers Energy Star Clotheswashers Heat Pump Water Heaters Faucet Aerator/Low Flow Nozzles Pre-Rinse Spray Valves Custom Water Heating
Other
Compressed Air – Engineered Nozzle Compressed Air Audit and Leak Repair Efficient Transformers Custom Motors and Drives Custom Process Whole Building Energy Monitoring Building Operator Certification Behavior Based Efficiency Retro-Commissioning
Industrial - Agriculture
Engine Block Heater Timer Energy Efficient/Energy Free Livestock Waterer High Volume Low Speed Fans High Efficiency Exhaust Fans Dairy Refrigeration Tune-up
Industrial – Machine Drive
High Efficiency Compressed Air Equipment and Controls Synchronous belt drives Motors – Efficient Rewind Motors and Drives Fan System Optimization Pumping System Optimization Energy Information Systems Advanced Lubricants Sensors & Controls Retro-Commissioning
Industrial – Process and Other
Strategic Energy Management High Efficiency Welders High Speed Turbo Blower for Wastewater Hybrid Injection Molding Fiber Laser Replacing CO2 laser High Efficiency Battery Charger Pellet Dryer Insulation
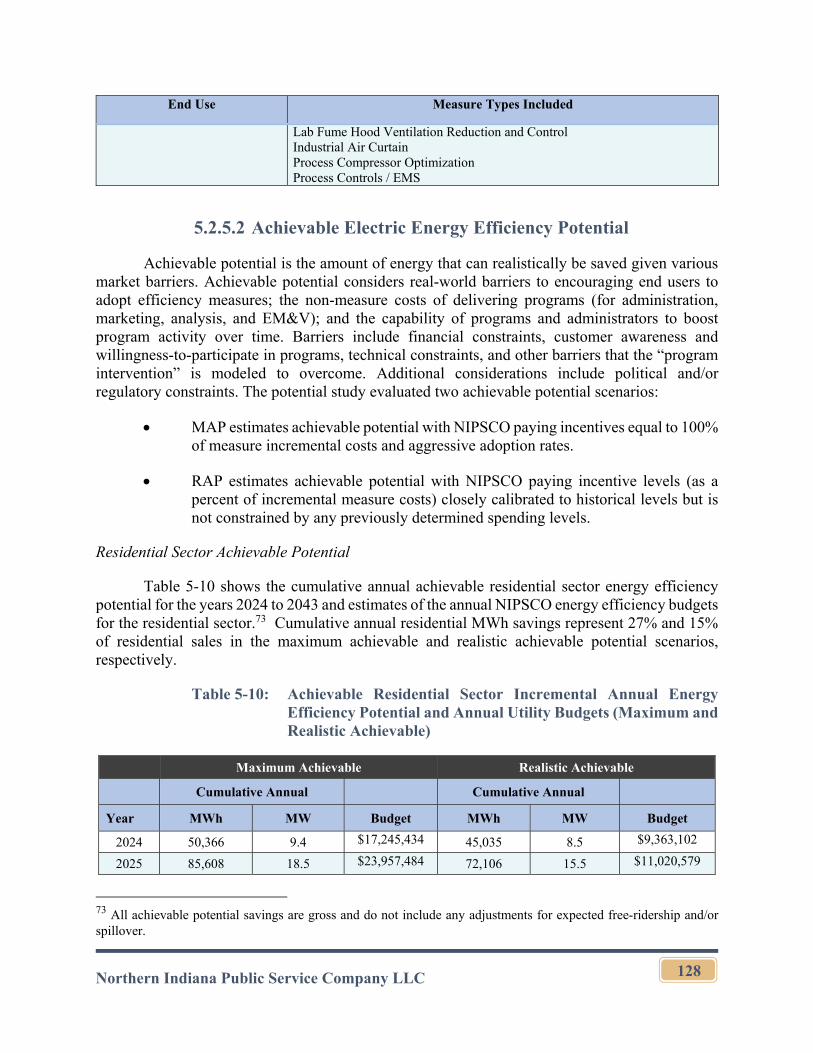
Northern Indiana Public Service Company LLC
128
End Use Measure Types Included
Lab Fume Hood Ventilation Reduction and Control Industrial Air Curtain Process Compressor Optimization Process Controls / EMS
5.2.5.2 Achievable Electric Energy Efficiency Potential
Achievable potential is the amount of energy that can realistically be saved given various market barriers. Achievable potential considers real-world barriers to encouraging end users to adopt efficiency measures; the non-measure costs of delivering programs (for administration, marketing, analysis, and EM&V); and the capability of programs and administrators to boost program activity over time. Barriers include financial constraints, customer awareness and willingness-to-participate in programs, technical constraints, and other barriers that the “program intervention” is modeled to overcome. Additional considerations include political and/or regulatory constraints. The potential study evaluated two achievable potential scenarios:
MAP estimates achievable potential with NIPSCO paying incentives equal to 100% of measure incremental costs and aggressive adoption rates.
RAP estimates achievable potential with NIPSCO paying incentive levels (as a percent of incremental measure costs) closely calibrated to historical levels but is not constrained by any previously determined spending levels.
Residential Sector Achievable Potential
Table 5-10 shows the cumulative annual achievable residential sector energy efficiency potential for the years 2024 to 2043 and estimates of the annual NIPSCO energy efficiency budgets for the residential sector.73 Cumulative annual residential MWh savings represent 27% and 15% of residential sales in the maximum achievable and realistic achievable potential scenarios, respectively.
Table 5-10: Achievable Residential Sector Incremental Annual Energy Efficiency Potential and Annual Utility Budgets (Maximum and Realistic Achievable)
Maximum Achievable Realistic Achievable
Cumulative Annual Cumulative Annual
Year MWh MW Budget MWh MW Budget
2024 50,366 9.4 $17,245,434 45,035 8.5 $9,363,102
2025 85,608 18.5 $23,957,484 72,106 15.5 $11,020,579
73 All achievable potential savings are gross and do not include any adjustments for expected free-ridership and/or spillover.
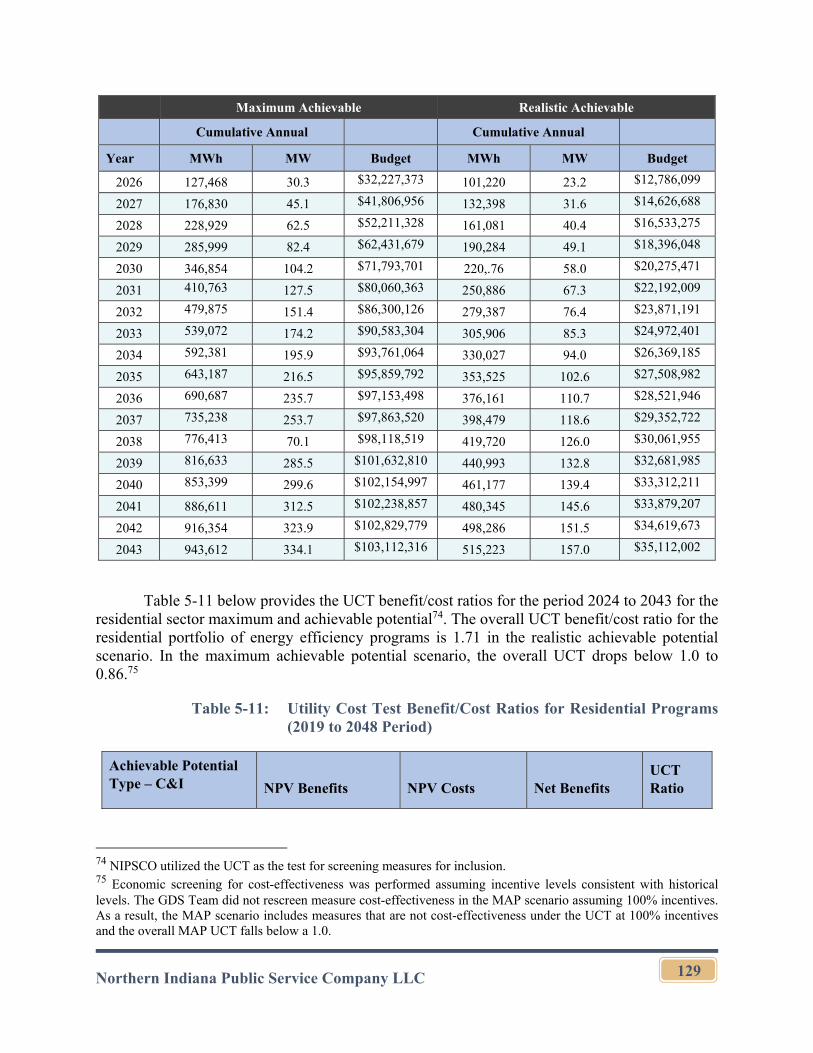
Northern Indiana Public Service Company LLC
129
Maximum Achievable Realistic Achievable
Cumulative Annual Cumulative Annual
Year MWh MW Budget MWh MW Budget
2026 127,468 30.3 $32,227,373 101,220 23.2 $12,786,099
2027 176,830 45.1 $41,806,956 132,398 31.6 $14,626,688
2028 228,929 62.5 $52,211,328 161,081 40.4 $16,533,275
2029 285,999 82.4 $62,431,679 190,284 49.1 $18,396,048
2030 346,854 104.2 $71,793,701 220,.76 58.0 $20,275,471
2031 410,763 127.5 $80,060,363 250,886 67.3 $22,192,009
2032 479,875 151.4 $86,300,126 279,387 76.4 $23,871,191
2033 539,072 174.2 $90,583,304 305,906 85.3 $24,972,401
2034 592,381 195.9 $93,761,064 330,027 94.0 $26,369,185
2035 643,187 216.5 $95,859,792 353,525 102.6 $27,508,982
2036 690,687 235.7 $97,153,498 376,161 110.7 $28,521,946
2037 735,238 253.7 $97,863,520 398,479 118.6 $29,352,722
2038 776,413 70.1 $98,118,519 419,720 126.0 $30,061,955
2039 816,633 285.5 $101,632,810 440,993 132.8 $32,681,985
2040 853,399 299.6 $102,154,997 461,177 139.4 $33,312,211
2041 886,611 312.5 $102,238,857 480,345 145.6 $33,879,207
2042 916,354 323.9 $102,829,779 498,286 151.5 $34,619,673
2043 943,612 334.1 $103,112,316 515,223 157.0 $35,112,002
Table 5-11 below provides the UCT benefit/cost ratios for the period 2024 to 2043 for the residential sector maximum and achievable potential74. The overall UCT benefit/cost ratio for the residential portfolio of energy efficiency programs is 1.71 in the realistic achievable potential scenario. In the maximum achievable potential scenario, the overall UCT drops below 1.0 to 0.86.75
Table 5-11: Utility Cost Test Benefit/Cost Ratios for Residential Programs (2019 to 2048 Period)
Achievable Potential Type – C&I NPV Benefits NPV Costs Net Benefits
UCT Ratio
74 NIPSCO utilized the UCT as the test for screening measures for inclusion. 75 Economic screening for cost-effectiveness was performed assuming incentive levels consistent with historical levels. The GDS Team did not rescreen measure cost-effectiveness in the MAP scenario assuming 100% incentives. As a result, the MAP scenario includes measures that are not cost-effectiveness under the UCT at 100% incentives and the overall MAP UCT falls below a 1.0.
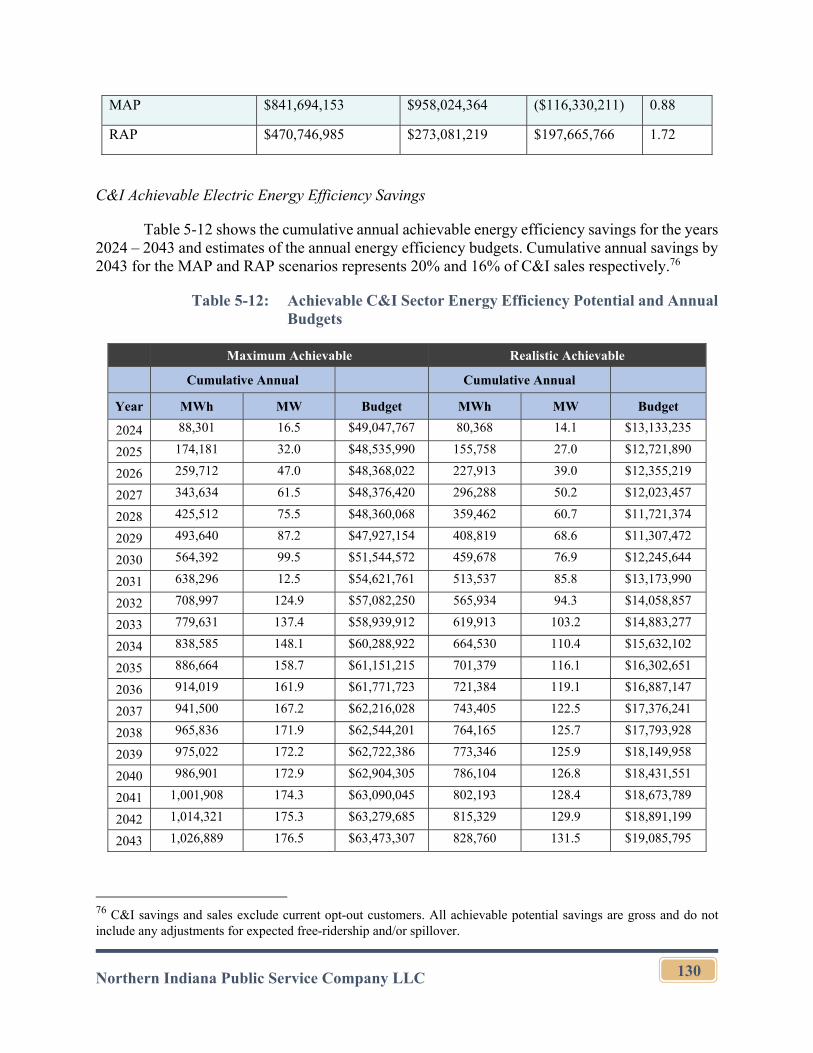
Northern Indiana Public Service Company LLC
130
MAP $841,694,153 $958,024,364 ($116,330,211) 0.88
RAP $470,746,985 $273,081,219 $197,665,766 1.72
C&I Achievable Electric Energy Efficiency Savings
Table 5-12 shows the cumulative annual achievable energy efficiency savings for the years 2024 – 2043 and estimates of the annual energy efficiency budgets. Cumulative annual savings by 2043 for the MAP and RAP scenarios represents 20% and 16% of C&I sales respectively.76
Table 5-12: Achievable C&I Sector Energy Efficiency Potential and Annual Budgets
Maximum Achievable Realistic Achievable
Cumulative Annual Cumulative Annual
Year MWh MW Budget MWh MW Budget
2024 88,301 16.5 $49,047,767 80,368 14.1 $13,133,235
2025 174,181 32.0 $48,535,990 155,758 27.0 $12,721,890
2026 259,712 47.0 $48,368,022 227,913 39.0 $12,355,219
2027 343,634 61.5 $48,376,420 296,288 50.2 $12,023,457
2028 425,512 75.5 $48,360,068 359,462 60.7 $11,721,374
2029 493,640 87.2 $47,927,154 408,819 68.6 $11,307,472
2030 564,392 99.5 $51,544,572 459,678 76.9 $12,245,644
2031 638,296 12.5 $54,621,761 513,537 85.8 $13,173,990
2032 708,997 124.9 $57,082,250 565,934 94.3 $14,058,857
2033 779,631 137.4 $58,939,912 619,913 103.2 $14,883,277
2034 838,585 148.1 $60,288,922 664,530 110.4 $15,632,102
2035 886,664 158.7 $61,151,215 701,379 116.1 $16,302,651
2036 914,019 161.9 $61,771,723 721,384 119.1 $16,887,147
2037 941,500 167.2 $62,216,028 743,405 122.5 $17,376,241
2038 965,836 171.9 $62,544,201 764,165 125.7 $17,793,928
2039 975,022 172.2 $62,722,386 773,346 125.9 $18,149,958
2040 986,901 172.9 $62,904,305 786,104 126.8 $18,431,551
2041 1,001,908 174.3 $63,090,045 802,193 128.4 $18,673,789
2042 1,014,321 175.3 $63,279,685 815,329 129.9 $18,891,199
2043 1,026,889 176.5 $63,473,307 828,760 131.5 $19,085,795
76 C&I savings and sales exclude current opt-out customers. All achievable potential savings are gross and do not include any adjustments for expected free-ridership and/or spillover.
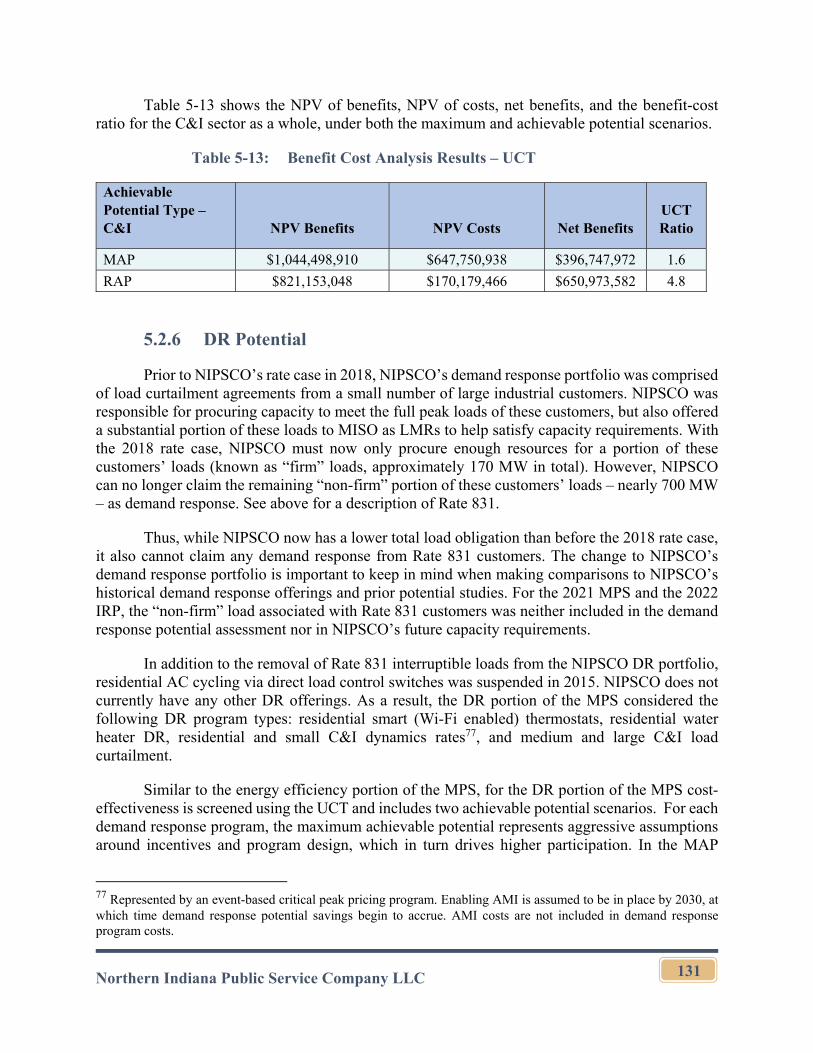
Northern Indiana Public Service Company LLC
131
Table 5-13 shows the NPV of benefits, NPV of costs, net benefits, and the benefit-cost ratio for the C&I sector as a whole, under both the maximum and achievable potential scenarios.
Table 5-13: Benefit Cost Analysis Results – UCT
Achievable Potential Type – C&I NPV Benefits NPV Costs Net Benefits
UCT Ratio
MAP $1,044,498,910 $647,750,938 $396,747,972 1.6
RAP $821,153,048 $170,179,466 $650,973,582 4.8
5.2.6 DR Potential
Prior to NIPSCO’s rate case in 2018, NIPSCO’s demand response portfolio was comprised of load curtailment agreements from a small number of large industrial customers. NIPSCO was responsible for procuring capacity to meet the full peak loads of these customers, but also offered a substantial portion of these loads to MISO as LMRs to help satisfy capacity requirements. With the 2018 rate case, NIPSCO must now only procure enough resources for a portion of these customers’ loads (known as “firm” loads, approximately 170 MW in total). However, NIPSCO can no longer claim the remaining “non-firm” portion of these customers’ loads – nearly 700 MW – as demand response. See above for a description of Rate 831.
Thus, while NIPSCO now has a lower total load obligation than before the 2018 rate case, it also cannot claim any demand response from Rate 831 customers. The change to NIPSCO’s demand response portfolio is important to keep in mind when making comparisons to NIPSCO’s historical demand response offerings and prior potential studies. For the 2021 MPS and the 2022 IRP, the “non-firm” load associated with Rate 831 customers was neither included in the demand response potential assessment nor in NIPSCO’s future capacity requirements.
In addition to the removal of Rate 831 interruptible loads from the NIPSCO DR portfolio, residential AC cycling via direct load control switches was suspended in 2015. NIPSCO does not currently have any other DR offerings. As a result, the DR portion of the MPS considered the following DR program types: residential smart (Wi-Fi enabled) thermostats, residential water heater DR, residential and small C&I dynamics rates77, and medium and large C&I load curtailment.
Similar to the energy efficiency portion of the MPS, for the DR portion of the MPS cost-effectiveness is screened using the UCT and includes two achievable potential scenarios. For each demand response program, the maximum achievable potential represents aggressive assumptions around incentives and program design, which in turn drives higher participation. In the MAP
77 Represented by an event-based critical peak pricing program. Enabling AMI is assumed to be in place by 2030, at which time demand response potential savings begin to accrue. AMI costs are not included in demand response program costs.
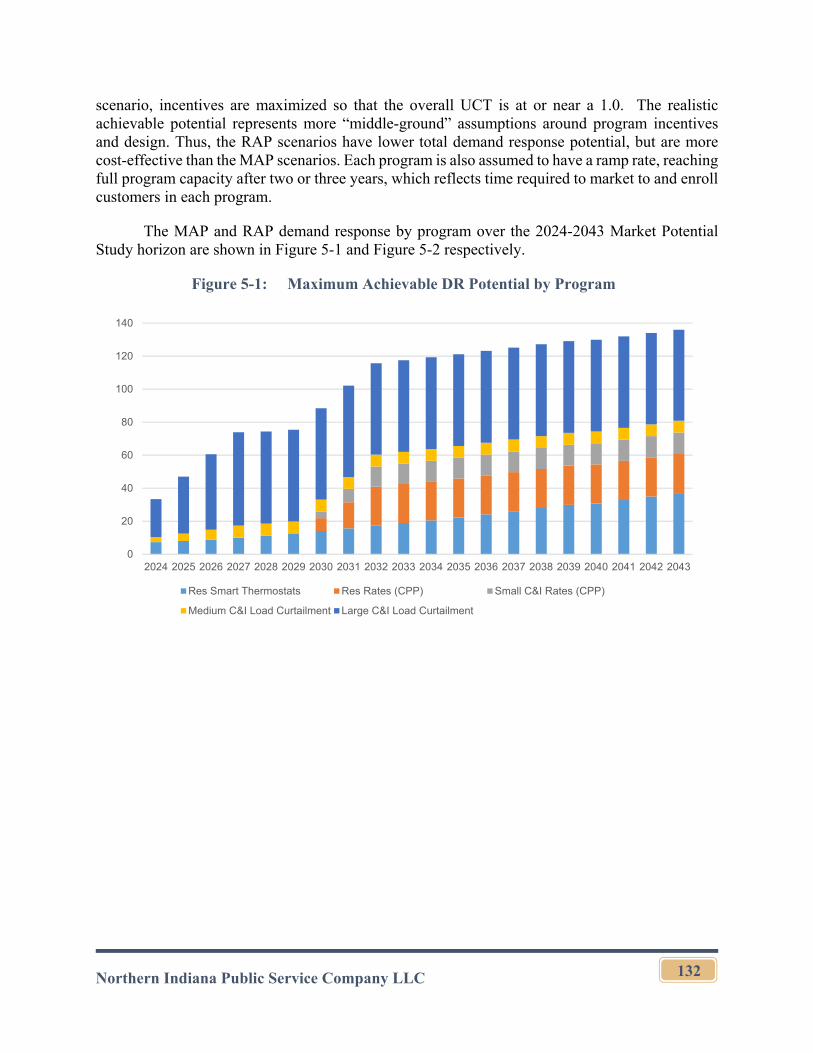
Northern Indiana Public Service Company LLC
132
scenario, incentives are maximized so that the overall UCT is at or near a 1.0. The realistic achievable potential represents more “middle-ground” assumptions around program incentives and design. Thus, the RAP scenarios have lower total demand response potential, but are more cost-effective than the MAP scenarios. Each program is also assumed to have a ramp rate, reaching full program capacity after two or three years, which reflects time required to market to and enroll customers in each program.
The MAP and RAP demand response by program over the 2024-2043 Market Potential Study horizon are shown in Figure 5-1 and Figure 5-2 respectively.
Figure 5-1: Maximum Achievable DR Potential by Program
0
20
40
60
80
100
120
140
2024 2025 2026 2027 2028 2029 2030 2031 2032 2033 2034 2035 2036 2037 2038 2039 2040 2041 2042 2043
Res Smart Thermostats Res Rates (CPP) Small C&I Rates (CPP)
Medium C&I Load Curtailment Large C&I Load Curtailment
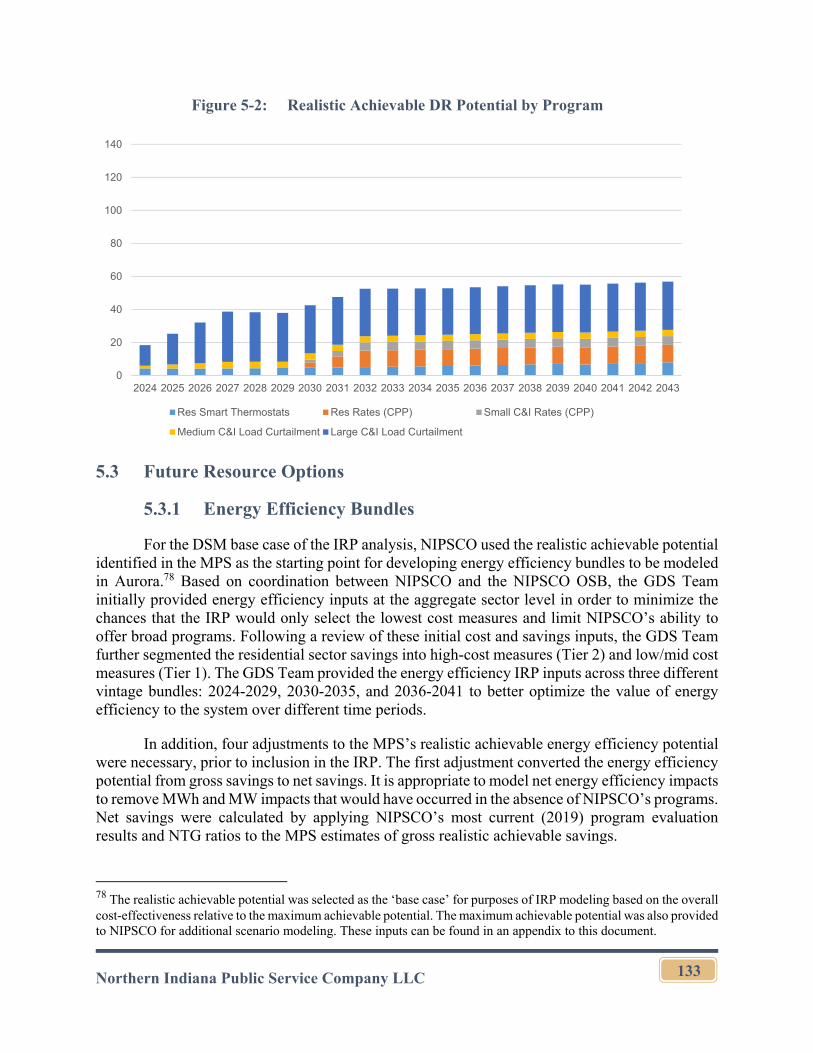
Northern Indiana Public Service Company LLC
133
Figure 5-2: Realistic Achievable DR Potential by Program
5.3 Future Resource Options
5.3.1 Energy Efficiency Bundles
For the DSM base case of the IRP analysis, NIPSCO used the realistic achievable potential identified in the MPS as the starting point for developing energy efficiency bundles to be modeled in Aurora.78 Based on coordination between NIPSCO and the NIPSCO OSB, the GDS Team initially provided energy efficiency inputs at the aggregate sector level in order to minimize the chances that the IRP would only select the lowest cost measures and limit NIPSCO’s ability to offer broad programs. Following a review of these initial cost and savings inputs, the GDS Team further segmented the residential sector savings into high-cost measures (Tier 2) and low/mid cost measures (Tier 1). The GDS Team provided the energy efficiency IRP inputs across three different vintage bundles: 2024-2029, 2030-2035, and 2036-2041 to better optimize the value of energy efficiency to the system over different time periods.
In addition, four adjustments to the MPS’s realistic achievable energy efficiency potential were necessary, prior to inclusion in the IRP. The first adjustment converted the energy efficiency potential from gross savings to net savings. It is appropriate to model net energy efficiency impacts to remove MWh and MW impacts that would have occurred in the absence of NIPSCO’s programs. Net savings were calculated by applying NIPSCO’s most current (2019) program evaluation results and NTG ratios to the MPS estimates of gross realistic achievable savings.
78 The realistic achievable potential was selected as the ‘base case’ for purposes of IRP modeling based on the overall cost-effectiveness relative to the maximum achievable potential. The maximum achievable potential was also provided to NIPSCO for additional scenario modeling. These inputs can be found in an appendix to this document.
0
20
40
60
80
100
120
140
2024 2025 2026 2027 2028 2029 2030 2031 2032 2033 2034 2035 2036 2037 2038 2039 2040 2041 2042 2043
Res Smart Thermostats Res Rates (CPP) Small C&I Rates (CPP)
Medium C&I Load Curtailment Large C&I Load Curtailment
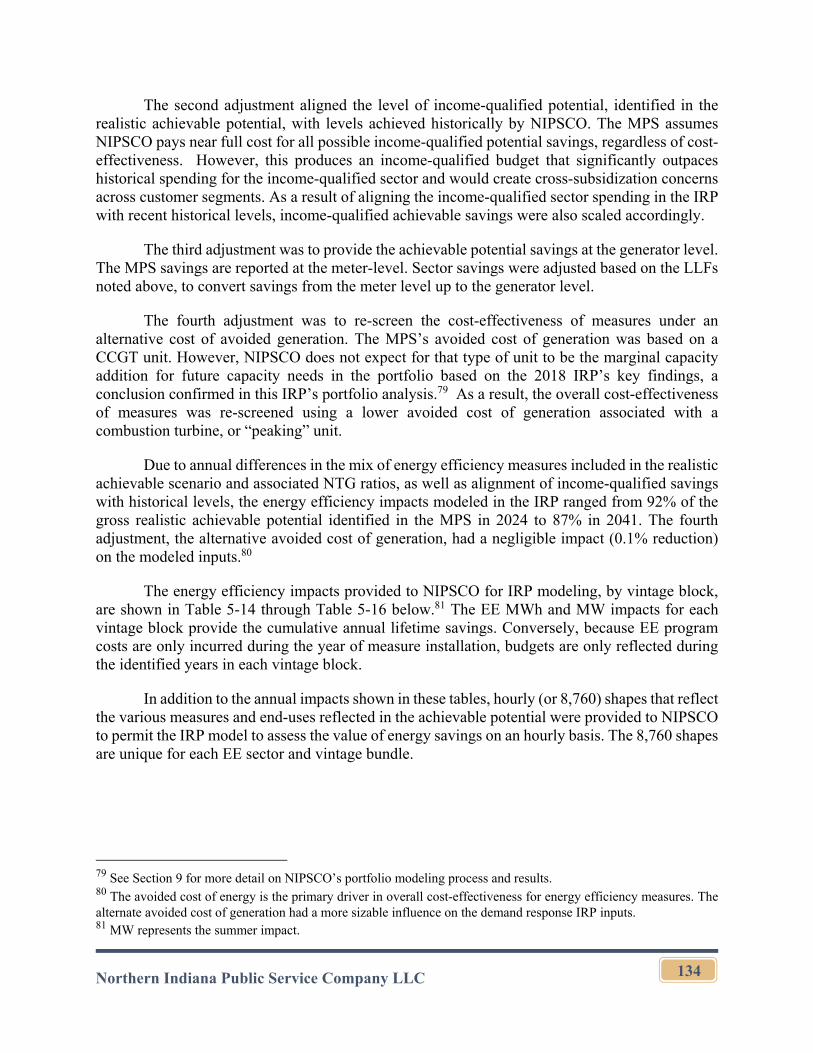
Northern Indiana Public Service Company LLC
134
The second adjustment aligned the level of income-qualified potential, identified in the realistic achievable potential, with levels achieved historically by NIPSCO. The MPS assumes NIPSCO pays near full cost for all possible income-qualified potential savings, regardless of cost-effectiveness. However, this produces an income-qualified budget that significantly outpaces historical spending for the income-qualified sector and would create cross-subsidization concerns across customer segments. As a result of aligning the income-qualified sector spending in the IRP with recent historical levels, income-qualified achievable savings were also scaled accordingly.
The third adjustment was to provide the achievable potential savings at the generator level. The MPS savings are reported at the meter-level. Sector savings were adjusted based on the LLFs noted above, to convert savings from the meter level up to the generator level.
The fourth adjustment was to re-screen the cost-effectiveness of measures under an alternative cost of avoided generation. The MPS’s avoided cost of generation was based on a CCGT unit. However, NIPSCO does not expect for that type of unit to be the marginal capacity addition for future capacity needs in the portfolio based on the 2018 IRP’s key findings, a conclusion confirmed in this IRP’s portfolio analysis.79 As a result, the overall cost-effectiveness of measures was re-screened using a lower avoided cost of generation associated with a combustion turbine, or “peaking” unit.
Due to annual differences in the mix of energy efficiency measures included in the realistic achievable scenario and associated NTG ratios, as well as alignment of income-qualified savings with historical levels, the energy efficiency impacts modeled in the IRP ranged from 92% of the gross realistic achievable potential identified in the MPS in 2024 to 87% in 2041. The fourth adjustment, the alternative avoided cost of generation, had a negligible impact (0.1% reduction) on the modeled inputs.80
The energy efficiency impacts provided to NIPSCO for IRP modeling, by vintage block, are shown in Table 5-14 through Table 5-16 below.81 The EE MWh and MW impacts for each vintage block provide the cumulative annual lifetime savings. Conversely, because EE program costs are only incurred during the year of measure installation, budgets are only reflected during the identified years in each vintage block.
In addition to the annual impacts shown in these tables, hourly (or 8,760) shapes that reflect the various measures and end-uses reflected in the achievable potential were provided to NIPSCO to permit the IRP model to assess the value of energy savings on an hourly basis. The 8,760 shapes are unique for each EE sector and vintage bundle.
79 See Section 9 for more detail on NIPSCO’s portfolio modeling process and results. 80 The avoided cost of energy is the primary driver in overall cost-effectiveness for energy efficiency measures. The alternate avoided cost of generation had a more sizable influence on the demand response IRP inputs. 81 MW represents the summer impact.
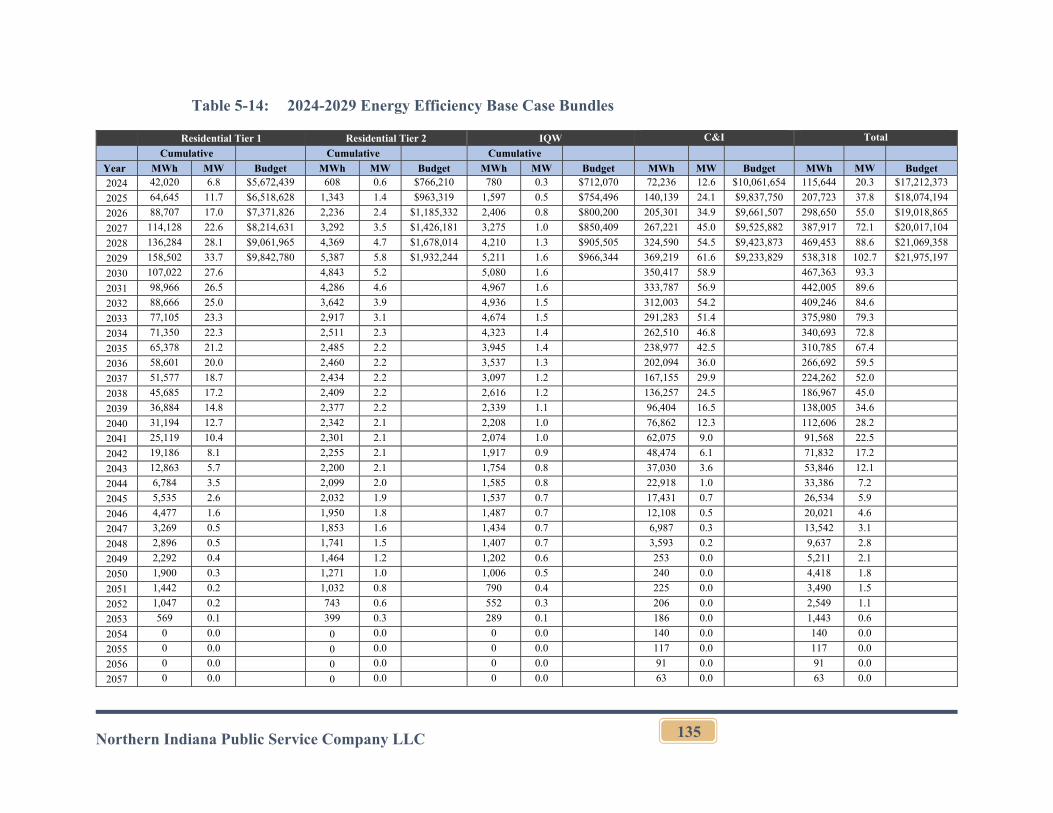
Northern Indiana Public Service Company LLC
135
Table 5-14: 2024-2029 Energy Efficiency Base Case Bundles
Residential Tier 1 Residential Tier 2 IQW C&I Total
Cumulative Cumulative Cumulative
Year MWh MW Budget MWh MW Budget MWh MW Budget MWh MW Budget MWh MW Budget
2024 42,020 6.8 $5,672,439 608 0.6 $766,210 780 0.3 $712,070 72,236 12.6 $10,061,654 115,644 20.3 $17,212,373
2025 64,645 11.7 $6,518,628 1,343 1.4 $963,319 1,597 0.5 $754,496 140,139 24.1 $9,837,750 207,723 37.8 $18,074,194
2026 88,707 17.0 $7,371,826 2,236 2.4 $1,185,332 2,406 0.8 $800,200 205,301 34.9 $9,661,507 298,650 55.0 $19,018,865
2027 114,128 22.6 $8,214,631 3,292 3.5 $1,426,181 3,275 1.0 $850,409 267,221 45.0 $9,525,882 387,917 72.1 $20,017,104
2028 136,284 28.1 $9,061,965 4,369 4.7 $1,678,014 4,210 1.3 $905,505 324,590 54.5 $9,423,873 469,453 88.6 $21,069,358
2029 158,502 33.7 $9,842,780 5,387 5.8 $1,932,244 5,211 1.6 $966,344 369,219 61.6 $9,233,829 538,318 102.7 $21,975,197
2030 107,022 27.6 4,843 5.2 5,080 1.6 350,417 58.9 467,363 93.3
2031 98,966 26.5 4,286 4.6 4,967 1.6 333,787 56.9 442,005 89.6
2032 88,666 25.0 3,642 3.9 4,936 1.5 312,003 54.2 409,246 84.6
2033 77,105 23.3 2,917 3.1 4,674 1.5 291,283 51.4 375,980 79.3
2034 71,350 22.3 2,511 2.3 4,323 1.4 262,510 46.8 340,693 72.8
2035 65,378 21.2 2,485 2.2 3,945 1.4 238,977 42.5 310,785 67.4
2036 58,601 20.0 2,460 2.2 3,537 1.3 202,094 36.0 266,692 59.5
2037 51,577 18.7 2,434 2.2 3,097 1.2 167,155 29.9 224,262 52.0
2038 45,685 17.2 2,409 2.2 2,616 1.2 136,257 24.5 186,967 45.0
2039 36,884 14.8 2,377 2.2 2,339 1.1 96,404 16.5 138,005 34.6
2040 31,194 12.7 2,342 2.1 2,208 1.0 76,862 12.3 112,606 28.2
2041 25,119 10.4 2,301 2.1 2,074 1.0 62,075 9.0 91,568 22.5
2042 19,186 8.1 2,255 2.1 1,917 0.9 48,474 6.1 71,832 17.2
2043 12,863 5.7 2,200 2.1 1,754 0.8 37,030 3.6 53,846 12.1
2044 6,784 3.5 2,099 2.0 1,585 0.8 22,918 1.0 33,386 7.2
2045 5,535 2.6 2,032 1.9 1,537 0.7 17,431 0.7 26,534 5.9
2046 4,477 1.6 1,950 1.8 1,487 0.7 12,108 0.5 20,021 4.6
2047 3,269 0.5 1,853 1.6 1,434 0.7 6,987 0.3 13,542 3.1
2048 2,896 0.5 1,741 1.5 1,407 0.7 3,593 0.2 9,637 2.8
2049 2,292 0.4 1,464 1.2 1,202 0.6 253 0.0 5,211 2.1
2050 1,900 0.3 1,271 1.0 1,006 0.5 240 0.0 4,418 1.8
2051 1,442 0.2 1,032 0.8 790 0.4 225 0.0 3,490 1.5
2052 1,047 0.2 743 0.6 552 0.3 206 0.0 2,549 1.1
2053 569 0.1 399 0.3 289 0.1 186 0.0 1,443 0.6
2054 0 0.0 0 0.0 0 0.0 140 0.0 140 0.0
2055 0 0.0 0 0.0 0 0.0 117 0.0 117 0.0
2056 0 0.0 0 0.0 0 0.0 91 0.0 91 0.0
2057 0 0.0 0 0.0 0 0.0 63 0.0 63 0.0
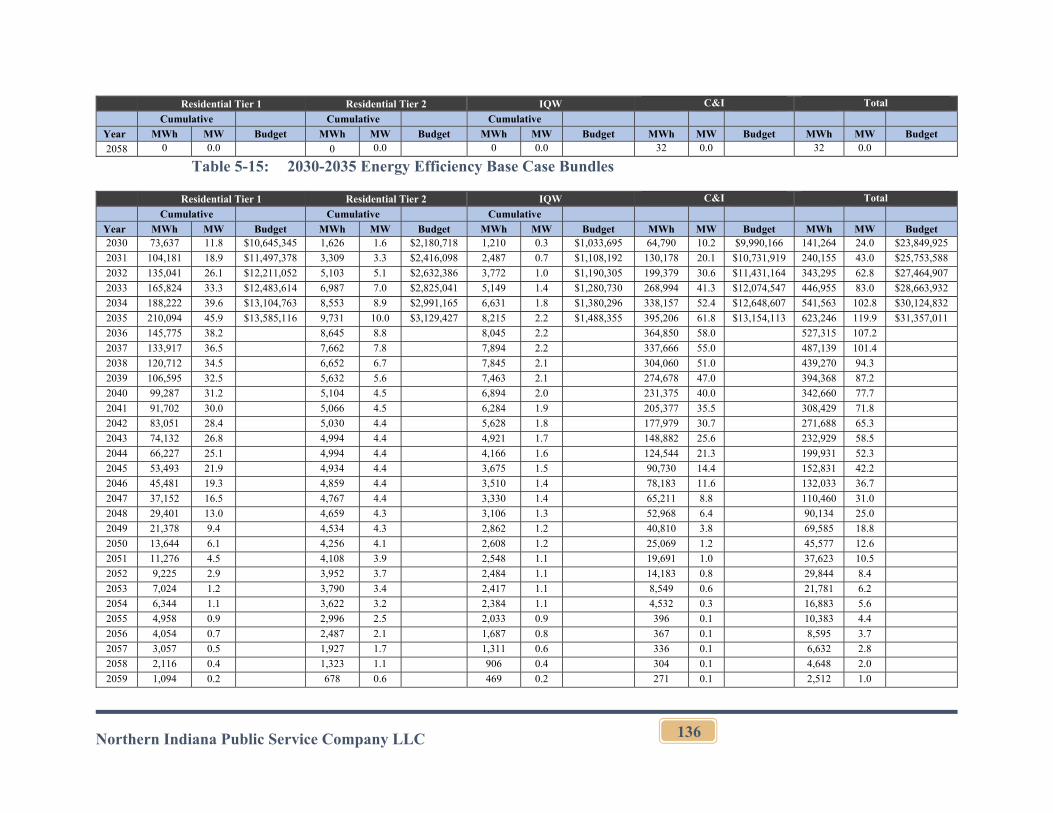
Northern Indiana Public Service Company LLC
136
Residential Tier 1 Residential Tier 2 IQW C&I Total
Cumulative Cumulative Cumulative
Year MWh MW Budget MWh MW Budget MWh MW Budget MWh MW Budget MWh MW Budget
2058 0 0.0 0 0.0 0 0.0 32 0.0 32 0.0
Table 5-15: 2030-2035 Energy Efficiency Base Case Bundles
Residential Tier 1 Residential Tier 2 IQW C&I Total
Cumulative Cumulative Cumulative
Year MWh MW Budget MWh MW Budget MWh MW Budget MWh MW Budget MWh MW Budget 2030 73,637 11.8 $10,645,345 1,626 1.6 $2,180,718 1,210 0.3 $1,033,695 64,790 10.2 $9,990,166 141,264 24.0 $23,849,925
2031 104,181 18.9 $11,497,378 3,309 3.3 $2,416,098 2,487 0.7 $1,108,192 130,178 20.1 $10,731,919 240,155 43.0 $25,753,588
2032 135,041 26.1 $12,211,052 5,103 5.1 $2,632,386 3,772 1.0 $1,190,305 199,379 30.6 $11,431,164 343,295 62.8 $27,464,907
2033 165,824 33.3 $12,483,614 6,987 7.0 $2,825,041 5,149 1.4 $1,280,730 268,994 41.3 $12,074,547 446,955 83.0 $28,663,932
2034 188,222 39.6 $13,104,763 8,553 8.9 $2,991,165 6,631 1.8 $1,380,296 338,157 52.4 $12,648,607 541,563 102.8 $30,124,832
2035 210,094 45.9 $13,585,116 9,731 10.0 $3,129,427 8,215 2.2 $1,488,355 395,206 61.8 $13,154,113 623,246 119.9 $31,357,011
2036 145,775 38.2 8,645 8.8 8,045 2.2 364,850 58.0 527,315 107.2 2037 133,917 36.5 7,662 7.8 7,894 2.2 337,666 55.0 487,139 101.4 2038 120,712 34.5 6,652 6.7 7,845 2.1 304,060 51.0 439,270 94.3 2039 106,595 32.5 5,632 5.6 7,463 2.1 274,678 47.0 394,368 87.2 2040 99,287 31.2 5,104 4.5 6,894 2.0 231,375 40.0 342,660 77.7 2041 91,702 30.0 5,066 4.5 6,284 1.9 205,377 35.5 308,429 71.8 2042 83,051 28.4 5,030 4.4 5,628 1.8 177,979 30.7 271,688 65.3 2043 74,132 26.8 4,994 4.4 4,921 1.7 148,882 25.6 232,929 58.5 2044 66,227 25.1 4,994 4.4 4,166 1.6 124,544 21.3 199,931 52.3 2045 53,493 21.9 4,934 4.4 3,675 1.5 90,730 14.4 152,831 42.2 2046 45,481 19.3 4,859 4.4 3,510 1.4 78,183 11.6 132,033 36.7 2047 37,152 16.5 4,767 4.4 3,330 1.4 65,211 8.8 110,460 31.0 2048 29,401 13.0 4,659 4.3 3,106 1.3 52,968 6.4 90,134 25.0 2049 21,378 9.4 4,534 4.3 2,862 1.2 40,810 3.8 69,585 18.8 2050 13,644 6.1 4,256 4.1 2,608 1.2 25,069 1.2 45,577 12.6 2051 11,276 4.5 4,108 3.9 2,548 1.1 19,691 1.0 37,623 10.5 2052 9,225 2.9 3,952 3.7 2,484 1.1 14,183 0.8 29,844 8.4 2053 7,024 1.2 3,790 3.4 2,417 1.1 8,549 0.6 21,781 6.2 2054 6,344 1.1 3,622 3.2 2,384 1.1 4,532 0.3 16,883 5.6 2055 4,958 0.9 2,996 2.5 2,033 0.9 396 0.1 10,383 4.4 2056 4,054 0.7 2,487 2.1 1,687 0.8 367 0.1 8,595 3.7 2057 3,057 0.5 1,927 1.7 1,311 0.6 336 0.1 6,632 2.8 2058 2,116 0.4 1,323 1.1 906 0.4 304 0.1 4,648 2.0 2059 1,094 0.2 678 0.6 469 0.2 271 0.1 2,512 1.0
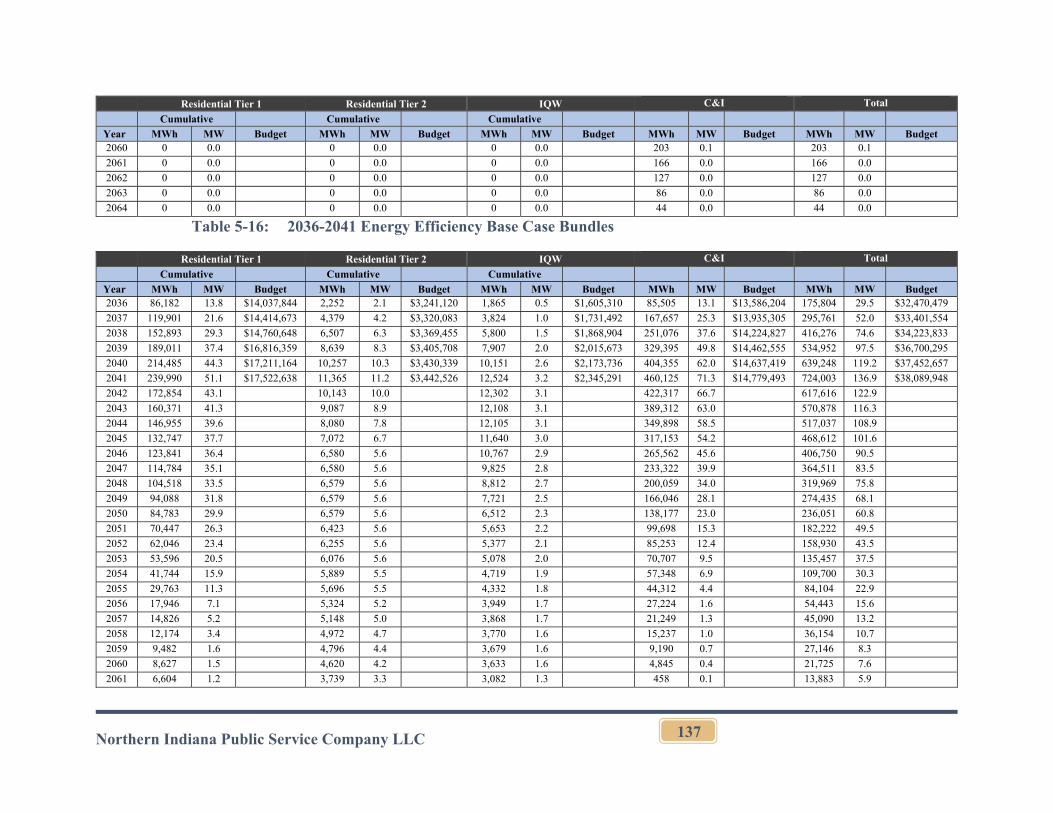
Northern Indiana Public Service Company LLC
137
Residential Tier 1 Residential Tier 2 IQW C&I Total
Cumulative Cumulative Cumulative
Year MWh MW Budget MWh MW Budget MWh MW Budget MWh MW Budget MWh MW Budget 2060 0 0.0 0 0.0 0 0.0 203 0.1 203 0.1
2061 0 0.0 0 0.0 0 0.0 166 0.0 166 0.0
2062 0 0.0 0 0.0 0 0.0 127 0.0 127 0.0
2063 0 0.0 0 0.0 0 0.0 86 0.0 86 0.0
2064 0 0.0 0 0.0 0 0.0 44 0.0 44 0.0
Table 5-16: 2036-2041 Energy Efficiency Base Case Bundles
Residential Tier 1 Residential Tier 2 IQW C&I Total
Cumulative Cumulative Cumulative
Year MWh MW Budget MWh MW Budget MWh MW Budget MWh MW Budget MWh MW Budget 2036 86,182 13.8 $14,037,844 2,252 2.1 $3,241,120 1,865 0.5 $1,605,310 85,505 13.1 $13,586,204 175,804 29.5 $32,470,479
2037 119,901 21.6 $14,414,673 4,379 4.2 $3,320,083 3,824 1.0 $1,731,492 167,657 25.3 $13,935,305 295,761 52.0 $33,401,554
2038 152,893 29.3 $14,760,648 6,507 6.3 $3,369,455 5,800 1.5 $1,868,904 251,076 37.6 $14,224,827 416,276 74.6 $34,223,833
2039 189,011 37.4 $16,816,359 8,639 8.3 $3,405,708 7,907 2.0 $2,015,673 329,395 49.8 $14,462,555 534,952 97.5 $36,700,295
2040 214,485 44.3 $17,211,164 10,257 10.3 $3,430,339 10,151 2.6 $2,173,736 404,355 62.0 $14,637,419 639,248 119.2 $37,452,657
2041 239,990 51.1 $17,522,638 11,365 11.2 $3,442,526 12,524 3.2 $2,345,291 460,125 71.3 $14,779,493 724,003 136.9 $38,089,948
2042 172,854 43.1 10,143 10.0 12,302 3.1 422,317 66.7 617,616 122.9 2043 160,371 41.3 9,087 8.9 12,108 3.1 389,312 63.0 570,878 116.3 2044 146,955 39.6 8,080 7.8 12,105 3.1 349,898 58.5 517,037 108.9 2045 132,747 37.7 7,072 6.7 11,640 3.0 317,153 54.2 468,612 101.6 2046 123,841 36.4 6,580 5.6 10,767 2.9 265,562 45.6 406,750 90.5 2047 114,784 35.1 6,580 5.6 9,825 2.8 233,322 39.9 364,511 83.5 2048 104,518 33.5 6,579 5.6 8,812 2.7 200,059 34.0 319,969 75.8 2049 94,088 31.8 6,579 5.6 7,721 2.5 166,046 28.1 274,435 68.1 2050 84,783 29.9 6,579 5.6 6,512 2.3 138,177 23.0 236,051 60.8 2051 70,447 26.3 6,423 5.6 5,653 2.2 99,698 15.3 182,222 49.5 2052 62,046 23.4 6,255 5.6 5,377 2.1 85,253 12.4 158,930 43.5 2053 53,596 20.5 6,076 5.6 5,078 2.0 70,707 9.5 135,457 37.5 2054 41,744 15.9 5,889 5.5 4,719 1.9 57,348 6.9 109,700 30.3 2055 29,763 11.3 5,696 5.5 4,332 1.8 44,312 4.4 84,104 22.9 2056 17,946 7.1 5,324 5.2 3,949 1.7 27,224 1.6 54,443 15.6 2057 14,826 5.2 5,148 5.0 3,868 1.7 21,249 1.3 45,090 13.2 2058 12,174 3.4 4,972 4.7 3,770 1.6 15,237 1.0 36,154 10.7 2059 9,482 1.6 4,796 4.4 3,679 1.6 9,190 0.7 27,146 8.3 2060 8,627 1.5 4,620 4.2 3,633 1.6 4,845 0.4 21,725 7.6 2061 6,604 1.2 3,739 3.3 3,082 1.3 458 0.1 13,883 5.9
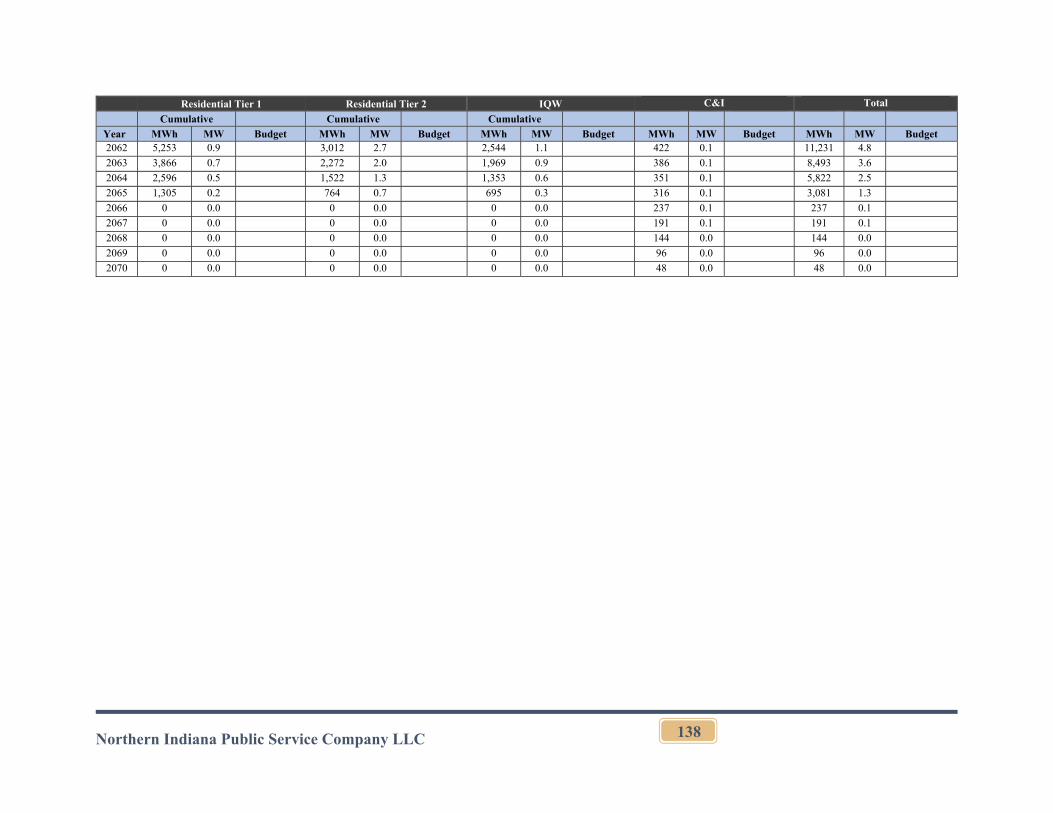
Northern Indiana Public Service Company LLC
138
Residential Tier 1 Residential Tier 2 IQW C&I Total
Cumulative Cumulative Cumulative
Year MWh MW Budget MWh MW Budget MWh MW Budget MWh MW Budget MWh MW Budget 2062 5,253 0.9 3,012 2.7 2,544 1.1 422 0.1 11,231 4.8 2063 3,866 0.7 2,272 2.0 1,969 0.9 386 0.1 8,493 3.6 2064 2,596 0.5 1,522 1.3 1,353 0.6 351 0.1 5,822 2.5 2065 1,305 0.2 764 0.7 695 0.3 316 0.1 3,081 1.3 2066 0 0.0 0 0.0 0 0.0 237 0.1 237 0.1
2067 0 0.0 0 0.0 0 0.0 191 0.1 191 0.1
2068 0 0.0 0 0.0 0 0.0 144 0.0 144 0.0
2069 0 0.0 0 0.0 0 0.0 96 0.0 96 0.0
2070 0 0.0 0 0.0 0 0.0 48 0.0 48 0.0
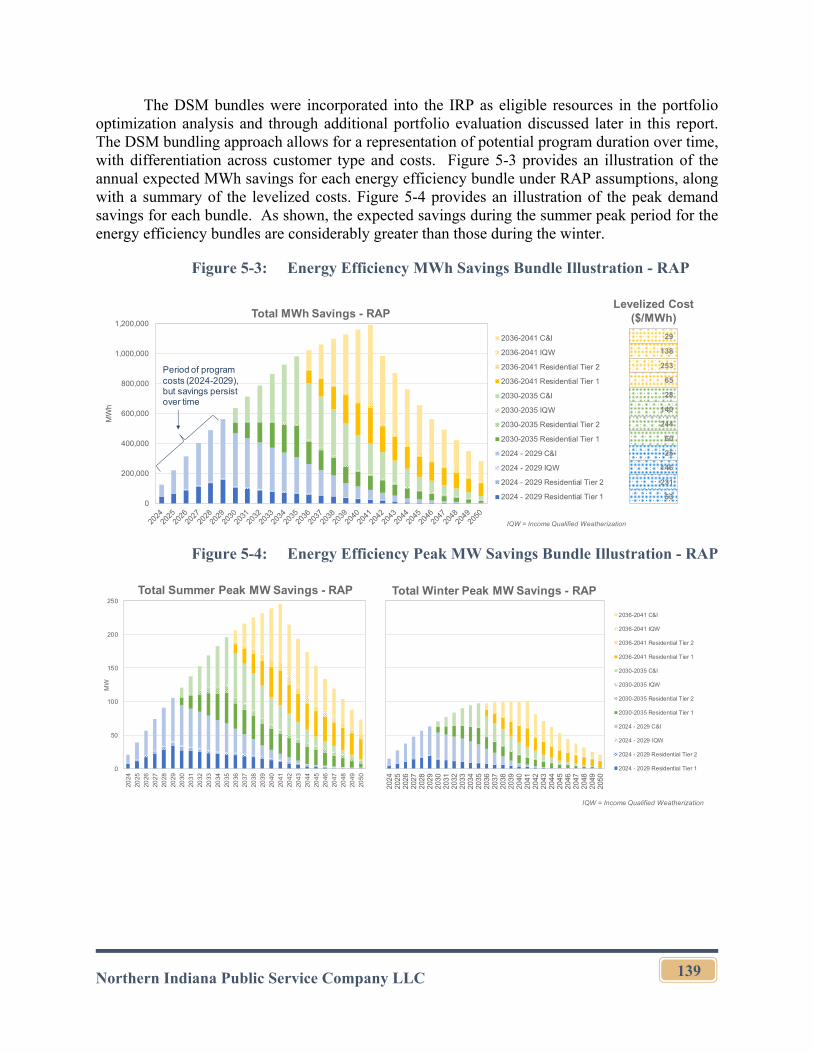
Northern Indiana Public Service Company LLC
139
The DSM bundles were incorporated into the IRP as eligible resources in the portfolio optimization analysis and through additional portfolio evaluation discussed later in this report. The DSM bundling approach allows for a representation of potential program duration over time, with differentiation across customer type and costs. Figure 5-3 provides an illustration of the annual expected MWh savings for each energy efficiency bundle under RAP assumptions, along with a summary of the levelized costs. Figure 5-4 provides an illustration of the peak demand savings for each bundle. As shown, the expected savings during the summer peak period for the energy efficiency bundles are considerably greater than those during the winter.
Figure 5-3: Energy Efficiency MWh Savings Bundle Illustration - RAP
Figure 5-4: Energy Efficiency Peak MW Savings Bundle Illustration - RAP
0
200,000
400,000
600,000
800,000
1,000,000
1,200,000
MW
h
2036-2041 C&I
2036-2041 IQW
2036-2041 Residential Tier 2
2036-2041 Residential Tier 1
2030-2035 C&I
2030-2035 IQW
2030-2035 Residential Tier 2
2030-2035 Residential Tier 1
2024 - 2029 C&I
2024 - 2029 IQW
2024 - 2029 Residential Tier 2
2024 - 2029 Residential Tier 1
IQW = Income Qualified Weatherization
Total MWh Savings - RAP
Period of program costs (2024-2029), but savings persist over time
29
138
253
65
28
140
244
60
25
146
231
53
Levelized Cost ($/MWh)
0
50
100
150
200
250
2024
2025
2026
2027
2028
2029
2030
2031
2032
2033
2034
2035
2036
2037
2038
2039
2040
2041
2042
2043
2044
2045
2046
2047
2048
2049
2050
MW
2024
2025
2026
2027
2028
2029
2030
2031
2032
2033
2034
2035
2036
2037
2038
2039
2040
2041
2042
2043
2044
2045
2046
2047
2048
2049
2050
2036-2041 C&I
2036-2041 IQW
2036-2041 Residential Tier 2
2036-2041 Residential Tier 1
2030-2035 C&I
2030-2035 IQW
2030-2035 Residential Tier 2
2030-2035 Residential Tier 1
2024 - 2029 C&I
2024 - 2029 IQW
2024 - 2029 Residential Tier 2
2024 - 2029 Residential Tier 1
Total Summer Peak MW Savings - RAP Total Winter Peak MW Savings - RAP
IQW = Income Qualified Weatherization
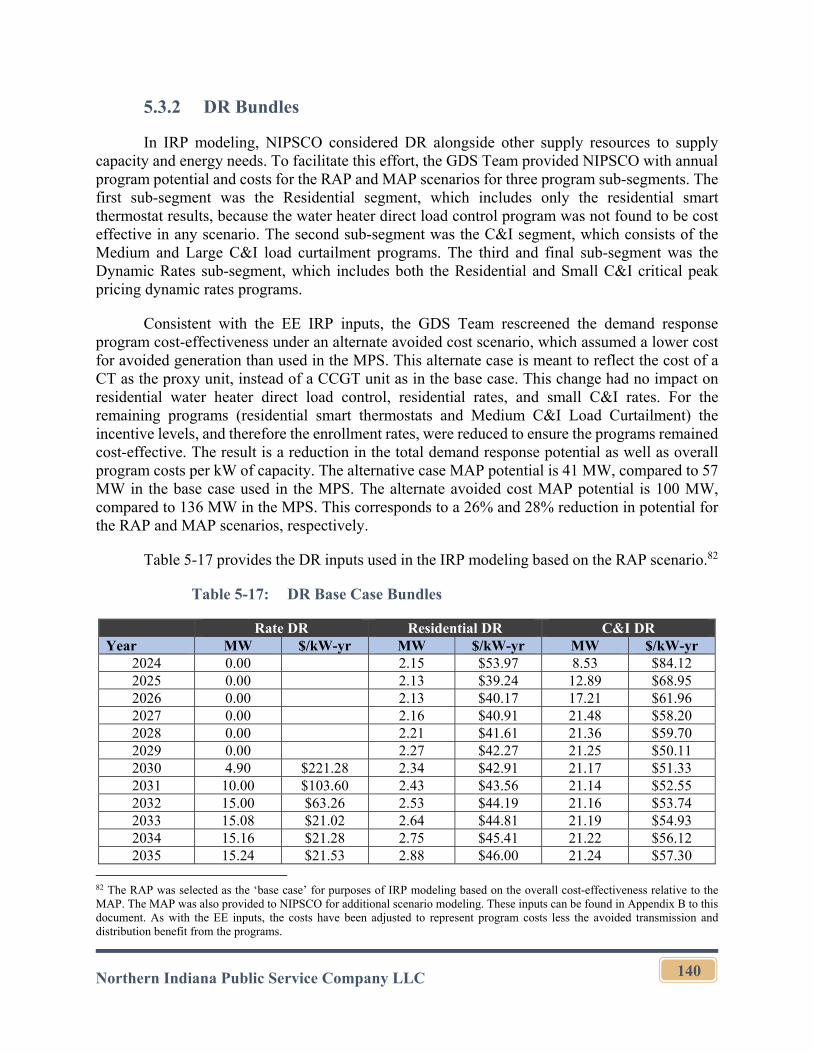
Northern Indiana Public Service Company LLC
140
5.3.2 DR Bundles
In IRP modeling, NIPSCO considered DR alongside other supply resources to supply capacity and energy needs. To facilitate this effort, the GDS Team provided NIPSCO with annual program potential and costs for the RAP and MAP scenarios for three program sub-segments. The first sub-segment was the Residential segment, which includes only the residential smart thermostat results, because the water heater direct load control program was not found to be cost effective in any scenario. The second sub-segment was the C&I segment, which consists of the Medium and Large C&I load curtailment programs. The third and final sub-segment was the Dynamic Rates sub-segment, which includes both the Residential and Small C&I critical peak pricing dynamic rates programs.
Consistent with the EE IRP inputs, the GDS Team rescreened the demand response program cost-effectiveness under an alternate avoided cost scenario, which assumed a lower cost for avoided generation than used in the MPS. This alternate case is meant to reflect the cost of a CT as the proxy unit, instead of a CCGT unit as in the base case. This change had no impact on residential water heater direct load control, residential rates, and small C&I rates. For the remaining programs (residential smart thermostats and Medium C&I Load Curtailment) the incentive levels, and therefore the enrollment rates, were reduced to ensure the programs remained cost-effective. The result is a reduction in the total demand response potential as well as overall program costs per kW of capacity. The alternative case MAP potential is 41 MW, compared to 57 MW in the base case used in the MPS. The alternate avoided cost MAP potential is 100 MW, compared to 136 MW in the MPS. This corresponds to a 26% and 28% reduction in potential for the RAP and MAP scenarios, respectively.
Table 5-17 provides the DR inputs used in the IRP modeling based on the RAP scenario.82
Table 5-17: DR Base Case Bundles
Rate DR Residential DR C&I DR Year MW $/kW-yr MW $/kW-yr MW $/kW-yr
2024 0.00
2.15 $53.97 8.53 $84.12 2025 0.00
2.13 $39.24 12.89 $68.95
2026 0.00
2.13 $40.17 17.21 $61.96 2027 0.00
2.16 $40.91 21.48 $58.20
2028 0.00
2.21 $41.61 21.36 $59.70 2029 0.00
2.27 $42.27 21.25 $50.11
2030 4.90 $221.28 2.34 $42.91 21.17 $51.33 2031 10.00 $103.60 2.43 $43.56 21.14 $52.55 2032 15.00 $63.26 2.53 $44.19 21.16 $53.74 2033 15.08 $21.02 2.64 $44.81 21.19 $54.93 2034 15.16 $21.28 2.75 $45.41 21.22 $56.12 2035 15.24 $21.53 2.88 $46.00 21.24 $57.30
82 The RAP was selected as the ‘base case’ for purposes of IRP modeling based on the overall cost-effectiveness relative to the MAP. The MAP was also provided to NIPSCO for additional scenario modeling. These inputs can be found in Appendix B to this document. As with the EE inputs, the costs have been adjusted to represent program costs less the avoided transmission and distribution benefit from the programs.
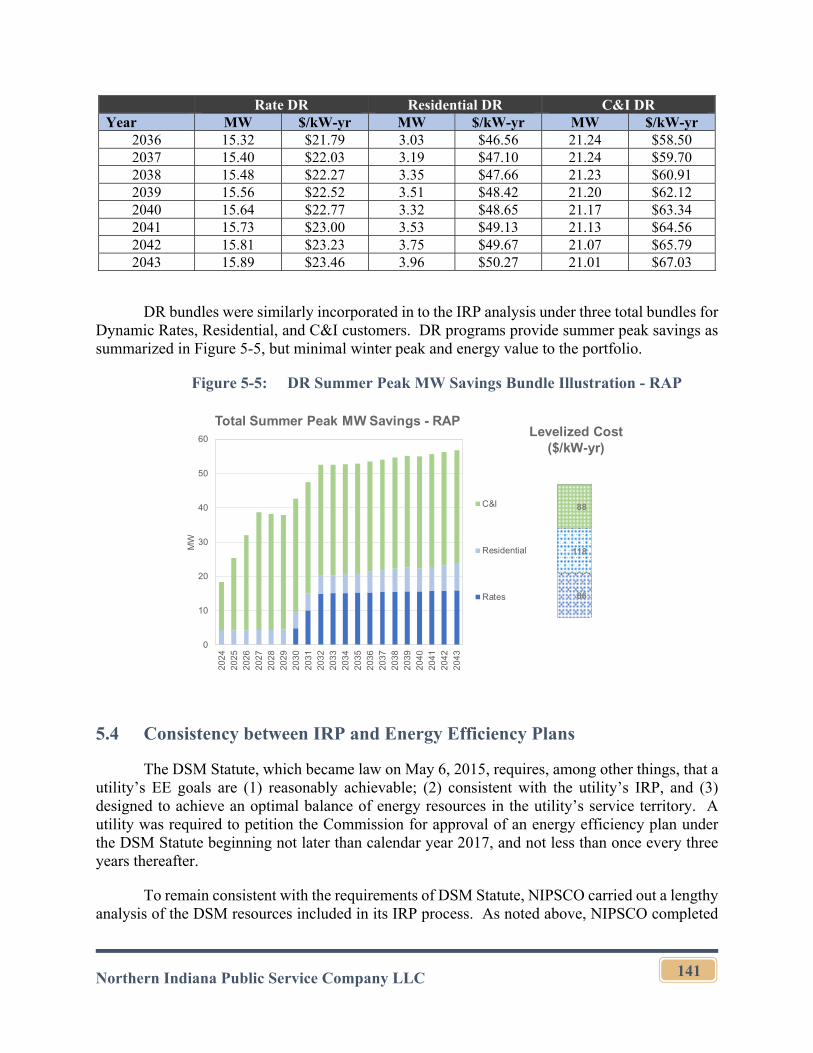
Northern Indiana Public Service Company LLC
141
Rate DR Residential DR C&I DR Year MW $/kW-yr MW $/kW-yr MW $/kW-yr
2036 15.32 $21.79 3.03 $46.56 21.24 $58.50 2037 15.40 $22.03 3.19 $47.10 21.24 $59.70 2038 15.48 $22.27 3.35 $47.66 21.23 $60.91 2039 15.56 $22.52 3.51 $48.42 21.20 $62.12 2040 15.64 $22.77 3.32 $48.65 21.17 $63.34 2041 15.73 $23.00 3.53 $49.13 21.13 $64.56 2042 15.81 $23.23 3.75 $49.67 21.07 $65.79 2043 15.89 $23.46 3.96 $50.27 21.01 $67.03
DR bundles were similarly incorporated in to the IRP analysis under three total bundles for Dynamic Rates, Residential, and C&I customers. DR programs provide summer peak savings as summarized in Figure 5-5, but minimal winter peak and energy value to the portfolio.
Figure 5-5: DR Summer Peak MW Savings Bundle Illustration - RAP
5.4 Consistency between IRP and Energy Efficiency Plans
The DSM Statute, which became law on May 6, 2015, requires, among other things, that a utility’s EE goals are (1) reasonably achievable; (2) consistent with the utility’s IRP, and (3) designed to achieve an optimal balance of energy resources in the utility’s service territory. A utility was required to petition the Commission for approval of an energy efficiency plan under the DSM Statute beginning not later than calendar year 2017, and not less than once every three years thereafter.
To remain consistent with the requirements of DSM Statute, NIPSCO carried out a lengthy analysis of the DSM resources included in its IRP process. As noted above, NIPSCO completed
Total Summer Peak MW Savings - RAP
0
10
20
30
40
50
60
20
24
20
25
20
26
20
27
20
28
20
29
20
30
20
31
20
32
20
33
20
34
20
35
20
36
20
37
20
38
20
39
20
40
20
41
20
42
20
43
MW
C&I
Residential
Rates
88
118
86
Levelized Cost ($/kW-yr)
Northern Indiana Public Service Company LLC
142
a Market Potential Study in 2021 to determine the achievable amount of savings. See Appendix B. NIPSCO, through the MPS process discussed above, conducted an in-depth review of the amount of savings that would be achievable in its service territory with its current customer base. Following that in-depth review process and as outlined above, NIPSCO incorporated energy efficiency and demand response bundles into the model for selection as resources. NIPSCO allowed the EE and DR, broadly referred to as DSM resources, to be selected across all portfolio concepts that were evaluated in the Existing Fleet and Replacement analysis phases (See Section 9).
In accordance with the DSM Statute, NIPSCO intends to request approval in 2022 of an EE plan for implementation in 2024 that includes:
EE goals that are: (1) reasonably achievable; (2) consistent with NIPSCO’s 2021 IRP; and (3) designed to achieve an optimal balance of energy resources in its service territory;
EE programs that are: (1) sponsored by an electricity supplier; and (2) designed to implement EE improvements;
program budgets;
program costs that include: (1) direct and indirect costs of energy efficiency programs; (2) costs associated with the EM&V of program results; (3) recovery of lost revenues and performance incentives;83 and
EM&V procedures that involve an independent EM&V.
NIPSCO intends to develop a DSM Action Plan prior to its filing in 2022 based on the EE selected by the IRP model. This may be updated if another MPS has been completed. The DSM Action Plan will take into account the results of the IRP for implementation and evaluation of the EE plan.
The benefit of a DSM Action Plan is that it uses various forms of information, including the IRP, to develop the best strategy for an energy efficiency plan. The DSM Action Plan will then be used to develop the DSM RFPs. The results of the winning bids will be utilized to develop the filing, with support from the MPS, IRP and DSM Action Plan. This is the most effective way to ensure NIPSCO has an EE plan that is based on real-world, achievable results from vendors who are committed to those results. Bidders’ responses to the savings identified in NIPSCO’s DSM RFP will vary based on the individual bidder’s perception of NIPSCO’s customer base and their previous experiences within other service territories, etc. This unique process for development of the DSM RFPs and creation of the EE plan allows NIPSCO to compensate for the
83 For purposes of this filing, the “direct costs” are those associated with implementing the programs, including any costs associated with program start up, while “indirect costs” are the NIPSCO administrative costs;
Northern Indiana Public Service Company LLC
143
long lead time between the completion of a market potential study and the actual implementation of a program.
It is important to note that the final program design is determined by the bidder(s) selected by NIPSCO, with consideration of input from its OSB. The selected bidder’s(s’) predictions of the market into the program design as they determine what may or may not work in the NIPSCO’s service territory is important for designing an EE program. That means that the programs included in the MPS typically change. NIPSCO uses the MPS as a feed into the IRP to develop the Action Plan. This Action Plan allows NIPSCO to take into account not just the results of the IRP, but also the experience of NIPSCO and its vendors with a particular program or measure. For example, electric hot water heating has a great deal of potential, but NIPSCO has not found there to be much interest from customers in the program. Knowing this means that NIPSCO will either (a) not structure a large amount of savings around a measure which has historically shown little participation or (b) need to increase the incentive to increase participation, which may impact the cost effectiveness of the program.
That does not mean that the EE plan will be without change. Until the programs are administered to the customer base and the first-hand experiences with energy efficiency occur, informed judgments must be used to establish the initial estimates of program impacts in NIPSCO’s service territory. That is the benefit of utilizing an OSB. It provides an on-going mechanism to adjust to changing market conditions, including codes and standards and new technologies, and to ensure NIPSCO is capturing as much energy efficiency savings as possible for the amount of funding available.
Northern Indiana Public Service Company LLC
144
Section 6. Transmission and Distribution System
Consistent with the principles set out in Section 1, NIPSCO continues to invest in its existing T&D resources to ensure reliable, compliant, flexible, diverse and affordable service to its customers. NIPSCO continually assesses the current physical T&D system resources for necessary improvements and upgrades to meet future customer demand or other changing conditions. As part of this effort, NIPSCO participates in the planning processes at the state, regional, and federal levels to ensure that its customers’ interests are fully represented and to coordinate its planning efforts with others. The goals of the planning process include:
Adequately serve native customer load and maintain continuity of service to customers under various system contingencies.
Proactively maintain and increase availability and reliability of the electric delivery system.
Manage costs while being consistent with the above guidelines
6.1 Transmission System Planning
6.1.1 Transmission System Planning Criteria and Guidelines
NIPSCO Transmission System Planning Criteria requires performance analysis of the transmission system for the outage of various system components including but not limited to generators, lines, transformers, substation bus sections, substation breakers, and double-circuit tower lines. Adequacy of transmission system performance is measured in terms of NIPSCO planning voltage criteria, facility thermal ratings, fault interrupting capability, voltage stability, and generator rotor angle stability as documented in the NIPSCO 2021 FERC Form 715 Annual Transmission Planning and Evaluation Report filing (Confidential Appendix C). When a violation of one or more of these requirements is identified, Transmission Planning develops mitigations that may consist of operating measures and/or system improvements.
6.1.2 North American Electric Reliability Corporation
NIPSCO is subject to the NERC, which is certified by the FERC to establish and enforce reliability standards for the bulk-electric system and whose mission is to ensure the reliability of the North American bulk electric system. NIPSCO is registered with NERC as a Balancing Authority, Distribution Provider, Generator Owner, Generator Operator, Resource Planner, Transmission Owner, Transmission Operator, and Transmission Planner. Together with MISO, in a Coordinated Functional Registration, NIPSCO is registered as a Balancing Authority, Transmission Owner, and Transmission Operator. Each Registered Entity is subject to compliance with applicable NERC standards, and ReliabilityFirst Regional Reliability Organization standards approved by FERC. Non-compliance with these standards can result in potential fines or penalties.
Northern Indiana Public Service Company LLC
145
6.1.3 Midcontinent Independent System Operator, Inc.
NIPSCO participates in the larger regional transmission reliability planning process through its membership in the MISO, which annually performs a planning analysis of the larger regional transmission system through the MTEP. The MTEP process identifies reliability adequacy on a larger regional basis and ensures that the transmission plans of each member company are compatible with those of other companies. It should be noted that any transmission project driven by local factors that NIPSCO needs to build must be submitted to MISO for its planning review to ensure that there is no harm to other systems in the region. Under extenuating circumstances, NIPSCO can request expedited review of these projects.
Requests by generation owners to connect new generators to the NIPSCO transmission system, to change the capacity of existing generators connected to the NIPSCO transmission system, or otherwise modify existing generators connected to the NIPSCO transmission system are handled through the MISO Generation Interconnection Process. NIPSCO participates in this effort to review potential impacts on the NIPSCO transmission system and identify improvements or upgrades necessary to accommodate these requests. Requests by generation owners connecting to the PJM transmission system are to be coordinated with NIPSCO by PJM through MISO per the process defined by the MISO-PJM JOA.
Requests by generation owners in the MISO footprint to retire existing generators are handled through the MISO Attachment Y process. NIPSCO participates in this effort to review potential impacts on the NIPSCO transmission system and identify either operating procedures or improvements and upgrades necessary to accommodate these requests. Requests by generation owners in the PJM footprint to retire existing generators may be reviewed by MISO for impacts on the NIPSCO transmission system per the process defined by the MISO-PJM JOA, but the generation owners in the PJM footprint are under no obligation to mitigate any resulting constraints on the NIPSCO transmission system.
Requests by generation owners to secure transmission service are handled through the MISO Transmission Service Request process. NIPSCO participates in this effort to review potential impacts on the NIPSCO transmission system and identify improvements or upgrades necessary to accommodate these requests.
Because NIPSCO is situated on a very significant boundary (seam) between MISO and PJM, NIPSCO participates in the coordination of transmission planning efforts between MISO and PJM as defined in the MISO-PJM JOA. In addition, MISO may propose transmission system projects or other upgrades that are not reliability based, but are economically based targeted at gains in market efficiency including the lowering of delivered energy costs to the end use customer. These projects must pass the criteria specified in MISO’s tariff (including a minimum benefit to cost ratio) before approval.
NIPSCO is also an active participant in MISO and PJM’s IMEP planning processes as defined in the MISO-PJM JOA. The IMEP processes focus on evaluating potential transmission projects to lower the overall production cost and lower delivered energy costs to the end use
Northern Indiana Public Service Company LLC
146
customer for both of the MISO and PJM footprints. These projects must pass the criteria specified in MISO-PJM JOA (including a minimum joint benefit to cost ratio) before approval.
6.1.4 Market Participants
MISO has a process through which market participants can request voluntary upgrades on the NIPSCO transmission system to better accommodate generation outlet capacity, reduce congestion, or other market driven needs. If a market participant wishes to pursue these types of upgrades, they must submit their proposal to MISO and NIPSCO for evaluation in the process defined by the MISO tariff and corresponding Business Practice Manuals. The costs to perform these types of upgrades are negotiated between the market participant and NIPSCO.
6.1.5 Customer Driven Development Projects
NIPSCO may be contacted to undertake transmission upgrades by individual customers based on the customer’s plans for economic development or expansion. In coordination with the customer, NIPSCO Major Accounts and NIPSCO Economic Development will determine if identified transmission upgrades are necessary to meet the customer’s development or expansion plans. Any transmission upgrades identified via this route, that are applicable under the MISO planning processes, are evaluated by MISO to ensure there is “no harm” to any other system in the region as a result of these upgrades.
6.1.6 NIPSCO Transmission System Capital Projects
NIPSCO’s current capital project plan for future years as driven by NIPSCO’s planning processes and any projects designated and approved through the MISO MTEP planning effort includes:
Dune Acres 138kV breaker upgrades
MISO MTEP20 IMEP Project: Rebuild of the Michigan City to Trail Creek to Bosserman 138kV circuits.
Maple to LNG 138kV circuit rebuild
LNG to Stillwell 138kV circuit rebuild
Maple to New Carlisle 138kV circuit rebuild
New Hiple to Northport 138kV Circuit
New 138/69kV substation, Menges Ditch, in Elkhart County
In addition to current portfolio, NIPSCO completed the following transmission system projects, including:
Northern Indiana Public Service Company LLC
147
Multi-Value Project 11: Sugar Creek Substation upgrades to accommodate the new 345 kV circuit from Ameren’s Kansas West substation to the NIPSCO/Duke Energy Indiana jointly-owned Sugar Creek substation
Circuit 13812 Maple Substation upgrade
Circuit 13854 Aetna Substation line drop upgrade
LaGrange Substation 138kV Ring bus conversion
Hiple 138kV relay upgrades for added redundancy
Kosciusko circuit 13881 switch upgrades
Bosserman to New Carlisle Circuit rebuild
MISO Market Efficiency Project: Reynolds Circuit 138109 switch upgrades.
MISO Market Efficiency Project: Circuit 13835, Roxana to Praxair, line upgrade
MISO Market Efficiency Project: Circuit 13813, Michigan City to Bosserman, line upgrade
MISO Market Efficiency Project: Circuit 34504, Munster to Burnham, line upgrade
6.1.7 Electric Infrastructure Modernization Plan
The TDSIC plan is an initiative to modernize infrastructure through upgrades to the NIPSCO electric and natural gas delivery systems. The Commission issued its Order in Cause No. 44733 on July 12, 2016 approving NIPSCO’s 7-Year Electric TDSIC Plan (2016-2022). NIPSCO terminated this 7-Year Electric Plan effective May 31, 2021, and filed a new Electric Plan on June 1, 2021 in Cause No. 45557.84 NIPSCO’s Electric TDSIC Plan, which runs from 2021 through 2026, is focused on transmission and distribution investments made for safety, reliability, and system modernization. The Plan also makes provision for appropriate economic development projects in the future, although none are proposed at this time.
NIPSCO’s Electric TDSIC Plan includes necessary investments that enable NIPSCO to continue providing safe, reliable electric service to its customers into the future. The Plan is comprised of three main segments: (1) investments that target replacement of aging assets (Aging Infrastructure); (2) investments intended to maintain the reliability of NIPSCO’s electric system to deliver power to customers when they need it (System Deliverability); and (3) investments to modernize NIPSCO’s communications and AMI technologies (Grid Modernization).
84 As of the submission of this 2021 IRP, NIPSCO’s proposed TDSIC Plan was pending before the Commission.
Northern Indiana Public Service Company LLC
148
6.2 Distribution System Planning
NIPSCO’s distribution system is reviewed for local circuit, substation and source feed adequacy. Normal operating status as well as single element or contingency failure loading and voltage operating characteristics are evaluated along with circuit and system wide reliability metrics (i.e., CAIDI, SAIDI, SAIFI).85 Distribution operating and design criteria rely on NIPSCO design thresholds in accordance with Company Standards, Distribution Systems Planning Criteria, and equipment manufacturer ratings. Voltage operating criteria are based on American National Standards Institute (ANSI) C84.1 and Indiana Administrative Code 170 IAC 4-1-20.
System improvement plans are developed and applied based upon mitigation of identified deficiencies associated with service capacity, service voltage, reliability levels, and load growth patterns. Specific and trending distribution component failures are mitigated through capital and infrastructure improvement processes. Infrastructure upgrade and replacement activities consider system characteristics including severity of operating deficiencies, likelihood of failure, potential customer impact, current substation and line topology, and equipment age and condition. Available new technologies are integrated into improvement and replacement activities where appropriate.
Net metering is an electricity policy for consumers who own renewable (solar, wind, biomass) energy facilities. Its application provides an incentive for customers to install renewable energy systems and generate electricity to offset their individual usage each month. If a participant produces more electricity than they use on a monthly basis, the customer can receive energy credits worth their utility retail rate for their excess generation that can be applied to future usage. The Net Metering program is ending for new customer applications for non-residential customers as of October 1, 2021 and for residential customers as of July 1, 2022. As new customers seek to interconnect after the Net Metering end dates the EDG, currently pending with the Commission in Cause No. 45505, will be made available to customers interested in interconnecting if approved by the Commission.
The renewable feed-in tariff (renewable energy payments) is another policy mechanism designed to encourage the adoption of renewable energy sources and helped accelerate the move toward renewable energy sources. The tariff provides power developers with a predictable purchase price for self-generation under a long-term power purchase arrangement, which helps support financing opportunities for these types of projects. The micro solar, micro wind, intermediate wind, and biomass capacity are not fully subscribed and applications are still being accepted. The intermediate solar category is closed and no longer accepting applications.
NIPSCO implemented its renewable feed-in tariff in July 2011 along with its existing net metering program. These programs helped introduce customer-owned renewable resource based generation onto NIPSCO’s electric distribution system. The feed-in tariff program began to attract 85 CAIDI is the Customer Average Interruption Duration Index and represents the average time of an outage during the year. SAIFI is the System Average Interruption Frequency Index and represents the average number of times that a system customer experiences an outage during the year. SAIDI is the System Average Interruption Duration Index and represents the number of minutes a utility’s average customer did not have power during the year.
Northern Indiana Public Service Company LLC
149
a significant amount of renewable generation projects which began coming “on line” in 2012 and has continued to grow. NIPSCO’s net metering, feed-in tariff, and pending EDG tariff generation interconnection programs provide, or will provide, an incentive and path for customers to integrate their own distributed generation resources into NIPSCO’s electric distribution systems. Solar, wind, and biomass fueled generation resources have been deployed by customers in varying amounts across the service territory.
By the end of 2020, renewable generation data identified 30.4 MWs associated with the net metering program and 36.1 MWs of generation associated with the feed-in tariff program. An aggregate breakdown by renewable fuel type is provided below. These values represent generation resources that include landfill gas combustion engines, animal waste gas combustion engines, photovoltaic solar array farms, small roof mounted and ground mounted residential solar arrays, intermediate sized commercial wind turbines, and small commercial and residential wind turbines.
Net Metering Generation:
28.2 MWs - Solar Generation
1.9 MWs - Wind Generation
0.3 MWs - Solar/Wind Combination Generation
Feed-In Tariff Generation:
21.6 MWs - Solar Generation
0.2 MWs - Wind Generation
14.3 MWs - Biomass Generation
The above biomass related generation value excludes 13.6 MWs of existing landfill based generation interconnected to NIPSCO’s distribution system. Although these renewable generation sources feed into NIPSCO’s network, the power deliveries are associated with customer PPAs with parties other than NIPSCO. These customers do not participate in NIPSCO’s net metering or feed-in tariff programs. In total, approximately 80 MWs of generation is interconnected to NIPSCO’s distribution system.
Long term system performance evaluations associated with customer generation continue to evolve as generation penetration levels increase. Performance concerns continue to be associated with adequate control of voltage on distribution primary systems. As larger customer owned generation is added or multiples of mid to large unit are introduced on common circuits, control of voltage levels at remote locations becomes more challenging under normal operating conditions, much less under abnormal operating conditions. Overall, impacts on system operations has yet to be fully determined and will depend upon the demonstrated long term performance and reliability of various installed generating resources including solar, wind, and biomass based generation fueled resources. Differences in operational characteristics, generation penetration,
Northern Indiana Public Service Company LLC
150
power delivery timing, and location all affect the relative impact on local distribution system operations at any given time.
The diverse types of customer-owned generation also have varying effects on the electric system. NIPSCO has observed that local generation most often varies substantially depending upon individual customer equipment, generation size, and generation input resources. Fuel resource type affects power delivery in various ways depending upon owner controlled resources as is the case of landfill and animal by-product gas inputs, or external environmental conditions such as wind velocity and solar irradiance. Highly variable outputs have been observed to occur on both solar and wind turbine installations. For instance, rapid changes in solar generation have exhibited swings of 85% of full rated output, within seconds. These conditions represent sizable down-up-down shifts in system operating characteristic on local circuits associated with some of the larger half MW or greater rated customer owned solar fields. These swings can present challenges to maintaining appropriate service voltage stability on distribution circuits. In addition to these more rapid changes relating to industry recognized “cloud affect,”
NIPSCO has also observed that more widespread weather patterns such as seasonal rain or snow storms also dramatically influence individual daily peak PV generation outputs on a longer term scale. Longer duration output reductions of 75% to 95% of rated equipment output have been observed during seasonal inclement weather conditions. Significantly reduced output levels can extend over several or more days, especially during winter season months. Wind powered generation was also observed to be as much, if not more, unpredictable and variable in power delivered to the distribution system. However, this has had less impact on NIPSCO distribution systems in recent years because little activity has occurred associated with small scale wind generation. On the other hand, large biomass fueled combustion turbines continue to be less volatile in generated outputs in comparison to solar and wind associated generation. Landfill based biomass generation facilities tend to be the most predictable followed by animal waste gas associated generation. However, even though biomass fueled resources exhibit a steadier dispatch of power, random events still occur where large customer generation drops off completely. The impact of lost generation becomes more significant with larger individual generators since local distribution systems need to adjust to compensate for fast changes in power resources. NIPSCO has also observed a trend with older large biomass (landfill) generation resources where output decreases with age of the landfill itself and associated generation equipment. 25% to 50% reductions in output have been observed at several sites.
Based upon past distribution system operating history associated with installed renewable generation resources, these technologies present a recognized energy resource that can be utilized to successfully supplement customer electric energy needs. However, their impact on local electric distribution infrastructure has not demonstrated to be sufficiently available to be considered an adequate substitute for NIPSCO’s local electric resources in reliably meeting electric capacity and service needs for its customers. Considering that distributed generation resources have no obligation for power deliverability, operate in a “take it as you make it” mode, and can cease operations at any time for whatever reason, all lead to the lower confidence level regarding availability of power supply, especially during periods of system stress or problems. Consequently, continued traditional capital investment into local distribution infrastructure is necessary to insure that the utility can meet all service obligations to its customers.
Northern Indiana Public Service Company LLC
151
6.2.1 Evolving Technologies and System Capabilities
NIPSCO continues the expansion of its distribution SCADA systems, improve its DA systems, and apply other new technologies.
NIPSCO’s application of SCADA on distribution substations has undergone expansion, resulting in an increase in coverage from 25% to its current level of 43% of all associated stations. Distribution circuit coverage stands at approximately 48% of all circuits. As part of its ongoing infrastructure improvement programs, new, as well as rebuilt distribution substations, and their associated circuits, are assessed for the application of SCADA and DA in their scope and construction. New station projects, as well as full or partial station rebuild projects are currently being implemented at a rate of approximately five or more per year. Based on continuation of these activities, further expansion of NIPSCO’s substation SCADA and DA systems are anticipated to continue.
NIPSCO initiated a new program for technology upgrades on existing control schemes and systems associated with its legacy DA systems. The original DA systems at NIPSCO date back to as early as the 1990’s. Older system control schemes and equipment are scheduled to be upgraded to new SEL distribution network automation control systems. These new systems feature automatic network reconfiguration and self-healing actions using algorithms that provide more flexibility and higher levels of reliability. They allow much greater levels of customization of settings and flexibility to fit specific operating conditions. The newer DA automated systems will further enhance how the system determines the best path forward when recognizing faults and restoring customer services. Application of these newer DA control schemes are anticipated to further reduce the amount of permanent outages seen by customers, resulting in improvements in SAIDI and SAIFI metrics. In addition to the above operational improvements, the new systems also provide an opportunity for scaling (expansion) of DA systems that did not exist prior due to previous limitations on the older technologies.
In 2020, NIPSCO initiated the roll out of it new “trip saver” program for the application of more advanced types of local distribution line protection. This program applies new state of the art automated line reclosers. These newer devices are being applied throughout NIPSCO’s territory to better handle temporary line faults. This equipment is applied and mounted in place of typical line fuses, and combines the best aspects of fuse-saving and fuse-blowing strategies to improve overall system reliability and prevent temporary faults from becoming sustained outages. Application of these devices will reduce the amount of permanent outages seen by customers resulting in improvements in SAIDI and SAIFI metrics. New equipment is being applied to replace older technologies such as “triple-shot” fuse installations and older traditional hydraulic reclosers.
NIPSCO continues to evaluate the benefits of emerging smart grid, DA, and other applicable technologies and to assess their deployment based upon corporate investment strategies in infrastructure as part of its long term approach.
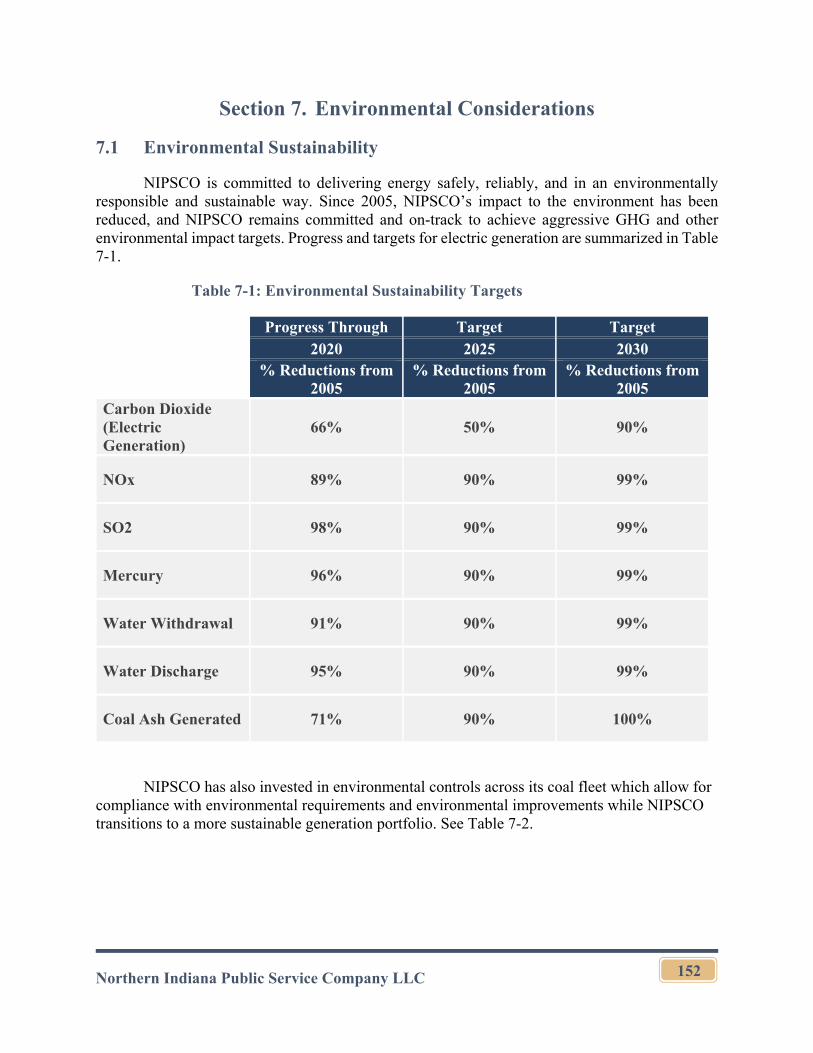
Northern Indiana Public Service Company LLC
152
Section 7. Environmental Considerations
7.1 Environmental Sustainability
NIPSCO is committed to delivering energy safely, reliably, and in an environmentally responsible and sustainable way. Since 2005, NIPSCO’s impact to the environment has been reduced, and NIPSCO remains committed and on-track to achieve aggressive GHG and other environmental impact targets. Progress and targets for electric generation are summarized in Table 7-1.
Table 7-1: Environmental Sustainability Targets
Progress Through Target Target 2020 2025 2030
% Reductions from 2005
% Reductions from 2005
% Reductions from 2005
Carbon Dioxide (Electric Generation)
66% 50% 90%
NOx 89% 90% 99%
SO2 98% 90% 99%
Mercury 96% 90% 99%
Water Withdrawal 91% 90% 99%
Water Discharge 95% 90% 99%
Coal Ash Generated 71% 90% 100%
NIPSCO has also invested in environmental controls across its coal fleet which allow for compliance with environmental requirements and environmental improvements while NIPSCO transitions to a more sustainable generation portfolio. See Table 7-2.
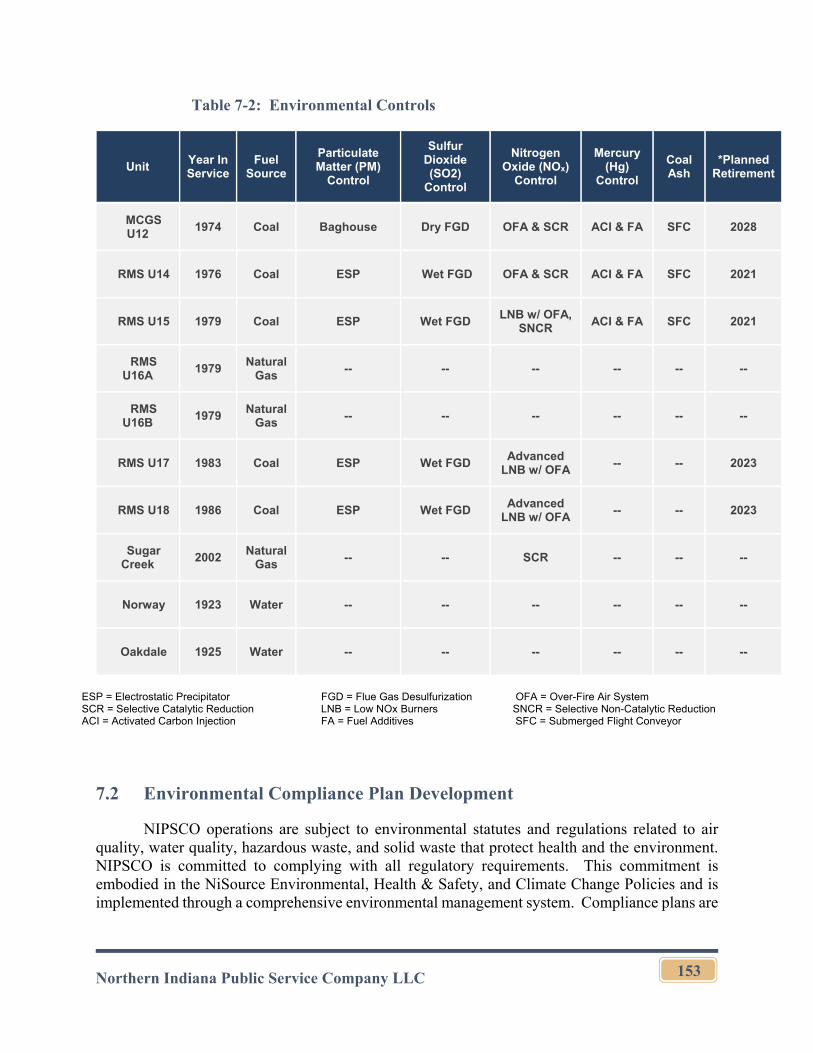
Northern Indiana Public Service Company LLC
153
Table 7-2: Environmental Controls
Unit Year In Service
Fuel Source
Particulate Matter (PM)
Control
Sulfur Dioxide (SO2)
Control
Nitrogen Oxide (NOx)
Control
Mercury (Hg)
Control
Coal Ash
*Planned Retirement
MCGS U12
1974 Coal Baghouse Dry FGD OFA & SCR ACI & FA SFC 2028
RMS U14 1976 Coal ESP Wet FGD OFA & SCR ACI & FA SFC 2021
RMS U15 1979 Coal ESP Wet FGD LNB w/ OFA,
SNCR ACI & FA SFC 2021
RMS U16A
1979 Natural
Gas -- -- -- -- -- --
RMS U16B
1979 Natural
Gas -- -- -- -- -- --
RMS U17 1983 Coal ESP Wet FGD Advanced
LNB w/ OFA -- -- 2023
RMS U18 1986 Coal ESP Wet FGD Advanced
LNB w/ OFA -- -- 2023
Sugar Creek
2002 Natural
Gas -- -- SCR -- -- --
Norway 1923 Water -- -- -- -- -- --
Oakdale 1925 Water -- -- -- -- -- --
7.2 Environmental Compliance Plan Development
NIPSCO operations are subject to environmental statutes and regulations related to air quality, water quality, hazardous waste, and solid waste that protect health and the environment. NIPSCO is committed to complying with all regulatory requirements. This commitment is embodied in the NiSource Environmental, Health & Safety, and Climate Change Policies and is implemented through a comprehensive environmental management system. Compliance plans are
ESP = Electrostatic Precipitator FGD = Flue Gas Desulfurization OFA = Over-Fire Air System SCR = Selective Catalytic Reduction LNB = Low NOx Burners SNCR = Selective Non-Catalytic Reduction ACI = Activated Carbon Injection FA = Fuel Additives SFC = Submerged Flight Conveyor
Northern Indiana Public Service Company LLC
154
developed, reviewed, and evaluated for implementation to meet new and changing legislative and regulatory developments.
7.3 Environmental Regulations
7.3.1 Solid Waste Management
The EPA finalized a rule regulating the management and disposal of the CCR which became effective on October 19, 2015. The CCR rule regulates CCRs under the RCRA Subtitle D as nonhazardous. The CCR rule is implemented in phases establishing requirements related to groundwater monitoring, CCR management and disposal, reporting, recordkeeping, and document management.86 The rule allows NIPSCO to continue its byproduct beneficial use program, significantly reducing CCR that must be disposed.
To comply with the rule, NIPSCO completed capital expenditures in 2019 to modify its infrastructure and manage CCRs. NIPSCO continues to assess and monitor groundwater quality at its generating stations to comply with CCR rule requirements and to determine if historic CCR management and disposal practices will require corrective measures.
7.3.2 Clean Water Act
The CWA establishes water quality standards for surface waters as well as a permit program for regulating discharges into the waters of the United States. Under the CWA, EPA created a program to establish wastewater discharge standards for industry, including electric utilities. In addition, the CWA made it unlawful to discharge from a point source into navigable waters without a permit. The NPDES permit program implements the CWA’s provisions.
7.3.3 Effluent Limitations Guidelines
EPA first promulgated the ELG Rule in 1974, and has amended the regulation many times, with the latest revision effective date of December 14, 2020. The ELG Rule regulates wastewater discharges from power plants operating as utilities. The implementing requirements are incorporated into NPDES permits. Significant capital expenditure is not required for NIPSCO to comply with the ELG Rule given the expected retirement dates of the coal units at Schahfer, and the dry FGD and CCR-related investments at Michigan City.
7.3.4 Clean Air Act
NIPSCO emissions of nitrogen oxides of NOx, SO2, and mercury have been reduced by nearly 90% since 2005. All Northern Indiana counties are in attainment of the NAAQS with the exception of the ozone standards in Lake and Porter Counties, which are included in Chicago metropolitan area nonattainment.
86 https://www.nipsco.com/about-us/ccr-rule-compliance-data-information
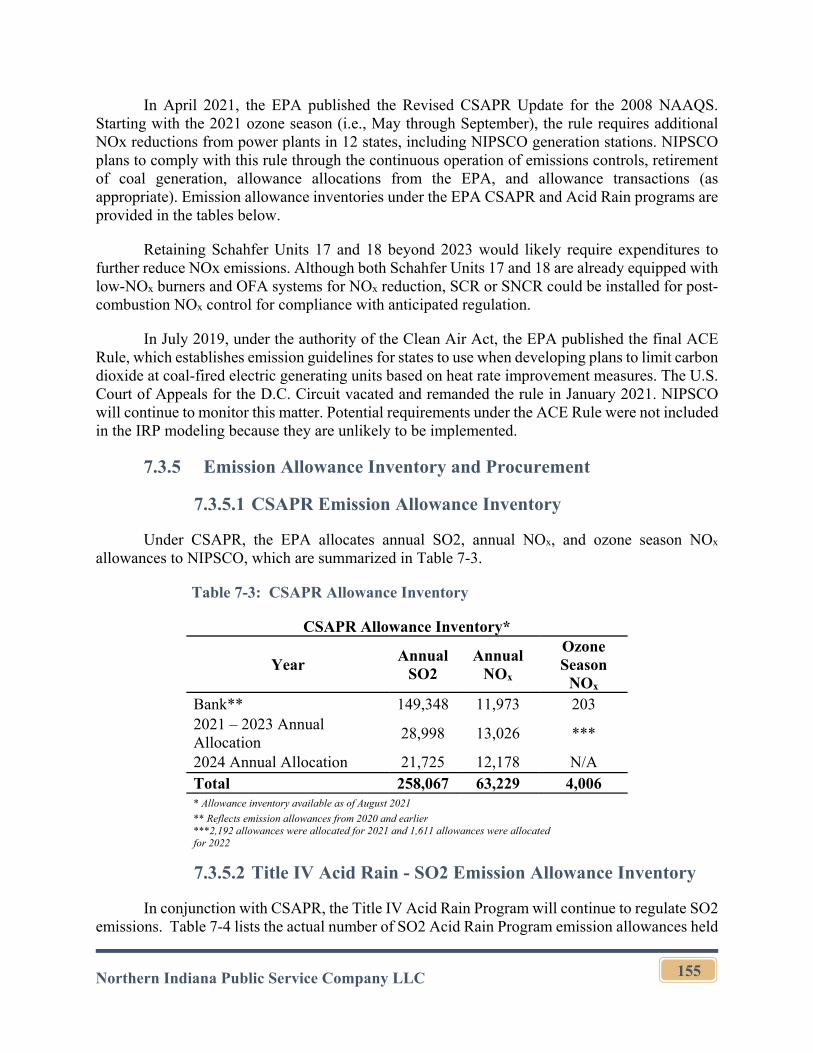
Northern Indiana Public Service Company LLC
155
In April 2021, the EPA published the Revised CSAPR Update for the 2008 NAAQS. Starting with the 2021 ozone season (i.e., May through September), the rule requires additional NOx reductions from power plants in 12 states, including NIPSCO generation stations. NIPSCO plans to comply with this rule through the continuous operation of emissions controls, retirement of coal generation, allowance allocations from the EPA, and allowance transactions (as appropriate). Emission allowance inventories under the EPA CSAPR and Acid Rain programs are provided in the tables below.
Retaining Schahfer Units 17 and 18 beyond 2023 would likely require expenditures to further reduce NOx emissions. Although both Schahfer Units 17 and 18 are already equipped with low-NOx burners and OFA systems for NOx reduction, SCR or SNCR could be installed for post-combustion NOx control for compliance with anticipated regulation.
In July 2019, under the authority of the Clean Air Act, the EPA published the final ACE Rule, which establishes emission guidelines for states to use when developing plans to limit carbon dioxide at coal-fired electric generating units based on heat rate improvement measures. The U.S. Court of Appeals for the D.C. Circuit vacated and remanded the rule in January 2021. NIPSCO will continue to monitor this matter. Potential requirements under the ACE Rule were not included in the IRP modeling because they are unlikely to be implemented.
7.3.5 Emission Allowance Inventory and Procurement
7.3.5.1 CSAPR Emission Allowance Inventory
Under CSAPR, the EPA allocates annual SO2, annual NOx, and ozone season NOx allowances to NIPSCO, which are summarized in Table 7-3.
Table 7-3: CSAPR Allowance Inventory
CSAPR Allowance Inventory*
Year Annual
SO2 Annual
NOx
Ozone Season
NOx Bank** 149,348 11,973 203 2021 – 2023 Annual Allocation
28,998 13,026 ***
2024 Annual Allocation 21,725 12,178 N/A Total 258,067 63,229 4,006 * Allowance inventory available as of August 2021
** Reflects emission allowances from 2020 and earlier ***2,192 allowances were allocated for 2021 and 1,611 allowances were allocated for 2022
7.3.5.2 Title IV Acid Rain - SO2 Emission Allowance Inventory
In conjunction with CSAPR, the Title IV Acid Rain Program will continue to regulate SO2 emissions. Table 7-4 lists the actual number of SO2 Acid Rain Program emission allowances held
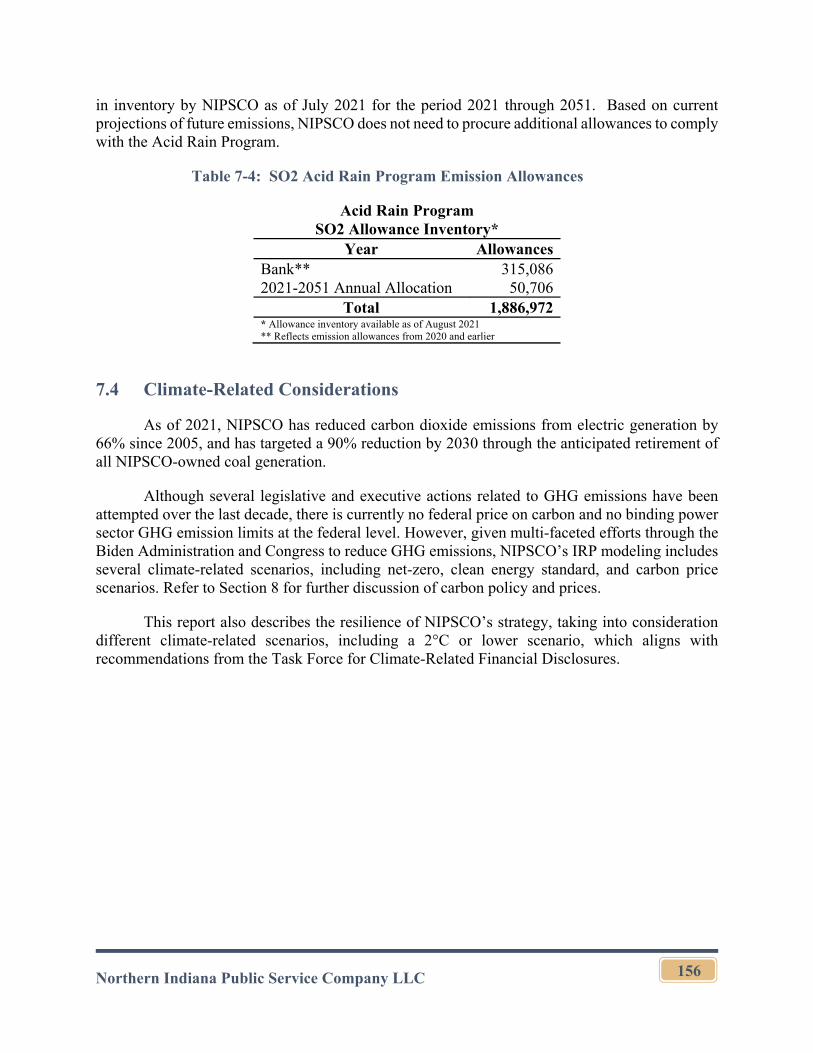
Northern Indiana Public Service Company LLC
156
in inventory by NIPSCO as of July 2021 for the period 2021 through 2051. Based on current projections of future emissions, NIPSCO does not need to procure additional allowances to comply with the Acid Rain Program.
Table 7-4: SO2 Acid Rain Program Emission Allowances
Acid Rain Program SO2 Allowance Inventory*
Year Allowances Bank** 315,086 2021-2051 Annual Allocation 50,706
Total 1,886,972 * Allowance inventory available as of August 2021 ** Reflects emission allowances from 2020 and earlier
7.4 Climate-Related Considerations
As of 2021, NIPSCO has reduced carbon dioxide emissions from electric generation by 66% since 2005, and has targeted a 90% reduction by 2030 through the anticipated retirement of all NIPSCO-owned coal generation.
Although several legislative and executive actions related to GHG emissions have been attempted over the last decade, there is currently no federal price on carbon and no binding power sector GHG emission limits at the federal level. However, given multi-faceted efforts through the Biden Administration and Congress to reduce GHG emissions, NIPSCO’s IRP modeling includes several climate-related scenarios, including net-zero, clean energy standard, and carbon price scenarios. Refer to Section 8 for further discussion of carbon policy and prices.
This report also describes the resilience of NIPSCO’s strategy, taking into consideration different climate-related scenarios, including a 2°C or lower scenario, which aligns with recommendations from the Task Force for Climate-Related Financial Disclosures.
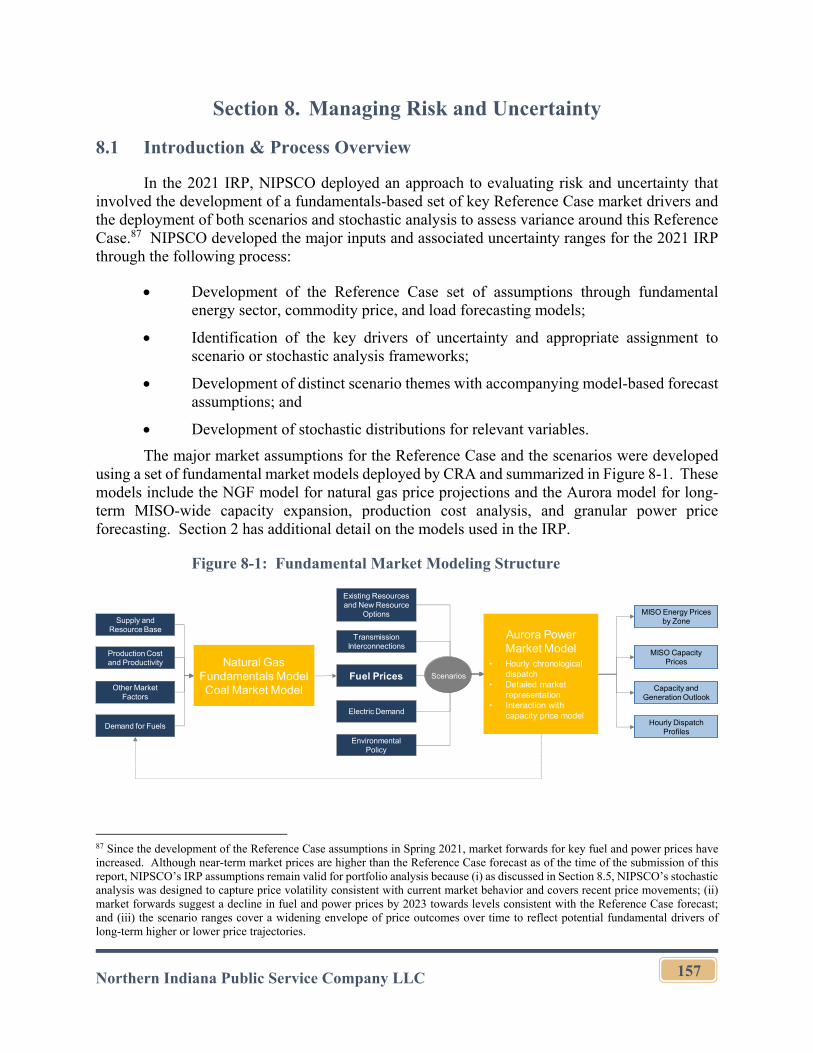
Northern Indiana Public Service Company LLC
157
Section 8. Managing Risk and Uncertainty
8.1 Introduction & Process Overview
In the 2021 IRP, NIPSCO deployed an approach to evaluating risk and uncertainty that involved the development of a fundamentals-based set of key Reference Case market drivers and the deployment of both scenarios and stochastic analysis to assess variance around this Reference Case.87 NIPSCO developed the major inputs and associated uncertainty ranges for the 2021 IRP through the following process:
Development of the Reference Case set of assumptions through fundamental energy sector, commodity price, and load forecasting models;
Identification of the key drivers of uncertainty and appropriate assignment to scenario or stochastic analysis frameworks;
Development of distinct scenario themes with accompanying model-based forecast assumptions; and
Development of stochastic distributions for relevant variables.
The major market assumptions for the Reference Case and the scenarios were developed using a set of fundamental market models deployed by CRA and summarized in Figure 8-1. These models include the NGF model for natural gas price projections and the Aurora model for long-term MISO-wide capacity expansion, production cost analysis, and granular power price forecasting. Section 2 has additional detail on the models used in the IRP.
Figure 8-1: Fundamental Market Modeling Structure
87 Since the development of the Reference Case assumptions in Spring 2021, market forwards for key fuel and power prices have increased. Although near-term market prices are higher than the Reference Case forecast as of the time of the submission of this report, NIPSCO’s IRP assumptions remain valid for portfolio analysis because (i) as discussed in Section 8.5, NIPSCO’s stochastic analysis was designed to capture price volatility consistent with current market behavior and covers recent price movements; (ii) market forwards suggest a decline in fuel and power prices by 2023 towards levels consistent with the Reference Case forecast; and (iii) the scenario ranges cover a widening envelope of price outcomes over time to reflect potential fundamental drivers of long-term higher or lower price trajectories.
Existing Resources and New Resource
Options
Fuel Prices
Transmission Interconnections
Electric Demand
Environmental Policy
MISO Energy Prices by Zone
Hourly Dispatch Profiles
MISO Capacity Prices
Aurora
Scenarios
Capacity and Generation Outlook
Natural Gas Fundamentals ModelCoal Market Model
Supply and Resource Base
Production Cost and Productivity
Other Market Factors
Demand for Fuels
Aurora Power Market Model
• Hourly chronological dispatch
• Detailed market representation
• Interaction with capacity price model
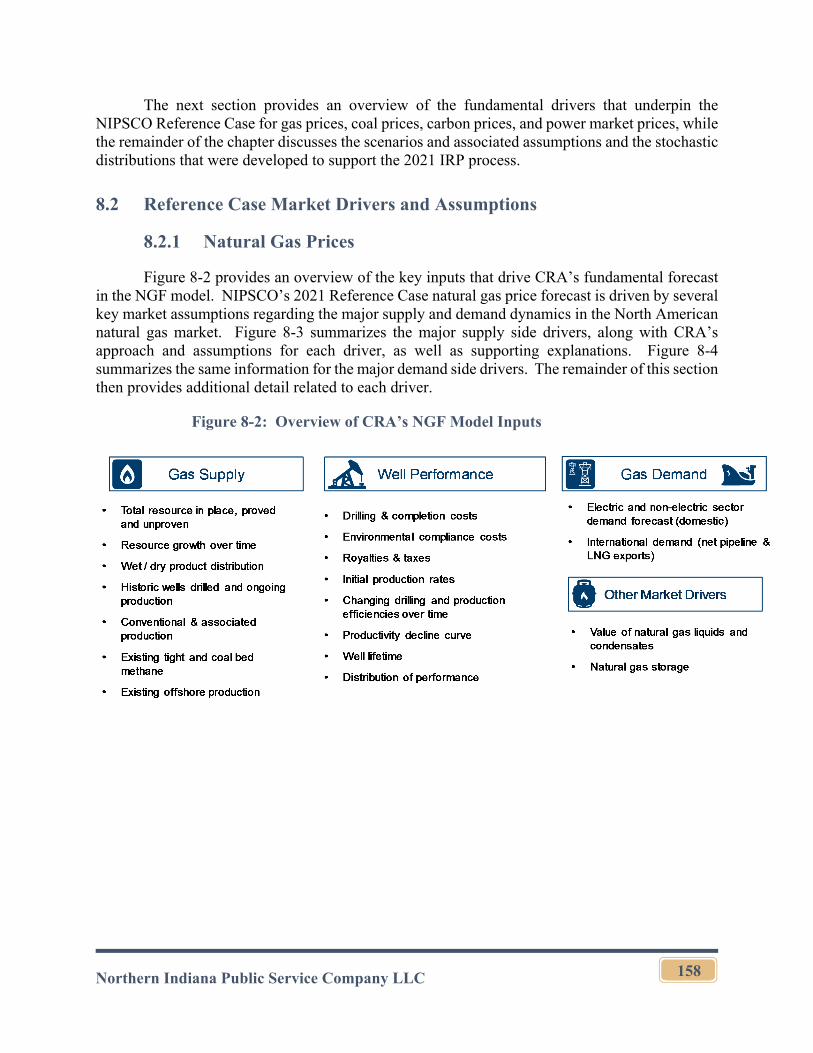
Northern Indiana Public Service Company LLC
158
The next section provides an overview of the fundamental drivers that underpin the NIPSCO Reference Case for gas prices, coal prices, carbon prices, and power market prices, while the remainder of the chapter discusses the scenarios and associated assumptions and the stochastic distributions that were developed to support the 2021 IRP process.
8.2 Reference Case Market Drivers and Assumptions
8.2.1 Natural Gas Prices
Figure 8-2 provides an overview of the key inputs that drive CRA’s fundamental forecast in the NGF model. NIPSCO’s 2021 Reference Case natural gas price forecast is driven by several key market assumptions regarding the major supply and demand dynamics in the North American natural gas market. Figure 8-3 summarizes the major supply side drivers, along with CRA’s approach and assumptions for each driver, as well as supporting explanations. Figure 8-4 summarizes the same information for the major demand side drivers. The remainder of this section then provides additional detail related to each driver.
Figure 8-2: Overview of CRA’s NGF Model Inputs
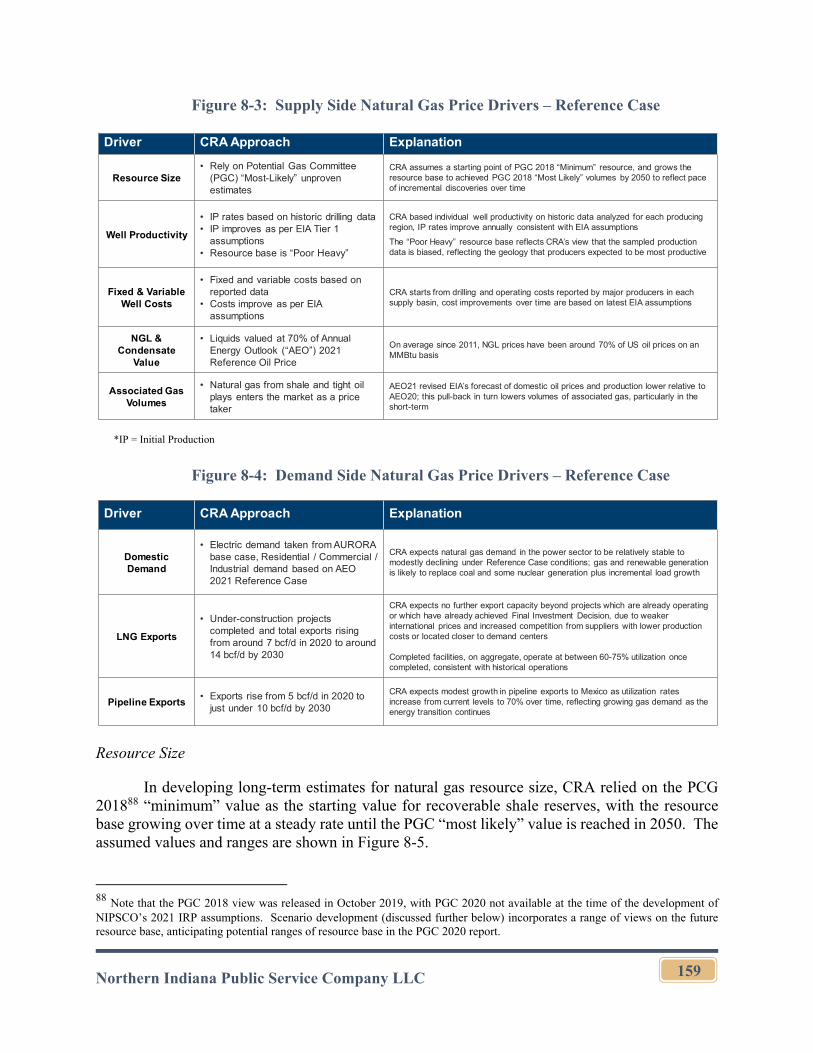
Northern Indiana Public Service Company LLC
159
Figure 8-3: Supply Side Natural Gas Price Drivers – Reference Case
*IP = Initial Production
Figure 8-4: Demand Side Natural Gas Price Drivers – Reference Case
Resource Size
In developing long-term estimates for natural gas resource size, CRA relied on the PCG 201888 “minimum” value as the starting value for recoverable shale reserves, with the resource base growing over time at a steady rate until the PGC “most likely” value is reached in 2050. The assumed values and ranges are shown in Figure 8-5.
88 Note that the PGC 2018 view was released in October 2019, with PGC 2020 not available at the time of the development of NIPSCO’s 2021 IRP assumptions. Scenario development (discussed further below) incorporates a range of views on the future resource base, anticipating potential ranges of resource base in the PGC 2020 report.
Driver CRA Approach Explanation
Resource Size• Rely on Potential Gas Committee
(PGC) “Most-Likely” unproven estimates
CRA assumes a starting point of PGC 2018 “Minimum” resource, and grows the resource base to achieved PGC 2018 “Most Likely” volumes by 2050 to reflect pace of incremental discoveries over time
Well Productivity
• IP rates based on historic drilling data• IP improves as per EIA Tier 1
assumptions• Resource base is “Poor Heavy”
CRA based individual well productivity on historic data analyzed for each producing region, IP rates improve annually consistent with EIA assumptions
The “Poor Heavy” resource base reflects CRA’s view that the sampled production data is biased, reflecting the geology that producers expected to be most productive
Fixed & Variable Well Costs
• Fixed and variable costs based on reported data
• Costs improve as per EIA assumptions
CRA starts from drilling and operating costs reported by major producers in each supply basin, cost improvements over time are based on latest EIA assumptions
NGL & Condensate
Value
• Liquids valued at 70% of Annual Energy Outlook (“AEO”) 2021 Reference Oil Price
On average since 2011, NGL prices have been around 70% of US oil prices on an MMBtu basis
Associated Gas Volumes
• Natural gas from shale and tight oil plays enters the market as a price taker
AEO21 revised EIA’s forecast of domestic oil prices and production lower relative to AEO20; this pull-back in turn lowers volumes of associated gas, particularly in the short-term
Driver CRA Approach Explanation
Domestic Demand
• Electric demand taken from AURORA base case, Residential / Commercial / Industrial demand based on AEO 2021 Reference Case
CRA expects natural gas demand in the power sector to be relatively stable to modestly declining under Reference Case conditions; gas and renewable generation is likely to replace coal and some nuclear generation plus incremental load growth
LNG Exports
• Under-construction projects completed and total exports rising from around 7 bcf/d in 2020 to around 14 bcf/d by 2030
CRA expects no further export capacity beyond projects which are already operating or which have already achieved Final Investment Decision, due to weaker international prices and increased competition from suppliers with lower production costs or located closer to demand centers
Completed facilities, on aggregate, operate at between 60-75% utilization once completed, consistent with historical operations
Pipeline Exports• Exports rise from 5 bcf/d in 2020 to
just under 10 bcf/d by 2030
CRA expects modest growth in pipeline exports to Mexico as utilization rates increase from current levels to 70% over time, reflecting growing gas demand as the energy transition continues
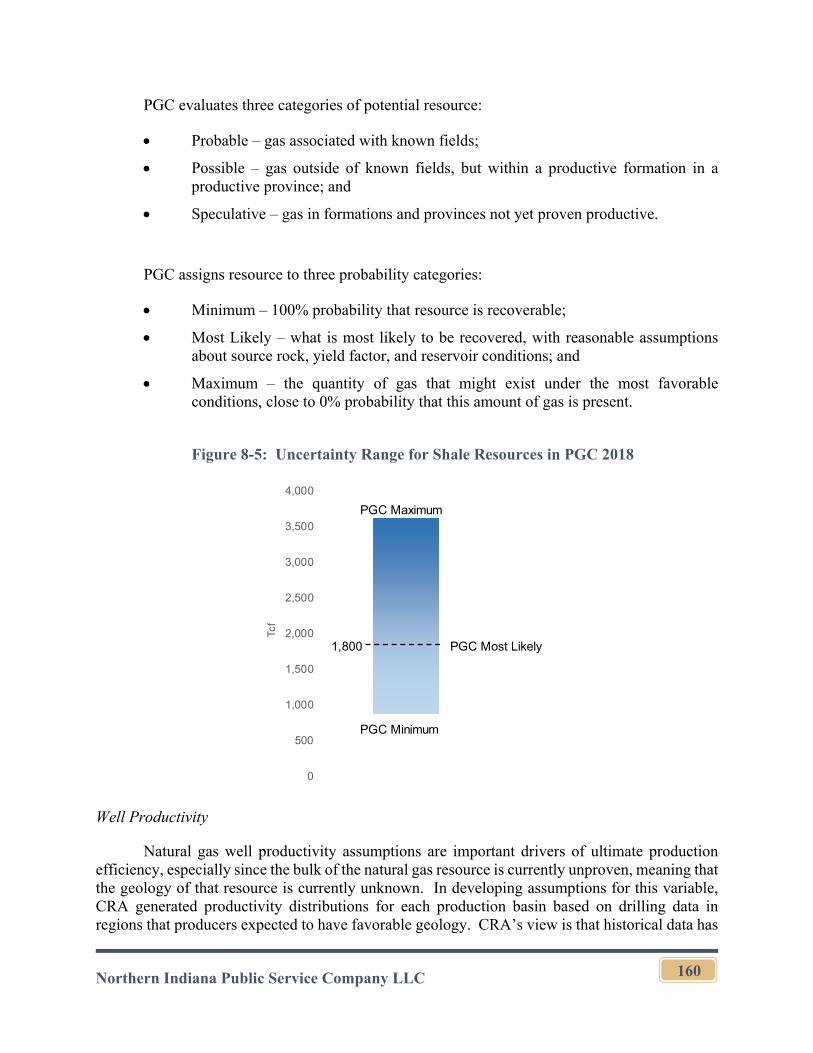
Northern Indiana Public Service Company LLC
160
PGC evaluates three categories of potential resource:
Probable – gas associated with known fields;
Possible – gas outside of known fields, but within a productive formation in a productive province; and
Speculative – gas in formations and provinces not yet proven productive.
PGC assigns resource to three probability categories:
Minimum – 100% probability that resource is recoverable;
Most Likely – what is most likely to be recovered, with reasonable assumptions about source rock, yield factor, and reservoir conditions; and
Maximum – the quantity of gas that might exist under the most favorable conditions, close to 0% probability that this amount of gas is present.
Figure 8-5: Uncertainty Range for Shale Resources in PGC 2018
Well Productivity
Natural gas well productivity assumptions are important drivers of ultimate production efficiency, especially since the bulk of the natural gas resource is currently unproven, meaning that the geology of that resource is currently unknown. In developing assumptions for this variable, CRA generated productivity distributions for each production basin based on drilling data in regions that producers expected to have favorable geology. CRA’s view is that historical data has
0
500
1,000
1,500
2,000
2,500
3,000
3,500
4,000
Tcf
1,800
PGC Maximum
PGC Minimum
PGC Most Likely
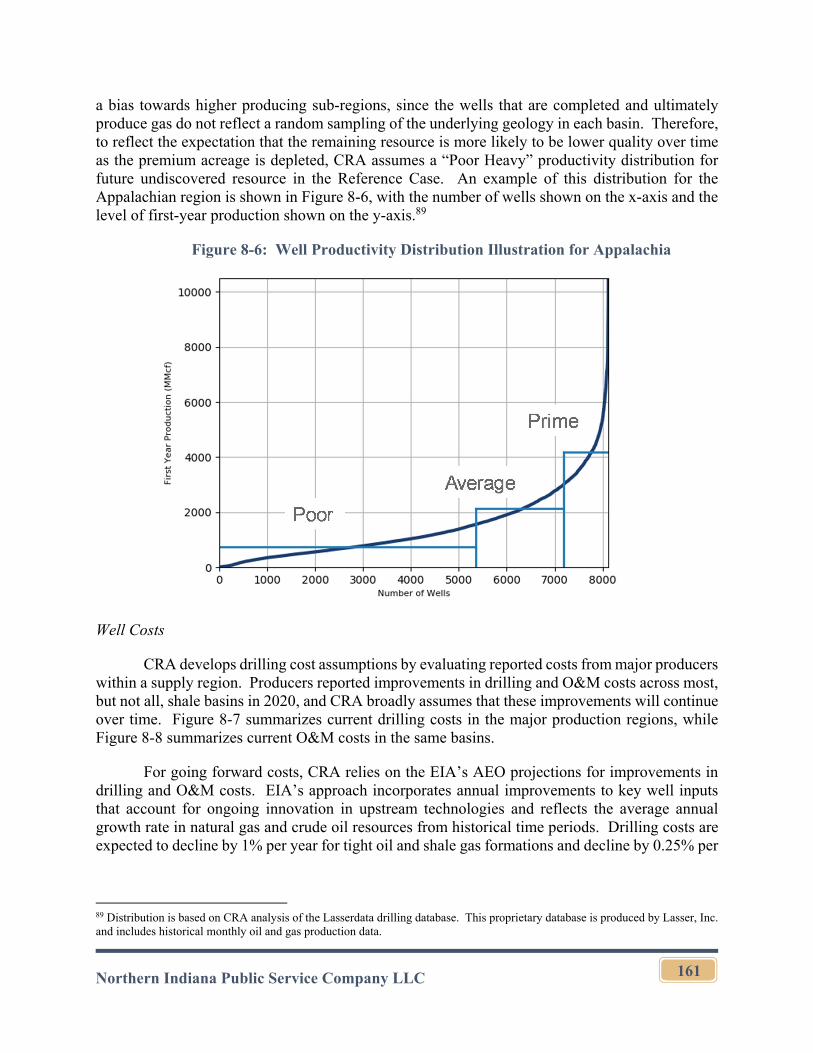
Northern Indiana Public Service Company LLC
161
a bias towards higher producing sub-regions, since the wells that are completed and ultimately produce gas do not reflect a random sampling of the underlying geology in each basin. Therefore, to reflect the expectation that the remaining resource is more likely to be lower quality over time as the premium acreage is depleted, CRA assumes a “Poor Heavy” productivity distribution for future undiscovered resource in the Reference Case. An example of this distribution for the Appalachian region is shown in Figure 8-6, with the number of wells shown on the x-axis and the level of first-year production shown on the y-axis.89
Figure 8-6: Well Productivity Distribution Illustration for Appalachia
Well Costs
CRA develops drilling cost assumptions by evaluating reported costs from major producers within a supply region. Producers reported improvements in drilling and O&M costs across most, but not all, shale basins in 2020, and CRA broadly assumes that these improvements will continue over time. Figure 8-7 summarizes current drilling costs in the major production regions, while Figure 8-8 summarizes current O&M costs in the same basins.
For going forward costs, CRA relies on the EIA’s AEO projections for improvements in drilling and O&M costs. EIA’s approach incorporates annual improvements to key well inputs that account for ongoing innovation in upstream technologies and reflects the average annual growth rate in natural gas and crude oil resources from historical time periods. Drilling costs are expected to decline by 1% per year for tight oil and shale gas formations and decline by 0.25% per
89 Distribution is based on CRA analysis of the Lasserdata drilling database. This proprietary database is produced by Lasser, Inc. and includes historical monthly oil and gas production data.
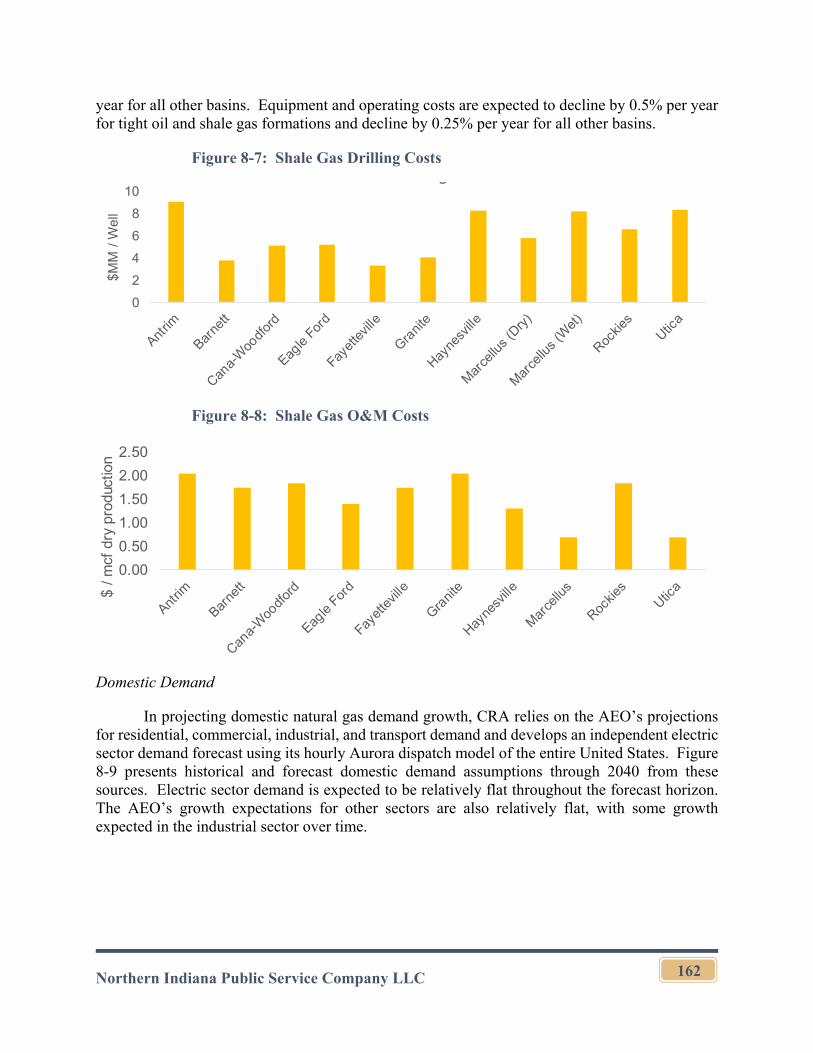
Northern Indiana Public Service Company LLC
162
year for all other basins. Equipment and operating costs are expected to decline by 0.5% per year for tight oil and shale gas formations and decline by 0.25% per year for all other basins.
Figure 8-7: Shale Gas Drilling Costs
Figure 8-8: Shale Gas O&M Costs
Domestic Demand
In projecting domestic natural gas demand growth, CRA relies on the AEO’s projections for residential, commercial, industrial, and transport demand and develops an independent electric sector demand forecast using its hourly Aurora dispatch model of the entire United States. Figure 8-9 presents historical and forecast domestic demand assumptions through 2040 from these sources. Electric sector demand is expected to be relatively flat throughout the forecast horizon. The AEO’s growth expectations for other sectors are also relatively flat, with some growth expected in the industrial sector over time.
0
2
4
6
8
10
$MM
/ W
ell
g
0.00
0.50
1.00
1.50
2.00
2.50
$ / m
cf d
ry p
rodu
ctio
n
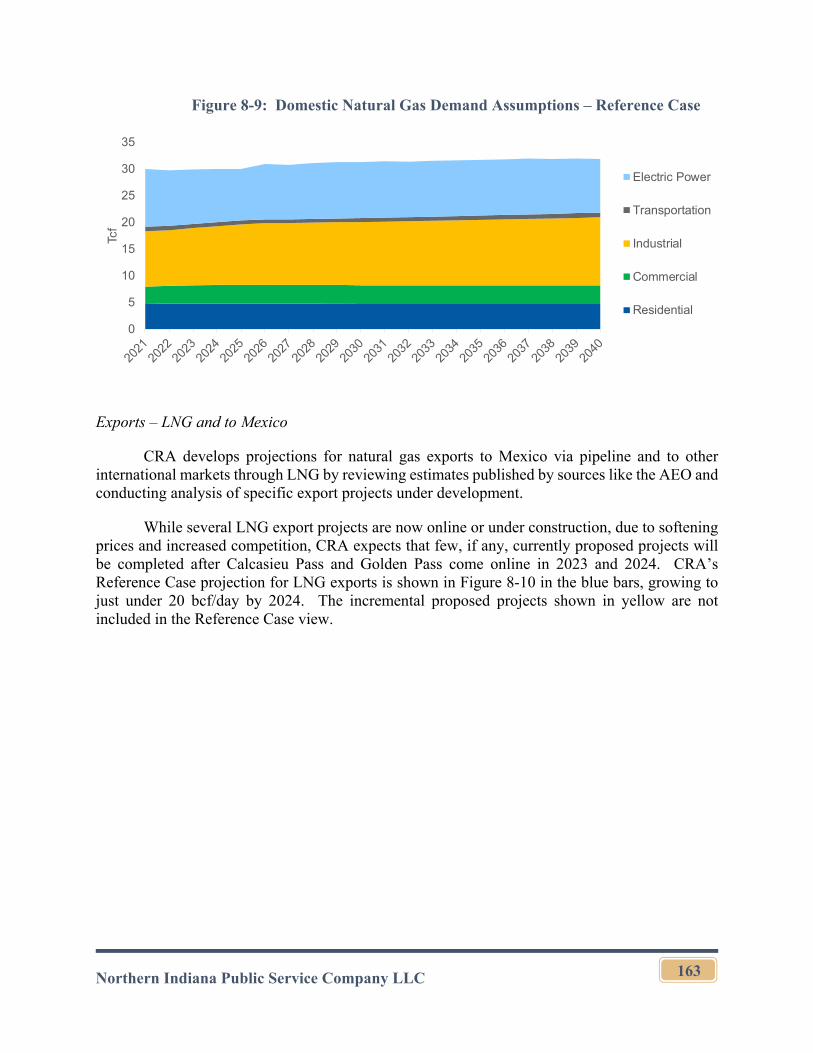
Northern Indiana Public Service Company LLC
163
Figure 8-9: Domestic Natural Gas Demand Assumptions – Reference Case
Exports – LNG and to Mexico
CRA develops projections for natural gas exports to Mexico via pipeline and to other international markets through LNG by reviewing estimates published by sources like the AEO and conducting analysis of specific export projects under development.
While several LNG export projects are now online or under construction, due to softening prices and increased competition, CRA expects that few, if any, currently proposed projects will be completed after Calcasieu Pass and Golden Pass come online in 2023 and 2024. CRA’s Reference Case projection for LNG exports is shown in Figure 8-10 in the blue bars, growing to just under 20 bcf/day by 2024. The incremental proposed projects shown in yellow are not included in the Reference Case view.
0
5
10
15
20
25
30
35
Tcf
Electric Power
Transportation
Industrial
Commercial
Residential
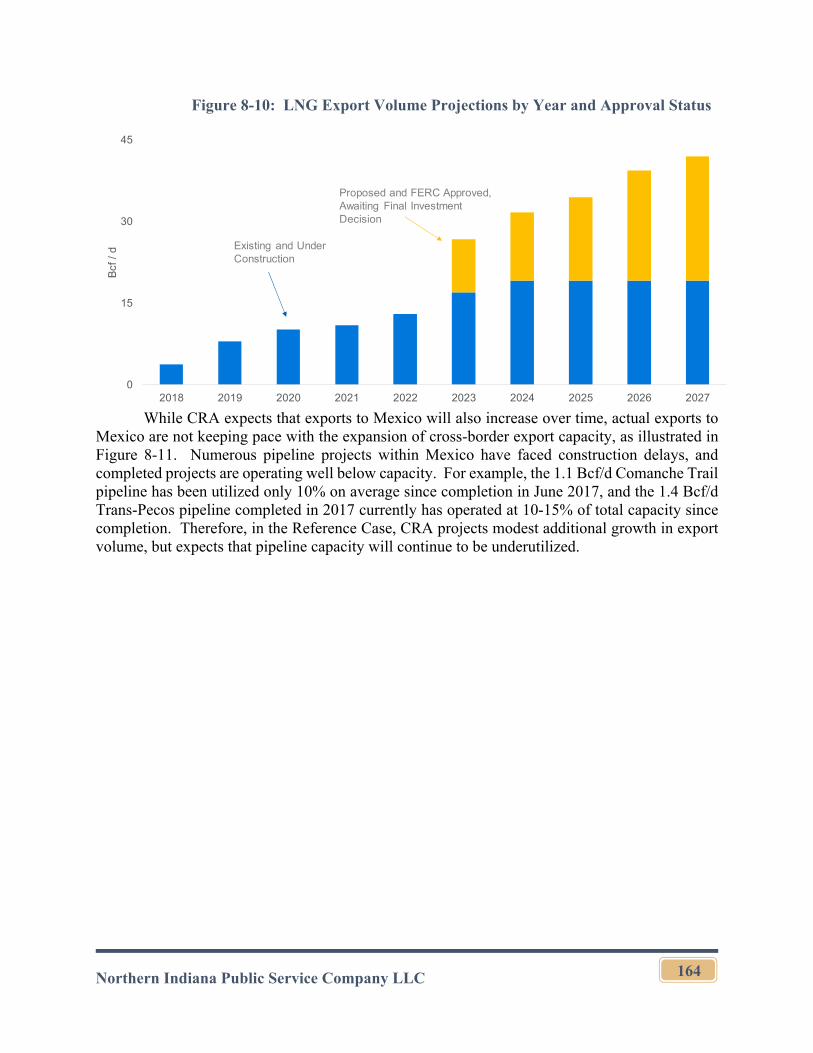
Northern Indiana Public Service Company LLC
164
Figure 8-10: LNG Export Volume Projections by Year and Approval Status
While CRA expects that exports to Mexico will also increase over time, actual exports to
Mexico are not keeping pace with the expansion of cross-border export capacity, as illustrated in Figure 8-11. Numerous pipeline projects within Mexico have faced construction delays, and completed projects are operating well below capacity. For example, the 1.1 Bcf/d Comanche Trail pipeline has been utilized only 10% on average since completion in June 2017, and the 1.4 Bcf/d Trans-Pecos pipeline completed in 2017 currently has operated at 10-15% of total capacity since completion. Therefore, in the Reference Case, CRA projects modest additional growth in export volume, but expects that pipeline capacity will continue to be underutilized.
0
15
30
45
2018 2019 2020 2021 2022 2023 2024 2025 2026 2027
Bcf
/ d
Proposed and FERC Approved, Awaiting Final Investment Decision
Existing and Under Construction
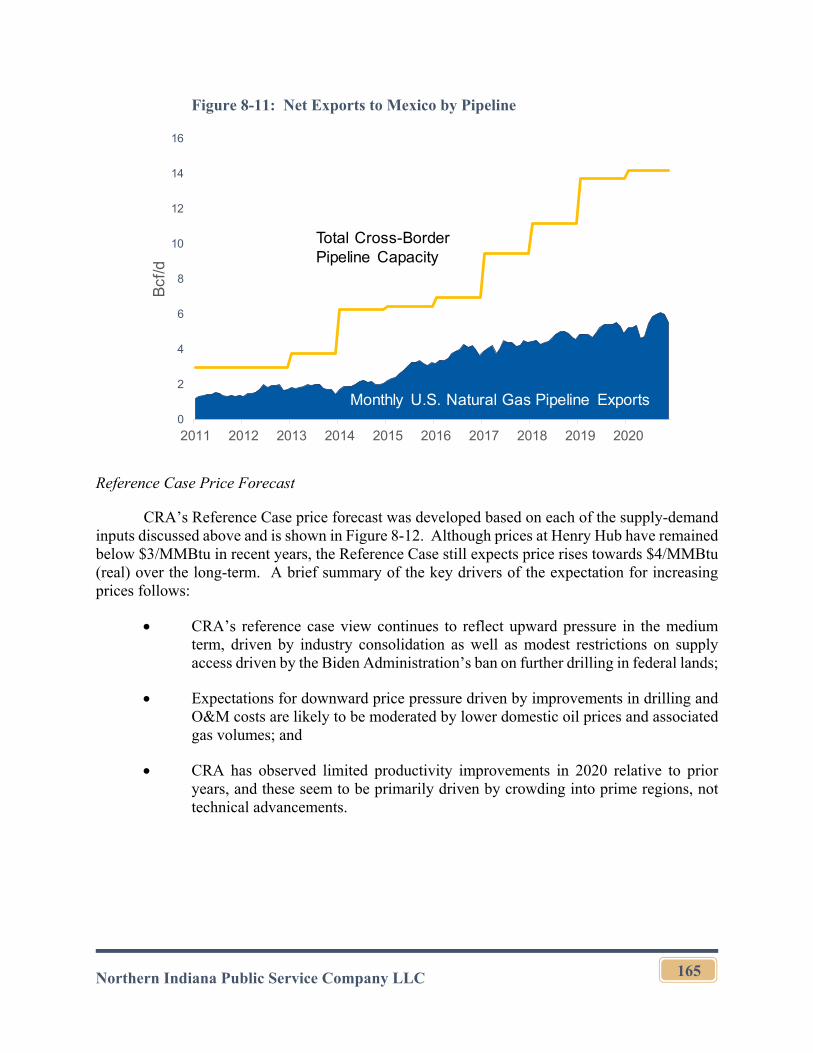
Northern Indiana Public Service Company LLC
165
Figure 8-11: Net Exports to Mexico by Pipeline
Reference Case Price Forecast
CRA’s Reference Case price forecast was developed based on each of the supply-demand inputs discussed above and is shown in Figure 8-12. Although prices at Henry Hub have remained below $3/MMBtu in recent years, the Reference Case still expects price rises towards $4/MMBtu (real) over the long-term. A brief summary of the key drivers of the expectation for increasing prices follows:
CRA’s reference case view continues to reflect upward pressure in the medium term, driven by industry consolidation as well as modest restrictions on supply access driven by the Biden Administration’s ban on further drilling in federal lands;
Expectations for downward price pressure driven by improvements in drilling and O&M costs are likely to be moderated by lower domestic oil prices and associated gas volumes; and
CRA has observed limited productivity improvements in 2020 relative to prior years, and these seem to be primarily driven by crowding into prime regions, not technical advancements.
0
2
4
6
8
10
12
14
16
2011 2012 2013 2014 2015 2016 2017 2018 2019 2020
Bcf
/d
Total Cross-Border Pipeline Capacity
Monthly U.S. Natural Gas Pipeline Exports
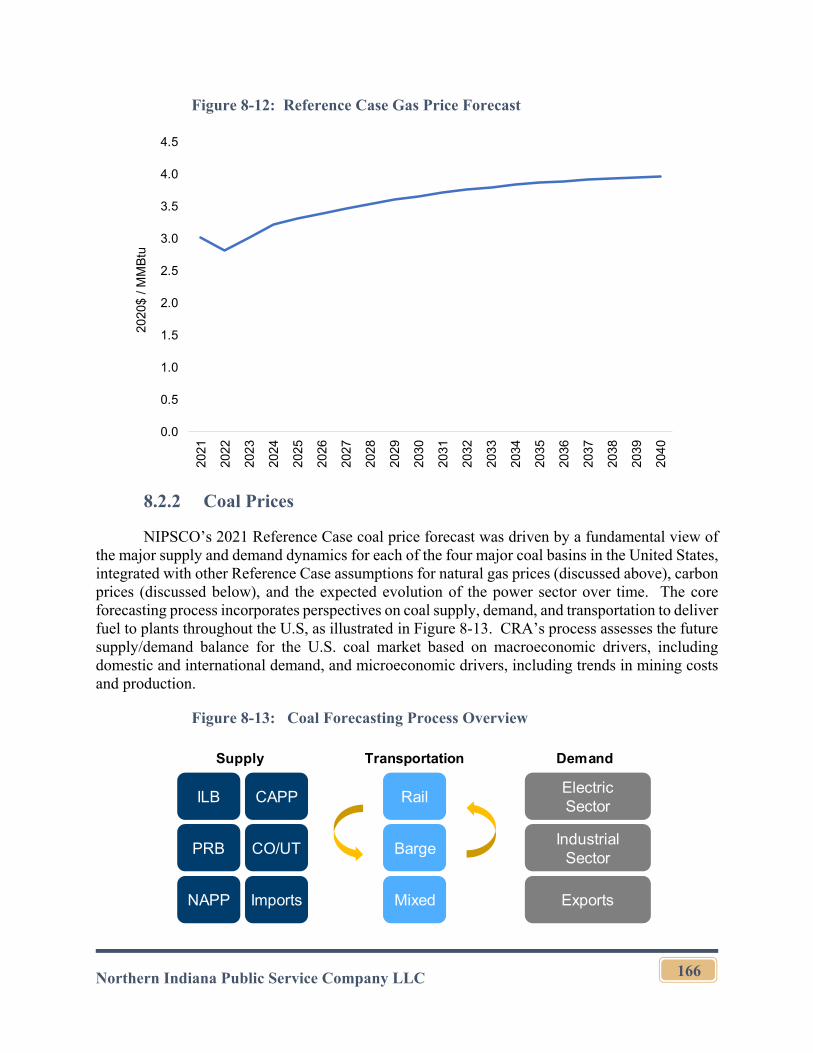
Northern Indiana Public Service Company LLC
166
Figure 8-12: Reference Case Gas Price Forecast
8.2.2 Coal Prices
NIPSCO’s 2021 Reference Case coal price forecast was driven by a fundamental view of the major supply and demand dynamics for each of the four major coal basins in the United States, integrated with other Reference Case assumptions for natural gas prices (discussed above), carbon prices (discussed below), and the expected evolution of the power sector over time. The core forecasting process incorporates perspectives on coal supply, demand, and transportation to deliver fuel to plants throughout the U.S, as illustrated in Figure 8-13. CRA’s process assesses the future supply/demand balance for the U.S. coal market based on macroeconomic drivers, including domestic and international demand, and microeconomic drivers, including trends in mining costs and production.
Figure 8-13: Coal Forecasting Process Overview
0.0
0.5
1.0
1.5
2.0
2.5
3.0
3.5
4.0
4.5
2021
2022
2023
2024
2025
2026
2027
2028
2029
2030
2031
2032
2033
2034
2035
2036
2037
2038
2039
2040
2020
$ / M
MB
tu
Electric Sector
Industrial Sector
Exports
Demand
ILB
PRB
CAPP
Supply
CO/UT
NAPP Imports
Transportation
Rail
Barge
Mixed
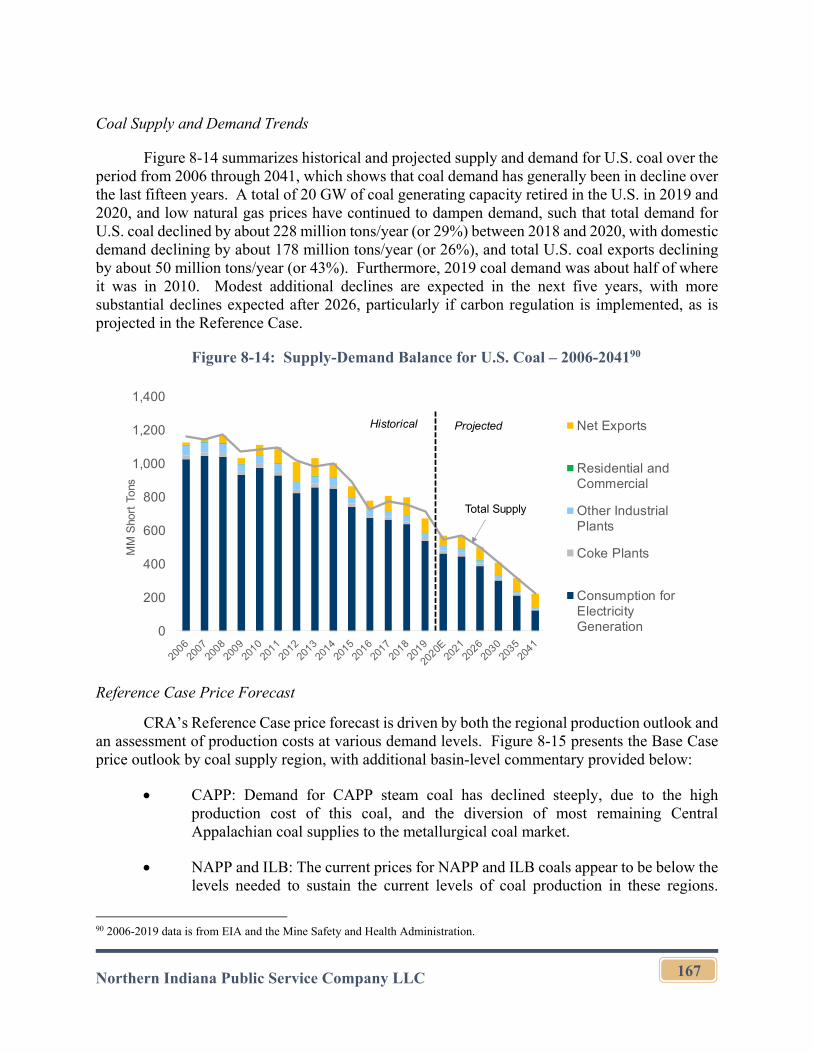
Northern Indiana Public Service Company LLC
167
Coal Supply and Demand Trends
Figure 8-14 summarizes historical and projected supply and demand for U.S. coal over the period from 2006 through 2041, which shows that coal demand has generally been in decline over the last fifteen years. A total of 20 GW of coal generating capacity retired in the U.S. in 2019 and 2020, and low natural gas prices have continued to dampen demand, such that total demand for U.S. coal declined by about 228 million tons/year (or 29%) between 2018 and 2020, with domestic demand declining by about 178 million tons/year (or 26%), and total U.S. coal exports declining by about 50 million tons/year (or 43%). Furthermore, 2019 coal demand was about half of where it was in 2010. Modest additional declines are expected in the next five years, with more substantial declines expected after 2026, particularly if carbon regulation is implemented, as is projected in the Reference Case.
Figure 8-14: Supply-Demand Balance for U.S. Coal – 2006-204190
Reference Case Price Forecast
CRA’s Reference Case price forecast is driven by both the regional production outlook and an assessment of production costs at various demand levels. Figure 8-15 presents the Base Case price outlook by coal supply region, with additional basin-level commentary provided below:
CAPP: Demand for CAPP steam coal has declined steeply, due to the high production cost of this coal, and the diversion of most remaining Central Appalachian coal supplies to the metallurgical coal market.
NAPP and ILB: The current prices for NAPP and ILB coals appear to be below the levels needed to sustain the current levels of coal production in these regions.
90 2006-2019 data is from EIA and the Mine Safety and Health Administration.
0
200
400
600
800
1,000
1,200
1,400
MM
Sho
rt T
ons
Net Exports
Residential andCommercial
Other IndustrialPlants
Coke Plants
Consumption forElectricityGeneration
Historical Projected
Total Supply
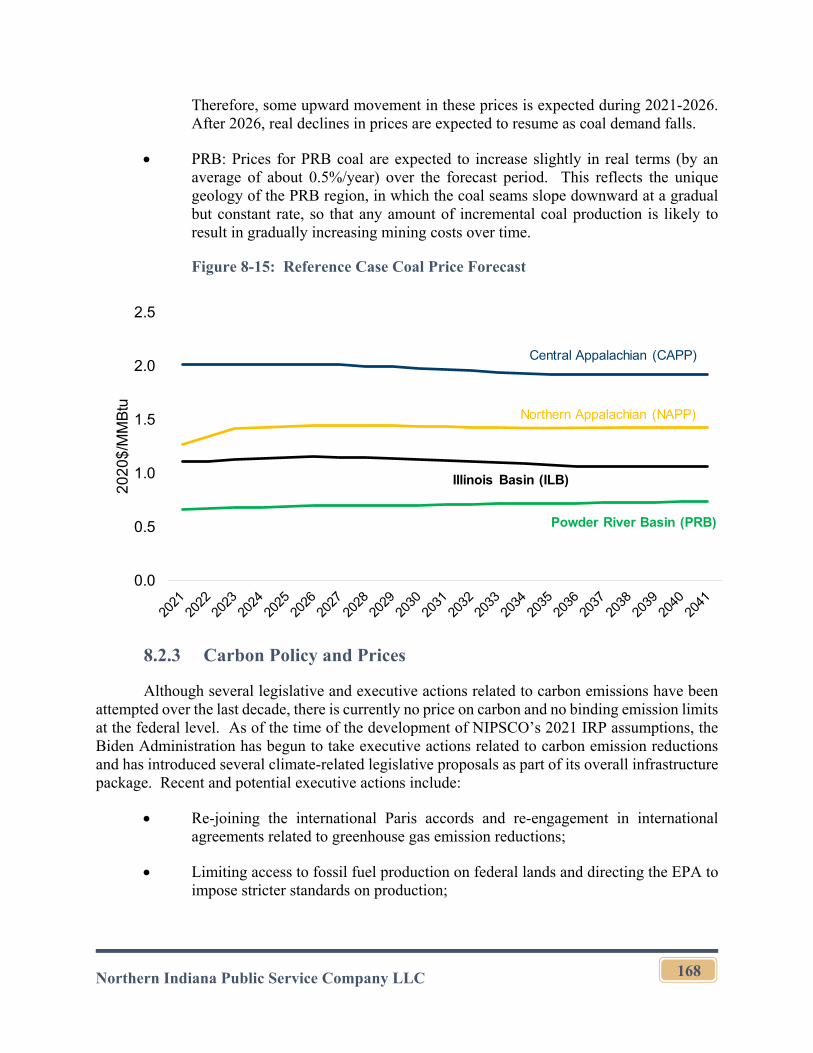
Northern Indiana Public Service Company LLC
168
Therefore, some upward movement in these prices is expected during 2021-2026. After 2026, real declines in prices are expected to resume as coal demand falls.
PRB: Prices for PRB coal are expected to increase slightly in real terms (by an average of about 0.5%/year) over the forecast period. This reflects the unique geology of the PRB region, in which the coal seams slope downward at a gradual but constant rate, so that any amount of incremental coal production is likely to result in gradually increasing mining costs over time.
Figure 8-15: Reference Case Coal Price Forecast
8.2.3 Carbon Policy and Prices
Although several legislative and executive actions related to carbon emissions have been attempted over the last decade, there is currently no price on carbon and no binding emission limits at the federal level. As of the time of the development of NIPSCO’s 2021 IRP assumptions, the Biden Administration has begun to take executive actions related to carbon emission reductions and has introduced several climate-related legislative proposals as part of its overall infrastructure package. Recent and potential executive actions include:
Re-joining the international Paris accords and re-engagement in international agreements related to greenhouse gas emission reductions;
Limiting access to fossil fuel production on federal lands and directing the EPA to impose stricter standards on production;
0.0
0.5
1.0
1.5
2.0
2.5
20
20
$/M
MB
tu
Central Appalachian (CAPP)
Northern Appalachian (NAPP)
Illinois Basin (ILB)
Powder River Basin (PRB)
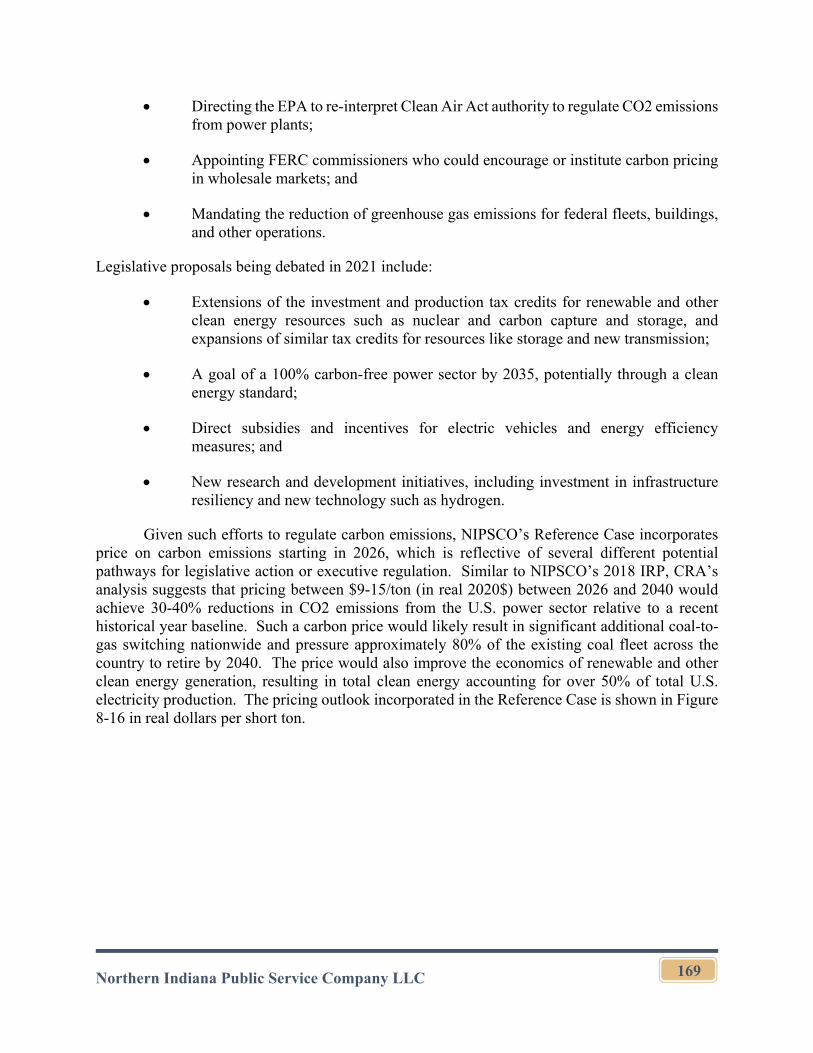
Northern Indiana Public Service Company LLC
169
Directing the EPA to re-interpret Clean Air Act authority to regulate CO2 emissions from power plants;
Appointing FERC commissioners who could encourage or institute carbon pricing in wholesale markets; and
Mandating the reduction of greenhouse gas emissions for federal fleets, buildings, and other operations.
Legislative proposals being debated in 2021 include:
Extensions of the investment and production tax credits for renewable and other clean energy resources such as nuclear and carbon capture and storage, and expansions of similar tax credits for resources like storage and new transmission;
A goal of a 100% carbon-free power sector by 2035, potentially through a clean energy standard;
Direct subsidies and incentives for electric vehicles and energy efficiency measures; and
New research and development initiatives, including investment in infrastructure resiliency and new technology such as hydrogen.
Given such efforts to regulate carbon emissions, NIPSCO’s Reference Case incorporates price on carbon emissions starting in 2026, which is reflective of several different potential pathways for legislative action or executive regulation. Similar to NIPSCO’s 2018 IRP, CRA’s analysis suggests that pricing between $9-15/ton (in real 2020$) between 2026 and 2040 would achieve 30-40% reductions in CO2 emissions from the U.S. power sector relative to a recent historical year baseline. Such a carbon price would likely result in significant additional coal-to-gas switching nationwide and pressure approximately 80% of the existing coal fleet across the country to retire by 2040. The price would also improve the economics of renewable and other clean energy generation, resulting in total clean energy accounting for over 50% of total U.S. electricity production. The pricing outlook incorporated in the Reference Case is shown in Figure 8-16 in real dollars per short ton.
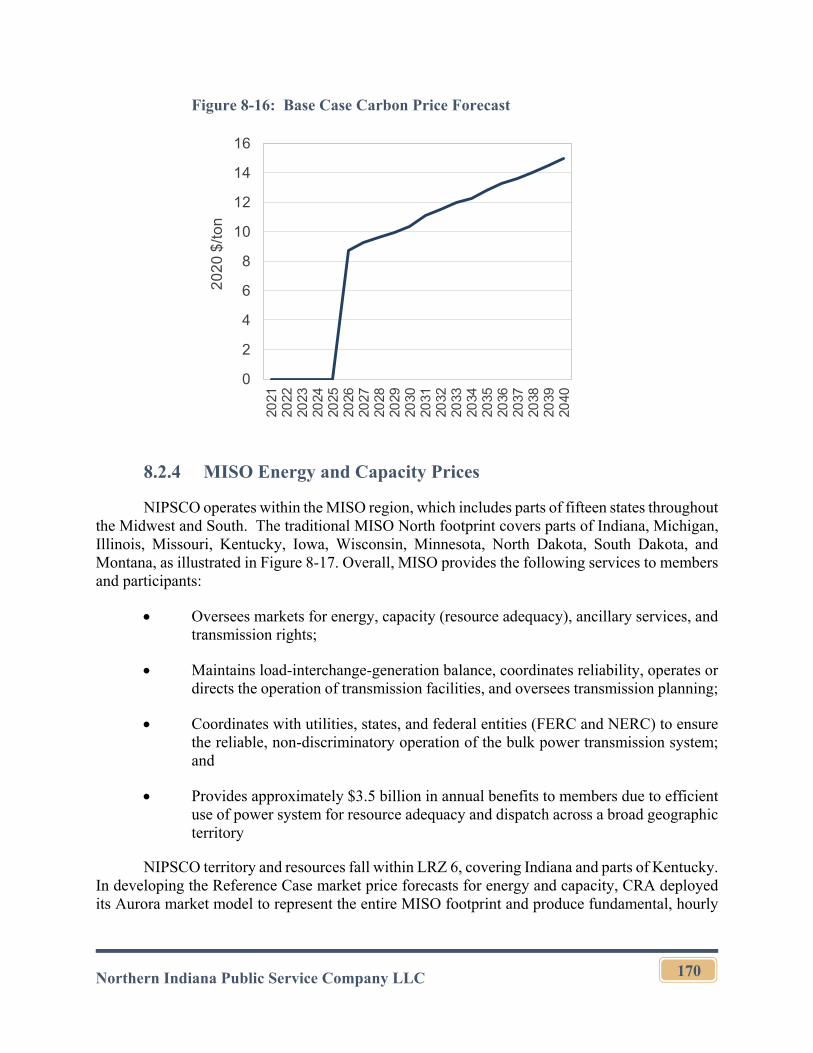
Northern Indiana Public Service Company LLC
170
Figure 8-16: Base Case Carbon Price Forecast
8.2.4 MISO Energy and Capacity Prices
NIPSCO operates within the MISO region, which includes parts of fifteen states throughout the Midwest and South. The traditional MISO North footprint covers parts of Indiana, Michigan, Illinois, Missouri, Kentucky, Iowa, Wisconsin, Minnesota, North Dakota, South Dakota, and Montana, as illustrated in Figure 8-17. Overall, MISO provides the following services to members and participants:
Oversees markets for energy, capacity (resource adequacy), ancillary services, and transmission rights;
Maintains load-interchange-generation balance, coordinates reliability, operates or directs the operation of transmission facilities, and oversees transmission planning;
Coordinates with utilities, states, and federal entities (FERC and NERC) to ensure the reliable, non-discriminatory operation of the bulk power transmission system; and
Provides approximately $3.5 billion in annual benefits to members due to efficient use of power system for resource adequacy and dispatch across a broad geographic territory
NIPSCO territory and resources fall within LRZ 6, covering Indiana and parts of Kentucky. In developing the Reference Case market price forecasts for energy and capacity, CRA deployed its Aurora market model to represent the entire MISO footprint and produce fundamental, hourly
0
2
4
6
8
10
12
14
16
2021
2022
2023
2024
2025
2026
2027
2028
2029
2030
2031
2032
2033
2034
2035
2036
2037
2038
2039
2040
20
20
$/t
on
Northern Indiana Public Service Company LLC
171
price projections that are internally consistent with the fundamental outlook for natural gas prices, carbon prices, and the future capacity mix in the region.
Figure 8-17: MISO Footprint
Based on the market inputs for fuel and carbon prices, along with other inputs associated with existing and new resource expectations throughout MISO, regional transmission interconnections, and regional electric demand, CRA developed Reference Case expectations for the MISO market, including energy capacity prices according to the process shown in Figure 8-18.
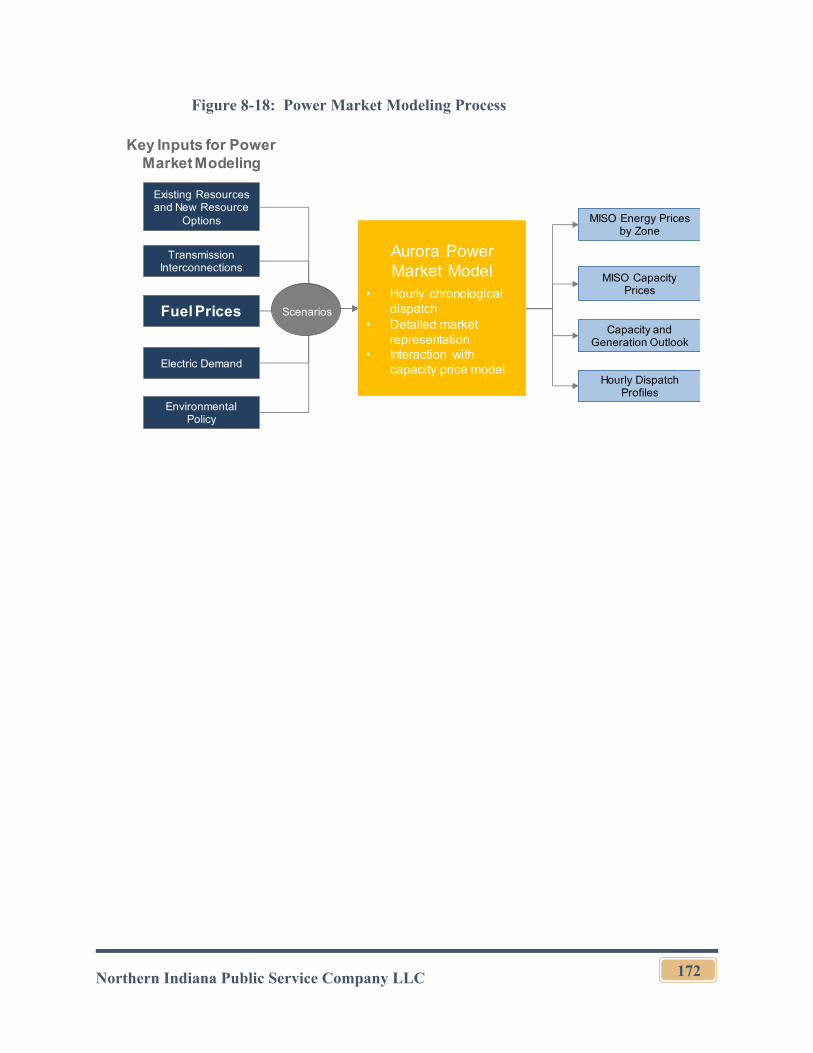
Northern Indiana Public Service Company LLC
172
Figure 8-18: Power Market Modeling Process
Existing Resources and New Resource
Options
Fuel Prices
Transmission Interconnections
Electric Demand
Environmental Policy
MISO Energy Prices by Zone
Hourly Dispatch Profiles
MISO Capacity Prices
Aurora
Scenarios
Capacity and Generation Outlook
Aurora Power Market Model
• Hourly chronological dispatch
• Detailed market representation
• Interaction with capacity price model
Key Inputs for Power Market Modeling
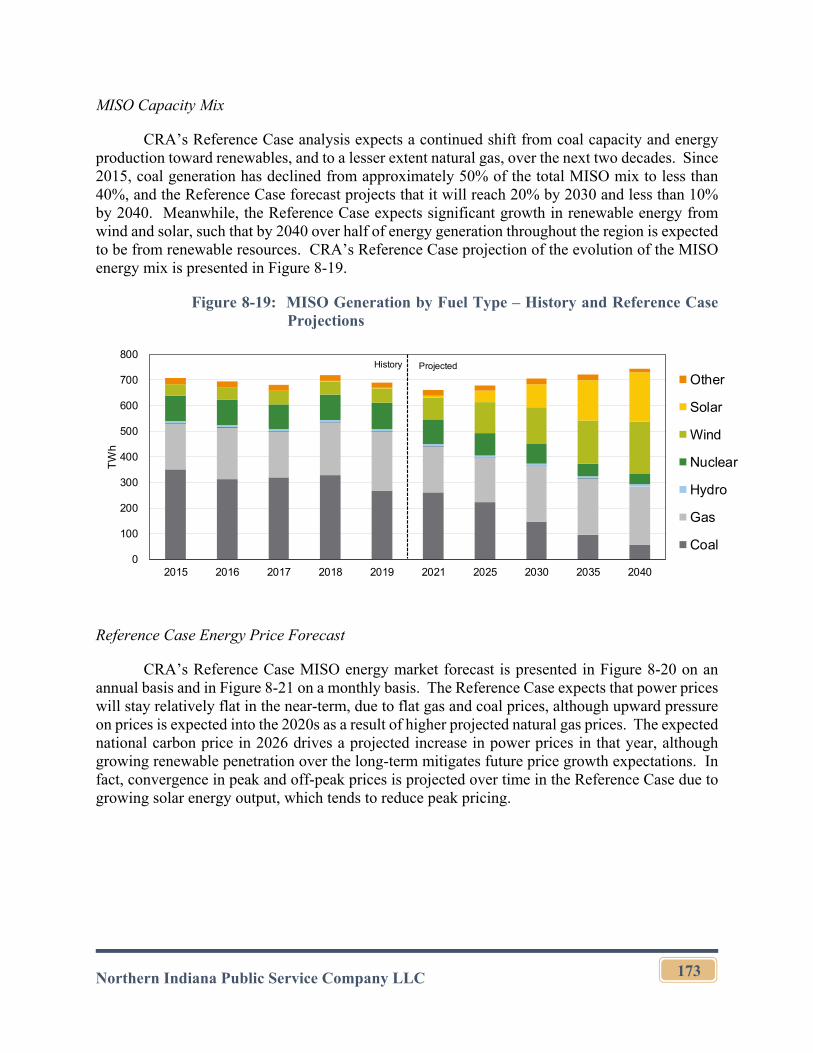
Northern Indiana Public Service Company LLC
173
MISO Capacity Mix
CRA’s Reference Case analysis expects a continued shift from coal capacity and energy production toward renewables, and to a lesser extent natural gas, over the next two decades. Since 2015, coal generation has declined from approximately 50% of the total MISO mix to less than 40%, and the Reference Case forecast projects that it will reach 20% by 2030 and less than 10% by 2040. Meanwhile, the Reference Case expects significant growth in renewable energy from wind and solar, such that by 2040 over half of energy generation throughout the region is expected to be from renewable resources. CRA’s Reference Case projection of the evolution of the MISO energy mix is presented in Figure 8-19.
Figure 8-19: MISO Generation by Fuel Type – History and Reference Case Projections
Reference Case Energy Price Forecast
CRA’s Reference Case MISO energy market forecast is presented in Figure 8-20 on an annual basis and in Figure 8-21 on a monthly basis. The Reference Case expects that power prices will stay relatively flat in the near-term, due to flat gas and coal prices, although upward pressure on prices is expected into the 2020s as a result of higher projected natural gas prices. The expected national carbon price in 2026 drives a projected increase in power prices in that year, although growing renewable penetration over the long-term mitigates future price growth expectations. In fact, convergence in peak and off-peak prices is projected over time in the Reference Case due to growing solar energy output, which tends to reduce peak pricing.
0
100
200
300
400
500
600
700
800
2015 2016 2017 2018 2019 2021 2025 2030 2035 2040
TW
h
Other
Solar
Wind
Nuclear
Hydro
Gas
Coal
History Projected
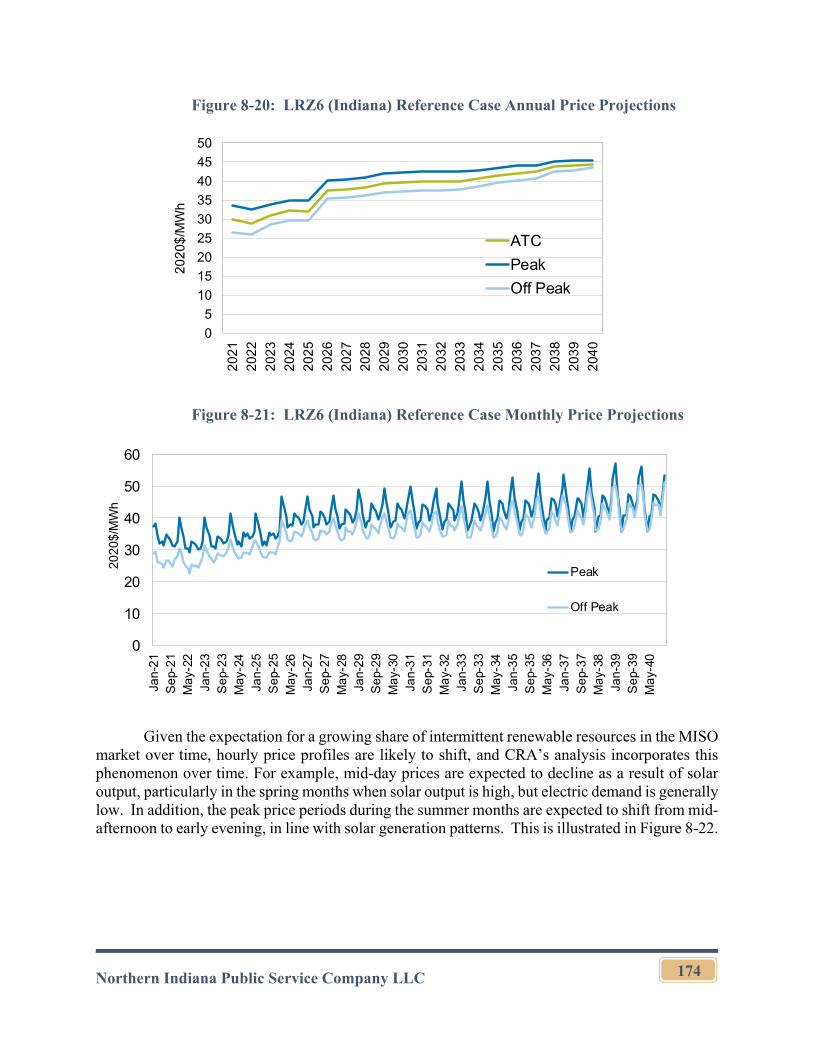
Northern Indiana Public Service Company LLC
174
Figure 8-20: LRZ6 (Indiana) Reference Case Annual Price Projections
Figure 8-21: LRZ6 (Indiana) Reference Case Monthly Price Projections
Given the expectation for a growing share of intermittent renewable resources in the MISO market over time, hourly price profiles are likely to shift, and CRA’s analysis incorporates this phenomenon over time. For example, mid-day prices are expected to decline as a result of solar output, particularly in the spring months when solar output is high, but electric demand is generally low. In addition, the peak price periods during the summer months are expected to shift from mid-afternoon to early evening, in line with solar generation patterns. This is illustrated in Figure 8-22.
0
5
10
15
20
25
30
35
40
45
50
20
21
20
22
20
23
20
24
20
25
20
26
20
27
20
28
20
29
20
30
20
31
20
32
20
33
20
34
20
35
20
36
20
37
20
38
20
39
20
40
20
20
$/M
Wh
ATC
Peak
Off Peak
0
10
20
30
40
50
60
Jan
-21
Se
p-21
Ma
y-22
Jan
-23
Se
p-23
Ma
y-24
Jan
-25
Se
p-25
Ma
y-26
Jan
-27
Se
p-27
Ma
y-28
Jan
-29
Se
p-29
Ma
y-30
Jan
-31
Se
p-31
Ma
y-32
Jan
-33
Se
p-33
Ma
y-34
Jan
-35
Se
p-35
Ma
y-36
Jan
-37
Se
p-37
Ma
y-38
Jan
-39
Se
p-39
Ma
y-40
202
0$/M
Wh
Peak
Off Peak
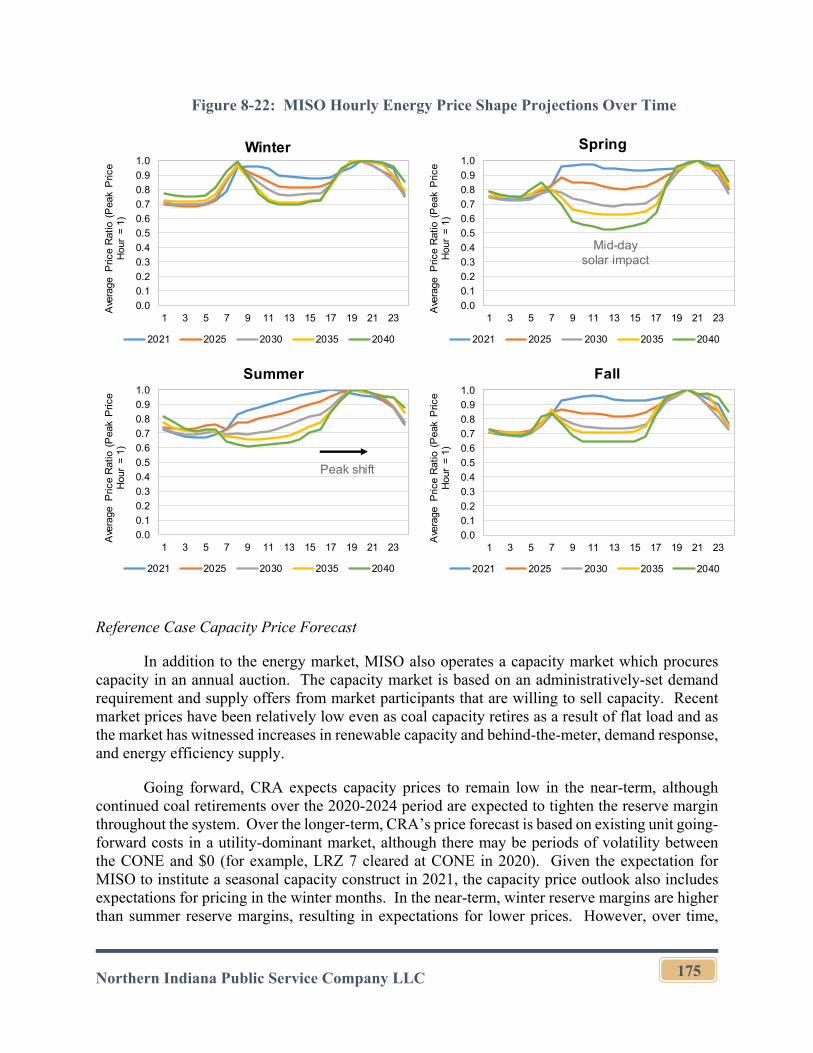
Northern Indiana Public Service Company LLC
175
Figure 8-22: MISO Hourly Energy Price Shape Projections Over Time
Reference Case Capacity Price Forecast
In addition to the energy market, MISO also operates a capacity market which procures capacity in an annual auction. The capacity market is based on an administratively-set demand requirement and supply offers from market participants that are willing to sell capacity. Recent market prices have been relatively low even as coal capacity retires as a result of flat load and as the market has witnessed increases in renewable capacity and behind-the-meter, demand response, and energy efficiency supply.
Going forward, CRA expects capacity prices to remain low in the near-term, although continued coal retirements over the 2020-2024 period are expected to tighten the reserve margin throughout the system. Over the longer-term, CRA’s price forecast is based on existing unit going-forward costs in a utility-dominant market, although there may be periods of volatility between the CONE and $0 (for example, LRZ 7 cleared at CONE in 2020). Given the expectation for MISO to institute a seasonal capacity construct in 2021, the capacity price outlook also includes expectations for pricing in the winter months. In the near-term, winter reserve margins are higher than summer reserve margins, resulting in expectations for lower prices. However, over time,
0.0
0.1
0.2
0.3
0.4
0.5
0.6
0.7
0.8
0.9
1.0
1 3 5 7 9 11 13 15 17 19 21 23
Ave
rage
Pric
e R
atio
(P
eak
Pric
e H
our
= 1
)
2021 2025 2030 2035 2040
Winter
Fall
0.0
0.1
0.2
0.3
0.4
0.5
0.6
0.7
0.8
0.9
1.0
1 3 5 7 9 11 13 15 17 19 21 23
Ave
rage
Pric
e R
atio
(P
eak
Pric
e H
our
= 1
)
2021 2025 2030 2035 2040
0.0
0.1
0.2
0.3
0.4
0.5
0.6
0.7
0.8
0.9
1.0
1 3 5 7 9 11 13 15 17 19 21 23
Ave
rage
Pric
e R
atio
(P
eak
Pric
e H
our
= 1
)
2021 2025 2030 2035 2040
0.0
0.1
0.2
0.3
0.4
0.5
0.6
0.7
0.8
0.9
1.0
1 3 5 7 9 11 13 15 17 19 21 23
Ave
rage
Pric
e R
atio
(P
eak
Pric
e H
our
= 1
)
2021 2025 2030 2035 2040
Spring
Summer
Peak shift
Mid-day solar impact
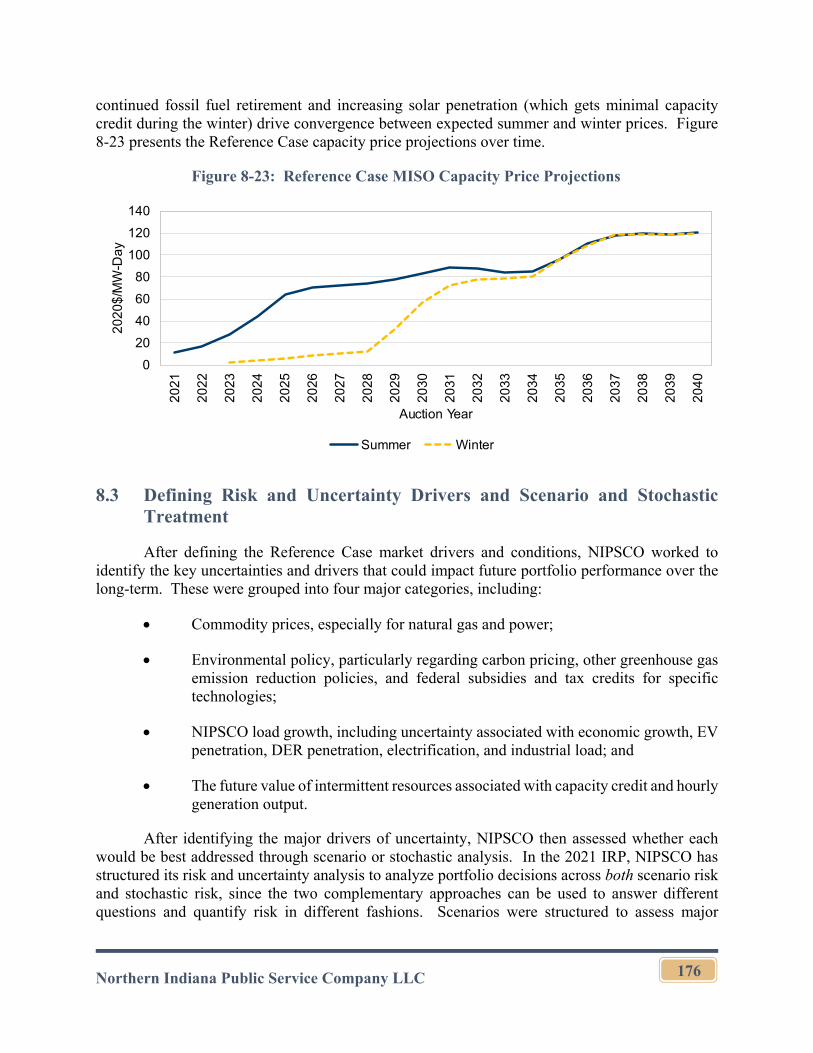
Northern Indiana Public Service Company LLC
176
continued fossil fuel retirement and increasing solar penetration (which gets minimal capacity credit during the winter) drive convergence between expected summer and winter prices. Figure 8-23 presents the Reference Case capacity price projections over time.
Figure 8-23: Reference Case MISO Capacity Price Projections
8.3 Defining Risk and Uncertainty Drivers and Scenario and Stochastic Treatment
After defining the Reference Case market drivers and conditions, NIPSCO worked to identify the key uncertainties and drivers that could impact future portfolio performance over the long-term. These were grouped into four major categories, including:
Commodity prices, especially for natural gas and power;
Environmental policy, particularly regarding carbon pricing, other greenhouse gas emission reduction policies, and federal subsidies and tax credits for specific technologies;
NIPSCO load growth, including uncertainty associated with economic growth, EV penetration, DER penetration, electrification, and industrial load; and
The future value of intermittent resources associated with capacity credit and hourly generation output.
After identifying the major drivers of uncertainty, NIPSCO then assessed whether each would be best addressed through scenario or stochastic analysis. In the 2021 IRP, NIPSCO has structured its risk and uncertainty analysis to analyze portfolio decisions across both scenario risk and stochastic risk, since the two complementary approaches can be used to answer different questions and quantify risk in different fashions. Scenarios were structured to assess major
0
20
40
60
80
100
120
140
20
21
20
22
20
23
20
24
20
25
20
26
20
27
20
28
20
29
20
30
20
31
20
32
20
33
20
34
20
35
20
36
20
37
20
38
20
39
20
40
20
20
$/M
W-D
ay
Auction Year
Summer Winter
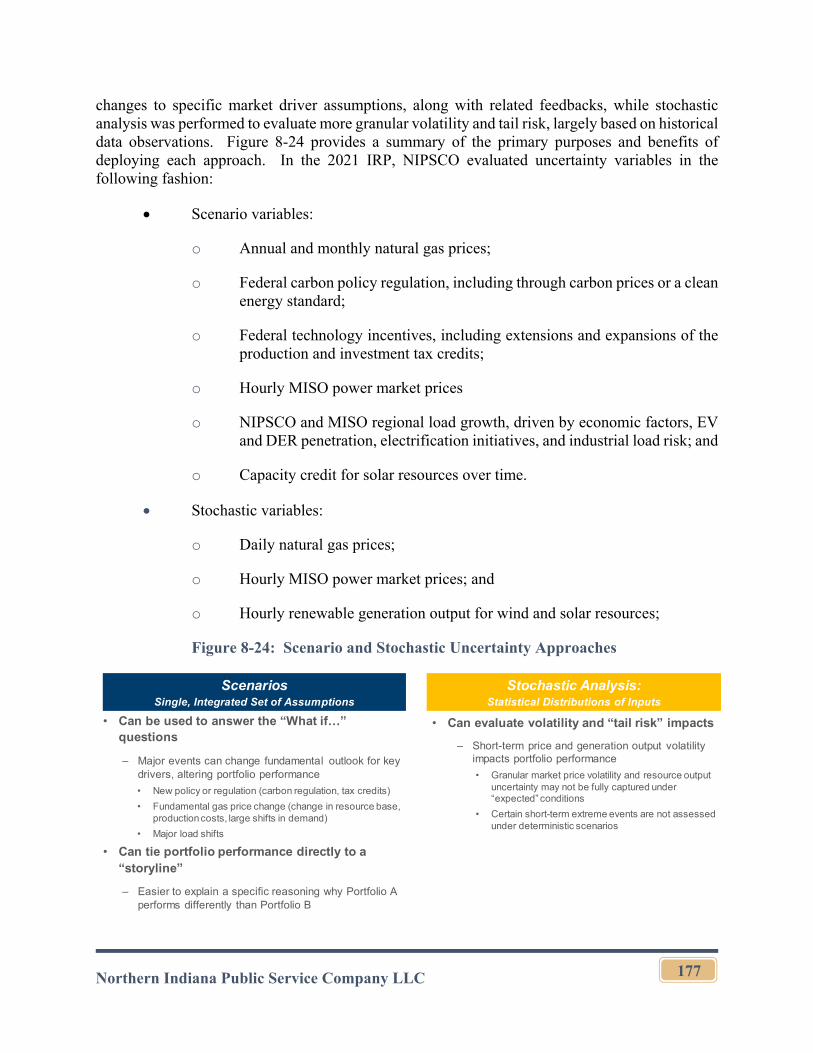
Northern Indiana Public Service Company LLC
177
changes to specific market driver assumptions, along with related feedbacks, while stochastic analysis was performed to evaluate more granular volatility and tail risk, largely based on historical data observations. Figure 8-24 provides a summary of the primary purposes and benefits of deploying each approach. In the 2021 IRP, NIPSCO evaluated uncertainty variables in the following fashion:
Scenario variables:
o Annual and monthly natural gas prices;
o Federal carbon policy regulation, including through carbon prices or a clean energy standard;
o Federal technology incentives, including extensions and expansions of the production and investment tax credits;
o Hourly MISO power market prices
o NIPSCO and MISO regional load growth, driven by economic factors, EV and DER penetration, electrification initiatives, and industrial load risk; and
o Capacity credit for solar resources over time.
Stochastic variables:
o Daily natural gas prices;
o Hourly MISO power market prices; and
o Hourly renewable generation output for wind and solar resources;
Figure 8-24: Scenario and Stochastic Uncertainty Approaches
• Can evaluate volatility and “tail risk” impacts
‒ Short-term price and generation output volatility impacts portfolio performance
• Granular market price volatility and resource output uncertainty may not be fully captured under “expected” conditions
• Certain short-term extreme events are not assessed under deterministic scenarios
Stochastic Analysis: Statistical Distributions of Inputs
ScenariosSingle, Integrated Set of Assumptions
• Can be used to answer the “What if…” questions
‒ Major events can change fundamental outlook for key drivers, altering portfolio performance
• New policy or regulation (carbon regulation, tax credits)
• Fundamental gas price change (change in resource base, production costs, large shifts in demand)
• Major load shifts
• Can tie portfolio performance directly to a “storyline”
‒ Easier to explain a specific reasoning why Portfolio A performs differently than Portfolio B
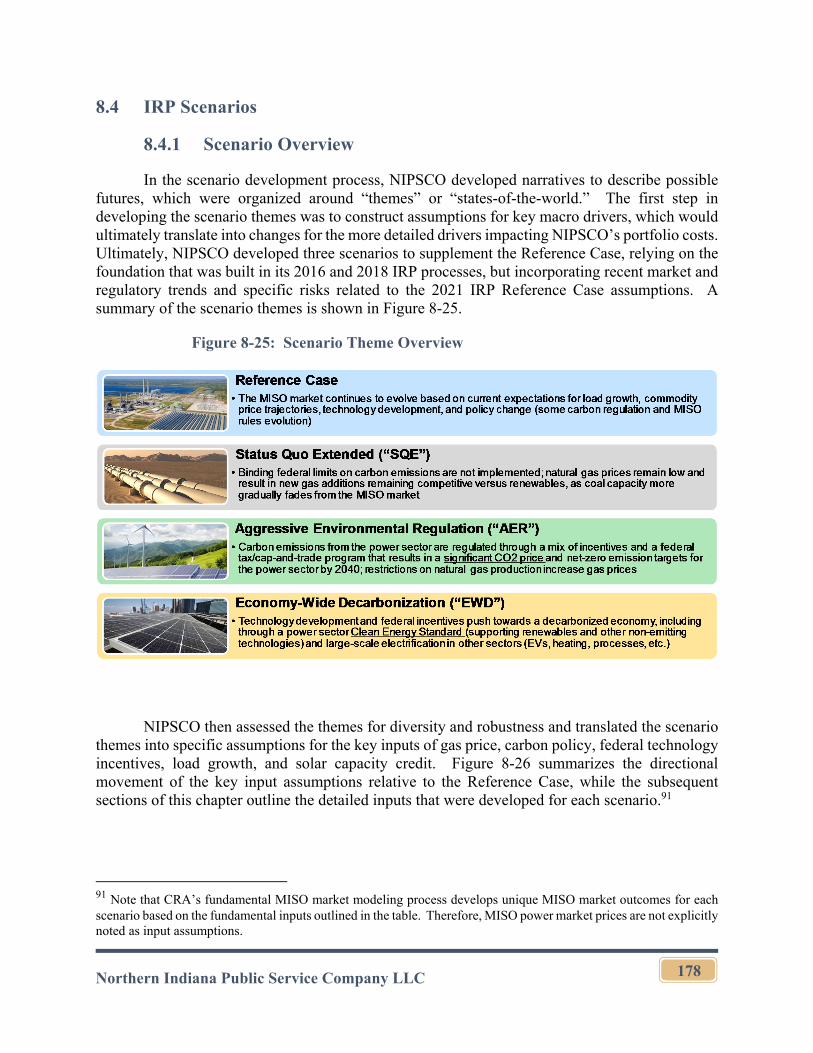
Northern Indiana Public Service Company LLC
178
8.4 IRP Scenarios
8.4.1 Scenario Overview
In the scenario development process, NIPSCO developed narratives to describe possible futures, which were organized around “themes” or “states-of-the-world.” The first step in developing the scenario themes was to construct assumptions for key macro drivers, which would ultimately translate into changes for the more detailed drivers impacting NIPSCO’s portfolio costs. Ultimately, NIPSCO developed three scenarios to supplement the Reference Case, relying on the foundation that was built in its 2016 and 2018 IRP processes, but incorporating recent market and regulatory trends and specific risks related to the 2021 IRP Reference Case assumptions. A summary of the scenario themes is shown in Figure 8-25.
Figure 8-25: Scenario Theme Overview
NIPSCO then assessed the themes for diversity and robustness and translated the scenario themes into specific assumptions for the key inputs of gas price, carbon policy, federal technology incentives, load growth, and solar capacity credit. Figure 8-26 summarizes the directional movement of the key input assumptions relative to the Reference Case, while the subsequent sections of this chapter outline the detailed inputs that were developed for each scenario.91
91 Note that CRA’s fundamental MISO market modeling process develops unique MISO market outcomes for each scenario based on the fundamental inputs outlined in the table. Therefore, MISO power market prices are not explicitly noted as input assumptions.
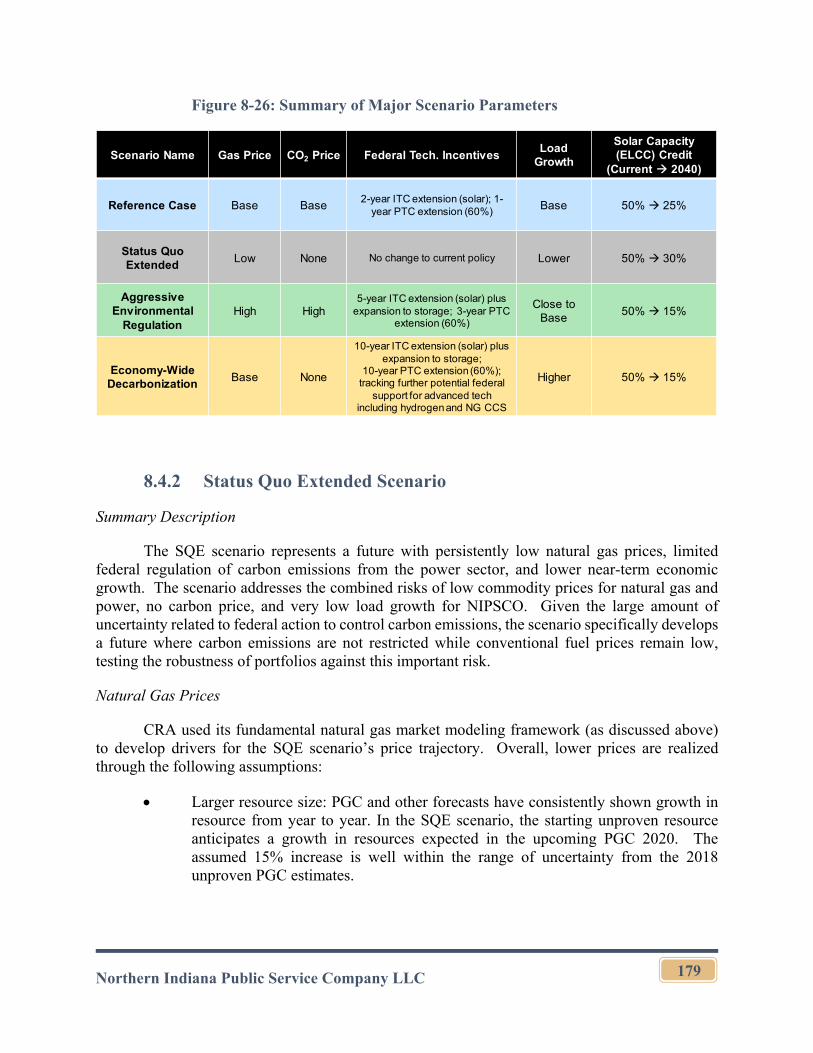
Northern Indiana Public Service Company LLC
179
Figure 8-26: Summary of Major Scenario Parameters
8.4.2 Status Quo Extended Scenario
Summary Description
The SQE scenario represents a future with persistently low natural gas prices, limited federal regulation of carbon emissions from the power sector, and lower near-term economic growth. The scenario addresses the combined risks of low commodity prices for natural gas and power, no carbon price, and very low load growth for NIPSCO. Given the large amount of uncertainty related to federal action to control carbon emissions, the scenario specifically develops a future where carbon emissions are not restricted while conventional fuel prices remain low, testing the robustness of portfolios against this important risk.
Natural Gas Prices
CRA used its fundamental natural gas market modeling framework (as discussed above) to develop drivers for the SQE scenario’s price trajectory. Overall, lower prices are realized through the following assumptions:
Larger resource size: PGC and other forecasts have consistently shown growth in resource from year to year. In the SQE scenario, the starting unproven resource anticipates a growth in resources expected in the upcoming PGC 2020. The assumed 15% increase is well within the range of uncertainty from the 2018 unproven PGC estimates.
Scenario Name Gas Price CO2 Price Federal Tech. IncentivesLoad
Growth
Solar Capacity (ELCC) Credit
(Current 2040)
Reference Case Base Base2-year ITC extension (solar); 1-
year PTC extension (60%) Base 50% 25%
Status Quo Extended
Low None No change to current policy Lower 50% 30%
Aggressive Environmental
RegulationHigh High
5-year ITC extension (solar) plus expansion to storage; 3-year PTC
extension (60%)
Close to Base
50% 15%
Economy-Wide Decarbonization
Base None
10-year ITC extension (solar) plus expansion to storage;
10-year PTC extension (60%); tracking further potential federal
support for advanced tech including hydrogen and NG CCS
Higher 50% 15%
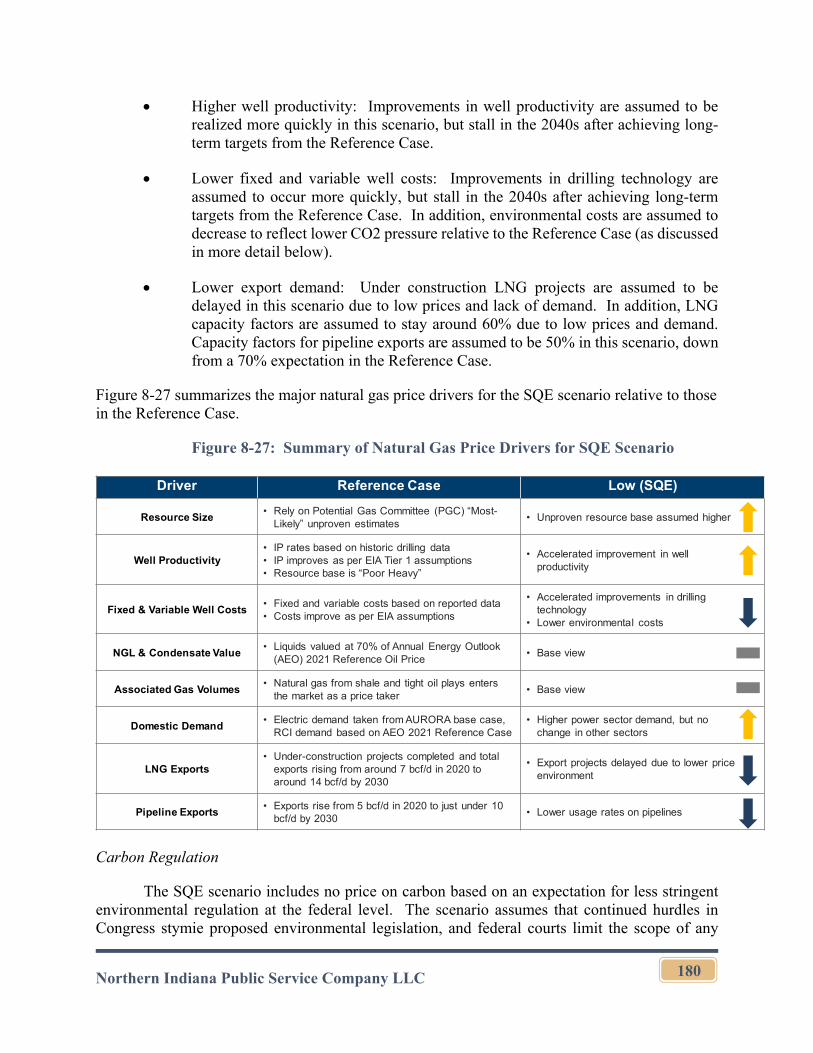
Northern Indiana Public Service Company LLC
180
Higher well productivity: Improvements in well productivity are assumed to be realized more quickly in this scenario, but stall in the 2040s after achieving long-term targets from the Reference Case.
Lower fixed and variable well costs: Improvements in drilling technology are assumed to occur more quickly, but stall in the 2040s after achieving long-term targets from the Reference Case. In addition, environmental costs are assumed to decrease to reflect lower CO2 pressure relative to the Reference Case (as discussed in more detail below).
Lower export demand: Under construction LNG projects are assumed to be delayed in this scenario due to low prices and lack of demand. In addition, LNG capacity factors are assumed to stay around 60% due to low prices and demand. Capacity factors for pipeline exports are assumed to be 50% in this scenario, down from a 70% expectation in the Reference Case.
Figure 8-27 summarizes the major natural gas price drivers for the SQE scenario relative to those in the Reference Case.
Figure 8-27: Summary of Natural Gas Price Drivers for SQE Scenario
Carbon Regulation
The SQE scenario includes no price on carbon based on an expectation for less stringent environmental regulation at the federal level. The scenario assumes that continued hurdles in Congress stymie proposed environmental legislation, and federal courts limit the scope of any
Driver Reference Case Low (SQE)
Resource Size• Rely on Potential Gas Committee (PGC) “Most-
Likely” unproven estimates• Unproven resource base assumed higher
Well Productivity• IP rates based on historic drilling data• IP improves as per EIA Tier 1 assumptions• Resource base is “Poor Heavy”
• Accelerated improvement in well productivity
Fixed & Variable Well Costs• Fixed and variable costs based on reported data• Costs improve as per EIA assumptions
• Accelerated improvements in drilling technology
• Lower environmental costs
NGL & Condensate Value• Liquids valued at 70% of Annual Energy Outlook
(AEO) 2021 Reference Oil Price• Base view
Associated Gas Volumes• Natural gas from shale and tight oil plays enters
the market as a price taker• Base view
Domestic Demand• Electric demand taken from AURORA base case,
RCI demand based on AEO 2021 Reference Case• Higher power sector demand, but no
change in other sectors
LNG Exports• Under-construction projects completed and total
exports rising from around 7 bcf/d in 2020 to around 14 bcf/d by 2030
• Export projects delayed due to lower price environment
Pipeline Exports• Exports rise from 5 bcf/d in 2020 to just under 10
bcf/d by 2030 • Lower usage rates on pipelines
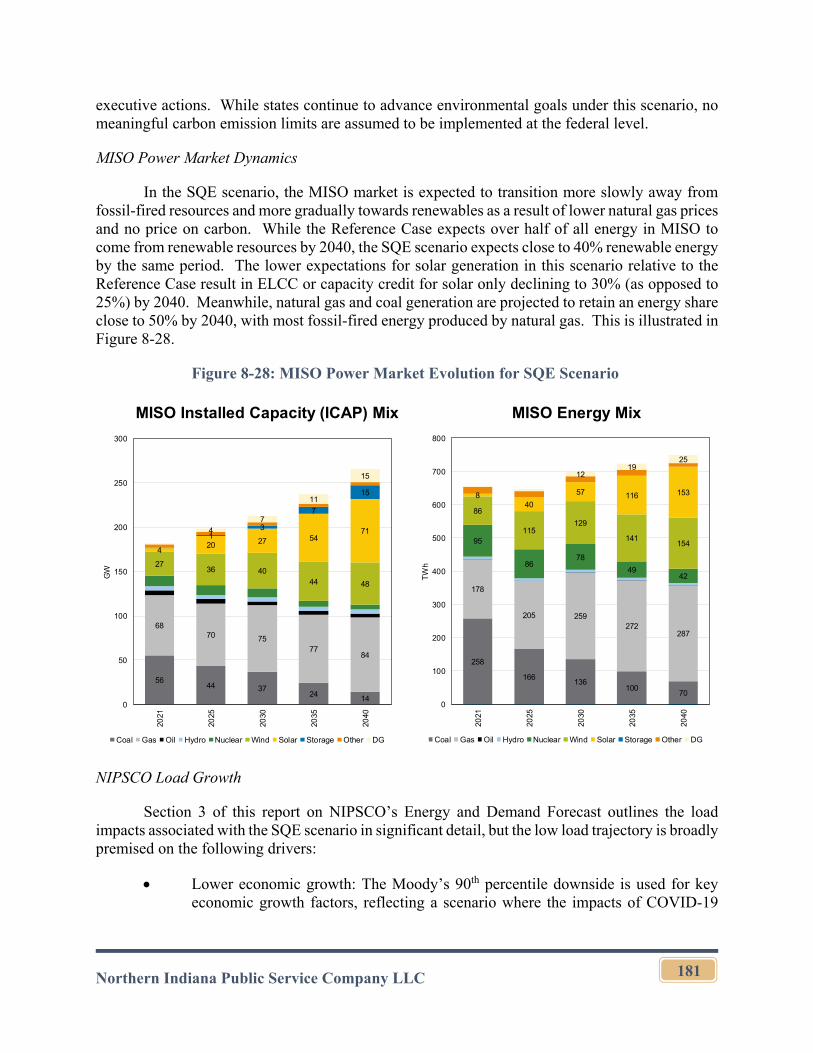
Northern Indiana Public Service Company LLC
181
executive actions. While states continue to advance environmental goals under this scenario, no meaningful carbon emission limits are assumed to be implemented at the federal level.
MISO Power Market Dynamics
In the SQE scenario, the MISO market is expected to transition more slowly away from fossil-fired resources and more gradually towards renewables as a result of lower natural gas prices and no price on carbon. While the Reference Case expects over half of all energy in MISO to come from renewable resources by 2040, the SQE scenario expects close to 40% renewable energy by the same period. The lower expectations for solar generation in this scenario relative to the Reference Case result in ELCC or capacity credit for solar only declining to 30% (as opposed to 25%) by 2040. Meanwhile, natural gas and coal generation are projected to retain an energy share close to 50% by 2040, with most fossil-fired energy produced by natural gas. This is illustrated in Figure 8-28.
Figure 8-28: MISO Power Market Evolution for SQE Scenario
NIPSCO Load Growth
Section 3 of this report on NIPSCO’s Energy and Demand Forecast outlines the load impacts associated with the SQE scenario in significant detail, but the low load trajectory is broadly premised on the following drivers:
Lower economic growth: The Moody’s 90th percentile downside is used for key economic growth factors, reflecting a scenario where the impacts of COVID-19
MISO Installed Capacity (ICAP) Mix MISO Energy Mix
5644 37
2414
6870 75
7784
2736 40
44 48
420 27 54
711
3
7
15
47
11
15
0
50
100
150
200
250
300
2021
2025
2030
2035
2040
GW
Coal Gas Oil Hydro Nuclear Wind Solar Storage Other DG
258
166136
10070
178
205 259272
287
95
8678
4942
86
115129
141154
840
57 116 153
1219
25
0
100
200
300
400
500
600
700
800
2021
2025
2030
2035
2040
TW
h
Coal Gas Oil Hydro Nuclear Wind Solar Storage Other DG
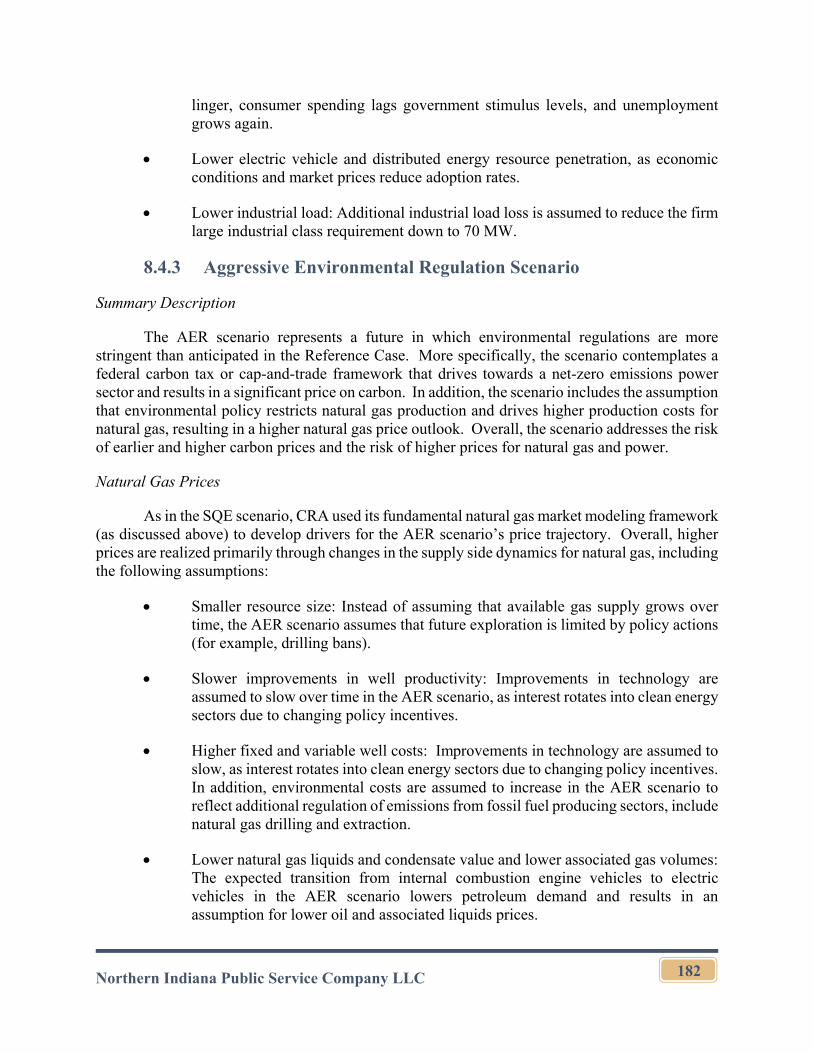
Northern Indiana Public Service Company LLC
182
linger, consumer spending lags government stimulus levels, and unemployment grows again.
Lower electric vehicle and distributed energy resource penetration, as economic conditions and market prices reduce adoption rates.
Lower industrial load: Additional industrial load loss is assumed to reduce the firm large industrial class requirement down to 70 MW.
8.4.3 Aggressive Environmental Regulation Scenario
Summary Description
The AER scenario represents a future in which environmental regulations are more stringent than anticipated in the Reference Case. More specifically, the scenario contemplates a federal carbon tax or cap-and-trade framework that drives towards a net-zero emissions power sector and results in a significant price on carbon. In addition, the scenario includes the assumption that environmental policy restricts natural gas production and drives higher production costs for natural gas, resulting in a higher natural gas price outlook. Overall, the scenario addresses the risk of earlier and higher carbon prices and the risk of higher prices for natural gas and power.
Natural Gas Prices
As in the SQE scenario, CRA used its fundamental natural gas market modeling framework (as discussed above) to develop drivers for the AER scenario’s price trajectory. Overall, higher prices are realized primarily through changes in the supply side dynamics for natural gas, including the following assumptions:
Smaller resource size: Instead of assuming that available gas supply grows over time, the AER scenario assumes that future exploration is limited by policy actions (for example, drilling bans).
Slower improvements in well productivity: Improvements in technology are assumed to slow over time in the AER scenario, as interest rotates into clean energy sectors due to changing policy incentives.
Higher fixed and variable well costs: Improvements in technology are assumed to slow, as interest rotates into clean energy sectors due to changing policy incentives. In addition, environmental costs are assumed to increase in the AER scenario to reflect additional regulation of emissions from fossil fuel producing sectors, include natural gas drilling and extraction.
Lower natural gas liquids and condensate value and lower associated gas volumes: The expected transition from internal combustion engine vehicles to electric vehicles in the AER scenario lowers petroleum demand and results in an assumption for lower oil and associated liquids prices.
Northern Indiana Public Service Company LLC
183
Figure 8-29 summarizes the major natural gas price drivers for the SQE scenario relative to those in the Reference Case.
Figure 8-29: Summary of Natural Gas Price Drivers for AER Scenario
Carbon Regulation
The AER scenario assumes a significant price on carbon, based on the premise that the Biden Administration and Congress lay the groundwork for a carbon emission reduction program via a tax or cap-and-trade regime, with future governments implementing stricter CO2 policy to establish net zero power sector targets by 2040. Under such assumptions, a price on carbon emissions would be instituted by 2024, with a ramp up in stringency over time to achieve net zero levels for the power sector. Based on CRA’s analysis, in the AER scenario, a carbon price increase to the $80-90/ton range (in real 2020$) could make certain alternative technologies required to achieve net zero emissions by the 2035-2040 time period (such as hydrogen, CCS, and nuclear) economically feasible. Figure 8-30 summarizes the carbon price projection in the AER scenario relative to the Reference Case. CRA’s MISO market analysis (discussed in additional detail below) projects that such a price would achieve clean energy generation percentages in the MISO region of approximately 90-95% by 2040.
In addition to the carbon pricing drivers, the AER scenario also assumes a five-year extension to the federal ITC at the 26% level and a three-year extension to the federal PTC at the 60% level. In addition, the scenario assumes that the ITC is extended to stand-alone storage facilities over the extension period. As of the time of the development of the 2021 IRP assumptions, only storage units paired with renewable energy resources can qualify for the ITC.
Driver Reference Case High (AER)
Resource Size• Rely on Potential Gas Committee (PGC) “Most-
Likely” unproven estimates• Remove resource growth resulting from
policy changes (eg. drilling bans)
Well Productivity• IP rates based on historic drilling data• IP improves as per EIA Tier 1 assumptions• Resource base is “Poor Heavy”
• Slow improvement as policy drives investment into clean energy sectors
Fixed & Variable Well Costs• Fixed and variable costs based on reported data• Costs improve as per EIA assumptions
• Slow improvement as policy drives investment into clean energy sectors
• Higher environmental costs
NGL & Condensate Value• Liquids valued at 70% of Annual Energy Outlook
(AEO) 2021 Reference Oil Price• Lower oil prices, given lower demand
Associated Gas Volumes• Natural gas from shale and tight oil plays enters
the market as a price taker• Lower, given lower oil demand
Domestic Demand• Electric demand taken from AURORA base case,
RCI demand based on AEO 2021 Reference Case• Significant drop in power sector and
other demand
LNG Exports• Under-construction projects completed and total
exports rising from around 7 bcf/d in 2020 to around 14 bcf/d by 2030
• Base view, even as U.S. prices increase
Pipeline Exports• Exports rise from 5 bcf/d in 2020 to just under 10
bcf/d by 2030 • Base view, even as U.S. prices increase
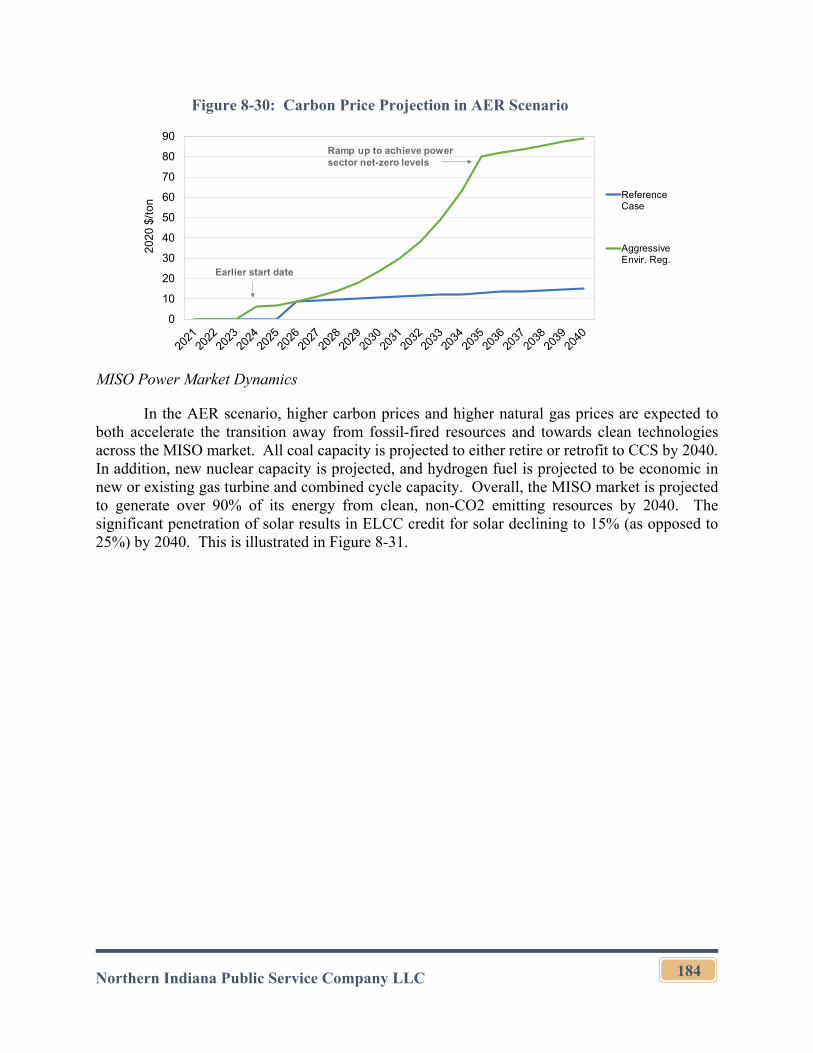
Northern Indiana Public Service Company LLC
184
Figure 8-30: Carbon Price Projection in AER Scenario
MISO Power Market Dynamics
In the AER scenario, higher carbon prices and higher natural gas prices are expected to both accelerate the transition away from fossil-fired resources and towards clean technologies across the MISO market. All coal capacity is projected to either retire or retrofit to CCS by 2040. In addition, new nuclear capacity is projected, and hydrogen fuel is projected to be economic in new or existing gas turbine and combined cycle capacity. Overall, the MISO market is projected to generate over 90% of its energy from clean, non-CO2 emitting resources by 2040. The significant penetration of solar results in ELCC credit for solar declining to 15% (as opposed to 25%) by 2040. This is illustrated in Figure 8-31.
0
10
20
30
40
50
60
70
80
9020
20 $
/ton
ReferenceCase
AggressiveEnvir. Reg.
Earlier start date
Ramp up to achieve power sector net-zero levels
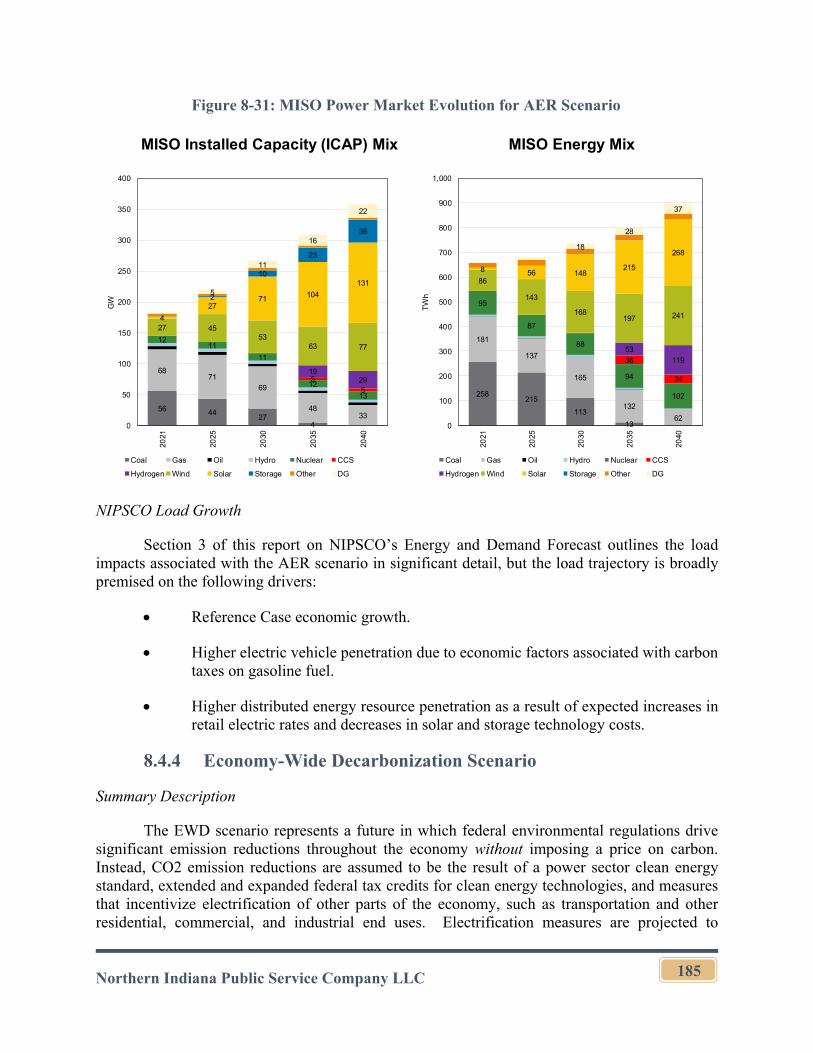
Northern Indiana Public Service Company LLC
185
Figure 8-31: MISO Power Market Evolution for AER Scenario
NIPSCO Load Growth
Section 3 of this report on NIPSCO’s Energy and Demand Forecast outlines the load impacts associated with the AER scenario in significant detail, but the load trajectory is broadly premised on the following drivers:
Reference Case economic growth.
Higher electric vehicle penetration due to economic factors associated with carbon taxes on gasoline fuel.
Higher distributed energy resource penetration as a result of expected increases in retail electric rates and decreases in solar and storage technology costs.
8.4.4 Economy-Wide Decarbonization Scenario
Summary Description
The EWD scenario represents a future in which federal environmental regulations drive significant emission reductions throughout the economy without imposing a price on carbon. Instead, CO2 emission reductions are assumed to be the result of a power sector clean energy standard, extended and expanded federal tax credits for clean energy technologies, and measures that incentivize electrification of other parts of the economy, such as transportation and other residential, commercial, and industrial end uses. Electrification measures are projected to
MISO Installed Capacity (ICAP) Mix MISO Energy Mix
56 4427
4
6871
69
4833
1211
11
12
13
5
5
1929
27 4553
63 77
4
2771 104
131
2
10
23
36
5
11
16
22
0
50
100
150
200
250
300
350
400
2021
2025
2030
2035
2040
GW
Coal Gas Oil Hydro Nuclear CCS
Hydrogen Wind Solar Storage Other DG
258215
113
13
181
137
165
132
62
95
87
88
94
102
36
34
53119
86
143
168197 241
8 56 148215
26818
28
37
0
100
200
300
400
500
600
700
800
900
1,000
2021
2025
2030
2035
2040
TW
h
Coal Gas Oil Hydro Nuclear CCS
Hydrogen Wind Solar Storage Other DG
Northern Indiana Public Service Company LLC
186
significantly increase power demand, particularly during the winter months. Overall, the scenario addresses the risk of strict environmental regulation without the consequent increase in power prices that would be expected with a carbon price, as well as the risk of higher-than-expected NIPSCO load.
Natural Gas Prices
By design, the natural gas price assumption for the EWD scenario is identical to the Reference Case. While certain environmental regulations in this scenario might decrease demand for natural gas, others might increase production costs. Thus, the long-term outlook from the Reference Case (see above) was preserved.
Carbon Regulation
The EWD scenario assumes several federal policy initiatives that drive towards economy-wide decarbonization. As described in more detail in Chapter 7 (Environmental Considerations), the scenario assumptions broadly adopt several elements of the climate policy objectives outlined in President Biden’s infrastructure plan framework. These include the following:
A ten-year extension for both the ITC at the 26% level and the PTC at the 60% level. In addition, the scenario assumes that the ITC is extended to stand-alone storage resources over the ten-year extension period. Furthermore, tax credit extensions or expansions to other advanced technology, such as hydrogen, CCS, and nuclear are assumed.
New federal investment and incentives to promote energy efficiency and electrification, including electric vehicles and other heating/industrial processes.
A national clean energy standard aiming to achieve net-zero carbon emissions from the power sector (inclusive of assumed non-power sector offsets) by 2040. This is broadly consistent with the Biden Administration’s stated goal of net-zero emissions for the power sector in 2035, but recognizes the potential for delays in full achievement given required technology advancement.
Overall, based on these scenario design considerations, no carbon pricing materializes, but the binding clean energy standard would be expected to drive a market for Clean Energy Credits or Zero Emission Electricity Credits. Under this construct, load serving entities like NIPSCO would be required to demonstrate compliance with the clean energy standard and be able to do so through their own resources or through the purchase Clean Energy Credits from other suppliers. If NIPSCO were to generate more clean energy than the target, excess credits could be sold. This construct is similar to the existing markets for Renewable Energy Credits.
CRA’s projection of Clean Energy Credit pricing under the EWD scenario is summarized in Figure 8-32. In the early years of the forecast horizon, the costs of marginal wind (and solar) additions would likely drive the market, keeping prices at or below $10/MWh. Over time, however, as the clean energy standard ramps up, higher cost resource additions would be required
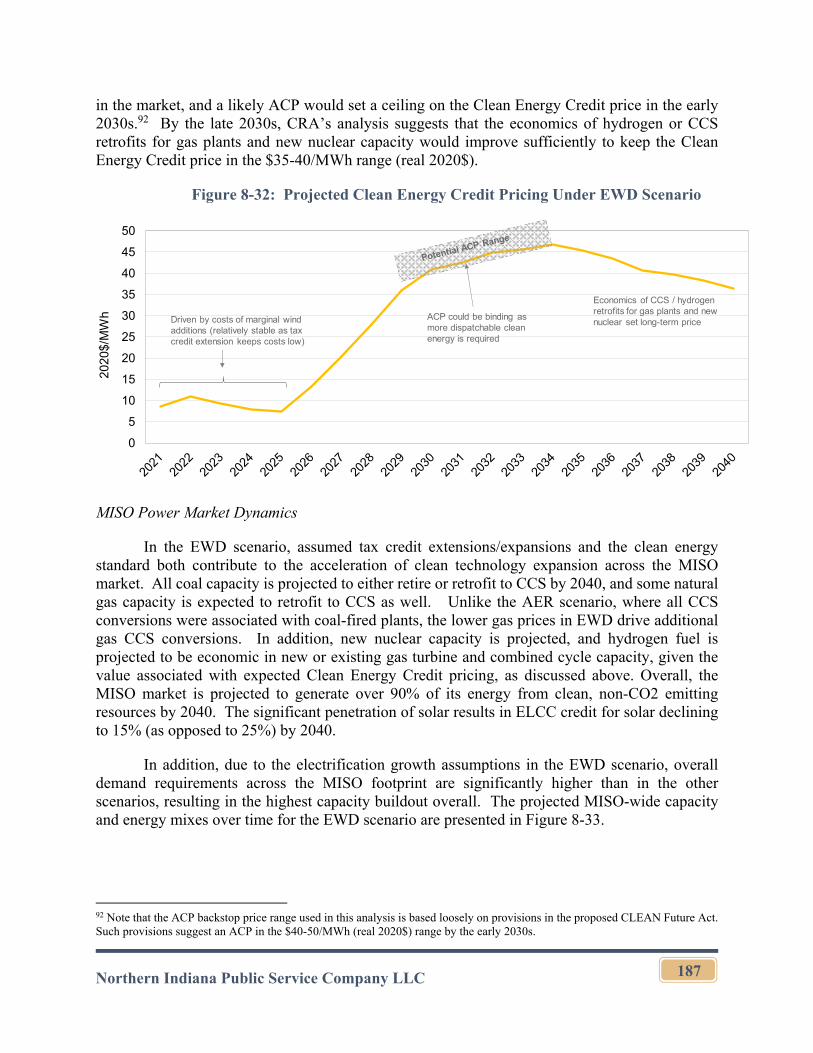
Northern Indiana Public Service Company LLC
187
in the market, and a likely ACP would set a ceiling on the Clean Energy Credit price in the early 2030s.92 By the late 2030s, CRA’s analysis suggests that the economics of hydrogen or CCS retrofits for gas plants and new nuclear capacity would improve sufficiently to keep the Clean Energy Credit price in the $35-40/MWh range (real 2020$).
Figure 8-32: Projected Clean Energy Credit Pricing Under EWD Scenario
MISO Power Market Dynamics
In the EWD scenario, assumed tax credit extensions/expansions and the clean energy standard both contribute to the acceleration of clean technology expansion across the MISO market. All coal capacity is projected to either retire or retrofit to CCS by 2040, and some natural gas capacity is expected to retrofit to CCS as well. Unlike the AER scenario, where all CCS conversions were associated with coal-fired plants, the lower gas prices in EWD drive additional gas CCS conversions. In addition, new nuclear capacity is projected, and hydrogen fuel is projected to be economic in new or existing gas turbine and combined cycle capacity, given the value associated with expected Clean Energy Credit pricing, as discussed above. Overall, the MISO market is projected to generate over 90% of its energy from clean, non-CO2 emitting resources by 2040. The significant penetration of solar results in ELCC credit for solar declining to 15% (as opposed to 25%) by 2040.
In addition, due to the electrification growth assumptions in the EWD scenario, overall demand requirements across the MISO footprint are significantly higher than in the other scenarios, resulting in the highest capacity buildout overall. The projected MISO-wide capacity and energy mixes over time for the EWD scenario are presented in Figure 8-33.
92 Note that the ACP backstop price range used in this analysis is based loosely on provisions in the proposed CLEAN Future Act. Such provisions suggest an ACP in the $40-50/MWh (real 2020$) range by the early 2030s.
0
5
10
15
20
25
30
35
40
45
50
2020
$/M
Wh Driven by costs of marginal wind
additions (relatively stable as tax credit extension keeps costs low)
ACP could be binding as more dispatchable clean energy is required
Economics of CCS / hydrogen retrofits for gas plants and new nuclear set long-term price
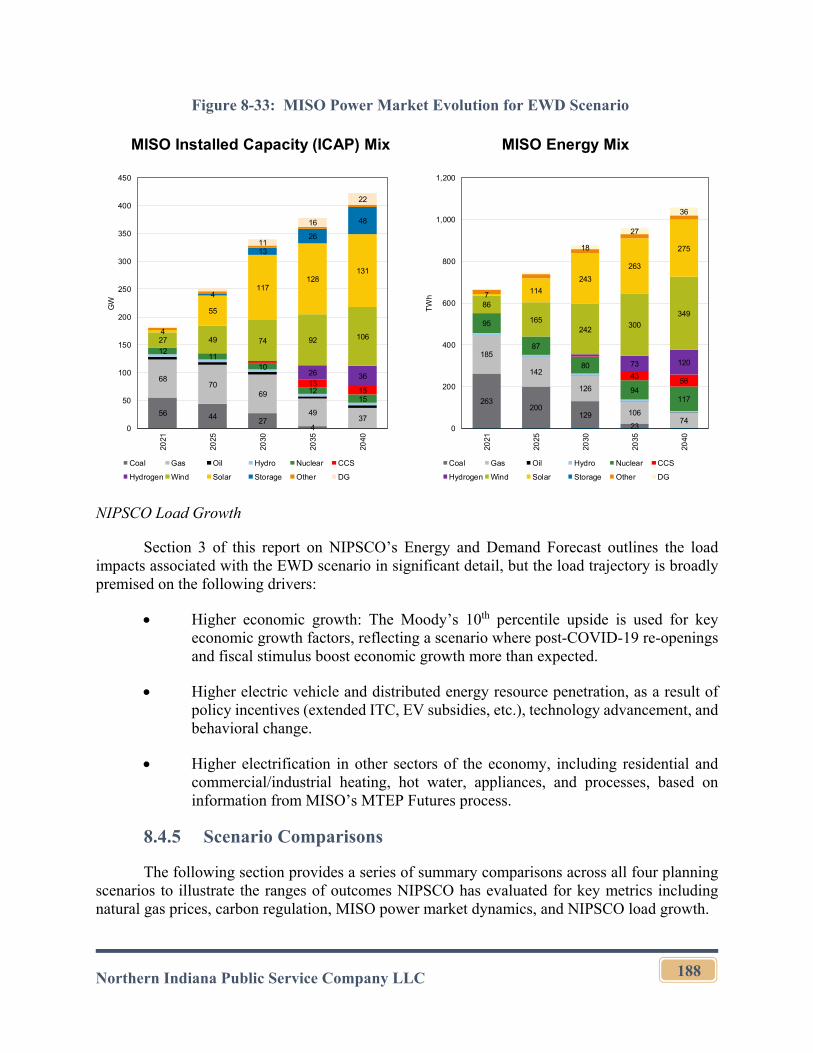
Northern Indiana Public Service Company LLC
188
Figure 8-33: MISO Power Market Evolution for EWD Scenario
NIPSCO Load Growth
Section 3 of this report on NIPSCO’s Energy and Demand Forecast outlines the load impacts associated with the EWD scenario in significant detail, but the load trajectory is broadly premised on the following drivers:
Higher economic growth: The Moody’s 10th percentile upside is used for key economic growth factors, reflecting a scenario where post-COVID-19 re-openings and fiscal stimulus boost economic growth more than expected.
Higher electric vehicle and distributed energy resource penetration, as a result of policy incentives (extended ITC, EV subsidies, etc.), technology advancement, and behavioral change.
Higher electrification in other sectors of the economy, including residential and commercial/industrial heating, hot water, appliances, and processes, based on information from MISO’s MTEP Futures process.
8.4.5 Scenario Comparisons
The following section provides a series of summary comparisons across all four planning scenarios to illustrate the ranges of outcomes NIPSCO has evaluated for key metrics including natural gas prices, carbon regulation, MISO power market dynamics, and NIPSCO load growth.
MISO Installed Capacity (ICAP) Mix MISO Energy Mix
56 4427
4
6870
69
4937
1211
10
1215
1315
26 36
27 49 74 92 1064
55
117128
131
4
13
26
48
11
16
22
0
50
100
150
200
250
300
350
400
450
2021
2025
2030
2035
2040
GW
Coal Gas Oil Hydro Nuclear CCS
Hydrogen Wind Solar Storage Other DG
263200
129
23
185
142
126
10674
95
87
80
94117
4356
73 120
86
165242
300
349
7 114
243
263
27518
27
36
0
200
400
600
800
1,000
1,200
2021
2025
2030
2035
2040
TW
h
Coal Gas Oil Hydro Nuclear CCS
Hydrogen Wind Solar Storage Other DG
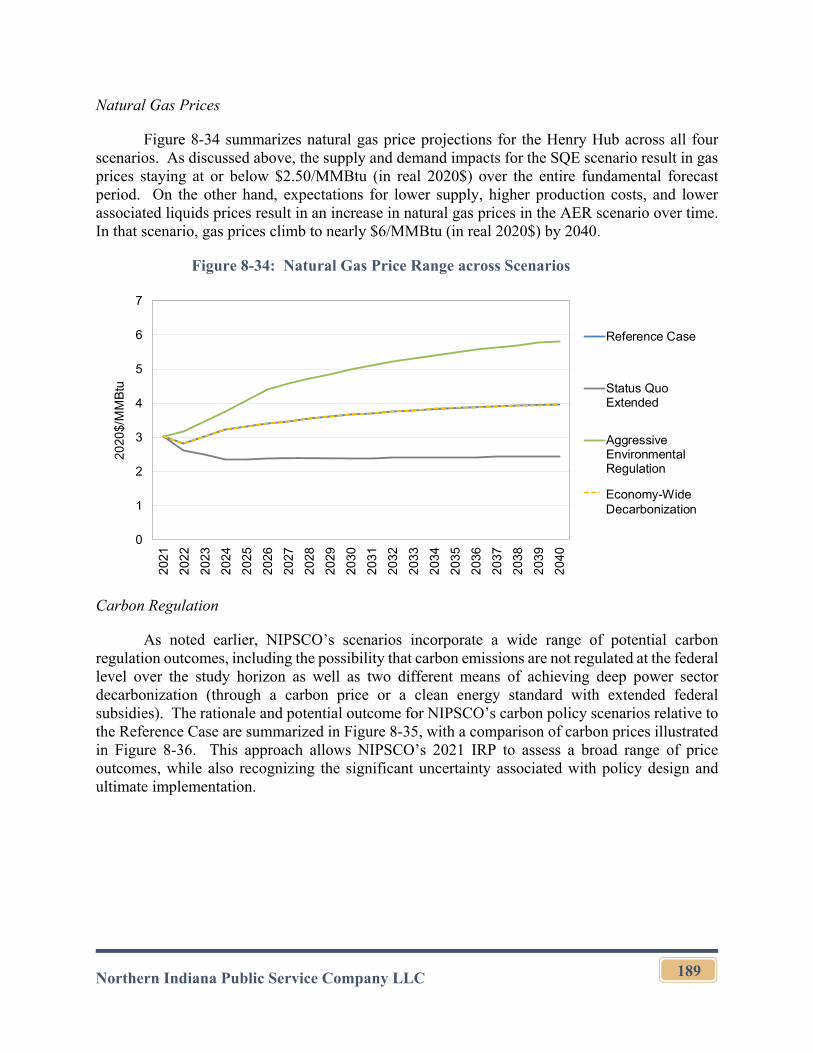
Northern Indiana Public Service Company LLC
189
Natural Gas Prices
Figure 8-34 summarizes natural gas price projections for the Henry Hub across all four scenarios. As discussed above, the supply and demand impacts for the SQE scenario result in gas prices staying at or below $2.50/MMBtu (in real 2020$) over the entire fundamental forecast period. On the other hand, expectations for lower supply, higher production costs, and lower associated liquids prices result in an increase in natural gas prices in the AER scenario over time. In that scenario, gas prices climb to nearly $6/MMBtu (in real 2020$) by 2040.
Figure 8-34: Natural Gas Price Range across Scenarios
Carbon Regulation
As noted earlier, NIPSCO’s scenarios incorporate a wide range of potential carbon regulation outcomes, including the possibility that carbon emissions are not regulated at the federal level over the study horizon as well as two different means of achieving deep power sector decarbonization (through a carbon price or a clean energy standard with extended federal subsidies). The rationale and potential outcome for NIPSCO’s carbon policy scenarios relative to the Reference Case are summarized in Figure 8-35, with a comparison of carbon prices illustrated in Figure 8-36. This approach allows NIPSCO’s 2021 IRP to assess a broad range of price outcomes, while also recognizing the significant uncertainty associated with policy design and ultimate implementation.
0
1
2
3
4
5
6
7
202
1
202
2
202
3
202
4
202
5
202
6
202
7
202
8
202
9
203
0
203
1
203
2
203
3
203
4
203
5
203
6
203
7
203
8
203
9
204
0
2020
$/M
MB
tu
Reference Case
Status QuoExtended
AggressiveEnvironmentalRegulation
Economy-wideDecarbonization/Ectrification
Economy-Wide Decarbonization
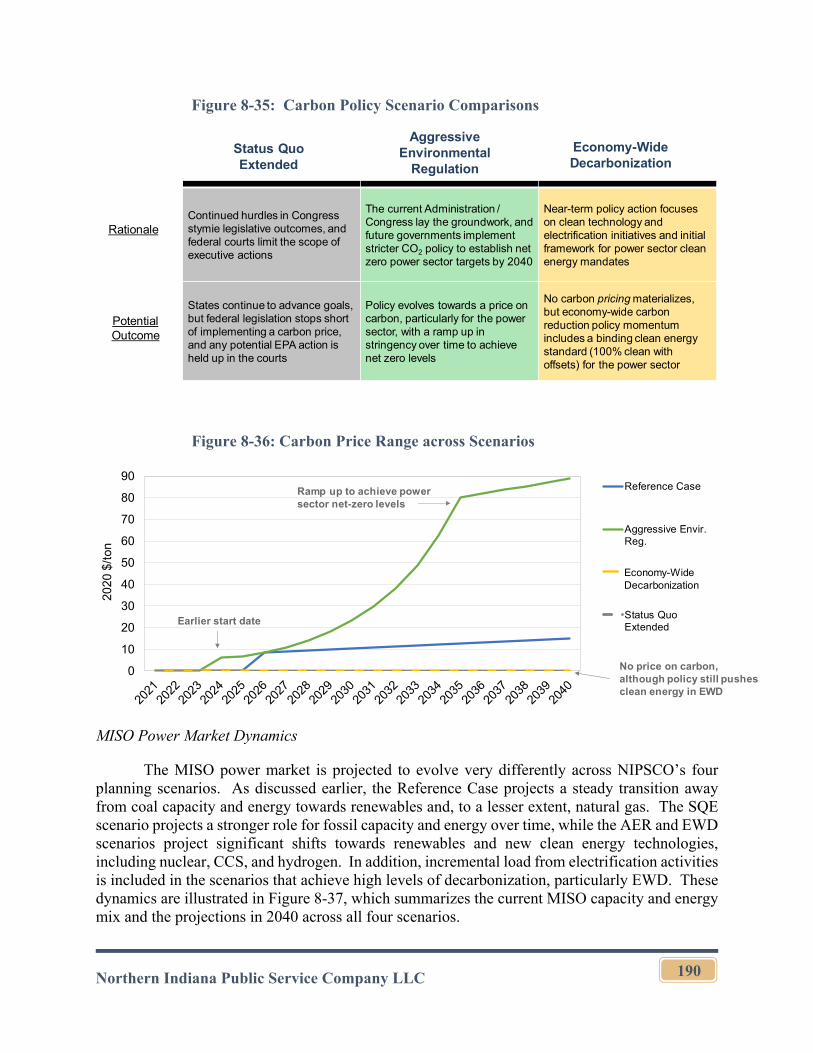
Northern Indiana Public Service Company LLC
190
Figure 8-35: Carbon Policy Scenario Comparisons
Figure 8-36: Carbon Price Range across Scenarios
MISO Power Market Dynamics
The MISO power market is projected to evolve very differently across NIPSCO’s four planning scenarios. As discussed earlier, the Reference Case projects a steady transition away from coal capacity and energy towards renewables and, to a lesser extent, natural gas. The SQE scenario projects a stronger role for fossil capacity and energy over time, while the AER and EWD scenarios project significant shifts towards renewables and new clean energy technologies, including nuclear, CCS, and hydrogen. In addition, incremental load from electrification activities is included in the scenarios that achieve high levels of decarbonization, particularly EWD. These dynamics are illustrated in Figure 8-37, which summarizes the current MISO capacity and energy mix and the projections in 2040 across all four scenarios.
Status Quo Extended
Rationale
Potential Outcome
Aggressive Environmental
Regulation
Economy-Wide Decarbonization
Continued hurdles in Congress stymie legislative outcomes, and federal courts limit the scope of executive actions
The current Administration / Congress lay the groundwork, and future governments implement stricter CO2 policy to establish net zero power sector targets by 2040
Near-term policy action focuses on clean technology and electrification initiatives and initial framework for power sector clean energy mandates
States continue to advance goals, but federal legislation stops short of implementing a carbon price, and any potential EPA action is held up in the courts
Policy evolves towards a price on carbon, particularly for the power sector, with a ramp up in stringency over time to achieve net zero levels
No carbon pricing materializes, but economy-wide carbon reduction policy momentum includes a binding clean energy standard (100% clean with offsets) for the power sector
0
10
20
30
40
50
60
70
80
90
2020
$/t
on
Reference Case
Aggressive Envir.Reg.
Economy-wideDecarbonization/Electrification
Status QuoExtended
Earlier start date
Ramp up to achieve power sector net-zero levels
No price on carbon, although policy still pushes clean energy in EWD
Economy-Wide Decarbonization
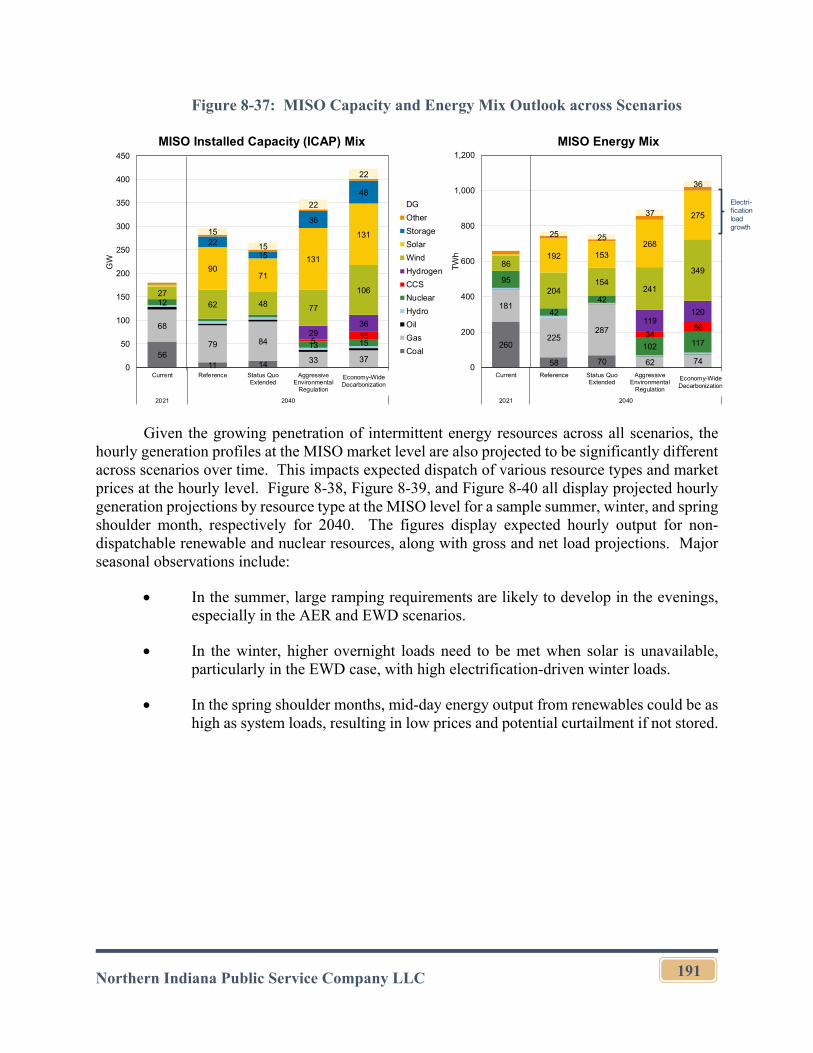
Northern Indiana Public Service Company LLC
191
Figure 8-37: MISO Capacity and Energy Mix Outlook across Scenarios
Given the growing penetration of intermittent energy resources across all scenarios, the hourly generation profiles at the MISO market level are also projected to be significantly different across scenarios over time. This impacts expected dispatch of various resource types and market prices at the hourly level. Figure 8-38, Figure 8-39, and Figure 8-40 all display projected hourly generation projections by resource type at the MISO level for a sample summer, winter, and spring shoulder month, respectively for 2040. The figures display expected hourly output for non-dispatchable renewable and nuclear resources, along with gross and net load projections. Major seasonal observations include:
In the summer, large ramping requirements are likely to develop in the evenings, especially in the AER and EWD scenarios.
In the winter, higher overnight loads need to be met when solar is unavailable, particularly in the EWD case, with high electrification-driven winter loads.
In the spring shoulder months, mid-day energy output from renewables could be as high as system loads, resulting in low prices and potential curtailment if not stored.
260
58 70
181
225287
62 74
95
42
42
102 11734
56119
120
86
204154
241
349
192 153268
275
25 25
37
36
0
200
400
600
800
1,000
1,200
Current Reference Status QuoExtended
AggressiveEnvironmental
Regulation
Economy-wideDecarbonization/
Electrification
2021 2040
TW
h
5611 14
68
79 84
33 37
12
13 155152936
2762 48 77
106
9071
131
13122
15
36
48
15
15
22
22
0
50
100
150
200
250
300
350
400
450
Current Reference Status QuoExtended
AggressiveEnvironmental
Regulation
Economy-wideDecarbonization/
Electrification
2021 2040
GW
DG
Other
Storage
Solar
Wind
Hydrogen
CCS
Nuclear
Hydro
Oil
Gas
Coal
MISO Installed Capacity (ICAP) Mix MISO Energy Mix
Electri-fication load growth
Economy-Wide Decarbonization
Economy-Wide Decarbonization
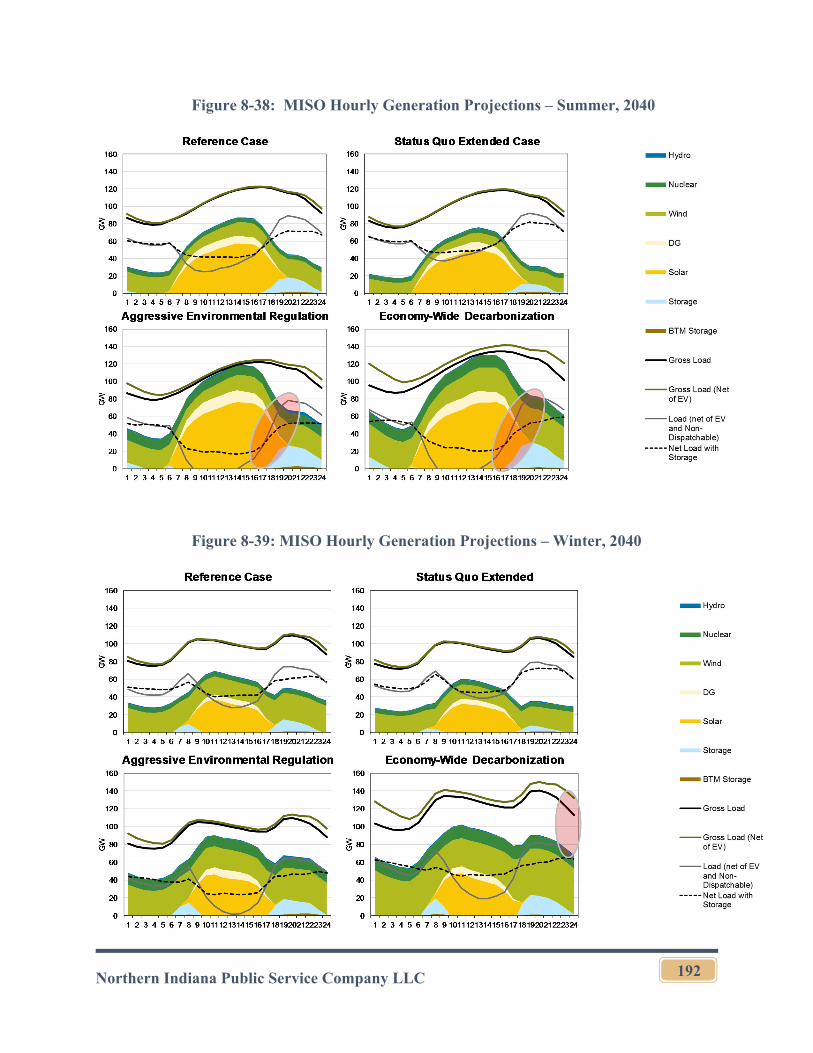
Northern Indiana Public Service Company LLC
192
Figure 8-38: MISO Hourly Generation Projections – Summer, 2040
Figure 8-39: MISO Hourly Generation Projections – Winter, 2040
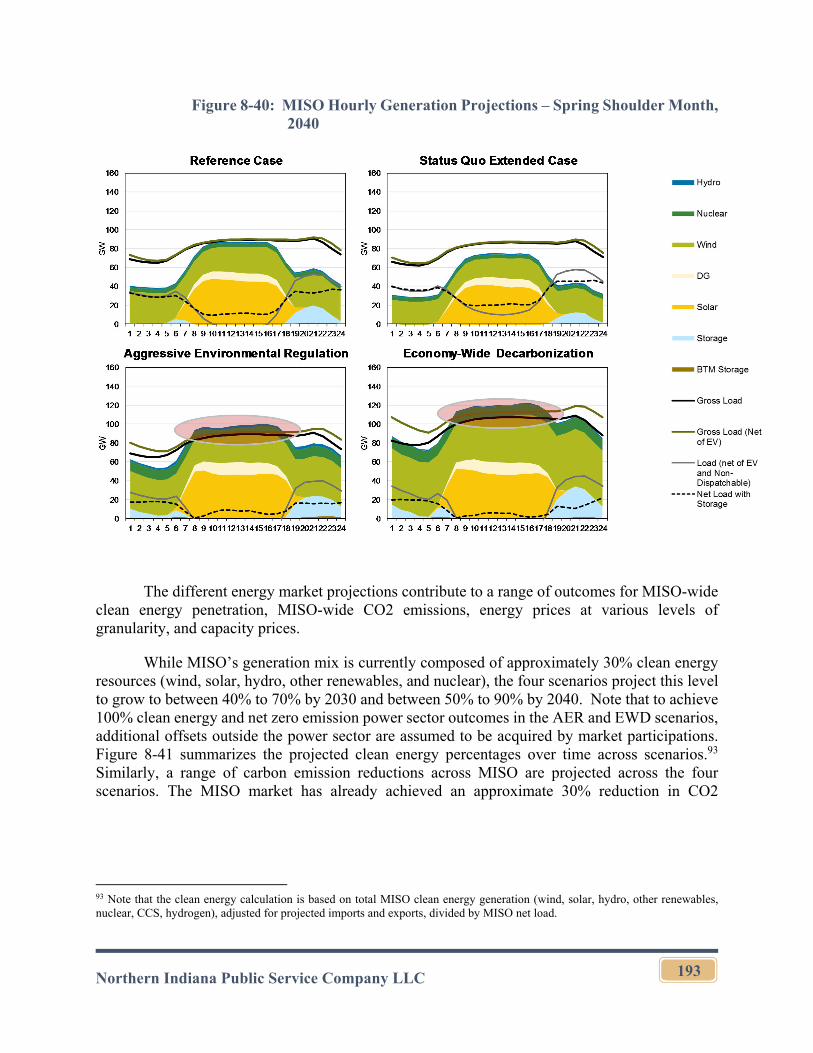
Northern Indiana Public Service Company LLC
193
Figure 8-40: MISO Hourly Generation Projections – Spring Shoulder Month, 2040
The different energy market projections contribute to a range of outcomes for MISO-wide clean energy penetration, MISO-wide CO2 emissions, energy prices at various levels of granularity, and capacity prices.
While MISO’s generation mix is currently composed of approximately 30% clean energy resources (wind, solar, hydro, other renewables, and nuclear), the four scenarios project this level to grow to between 40% to 70% by 2030 and between 50% to 90% by 2040. Note that to achieve 100% clean energy and net zero emission power sector outcomes in the AER and EWD scenarios, additional offsets outside the power sector are assumed to be acquired by market participations. Figure 8-41 summarizes the projected clean energy percentages over time across scenarios.93 Similarly, a range of carbon emission reductions across MISO are projected across the four scenarios. The MISO market has already achieved an approximate 30% reduction in CO2
93 Note that the clean energy calculation is based on total MISO clean energy generation (wind, solar, hydro, other renewables, nuclear, CCS, hydrogen), adjusted for projected imports and exports, divided by MISO net load.
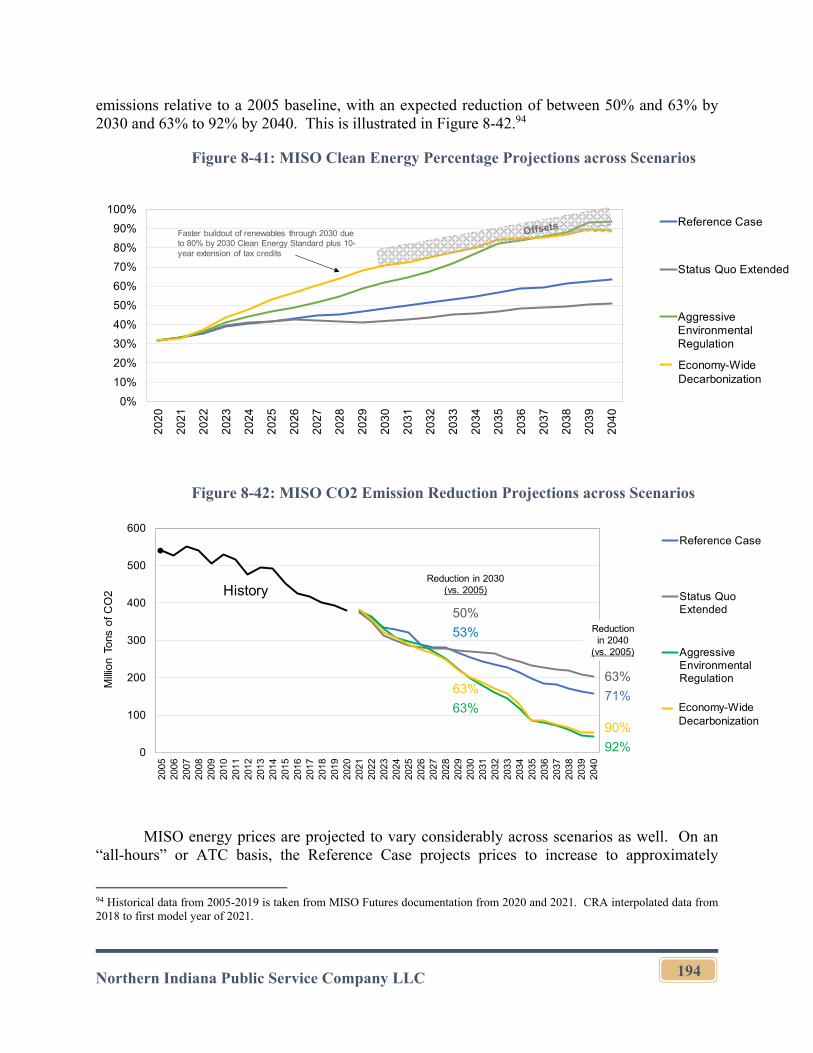
Northern Indiana Public Service Company LLC
194
emissions relative to a 2005 baseline, with an expected reduction of between 50% and 63% by 2030 and 63% to 92% by 2040. This is illustrated in Figure 8-42.94
Figure 8-41: MISO Clean Energy Percentage Projections across Scenarios
Figure 8-42: MISO CO2 Emission Reduction Projections across Scenarios
MISO energy prices are projected to vary considerably across scenarios as well. On an “all-hours” or ATC basis, the Reference Case projects prices to increase to approximately
94 Historical data from 2005-2019 is taken from MISO Futures documentation from 2020 and 2021. CRA interpolated data from 2018 to first model year of 2021.
0%
10%
20%
30%
40%
50%
60%
70%
80%
90%
100%
20
20
20
21
20
22
20
23
20
24
20
25
20
26
20
27
20
28
20
29
20
30
20
31
20
32
20
33
20
34
20
35
20
36
20
37
20
38
20
39
20
40
Reference Case
Status Quo Extended
AggressiveEnvironmentalRegulation
Economy-wideDecarbonization/Electcation
Faster buildout of renewables through 2030 due to 80% by 2030 Clean Energy Standard plus 10-year extension of tax credits
Economy-Wide Decarbonization
0
100
200
300
400
500
600
2005
2006
2007
2008
2009
2010
2011
2012
2013
2014
2015
2016
2017
2018
2019
2020
2021
2022
2023
2024
2025
2026
2027
2028
2029
2030
2031
2032
2033
2034
2035
2036
2037
2038
2039
2040
Mill
ion
Tons
of
CO
2
Reference Case
Status QuoExtended
AggressiveEnvironmentalRegulation
Economy-wideDecarbonization/Electrification
History
63%
63%
50%
53%
90%
92%
63%
71%
Reduction in 2030 (vs. 2005)
Reduction in 2040
(vs. 2005)
Economy-Wide Decarbonization
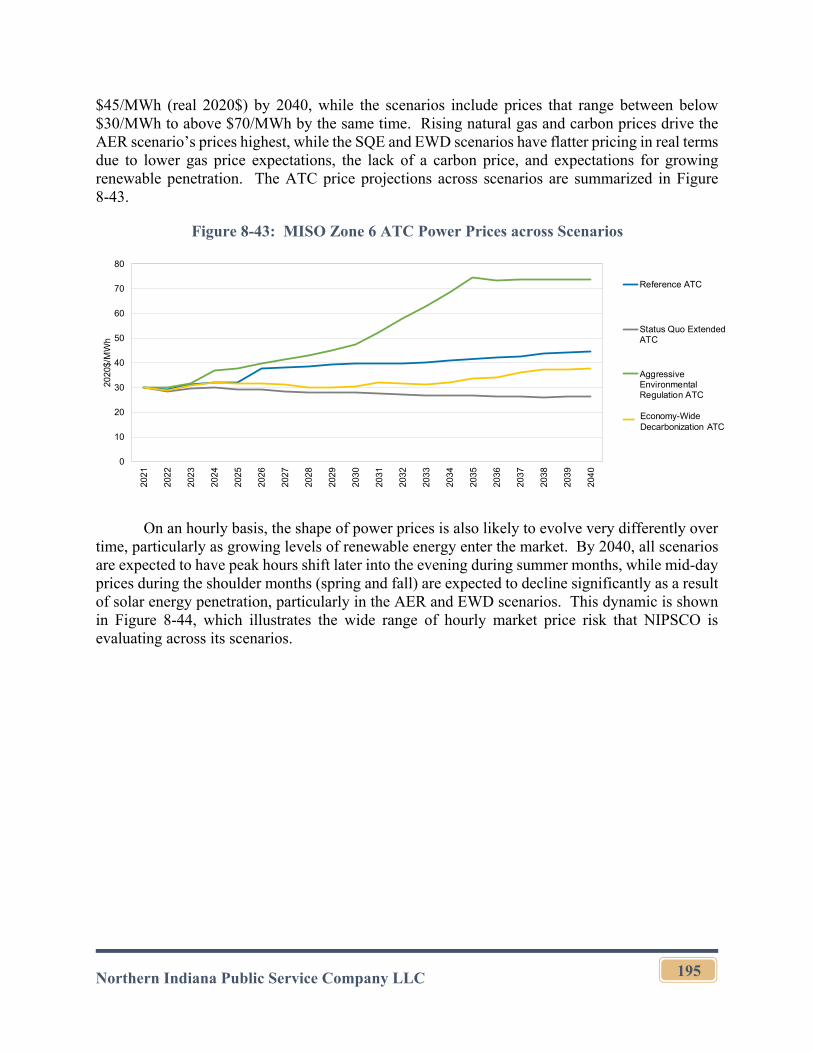
Northern Indiana Public Service Company LLC
195
$45/MWh (real 2020$) by 2040, while the scenarios include prices that range between below $30/MWh to above $70/MWh by the same time. Rising natural gas and carbon prices drive the AER scenario’s prices highest, while the SQE and EWD scenarios have flatter pricing in real terms due to lower gas price expectations, the lack of a carbon price, and expectations for growing renewable penetration. The ATC price projections across scenarios are summarized in Figure 8-43.
Figure 8-43: MISO Zone 6 ATC Power Prices across Scenarios
On an hourly basis, the shape of power prices is also likely to evolve very differently over time, particularly as growing levels of renewable energy enter the market. By 2040, all scenarios are expected to have peak hours shift later into the evening during summer months, while mid-day prices during the shoulder months (spring and fall) are expected to decline significantly as a result of solar energy penetration, particularly in the AER and EWD scenarios. This dynamic is shown in Figure 8-44, which illustrates the wide range of hourly market price risk that NIPSCO is evaluating across its scenarios.
0
10
20
30
40
50
60
70
80
2021
2022
2023
2024
2025
2026
2027
2028
2029
2030
2031
2032
2033
2034
2035
2036
2037
2038
2039
2040
2020
$/M
Wh
Reference ATC
Status Quo ExtendedATC
AggressiveEnvironmentalRegulation ATC
Economy-wideDecarbonization/Electrification ATC
Economy-Wide Decarbonization ATC
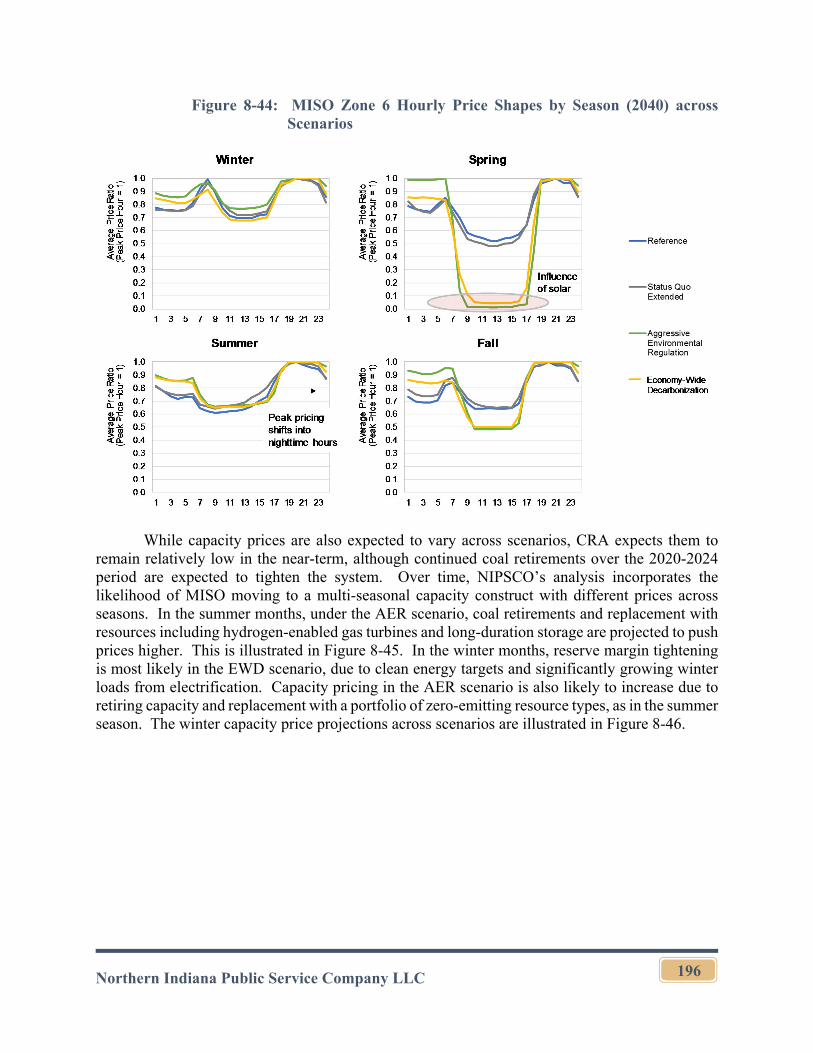
Northern Indiana Public Service Company LLC
196
Figure 8-44: MISO Zone 6 Hourly Price Shapes by Season (2040) across Scenarios
While capacity prices are also expected to vary across scenarios, CRA expects them to remain relatively low in the near-term, although continued coal retirements over the 2020-2024 period are expected to tighten the system. Over time, NIPSCO’s analysis incorporates the likelihood of MISO moving to a multi-seasonal capacity construct with different prices across seasons. In the summer months, under the AER scenario, coal retirements and replacement with resources including hydrogen-enabled gas turbines and long-duration storage are projected to push prices higher. This is illustrated in Figure 8-45. In the winter months, reserve margin tightening is most likely in the EWD scenario, due to clean energy targets and significantly growing winter loads from electrification. Capacity pricing in the AER scenario is also likely to increase due to retiring capacity and replacement with a portfolio of zero-emitting resource types, as in the summer season. The winter capacity price projections across scenarios are illustrated in Figure 8-46.
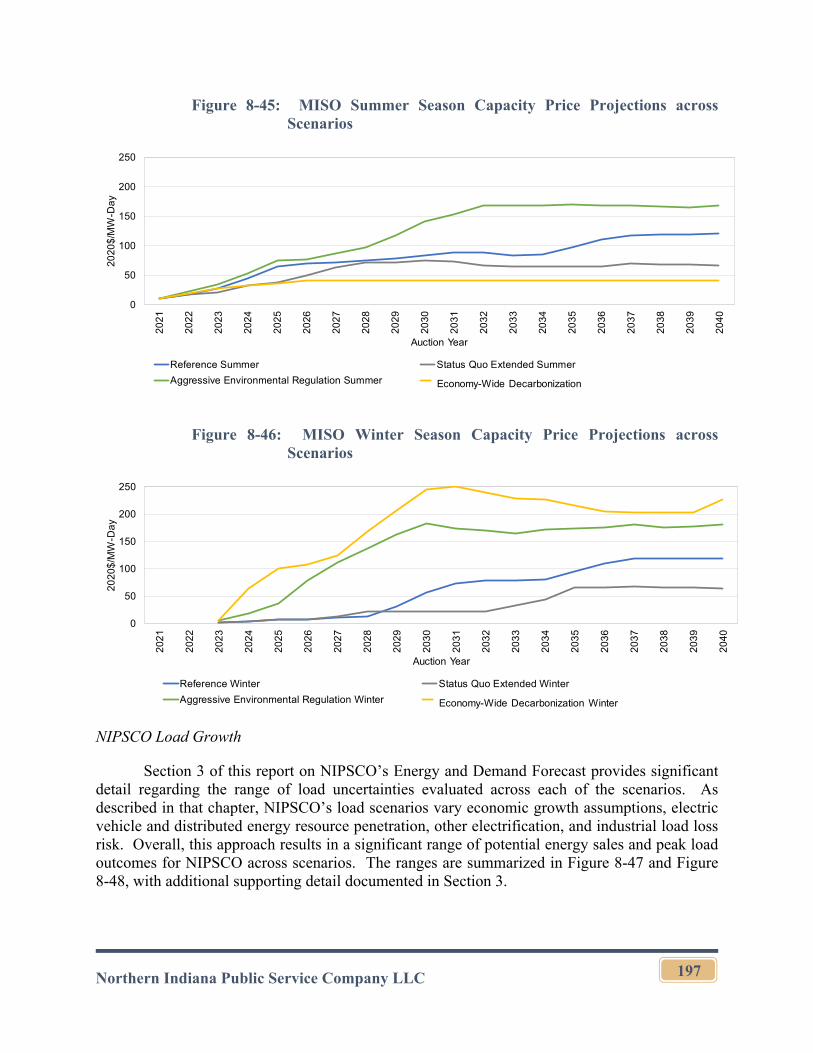
Northern Indiana Public Service Company LLC
197
Figure 8-45: MISO Summer Season Capacity Price Projections across Scenarios
Figure 8-46: MISO Winter Season Capacity Price Projections across Scenarios
NIPSCO Load Growth
Section 3 of this report on NIPSCO’s Energy and Demand Forecast provides significant detail regarding the range of load uncertainties evaluated across each of the scenarios. As described in that chapter, NIPSCO’s load scenarios vary economic growth assumptions, electric vehicle and distributed energy resource penetration, other electrification, and industrial load loss risk. Overall, this approach results in a significant range of potential energy sales and peak load outcomes for NIPSCO across scenarios. The ranges are summarized in Figure 8-47 and Figure 8-48, with additional supporting detail documented in Section 3.
0
50
100
150
200
2502
02
1
20
22
20
23
20
24
20
25
20
26
20
27
20
28
20
29
20
30
20
31
20
32
20
33
20
34
20
35
20
36
20
37
20
38
20
39
20
40
20
20
$/M
W-D
ay
Auction Year
Reference Summer Status Quo Extended Summer
Aggressive Environmental Regulation Summer Economy-wide Decarbonization/Electrification SummerEconomy-Wide Decarbonization
0
50
100
150
200
250
20
21
20
22
20
23
20
24
20
25
20
26
20
27
20
28
20
29
20
30
20
31
20
32
20
33
20
34
20
35
20
36
20
37
20
38
20
39
20
40
20
20
$/M
W-D
ay
Auction Year
Reference Winter Status Quo Extended Winter
Aggressive Environmental Regulation Winter Economy-wide Decarbonization/Electrification WinterEconomy-Wide Decarbonization Winter
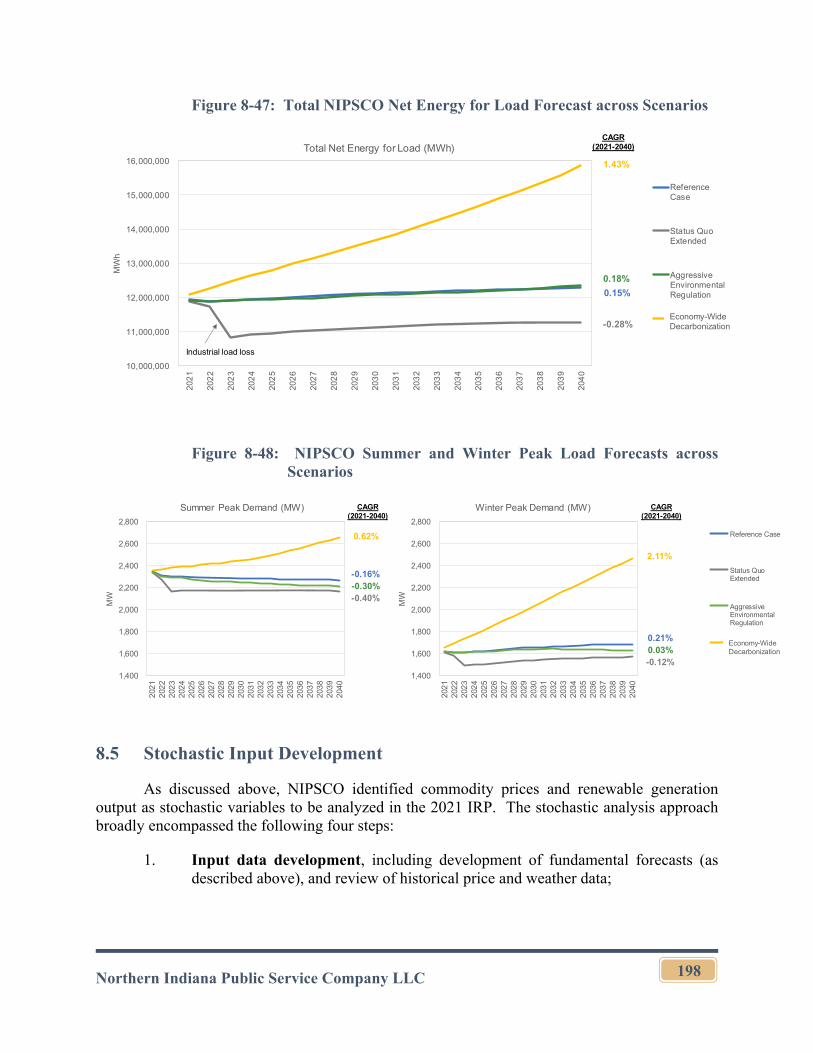
Northern Indiana Public Service Company LLC
198
Figure 8-47: Total NIPSCO Net Energy for Load Forecast across Scenarios
Figure 8-48: NIPSCO Summer and Winter Peak Load Forecasts across Scenarios
8.5 Stochastic Input Development
As discussed above, NIPSCO identified commodity prices and renewable generation output as stochastic variables to be analyzed in the 2021 IRP. The stochastic analysis approach broadly encompassed the following four steps:
1. Input data development, including development of fundamental forecasts (as described above), and review of historical price and weather data;
10,000,000
11,000,000
12,000,000
13,000,000
14,000,000
15,000,000
16,000,000
202
1
202
2
202
3
202
4
202
5
202
6
202
7
202
8
202
9
203
0
203
1
203
2
203
3
203
4
203
5
203
6
203
7
203
8
203
9
204
0
MW
h
Total Net Energy for Load (MWh)
ReferenceCase
Status QuoExtended
AggressiveEnvironmentalRegulation
Economy-wideDecarb andElectrification
CAGR (2021-2040)
1.43%
0.18%
0.15%
-0.28%
Industrial load loss
Economy-Wide Decarbonization
1,400
1,600
1,800
2,000
2,200
2,400
2,600
2,800
2021
2022
2023
2024
2025
2026
2027
2028
2029
2030
2031
2032
2033
2034
2035
2036
2037
2038
2039
2040
MW
Summer Peak Demand (MW)
1,400
1,600
1,800
2,000
2,200
2,400
2,600
2,800
2021
2022
2023
2024
2025
2026
2027
2028
2029
2030
2031
2032
2033
2034
2035
2036
2037
2038
2039
2040
MW
Winter Peak Demand (MW)
Reference Case
Status QuoExtended
AggressiveEnvironmentalRegulation
Economy-wideDecarb andElectrification
2.11%
0.03%0.21%
-0.12%
CAGR(2021-2040)
0.62%
-0.30%-0.16%
-0.40%
CAGR(2021-2040)
Economy-Wide Decarbonization
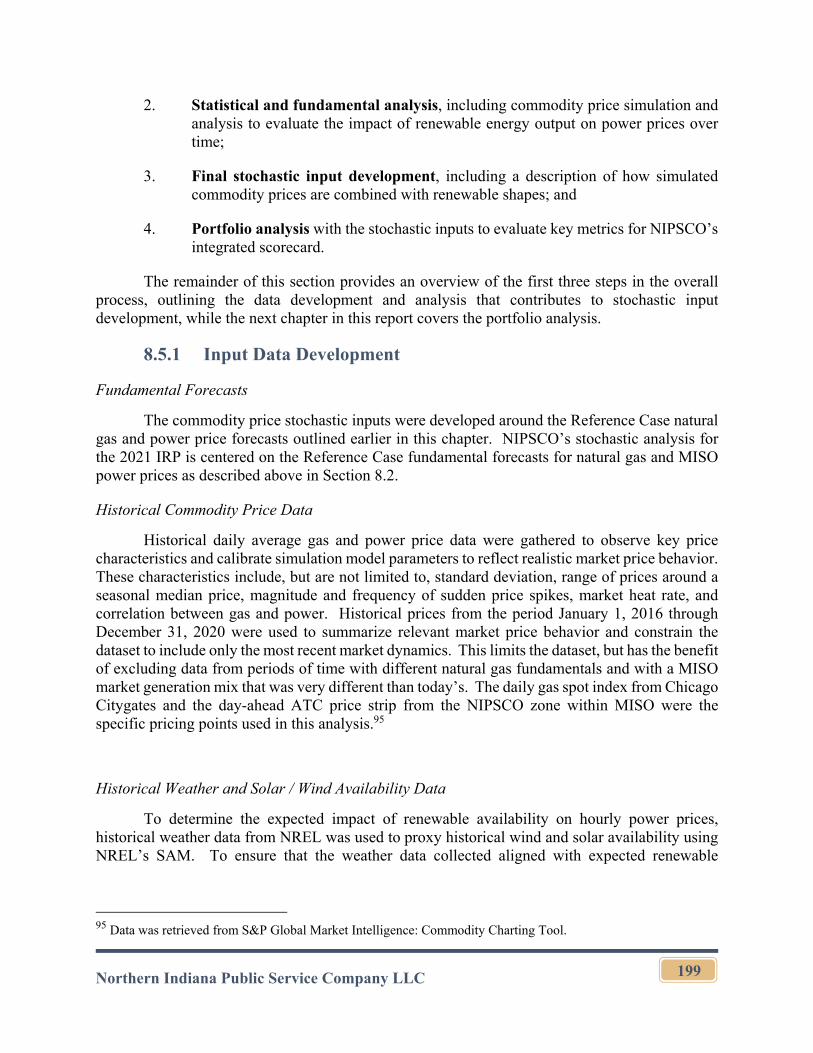
Northern Indiana Public Service Company LLC
199
2. Statistical and fundamental analysis, including commodity price simulation and analysis to evaluate the impact of renewable energy output on power prices over time;
3. Final stochastic input development, including a description of how simulated commodity prices are combined with renewable shapes; and
4. Portfolio analysis with the stochastic inputs to evaluate key metrics for NIPSCO’s integrated scorecard.
The remainder of this section provides an overview of the first three steps in the overall process, outlining the data development and analysis that contributes to stochastic input development, while the next chapter in this report covers the portfolio analysis.
8.5.1 Input Data Development
Fundamental Forecasts
The commodity price stochastic inputs were developed around the Reference Case natural gas and power price forecasts outlined earlier in this chapter. NIPSCO’s stochastic analysis for the 2021 IRP is centered on the Reference Case fundamental forecasts for natural gas and MISO power prices as described above in Section 8.2.
Historical Commodity Price Data
Historical daily average gas and power price data were gathered to observe key price characteristics and calibrate simulation model parameters to reflect realistic market price behavior. These characteristics include, but are not limited to, standard deviation, range of prices around a seasonal median price, magnitude and frequency of sudden price spikes, market heat rate, and correlation between gas and power. Historical prices from the period January 1, 2016 through December 31, 2020 were used to summarize relevant market price behavior and constrain the dataset to include only the most recent market dynamics. This limits the dataset, but has the benefit of excluding data from periods of time with different natural gas fundamentals and with a MISO market generation mix that was very different than today’s. The daily gas spot index from Chicago Citygates and the day-ahead ATC price strip from the NIPSCO zone within MISO were the specific pricing points used in this analysis.95
Historical Weather and Solar / Wind Availability Data
To determine the expected impact of renewable availability on hourly power prices, historical weather data from NREL was used to proxy historical wind and solar availability using NREL’s SAM. To ensure that the weather data collected aligned with expected renewable
95 Data was retrieved from S&P Global Market Intelligence: Commodity Charting Tool.
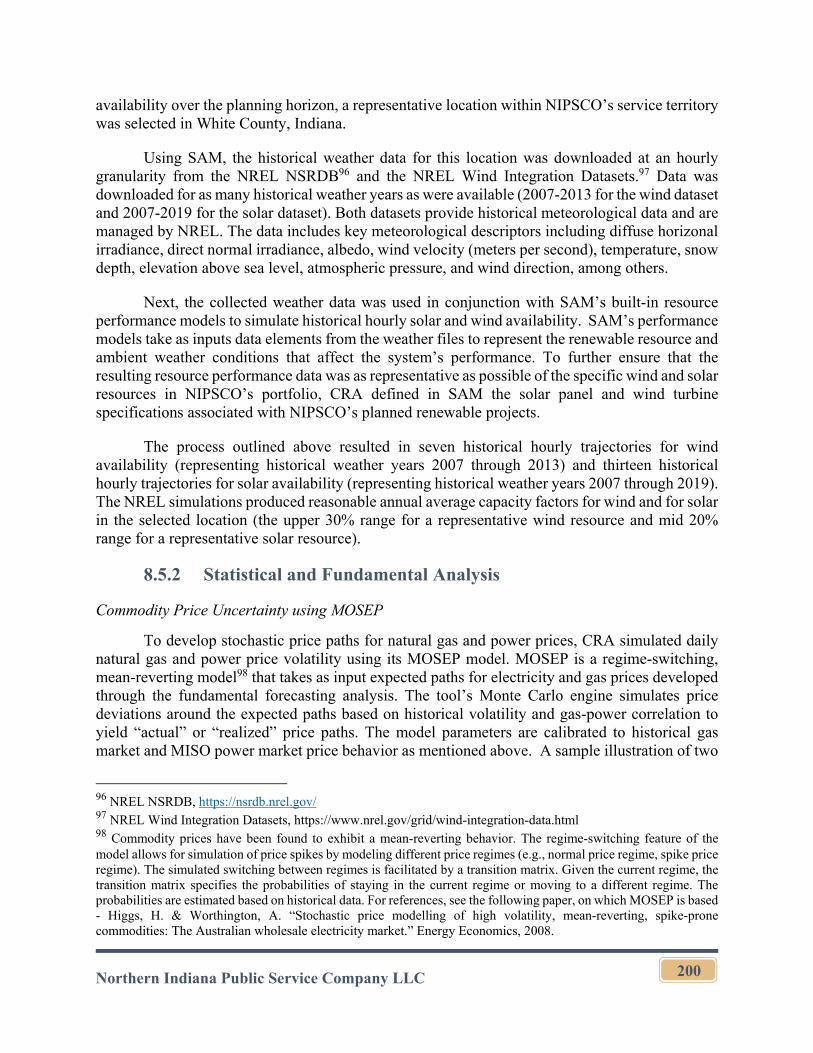
Northern Indiana Public Service Company LLC
200
availability over the planning horizon, a representative location within NIPSCO’s service territory was selected in White County, Indiana.
Using SAM, the historical weather data for this location was downloaded at an hourly granularity from the NREL NSRDB96 and the NREL Wind Integration Datasets.97 Data was downloaded for as many historical weather years as were available (2007-2013 for the wind dataset and 2007-2019 for the solar dataset). Both datasets provide historical meteorological data and are managed by NREL. The data includes key meteorological descriptors including diffuse horizonal irradiance, direct normal irradiance, albedo, wind velocity (meters per second), temperature, snow depth, elevation above sea level, atmospheric pressure, and wind direction, among others.
Next, the collected weather data was used in conjunction with SAM’s built-in resource performance models to simulate historical hourly solar and wind availability. SAM’s performance models take as inputs data elements from the weather files to represent the renewable resource and ambient weather conditions that affect the system’s performance. To further ensure that the resulting resource performance data was as representative as possible of the specific wind and solar resources in NIPSCO’s portfolio, CRA defined in SAM the solar panel and wind turbine specifications associated with NIPSCO’s planned renewable projects.
The process outlined above resulted in seven historical hourly trajectories for wind availability (representing historical weather years 2007 through 2013) and thirteen historical hourly trajectories for solar availability (representing historical weather years 2007 through 2019). The NREL simulations produced reasonable annual average capacity factors for wind and for solar in the selected location (the upper 30% range for a representative wind resource and mid 20% range for a representative solar resource).
8.5.2 Statistical and Fundamental Analysis
Commodity Price Uncertainty using MOSEP
To develop stochastic price paths for natural gas and power prices, CRA simulated daily natural gas and power price volatility using its MOSEP model. MOSEP is a regime-switching, mean-reverting model98 that takes as input expected paths for electricity and gas prices developed through the fundamental forecasting analysis. The tool’s Monte Carlo engine simulates price deviations around the expected paths based on historical volatility and gas-power correlation to yield “actual” or “realized” price paths. The model parameters are calibrated to historical gas market and MISO power market price behavior as mentioned above. A sample illustration of two
96 NREL NSRDB, https://nsrdb.nrel.gov/ 97 NREL Wind Integration Datasets, https://www.nrel.gov/grid/wind-integration-data.html 98 Commodity prices have been found to exhibit a mean-reverting behavior. The regime-switching feature of the model allows for simulation of price spikes by modeling different price regimes (e.g., normal price regime, spike price regime). The simulated switching between regimes is facilitated by a transition matrix. Given the current regime, the transition matrix specifies the probabilities of staying in the current regime or moving to a different regime. The probabilities are estimated based on historical data. For references, see the following paper, on which MOSEP is based - Higgs, H. & Worthington, A. “Stochastic price modelling of high volatility, mean-reverting, spike-prone commodities: The Australian wholesale electricity market.” Energy Economics, 2008.
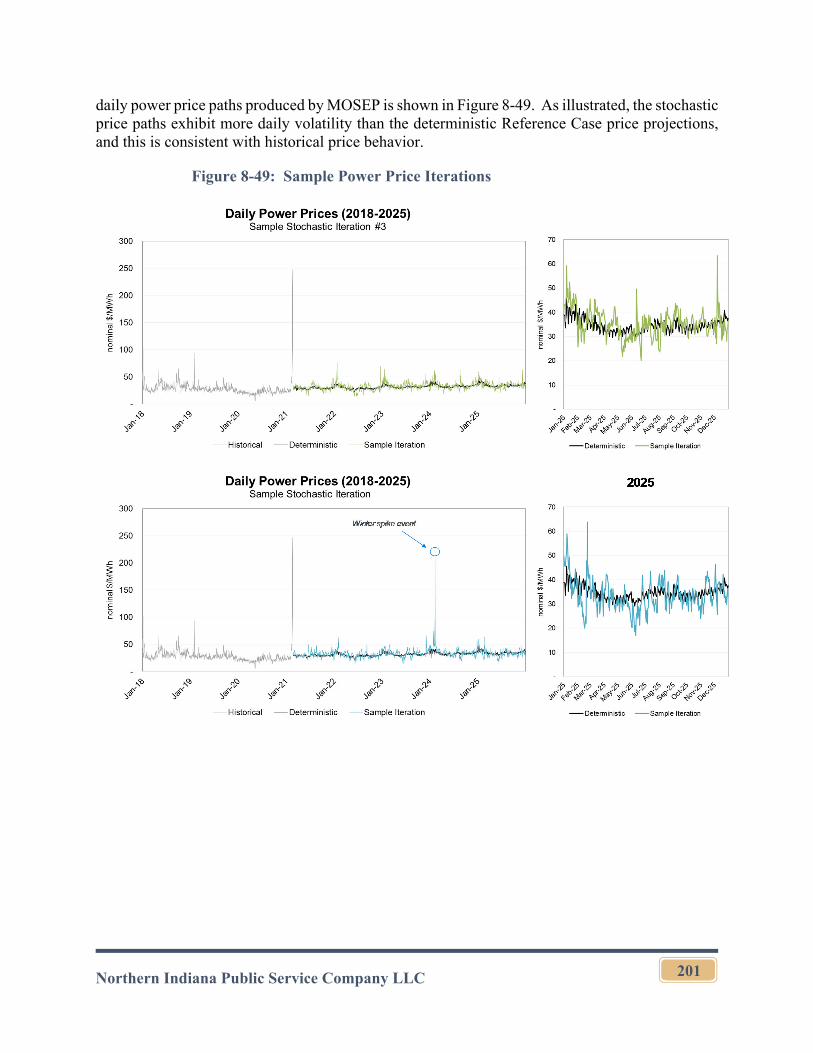
Northern Indiana Public Service Company LLC
201
daily power price paths produced by MOSEP is shown in Figure 8-49. As illustrated, the stochastic price paths exhibit more daily volatility than the deterministic Reference Case price projections, and this is consistent with historical price behavior.
Figure 8-49: Sample Power Price Iterations
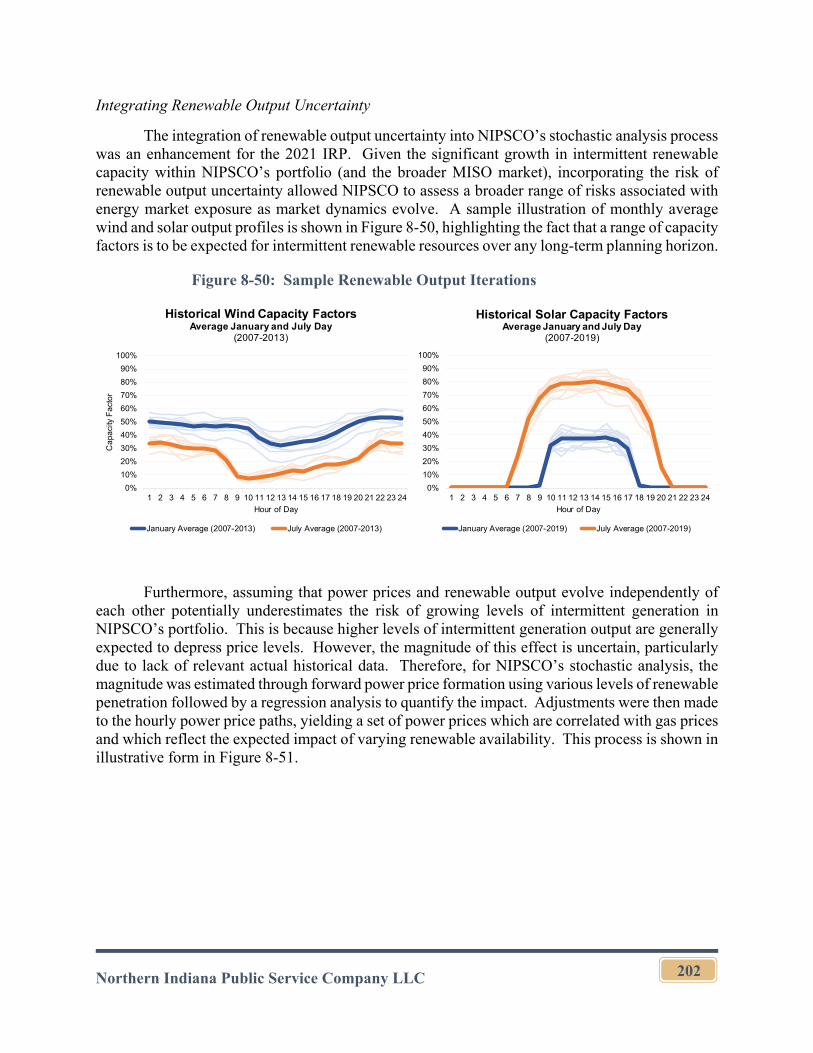
Northern Indiana Public Service Company LLC
202
Integrating Renewable Output Uncertainty
The integration of renewable output uncertainty into NIPSCO’s stochastic analysis process was an enhancement for the 2021 IRP. Given the significant growth in intermittent renewable capacity within NIPSCO’s portfolio (and the broader MISO market), incorporating the risk of renewable output uncertainty allowed NIPSCO to assess a broader range of risks associated with energy market exposure as market dynamics evolve. A sample illustration of monthly average wind and solar output profiles is shown in Figure 8-50, highlighting the fact that a range of capacity factors is to be expected for intermittent renewable resources over any long-term planning horizon.
Figure 8-50: Sample Renewable Output Iterations
Furthermore, assuming that power prices and renewable output evolve independently of each other potentially underestimates the risk of growing levels of intermittent generation in NIPSCO’s portfolio. This is because higher levels of intermittent generation output are generally expected to depress price levels. However, the magnitude of this effect is uncertain, particularly due to lack of relevant actual historical data. Therefore, for NIPSCO’s stochastic analysis, the magnitude was estimated through forward power price formation using various levels of renewable penetration followed by a regression analysis to quantify the impact. Adjustments were then made to the hourly power price paths, yielding a set of power prices which are correlated with gas prices and which reflect the expected impact of varying renewable availability. This process is shown in illustrative form in Figure 8-51.
0%
10%
20%
30%
40%
50%
60%
70%
80%
90%
100%
1 2 3 4 5 6 7 8 9 10 11 12 13 14 15 16 17 18 19 20 21 22 23 24
Hour of Day
Historical Solar Capacity FactorsAverage January and July Day
(2007-2019)
January Average (2007-2019) July Average (2007-2019)
0%
10%
20%
30%
40%
50%
60%
70%
80%
90%
100%
1 2 3 4 5 6 7 8 9 10 11 12 13 14 15 16 17 18 19 20 21 22 23 24
Ca
paci
ty F
act
or
Hour of Day
Historical Wind Capacity Factors Average January and July Day
(2007-2013)
January Average (2007-2013) July Average (2007-2013)
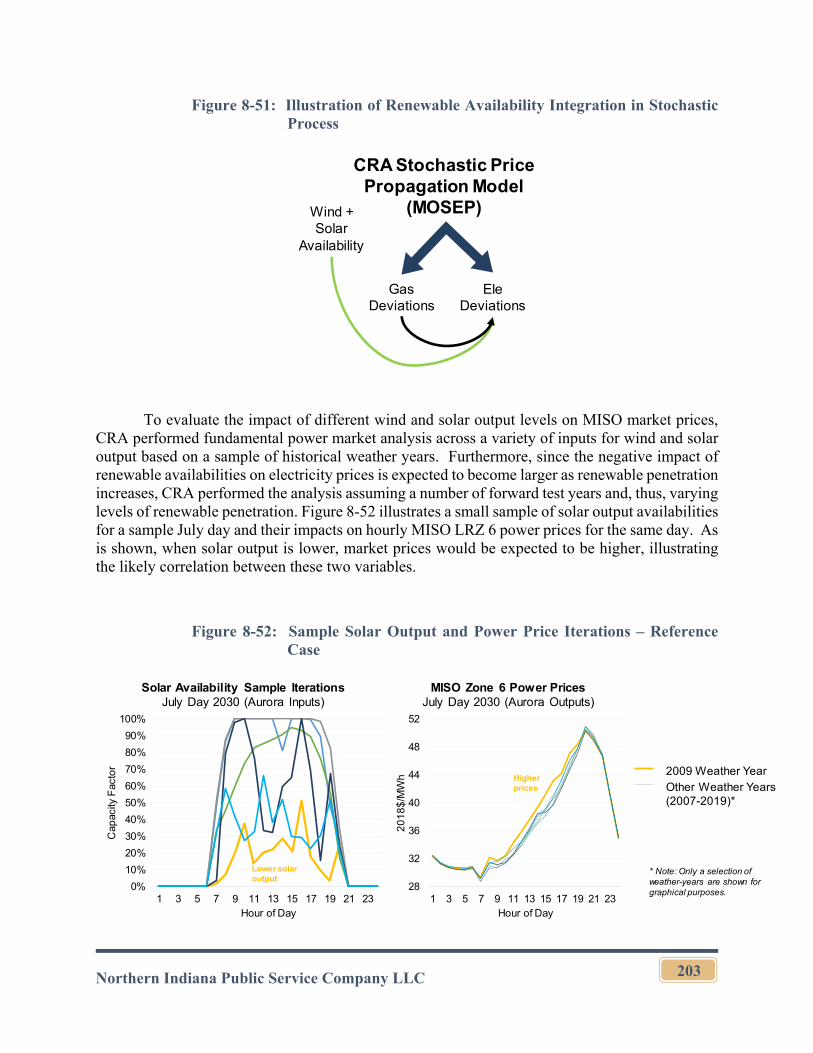
Northern Indiana Public Service Company LLC
203
Figure 8-51: Illustration of Renewable Availability Integration in Stochastic Process
To evaluate the impact of different wind and solar output levels on MISO market prices, CRA performed fundamental power market analysis across a variety of inputs for wind and solar output based on a sample of historical weather years. Furthermore, since the negative impact of renewable availabilities on electricity prices is expected to become larger as renewable penetration increases, CRA performed the analysis assuming a number of forward test years and, thus, varying levels of renewable penetration. Figure 8-52 illustrates a small sample of solar output availabilities for a sample July day and their impacts on hourly MISO LRZ 6 power prices for the same day. As is shown, when solar output is lower, market prices would be expected to be higher, illustrating the likely correlation between these two variables.
Figure 8-52: Sample Solar Output and Power Price Iterations – Reference Case
CRA Stochastic Price Propagation Model
(MOSEP)
Gas Deviations
Ele Deviations
Wind + Solar
Availability
28
32
36
40
44
48
52
1 3 5 7 9 11 13 15 17 19 21 23
20
18
$/M
Wh
Hour of Day
MISO Zone 6 Power PricesJuly Day 2030 (Aurora Outputs)
0%
10%
20%
30%
40%
50%
60%
70%
80%
90%
100%
1 3 5 7 9 11 13 15 17 19 21 23
Cap
acity
Fac
tor
Hour of Day
Solar Availability Sample IterationsJuly Day 2030 (Aurora Inputs)
Lower solar output
Higher prices
2009 Weather YearOther Weather Years (2007-2019)*
* Note: Only a selection of weather-years are shown for graphical purposes.
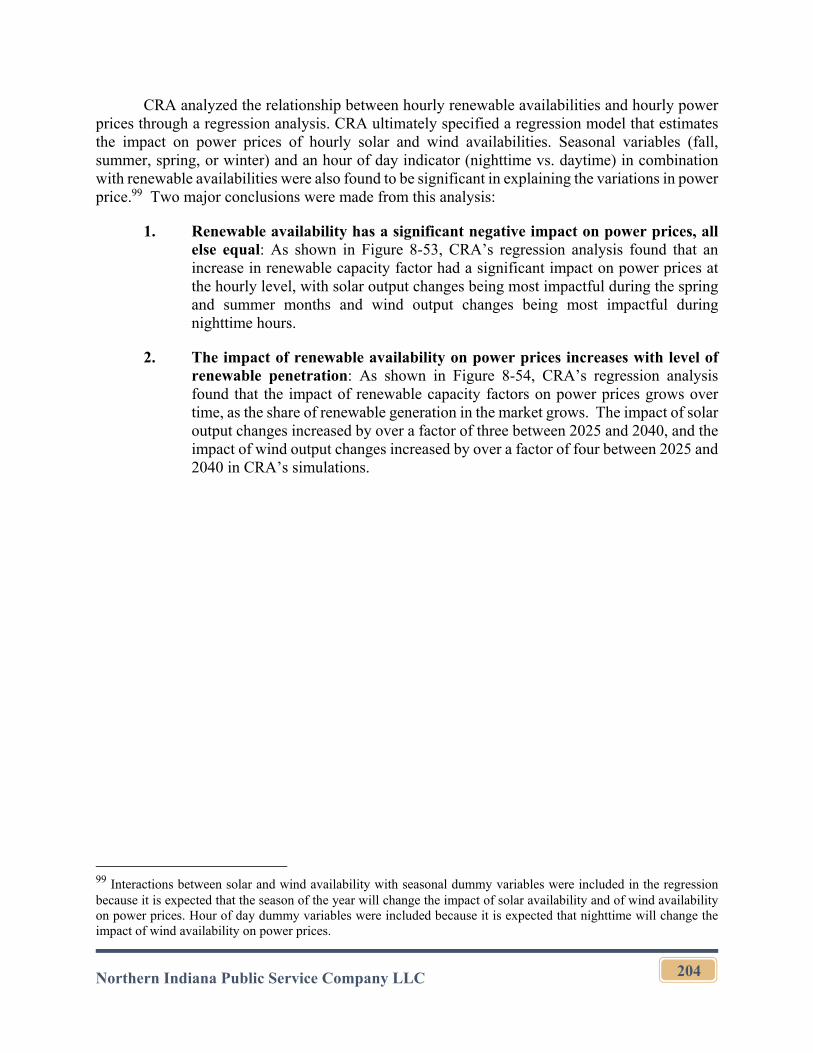
Northern Indiana Public Service Company LLC
204
CRA analyzed the relationship between hourly renewable availabilities and hourly power prices through a regression analysis. CRA ultimately specified a regression model that estimates the impact on power prices of hourly solar and wind availabilities. Seasonal variables (fall, summer, spring, or winter) and an hour of day indicator (nighttime vs. daytime) in combination with renewable availabilities were also found to be significant in explaining the variations in power price.99 Two major conclusions were made from this analysis:
1. Renewable availability has a significant negative impact on power prices, all else equal: As shown in Figure 8-53, CRA’s regression analysis found that an increase in renewable capacity factor had a significant impact on power prices at the hourly level, with solar output changes being most impactful during the spring and summer months and wind output changes being most impactful during nighttime hours.
2. The impact of renewable availability on power prices increases with level of renewable penetration: As shown in Figure 8-54, CRA’s regression analysis found that the impact of renewable capacity factors on power prices grows over time, as the share of renewable generation in the market grows. The impact of solar output changes increased by over a factor of three between 2025 and 2040, and the impact of wind output changes increased by over a factor of four between 2025 and 2040 in CRA’s simulations.
99 Interactions between solar and wind availability with seasonal dummy variables were included in the regression because it is expected that the season of the year will change the impact of solar availability and of wind availability on power prices. Hour of day dummy variables were included because it is expected that nighttime will change the impact of wind availability on power prices.
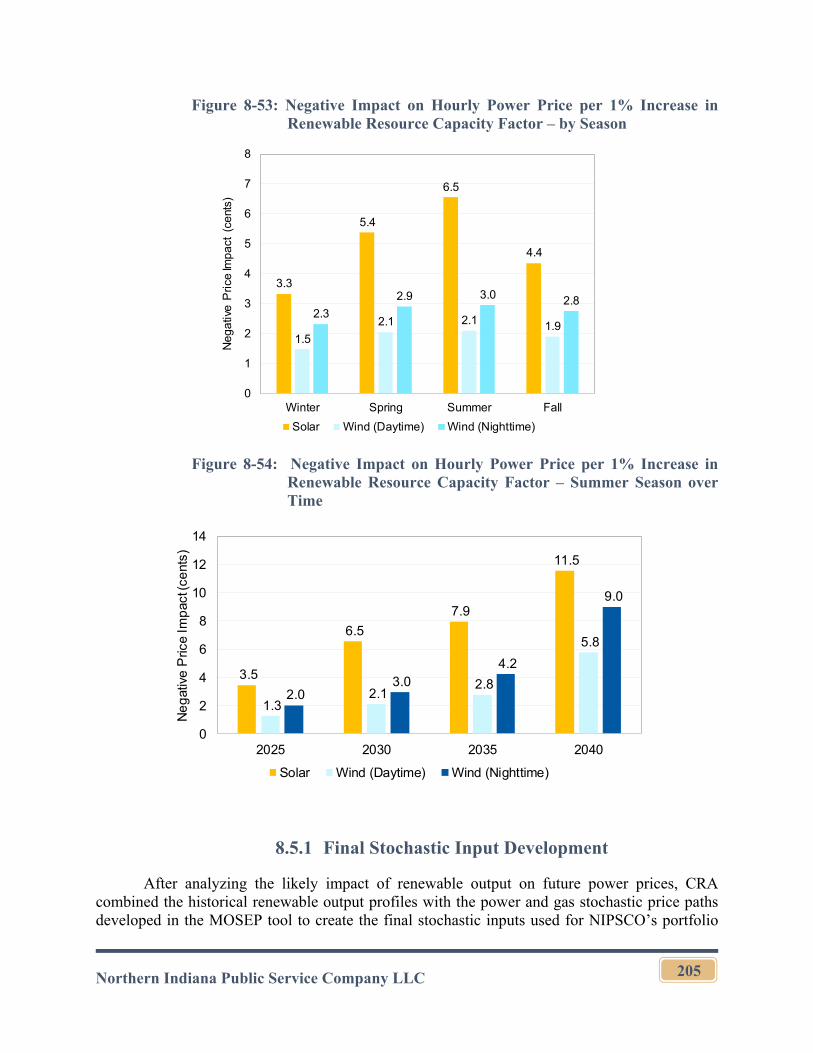
Northern Indiana Public Service Company LLC
205
Figure 8-53: Negative Impact on Hourly Power Price per 1% Increase in Renewable Resource Capacity Factor – by Season
Figure 8-54: Negative Impact on Hourly Power Price per 1% Increase in Renewable Resource Capacity Factor – Summer Season over Time
8.5.1 Final Stochastic Input Development
After analyzing the likely impact of renewable output on future power prices, CRA combined the historical renewable output profiles with the power and gas stochastic price paths developed in the MOSEP tool to create the final stochastic inputs used for NIPSCO’s portfolio
3.3
5.4
6.5
4.4
1.5
2.1 2.1 1.92.3
2.9 3.0 2.8
0
1
2
3
4
5
6
7
8
Winter Spring Summer Fall
Neg
ativ
e P
rice
Imp
act
(ce
nts)
Solar Wind (Daytime) Wind (Nighttime)
3.5
6.5
7.9
11.5
1.3 2.1
2.8
5.8
2.0 3.0
4.2
9.0
0
2
4
6
8
10
12
14
2025 2030 2035 2040
Ne
gat
ive
Pric
e Im
pac
t (ce
nts)
Solar Wind (Daytime) Wind (Nighttime)
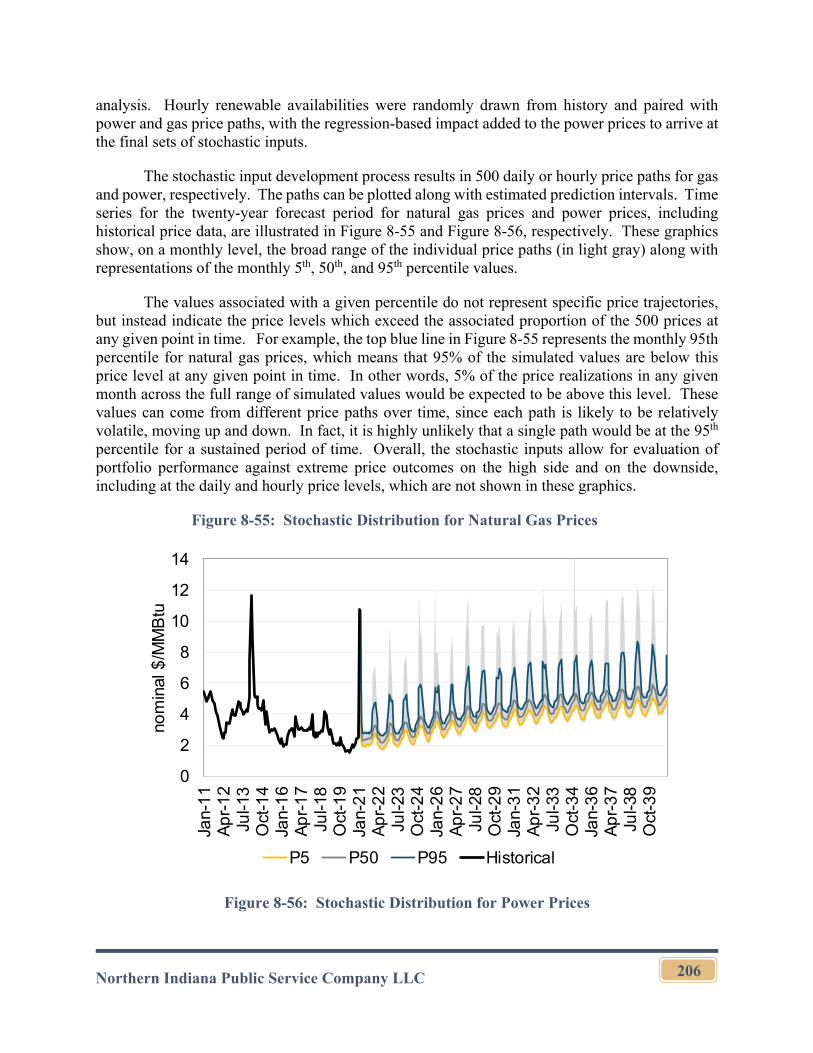
Northern Indiana Public Service Company LLC
206
analysis. Hourly renewable availabilities were randomly drawn from history and paired with power and gas price paths, with the regression-based impact added to the power prices to arrive at the final sets of stochastic inputs.
The stochastic input development process results in 500 daily or hourly price paths for gas and power, respectively. The paths can be plotted along with estimated prediction intervals. Time series for the twenty-year forecast period for natural gas prices and power prices, including historical price data, are illustrated in Figure 8-55 and Figure 8-56, respectively. These graphics show, on a monthly level, the broad range of the individual price paths (in light gray) along with representations of the monthly 5th, 50th, and 95th percentile values.
The values associated with a given percentile do not represent specific price trajectories, but instead indicate the price levels which exceed the associated proportion of the 500 prices at any given point in time. For example, the top blue line in Figure 8-55 represents the monthly 95th percentile for natural gas prices, which means that 95% of the simulated values are below this price level at any given point in time. In other words, 5% of the price realizations in any given month across the full range of simulated values would be expected to be above this level. These values can come from different price paths over time, since each path is likely to be relatively volatile, moving up and down. In fact, it is highly unlikely that a single path would be at the 95th percentile for a sustained period of time. Overall, the stochastic inputs allow for evaluation of portfolio performance against extreme price outcomes on the high side and on the downside, including at the daily and hourly price levels, which are not shown in these graphics.
Figure 8-55: Stochastic Distribution for Natural Gas Prices
Figure 8-56: Stochastic Distribution for Power Prices
0
2
4
6
8
10
12
14
Jan-
11
Ap
r-1
2Ju
l-13
Oct
-14
Jan-
16
Ap
r-1
7Ju
l-18
Oct
-19
Jan-
21
Ap
r-2
2Ju
l-23
Oct
-24
Jan-
26
Ap
r-2
7Ju
l-28
Oct
-29
Jan-
31
Ap
r-3
2Ju
l-33
Oct
-34
Jan-
36
Ap
r-3
7Ju
l-38
Oct
-39
nom
inal
$/M
MB
tu
P5 P50 P95 Historical
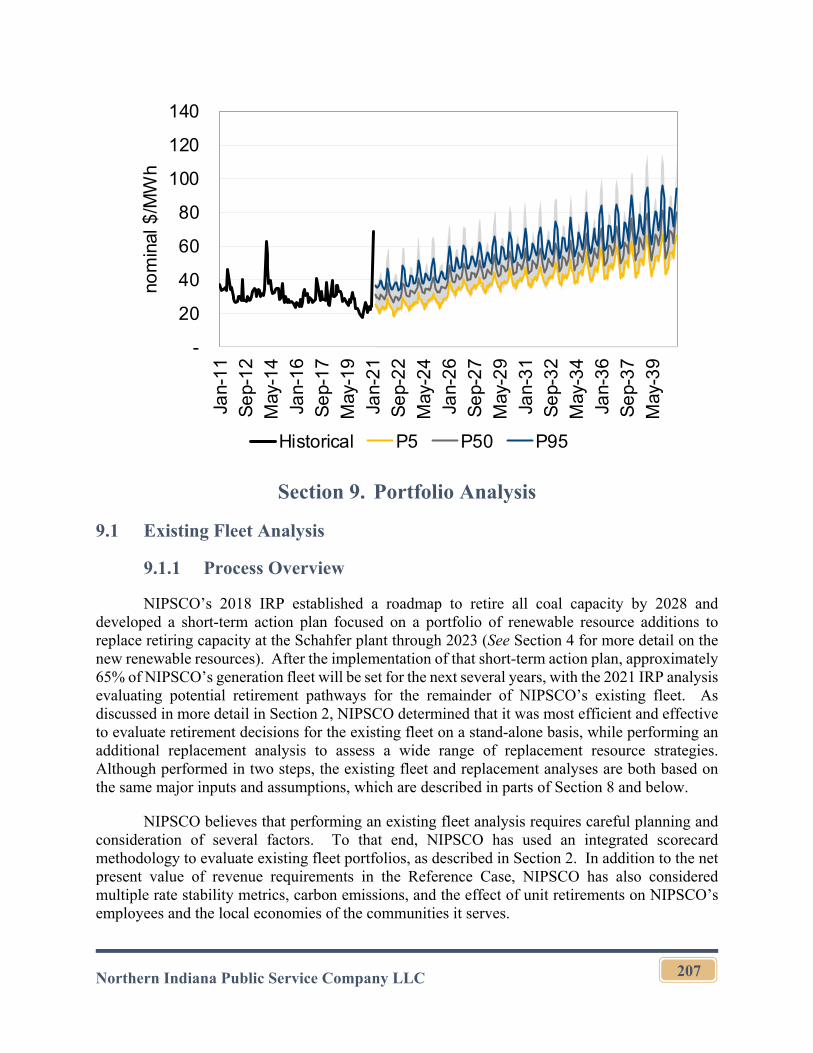
Northern Indiana Public Service Company LLC
207
Section 9. Portfolio Analysis
9.1 Existing Fleet Analysis
9.1.1 Process Overview
NIPSCO’s 2018 IRP established a roadmap to retire all coal capacity by 2028 and developed a short-term action plan focused on a portfolio of renewable resource additions to replace retiring capacity at the Schahfer plant through 2023 (See Section 4 for more detail on the new renewable resources). After the implementation of that short-term action plan, approximately 65% of NIPSCO’s generation fleet will be set for the next several years, with the 2021 IRP analysis evaluating potential retirement pathways for the remainder of NIPSCO’s existing fleet. As discussed in more detail in Section 2, NIPSCO determined that it was most efficient and effective to evaluate retirement decisions for the existing fleet on a stand-alone basis, while performing an additional replacement analysis to assess a wide range of replacement resource strategies. Although performed in two steps, the existing fleet and replacement analyses are both based on the same major inputs and assumptions, which are described in parts of Section 8 and below.
NIPSCO believes that performing an existing fleet analysis requires careful planning and consideration of several factors. To that end, NIPSCO has used an integrated scorecard methodology to evaluate existing fleet portfolios, as described in Section 2. In addition to the net present value of revenue requirements in the Reference Case, NIPSCO has also considered multiple rate stability metrics, carbon emissions, and the effect of unit retirements on NIPSCO’s employees and the local economies of the communities it serves.
-
20
40
60
80
100
120
140
Jan-
11
Se
p-1
2M
ay-1
4Ja
n-1
6S
ep-
17
May
-19
Jan-
21
Se
p-2
2M
ay-2
4Ja
n-2
6S
ep-
27
May
-29
Jan-
31
Se
p-3
2M
ay-3
4Ja
n-3
6S
ep-
37
May
-39
nom
inal
$/M
Wh
Historical P5 P50 P95
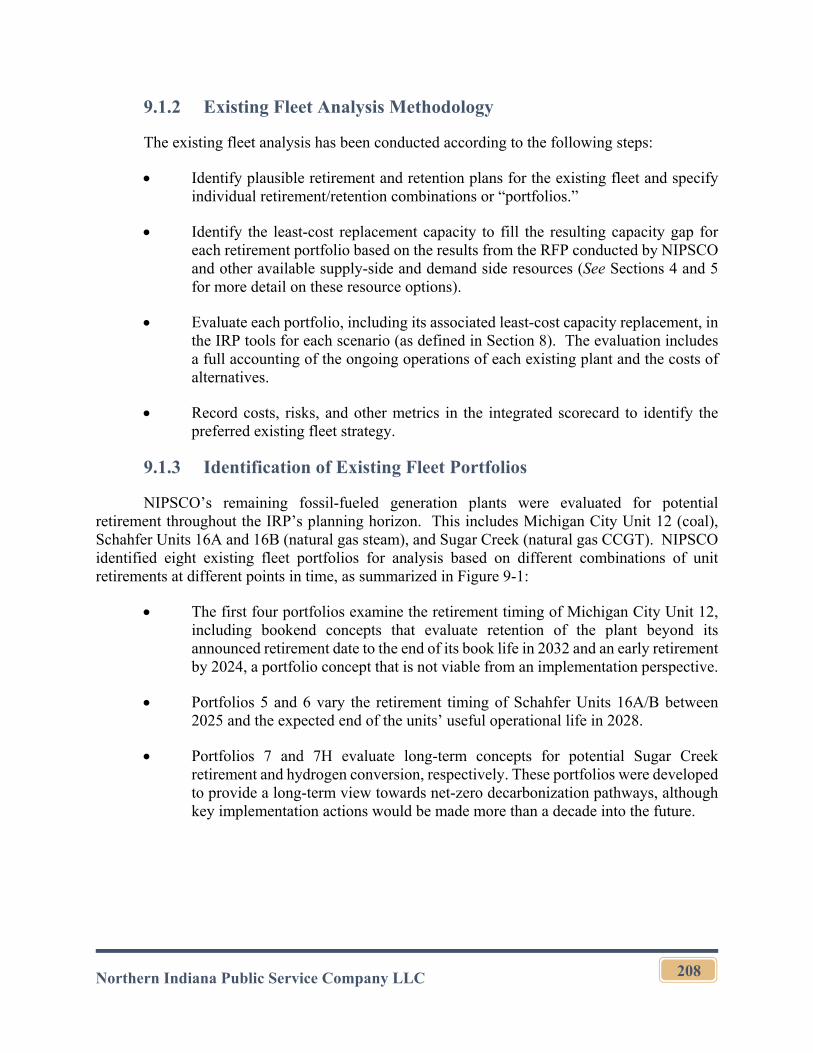
Northern Indiana Public Service Company LLC
208
9.1.2 Existing Fleet Analysis Methodology
The existing fleet analysis has been conducted according to the following steps:
Identify plausible retirement and retention plans for the existing fleet and specify individual retirement/retention combinations or “portfolios.”
Identify the least-cost replacement capacity to fill the resulting capacity gap for each retirement portfolio based on the results from the RFP conducted by NIPSCO and other available supply-side and demand side resources (See Sections 4 and 5 for more detail on these resource options).
Evaluate each portfolio, including its associated least-cost capacity replacement, in the IRP tools for each scenario (as defined in Section 8). The evaluation includes a full accounting of the ongoing operations of each existing plant and the costs of alternatives.
Record costs, risks, and other metrics in the integrated scorecard to identify the preferred existing fleet strategy.
9.1.3 Identification of Existing Fleet Portfolios
NIPSCO’s remaining fossil-fueled generation plants were evaluated for potential retirement throughout the IRP’s planning horizon. This includes Michigan City Unit 12 (coal), Schahfer Units 16A and 16B (natural gas steam), and Sugar Creek (natural gas CCGT). NIPSCO identified eight existing fleet portfolios for analysis based on different combinations of unit retirements at different points in time, as summarized in Figure 9-1:
The first four portfolios examine the retirement timing of Michigan City Unit 12, including bookend concepts that evaluate retention of the plant beyond its announced retirement date to the end of its book life in 2032 and an early retirement by 2024, a portfolio concept that is not viable from an implementation perspective.
Portfolios 5 and 6 vary the retirement timing of Schahfer Units 16A/B between 2025 and the expected end of the units’ useful operational life in 2028.
Portfolios 7 and 7H evaluate long-term concepts for potential Sugar Creek retirement and hydrogen conversion, respectively. These portfolios were developed to provide a long-term view towards net-zero decarbonization pathways, although key implementation actions would be made more than a decade into the future.
Northern Indiana Public Service Company LLC
209
Figure 9-1: Overview of Existing Fleet Portfolios
9.1.4 Existing Fleet Cost Assumptions
The evaluation of each existing fleet portfolio was performed through a full portfolio analysis that included dispatch in Aurora and financial accounting in PERFORM (See Section 2 for more detail on the overall modeling process). Market assumptions were consistent with those outlined earlier in Section 8 for the Reference Case and the three alternative scenarios. In addition to the major market inputs and the costs of replacement resources (see next section below), several relevant assumptions were made regarding the ongoing costs of the existing coal fleet.
Ongoing costs include fuel, fixed O&M costs, and maintenance capital, as well as the recovery of remaining book value associated with each plant as of April 2021. This recovery includes return of (depreciation), return on, and income and property taxes associated with the remaining net book value of NIPSCO’s existing fleet.
Fixed O&M costs included all labor, materials, engineering and support services, and overhead costs necessary to operate the plant. For all units, projections of fixed O&M costs were obtained for each year within 2021-2040. These costs were then escalated at 2.1% per year100 for the 2041-2050 end effects modeling period. Additional detail is provided in Confidential Appendix
100 The EIA’s AEO assumes a 2.1% rate of inflation for “All Commodities,” which is used as a long-term proxy of general cost inflation for the end effects extrapolation.
Portfolio Transition
Target:
15% Coal through 2032
15% Coal through 2028
15% Coal through 2026
15% Coal through 2024
15% Coal through 2028
15% Coal through 2026
15% Coal through 2028
Fossil Free by 2032
15% Coal through 2028
Option for Fossil Free by 2032
MC 12 Through Book life
2018 IRP Preferred Plan
Early Retirement of MC 12
Early Retirement of MC 12
2018 IRP Preferred Plan + 2025 16AB
retirement
Early Retirement of MC 12
+ 2025 16AB retirement
2018 IRP Preferred Plan + 2025 16AB ret. +
2032 SC ret.
2018 IRP Preferred Plan + 2025 16AB ret. +
2032 SC conv.
Retain beyond
2032Sugar Creek Sugar Creek Sugar Creek Sugar Creek Sugar Creek Sugar Creek None
Sugar Creek converts to H2
(2032)
Michigan City 12
Retire Retire Retire Retire Retire Retire Retire
2032 2028 2026 2024 2028 2026 2028
Schahfer 16AB
Retire Retire
2028 2025
Sugar Creek
Retain
Retire Convert to H2
2032 2032
1 2 3 4 5 6 7 7H
Short term Longer term
Not a viable pathway due to implementation timing
Northern Indiana Public Service Company LLC
210
D. As an existing unit’s projected retirement date moves up, the relative fixed O&M spend tended to decrease during the years leading up to retirement.
Maintenance capital costs included the projected capital expenditures necessary to keep the units running through the analysis period at the projected level of operations. For all units, projections of maintenance capital costs were obtained for each year within 2021-2040. These costs were then escalated at 2.1% per year 2041-2050 end effects modeling period. Additional detail is provided in Confidential Appendix D. Similar to fixed O&M costs, as an existing unit’s projected retirement date moves up, the relative capital spend tended to decrease during the years leading up to retirement.
NIPSCO also included estimated transmission upgrade costs associated with Schahfer and Michigan City’s retirements. An additional $6.7 million of capital expenditures was incorporated for transmission upgrades at the time Schahfer 16A/B retires in any existing fleet portfolio. An additional $82.9 million of capital expenditures was incorporated for transmission upgrades at the time Michigan City retires in any existing fleet portfolio.
Recovery of depreciation expenses on existing capital by 2033 has also been incorporated in the existing fleet analysis. NIPSCO assumes that each unit continues to depreciate at the same rate of 3.88% until 2033, regardless of whether the unit has been retired or not. This means that each retirement portfolio has the same depreciation schedule for existing capital. At 2033, the sum of all coal plants’ NBV on existing capital is equal to the negative “cost of removal” for all the coal plants. The negative NBV on existing capital in 2033 lowers rate base in perpetuity. The cost of removal was estimated by John J. Spanos, an expert witness supporting NIPSCO’s 2019 Electric Rate Case101 In addition to the “return of” (depreciation) the net book value, NIPSCO continues to earn a “return on” the net book value equal to NIPSCO’s assumed weighted average cost of capital. NIPSCO assumes that property and income tax will not be collected on the remaining NBV of the plant if it is retired.
9.1.5 Identification of Least-Cost Replacement Capacity
As in the 2018 IRP, NIPSCO’s All-Source RFP provided insight into the supply and pricing of resource alternatives available to NIPSCO (See Section 4 for details on the process and the costs and operational parameters of the individual tranches used for evaluation). In addition, NIPSCO identified other resource options, including DERs (See Section 4), an uprate at the existing Sugar Creek facility (See Section 4), and bundles of DSM resource options over time (See Section 5).
With these resource options, a portfolio optimization was performed within Aurora’s portfolio optimization tool under each of the eight retirement portfolio concepts to identify least-cost sets of replacement resources under Reference Case market conditions. The portfolio optimization modeling was performed for both the winter and summer peak seasons and was
101 See Cause No. 45159.
Northern Indiana Public Service Company LLC
211
designed to minimize the net present value of revenue requirements, with certain constraints for reserve margins, maximum off-system energy sales, and resource eligibility.102
Overall, the economic optimization model selected a diverse set of resources. Driven by a binding winter reserve margin and the energy resources already obtained from the 2018 IRP Preferred Plan, the indicative ordering of model selection preference tends to favor resources that offer greater levels of firm capacity relative to their energy contributions. When available for selection, the resources universally selected through 2027 included (all values in ICAP) included the following:
Approximately 10 MW of NIPSCO-owned DERs with the largest distribution cost deferrals;
The uprate to the existing Sugar Creek CCGT at the modeled level of 53 MW;
Approximately 68 MW (summer peak credit)103 of DSM resources by 2027, which includes the cumulative impact of both Tier 1 Residential and Commercial programs by 2027, with Commercial programs being most cost effective;104
Thermal capacity contracts from the 2021 RFP up to 150 MW;
In addition, several different resource types were consistently selected at various sizes and timings based on retirement dates and resource eligibility. These included:
A natural gas peaker up to 300 MW (hydrogen-enabled in Portfolio 7H);
Various levels of stand-alone storage between 135 MW and 570 MW;
Solar capacity up to 250 MW;
Wind capacity up to 200 MW;
A 20 MW electrolyzer pilot at Sugar Creek in Portfolio 7H.
Figure 9-2 provides a summary of the capacity resources that were selected under Portfolios 1-6, and Figure 9-3 provides a summary of the capacity resources that were selected under Portfolios 7 and 7H. Note that these portfolios do not represent NIPSCO’s preferred replacement strategy, but only least-cost optimization outcomes that are used to evaluate retirement implications associated with the existing fleet.
102 Portfolios were optimized against winter reserve margin constraints (9.4%), followed by summer to ensure compliance with both. A maximum net energy sales limit of 30% during the fleet transition (2023-2026), falling to 25% in 2030+, was enforced. Portfolios 7 and 7H are designed to achieve net zero emissions over the study horizon, so eligible resources were restricted. Portfolio 7 did not allow for new fossil resources, and Portfolio 7H “forced in” hydrogen-enabled resources 103 Note that the winter peak impact of the selected DSM resources is approximately 46MW. 104 Note that the Tier 1 Residential and Commercial DSM bundles were selected across all time horizons in the fundamental modeling period. Additional detail on bundle costs and savings is provided in Section 5.
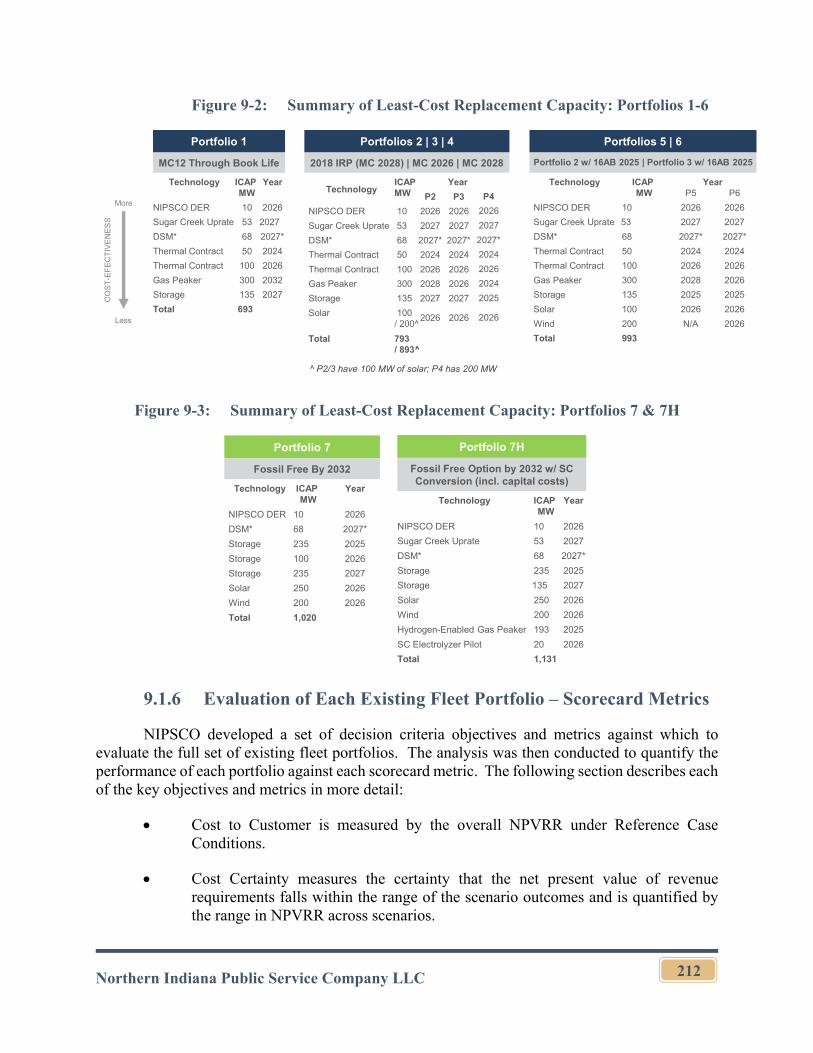
Northern Indiana Public Service Company LLC
212
Figure 9-2: Summary of Least-Cost Replacement Capacity: Portfolios 1-6
Figure 9-3: Summary of Least-Cost Replacement Capacity: Portfolios 7 & 7H
9.1.6 Evaluation of Each Existing Fleet Portfolio – Scorecard Metrics
NIPSCO developed a set of decision criteria objectives and metrics against which to evaluate the full set of existing fleet portfolios. The analysis was then conducted to quantify the performance of each portfolio against each scorecard metric. The following section describes each of the key objectives and metrics in more detail:
Cost to Customer is measured by the overall NPVRR under Reference Case Conditions.
Cost Certainty measures the certainty that the net present value of revenue requirements falls within the range of the scenario outcomes and is quantified by the range in NPVRR across scenarios.
Portfolio 1
MC12 Through Book Life
Technology ICAP MW
Year
NIPSCO DER 10 2026
Sugar Creek Uprate 53 2027
DSM*
Thermal Contract 50 2024
Thermal Contract 100 2026
Gas Peaker 300 2032
Storage 135 2027
Total 693
Portfolios 2 | 3 | 4
2018 IRP (MC 2028) | MC 2026 | MC 2028
TechnologyICAP MW
Year
P2 P3
NIPSCO DER 10 2026 2026
Sugar Creek Uprate 53 2027 2027
DSM*
Thermal Contract 50 2024 2024
Thermal Contract 100 2026 2026
Gas Peaker 300 2028 2026
Storage 135 2027 2027
Solar 100/ 200^
2026 2026
Total 793 / 893^
CO
ST
-EF
EC
TIV
EN
ES
S
Less
More
68 682027* 2027* 2027*
Portfolios 5 | 6
Portfolio 2 w/ 16AB 2025 | Portfolio 3 w/ 16AB 2025
Technology ICAP MW
YearP5 P6
NIPSCO DER 10 2026 2026
Sugar Creek Uprate 53 2027 2027
DSM* 68 2027* 2027*
Thermal Contract 50 2024 2024
Thermal Contract 100 2026 2026
Gas Peaker 300 2028 2026
Storage 135 2025 2025
Solar 100 2026 2026
Wind 200 N/A 2026
Total 993
P4
2026
2027
2024
2026
2024
2025
2026
2027*
^ P2/3 have 100 MW of solar; P4 has 200 MW
Portfolio 7H
Fossil Free Option by 2032 w/ SC Conversion (incl. capital costs)
Technology ICAP MW
Year
NIPSCO DER 10 2026
Sugar Creek Uprate 53 2027
DSM*
Storage 235 2025
Storage 135 2027
Solar 250 2026
Wind 200 2026
Hydrogen-Enabled Gas Peaker 193 2025
SC Electrolyzer Pilot 20 2026
Total 1,131
68 2027*
Portfolio 7
Fossil Free By 2032
Technology ICAP MW
Year
NIPSCO DER 10 2026
DSM* 68 2027*
Storage 235 2025
Storage 100 2026
Storage 235 2027
Solar 250 2026
Wind 200 2026
Total 1,020
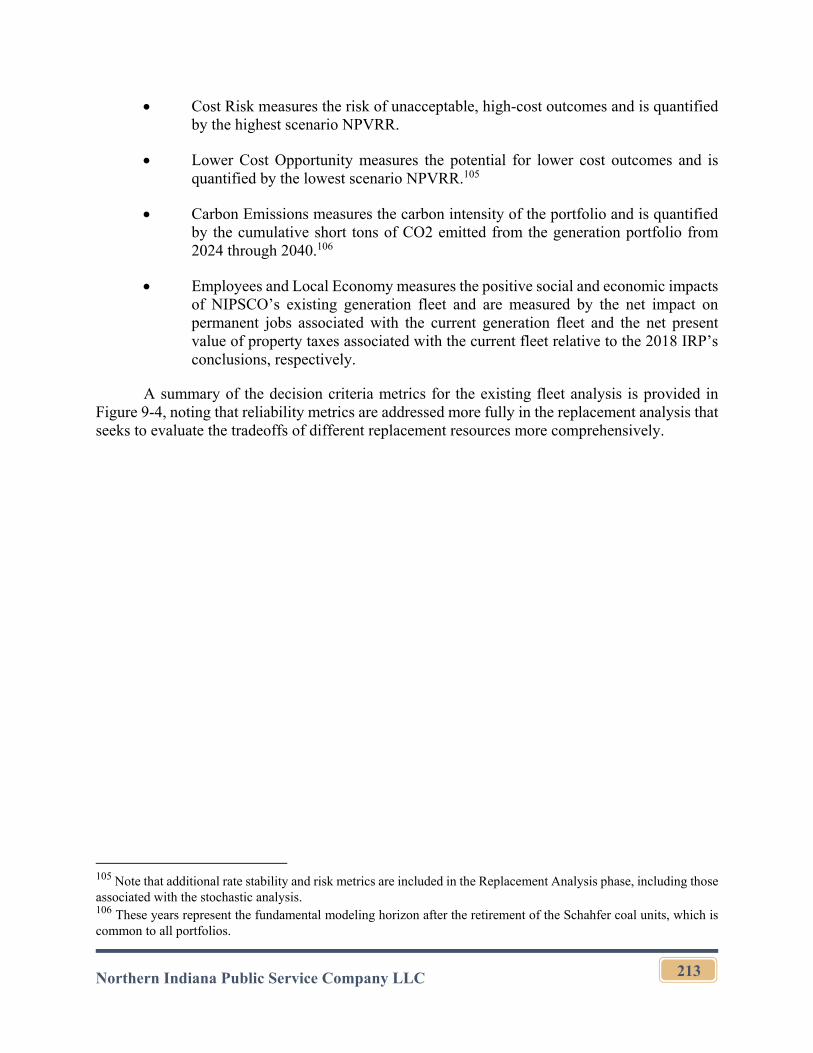
Northern Indiana Public Service Company LLC
213
Cost Risk measures the risk of unacceptable, high-cost outcomes and is quantified by the highest scenario NPVRR.
Lower Cost Opportunity measures the potential for lower cost outcomes and is quantified by the lowest scenario NPVRR.105
Carbon Emissions measures the carbon intensity of the portfolio and is quantified by the cumulative short tons of CO2 emitted from the generation portfolio from 2024 through 2040.106
Employees and Local Economy measures the positive social and economic impacts of NIPSCO’s existing generation fleet and are measured by the net impact on permanent jobs associated with the current generation fleet and the net present value of property taxes associated with the current fleet relative to the 2018 IRP’s conclusions, respectively.
A summary of the decision criteria metrics for the existing fleet analysis is provided in Figure 9-4, noting that reliability metrics are addressed more fully in the replacement analysis that seeks to evaluate the tradeoffs of different replacement resources more comprehensively.
105 Note that additional rate stability and risk metrics are included in the Replacement Analysis phase, including those associated with the stochastic analysis. 106 These years represent the fundamental modeling horizon after the retirement of the Schahfer coal units, which is common to all portfolios.
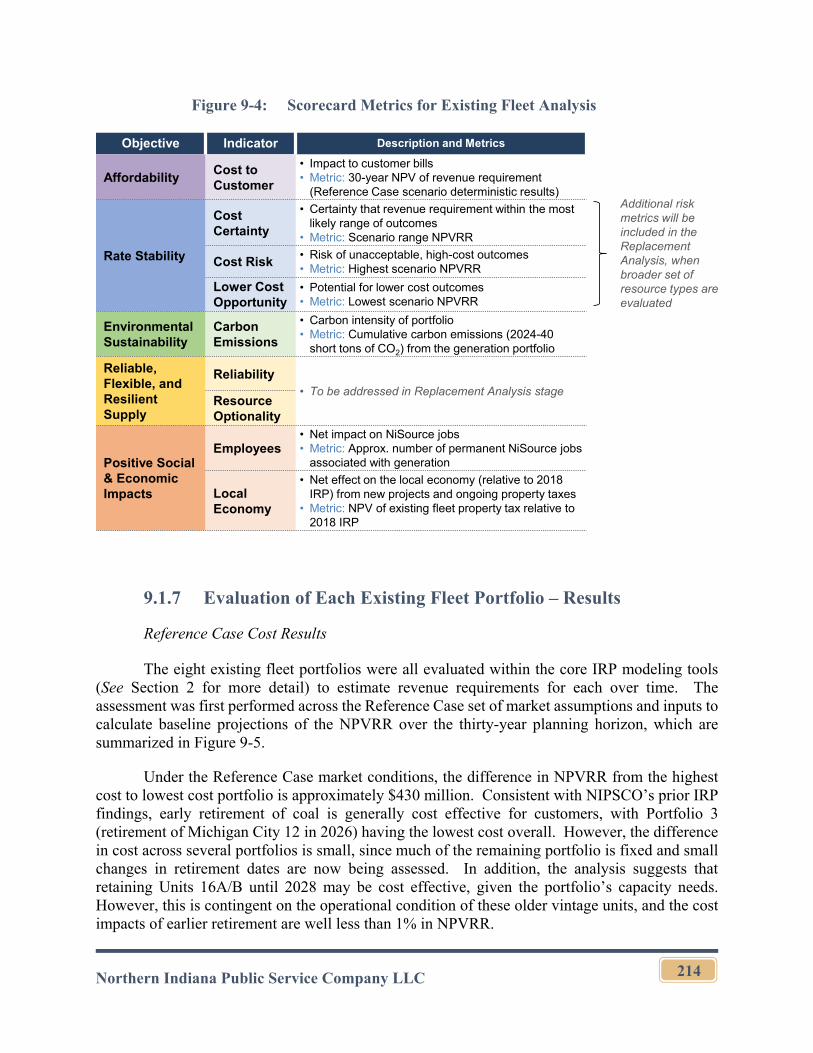
Northern Indiana Public Service Company LLC
214
Figure 9-4: Scorecard Metrics for Existing Fleet Analysis
9.1.7 Evaluation of Each Existing Fleet Portfolio – Results
Reference Case Cost Results
The eight existing fleet portfolios were all evaluated within the core IRP modeling tools (See Section 2 for more detail) to estimate revenue requirements for each over time. The assessment was first performed across the Reference Case set of market assumptions and inputs to calculate baseline projections of the NPVRR over the thirty-year planning horizon, which are summarized in Figure 9-5.
Under the Reference Case market conditions, the difference in NPVRR from the highest cost to lowest cost portfolio is approximately $430 million. Consistent with NIPSCO’s prior IRP findings, early retirement of coal is generally cost effective for customers, with Portfolio 3 (retirement of Michigan City 12 in 2026) having the lowest cost overall. However, the difference in cost across several portfolios is small, since much of the remaining portfolio is fixed and small changes in retirement dates are now being assessed. In addition, the analysis suggests that retaining Units 16A/B until 2028 may be cost effective, given the portfolio’s capacity needs. However, this is contingent on the operational condition of these older vintage units, and the cost impacts of earlier retirement are well less than 1% in NPVRR.
Objective Indicator Description and Metrics
AffordabilityCost to Customer
• Impact to customer bills• Metric: 30-year NPV of revenue requirement
(Reference Case scenario deterministic results)
Rate Stability
Cost Certainty
• Certainty that revenue requirement within the most likely range of outcomes
• Metric: Scenario range NPVRR
Cost Risk• Risk of unacceptable, high-cost outcomes• Metric: Highest scenario NPVRR
Lower Cost Opportunity
• Potential for lower cost outcomes• Metric: Lowest scenario NPVRR
Environmental Sustainability
Carbon Emissions
• Carbon intensity of portfolio• Metric: Cumulative carbon emissions (2024-40
short tons of CO2) from the generation portfolio
Reliable, Flexible, and Resilient Supply
Reliability• To be addressed in Replacement Analysis stage
Resource Optionality
Positive Social & Economic Impacts
Employees• Net impact on NiSource jobs• Metric: Approx. number of permanent NiSource jobs
associated with generation
Local Economy
• Net effect on the local economy (relative to 2018 IRP) from new projects and ongoing property taxes
• Metric: NPV of existing fleet property tax relative to 2018 IRP
Additional risk metrics will be included in the Replacement Analysis, when broader set of resource types are evaluated
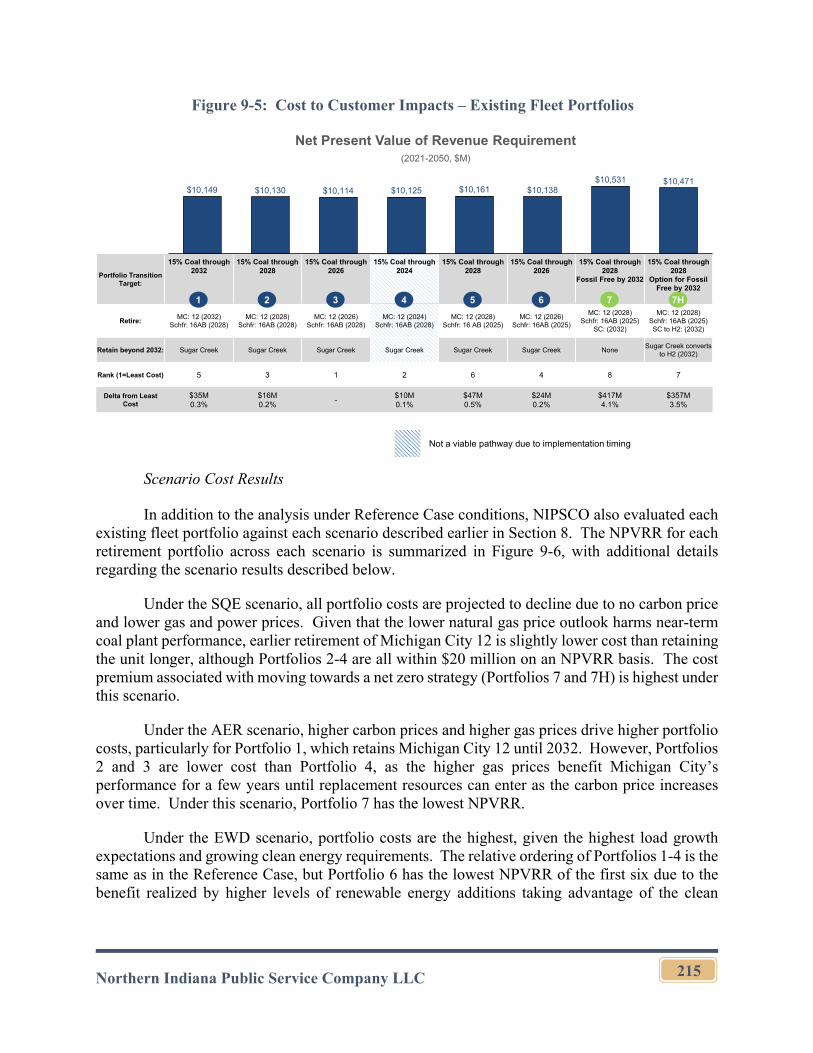
Northern Indiana Public Service Company LLC
215
Figure 9-5: Cost to Customer Impacts – Existing Fleet Portfolios
Scenario Cost Results
In addition to the analysis under Reference Case conditions, NIPSCO also evaluated each existing fleet portfolio against each scenario described earlier in Section 8. The NPVRR for each retirement portfolio across each scenario is summarized in Figure 9-6, with additional details regarding the scenario results described below.
Under the SQE scenario, all portfolio costs are projected to decline due to no carbon price and lower gas and power prices. Given that the lower natural gas price outlook harms near-term coal plant performance, earlier retirement of Michigan City 12 is slightly lower cost than retaining the unit longer, although Portfolios 2-4 are all within $20 million on an NPVRR basis. The cost premium associated with moving towards a net zero strategy (Portfolios 7 and 7H) is highest under this scenario.
Under the AER scenario, higher carbon prices and higher gas prices drive higher portfolio costs, particularly for Portfolio 1, which retains Michigan City 12 until 2032. However, Portfolios 2 and 3 are lower cost than Portfolio 4, as the higher gas prices benefit Michigan City’s performance for a few years until replacement resources can enter as the carbon price increases over time. Under this scenario, Portfolio 7 has the lowest NPVRR.
Under the EWD scenario, portfolio costs are the highest, given the highest load growth expectations and growing clean energy requirements. The relative ordering of Portfolios 1-4 is the same as in the Reference Case, but Portfolio 6 has the lowest NPVRR of the first six due to the benefit realized by higher levels of renewable energy additions taking advantage of the clean
Portfolio Transition Target:
15% Coal through 2032
15% Coal through 2028
15% Coal through 2026
15% Coal through 2024
15% Coal through 2028
15% Coal through 2026
15% Coal through 2028
Fossil Free by 2032
15% Coal through 2028
Option for Fossil Free by 2032
Retire:MC: 12 (2032)
Schfr: 16AB (2028)MC: 12 (2028)
Schfr: 16AB (2028)MC: 12 (2026)
Schfr: 16AB (2028)MC: 12 (2024)
Schfr: 16AB (2028)MC: 12 (2028)
Schfr: 16 AB (2025)MC: 12 (2026)
Schfr: 16AB (2025)
MC: 12 (2028)Schfr: 16AB (2025)
SC: (2032)
MC: 12 (2028)Schfr: 16AB (2025)SC to H2: (2032)
Retain beyond 2032: Sugar Creek Sugar Creek Sugar Creek Sugar Creek Sugar Creek Sugar Creek NoneSugar Creek converts
to H2 (2032)
Rank (1=Least Cost) 5 3 1 2 6 4 8 7
Delta from LeastCost
$35M0.3%
$16M0.2%
-$10M0.1%
$47M0.5%
$24M0.2%
$417M4.1%
$357M3.5%
Net Present Value of Revenue Requirement(2021-2050, $M)
1
$10,149 $10,130 $10,114 $10,125 $10,161 $10,138$10,531 $10,471
2 3 5 6 7 7H4
Not a viable pathway due to implementation timing
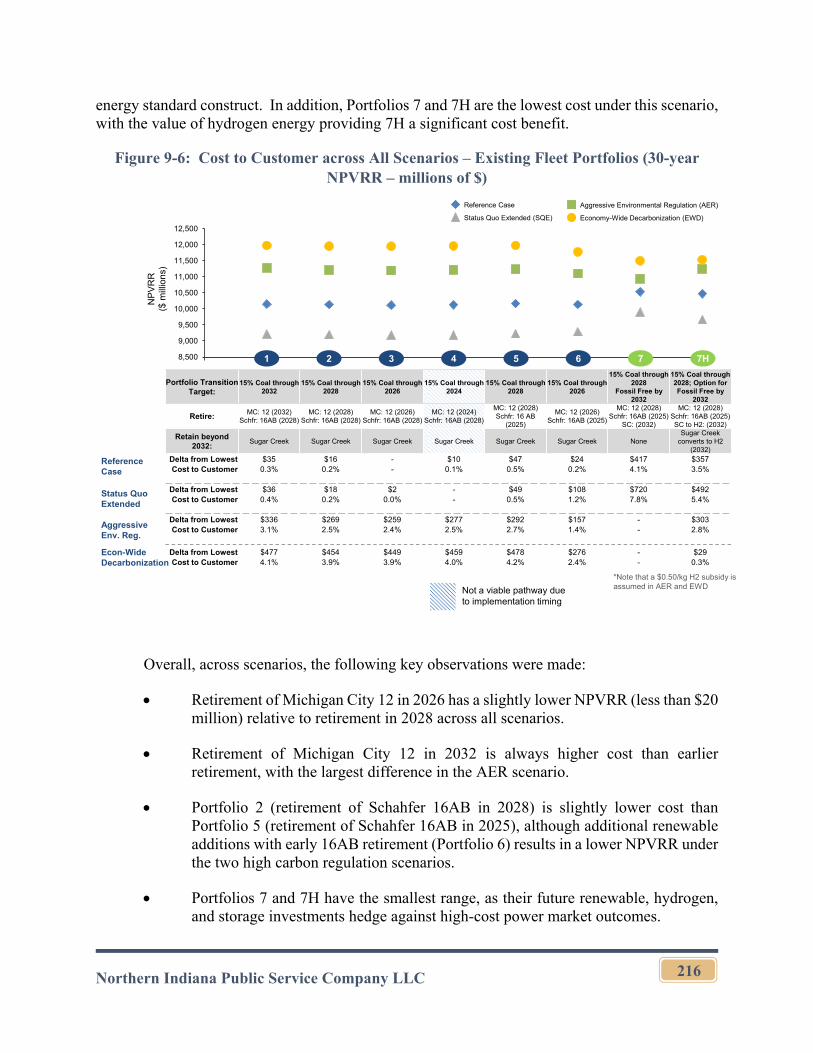
Northern Indiana Public Service Company LLC
216
energy standard construct. In addition, Portfolios 7 and 7H are the lowest cost under this scenario, with the value of hydrogen energy providing 7H a significant cost benefit.
Figure 9-6: Cost to Customer across All Scenarios – Existing Fleet Portfolios (30-year NPVRR – millions of $)
Overall, across scenarios, the following key observations were made:
Retirement of Michigan City 12 in 2026 has a slightly lower NPVRR (less than $20 million) relative to retirement in 2028 across all scenarios.
Retirement of Michigan City 12 in 2032 is always higher cost than earlier retirement, with the largest difference in the AER scenario.
Portfolio 2 (retirement of Schahfer 16AB in 2028) is slightly lower cost than Portfolio 5 (retirement of Schahfer 16AB in 2025), although additional renewable additions with early 16AB retirement (Portfolio 6) results in a lower NPVRR under the two high carbon regulation scenarios.
Portfolios 7 and 7H have the smallest range, as their future renewable, hydrogen, and storage investments hedge against high-cost power market outcomes.
Econ-Wide Decarbonization
Portfolio Transition Target:
15% Coal through 2032
15% Coal through 2028
15% Coal through 2026
15% Coal through 2024
15% Coal through 2028
15% Coal through 2026
15% Coal through 2028
Fossil Free by 2032
15% Coal through 2028; Option forFossil Free by
2032
Retire:MC: 12 (2032)
Schfr: 16AB (2028)MC: 12 (2028)
Schfr: 16AB (2028)MC: 12 (2026)
Schfr: 16AB (2028)MC: 12 (2024)
Schfr: 16AB (2028)
MC: 12 (2028)Schfr: 16 AB
(2025)
MC: 12 (2026)Schfr: 16AB (2025)
MC: 12 (2028)Schfr: 16AB (2025)
SC: (2032)
MC: 12 (2028)Schfr: 16AB (2025)SC to H2: (2032)
Retain beyond 2032:
Sugar Creek Sugar Creek Sugar Creek Sugar Creek Sugar Creek Sugar Creek NoneSugar Creek
converts to H2 (2032)
Delta from Lowest $35 $16 - $10 $47 $24 $417 $357Cost to Customer 0.3% 0.2% - 0.1% 0.5% 0.2% 4.1% 3.5%
Delta from Lowest $36 $18 $2 - $49 $108 $720 $492Cost to Customer 0.4% 0.2% 0.0% - 0.5% 1.2% 7.8% 5.4%
Delta from Lowest $336 $269 $259 $277 $292 $157 - $303Cost to Customer 3.1% 2.5% 2.4% 2.5% 2.7% 1.4% - 2.8%
Delta from Lowest $477 $454 $449 $459 $478 $276 - $29Cost to Customer 4.1% 3.9% 3.9% 4.0% 4.2% 2.4% - 0.3%
Reference Case
Status Quo Extended
Aggressive Env. Reg.
8,500
9,000
9,500
10,000
10,500
11,000
11,500
12,000
12,500
NP
VR
R($
mill
ions
)
1 2 3 5 6 7 7H
*Note that a $0.50/kg H2 subsidy is assumed in AER and EWD
4
Reference Case Aggressive Environmental Regulation (AER)
Status Quo Extended (SQE) Economy-Wide Decarbonization (EWD)
Not a viable pathway due to implementation timing
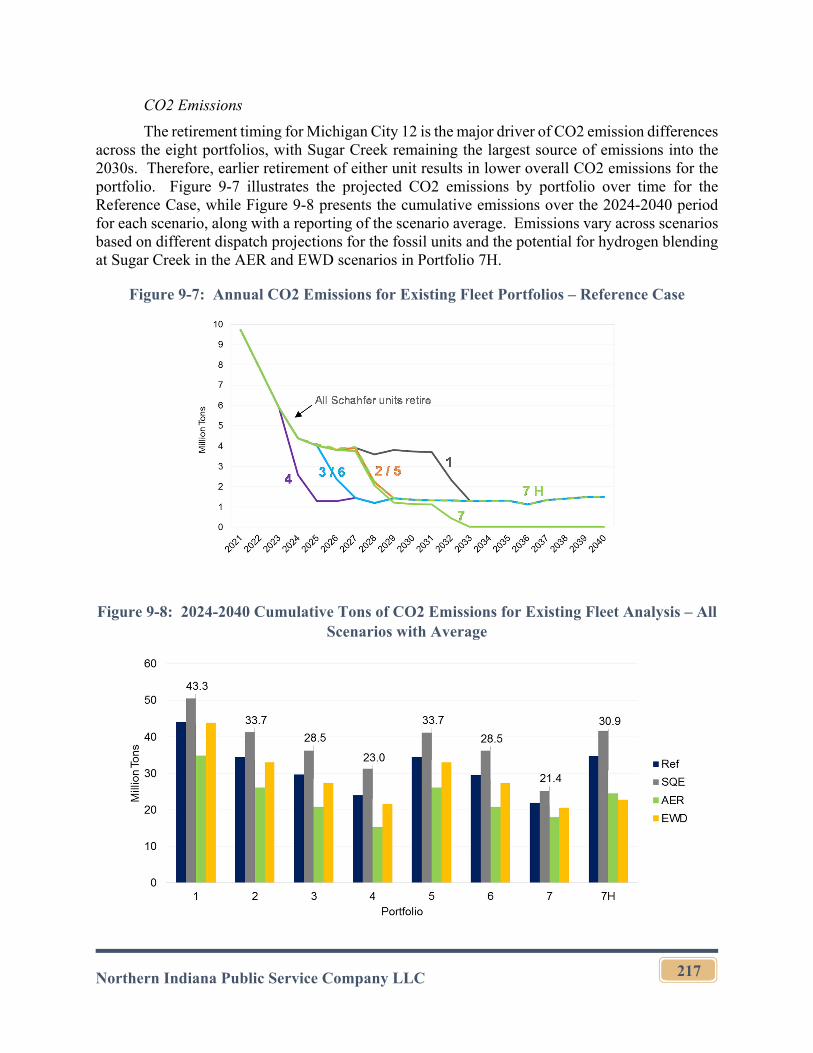
Northern Indiana Public Service Company LLC
217
CO2 Emissions
The retirement timing for Michigan City 12 is the major driver of CO2 emission differences across the eight portfolios, with Sugar Creek remaining the largest source of emissions into the 2030s. Therefore, earlier retirement of either unit results in lower overall CO2 emissions for the portfolio. Figure 9-7 illustrates the projected CO2 emissions by portfolio over time for the Reference Case, while Figure 9-8 presents the cumulative emissions over the 2024-2040 period for each scenario, along with a reporting of the scenario average. Emissions vary across scenarios based on different dispatch projections for the fossil units and the potential for hydrogen blending at Sugar Creek in the AER and EWD scenarios in Portfolio 7H.
Figure 9-7: Annual CO2 Emissions for Existing Fleet Portfolios – Reference Case
Figure 9-8: 2024-2040 Cumulative Tons of CO2 Emissions for Existing Fleet Analysis – All Scenarios with Average
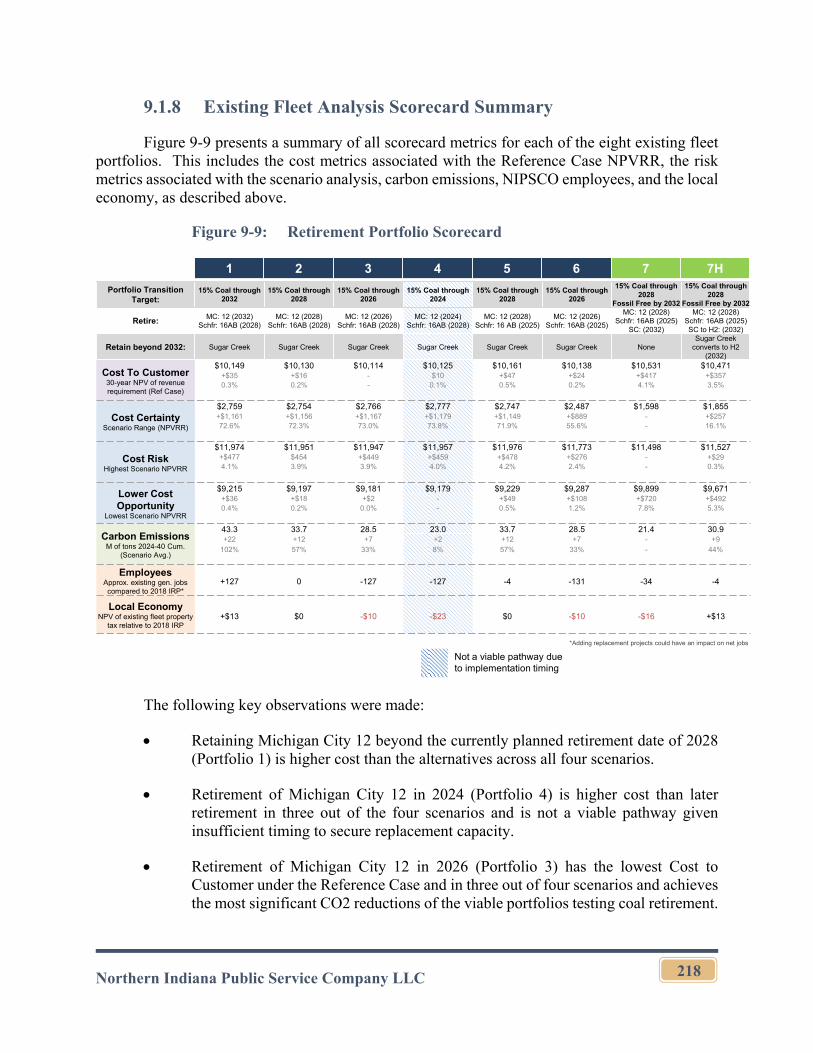
Northern Indiana Public Service Company LLC
218
9.1.8 Existing Fleet Analysis Scorecard Summary
Figure 9-9 presents a summary of all scorecard metrics for each of the eight existing fleet portfolios. This includes the cost metrics associated with the Reference Case NPVRR, the risk metrics associated with the scenario analysis, carbon emissions, NIPSCO employees, and the local economy, as described above.
Figure 9-9: Retirement Portfolio Scorecard
The following key observations were made:
Retaining Michigan City 12 beyond the currently planned retirement date of 2028 (Portfolio 1) is higher cost than the alternatives across all four scenarios.
Retirement of Michigan City 12 in 2024 (Portfolio 4) is higher cost than later retirement in three out of the four scenarios and is not a viable pathway given insufficient timing to secure replacement capacity.
Retirement of Michigan City 12 in 2026 (Portfolio 3) has the lowest Cost to Customer under the Reference Case and in three out of four scenarios and achieves the most significant CO2 reductions of the viable portfolios testing coal retirement.
1 2 3 4 5 6 7 7H
Not a viable pathway due to implementation timing
*Adding replacement projects could have an impact on net jobs
Portfolio Transition Target:
15% Coal through 2032
15% Coal through 2028
15% Coal through 2026
15% Coal through 2024
15% Coal through 2028
15% Coal through 2026
15% Coal through 2028
Fossil Free by 2032
15% Coal through 2028
Fossil Free by 2032
Retire:MC: 12 (2032)
Schfr: 16AB (2028)MC: 12 (2028)
Schfr: 16AB (2028)MC: 12 (2026)
Schfr: 16AB (2028)MC: 12 (2024)
Schfr: 16AB (2028)MC: 12 (2028)
Schfr: 16 AB (2025)MC: 12 (2026)
Schfr: 16AB (2025)
MC: 12 (2028)Schfr: 16AB (2025)
SC: (2032)
MC: 12 (2028)Schfr: 16AB (2025)SC to H2: (2032)
Retain beyond 2032: Sugar Creek Sugar Creek Sugar Creek Sugar Creek Sugar Creek Sugar Creek NoneSugar Creek
converts to H2 (2032)
Cost To Customer30-year NPV of revenue requirement (Ref Case)
$10,149 $10,130 $10,114 $10,125 $10,161 $10,138 $10,531 $10,471+$35 +$16 - $10 +$47 +$24 +$417 +$3570.3% 0.2% - 0.1% 0.5% 0.2% 4.1% 3.5%
Cost CertaintyScenario Range (NPVRR)
$2,759 $2,754 $2,766 $2,777 $2,747 $2,487 $1,598 $1,855+$1,161 +$1,156 +$1,167 +$1,179 +$1,149 +$889 - +$25772.6% 72.3% 73.0% 73.8% 71.9% 55.6% - 16.1%
Cost RiskHighest Scenario NPVRR
$11,974 $11,951 $11,947 $11,957 $11,976 $11,773 $11,498 $11,527+$477 $454 +$449 +$459 +$478 +$276 - +$294.1% 3.9% 3.9% 4.0% 4.2% 2.4% - 0.3%
Lower Cost Opportunity
Lowest Scenario NPVRR
$9,215 $9,197 $9,181 $9,179 $9,229 $9,287 $9,899 $9,671+$36 +$18 +$2 - +$49 +$108 +$720 +$4920.4% 0.2% 0.0% - 0.5% 1.2% 7.8% 5.3%
Carbon EmissionsM of tons 2024-40 Cum.
(Scenario Avg.)
43.3 33.7 28.5 23.0 33.7 28.5 21.4 30.9+22 +12 +7 +2 +12 +7 - +9
102% 57% 33% 8% 57% 33% - 44%
EmployeesApprox. existing gen. jobs compared to 2018 IRP*
+127 0 -127 -127 -4 -131 -34 -4
Local EconomyNPV of existing fleet property
tax relative to 2018 IRP+$13 $0 -$10 -$23 $0 -$10 -$16 +$13
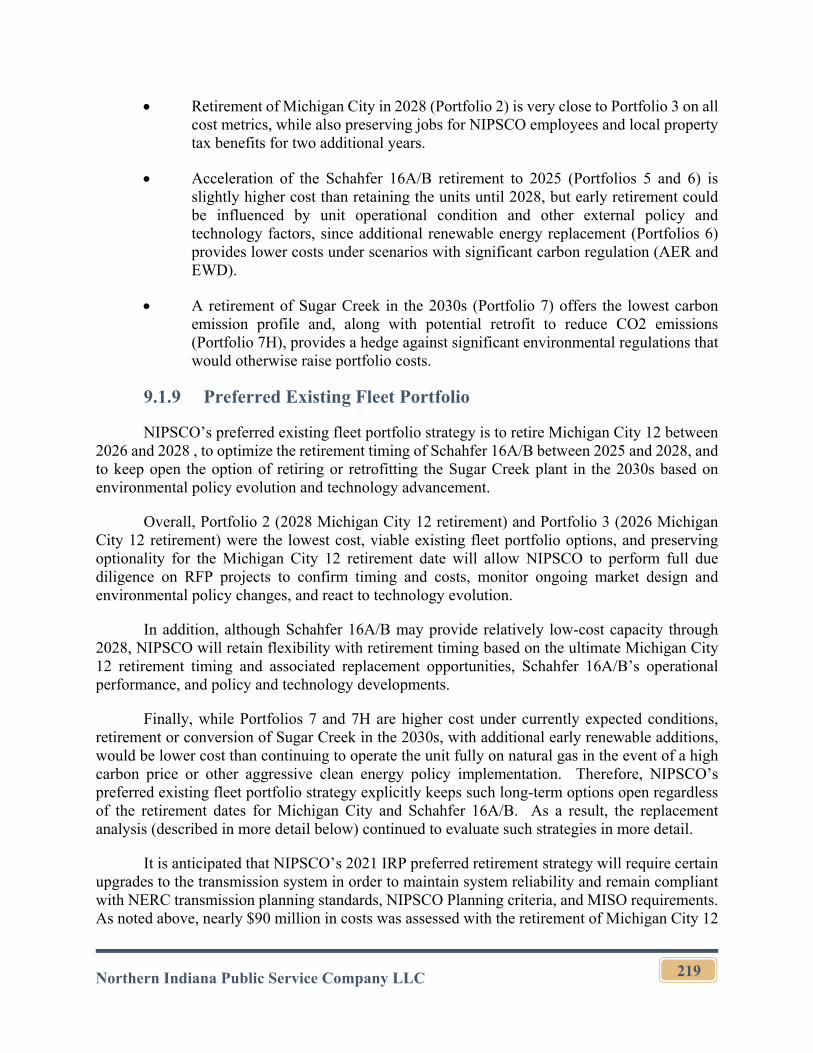
Northern Indiana Public Service Company LLC
219
Retirement of Michigan City in 2028 (Portfolio 2) is very close to Portfolio 3 on all cost metrics, while also preserving jobs for NIPSCO employees and local property tax benefits for two additional years.
Acceleration of the Schahfer 16A/B retirement to 2025 (Portfolios 5 and 6) is slightly higher cost than retaining the units until 2028, but early retirement could be influenced by unit operational condition and other external policy and technology factors, since additional renewable energy replacement (Portfolios 6) provides lower costs under scenarios with significant carbon regulation (AER and EWD).
A retirement of Sugar Creek in the 2030s (Portfolio 7) offers the lowest carbon emission profile and, along with potential retrofit to reduce CO2 emissions (Portfolio 7H), provides a hedge against significant environmental regulations that would otherwise raise portfolio costs.
9.1.9 Preferred Existing Fleet Portfolio
NIPSCO’s preferred existing fleet portfolio strategy is to retire Michigan City 12 between 2026 and 2028 , to optimize the retirement timing of Schahfer 16A/B between 2025 and 2028, and to keep open the option of retiring or retrofitting the Sugar Creek plant in the 2030s based on environmental policy evolution and technology advancement.
Overall, Portfolio 2 (2028 Michigan City 12 retirement) and Portfolio 3 (2026 Michigan City 12 retirement) were the lowest cost, viable existing fleet portfolio options, and preserving optionality for the Michigan City 12 retirement date will allow NIPSCO to perform full due diligence on RFP projects to confirm timing and costs, monitor ongoing market design and environmental policy changes, and react to technology evolution.
In addition, although Schahfer 16A/B may provide relatively low-cost capacity through 2028, NIPSCO will retain flexibility with retirement timing based on the ultimate Michigan City 12 retirement timing and associated replacement opportunities, Schahfer 16A/B’s operational performance, and policy and technology developments.
Finally, while Portfolios 7 and 7H are higher cost under currently expected conditions, retirement or conversion of Sugar Creek in the 2030s, with additional early renewable additions, would be lower cost than continuing to operate the unit fully on natural gas in the event of a high carbon price or other aggressive clean energy policy implementation. Therefore, NIPSCO’s preferred existing fleet portfolio strategy explicitly keeps such long-term options open regardless of the retirement dates for Michigan City and Schahfer 16A/B. As a result, the replacement analysis (described in more detail below) continued to evaluate such strategies in more detail.
It is anticipated that NIPSCO’s 2021 IRP preferred retirement strategy will require certain upgrades to the transmission system in order to maintain system reliability and remain compliant with NERC transmission planning standards, NIPSCO Planning criteria, and MISO requirements. As noted above, nearly $90 million in costs was assessed with the retirement of Michigan City 12
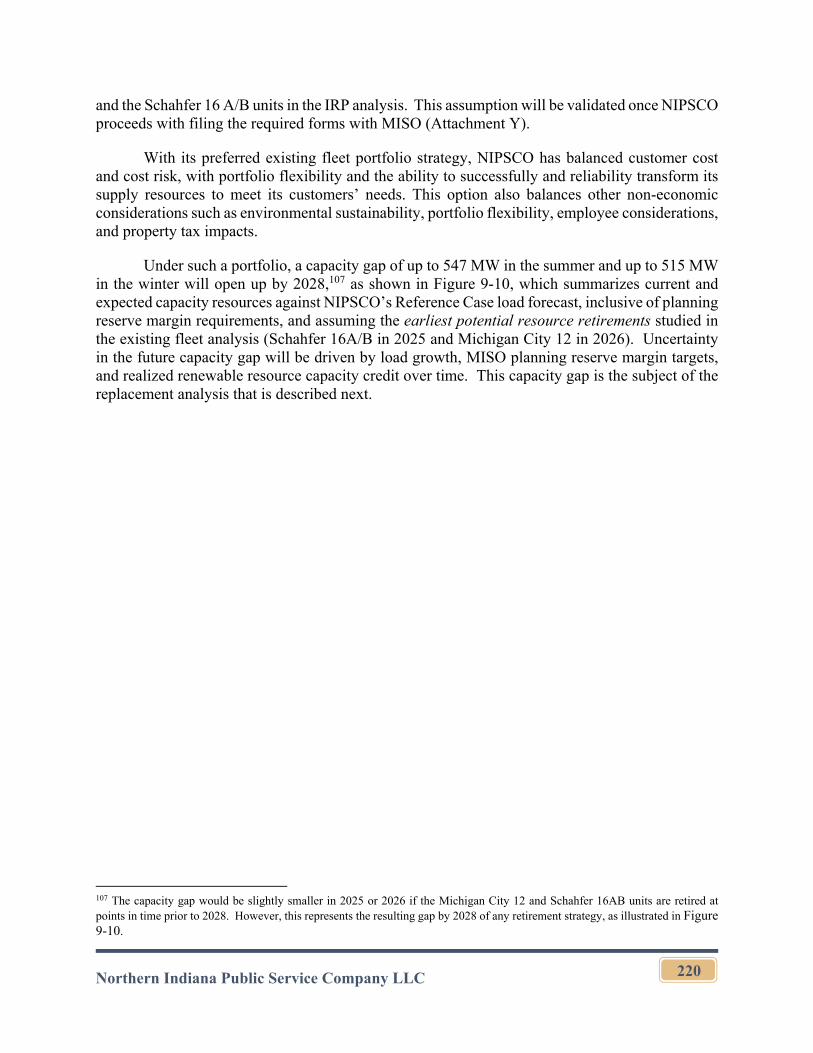
Northern Indiana Public Service Company LLC
220
and the Schahfer 16 A/B units in the IRP analysis. This assumption will be validated once NIPSCO proceeds with filing the required forms with MISO (Attachment Y).
With its preferred existing fleet portfolio strategy, NIPSCO has balanced customer cost and cost risk, with portfolio flexibility and the ability to successfully and reliability transform its supply resources to meet its customers’ needs. This option also balances other non-economic considerations such as environmental sustainability, portfolio flexibility, employee considerations, and property tax impacts.
Under such a portfolio, a capacity gap of up to 547 MW in the summer and up to 515 MW in the winter will open up by 2028,107 as shown in Figure 9-10, which summarizes current and expected capacity resources against NIPSCO’s Reference Case load forecast, inclusive of planning reserve margin requirements, and assuming the earliest potential resource retirements studied in the existing fleet analysis (Schahfer 16A/B in 2025 and Michigan City 12 in 2026). Uncertainty in the future capacity gap will be driven by load growth, MISO planning reserve margin targets, and realized renewable resource capacity credit over time. This capacity gap is the subject of the replacement analysis that is described next.
107 The capacity gap would be slightly smaller in 2025 or 2026 if the Michigan City 12 and Schahfer 16AB units are retired at points in time prior to 2028. However, this represents the resulting gap by 2028 of any retirement strategy, as illustrated in Figure 9-10.
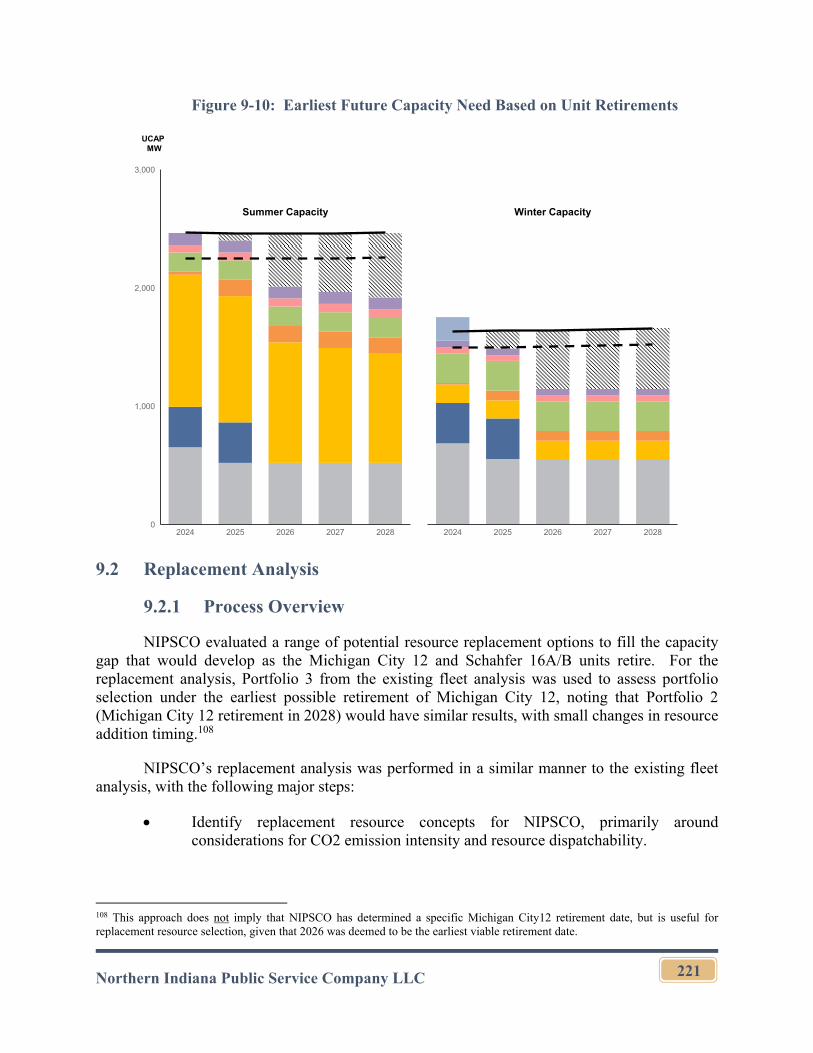
Northern Indiana Public Service Company LLC
221
Figure 9-10: Earliest Future Capacity Need Based on Unit Retirements
9.2 Replacement Analysis
9.2.1 Process Overview
NIPSCO evaluated a range of potential resource replacement options to fill the capacity gap that would develop as the Michigan City 12 and Schahfer 16A/B units retire. For the replacement analysis, Portfolio 3 from the existing fleet analysis was used to assess portfolio selection under the earliest possible retirement of Michigan City 12, noting that Portfolio 2 (Michigan City 12 retirement in 2028) would have similar results, with small changes in resource addition timing.108
NIPSCO’s replacement analysis was performed in a similar manner to the existing fleet analysis, with the following major steps:
Identify replacement resource concepts for NIPSCO, primarily around considerations for CO2 emission intensity and resource dispatchability.
108 This approach does not imply that NIPSCO has determined a specific Michigan City12 retirement date, but is useful for replacement resource selection, given that 2026 was deemed to be the earliest viable retirement date.
2,000
0
1,000
3,000
20262024 2025 2027 2028
Summer Capacity
202720262024 2025 2028
Winter Capacity
UCAP MW
Northern Indiana Public Service Company LLC
222
Develop specific replacement portfolios within each concept using IRP optimization tools, bids from the RFPs, and expert judgment.
Evaluate each replacement portfolio in the IRP tools for each scenario and across the full stochastic distribution of major market inputs (as discussed in detail in Section 8).
Record costs, risks, and other metrics in the integrated scorecard to arrive at a preferred replacement portfolio strategy.
9.2.2 Identification of Replacement Resource Concepts
NIPSCO developed a matrix of replacement resource concepts based on two key planning considerations. The first consideration was structured around the “dispatchability” of the resource options. Broadly speaking, dispatchability refers to the ability of resources within the portfolio to provide energy “on demand,” meaning that resources not reliant on external weather conditions and factors and resources with longer energy duration capabilities are considered more dispatchable. Across the dispatchability consideration, three categories were broadly defined:
Portfolios that meet only the existing summer reserve margin requirements over time and tend to contain more solar capacity than other dispatchable resource types;109
Portfolios that meet both winter and summer reserve margin requirements over time and tend to contain additional thermal or storage capacity;
“Enhanced” reserve margin portfolios that more fully rely on local resources with longer energy duration capabilities, especially thermal resources. Such a portfolio category recognizes the need for local resources during emergency conditions and anticipates future MISO market policy developments that may reduce the capacity credit for resources with limited energy durations, such as four-hour batteries.
The second consideration was structured around the CO2 emission intensity of each potential portfolio option. While no specific emission intensities were defined, portfolios with more fossil-fired resource capacity were considered to have higher emission intensities, while portfolios with more renewable and storage capacity were considered to have lower emission intensities. In addition, specific net-zero emission concepts based on retirement or conversion to hydrogen of all fossil resources in the portfolio were developed.
Overall, nine different concepts were identified for more detailed portfolio development, as shown in Figure 9-11. These portfolios are referred to as Portfolios A-I throughout the rest of this Section.
109 Given expectations for MISO market rules changes, these portfolio concepts are not viable, but were evaluated to assess their costs across scenarios along with other tradeoffs. Certain stakeholders also expressed an interest in evaluating this theme.
Northern Indiana Public Service Company LLC
223
Figure 9-11: Replacement Consideration Matrix
9.2.3 Development of Specific Replacement Portfolios
Based on the nine replacement concepts, NIPSCO then developed specific portfolios to fit each theme. This was done through a combination of the Aurora model’s portfolio optimization capability and expert judgment to adjust portfolio concepts based on optimization analysis and available RFP bids.
DSM and DER Selection
Across all portfolio themes, the following DSM bundles were incorporated based on the economic optimization analysis: (i) Tier 1 residential EE for 2024-2029, 2030-2035, and 2036-2041; (ii) commercial and industrial EE for 2024-2029, 2030-2035, and 2036-2041; and (iii) the residential DR rates programs after 2030. (See Section 5 for additional detail on the specific energy and peak savings contributions of each bundle). In addition, 10 MW of NIPSCO DER was incorporated in all portfolio themes, reflecting the DER opportunities with the largest investment deferral benefit (See Section 4 for additional detail).
All-Source RFP Resource Selection
Beyond DSM and DER additions, NIPSCO used the following approach to select RFP project additions for each of the portfolio themes, which are summarized in Figure 9-12 with incremental ICAP additions and in Figure 9-13 with new resource UCAP contributions shown in the context of the remaining portfolio and expected seasonal reserve margin requirements for 2027:
Dispatchability
Current Planning Reserve Margin
Winter & Summer Reserve Margin
Enhanced Reserve Margin (Local w/ Higher Energy Duration)
Em
issi
on
s
Higher CarbonEmissions
Thermal PPAs, solar and storage
Non-service territory gas peaking (no early storage)
Natural gas dominant (CC)
Mid Carbon Emissions
No new thermal resources; solar dominant w/ storage
Thermal PPAs plus storage and solar
Local gas peaker, plus solar and storage
Low Carbon Emissions
Solar dominant w/ storage, plus retire Sugar Creek
All renewables and storage, plus retire Sugar Creek (Portfolio 7)
New H2-enabled peaker plus solar and storage, plus SC conversion to H2 (Portfolio 7H)
Sugar Creek Retires or converts to H2
Net Zero Concepts
A B C
D E F
G H I
Sugar Creek is retained through modeling
horizon
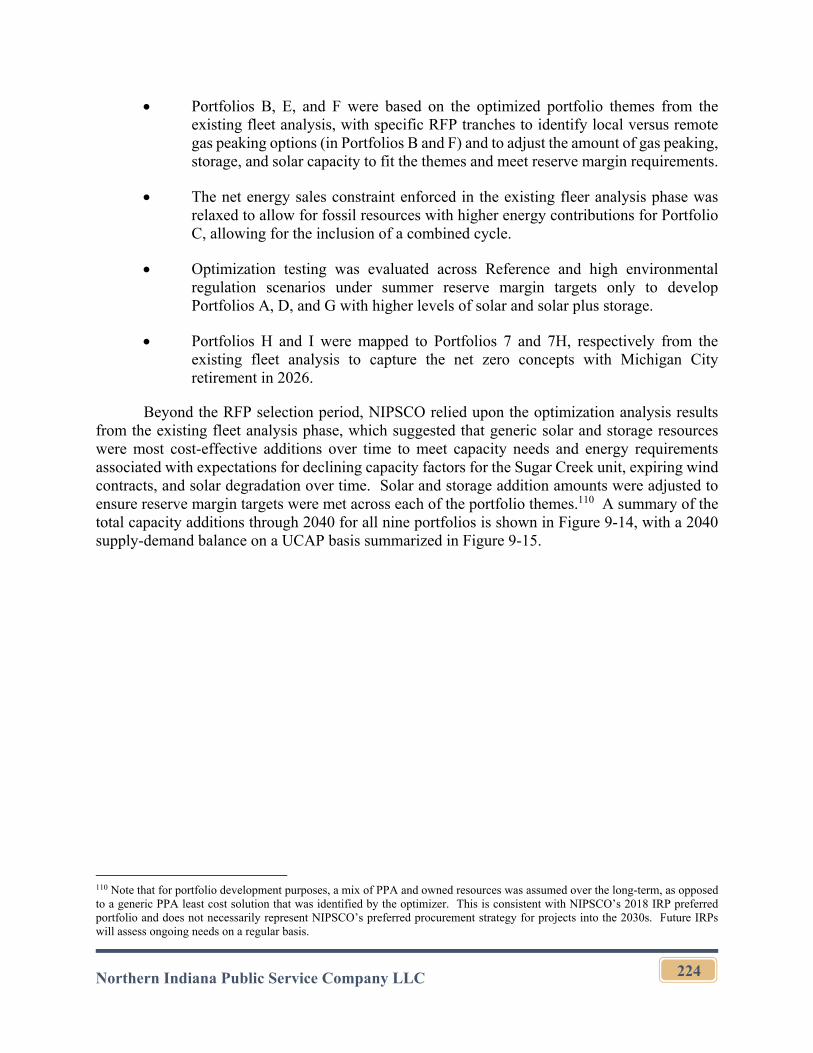
Northern Indiana Public Service Company LLC
224
Portfolios B, E, and F were based on the optimized portfolio themes from the existing fleet analysis, with specific RFP tranches to identify local versus remote gas peaking options (in Portfolios B and F) and to adjust the amount of gas peaking, storage, and solar capacity to fit the themes and meet reserve margin requirements.
The net energy sales constraint enforced in the existing fleer analysis phase was relaxed to allow for fossil resources with higher energy contributions for Portfolio C, allowing for the inclusion of a combined cycle.
Optimization testing was evaluated across Reference and high environmental regulation scenarios under summer reserve margin targets only to develop Portfolios A, D, and G with higher levels of solar and solar plus storage.
Portfolios H and I were mapped to Portfolios 7 and 7H, respectively from the existing fleet analysis to capture the net zero concepts with Michigan City retirement in 2026.
Beyond the RFP selection period, NIPSCO relied upon the optimization analysis results from the existing fleet analysis phase, which suggested that generic solar and storage resources were most cost-effective additions over time to meet capacity needs and energy requirements associated with expectations for declining capacity factors for the Sugar Creek unit, expiring wind contracts, and solar degradation over time. Solar and storage addition amounts were adjusted to ensure reserve margin targets were met across each of the portfolio themes.110 A summary of the total capacity additions through 2040 for all nine portfolios is shown in Figure 9-14, with a 2040 supply-demand balance on a UCAP basis summarized in Figure 9-15.
110 Note that for portfolio development purposes, a mix of PPA and owned resources was assumed over the long-term, as opposed to a generic PPA least cost solution that was identified by the optimizer. This is consistent with NIPSCO’s 2018 IRP preferred portfolio and does not necessarily represent NIPSCO’s preferred procurement strategy for projects into the 2030s. Future IRPs will assess ongoing needs on a regular basis.
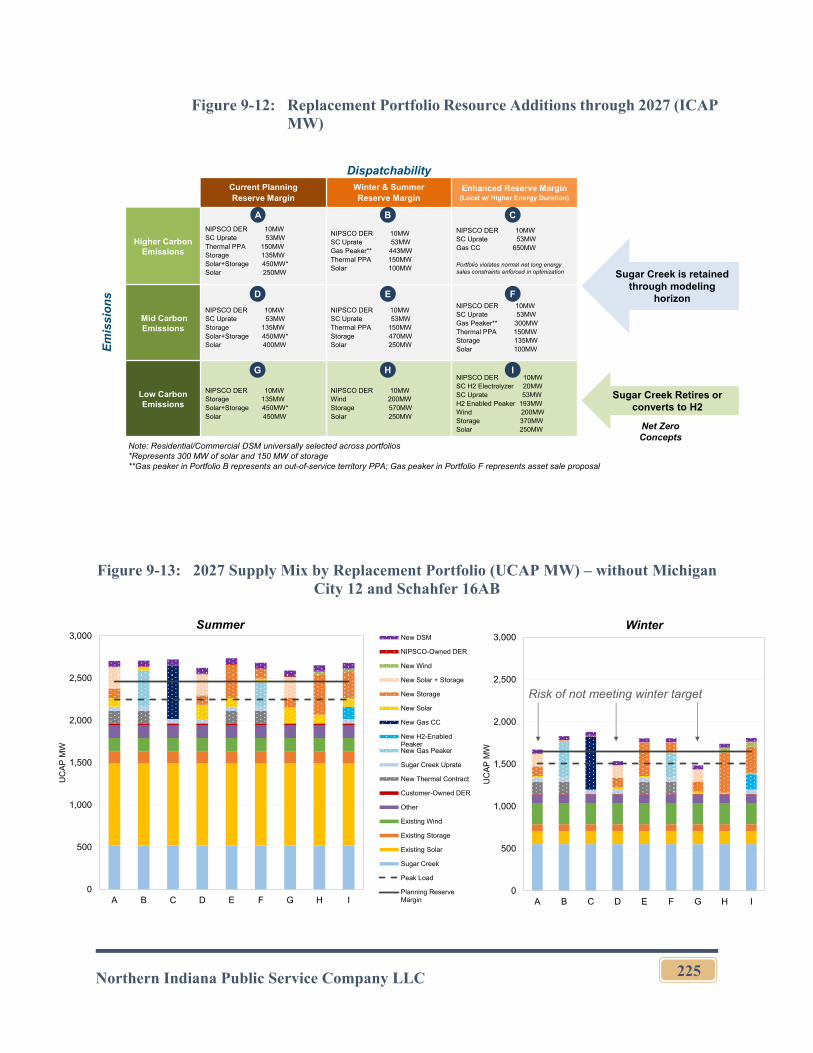
Northern Indiana Public Service Company LLC
225
Figure 9-12: Replacement Portfolio Resource Additions through 2027 (ICAP MW)
Figure 9-13: 2027 Supply Mix by Replacement Portfolio (UCAP MW) – without Michigan City 12 and Schahfer 16AB
DispatchabilityCurrent Planning Reserve Margin
Winter & Summer Reserve Margin
Enhanced Reserve Margin (Local w/ Higher Energy Duration)
Em
issi
on
s
Higher CarbonEmissions
NIPSCO DER 10MWSC Uprate 53MWThermal PPA 150MWStorage 135MWSolar+Storage 450MW*Solar 250MW
NIPSCO DER 10MWSC Uprate 53MWGas Peaker** 443MWThermal PPA 150MWSolar 100MW
NIPSCO DER 10MWSC Uprate 53MWGas CC 650MW
Portfolio violates normal net long energy sales constraints enforced in optimization
Mid Carbon Emissions
NIPSCO DER 10MWSC Uprate 53MWStorage 135MWSolar+Storage 450MW*Solar 400MW
NIPSCO DER 10MWSC Uprate 53MWThermal PPA 150MWStorage 470MWSolar 250MW
NIPSCO DER 10MWSC Uprate 53MWGas Peaker** 300MWThermal PPA 150MWStorage 135MWSolar 100MW
Low Carbon Emissions
NIPSCO DER 10MWStorage 135MWSolar+Storage 450MW*Solar 450MW
NIPSCO DER 10MWWind 200MWStorage 570MWSolar 250MW
NIPSCO DER 10MWSC H2 Electrolyzer 20MWSC Uprate 53MWH2 Enabled Peaker 193MWWind 200MWStorage 370MWSolar 250MW
Sugar Creek Retires or converts to H2
Net Zero Concepts
A B C
D E F
G H I
Note: Residential/Commercial DSM universally selected across portfolios *Represents 300 MW of solar and 150 MW of storage**Gas peaker in Portfolio B represents an out-of-service territory PPA; Gas peaker in Portfolio F represents asset sale proposal
Sugar Creek is retained through modeling
horizon
0
500
1,000
1,500
2,000
2,500
3,000
A B C D E F G H I
UC
AP
MW
0
500
1,000
1,500
2,000
2,500
3,000
A B C D E F G H I
UC
AP
MW
New DSM
NIPSCO-Owned DER
New Wind
New Solar + Storage
New Storage
New Solar
New Gas CC
New H2-EnabledPeakerNew Gas Peaker
Sugar Creek Uprate
New Thermal Contract
Customer-Owned DER
Other
Existing Wind
Existing Storage
Existing Solar
Sugar Creek
Peak Load
Planning ReserveMargin
Summer
Risk of not meeting winter target
Winter
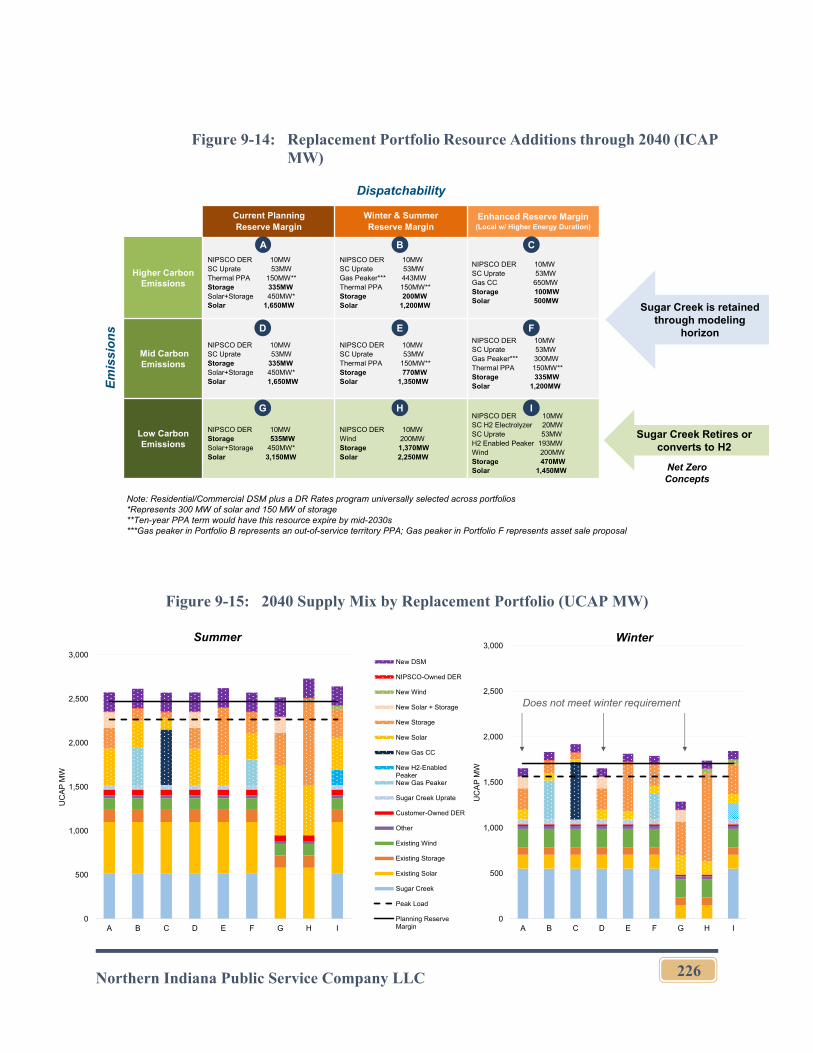
Northern Indiana Public Service Company LLC
226
Figure 9-14: Replacement Portfolio Resource Additions through 2040 (ICAP MW)
Figure 9-15: 2040 Supply Mix by Replacement Portfolio (UCAP MW)
Dispatchability
Current Planning Reserve Margin
Winter & Summer Reserve Margin
Enhanced Reserve Margin (Local w/ Higher Energy Duration)
Em
issi
on
s
Higher CarbonEmissions
NIPSCO DER 10MWSC Uprate 53MWThermal PPA 150MW**Storage 335MWSolar+Storage 450MW*Solar 1,650MW
NIPSCO DER 10MWSC Uprate 53MWGas Peaker*** 443MWThermal PPA 150MW**Storage 200MW Solar 1,200MW
NIPSCO DER 10MWSC Uprate 53MWGas CC 650MWStorage 100MW Solar 500MW
Mid Carbon Emissions
NIPSCO DER 10MWSC Uprate 53MWStorage 335MWSolar+Storage 450MW*Solar 1,650MW
NIPSCO DER 10MWSC Uprate 53MWThermal PPA 150MW**Storage 770MWSolar 1,350MW
NIPSCO DER 10MWSC Uprate 53MWGas Peaker*** 300MWThermal PPA 150MW**Storage 335MWSolar 1,200MW
Low Carbon Emissions
NIPSCO DER 10MWStorage 535MWSolar+Storage 450MW*Solar 3,150MW
NIPSCO DER 10MWWind 200MWStorage 1,370MWSolar 2,250MW
NIPSCO DER 10MWSC H2 Electrolyzer 20MWSC Uprate 53MWH2 Enabled Peaker 193MWWind 200MWStorage 470MWSolar 1,450MW
Sugar Creek Retires or converts to H2
Net Zero Concepts
A B C
D E F
G H I
Note: Residential/Commercial DSM plus a DR Rates program universally selected across portfolios *Represents 300 MW of solar and 150 MW of storage**Ten-year PPA term would have this resource expire by mid-2030s***Gas peaker in Portfolio B represents an out-of-service territory PPA; Gas peaker in Portfolio F represents asset sale proposal
Sugar Creek is retained through modeling
horizon
0
500
1,000
1,500
2,000
2,500
3,000
A B C D E F G H I
UC
AP
MW
Summer Winter
Does not meet winter requirement
0
500
1,000
1,500
2,000
2,500
3,000
A B C D E F G H I
UC
AP
MW
New DSM
NIPSCO-Owned DER
New Wind
New Solar + Storage
New Storage
New Solar
New Gas CC
New H2-EnabledPeakerNew Gas Peaker
Sugar Creek Uprate
Customer-Owned DER
Other
Existing Wind
Existing Storage
Existing Solar
Sugar Creek
Peak Load
Planning ReserveMargin
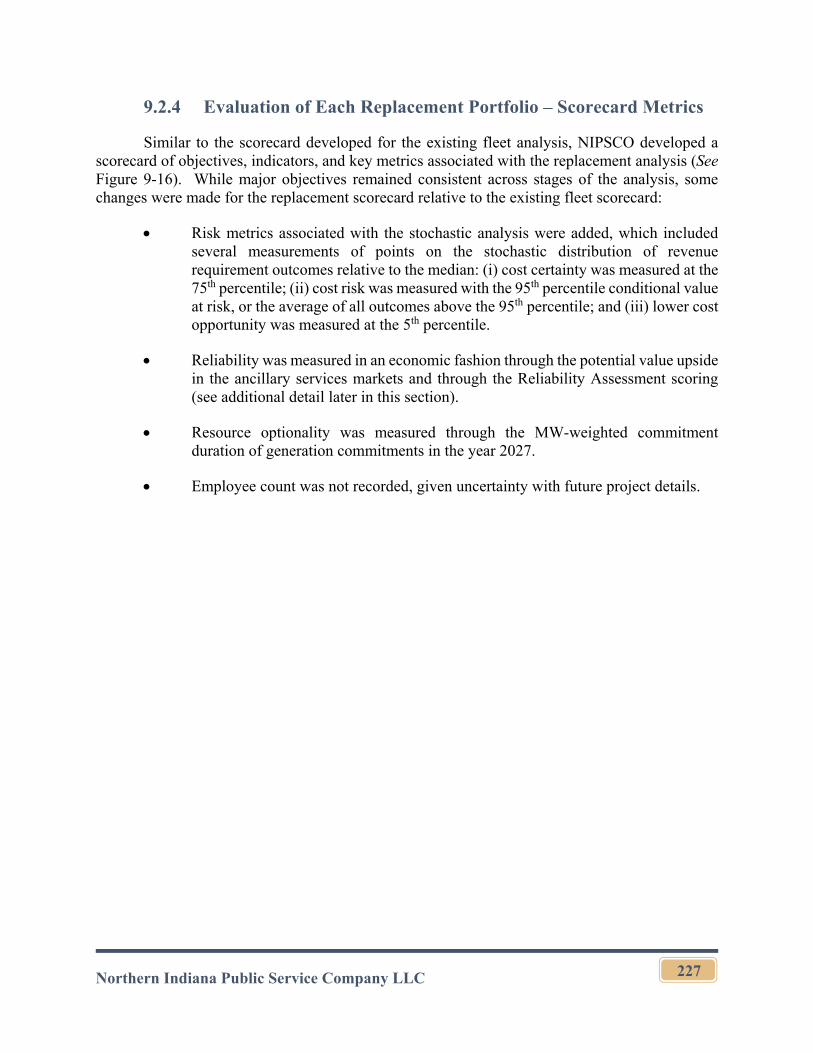
Northern Indiana Public Service Company LLC
227
9.2.4 Evaluation of Each Replacement Portfolio – Scorecard Metrics
Similar to the scorecard developed for the existing fleet analysis, NIPSCO developed a scorecard of objectives, indicators, and key metrics associated with the replacement analysis (See Figure 9-16). While major objectives remained consistent across stages of the analysis, some changes were made for the replacement scorecard relative to the existing fleet scorecard:
Risk metrics associated with the stochastic analysis were added, which included several measurements of points on the stochastic distribution of revenue requirement outcomes relative to the median: (i) cost certainty was measured at the 75th percentile; (ii) cost risk was measured with the 95th percentile conditional value at risk, or the average of all outcomes above the 95th percentile; and (iii) lower cost opportunity was measured at the 5th percentile.
Reliability was measured in an economic fashion through the potential value upside in the ancillary services markets and through the Reliability Assessment scoring (see additional detail later in this section).
Resource optionality was measured through the MW-weighted commitment duration of generation commitments in the year 2027.
Employee count was not recorded, given uncertainty with future project details.
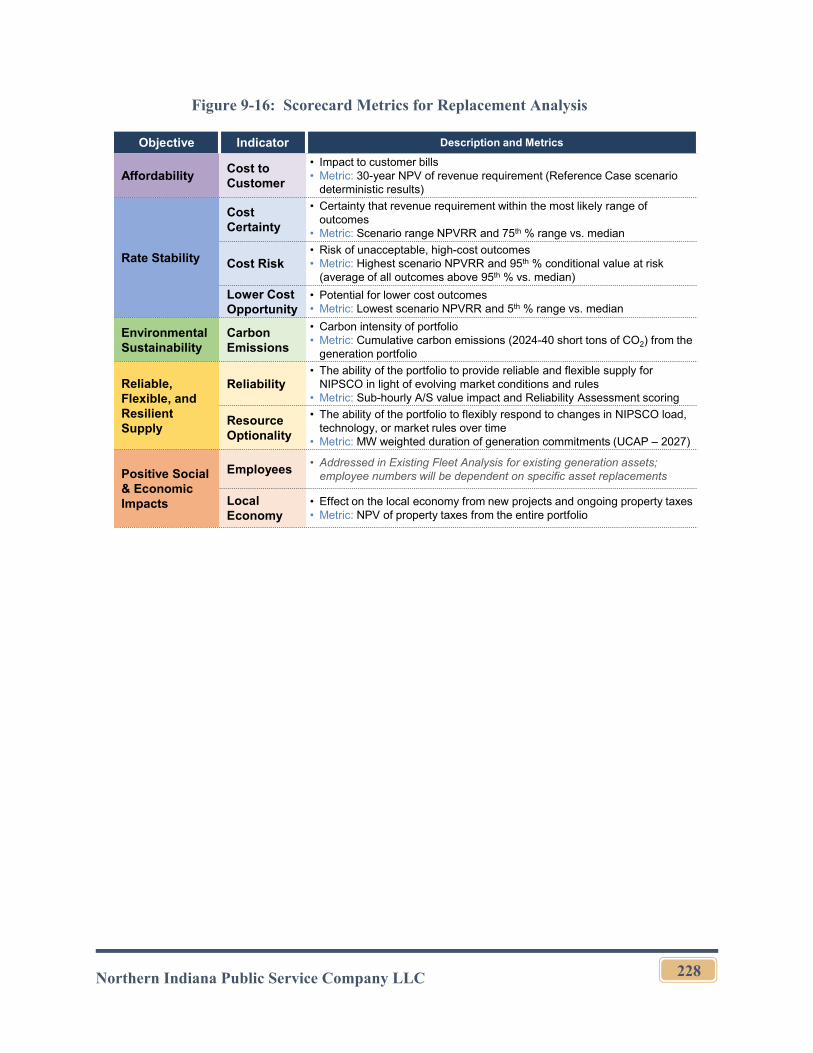
Northern Indiana Public Service Company LLC
228
Figure 9-16: Scorecard Metrics for Replacement Analysis
Objective Indicator Description and Metrics
AffordabilityCost to Customer
• Impact to customer bills• Metric: 30-year NPV of revenue requirement (Reference Case scenario
deterministic results)
Rate Stability
Cost Certainty
• Certainty that revenue requirement within the most likely range of outcomes
• Metric: Scenario range NPVRR and 75th % range vs. median
Cost Risk• Risk of unacceptable, high-cost outcomes• Metric: Highest scenario NPVRR and 95th % conditional value at risk
(average of all outcomes above 95th % vs. median)
Lower Cost Opportunity
• Potential for lower cost outcomes• Metric: Lowest scenario NPVRR and 5th % range vs. median
Environmental Sustainability
Carbon Emissions
• Carbon intensity of portfolio• Metric: Cumulative carbon emissions (2024-40 short tons of CO2) from the
generation portfolio
Reliable, Flexible, and Resilient Supply
Reliability• The ability of the portfolio to provide reliable and flexible supply for
NIPSCO in light of evolving market conditions and rules• Metric: Sub-hourly A/S value impact and Reliability Assessment scoring
Resource Optionality
• The ability of the portfolio to flexibly respond to changes in NIPSCO load, technology, or market rules over time
• Metric: MW weighted duration of generation commitments (UCAP – 2027)
Positive Social & Economic Impacts
Employees• Addressed in Existing Fleet Analysis for existing generation assets;
employee numbers will be dependent on specific asset replacements
Local Economy
• Effect on the local economy from new projects and ongoing property taxes• Metric: NPV of property taxes from the entire portfolio
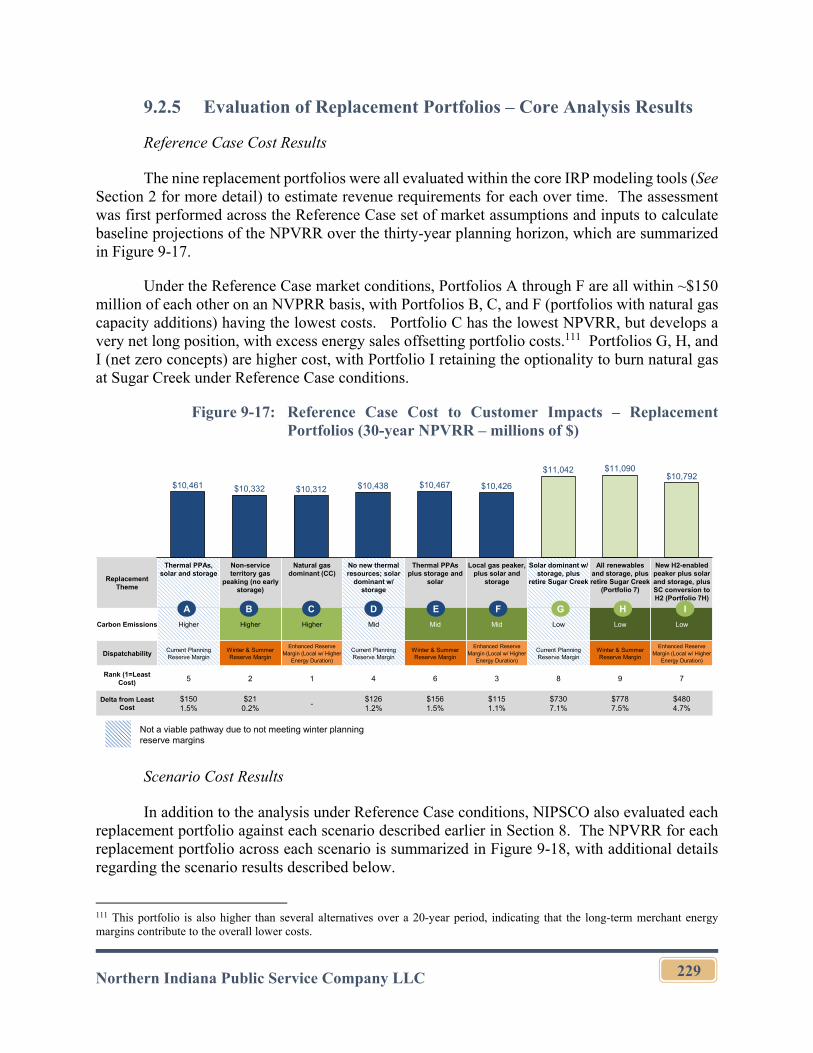
Northern Indiana Public Service Company LLC
229
9.2.5 Evaluation of Replacement Portfolios – Core Analysis Results
Reference Case Cost Results
The nine replacement portfolios were all evaluated within the core IRP modeling tools (See Section 2 for more detail) to estimate revenue requirements for each over time. The assessment was first performed across the Reference Case set of market assumptions and inputs to calculate baseline projections of the NPVRR over the thirty-year planning horizon, which are summarized in Figure 9-17.
Under the Reference Case market conditions, Portfolios A through F are all within ~$150 million of each other on an NVPRR basis, with Portfolios B, C, and F (portfolios with natural gas capacity additions) having the lowest costs. Portfolio C has the lowest NPVRR, but develops a very net long position, with excess energy sales offsetting portfolio costs.111 Portfolios G, H, and I (net zero concepts) are higher cost, with Portfolio I retaining the optionality to burn natural gas at Sugar Creek under Reference Case conditions.
Figure 9-17: Reference Case Cost to Customer Impacts – Replacement Portfolios (30-year NPVRR – millions of $)
Scenario Cost Results
In addition to the analysis under Reference Case conditions, NIPSCO also evaluated each replacement portfolio against each scenario described earlier in Section 8. The NPVRR for each replacement portfolio across each scenario is summarized in Figure 9-18, with additional details regarding the scenario results described below.
111 This portfolio is also higher than several alternatives over a 20-year period, indicating that the long-term merchant energy margins contribute to the overall lower costs.
Replacement Theme
Thermal PPAs,solar and storage
Non-service territory gas
peaking (no early storage)
Natural gas dominant (CC)
No new thermal resources; solar
dominant w/ storage
Thermal PPAs plus storage and
solar
Local gas peaker, plus solar and
storage
Solar dominant w/ storage, plus
retire Sugar Creek
All renewables and storage, plus retire Sugar Creek
(Portfolio 7)
New H2-enabled peaker plus solar and storage, plus SC conversion to H2 (Portfolio 7H)
Carbon Emissions Higher Higher Higher Mid Mid Mid Low Low Low
DispatchabilityCurrent Planning Reserve Margin
Winter & SummerReserve Margin
Enhanced Reserve Margin (Local w/ Higher
Energy Duration)
Current Planning Reserve Margin
Winter & SummerReserve Margin
Enhanced Reserve Margin (Local w/ Higher
Energy Duration)
Current Planning Reserve Margin
Winter & SummerReserve Margin
Enhanced Reserve Margin (Local w/ Higher
Energy Duration)
Rank (1=Least Cost) 5 2 1 4 6 3 8 9 7
Delta from LeastCost
$1501.5%
$210.2%
-$1261.2%
$1561.5%
$1151.1%
$7307.1%
$7787.5%
$4804.7%
A
$10,461 $10,332 $10,312 $10,438 $10,467 $10,426
$11,042 $11,090$10,792
B C D E F G H I
Not a viable pathway due to not meeting winter planning reserve margins
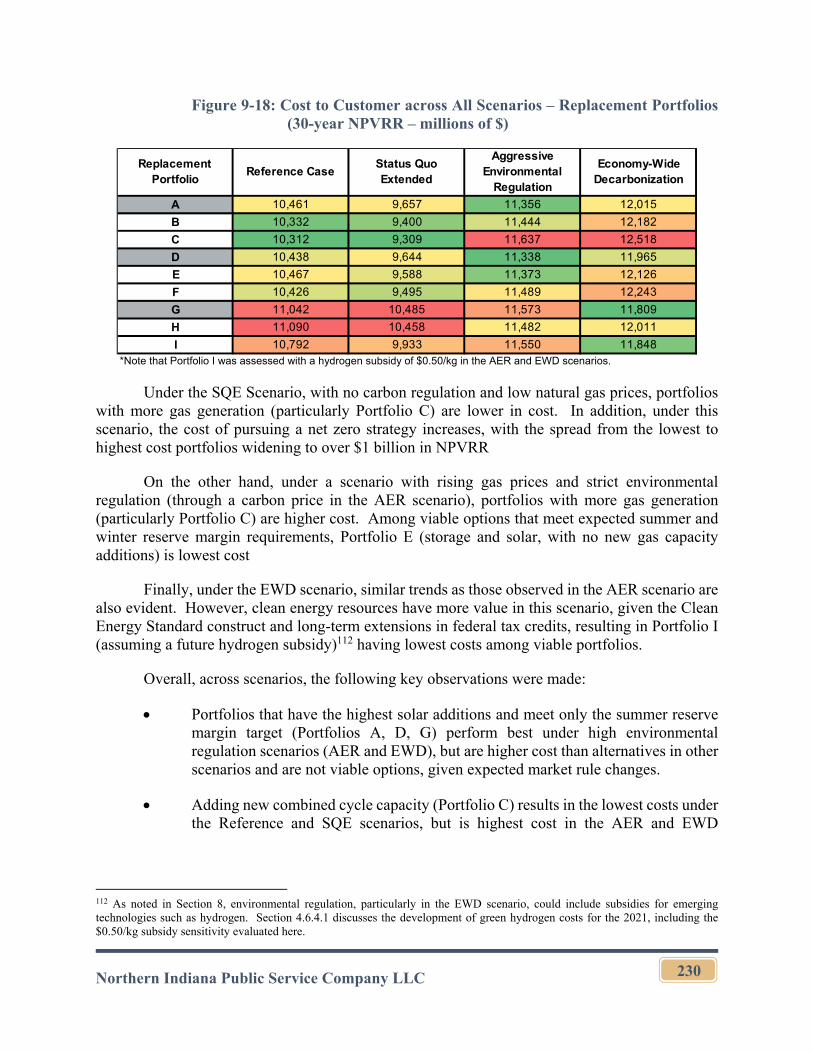
Northern Indiana Public Service Company LLC
230
Figure 9-18: Cost to Customer across All Scenarios – Replacement Portfolios (30-year NPVRR – millions of $)
*Note that Portfolio I was assessed with a hydrogen subsidy of $0.50/kg in the AER and EWD scenarios.
Under the SQE Scenario, with no carbon regulation and low natural gas prices, portfolios with more gas generation (particularly Portfolio C) are lower in cost. In addition, under this scenario, the cost of pursuing a net zero strategy increases, with the spread from the lowest to highest cost portfolios widening to over $1 billion in NPVRR
On the other hand, under a scenario with rising gas prices and strict environmental regulation (through a carbon price in the AER scenario), portfolios with more gas generation (particularly Portfolio C) are higher cost. Among viable options that meet expected summer and winter reserve margin requirements, Portfolio E (storage and solar, with no new gas capacity additions) is lowest cost
Finally, under the EWD scenario, similar trends as those observed in the AER scenario are also evident. However, clean energy resources have more value in this scenario, given the Clean Energy Standard construct and long-term extensions in federal tax credits, resulting in Portfolio I (assuming a future hydrogen subsidy)112 having lowest costs among viable portfolios.
Overall, across scenarios, the following key observations were made:
Portfolios that have the highest solar additions and meet only the summer reserve margin target (Portfolios A, D, G) perform best under high environmental regulation scenarios (AER and EWD), but are higher cost than alternatives in other scenarios and are not viable options, given expected market rule changes.
Adding new combined cycle capacity (Portfolio C) results in the lowest costs under the Reference and SQE scenarios, but is highest cost in the AER and EWD
112 As noted in Section 8, environmental regulation, particularly in the EWD scenario, could include subsidies for emerging technologies such as hydrogen. Section 4.6.4.1 discusses the development of green hydrogen costs for the 2021, including the $0.50/kg subsidy sensitivity evaluated here.
Replacement Portfolio
Reference CaseStatus Quo Extended
Aggressive Environmental
Regulation
Economy-Wide Decarbonization
A 10,461 9,657 11,356 12,015
B 10,332 9,400 11,444 12,182
C 10,312 9,309 11,637 12,518
D 10,438 9,644 11,338 11,965
E 10,467 9,588 11,373 12,126
F 10,426 9,495 11,489 12,243
G 11,042 10,485 11,573 11,809
H 11,090 10,458 11,482 12,011
I 10,792 9,933 11,550 11,848
Northern Indiana Public Service Company LLC
231
scenarios, illustrating how adding significant amounts of additional natural gas-fired energy to the portfolio contributes to higher levels of scenario risk.
While a portfolio approach that retires all thermal resources by 2032 and relies solely on renewables and storage (Portfolio H) provides a high level of scenario cost certainty, it is highest cost under Reference Case conditions.
Stochastic Analysis Results
In addition to assessing each replacement portfolio against each market scenario, NIPSCO has also evaluated the replacement options against the full stochastic distribution of potential outcomes for commodity prices and renewable output, as described in more detail in Section 8. The stochastic assessment is used to further evaluate the risk of each of the portfolios against a framework that is focused on short-term price and renewable output volatility as opposed to the long-term movement in macroeconomic or policy trends that are assessed across scenarios.
Figure 9-19 presents a summary of the stochastic results for each of the replacement portfolios, with the graphics highlighting the spread in NPVRR relative to the median (50th percentile) cost for each portfolio. The 25th to 75th percentile range is shown in the shaded box are, while the 5th and 95th percentiles are marked by the tails or “whiskers” shown below and above the box, respectively. The CVAR or average of the observations above the 95th percentile is indicated with a dot. The key risk metrics associated with NIPSCO’s integrated scorecard framework are shown in the table below the graphic.
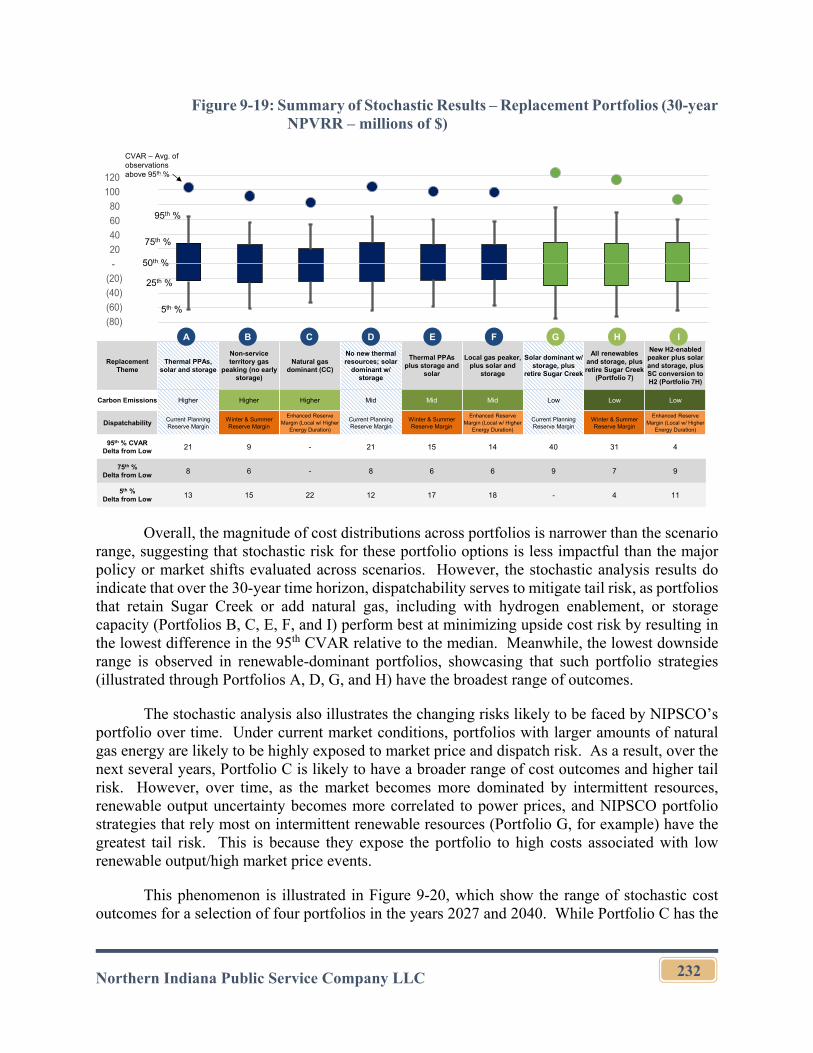
Northern Indiana Public Service Company LLC
232
Figure 9-19: Summary of Stochastic Results – Replacement Portfolios (30-year NPVRR – millions of $)
Overall, the magnitude of cost distributions across portfolios is narrower than the scenario range, suggesting that stochastic risk for these portfolio options is less impactful than the major policy or market shifts evaluated across scenarios. However, the stochastic analysis results do indicate that over the 30-year time horizon, dispatchability serves to mitigate tail risk, as portfolios that retain Sugar Creek or add natural gas, including with hydrogen enablement, or storage capacity (Portfolios B, C, E, F, and I) perform best at minimizing upside cost risk by resulting in the lowest difference in the 95th CVAR relative to the median. Meanwhile, the lowest downside range is observed in renewable-dominant portfolios, showcasing that such portfolio strategies (illustrated through Portfolios A, D, G, and H) have the broadest range of outcomes.
The stochastic analysis also illustrates the changing risks likely to be faced by NIPSCO’s portfolio over time. Under current market conditions, portfolios with larger amounts of natural gas energy are likely to be highly exposed to market price and dispatch risk. As a result, over the next several years, Portfolio C is likely to have a broader range of cost outcomes and higher tail risk. However, over time, as the market becomes more dominated by intermittent resources, renewable output uncertainty becomes more correlated to power prices, and NIPSCO portfolio strategies that rely most on intermittent renewable resources (Portfolio G, for example) have the greatest tail risk. This is because they expose the portfolio to high costs associated with low renewable output/high market price events.
This phenomenon is illustrated in Figure 9-20, which show the range of stochastic cost outcomes for a selection of four portfolios in the years 2027 and 2040. While Portfolio C has the
A B C D E F G H I (80)
(60)
(40)
(20)
-
20
40
60
80
100
120
Replacement Theme
Thermal PPAs,solar and storage
Non-service territory gas
peaking (no early storage)
Natural gas dominant (CC)
No new thermal resources; solar
dominant w/ storage
Thermal PPAs plus storage and
solar
Local gas peaker, plus solar and
storage
Solar dominant w/ storage, plus
retire Sugar Creek
All renewables and storage, plus retire Sugar Creek
(Portfolio 7)
New H2-enabled peaker plus solar and storage, plus SC conversion to H2 (Portfolio 7H)
Carbon Emissions Higher Higher Higher Mid Mid Mid Low Low Low
DispatchabilityCurrent Planning Reserve Margin
Winter & SummerReserve Margin
Enhanced Reserve Margin (Local w/ Higher
Energy Duration)
Current Planning Reserve Margin
Winter & SummerReserve Margin
Enhanced Reserve Margin (Local w/ Higher
Energy Duration)
Current Planning Reserve Margin
Winter & SummerReserve Margin
Enhanced Reserve Margin (Local w/ Higher
Energy Duration)
95th % CVARDelta from Low 21 9 - 21 15 14 40 31 4
75th %Delta from Low 8 6 - 8 6 6 9 7 9
5th %Delta from Low 13 15 22 12 17 18 - 4 11
A B C D E F G H I
CVAR – Avg. of observations above 95th %
95th %
50th %
25th %
5th %
75th %
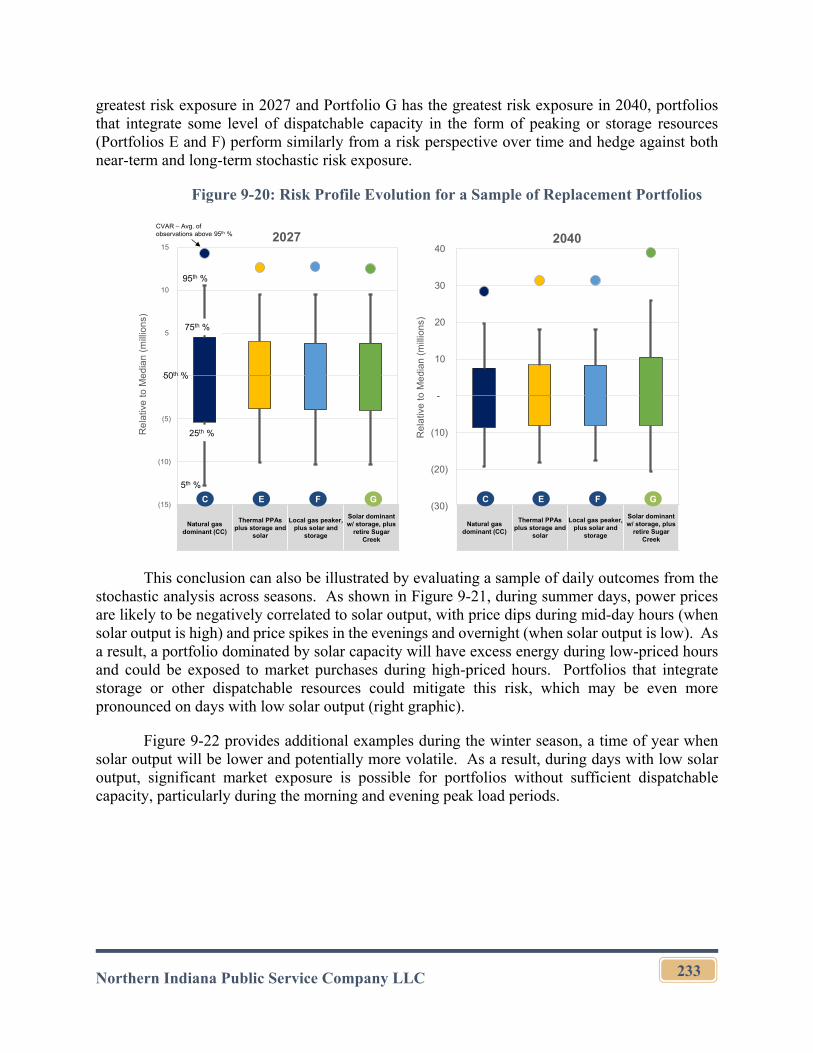
Northern Indiana Public Service Company LLC
233
greatest risk exposure in 2027 and Portfolio G has the greatest risk exposure in 2040, portfolios that integrate some level of dispatchable capacity in the form of peaking or storage resources (Portfolios E and F) perform similarly from a risk perspective over time and hedge against both near-term and long-term stochastic risk exposure.
Figure 9-20: Risk Profile Evolution for a Sample of Replacement Portfolios
This conclusion can also be illustrated by evaluating a sample of daily outcomes from the stochastic analysis across seasons. As shown in Figure 9-21, during summer days, power prices are likely to be negatively correlated to solar output, with price dips during mid-day hours (when solar output is high) and price spikes in the evenings and overnight (when solar output is low). As a result, a portfolio dominated by solar capacity will have excess energy during low-priced hours and could be exposed to market purchases during high-priced hours. Portfolios that integrate storage or other dispatchable resources could mitigate this risk, which may be even more pronounced on days with low solar output (right graphic).
Figure 9-22 provides additional examples during the winter season, a time of year when solar output will be lower and potentially more volatile. As a result, during days with low solar output, significant market exposure is possible for portfolios without sufficient dispatchable capacity, particularly during the morning and evening peak load periods.
(30)
(20)
(10)
-
10
20
30
40
C E F G
Re
lativ
e to
Me
dia
n (
mill
ion
s)
(15)
(10)
(5)
-
5
10
15
C E F G
Re
lativ
e t
o M
ed
ian
(m
illio
ns)
Natural gas dominant (CC)
Thermal PPAs plus storage and
solar
Local gas peaker, plus solar and
storage
Solar dominant w/ storage, plus
retire Sugar Creek
C E F G
Natural gas dominant (CC)
Thermal PPAs plus storage and
solar
Local gas peaker, plus solar and
storage
Solar dominant w/ storage, plus
retire Sugar Creek
C E F G
2027 2040CVAR – Avg. of observations above 95th %
95th %
50th %
25th %
5th %
75th %
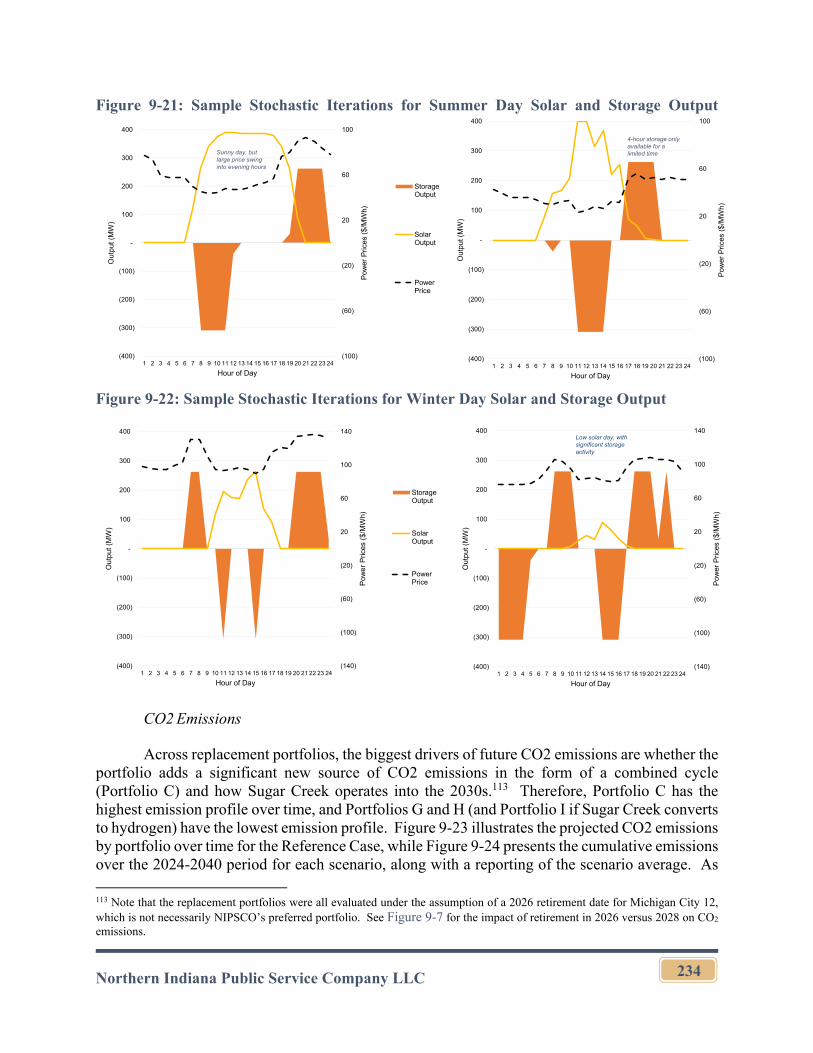
Northern Indiana Public Service Company LLC
234
Figure 9-21: Sample Stochastic Iterations for Summer Day Solar and Storage Output
Figure 9-22: Sample Stochastic Iterations for Winter Day Solar and Storage Output
CO2 Emissions
Across replacement portfolios, the biggest drivers of future CO2 emissions are whether the portfolio adds a significant new source of CO2 emissions in the form of a combined cycle (Portfolio C) and how Sugar Creek operates into the 2030s.113 Therefore, Portfolio C has the highest emission profile over time, and Portfolios G and H (and Portfolio I if Sugar Creek converts to hydrogen) have the lowest emission profile. Figure 9-23 illustrates the projected CO2 emissions by portfolio over time for the Reference Case, while Figure 9-24 presents the cumulative emissions over the 2024-2040 period for each scenario, along with a reporting of the scenario average. As
113 Note that the replacement portfolios were all evaluated under the assumption of a 2026 retirement date for Michigan City 12, which is not necessarily NIPSCO’s preferred portfolio. See Figure 9-7 for the impact of retirement in 2026 versus 2028 on CO2 emissions.
(100)
(60)
(20)
20
60
100
(400)
(300)
(200)
(100)
-
100
200
300
400
1 2 3 4 5 6 7 8 9 10 11 12 13 14 15 16 17 18 19 20 21 22 23 24
Pow
er P
rices
($/
MW
h)
Ou
tput
(M
W)
Hour of Day
4-hour storage only available for a limited time
(100)
(60)
(20)
20
60
100
(400)
(300)
(200)
(100)
-
100
200
300
400
1 2 3 4 5 6 7 8 9 10 11 12 13 14 15 16 17 18 19 20 21 22 23 24P
ower
Pric
es (
$/M
Wh)
Out
put
(M
W)
Hour of Day
StorageOutput
SolarOutput
PowerPrice
Sunny day, but large price swing into evening hours
(140)
(100)
(60)
(20)
20
60
100
140
(400)
(300)
(200)
(100)
-
100
200
300
400
1 2 3 4 5 6 7 8 9 10 11 12 13 14 15 16 17 18 19 20 21 22 23 24
Pow
er P
rices
($/
MW
h)
Out
put (
MW
)
Hour of Day
StorageOutput
SolarOutput
PowerPrice
(140)
(100)
(60)
(20)
20
60
100
140
(400)
(300)
(200)
(100)
-
100
200
300
400
1 2 3 4 5 6 7 8 9 10 11 12 13 14 15 16 17 18 19 20 21 22 23 24
Pow
er P
rices
($/
MW
h)
Out
put (
MW
)
Hour of Day
Low solar day, with significant storage activity
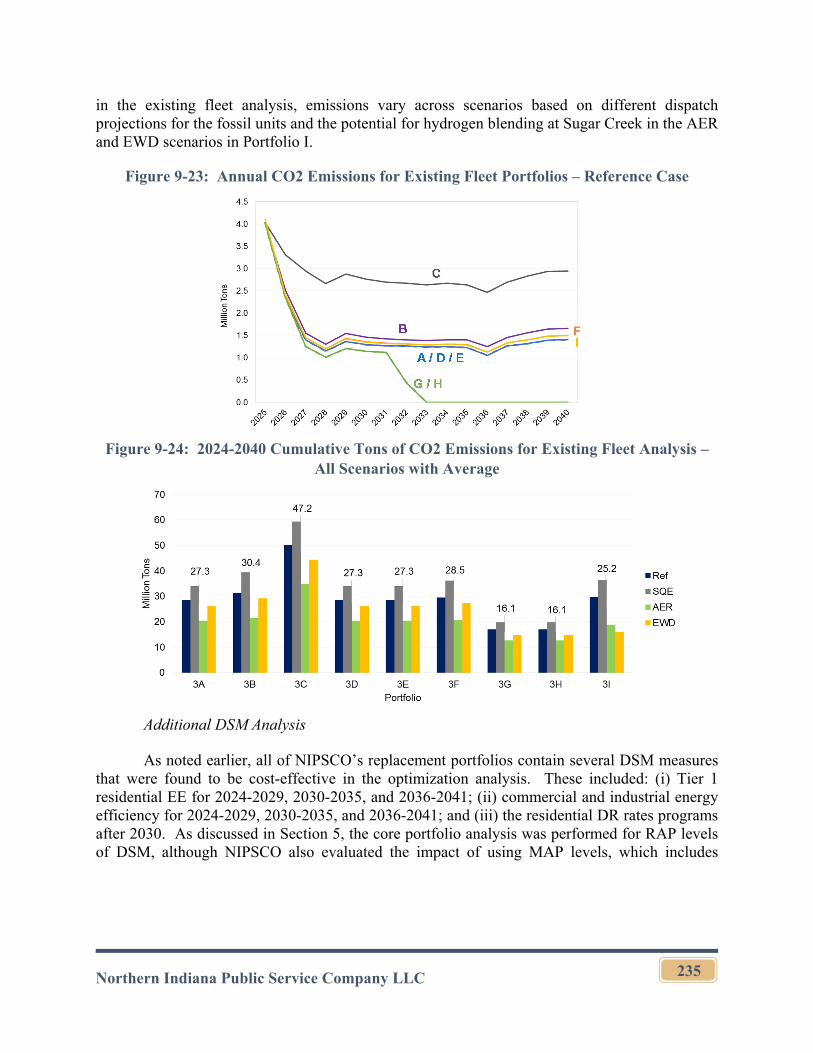
Northern Indiana Public Service Company LLC
235
in the existing fleet analysis, emissions vary across scenarios based on different dispatch projections for the fossil units and the potential for hydrogen blending at Sugar Creek in the AER and EWD scenarios in Portfolio I.
Figure 9-23: Annual CO2 Emissions for Existing Fleet Portfolios – Reference Case
Figure 9-24: 2024-2040 Cumulative Tons of CO2 Emissions for Existing Fleet Analysis – All Scenarios with Average
Additional DSM Analysis
As noted earlier, all of NIPSCO’s replacement portfolios contain several DSM measures that were found to be cost-effective in the optimization analysis. These included: (i) Tier 1 residential EE for 2024-2029, 2030-2035, and 2036-2041; (ii) commercial and industrial energy efficiency for 2024-2029, 2030-2035, and 2036-2041; and (iii) the residential DR rates programs after 2030. As discussed in Section 5, the core portfolio analysis was performed for RAP levels of DSM, although NIPSCO also evaluated the impact of using MAP levels, which includes
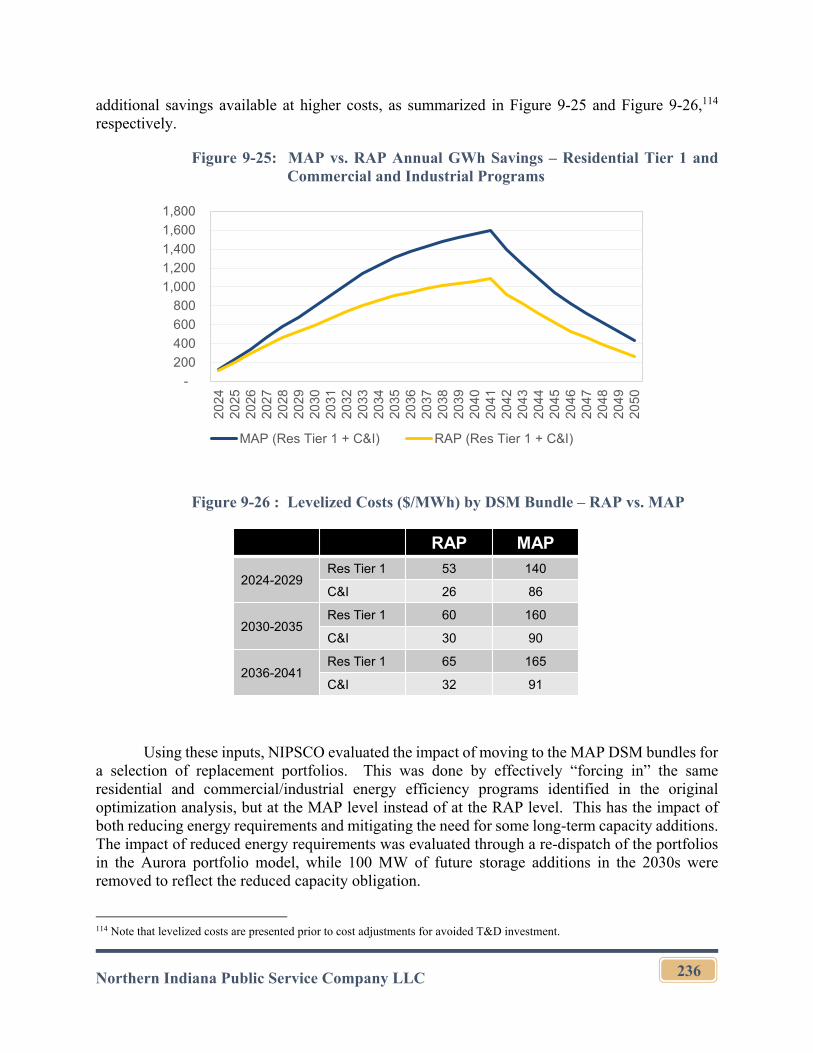
Northern Indiana Public Service Company LLC
236
additional savings available at higher costs, as summarized in Figure 9-25 and Figure 9-26,114 respectively.
Figure 9-25: MAP vs. RAP Annual GWh Savings – Residential Tier 1 and Commercial and Industrial Programs
Figure 9-26 : Levelized Costs ($/MWh) by DSM Bundle – RAP vs. MAP
Using these inputs, NIPSCO evaluated the impact of moving to the MAP DSM bundles for a selection of replacement portfolios. This was done by effectively “forcing in” the same residential and commercial/industrial energy efficiency programs identified in the original optimization analysis, but at the MAP level instead of at the RAP level. This has the impact of both reducing energy requirements and mitigating the need for some long-term capacity additions. The impact of reduced energy requirements was evaluated through a re-dispatch of the portfolios in the Aurora portfolio model, while 100 MW of future storage additions in the 2030s were removed to reflect the reduced capacity obligation.
114 Note that levelized costs are presented prior to cost adjustments for avoided T&D investment.
-
200
400
600
800
1,000
1,200
1,400
1,600
1,80020
2420
2520
2620
2720
2820
2920
3020
3120
3220
3320
3420
3520
3620
3720
3820
3920
4020
4120
4220
4320
4420
4520
4620
4720
4820
4920
50
MAP (Res Tier 1 + C&I) RAP (Res Tier 1 + C&I)
RAP MAP
2024-2029Res Tier 1 53 140
C&I 26 86
2030-2035Res Tier 1 60 160
C&I 30 90
2036-2041Res Tier 1 65 165
C&I 32 91
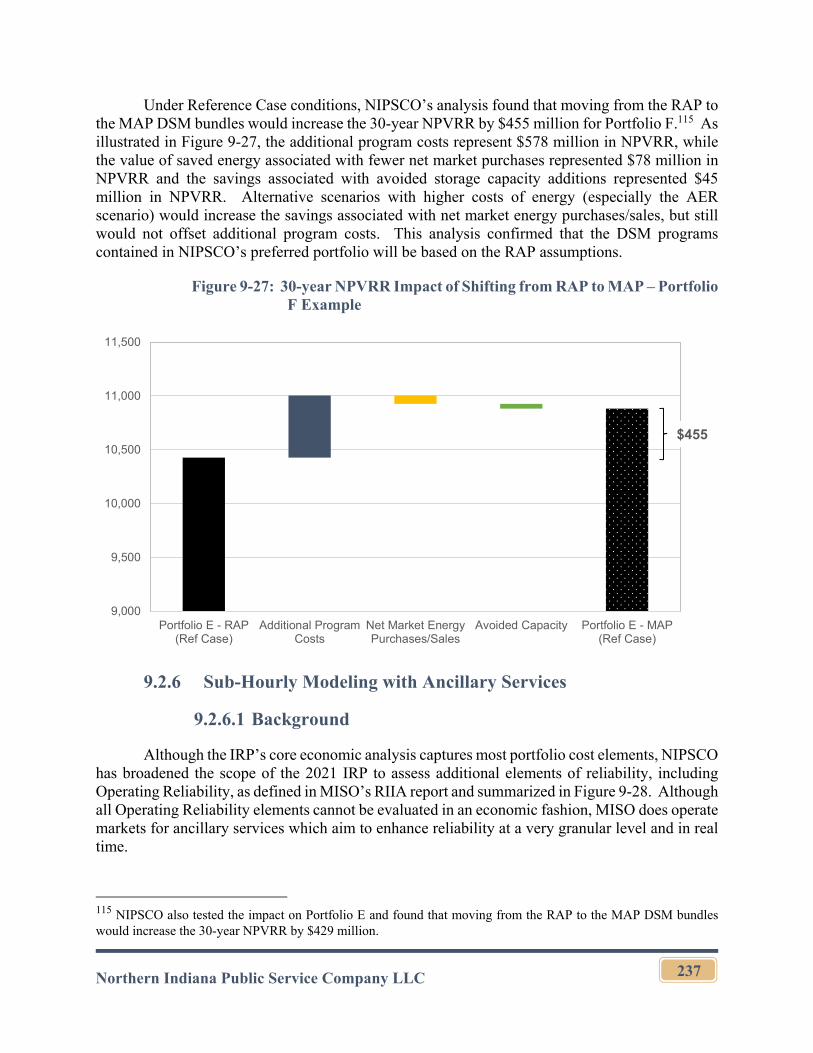
Northern Indiana Public Service Company LLC
237
Under Reference Case conditions, NIPSCO’s analysis found that moving from the RAP to the MAP DSM bundles would increase the 30-year NPVRR by $455 million for Portfolio F.115 As illustrated in Figure 9-27, the additional program costs represent $578 million in NPVRR, while the value of saved energy associated with fewer net market purchases represented $78 million in NPVRR and the savings associated with avoided storage capacity additions represented $45 million in NPVRR. Alternative scenarios with higher costs of energy (especially the AER scenario) would increase the savings associated with net market energy purchases/sales, but still would not offset additional program costs. This analysis confirmed that the DSM programs contained in NIPSCO’s preferred portfolio will be based on the RAP assumptions.
Figure 9-27: 30-year NPVRR Impact of Shifting from RAP to MAP – Portfolio F Example
9.2.6 Sub-Hourly Modeling with Ancillary Services
9.2.6.1 Background
Although the IRP’s core economic analysis captures most portfolio cost elements, NIPSCO has broadened the scope of the 2021 IRP to assess additional elements of reliability, including Operating Reliability, as defined in MISO’s RIIA report and summarized in Figure 9-28. Although all Operating Reliability elements cannot be evaluated in an economic fashion, MISO does operate markets for ancillary services which aim to enhance reliability at a very granular level and in real time.
115 NIPSCO also tested the impact on Portfolio E and found that moving from the RAP to the MAP DSM bundles would increase the 30-year NPVRR by $429 million.
9,000
9,500
10,000
10,500
11,000
11,500
Portfolio E - RAP(Ref Case)
Additional ProgramCosts
Net Market EnergyPurchases/Sales
Avoided Capacity Portfolio E - MAP(Ref Case)
$455
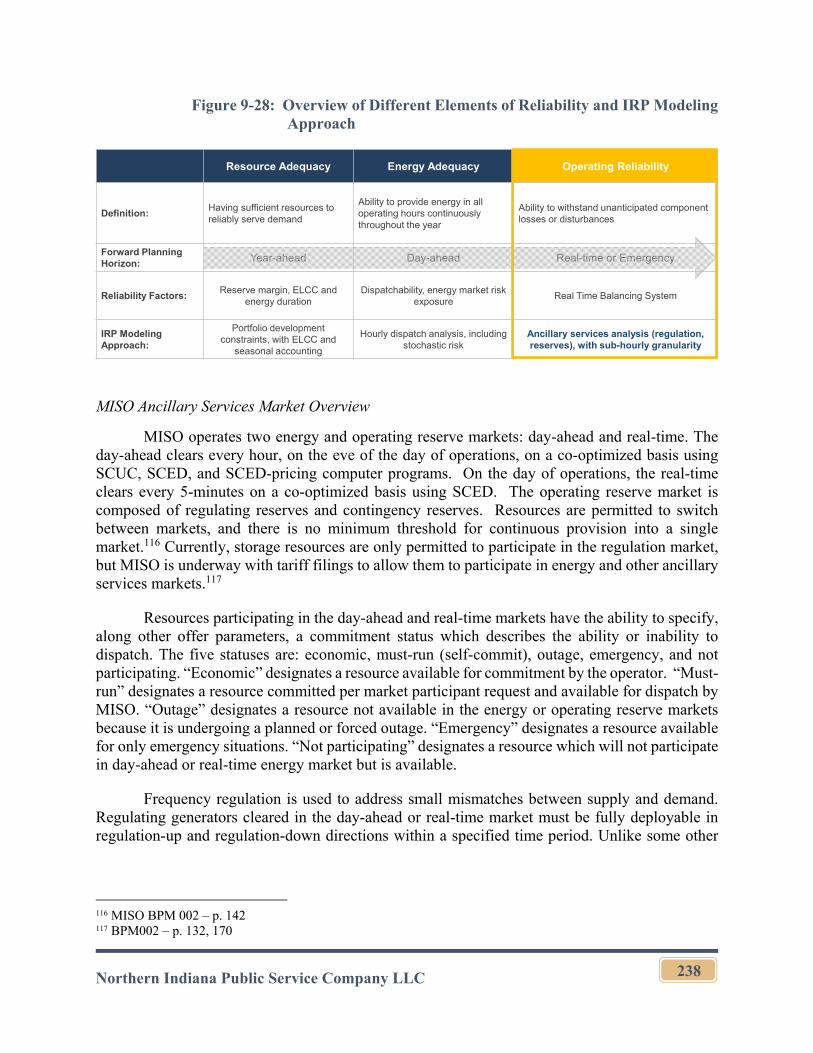
Northern Indiana Public Service Company LLC
238
Figure 9-28: Overview of Different Elements of Reliability and IRP Modeling Approach
MISO Ancillary Services Market Overview
MISO operates two energy and operating reserve markets: day-ahead and real-time. The day-ahead clears every hour, on the eve of the day of operations, on a co-optimized basis using SCUC, SCED, and SCED-pricing computer programs. On the day of operations, the real-time clears every 5-minutes on a co-optimized basis using SCED. The operating reserve market is composed of regulating reserves and contingency reserves. Resources are permitted to switch between markets, and there is no minimum threshold for continuous provision into a single market.116 Currently, storage resources are only permitted to participate in the regulation market, but MISO is underway with tariff filings to allow them to participate in energy and other ancillary services markets.117
Resources participating in the day-ahead and real-time markets have the ability to specify, along other offer parameters, a commitment status which describes the ability or inability to dispatch. The five statuses are: economic, must-run (self-commit), outage, emergency, and not participating. “Economic” designates a resource available for commitment by the operator. “Must-run” designates a resource committed per market participant request and available for dispatch by MISO. “Outage” designates a resource not available in the energy or operating reserve markets because it is undergoing a planned or forced outage. “Emergency” designates a resource available for only emergency situations. “Not participating” designates a resource which will not participate in day-ahead or real-time energy market but is available.
Frequency regulation is used to address small mismatches between supply and demand. Regulating generators cleared in the day-ahead or real-time market must be fully deployable in regulation-up and regulation-down directions within a specified time period. Unlike some other
116 MISO BPM 002 – p. 142 117 BPM002 – p. 132, 170
Resource Adequacy Energy Adequacy Operating Reliability
Definition:Having sufficient resources to reliably serve demand
Ability to provide energy in all operating hours continuously throughout the year
Ability to withstand unanticipated component losses or disturbances
Forward Planning Horizon: Year-ahead Day-ahead Real-time or Emergency
Reliability Factors:Reserve margin, ELCC and
energy durationDispatchability, energy market risk
exposureReal Time Balancing System
IRP Modeling Approach:
Portfolio development constraints, with ELCC and
seasonal accounting
Hourly dispatch analysis, including stochastic risk
Ancillary services analysis (regulation, reserves), with sub-hourly granularity
Northern Indiana Public Service Company LLC
239
RTOs that have separate markets for regulation-up and regulation-down, MISO has a single regulation market.
Contingency reserves are used to address unforeseen events such as a large generator tripping offline. Contingency reserves are composed of spinning and supplemental reserves. Spinning reserves are provided by units that are synchronized to grid, not generating at their maximum output, and able to ramp up their generation. Supplemental reserves are also provided by units that are not synchronized to the grid but are able to come online quickly if needed.
FERC Order 841 Implications for Storage Market Participation
The role of storage in the energy and ancillary services markets is likely to continue to evolve as the electricity markets comprise more intermittent resources. As a result, FERC issued Order No. 841 to boost competition in the storage sector and ensure that markets like MISO provide just and reasonable rates. Order No. 841 requires each RTO and ISO to revise its tariff to establish a participation model for electric storage resources consisting of market rules that, recognizing the physical and operational characteristics of electric storage resources, will help facilitate their participation in the RTO/ISO markets.
MISO is responsible for implementing this order and has been granted an extension for compliance through 2022. Some key elements of MISO’s market design changes are likely to include the following:
A proposal to establish a unique offer structure for ESR in both the Day-Ahead Market and the Real-Time Market and to provide flexibility to ESR owners by establishing a Commitment Status to communicate how the resource will be available to the markets.
Enablement of ESR to provide energy and ancillary services, blackstart service, and reactive supply and voltage control.
Allowance of ESR to qualify as Use Limited Resources to accommodate resources that may need or desire their commitment to be limited to four hours per day in order to reliably provide a service.
Allowance for ESR to both receive and inject electric energy in a way that recognizes physical and operational characteristics and optimizes benefits to MISO and prevents conflicting dispatch instructions through a single offer curve made up of both discharge segments (i.e., price/MW pairs for positive values or injections) and charge segments (i.e., price/MW pairs for negative values or withdrawals). Resources will be paid or pay the LMP at the pricing node for, respectively, injections to discharge and withdrawals to charge. Efficiency losses will not be considered load or station power but will be included in energy schedules.
Ability of ESR to participate and set prices in the Planning Reserve Auction, submit wholesale bids to buy energy though the Day-Ahead and Real-Time Energy Offer
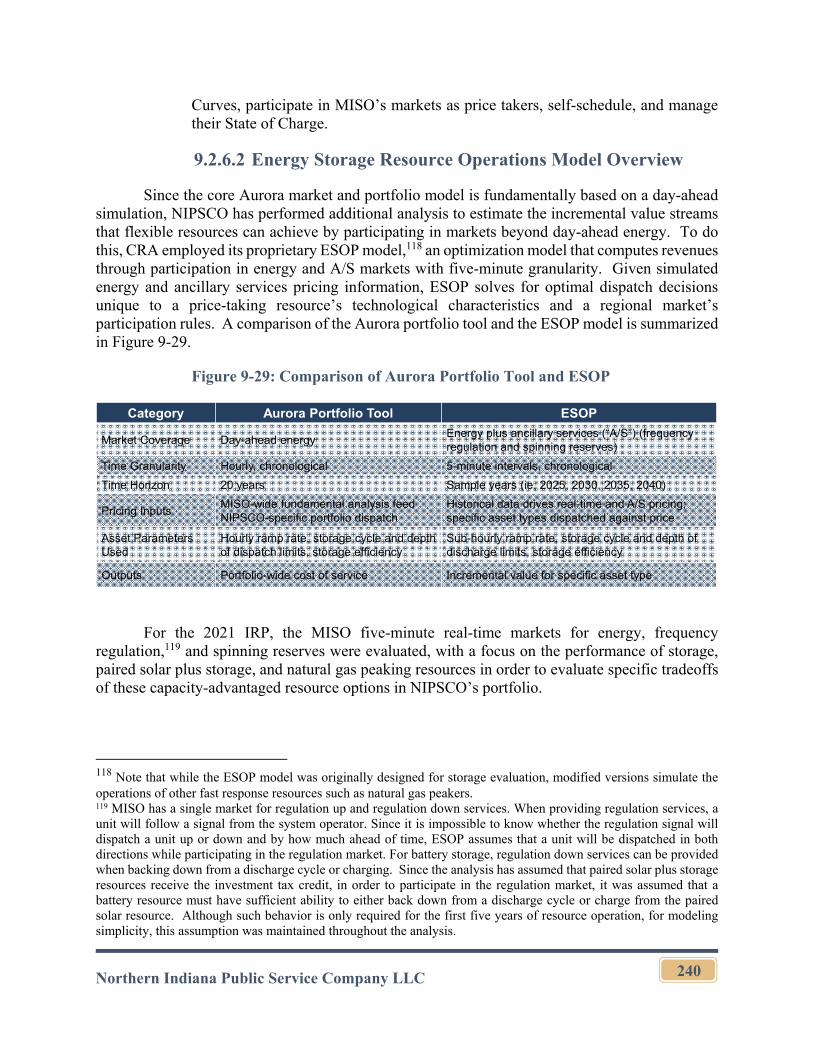
Northern Indiana Public Service Company LLC
240
Curves, participate in MISO’s markets as price takers, self-schedule, and manage their State of Charge.
9.2.6.2 Energy Storage Resource Operations Model Overview
Since the core Aurora market and portfolio model is fundamentally based on a day-ahead simulation, NIPSCO has performed additional analysis to estimate the incremental value streams that flexible resources can achieve by participating in markets beyond day-ahead energy. To do this, CRA employed its proprietary ESOP model,118 an optimization model that computes revenues through participation in energy and A/S markets with five-minute granularity. Given simulated energy and ancillary services pricing information, ESOP solves for optimal dispatch decisions unique to a price-taking resource’s technological characteristics and a regional market’s participation rules. A comparison of the Aurora portfolio tool and the ESOP model is summarized in Figure 9-29.
Figure 9-29: Comparison of Aurora Portfolio Tool and ESOP
For the 2021 IRP, the MISO five-minute real-time markets for energy, frequency regulation,119 and spinning reserves were evaluated, with a focus on the performance of storage, paired solar plus storage, and natural gas peaking resources in order to evaluate specific tradeoffs of these capacity-advantaged resource options in NIPSCO’s portfolio.
118 Note that while the ESOP model was originally designed for storage evaluation, modified versions simulate the operations of other fast response resources such as natural gas peakers. 119 MISO has a single market for regulation up and regulation down services. When providing regulation services, a unit will follow a signal from the system operator. Since it is impossible to know whether the regulation signal will dispatch a unit up or down and by how much ahead of time, ESOP assumes that a unit will be dispatched in both directions while participating in the regulation market. For battery storage, regulation down services can be provided when backing down from a discharge cycle or charging. Since the analysis has assumed that paired solar plus storage resources receive the investment tax credit, in order to participate in the regulation market, it was assumed that a battery resource must have sufficient ability to either back down from a discharge cycle or charge from the paired solar resource. Although such behavior is only required for the first five years of resource operation, for modeling simplicity, this assumption was maintained throughout the analysis.
Category Aurora Portfolio Tool ESOP
Market Coverage Day-ahead energyEnergy plus ancillary services (“A/S”) (frequency regulation and spinning reserves)
Time Granularity Hourly, chronological 5-minute intervals, chronological
Time Horizon 20 years Sample years (ie, 2025, 2030, 2035, 2040)
Pricing InputsMISO-wide fundamental analysis feed NIPSCO-specific portfolio dispatch
Historical data drives real-time and A/S pricing; specific asset types dispatched against price
Asset Parameters Used
Hourly ramp rate, storage cycle and depth of dispatch limits, storage efficiency
Sub-hourly ramp rate, storage cycle and depth of discharge limits, storage efficiency
Outputs Portfolio-wide cost of service Incremental value for specific asset type
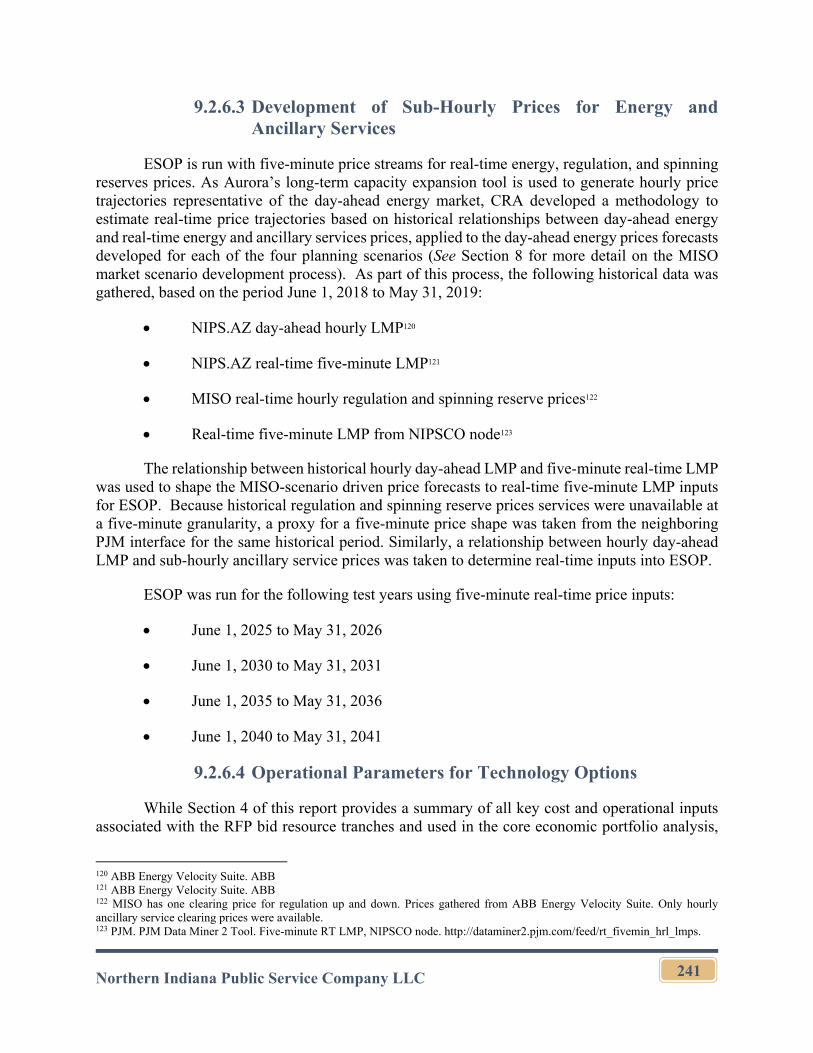
Northern Indiana Public Service Company LLC
241
9.2.6.3 Development of Sub-Hourly Prices for Energy and Ancillary Services
ESOP is run with five-minute price streams for real-time energy, regulation, and spinning reserves prices. As Aurora’s long-term capacity expansion tool is used to generate hourly price trajectories representative of the day-ahead energy market, CRA developed a methodology to estimate real-time price trajectories based on historical relationships between day-ahead energy and real-time energy and ancillary services prices, applied to the day-ahead energy prices forecasts developed for each of the four planning scenarios (See Section 8 for more detail on the MISO market scenario development process). As part of this process, the following historical data was gathered, based on the period June 1, 2018 to May 31, 2019:
NIPS.AZ day-ahead hourly LMP120
NIPS.AZ real-time five-minute LMP121
MISO real-time hourly regulation and spinning reserve prices122
Real-time five-minute LMP from NIPSCO node123
The relationship between historical hourly day-ahead LMP and five-minute real-time LMP was used to shape the MISO-scenario driven price forecasts to real-time five-minute LMP inputs for ESOP. Because historical regulation and spinning reserve prices services were unavailable at a five-minute granularity, a proxy for a five-minute price shape was taken from the neighboring PJM interface for the same historical period. Similarly, a relationship between hourly day-ahead LMP and sub-hourly ancillary service prices was taken to determine real-time inputs into ESOP.
ESOP was run for the following test years using five-minute real-time price inputs:
June 1, 2025 to May 31, 2026
June 1, 2030 to May 31, 2031
June 1, 2035 to May 31, 2036
June 1, 2040 to May 31, 2041
9.2.6.4 Operational Parameters for Technology Options
While Section 4 of this report provides a summary of all key cost and operational inputs associated with the RFP bid resource tranches and used in the core economic portfolio analysis,
120 ABB Energy Velocity Suite. ABB 121 ABB Energy Velocity Suite. ABB 122 MISO has one clearing price for regulation up and down. Prices gathered from ABB Energy Velocity Suite. Only hourly ancillary service clearing prices were available. 123 PJM. PJM Data Miner 2 Tool. Five-minute RT LMP, NIPSCO node. http://dataminer2.pjm.com/feed/rt_fivemin_hrl_lmps.
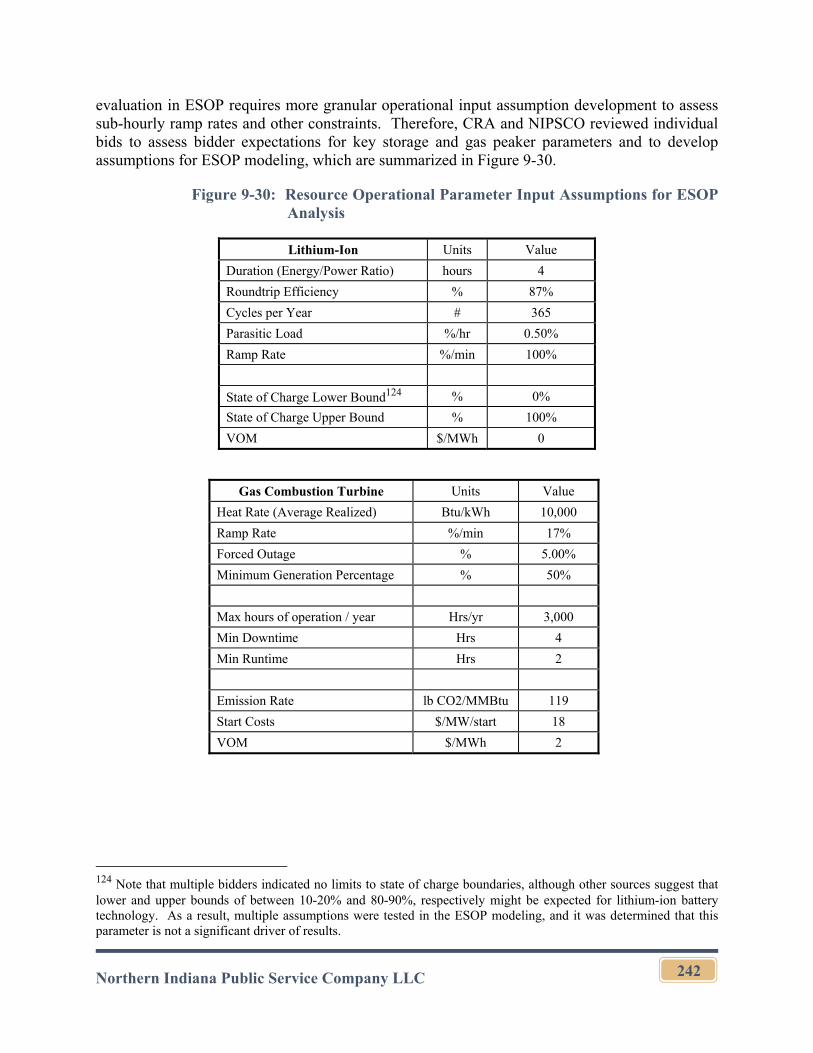
Northern Indiana Public Service Company LLC
242
evaluation in ESOP requires more granular operational input assumption development to assess sub-hourly ramp rates and other constraints. Therefore, CRA and NIPSCO reviewed individual bids to assess bidder expectations for key storage and gas peaker parameters and to develop assumptions for ESOP modeling, which are summarized in Figure 9-30.
Figure 9-30: Resource Operational Parameter Input Assumptions for ESOP Analysis
Lithium-Ion Units Value
Duration (Energy/Power Ratio) hours 4
Roundtrip Efficiency % 87%
Cycles per Year # 365
Parasitic Load %/hr 0.50%
Ramp Rate %/min 100%
State of Charge Lower Bound124 % 0%
State of Charge Upper Bound % 100%
VOM $/MWh 0
Gas Combustion Turbine Units Value
Heat Rate (Average Realized) Btu/kWh 10,000
Ramp Rate %/min 17%
Forced Outage % 5.00%
Minimum Generation Percentage % 50%
Max hours of operation / year Hrs/yr 3,000
Min Downtime Hrs 4
Min Runtime Hrs 2
Emission Rate lb CO2/MMBtu 119
Start Costs $/MW/start 18
VOM $/MWh 2
124 Note that multiple bidders indicated no limits to state of charge boundaries, although other sources suggest that lower and upper bounds of between 10-20% and 80-90%, respectively might be expected for lithium-ion battery technology. As a result, multiple assumptions were tested in the ESOP modeling, and it was determined that this parameter is not a significant driver of results.
Northern Indiana Public Service Company LLC
243
9.2.6.5 Key Findings from ESOP Analysis
Based on the resource types that comprise NIPSCO’s portfolio options (see discussion of portfolio composition and definition in the earlier sub-sections of this Section) and the types of resources likely to have opportunities for additional value in the sub-hourly energy and ancillary services markets beyond what is accounted for in the core portfolio analysis, CRA evaluated three distinct technology options in ESOP:
Lithium-ion four-hour duration battery storage;
Paired solar plus storage (lithium-ion four-hour duration) at a 2:1 ratio;125 and
Natural gas-fired combustion turbine peaker
As noted above, the three resource types were assessed over four sample future years in order to estimate the incremental value that might be available in the sub-hourly energy and ancillary services markets above what is captured in the Aurora model’s day ahead hourly assessment. The analysis found that the most significant upside is for battery technology, particularly in the regulation market, as illustrated in the Reference Case margin projections summarized in Figure 9-31. Key findings by technology included:
Lithium-Ion battery: As the most highly flexible resource option, the battery can respond rapidly in real time to changing price signals at five-minute granularity. Most notably, the resource can participate regularly in the regulation market, providing up and down service given its unique ability to charge or discharge. An illustration of simulated charging and discharging behavior along with energy and regulation price behavior is shown for a sample summer day in Figure 9-32. This shows how the battery can adjust its state of charge very rapidly to respond to 5-minute price signals, while also participating in the regulation market.
Paired solar plus storage: As in the hourly Aurora modeling, the solar component provides significant energy value, while the upside from the ESOP analysis is primarily limited to participation in the regulation market. It is important to note that current ITC rules limit the battery’s flexibility and ability to take advantage of the regulation market, given that the battery resource must charge predominantly from the solar component.
Natural gas-fired combustion turbine: The gas peaking resource is able to monetize real-time sub-hourly volatility, providing value upside compared to the Aurora day ahead hourly modeling. However, regulation opportunities are only available when the unit is already operating for energy, limiting the upside when compared to the battery storage projections. Spinning reserve revenues are also likely to be available, but these are less valuable than regulation.
125 Note that the most attractive RFP tranches, including those selected in the portfolio development phase, were at ratios of approximately 2:1 (solar:storage), so this configuration was analyzed in the ESOP analysis.
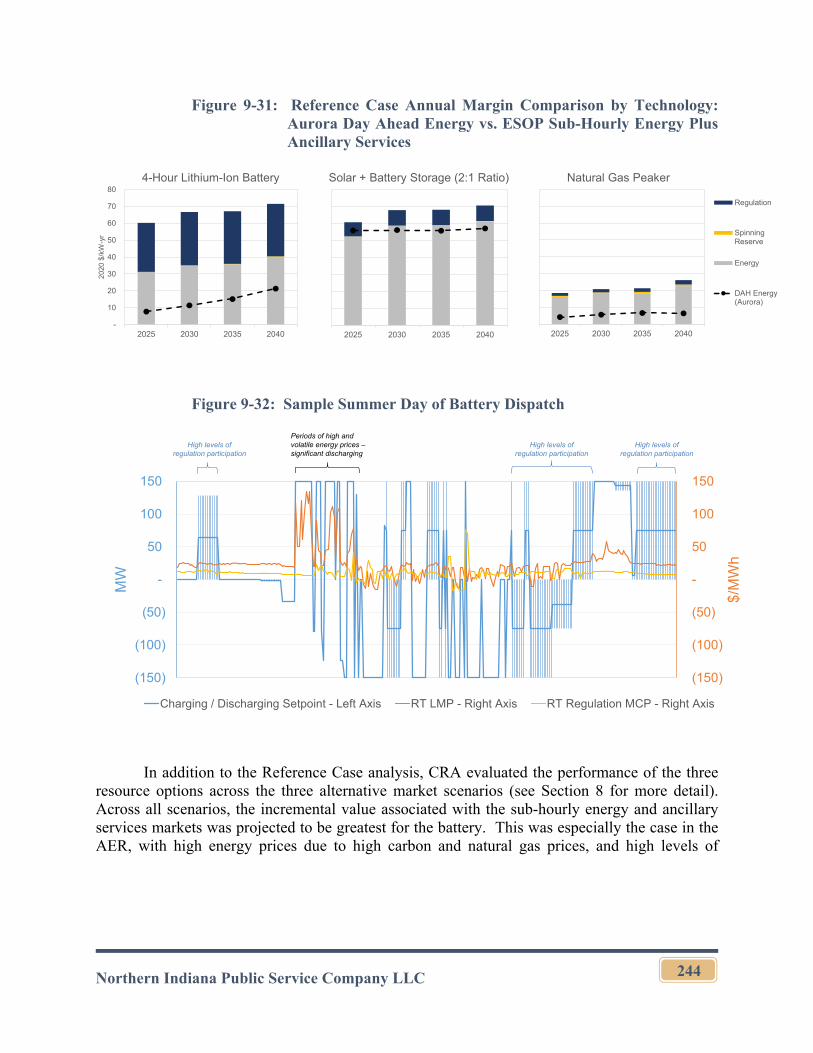
Northern Indiana Public Service Company LLC
244
Figure 9-31: Reference Case Annual Margin Comparison by Technology: Aurora Day Ahead Energy vs. ESOP Sub-Hourly Energy Plus Ancillary Services
Figure 9-32: Sample Summer Day of Battery Dispatch
In addition to the Reference Case analysis, CRA evaluated the performance of the three resource options across the three alternative market scenarios (see Section 8 for more detail). Across all scenarios, the incremental value associated with the sub-hourly energy and ancillary services markets was projected to be greatest for the battery. This was especially the case in the AER, with high energy prices due to high carbon and natural gas prices, and high levels of
2025 2030 2035 2040 -
10
20
30
40
50
60
70
80
2025 2030 2035 2040
20
20 $
/kW
-yr
2025 2030 2035 2040
Regulation
SpinningReserve
Energy
DAH Energy(Aurora)
4-Hour Lithium-Ion Battery Solar + Battery Storage (2:1 Ratio) Natural Gas Peaker
Periods of high and volatile energy prices –significant discharging
(150)
(100)
(50)
-
50
100
150
(150)
(100)
(50)
-
50
100
150
$/M
Wh
MW
Charging / Discharging Setpoint - Left Axis RT LMP - Right Axis RT Regulation MCP - Right Axis
High levels of regulation participation
High levels of regulation participation
High levels of regulation participation
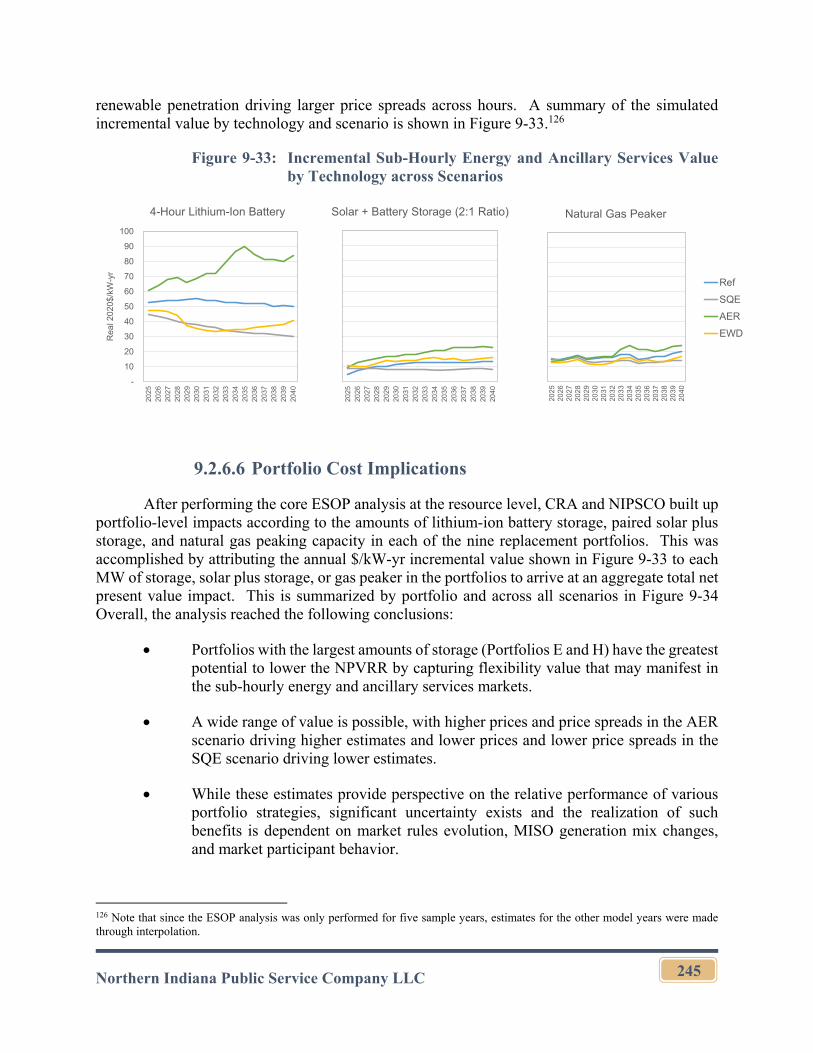
Northern Indiana Public Service Company LLC
245
renewable penetration driving larger price spreads across hours. A summary of the simulated incremental value by technology and scenario is shown in Figure 9-33.126
Figure 9-33: Incremental Sub-Hourly Energy and Ancillary Services Value by Technology across Scenarios
9.2.6.6 Portfolio Cost Implications
After performing the core ESOP analysis at the resource level, CRA and NIPSCO built up portfolio-level impacts according to the amounts of lithium-ion battery storage, paired solar plus storage, and natural gas peaking capacity in each of the nine replacement portfolios. This was accomplished by attributing the annual $/kW-yr incremental value shown in Figure 9-33 to each MW of storage, solar plus storage, or gas peaker in the portfolios to arrive at an aggregate total net present value impact. This is summarized by portfolio and across all scenarios in Figure 9-34 Overall, the analysis reached the following conclusions:
Portfolios with the largest amounts of storage (Portfolios E and H) have the greatest potential to lower the NPVRR by capturing flexibility value that may manifest in the sub-hourly energy and ancillary services markets.
A wide range of value is possible, with higher prices and price spreads in the AER scenario driving higher estimates and lower prices and lower price spreads in the SQE scenario driving lower estimates.
While these estimates provide perspective on the relative performance of various portfolio strategies, significant uncertainty exists and the realization of such benefits is dependent on market rules evolution, MISO generation mix changes, and market participant behavior.
126 Note that since the ESOP analysis was only performed for five sample years, estimates for the other model years were made through interpolation.
-
10
20
30
40
50
60
70
80
90
100
2025
2026
2027
2028
2029
2030
2031
2032
2033
2034
2035
2036
2037
2038
2039
2040
Rea
l 20
20$
/kW
-yr
4-Hour Lithium-Ion Battery Solar + Battery Storage (2:1 Ratio) Natural Gas Peaker
2025
2026
2027
2028
2029
2030
2031
2032
2033
2034
2035
2036
2037
2038
2039
2040
2025
2026
2027
2028
2029
2030
2031
2032
2033
2034
2035
2036
2037
2038
2039
2040
Ref
SQE
AER
EWD
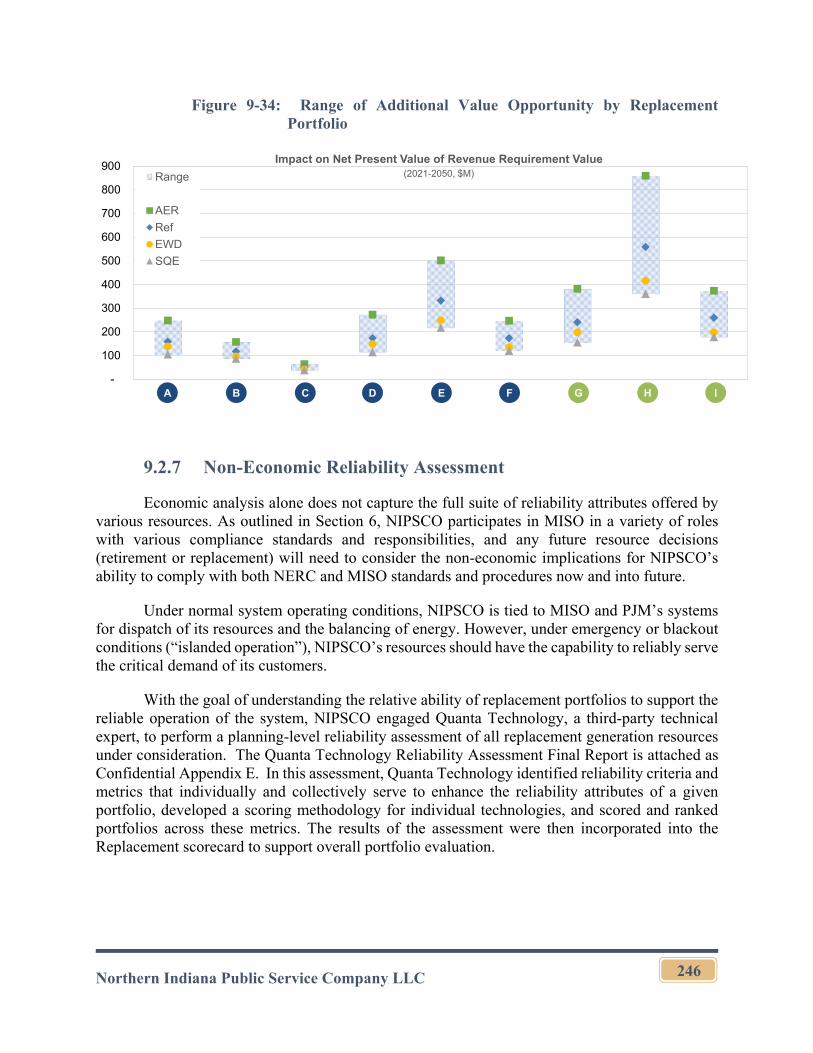
Northern Indiana Public Service Company LLC
246
Figure 9-34: Range of Additional Value Opportunity by Replacement Portfolio
9.2.7 Non-Economic Reliability Assessment
Economic analysis alone does not capture the full suite of reliability attributes offered by various resources. As outlined in Section 6, NIPSCO participates in MISO in a variety of roles with various compliance standards and responsibilities, and any future resource decisions (retirement or replacement) will need to consider the non-economic implications for NIPSCO’s ability to comply with both NERC and MISO standards and procedures now and into future.
Under normal system operating conditions, NIPSCO is tied to MISO and PJM’s systems for dispatch of its resources and the balancing of energy. However, under emergency or blackout conditions (“islanded operation”), NIPSCO’s resources should have the capability to reliably serve the critical demand of its customers.
With the goal of understanding the relative ability of replacement portfolios to support the reliable operation of the system, NIPSCO engaged Quanta Technology, a third-party technical expert, to perform a planning-level reliability assessment of all replacement generation resources under consideration. The Quanta Technology Reliability Assessment Final Report is attached as Confidential Appendix E. In this assessment, Quanta Technology identified reliability criteria and metrics that individually and collectively serve to enhance the reliability attributes of a given portfolio, developed a scoring methodology for individual technologies, and scored and ranked portfolios across these metrics. The results of the assessment were then incorporated into the Replacement scorecard to support overall portfolio evaluation.
-
100
200
300
400
500
600
700
800
900Range
AER
Ref
EWD
SQE
A B C D E F G H I
Impact on Net Present Value of Revenue Requirement Value(2021-2050, $M)
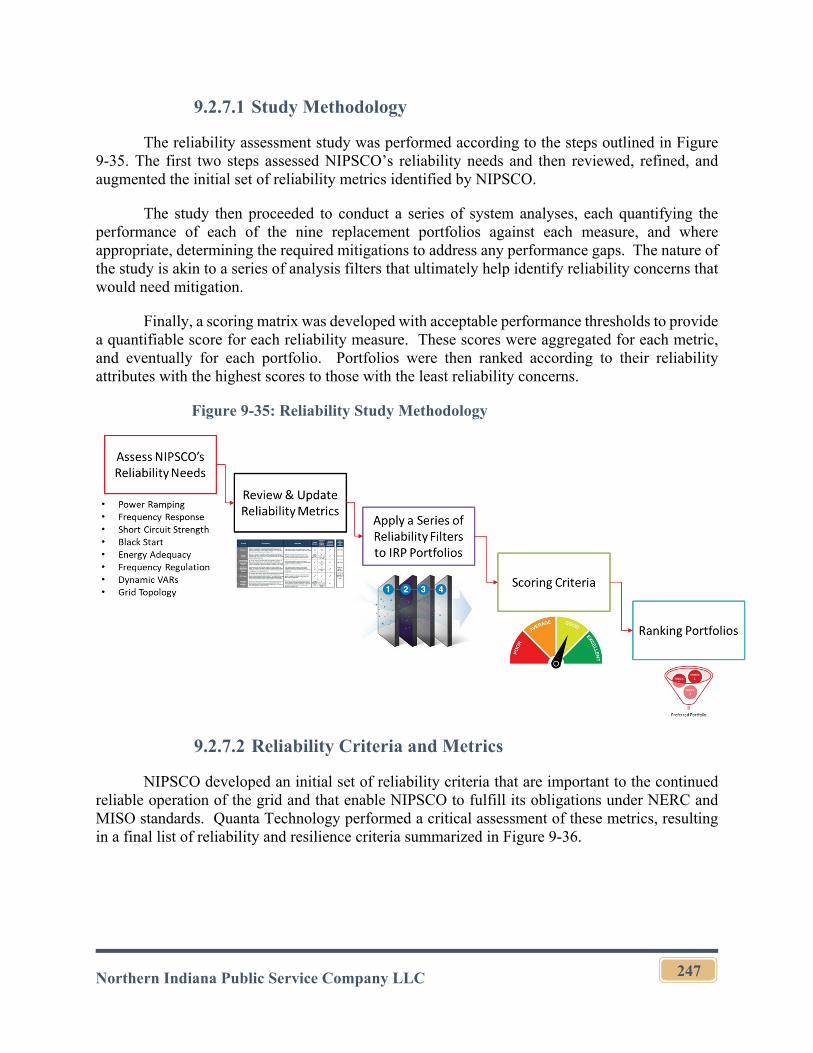
Northern Indiana Public Service Company LLC
247
9.2.7.1 Study Methodology
The reliability assessment study was performed according to the steps outlined in Figure 9-35. The first two steps assessed NIPSCO’s reliability needs and then reviewed, refined, and augmented the initial set of reliability metrics identified by NIPSCO.
The study then proceeded to conduct a series of system analyses, each quantifying the performance of each of the nine replacement portfolios against each measure, and where appropriate, determining the required mitigations to address any performance gaps. The nature of the study is akin to a series of analysis filters that ultimately help identify reliability concerns that would need mitigation.
Finally, a scoring matrix was developed with acceptable performance thresholds to provide a quantifiable score for each reliability measure. These scores were aggregated for each metric, and eventually for each portfolio. Portfolios were then ranked according to their reliability attributes with the highest scores to those with the least reliability concerns.
Figure 9-35: Reliability Study Methodology
9.2.7.2 Reliability Criteria and Metrics
NIPSCO developed an initial set of reliability criteria that are important to the continued reliable operation of the grid and that enable NIPSCO to fulfill its obligations under NERC and MISO standards. Quanta Technology performed a critical assessment of these metrics, resulting in a final list of reliability and resilience criteria summarized in Figure 9-36.

Northern Indiana Public Service Company LLC
248
Figure 9-36: Reliability Criteria
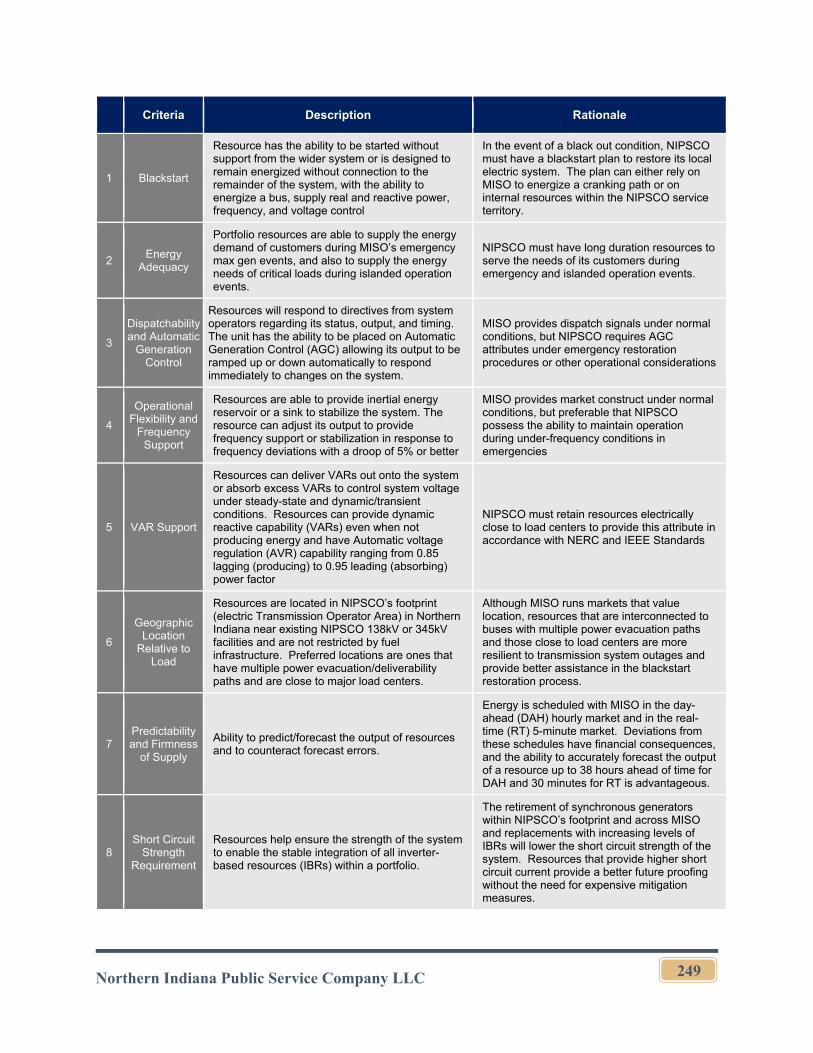
Northern Indiana Public Service Company LLC
249
Criteria Description Rationale
1 Blackstart
Resource has the ability to be started without support from the wider system or is designed to remain energized without connection to the remainder of the system, with the ability to energize a bus, supply real and reactive power, frequency, and voltage control
In the event of a black out condition, NIPSCO must have a blackstart plan to restore its local electric system. The plan can either rely on MISO to energize a cranking path or on internal resources within the NIPSCO service territory.
2 Energy
Adequacy
Portfolio resources are able to supply the energy demand of customers during MISO’s emergency max gen events, and also to supply the energy needs of critical loads during islanded operation events.
NIPSCO must have long duration resources to serve the needs of its customers during emergency and islanded operation events.
3
Dispatchability and Automatic
Generation Control
Resources will respond to directives from system operators regarding its status, output, and timing. The unit has the ability to be placed on Automatic Generation Control (AGC) allowing its output to be ramped up or down automatically to respond immediately to changes on the system.
MISO provides dispatch signals under normal conditions, but NIPSCO requires AGC attributes under emergency restoration procedures or other operational considerations
4
Operational Flexibility and
Frequency Support
Resources are able to provide inertial energy reservoir or a sink to stabilize the system. The resource can adjust its output to provide frequency support or stabilization in response to frequency deviations with a droop of 5% or better
MISO provides market construct under normal conditions, but preferable that NIPSCO possess the ability to maintain operation during under-frequency conditions in emergencies
5 VAR Support
Resources can deliver VARs out onto the system or absorb excess VARs to control system voltage under steady-state and dynamic/transient conditions. Resources can provide dynamic reactive capability (VARs) even when not producing energy and have Automatic voltage regulation (AVR) capability ranging from 0.85 lagging (producing) to 0.95 leading (absorbing) power factor
NIPSCO must retain resources electrically close to load centers to provide this attribute in accordance with NERC and IEEE Standards
6
Geographic Location
Relative to Load
Resources are located in NIPSCO’s footprint (electric Transmission Operator Area) in Northern Indiana near existing NIPSCO 138kV or 345kV facilities and are not restricted by fuel infrastructure. Preferred locations are ones that have multiple power evacuation/deliverability paths and are close to major load centers.
Although MISO runs markets that value location, resources that are interconnected to buses with multiple power evacuation paths and those close to load centers are more resilient to transmission system outages and provide better assistance in the blackstart restoration process.
7 Predictability and Firmness
of Supply
Ability to predict/forecast the output of resources and to counteract forecast errors.
Energy is scheduled with MISO in the day-ahead (DAH) hourly market and in the real-time (RT) 5-minute market. Deviations from these schedules have financial consequences, and the ability to accurately forecast the output of a resource up to 38 hours ahead of time for DAH and 30 minutes for RT is advantageous.
8 Short Circuit
Strength Requirement
Resources help ensure the strength of the system to enable the stable integration of all inverter-based resources (IBRs) within a portfolio.
The retirement of synchronous generators within NIPSCO’s footprint and across MISO and replacements with increasing levels of IBRs will lower the short circuit strength of the system. Resources that provide higher short circuit current provide a better future proofing without the need for expensive mitigation measures.
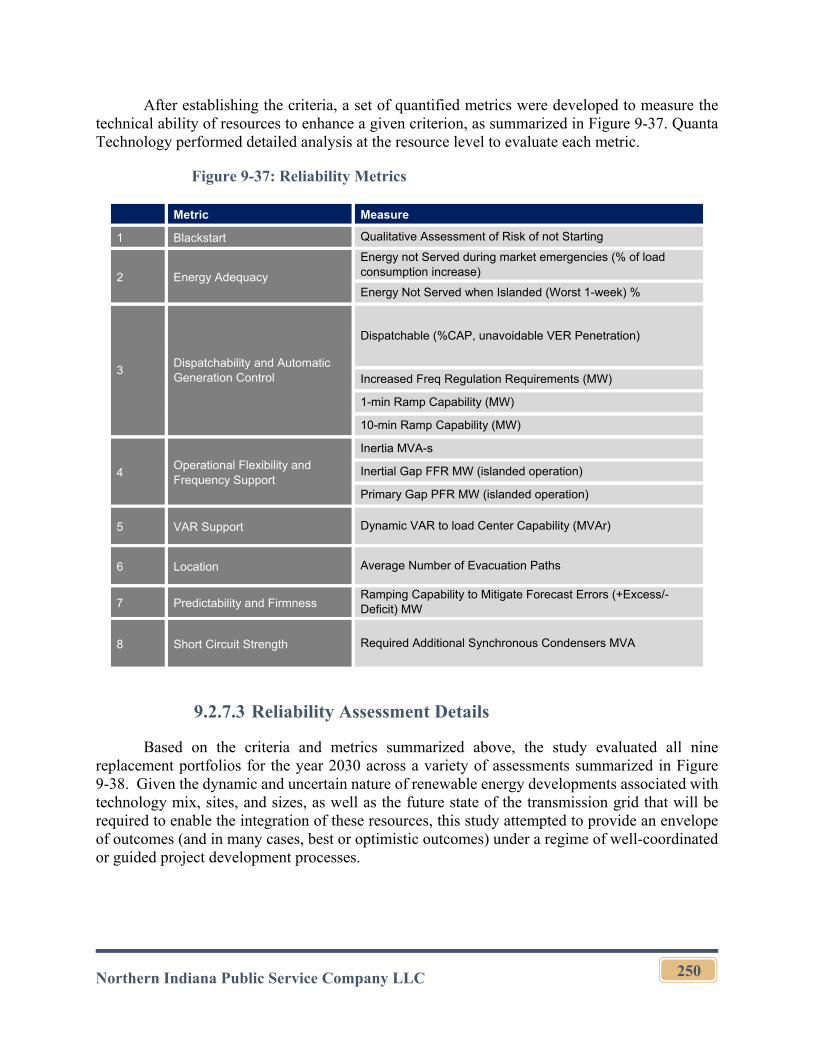
Northern Indiana Public Service Company LLC
250
After establishing the criteria, a set of quantified metrics were developed to measure the technical ability of resources to enhance a given criterion, as summarized in Figure 9-37. Quanta Technology performed detailed analysis at the resource level to evaluate each metric.
Figure 9-37: Reliability Metrics
Metric Measure
1 Blackstart Qualitative Assessment of Risk of not Starting
2 Energy Adequacy
Energy not Served during market emergencies (% of load consumption increase)
Energy Not Served when Islanded (Worst 1-week) %
3 Dispatchability and Automatic Generation Control
Dispatchable (%CAP, unavoidable VER Penetration)
Increased Freq Regulation Requirements (MW)
1-min Ramp Capability (MW)
10-min Ramp Capability (MW)
4 Operational Flexibility and Frequency Support
Inertia MVA-s
Inertial Gap FFR MW (islanded operation)
Primary Gap PFR MW (islanded operation)
5 VAR Support Dynamic VAR to load Center Capability (MVAr)
6 Location Average Number of Evacuation Paths
7 Predictability and Firmness Ramping Capability to Mitigate Forecast Errors (+Excess/-Deficit) MW
8 Short Circuit Strength Required Additional Synchronous Condensers MVA
9.2.7.3 Reliability Assessment Details
Based on the criteria and metrics summarized above, the study evaluated all nine replacement portfolios for the year 2030 across a variety of assessments summarized in Figure 9-38. Given the dynamic and uncertain nature of renewable energy developments associated with technology mix, sites, and sizes, as well as the future state of the transmission grid that will be required to enable the integration of these resources, this study attempted to provide an envelope of outcomes (and in many cases, best or optimistic outcomes) under a regime of well-coordinated or guided project development processes.
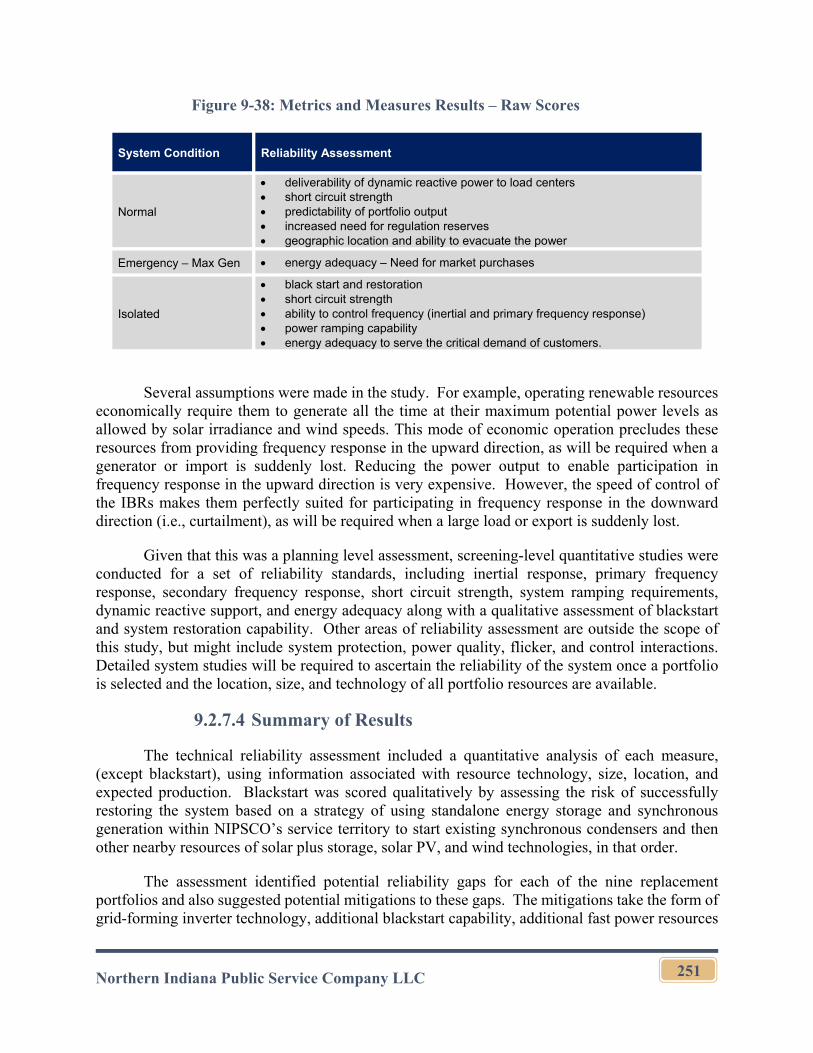
Northern Indiana Public Service Company LLC
251
Figure 9-38: Metrics and Measures Results – Raw Scores
System Condition Reliability Assessment
Normal
deliverability of dynamic reactive power to load centers short circuit strength predictability of portfolio output increased need for regulation reserves geographic location and ability to evacuate the power
Emergency – Max Gen energy adequacy – Need for market purchases
Isolated
black start and restoration short circuit strength ability to control frequency (inertial and primary frequency response) power ramping capability energy adequacy to serve the critical demand of customers.
Several assumptions were made in the study. For example, operating renewable resources economically require them to generate all the time at their maximum potential power levels as allowed by solar irradiance and wind speeds. This mode of economic operation precludes these resources from providing frequency response in the upward direction, as will be required when a generator or import is suddenly lost. Reducing the power output to enable participation in frequency response in the upward direction is very expensive. However, the speed of control of the IBRs makes them perfectly suited for participating in frequency response in the downward direction (i.e., curtailment), as will be required when a large load or export is suddenly lost.
Given that this was a planning level assessment, screening-level quantitative studies were conducted for a set of reliability standards, including inertial response, primary frequency response, secondary frequency response, short circuit strength, system ramping requirements, dynamic reactive support, and energy adequacy along with a qualitative assessment of blackstart and system restoration capability. Other areas of reliability assessment are outside the scope of this study, but might include system protection, power quality, flicker, and control interactions. Detailed system studies will be required to ascertain the reliability of the system once a portfolio is selected and the location, size, and technology of all portfolio resources are available.
9.2.7.4 Summary of Results
The technical reliability assessment included a quantitative analysis of each measure, (except blackstart), using information associated with resource technology, size, location, and expected production. Blackstart was scored qualitatively by assessing the risk of successfully restoring the system based on a strategy of using standalone energy storage and synchronous generation within NIPSCO’s service territory to start existing synchronous condensers and then other nearby resources of solar plus storage, solar PV, and wind technologies, in that order.
The assessment identified potential reliability gaps for each of the nine replacement portfolios and also suggested potential mitigations to these gaps. The mitigations take the form of grid-forming inverter technology, additional blackstart capability, additional fast power resources
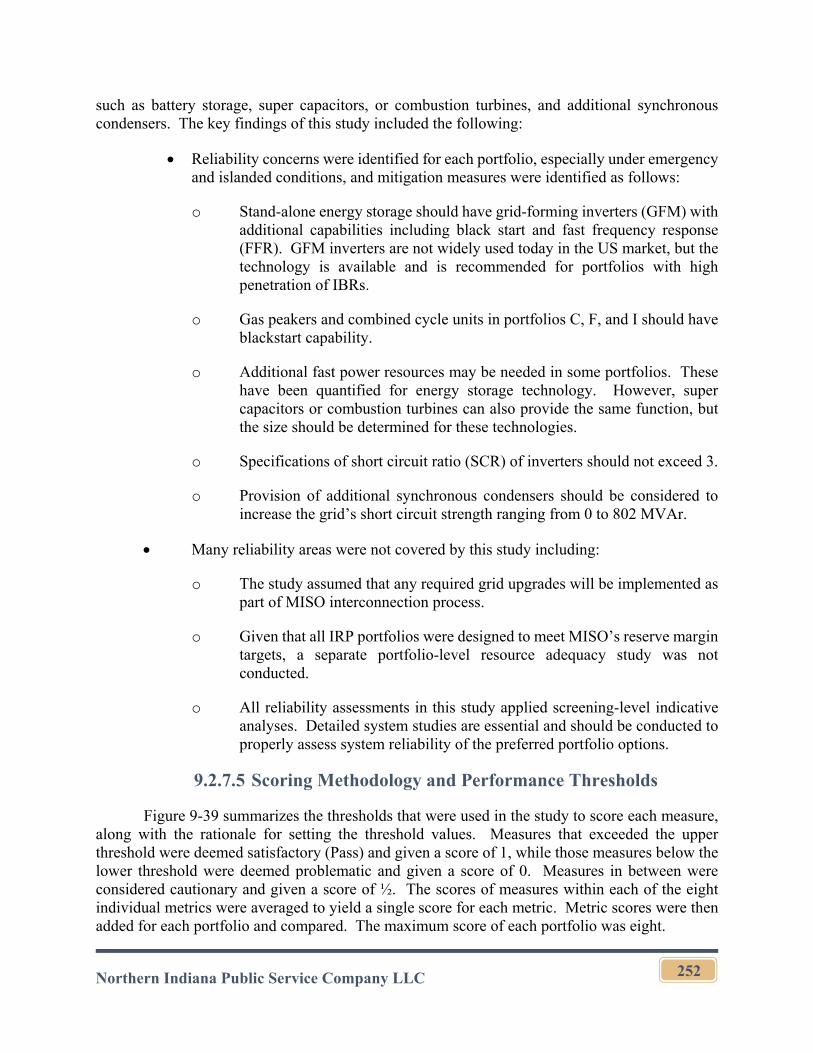
Northern Indiana Public Service Company LLC
252
such as battery storage, super capacitors, or combustion turbines, and additional synchronous condensers. The key findings of this study included the following:
Reliability concerns were identified for each portfolio, especially under emergency and islanded conditions, and mitigation measures were identified as follows:
o Stand-alone energy storage should have grid-forming inverters (GFM) with additional capabilities including black start and fast frequency response (FFR). GFM inverters are not widely used today in the US market, but the technology is available and is recommended for portfolios with high penetration of IBRs.
o Gas peakers and combined cycle units in portfolios C, F, and I should have blackstart capability.
o Additional fast power resources may be needed in some portfolios. These have been quantified for energy storage technology. However, super capacitors or combustion turbines can also provide the same function, but the size should be determined for these technologies.
o Specifications of short circuit ratio (SCR) of inverters should not exceed 3.
o Provision of additional synchronous condensers should be considered to increase the grid’s short circuit strength ranging from 0 to 802 MVAr.
Many reliability areas were not covered by this study including:
o The study assumed that any required grid upgrades will be implemented as part of MISO interconnection process.
o Given that all IRP portfolios were designed to meet MISO’s reserve margin targets, a separate portfolio-level resource adequacy study was not conducted.
o All reliability assessments in this study applied screening-level indicative analyses. Detailed system studies are essential and should be conducted to properly assess system reliability of the preferred portfolio options.
9.2.7.5 Scoring Methodology and Performance Thresholds
Figure 9-39 summarizes the thresholds that were used in the study to score each measure, along with the rationale for setting the threshold values. Measures that exceeded the upper threshold were deemed satisfactory (Pass) and given a score of 1, while those measures below the lower threshold were deemed problematic and given a score of 0. Measures in between were considered cautionary and given a score of ½. The scores of measures within each of the eight individual metrics were averaged to yield a single score for each metric. Metric scores were then added for each portfolio and compared. The maximum score of each portfolio was eight.
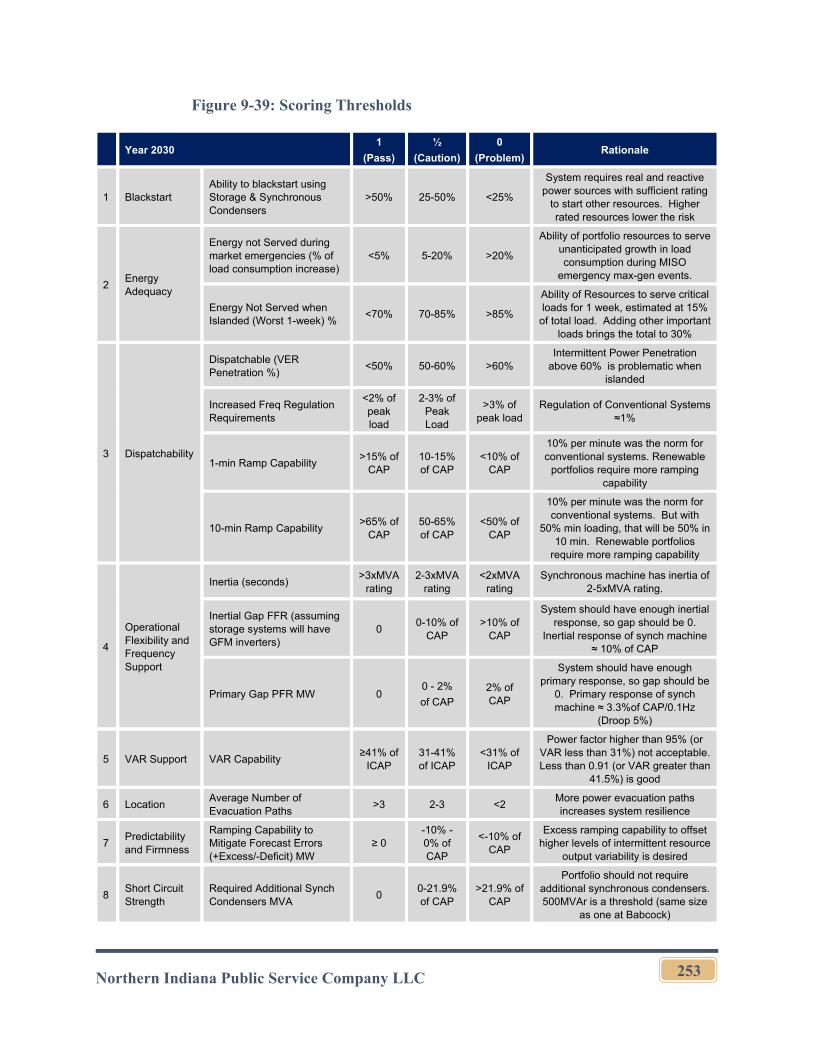
Northern Indiana Public Service Company LLC
253
Figure 9-39: Scoring Thresholds
Year 2030 1
(Pass)
½
(Caution)
0
(Problem) Rationale
1 Blackstart Ability to blackstart using Storage & Synchronous Condensers
>50% 25-50% <25%
System requires real and reactive power sources with sufficient rating
to start other resources. Higher rated resources lower the risk
2 Energy Adequacy
Energy not Served during market emergencies (% of load consumption increase)
<5% 5-20% >20%
Ability of portfolio resources to serve unanticipated growth in load consumption during MISO
emergency max-gen events.
Energy Not Served when Islanded (Worst 1-week) %
<70% 70-85% >85%
Ability of Resources to serve critical loads for 1 week, estimated at 15%
of total load. Adding other important loads brings the total to 30%
3 Dispatchability
Dispatchable (VER Penetration %)
<50% 50-60% >60% Intermittent Power Penetration
above 60% is problematic when islanded
Increased Freq Regulation Requirements
<2% of peak load
2-3% of Peak Load
>3% of peak load
Regulation of Conventional Systems ≈1%
1-min Ramp Capability >15% of
CAP 10-15% of CAP
<10% of CAP
10% per minute was the norm for conventional systems. Renewable
portfolios require more ramping capability
10-min Ramp Capability >65% of
CAP 50-65% of CAP
<50% of CAP
10% per minute was the norm for conventional systems. But with
50% min loading, that will be 50% in 10 min. Renewable portfolios
require more ramping capability
4
Operational Flexibility and Frequency Support
Inertia (seconds) >3xMVA
rating 2-3xMVA
rating <2xMVA
rating Synchronous machine has inertia of
2-5xMVA rating.
Inertial Gap FFR (assuming storage systems will have GFM inverters)
0 0-10% of
CAP >10% of
CAP
System should have enough inertial response, so gap should be 0.
Inertial response of synch machine ≈ 10% of CAP
Primary Gap PFR MW 0 0 - 2%
of CAP 2% of CAP
System should have enough primary response, so gap should be
0. Primary response of synch machine ≈ 3.3%of CAP/0.1Hz
(Droop 5%)
5 VAR Support VAR Capability ≥41% of
ICAP 31-41% of ICAP
<31% of ICAP
Power factor higher than 95% (or VAR less than 31%) not acceptable. Less than 0.91 (or VAR greater than
41.5%) is good
6 Location Average Number of Evacuation Paths
>3 2-3 <2 More power evacuation paths increases system resilience
7 Predictability and Firmness
Ramping Capability to Mitigate Forecast Errors (+Excess/-Deficit) MW
≥ 0 -10% - 0% of CAP
<-10% of CAP
Excess ramping capability to offset higher levels of intermittent resource
output variability is desired
8 Short Circuit Strength
Required Additional Synch Condensers MVA
0 0-21.9% of CAP
>21.9% of CAP
Portfolio should not require additional synchronous condensers. 500MVAr is a threshold (same size
as one at Babcock)
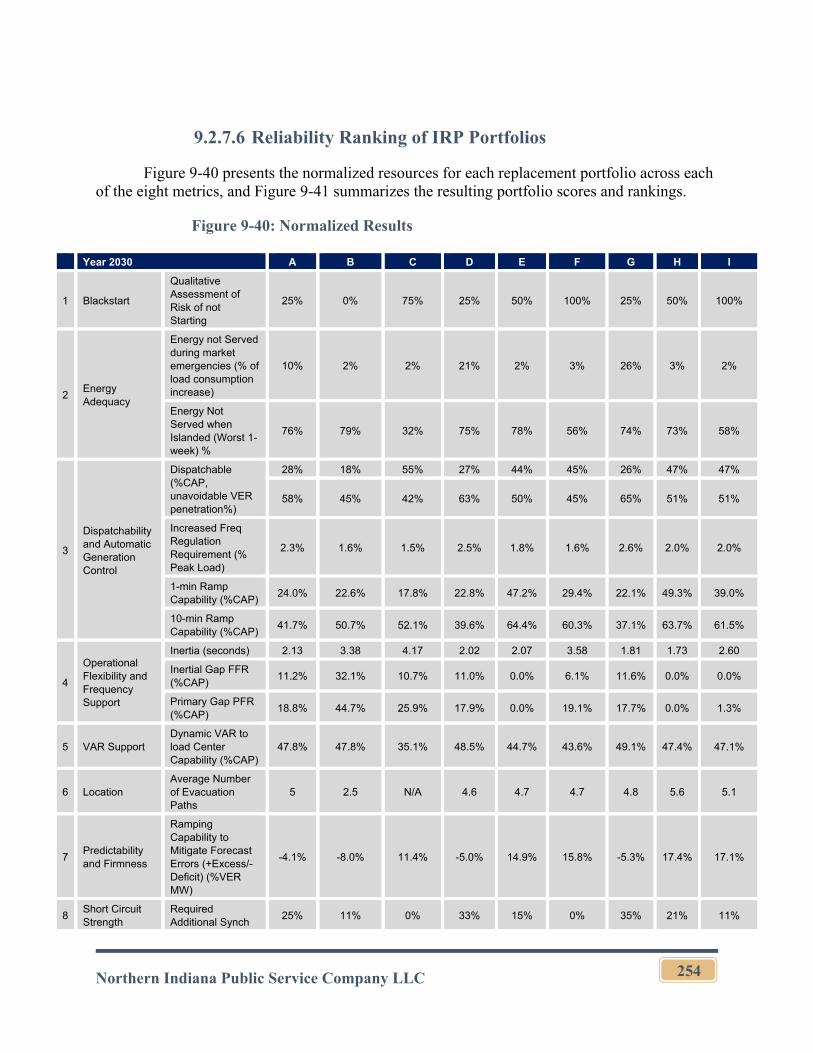
Northern Indiana Public Service Company LLC
254
9.2.7.6 Reliability Ranking of IRP Portfolios
Figure 9-40 presents the normalized resources for each replacement portfolio across each of the eight metrics, and Figure 9-41 summarizes the resulting portfolio scores and rankings.
Figure 9-40: Normalized Results
Year 2030 A B C D E F G H I
1 Blackstart
Qualitative Assessment of Risk of not Starting
25% 0% 75% 25% 50% 100% 25% 50% 100%
2 Energy Adequacy
Energy not Served during market emergencies (% of load consumption increase)
10% 2% 2% 21% 2% 3% 26% 3% 2%
Energy Not Served when Islanded (Worst 1-week) %
76% 79% 32% 75% 78% 56% 74% 73% 58%
3
Dispatchability and Automatic Generation Control
Dispatchable (%CAP, unavoidable VER penetration%)
28% 18% 55% 27% 44% 45% 26% 47% 47%
58% 45% 42% 63% 50% 45% 65% 51% 51%
Increased Freq Regulation Requirement (% Peak Load)
2.3% 1.6% 1.5% 2.5% 1.8% 1.6% 2.6% 2.0% 2.0%
1-min Ramp Capability (%CAP)
24.0% 22.6% 17.8% 22.8% 47.2% 29.4% 22.1% 49.3% 39.0%
10-min Ramp Capability (%CAP)
41.7% 50.7% 52.1% 39.6% 64.4% 60.3% 37.1% 63.7% 61.5%
4
Operational Flexibility and Frequency Support
Inertia (seconds) 2.13 3.38 4.17 2.02 2.07 3.58 1.81 1.73 2.60
Inertial Gap FFR (%CAP)
11.2% 32.1% 10.7% 11.0% 0.0% 6.1% 11.6% 0.0% 0.0%
Primary Gap PFR (%CAP)
18.8% 44.7% 25.9% 17.9% 0.0% 19.1% 17.7% 0.0% 1.3%
5 VAR Support Dynamic VAR to load Center Capability (%CAP)
47.8% 47.8% 35.1% 48.5% 44.7% 43.6% 49.1% 47.4% 47.1%
6 Location Average Number of Evacuation Paths
5 2.5 N/A 4.6 4.7 4.7 4.8 5.6 5.1
7 Predictability and Firmness
Ramping Capability to Mitigate Forecast Errors (+Excess/-Deficit) (%VER MW)
-4.1% -8.0% 11.4% -5.0% 14.9% 15.8% -5.3% 17.4% 17.1%
8 Short Circuit Strength
Required Additional Synch
25% 11% 0% 33% 15% 0% 35% 21% 11%
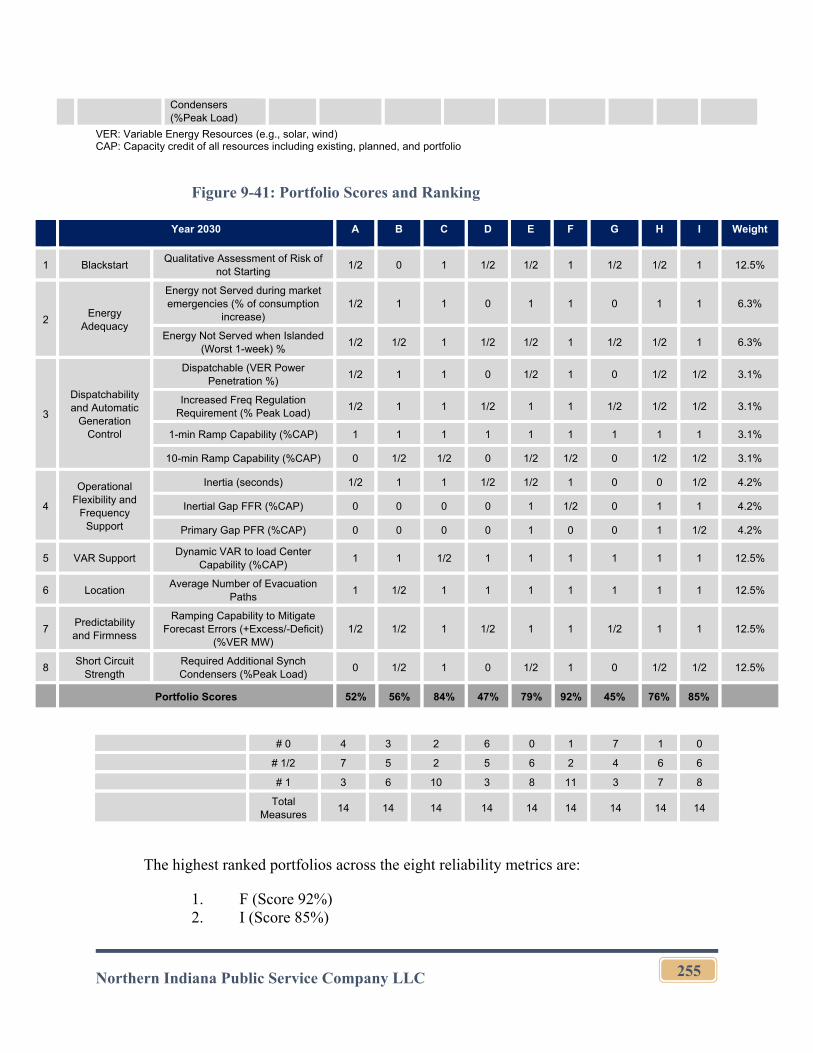
Northern Indiana Public Service Company LLC
255
Condensers (%Peak Load)
VER: Variable Energy Resources (e.g., solar, wind) CAP: Capacity credit of all resources including existing, planned, and portfolio
Figure 9-41: Portfolio Scores and Ranking
Year 2030 A B C D E F G H I Weight
1 Blackstart Qualitative Assessment of Risk of
not Starting 1/2 0 1 1/2 1/2 1 1/2 1/2 1 12.5%
2 Energy
Adequacy
Energy not Served during market emergencies (% of consumption
increase) 1/2 1 1 0 1 1 0 1 1 6.3%
Energy Not Served when Islanded (Worst 1-week) %
1/2 1/2 1 1/2 1/2 1 1/2 1/2 1 6.3%
3
Dispatchability and Automatic
Generation Control
Dispatchable (VER Power Penetration %)
1/2 1 1 0 1/2 1 0 1/2 1/2 3.1%
Increased Freq Regulation Requirement (% Peak Load)
1/2 1 1 1/2 1 1 1/2 1/2 1/2 3.1%
1-min Ramp Capability (%CAP) 1 1 1 1 1 1 1 1 1 3.1%
10-min Ramp Capability (%CAP) 0 1/2 1/2 0 1/2 1/2 0 1/2 1/2 3.1%
4
Operational Flexibility and
Frequency Support
Inertia (seconds) 1/2 1 1 1/2 1/2 1 0 0 1/2 4.2%
Inertial Gap FFR (%CAP) 0 0 0 0 1 1/2 0 1 1 4.2%
Primary Gap PFR (%CAP) 0 0 0 0 1 0 0 1 1/2 4.2%
5 VAR Support Dynamic VAR to load Center
Capability (%CAP) 1 1 1/2 1 1 1 1 1 1 12.5%
6 Location Average Number of Evacuation
Paths 1 1/2 1 1 1 1 1 1 1 12.5%
7 Predictability and Firmness
Ramping Capability to Mitigate Forecast Errors (+Excess/-Deficit)
(%VER MW) 1/2 1/2 1 1/2 1 1 1/2 1 1 12.5%
8 Short Circuit
Strength Required Additional Synch Condensers (%Peak Load)
0 1/2 1 0 1/2 1 0 1/2 1/2 12.5%
Portfolio Scores 52% 56% 84% 47% 79% 92% 45% 76% 85%
# 0 4 3 2 6 0 1 7 1 0 # 1/2 7 5 2 5 6 2 4 6 6 # 1 3 6 10 3 8 11 3 7 8
Total Measures
14 14 14 14 14 14 14 14 14
The highest ranked portfolios across the eight reliability metrics are:
1. F (Score 92%) 2. I (Score 85%)
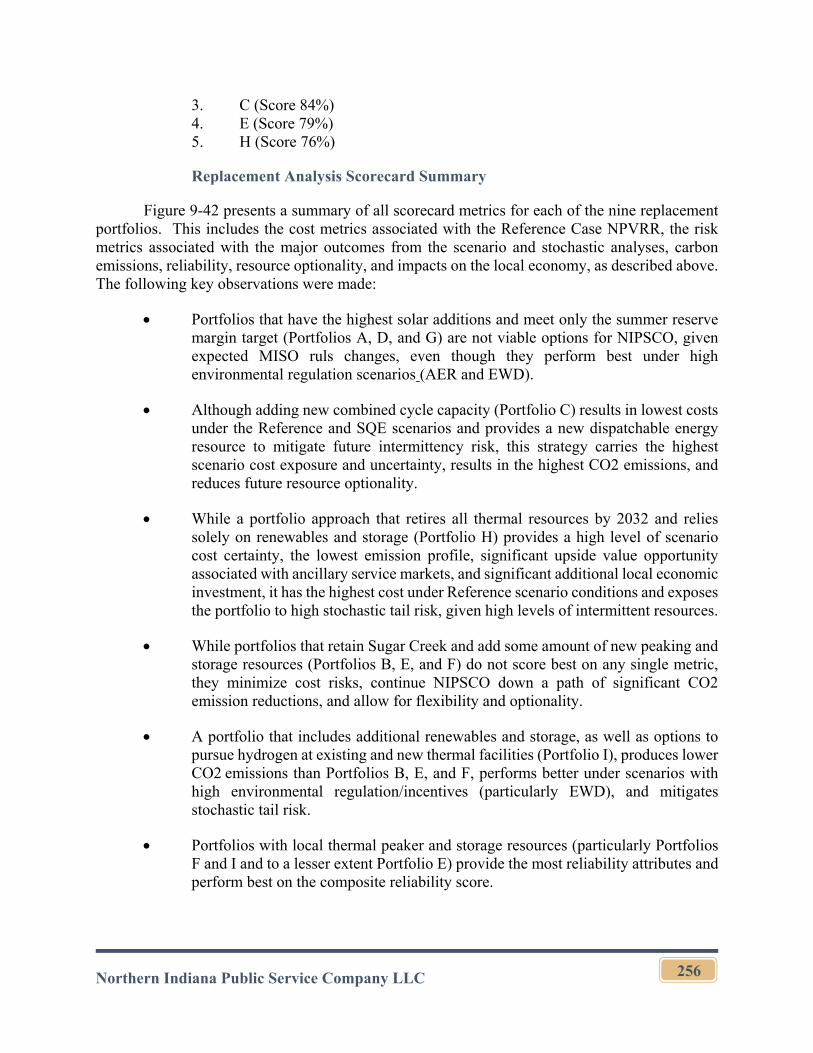
Northern Indiana Public Service Company LLC
256
3. C (Score 84%) 4. E (Score 79%) 5. H (Score 76%)
Replacement Analysis Scorecard Summary
Figure 9-42 presents a summary of all scorecard metrics for each of the nine replacement portfolios. This includes the cost metrics associated with the Reference Case NPVRR, the risk metrics associated with the major outcomes from the scenario and stochastic analyses, carbon emissions, reliability, resource optionality, and impacts on the local economy, as described above. The following key observations were made:
Portfolios that have the highest solar additions and meet only the summer reserve margin target (Portfolios A, D, and G) are not viable options for NIPSCO, given expected MISO ruls changes, even though they perform best under high environmental regulation scenarios (AER and EWD).
Although adding new combined cycle capacity (Portfolio C) results in lowest costs under the Reference and SQE scenarios and provides a new dispatchable energy resource to mitigate future intermittency risk, this strategy carries the highest scenario cost exposure and uncertainty, results in the highest CO2 emissions, and reduces future resource optionality.
While a portfolio approach that retires all thermal resources by 2032 and relies solely on renewables and storage (Portfolio H) provides a high level of scenario cost certainty, the lowest emission profile, significant upside value opportunity associated with ancillary service markets, and significant additional local economic investment, it has the highest cost under Reference scenario conditions and exposes the portfolio to high stochastic tail risk, given high levels of intermittent resources.
While portfolios that retain Sugar Creek and add some amount of new peaking and storage resources (Portfolios B, E, and F) do not score best on any single metric, they minimize cost risks, continue NIPSCO down a path of significant CO2 emission reductions, and allow for flexibility and optionality.
A portfolio that includes additional renewables and storage, as well as options to pursue hydrogen at existing and new thermal facilities (Portfolio I), produces lower CO2 emissions than Portfolios B, E, and F, performs better under scenarios with high environmental regulation/incentives (particularly EWD), and mitigates stochastic tail risk.
Portfolios with local thermal peaker and storage resources (particularly Portfolios F and I and to a lesser extent Portfolio E) provide the most reliability attributes and perform best on the composite reliability score.
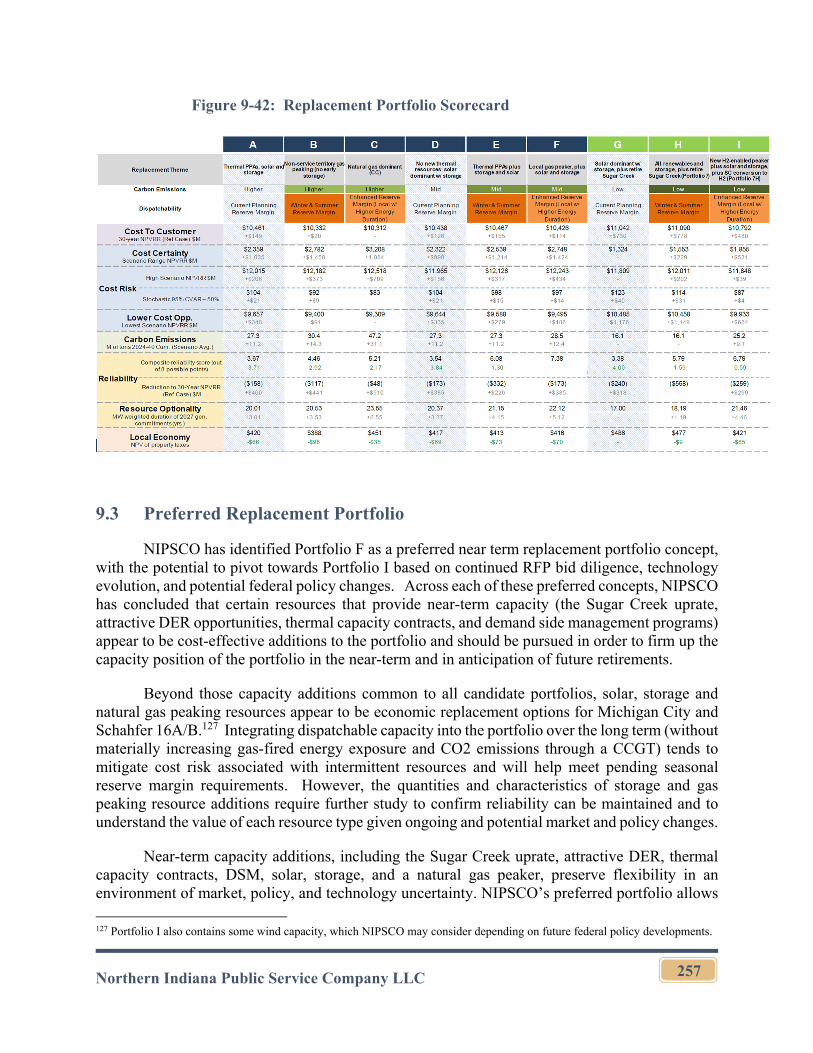
Northern Indiana Public Service Company LLC
257
Figure 9-42: Replacement Portfolio Scorecard
9.3 Preferred Replacement Portfolio
NIPSCO has identified Portfolio F as a preferred near term replacement portfolio concept, with the potential to pivot towards Portfolio I based on continued RFP bid diligence, technology evolution, and potential federal policy changes. Across each of these preferred concepts, NIPSCO has concluded that certain resources that provide near-term capacity (the Sugar Creek uprate, attractive DER opportunities, thermal capacity contracts, and demand side management programs) appear to be cost-effective additions to the portfolio and should be pursued in order to firm up the capacity position of the portfolio in the near-term and in anticipation of future retirements.
Beyond those capacity additions common to all candidate portfolios, solar, storage and natural gas peaking resources appear to be economic replacement options for Michigan City and Schahfer 16A/B.127 Integrating dispatchable capacity into the portfolio over the long term (without materially increasing gas-fired energy exposure and CO2 emissions through a CCGT) tends to mitigate cost risk associated with intermittent resources and will help meet pending seasonal reserve margin requirements. However, the quantities and characteristics of storage and gas peaking resource additions require further study to confirm reliability can be maintained and to understand the value of each resource type given ongoing and potential market and policy changes.
Near-term capacity additions, including the Sugar Creek uprate, attractive DER, thermal capacity contracts, DSM, solar, storage, and a natural gas peaker, preserve flexibility in an environment of market, policy, and technology uncertainty. NIPSCO’s preferred portfolio allows
127 Portfolio I also contains some wind capacity, which NIPSCO may consider depending on future federal policy developments.
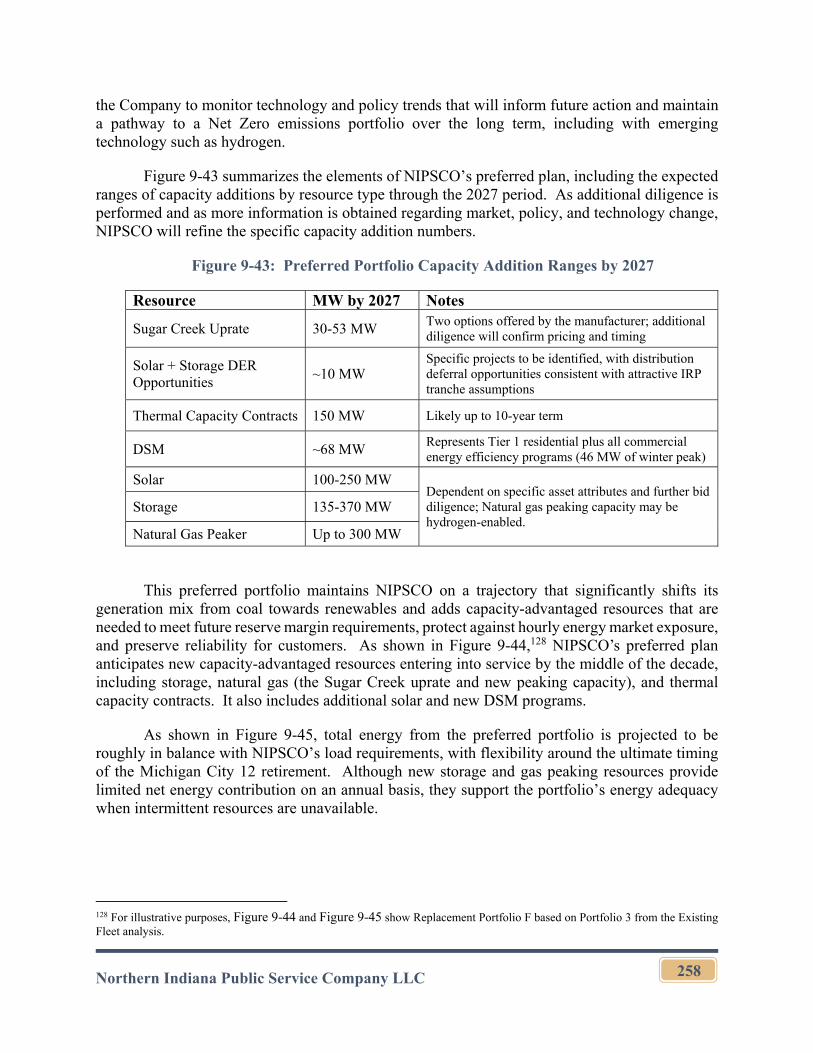
Northern Indiana Public Service Company LLC
258
the Company to monitor technology and policy trends that will inform future action and maintain a pathway to a Net Zero emissions portfolio over the long term, including with emerging technology such as hydrogen.
Figure 9-43 summarizes the elements of NIPSCO’s preferred plan, including the expected ranges of capacity additions by resource type through the 2027 period. As additional diligence is performed and as more information is obtained regarding market, policy, and technology change, NIPSCO will refine the specific capacity addition numbers.
Figure 9-43: Preferred Portfolio Capacity Addition Ranges by 2027
Resource MW by 2027 Notes
Sugar Creek Uprate 30-53 MW Two options offered by the manufacturer; additional diligence will confirm pricing and timing
Solar + Storage DER Opportunities
~10 MW Specific projects to be identified, with distribution deferral opportunities consistent with attractive IRP tranche assumptions
Thermal Capacity Contracts 150 MW Likely up to 10-year term
DSM ~68 MW Represents Tier 1 residential plus all commercial energy efficiency programs (46 MW of winter peak)
Solar 100-250 MW Dependent on specific asset attributes and further bid diligence; Natural gas peaking capacity may be hydrogen-enabled.
Storage 135-370 MW
Natural Gas Peaker Up to 300 MW
This preferred portfolio maintains NIPSCO on a trajectory that significantly shifts its generation mix from coal towards renewables and adds capacity-advantaged resources that are needed to meet future reserve margin requirements, protect against hourly energy market exposure, and preserve reliability for customers. As shown in Figure 9-44,128 NIPSCO’s preferred plan anticipates new capacity-advantaged resources entering into service by the middle of the decade, including storage, natural gas (the Sugar Creek uprate and new peaking capacity), and thermal capacity contracts. It also includes additional solar and new DSM programs.
As shown in Figure 9-45, total energy from the preferred portfolio is projected to be roughly in balance with NIPSCO’s load requirements, with flexibility around the ultimate timing of the Michigan City 12 retirement. Although new storage and gas peaking resources provide limited net energy contribution on an annual basis, they support the portfolio’s energy adequacy when intermittent resources are unavailable.
128 For illustrative purposes, Figure 9-44 and Figure 9-45 show Replacement Portfolio F based on Portfolio 3 from the Existing Fleet analysis.
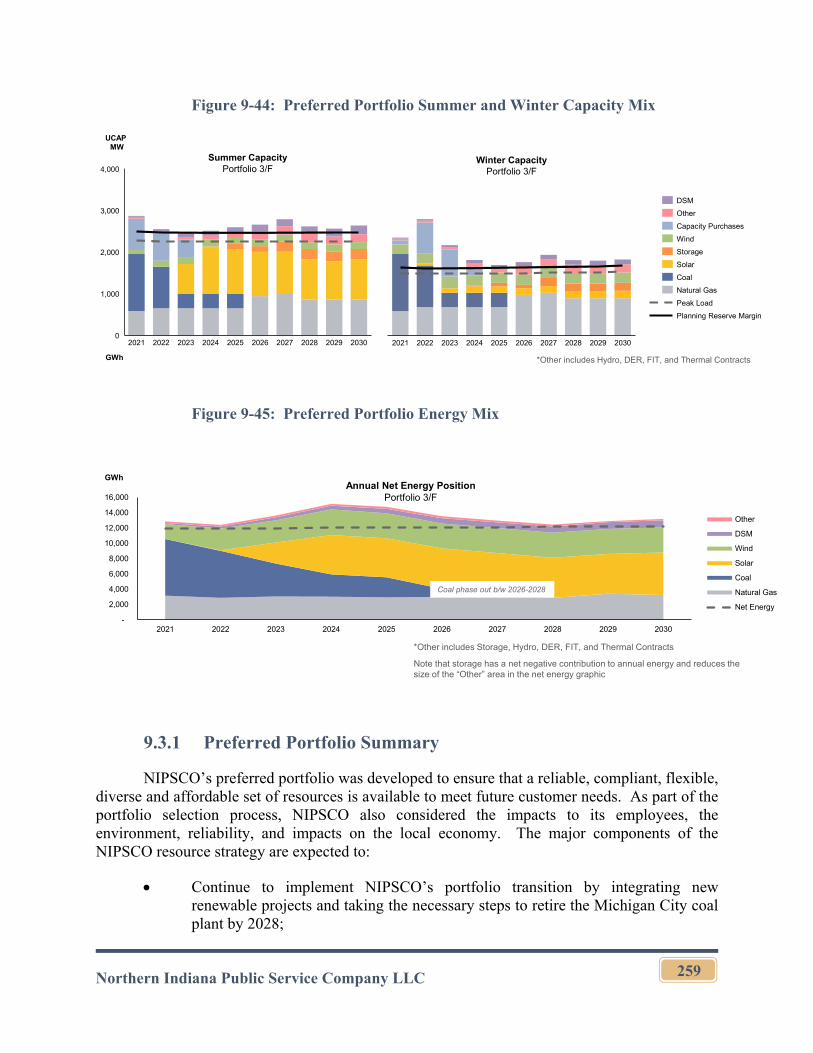
Northern Indiana Public Service Company LLC
259
Figure 9-44: Preferred Portfolio Summer and Winter Capacity Mix
Figure 9-45: Preferred Portfolio Energy Mix
9.3.1 Preferred Portfolio Summary
NIPSCO’s preferred portfolio was developed to ensure that a reliable, compliant, flexible, diverse and affordable set of resources is available to meet future customer needs. As part of the portfolio selection process, NIPSCO also considered the impacts to its employees, the environment, reliability, and impacts on the local economy. The major components of the NIPSCO resource strategy are expected to:
Continue to implement NIPSCO’s portfolio transition by integrating new renewable projects and taking the necessary steps to retire the Michigan City coal plant by 2028;
2,000
0
1,000
4,000
3,000
2022 20232021 2027 20282024 2025 2026 2029 2030
Summer CapacityPortfolio 3/F
2025 20282022 202620232021 2024 20292027 2030
Winter CapacityPortfolio 3/F
UCAP MW
Capacity Purchases
DSM
Storage
Wind
Other
Solar
Coal
Natural Gas
Peak Load
Planning Reserve Margin
GWh *Other includes Hydro, DER, FIT, and Thermal Contracts
-
2,000
4,000
6,000
8,000
10,000
12,000
14,000
16,000
2021 2022 2023 2024 2025 2026 2027 2028 2029 2030
Other
DSM
Wind
Solar
Coal
Natural Gas
Net Energy
Annual Net Energy PositionPortfolio 3/F
GWh
Coal phase out b/w 2026-2028
*Other includes Storage, Hydro, DER, FIT, and Thermal Contracts
Note that storage has a net negative contribution to annual energy and reduces the size of the “Other” area in the net energy graphic
Northern Indiana Public Service Company LLC
260
Continue the Company’s commitment to EE and DR by executing the current filed DSM plan and continuing to plan for significant residential and commercial DSM programs over time;
Provide a cost-effective portfolio for customers while also balancing other objectives associated with rate stability, environmental sustainability, and positive social and economic impacts;
Ensure that system reliability is preserved as NIPSCO and the broader MISO market increase the amount of intermittent resource capacity;
Reduce customer and NIPSCO exposure to market, policy, and technology risks by intentionally integrating modular, highly diverse new resource alternatives over the next several years;
Preserve flexibility in resource procurement, particularly over the long-term;
Continue to actively monitor federal policy, technology, and MISO market trends, while staying engaged with project developers and asset owners to understand the landscape of new resource options;
Continue to invest in infrastructure modernization to maintain safe and reliable delivery of energy services;
Continue to comply with NERC, MISO, and EPA standards and regulations.
It is important to remember that this preferred portfolio as part of the 2021 IRP is a snapshot in time and while it establishes a direction for NIPSCO, it is subject to change as the external operating environment changes. In addition, the submission of this plan and its resulting preferred portfolio does not stop the transparency of the process or engagement with stakeholders.
9.3.2 Financial Impact
Figure 9-46 shows NIPSCO’s financial impact of Replacement Portfolio F under the retirement dates from Existing Fleet Portfolio 3 over the planning period. While NIPSCO’s preferred portfolio intentionally retains flexibility to incorporate elements of Portfolios 3 and 5 from the Existing Fleet analysis, as well as Portfolios F and I from the Replacement analysis, this summary is being provided as a baseline benchmark.
The 30-year NPVRR is broken down into operating and capital costs. The operating costs include the fixed and variable costs associated with both existing units and future resources, as well as contract costs and net market purchases. The capital costs include all capital related costs for existing units and costs related to the acquisition of new resources in the preferred portfolio. These costs include depreciation expenses, capital charges, and taxes. In order to present a levelized net present value rate summary, the total energy forecast for NIPSCO is also discounted over the 30-year period at the same rate.
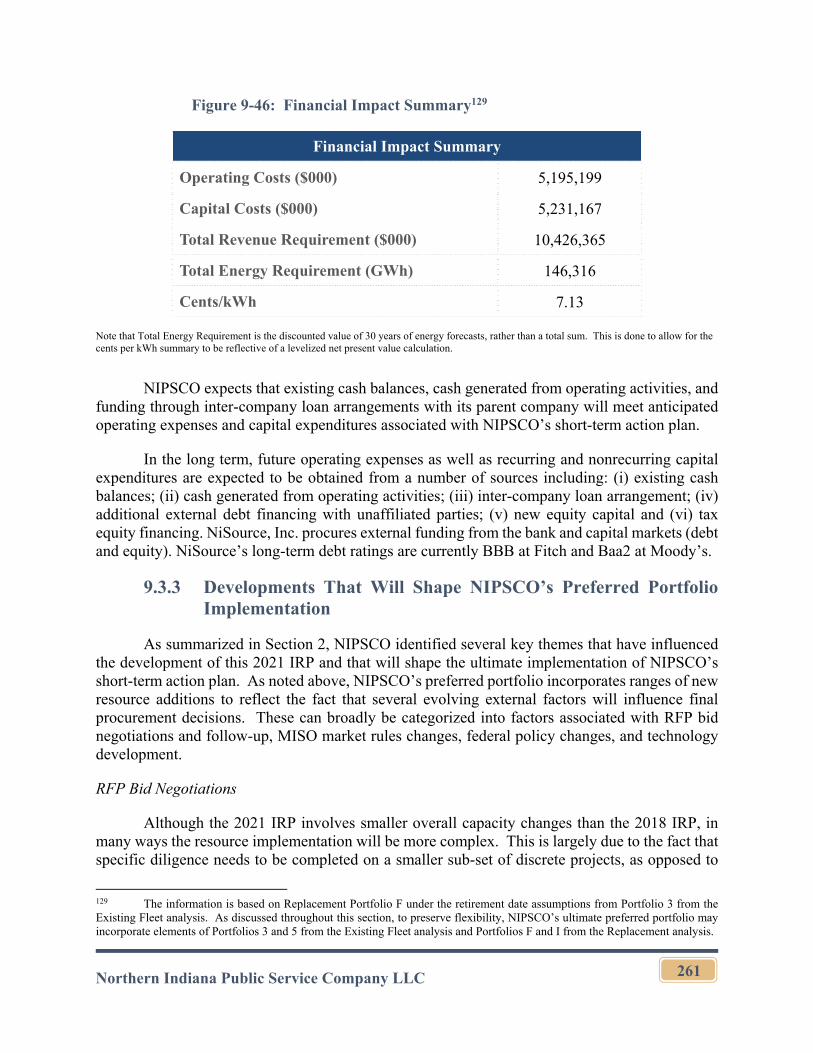
Northern Indiana Public Service Company LLC
261
Figure 9-46: Financial Impact Summary129
Financial Impact Summary Operating Costs ($000) 5,195,199
Capital Costs ($000) 5,231,167
Total Revenue Requirement ($000) 10,426,365
Total Energy Requirement (GWh) 146,316
Cents/kWh 7.13 Note that Total Energy Requirement is the discounted value of 30 years of energy forecasts, rather than a total sum. This is done to allow for the cents per kWh summary to be reflective of a levelized net present value calculation.
NIPSCO expects that existing cash balances, cash generated from operating activities, and funding through inter-company loan arrangements with its parent company will meet anticipated operating expenses and capital expenditures associated with NIPSCO’s short-term action plan.
In the long term, future operating expenses as well as recurring and nonrecurring capital expenditures are expected to be obtained from a number of sources including: (i) existing cash balances; (ii) cash generated from operating activities; (iii) inter-company loan arrangement; (iv) additional external debt financing with unaffiliated parties; (v) new equity capital and (vi) tax equity financing. NiSource, Inc. procures external funding from the bank and capital markets (debt and equity). NiSource’s long-term debt ratings are currently BBB at Fitch and Baa2 at Moody’s.
9.3.3 Developments That Will Shape NIPSCO’s Preferred Portfolio Implementation
As summarized in Section 2, NIPSCO identified several key themes that have influenced the development of this 2021 IRP and that will shape the ultimate implementation of NIPSCO’s short-term action plan. As noted above, NIPSCO’s preferred portfolio incorporates ranges of new resource additions to reflect the fact that several evolving external factors will influence final procurement decisions. These can broadly be categorized into factors associated with RFP bid negotiations and follow-up, MISO market rules changes, federal policy changes, and technology development.
RFP Bid Negotiations
Although the 2021 IRP involves smaller overall capacity changes than the 2018 IRP, in many ways the resource implementation will be more complex. This is largely due to the fact that specific diligence needs to be completed on a smaller sub-set of discrete projects, as opposed to
129 The information is based on Replacement Portfolio F under the retirement date assumptions from Portfolio 3 from the Existing Fleet analysis. As discussed throughout this section, to preserve flexibility, NIPSCO’s ultimate preferred portfolio may incorporate elements of Portfolios 3 and 5 from the Existing Fleet analysis and Portfolios F and I from the Replacement analysis.
Northern Indiana Public Service Company LLC
262
the greater flexibility afforded NIPSCO in 2018 associated with identifying many renewable projects to fill a relatively large capacity target.
As NIPSCO proceeds with its short-term implementation plan, the following RFP bid diligence will be required:
Review the best-performing gas peaker bids to confirm consistency with Reliability Assessment conclusions, assess opportunities for hydrogen enablement, and evaluate overall project viability and feasibility;
Assess characteristics of storage bids to confirm consistency with Reliability Assessment, such as a preference for grid forming inverter technology, and other operational requirements; and
Consider additional RFPs for capacity resources if needed to re-assess the landscape and ensure consistency with all IRP preferred portfolio requirements.
MISO Market Rules Changes
At the outset of its 2021 IRP process, NIPSCO identified several regulatory developments at the MISO level that would impact portfolio performance and ultimate implementation of the preferred plan. While MISO has advanced policy development implementation in many areas over the last year, several areas of uncertainty remain, requiring NIPSCO to ensure portfolio decisions are flexible enough to adapt to the changing environment. These include:
Ongoing activities associated with MISO’s RAN framework and the pending implementation of a seasonal capacity construct: Throughout 2021, MISO engaged with stakeholders regarding the implementation of a four-season capacity construct. While still not final, NIPSCO expects a filing on this proposal with FERC to be followed by implementation over the next few years. NIPSCO’s 2021 IRP has explicitly planned for this, but portfolio adjustments may be needed in the event of different reserve margin targets (for example, a higher winter standard than modeled in the IRP) and evolving capacity accreditation rules.
MISO’s transition to an ELCC methodology to assess capacity credit for wind and solar resources over time and by season: NIPSCO’s 2021 IRP incorporated a range of ELCC trajectories over time by scenario (See Section 8 for details across scenarios and earlier parts of this section for the impacts on NIPSCO’s supply-demand balance) and assumed different summer and winter capacity credit ratings for intermittent technologies. However, as MISO implements new ELCC accounting procedures and the seasonal capacity construct, and as the amount of intermittent capacity in the broader market increases, credit values may evolve differently than what NIPSCO has assumed in the IRP. Therefore, resource procurement will need to remain flexible in order to ensure planning reserve margins are maintained.
Northern Indiana Public Service Company LLC
263
MISO’s ongoing RIIA study: Although the 2021 IRP was designed specifically to evaluate reliability across the many dimensions identified in recent RIIA reports, NIPSCO will continue to track developments and their impact on the portfolio.
MISO’s implementation of market rules associated with FERC No. Order 841, which requires ISOs and RTOs to establish a participation model for storage resources in energy, capacity, and ancillary services markets: The 2021 IRP has identified significant value opportunities for storage resources in the sub-hourly energy and ancillary services markets. However, rules for storage implementation are not fully established, with MISO requesting implementation delays until 2022. As these rules are formalized, including for capacity accreditation and energy and ancillary services participation, NIPSCO will continue to track developments and adapt its resource procurement plans (particularly around storage) accordingly.
Federal Energy and Environmental Policy Changes
As of the time of the development of NIPSCO’s 2021 IRP preferred portfolio, federal policymakers were debating significant changes to energy and environmental policy. While NIPSCO’s scenarios have contemplated a broad range of policy outcomes largely consistent with the state of the debate (See Section 8 for more detail), certain outcomes could impact portfolio implementation decisions. The most relevant include:
The potential implementation of a stand-alone storage ITC: NIPSCO’s preferred portfolio contains a wide range of potential storage additions, and NIPSCO’s scenario analysis indicated that storage resources perform better in scenarios that assume the implementation of a storage ITC. Therefore, if implemented, NIPSCO’s preferred portfolio retains the flexibility to pivot towards higher levels of storage additions.
Changes to current implementation of the ITC including, potential “direct-pay” provisions and Internal Revenue Service normalization rules.
The potential implementation of a hydrogen PTC or other federal incentives for hydrogen development: NIPSCO’s portfolio analysis suggested that federal subsidies for hydrogen production would improve the performance of portfolios that integrate this resource type into the mix. Therefore, if federal legislation includes direct subsidies or other incentives associated with hydrogen production or use, NIPSCO may adapt by exploring pilot programs or other initiatives designed to test and integrate hydrogen into its generation mix.
The potential implementation of a carbon tax, clean energy standard or CEPP: Various recent policy proposals have offered several alternative means of incentivizing clean energy additions, and certain policy outcomes may influence the amount of new renewable capacity (both solar and wind) that NIPSCO ultimately adds to its portfolio through the short-term implementation plan.
Northern Indiana Public Service Company LLC
264
Technology Change
As the power sector continues to navigate a period of significant change, NIPSCO expects that technology evolution will be rapid, requiring regular review of the supply-side resource marketplace and flexibility in the preferred portfolio. For example, as NIPSCO implemented the short-term action plan from its 2018 IRP, additional paired solar plus storage additions were made in response to improving technology and declining costs for lithium-ion battery storage. Going forward, NIPSCO expects power sector technology evolution to continue to impact both short-term procurement activities and long-term resource decisions. In particular, NIPSCO will continue to monitor the following:
Stand-alone storage resource costs, efficiencies, and operational parameters, such as cycle limits, depth of discharge specifications, and ongoing expenses;
Grid-forming inverter technology that could provide reliability benefits, such as blackstart, fast frequency response, and inertial response, to NIPSCO’s system as it becomes more inverter-based;
Hydrogen production developments, particularly associated with electrolysis of water with clean electricity sources (“green hydrogen”) and the costs and capabilities of turbines and other thermal resources to burn hydrogen or blend hydrogen with natural gas;
CCS costs and sequestration opportunities, particularly associated with the Sugar Creek facility;
Long-duration storage technologies, including gravity storage, and their associated costs, efficiencies, and other value drivers;
Other technologies that may emerge over the long term, including small modular reactors and other nuclear technology.
Other Factors
As with the implementation of NIPSCO’s 2018 IRP, NIPSCO will again continue to perform project-specific analyses for any new resources that may enter the portfolio to evaluate items such as congestion and nodal price risk, energy deliverability, and other reliability topics. This may include detailed nodal and power flow modeling and other local transmission and distribution system analyses.
9.4 Short-Term Action Plan
NIPSCO’s short-term action plan covers the period 2022 to 2027 and includes several elements, as summarized in
Northern Indiana Public Service Company LLC
265
Figure 9-47. NIPSCO will initiate the planning process for the retirement of the Michigan City 12 and Schahfer 16AB units, leaving flexibility in ultimate timing, as described in the preferred existing fleet portfolio section above. During the retirement implementation period, NIPSCO will make the required notifications to MISO, NERC and other relevant organizations of its intention to retire units, and NIPSCO will also identify and implement reliability and transmission upgrades resulting from the retirements.
NIPSCO will also select replacement resources identified through the 2021 RFP evaluation process, prioritizing resources that were common across all portfolios that influenced the preferred portfolio selection. These include short-term thermal contracts and some solar resources. NIPSCO will also take the necessary steps to proceed with uprates to the Sugar Creek CCGT facility and identify opportunities for DER projects with distribution deferral costs consistent with the attractive tranche selected in the preferred portfolio. NIPSCO will also continue to implement the filed DSM plan for 2022 to 2024 and will continue to pursue longer-term DSM implementation consistent with the bundles selected in the preferred portfolio.
In addition, NIPSCO will perform due diligence on the short-list of gas peaker and storage bids and will conduct additional targeted RFP solicitations and associated portfolio analysis if current projects do not meet all reliability and other considerations inherent in the preferred portfolio. For the projects selected, NIPSCO will pursue the required approvals from the Commission to acquire those projects. Finally, to fill any short-term capacity needs during this period, NIPSCO will rely on MISO market purchases or short-term bilateral capacity contracts.
9.5 Conclusion
The NIPSCO Integrated Resource Plan seeks to ensure reliable, cost-effective electric service for customers while maintaining a robust and diverse pool of supply-side generation and demand-side options. This 2021 IRP incorporated several emerging trends and greatly expanded the analysis of risk and reliability to identify a preferred portfolio that is highly flexible to changing external conditions. It is no longer possible to view the world in terms of choosing a simple least cost option, and NIPSCO has identified an implementation roadmap that reflects the need to minimize future environmental impacts, maximize resource diversification, and preserve optionality over the long-term.
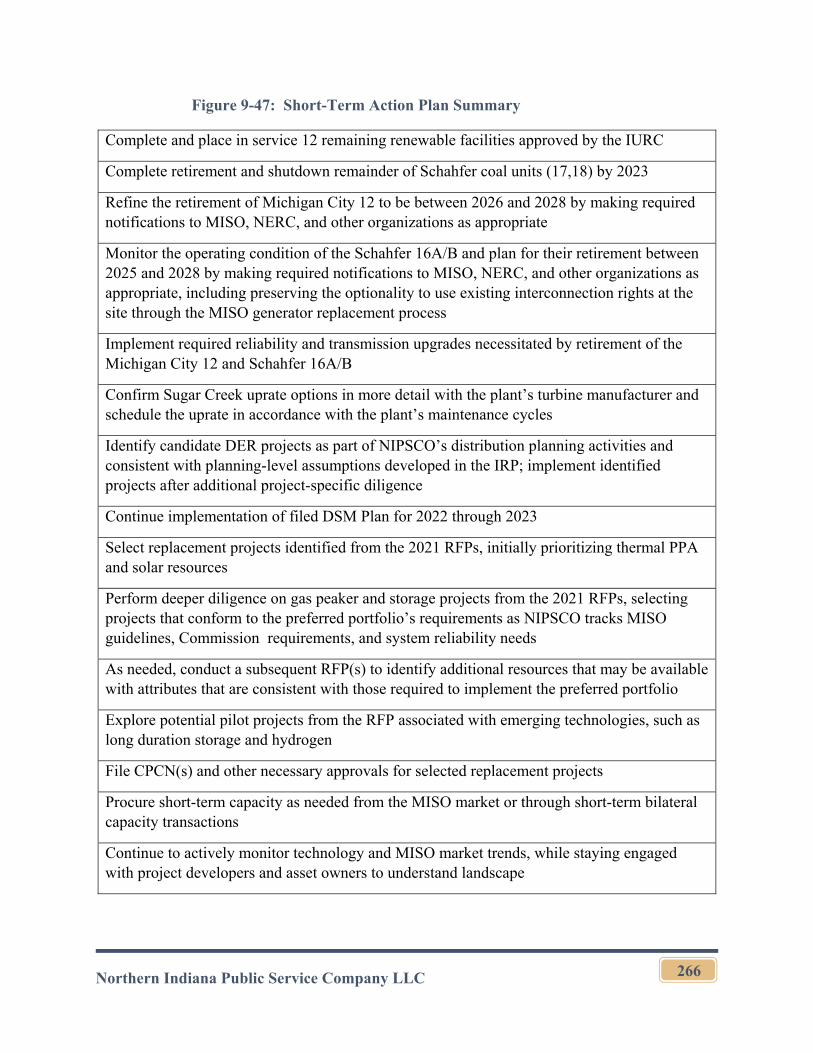
Northern Indiana Public Service Company LLC
266
Figure 9-47: Short-Term Action Plan Summary
Complete and place in service 12 remaining renewable facilities approved by the IURC
Complete retirement and shutdown remainder of Schahfer coal units (17,18) by 2023
Refine the retirement of Michigan City 12 to be between 2026 and 2028 by making required notifications to MISO, NERC, and other organizations as appropriate
Monitor the operating condition of the Schahfer 16A/B and plan for their retirement between 2025 and 2028 by making required notifications to MISO, NERC, and other organizations as appropriate, including preserving the optionality to use existing interconnection rights at the site through the MISO generator replacement process
Implement required reliability and transmission upgrades necessitated by retirement of the Michigan City 12 and Schahfer 16A/B
Confirm Sugar Creek uprate options in more detail with the plant’s turbine manufacturer and schedule the uprate in accordance with the plant’s maintenance cycles
Identify candidate DER projects as part of NIPSCO’s distribution planning activities and consistent with planning-level assumptions developed in the IRP; implement identified projects after additional project-specific diligence
Continue implementation of filed DSM Plan for 2022 through 2023
Select replacement projects identified from the 2021 RFPs, initially prioritizing thermal PPA and solar resources
Perform deeper diligence on gas peaker and storage projects from the 2021 RFPs, selecting projects that conform to the preferred portfolio’s requirements as NIPSCO tracks MISO guidelines, Commission requirements, and system reliability needs
As needed, conduct a subsequent RFP(s) to identify additional resources that may be available with attributes that are consistent with those required to implement the preferred portfolio
Explore potential pilot projects from the RFP associated with emerging technologies, such as long duration storage and hydrogen
File CPCN(s) and other necessary approvals for selected replacement projects
Procure short-term capacity as needed from the MISO market or through short-term bilateral capacity transactions
Continue to actively monitor technology and MISO market trends, while staying engaged with project developers and asset owners to understand landscape

Northern Indiana Public Service Company LLC
267
Perform additional reliability analysis within the NIPSCO system as needed to ensure evolving portfolio meets all reliability needs and requirements
Comply with NERC, EPA, and other regulations
Continue planned investments in infrastructure modernization to maintain the safe and reliable delivery of energy services
Northern Indiana Public Service Company LLC
268
Section 10. Customer Engagement
10.1 Enhancing Customer Engagement
People must be at the center of a sustainable energy future. Understanding and incorporating the diverse needs and perspectives of NIPSCO’s customers is important, and the Company is focused on continuously improving how it serves and engages with its customers. Whether it is transitioning to lower-cost and cleaner energy sources, helping customers understand changes and enhancements to their service, or listening to customer feedback about how they want to interact with NIPSCO, customers have been and continue to be the central focus.
10.1.1 Leveraging Customer and Stakeholder Feedback
NIPSCO relies on customer feedback to uncover service improvement opportunities. Those feedback mechanisms include the Customer Advisory Panel, J.D. Power customer satisfaction surveys, customer surveys administered by the MSR Group, online customer panels, and comments and complaints that are emailed or called in to NIPSCO’s customer care center, as well as the IURC Consumer Affairs Division. NIPSCO also surveys customers to determine customer satisfaction with its customer care center and interactions with field personnel, as well as with other interactions, such as mobile, integrated voice responses and the website. The company also researches best practices that have been demonstrated by those within the utility sector as well as those outside of the industry. Customer feedback is the primary driver behind many of the changes to operations, improvements to customer communications, enhancements to services, and other offerings that have been instituted in recent years.
In 2020, NIPSCO also partnered with E Source, a company with 30+ years of industry expertise, to perform a market research study gathering voice-of-customer insights that shed a unique light on their experiences and expectations of NIPSCO, utilities, and energy. The study was designed to determine a baseline on NIPSCO customer wants and needs while identifying ways to bridge gaps between those wants and needs and NIPSCO’s brand promise. The customer insights provided a fresh perspective on ways NIPSCO can best meet the expectations of today’s customers, which will include updating brand messaging and validating in-flight customer experience investments and enhancements, while also potentially providing business case data for future customer-focused initiatives.
Direct customer feedback has been critical in helping NIPSCO and its parent company, NiSource, to better understand and prioritize customer needs. Based on customer feedback, the following features and capabilities have been implemented – or are currently being implemented – at NIPSCO and its five sister utilities:
Service Request Management: Allowing customers to start, stop and transfer service digitally;
Mobile Application: Delivering a mobile application so customers can directly conduct utility business via a native mobile application; and
Northern Indiana Public Service Company LLC
269
Chatbot and Live Chat: Allowing customers to receive support via a chatbot or via online chat with a live agent.
Customer feedback also allows NIPSCO to drive continuous incremental improvements across existing initiatives, including paperless enrollments and ongoing website enhancements, and helps NIPSCO better understand areas in which customers are satisfied with their interactions and areas in which the Company can continue to improve across technologies, processes and experiences.
10.1.2 Customer Education – Your Energy, Your Future
As NIPSCO transitions away from coal generation and toward lower-cost, cleaner generation options, it is important for customers to understand why and how this transition will occur so NIPSCO can maintain customer trust and confidence in the essential, reliable energy it provides.
One of the ways NIPSCO has been able to help educate customers about its “Your Energy, Your Future” generation transition plan is through a robust awareness campaign. The campaign – which included advertising and public relations efforts to communicate this message – started in 2019, was refreshed in 2020, and has continued in 2021. The goal of the NIPSCO public education efforts is to generate awareness about the generation transition by helping customers understand the customer, economic, and environmental benefits of these changes.
Part of the campaign included the creation of a dedicated website, or microsite, to house all information related to NIPSCO’s Your Energy, Your Future generation transition, which can be found at NIPSCO.com/future.
New in 2020 was an “explainer” video prominently featured on the microsite that breaks down the basics of NIPSCO’s generation transition in three minutes – highlighting customer cost savings, continued reliability, lower emissions, and additional economic benefits to the communities NIPSCO serves. The video was viewed by nearly 30,000 customers between NIPSCO’s website and Facebook page over a 22-week period, when the advertising campaign was in flight.
Along with the microsite and video, NIPSCO utilized television, radio and print advertising, bill inserts, customer emails, and social media to reach customers and educate them about the generation transition. Press releases were also utilized to announce the latest renewable energy project news.
In 2020, NIPSCO partnered with the Center for Innovation through Visualization and Simulation through Purdue University Northwest to create a virtual simulation of a wind farm showing how wind energy is captured and delivered to customers’ homes through the distribution system. The simulation will be featured on the Your Energy, Your Future microsite, along with being loaded into virtual reality goggles that NIPSCO representatives will bring to community events once COVID-19 restrictions are fully lifted.
Northern Indiana Public Service Company LLC
270
NIPSCO’s 2020 Your Energy, Your Future ad campaign’s “Leaving It Better” story featuring Gary, Indiana resident and community leader LaJuan Clemons was nominated and won an Emmy award in June 2021. The Lower Lakes Chapter of the National Academy of Television Arts & Sciences awards Emmys to stations, studios, and production companies, and the LaJuan video story was entered in partnership with NIPSCO’s advertising agency, Borshoff, and its production partner, Bayonet Media. The winning video featured LaJuan’s inspiring story of how he helps Leave It Better in his Gary, Indiana, community. The video won in the Branded Content–Short-Form Content category.
Annually, NIPSCO garners customer feedback through a sentiment and awareness study from the Your Energy, Your Future campaign. The most recent study, conducted at the end of 2020, showed 67% of customers have a favorable view of NIPSCO’s generation transition plan. Feedback showed customers associated NIPSCO’s generation transition with cleaner energy, reducing emissions and improving the environment, while also demonstrating that they understand NIPSCO will continue to provide reliable energy into the future. Customer feedback on external campaigns helps NIPSCO learn which parts of its plan may need more consumer education in the future.
10.1.3 NIPSCO’s Customer Workshop Series
NIPSCO has kicked off the ninth season of its Customer Workshop Series in partnership with Purdue University. Due to the COVID-19 pandemic, NIPSCO Major Accounts elected not to host the Customer Workshop Series in 2020. Other than this one-year break, hundreds of NIPSCO Transmission and C&I customers from all over northern Indiana have attended the various workshops since 2011. The series includes workshops ranging from the technical (Understanding HVAC, Fundamentals of Compressed Air, Energy Savings 101, Demand Management, Lighting, etc.) to the interpersonal (Six Sigma, Managing Time & Stress, Becoming a Leader, Managing Across Generations, etc.), and customers are able to pick which workshops are valuable to their businesses and reserve openings for themselves and/or their colleagues at no expense.
Attendees are able to interact with industry experts and representatives from the NIPSCO Major Accounts team, as well as their peers at other companies, learning best practices and voicing their current challenges and solutions in an open, classroom setting. Each season, customers complete surveys, and the feedback is used to improve the subsequent season. During the 2021 season, NIPSCO continued to host classes throughout the service territory while abiding by Centers for Disease Control and Prevention guidelines for social distancing to protect the health and well-being of customers, Purdue employees, and NIPSCO team members.
10.2 Community Partnerships
10.2.1 Community Advisory Panels
Another avenue used by NIPSCO to engage with its customers and stakeholders is the use of Community Advisory Panels (CAPs), which serve as a forum to discuss new company initiatives and programs as well as to educate and facilitate feedback regarding service and other NIPSCO-related matters in our communities. NIPSCO has five regional CAPs across the
Northern Indiana Public Service Company LLC
271
Company’s northern Indiana footprint. CAPs are composed of individual customers, as well as local government and community leaders representing a diverse, broad cross-section of NIPSCO customers. NIPSCO senior management meets with each of the regional CAPs three times a year to share the Company’s strategic direction and to ask members of the CAPs for insight on emerging issues. In 2019, NIPSCO adjusted the CAP territories slightly to reflect changes made to the areas that its Public Affairs managers serve. During 2020, NIPSCO was able to conduct three annual meetings virtually to maintain the integrity of the program. CAP members received updated information on NIPSCO’s Your Energy, Your Future generation transition plan, as well as background on how the MISO operates in connection with NIPSCO and other states. In addition, NIPSCO utilized the CAP relationships throughout 2020 to communicate operational updates NIPSCO initiated as a result of COVID-19.
10.2.2 Partners For Clean Air
NIPSCO is a Gold Member of the Northwest Indiana Partners for Clean Air, a coalition of businesses, industries, local governments, and community groups committed to improving overall air quality and public health through voluntary actions. NIPSCO’s voluntary actions include implementing energy-efficiency programs for customers and the Your Energy, Your Future generation transition. On April 30, 2021, NIPSCO received the Business Award at the annual Partners for Clean Air virtual award ceremony. To win this award, NIPSCO partnered with South Shore Clean Cities to support the construction of 24 new, public electric vehicle charging stations by matching funds for grant projects with $500 donations for eligible participants. Level 2 electric vehicle charging stations have been installed in 18 communities across northern Indiana.
10.3 Customer Programs
10.3.1 Feed-in Tariff
NIPSCO’s FIT Phase I was approved on July 13, 2011, in Cause No. 43922. Implementation began immediately as a three-year pilot program with a 30 MW capacity cap. Phase I offered a higher rate to participants selling electricity than the retail electric rate in the current approved sales tariffs and provided an incentive to encourage development of renewable generating resources. The pilot program was designed to help maximize the development of renewable energy in Indiana, which welcomed biomass, wind, hydro and solar resources. The FIT provides the customer a sell-back opportunity to NIPSCO at a predetermined price for up to 15 years through a RPPA. Participating customers receive payment from NIPSCO for the amount of electricity generated and delivered to NIPSCO through an approved interconnection and metering point.
Additional program details:
The participating generator must be an existing NIPSCO electric customer.
An IA and RPPA are required to reserve capacity or enter the queue.
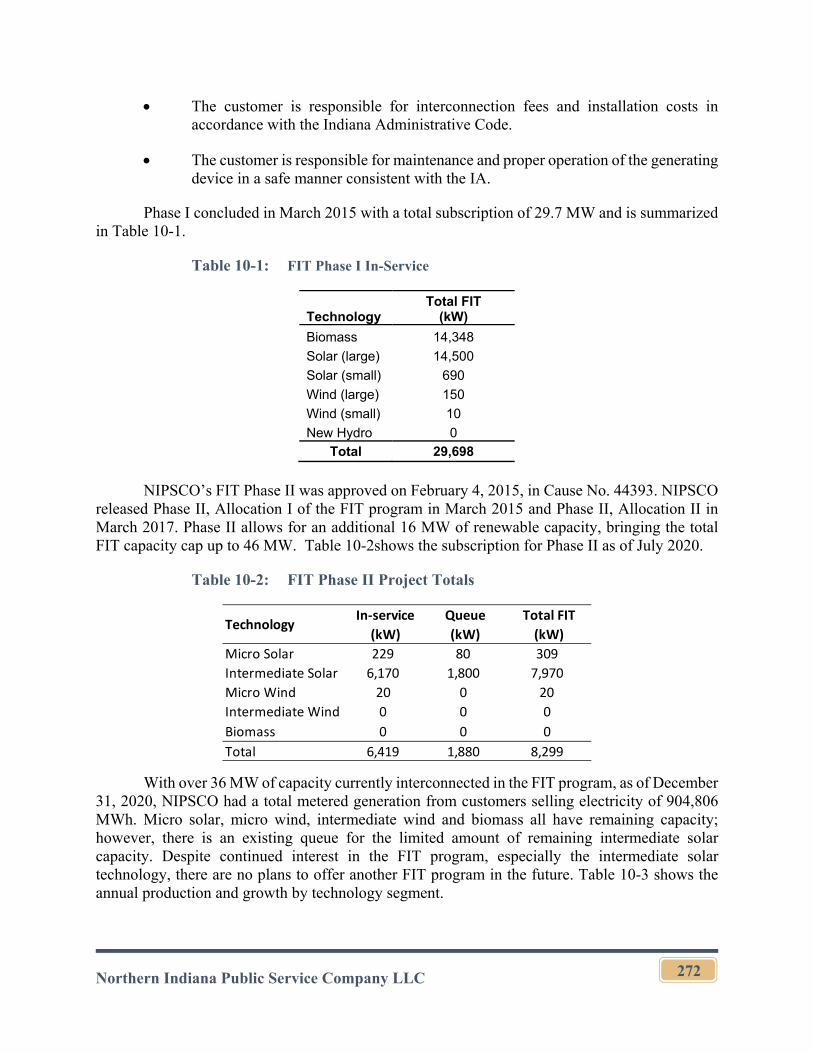
Northern Indiana Public Service Company LLC
272
The customer is responsible for interconnection fees and installation costs in accordance with the Indiana Administrative Code.
The customer is responsible for maintenance and proper operation of the generating device in a safe manner consistent with the IA.
Phase I concluded in March 2015 with a total subscription of 29.7 MW and is summarized in Table 10-1.
Table 10-1: FIT Phase I In-Service
Technology Total FIT
(kW)
Biomass 14,348
Solar (large) 14,500
Solar (small) 690
Wind (large) 150
Wind (small) 10
New Hydro 0
Total 29,698
NIPSCO’s FIT Phase II was approved on February 4, 2015, in Cause No. 44393. NIPSCO
released Phase II, Allocation I of the FIT program in March 2015 and Phase II, Allocation II in March 2017. Phase II allows for an additional 16 MW of renewable capacity, bringing the total FIT capacity cap up to 46 MW. Table 10-2shows the subscription for Phase II as of July 2020.
Table 10-2: FIT Phase II Project Totals
With over 36 MW of capacity currently interconnected in the FIT program, as of December 31, 2020, NIPSCO had a total metered generation from customers selling electricity of 904,806 MWh. Micro solar, micro wind, intermediate wind and biomass all have remaining capacity; however, there is an existing queue for the limited amount of remaining intermediate solar capacity. Despite continued interest in the FIT program, especially the intermediate solar technology, there are no plans to offer another FIT program in the future. Table 10-3 shows the annual production and growth by technology segment.
TechnologyIn‐service
(kW)
Queue
(kW)
Total FIT
(kW)
Micro Solar 229 80 309
Intermediate Solar 6,170 1,800 7,970
Micro Wind 20 0 20
Intermediate Wind 0 0 0
Biomass 0 0 0
Total 6,419 1,880 8,299
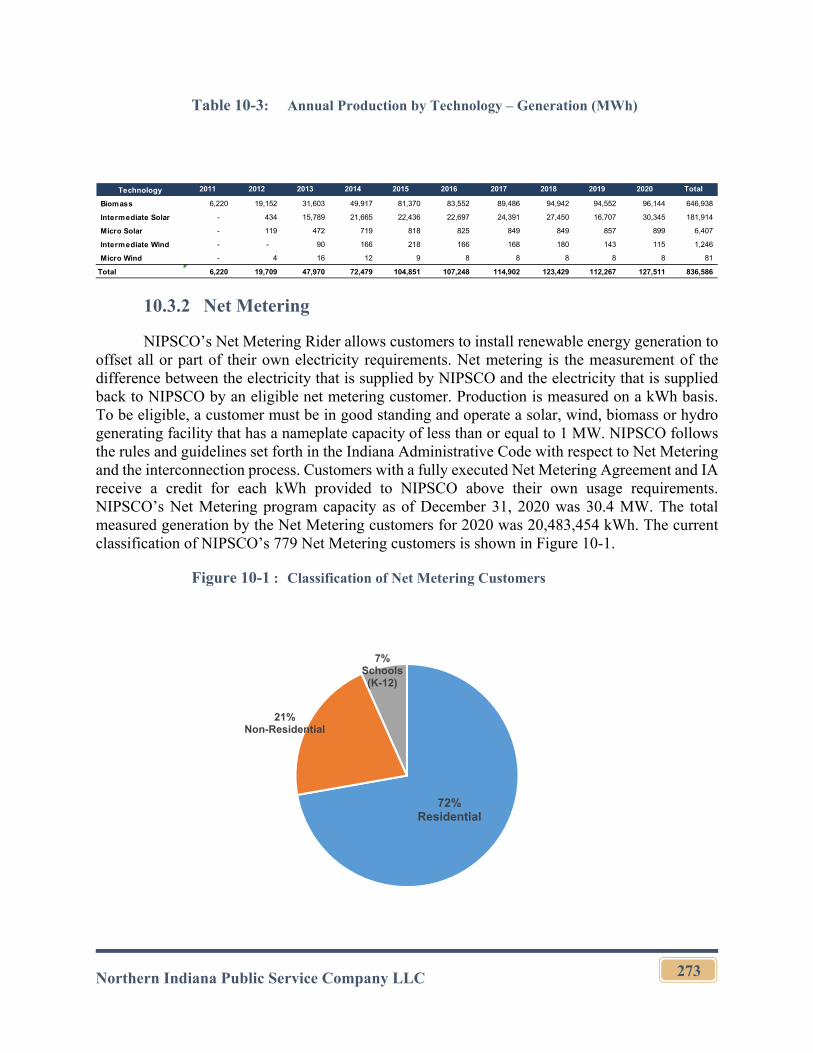
Northern Indiana Public Service Company LLC
273
Table 10-3: Annual Production by Technology – Generation (MWh)
10.3.2 Net Metering
NIPSCO’s Net Metering Rider allows customers to install renewable energy generation to offset all or part of their own electricity requirements. Net metering is the measurement of the difference between the electricity that is supplied by NIPSCO and the electricity that is supplied back to NIPSCO by an eligible net metering customer. Production is measured on a kWh basis. To be eligible, a customer must be in good standing and operate a solar, wind, biomass or hydro generating facility that has a nameplate capacity of less than or equal to 1 MW. NIPSCO follows the rules and guidelines set forth in the Indiana Administrative Code with respect to Net Metering and the interconnection process. Customers with a fully executed Net Metering Agreement and IA receive a credit for each kWh provided to NIPSCO above their own usage requirements. NIPSCO’s Net Metering program capacity as of December 31, 2020 was 30.4 MW. The total measured generation by the Net Metering customers for 2020 was 20,483,454 kWh. The current classification of NIPSCO’s 779 Net Metering customers is shown in Figure 10-1.
Figure 10-1 : Classification of Net Metering Customers
Technology 2011 2012 2013 2014 2015 2016 2017 2018 2019 2020 Total
Biomass 6,220 19,152 31,603 49,917 81,370 83,552 89,486 94,942 94,552 96,144 646,938
Intermediate Solar - 434 15,789 21,665 22,436 22,697 24,391 27,450 16,707 30,345 181,914
Micro Solar - 119 472 719 818 825 849 849 857 899 6,407
Intermediate Wind - - 90 166 218 166 168 180 143 115 1,246
Micro Wind - 4 16 12 9 8 8 8 8 8 81
Total 6,220 19,709 47,970 72,479 104,851 107,248 114,902 123,429 112,267 127,511 836,586
72%Residential
21%Non-Residential
7%Schools (K-12)
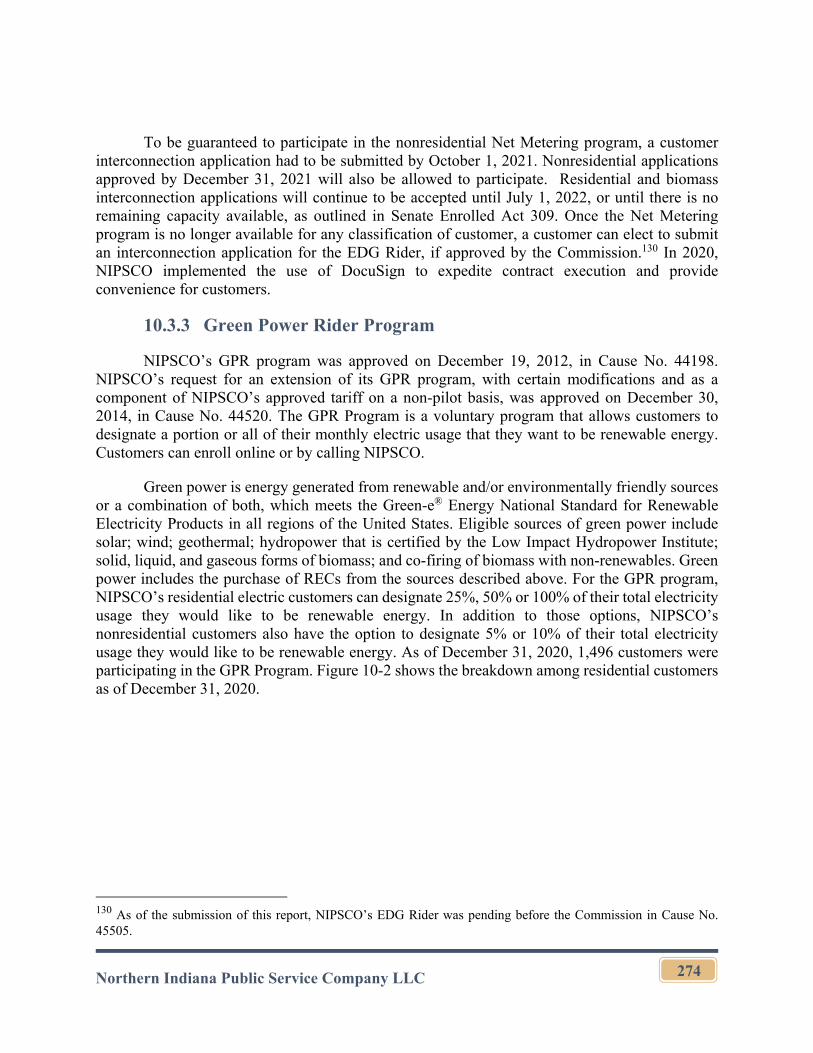
Northern Indiana Public Service Company LLC
274
To be guaranteed to participate in the nonresidential Net Metering program, a customer interconnection application had to be submitted by October 1, 2021. Nonresidential applications approved by December 31, 2021 will also be allowed to participate. Residential and biomass interconnection applications will continue to be accepted until July 1, 2022, or until there is no remaining capacity available, as outlined in Senate Enrolled Act 309. Once the Net Metering program is no longer available for any classification of customer, a customer can elect to submit an interconnection application for the EDG Rider, if approved by the Commission.130 In 2020, NIPSCO implemented the use of DocuSign to expedite contract execution and provide convenience for customers.
10.3.3 Green Power Rider Program
NIPSCO’s GPR program was approved on December 19, 2012, in Cause No. 44198. NIPSCO’s request for an extension of its GPR program, with certain modifications and as a component of NIPSCO’s approved tariff on a non-pilot basis, was approved on December 30, 2014, in Cause No. 44520. The GPR Program is a voluntary program that allows customers to designate a portion or all of their monthly electric usage that they want to be renewable energy. Customers can enroll online or by calling NIPSCO.
Green power is energy generated from renewable and/or environmentally friendly sources or a combination of both, which meets the Green-e® Energy National Standard for Renewable Electricity Products in all regions of the United States. Eligible sources of green power include solar; wind; geothermal; hydropower that is certified by the Low Impact Hydropower Institute; solid, liquid, and gaseous forms of biomass; and co-firing of biomass with non-renewables. Green power includes the purchase of RECs from the sources described above. For the GPR program, NIPSCO’s residential electric customers can designate 25%, 50% or 100% of their total electricity usage they would like to be renewable energy. In addition to those options, NIPSCO’s nonresidential customers also have the option to designate 5% or 10% of their total electricity usage they would like to be renewable energy. As of December 31, 2020, 1,496 customers were participating in the GPR Program. Figure 10-2 shows the breakdown among residential customers as of December 31, 2020.
130 As of the submission of this report, NIPSCO’s EDG Rider was pending before the Commission in Cause No. 45505.
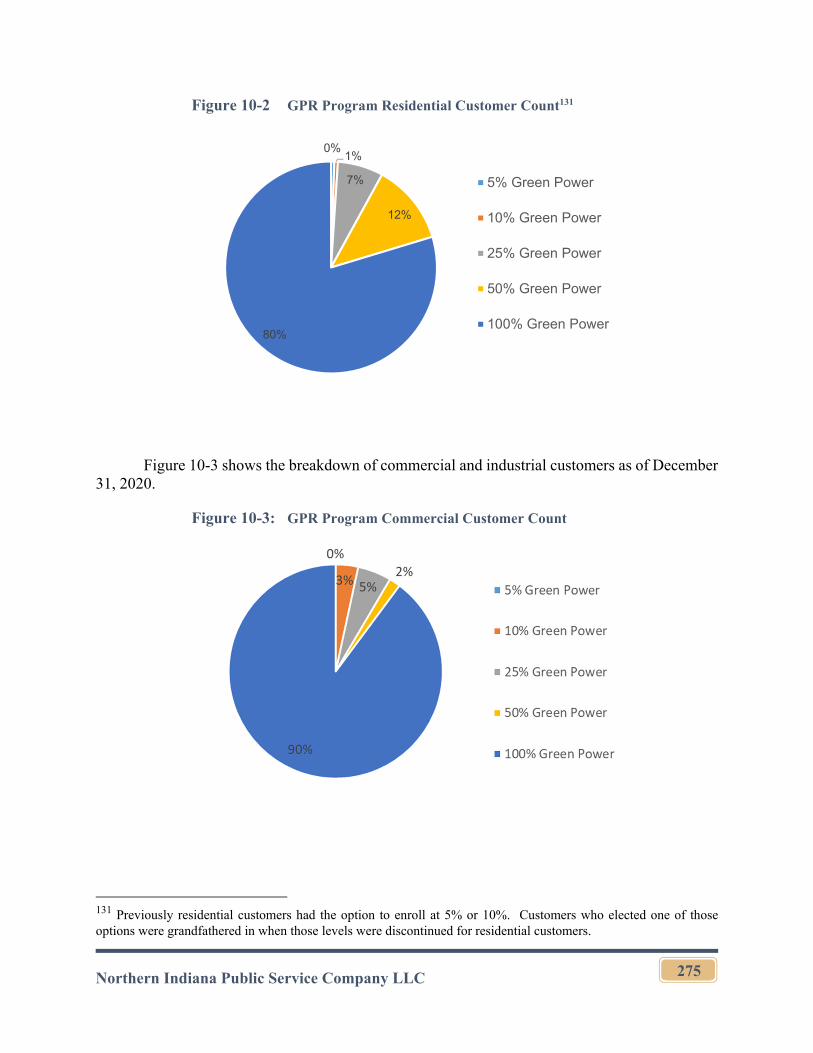
Northern Indiana Public Service Company LLC
275
Figure 10-2 GPR Program Residential Customer Count131
Figure 10-3 shows the breakdown of commercial and industrial customers as of December 31, 2020.
Figure 10-3: GPR Program Commercial Customer Count
131 Previously residential customers had the option to enroll at 5% or 10%. Customers who elected one of those options were grandfathered in when those levels were discontinued for residential customers.
0%1%
7%
12%
80%
5% Green Power
10% Green Power
25% Green Power
50% Green Power
100% Green Power
Northern Indiana Public Service Company LLC
276
NIPSCO’s GPR program for the period of January 1 through December 31, 2020, accounted for 21,308,200 kWh of energy consumption designated as green power. Residential customers accounted for 11,060,703 kWh of energy consumption, and C&I customers accounted for 10,247,497 kWh of energy consumption of designated green power. For both residential and commercial customers, the majority of the GPR program enrollments designate 100% of their energy as green power. Table 10-4 shows the energy consumption designated as Green Power for participating customers, by rate type, for the period January 1 through December 31, 2020.
Table 10-4 2020 Green Power Customers by Rate Type (kWh)
Participating customers are billed under their current applicable rates, with a separate line item showing the premium to participate in the GPR program. This premium is calculated by multiplying the GPR rate by the kWhs the customer specifies to be subject to the GPR. Table 10-5 shows the green power premiums applicable during the period January 1, 2017, through December 31, 2020.
Table 10-5: Green Power Rates
July 2017 to June 2018
July 2018 to June 2019
July 2019 to June 2020
July 2020 to June 2021
$0.002940 $0.001805 $0.001657 $0.002860
10.3.4 Transportation Decarbonization: DC Fast charging stations & IDEM Grant
The Indiana Volkswagen Environmental Mitigation Trust Fund Committee was formed to manage the disbursement of Indiana’s share of funds from the Environmental Mitigation Trust created as part of Volkswagen’s settlement of Clean Air Act violations regarding diesel emissions from its vehicles. IDEM is the lead agency for the state of Indiana’s participation in the Environmental Mitigation Trust. In late 2020, NIPSCO joined the Indiana Utility Group, a consortium of eight Indiana utilities, to apply for Electric Vehicle DC Fast Charging funding. In March 2021, the Indiana Utilities Group submitted a coordinated grant application for 61 DC fast-charging stations, 10 of which were for NIPSCO’s service territory. Along with the IDEM grant of more than $900,000, NIPSCO is investing more than $1.4 million in constructing these charging stations. NIPSCO has a goal of having all 10 stations in operation by late 2022.
January February March April May June July August September October November December Total
2020 2020 2020 2020 2020 2020 2020 2020 2020 2020 2020 2020 2020
Commercial 893,256 892,359 927,167 846,381 758,117 992,134 1,168,867 1,048,591 1,029,012 901,414 787,791 815,614 11,060,703
Residential 860,081 765,934 724,971 697,433 643,985 898,306 1,319,713 1,166,669 1,072,389 665,051 631,954 801,011 10,247,497
Total 1,753,337 1,658,293 1,652,138 1,543,814 1,402,102 1,890,440 2,488,580 2,215,260 2,101,401 1,566,465 1,419,745 1,616,625 21,308,200
Rate Type

Northern Indiana Public Service Company LLC
277
10.3.5 Advanced Metering Infrastructure
NIPSCO has proposed to implement AMI meter technology for its electric customers, and this proposal is still pending in a proceeding before the Commission.132 AMI is central to NIPSCO’s efforts to enable modern energy capabilities. These capabilities include integration of electric vehicle charging and customer-owned generation resources into the distribution grid, improved forecasting of electricity demand thus enabling better planning for the future, and access to data that helps NIPSCO to both understand impacts to and anticipate issues with the distribution system as generation technology and usage patterns evolve to maintain reliability.
10.4 Corporate Development and Community Support
10.4.1 Supporting Economic Growth
NIPSCO partners with community leaders and state, regional, and local economic development organizations to attract and support the expansion of new and existing businesses and to help create more jobs across the NIPSCO service territory. In addition to being one of the largest employers in the region, NIPSCO spends $1.1 million in economic development efforts each year, which has resulted in 85 new businesses or expansions and 8,700 local jobs in the past 10 years.
NIPSCO’s Rider 877 – Economic Development Rider offers discounts on existing tariff services for qualifying projects that bring new jobs and investment from outside the NIPSCO service territory. When coupled with local and state incentives, a powerful package is created with often positive results.
NIPSCO’s Your Energy, Your Future generation transition will help save Indiana’s businesses and families money and also make northern Indiana more economically competitive. The generation transition positions Indiana as a more attractive location to employers, as well as residents, as NIPSCO brings a sustainable balance of cleaner, lower-cost renewable energy to its portfolio. For example, in 2019, the Digital Crossroads Data Center – a more than $50 million facility bringing jobs and revenue to the area – decided to open in Hammond, Indiana. NIPSCO’s generation transition commitment was part of what attracted the business to the area, as it looked to be the most energy-efficient, lowest-latency urban data center in the United States.
10.4.2 Supplier Diversity
Cultivating a diverse pipeline of suppliers helps bring innovative ideas and processes, a competitive advantage, and other benefits to NIPSCO’s communities. NIPSCO has created a supplier diversity program that strengthens and widens the playing field for qualified suppliers who are typically underutilized in the supply chain of a large corporation.
In 2020, NIPSCO’s direct supplier spending in Indiana was $1.057 billion. Of that, $95.9 million was spent on diverse businesses and $19.6 million was spent on diverse subcontractors.
132 See Cause No. 45557, NIPSCO’s TDSIC Plan further discussed in Section 6.
Northern Indiana Public Service Company LLC
278
10.4.3 Workforce Development
NIPSCO continues to lead efforts and partnerships focused on workforce development – both for the current and future workforce generations. Some of the highlights include:
Ivy Tech Partnership for Energy Industry Training Program: This program began in 2009 and provides training in electric-line, power plant technology, and gas technology areas. NIPSCO has hired more than 60 students from the program, and graduates are guaranteed an interview opportunity. Additionally, NIPSCO provides instructors for these training classes and, in 2017, provided a full-scale electric distribution system for training purposes built within the Ivy Tech Valparaiso campus energy technology lab – the only such facility in an educational setting in Indiana. NIPSCO is currently working with Ivy Tech to review the entire program and update the curriculum to meet the training needs for renewable energy generation operation and maintenance.
NIPSCO Energy Academy: Started in 2014, the NIPSCO Energy Academy program is a partnership designed to prepare area students for high-demand jobs in the electronics, energy, and utility industries. It is the first initiative of its kind in Indiana, and it will serve students from Michigan City High School, LaPorte High School, New Prairie High School, South Central High School, LaCrosse High School, and Westville High School. More than 100 students that have gone through the program. NIPSCO is currently looking to add a similar Energy Academy in Lake County.
IN-POWER Youth Mentoring Program: In 2010, NIPSCO introduced the IN-POWER Youth Mentoring Program – a unique mentoring program for local high school students that takes a holistic approach to developing a more highly skilled future workforce in the energy sector. The program was expanded with IN-POWER STEM PLUS, designed to give 7th and 8th grade students a firsthand experience on gas and electric safety while teaching them about the various aspects of STEM needed in the energy sector. NIPSCO employees and American Association of Blacks in Energy Indiana members serve as mentors and instructors. Participants receive college credits, unique mentoring and internships, among other opportunities.
NIPSCO Energy Ambassador Program: The NIPSCO Energy Ambassador program, in partnership with the Urban League, is a college- and career- readiness program initiated in 2019. This opportunity invites 11th and 12th grade students throughout northwest Indiana to participate in virtual workshops and activities designed to educate students about NIPSCO’s operations and encourage STEM learning. In this, the program’s third year, NIPSCO donated $60,000 to the Urban League to support the 2021 summer internship. Other goals of the program include reducing social-emotional barriers for students, increasing students’ interest in STEM careers, boosting self-esteem and supporting educations goals. Approximately 45 students participate annually and:
Northern Indiana Public Service Company LLC
279
o Receive informational training from NIPSCO representatives
o Disseminate NIPSCO customer-centric information to their respective communities to provide awareness
o Participate in career exploration experiences
o Participate in community service outreach activities
o Attend workshops to become college or career ready
JA Support: NIPSCO provides annual support for classroom business education programs through both contributions and volunteer instructors across NIPSCO’s service area. For the past several years, NIPSCO has supported a “JA Day” in a local Hammond and East Chicago school systems. In 2021, NIPSCO partnered with JA to offer a virtual platform that taught participating students about different job sectors.
City of Gary Summer of Opportunity Job Program: The Summer of Opportunity places youth in meaningful work opportunities throughout Gary, with lunch-and-learn workshops featuring local professionals, with every other session focusing on financial literacy. Local youth staff six summer program sites that offer summer meals and learning. NIPSCO partners with the mayor’s office, Gary Youth Services Bureau, Urban League, and the Gary Chamber of Commerce to create a set of supports that enable strong transitions from school year to school year and from high school to college and career.
Girl Scouts Engineering Day: For more than five years, NIPSCO has hosted approximately 125 girls from kindergarten to 4th grade for the annual Introduce a Girl to Engineering Day. The girls come from local Girl Scout troops along with some young relatives of NIPSCO and NiSource employees. The four-hour event is part of the company’s efforts to help build the next generation of female leaders, support local communities and provide opportunities for local students interested in STEM-related careers. The event is organized by the employee resource group Developing and Advancing Women (DAWN) at NiSource.
On My Way Pre-K: NIPSCO was a lead sponsor of the Pilot Pre-K Program, which began in 2016, and has been shown to be a successful early education program to improve children’s chances of being ready to learn when they reach kindergarten and throughout their educational experiences, a key factor in breaking the cycle of poverty.
10.4.4 Corporate Citizenship
NIPSCO believes that reinvesting in the communities where its employees live and work will enhance the quality of life for everyone. Each year, NIPSCO donates time, money, and other
Northern Indiana Public Service Company LLC
280
resources to hundreds of local philanthropic programs and organizations across its 30-county service area, focusing on:
Safety
Economic and workforce development
Environmental stewardship
STEM and energy education
Basic needs and hardship assistance
Through these programs and partnerships, NIPSCO is working hard with its communities to build a brighter future for years to come.
In 2020, NIPSCO and the NiSource Charitable Foundation contributed approximately $1 million to local organizations throughout the NIPSCO service territory.
A highlight of that effort includes NIPSCO’s annual Charity of Choice campaign, during which employees select one nonprofit organization or an area of need to support. Fundraisers, volunteerism, and other activities are planned throughout a summer-long, employee-led campaign. Recent benefactors and causes selected by employees have included autism, veterans, Boys & Girls Clubs, the American Heart Association, the American Red Cross, and organizations supporting the community through the COVID-19 pandemic. The 2021 Charity of Choice campaign supported mental health awareness and education.
10.4.5 Volunteerism
NIPSCO employees have a passion for volunteering and giving back to their local communities. Through a program called Dollars for Doers, cultivated by NIPSCO’s parent company, NiSource Inc., employees translate their community service into financial support for organizations they care about most. The program contributes up to $500 per employee to an organization in return for volunteer time. In 2019, NIPSCO employees volunteered more than 2,100 hours, which resulted in more than $56,000 of contribution to local organizations. In 2020, while the COVID-19 pandemic limited how NIPSCO employees could safely volunteer time across the service area, NIPSCO employees contributed more than 1,000 volunteer hours, equating to an additional impact of $30,953 to various charities.
Additionally, NIPSCO employees volunteer their personal time and resources with more than 100 local nonprofit boards, local associations and other local community efforts each year.
Northern Indiana Public Service Company LLC
281
Section 11. Compliance with IRP Rule
Rule Section(s)
170 IAC 4-7-2: Integrated Resource Plan Submission
(d) On or before the applicable date, a utility subject to subsection (a) or (b) must submit electronically to the director or through an electronic filing system if requested by the director, the following documents:
(1) The integrated resource plan.
Submitted via email on November 15, 2021
(2) A technical appendix containing supporting documentation sufficient to allow an interested party to evaluate the assumptions in the IRP.
Confidential Appendix D
(3) An IRP summary that communicates core IRP concepts and results to non-technical audiences in a simplified format using visual elements where appropriate. The IRP summary shall include, but is not limited to, the following:
(A) A brief description of the utility’s: (i) existing resources; (ii) preferred resource portfolio; (iii) key factors influencing the preferred resource
portfolio; (iv) short term action plan; (v) the IRP public advisory process; and (vi) any additional details the commission staff may
request. (B) A simplified discussion of resource types and load
characteristics. The utility shall make the IRP summary readily accessible on its
website.
Executive Summary
(e) Contemporaneously with the submission of an IRP, a utility shall provide to the director the following:
(1) The name and address of each known entity considered by the utility to be an interested party.
(2) A statement that the utility has sent each known interested party, electronically or by deposit in the United States mail, First Class postage prepaid, a notice of the utility’s submission of the IRP to the commission. The notice must include the following information:
(A) A general description of the subject matter of the submitted IRP.
(B) A statement that the commission invites interested parties to submit written comments on the utility’s IRP within 90 days of the IRP submittal.
Transmittal Letter
Northern Indiana Public Service Company LLC
282
Rule Section(s)
An interested party includes any business, organization, or customer that participated in the utility’s previous public advisory process. A utility is not required to separately notify all of its customers.
(3) A statement that the utility has served a copy of the documents submitted under subsection (d) above on the office of the consumer counselor.
170 IAC 4-7-2.6: Public Advisory Process
(a) The following utilities are exempt from this section: (1) A municipally owned utility; (2) A cooperatively owned utility; and (3) A utility submitting an IRP under subsection 2(b) of this rule.
(b) The utility shall provide information requested by an interested party relating to the development of the utility’s IRP.
(c) The utility shall solicit, consider, and timely respond to all relevant input relating to the development of the utility’s IRP provided by interested parties, the commission, and its staff.
(d) The utility retains full responsibility for the content of its IRP.
N/A
(e) The utility shall conduct a public advisory process as follows: (1) Prior to submitting its IRP to the commission, the utility shall
hold at least three meetings, a majority of which shall be held in the utility’s service territory. The topics discussed in the meetings shall include, but not be limited to, the following:
(A) An introduction to the IRP and public advisory process. (B) The utility’s load forecast. (C) Evaluation of existing resources. (D) Evaluation of supply and demand-side resource
alternatives, including: (i) associated costs; (ii) quantifiable energy and non-energy benefits; and (iii) performance attributes.
(E) Modeling methods. (F) Modeling inputs. (G) Treatment of risk and uncertainty. (H) Discussion seeking input on its candidate resource
portfolios. (I) The utility’s scenarios and sensitivities. (J) Discussion of the utility’s preferred resource portfolio
and its rationale. (2) The utility is encouraged to hold additional meetings as
appropriate. (3) The schedule for meetings shall be determined by the utility
and shall:
Section 2.1 Appendix A
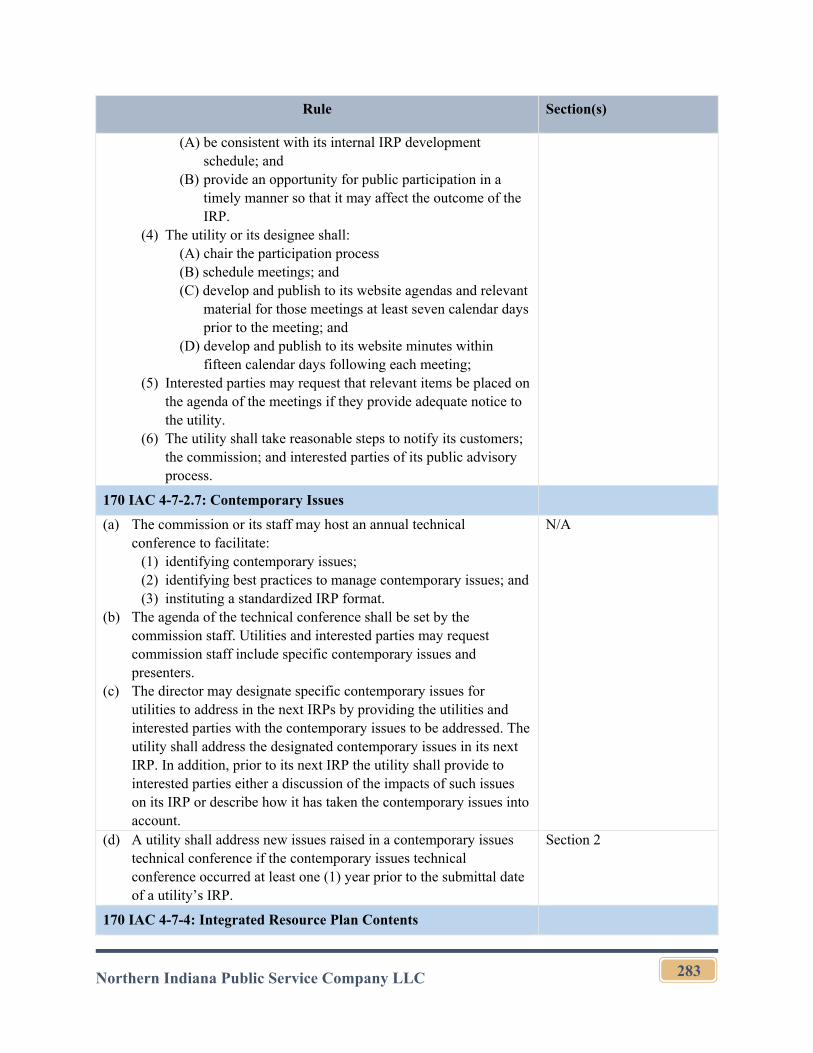
Northern Indiana Public Service Company LLC
283
Rule Section(s)
(A) be consistent with its internal IRP development schedule; and
(B) provide an opportunity for public participation in a timely manner so that it may affect the outcome of the IRP.
(4) The utility or its designee shall: (A) chair the participation process (B) schedule meetings; and (C) develop and publish to its website agendas and relevant
material for those meetings at least seven calendar days prior to the meeting; and
(D) develop and publish to its website minutes within fifteen calendar days following each meeting;
(5) Interested parties may request that relevant items be placed on the agenda of the meetings if they provide adequate notice to the utility.
(6) The utility shall take reasonable steps to notify its customers; the commission; and interested parties of its public advisory process.
170 IAC 4-7-2.7: Contemporary Issues
(a) The commission or its staff may host an annual technical conference to facilitate:
(1) identifying contemporary issues; (2) identifying best practices to manage contemporary issues; and (3) instituting a standardized IRP format.
(b) The agenda of the technical conference shall be set by the commission staff. Utilities and interested parties may request commission staff include specific contemporary issues and presenters.
(c) The director may designate specific contemporary issues for utilities to address in the next IRPs by providing the utilities and interested parties with the contemporary issues to be addressed. The utility shall address the designated contemporary issues in its next IRP. In addition, prior to its next IRP the utility shall provide to interested parties either a discussion of the impacts of such issues on its IRP or describe how it has taken the contemporary issues into account.
N/A
(d) A utility shall address new issues raised in a contemporary issues technical conference if the contemporary issues technical conference occurred at least one (1) year prior to the submittal date of a utility’s IRP.
Section 2
170 IAC 4-7-4: Integrated Resource Plan Contents
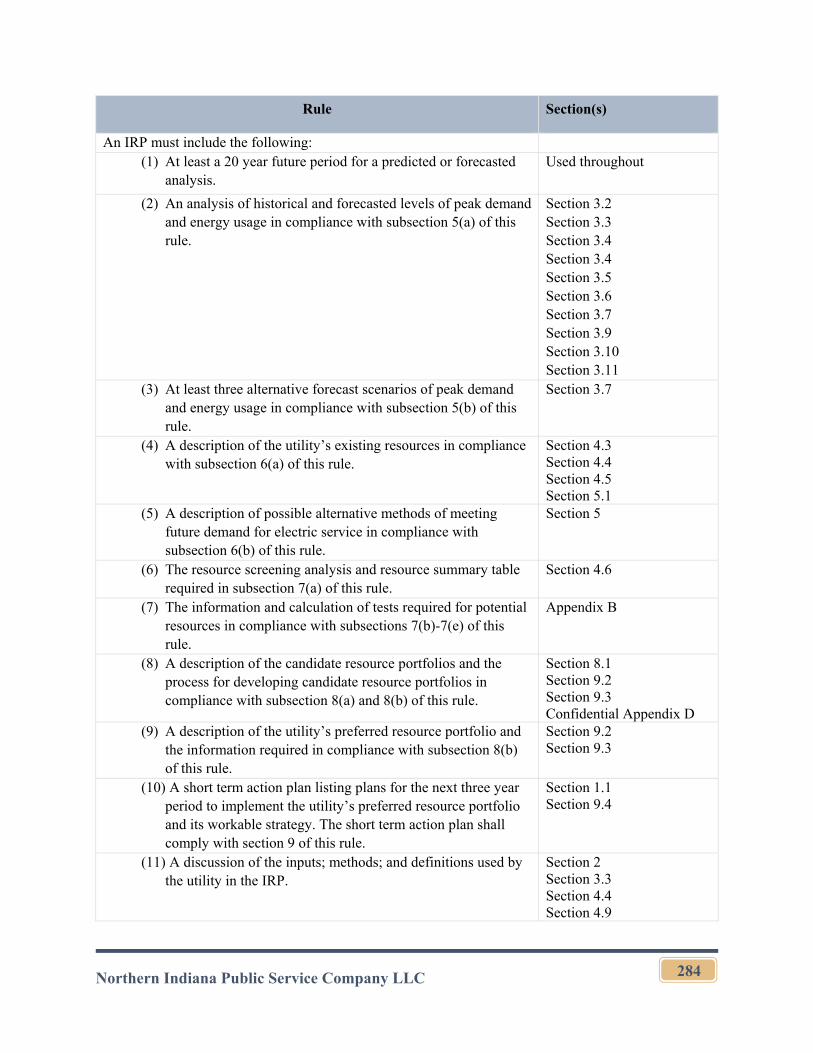
Northern Indiana Public Service Company LLC
284
Rule Section(s)
An IRP must include the following: (1) At least a 20 year future period for a predicted or forecasted
analysis. Used throughout
(2) An analysis of historical and forecasted levels of peak demand and energy usage in compliance with subsection 5(a) of this rule.
Section 3.2 Section 3.3 Section 3.4 Section 3.4 Section 3.5 Section 3.6 Section 3.7 Section 3.9 Section 3.10 Section 3.11
(3) At least three alternative forecast scenarios of peak demand and energy usage in compliance with subsection 5(b) of this rule.
Section 3.7
(4) A description of the utility’s existing resources in compliance with subsection 6(a) of this rule.
Section 4.3 Section 4.4 Section 4.5 Section 5.1
(5) A description of possible alternative methods of meeting future demand for electric service in compliance with subsection 6(b) of this rule.
Section 5
(6) The resource screening analysis and resource summary table required in subsection 7(a) of this rule.
Section 4.6
(7) The information and calculation of tests required for potential resources in compliance with subsections 7(b)-7(e) of this rule.
Appendix B
(8) A description of the candidate resource portfolios and the process for developing candidate resource portfolios in compliance with subsection 8(a) and 8(b) of this rule.
Section 8.1 Section 9.2 Section 9.3 Confidential Appendix D
(9) A description of the utility’s preferred resource portfolio and the information required in compliance with subsection 8(b) of this rule.
Section 9.2 Section 9.3
(10) A short term action plan listing plans for the next three year period to implement the utility’s preferred resource portfolio and its workable strategy. The short term action plan shall comply with section 9 of this rule.
Section 1.1 Section 9.4
(11) A discussion of the inputs; methods; and definitions used by the utility in the IRP.
Section 2 Section 3.3 Section 4.4 Section 4.9
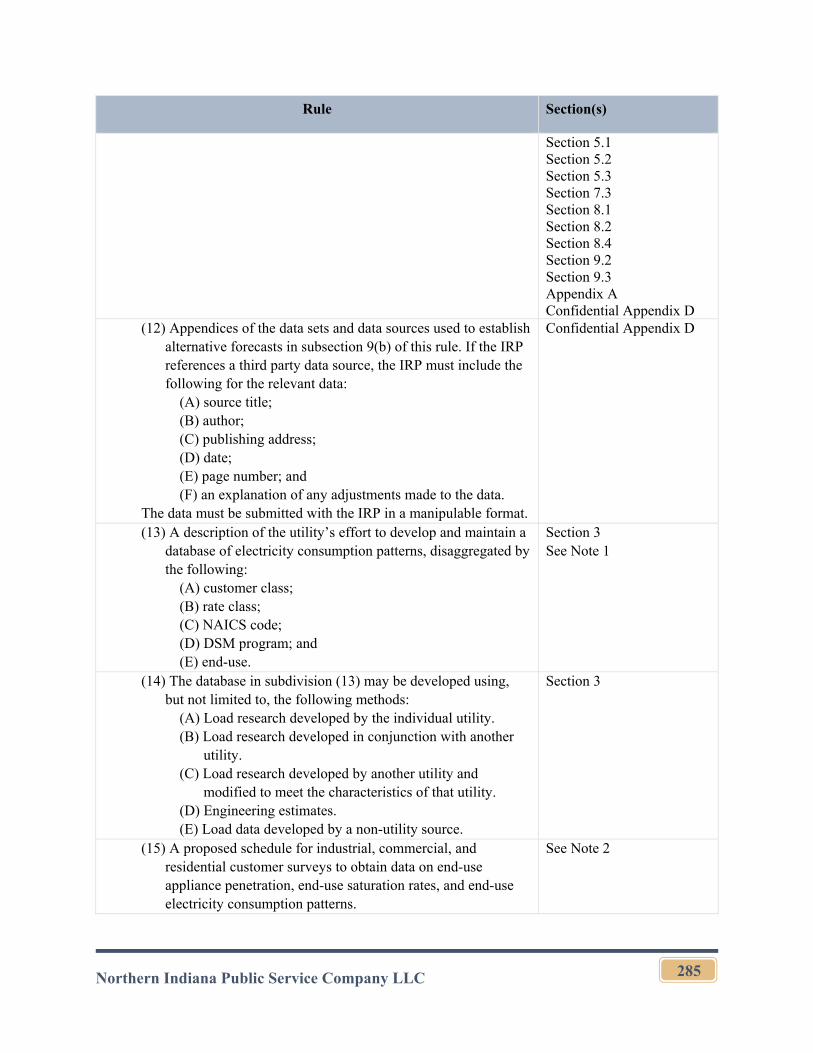
Northern Indiana Public Service Company LLC
285
Rule Section(s)
Section 5.1 Section 5.2 Section 5.3 Section 7.3 Section 8.1 Section 8.2 Section 8.4 Section 9.2 Section 9.3 Appendix A Confidential Appendix D
(12) Appendices of the data sets and data sources used to establish alternative forecasts in subsection 9(b) of this rule. If the IRP references a third party data source, the IRP must include the following for the relevant data:
(A) source title; (B) author; (C) publishing address; (D) date; (E) page number; and (F) an explanation of any adjustments made to the data.
The data must be submitted with the IRP in a manipulable format.
Confidential Appendix D
(13) A description of the utility’s effort to develop and maintain a database of electricity consumption patterns, disaggregated by the following:
(A) customer class; (B) rate class; (C) NAICS code; (D) DSM program; and (E) end-use.
Section 3 See Note 1
(14) The database in subdivision (13) may be developed using, but not limited to, the following methods:
(A) Load research developed by the individual utility. (B) Load research developed in conjunction with another
utility. (C) Load research developed by another utility and
modified to meet the characteristics of that utility. (D) Engineering estimates. (E) Load data developed by a non-utility source.
Section 3
(15) A proposed schedule for industrial, commercial, and residential customer surveys to obtain data on end-use appliance penetration, end-use saturation rates, and end-use electricity consumption patterns.
See Note 2
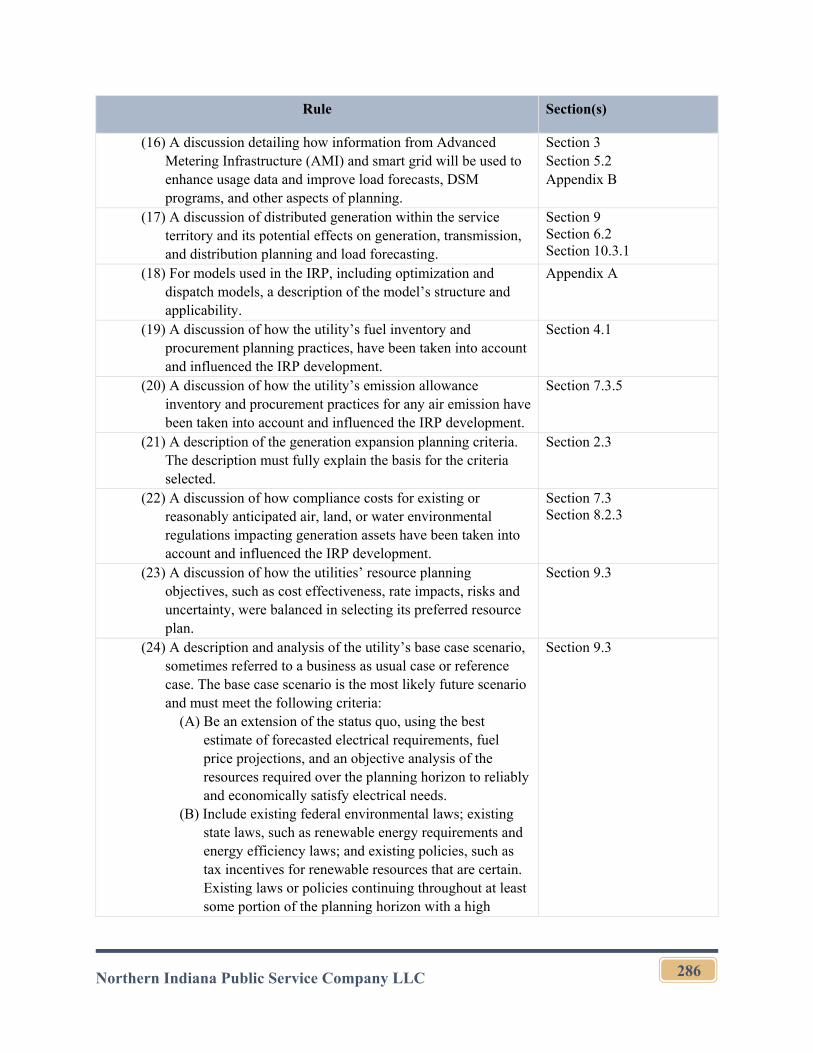
Northern Indiana Public Service Company LLC
286
Rule Section(s)
(16) A discussion detailing how information from Advanced Metering Infrastructure (AMI) and smart grid will be used to enhance usage data and improve load forecasts, DSM programs, and other aspects of planning.
Section 3 Section 5.2 Appendix B
(17) A discussion of distributed generation within the service territory and its potential effects on generation, transmission, and distribution planning and load forecasting.
Section 9 Section 6.2 Section 10.3.1
(18) For models used in the IRP, including optimization and dispatch models, a description of the model’s structure and applicability.
Appendix A
(19) A discussion of how the utility’s fuel inventory and procurement planning practices, have been taken into account and influenced the IRP development.
Section 4.1
(20) A discussion of how the utility’s emission allowance inventory and procurement practices for any air emission have been taken into account and influenced the IRP development.
Section 7.3.5
(21) A description of the generation expansion planning criteria. The description must fully explain the basis for the criteria selected.
Section 2.3
(22) A discussion of how compliance costs for existing or reasonably anticipated air, land, or water environmental regulations impacting generation assets have been taken into account and influenced the IRP development.
Section 7.3 Section 8.2.3
(23) A discussion of how the utilities’ resource planning objectives, such as cost effectiveness, rate impacts, risks and uncertainty, were balanced in selecting its preferred resource plan.
Section 9.3
(24) A description and analysis of the utility’s base case scenario, sometimes referred to a business as usual case or reference case. The base case scenario is the most likely future scenario and must meet the following criteria:
(A) Be an extension of the status quo, using the best estimate of forecasted electrical requirements, fuel price projections, and an objective analysis of the resources required over the planning horizon to reliably and economically satisfy electrical needs.
(B) Include existing federal environmental laws; existing state laws, such as renewable energy requirements and energy efficiency laws; and existing policies, such as tax incentives for renewable resources that are certain. Existing laws or policies continuing throughout at least some portion of the planning horizon with a high
Section 9.3
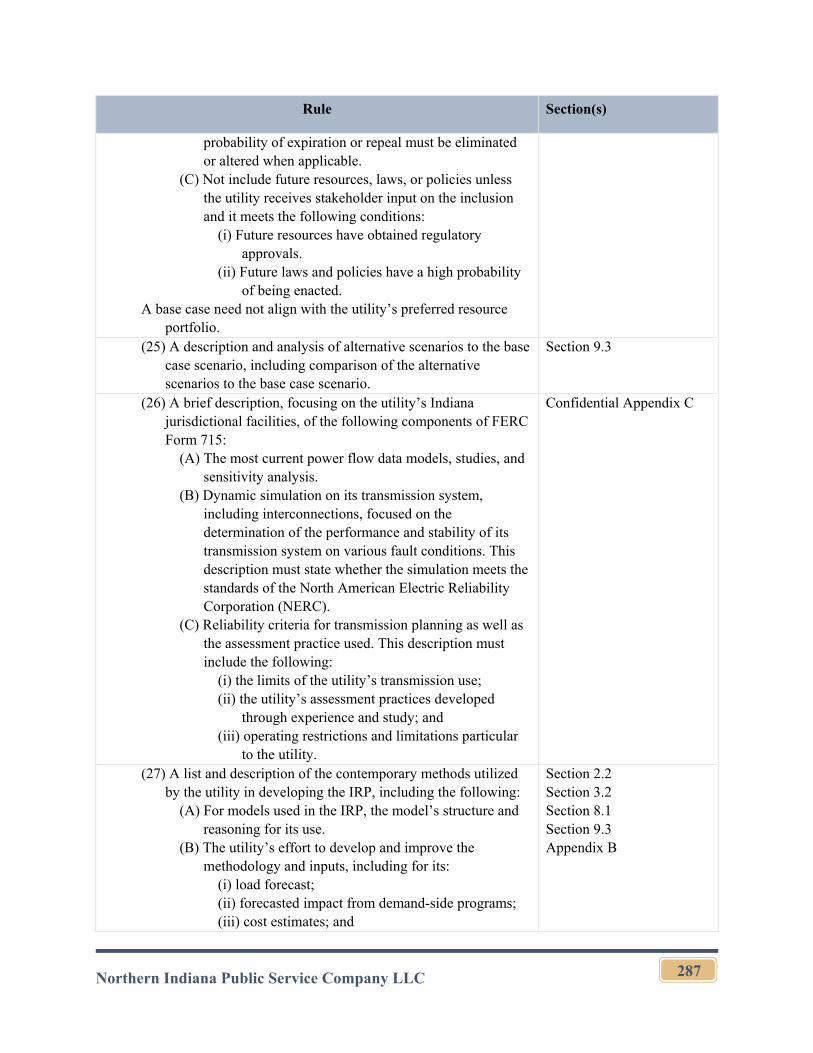
Northern Indiana Public Service Company LLC
287
Rule Section(s)
probability of expiration or repeal must be eliminated or altered when applicable.
(C) Not include future resources, laws, or policies unless the utility receives stakeholder input on the inclusion and it meets the following conditions:
(i) Future resources have obtained regulatory approvals.
(ii) Future laws and policies have a high probability of being enacted.
A base case need not align with the utility’s preferred resource portfolio.
(25) A description and analysis of alternative scenarios to the base case scenario, including comparison of the alternative scenarios to the base case scenario.
Section 9.3
(26) A brief description, focusing on the utility’s Indiana jurisdictional facilities, of the following components of FERC Form 715:
(A) The most current power flow data models, studies, and sensitivity analysis.
(B) Dynamic simulation on its transmission system, including interconnections, focused on the determination of the performance and stability of its transmission system on various fault conditions. This description must state whether the simulation meets the standards of the North American Electric Reliability Corporation (NERC).
(C) Reliability criteria for transmission planning as well as the assessment practice used. This description must include the following:
(i) the limits of the utility’s transmission use; (ii) the utility’s assessment practices developed
through experience and study; and (iii) operating restrictions and limitations particular
to the utility.
Confidential Appendix C
(27) A list and description of the contemporary methods utilized by the utility in developing the IRP, including the following:
(A) For models used in the IRP, the model’s structure and reasoning for its use.
(B) The utility’s effort to develop and improve the methodology and inputs, including for its:
(i) load forecast; (ii) forecasted impact from demand-side programs; (iii) cost estimates; and
Section 2.2 Section 3.2 Section 8.1 Section 9.3 Appendix B
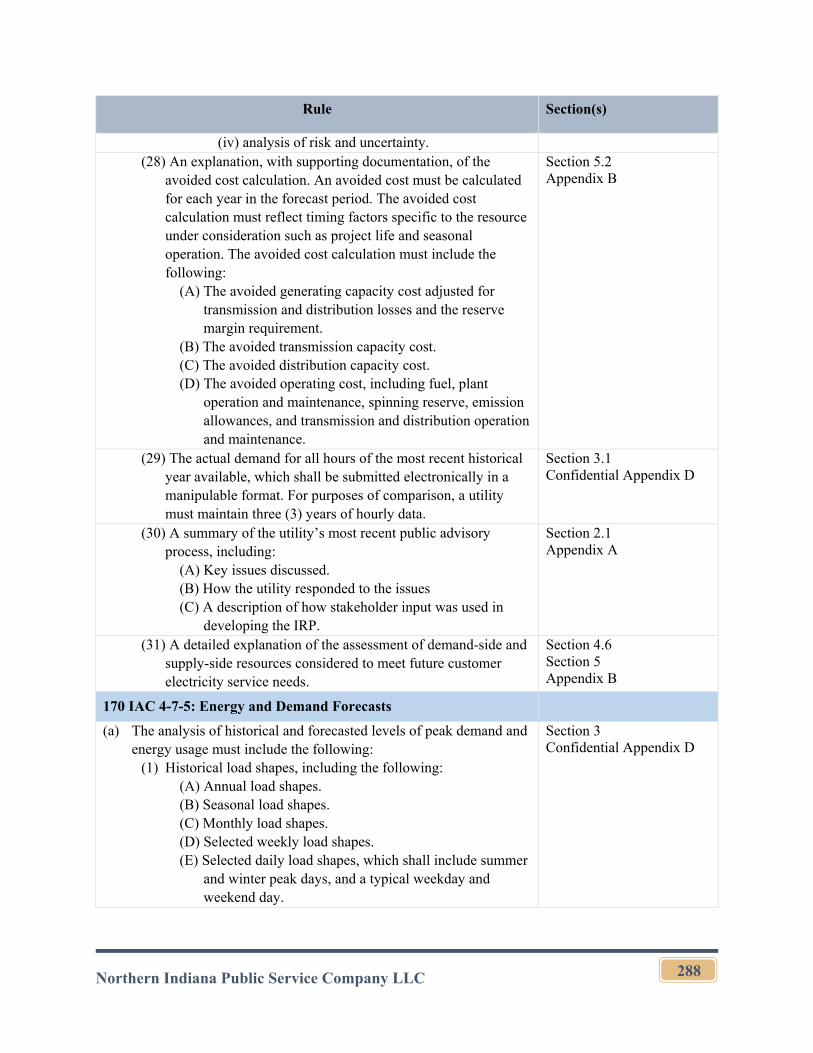
Northern Indiana Public Service Company LLC
288
Rule Section(s)
(iv) analysis of risk and uncertainty. (28) An explanation, with supporting documentation, of the
avoided cost calculation. An avoided cost must be calculated for each year in the forecast period. The avoided cost calculation must reflect timing factors specific to the resource under consideration such as project life and seasonal operation. The avoided cost calculation must include the following:
(A) The avoided generating capacity cost adjusted for transmission and distribution losses and the reserve margin requirement.
(B) The avoided transmission capacity cost. (C) The avoided distribution capacity cost. (D) The avoided operating cost, including fuel, plant
operation and maintenance, spinning reserve, emission allowances, and transmission and distribution operation and maintenance.
Section 5.2 Appendix B
(29) The actual demand for all hours of the most recent historical year available, which shall be submitted electronically in a manipulable format. For purposes of comparison, a utility must maintain three (3) years of hourly data.
Section 3.1 Confidential Appendix D
(30) A summary of the utility’s most recent public advisory process, including:
(A) Key issues discussed. (B) How the utility responded to the issues (C) A description of how stakeholder input was used in
developing the IRP.
Section 2.1 Appendix A
(31) A detailed explanation of the assessment of demand-side and supply-side resources considered to meet future customer electricity service needs.
Section 4.6 Section 5 Appendix B
170 IAC 4-7-5: Energy and Demand Forecasts
(a) The analysis of historical and forecasted levels of peak demand and energy usage must include the following:
(1) Historical load shapes, including the following: (A) Annual load shapes. (B) Seasonal load shapes. (C) Monthly load shapes. (D) Selected weekly load shapes. (E) Selected daily load shapes, which shall include summer
and winter peak days, and a typical weekday and weekend day.
Section 3 Confidential Appendix D
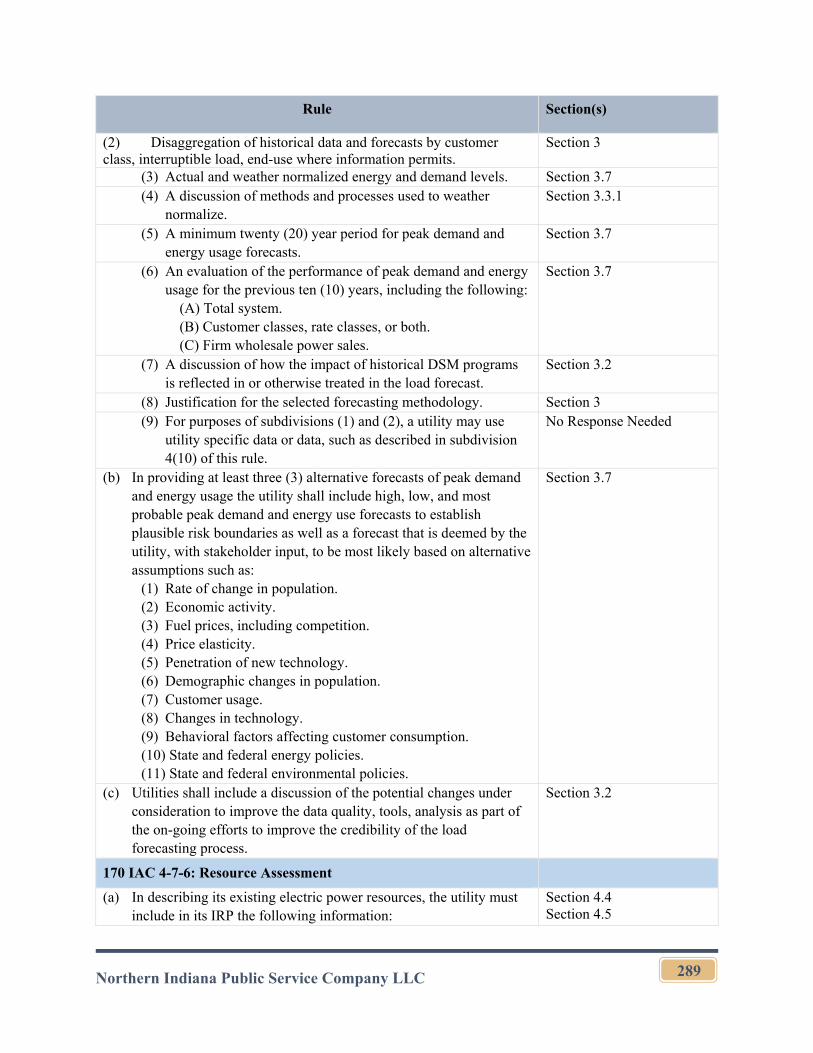
Northern Indiana Public Service Company LLC
289
Rule Section(s)
(2) Disaggregation of historical data and forecasts by customer class, interruptible load, end-use where information permits.
Section 3
(3) Actual and weather normalized energy and demand levels. Section 3.7 (4) A discussion of methods and processes used to weather
normalize. Section 3.3.1
(5) A minimum twenty (20) year period for peak demand and energy usage forecasts.
Section 3.7
(6) An evaluation of the performance of peak demand and energy usage for the previous ten (10) years, including the following:
(A) Total system. (B) Customer classes, rate classes, or both. (C) Firm wholesale power sales.
Section 3.7
(7) A discussion of how the impact of historical DSM programs is reflected in or otherwise treated in the load forecast.
Section 3.2
(8) Justification for the selected forecasting methodology. Section 3 (9) For purposes of subdivisions (1) and (2), a utility may use
utility specific data or data, such as described in subdivision 4(10) of this rule.
No Response Needed
(b) In providing at least three (3) alternative forecasts of peak demand and energy usage the utility shall include high, low, and most probable peak demand and energy use forecasts to establish plausible risk boundaries as well as a forecast that is deemed by the utility, with stakeholder input, to be most likely based on alternative assumptions such as:
(1) Rate of change in population. (2) Economic activity. (3) Fuel prices, including competition. (4) Price elasticity. (5) Penetration of new technology. (6) Demographic changes in population. (7) Customer usage. (8) Changes in technology. (9) Behavioral factors affecting customer consumption. (10) State and federal energy policies. (11) State and federal environmental policies.
Section 3.7
(c) Utilities shall include a discussion of the potential changes under consideration to improve the data quality, tools, analysis as part of the on-going efforts to improve the credibility of the load forecasting process.
Section 3.2
170 IAC 4-7-6: Resource Assessment
(a) In describing its existing electric power resources, the utility must include in its IRP the following information:
Section 4.4 Section 4.5
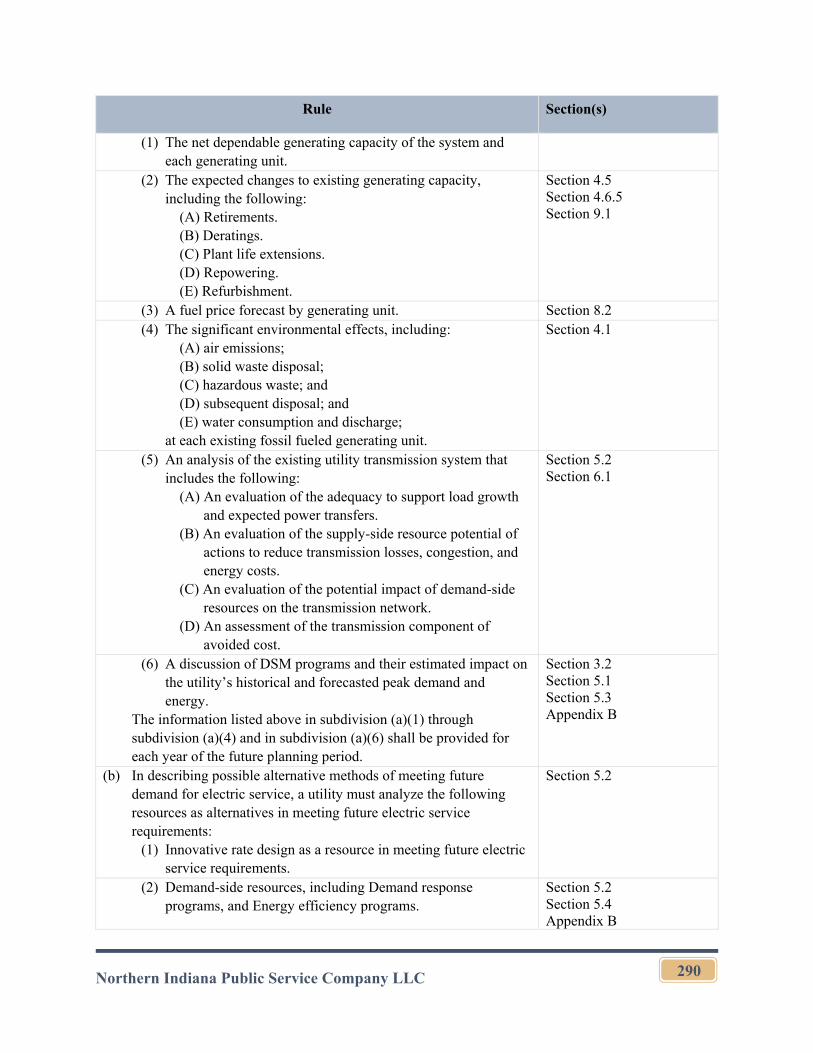
Northern Indiana Public Service Company LLC
290
Rule Section(s)
(1) The net dependable generating capacity of the system and each generating unit.
(2) The expected changes to existing generating capacity, including the following:
(A) Retirements. (B) Deratings. (C) Plant life extensions. (D) Repowering. (E) Refurbishment.
Section 4.5 Section 4.6.5 Section 9.1
(3) A fuel price forecast by generating unit. Section 8.2 (4) The significant environmental effects, including:
(A) air emissions; (B) solid waste disposal; (C) hazardous waste; and (D) subsequent disposal; and (E) water consumption and discharge;
at each existing fossil fueled generating unit.
Section 4.1
(5) An analysis of the existing utility transmission system that includes the following:
(A) An evaluation of the adequacy to support load growth and expected power transfers.
(B) An evaluation of the supply-side resource potential of actions to reduce transmission losses, congestion, and energy costs.
(C) An evaluation of the potential impact of demand-side resources on the transmission network.
(D) An assessment of the transmission component of avoided cost.
Section 5.2 Section 6.1
(6) A discussion of DSM programs and their estimated impact on the utility’s historical and forecasted peak demand and energy.
The information listed above in subdivision (a)(1) through subdivision (a)(4) and in subdivision (a)(6) shall be provided for each year of the future planning period.
Section 3.2 Section 5.1 Section 5.3 Appendix B
(b) In describing possible alternative methods of meeting future demand for electric service, a utility must analyze the following resources as alternatives in meeting future electric service requirements:
(1) Innovative rate design as a resource in meeting future electric service requirements.
Section 5.2
(2) Demand-side resources, including Demand response programs, and Energy efficiency programs.
Section 5.2 Section 5.4 Appendix B
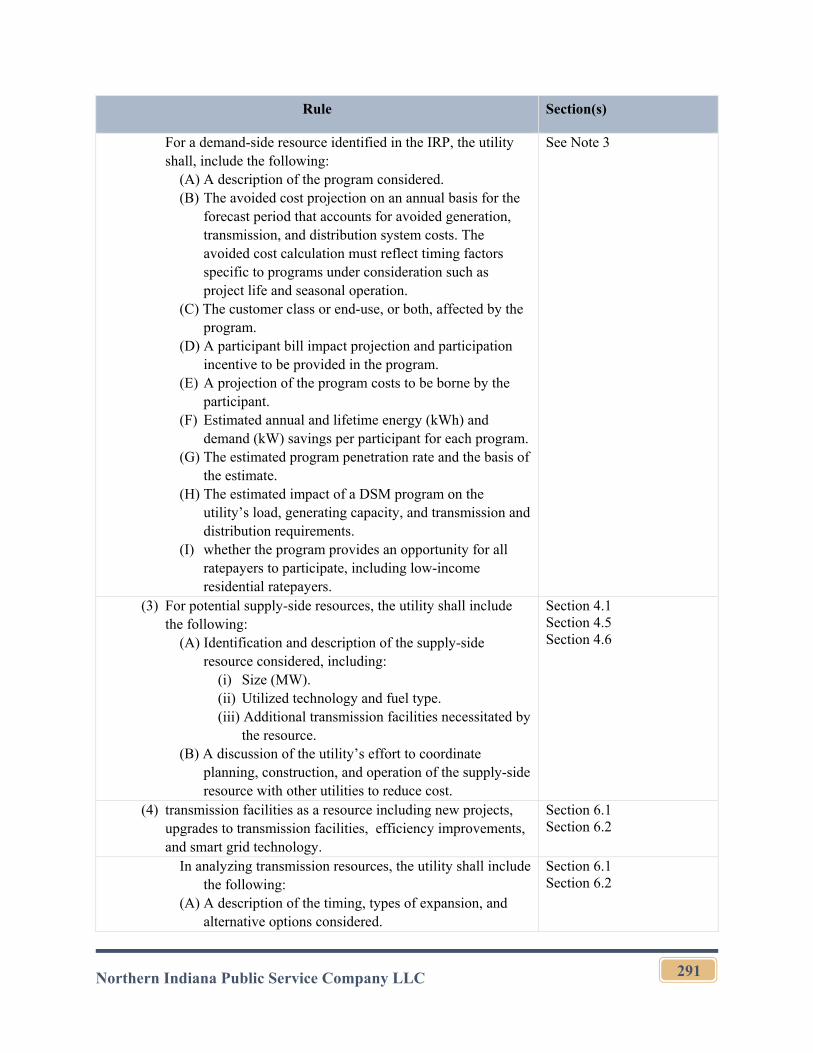
Northern Indiana Public Service Company LLC
291
Rule Section(s)
For a demand-side resource identified in the IRP, the utility shall, include the following:
(A) A description of the program considered. (B) The avoided cost projection on an annual basis for the
forecast period that accounts for avoided generation, transmission, and distribution system costs. The avoided cost calculation must reflect timing factors specific to programs under consideration such as project life and seasonal operation.
(C) The customer class or end-use, or both, affected by the program.
(D) A participant bill impact projection and participation incentive to be provided in the program.
(E) A projection of the program costs to be borne by the participant.
(F) Estimated annual and lifetime energy (kWh) and demand (kW) savings per participant for each program.
(G) The estimated program penetration rate and the basis of the estimate.
(H) The estimated impact of a DSM program on the utility’s load, generating capacity, and transmission and distribution requirements.
(I) whether the program provides an opportunity for all ratepayers to participate, including low-income residential ratepayers.
See Note 3
(3) For potential supply-side resources, the utility shall include the following:
(A) Identification and description of the supply-side resource considered, including:
(i) Size (MW). (ii) Utilized technology and fuel type. (iii) Additional transmission facilities necessitated by
the resource. (B) A discussion of the utility’s effort to coordinate
planning, construction, and operation of the supply-side resource with other utilities to reduce cost.
Section 4.1 Section 4.5 Section 4.6
(4) transmission facilities as a resource including new projects, upgrades to transmission facilities, efficiency improvements, and smart grid technology.
Section 6.1 Section 6.2
In analyzing transmission resources, the utility shall include the following:
(A) A description of the timing, types of expansion, and alternative options considered.
Section 6.1 Section 6.2
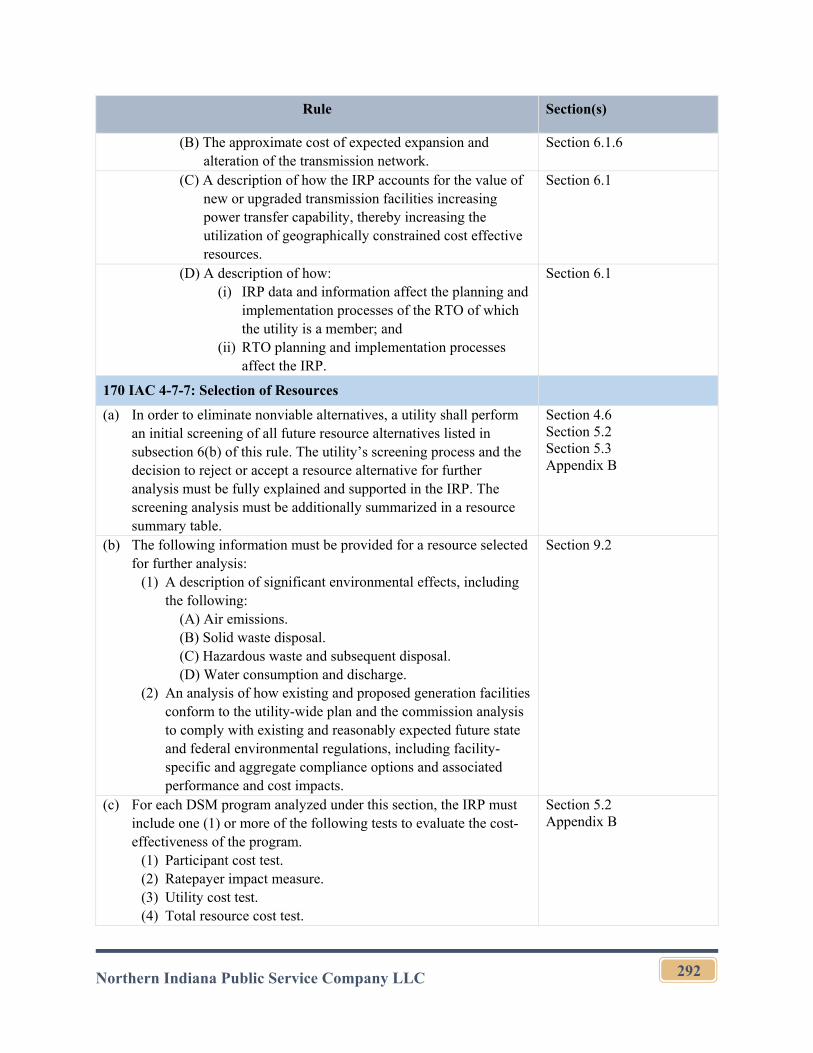
Northern Indiana Public Service Company LLC
292
Rule Section(s)
(B) The approximate cost of expected expansion and alteration of the transmission network.
Section 6.1.6
(C) A description of how the IRP accounts for the value of new or upgraded transmission facilities increasing power transfer capability, thereby increasing the utilization of geographically constrained cost effective resources.
Section 6.1
(D) A description of how: (i) IRP data and information affect the planning and
implementation processes of the RTO of which the utility is a member; and
(ii) RTO planning and implementation processes affect the IRP.
Section 6.1
170 IAC 4-7-7: Selection of Resources
(a) In order to eliminate nonviable alternatives, a utility shall perform an initial screening of all future resource alternatives listed in subsection 6(b) of this rule. The utility’s screening process and the decision to reject or accept a resource alternative for further analysis must be fully explained and supported in the IRP. The screening analysis must be additionally summarized in a resource summary table.
Section 4.6 Section 5.2 Section 5.3 Appendix B
(b) The following information must be provided for a resource selected for further analysis:
(1) A description of significant environmental effects, including the following:
(A) Air emissions. (B) Solid waste disposal. (C) Hazardous waste and subsequent disposal. (D) Water consumption and discharge.
(2) An analysis of how existing and proposed generation facilities conform to the utility-wide plan and the commission analysis to comply with existing and reasonably expected future state and federal environmental regulations, including facility-specific and aggregate compliance options and associated performance and cost impacts.
Section 9.2
(c) For each DSM program analyzed under this section, the IRP must include one (1) or more of the following tests to evaluate the cost-effectiveness of the program.
(1) Participant cost test. (2) Ratepayer impact measure. (3) Utility cost test. (4) Total resource cost test.
Section 5.2 Appendix B
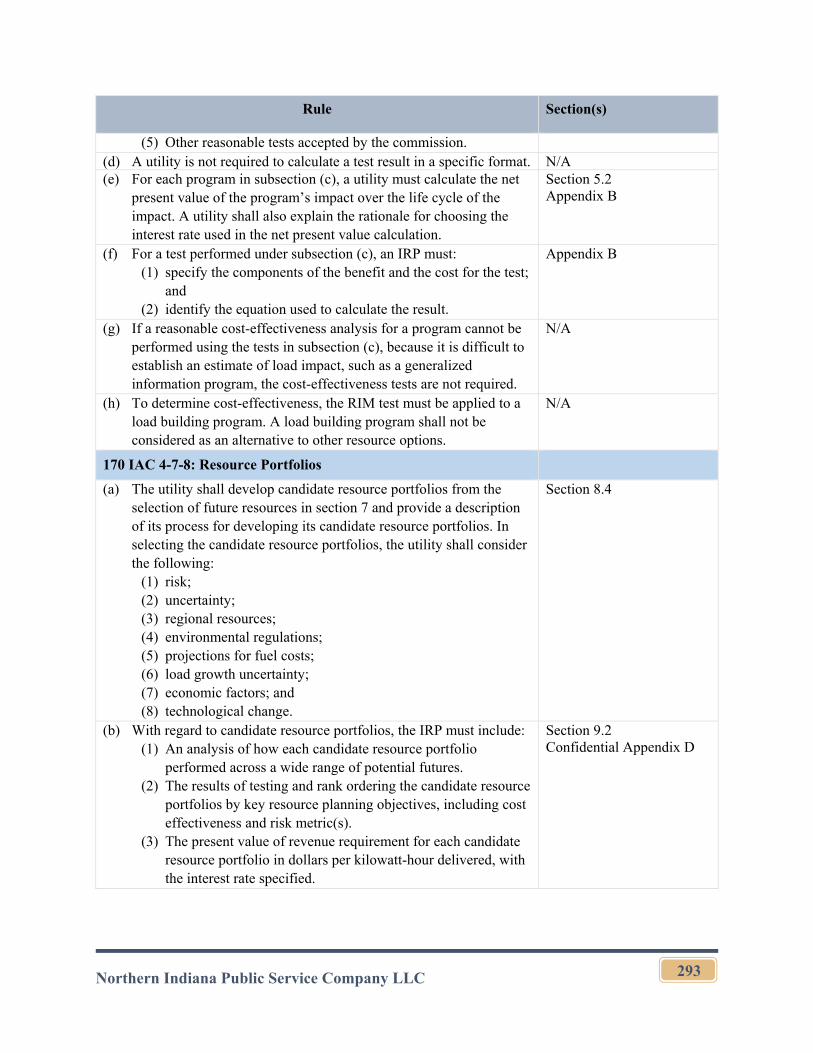
Northern Indiana Public Service Company LLC
293
Rule Section(s)
(5) Other reasonable tests accepted by the commission. (d) A utility is not required to calculate a test result in a specific format. N/A (e) For each program in subsection (c), a utility must calculate the net
present value of the program’s impact over the life cycle of the impact. A utility shall also explain the rationale for choosing the interest rate used in the net present value calculation.
Section 5.2 Appendix B
(f) For a test performed under subsection (c), an IRP must: (1) specify the components of the benefit and the cost for the test;
and (2) identify the equation used to calculate the result.
Appendix B
(g) If a reasonable cost-effectiveness analysis for a program cannot be performed using the tests in subsection (c), because it is difficult to establish an estimate of load impact, such as a generalized information program, the cost-effectiveness tests are not required.
N/A
(h) To determine cost-effectiveness, the RIM test must be applied to a load building program. A load building program shall not be considered as an alternative to other resource options.
N/A
170 IAC 4-7-8: Resource Portfolios
(a) The utility shall develop candidate resource portfolios from the selection of future resources in section 7 and provide a description of its process for developing its candidate resource portfolios. In selecting the candidate resource portfolios, the utility shall consider the following:
(1) risk; (2) uncertainty; (3) regional resources; (4) environmental regulations; (5) projections for fuel costs; (6) load growth uncertainty; (7) economic factors; and (8) technological change.
Section 8.4
(b) With regard to candidate resource portfolios, the IRP must include: (1) An analysis of how each candidate resource portfolio
performed across a wide range of potential futures. (2) The results of testing and rank ordering the candidate resource
portfolios by key resource planning objectives, including cost effectiveness and risk metric(s).
(3) The present value of revenue requirement for each candidate resource portfolio in dollars per kilowatt-hour delivered, with the interest rate specified.
Section 9.2 Confidential Appendix D
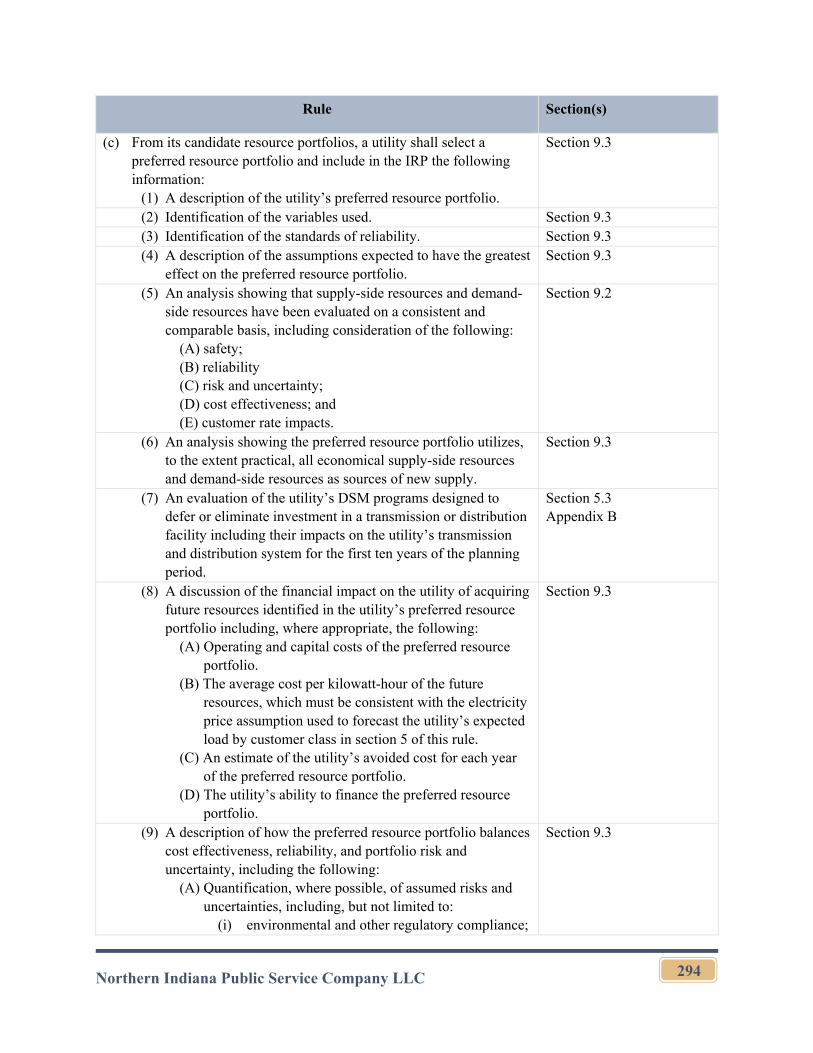
Northern Indiana Public Service Company LLC
294
Rule Section(s)
(c) From its candidate resource portfolios, a utility shall select a preferred resource portfolio and include in the IRP the following information:
(1) A description of the utility’s preferred resource portfolio.
Section 9.3
(2) Identification of the variables used. Section 9.3 (3) Identification of the standards of reliability. Section 9.3 (4) A description of the assumptions expected to have the greatest
effect on the preferred resource portfolio. Section 9.3
(5) An analysis showing that supply-side resources and demand-side resources have been evaluated on a consistent and comparable basis, including consideration of the following:
(A) safety; (B) reliability (C) risk and uncertainty; (D) cost effectiveness; and (E) customer rate impacts.
Section 9.2
(6) An analysis showing the preferred resource portfolio utilizes, to the extent practical, all economical supply-side resources and demand-side resources as sources of new supply.
Section 9.3
(7) An evaluation of the utility’s DSM programs designed to defer or eliminate investment in a transmission or distribution facility including their impacts on the utility’s transmission and distribution system for the first ten years of the planning period.
Section 5.3 Appendix B
(8) A discussion of the financial impact on the utility of acquiring future resources identified in the utility’s preferred resource portfolio including, where appropriate, the following:
(A) Operating and capital costs of the preferred resource portfolio.
(B) The average cost per kilowatt-hour of the future resources, which must be consistent with the electricity price assumption used to forecast the utility’s expected load by customer class in section 5 of this rule.
(C) An estimate of the utility’s avoided cost for each year of the preferred resource portfolio.
(D) The utility’s ability to finance the preferred resource portfolio.
Section 9.3
(9) A description of how the preferred resource portfolio balances cost effectiveness, reliability, and portfolio risk and uncertainty, including the following:
(A) Quantification, where possible, of assumed risks and uncertainties, including, but not limited to:
(i) environmental and other regulatory compliance;
Section 9.3
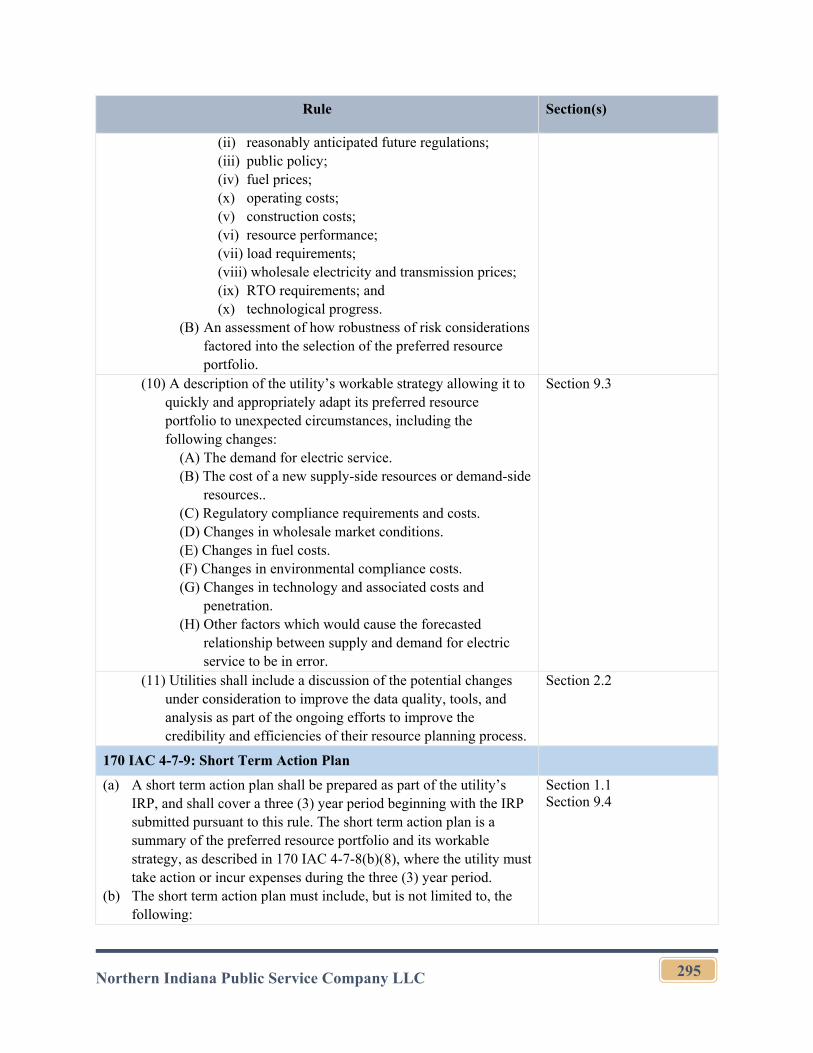
Northern Indiana Public Service Company LLC
295
Rule Section(s)
(ii) reasonably anticipated future regulations; (iii) public policy; (iv) fuel prices; (x) operating costs; (v) construction costs; (vi) resource performance; (vii) load requirements; (viii) wholesale electricity and transmission prices; (ix) RTO requirements; and (x) technological progress.
(B) An assessment of how robustness of risk considerations factored into the selection of the preferred resource portfolio.
(10) A description of the utility’s workable strategy allowing it to quickly and appropriately adapt its preferred resource portfolio to unexpected circumstances, including the following changes:
(A) The demand for electric service. (B) The cost of a new supply-side resources or demand-side
resources.. (C) Regulatory compliance requirements and costs. (D) Changes in wholesale market conditions. (E) Changes in fuel costs. (F) Changes in environmental compliance costs. (G) Changes in technology and associated costs and
penetration. (H) Other factors which would cause the forecasted
relationship between supply and demand for electric service to be in error.
Section 9.3
(11) Utilities shall include a discussion of the potential changes under consideration to improve the data quality, tools, and analysis as part of the ongoing efforts to improve the credibility and efficiencies of their resource planning process.
Section 2.2
170 IAC 4-7-9: Short Term Action Plan
(a) A short term action plan shall be prepared as part of the utility’s IRP, and shall cover a three (3) year period beginning with the IRP submitted pursuant to this rule. The short term action plan is a summary of the preferred resource portfolio and its workable strategy, as described in 170 IAC 4-7-8(b)(8), where the utility must take action or incur expenses during the three (3) year period.
(b) The short term action plan must include, but is not limited to, the following:
Section 1.1 Section 9.4
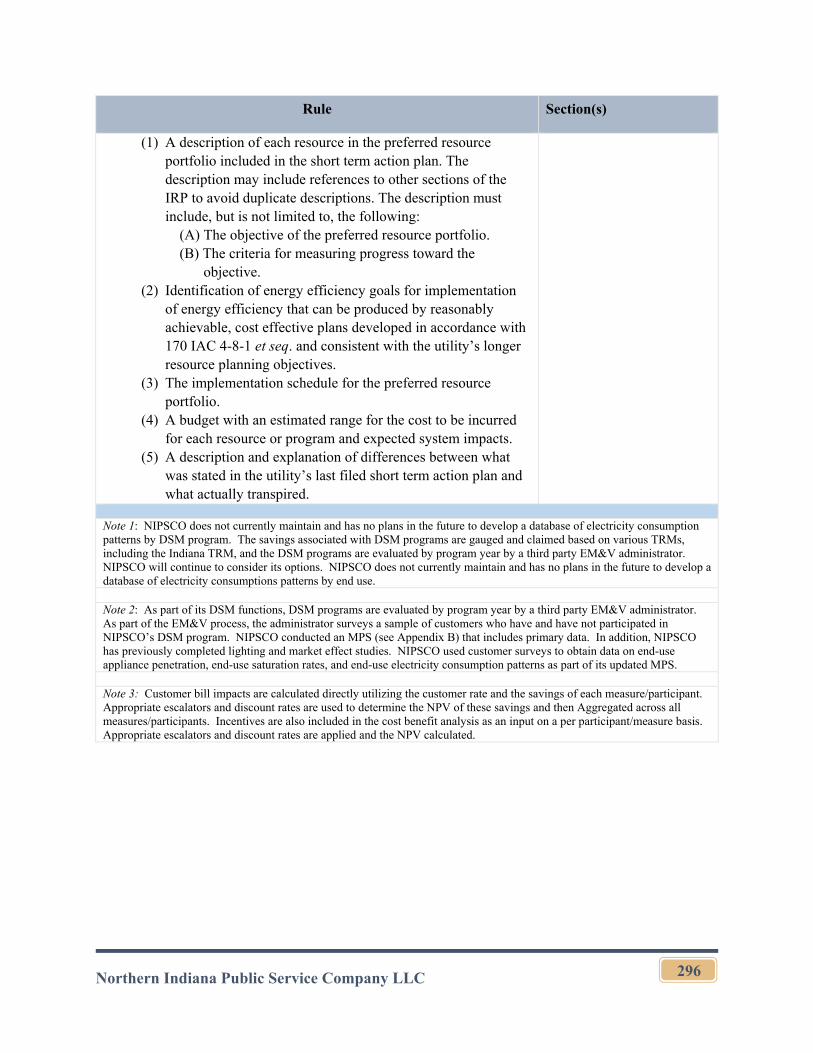
Northern Indiana Public Service Company LLC
296
Rule Section(s)
(1) A description of each resource in the preferred resource portfolio included in the short term action plan. The description may include references to other sections of the IRP to avoid duplicate descriptions. The description must include, but is not limited to, the following:
(A) The objective of the preferred resource portfolio. (B) The criteria for measuring progress toward the
objective. (2) Identification of energy efficiency goals for implementation
of energy efficiency that can be produced by reasonably achievable, cost effective plans developed in accordance with 170 IAC 4-8-1 et seq. and consistent with the utility’s longer resource planning objectives.
(3) The implementation schedule for the preferred resource portfolio.
(4) A budget with an estimated range for the cost to be incurred for each resource or program and expected system impacts.
(5) A description and explanation of differences between what was stated in the utility’s last filed short term action plan and what actually transpired.
Note 1: NIPSCO does not currently maintain and has no plans in the future to develop a database of electricity consumption patterns by DSM program. The savings associated with DSM programs are gauged and claimed based on various TRMs, including the Indiana TRM, and the DSM programs are evaluated by program year by a third party EM&V administrator. NIPSCO will continue to consider its options. NIPSCO does not currently maintain and has no plans in the future to develop a database of electricity consumptions patterns by end use. Note 2: As part of its DSM functions, DSM programs are evaluated by program year by a third party EM&V administrator. As part of the EM&V process, the administrator surveys a sample of customers who have and have not participated in NIPSCO’s DSM program. NIPSCO conducted an MPS (see Appendix B) that includes primary data. In addition, NIPSCO has previously completed lighting and market effect studies. NIPSCO used customer surveys to obtain data on end-use appliance penetration, end-use saturation rates, and end-use electricity consumption patterns as part of its updated MPS. Note 3: Customer bill impacts are calculated directly utilizing the customer rate and the savings of each measure/participant. Appropriate escalators and discount rates are used to determine the NPV of these savings and then Aggregated across all measures/participants. Incentives are also included in the cost benefit analysis as an input on a per participant/measure basis. Appropriate escalators and discount rates are applied and the NPV calculated.