north fork of the st. lucie river floodplain vegetation
TRANSCRIPT
i
Resources Division
NORTH FORK ST. LUCIE RIVER
FLOODPLAIN VEGETATION
TECHNICAL REPORT
WR-2015-005
Coastal Ecosystem Section Applied Sciences Bureau Water Resources Division
South Florida Water Management District
Final Report July 2015
North Fork of the St. Lucie River Floodplain Vegetation Technical Report
ii
ACKNOWLEDGEMENTS This document is the result of a cooperative effort between the Coastal Ecosystems Section
of South Florida Water Management District (SFWMD) and the Florida Department of Environmental Protection (FDEP), Florida Park Service (FPS) at the Savannas Preserve State Park in Jensen Beach, Florida and the Indian River Lagoon Aquatic Preserve Office in Fort Pierce, Florida.
The principle author of this document was as follows:
Marion Hedgepeth SFWMD
The following staff contributed to the completion of this report:
Cecilia Conrad SFWMD (retired)
Jason Godin SFWMD
Detong Sun SFWMD
Yongshan Wan SFWMD
We would like to acknowledge the contributions of Christine Lockhart of Habitat Specialist Inc. with regards to the pre-vegetation plant survey, reference collection established for this project, and for her assistance with plant identifications. We are especially grateful to Christopher Vandello of the Savannas Preserve State Park and Laura Herren and Brian Sharpe of the FDEP Indian River Lagoon Aquatic Preserves Office for their assistance in establishing the vegetation transects and conducting the field studies. And, we would like to recognize other field assistance from Mayra Ashton, Barbara Welch, and Caroline Hanes of SFWMD. Also, we would like to thank Kin Chuirazzi for performing a technical review of the document.
North Fork of the St. Lucie River Floodplain Vegetation Technical Report
iii
TABLE OF CONTENTS
Acknowledgements ..........................................................................................................................ii
List of Tables ................................................................................................................................ vii
List of Figures ................................................................................................................................. ix
Acronyms and Abbreviations ........................................................................................................ xiii
Introduction ................................................................................................................................. 1
Purpose and Scope.......................................................................................................................... 9
Previous Vegetation and Water Quality Studies ................................................................ 11
Topographical Characteristics and Geographical Information System Coverage .............. 14
Ecological Conceptual Model of Floodplain Vegetation ..................................................... 16
North Fork St. Lucie River Floodplain Taxonomic Plant Survey .......................................... 16
Methods ............................................................................................................................... 19
Air, Temperature and Rainfall ............................................................................................. 19
Soil Characteristics, Soil Electrical Conductivity and Soil Moisture Sampling .................... 19
River Flow and Salinity ........................................................................................................ 19
Vegetative Sampling ........................................................................................................... 20
Plant and Forest Type Identification ................................................................................... 24
Statistical Analysis ............................................................................................................... 24
Results ............................................................................................................................... 27
Air, Temperature and Rainfall ............................................................................................. 27
Soil Types, Soil Electrical Conductivity and Soil Moisture .................................................. 29
River Flow and Salinity ........................................................................................................ 33
Floodplain Vegetative Communities ................................................................................... 37
Forest Community Types .................................................................................................... 39
Transect Summaries ............................................................................................................ 40
Canopy Communities ...................................................................................................... 40
Canopy Abundance and Forest Type by Transect .......................................................... 43
The Structure of the Floodplain Canopy Community Using Multivariate Analysis ........ 55
Shrub and Groundcover Communities ........................................................................... 64
North Fork of the St. Lucie River Floodplain Vegetation Technical Report
iv
Shrub Community ........................................................................................................... 66
Groundcover Community ............................................................................................... 75
Discussion and Conclusions .......................................................................................................... 81
Floodplain Forest Impacts ................................................................................................... 85
Floodplain Restoration and Future Studies ........................................................................ 86
Impact of Climatic Events on Vegetative Changes ............................................................. 89
Literature Cited ............................................................................................................................. 93
Appendix A: 1944 and 1958 Black and White Aerials of the North Fork St. Lucie River and Location of Transect Benchmarks ....................................................................... 101
Appendix B: 1971 Plant List for the Freshwater Swamp of the North Fork St. Lucie River .... 109
Appendix C: 2009 North Fork St. Lucie River Plant Survey List ............................................... 113
Summary of Information in Table ..................................................................................... 126
Appendix D: Major Soils, Soil Electrical Conductivity and Soil Moisture on the North Fork St. Lucie River Floodplain ......................................................................................... 127
Appendix E: North Fork St. Lucie River Floodplain Soil Electrical Conductivity and Soil Moisture Data Set ............................................................................................... 133
Appendix F: Summary of Forest Type Determinations ........................................................... 137
Summary of Forest Type Determinations ......................................................................... 138
Uplands ......................................................................................................................... 140
Hammocks..................................................................................................................... 141
Riverine and Upper Tidal Reaches and High Bottomland Hardwoods ......................... 142
Riverine Swamps ........................................................................................................... 143
Upper Tidal Swamps ..................................................................................................... 144
Lower Tidal Forest ......................................................................................................... 145
Freshwater and Saltwater Marshes .............................................................................. 146
Appendix G: North Fork St. Lucie River Floodplain Data Sets and Additional Graphs ............ 147
Appendix H: Results and Additional Multi-Variate Analysis and Graphs ................................ 173
Results Canonical Correspondence Analysis Canopy Layer .............................................. 174
Scatterplot Matrix for Floodplain Canopy Abundance ..................................................... 176
Canopy Bray-Curtis (BC) Biplots ........................................................................................ 178

North Fork of the St. Lucie River Floodplain Vegetation Technical Report
v
2009 Shrub Percent Cover ................................................................................................ 194
Results Canonical Correspondence Analysis of Shrub Layer ............................................ 198
Shrub Species Bray Curtis (BC) Bi-plots............................................................................. 200
Appendix I: North Fork St. Lucie River Floodplain Grid Maps ................................................ 203
Floodplain LIDAR ............................................................................................................... 204

North Fork of the St. Lucie River Floodplain Vegetation Technical Report
vi
North Fork of the St. Lucie River Floodplain Vegetation Technical Report
vii
LIST OF TABLES
Table 1. Surface water salinity and conductivity readings collected by Hunt and Lodge on the North Fork St. Lucie River in 1971. ................................................................. 13
Table 2. Average minimum monthly air temperatures at the SVWX Weather Station. .... 28 Table 3. Average monthly rainfall in inches between 1995 and 2010 on the St. Lucie River.
............................................................................................................................... 28 Table 4. Mean monthly flow at the Gordy Road structure 1999–2011 (DBHYDRO, DBKEY
JW239). ................................................................................................................. 34 Table 5. Forest community types in the North Fork St. Lucie River floodplain transects
based on relative basal area of the canopy species. ............................................ 39 Table 6. CCA results for the North Fork St. Lucie River floodplain canopy abundance by
species. .................................................................................................................. 61 Table 7. A summary table of the results from the Bray Curtis analysis of canopy species
and the environmental variables. ......................................................................... 65 Table 8. 2009 Survey of shrubs by transect. An asterick indicates an invasive exotic
species. .................................................................................................................. 67 Table 9. Percent cover of shrubs by forest type and transect. .......................................... 69 Table 10. CCA analysis of shrub species and environmental variables. ............................... 74 Table 11. Groundcover stem count and percent cover by transect. ................................... 76 Table 12. roundcover stem count and percent cover by forest type................................... 80 Table F-13. Wetland indicator status by the United States Department of Agriculture,
Natural Resources Conservation Service. ............................................................. 99 Table B-1. 1971 Plant list for the freshwater swamp of the North Fork St. Lucie River. ..... 110 Table C-1. South Florida Water Management District’s North Fork St. Lucie River Floodplain
2009 Survey of Plant Species. ............................................................................. 114 Table D-1. Major soils of the North Fork St. Lucie floodplain .............................................. 128 Table E-1. North Fork St. Lucie River floodplain soil electrical conductivity (EC) and percent
soil moisture (%SM) data set. ............................................................................. 134 Table F-1. Summary of hydrological conditions, soil textures, and dominant canopy species
of forest types in the floodplains of South Florida (modified from Light et al., 2002a). ................................................................................................................ 138
Table G-1. 2009 canopy data set. ......................................................................................... 149 Table H-1. CCA canopy layer. ............................................................................................... 174 Table H-2. Shrub percent cover in plot. ............................................................................... 194 Table H-3. Shrub percent cover by species. ......................................................................... 196 Table H-4. CCA of shrub layer. .............................................................................................. 198

North Fork of the St. Lucie River Floodplain Vegetation Technical Report
viii
North Fork of the St. Lucie River Floodplain Vegetation Technical Report
ix
LIST OF FIGURES
Figure 1. Location map for the St. Lucie River Watershed and its surrounding subwatersheds. .................................................................................. 2
Figure 2. River miles and some major water control structures on the North Fork St. Lucie River. ......................................................................................................... 3
Figure 3. 1940 black and white aerial photograph of the lower St. Lucie River Watershed. 5 Figure 4. 1856 J. C. Ives Military Map of the Peninsula of Florida South of Tampa Bay
enlarged to show the St. Lucie River System (North and South forks) and some of its first residents. .................................................................................................... 7
Figure 5. An example of Dr. Alexander’s high hammock (oaks, pine and saw palmetto) that formed on the berms (i.e. spoil material from dredging) along the river channel................................................................................................................................ 11
Figure 6. LIDAR TIN of the North Fork St. Lucie River illustrating the effect of spoil mounds (berms) reducing the inundation of the floodplain areas adjacent to the Oxbow Eco-Center (RM 25.7). ........................................................................................... 15
Figure 7. Conceptual ecological model of a South Florida river floodplain and adapted for the St. Lucie River and Watershed floodplain communities. ............................... 17
Figure 8. Photograph of a red bay voucher specimen from the North Fork St. Lucie River Floodplain Study Collection. ................................................................................. 18
Figure 9. Location of vegetation transects on the North Fork St. Lucie River. .................... 21 Figure 10. Schematic of transect vegetation monitoring. ..................................................... 22 Figure 11. Measuring tree canopy dbh. ................................................................................. 23 Figure 12. Measuring groundcover within a meter square area in the hammock on the
Miller Oxbow Transect. ......................................................................................... 23 Figure 13. Monthly rainfall totals from SVWX weather station prior to and during the field
survey (DBHYDRO). ............................................................................................... 29 Figure 14. EC and %SM on the A. Miller Oxbow Transect RM 30 and B. River’s Edge
Transect RM 26.3. ................................................................................................ 31 Figure 15. Major contributions to freshwater flow on the North Fork St. Lucie River
(DBHYDRO). ........................................................................................................... 33 Figure 16. Isohalines for 1, 6 and 14 salinities on the North Fork St. Lucie River as simulated
by the CH3D Model. .............................................................................................. 36 Figure 17. Reaches of the St. Lucie River based on floodplain vegetation communities. ..... 38 Figure 18. Overall abundance of canopy species in the 2009 study. .................................... 40 Figure 19. Overall basal area of canopy species in the 2009 study. ...................................... 41 Figure 20. Dbh size frequencies for all 2009 canopy species. ............................................... 42 Figure 21. Canopy abundance on the Miller Oxbow Transect in 2009. ................................ 43
North Fork of the St. Lucie River Floodplain Vegetation Technical Report
x
Figure 22. Dbh size class frequency on the Miller Oxbow Transect in 2009. ........................ 44 Figure 23. LIDAR interpretation of elevation data and plot locations on the Miller Oxbow
Transect in 2009. ................................................................................................... 45 Figure 24. Canopy abundance on the River Edge Transect in 2009. ..................................... 46 Figure 25. Canopy dbh size class frequency on the River’s Edge Transect in 2009. ............. 47 Figure 26. LIDAR interpretation of elevation data and plot locations on the Rivers Edge
Transect. ............................................................................................................... 48 Figure 27. Canopy abundance at the Beach Avenue Transect in 2009. ................................ 49 Figure 28. Canopy dbh size class frequency on the Beach Avenue Transect in 2009. .......... 50 Figure 29. LIDAR interpretation of elevation data and plot locations on the Beach Avenue
Transect in 2009. ................................................................................................... 51 Figure 30. Canopy abundance on the Crowberry Drive Transect in 2009. ............................ 52 Figure 31. Canopy dbh size class frequency for the Crowberry Drive Transect in 2009. ...... 53 Figure 32. LIDAR interpretation of elevation data and plot locations on the Crowberry Drive
Transect in 2009. ................................................................................................... 54 Figure 33. Dendrogram resulting from the cluster analysis of 16 canopy species in 65 plots
for the floodplain along the North Fork St. Lucie River. ....................................... 56 Figure 34. Two-dimensional scatterplot of the 65 vegetative plots by major forest
community group. ................................................................................................. 57 Figure 35. A two-way cluster analysis of vegetative plots by minimum/ maximum of canopy
species. .................................................................................................................. 59 Figure 36. Three-dimensional CCA ordination analysis using the 16 canopy species and the
two environmental variables and river mile. ........................................................ 60 Figure 37. Two-dimensional scatterplot of the 16 canopy species (green dots) shown with
the three vectors. .................................................................................................. 63 Figure 38. Cluster analysis dendrogram of percent cover for 75 vegetative plots and 40
shrub species......................................................................................................... 70 Figure 39. Two-way cluster analysis for the shrub layer using 75 plots and 40 species. ...... 72 Figure 40. Two-dimensional scatterplot of 75 vegetative plots and 40 shrub species. ........ 73 Figure 41. LIDAR of the 2010 Miller Oxbow Reconnection Project. ...................................... 87 Figure A-1. 1944 black and white aerial of the lower portion of the North Fork St. Lucie River.
Figure A-2. 1958 black and white aerial of the North Fork St. Lucie River. ....... 102 Figure A-3. 1958 black and white aerial of Five Mile and Ten Mile creeks ........................... 104 Figure A-4. Location of transect benchmarks. ...................................................................... 105 Figure A-5. Location of Benchmarks 1 and 2. ........................................................................ 106 Figure A-6. Location of Benchmarks 3 and 4. ........................................................................ 107 Figure D-1. Soil survey maps. ................................................................................................ 129 Figure D-2. Soil survey maps. ................................................................................................ 130
North Fork of the St. Lucie River Floodplain Vegetation Technical Report
xi
Figure D-3. Soil survey maps. ................................................................................................ 131 Figure F-1. Upland forest type. ............................................................................................. 140 Figure F-2. Hammocks are found in both riverine and tidal reaches of the river. ............... 141 Figure F-3. Bottomland hardwood forest type (Miller Oxbow Transect). ............................ 142 Figure F-4. Riverine swamp forest type (Rsw1). ................................................................... 143 Figure F-5. Upper tidal swamp forest type (UTsw1). ............................................................ 144 Figure F-6. Lower tidal swamp forest type (LTsw1). ............................................................. 145 Figure F-7. Former saltwater marsh under power lines at River Mile 6.5 that has since
converted to mangroves on the Northwest Fork Loxahatchee River (Bill Lund photograph from 1971). ..................................................................................... 146
Figure G-1. Additional canopy basal area graphs by transect. .............................................. 148 Figure H-1. Scatterplot matrix of the 16 canopy species and 3 environmental variable. ..... 176 Figure H-2. Scatterplot matrix of all canopy species and environmental variables. ............. 177 Figure H-3. Biplot for pond apple (Annona glabra) with EC and %SM. ................................. 178 Figure H-4. Biplot for red maple (Acer rubrum) with EC and %SM. ...................................... 179 Figure H-5. Biplot for water hickory (Carya aquatica) with EC and %SM. ............................ 180 Figure H-6. Biplot for pop ash (Fraxinus caroliniana) with EC and %SM............................... 181 Figure H-7. Biplot for white mangrove (Laguncularia racemosa) with EC and %SM. ........... 182 Figure H-8. Biplot for wax myrtle (Myrica cerifera) with EC and %SM. ................................ 183 Figure H-9. iplot for red bay (Persea borbonia) with EC and %SM. ...................................... 184 Figure H-10. Biplot for strawberry guava (Psidium cattleianum) with EC and %SM............... 185 Figure H-11. Biplot for slash pine (Pinus elliottii) with EC and %SM. ...................................... 186 Figure H-12. Biplot for laurel oak (Quercus laurifolia) with EC and %SM. .............................. 187 Figure H-13. Biplot for java plum (Syzygium cumini) with EC and %SM. ................................ 188 Figure H-14. Biplot for live oak (Quercus virginiana) with EC and %SM. ................................ 189 Figure H-15. Biplot for cabbage palm (Sabal palmetto) with EC and %SM. ............................ 190 Figure H-16. Biplot for saw palmetto (Serenoa repens) with EC and %SM. ............................ 191 Figure H-17. Biplot for Brazilian pepper (Schinus terebinthifolia) with EC and %SM. ............ 192 Figure H-18. Biplot for tamarind (Tamarindus indica) with EC and %SM. .............................. 193 Figure H-19. Biplot of sawgrass (Cladium jamaicense) with the environmental variables. .... 200 Figure H-20. Biplot of giant leather fern (Acrostichum danaeifolium) with the environmental
variables. ............................................................................................................. 201 Figure I-1. Location of each of the following section maps along the North Fork St. Lucie
River. ................................................................................................................... 205 Figure I-2. Section A LIDAR map. .......................................................................................... 206 Figure I-3. Section B LIDAR map. .......................................................................................... 207 Figure I-4. Section C LIDAR map. .......................................................................................... 208 Figure I-5. Section D LIDAR map. ......................................................................................... 209

North Fork of the St. Lucie River Floodplain Vegetation Technical Report
xii
Figure I-6. Section E LIDAR map. .......................................................................................... 210 Figure I-7. Section F LIDAR map. .......................................................................................... 211
North Fork of the St. Lucie River Floodplain Vegetation Technical Report
xiii
ACRONYMS AND ABBREVIATIONS
° C degrees Celsius ° F degrees Fahrenheit %SM percent soil moisture blh bottomland hardwood CERP Comprehensive Everglades Restoration Plan CCA canonical correspondence analysis cfs cubic feet per second CH3D Curvilinear Hydrodynamics Three Dimensional cm centimeter cS/cm centisiemens per centimeter dbh diameter at breast height DBHYDRO South Florida Water Management District’s corporate environmental database DEM Digital Elevation Model District South Florida Water Management District EC soil electrical conductivity FAC facultative FACW facultative wetland FACU facultative upland FDEP Florida Department of Environmental Protection GIS geographic information system GPS global positioning system HH hydric hammock LIDAR light detection and radar m meter M marsh m2 square meter MFL minimum flows and levels MH mesic hammock NAVD North American Vertical Datum NGVD National Geodetic Vertical Datum of 1929 NSM Natural Systems Model OBL obligate wetland OPTI optimization model developed to simulate delivery of the flows in the CERP reservoirs
to meet target flow distributions R riverine RM River Mile sw swamp TIN triangular irregular network U obligate upland UT upper tidal VEC valued ecosystem component WaSh a watershed hydrologic model created to evaluate watershed inflows with future CERP
projects and without conditions

North Fork of the St. Lucie River Floodplain Vegetation Technical Report
xiv
North Fork of the St. Lucie River Floodplain Vegetation Technical Report
1
INTRODUCTION
River floodplains are an important part of any watershed system. They provide storage and filtration of surface water, diverse habitats for plants and animals, corridors for the movement of animals and dissemination of plants, and provide a supply of nutrients to estuarine environments (Darst et al., 2003). In Mitsch and Gosselink’s book Wetlands (2000, page 514), Gregory et al. described these riparian zones as “the interface between terrestrial and aquatic ecosystems. As ecotones, they encompass sharp gradients of environmental factors, ecological processes and plant communities and are composed of mosaics of landforms, communities and environments within a larger landscape.” Vegetation types within floodplains clearly differ as a result of changes in hydrology, topography, soils, and proximity to the coast (Darst et al., 2003). Burke et al. (2003) noted that flooding intensity (i.e. hydroperiod) was the major factor affecting community structure in temperate blackwater floodplain forest. Secondarily, they found the physical and chemical characteristics of the soil, particularly water-holding capacity, affects plant community sustainability during low river flow periods and droughts. Other factors noted for affecting species composition in floodplains include logging and fire history, presence or absence of exotics, and the availability of nutrients and light.
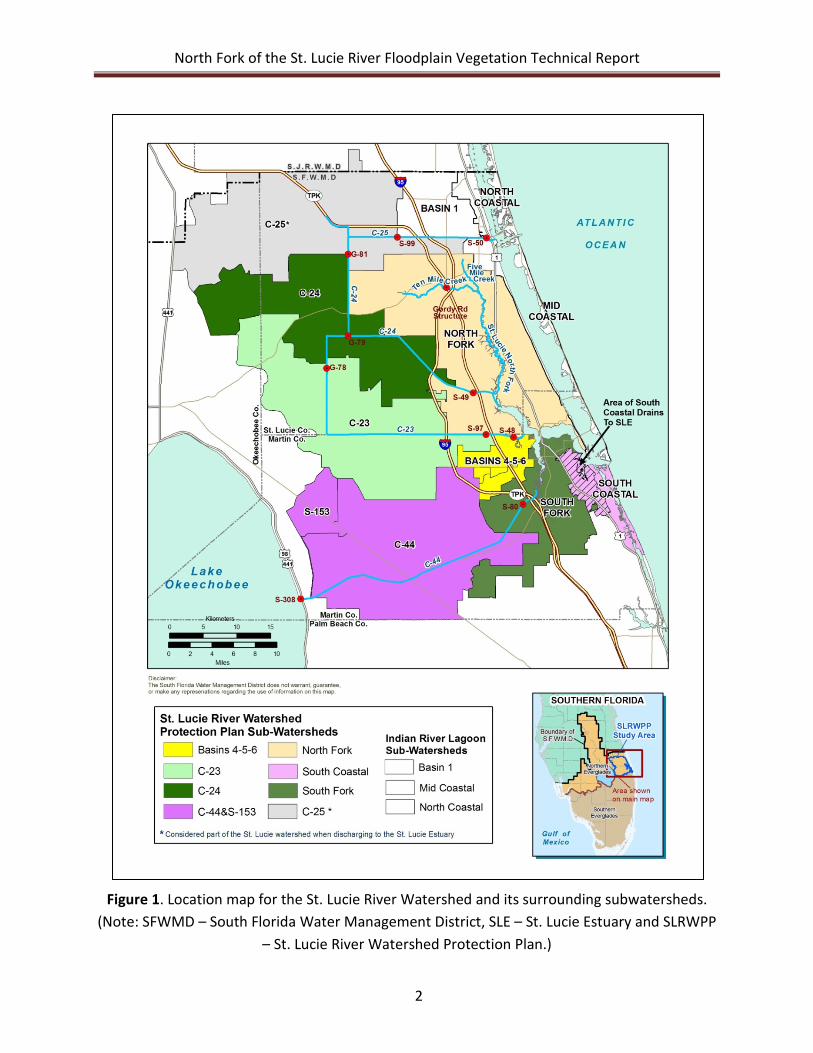
The St. Lucie River Watershed (Figure 1) is located on the southeastern coast of Florida in Martin and St. Lucie counties and is the target of this investigation. It is divided into two major subwatersheds (St. Lucie River and Indian River Lagoon) and encompasses 781 square miles. The western basins of the St. Lucie River (C-25, C-24, C-23 and C-44) consist primarily of agricultural lands dominated by citrus and improved pasture. The eastern basins of the St. Lucie River and Indian River Lagoon are more urban with some remaining agricultural activities. The St. Lucie Canal (C-44) is used primarily for regulatory releases (i.e. flood control, and water delivery and navigation) and is governed by the United States Army Corps of Engineers’ schedule of lake levels for Lake Okeechobee.
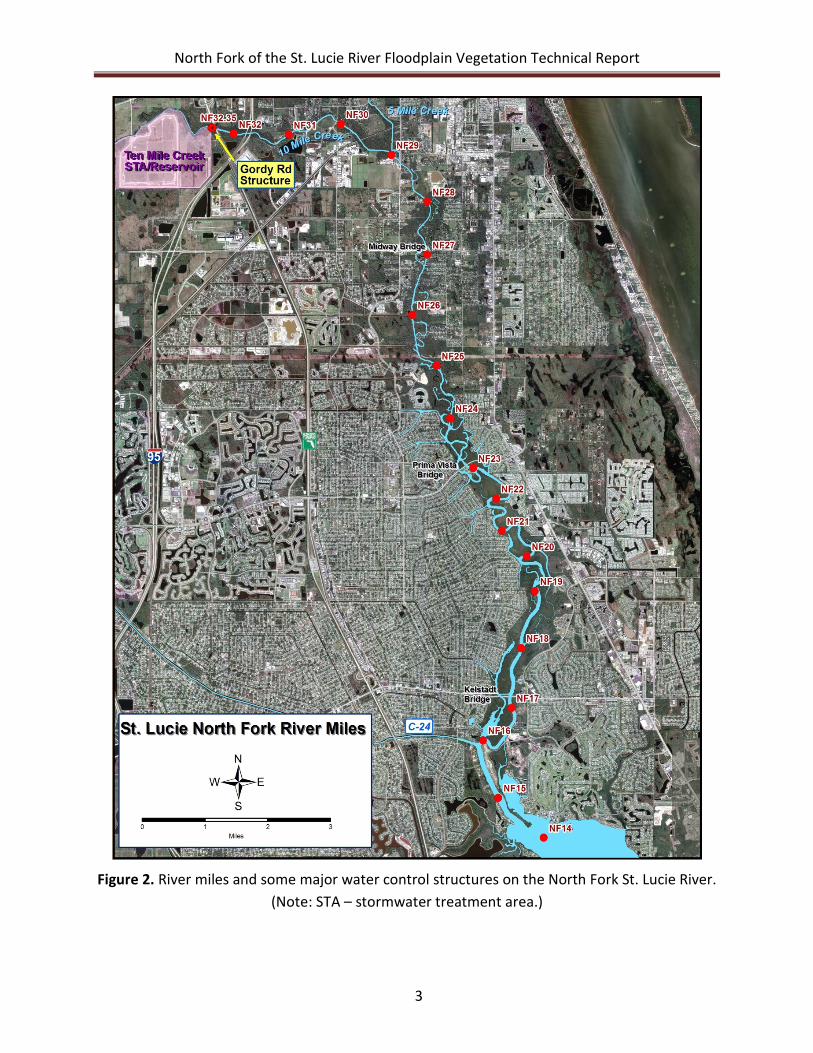
The North Fork St. Lucie River (Figure 2) drains an area of approximately 108,165 acres (169 square miles) in eastern St. Lucie County and northeastern Martin County (Post, Buckley, Schuh & Jernigan Inc., 2003). During the nineteenth century, the North Fork was known as the Halpatiokee River (Teas, 1971). Today its major tributaries are Ten Mile and Five Mile creeks. The main body of the North Fork is about four miles long with a channel depth of approximately 10 feet as a result of dredging. The width of the floodplain varies from 100 feet at it upper limits to 4,000 feet at its downstream end. The North Fork is tidally driven up to Five Mile Creek and to the control structure on Ten Mile Creek at Gordy Road (SFWMD, 2002). It is the primary drainage outlet for the C-23 and C-24 canals, the City of Port St. Lucie, most of the City of Fort Pierce and the North St. Lucie River Water Control District.
North Fork of the St. Lucie River Floodplain Vegetation Technical Report
2
Figure 1. Location map for the St. Lucie River Watershed and its surrounding subwatersheds. (Note: SFWMD – South Florida Water Management District, SLE – St. Lucie Estuary and SLRWPP
– St. Lucie River Watershed Protection Plan.)
North Fork of the St. Lucie River Floodplain Vegetation Technical Report
3
Figure 2. River miles and some major water control structures on the North Fork St. Lucie River. (Note: STA – stormwater treatment area.)
North Fork of the St. Lucie River Floodplain Vegetation Technical Report
4
In 1971, the Florida Board of Trustees of the Internal Improvement Trust Fund established most of the riparian areas of the North Fork as the North Fork St. Lucie Aquatic Preserve. The boundaries of the preserve run from approximately River Mile (RM) 12 (Lighthouse Point) to RM 27 (Midway Road) (Figure 2). The 5,000-acre area was to be managed as a wilderness preserve by the Florida Department of Natural Resources, Division of Recreation and Parks, Bureau of Environmental Land Management. The North Fork St. Lucie River Aquatic Preserve Management Plan was completed in 1984 (Florida Department of Natural Resources, 1984). In the plan, vegetative communities were listed as mangrove, freshwater swamp forest or swamp hammocks, marine grassbeds and tidal flats. With the increasing pressure of development particularly within the City of Port St. Lucie, Davis (1982) described the river system as “holding its own.” Today, bobcats (Lynx rufus) still roam through the preserve although it is surrounded by highly urbanized lands.
The floodplains of the St. Lucie River consist of tropical and temperate zone riparian forest and marshes that have evolved within the climate and rainfall patterns typical of the South Florida peninsula. Average seasonal temperatures range from 17.8 degrees Celsius (° C) (64° Fahrenheit [° F]) during the winter to about 27.2° C (81° F) during summer (U.S. Department of Commerce, 2010). Average annual rainfall based on 52 years of data was estimated at approximately 51 inches with considerable variations from year to year . As with the seasonal rainfall pattern of South Florida, a somewhat variable wet season occurs between May through October and a dry season occurs between November and April.
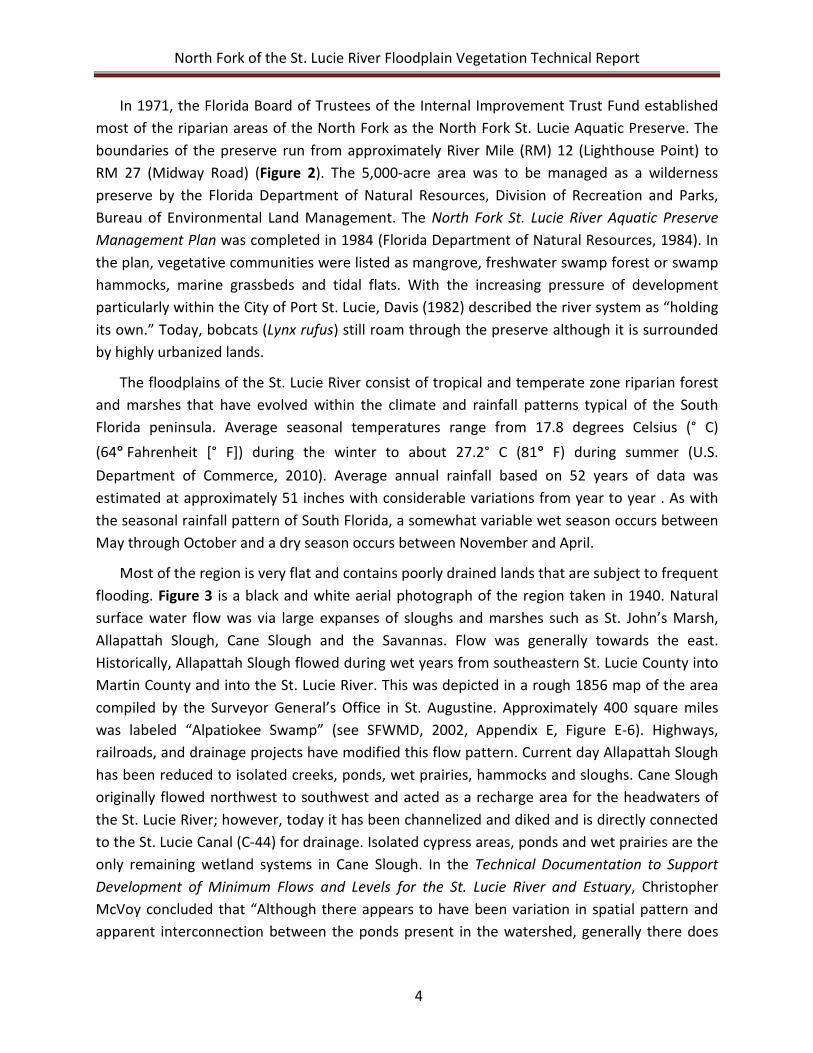
Most of the region is very flat and contains poorly drained lands that are subject to frequent flooding. Figure 3 is a black and white aerial photograph of the region taken in 1940. Natural surface water flow was via large expanses of sloughs and marshes such as St. John’s Marsh, Allapattah Slough, Cane Slough and the Savannas. Flow was generally towards the east. Historically, Allapattah Slough flowed during wet years from southeastern St. Lucie County into Martin County and into the St. Lucie River. This was depicted in a rough 1856 map of the area compiled by the Surveyor General’s Office in St. Augustine. Approximately 400 square miles was labeled “Alpatiokee Swamp” (see SFWMD, 2002, Appendix E, Figure E-6). Highways, railroads, and drainage projects have modified this flow pattern. Current day Allapattah Slough has been reduced to isolated creeks, ponds, wet prairies, hammocks and sloughs. Cane Slough originally flowed northwest to southwest and acted as a recharge area for the headwaters of the St. Lucie River; however, today it has been channelized and diked and is directly connected to the St. Lucie Canal (C-44) for drainage. Isolated cypress areas, ponds and wet prairies are the only remaining wetland systems in Cane Slough. In the Technical Documentation to Support Development of Minimum Flows and Levels for the St. Lucie River and Estuary, Christopher McVoy concluded that “Although there appears to have been variation in spatial pattern and apparent interconnection between the ponds present in the watershed, generally there does
North Fork of the St. Lucie River Floodplain Vegetation Technical Report
5
not appear a strong suggestion of extensive connection nor of extensive surface runoff. The most important contribution of the watershed to the St. Lucie River may have been more through groundwater contribution to base flow than through surface water runoff” (SFWMD, 2002, Appendix E).
Figure 3. 1940 black and white aerial photograph of the lower St. Lucie River Watershed. (Source: United States Department of Agriculture)
When the first European settlers colonized the coastal area in the early 1800s, the St. Lucie River was a freshwater stream flowing into the Indian River Lagoon. In James Henshall’s 2012 book Camping and Cruising in Florida: One Hundred Years Ago, he wrote “The St. Lucie is the largest stream emptying into Indian River, and its waters, including those of the bay at its mouth, are quite fresh…In the broad bay at the mouth of the St. Lucie we saw growing great quantities of a grass-like plant, resembling wild celery, or eel grass, upon which were feeding thousands of coots and ducks.” The freshwater manatee grass (Syringodium filiforme) was killed with the opening of the St. Lucie inlet in 1892. The grass was replaced with oyster bars, which in turn, were killed within years of the completion of the Lake Okeechobee Waterway in 1923 (Osborn, 2012).
North Fork of the St. Lucie River Floodplain Vegetation Technical Report
6
The hydrology of the lower river was permanently altered in 1892 when local residents dredged an inlet creating the St. Lucie River Estuary. The Florida Legislature created the Drainage Commission in 1905, which was followed by the 1916 Florida Drainage Acts establishing taxing districts to drain land for flood control and agriculture. The St. Lucie Canal (C-44) was constructed between 1916 and 1924 to provide an outlet for Lake Okeechobee floodwaters. Ft. Pierce Farms Drainage District and North St. Lucie River Water Control District were established between 1918 and 1919 to provide flood control and drainage for area citrus production. At RM 32.2 of the river system, the Gordy Road water control structure provides freshwater flow to the North Fork via Ten Mile Creek.
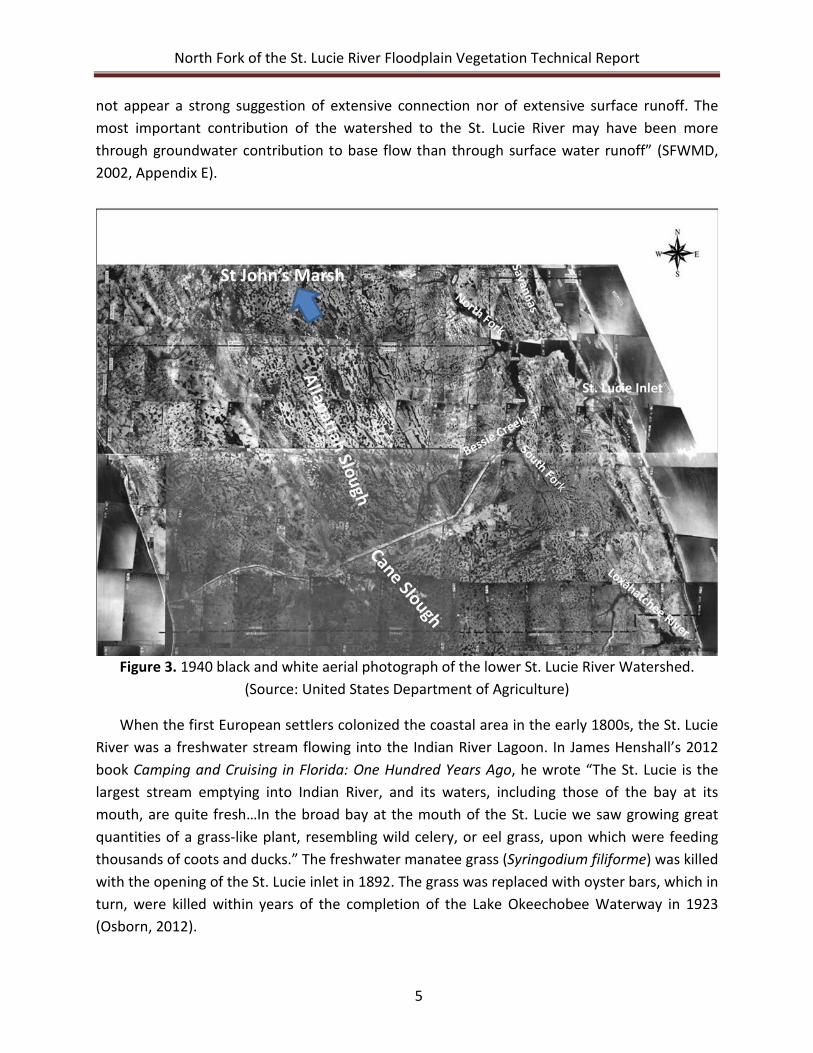
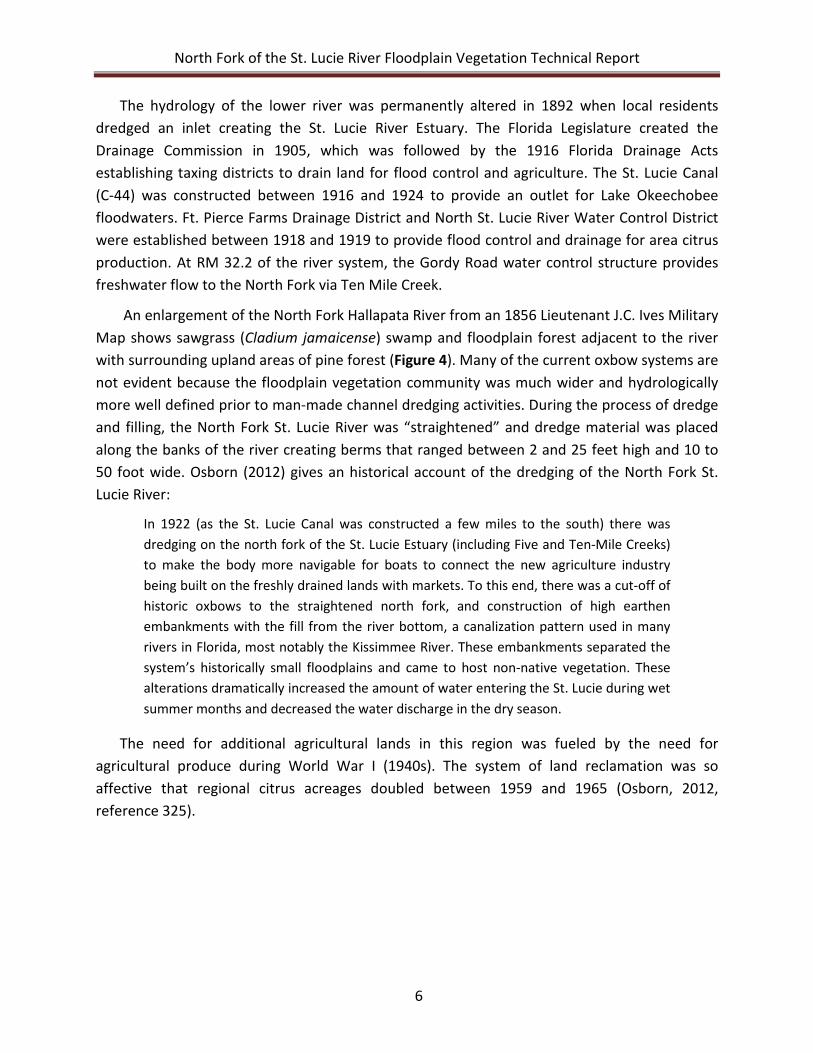
An enlargement of the North Fork Hallapata River from an 1856 Lieutenant J.C. Ives Military Map shows sawgrass (Cladium jamaicense) swamp and floodplain forest adjacent to the river with surrounding upland areas of pine forest (Figure 4). Many of the current oxbow systems are not evident because the floodplain vegetation community was much wider and hydrologically more well defined prior to man-made channel dredging activities. During the process of dredge and filling, the North Fork St. Lucie River was “straightened” and dredge material was placed along the banks of the river creating berms that ranged between 2 and 25 feet high and 10 to 50 foot wide. Osborn (2012) gives an historical account of the dredging of the North Fork St. Lucie River:
In 1922 (as the St. Lucie Canal was constructed a few miles to the south) there was dredging on the north fork of the St. Lucie Estuary (including Five and Ten-Mile Creeks) to make the body more navigable for boats to connect the new agriculture industry being built on the freshly drained lands with markets. To this end, there was a cut-off of historic oxbows to the straightened north fork, and construction of high earthen embankments with the fill from the river bottom, a canalization pattern used in many rivers in Florida, most notably the Kissimmee River. These embankments separated the system’s historically small floodplains and came to host non-native vegetation. These alterations dramatically increased the amount of water entering the St. Lucie during wet summer months and decreased the water discharge in the dry season.
The need for additional agricultural lands in this region was fueled by the need for agricultural produce during World War I (1940s). The system of land reclamation was so affective that regional citrus acreages doubled between 1959 and 1965 (Osborn, 2012, reference 325).
North Fork of the St. Lucie River Floodplain Vegetation Technical Report
7
Figure 4. 1856 J. C. Ives Military Map of the Peninsula of Florida South of Tampa Bay enlarged to show the St. Lucie River System (North and South forks) and some of its first residents.
Note the sawgrass swamp between the Midway Bridge and Kelstadt Bridge areas.
pine
1856 Map of the North and South
Fork of the Hallapata River and Indian River
Lagoon.
Future KelstadtBridge
Future Midway Bridge
North Fork of the St. Lucie River Floodplain Vegetation Technical Report
8
After several flooding events associated with hurricanes, the Central and Southern Florida Flood Control District was created in 1949. Shortly thereafter, the St. Lucie Canal was enlarged and deepened to nearly double its previous volume. By this time, canals and levees were used additionally to store water for irrigation during the dry season. Development was knocking at the door by 1958, when General Development Corporation began to create the community of Port St. Lucie on 80 square miles of wetlands and pine forest land adjacent to the North Fork St. Lucie River.
1944 and 1958 black and white aerials of the North Fork are pictured in Appendix A. In Appendix A-1, the dredged and bermed North Fork of today was very evident in 1944. Small tributaries on the west side of the river appear to be intact with no surrounding development, while land to the east already appears to be subdivided into sections with one north/south road for access. The canopy community within the floodplain appears to be very young. In the 1958 aerial (Appendix A-2), there are many new drainage ditches on the west side of the river. There is some development on both sides of the river, but mainly on the east side; and, the railroad is present over Five and Ten Mile creeks (Appendix A-3). The floodplain canopy community in the 1958 aerial photographs appears to be much more mature than the 1944 community. Some of the oaks and cabbage palms on the berms would be approximately 36 years old in the 1958 aerial photographs. It is not known how long commercial logging continued in this area of St. Lucie County. On the Loxahatchee River, commercial river logging ended around 1940.
North Fork of the St. Lucie River Floodplain Vegetation Technical Report
9
PURPOSE AND SCOPE
This current floodplain vegetation study was initiated by the South Florida Water Management District’s (District’s) Coastal Ecosystem Section to characterize and quantify existing floodplain vegetation communities, examine their current health, and make recommendations on the impact of enhancing current freshwater flow and salinity patterns on the North Fork St. Lucie River. Better management of flow will improve water quality, reduce sediment deposition in the St. Lucie Estuary, and reduce the impact of saltwater intrusion within the North Fork. In fact, with the digging of the inlet and channels and with rises in sea level, the St. Lucie River is becoming more saline. Therefore, it is imperative for us to examine ways to protect and enhance hydrological conditions on the remaining river floodplain communities. Data collected for this study will be useful information for updates of the minimum flows and level rule, water reservations, estuarine protection plan, and the North Fork St. Lucie River: Aquatic Preserve Management Plan (Florida Department of Natural Resources, 1984). This information will also be helpful when developing adaptive management of flows from the Ten Mile Creek Water Preserve Area and the improved management of flows from the future reservoir/stormwater treatment area facility.
Man-made impacts have greatly affected the distribution of floodplain vegetation on the St. Lucie River and its major tributaries. The formation of a regional flood control system (Figure 1) and the stabilization of the St. Lucie Inlet resulted in a redistribution of vegetative communities in the floodplains. Salt tolerant mangroves from the Indian River Lagoon system eventually established further upstream within the St. Lucie Estuary and in the lower reaches of the tributaries, while the main branch of the North Fork and its associated floodplains were dredged for flood control and navigation by the North St. Lucie Water Control District and the United States Army Corps of Engineers. Since the placement of the berms, a significant portion of the floodplain of the North Fork St. Lucie River is partially or completely isolated from the main river channel. This has resulted in altered salinity gradients, stagnant stream reaches and sedimentation within the isolated oxbow systems (Post Buckley Schuh & Jernigan, Inc., 2003).
In addition, freshwater discharges to the North Fork have been reduced by 40% (SFWMD, 2002) as a result of the diversion of water into the C-24 Canal. The Ten Mile Creek Project, which was authorized by the United States Congress under Section 528 of the Water Resources Development Act of 1996, is underway to attenuate wet season stormwater flows to the North Fork St. Lucie. The Ten Mile Creek Reservoir/Stormwater Treatment Area (Figure 3) was constructed to capture and store storm water, which will be passed through a polishing cell for additional water quality treatment and then released into the North Fork. Dry season discharges from the reservoir will recharge local irrigation canals and reduce local dependence on the Floridan Aquifer.
North Fork of the St. Lucie River Floodplain Vegetation Technical Report
10
In 2002, a minimum flows and level (MFL) criteria was established for the St. Lucie River and Estuary based on the determination that significant harm occurs to the oligohaline zone on the North Fork when net freshwater flows to the estuary are at or below zero for a period of two consecutive months for two or more years in succession. Performance measures addressed the maintenance of a salinity of 5 in the oligohaline zone at a point seven miles above the Kellstadt Bridge. Results of the analysis indicated a flow of 70 cubic feet per second (cfs) at the Gordy Road Structure would be needed to maintain the oligohaline zone seven miles above Kellstadt Bridge (RM 24) while 240 cfs would be needed to maintain a salinity of 5 at or below the bridge (Port St. Lucie Boulevard, RM 17.5).
In 2003, Post, Buckley, Schuh & Jernigan Inc., under contract to the Florida Department of Environmental Protection (FDEP), conducted a study to determine the restoration potential of reconnecting isolated oxbows and wetlands along the North Fork St. Lucie River. They determined that isolation of oxbows and floodplain wetlands had resulted in the lost use of important habitats for wading birds, fish, reptiles and other wildlife along with the loss of filtration capacity of the floodplain and the spread of salt tolerant mangroves and exotic vegetation. They concluded that this was due to changes in hydrology and the disposal of spoil material along the banks of the river. FDEP aquatic preserve staff have completed several oxbow and wetland reconnection projects along the river and are currently examining the possibility of future projects to restore hydrology to these isolated wetland systems.
On a larger scale, the Comprehensive Everglades Restoration Plan (CERP) has committed to the restoration of the North Fork St. Lucie River through its Indian River Lagoon-South Project. The primary purposes of this project are to reduce high volumes of freshwater discharges in the system and restore a more natural timing and distribution of flows to the estuary, which should, in turn, provide a healthier environment for biota populations. Through the water reservation process, the District has made a commitment to protect the quantities of water necessary for each CERP project (SFWMD, 2009). A water reservation was developed for the North Fork to ensure healthy and sustainable native fish and wildlife communities. Through the review of empirical data and literature, a low salinity zone (0 to 10) was identified within the North Fork that provides critical habitat for larval and juvenile fishes. The specific target area of this critical habitat corresponds to the area between Kelstadt and Prima Vista bridges (RM 17.2 and RM 23.1, respectively). A mean monthly flow of 130 cfs was identified to maintain this critical habitat between the bridges. Appendix B of the Technical Document to Support a Water Reservation Rule for the North Fork of the St. Lucie River (SFWMD, 2009) document contains the methodology that produced and the results of the digital elevation model for the floodplains of the North Fork St. Lucie River. The resulting model was also used to analyze floodplain inundation, storage capabilities and restoration potential for the vegetation transects of this
North Fork of the St. Lucie River Floodplain Vegetation Technical Report
11
study. The results of this modeling exercise will be discussed under the Topographical Characteristics and Geographical System Coverage section of this document.
Previous Vegetation and Water Quality Studies
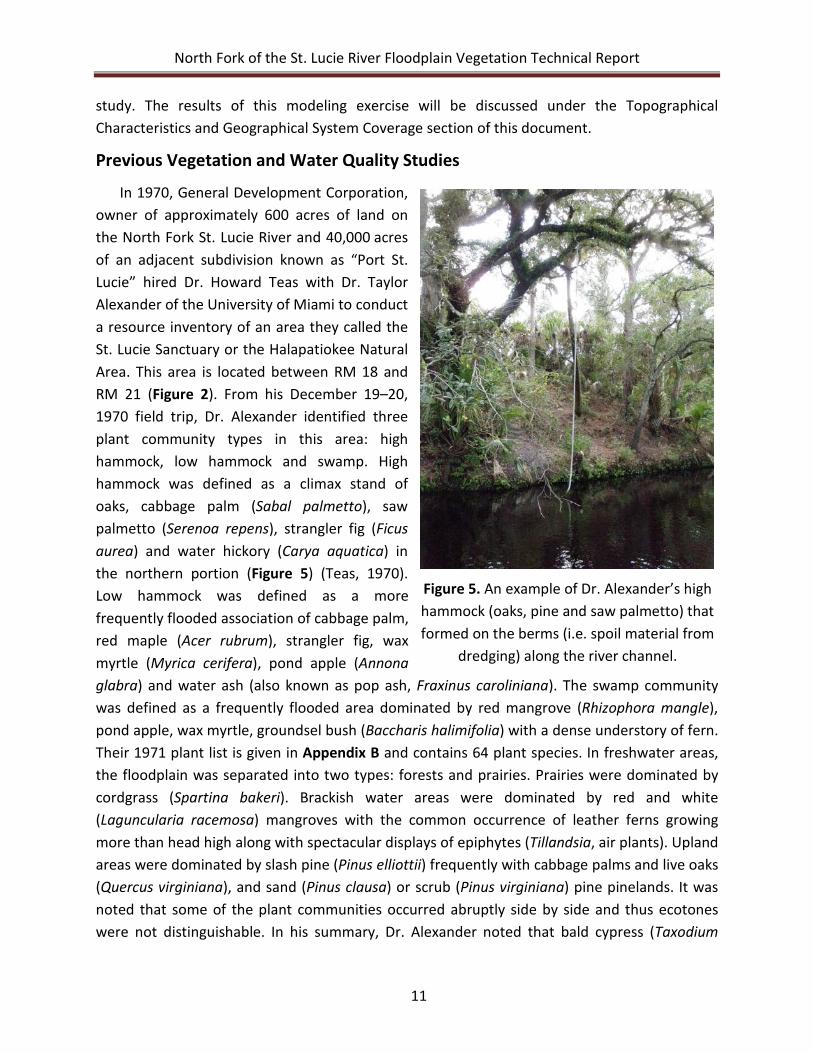
In 1970, General Development Corporation, owner of approximately 600 acres of land on the North Fork St. Lucie River and 40,000 acres of an adjacent subdivision known as “Port St. Lucie” hired Dr. Howard Teas with Dr. Taylor Alexander of the University of Miami to conduct a resource inventory of an area they called the St. Lucie Sanctuary or the Halapatiokee Natural Area. This area is located between RM 18 and RM 21 (Figure 2). From his December 19–20, 1970 field trip, Dr. Alexander identified three plant community types in this area: high hammock, low hammock and swamp. High hammock was defined as a climax stand of oaks, cabbage palm (Sabal palmetto), saw palmetto (Serenoa repens), strangler fig (Ficus aurea) and water hickory (Carya aquatica) in the northern portion (Figure 5) (Teas, 1970). Low hammock was defined as a more frequently flooded association of cabbage palm, red maple (Acer rubrum), strangler fig, wax myrtle (Myrica cerifera), pond apple (Annona glabra) and water ash (also known as pop ash, Fraxinus caroliniana). The swamp community was defined as a frequently flooded area dominated by red mangrove (Rhizophora mangle), pond apple, wax myrtle, groundsel bush (Baccharis halimifolia) with a dense understory of fern. Their 1971 plant list is given in Appendix B and contains 64 plant species. In freshwater areas, the floodplain was separated into two types: forests and prairies. Prairies were dominated by cordgrass (Spartina bakeri). Brackish water areas were dominated by red and white (Laguncularia racemosa) mangroves with the common occurrence of leather ferns growing more than head high along with spectacular displays of epiphytes (Tillandsia, air plants). Upland areas were dominated by slash pine (Pinus elliottii) frequently with cabbage palms and live oaks (Quercus virginiana), and sand (Pinus clausa) or scrub (Pinus virginiana) pine pinelands. It was noted that some of the plant communities occurred abruptly side by side and thus ecotones were not distinguishable. In his summary, Dr. Alexander noted that bald cypress (Taxodium
Figure 5. An example of Dr. Alexander’s high hammock (oaks, pine and saw palmetto) that formed on the berms (i.e. spoil material from
dredging) along the river channel.
North Fork of the St. Lucie River Floodplain Vegetation Technical Report
12
distichum) was missing from the North Fork St. Lucie River but he made no suggestions as to why they were missing. Teas’ report also examined wildlife in the form of birds, mammals, reptiles and amphibians within the study area (Teas, 1970).
In a supplemental report in 1971, Dr. Alexander collected 17 cores from trees within the floodplain to examine annual rings for age determination. In the river forest hardwood community, he collected cores from red maple, water hickory, oaks, sand pine and slash pine from the surrounding uplands. The mature red maple and hickory canopies were estimated in the 50-year class, which would date back to about 1922 when the berms were created on the North Fork. Water oak (Quercus nigra) or laurel oak (Quercus laurifolia) could not be aged because the coring device would “freeze” in the trunk and could not be extracted. The oldest of the live oak canopy was estimated at about a century old.
Additionally, Dr. Alexander noted that the tidally inundated systems contained all three species of mangrove, red, black (Avicennia germinans), and white, along with buttonbush (Conocarpus erectus) and leather fern (Acrostichum danaeifolium). Other vegetation associated with the mangrove communities included salt bush (Distichlis spicata), black needle rush (Juncus roemerianus), spike rush (Eleocharis cellulose), cordgrass (Spartina spp.), glass wort (Salicornia spp.), sea purslane (Sesuvium portulacastrum), salt wort (Batis maritima), and sea ox-eye (Borrichia frutescens). In his 1971 report, he concluded that in the tidal areas, salt sensitive species would die out while resistant species would survive and, as conditions changed, species would reinvade according to their tolerances. He noted that large areas of plants were killed in the area after Hurricane Donna in 1960 and Hurricane Betsy in 1965. He particularly noted the need to allow artificial impoundment areas to be flushed of salt.
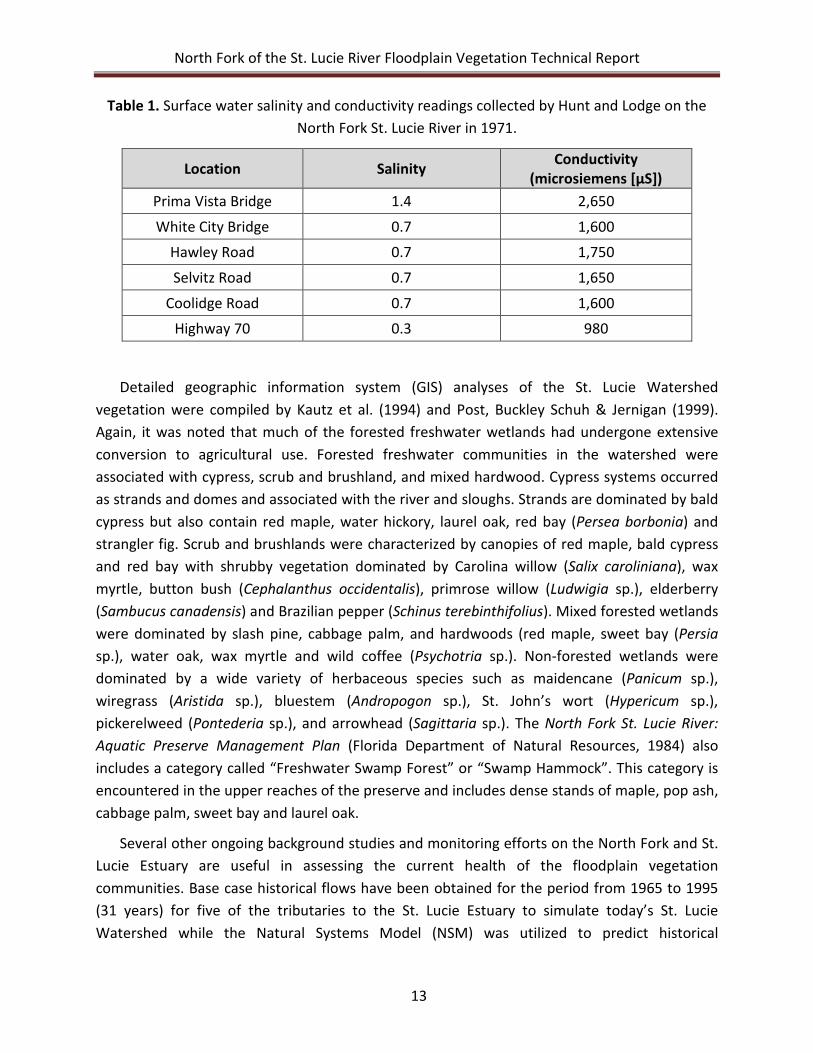
An additional report within the 1971 Teas document looked at water quality within the North Fork. The report was entitled A Limnological Reconnaissance of the North Fork of the St. Lucie River by Burton P. Hunt and Thomas E. Lodge. Their six sampling locations were located at Prima Vista Bridge (RM 23), White City Bridge (RM 27), Hawley Road (RM 29), Five Mile Creek at Highway 70, Selvitz Road (RM 30) and Coolidge Road (RM 32) on Ten Mile Creek. Table 1 Illustrates the condition of salinity and conductivity in surface waters on January 30, 1971. Additional data collected in January and March of 1971 showed salinities of 2.3, 6.7 and 1.4 at the Prima Vista Bridge and 0.8, 0.8 and 0.7 at the White City Bridge. The salinity and conductivity readings were considerably higher than what they had observed in most inland waters of South Florida.
North Fork of the St. Lucie River Floodplain Vegetation Technical Report
13
Table 1. Surface water salinity and conductivity readings collected by Hunt and Lodge on the North Fork St. Lucie River in 1971.
Location Salinity Conductivity (microsiemens [μS])
Prima Vista Bridge 1.4 2,650
White City Bridge 0.7 1,600
Hawley Road 0.7 1,750
Selvitz Road 0.7 1,650
Coolidge Road 0.7 1,600
Highway 70 0.3 980
Detailed geographic information system (GIS) analyses of the St. Lucie Watershed vegetation were compiled by Kautz et al. (1994) and Post, Buckley Schuh & Jernigan (1999). Again, it was noted that much of the forested freshwater wetlands had undergone extensive conversion to agricultural use. Forested freshwater communities in the watershed were associated with cypress, scrub and brushland, and mixed hardwood. Cypress systems occurred as strands and domes and associated with the river and sloughs. Strands are dominated by bald cypress but also contain red maple, water hickory, laurel oak, red bay (Persea borbonia) and strangler fig. Scrub and brushlands were characterized by canopies of red maple, bald cypress and red bay with shrubby vegetation dominated by Carolina willow (Salix caroliniana), wax myrtle, button bush (Cephalanthus occidentalis), primrose willow (Ludwigia sp.), elderberry (Sambucus canadensis) and Brazilian pepper (Schinus terebinthifolius). Mixed forested wetlands were dominated by slash pine, cabbage palm, and hardwoods (red maple, sweet bay (Persia sp.), water oak, wax myrtle and wild coffee (Psychotria sp.). Non-forested wetlands were dominated by a wide variety of herbaceous species such as maidencane (Panicum sp.), wiregrass (Aristida sp.), bluestem (Andropogon sp.), St. John’s wort (Hypericum sp.), pickerelweed (Pontederia sp.), and arrowhead (Sagittaria sp.). The North Fork St. Lucie River: Aquatic Preserve Management Plan (Florida Department of Natural Resources, 1984) also includes a category called “Freshwater Swamp Forest” or “Swamp Hammock”. This category is encountered in the upper reaches of the preserve and includes dense stands of maple, pop ash, cabbage palm, sweet bay and laurel oak.
Several other ongoing background studies and monitoring efforts on the North Fork and St. Lucie Estuary are useful in assessing the current health of the floodplain vegetation communities. Base case historical flows have been obtained for the period from 1965 to 1995 (31 years) for five of the tributaries to the St. Lucie Estuary to simulate today’s St. Lucie Watershed while the Natural Systems Model (NSM) was utilized to predict historical
North Fork of the St. Lucie River Floodplain Vegetation Technical Report
14
hydrological conditions (SFWMD, 2002). A two-dimensional hydrodynamic/salinity model was developed to predict salinity conditions based on tidal exchange, river flow and basin configuration (Hu, 2000). More specifically the model was developed to analyze the relationship between freshwater flow (from Ten Mile Creek, Five Mile Creek, rainfall and groundwater seepage) and salinity at various distances along the river. A three-dimensional estuarine hydrodynamic model (Curvilinear Hydrodynamics Three-Dimensional [CH3D] code) was developed to simulate salinity within estuarine portions of the St. Lucie River (SFWMD, 2009). The model was used to establish the salinity performance measure (i.e. 1 isohaline) and flow target for the North Fork St. Lucie River. In addition, a watershed hydrologic model (WaSh) was created to evaluate watershed inflows with future CERP projects and without conditions, while an OPTI (Version 6) Model was developed to simulate delivery of the flows in the reservoirs to meet target flow distributions.
Topographical Characteristics and Geographical Information System Coverage
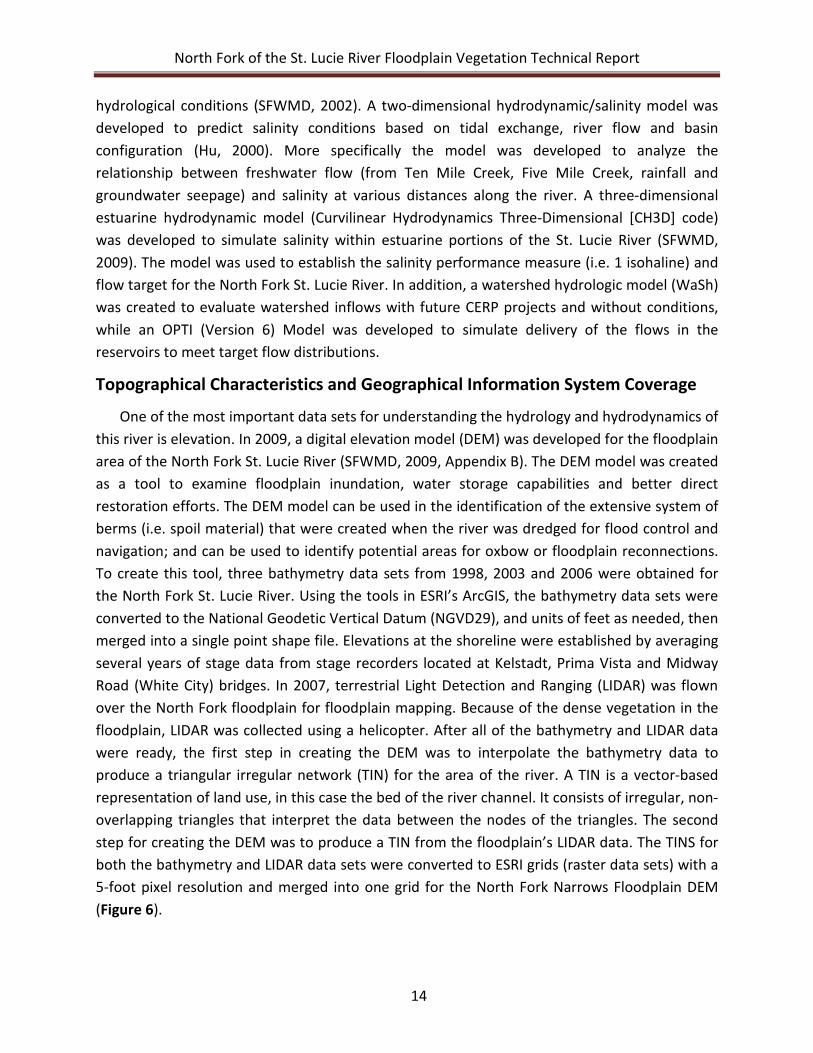
One of the most important data sets for understanding the hydrology and hydrodynamics of this river is elevation. In 2009, a digital elevation model (DEM) was developed for the floodplain area of the North Fork St. Lucie River (SFWMD, 2009, Appendix B). The DEM model was created as a tool to examine floodplain inundation, water storage capabilities and better direct restoration efforts. The DEM model can be used in the identification of the extensive system of berms (i.e. spoil material) that were created when the river was dredged for flood control and navigation; and can be used to identify potential areas for oxbow or floodplain reconnections. To create this tool, three bathymetry data sets from 1998, 2003 and 2006 were obtained for the North Fork St. Lucie River. Using the tools in ESRI’s ArcGIS, the bathymetry data sets were converted to the National Geodetic Vertical Datum (NGVD29), and units of feet as needed, then merged into a single point shape file. Elevations at the shoreline were established by averaging several years of stage data from stage recorders located at Kelstadt, Prima Vista and Midway Road (White City) bridges. In 2007, terrestrial Light Detection and Ranging (LIDAR) was flown over the North Fork floodplain for floodplain mapping. Because of the dense vegetation in the floodplain, LIDAR was collected using a helicopter. After all of the bathymetry and LIDAR data were ready, the first step in creating the DEM was to interpolate the bathymetry data to produce a triangular irregular network (TIN) for the area of the river. A TIN is a vector-based representation of land use, in this case the bed of the river channel. It consists of irregular, non-overlapping triangles that interpret the data between the nodes of the triangles. The second step for creating the DEM was to produce a TIN from the floodplain’s LIDAR data. The TINS for both the bathymetry and LIDAR data sets were converted to ESRI grids (raster data sets) with a 5-foot pixel resolution and merged into one grid for the North Fork Narrows Floodplain DEM (Figure 6).
North Fork of the St. Lucie River Floodplain Vegetation Technical Report
15
Figure 6. LIDAR TIN of the North Fork St. Lucie River illustrating the effect of spoil mounds (berms) reducing the inundation of the floodplain areas adjacent to the Oxbow Eco-Center
(RM 25.7).
The DEM was then used to establish the river stage needed to connect the river’s main channel to the floodplain for fish habitat and enhancing hydroperiods for the wetland communities. Floodplain inundation was examined for four different stages of the river—1 foot, 1.5 feet, 2 feet and 2.5 feet. The results of this analysis indicated that a stage of approximately 2 feet is needed for significant floodplain inundation (SFWMD, 2009, Appendix B). In addition, from examining the existing stage data, it was determined that there was not a significant difference between stage levels at the three monitoring sites; therefore, the DEM Model could be applied throughout the North Fork and its floodplain. It was concluded that as the river is managed today, a stage of floodplain inundation can be reached but not for any significant period of duration.
Floodplain
Upland
North Fork of the St. Lucie River Floodplain Vegetation Technical Report
16
Ecological Conceptual Model of Floodplain Vegetation
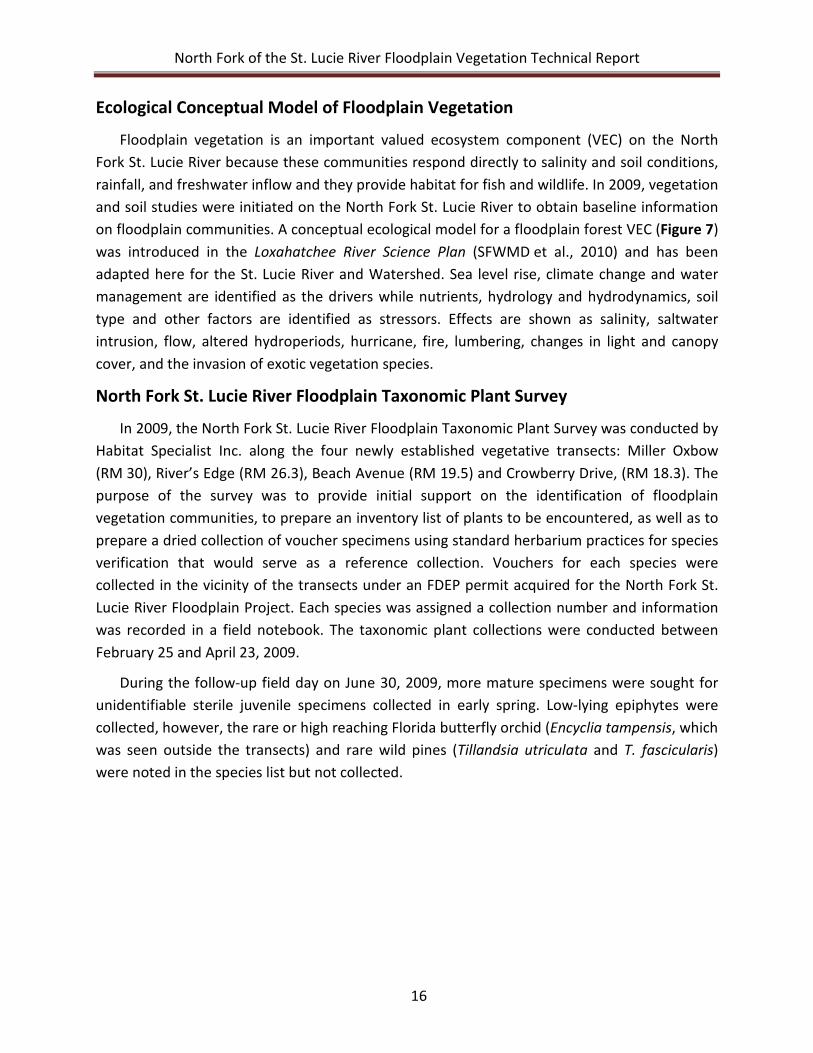
Floodplain vegetation is an important valued ecosystem component (VEC) on the North Fork St. Lucie River because these communities respond directly to salinity and soil conditions, rainfall, and freshwater inflow and they provide habitat for fish and wildlife. In 2009, vegetation and soil studies were initiated on the North Fork St. Lucie River to obtain baseline information on floodplain communities. A conceptual ecological model for a floodplain forest VEC (Figure 7) was introduced in the Loxahatchee River Science Plan (SFWMD et al., 2010) and has been adapted here for the St. Lucie River and Watershed. Sea level rise, climate change and water management are identified as the drivers while nutrients, hydrology and hydrodynamics, soil type and other factors are identified as stressors. Effects are shown as salinity, saltwater intrusion, flow, altered hydroperiods, hurricane, fire, lumbering, changes in light and canopy cover, and the invasion of exotic vegetation species.
North Fork St. Lucie River Floodplain Taxonomic Plant Survey
In 2009, the North Fork St. Lucie River Floodplain Taxonomic Plant Survey was conducted by Habitat Specialist Inc. along the four newly established vegetative transects: Miller Oxbow (RM 30), River’s Edge (RM 26.3), Beach Avenue (RM 19.5) and Crowberry Drive, (RM 18.3). The purpose of the survey was to provide initial support on the identification of floodplain vegetation communities, to prepare an inventory list of plants to be encountered, as well as to prepare a dried collection of voucher specimens using standard herbarium practices for species verification that would serve as a reference collection. Vouchers for each species were collected in the vicinity of the transects under an FDEP permit acquired for the North Fork St. Lucie River Floodplain Project. Each species was assigned a collection number and information was recorded in a field notebook. The taxonomic plant collections were conducted between February 25 and April 23, 2009.
During the follow-up field day on June 30, 2009, more mature specimens were sought for unidentifiable sterile juvenile specimens collected in early spring. Low-lying epiphytes were collected, however, the rare or high reaching Florida butterfly orchid (Encyclia tampensis, which was seen outside the transects) and rare wild pines (Tillandsia utriculata and T. fascicularis) were noted in the species list but not collected.
North Fork of the St. Lucie River Floodplain Vegetation Technical Report
17
Figure 7. Conceptual ecological model of a South Florida river floodplain and adapted for the St. Lucie River and Watershed floodplain communities.
North Fork of the St. Lucie River Floodplain Vegetation Technical Report
18
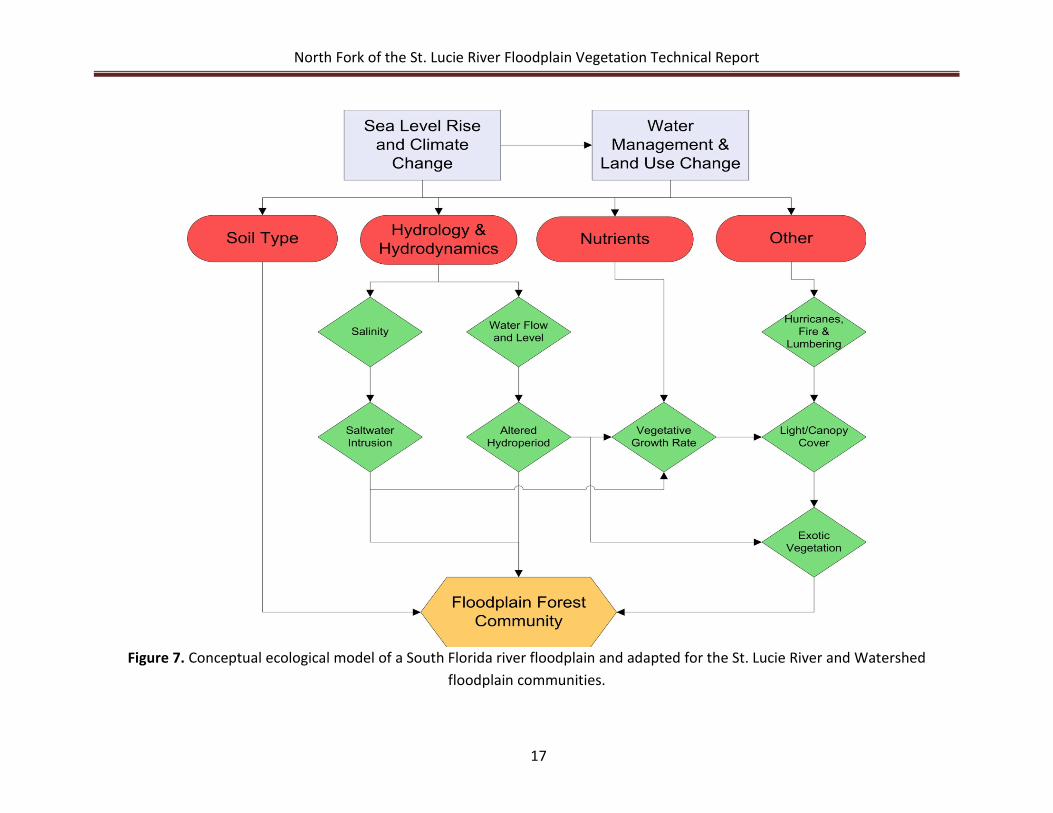
As a result of the initial taxonomic plant survey, 163 plant species were identified along the four transects. Appendix C includes a list of the plant species that were encountered. The percent of wetland indicator species ranged from 34% at Miller Oxbow to 59% at Crowberry Drive. The entire voucher specimen collection was photographed and is available on compact disk and the collection itself is stored at District headquarters for reference use. Figure 8 is a photograph of a dried specimen of red bay from the collection.
Figure 8. Photograph of a red bay voucher specimen from the North Fork St. Lucie River Floodplain Study Collection.
North Fork of the St. Lucie River Floodplain Vegetation Technical Report
19
METHODS
Air, Temperature and Rainfall
Mean daily air temperatures (° C) and rainfall in inches were obtained for the years 1995 to 2010. The Savannas Preserve Weather Station (SVWX) was used for air temperature while data from water control structures on the C-23, C-24 and C-25 canals, and the Gordy Road structure (North Fork) were used for rainfall. All of these databases are available in the District’s corporate environmental database, DBHYDRO.
Soil Characteristics, Soil Electrical Conductivity and Soil Moisture Sampling The Soil Survey of St. Lucie County Area, Florida was used to determine general soil types
along each transect (USDA et al., 1977). Field work for these surveys was conducted between 1973 and 1977 by the collaborative effort of the United States Department of Agriculture’s Soil Conservation Service with University of Florida’s Institute of Food and Agricultural Sciences and Agricultural Experiment Stations, Soil Science Department, and the Florida Department of Agriculture and Consumer Services. Soil electrical conductivity (EC) and percent soil moisture (%SM) for our study were examined with an Aquaterr EC-300 probe at each segment pole (i.e. every 10 meters) once during the field study. River Flow and Salinity
Flow data has been measured daily on the St. Lucie River since 1964 from District water management structures—S-80 (C-44 Canal), S-49 (C-24 Canal), and S-97 (C-23 Canal). The Gordy Road Structure is operated by the North St. Lucie Water Control District. Early flow data for the Gordy Road Structure was scarce; however, flow data was available for the period from 1999 to 2011. The WaSh Model was used to provide flow from areas not covered by the above structures. A groundwater model and a channel routing model were added to the WaSh model to simulate hydrology in watersheds with high groundwater tables and dense drainage canal networks like the St. Lucie River. Surface flow from the tidal North Fork and tidal South Fork were treated as distributed flow. The CH3D Model was developed to simulate the hydrodynamics/salinity and sediment transport of the St. Lucie Estuary. Model development, calibration and verification are summarized in the Technical Document to Support a Water Reservation Rule for the North Fork St. Lucie River (SFWMD, 2009, Appendix D). The model uses data collected over a nine-year period (1997–2005).
Since 1997 until the present day, almost continuous stage, salinity and temperature have been measured at 15-minute intervals at the A1A, US1 and Kelstadt bridges. Monitoring stations at the Prima Vista and Midway bridges were added in 2003. All of the hydrological data mentioned above is stored within the District’s DBHYDRO database. Stage analysis was not
North Fork of the St. Lucie River Floodplain Vegetation Technical Report
20
included in this report, because it was concluded that the average stage at the three remaining monitoring sites on the North Fork differed by only 0.16 feet (SFWMD, 2009, Appendix B).
Vegetative Sampling
On November 1 and 29, and December 10, 2007 car and boat reconnaissance trips were conducted along the North Fork St. Lucie River to groundtruth floodplain vegetation adjacent to the main channel and several oxbows. Major vegetative species and berms were noted on enlarged 2005 aerial maps of the river system and potential sites for belt transects were located.
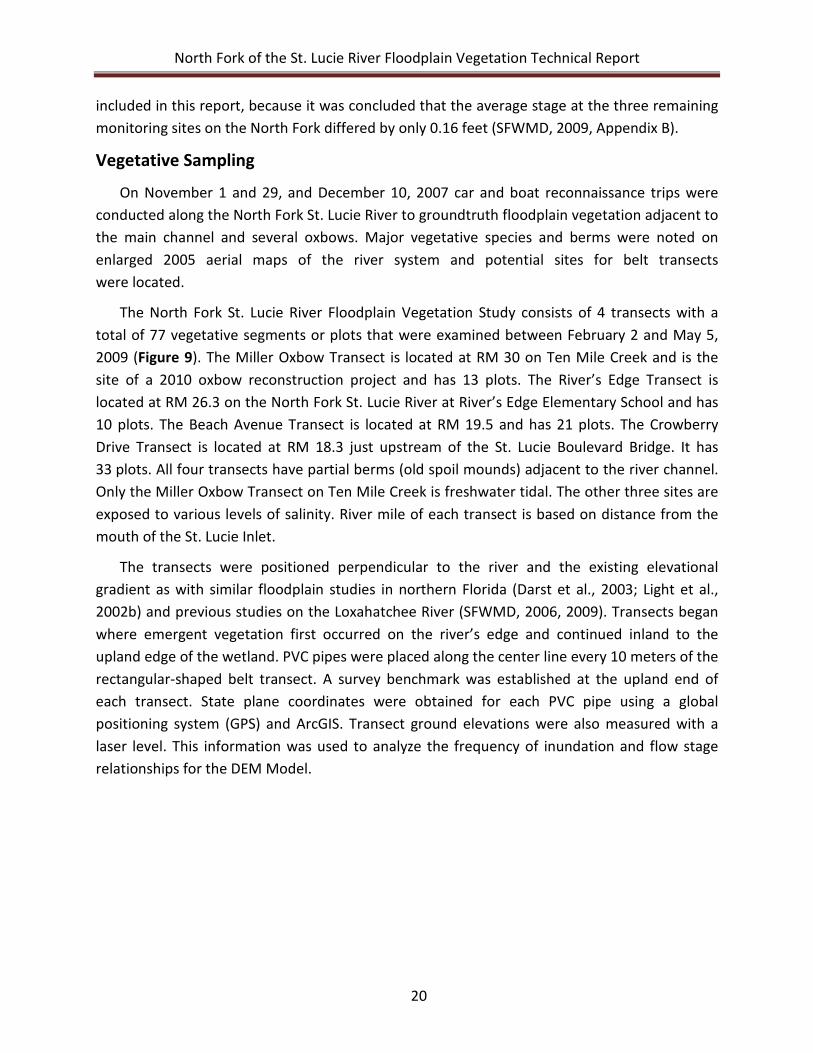
The North Fork St. Lucie River Floodplain Vegetation Study consists of 4 transects with a total of 77 vegetative segments or plots that were examined between February 2 and May 5, 2009 (Figure 9). The Miller Oxbow Transect is located at RM 30 on Ten Mile Creek and is the site of a 2010 oxbow reconstruction project and has 13 plots. The River’s Edge Transect is located at RM 26.3 on the North Fork St. Lucie River at River’s Edge Elementary School and has 10 plots. The Beach Avenue Transect is located at RM 19.5 and has 21 plots. The Crowberry Drive Transect is located at RM 18.3 just upstream of the St. Lucie Boulevard Bridge. It has 33 plots. All four transects have partial berms (old spoil mounds) adjacent to the river channel. Only the Miller Oxbow Transect on Ten Mile Creek is freshwater tidal. The other three sites are exposed to various levels of salinity. River mile of each transect is based on distance from the mouth of the St. Lucie Inlet.
The transects were positioned perpendicular to the river and the existing elevational gradient as with similar floodplain studies in northern Florida (Darst et al., 2003; Light et al., 2002b) and previous studies on the Loxahatchee River (SFWMD, 2006, 2009). Transects began where emergent vegetation first occurred on the river’s edge and continued inland to the upland edge of the wetland. PVC pipes were placed along the center line every 10 meters of the rectangular-shaped belt transect. A survey benchmark was established at the upland end of each transect. State plane coordinates were obtained for each PVC pipe using a global positioning system (GPS) and ArcGIS. Transect ground elevations were also measured with a laser level. This information was used to analyze the frequency of inundation and flow stage relationships for the DEM Model.
North Fork of the St. Lucie River Floodplain Vegetation Technical Report
21
Figure 9. Location of vegetation transects on the North Fork St. Lucie River.
North Fork of the St. Lucie River Floodplain Vegetation Technical Report
22
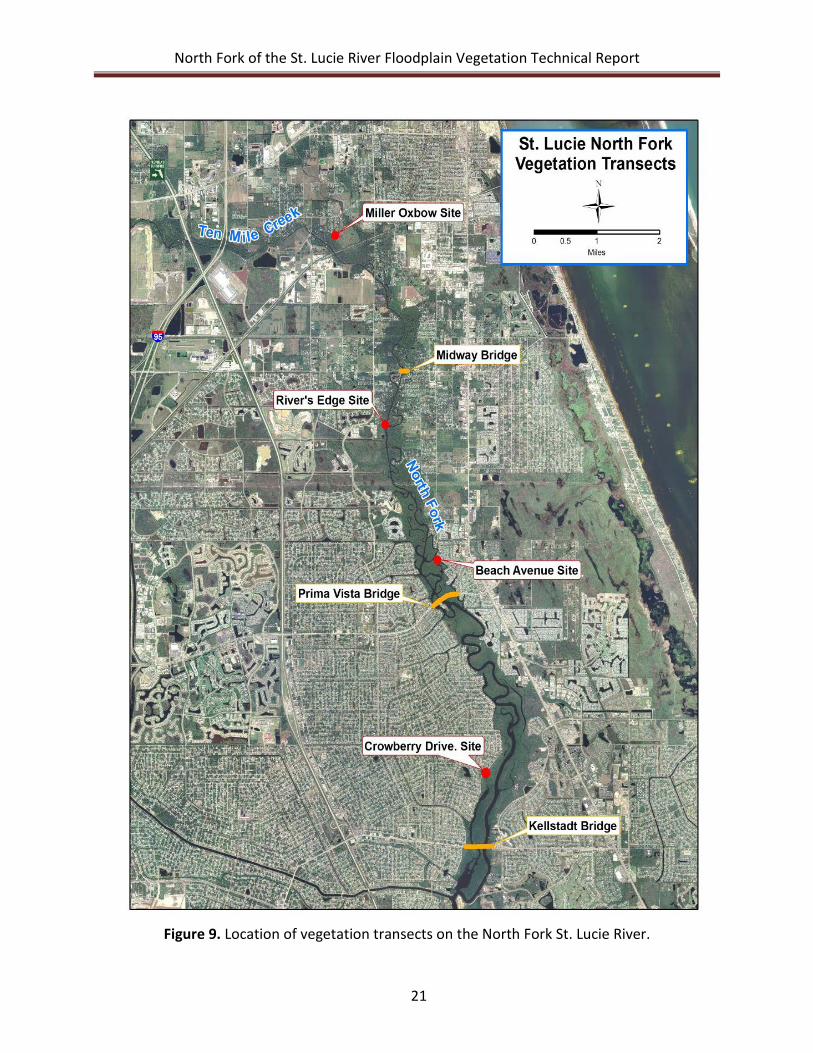
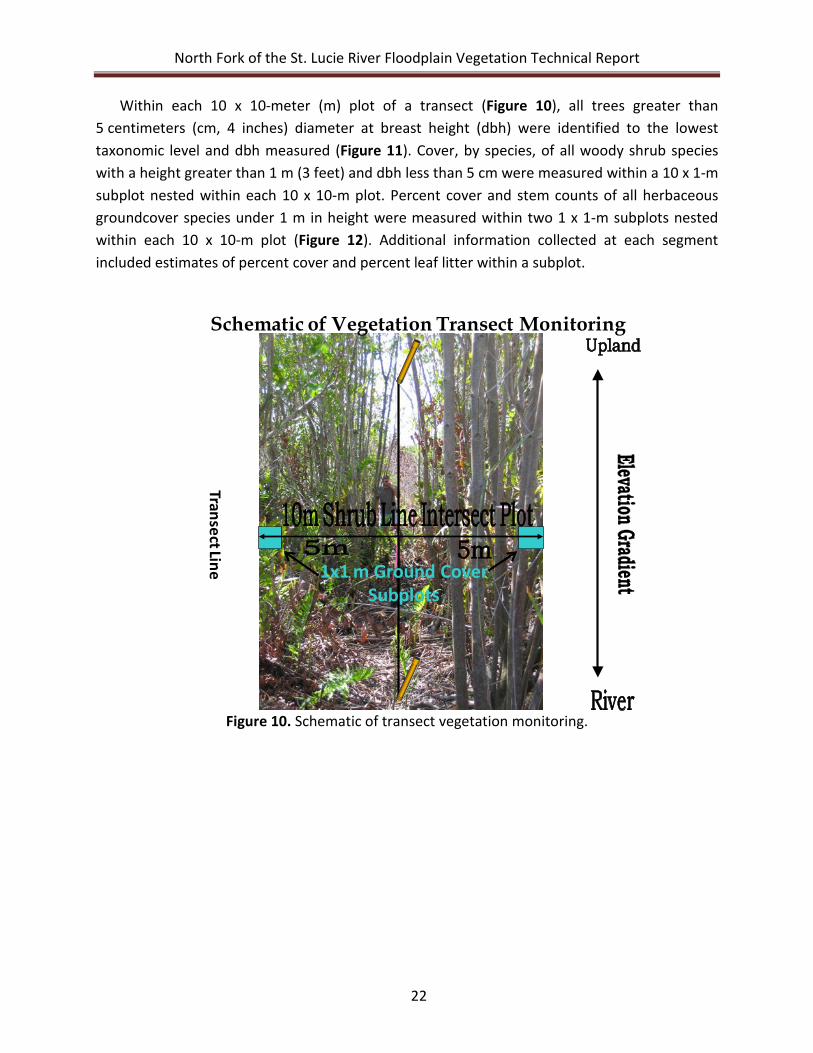
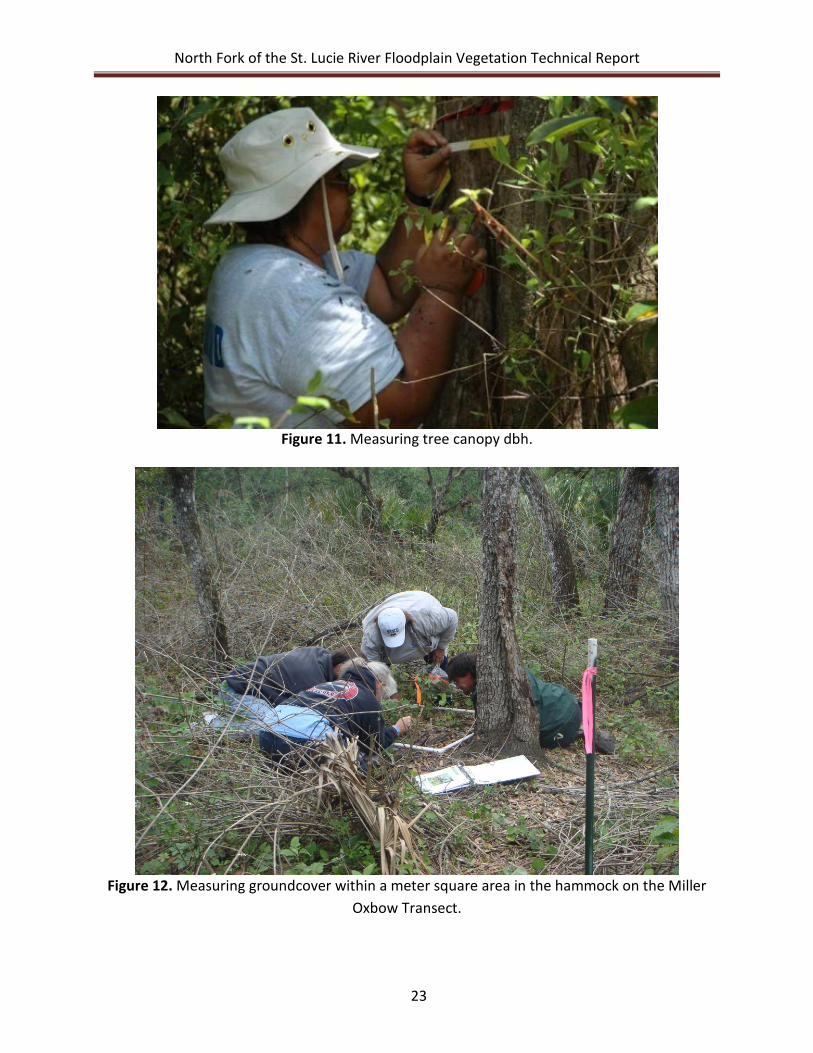
Within each 10 x 10-meter (m) plot of a transect (Figure 10), all trees greater than 5 centimeters (cm, 4 inches) diameter at breast height (dbh) were identified to the lowest taxonomic level and dbh measured (Figure 11). Cover, by species, of all woody shrub species with a height greater than 1 m (3 feet) and dbh less than 5 cm were measured within a 10 x 1-m subplot nested within each 10 x 10-m plot. Percent cover and stem counts of all herbaceous groundcover species under 1 m in height were measured within two 1 x 1-m subplots nested within each 10 x 10-m plot (Figure 12). Additional information collected at each segment included estimates of percent cover and percent leaf litter within a subplot.
Figure 10. Schematic of transect vegetation monitoring.
Transect Line 1x1 m Ground Cover Subplots
Schematic of Vegetation Transect Monitoring
North Fork of the St. Lucie River Floodplain Vegetation Technical Report
23
Figure 11. Measuring tree canopy dbh.
Figure 12. Measuring groundcover within a meter square area in the hammock on the Miller Oxbow Transect.
North Fork of the St. Lucie River Floodplain Vegetation Technical Report
24
Plant and Forest Type Identification
Plants were identified to the lowest possible taxonomic level. Plant identification and nomenclature followed that of Wunderlin and Hansen (2003). Plant species, common names and electronic code names are listed in Appendix C. The identification of floodplain forest types was based on the canopy tree species that generally grow together in recognizable communities such as swamps, bottomland hardwoods and hammocks. The process that was used for this study and the Loxahatchee River Study was modified from the work of Darst et al., 2003 and 2008 on the floodplain forests of the Suwannee and Apalachicola rivers of northern Florida. The relative basal area of each tree species within a plot was calculated by dividing the total basal area of a species by the total basal area of all species measured within the plot. Multi-trunk trees were considered separate trees for this analysis. Adjustments were made to a few plots where the canopy clearly did not reflect the character of surrounding shrub and groundcover communities due to microtopography or, in some cases, due to the absence of any canopy.
Plant community analysis was conducted on the canopy, shrub and groundcover layers. Canopy data were examined for species richness, abundance, distribution, basal area, and dbh frequency. Shrub and groundcover data were examined for species richness, percent cover and overall distribution by forest type. Additionally, seedling and saplings counts were made within groundcover meter square areas. With regard to shrub and groundcover data, notation was made of each species wetland indicator status using categories created by the United States Department of Agriculture’s Natural Resources Conservation Service. Those categories included obligate wetland (OBL), facultative wetland (FACW), facultative (FAC), facultative upland (FACU), and obligate upland (U). The definitions of these terms are included in Appendix F.
Statistical Analysis
Statistical programs used to analyze the data for this study included Microsoft Excel and PC-ORD (McCune and Grace, 2002; Peck, 2010; and McCune and Mefford, 2011). PC-ORD Version 6.0 was used to perform a variety of ordination analyses with canopy abundance and shrub percent cover data sets. Those plots without canopy/shrub were removed from the analysis along with those plots that were identified as marsh. All 16 canopy species identified during the study were included in the ordination analysis in order to observe diversity by forest type community. Of the 44 shrub species encountered during the study, 40 of the most common species were used in the ordination analysis. A complete listing of the six letter genus/species codes can be obtained from the list of species in Appendix C.
Cluster analysis (Bray Curtis) and canonical correspondence analysis (CCA) were used to cluster the matrix of canopy and shrub species with the matrix of environmental variables. Prior to clustering, a general relativization by column (i.e. species) was performed on both canopy
North Fork of the St. Lucie River Floodplain Vegetation Technical Report
25
and shrub data sets to reduce the effect of responses with high totals of abundance and percent cover relative to those with lower values. This measure retains the variation in abundance and percent cover across sample units, but tends to reduce the influence of very common species and increases that of rare species.
For the CCA analysis, both the abundance and percent cover matrixes and environmental variables (%SM and EC) were transformed using natural log+1 and Ward’s Method was used to link the groups while Euclidean (Pythagorean) was used as a measure of distance (Sorensen, Bray-Curtis). By default, Hill’s scaling was used to rescale the site scores. The environmental variables included EC, %SM and river mile. Statistical correlations (Pearson Product Moment and Kendall tau [Rank]) were calculated for the relationships between the plant species and the environmental variables.

North Fork of the St. Lucie River Floodplain Vegetation Technical Report
26
North Fork of the St. Lucie River Floodplain Vegetation Technical Report
27
RESULTS
Air, Temperature and Rainfall Minimum daily and average monthly air temperatures at the Savannas Preserve Weather
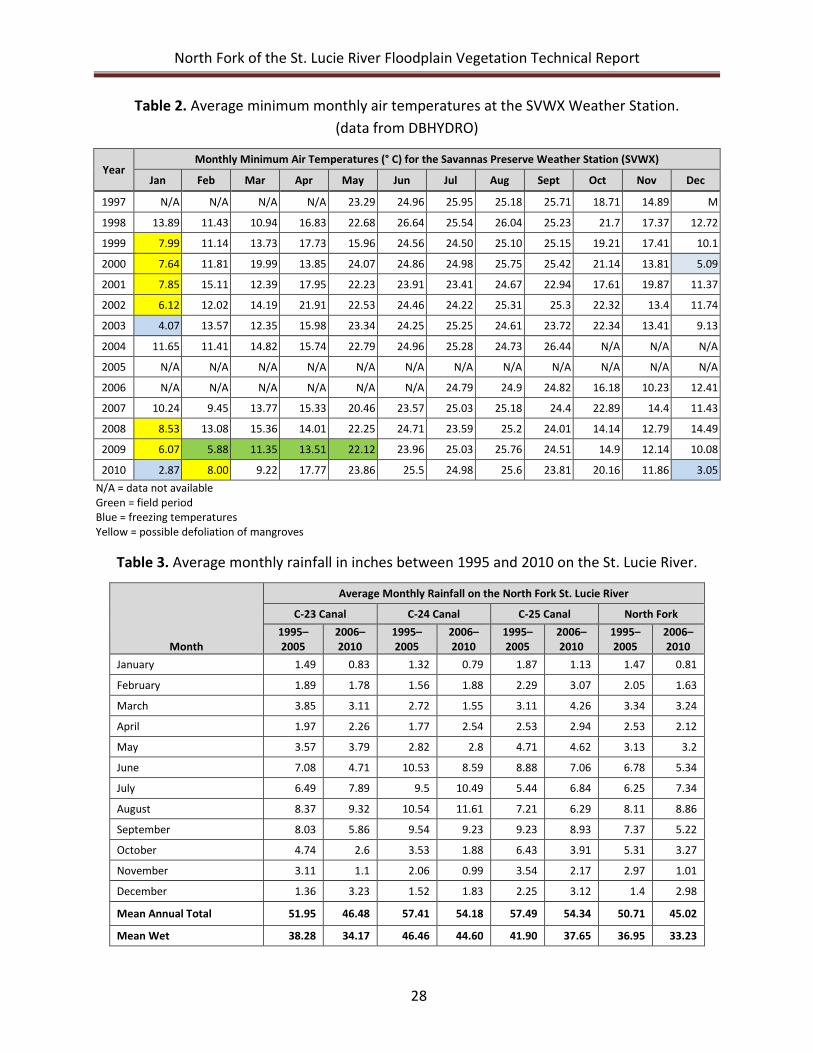
Station (SVWX) were examined between 1997 and 2010 to look for periods of cold and freezing weather that might have affected vegetative communities, particularly the mangroves (Table 2). Once a low minimum temperature was identified, the mean daily air temperatures were examined to determine the length of the period of low temperatures; because, mangroves reportedly may defoliate at 7.2° C (45° F, yellow spaces in Table 2) and may be more severely damaged or killed at temperatures near freezing—0 to 4° C (32–39° F, blue spaces)—for more than 3 days (Odum et al., 1982). January and December 2010 had the lowest minimal monthly air temperature over the 14-year period; however, daily average air temperatures were below 7.2° C for two and three days, respectively. Both January and February 2009 had minimum monthly air temperatures in the range to defoliate mangroves. These two events only lasted a day; however, canopy size white mangroves (> 5-cm dbh) with dead foliage were observed on two plots (CD130 and CD170) of the Crowberry Drive Transect. These two plots coincided with the edges of an open area of several plots with no canopy but primarily sawgrass as the main groundcover. EC and %SM within these plots ranged from 1,506 to 1,516 centisiemens per meter (cS/m) and 74 to 78% moisture, respectively, which is in range for white mangroves. Large leather ferns also appeared to be affected by cold air temperatures in this open area.
Average monthly rainfall on the North Fork St Lucie River for 10- and 5-year periods between 1995 and 2010 are given in Table 3 for the C-23, C-24 and C-25 canals, and North Fork (Gordy Road) structures. Highest rainfall values were reported from June to September of each year. Of the four subbasins in Table 3, North Fork had the lowest mean annual total rainfall values. Both 1995 and 2010 were reportedly above average wet years, while 2001, 2002 and 2007 were drought years. Both Hurricanes Frances and Jeanne impacted the St. Lucie River Watershed during September 2004. Runoff from these storms probably accounts for the higher average monthly values in all four subbasins during the 1995–2005 period. Monthly rainfall totals (DBHYDRO) for the SVWX weather station are given in Figure 13 for the year leading up to and during the field survey. After a very wet August 2008 (16.92 inches), conditions were very dry leading up to the field survey period. Monthly rainfall totals were 0.43, 0.4 and 0.15 inches in December 2008 through February 2009, respectively. The wet season began in May with rainfall monthly totals reaching 5.21 inches.
North Fork of the St. Lucie River Floodplain Vegetation Technical Report
28
Table 2. Average minimum monthly air temperatures at the SVWX Weather Station. (data from DBHYDRO)
Year Monthly Minimum Air Temperatures (° C) for the Savannas Preserve Weather Station (SVWX)
Jan Feb Mar Apr May Jun Jul Aug Sept Oct Nov Dec
1997 N/A N/A N/A N/A 23.29 24.96 25.95 25.18 25.71 18.71 14.89 M
1998 13.89 11.43 10.94 16.83 22.68 26.64 25.54 26.04 25.23 21.7 17.37 12.72
1999 7.99 11.14 13.73 17.73 15.96 24.56 24.50 25.10 25.15 19.21 17.41 10.1
2000 7.64 11.81 19.99 13.85 24.07 24.86 24.98 25.75 25.42 21.14 13.81 5.09
2001 7.85 15.11 12.39 17.95 22.23 23.91 23.41 24.67 22.94 17.61 19.87 11.37
2002 6.12 12.02 14.19 21.91 22.53 24.46 24.22 25.31 25.3 22.32 13.4 11.74
2003 4.07 13.57 12.35 15.98 23.34 24.25 25.25 24.61 23.72 22.34 13.41 9.13
2004 11.65 11.41 14.82 15.74 22.79 24.96 25.28 24.73 26.44 N/A N/A N/A
2005 N/A N/A N/A N/A N/A N/A N/A N/A N/A N/A N/A N/A
2006 N/A N/A N/A N/A N/A N/A 24.79 24.9 24.82 16.18 10.23 12.41
2007 10.24 9.45 13.77 15.33 20.46 23.57 25.03 25.18 24.4 22.89 14.4 11.43
2008 8.53 13.08 15.36 14.01 22.25 24.71 23.59 25.2 24.01 14.14 12.79 14.49
2009 6.07 5.88 11.35 13.51 22.12 23.96 25.03 25.76 24.51 14.9 12.14 10.08
2010 2.87 8.00 9.22 17.77 23.86 25.5 24.98 25.6 23.81 20.16 11.86 3.05 N/A = data not available Green = field period Blue = freezing temperatures Yellow = possible defoliation of mangroves
Table 3. Average monthly rainfall in inches between 1995 and 2010 on the St. Lucie River.
Month
Average Monthly Rainfall on the North Fork St. Lucie River
C-23 Canal C-24 Canal C-25 Canal North Fork 1995–2005
2006–2010
1995–2005
2006–2010
1995–2005
2006–2010
1995–2005
2006–2010
January 1.49 0.83 1.32 0.79 1.87 1.13 1.47 0.81
February 1.89 1.78 1.56 1.88 2.29 3.07 2.05 1.63
March 3.85 3.11 2.72 1.55 3.11 4.26 3.34 3.24
April 1.97 2.26 1.77 2.54 2.53 2.94 2.53 2.12
May 3.57 3.79 2.82 2.8 4.71 4.62 3.13 3.2
June 7.08 4.71 10.53 8.59 8.88 7.06 6.78 5.34
July 6.49 7.89 9.5 10.49 5.44 6.84 6.25 7.34
August 8.37 9.32 10.54 11.61 7.21 6.29 8.11 8.86
September 8.03 5.86 9.54 9.23 9.23 8.93 7.37 5.22
October 4.74 2.6 3.53 1.88 6.43 3.91 5.31 3.27
November 3.11 1.1 2.06 0.99 3.54 2.17 2.97 1.01
December 1.36 3.23 1.52 1.83 2.25 3.12 1.4 2.98
Mean Annual Total 51.95 46.48 57.41 54.18 57.49 54.34 50.71 45.02
Mean Wet 38.28 34.17 46.46 44.60 41.90 37.65 36.95 33.23

North Fork of the St. Lucie River Floodplain Vegetation Technical Report
29
Figure 13. Monthly rainfall totals from SVWX weather station prior to and during the field survey (DBHYDRO).
Soil Types, Soil Electrical Conductivity and Soil Moisture
According to the 1977 United States Department of Agriculture soil survey map, there are 14 major soil types on the North Fork St. Lucie River floodplain. Appendix D contains a list and definition of these soil types along with general hydrological conditions (e.g. general plant community type, depth of water table and duration of flooding), and area soil maps. These soils ranged from white to gray fine sands to inland and coastal organic mucks. The most notable change in floodplain soil type occurs between RM 23.5 and RM 24 (Figure 2) on the North Fork. This change is located just upstream of the Prima Vista Bridge and downstream of the Beach Avenue Transect and appears to be at a junction where the river channel begins to widen (Appendix D, Figure D-2, page 33 plate). In this area, there is a switch in soil type from primarily Fluvaquents (code 14) to Terra Ceia Muck (code 45). Both of these are poorly drained soils; however, Terra Ceia Muck is generally inundated for a longer period of time and found more on the lower floodplains of rivers and streams than Fluvaquents. Fluvaquents have been characterized as being young, recently deposited sediment on floodplains of rivers and creeks with primarily a canopy of cabbage palms and wetland hardwoods with an understory of saw palmetto and herbaceous plants. Terra Ceia Muck is more characteristic of freshwater marshes or depressions with willow, sweet bay, maple and wax myrtle and an understory of giant ferns, vines and open areas of sawgrass.
Of our four vegetative transect sites, half are characterized as Terra Ceia Muck and half as Fluvaquents. At the most downstream transect, Crowberry Drive (RM 18.3, Appendix D, Figure D-2, page 39 plate) the hammock area adjacent to the roadway contained Electra Fine Sands and the swamp area contained Terra Ceia Muck. Electra Fine Sands are somewhat poorly
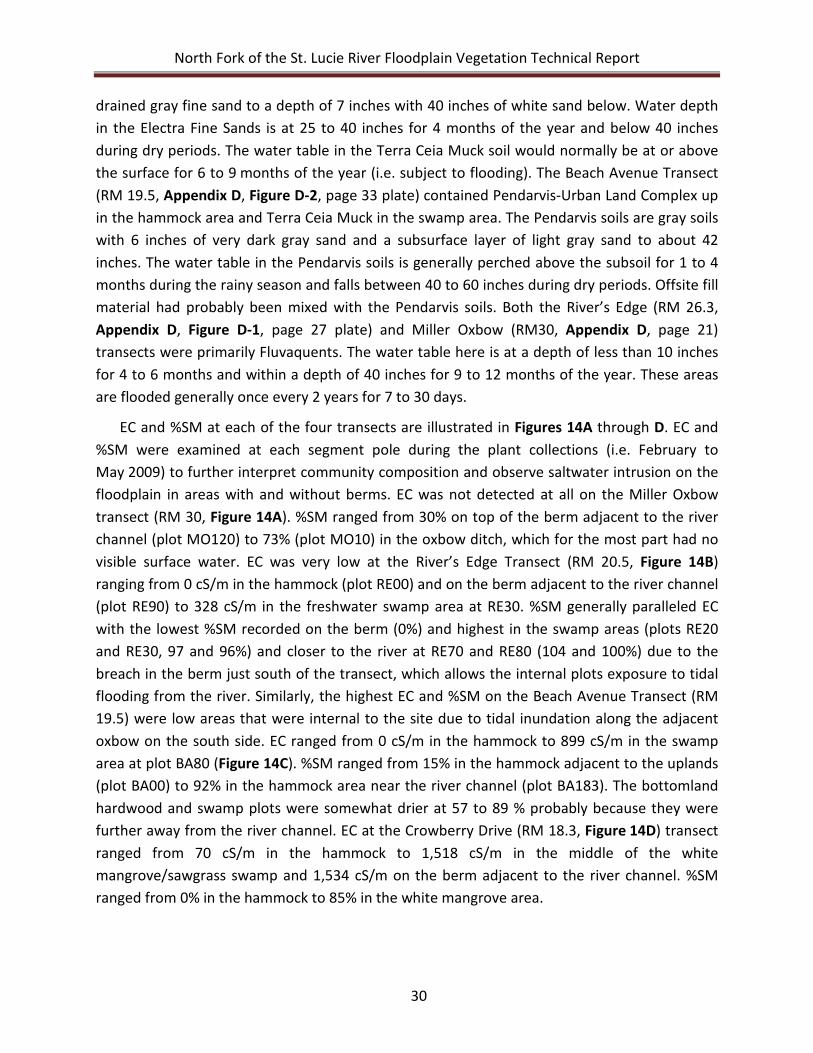
North Fork of the St. Lucie River Floodplain Vegetation Technical Report
30
drained gray fine sand to a depth of 7 inches with 40 inches of white sand below. Water depth in the Electra Fine Sands is at 25 to 40 inches for 4 months of the year and below 40 inches during dry periods. The water table in the Terra Ceia Muck soil would normally be at or above the surface for 6 to 9 months of the year (i.e. subject to flooding). The Beach Avenue Transect (RM 19.5, Appendix D, Figure D-2, page 33 plate) contained Pendarvis-Urban Land Complex up in the hammock area and Terra Ceia Muck in the swamp area. The Pendarvis soils are gray soils with 6 inches of very dark gray sand and a subsurface layer of light gray sand to about 42 inches. The water table in the Pendarvis soils is generally perched above the subsoil for 1 to 4 months during the rainy season and falls between 40 to 60 inches during dry periods. Offsite fill material had probably been mixed with the Pendarvis soils. Both the River’s Edge (RM 26.3, Appendix D, Figure D-1, page 27 plate) and Miller Oxbow (RM30, Appendix D, page 21) transects were primarily Fluvaquents. The water table here is at a depth of less than 10 inches for 4 to 6 months and within a depth of 40 inches for 9 to 12 months of the year. These areas are flooded generally once every 2 years for 7 to 30 days.
EC and %SM at each of the four transects are illustrated in Figures 14A through D. EC and %SM were examined at each segment pole during the plant collections (i.e. February to May 2009) to further interpret community composition and observe saltwater intrusion on the floodplain in areas with and without berms. EC was not detected at all on the Miller Oxbow transect (RM 30, Figure 14A). %SM ranged from 30% on top of the berm adjacent to the river channel (plot MO120) to 73% (plot MO10) in the oxbow ditch, which for the most part had no visible surface water. EC was very low at the River’s Edge Transect (RM 20.5, Figure 14B) ranging from 0 cS/m in the hammock (plot RE00) and on the berm adjacent to the river channel (plot RE90) to 328 cS/m in the freshwater swamp area at RE30. %SM generally paralleled EC with the lowest %SM recorded on the berm (0%) and highest in the swamp areas (plots RE20 and RE30, 97 and 96%) and closer to the river at RE70 and RE80 (104 and 100%) due to the breach in the berm just south of the transect, which allows the internal plots exposure to tidal flooding from the river. Similarly, the highest EC and %SM on the Beach Avenue Transect (RM 19.5) were low areas that were internal to the site due to tidal inundation along the adjacent oxbow on the south side. EC ranged from 0 cS/m in the hammock to 899 cS/m in the swamp area at plot BA80 (Figure 14C). %SM ranged from 15% in the hammock adjacent to the uplands (plot BA00) to 92% in the hammock area near the river channel (plot BA183). The bottomland hardwood and swamp plots were somewhat drier at 57 to 89 % probably because they were further away from the river channel. EC at the Crowberry Drive (RM 18.3, Figure 14D) transect ranged from 70 cS/m in the hammock to 1,518 cS/m in the middle of the white mangrove/sawgrass swamp and 1,534 cS/m on the berm adjacent to the river channel. %SM ranged from 0% in the hammock to 85% in the white mangrove area.
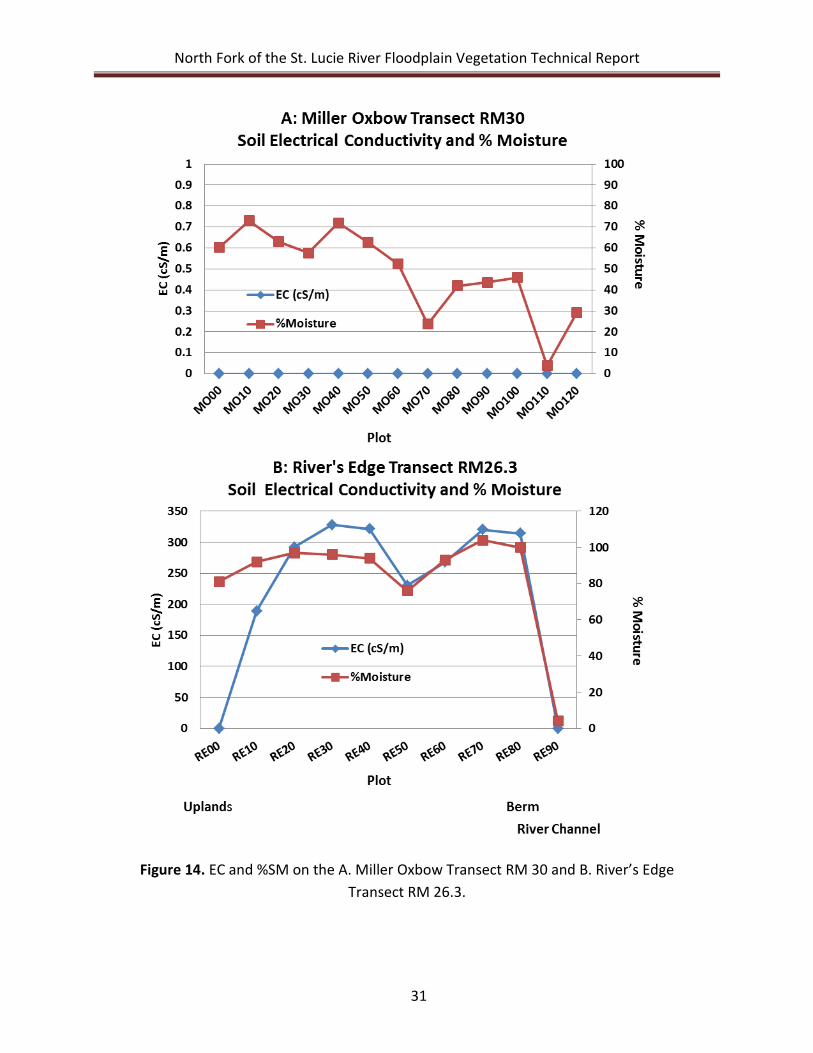
North Fork of the St. Lucie River Floodplain Vegetation Technical Report
31
Figure 14. EC and %SM on the A. Miller Oxbow Transect RM 30 and B. River’s Edge Transect RM 26.3.
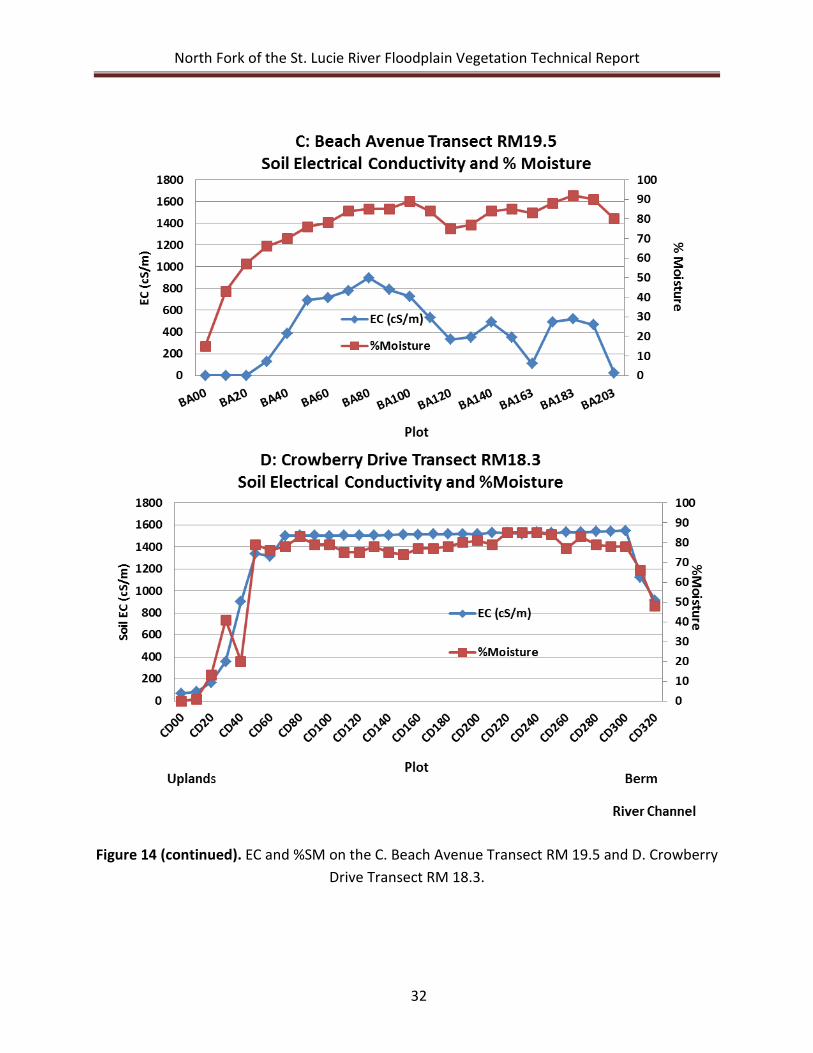
North Fork of the St. Lucie River Floodplain Vegetation Technical Report
32
Figure 14 (continued). EC and %SM on the C. Beach Avenue Transect RM 19.5 and D. Crowberry Drive Transect RM 18.3.
North Fork of the St. Lucie River Floodplain Vegetation Technical Report
33
River Flow and Salinity
Figure 15 presents the average annual freshwater flows to the North Fork from the Gordy Road structure, S-49 and S-97 between 1999 and 2011. Average annual flows from the Gordy Road structure (dashed line) dropped below the 130-cfs target flow during 1999, 2000, 2006, 2007 and late 2008 to early 2011. The Gordy Road structure’s reaction to the 2004 Hurricanes Frances and Jeanne appeared to produce higher flows than S-49 and S-79 during the same time period while the opposite reaction occurred for Hurricane Wilma in 2005 with lower flows produced at the Gordy Road structure. Gordy Road structure flows appeared to be at their lowest in early 2009 when the field surveys were conducted; therefore, we were probably examining the floodplain vegetation under relatively dry conditions even for a dry season.
Figure 15. Major contributions to freshwater flow on the North Fork St. Lucie River (DBHYDRO).
Mean monthly flows for the Gordy Road structure between 1999 and 2011 are presented in Table 4. Blue-colored cells represent the mean monthly flows recorded during Hurricanes Frances and Jeanne (September 2004) and Wilma in October 2005, and represent three of the highest flows recorded at the structure. Yellow-colored cells represent mean monthly flows less than the targeted 130 cfs for dry and wet season, while the green-colored cells represent those flows that met the water reservation target flow during the dry season. While 2003 through 2005 appeared to successfully meet the target for all dry season months, the flow has been generally below the target for 2006 through 2011.
0
50
100
150
200
250
300
350
400
450
1999 2001 2003 2005 2007 2009 2011
FLO
W (c
fs)
YEAR
Average Annual Freshwater Flow to the North Fork of the St. Lucie River from the Major Water Control Structures
Gordy Rd.
S-49 (C-24)
S-97 (C-23)
2004/2005 hurricanes
130 cfs
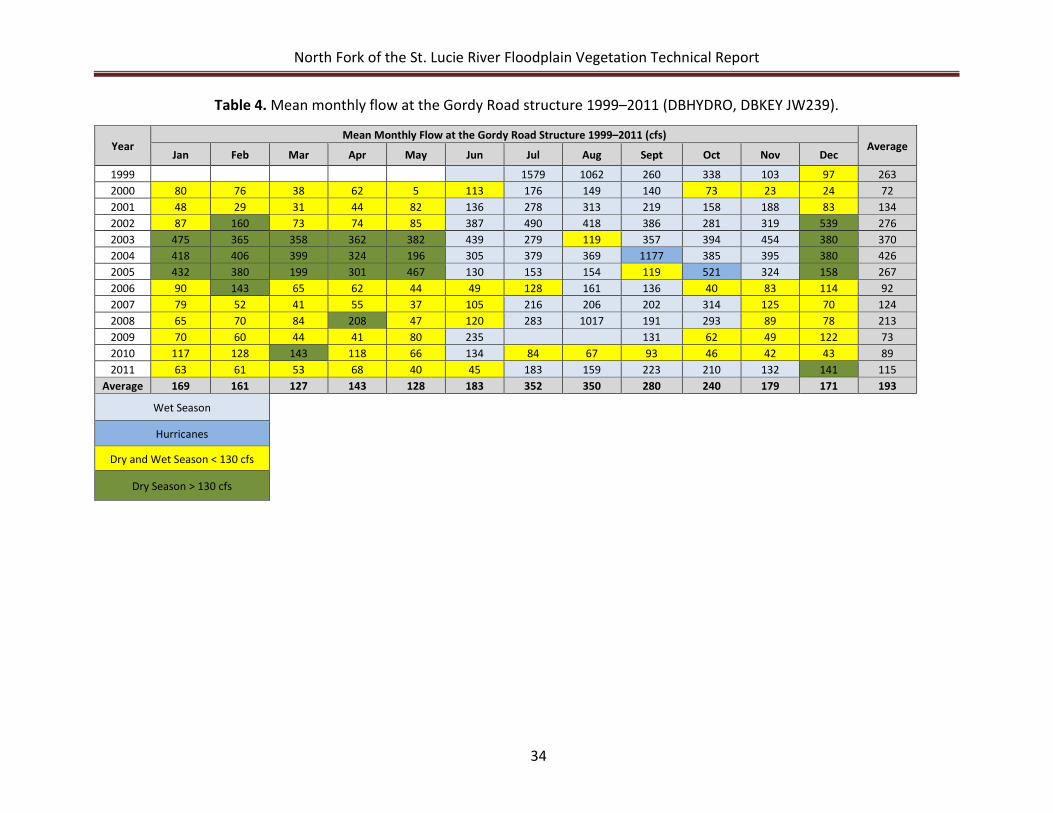
North Fork of the St. Lucie River Floodplain Vegetation Technical Report
34
Table 4. Mean monthly flow at the Gordy Road structure 1999–2011 (DBHYDRO, DBKEY JW239).
Year Mean Monthly Flow at the Gordy Road Structure 1999–2011 (cfs) Average
Jan Feb Mar Apr May Jun Jul Aug Sept Oct Nov Dec 1999 1579 1062 260 338 103 97 263 2000 80 76 38 62 5 113 176 149 140 73 23 24 72 2001 48 29 31 44 82 136 278 313 219 158 188 83 134 2002 87 160 73 74 85 387 490 418 386 281 319 539 276 2003 475 365 358 362 382 439 279 119 357 394 454 380 370 2004 418 406 399 324 196 305 379 369 1177 385 395 380 426 2005 432 380 199 301 467 130 153 154 119 521 324 158 267 2006 90 143 65 62 44 49 128 161 136 40 83 114 92 2007 79 52 41 55 37 105 216 206 202 314 125 70 124 2008 65 70 84 208 47 120 283 1017 191 293 89 78 213 2009 70 60 44 41 80 235 131 62 49 122 73 2010 117 128 143 118 66 134 84 67 93 46 42 43 89 2011 63 61 53 68 40 45 183 159 223 210 132 141 115
Average 169 161 127 143 128 183 352 350 280 240 179 171 193 Wet Season
Hurricanes Dry and Wet Season < 130 cfs
Dry Season > 130 cfs
North Fork of the St. Lucie River Floodplain Vegetation Technical Report
35
The CH3D Model was able to simulate a very wide range of hydrologic and hydraulic conditions on the North Fork St. Lucie River. With regards to floodplain vegetation, we were looking along the river and the interior of the floodplain for potential signs of saltwater intrusion and possible areas where salt might be accumulating and not necessarily the location of the low salinity zone for which the model is generally used. The model accurately simulated salinity on the river for the very dry 2000 and 2007 to the very wet 2004, 2005 and 2010. The model simulated the salinity gradient on the North Fork satisfactorily particularly between Prima Vista and Kellstadt bridges using the Gordy Road structure flows for 1999 to 2011. This information is summarized in Appendix D of the Technical Document to Support a Water Reservation Rule for the North Fork of the St. Lucie River (SFWMD, 2009).
Using the CH3D Model, the 1, 6 and 14 isohalines were plotted in terms of river mile to represent the extent and range of salinity conditions within the North Fork St. Lucie River (Figure 16). The results indicated that the 14 isohaline (green line) slightly reached above Prima Vista Bridge (RM 23.1) during 2000; and in general, it did not recede below the Kellstadt Bridge (RM 17.1) except during wet seasons. On a few occasions, the 14 isohaline reached up to the Beach Avenue Transect and was commonly seen in the channel during the dry season at the Crowberry Drive Transect. The upstream location of the 14 isohaline may be particularly stressful to some freshwater floodplain species such as red maple and water hickory bottomland hardwood species, which are intolerant of salt and long-term flooding. Although the 14 isohaline never reached the Midway Bridge (RM 27) the 6 and 1 isohalines did. The 6 isohaline (red line) behaved similarly in that it only reached above the Prima Vista Bridge during 2000 and did not recede below the Kellstadt Bridge except during wet seasons. As mentioned previously, this river system did not contain natural populations of bald cypress, which is very tolerant of flooding but intolerant of salt. The few young bald cypress observed in the riverine and upper tidal reaches appeared to have been recently planted. Other freshwater species such as water hickory, were not observed near the river channel below Midway Bridge (RM 27) while general flood tolerant and salt tolerant species, such as pond apple, were not observed below Kellstadt Bridge. However, pond apple became prevalent along the river, just downstream of the Prima Vista Bridge (RM 23). Salt tolerant red mangrove was present along the shoreline of the North Fork St. Lucie River from the mouth to the junction of South St. Lucie River Water Control District’s #102 Canal at RM 27.5. It was not found in the interior of the floodplain transects probably due to the berms and the shortened hydroperiods on the floodplain behind the berms.
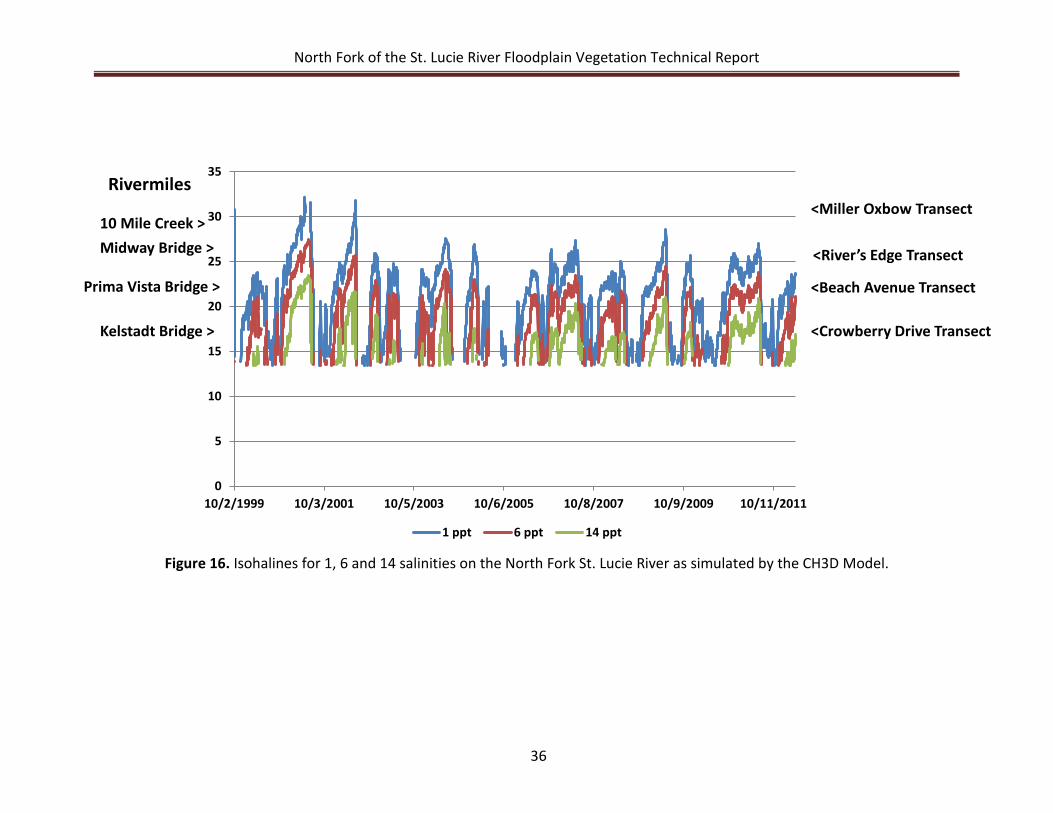
North Fork of the St. Lucie River Floodplain Vegetation Technical Report
36
0
5
10
15
20
25
30
35
10/2/1999 10/3/2001 10/5/2003 10/6/2005 10/8/2007 10/9/2009 10/11/2011
1 ppt 6 ppt 14 ppt
Rivermiles
10 Mile Creek >Midway Bridge >
Prima Vista Bridge >
Kelstadt Bridge > <Crowberry Drive Transect
<Beach Avenue Transect
<River’s Edge Transect
<Miller Oxbow Transect
Figure 16. Isohalines for 1, 6 and 14 salinities on the North Fork St. Lucie River as simulated by the CH3D Model.
North Fork of the St. Lucie River Floodplain Vegetation Technical Report
37
Floodplain Vegetative Communities
The St. Lucie River floodplain was divided into three distinct reaches (Figure 17, orange lines) based on canopy communities within the four transects and vegetative communities observed along the river channel and oxbows during the 2007 reconnaissance trips. The riverine reach includes Five Mile and Ten Mile creeks; the main North Fork channel downstream to the Midway Bridge (RM 27); the St. Lucie Canal upstream of the S-80 structure; and, the non-tidal portions of the South Fork. The upper tidal reach includes that portion of the North Fork from approximately RM 26.9 to RM 14 in the mid-estuary and the mouth and the tidal portions of the South Fork. The lower tidal reach consists of the mid-estuary, adjacent segments of the Indian River Lagoon to the opening of the St. Lucie Inlet (RM 13.9 to RM 0). The riverine reach has primarily a freshwater canopy that is generally unaffected by salinity while the upper tidal reach has a mixture of freshwater/brackish mixed canopy that has experienced some saltwater intrusion due to tidal influences and reduced freshwater flows. Post, Buckley, Schuh & Jernigan Inc. (2003) refers to this segment of the river as the scrub-scrub tidal wetlands of the North Fork. The lower tidal reach is dominated by salt tolerant species and is highly influenced by tides and salinity in surface waters and soils.
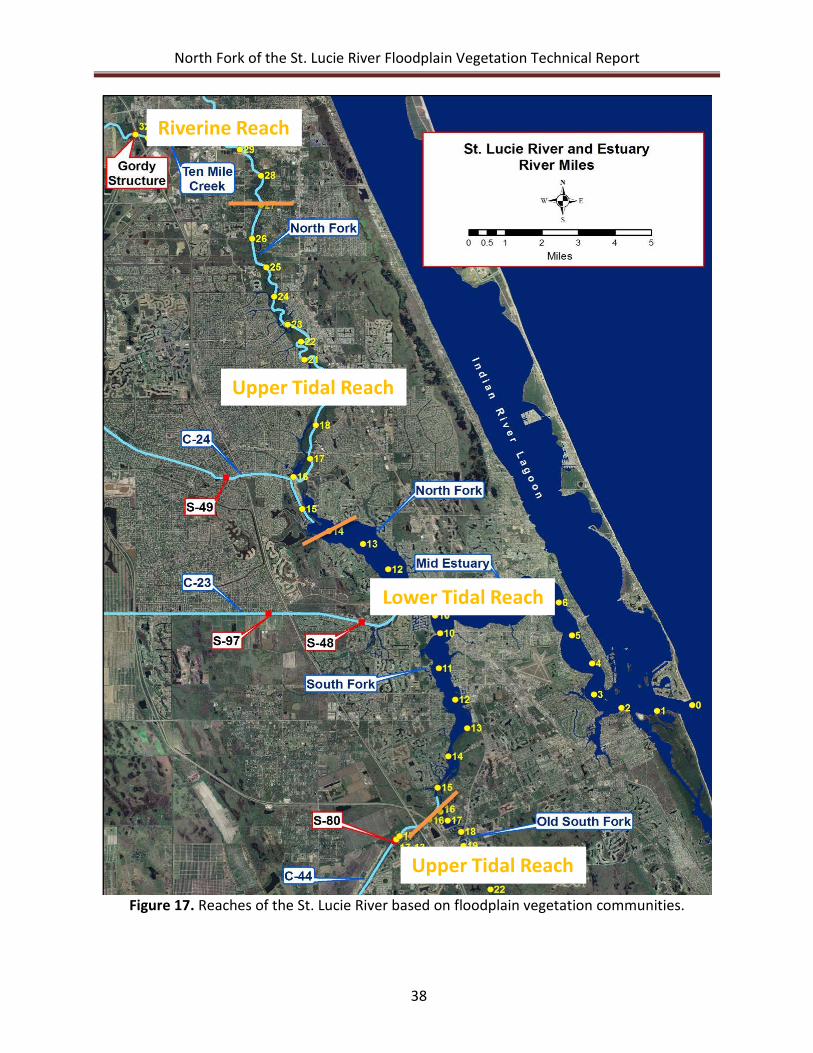
North Fork of the St. Lucie River Floodplain Vegetation Technical Report
38
Figure 17. Reaches of the St. Lucie River based on floodplain vegetation communities.
Riverine Reach
Upper Tidal Reach
Lower Tidal Reach
Upper Tidal Reach
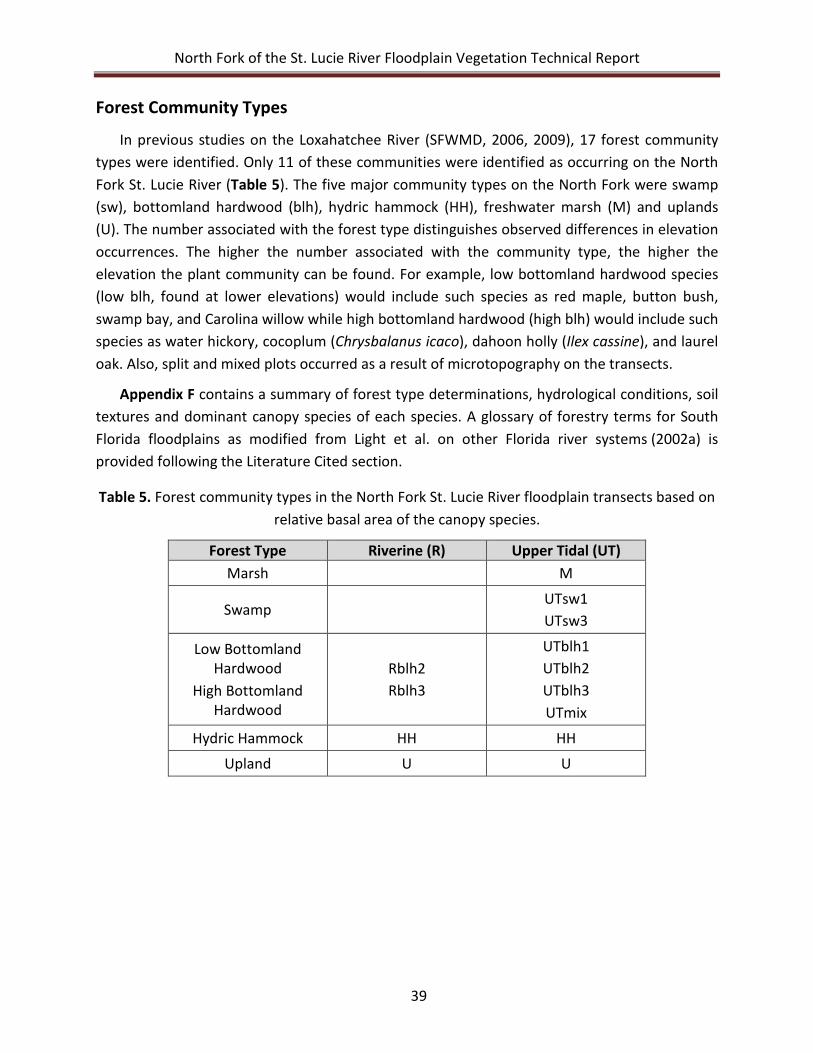
North Fork of the St. Lucie River Floodplain Vegetation Technical Report
39
Forest Community Types
In previous studies on the Loxahatchee River (SFWMD, 2006, 2009), 17 forest community types were identified. Only 11 of these communities were identified as occurring on the North Fork St. Lucie River (Table 5). The five major community types on the North Fork were swamp (sw), bottomland hardwood (blh), hydric hammock (HH), freshwater marsh (M) and uplands (U). The number associated with the forest type distinguishes observed differences in elevation occurrences. The higher the number associated with the community type, the higher the elevation the plant community can be found. For example, low bottomland hardwood species (low blh, found at lower elevations) would include such species as red maple, button bush, swamp bay, and Carolina willow while high bottomland hardwood (high blh) would include such species as water hickory, cocoplum (Chrysbalanus icaco), dahoon holly (Ilex cassine), and laurel oak. Also, split and mixed plots occurred as a result of microtopography on the transects.
Appendix F contains a summary of forest type determinations, hydrological conditions, soil textures and dominant canopy species of each species. A glossary of forestry terms for South Florida floodplains as modified from Light et al. on other Florida river systems (2002a) is provided following the Literature Cited section.
Table 5. Forest community types in the North Fork St. Lucie River floodplain transects based on relative basal area of the canopy species.
Forest Type Riverine (R) Upper Tidal (UT) Marsh M
Swamp UTsw1 UTsw3
Low Bottomland Hardwood
High Bottomland Hardwood
Rblh2 Rblh3
UTblh1 UTblh2 UTblh3 UTmix
Hydric Hammock HH HH
Upland U U
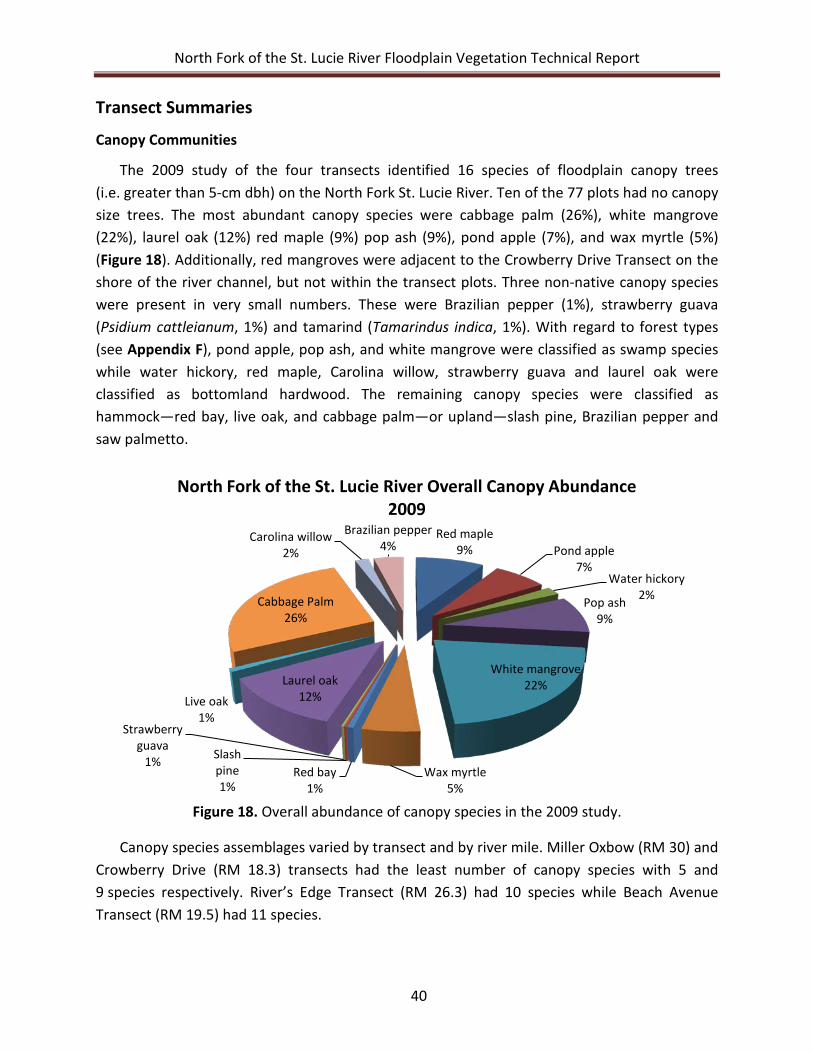
North Fork of the St. Lucie River Floodplain Vegetation Technical Report
40
Transect Summaries
Canopy Communities
The 2009 study of the four transects identified 16 species of floodplain canopy trees (i.e. greater than 5-cm dbh) on the North Fork St. Lucie River. Ten of the 77 plots had no canopy size trees. The most abundant canopy species were cabbage palm (26%), white mangrove (22%), laurel oak (12%) red maple (9%) pop ash (9%), pond apple (7%), and wax myrtle (5%) (Figure 18). Additionally, red mangroves were adjacent to the Crowberry Drive Transect on the shore of the river channel, but not within the transect plots. Three non-native canopy species were present in very small numbers. These were Brazilian pepper (1%), strawberry guava (Psidium cattleianum, 1%) and tamarind (Tamarindus indica, 1%). With regard to forest types (see Appendix F), pond apple, pop ash, and white mangrove were classified as swamp species while water hickory, red maple, Carolina willow, strawberry guava and laurel oak were classified as bottomland hardwood. The remaining canopy species were classified as hammock—red bay, live oak, and cabbage palm—or upland—slash pine, Brazilian pepper and saw palmetto.
Figure 18. Overall abundance of canopy species in the 2009 study.
Canopy species assemblages varied by transect and by river mile. Miller Oxbow (RM 30) and Crowberry Drive (RM 18.3) transects had the least number of canopy species with 5 and 9 species respectively. River’s Edge Transect (RM 26.3) had 10 species while Beach Avenue Transect (RM 19.5) had 11 species.
Red maple 9% Pond apple
7% Water hickory
2% Pop ash 9%
White mangrove 22%
Wax myrtle 5%
Red bay 1%
Slash pine 1%
Strawberry guava
1%
Laurel oak 12% Live oak
1%
Cabbage Palm 26%
Carolina willow 2%
Brazilian pepper 4%
North Fork of the St. Lucie River Overall Canopy Abundance 2009
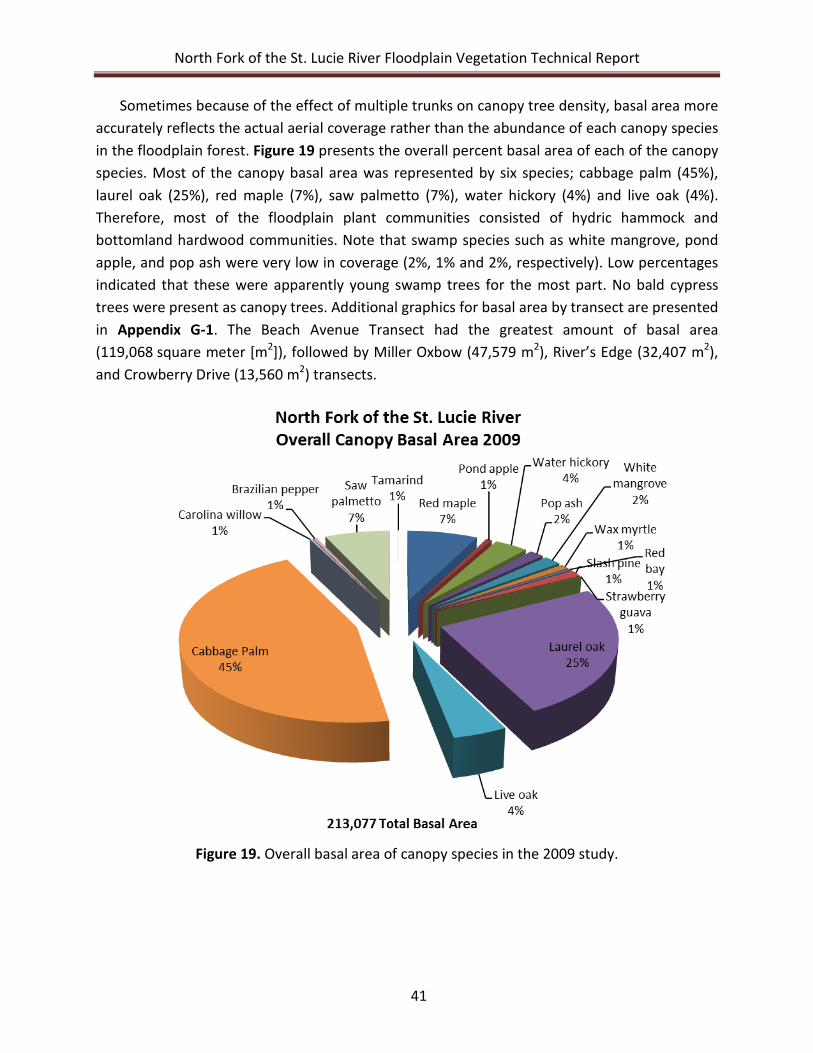
North Fork of the St. Lucie River Floodplain Vegetation Technical Report
41
Sometimes because of the effect of multiple trunks on canopy tree density, basal area more accurately reflects the actual aerial coverage rather than the abundance of each canopy species in the floodplain forest. Figure 19 presents the overall percent basal area of each of the canopy species. Most of the canopy basal area was represented by six species; cabbage palm (45%), laurel oak (25%), red maple (7%), saw palmetto (7%), water hickory (4%) and live oak (4%). Therefore, most of the floodplain plant communities consisted of hydric hammock and bottomland hardwood communities. Note that swamp species such as white mangrove, pond apple, and pop ash were very low in coverage (2%, 1% and 2%, respectively). Low percentages indicated that these were apparently young swamp trees for the most part. No bald cypress trees were present as canopy trees. Additional graphics for basal area by transect are presented in Appendix G-1. The Beach Avenue Transect had the greatest amount of basal area (119,068 square meter [m2]), followed by Miller Oxbow (47,579 m2), River’s Edge (32,407 m2), and Crowberry Drive (13,560 m2) transects.
Figure 19. Overall basal area of canopy species in the 2009 study.
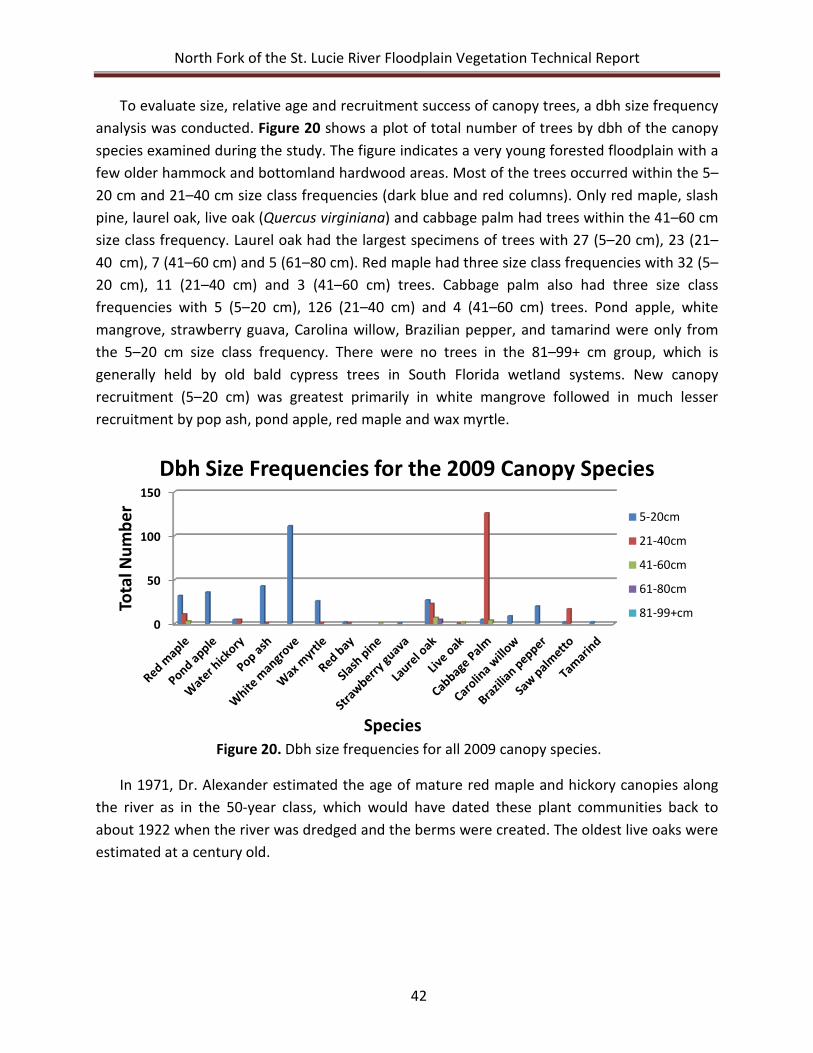
North Fork of the St. Lucie River Floodplain Vegetation Technical Report
42
To evaluate size, relative age and recruitment success of canopy trees, a dbh size frequency analysis was conducted. Figure 20 shows a plot of total number of trees by dbh of the canopy species examined during the study. The figure indicates a very young forested floodplain with a few older hammock and bottomland hardwood areas. Most of the trees occurred within the 5–20 cm and 21–40 cm size class frequencies (dark blue and red columns). Only red maple, slash pine, laurel oak, live oak (Quercus virginiana) and cabbage palm had trees within the 41–60 cm size class frequency. Laurel oak had the largest specimens of trees with 27 (5–20 cm), 23 (21–40 cm), 7 (41–60 cm) and 5 (61–80 cm). Red maple had three size class frequencies with 32 (5–20 cm), 11 (21–40 cm) and 3 (41–60 cm) trees. Cabbage palm also had three size class frequencies with 5 (5–20 cm), 126 (21–40 cm) and 4 (41–60 cm) trees. Pond apple, white mangrove, strawberry guava, Carolina willow, Brazilian pepper, and tamarind were only from the 5–20 cm size class frequency. There were no trees in the 81–99+ cm group, which is generally held by old bald cypress trees in South Florida wetland systems. New canopy recruitment (5–20 cm) was greatest primarily in white mangrove followed in much lesser recruitment by pop ash, pond apple, red maple and wax myrtle.
Figure 20. Dbh size frequencies for all 2009 canopy species.
In 1971, Dr. Alexander estimated the age of mature red maple and hickory canopies along the river as in the 50-year class, which would have dated these plant communities back to about 1922 when the river was dredged and the berms were created. The oldest live oaks were estimated at a century old.
0
50
100
150
Tota
l Num
ber
Species
Dbh Size Frequencies for the 2009 Canopy Species
5-20cm
21-40cm
41-60cm
61-80cm
81-99+cm
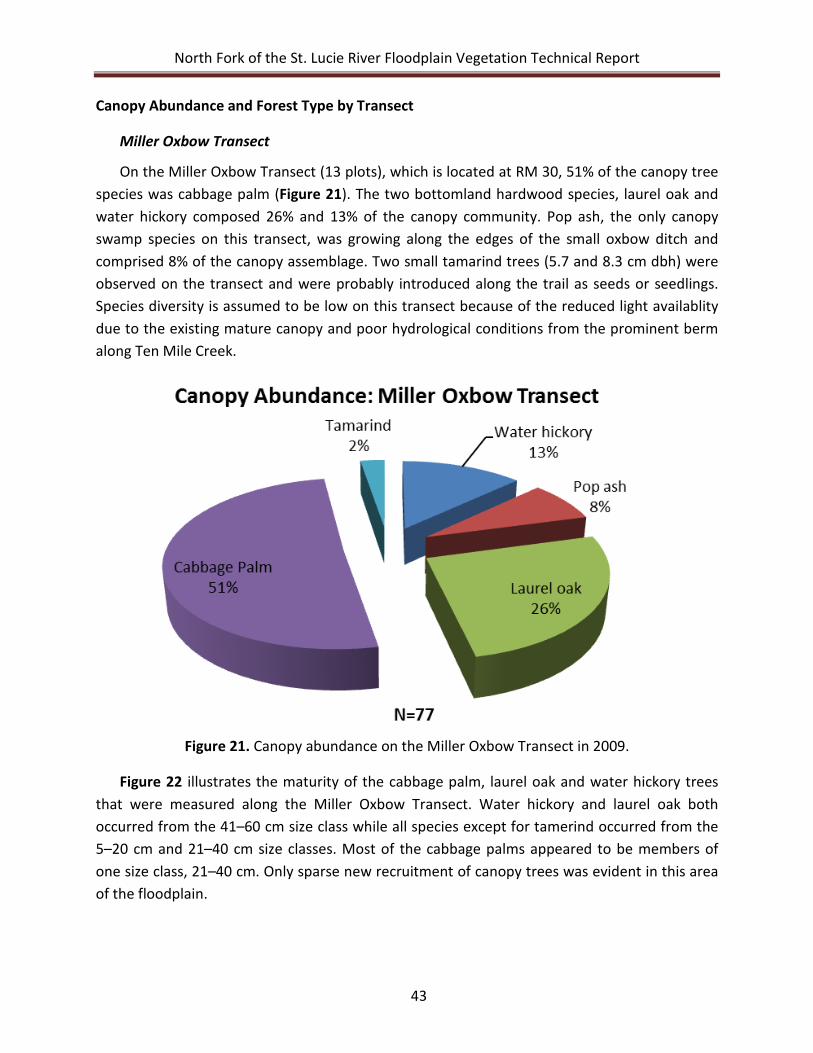
North Fork of the St. Lucie River Floodplain Vegetation Technical Report
43
Canopy Abundance and Forest Type by Transect
Miller Oxbow Transect
On the Miller Oxbow Transect (13 plots), which is located at RM 30, 51% of the canopy tree species was cabbage palm (Figure 21). The two bottomland hardwood species, laurel oak and water hickory composed 26% and 13% of the canopy community. Pop ash, the only canopy swamp species on this transect, was growing along the edges of the small oxbow ditch and comprised 8% of the canopy assemblage. Two small tamarind trees (5.7 and 8.3 cm dbh) were observed on the transect and were probably introduced along the trail as seeds or seedlings. Species diversity is assumed to be low on this transect because of the reduced light availablity due to the existing mature canopy and poor hydrological conditions from the prominent berm along Ten Mile Creek.
Figure 21. Canopy abundance on the Miller Oxbow Transect in 2009.
Figure 22 illustrates the maturity of the cabbage palm, laurel oak and water hickory trees that were measured along the Miller Oxbow Transect. Water hickory and laurel oak both occurred from the 41–60 cm size class while all species except for tamerind occurred from the 5–20 cm and 21–40 cm size classes. Most of the cabbage palms appeared to be members of one size class, 21–40 cm. Only sparse new recruitment of canopy trees was evident in this area of the floodplain.
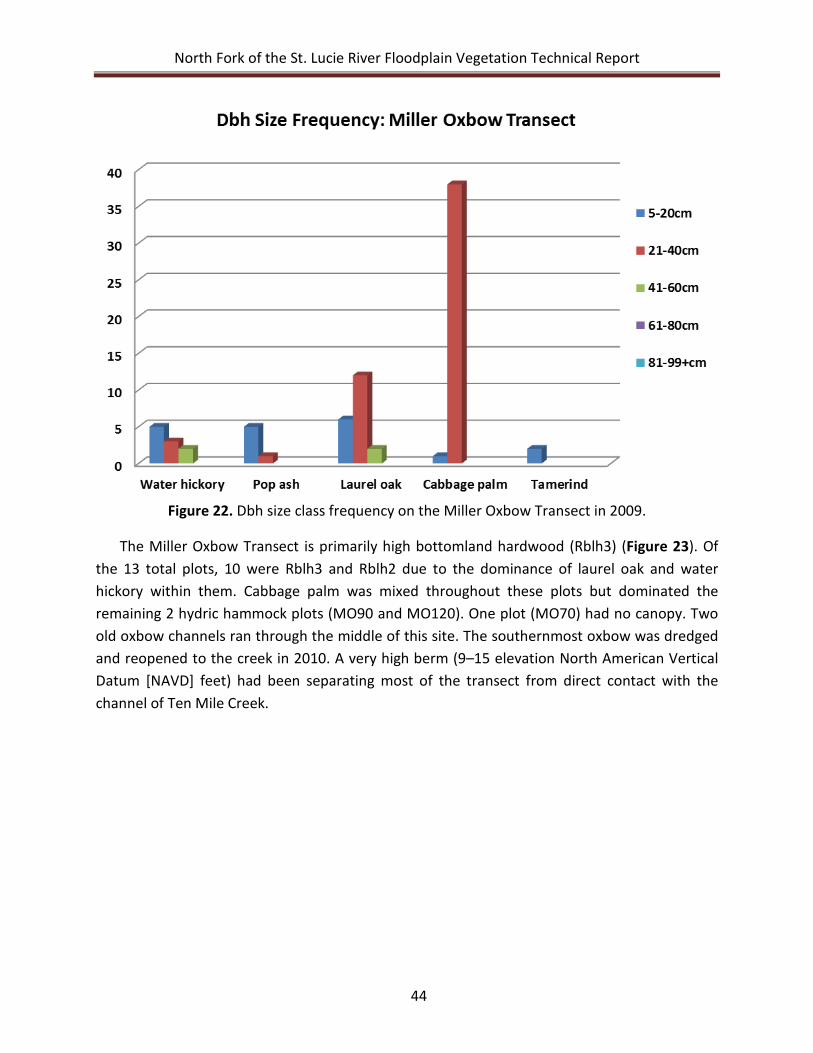
North Fork of the St. Lucie River Floodplain Vegetation Technical Report
44
Figure 22. Dbh size class frequency on the Miller Oxbow Transect in 2009.
The Miller Oxbow Transect is primarily high bottomland hardwood (Rblh3) (Figure 23). Of the 13 total plots, 10 were Rblh3 and Rblh2 due to the dominance of laurel oak and water hickory within them. Cabbage palm was mixed throughout these plots but dominated the remaining 2 hydric hammock plots (MO90 and MO120). One plot (MO70) had no canopy. Two old oxbow channels ran through the middle of this site. The southernmost oxbow was dredged and reopened to the creek in 2010. A very high berm (9–15 elevation North American Vertical Datum [NAVD] feet) had been separating most of the transect from direct contact with the channel of Ten Mile Creek.
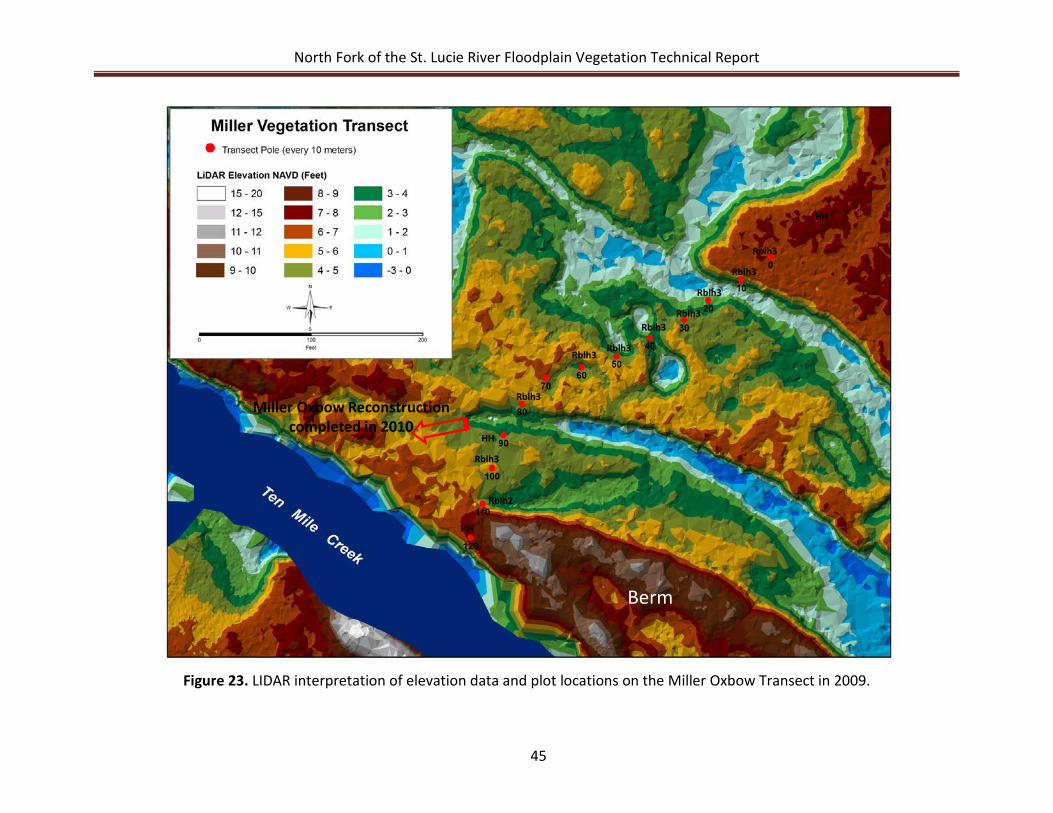
North Fork of the St. Lucie River Floodplain Vegetation Technical Report
45
Figure 23. LIDAR interpretation of elevation data and plot locations on the Miller Oxbow Transect in 2009.
HH
Rblh3
Rblh3
Rblh3
Rblh3
Rblh3Rblh3
Rblh3
Rblh3
HH
Rblh3
HH
Rblh2
Miller Oxbow Reconstructioncompleted in 2010
Berm
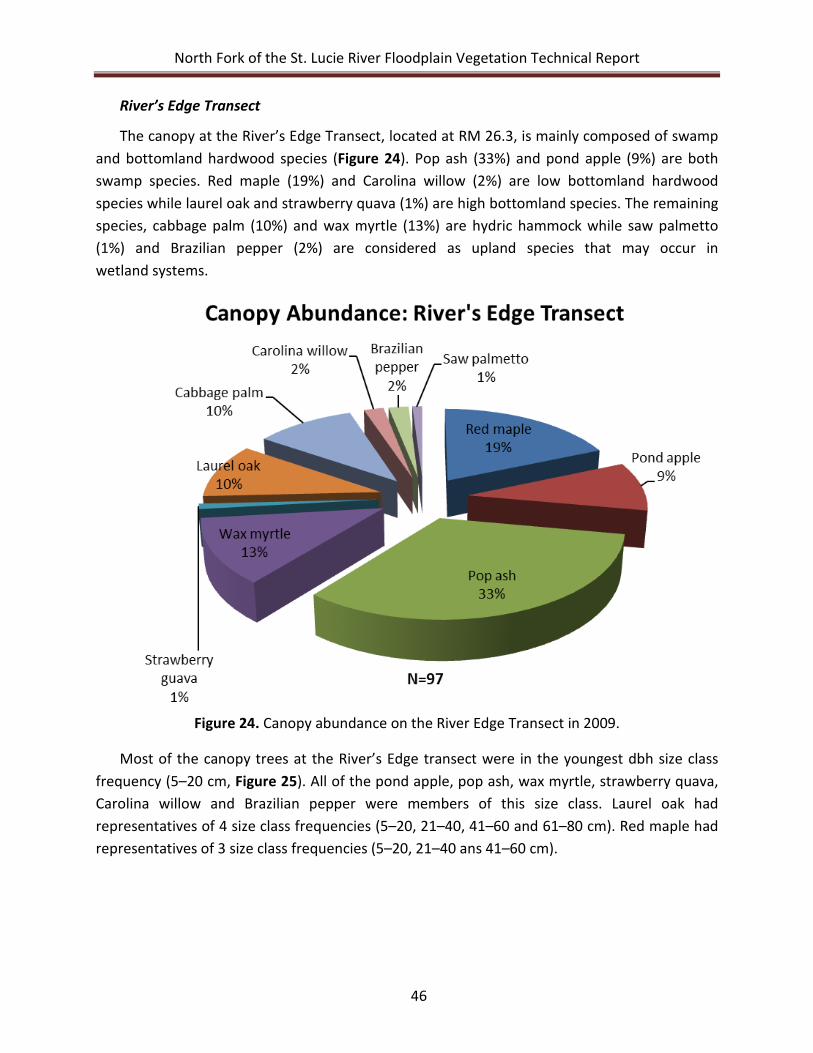
North Fork of the St. Lucie River Floodplain Vegetation Technical Report
46
River’s Edge Transect
The canopy at the River’s Edge Transect, located at RM 26.3, is mainly composed of swamp and bottomland hardwood species (Figure 24). Pop ash (33%) and pond apple (9%) are both swamp species. Red maple (19%) and Carolina willow (2%) are low bottomland hardwood species while laurel oak and strawberry quava (1%) are high bottomland species. The remaining species, cabbage palm (10%) and wax myrtle (13%) are hydric hammock while saw palmetto (1%) and Brazilian pepper (2%) are considered as upland species that may occur in wetland systems.
Figure 24. Canopy abundance on the River Edge Transect in 2009.
Most of the canopy trees at the River’s Edge transect were in the youngest dbh size class frequency (5–20 cm, Figure 25). All of the pond apple, pop ash, wax myrtle, strawberry quava, Carolina willow and Brazilian pepper were members of this size class. Laurel oak had representatives of 4 size class frequencies (5–20, 21–40, 41–60 and 61–80 cm). Red maple had representatives of 3 size class frequencies (5–20, 21–40 ans 41–60 cm).
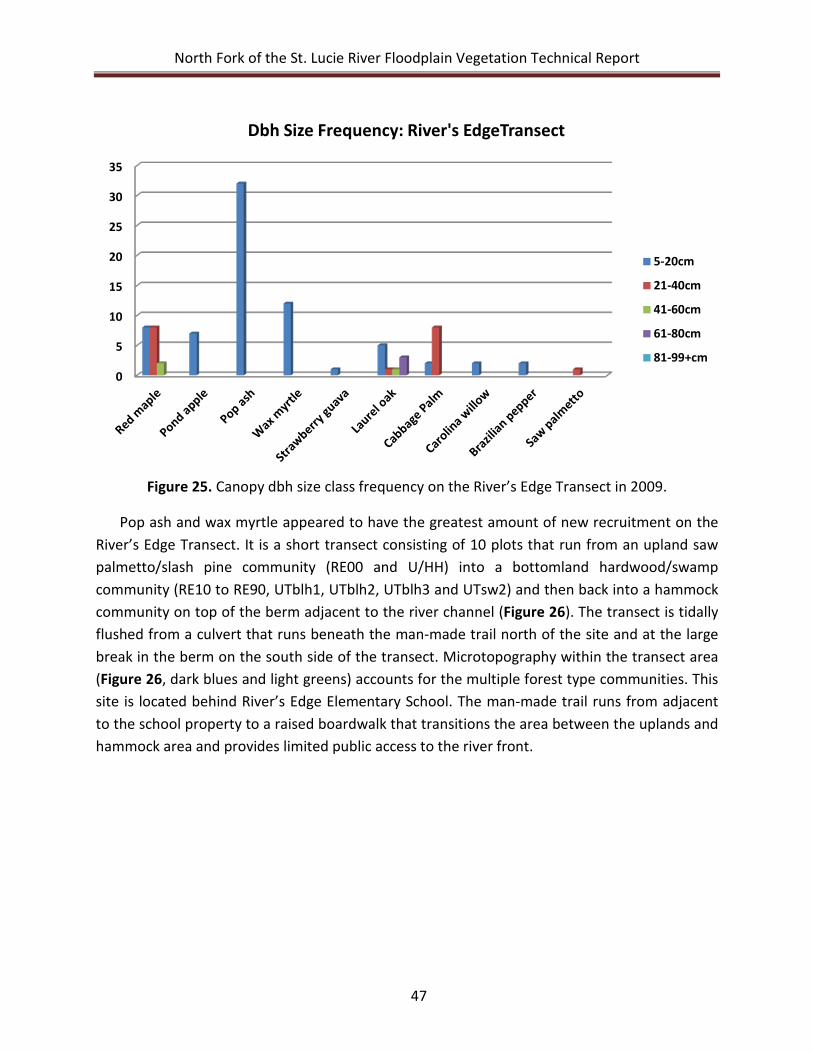
North Fork of the St. Lucie River Floodplain Vegetation Technical Report
47
Figure 25. Canopy dbh size class frequency on the River’s Edge Transect in 2009.
Pop ash and wax myrtle appeared to have the greatest amount of new recruitment on the River’s Edge Transect. It is a short transect consisting of 10 plots that run from an upland saw palmetto/slash pine community (RE00 and U/HH) into a bottomland hardwood/swamp community (RE10 to RE90, UTblh1, UTblh2, UTblh3 and UTsw2) and then back into a hammock community on top of the berm adjacent to the river channel (Figure 26). The transect is tidally flushed from a culvert that runs beneath the man-made trail north of the site and at the large break in the berm on the south side of the transect. Microtopography within the transect area (Figure 26, dark blues and light greens) accounts for the multiple forest type communities. This site is located behind River’s Edge Elementary School. The man-made trail runs from adjacent to the school property to a raised boardwalk that transitions the area between the uplands and hammock area and provides limited public access to the river front.
0
5
10
15
20
25
30
35
Dbh Size Frequency: River's EdgeTransect
5-20cm
21-40cm
41-60cm
61-80cm
81-99+cm
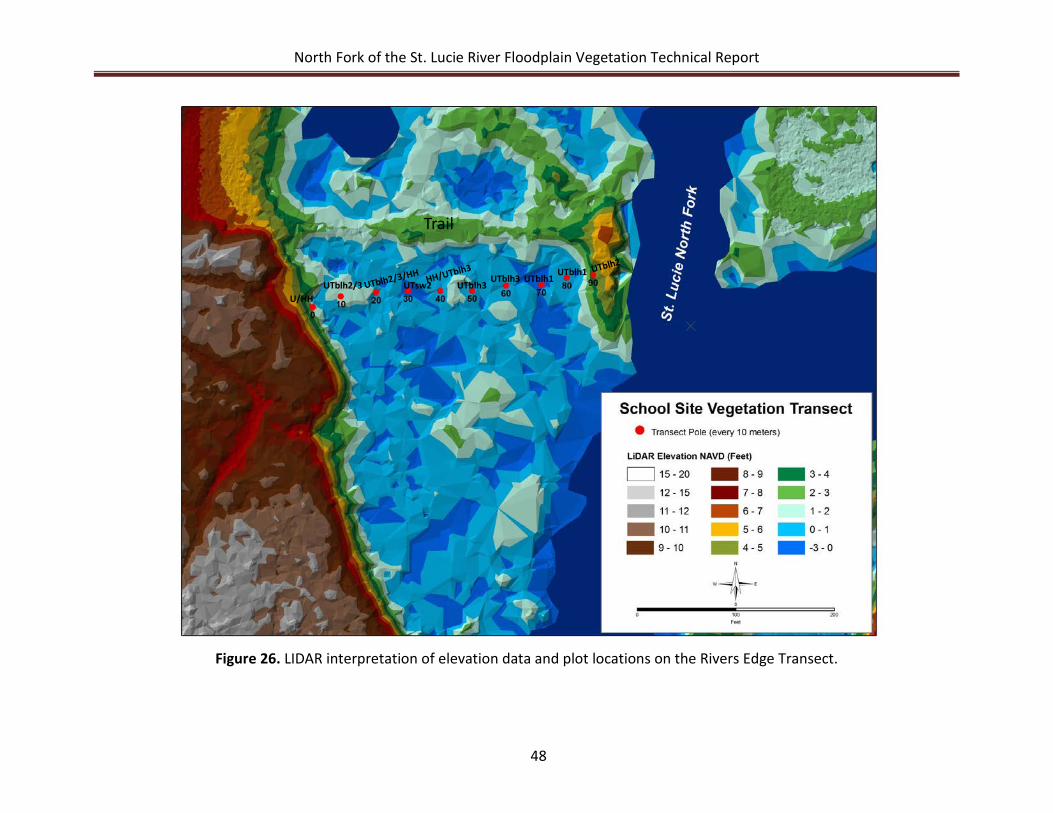
North Fork of the St. Lucie River Floodplain Vegetation Technical Report
48
Figure 26. LIDAR interpretation of elevation data and plot locations on the Rivers Edge Transect.
U/HHUTblh2/3 UTsw2 UTblh3
UTblh1UTblh3UTblh1
Trail
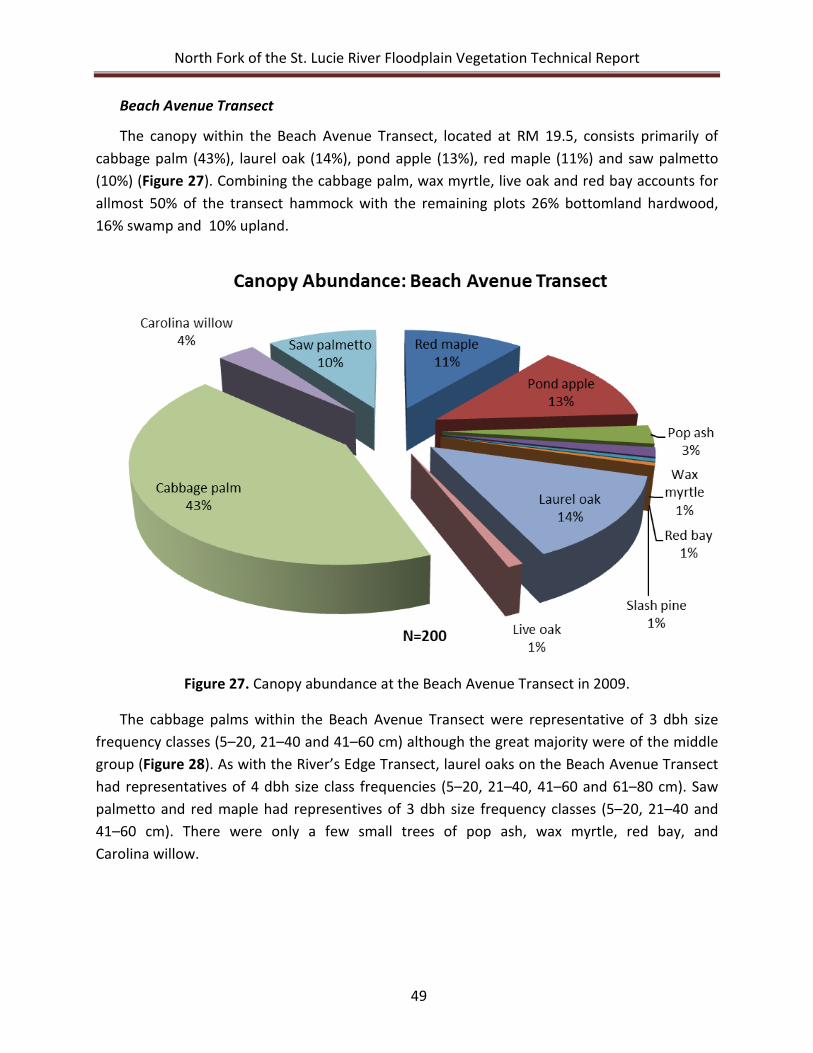
North Fork of the St. Lucie River Floodplain Vegetation Technical Report
49
Beach Avenue Transect
The canopy within the Beach Avenue Transect, located at RM 19.5, consists primarily of cabbage palm (43%), laurel oak (14%), pond apple (13%), red maple (11%) and saw palmetto (10%) (Figure 27). Combining the cabbage palm, wax myrtle, live oak and red bay accounts for allmost 50% of the transect hammock with the remaining plots 26% bottomland hardwood, 16% swamp and 10% upland.
Figure 27. Canopy abundance at the Beach Avenue Transect in 2009.
The cabbage palms within the Beach Avenue Transect were representative of 3 dbh size frequency classes (5–20, 21–40 and 41–60 cm) although the great majority were of the middle group (Figure 28). As with the River’s Edge Transect, laurel oaks on the Beach Avenue Transect had representatives of 4 dbh size class frequencies (5–20, 21–40, 41–60 and 61–80 cm). Saw palmetto and red maple had representives of 3 dbh size frequency classes (5–20, 21–40 and 41–60 cm). There were only a few small trees of pop ash, wax myrtle, red bay, and Carolina willow.
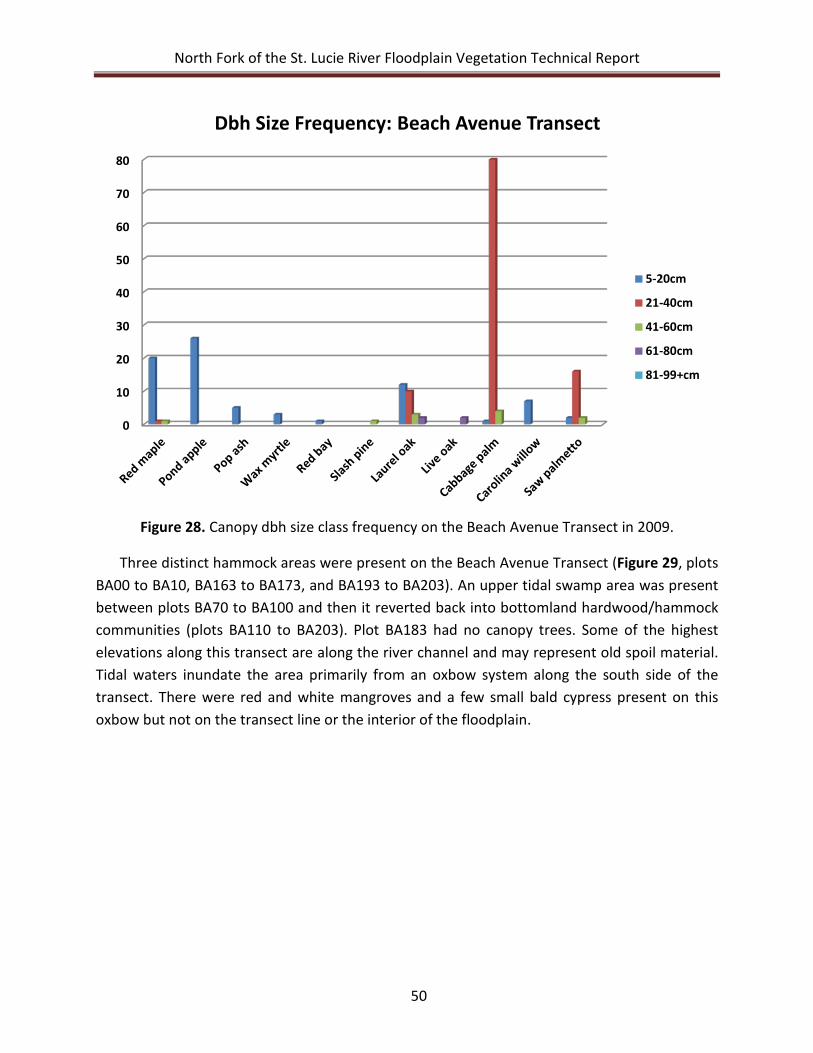
North Fork of the St. Lucie River Floodplain Vegetation Technical Report
50
Figure 28. Canopy dbh size class frequency on the Beach Avenue Transect in 2009.
Three distinct hammock areas were present on the Beach Avenue Transect (Figure 29, plots BA00 to BA10, BA163 to BA173, and BA193 to BA203). An upper tidal swamp area was present between plots BA70 to BA100 and then it reverted back into bottomland hardwood/hammock communities (plots BA110 to BA203). Plot BA183 had no canopy trees. Some of the highest elevations along this transect are along the river channel and may represent old spoil material. Tidal waters inundate the area primarily from an oxbow system along the south side of the transect. There were red and white mangroves and a few small bald cypress present on this oxbow but not on the transect line or the interior of the floodplain.
0
10
20
30
40
50
60
70
80
Dbh Size Frequency: Beach Avenue Transect
5-20cm
21-40cm
41-60cm
61-80cm
81-99+cm
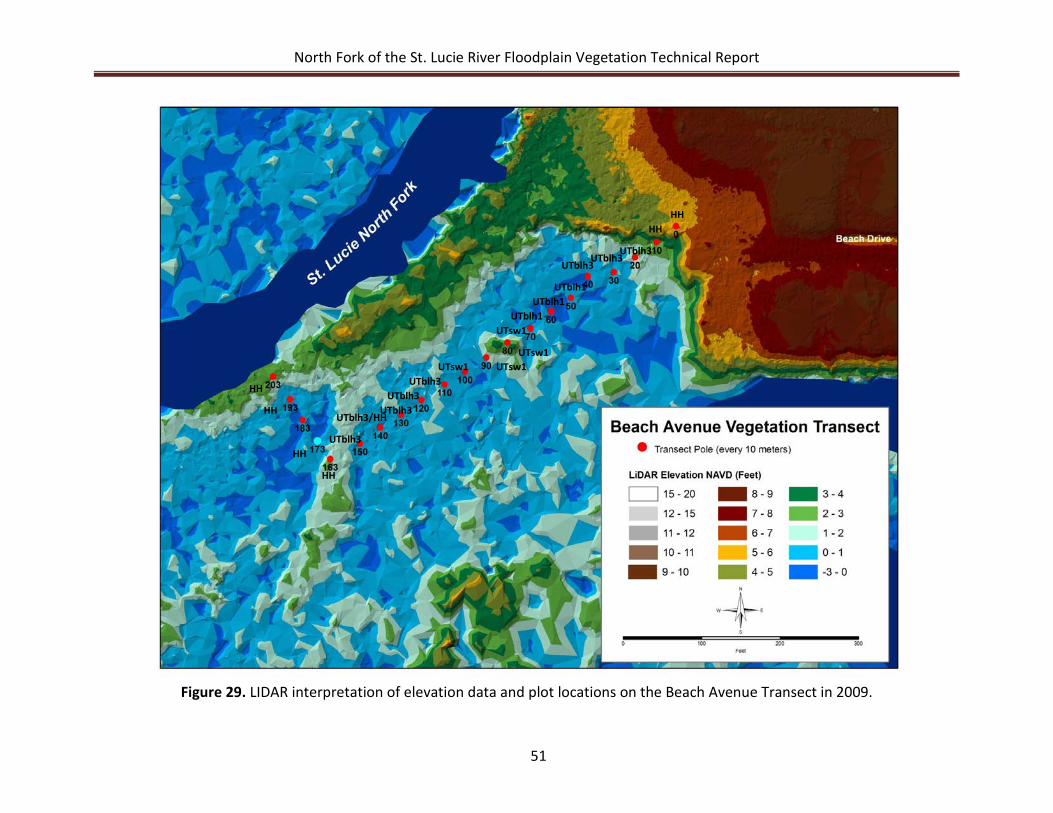
North Fork of the St. Lucie River Floodplain Vegetation Technical Report
51
Figure 29. LIDAR interpretation of elevation data and plot locations on the Beach Avenue Transect in 2009.
HH
UTblh3
HH
UTblh3UTblh3
UTblh1UTblh1
UTsw1UTblh1
UTsw1 UTsw1
UTblh3UTblh3
UTblh3/HHUTblh3
HH
UTblh3
HH
HH
HH
UTsw1
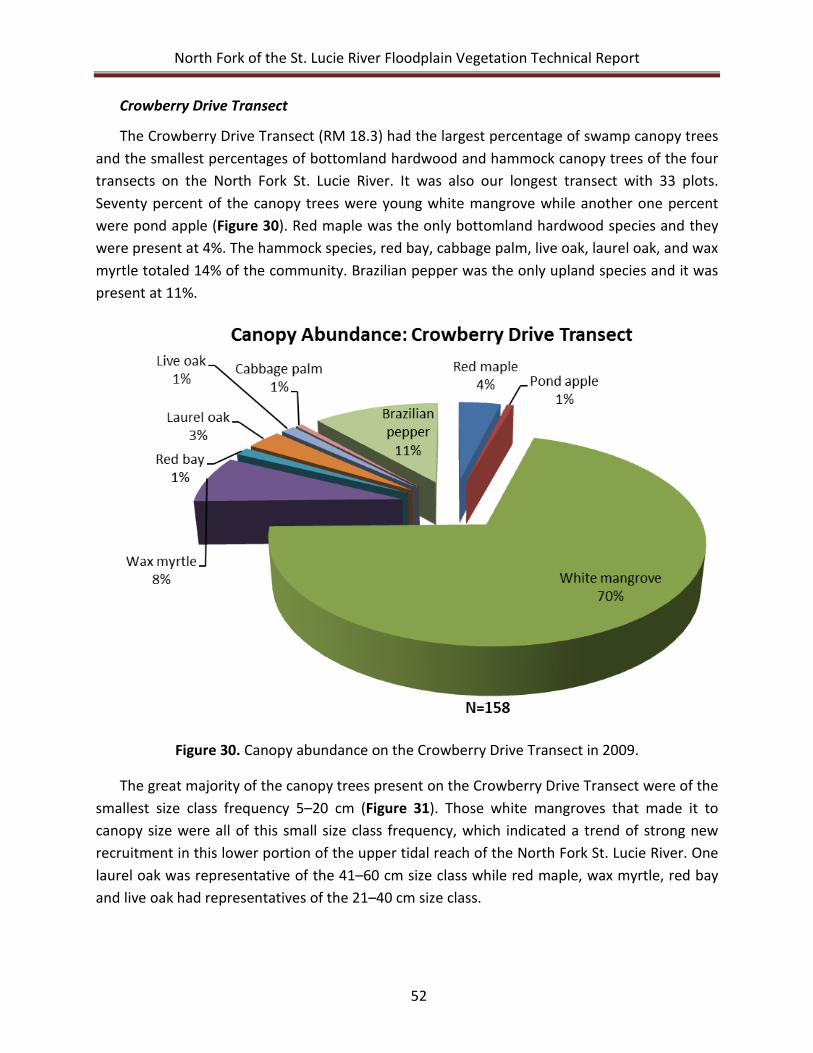
North Fork of the St. Lucie River Floodplain Vegetation Technical Report
52
Crowberry Drive Transect
The Crowberry Drive Transect (RM 18.3) had the largest percentage of swamp canopy trees and the smallest percentages of bottomland hardwood and hammock canopy trees of the four transects on the North Fork St. Lucie River. It was also our longest transect with 33 plots. Seventy percent of the canopy trees were young white mangrove while another one percent were pond apple (Figure 30). Red maple was the only bottomland hardwood species and they were present at 4%. The hammock species, red bay, cabbage palm, live oak, laurel oak, and wax myrtle totaled 14% of the community. Brazilian pepper was the only upland species and it was present at 11%.
Figure 30. Canopy abundance on the Crowberry Drive Transect in 2009.
The great majority of the canopy trees present on the Crowberry Drive Transect were of the smallest size class frequency 5–20 cm (Figure 31). Those white mangroves that made it to canopy size were all of this small size class frequency, which indicated a trend of strong new recruitment in this lower portion of the upper tidal reach of the North Fork St. Lucie River. One laurel oak was representative of the 41–60 cm size class while red maple, wax myrtle, red bay and live oak had representatives of the 21–40 cm size class.
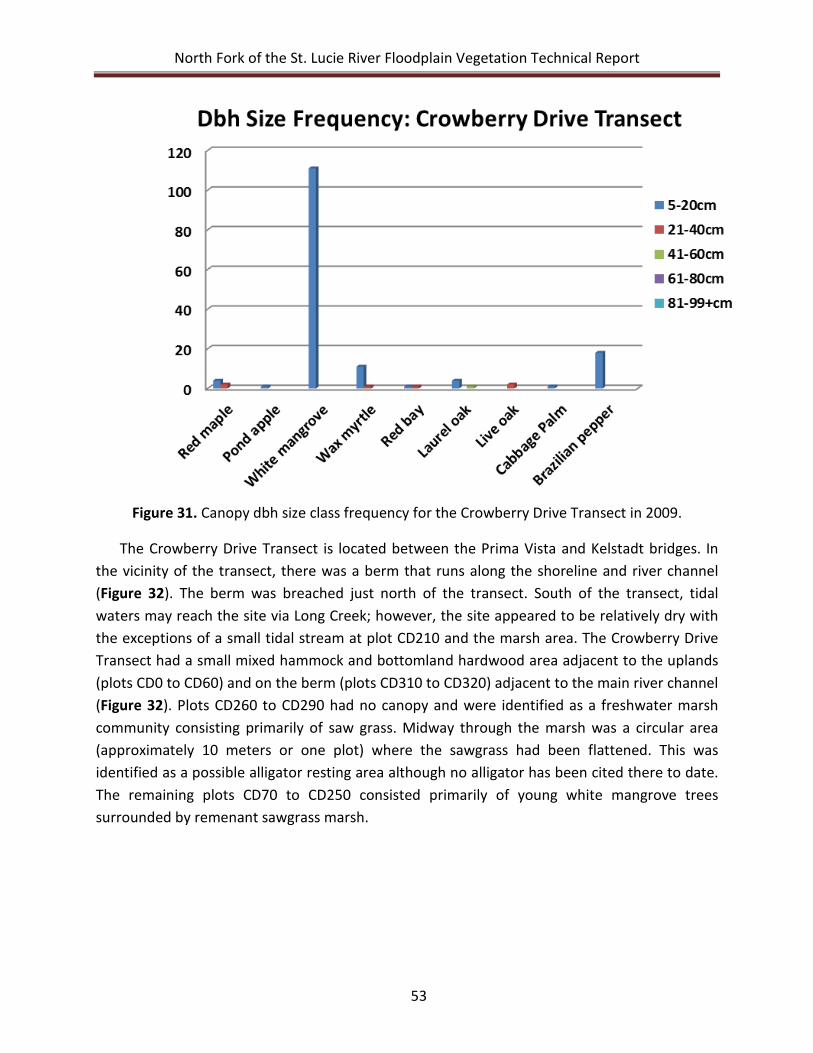
North Fork of the St. Lucie River Floodplain Vegetation Technical Report
53
Figure 31. Canopy dbh size class frequency for the Crowberry Drive Transect in 2009.
The Crowberry Drive Transect is located between the Prima Vista and Kelstadt bridges. In the vicinity of the transect, there was a berm that runs along the shoreline and river channel (Figure 32). The berm was breached just north of the transect. South of the transect, tidal waters may reach the site via Long Creek; however, the site appeared to be relatively dry with the exceptions of a small tidal stream at plot CD210 and the marsh area. The Crowberry Drive Transect had a small mixed hammock and bottomland hardwood area adjacent to the uplands (plots CD0 to CD60) and on the berm (plots CD310 to CD320) adjacent to the main river channel (Figure 32). Plots CD260 to CD290 had no canopy and were identified as a freshwater marsh community consisting primarily of saw grass. Midway through the marsh was a circular area (approximately 10 meters or one plot) where the sawgrass had been flattened. This was identified as a possible alligator resting area although no alligator has been cited there to date. The remaining plots CD70 to CD250 consisted primarily of young white mangrove trees surrounded by remenant sawgrass marsh.
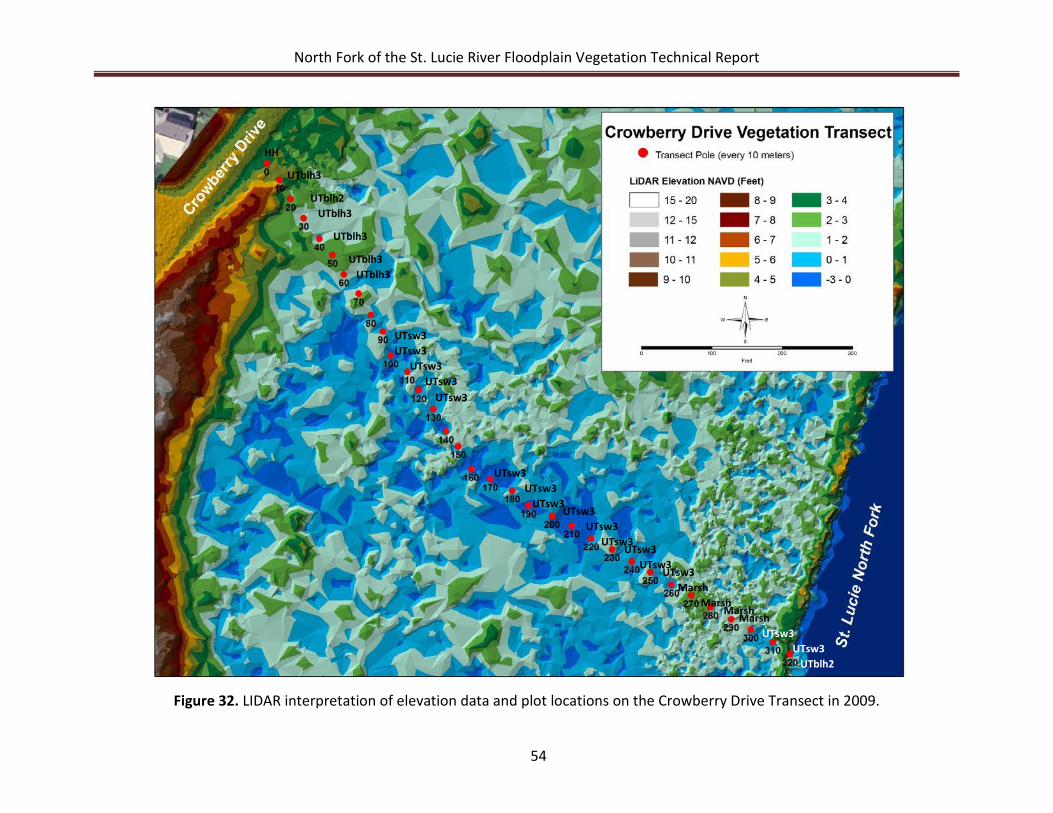
North Fork of the St. Lucie River Floodplain Vegetation Technical Report
54
Figure 32. LIDAR interpretation of elevation data and plot locations on the Crowberry Drive Transect in 2009.
UTblh3
HH
UTblh3UTblh2
UTblh3
UTblh3
UTsw3
UTblh3
UTsw3UTsw3
UTsw3UTsw3
UTsw3UTsw3
UTsw3UTsw3
UTsw3UTsw3
UTsw3UTsw3
MarshUTsw3
MarshMarsh
UTsw3Marsh
UTblh2UTsw3
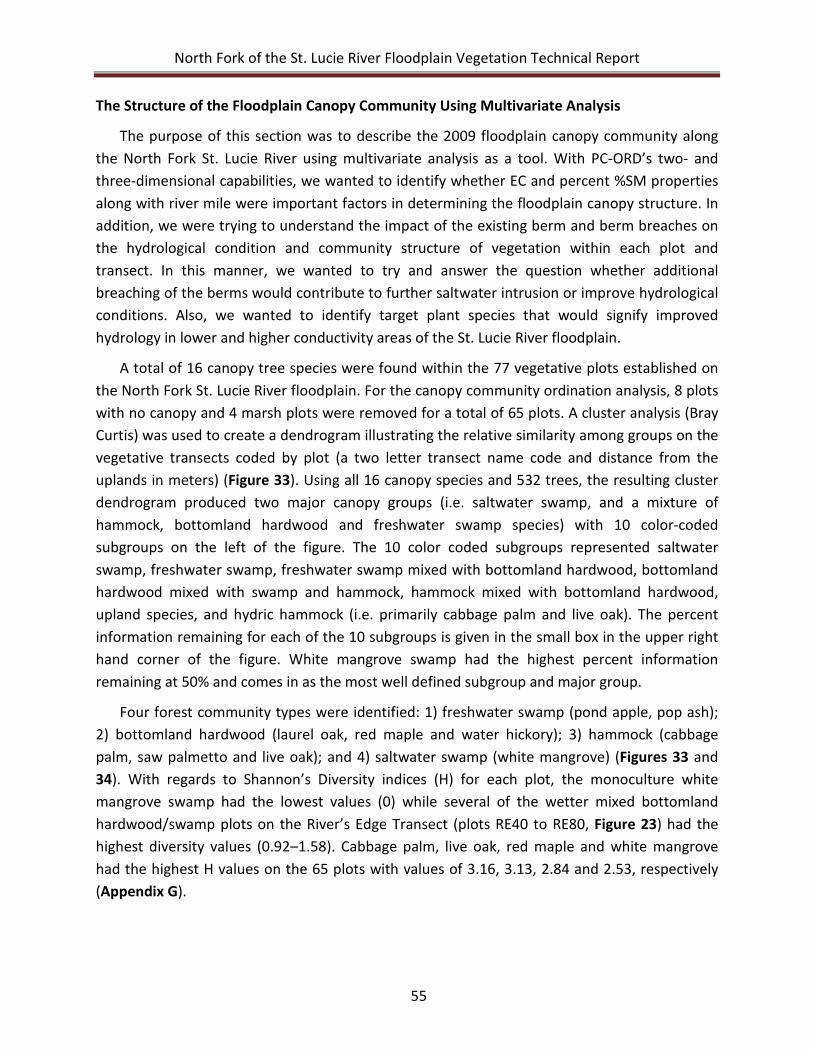
North Fork of the St. Lucie River Floodplain Vegetation Technical Report
55
The Structure of the Floodplain Canopy Community Using Multivariate Analysis
The purpose of this section was to describe the 2009 floodplain canopy community along the North Fork St. Lucie River using multivariate analysis as a tool. With PC-ORD’s two- and three-dimensional capabilities, we wanted to identify whether EC and percent %SM properties along with river mile were important factors in determining the floodplain canopy structure. In addition, we were trying to understand the impact of the existing berm and berm breaches on the hydrological condition and community structure of vegetation within each plot and transect. In this manner, we wanted to try and answer the question whether additional breaching of the berms would contribute to further saltwater intrusion or improve hydrological conditions. Also, we wanted to identify target plant species that would signify improved hydrology in lower and higher conductivity areas of the St. Lucie River floodplain.
A total of 16 canopy tree species were found within the 77 vegetative plots established on the North Fork St. Lucie River floodplain. For the canopy community ordination analysis, 8 plots with no canopy and 4 marsh plots were removed for a total of 65 plots. A cluster analysis (Bray Curtis) was used to create a dendrogram illustrating the relative similarity among groups on the vegetative transects coded by plot (a two letter transect name code and distance from the uplands in meters) (Figure 33). Using all 16 canopy species and 532 trees, the resulting cluster dendrogram produced two major canopy groups (i.e. saltwater swamp, and a mixture of hammock, bottomland hardwood and freshwater swamp species) with 10 color-coded subgroups on the left of the figure. The 10 color coded subgroups represented saltwater swamp, freshwater swamp, freshwater swamp mixed with bottomland hardwood, bottomland hardwood mixed with swamp and hammock, hammock mixed with bottomland hardwood, upland species, and hydric hammock (i.e. primarily cabbage palm and live oak). The percent information remaining for each of the 10 subgroups is given in the small box in the upper right hand corner of the figure. White mangrove swamp had the highest percent information remaining at 50% and comes in as the most well defined subgroup and major group.
Four forest community types were identified: 1) freshwater swamp (pond apple, pop ash); 2) bottomland hardwood (laurel oak, red maple and water hickory); 3) hammock (cabbage palm, saw palmetto and live oak); and 4) saltwater swamp (white mangrove) (Figures 33 and 34). With regards to Shannon’s Diversity indices (H) for each plot, the monoculture white mangrove swamp had the lowest values (0) while several of the wetter mixed bottomland hardwood/swamp plots on the River’s Edge Transect (plots RE40 to RE80, Figure 23) had the highest diversity values (0.92–1.58). Cabbage palm, live oak, red maple and white mangrove had the highest H values on the 65 plots with values of 3.16, 3.13, 2.84 and 2.53, respectively (Appendix G).
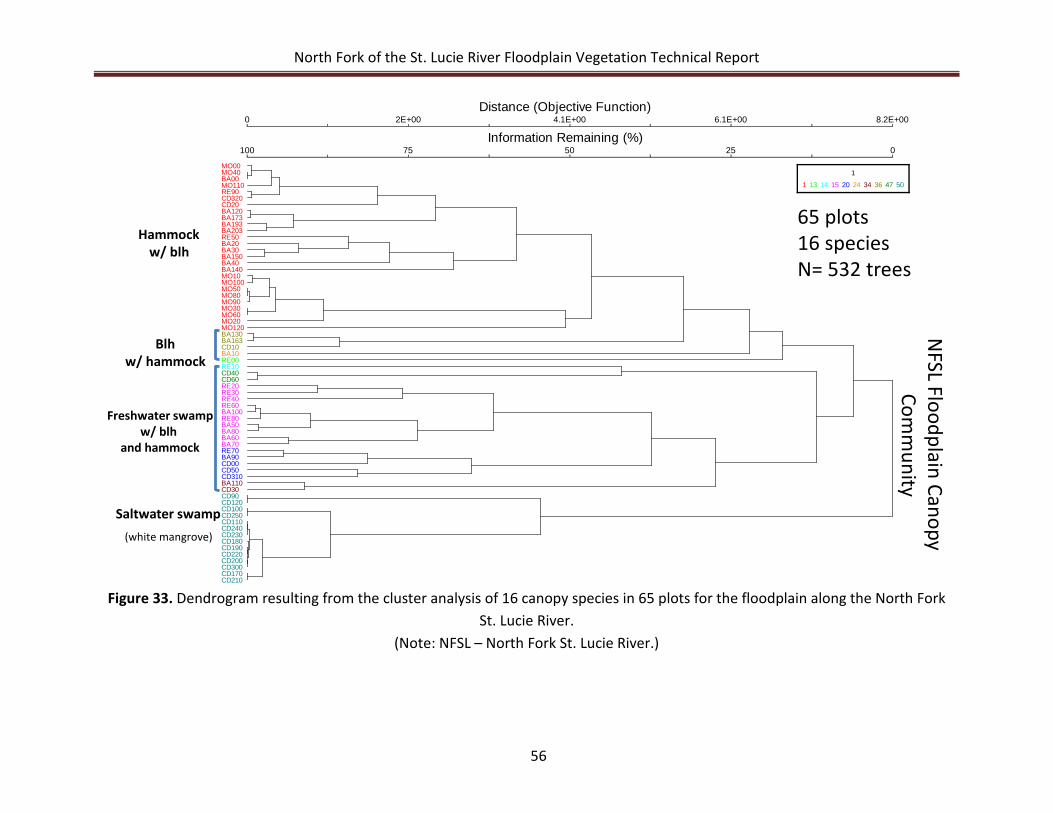
North Fork of the St. Lucie River Floodplain Vegetation Technical Report
56
Figure 33. Dendrogram resulting from the cluster analysis of 16 canopy species in 65 plots for the floodplain along the North Fork St. Lucie River.
(Note: NFSL – North Fork St. Lucie River.)
Distance (Objective Function)
Information Remaining (%)0
100
2E+00
75
4.1E+00
50
6.1E+00
25
8.2E+00
0
MO00MO40BA00MO110RE90CD320CD20BA120BA173BA193BA203RE50BA20BA30BA150BA40BA140MO10MO100MO50MO80MO90MO30MO60MO20MO120BA130BA163CD10BA10RE00RE10CD40CD60RE20RE30RE40RE60BA100RE80BA50BA80BA60BA70RE70BA90CD00CD50CD310BA110CD30CD90CD120CD100CD250CD110CD240CD230CD180CD190CD220CD200CD300CD170CD210
1
1 13 14 15 20 24 34 36 47 50
65 plots16 speciesN= 532 trees
NFSL Floodplain Canopy
Comm
unity
Saltwater swamp(white mangrove)
Hammockw/ blh
Blhw/ hammock
Freshwater swampw/ blh
and hammock
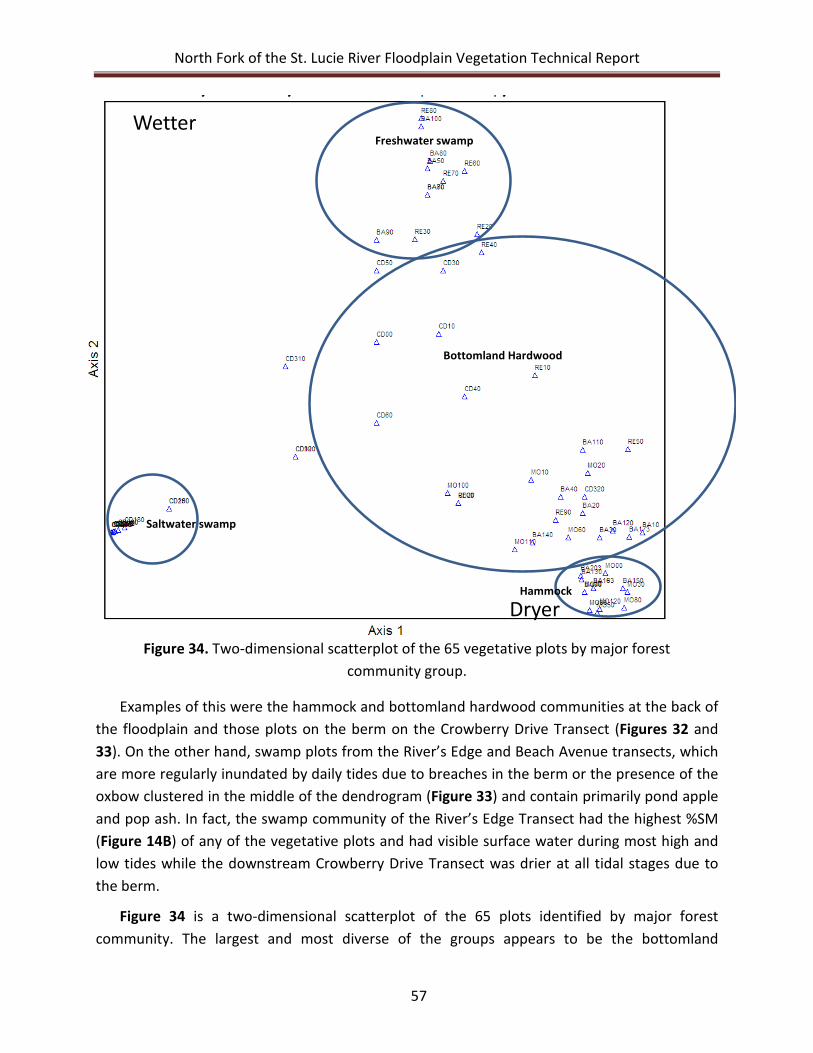
North Fork of the St. Lucie River Floodplain Vegetation Technical Report
57
Figure 34. Two-dimensional scatterplot of the 65 vegetative plots by major forest community group.
Examples of this were the hammock and bottomland hardwood communities at the back of the floodplain and those plots on the berm on the Crowberry Drive Transect (Figures 32 and 33). On the other hand, swamp plots from the River’s Edge and Beach Avenue transects, which are more regularly inundated by daily tides due to breaches in the berm or the presence of the oxbow clustered in the middle of the dendrogram (Figure 33) and contain primarily pond apple and pop ash. In fact, the swamp community of the River’s Edge Transect had the highest %SM (Figure 14B) of any of the vegetative plots and had visible surface water during most high and low tides while the downstream Crowberry Drive Transect was drier at all tidal stages due to the berm.
Figure 34 is a two-dimensional scatterplot of the 65 plots identified by major forest community. The largest and most diverse of the groups appears to be the bottomland
Saltwater swamp
Freshwater swamp
Bottomland Hardwood
Hammock
Wetter
Dryer
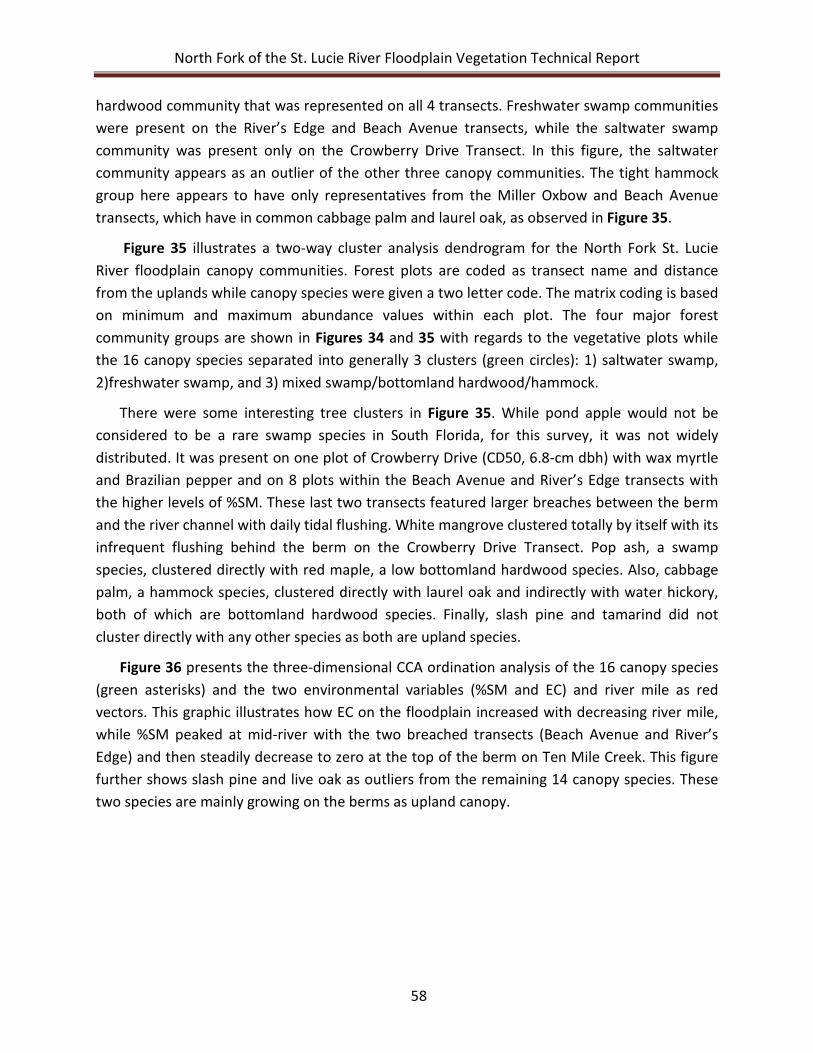
North Fork of the St. Lucie River Floodplain Vegetation Technical Report
58
hardwood community that was represented on all 4 transects. Freshwater swamp communities were present on the River’s Edge and Beach Avenue transects, while the saltwater swamp community was present only on the Crowberry Drive Transect. In this figure, the saltwater community appears as an outlier of the other three canopy communities. The tight hammock group here appears to have only representatives from the Miller Oxbow and Beach Avenue transects, which have in common cabbage palm and laurel oak, as observed in Figure 35.
Figure 35 illustrates a two-way cluster analysis dendrogram for the North Fork St. Lucie River floodplain canopy communities. Forest plots are coded as transect name and distance from the uplands while canopy species were given a two letter code. The matrix coding is based on minimum and maximum abundance values within each plot. The four major forest community groups are shown in Figures 34 and 35 with regards to the vegetative plots while the 16 canopy species separated into generally 3 clusters (green circles): 1) saltwater swamp, 2)freshwater swamp, and 3) mixed swamp/bottomland hardwood/hammock.
There were some interesting tree clusters in Figure 35. While pond apple would not be considered to be a rare swamp species in South Florida, for this survey, it was not widely distributed. It was present on one plot of Crowberry Drive (CD50, 6.8-cm dbh) with wax myrtle and Brazilian pepper and on 8 plots within the Beach Avenue and River’s Edge transects with the higher levels of %SM. These last two transects featured larger breaches between the berm and the river channel with daily tidal flushing. White mangrove clustered totally by itself with its infrequent flushing behind the berm on the Crowberry Drive Transect. Pop ash, a swamp species, clustered directly with red maple, a low bottomland hardwood species. Also, cabbage palm, a hammock species, clustered directly with laurel oak and indirectly with water hickory, both of which are bottomland hardwood species. Finally, slash pine and tamarind did not cluster directly with any other species as both are upland species.
Figure 36 presents the three-dimensional CCA ordination analysis of the 16 canopy species (green asterisks) and the two environmental variables (%SM and EC) and river mile as red vectors. This graphic illustrates how EC on the floodplain increased with decreasing river mile, while %SM peaked at mid-river with the two breached transects (Beach Avenue and River’s Edge) and then steadily decrease to zero at the top of the berm on Ten Mile Creek. This figure further shows slash pine and live oak as outliers from the remaining 14 canopy species. These two species are mainly growing on the berms as upland canopy.
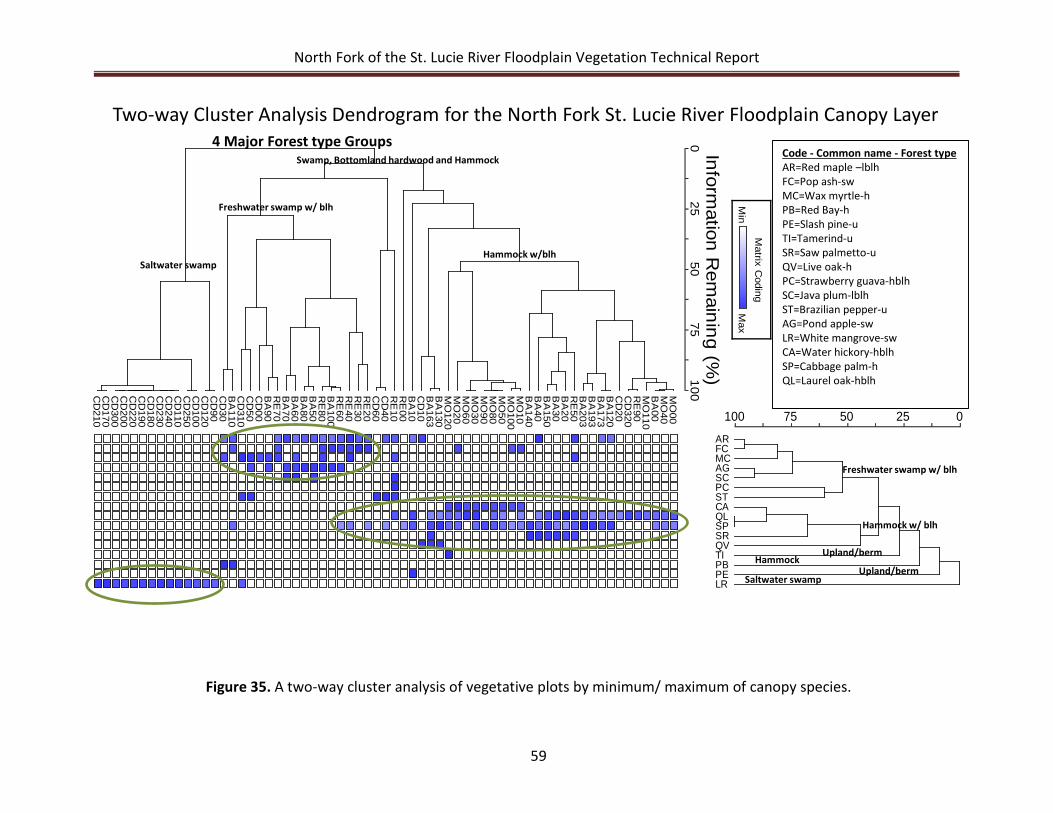
North Fork of the St. Lucie River Floodplain Vegetation Technical Report
59
Figure 35. A two-way cluster analysis of vegetative plots by minimum/ maximum of canopy species.
Information R
emaining (%
)0
2550
75100
100 75 50 25 0
MO
00M
O40
BA
00M
O110
RE
90C
D320
CD
20B
A120
BA
173B
A193
BA
203R
E50
BA
20B
A30
BA
150B
A40
BA
140M
O10
MO
100M
O50
MO
80M
O90
MO
30M
O60
MO
20M
O120
BA
130B
A163
CD
10B
A10
RE
00R
E10
CD
40C
D60
RE
20R
E30
RE
40R
E60
BA
100R
E80
BA
50B
A80
BA
60B
A70
RE
70B
A90
CD
00C
D50
CD
310B
A110
CD
30C
D90
CD
120C
D100
CD
250C
D110
CD
240C
D230
CD
180C
D190
CD
220C
D200
CD
300C
D170
CD
210
ARFCMCAGSCPCSTCAQLSPSRQVTIPBPELR
Matrix C
oding
Max
Min
Saltwater swamp
Upland/berm
Freshwater swamp w/ blh
Hammock w/ blh
HammockUpland/berm
Two-way Cluster Analysis Dendrogram for the North Fork St. Lucie River Floodplain Canopy Layer
Saltwater swamp
Freshwater swamp w/ blh
Swamp, Bottomland hardwood and Hammock
Hammock w/blh
Code - Common name - Forest typeAR=Red maple –lblhFC=Pop ash-swMC=Wax myrtle-hPB=Red Bay-hPE=Slash pine-uTI=Tamerind-uSR=Saw palmetto-uQV=Live oak-hPC=Strawberry guava-hblhSC=Java plum-lblhST=Brazilian pepper-uAG=Pond apple-swLR=White mangrove-swCA=Water hickory-hblhSP=Cabbage palm-hQL=Laurel oak-hblh
4 Major Forest type Groups
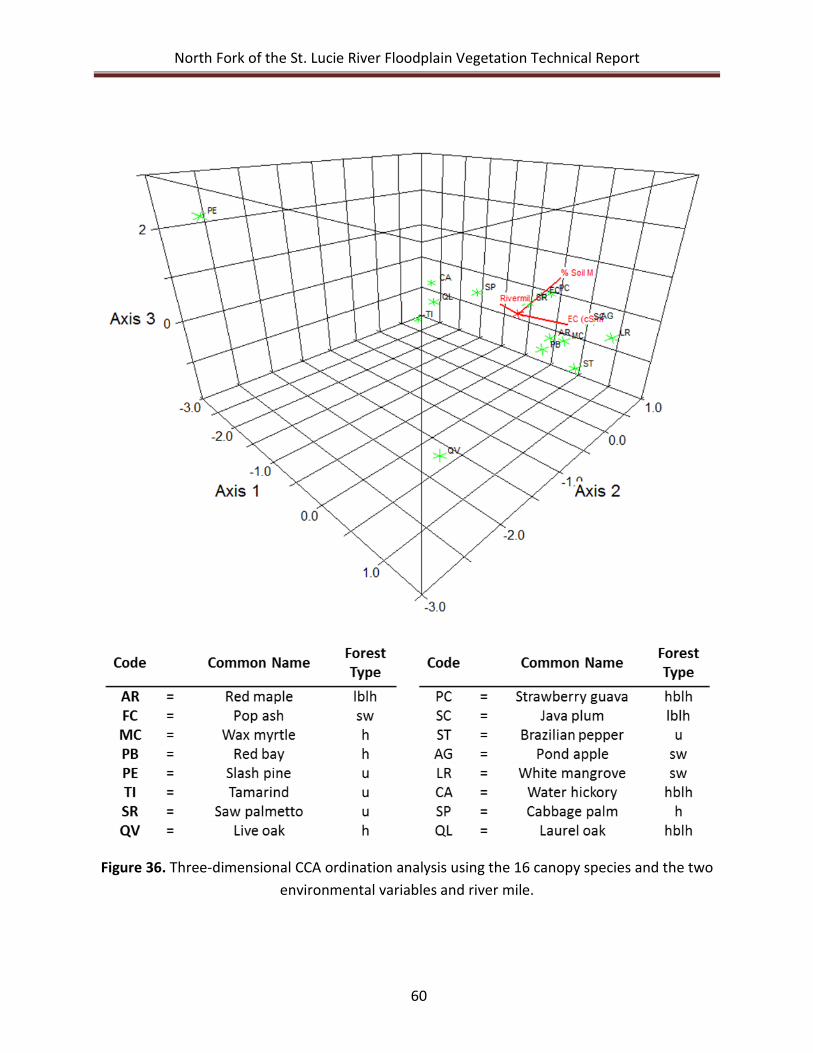
North Fork of the St. Lucie River Floodplain Vegetation Technical Report
60
Figure 36. Three-dimensional CCA ordination analysis using the 16 canopy species and the two environmental variables and river mile.
North Fork of the St. Lucie River Floodplain Vegetation Technical Report
61
Table 6 provides the results of the CCA analysis using log transformed data. The correlation between EC and %SM was only 0.358. Axis 1 accounted for 11% of the variance of the cumulative variance while Axis 2 accounted for 14% and Axis 3 accounted for 16.2% of the variance among species distribution. Pearson correlations between the species and the environmental variables were 0.831 for Axis 1 and 0.655 for Axis 2. Intra-set correlations were -0.992 for EC on Axis 1, 0.683 for %SM on Axis 3 and -0.885 for river mile on Axis 1 while inter-set correlations were 0.824 for EC on Axis 1, 0.446 for %SM on Axis 2 and -0.735 for river mile on Axis 1. Significant Pearson, Kendall tau were observed for water hickory (-0.685, 0.469 and -0.465) on Axis 1; white mangrove (0.463, 0.214, 0.561) on Axis 1; laurel oak (-0.603, 0.364,-0.5) on Axis 1; and cabbage palm (-0.424, 0.180,-0.414) on Axis 1. EC had the highest Pearson Kendall tau with 0.989, 0.978 and 0.871 on Axis 1. %SM had the second highest values with 0.798, 0.636 and 0.521 on Axis 3.
Table 6. CCA results for the North Fork St. Lucie River floodplain canopy abundance by species.
CORRELATIONS AMONG VARIABLES IN SECOND MATRIX EC (cS/m) %SM River Mile
EC (cS/m) 1.000 0.358 -0.831 %SM 0.358 1.000 -0.107
River Mile -0.831 -0.107 1.000
AXIS SUMMARY STATISTICS Total variance ("inertia") in the species data: 4.8825
Statistics Axis 1 Axis 2 Axis 3 Eigenvalue 0.516 0.161 0.112 Variance in species data % of variance explained 10.6 3.3 2.3 Cumulative % explained 10.6 13.9 16.2 Pearson Correlation, Species-Environment* 0.831 0.655 0.614
Kendall (Rank) Correlation, Species-Environment 0.727 0.470 0.330
* Correlations are "intra-set correlations" of ter Braak (1986) CORRELATIONS AND BIPLOT SCORES for 3 variable
Variable Correlations* Biplot Scores
Axis 1 Axis 2 Axis 3 Axis 1 Axis 2 Axis 3 1 EC (cS/m) 0.992 0.125 0.019 0.690 0.115 0.018
2 %SM 0.262 0.681 0.683 0.183 0.624 0.644
3 River Mile -0.885 0.408 -0.224 -0.616 0.374 -0.211 * Correlations are "intra-set correlations" of ter Braak (1986)
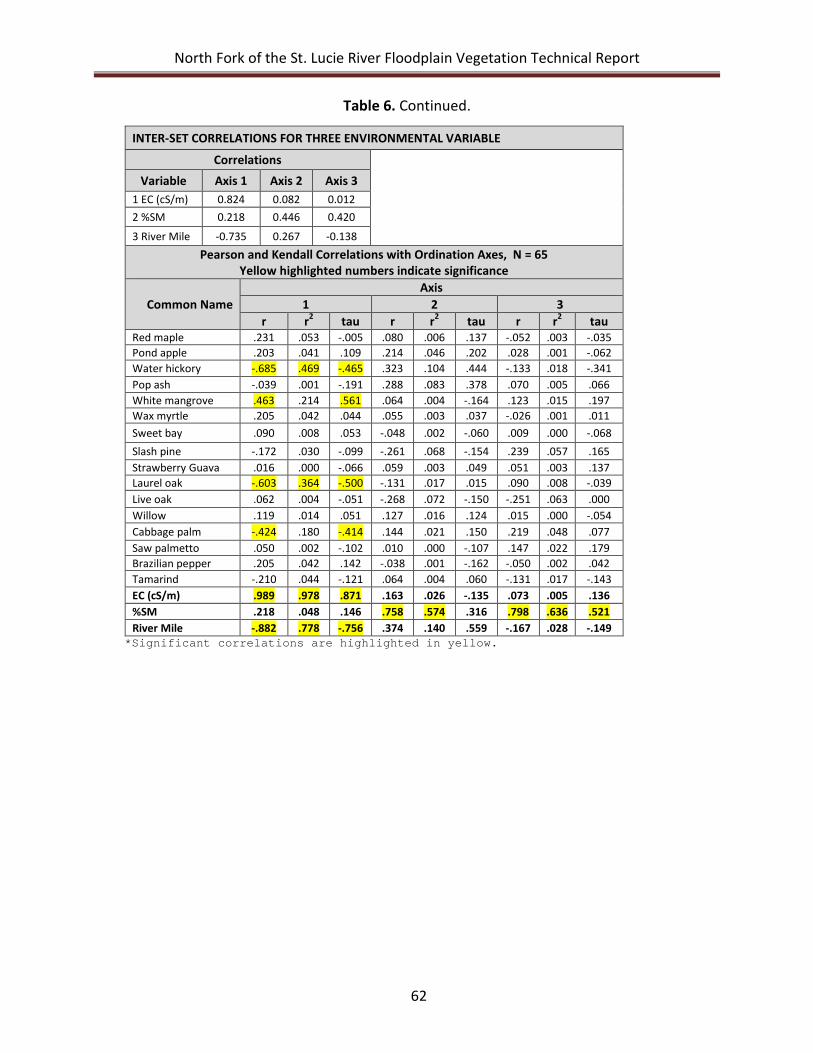
North Fork of the St. Lucie River Floodplain Vegetation Technical Report
62
Table 6. Continued.
INTER-SET CORRELATIONS FOR THREE ENVIRONMENTAL VARIABLE
Correlations
Variable Axis 1 Axis 2 Axis 3 1 EC (cS/m) 0.824 0.082 0.012 2 %SM 0.218 0.446 0.420
3 River Mile -0.735 0.267 -0.138 Pearson and Kendall Correlations with Ordination Axes, N = 65
Yellow highlighted numbers indicate significance
Common Name Axis
1 2 3 r r2 tau r r2 tau r r2 tau
Red maple .231 .053 -.005 .080 .006 .137 -.052 .003 -.035 Pond apple .203 .041 .109 .214 .046 .202 .028 .001 -.062 Water hickory -.685 .469 -.465 .323 .104 .444 -.133 .018 -.341 Pop ash -.039 .001 -.191 .288 .083 .378 .070 .005 .066 White mangrove .463 .214 .561 .064 .004 -.164 .123 .015 .197 Wax myrtle .205 .042 .044 .055 .003 .037 -.026 .001 .011 Sweet bay .090 .008 .053 -.048 .002 -.060 .009 .000 -.068 Slash pine -.172 .030 -.099 -.261 .068 -.154 .239 .057 .165 Strawberry Guava .016 .000 -.066 .059 .003 .049 .051 .003 .137 Laurel oak -.603 .364 -.500 -.131 .017 .015 .090 .008 -.039 Live oak .062 .004 -.051 -.268 .072 -.150 -.251 .063 .000 Willow .119 .014 .051 .127 .016 .124 .015 .000 -.054 Cabbage palm -.424 .180 -.414 .144 .021 .150 .219 .048 .077 Saw palmetto .050 .002 -.102 .010 .000 -.107 .147 .022 .179 Brazilian pepper .205 .042 .142 -.038 .001 -.162 -.050 .002 .042 Tamarind -.210 .044 -.121 .064 .004 .060 -.131 .017 -.143 EC (cS/m) .989 .978 .871 .163 .026 -.135 .073 .005 .136 %SM .218 .048 .146 .758 .574 .316 .798 .636 .521 River Mile -.882 .778 -.756 .374 .140 .559 -.167 .028 -.149
*Significant correlations are highlighted in yellow.
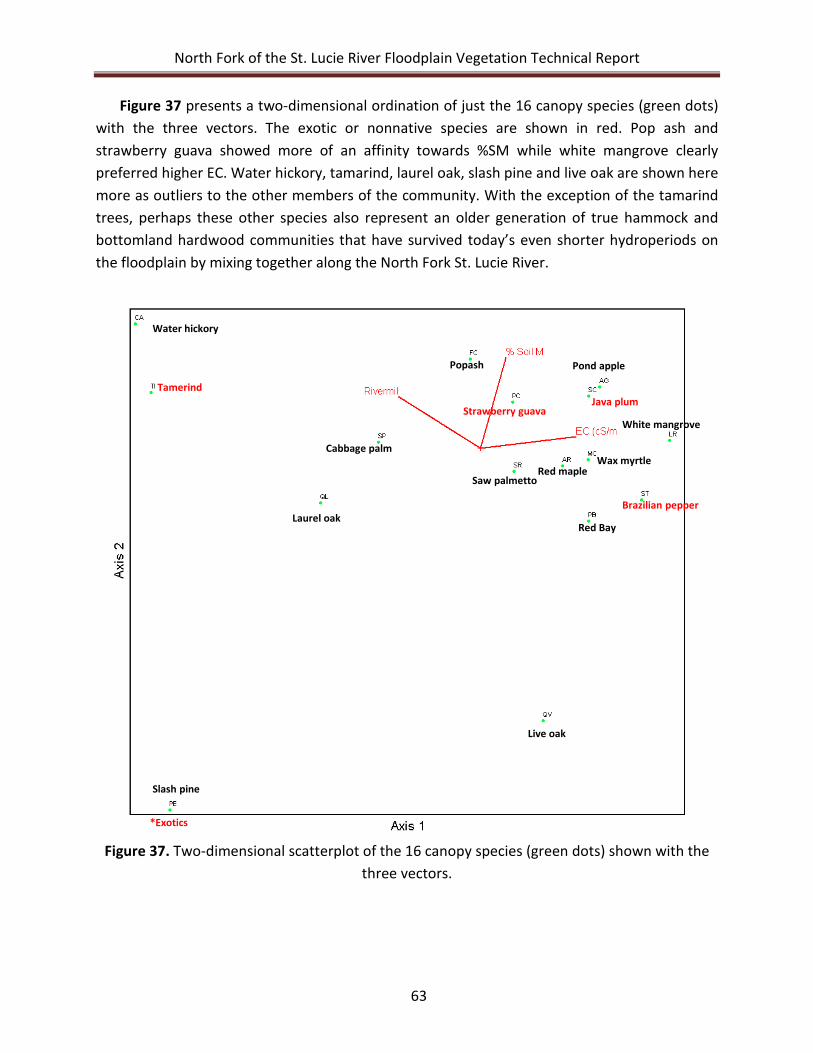
North Fork of the St. Lucie River Floodplain Vegetation Technical Report
63
Figure 37 presents a two-dimensional ordination of just the 16 canopy species (green dots) with the three vectors. The exotic or nonnative species are shown in red. Pop ash and strawberry guava showed more of an affinity towards %SM while white mangrove clearly preferred higher EC. Water hickory, tamarind, laurel oak, slash pine and live oak are shown here more as outliers to the other members of the community. With the exception of the tamarind trees, perhaps these other species also represent an older generation of true hammock and bottomland hardwood communities that have survived today’s even shorter hydroperiods on the floodplain by mixing together along the North Fork St. Lucie River.
Figure 37. Two-dimensional scatterplot of the 16 canopy species (green dots) shown with the three vectors.
*Exotics
Brazilian pepper
Tamerind
Laurel oak
Saw palmetto
Water hickory
Slash pine
Cabbage palm
Live oak
Strawberry guava
Red maple
Red Bay
Wax myrtle
White mangrove
Pond apple
Java plum
Popash
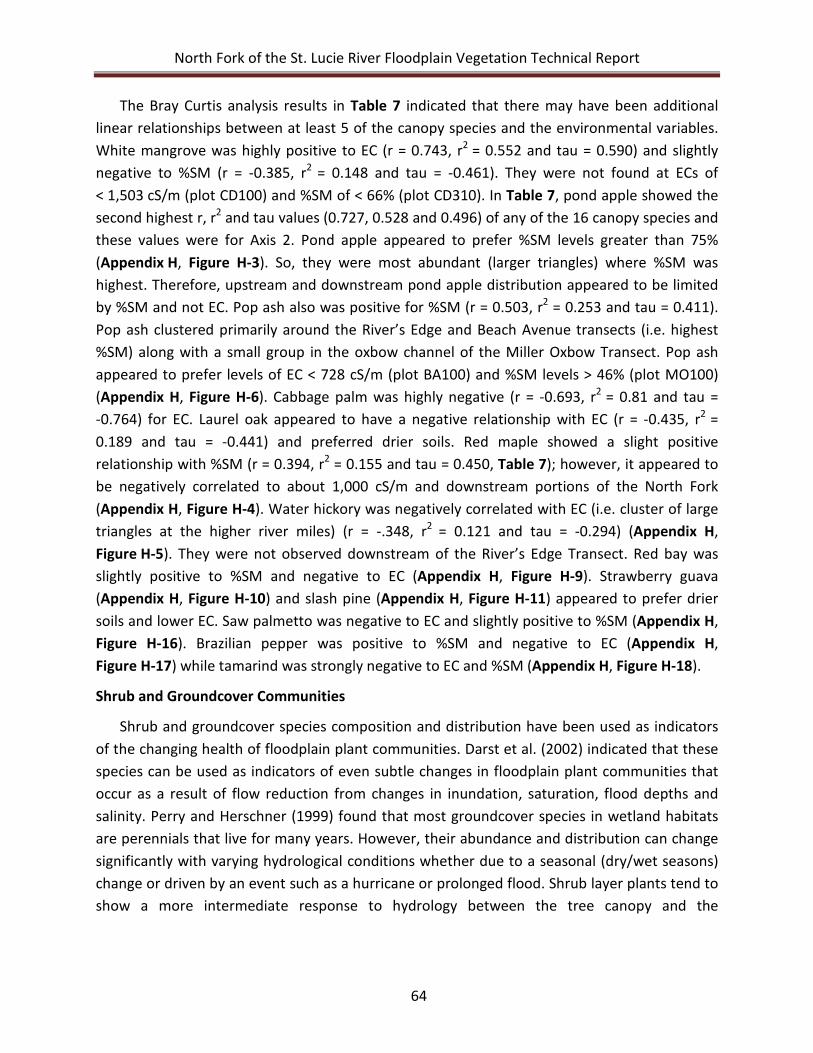
North Fork of the St. Lucie River Floodplain Vegetation Technical Report
64
The Bray Curtis analysis results in Table 7 indicated that there may have been additional linear relationships between at least 5 of the canopy species and the environmental variables. White mangrove was highly positive to EC (r = 0.743, r2 = 0.552 and tau = 0.590) and slightly negative to %SM (r = -0.385, r2 = 0.148 and tau = -0.461). They were not found at ECs of < 1,503 cS/m (plot CD100) and %SM of < 66% (plot CD310). In Table 7, pond apple showed the second highest r, r2 and tau values (0.727, 0.528 and 0.496) of any of the 16 canopy species and these values were for Axis 2. Pond apple appeared to prefer %SM levels greater than 75% (Appendix H, Figure H-3). So, they were most abundant (larger triangles) where %SM was highest. Therefore, upstream and downstream pond apple distribution appeared to be limited by %SM and not EC. Pop ash also was positive for %SM (r = 0.503, r2 = 0.253 and tau = 0.411). Pop ash clustered primarily around the River’s Edge and Beach Avenue transects (i.e. highest %SM) along with a small group in the oxbow channel of the Miller Oxbow Transect. Pop ash appeared to prefer levels of EC < 728 cS/m (plot BA100) and %SM levels > 46% (plot MO100) (Appendix H, Figure H-6). Cabbage palm was highly negative (r = -0.693, r2 = 0.81 and tau = -0.764) for EC. Laurel oak appeared to have a negative relationship with EC (r = -0.435, r2 = 0.189 and tau = -0.441) and preferred drier soils. Red maple showed a slight positive relationship with %SM (r = 0.394, r2 = 0.155 and tau = 0.450, Table 7); however, it appeared to be negatively correlated to about 1,000 cS/m and downstream portions of the North Fork (Appendix H, Figure H-4). Water hickory was negatively correlated with EC (i.e. cluster of large triangles at the higher river miles) (r = -.348, r2 = 0.121 and tau = -0.294) (Appendix H, Figure H-5). They were not observed downstream of the River’s Edge Transect. Red bay was slightly positive to %SM and negative to EC (Appendix H, Figure H-9). Strawberry guava (Appendix H, Figure H-10) and slash pine (Appendix H, Figure H-11) appeared to prefer drier soils and lower EC. Saw palmetto was negative to EC and slightly positive to %SM (Appendix H, Figure H-16). Brazilian pepper was positive to %SM and negative to EC (Appendix H, Figure H-17) while tamarind was strongly negative to EC and %SM (Appendix H, Figure H-18).
Shrub and Groundcover Communities
Shrub and groundcover species composition and distribution have been used as indicators of the changing health of floodplain plant communities. Darst et al. (2002) indicated that these species can be used as indicators of even subtle changes in floodplain plant communities that occur as a result of flow reduction from changes in inundation, saturation, flood depths and salinity. Perry and Herschner (1999) found that most groundcover species in wetland habitats are perennials that live for many years. However, their abundance and distribution can change significantly with varying hydrological conditions whether due to a seasonal (dry/wet seasons) change or driven by an event such as a hurricane or prolonged flood. Shrub layer plants tend to show a more intermediate response to hydrology between the tree canopy and the
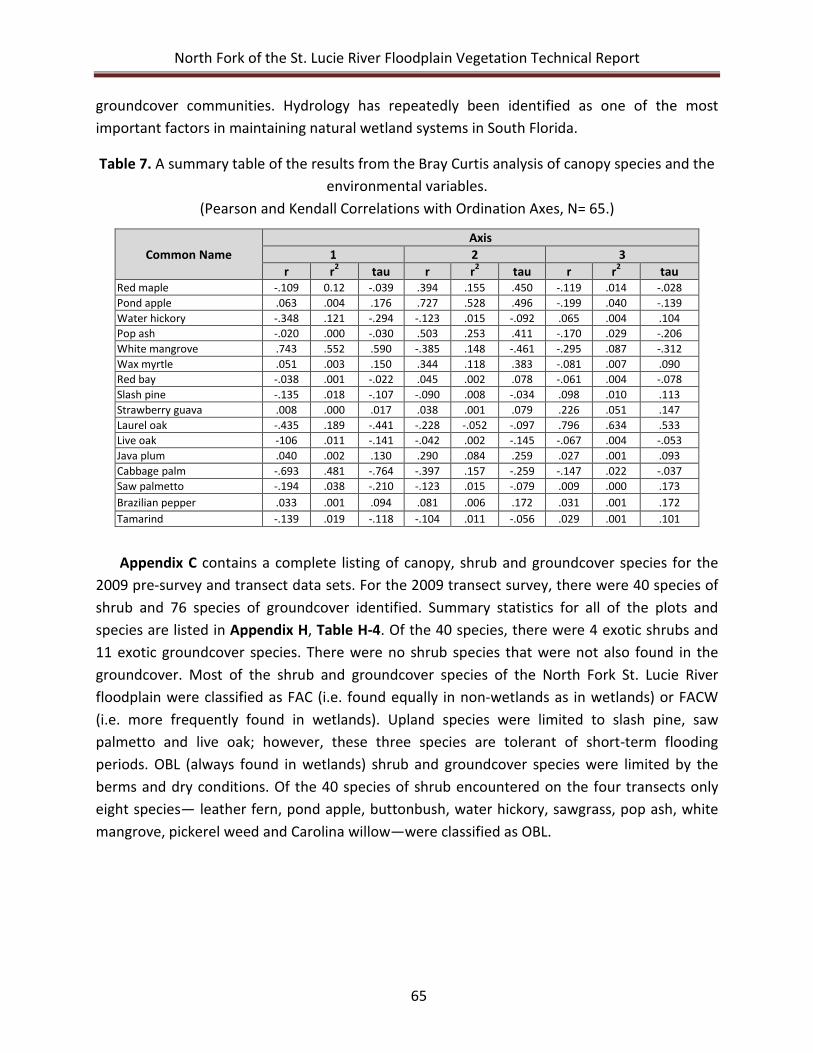
North Fork of the St. Lucie River Floodplain Vegetation Technical Report
65
groundcover communities. Hydrology has repeatedly been identified as one of the most important factors in maintaining natural wetland systems in South Florida.
Table 7. A summary table of the results from the Bray Curtis analysis of canopy species and the environmental variables.
(Pearson and Kendall Correlations with Ordination Axes, N= 65.)
Common Name Axis
1 2 3 r r2 tau r r2 tau r r2 tau
Red maple -.109 0.12 -.039 .394 .155 .450 -.119 .014 -.028 Pond apple .063 .004 .176 .727 .528 .496 -.199 .040 -.139 Water hickory -.348 .121 -.294 -.123 .015 -.092 .065 .004 .104 Pop ash -.020 .000 -.030 .503 .253 .411 -.170 .029 -.206 White mangrove .743 .552 .590 -.385 .148 -.461 -.295 .087 -.312 Wax myrtle .051 .003 .150 .344 .118 .383 -.081 .007 .090 Red bay -.038 .001 -.022 .045 .002 .078 -.061 .004 -.078 Slash pine -.135 .018 -.107 -.090 .008 -.034 .098 .010 .113 Strawberry guava .008 .000 .017 .038 .001 .079 .226 .051 .147 Laurel oak -.435 .189 -.441 -.228 -.052 -.097 .796 .634 .533 Live oak -106 .011 -.141 -.042 .002 -.145 -.067 .004 -.053 Java plum .040 .002 .130 .290 .084 .259 .027 .001 .093 Cabbage palm -.693 .481 -.764 -.397 .157 -.259 -.147 .022 -.037 Saw palmetto -.194 .038 -.210 -.123 .015 -.079 .009 .000 .173 Brazilian pepper .033 .001 .094 .081 .006 .172 .031 .001 .172 Tamarind -.139 .019 -.118 -.104 .011 -.056 .029 .001 .101
Appendix C contains a complete listing of canopy, shrub and groundcover species for the 2009 pre-survey and transect data sets. For the 2009 transect survey, there were 40 species of shrub and 76 species of groundcover identified. Summary statistics for all of the plots and species are listed in Appendix H, Table H-4. Of the 40 species, there were 4 exotic shrubs and 11 exotic groundcover species. There were no shrub species that were not also found in the groundcover. Most of the shrub and groundcover species of the North Fork St. Lucie River floodplain were classified as FAC (i.e. found equally in non-wetlands as in wetlands) or FACW (i.e. more frequently found in wetlands). Upland species were limited to slash pine, saw palmetto and live oak; however, these three species are tolerant of short-term flooding periods. OBL (always found in wetlands) shrub and groundcover species were limited by the berms and dry conditions. Of the 40 species of shrub encountered on the four transects only eight species— leather fern, pond apple, buttonbush, water hickory, sawgrass, pop ash, white mangrove, pickerel weed and Carolina willow—were classified as OBL.
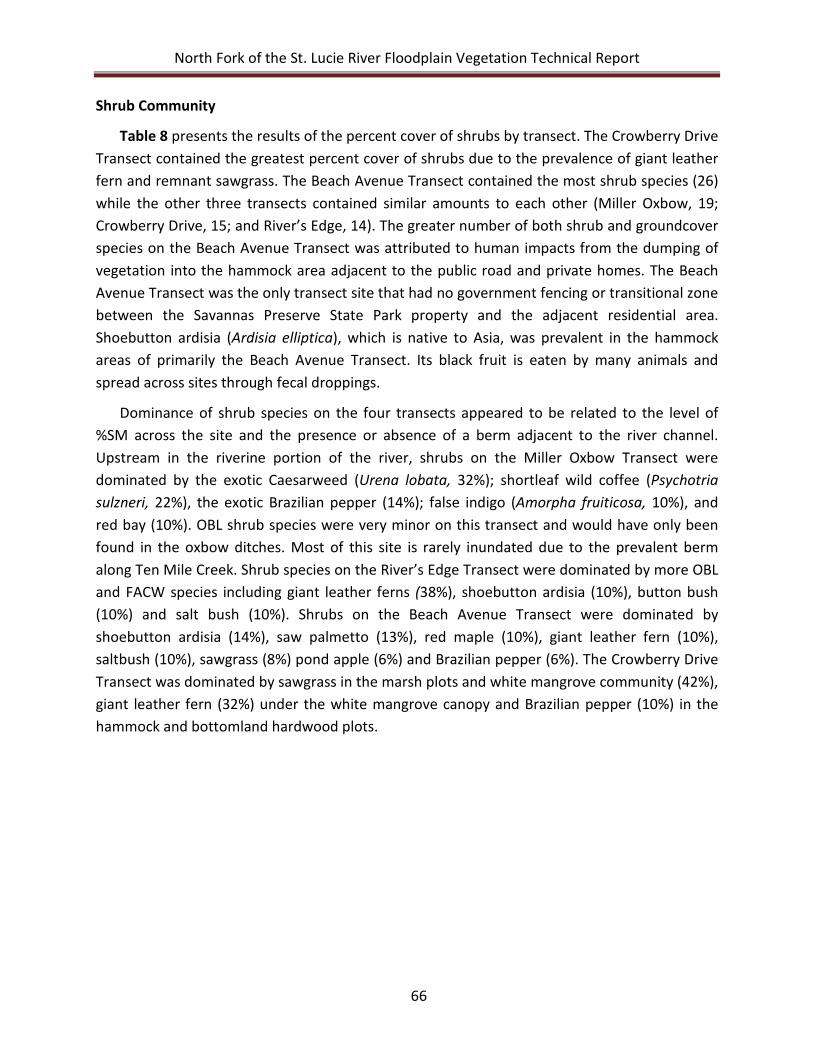
North Fork of the St. Lucie River Floodplain Vegetation Technical Report
66
Shrub Community
Table 8 presents the results of the percent cover of shrubs by transect. The Crowberry Drive Transect contained the greatest percent cover of shrubs due to the prevalence of giant leather fern and remnant sawgrass. The Beach Avenue Transect contained the most shrub species (26) while the other three transects contained similar amounts to each other (Miller Oxbow, 19; Crowberry Drive, 15; and River’s Edge, 14). The greater number of both shrub and groundcover species on the Beach Avenue Transect was attributed to human impacts from the dumping of vegetation into the hammock area adjacent to the public road and private homes. The Beach Avenue Transect was the only transect site that had no government fencing or transitional zone between the Savannas Preserve State Park property and the adjacent residential area. Shoebutton ardisia (Ardisia elliptica), which is native to Asia, was prevalent in the hammock areas of primarily the Beach Avenue Transect. Its black fruit is eaten by many animals and spread across sites through fecal droppings.
Dominance of shrub species on the four transects appeared to be related to the level of %SM across the site and the presence or absence of a berm adjacent to the river channel. Upstream in the riverine portion of the river, shrubs on the Miller Oxbow Transect were dominated by the exotic Caesarweed (Urena lobata, 32%); shortleaf wild coffee (Psychotria sulzneri, 22%), the exotic Brazilian pepper (14%); false indigo (Amorpha fruiticosa, 10%), and red bay (10%). OBL shrub species were very minor on this transect and would have only been found in the oxbow ditches. Most of this site is rarely inundated due to the prevalent berm along Ten Mile Creek. Shrub species on the River’s Edge Transect were dominated by more OBL and FACW species including giant leather ferns (38%), shoebutton ardisia (10%), button bush (10%) and salt bush (10%). Shrubs on the Beach Avenue Transect were dominated by shoebutton ardisia (14%), saw palmetto (13%), red maple (10%), giant leather fern (10%), saltbush (10%), sawgrass (8%) pond apple (6%) and Brazilian pepper (6%). The Crowberry Drive Transect was dominated by sawgrass in the marsh plots and white mangrove community (42%), giant leather fern (32%) under the white mangrove canopy and Brazilian pepper (10%) in the hammock and bottomland hardwood plots.
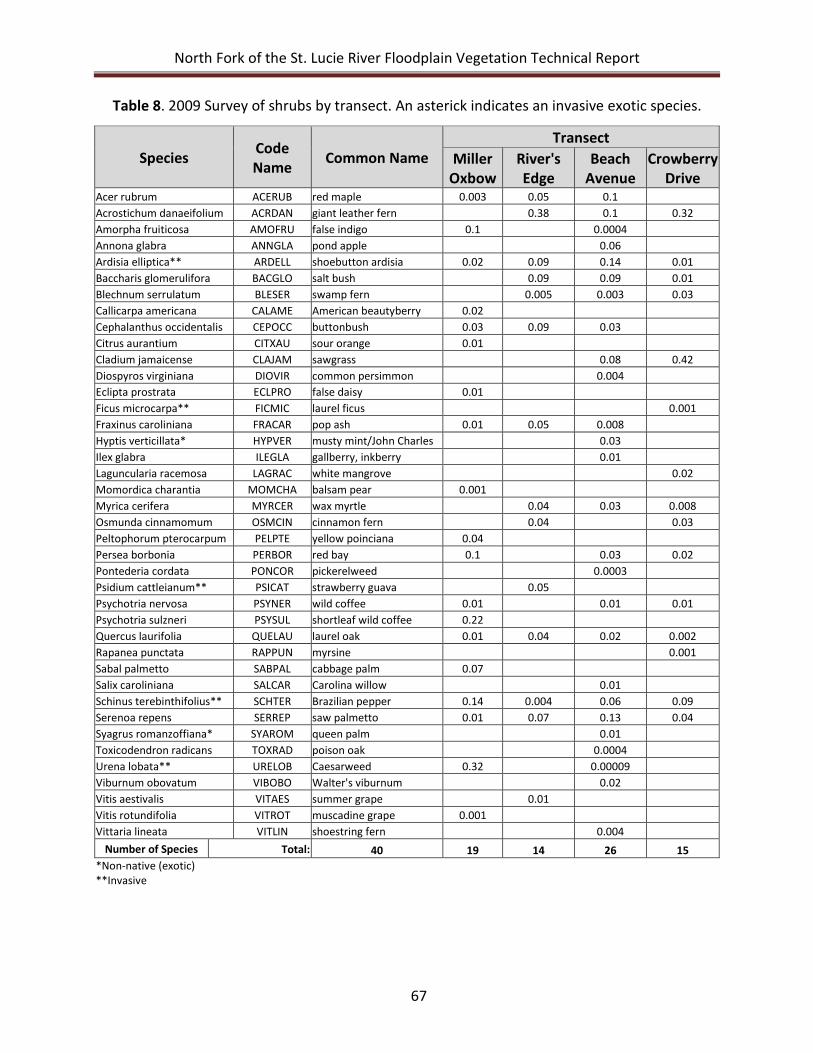
North Fork of the St. Lucie River Floodplain Vegetation Technical Report
67
Table 8. 2009 Survey of shrubs by transect. An asterick indicates an invasive exotic species.
Species Code Name Common Name
Transect Miller
Oxbow River's Edge
Beach Avenue
Crowberry Drive
Acer rubrum ACERUB red maple 0.003 0.05 0.1 Acrostichum danaeifolium ACRDAN giant leather fern 0.38 0.1 0.32 Amorpha fruiticosa AMOFRU false indigo 0.1 0.0004 Annona glabra ANNGLA pond apple 0.06 Ardisia elliptica** ARDELL shoebutton ardisia 0.02 0.09 0.14 0.01 Baccharis glomerulifora BACGLO salt bush 0.09 0.09 0.01 Blechnum serrulatum BLESER swamp fern 0.005 0.003 0.03 Callicarpa americana CALAME American beautyberry 0.02 Cephalanthus occidentalis CEPOCC buttonbush 0.03 0.09 0.03 Citrus aurantium CITXAU sour orange 0.01 Cladium jamaicense CLAJAM sawgrass 0.08 0.42 Diospyros virginiana DIOVIR common persimmon 0.004 Eclipta prostrata ECLPRO false daisy 0.01 Ficus microcarpa** FICMIC laurel ficus 0.001 Fraxinus caroliniana FRACAR pop ash 0.01 0.05 0.008 Hyptis verticillata* HYPVER musty mint/John Charles 0.03 Ilex glabra ILEGLA gallberry, inkberry 0.01 Laguncularia racemosa LAGRAC white mangrove 0.02 Momordica charantia MOMCHA balsam pear 0.001 Myrica cerifera MYRCER wax myrtle 0.04 0.03 0.008 Osmunda cinnamomum OSMCIN cinnamon fern 0.04 0.03 Peltophorum pterocarpum PELPTE yellow poinciana 0.04 Persea borbonia PERBOR red bay 0.1 0.03 0.02 Pontederia cordata PONCOR pickerelweed 0.0003 Psidium cattleianum** PSICAT strawberry guava 0.05 Psychotria nervosa PSYNER wild coffee 0.01 0.01 0.01 Psychotria sulzneri PSYSUL shortleaf wild coffee 0.22 Quercus laurifolia QUELAU laurel oak 0.01 0.04 0.02 0.002 Rapanea punctata RAPPUN myrsine 0.001 Sabal palmetto SABPAL cabbage palm 0.07 Salix caroliniana SALCAR Carolina willow 0.01 Schinus terebinthifolius** SCHTER Brazilian pepper 0.14 0.004 0.06 0.09 Serenoa repens SERREP saw palmetto 0.01 0.07 0.13 0.04 Syagrus romanzoffiana* SYAROM queen palm 0.01 Toxicodendron radicans TOXRAD poison oak 0.0004 Urena lobata** URELOB Caesarweed 0.32 0.00009 Viburnum obovatum VIBOBO Walter's viburnum 0.02 Vitis aestivalis VITAES summer grape 0.01 Vitis rotundifolia VITROT muscadine grape 0.001 Vittaria lineata VITLIN shoestring fern 0.004
Number of Species Total: 40 19 14 26 15 *Non-native (exotic) **Invasive
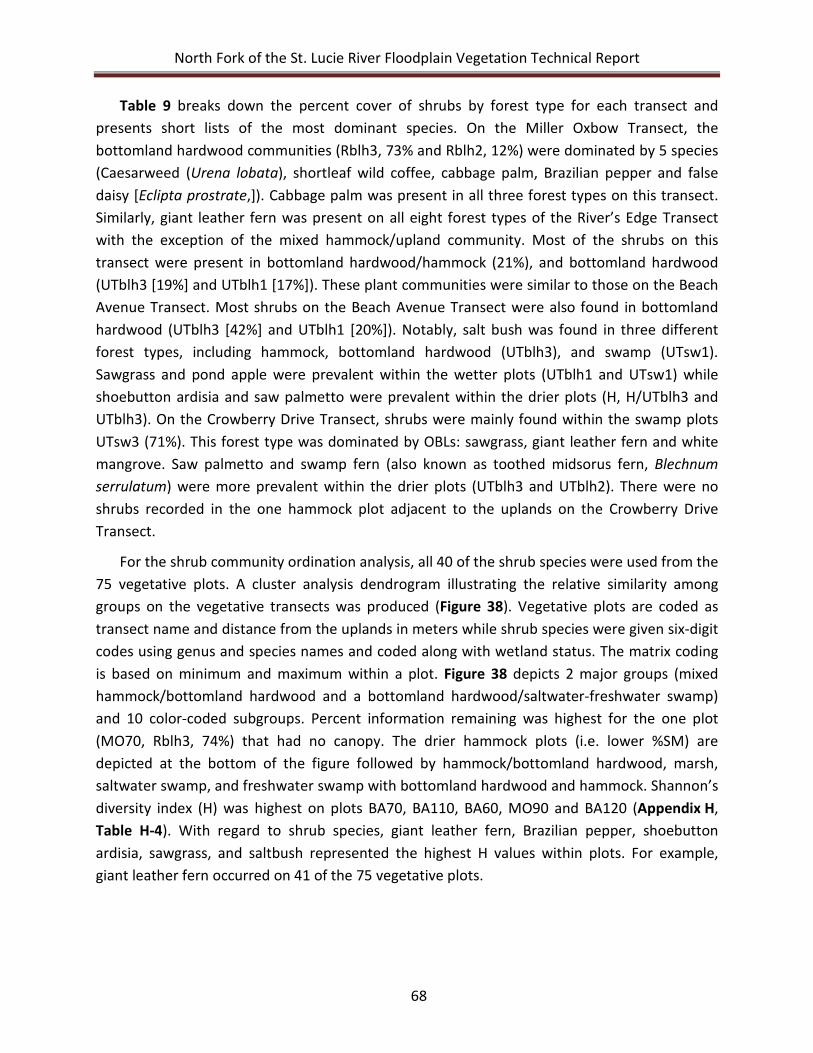
North Fork of the St. Lucie River Floodplain Vegetation Technical Report
68
Table 9 breaks down the percent cover of shrubs by forest type for each transect and presents short lists of the most dominant species. On the Miller Oxbow Transect, the bottomland hardwood communities (Rblh3, 73% and Rblh2, 12%) were dominated by 5 species (Caesarweed (Urena lobata), shortleaf wild coffee, cabbage palm, Brazilian pepper and false daisy [Eclipta prostrate,]). Cabbage palm was present in all three forest types on this transect. Similarly, giant leather fern was present on all eight forest types of the River’s Edge Transect with the exception of the mixed hammock/upland community. Most of the shrubs on this transect were present in bottomland hardwood/hammock (21%), and bottomland hardwood (UTblh3 [19%] and UTblh1 [17%]). These plant communities were similar to those on the Beach Avenue Transect. Most shrubs on the Beach Avenue Transect were also found in bottomland hardwood (UTblh3 [42%] and UTblh1 [20%]). Notably, salt bush was found in three different forest types, including hammock, bottomland hardwood (UTblh3), and swamp (UTsw1). Sawgrass and pond apple were prevalent within the wetter plots (UTblh1 and UTsw1) while shoebutton ardisia and saw palmetto were prevalent within the drier plots (H, H/UTblh3 and UTblh3). On the Crowberry Drive Transect, shrubs were mainly found within the swamp plots UTsw3 (71%). This forest type was dominated by OBLs: sawgrass, giant leather fern and white mangrove. Saw palmetto and swamp fern (also known as toothed midsorus fern, Blechnum serrulatum) were more prevalent within the drier plots (UTblh3 and UTblh2). There were no shrubs recorded in the one hammock plot adjacent to the uplands on the Crowberry Drive Transect.
For the shrub community ordination analysis, all 40 of the shrub species were used from the 75 vegetative plots. A cluster analysis dendrogram illustrating the relative similarity among groups on the vegetative transects was produced (Figure 38). Vegetative plots are coded as transect name and distance from the uplands in meters while shrub species were given six-digit codes using genus and species names and coded along with wetland status. The matrix coding is based on minimum and maximum within a plot. Figure 38 depicts 2 major groups (mixed hammock/bottomland hardwood and a bottomland hardwood/saltwater-freshwater swamp) and 10 color-coded subgroups. Percent information remaining was highest for the one plot (MO70, Rblh3, 74%) that had no canopy. The drier hammock plots (i.e. lower %SM) are depicted at the bottom of the figure followed by hammock/bottomland hardwood, marsh, saltwater swamp, and freshwater swamp with bottomland hardwood and hammock. Shannon’s diversity index (H) was highest on plots BA70, BA110, BA60, MO90 and BA120 (Appendix H, Table H-4). With regard to shrub species, giant leather fern, Brazilian pepper, shoebutton ardisia, sawgrass, and saltbush represented the highest H values within plots. For example, giant leather fern occurred on 41 of the 75 vegetative plots.
North Fork of the St. Lucie River Floodplain Vegetation Technical Report
69
Table 9. Percent cover of shrubs by forest type and transect.
Transect Forest Types
H/U H H/UTblh3 Rblh3 Rblh2 UTblh2/3/H UTblh3 UTblh2/3 UTblh2 UTblh1 UTmix UTsw3 UTsw2 UTsw1 Marsh Miller Oxbow 0.16 0.73 0.12 Most common
SERREP
URELOB PSYSUL
species
PERBOR
PSYSUL SABPAL
PSYNER
SABPAL
SABPAL
SCHTER
PELPTE
ECLPRO
River's Edge 0.08 0.21 0.12 0.19 0.08 0.04 0.17 0.12 Most common SERREP
ACRDAN
BACGLO ARDELL ACRDAN SERREP ACRDAN
ACRDAN
species BACGLO
CEPOCC
ACRDAN ACRDAN OSMCIN
ARDELL
ACERUB
VITAES
QUELAU
OSMCIN
FRACAR
OSMCIN
ACERUB
MYRCER
BACGLO
BACGLO
FRACAR
Beach Avenue 0.16 0.03 0.42 0.2 0.18 Most common
BACGLO ARDELL
ARDELL
CLAJAM
ACRDAN
species
SERREP SERREP
SERREP
ACERUB
CLAJAM
QUELAU
ACERUB
CEPOCC
ANNGLA
ILEGLA
ACRDAN
MYRCER
HYPVER
ARDELL
BACGLO
ANNGLA
BACGLO
Crowberry Drive 0.11 0.06 0.03 0.71 0.09 Most common
ACRDAN
SERREP
ACRDAN CLAJAM
CLAJAM
species
OSMCIN
MYRCER
CLAJAM ACRDAN
SCHTER
BLESER
BLESER
SCHTER
ACRDAN
SERREP
ARDELL
LAGRAC
LAGRAC PERBOR
See Appendix C for species codes. See Appendix F for forest type codes.
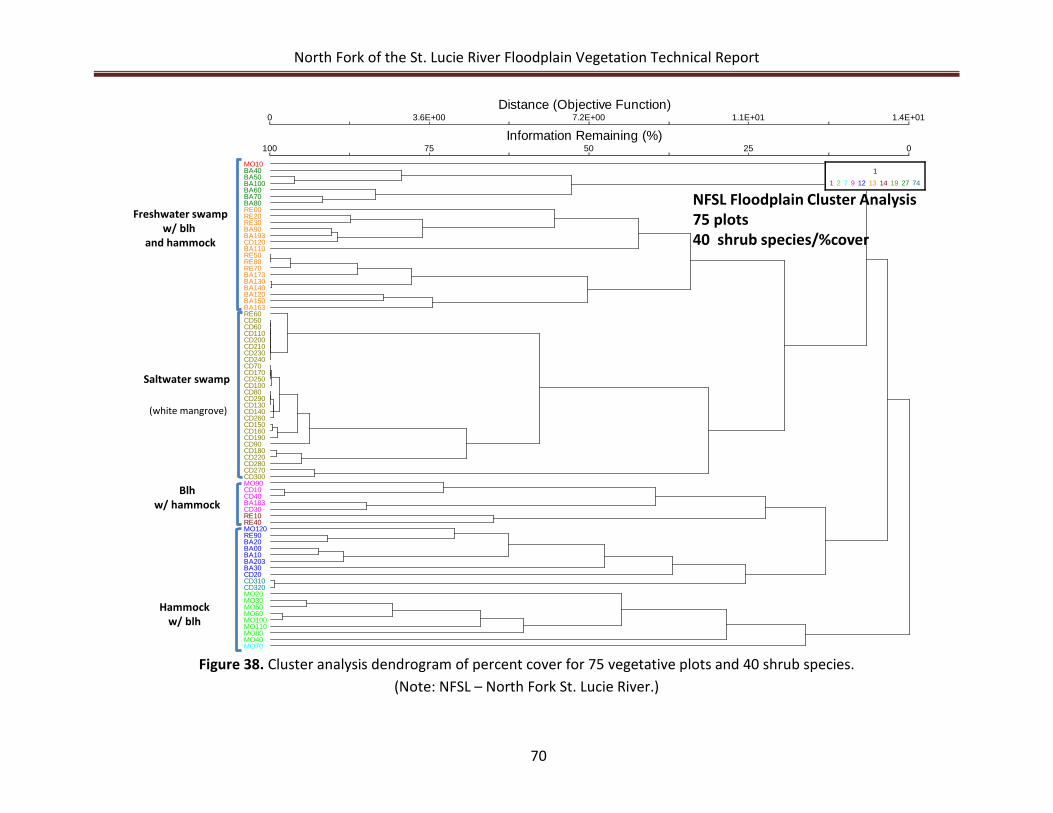
North Fork of the St. Lucie River Floodplain Vegetation Technical Report
70
Figure 38. Cluster analysis dendrogram of percent cover for 75 vegetative plots and 40 shrub species. (Note: NFSL – North Fork St. Lucie River.)
Distance (Objective Function)
Information Remaining (%)0
100
3.6E+00
75
7.2E+00
50
1.1E+01
25
1.4E+01
0
MO10BA40BA50BA100BA60BA70BA80RE00RE20RE30BA90BA193CD120BA110RE50RE80RE70BA173BA130BA140BA120BA150BA163RE60CD50CD60CD110CD200CD210CD230CD240CD70CD170CD250CD100CD80CD290CD130CD140CD260CD150CD160CD190CD90CD180CD220CD280CD270CD300MO90CD10CD40BA183CD30RE10RE40MO120RE90BA20BA00BA10BA203BA30CD20CD310CD320MO20MO30MO50MO60MO100MO110MO80MO40MO70
1
1 2 7 9 12 13 14 19 27 74
Saltwater swamp
(white mangrove)
Hammockw/ blh
Blhw/ hammock
Freshwater swampw/ blh
and hammock
NFSL Floodplain Cluster Analysis75 plots40 shrub species/%cover
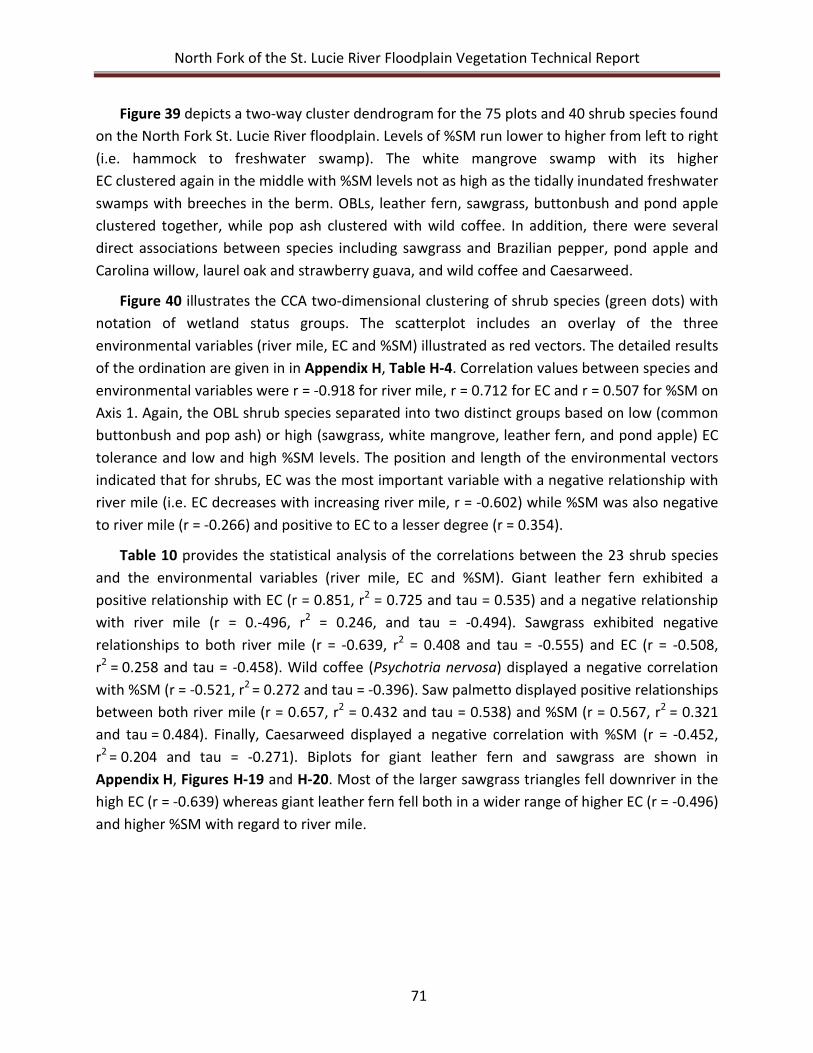
North Fork of the St. Lucie River Floodplain Vegetation Technical Report
71
Figure 39 depicts a two-way cluster dendrogram for the 75 plots and 40 shrub species found on the North Fork St. Lucie River floodplain. Levels of %SM run lower to higher from left to right (i.e. hammock to freshwater swamp). The white mangrove swamp with its higher EC clustered again in the middle with %SM levels not as high as the tidally inundated freshwater swamps with breeches in the berm. OBLs, leather fern, sawgrass, buttonbush and pond apple clustered together, while pop ash clustered with wild coffee. In addition, there were several direct associations between species including sawgrass and Brazilian pepper, pond apple and Carolina willow, laurel oak and strawberry guava, and wild coffee and Caesarweed.
Figure 40 illustrates the CCA two-dimensional clustering of shrub species (green dots) with notation of wetland status groups. The scatterplot includes an overlay of the three environmental variables (river mile, EC and %SM) illustrated as red vectors. The detailed results of the ordination are given in in Appendix H, Table H-4. Correlation values between species and environmental variables were r = -0.918 for river mile, r = 0.712 for EC and r = 0.507 for %SM on Axis 1. Again, the OBL shrub species separated into two distinct groups based on low (common buttonbush and pop ash) or high (sawgrass, white mangrove, leather fern, and pond apple) EC tolerance and low and high %SM levels. The position and length of the environmental vectors indicated that for shrubs, EC was the most important variable with a negative relationship with river mile (i.e. EC decreases with increasing river mile, r = -0.602) while %SM was also negative to river mile (r = -0.266) and positive to EC to a lesser degree (r = 0.354).
Table 10 provides the statistical analysis of the correlations between the 23 shrub species and the environmental variables (river mile, EC and %SM). Giant leather fern exhibited a positive relationship with EC (r = 0.851, r2 = 0.725 and tau = 0.535) and a negative relationship with river mile (r = 0.-496, r2 = 0.246, and tau = -0.494). Sawgrass exhibited negative relationships to both river mile (r = -0.639, r2 = 0.408 and tau = -0.555) and EC (r = -0.508, r2 = 0.258 and tau = -0.458). Wild coffee (Psychotria nervosa) displayed a negative correlation with %SM (r = -0.521, r2 = 0.272 and tau = -0.396). Saw palmetto displayed positive relationships between both river mile (r = 0.657, r2 = 0.432 and tau = 0.538) and %SM (r = 0.567, r2 = 0.321 and tau = 0.484). Finally, Caesarweed displayed a negative correlation with %SM (r = -0.452, r2 = 0.204 and tau = -0.271). Biplots for giant leather fern and sawgrass are shown in Appendix H, Figures H-19 and H-20. Most of the larger sawgrass triangles fell downriver in the high EC (r = -0.639) whereas giant leather fern fell both in a wider range of higher EC (r = -0.496) and higher %SM with regard to river mile.
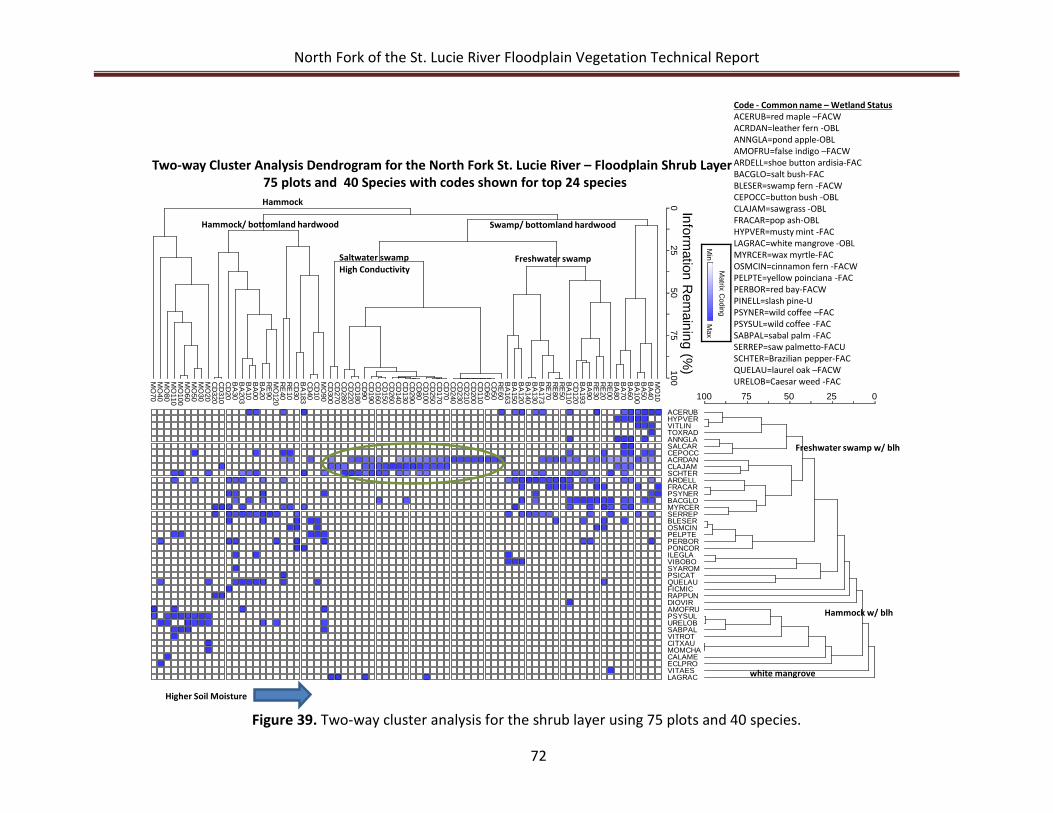
North Fork of the St. Lucie River Floodplain Vegetation Technical Report
72
Figure 39. Two-way cluster analysis for the shrub layer using 75 plots and 40 species.
y
Information R
emaining (%
)0
2550
75100
100 75 50 25 0M
O10
BA
40B
A50
BA
100B
A60
BA
70B
A80
RE
00R
E20
RE
30B
A90
BA
193C
D120
BA
110R
E50
RE
80R
E70
BA
173B
A130
BA
140B
A120
BA
150B
A163
RE
60C
D50
CD
60C
D110
CD
200C
D210
CD
230C
D240
CD
70C
D170
CD
250C
D100
CD
80C
D290
CD
130C
D140
CD
260C
D150
CD
160C
D190
CD
90C
D180
CD
220C
D280
CD
270C
D300
MO
90C
D10
CD
40B
A183
CD
30R
E10
RE
40M
O120
RE
90B
A20
BA
00B
A10
BA
203B
A30
CD
20C
D310
CD
320M
O20
MO
30M
O50
MO
60M
O100
MO
110M
O80
MO
40M
O70
ACERUBHYPVERVITLINTOXRADANNGLASALCARCEPOCCACRDANCLAJAMSCHTERARDELLFRACARPSYNERBACGLOMYRCERSERREPBLESEROSMCINPELPTEPERBORPONCORILEGLAVIBOBOSYAROMPSICATQUELAUFICMICRAPPUNDIOVIRAMOFRUPSYSULURELOBSABPALVITROTCITXAUMOMCHACALAMEECLPROVITAESLAGRAC
Matrix C
oding
Max
MinSaltwater swamp
Code - Common name – Wetland StatusACERUB=red maple –FACWACRDAN=leather fern -OBLANNGLA=pond apple-OBLAMOFRU=false indigo –FACWARDELL=shoe button ardisia-FACBACGLO=salt bush-FACBLESER=swamp fern -FACWCEPOCC=button bush -OBLCLAJAM=sawgrass -OBLFRACAR=pop ash-OBLHYPVER=musty mint -FACLAGRAC=white mangrove -OBLMYRCER=wax myrtle-FACOSMCIN=cinnamon fern -FACWPELPTE=yellow poinciana -FACPERBOR=red bay-FACWPINELL=slash pine-UPSYNER=wild coffee –FACPSYSUL=wild coffee -FACSABPAL=sabal palm -FACSERREP=saw palmetto-FACUSCHTER=Brazilian pepper-FACQUELAU=laurel oak –FACWURELOB=Caesar weed -FAC
Higher Soil Moisture
Freshwater swamp
Hammock
Swamp/ bottomland hardwood
High Conductivity
Hammock/ bottomland hardwood
Two-way Cluster Analysis Dendrogram for the North Fork St. Lucie River – Floodplain Shrub Layer75 plots and 40 Species with codes shown for top 24 species
white mangrove
Freshwater swamp w/ blh
Hammock w/ blh
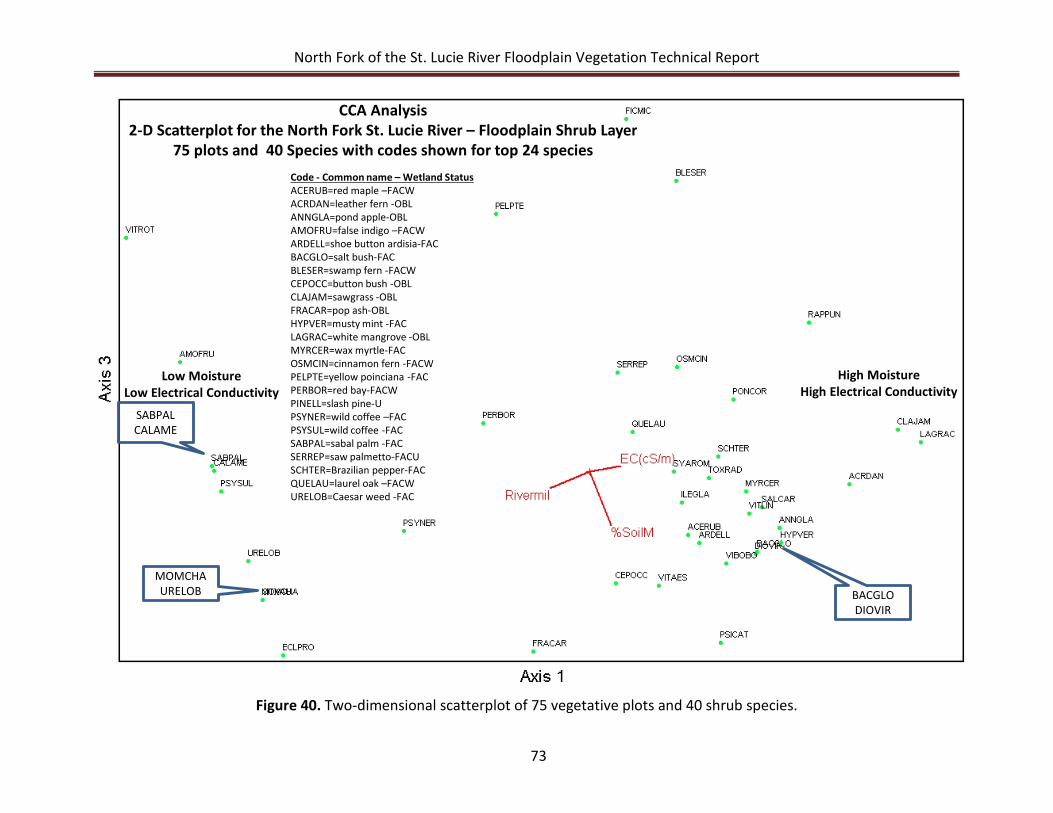
North Fork of the St. Lucie River Floodplain Vegetation Technical Report
73
Figure 40. Two-dimensional scatterplot of 75 vegetative plots and 40 shrub species.
BACGLODIOVIR
SABPALCALAME
CCA Analysis2-D Scatterplot for the North Fork St. Lucie River – Floodplain Shrub Layer
75 plots and 40 Species with codes shown for top 24 speciesCode - Common name – Wetland StatusACERUB=red maple –FACWACRDAN=leather fern -OBLANNGLA=pond apple-OBLAMOFRU=false indigo –FACWARDELL=shoe button ardisia-FACBACGLO=salt bush-FACBLESER=swamp fern -FACWCEPOCC=button bush -OBLCLAJAM=sawgrass -OBLFRACAR=pop ash-OBLHYPVER=musty mint -FACLAGRAC=white mangrove -OBLMYRCER=wax myrtle-FACOSMCIN=cinnamon fern -FACWPELPTE=yellow poinciana -FACPERBOR=red bay-FACWPINELL=slash pine-UPSYNER=wild coffee –FACPSYSUL=wild coffee -FACSABPAL=sabal palm -FACSERREP=saw palmetto-FACUSCHTER=Brazilian pepper-FACQUELAU=laurel oak –FACWURELOB=Caesar weed -FAC
MOMCHAURELOB
Low MoistureLow Electrical Conductivity
High MoistureHigh Electrical Conductivity
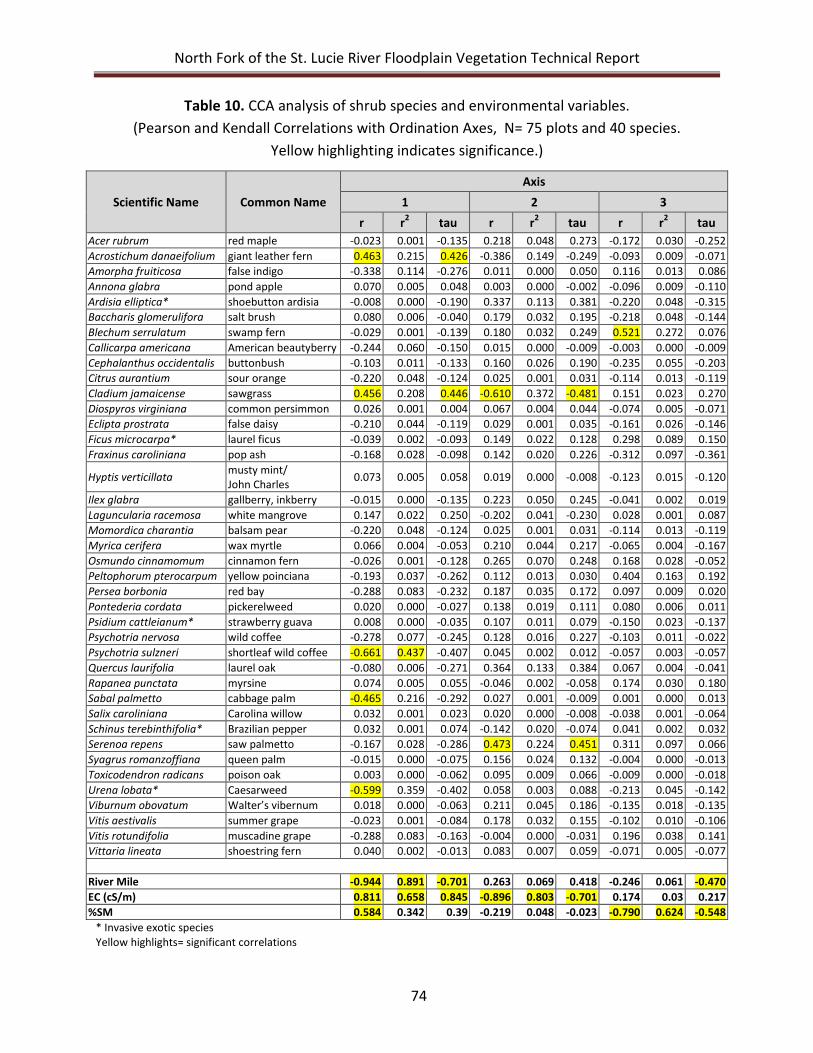
North Fork of the St. Lucie River Floodplain Vegetation Technical Report
74
Table 10. CCA analysis of shrub species and environmental variables. (Pearson and Kendall Correlations with Ordination Axes, N= 75 plots and 40 species.
Yellow highlighting indicates significance.)
Scientific Name Common Name Axis
1 2 3 r r2 tau r r2 tau r r2 tau
Acer rubrum red maple -0.023 0.001 -0.135 0.218 0.048 0.273 -0.172 0.030 -0.252 Acrostichum danaeifolium giant leather fern 0.463 0.215 0.426 -0.386 0.149 -0.249 -0.093 0.009 -0.071 Amorpha fruiticosa false indigo -0.338 0.114 -0.276 0.011 0.000 0.050 0.116 0.013 0.086 Annona glabra pond apple 0.070 0.005 0.048 0.003 0.000 -0.002 -0.096 0.009 -0.110 Ardisia elliptica* shoebutton ardisia -0.008 0.000 -0.190 0.337 0.113 0.381 -0.220 0.048 -0.315 Baccharis glomerulifora salt brush 0.080 0.006 -0.040 0.179 0.032 0.195 -0.218 0.048 -0.144 Blechum serrulatum swamp fern -0.029 0.001 -0.139 0.180 0.032 0.249 0.521 0.272 0.076 Callicarpa americana American beautyberry -0.244 0.060 -0.150 0.015 0.000 -0.009 -0.003 0.000 -0.009 Cephalanthus occidentalis buttonbush -0.103 0.011 -0.133 0.160 0.026 0.190 -0.235 0.055 -0.203 Citrus aurantium sour orange -0.220 0.048 -0.124 0.025 0.001 0.031 -0.114 0.013 -0.119 Cladium jamaicense sawgrass 0.456 0.208 0.446 -0.610 0.372 -0.481 0.151 0.023 0.270 Diospyros virginiana common persimmon 0.026 0.001 0.004 0.067 0.004 0.044 -0.074 0.005 -0.071 Eclipta prostrata false daisy -0.210 0.044 -0.119 0.029 0.001 0.035 -0.161 0.026 -0.146 Ficus microcarpa* laurel ficus -0.039 0.002 -0.093 0.149 0.022 0.128 0.298 0.089 0.150 Fraxinus caroliniana pop ash -0.168 0.028 -0.098 0.142 0.020 0.226 -0.312 0.097 -0.361
Hyptis verticillata musty mint/ John Charles 0.073 0.005 0.058 0.019 0.000 -0.008 -0.123 0.015 -0.120
Ilex glabra gallberry, inkberry -0.015 0.000 -0.135 0.223 0.050 0.245 -0.041 0.002 0.019 Laguncularia racemosa white mangrove 0.147 0.022 0.250 -0.202 0.041 -0.230 0.028 0.001 0.087 Momordica charantia balsam pear -0.220 0.048 -0.124 0.025 0.001 0.031 -0.114 0.013 -0.119 Myrica cerifera wax myrtle 0.066 0.004 -0.053 0.210 0.044 0.217 -0.065 0.004 -0.167 Osmundo cinnamomum cinnamon fern -0.026 0.001 -0.128 0.265 0.070 0.248 0.168 0.028 -0.052 Peltophorum pterocarpum yellow poinciana -0.193 0.037 -0.262 0.112 0.013 0.030 0.404 0.163 0.192 Persea borbonia red bay -0.288 0.083 -0.232 0.187 0.035 0.172 0.097 0.009 0.020 Pontederia cordata pickerelweed 0.020 0.000 -0.027 0.138 0.019 0.111 0.080 0.006 0.011 Psidium cattleianum* strawberry guava 0.008 0.000 -0.035 0.107 0.011 0.079 -0.150 0.023 -0.137 Psychotria nervosa wild coffee -0.278 0.077 -0.245 0.128 0.016 0.227 -0.103 0.011 -0.022 Psychotria sulzneri shortleaf wild coffee -0.661 0.437 -0.407 0.045 0.002 0.012 -0.057 0.003 -0.057 Quercus laurifolia laurel oak -0.080 0.006 -0.271 0.364 0.133 0.384 0.067 0.004 -0.041 Rapanea punctata myrsine 0.074 0.005 0.055 -0.046 0.002 -0.058 0.174 0.030 0.180 Sabal palmetto cabbage palm -0.465 0.216 -0.292 0.027 0.001 -0.009 0.001 0.000 0.013 Salix caroliniana Carolina willow 0.032 0.001 0.023 0.020 0.000 -0.008 -0.038 0.001 -0.064 Schinus terebinthifolia* Brazilian pepper 0.032 0.001 0.074 -0.142 0.020 -0.074 0.041 0.002 0.032 Serenoa repens saw palmetto -0.167 0.028 -0.286 0.473 0.224 0.451 0.311 0.097 0.066 Syagrus romanzoffiana queen palm -0.015 0.000 -0.075 0.156 0.024 0.132 -0.004 0.000 -0.013 Toxicodendron radicans poison oak 0.003 0.000 -0.062 0.095 0.009 0.066 -0.009 0.000 -0.018 Urena lobata* Caesarweed -0.599 0.359 -0.402 0.058 0.003 0.088 -0.213 0.045 -0.142 Viburnum obovatum Walter’s vibernum 0.018 0.000 -0.063 0.211 0.045 0.186 -0.135 0.018 -0.135 Vitis aestivalis summer grape -0.023 0.001 -0.084 0.178 0.032 0.155 -0.102 0.010 -0.106 Vitis rotundifolia muscadine grape -0.288 0.083 -0.163 -0.004 0.000 -0.031 0.196 0.038 0.141 Vittaria lineata shoestring fern 0.040 0.002 -0.013 0.083 0.007 0.059 -0.071 0.005 -0.077
River Mile -0.944 0.891 -0.701 0.263 0.069 0.418 -0.246 0.061 -0.470 EC (cS/m) 0.811 0.658 0.845 -0.896 0.803 -0.701 0.174 0.03 0.217 %SM 0.584 0.342 0.39 -0.219 0.048 -0.023 -0.790 0.624 -0.548
* Invasive exotic species Yellow highlights= significant correlations
North Fork of the St. Lucie River Floodplain Vegetation Technical Report
75
Groundcover Community
The analysis of groundcover species provides a special view of new plant recruitment on the floodplain and gives us hints of seasonal and short-term changes in hydrology. Most of the 76 groundcover species observed on the four North Fork St. Lucie River transects were FAC and FACW wetland status. More OBLs were included among the list of groundcover species. The Miller Oxbow and Beach Avenue transects had the highest number of species (43 and 32, respectively) while the River’s Edge Transect and Crowberry Drive Transect had the fewest (21 and 19, respectively). Eleven exotic species were present among the 76 groundcover species. At this time, ordination analysis has not been performed on the groundcover data sets.
Table 11 presents the results of the groundcover species stem count and percent cover data by transect. On the Miller Oxbow Transect stem counts were dominated by Caesarweed (434), Jack-in-the-bush (Chromolaena odorata, 340), common day flower (Commelina diffusa, 140), and whorled marsh pennywort (Hydrocotyle verticellata, 117). These plants are a combination of FAC and FACW species. Percent cover on the Miller Oxbow Transect was dominated by Jack-in-the-bush (39%), horsetail (Conyza canadensis, 20%) and lantana (Lantana camara, 16%), which are a combination of FAC and FACU species. Stem counts on the River’s Edge Transect was dominated by more OBL species such as swamp fern (119), saw palmetto (70) and swamp lily (Crinum americana, 63), which are FACW, FACU and OBL species. Swamp fern (235%), lizard’s tail (Saururus cernuus, 124%, OBL), and swamp lily dominated the percent cover across this transect. Two non-native or exotic species dominated the stem counts and percent cover on the Beach Avenue Transect. These were shoebutton ardisia (309, 145%, FAC) and creeping oxyeye (Sphagneticola trilobata, 218, 143%, FAC). Salt bush (FAC) was present at 116% cover. Groundcover stem counts on the Crowberry Drive Transect was dominated by white mangrove (2,783, OBL), Brazilian pepper (919, FAC) and creeping oxyeye (201). Percent cover on this transect was dominated by white mangrove (205%), creeping oxyeye (120%), herb-of-grace (Bacopa monnieri, 118%, OBL), swamp fern (83%) and Brazilian pepper (71%).
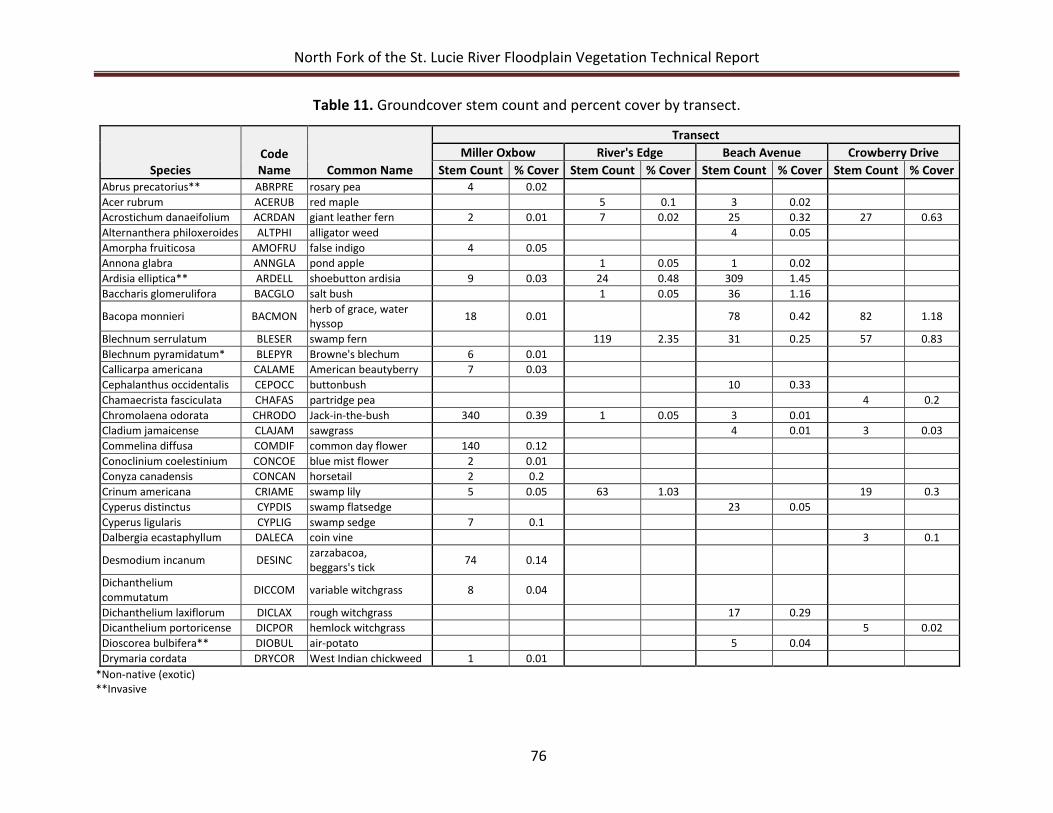
North Fork of the St. Lucie River Floodplain Vegetation Technical Report
76
Table 11. Groundcover stem count and percent cover by transect.
Species Code Name Common Name
Transect Miller Oxbow River's Edge Beach Avenue Crowberry Drive
Stem Count % Cover Stem Count % Cover Stem Count % Cover Stem Count % Cover Abrus precatorius** ABRPRE rosary pea 4 0.02 Acer rubrum ACERUB red maple 5 0.1 3 0.02 Acrostichum danaeifolium ACRDAN giant leather fern 2 0.01 7 0.02 25 0.32 27 0.63 Alternanthera philoxeroides ALTPHI alligator weed 4 0.05 Amorpha fruiticosa AMOFRU false indigo 4 0.05 Annona glabra ANNGLA pond apple 1 0.05 1 0.02 Ardisia elliptica** ARDELL shoebutton ardisia 9 0.03 24 0.48 309 1.45 Baccharis glomerulifora BACGLO salt bush 1 0.05 36 1.16 Bacopa monnieri BACMON herb of grace, water
hyssop 18 0.01 78 0.42 82 1.18
Blechnum serrulatum BLESER swamp fern 119 2.35 31 0.25 57 0.83 Blechnum pyramidatum* BLEPYR Browne's blechum 6 0.01 Callicarpa americana CALAME American beautyberry 7 0.03 Cephalanthus occidentalis CEPOCC buttonbush 10 0.33 Chamaecrista fasciculata CHAFAS partridge pea 4 0.2 Chromolaena odorata CHRODO Jack-in-the-bush 340 0.39 1 0.05 3 0.01 Cladium jamaicense CLAJAM sawgrass 4 0.01 3 0.03 Commelina diffusa COMDIF common day flower 140 0.12 Conoclinium coelestinium CONCOE blue mist flower 2 0.01 Conyza canadensis CONCAN horsetail 2 0.2 Crinum americana CRIAME swamp lily 5 0.05 63 1.03 19 0.3 Cyperus distinctus CYPDIS swamp flatsedge 23 0.05 Cyperus ligularis CYPLIG swamp sedge 7 0.1 Dalbergia ecastaphyllum DALECA coin vine 3 0.1
Desmodium incanum DESINC zarzabacoa, beggars's tick 74 0.14
Dichanthelium commutatum DICCOM variable witchgrass 8 0.04 Dichanthelium laxiflorum DICLAX rough witchgrass 17 0.29 Dicanthelium portoricense DICPOR hemlock witchgrass 5 0.02 Dioscorea bulbifera** DIOBUL air-potato 5 0.04 Drymaria cordata DRYCOR West Indian chickweed 1 0.01
*Non-native (exotic) **Invasive
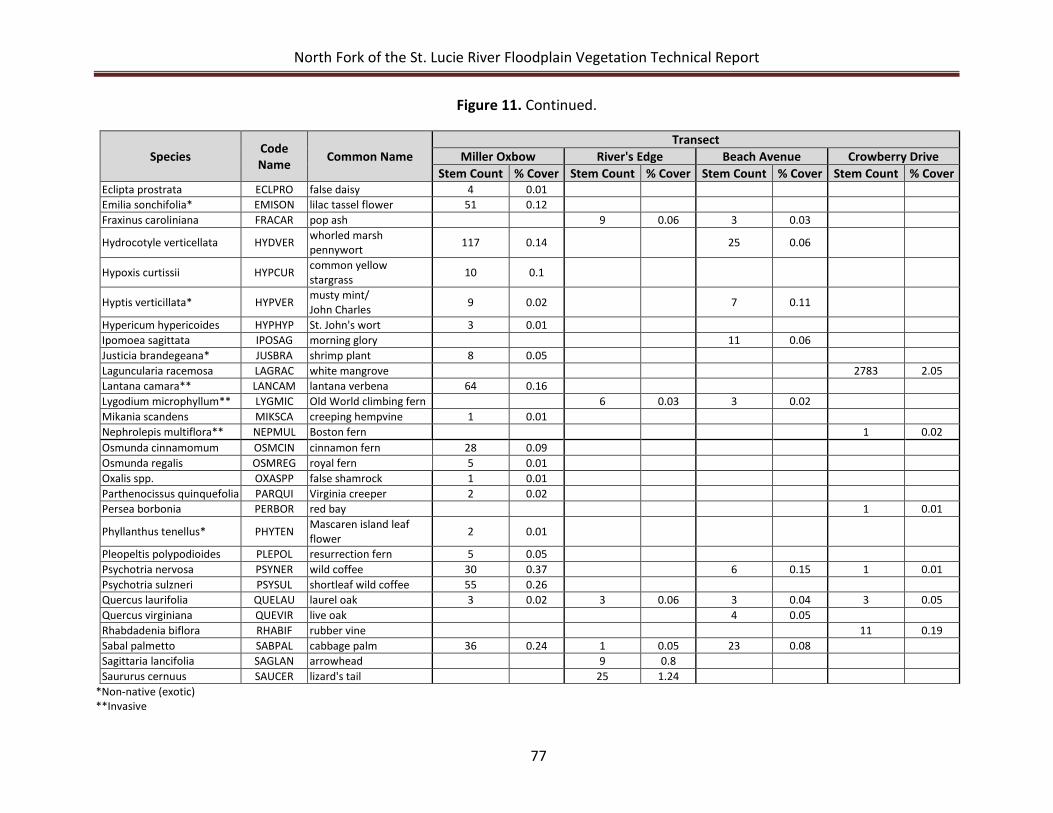
North Fork of the St. Lucie River Floodplain Vegetation Technical Report
77
Figure 11. Continued.
Species Code Name Common Name
Transect Miller Oxbow River's Edge Beach Avenue Crowberry Drive
Stem Count % Cover Stem Count % Cover Stem Count % Cover Stem Count % Cover Eclipta prostrata ECLPRO false daisy 4 0.01 Emilia sonchifolia* EMISON lilac tassel flower 51 0.12 Fraxinus caroliniana FRACAR pop ash 9 0.06 3 0.03 Hydrocotyle verticellata HYDVER whorled marsh
pennywort 117 0.14 25 0.06
Hypoxis curtissii HYPCUR common yellow stargrass 10 0.1
Hyptis verticillata* HYPVER musty mint/ John Charles 9 0.02 7 0.11
Hypericum hypericoides HYPHYP St. John's wort 3 0.01 Ipomoea sagittata IPOSAG morning glory 11 0.06 Justicia brandegeana* JUSBRA shrimp plant 8 0.05 Laguncularia racemosa LAGRAC white mangrove 2783 2.05 Lantana camara** LANCAM lantana verbena 64 0.16 Lygodium microphyllum** LYGMIC Old World climbing fern 6 0.03 3 0.02 Mikania scandens MIKSCA creeping hempvine 1 0.01 Nephrolepis multiflora** NEPMUL Boston fern 1 0.02 Osmunda cinnamomum OSMCIN cinnamon fern 28 0.09 Osmunda regalis OSMREG royal fern 5 0.01 Oxalis spp. OXASPP false shamrock 1 0.01 Parthenocissus quinquefolia PARQUI Virginia creeper 2 0.02 Persea borbonia PERBOR red bay 1 0.01
Phyllanthus tenellus* PHYTEN Mascaren island leaf flower 2 0.01
Pleopeltis polypodioides PLEPOL resurrection fern 5 0.05 Psychotria nervosa PSYNER wild coffee 30 0.37 6 0.15 1 0.01 Psychotria sulzneri PSYSUL shortleaf wild coffee 55 0.26 Quercus laurifolia QUELAU laurel oak 3 0.02 3 0.06 3 0.04 3 0.05 Quercus virginiana QUEVIR live oak 4 0.05 Rhabdadenia biflora RHABIF rubber vine 11 0.19 Sabal palmetto SABPAL cabbage palm 36 0.24 1 0.05 23 0.08 Sagittaria lancifolia SAGLAN arrowhead 9 0.8 Saururus cernuus SAUCER lizard's tail 25 1.24
*Non-native (exotic) **Invasive
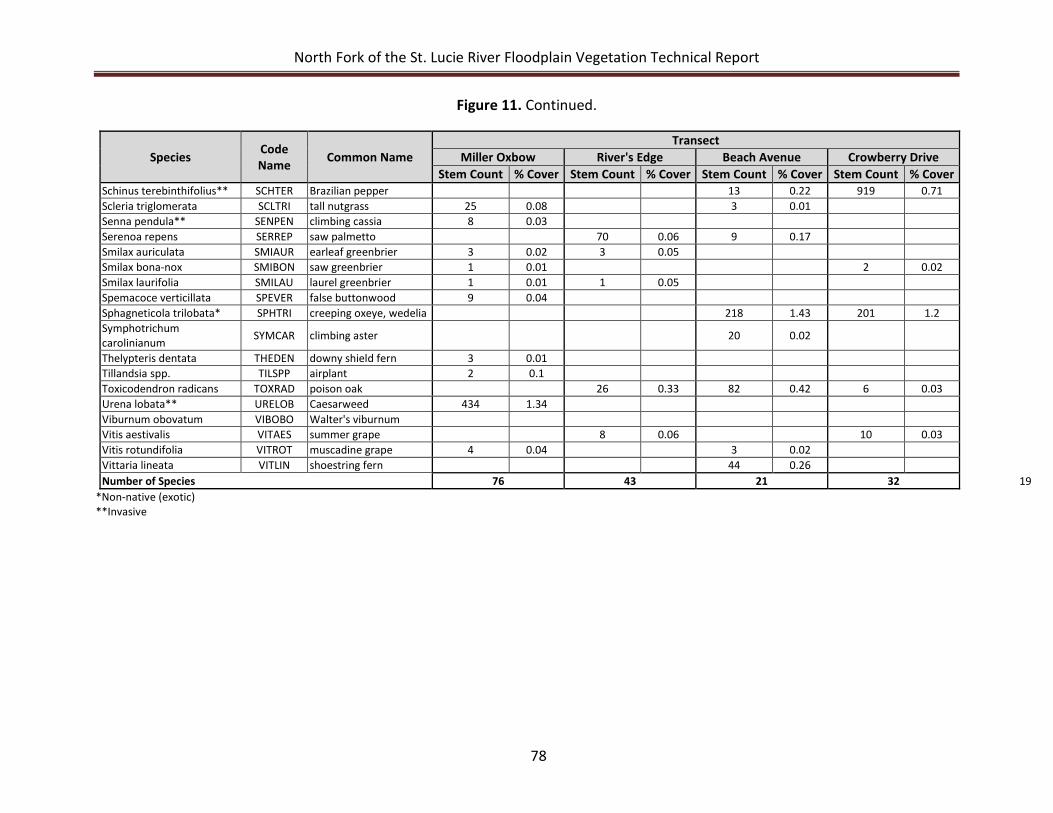
North Fork of the St. Lucie River Floodplain Vegetation Technical Report
78
Figure 11. Continued.
Species Code Name Common Name
Transect Miller Oxbow River's Edge Beach Avenue Crowberry Drive
Stem Count % Cover Stem Count % Cover Stem Count % Cover Stem Count % Cover Schinus terebinthifolius** SCHTER Brazilian pepper 13 0.22 919 0.71 Scleria triglomerata SCLTRI tall nutgrass 25 0.08 3 0.01 Senna pendula** SENPEN climbing cassia 8 0.03 Serenoa repens SERREP saw palmetto 70 0.06 9 0.17 Smilax auriculata SMIAUR earleaf greenbrier 3 0.02 3 0.05 Smilax bona-nox SMIBON saw greenbrier 1 0.01 2 0.02 Smilax laurifolia SMILAU laurel greenbrier 1 0.01 1 0.05 Spemacoce verticillata SPEVER false buttonwood 9 0.04 Sphagneticola trilobata* SPHTRI creeping oxeye, wedelia 218 1.43 201 1.2 Symphotrichum carolinianum SYMCAR climbing aster 20 0.02 Thelypteris dentata THEDEN downy shield fern 3 0.01 Tillandsia spp. TILSPP airplant 2 0.1 Toxicodendron radicans TOXRAD poison oak 26 0.33 82 0.42 6 0.03 Urena lobata** URELOB Caesarweed 434 1.34 Viburnum obovatum VIBOBO Walter's viburnum Vitis aestivalis VITAES summer grape 8 0.06 10 0.03 Vitis rotundifolia VITROT muscadine grape 4 0.04 3 0.02 Vittaria lineata VITLIN shoestring fern 44 0.26 Number of Species 76 43 21 32 19
*Non-native (exotic) **Invasive
North Fork of the St. Lucie River Floodplain Vegetation Technical Report
79
Table 12 presents the total stem count and percent cover data by transect and by forest type along with some of the most common species. On the Miller Oxbow Transect, the hammock community was dominated by 4 species: tall nutgrass (Scleria triglomerata, FACW), cabbage palm (FAC), Jack-in-the-bush (FACW) and common day flower (FACW). Jack-in-the-bush was present in all three forest types (hammock, Rblh3 and Rblh2) while common day flower was present in both hammock and Rblh3. The other species that dominated Rblh3 and Rblh2 bottomland hardwood were whorled marsh pennywort, Caesarweed, American beautyberry (Callicarpa americana) and shortleaf wild coffee. On the River’s Edge Transect, swamp fern was common on all three forest types (hammock, bottomland hardwood and swamp) while cinnamon fern (Osmunda cinnamomum) was common on both hammock and bottomland hardwood forest types. With the open tidal influence on this transect, it was notable that several OBLs were present in the bottomland hardwood communities including swamp lily, herb-of-grace, and lizards tail. Poison oak (Toxicodendron radicans) and shoebutton ardisia were present on the drier plots of H/UTblh3. Tall nut grass was common in the hammock and bottomland hardwood plots of the Beach Avenue Transect while swamp flat sedge (Cyperus distinctus, OBL) was only found in the hammock of this transect. Shoe string fern (Vittaria lineata, FAC) was common in both bottomland hardwood and tidal swamp while climbing aster (Symhyotrichum carolinianum), an OBL, was only found common in the UTblh3. On this transect, whorled marsh pennywort was present in the lower portion of the bottomland hardwood along with herb-of-grace and poison oak. The Crowberry Drive Transect was less diverse with white mangrove and herb-of-grace in the swamp plots and tall nutgrass, swamp fern and Brazilian pepper in the few hammock and bottomland hardwood plots.
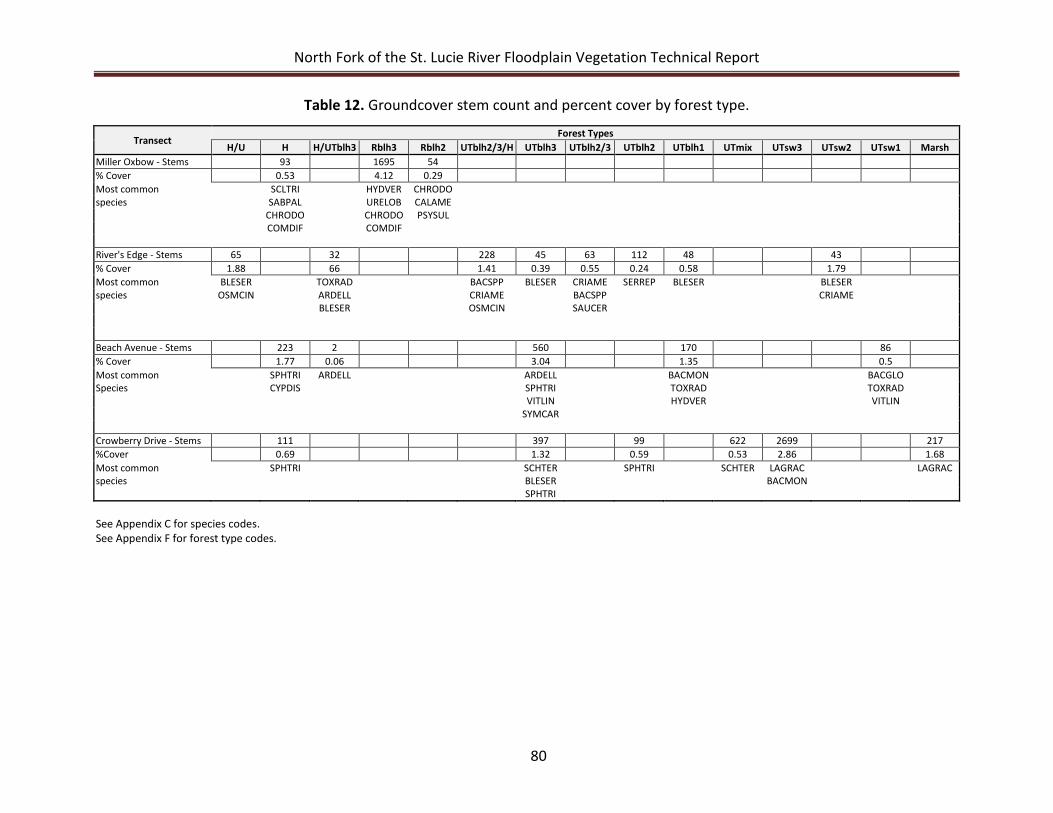
North Fork of the St. Lucie River Floodplain Vegetation Technical Report
80
Table 12. Groundcover stem count and percent cover by forest type.
Transect Forest Types
H/U H H/UTblh3 Rblh3 Rblh2 UTblh2/3/H UTblh3 UTblh2/3 UTblh2 UTblh1 UTmix UTsw3 UTsw2 UTsw1 Marsh Miller Oxbow - Stems 93 1695 54 % Cover 0.53 4.12 0.29 Most common
SCLTRI
HYDVER CHRODO
species
SABPAL
URELOB CALAME
CHRODO
CHRODO PSYSUL
COMDIF
COMDIF
River's Edge - Stems 65 32 228 45 63 112 48 43 % Cover 1.88 66 1.41 0.39 0.55 0.24 0.58 1.79 Most common BLESER
TOXRAD
BACSPP BLESER CRIAME SERREP BLESER
BLESER
species OSMCIN
ARDELL
CRIAME
BACSPP
CRIAME
BLESER
OSMCIN
SAUCER
Beach Avenue - Stems 223 2 560 170 86 % Cover 1.77 0.06 3.04 1.35 0.5 Most common
SPHTRI ARDELL
ARDELL
BACMON
BACGLO
Species
CYPDIS
SPHTRI
TOXRAD
TOXRAD
VITLIN
HYDVER
VITLIN
SYMCAR
Crowberry Drive - Stems 111 397 99 622 2699 217 %Cover 0.69 1.32 0.59 0.53 2.86 1.68 Most common
SPHTRI
SCHTER
SPHTRI
SCHTER LAGRAC
LAGRAC
species
BLESER
BACMON
SPHTRI
See Appendix C for species codes. See Appendix F for forest type codes.
North Fork of the St. Lucie River Floodplain Vegetation Technical Report
81
DISCUSSION AND CONCLUSIONS
With regard to forest composition, Post, Buckley, Schuh & Jernigan (2003) stated that the health of floodplain vegetation on the North Fork St. Lucie River was primarily determined by duration of inundation and saturation, depth and frequency of floods, and salinity. Anderson and Lockaby (2011) found that along the Apalachicola River, two major physiochemical changes affected tidal and nontidal wetlands: 1) hydrodynamics or prolonged inundation due to regular tidal flooding along with elevation and microtopography, and 2) periodic exposure to salinity as a result of storm surge or periods of low river flow. Cluster analysis of their 12 dominant canopy species differentiated hydrologic and community groups. They noted that tidal wetlands on the Apalachicola River had smaller diameter trees but greater tree density, and their tidal wetlands had significantly lower concentrations of soil constituents than the non-tidal wetlands. They also found that as EC approached 4 S/cm, the osmotic impact on trees becomes significant to physiological stress that could reduce photosynthetic activity, tree growth and canopy cover. Additionally, they noted declines in understory vegetation further upriver reflecting greater canopy cover and flood energy in the riverine reach.
In our study of the North Fork St. Lucie River, air temperature was significant when it came to cold and freezing weather periods. In this watershed, inland mangroves were particularly affected by cold weather resulting in either defoliation or death. It was unclear whether defoliated giant leather ferns were affected both by cold weather and dry or high soil salinity periods. However, agricultural literature points to the fact that they can be grown in upland landscapes, if properly watered. It was a very arid dry season leading up to our field study although local rainfall proved not to be significant during this investigation.
There was a significant change in floodplain soil type noted between RM 23.5 and RM 24 where the river begins to widen. This area is just upstream of the Prima Vista Bridge and downstream of the Beach Avenue Transect. In this area, floodplain soils switched primarily from Fluvaquents to Terra Ceia Muck, reflecting a change also in plant species composition (i.e. more freshwater canopy species). In general, Terra Ceia Muck is inundated for longer periods of time (6 to 9 months) and more reflective of a lower tidal floodplain feature with marshes and depressions while Fluvaquents are more associated with upstream creeks and riverbeds with hammocks and wetland hardwoods, and are generally flooded once every 2 years for 7 to 30 days (USDA et al., 1977).
With regard to EC and %SM in our study, the highest EC values were associated with the transitional young mangrove forested areas with remnant sawgrass/leather fern marsh on the Crowberry Drive Transect while no or low ECs were associated with berms and hammock areas.
North Fork of the St. Lucie River Floodplain Vegetation Technical Report
82
%SM values generally rose in areas adjacent to the river channel; and were highest on the River’s Edge Transect with its significant breach in the berm and daily tidal inundation. Soils on the Miller Oxbow transect, which has the widest and tallest berm, were the driest overall.
In an MFL examination of modeled historical and current patterns of flows to the North Fork St. Lucie River between 1965 and 1995, it was concluded that freshwater flow had declined 39% due to reductions in high flow events although peak discharge events typically persisted for longer periods of time (SFWMD, 2002). The combined use of the watershed, hydrodynamic and salinity, and OPTI6 modeling produced a North Fork dry season water reservation target flow of 130 cfs at the Gordy Road structure in order to protect fish and wildlife from harm by maintaining the low salinity zone between the Kellstadt and Prima Vista bridges (RM 17.2 and RM 23.1). Results of the North Fork Narrows DEM concluded that it would take a 2-foot stage increase to inundate 18% of the floodplain (645 acres of 3,666 acres) (SFWMD, 2009, Appendix D). Mean monthly flow data from the Gordy Road structure showed that the MFL criteria (130 cfs) is only being partially met at this time. 2003 through 2005 appeared to successfully meet the water reservation target flow for all dry season months; however, the flow has been generally below the criteria for 2006 through 2011.
Modeled salinity data of the North Fork St. Lucie River showed the 14 isohaline reaching above the Prima Vista Bridge (RM 23.1, near the Beach Avenue Transect). It did not recede below the Kellstadt Bridge (RM 17.3) until wet season or high flows. The 6 and 1 isohalines reached up to the Midway Bridge (RM 27, near the River’s Edge Transect) during low flow conditions and did not recede below the Kellstadt Bridge except under high flows in the wet season. These salinity conditions may contribute to saltwater intrusion within the North Fork St. Lucie River floodplain communities (notably Crowberry Drive and Beach Avenue transects, and during extreme droughts, River’s Edge Transect). Therefore, these data may indicate to us that opening berms and restoring hydroperiod to floodplain areas may be an issue particularly to species such as water hickory, red maple and pop ash in the upper tidal reach of the river, if freshwater flow is not available from the Gordy Road or S-59 structure (C-24 Basin) to maintain low salinity levels in the river channel of the North Fork St. Lucie River.
In a 2009 examination of four vegetative transects with a total of 77 plots on the North Fork St. Lucie River and Ten Mile Creek, 17 forest community types, 16 canopy species, 40 shrub species, and 76 groundcover species were identified and enumerated. The six major forest types were bottomland hardwood, hydric hammock, fresh and saltwater swamp, tidal freshwater sawgrass marsh, and uplands. The most abundant canopy species were cabbage palm, white mangrove and laurel oak while the highest basal area canopy species were cabbage palm and laurel oak. With regards to canopy species size, the majority of the trees fell into the 5–20 cm and 21–40 cm dbh size class frequencies. Only red maple, slash pine, laurel oak, live oak and cabbage palm had trees greater than 40 cm. There were no trees that fell into the 81–
North Fork of the St. Lucie River Floodplain Vegetation Technical Report
83
99+ cm size class frequency, which is commonly occupied by older bald cypress trees on the Florida peninsula. New recruitment to the canopy layer was dominated primarily by white mangrove on the downstream portion of the river; otherwise, there was a small amount of recruitment from pop ash, pond apple, red maple and wax myrtle in the shrub and groundcover layers. As with the Appalachicola River floodplain, there were smaller diameter trees but greater density in the tidal reach of the North Fork St. Lucie River.
In observance of canopy species distribution by transect, those transects with poorer hydrology (Miller Oxbow and Crowberry Drive) had fewer canopy species. The Miller Oxbow Transect (the driest of the four transects) had the tallest berm, the fewest number of canopy trees (77, 12 plots), and the smallest number of canopy species (5). The Crowberry Drive Transect had a smaller berm than Miller Oxbow, 158 canopy trees, 9 canopy species and the largest number of plots (31). However, 70% of the trees on this transect were small white mangrove (i.e. saltwater swamp), all of them within the 5–20 cm dbh size class frequency. The Beach Avenue Transect, with its small berm but backwater connection via an oxbow to the river, had 200 canopy trees (20 plots), 12 canopy species, and some of the largest laurel and live oaks, cabbage palm and saw palmetto. 54% of the canopy was hammock species while 16% was swamp and 16% was bottomland hardwood. The River’s Edge Transect was the shortest transect with just 10 plots (97 trees); however, it had 10 canopy species composed of 61% swamp and low bottomland hardwood species and about 36% hammock and high bottomland hardwood species.
Using ordination of the 16 canopy species and 65 of the total plots, the resulting cluster dendrogram identified two major canopy groups (i.e. saltwater swamp and mixed hammock, bottomland hardwood and freshwater swamp). Four forest community types were identified: 1) freshwater swamp (pond apple and pop ash); 2) bottomland hardwood (laurel oak, red maple and water hickory); 3) hammock (cabbage palm, saw palmetto and live oak); and 4) saltwater swamp (white mangrove). Mixed communities of hammock/bottomland hardwood and bottomland hardwood/swamp species were quite prevalent on the North Fork St. Lucie River probably due to the lack of inundation (i.e. poor hydrology) across most transects and the presence of the berms, which isolated much of the floodplain area.
Ordination analysis grouped canopy species by salt tolerance, %SM preference and river mile. EC by river mile was shown to have the strongest correlation followed by %SM and river mile for canopy species. EC values increased with decreasing river mile due to the higher salinities downstream and higher concentration of white mangroves downstream. While white mangrove showed a high positive correlation with EC, cabbage palm, live oak and water hickory showed a negative correlation using a Bray Curtis analysis. White mangroves were not found at ECs of < 1,503 cS/m or %SM levels of < 66%. Pond apple appeared to be indifferent with regards to EC. In a bald cypress and pond apple seedling mesocosm study, pond apple seedlings
North Fork of the St. Lucie River Floodplain Vegetation Technical Report
84
survived salinities of 25 for one week in both flooding and non-flooding conditions (Liu and Li, 2007).
%SM increased slightly with EC; however, the highest %SM values were mid-river on the River’s Edge Transect, which is tidally flushed daily via a large breach in the berm. This area was dominated by swamp species, pond apple and pop ash. %SM was lowest adjacent to the uplands (i.e. hammock areas) and on berms adjacent to the river channel. White mangrove demonstrated a slightly negative response to %SM while pond apple, pop ash and red maple demonstrated significant positive responses. Pond apple were only observed at %SM > 75. It is assumed that the small population of pond apple trees on the North Fork St. Lucie River is attributed to the reduced hydroperiods on the floodplain areas that are isolated from the main channel. This is also probably the reason why red and black mangroves have not spread into the interior of the floodplain area.
There were 40 species of shrub and 76 species of groundcover identified within the four North Fork St. Lucie River transects. Most of these species were classified as FAC or FACW or could be found associated with wetland systems. There were only 9 shrub species classified as OBL or always found in association with wetland systems. There were 7 non-native (exotic) shrubs and 14 non-native (exotic) groundcover species encountered. The most frequently encountered exotics were shoebutton ardisia and Brazilian pepper. The highest percent cover of shrubs was attributed to the abundance of white mangrove, sawgrass and giant leather fern on the Crowberry Drive Transect. The Beach Avenue Transect had the highest number of shrub species due to human impacts from the dumping of vegetation inside the aquatic preserve property. The Miller Oxbow and the Beach Avenue transects had the highest number of groundcover species. Dominance of shrub and groundcover species on the four transects correlated highest with %SM and the presence or absence of a berm adjacent to the river channel. Shrub and groundcover species were frequently found within multiple forest types creating mixed communities of upland/hammock, hammock/bottomland hardwood and bottomland hardwood/swamp across changes in ground elevation. In an ordination analysis of the 40 shrub species, plant communities were sorted by low and high EC and low and high %SM preferences. Giant leather fern exhibited a positive relationship with EC while sawgrass exhibited a negative relationship to it. Alexander (1967) noted the recovery of vegetation (particularly sawgrass prairies) in the southeastern Everglades after Hurricane Betsy blew salt water far inland. Some species such as pond apple, salt bush, red bay, sawgrass and myrsine (Myrsine cubana) that were severely damaged began producing new root sprouts and seedlings within a few weeks after the storm while other species such as button bush, dahoon holly, Carolina willow, bald cypress and cabbage palm were much slower to recover.
North Fork of the St. Lucie River Floodplain Vegetation Technical Report
85
Floodplain Forest Impacts
The riparian forested wetland systems within the St. Lucie River Watershed vary from dry to occasionally flooded stages as the river and its tributaries react to local rainfall events. The major forest types are upland, hammock, bottomland hardwood and freshwater and tidal swamp. The riparian forests are generally referred to in the southeastern United States as bottomland hardwood forests. They contain diverse vegetation that varies along gradients of flooding frequency. They are generally considered to be more productive than the adjacent uplands because of the periodic inflow of nutrients, especially when flooding is seasonal rather than continuous (Mitsch and Gosselink, 1993). In freshwater reaches of the St. Lucie River, the dominant bottomland hardwood species are red maple, water hickory and a variety of bay (Persea sp.). Swamps are defined as woody wetlands that have standing water for most if not all of the growing season. Swamps on the floodplains of the St Lucie River consist of red and white mangroves, pond apple and pop ash. Noticeably reduced in number are bald cypress and pond apple, which were probably logged as the river and tributaries were dredged and channelized.
It appears from our vegetation study of the North Fork St. Lucie River that much of the lower floodplain area no longer exists. As part of the early dredging activities around the 1920s, most of the floodplain canopy trees along the river were cut and removed for lumber. What remains of the floodplain is the middle and upper areas or the bottomland hardwood and hammock communities in the upper and middle part of the river system and some smaller areas of swamp and tidal marshes in the downstream tidal reach of the North Fork. Some of the areas of bottomland hardwood and hammock are natural while others are man-made by the system of berms that were created on both sides of the main channel. In the downstream area, most of the marshes are now located behind the berms and are in the process of converting to forested wetland systems as they have done on the Loxahatchee River.
This study showed that swamp species like pond apple, pop ash and sawgrass are clearly struggling to survive the shorten hydroperiods on the isolated floodplains of the North Fork St. Lucie River. While pond apple and pop ash may be visible along the shores of the river channel, they are not abundant within the interior of the floodplain and those that are present are relatively young and small. The largest canopy pond apple observed on the transects was 11.0-cm dbh on Beach Avenue (plot BA100). The largest canopy pop ash observed was 25.0-cm dbh on the Miller Oxbow Transect (plot MO20). Overall, mixed communities of upland/hammock, hammock/bottomland hardwood and bottomland hardwood/swamp are becoming the norm. The remaining proliferation of mixed community and forest types are indicative of floodplains with altered hydrology and signs of saltwater intrusion. The mixed bottomland hardwood community was truly a mixture of uplands (Brazilian pepper), hammock
North Fork of the St. Lucie River Floodplain Vegetation Technical Report
86
(wax myrtle and red bay), bottomland hardwood (red maple and strawberry guava) and even swamp species (pop ash). The mixed hammock group consisted of slash pine, saw palmetto and tamarind (upland species); cabbage palm (hammock species); water hickory and laurel oak (high bottom land hardwood species).
Floodplain Restoration and Future Studies
In the 2003 Feasibility Study for the Reconnection of Wetlands and Oxbows along the North Fork of the St. Lucie River, 26 berms were identified, 3 berm breach projects that had been conducted were described, and 21 oxbow reconnection/creation site locations and 21 berm breach site locations were identified (Post ,Buckley, Schuh & Jernigan, 2003). Cost and cost estimates were given or estimated for each project. However, some of the land is still under private ownership, so additional monies were needed for land purchases. Projects were ranked based on cost per acre of wetland habitat restored. At that time, they felt that more hydrologic modeling and fisheries studies were needed to evaluate the context of reconnection with respect to salinity zones and juvenile fish abundances in the river. They concluded that the environmental benefits of the reconnection of oxbows and isolated wetland habitats would reduce freshwater pulses and flow velocities, and provide greater retention time by creating a greater number of flow pathways longitudinally along the river. This, in turn, would increase the filtration capacity within the river and reduce suspended solids, nutrients, heavy metals, sediments and other pollutant loads to the downstream estuary. With breaches of sufficient width and depth, substantial flow conveyance would allow for greater wetted perimeter of the previously isolated wetlands and in turn allow for increased utilization by aquatic organisms. In addition, it is thought that increased inundation may reduce or further limit the spread of exotic vegetation such as Brazilian pepper. Figure 41 illustrates the Florida Fish and Wildlife Conservation Commission’s 2010 Miller Oxbow Reconnection Project on Ten Mile Creek.
The Central and Southern Florida Project Indian River Lagoon – South Final Integrated Project Implementation Report and Environmental Impact Statement (USACE and SFWMD, 2004) listed five features that would be necessary to meet the identified project goals for the Indian River Lagoon – South Project. These features included 1) reservoirs, 2) stormwater treatment areas; 3) natural storage and treatment areas, including restoration within the North Fork floodplain; 4) diversion; and 5) muck removal and the creation of artificial habitat in the estuary. In addition to proposed treatment areas, the project includes preserving approximately 3,100 acres of floodplain wetlands and oligohaline habitat within the North Fork St. Lucie River. Preservation of the North Fork floodplain will provide some of the needed water storage, maintain wading bird habitat, improve water quality, and protect areas that currently serve as nursery areas for larval and juvenile fishes.
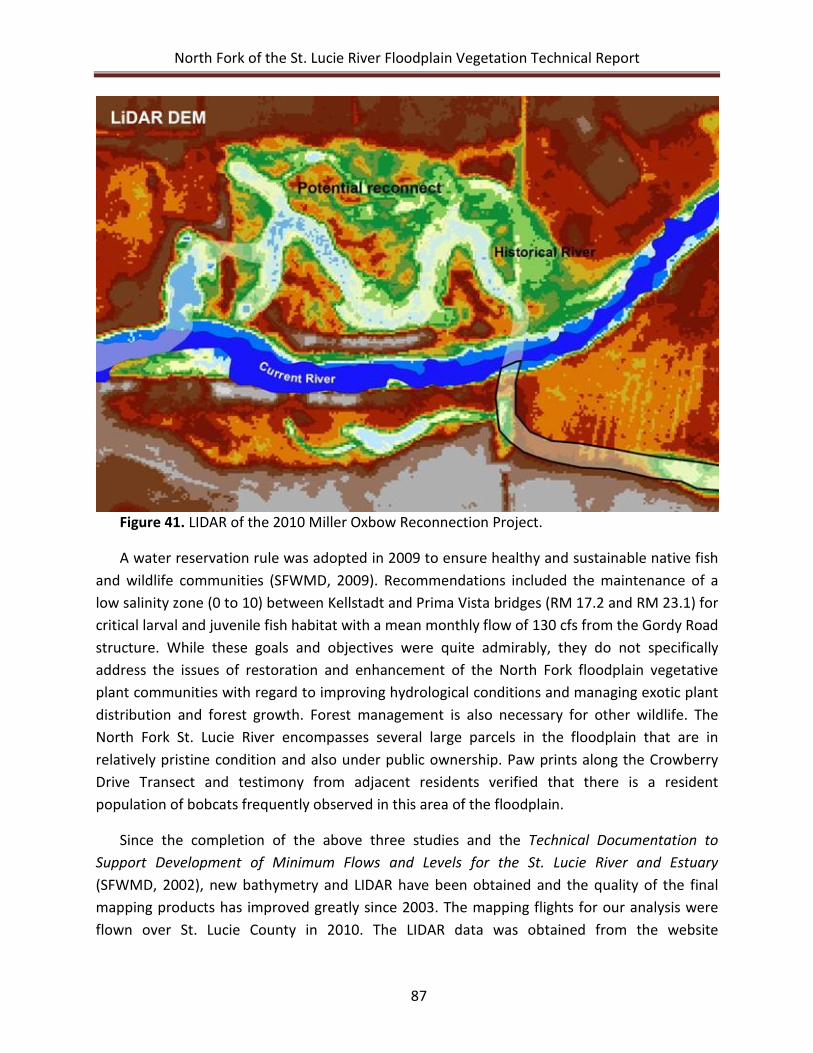
North Fork of the St. Lucie River Floodplain Vegetation Technical Report
87
Figure 41. LIDAR of the 2010 Miller Oxbow Reconnection Project.
A water reservation rule was adopted in 2009 to ensure healthy and sustainable native fish and wildlife communities (SFWMD, 2009). Recommendations included the maintenance of a low salinity zone (0 to 10) between Kellstadt and Prima Vista bridges (RM 17.2 and RM 23.1) for critical larval and juvenile fish habitat with a mean monthly flow of 130 cfs from the Gordy Road structure. While these goals and objectives were quite admirably, they do not specifically address the issues of restoration and enhancement of the North Fork floodplain vegetative plant communities with regard to improving hydrological conditions and managing exotic plant distribution and forest growth. Forest management is also necessary for other wildlife. The North Fork St. Lucie River encompasses several large parcels in the floodplain that are in relatively pristine condition and also under public ownership. Paw prints along the Crowberry Drive Transect and testimony from adjacent residents verified that there is a resident population of bobcats frequently observed in this area of the floodplain.
Since the completion of the above three studies and the Technical Documentation to Support Development of Minimum Flows and Levels for the St. Lucie River and Estuary (SFWMD, 2002), new bathymetry and LIDAR have been obtained and the quality of the final mapping products has improved greatly since 2003. The mapping flights for our analysis were flown over St. Lucie County in 2010. The LIDAR data was obtained from the website
North Fork of the St. Lucie River Floodplain Vegetation Technical Report
88
http://www.floridadisaster.org/gis/lidar/. Appendix I contains a six map series of North Fork St. Lucie River floodplain grid maps, which covers the area of Five Mile and Ten Mile creeks (up to the Gordy Road structure and RM 32) downstream to the mouth of the North Fork adjacent to Kitching Cove and Howard Creek (RM 15 and RM 14). Some roadways and city names are labeled to assist in the identification of locations along the river. Shape files and jpg files of the maps are available to enlarge the figures for greater detail of the berms and vegetated areas. The darker brown and gold colors of the grid maps represent areas that were originally part of the river floodplain prior to urban development along the river. The extent and length of the wetland filling along the river channel (i.e. berms) is easily identifiable in each grid map. The density and distribution of vegetation along with back creeks and oxbows are also very visible for assessing and planning restoration and enhancement projects.
With the new grid maps, the originally identified oxbow reconnection and berm breach projects should be reassessed along with the possible identification of new projects areas. The 2003 Post Buckley, Schuh & Jernigan, Inc. feasibility project did not examine the river and floodplain downstream of the Prima Vista Bridge. There are some large floodplain parcels (such as the Crowberry Drive Transect area) in the lower North Fork that could be breached to allow for greater tidal inundation in the forest and marsh. With the improvement of hydrology, vegetative test plots could be established to reintroduce OBL plant species such as bald cypress and pond apple back into the interior of the floodplain and possibly discourage communities of monoculture white mangrove, which have taken advantage in the past of the reduced hydroperiods. To recreate some areas of lower floodplain along the river corridor, test plots could be established by dredging some berm areas to lower elevation and planting OBL or swamp species that would provide direct aquatic connections between river and floodplain habitats for aquatic organisms, fishes and wading birds. This would greatly increase juvenile fish habitat that for now is limited to small streams within the floodplain except in the case of major flooding events. Vegetation, EC and %SM monitoring should continue along with soil nutrients and juvenile fish assessments.
With regard to future floodplain monitoring and recommendations of target plant species, the white mangrove community with its high EC values and limited downstream distribution would classify as a major indicator species for saltwater swamp within the group of 16 species. Live oak, a hammock species, would classify as an indicator of higher elevation berms along the river channel and transitional areas within the inner floodplain landscape. Pond apple would be representative of the freshwater swamp species found primarily in the next highest EC values and the highest %SM values making the abundance of this species an indicator of healthy hydroperiods and acceptable EC levels in tidally influenced areas of this floodplain.
North Fork of the St. Lucie River Floodplain Vegetation Technical Report
89
Impact of Climatic Events on Vegetative Changes
Odum et al. (1982) noted that one side effect of lowered freshwater flow and saltwater intrusion has been the inland expansion of mangrove forest. Examples in South Florida include much of the Everglades and the borders of Biscayne Bay. These mangrove forests have expanded inland since the 1940s in conjunction with man’s alteration of surface and groundwater flow. This is also true for the St. Lucie River and the Loxahatchee River systems. Mangroves have spread up and down the Intracoastal Waterway and inland in both systems since the permanent openings of the inlets.
Hurricanes spread mangrove propagules and other plant seeds over long distances through storm surges and produce severe physical damage to vegetation. Major hurricanes and tropical storms have occurred along the Treasure Coast in 1898, 1903, 1924, 1926, 1928, 1933, 1948, 1949, 1964, 1979, 2004 (Hurricanes Charley, Francis, Ivan and Jeanne), and 2005 (Hurricane Wilma). Record winds of 153 miles per hour were recorded at the Jupiter Lighthouse in Tequesta, Florida during the Great Hurricane of 1949. Hurricane Francis made landfall on September 5 near Sewall’s Point with maximum sustained winds recorded at 169 kilometers per hour (km/hr), a Category 2 storm. Approximately 3 weeks later, Hurricane Jeanne came ashore in the Stuart area on September 25 as a Category 3 storm with top sustaining winds of 193 km/hr (Tuckwood, 2004). Hurricane Wilma was also a Category 2 storm. On the Loxahatchee River, severe damage and mortality was most apparent in areas of the tallest canopy species (bald cypress, red maple and water hickory) (Roberts, et al, 2011). Flooding produced some problems with sedimentation and with the decreased canopy cover, shrub and groundcover communities reacted positively to the increase in sunlight and nutrients. Also, non-native plant species appeared to be on the rise after the hurricanes. In addition, amphibian studies noted a decline in the number of native frogs on the Loxahatchee River floodplain and a dramatic increase in the exotic Cuban tree frog (Osteopilus septentrionalis), which consumes smaller native green tree frogs (Hyla cinerea) and has a much shorter tadpole stage than our native frogs.
Severe droughts were reported on the Treasure Coast in 1937–1938, 1943–1944, 1950–1951, 1955–1956, 1960–1961, 1966–1967, 1970–1971, 1989–1990, 2000–2001 and 2007. Droughts effect vegetation through “water stress” and saltwater intrusion. Seeds of many freshwater plants, such as bald cypress, will not germinate without moisture and seedlings may not survive at higher salinities.
Inland mangroves appear to be more affected by lower regional winter air temperatures (i.e. freezes) here than coastal mangroves systems of Dade, Broward and Monroe counties. Historically, cold winters were reported in 1930–1940, 1957–1958, 1962–1963 and 1964–1965 (Alexander and Crook, 1975) and in 1977, 1983, 1985 and 1989 (FDEP, 2000). Infrared aerial
North Fork of the St. Lucie River Floodplain Vegetation Technical Report
90
photographs of the Northwest Fork Loxahatchee River taken during a special flight for the District in April 1985 showed signs of extensive mangrove defoliation with trees of 30 feet or more exhibiting broken branches and trunks. On the Treasure Coast, average monthly air temperatures for January and February 1985 were 7.7 and 11.1° C (46° and 52° F), respectively (United States Department of Commerce, Climatological Data: Florida). Temperatures had ranged as low as 3.9° C (25° F). Mangroves do not tolerate temperature fluctuations exceeding 7.8° C (18° F) or temperature below freezing (Odum et al, 1982). Mangroves may defoliate after exposure to 7.2° C (45° F) or less. Mangroves in more inland areas like the North Fork St. Lucie River seem to be more effected by low temperatures than those closer to the coast. Also, mangrove height appears to be suppressed by colder temperatures. In our 2009 study, areas of young white mangroves along with giant leather ferns were defoliated along the Crowberry Drive Transect near RM 18.3.
On the other hand with global warming, we appear to be having milder winters in the last decade, which has probably increased the distribution of mangroves in Florida and along the remaining Gulf Coast. Of concern on the Loxahatchee River and the North Fork St. Lucie River is that with sea level rise and the milder winters, mangroves, particularly white mangroves, may further intrude up into freshwater riverine areas and out compete freshwater plant species such as sawgrass and giant leather fern. It is of particular concern in the lower tidal reach of the North Fork when considering whether to reconnect isolated areas of floodplain to improve hydrology. Increased periods of inundation could discourage the recruitment of white mangrove and promote the recruitment of pond apple, pop ash and bald cypress. However, if freshwater flow is not available during low flow periods, then we could be exposing these tidal floodplain areas to increased salinities and the recruitment of more red and black mangroves.
Alexander had noted that conductivity data from the river swamp and exclusive of the mangrove areas revealed the influence of brackish water from the St. Lucie River (Teas, 1971). For example, he noted the restriction of water hickory (which is very salt sensitive) to mounds and ridges near the brackish water. He wrote “Experience with other but similar areas during storm tides indicates a delicate balance of salt content is to be expected in these soils. During dry seasons the water evaporates and the salt content of the soils increases. Readings of 4.0 mho/cm [S/cm] lie in the range of where many plants become sensitive. There is an extreme danger of salt water storm tides in the upper reaches of this site. If salt water is forced up the river valley and impounded in the low areas then as drying occurs, salt content will soar in the root zone. This accounted for large areas of plants being killed in affected areas after Hurricane Donna in 1960 and Hurricane Betsy in 1965. The destruction in the latter case was due primarily to saltwater impoundment behind man-made structures. Careful attention to this is needed of management of the North Fork St. Lucie River. Freshwater flow should be assured from the surrounding areas to flush out salt rapidly. No artificial impoundments are safe over

North Fork of the St. Lucie River Floodplain Vegetation Technical Report
91
long periods unless a relief system is built.” He was referring to a system of freshwater storage during the wet season for release during the dry season, which essentially today is the goal of the CERP Indian River Lagoon – South Project.

North Fork of the St. Lucie River Floodplain Vegetation Technical Report
92
North Fork of the St. Lucie River Floodplain Vegetation Technical Report
93
LITERATURE CITED
Alexander, T.R. 1967. Effects of Hurricane Betsy on the southeastern Everglades. Florida Scientist 30(1): 9-17.
Alexander, T.R. and A.G. Crook. 1975. Recent and Long Term Vegetation Changes and Patterns in South Florida. Paper presented at the annual meeting of the Florida Academy of Sciences, March 25-27, 1971.
Anderson C.J. and B.G. Lockaby. 2011. Forested wetland communities as indicators of tidal influence along the Apalachicola River, Florida, USA. Wetlands 31:895-906.
Burke, M.K., S.L. King and M.H. Eisenbies. 2003. Vegetation, soil, and flooding relationships in a blackwater floodplain forest. Wetlands 23(4):988-1002.
Darst, M.R., H.M. Light, L.J. Lewis and A.A. Sepulveda. 2003. Forest Types in the Lower Suwannee River Floodplain, Florida, a Report and Interactive Map. Water Resources Investigations Report 03-4008, United States Geological Survey, Tallahassee, Florida,
Darst, M.R. and H.M. Light. 2008. Drier Forest Composition Associated with Hydrologic Change in the Apalachicola River Floodplain, Florida. Scientific Investigations Report 2008-5062, United States Geological Survey, Reston, Virginia.
Davis Jr., J.H. 1943. The Natural Features of Southern Florida. Geological Bulletin 25, Florida Geological Survey, Tallahassee, Florida.
Davis, T.L. 1982. North Fork St. Lucie River Water Quality Survey through 1981. Florida Department of Environmental Regulation, Port St. Lucie, Florida.
Florida Department of Environmental Protection. 2000. Jonathan Dickinson State Park Management Plan. FDEP, Tallahassee, FL.
Florida Department of Natural Resources. 1984. North Fork St. Lucie River: Aquatic Preserve Management Plan. Bureau of Aquatic Preserves, Division of State Lands, Tallahassee, Florida.
Florida Surveyor General’s Office. 1856. A Plat Exhibiting the State of the Surveys in the State of Florida with References. Approved John Wescott Survey General, Surveyor General’s Office, St. Augustine, Florida. 18 miles to 1 inch (1:1, 140,000).
Henshall, J. 2012. Camping and Cruising in Florida: One Hundred Years Ago. Forgotten Books Publishing Company, Cincinnati: R. Clarke & Co. 1884.
North Fork of the St. Lucie River Floodplain Vegetation Technical Report
94
Hu, Gordon. 2000. The Application of the St. Lucie Estuary Hydrodynamic/salinity Model in Indian River Lagoon and the St. Lucie Estuary Environmental Studies. Technical Memorandum, South Florida Water Management District, West Palm Beach, Florida.
Ives, Lieut. J.C. 1856. Military Map of the Peninsula of Florida South of Tampa Bay. Approved by Capt. A. A. Humphrey by order of Hon. Jefferson Davis, Secretary of War.
Kautz, R., J. Cox, M. Maclaughlin and J. Stys. 1994. Mapping Wetland Habitats of High Priority to Endangered and Threatened Species in Florida. Florida Game and Freshwater Fish Commission, Office of Environmental Services, Tallahassee, Florida.
Light, H.M., M.R. Darst and L.J. Lewis. 2002a. Hydrology, Vegetation, and Soils of Riverine and Tidal Floodplain Forests of the Lower Suwannee River, Florida, and Potential Impacts of Flow Reductions. Professional Paper, Volume 1656, United States Geological Survey, United States Government Printing Office, Washington, District of Columbia.
Light, H.M., M. Darst, M. MacLaughlin, and S. Sprecher. 2002b. Hydrology, Vegetation, and Soils, of Four North Florida River Floodplains with an Evaluation of State and Federal Wetland Determinations. Water Resources Investigations Report 93-4033, United States Geological Service, Denver, Colorado, and Florida Department of Environmental Regulation, Tallahassee, Florida.
Liu, G. and Y. Li. 2007. Analysis of Salinity and Oxygen Availability in the Floodplain of the Loxahatchee River Watershed. Preliminary Research Report (TREC-Li07-LH1), Tropical Research and Education Center, University of Florida, Homestead, Florida.
McCune B. and J.B. Grace. 2002. Analysis of Ecological Communities. MjM Software Design, Gleneden Beach, Oregon.
McCune, B., and M.J. Mefford. 2011. PC-ORD, Multivariate Analysis of Ecological Data Version 6.0. MjM Software Design, Gleneden Beach, Oregon.
Mitsch, W.J. and J.G. Gosselink. 1993. Guide to the Vascular Plants of Florida, 2nd Edition. Van Nostrand Reinhold Publication, New York, New York.
Mitsch, W.J. and J.G. Gosselink. 2000. Wetlands. 3rd Edition, John Wiley & Sons, Inc. New York.
Odum, E.W., C.C. McIvor and T.J. Smith, III. 1982. The Ecology of the Mangroves of South Florida: A Community Profile. Reference OBS-81-24, United States Fish and Wildlife, Office of Biological Services, Washington, District of Columbia .
Osborn, N. 2012. Oranges and Inlets: An Environmental History of Florida’s Indian River Lagoon. Master of Arts Thesis, Florida Atlantic University, Boca Raton, Florida.
North Fork of the St. Lucie River Floodplain Vegetation Technical Report
95
Peck, J.E. 2010. Multivariate Analysis for Community Ecologists: Step-by-Step Using PC-ORD. MjM Software Design, Gleneden Beach, Oregon.
Perry, J.E. and C.H. Hershner. 1999. Temporal changes in the vegetation pattern in a tidal freshwater marsh. Wetlands 19:90-99.
Post, Buckley, Schuh & Jernigan, Inc. 1999. St. Lucie Watershed Assessment Task A: Watershed Characterization. Technical Report for the South Florida Water Management District, West Palm Beach, Florida.
Post, Buckley, Schuh & Jernigan, Inc. 2003. Feasibility Study for the Reconnection of Wetlands and Oxbows along the North Fork of the St. Lucie River. Prepared for Florida Department of Environmental Protection. West Palm Beach, Florida.
Roberts, R.E. M. Y. Hedgepeth, and T.R. Alexander. 2008. Vegetational Responses to Saltwater Intrusion along the Northwest Fork of the Loxahatchee River within Jonathan Dickinson State Park. Florida Scientist 71(4):383-397.
Roberts, R.E., M.Y. Hedgepeth and R.R. Gross. 2011. Impacts from Hurricanes Frances and Jeanne on the floodplain forest communities of the Loxahatchee River. Florida Scientist 74(1):1-16.
SFWMD 2002. Technical Documentation to Support Development of Minimum Flows and Levels for the St. Lucie River and Estuary. South Florida Water Management District, West Palm Beach, Florida.
SFWMD. 2006. Restoration Plan for the Northwest Fork of the Loxahatchee River. South Florida Water Management District, West Palm Beach, Florida. April 2006.
SFWMD. 2009. Technical Document to Support a Water Reservation Rule for the North Fork of the St. Lucie River. South Florida Water Management District, West Palm Beach, Florida. May 2009.
SFWMD and FDEP FPS. 2009. Riverine and Tidal Floodplain Vegetation of the Loxahatchee River and its Major Tributaries. South Florida Water Management District, West Palm Beach, Florida, and Florida Department of Environmental Protection, Florida Park Service District 5, Hobe Sound, Florida.
Teas, H.J. 1970. The St. Lucie Sanctuary: The Halpatiokee Natural Area. University of Miami, Department of Biology, Coral Gables, Florida.
Teas, H.J. 1971. Biological Survey of the North Fork of the St. Lucie River. Report submitted to the General Development Corporation, Miami, Florida.
North Fork of the St. Lucie River Floodplain Vegetation Technical Report
96
ter Braak, C.J. F. and L.G. Barendregt. 1986. Weighted Averaging of Species Indicator Values: Its Efficiency in Environmental Calibration. Mathematical Biosciences 78:57-72.
Tuckwood, J. (ed.). 2004. Mean Season: Florida’s Hurricanes of 2004. The Palm Beach Post, West Palm Beach, Florida.
USACE and SFWMD. 2004. Central and Southern Florida Project Indian River Lagoon – South Final Integrated Project Implementation Report and Environmental Impact Statement. United States Army Corps of Engineers, Jacksonville, Florida, and South Florida Water Management District, West Palm Beach, Florida. March 2004.
USDA, UF and FDACS 1977. Soil Survey of St. Lucie County. Soil Conservation Service, United States Department of Agriculture, Washington, District of Columbia; Institute of Food and Agricultural Sciences and Agricultural Experiment Stations, Soil Sciences Department, University of Florida, Gainesville, Florida; and Florida Department of Agriculture and Consumer Services, Tallahassee, Florida .
U.S. Department of Commerce. 2010. Annual Climatological Data: Florida. Washington D.C.
Wunderlin, R.P. and B.F. Hansen. 2008. Atlas of Florida Vascular Plants. www.plantatlas.usf.edu/.
North Fork of the St. Lucie River Floodplain Vegetation Technical Report
97
GLOSSARY Basal area is the cross-sectional area of a trunk (in square meters), which is calculated from
diameter breast height (dbh) (in centimeters) using the formula πr2, in which: π=3.1416 and r = dbh/2. (See relative basal area.)
Belt transect is a long, narrow rectangular sampling area oriented along a centerline with a width of a few meters on one or both sides of the line.
Bottomland hardwoods (Rblh1, Rblh2, Rblh3, UTblh2 and UTblh3) are forests on ridges, flats and slopes of floodplains that are flooded continuously for several weeks or longer every 1 to 3 years and contain tree species adapted to periodic inundation and saturation.
Braided channels are characterized by the main river channel dividing into numerous interconnected channels.
Density is the number of individual plants (abundance) in a unit area. Trees with multiple trunks were considered separate trees.
Diameter at breast height (dbh) is the diameter of a tree trunk measured at about 1.4 to 1.5 meters above the ground.
Digital orthophoto quadrangle (DOQQ) is a digital image of color-infrared photographs (scale 1:40,000) that has been rectified to an orthographic projection. The geographic extent of a DOQQ is equivalent to on-quarter of a United States Geological Survey quadrangle map.
Dominant species are the most abundant species within a forest type, and have the most influence on the composition and distribution of other species. (See importance of a species.)
Elevation in this report is measured in the National Geodetic Vertical Datum (NGVD29).
Floodplain refers to the wide flat part of the watershed that is usually covered with water when the river floods but does not include open water in the main river channel.
Frequency is the number of times a species is recorded in a given sample size (or species presence).
Forest types are groups of canopy trees species that usually grow together in a relatively distinct and recognizable community. In this report, forest types have been botanically defined based on both vegetation sampling and elevations. (See general forest types and specific forest types).
North Fork of the St. Lucie River Floodplain Vegetation Technical Report
98
General forest types refer to the following 16 forest types, some of which are combinations of specific types: Rsw1, Rsw2, Rblh1, Rblh2, Rblh3, Rmix, UTsw1, UTsw2, UTsw3, UTmix, LTsw1, LTsw2, LTmix, HH, MH and U. Forest types are determined by hydrology, topography, vegetation, soils and distance from the inlet. (See forest types and specific forest types.)
Geographic information system (GIS) is a collection of computer software and data files designed to store, analyze and display geographically referenced information.
Hammocks (MH and HH) refer to both mesic and hydric hammocks as described by Wunderlin and Hansen (2008). Hammocks are a unique forest type, rare outside Florida that supports characteristic mixed hardwood forest with evergreen and semi-evergreen trees.
Hummocks are mounds around the bases of trees live or dead that are elevated above the surrounding ground. Hummocks can be found in all floodplain swamp communities.
Importance of a species is used to compare species in a forest type of sampling area and is based on relative basal area for canopy species and relative density for subcanopy species. (See dominant species.)
Lower tidal reach (LTsw1, LTsw2 and LTmix) is that part of the floodplain forest of the lower river having a canopy forest composition influenced by tides and salinity in the water and soil. It includes the mid-estuary of the St. Lucie Estuary, Indian River Lagoon and the St. Lucie Inlet.
Mixed forests (Rmix, UTmix and LTmix) are forest types dominated by a mixture of swamp, hammock or bottomland hardwood species.
Oak/pine upland forests (oak/pine) are present at high elevations and are only inundated during the highest floods. Many tree species present in upland forests cannot survive more than brief periods of inundation. (See uplands.)
Relative basal area (RBA) is the percentage of a species in a forest type based on basal area. It is calculated by dividing the total basal area of that species (in square meters [m2]) by the total basal area of all species (in m2) in a vegetative plot.
River miles (RM) are used to indicate stream distances starting with River Mile 0 at the mouth of the river (St. Lucie Inlet).
Riverine reach (R) (Rsw1, Rsw2, Rblh1, Rblh2, Rblh3 and Rmix) Primary freshwater canopy forest that is generally unaffected by salinity. It includes Five Mile and Ten Mile creeks and downstream to River Mile 27 (Midway Bridge).
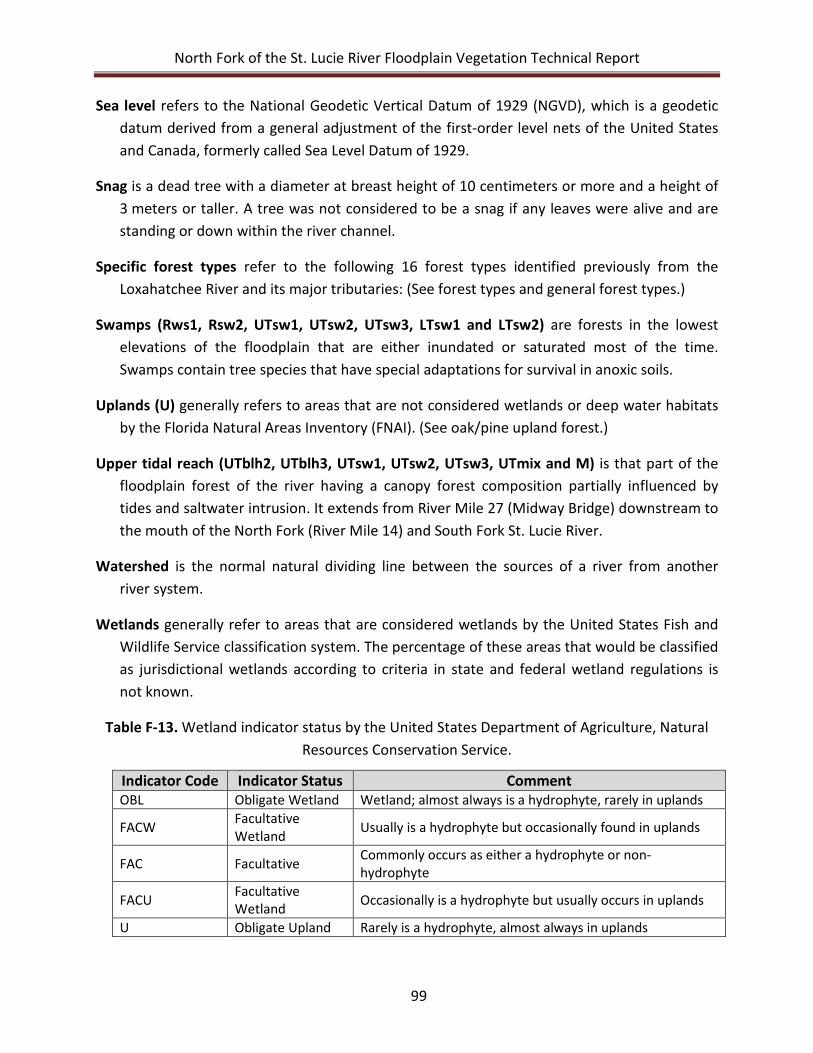
North Fork of the St. Lucie River Floodplain Vegetation Technical Report
99
Sea level refers to the National Geodetic Vertical Datum of 1929 (NGVD), which is a geodetic datum derived from a general adjustment of the first-order level nets of the United States and Canada, formerly called Sea Level Datum of 1929.
Snag is a dead tree with a diameter at breast height of 10 centimeters or more and a height of 3 meters or taller. A tree was not considered to be a snag if any leaves were alive and are standing or down within the river channel.
Specific forest types refer to the following 16 forest types identified previously from the Loxahatchee River and its major tributaries: (See forest types and general forest types.)
Swamps (Rws1, Rsw2, UTsw1, UTsw2, UTsw3, LTsw1 and LTsw2) are forests in the lowest elevations of the floodplain that are either inundated or saturated most of the time. Swamps contain tree species that have special adaptations for survival in anoxic soils.
Uplands (U) generally refers to areas that are not considered wetlands or deep water habitats by the Florida Natural Areas Inventory (FNAI). (See oak/pine upland forest.)
Upper tidal reach (UTblh2, UTblh3, UTsw1, UTsw2, UTsw3, UTmix and M) is that part of the floodplain forest of the river having a canopy forest composition partially influenced by tides and saltwater intrusion. It extends from River Mile 27 (Midway Bridge) downstream to the mouth of the North Fork (River Mile 14) and South Fork St. Lucie River.
Watershed is the normal natural dividing line between the sources of a river from another river system.
Wetlands generally refer to areas that are considered wetlands by the United States Fish and Wildlife Service classification system. The percentage of these areas that would be classified as jurisdictional wetlands according to criteria in state and federal wetland regulations is not known.
Table F-13. Wetland indicator status by the United States Department of Agriculture, Natural Resources Conservation Service.
Indicator Code Indicator Status Comment OBL Obligate Wetland Wetland; almost always is a hydrophyte, rarely in uplands
FACW Facultative Wetland Usually is a hydrophyte but occasionally found in uplands
FAC Facultative Commonly occurs as either a hydrophyte or non-hydrophyte
FACU Facultative Wetland Occasionally is a hydrophyte but usually occurs in uplands
U Obligate Upland Rarely is a hydrophyte, almost always in uplands

North Fork of the St. Lucie River Floodplain Vegetation Technical Report
100
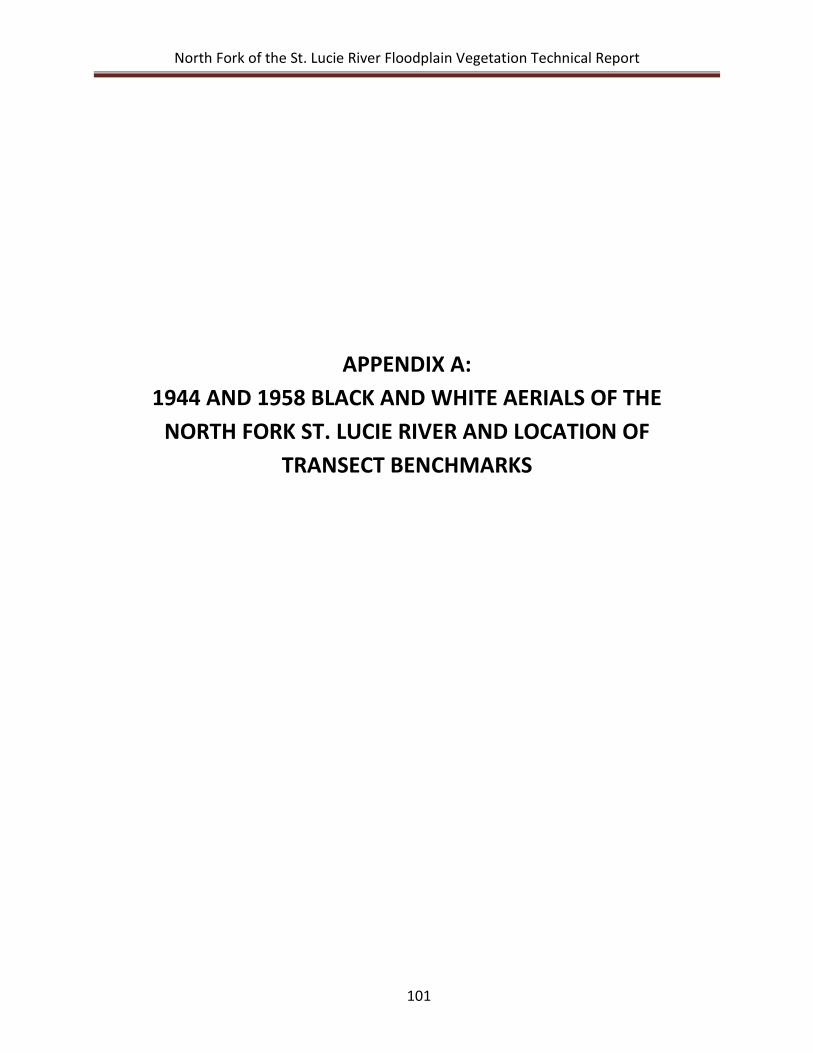
North Fork of the St. Lucie River Floodplain Vegetation Technical Report
101
APPENDIX A: 1944 AND 1958 BLACK AND WHITE AERIALS OF THE
NORTH FORK ST. LUCIE RIVER AND LOCATION OF TRANSECT BENCHMARKS
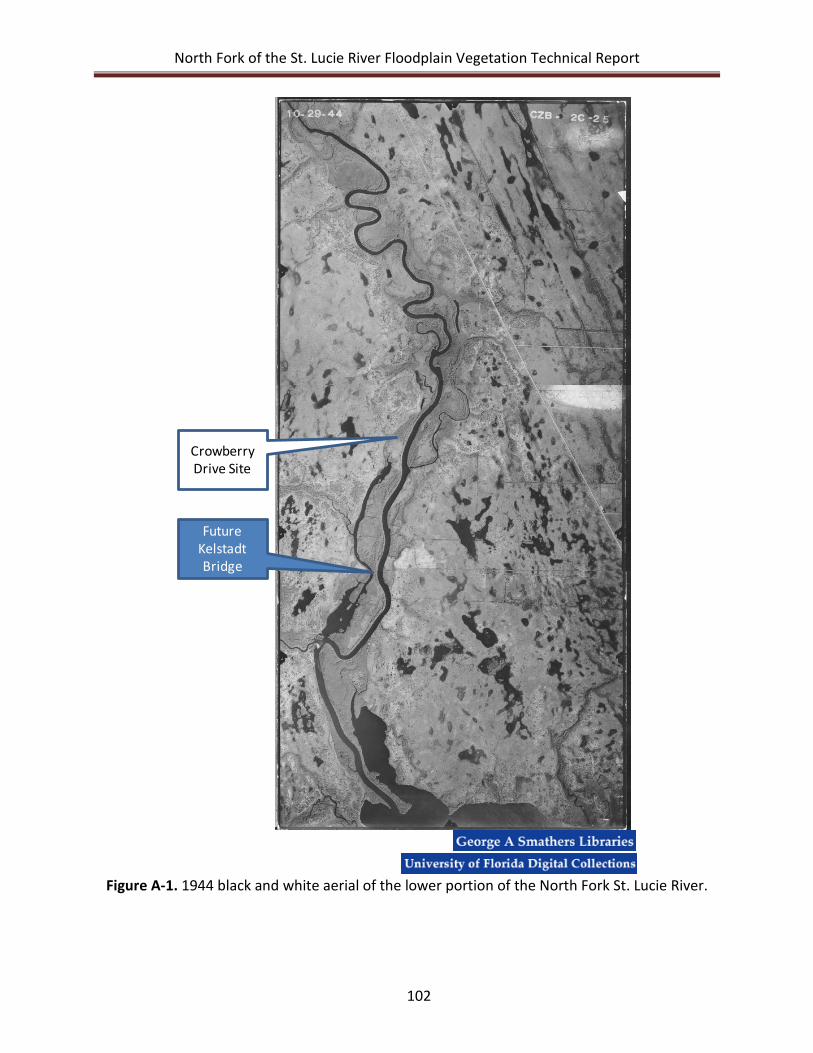
North Fork of the St. Lucie River Floodplain Vegetation Technical Report
102
Figure A-1. 1944 black and white aerial of the lower portion of the North Fork St. Lucie River.
Future KelstadtBridge
Crowberry Drive Site
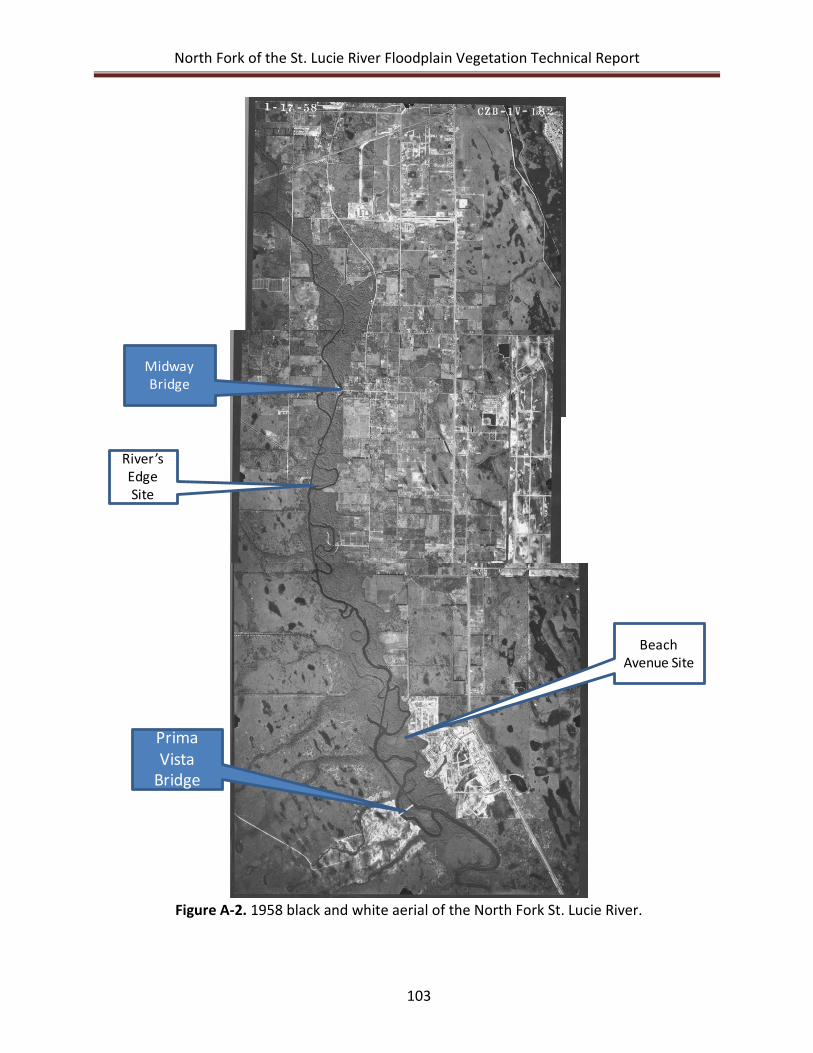
North Fork of the St. Lucie River Floodplain Vegetation Technical Report
103
Figure A-2. 1958 black and white aerial of the North Fork St. Lucie River.
Prima Vista
Bridge
Midway Bridge
Beach Avenue Site
River’s Edge Site
North Fork of the St. Lucie River Floodplain Vegetation Technical Report
104
Figure A-3. 1958 black and white aerial of Five Mile and Ten Mile creeks
Ten Mile CreekMiller
Oxbow Site
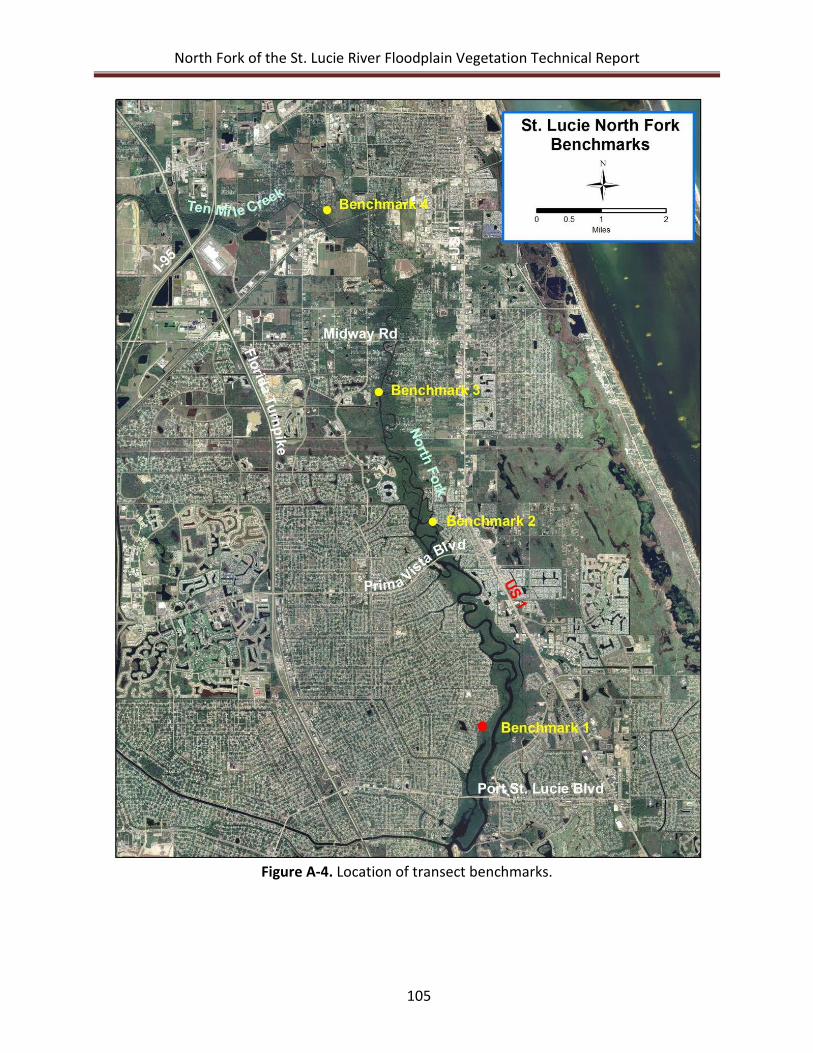
North Fork of the St. Lucie River Floodplain Vegetation Technical Report
105
Figure A-4. Location of transect benchmarks.
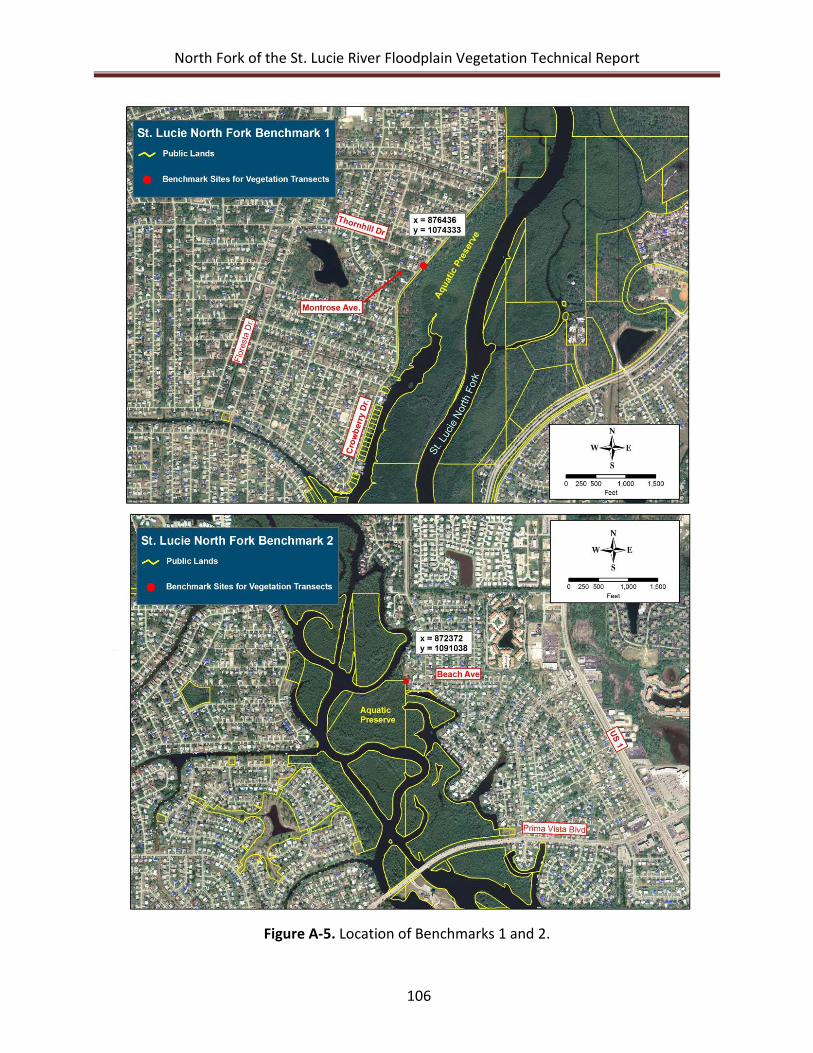
North Fork of the St. Lucie River Floodplain Vegetation Technical Report
106
Figure A-5. Location of Benchmarks 1 and 2.
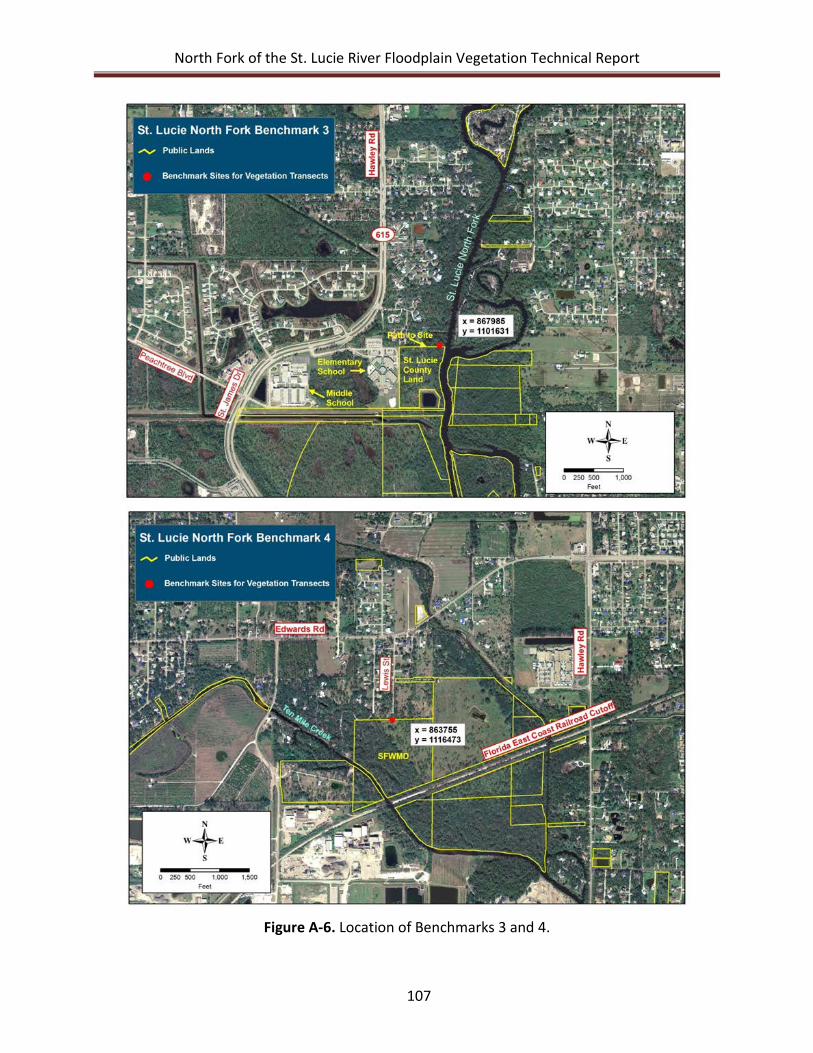
North Fork of the St. Lucie River Floodplain Vegetation Technical Report
107
Figure A-6. Location of Benchmarks 3 and 4.

North Fork of the St. Lucie River Floodplain Vegetation Technical Report
108
North Fork of the St. Lucie River Floodplain Vegetation Technical Report
109
APPENDIX B: 1971 PLANT LIST FOR THE FRESHWATER SWAMP OF THE
NORTH FORK ST. LUCIE RIVER
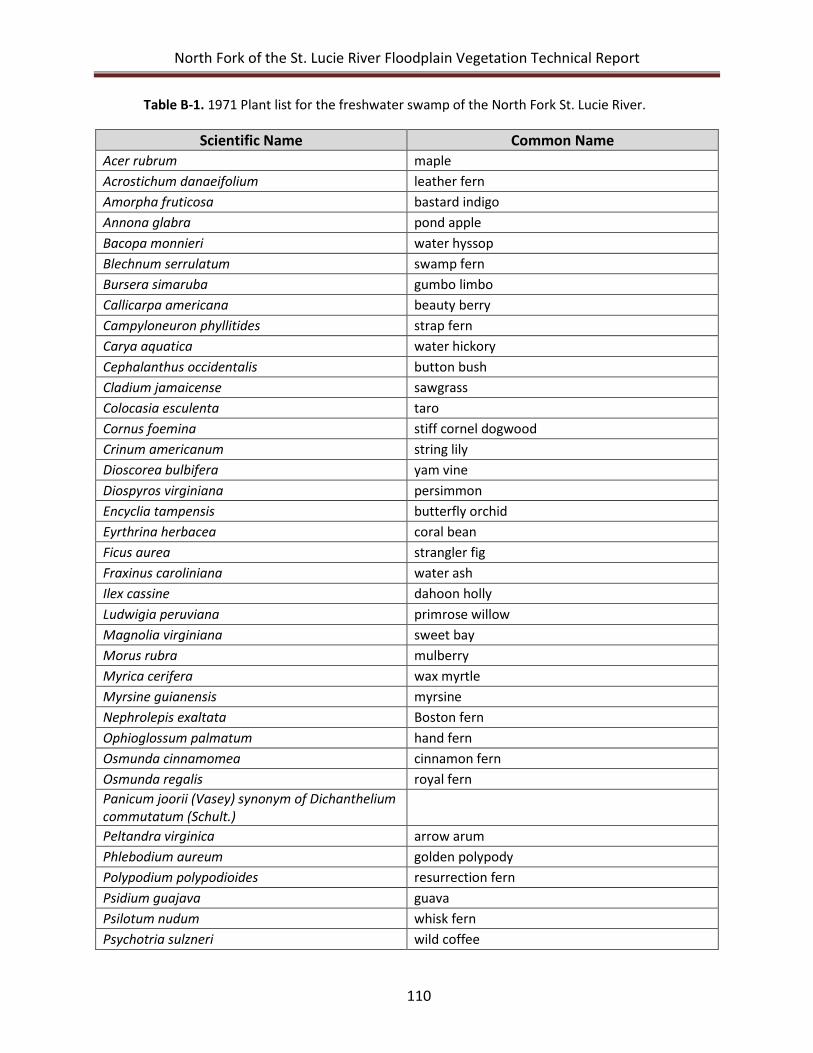
North Fork of the St. Lucie River Floodplain Vegetation Technical Report
110
Table B-1. 1971 Plant list for the freshwater swamp of the North Fork St. Lucie River.
Scientific Name Common Name Acer rubrum maple Acrostichum danaeifolium leather fern Amorpha fruticosa bastard indigo Annona glabra pond apple Bacopa monnieri water hyssop Blechnum serrulatum swamp fern Bursera simaruba gumbo limbo Callicarpa americana beauty berry Campyloneuron phyllitides strap fern Carya aquatica water hickory Cephalanthus occidentalis button bush Cladium jamaicense sawgrass Colocasia esculenta taro Cornus foemina stiff cornel dogwood Crinum americanum string lily Dioscorea bulbifera yam vine Diospyros virginiana persimmon Encyclia tampensis butterfly orchid Eyrthrina herbacea coral bean Ficus aurea strangler fig Fraxinus caroliniana water ash Ilex cassine dahoon holly Ludwigia peruviana primrose willow Magnolia virginiana sweet bay Morus rubra mulberry Myrica cerifera wax myrtle Myrsine guianensis myrsine Nephrolepis exaltata Boston fern Ophioglossum palmatum hand fern Osmunda cinnamomea cinnamon fern Osmunda regalis royal fern Panicum joorii (Vasey) synonym of Dichanthelium commutatum (Schult.)
Peltandra virginica arrow arum Phlebodium aureum golden polypody Polypodium polypodioides resurrection fern Psidium guajava guava Psilotum nudum whisk fern Psychotria sulzneri wild coffee
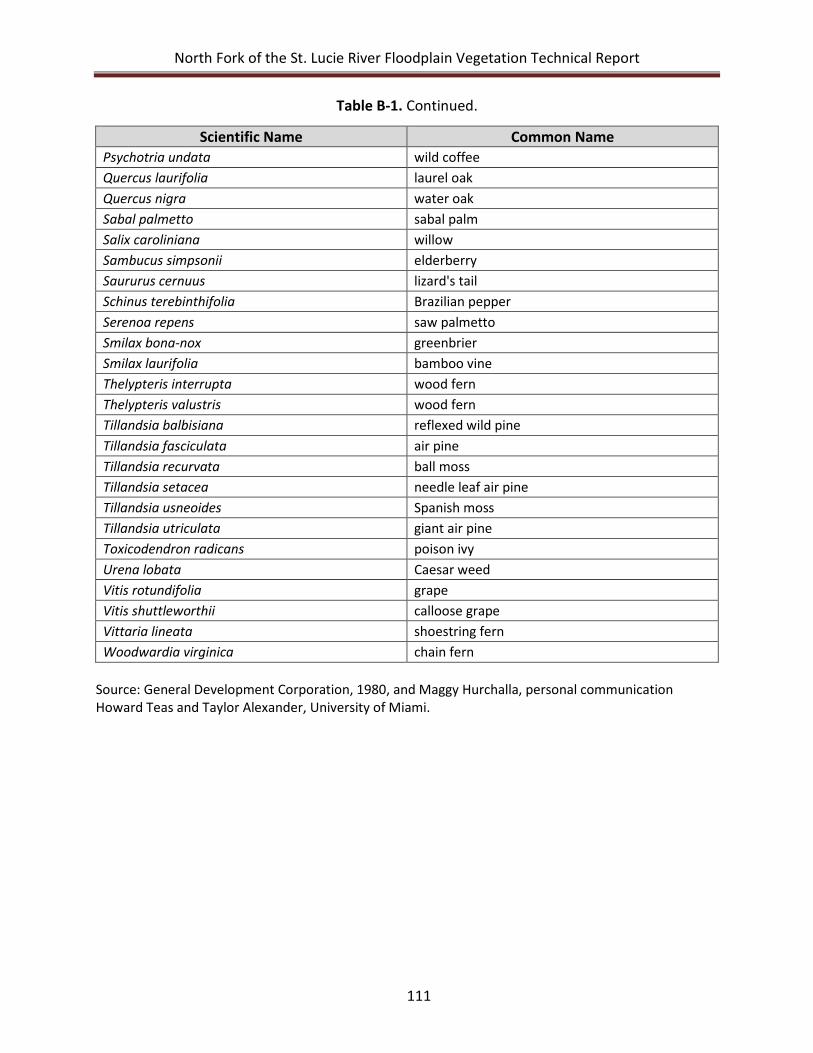
North Fork of the St. Lucie River Floodplain Vegetation Technical Report
111
Table B-1. Continued.
Scientific Name Common Name Psychotria undata wild coffee Quercus laurifolia laurel oak Quercus nigra water oak Sabal palmetto sabal palm Salix caroliniana willow Sambucus simpsonii elderberry Saururus cernuus lizard's tail Schinus terebinthifolia Brazilian pepper Serenoa repens saw palmetto Smilax bona-nox greenbrier Smilax laurifolia bamboo vine Thelypteris interrupta wood fern Thelypteris valustris wood fern Tillandsia balbisiana reflexed wild pine Tillandsia fasciculata air pine Tillandsia recurvata ball moss Tillandsia setacea needle leaf air pine Tillandsia usneoides Spanish moss Tillandsia utriculata giant air pine Toxicodendron radicans poison ivy Urena lobata Caesar weed Vitis rotundifolia grape Vitis shuttleworthii calloose grape Vittaria lineata shoestring fern Woodwardia virginica chain fern
Source: General Development Corporation, 1980, and Maggy Hurchalla, personal communication Howard Teas and Taylor Alexander, University of Miami.

North Fork of the St. Lucie River Floodplain Vegetation Technical Report
112
North Fork of the St. Lucie River Floodplain Vegetation Technical Report
113
APPENDIX C: 2009 NORTH FORK ST. LUCIE RIVER PLANT SURVEY LIST
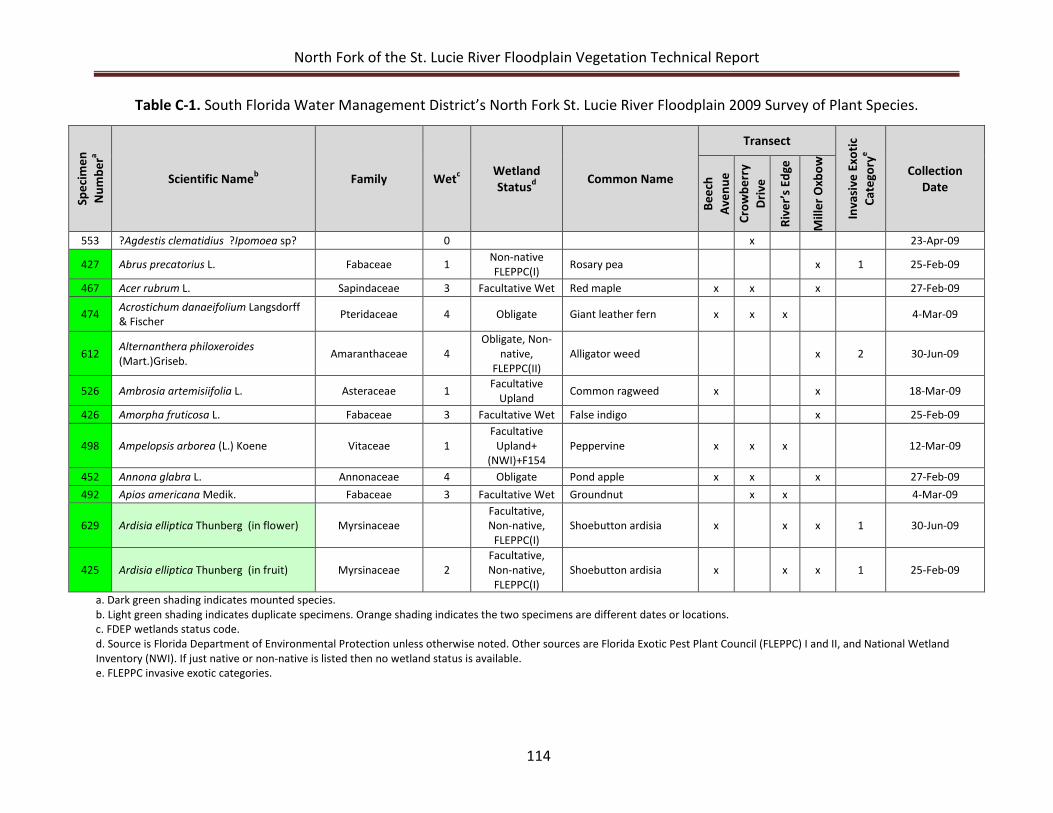
North Fork of the St. Lucie River Floodplain Vegetation Technical Report
114
Table C-1. South Florida Water Management District’s North Fork St. Lucie River Floodplain 2009 Survey of Plant Species. Sp
ecim
en
Num
bera
Scientific Nameb Family Wetc Wetland Statusd Common Name
Transect
Inva
sive
Exo
tic
Cate
gory
e
Collection Date
Beec
h Av
enue
Cr
owbe
rry
Driv
e
Rive
r’s E
dge
Mill
er O
xbow
553 ?Agdestis clematidius ?Ipomoea sp? 0 x 23-Apr-09
427 Abrus precatorius L. Fabaceae 1 Non-native FLEPPC(I) Rosary pea x 1 25-Feb-09
467 Acer rubrum L. Sapindaceae 3 Facultative Wet Red maple x x x 27-Feb-09
474 Acrostichum danaeifolium Langsdorff & Fischer Pteridaceae 4 Obligate Giant leather fern x x x 4-Mar-09
612 Alternanthera philoxeroides (Mart.)Griseb. Amaranthaceae 4
Obligate, Non-native,
FLEPPC(II) Alligator weed x 2 30-Jun-09
526 Ambrosia artemisiifolia L. Asteraceae 1 Facultative Upland Common ragweed x x 18-Mar-09
426 Amorpha fruticosa L. Fabaceae 3 Facultative Wet False indigo x 25-Feb-09
498 Ampelopsis arborea (L.) Koene Vitaceae 1 Facultative
Upland+ (NWI)+F154
Peppervine x x x 12-Mar-09
452 Annona glabra L. Annonaceae 4 Obligate Pond apple x x x 27-Feb-09 492 Apios americana Medik. Fabaceae 3 Facultative Wet Groundnut x x 4-Mar-09
629 Ardisia elliptica Thunberg (in flower) Myrsinaceae
Facultative, Non-native,
FLEPPC(I) Shoebutton ardisia x x x 1 30-Jun-09
425 Ardisia elliptica Thunberg (in fruit) Myrsinaceae 2 Facultative, Non-native,
FLEPPC(I) Shoebutton ardisia x x x 1 25-Feb-09
a. Dark green shading indicates mounted species. b. Light green shading indicates duplicate specimens. Orange shading indicates the two specimens are different dates or locations. c. FDEP wetlands status code. d. Source is Florida Department of Environmental Protection unless otherwise noted. Other sources are Florida Exotic Pest Plant Council (FLEPPC) I and II, and National Wetland Inventory (NWI). If just native or non-native is listed then no wetland status is available. e. FLEPPC invasive exotic categories.
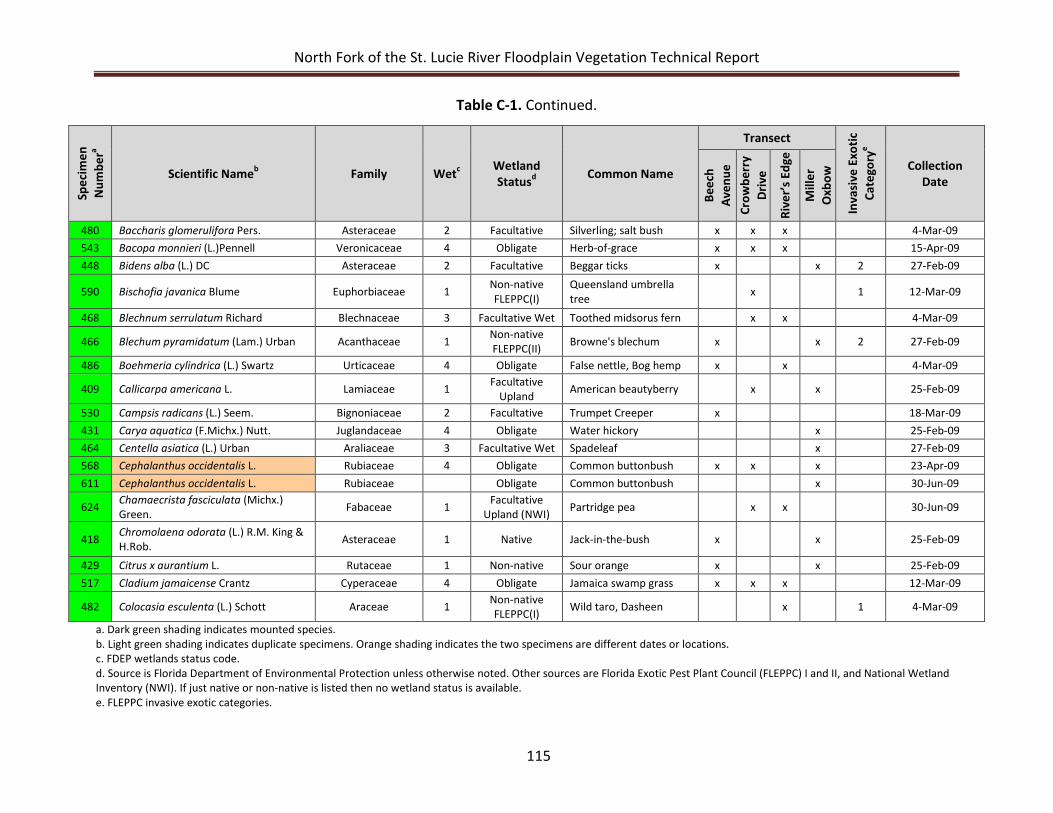
North Fork of the St. Lucie River Floodplain Vegetation Technical Report
115
Table C-1. Continued. Sp
ecim
en
Num
bera
Scientific Nameb Family Wetc Wetland Statusd Common Name
Transect
Inva
sive
Exo
tic
Cate
gory
e
Collection Date
Beec
h Av
enue
Cr
owbe
rry
Driv
e
Rive
r’s E
dge
Mill
er
Oxb
ow
480 Baccharis glomerulifora Pers. Asteraceae 2 Facultative Silverling; salt bush x x x 4-Mar-09 543 Bacopa monnieri (L.)Pennell Veronicaceae 4 Obligate Herb-of-grace x x x 15-Apr-09 448 Bidens alba (L.) DC Asteraceae 2 Facultative Beggar ticks x x 2 27-Feb-09
590 Bischofia javanica Blume Euphorbiaceae 1 Non-native FLEPPC(I)
Queensland umbrella tree x 1 12-Mar-09
468 Blechnum serrulatum Richard Blechnaceae 3 Facultative Wet Toothed midsorus fern x x 4-Mar-09
466 Blechum pyramidatum (Lam.) Urban Acanthaceae 1 Non-native FLEPPC(II) Browne's blechum x x 2 27-Feb-09
486 Boehmeria cylindrica (L.) Swartz Urticaceae 4 Obligate False nettle, Bog hemp x x 4-Mar-09
409 Callicarpa americana L. Lamiaceae 1 Facultative Upland American beautyberry x x 25-Feb-09
530 Campsis radicans (L.) Seem. Bignoniaceae 2 Facultative Trumpet Creeper x 18-Mar-09 431 Carya aquatica (F.Michx.) Nutt. Juglandaceae 4 Obligate Water hickory x 25-Feb-09 464 Centella asiatica (L.) Urban Araliaceae 3 Facultative Wet Spadeleaf x 27-Feb-09 568 Cephalanthus occidentalis L. Rubiaceae 4 Obligate Common buttonbush x x x 23-Apr-09 611 Cephalanthus occidentalis L. Rubiaceae Obligate Common buttonbush x 30-Jun-09
624 Chamaecrista fasciculata (Michx.) Green. Fabaceae 1 Facultative
Upland (NWI) Partridge pea x x 30-Jun-09
418 Chromolaena odorata (L.) R.M. King & H.Rob. Asteraceae 1 Native Jack-in-the-bush x x 25-Feb-09
429 Citrus x aurantium L. Rutaceae 1 Non-native Sour orange x x 25-Feb-09 517 Cladium jamaicense Crantz Cyperaceae 4 Obligate Jamaica swamp grass x x x 12-Mar-09
482 Colocasia esculenta (L.) Schott Araceae 1 Non-native FLEPPC(I) Wild taro, Dasheen x 1 4-Mar-09
a. Dark green shading indicates mounted species. b. Light green shading indicates duplicate specimens. Orange shading indicates the two specimens are different dates or locations. c. FDEP wetlands status code. d. Source is Florida Department of Environmental Protection unless otherwise noted. Other sources are Florida Exotic Pest Plant Council (FLEPPC) I and II, and National Wetland Inventory (NWI). If just native or non-native is listed then no wetland status is available. e. FLEPPC invasive exotic categories.
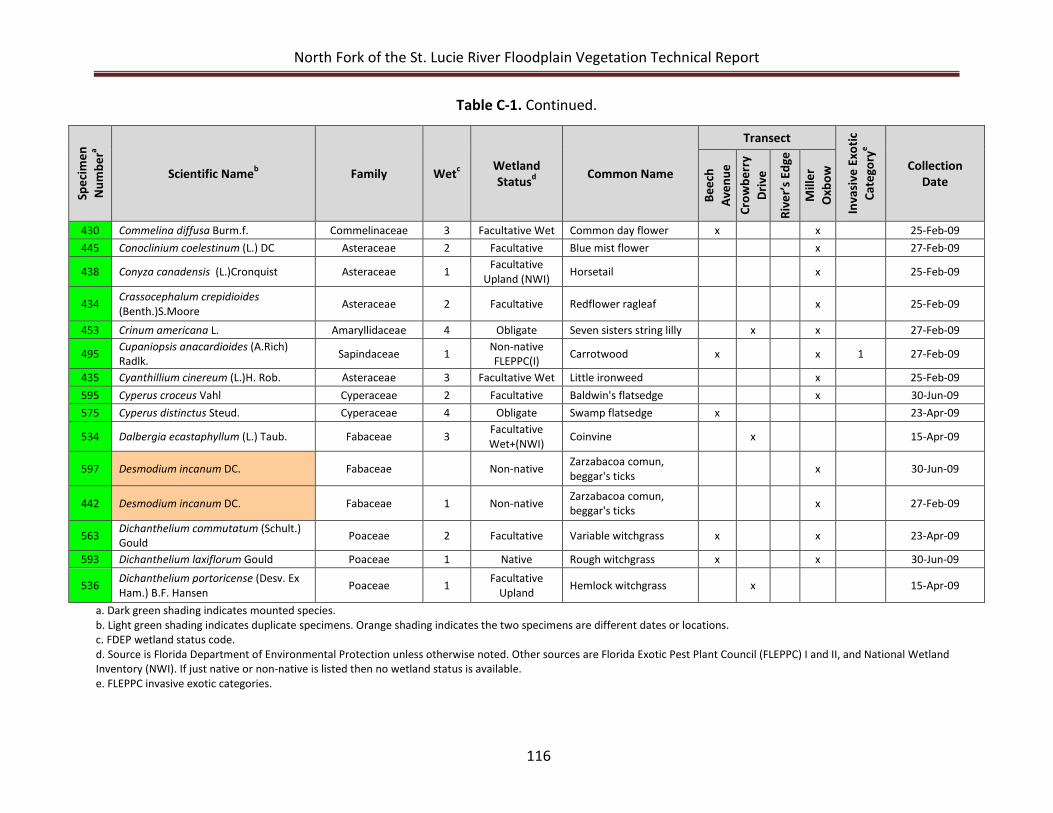
North Fork of the St. Lucie River Floodplain Vegetation Technical Report
116
Table C-1. Continued. Sp
ecim
en
Num
bera
Scientific Nameb Family Wetc Wetland Statusd Common Name
Transect
Inva
sive
Exo
tic
Cate
gory
e
Collection Date
Beec
h Av
enue
Cr
owbe
rry
Driv
e
Rive
r’s E
dge
Mill
er
Oxb
ow
430 Commelina diffusa Burm.f. Commelinaceae 3 Facultative Wet Common day flower x x 25-Feb-09 445 Conoclinium coelestinum (L.) DC Asteraceae 2 Facultative Blue mist flower x 27-Feb-09
438 Conyza canadensis (L.)Cronquist Asteraceae 1 Facultative Upland (NWI) Horsetail x 25-Feb-09
434 Crassocephalum crepidioides (Benth.)S.Moore Asteraceae 2 Facultative Redflower ragleaf x 25-Feb-09
453 Crinum americana L. Amaryllidaceae 4 Obligate Seven sisters string lilly x x 27-Feb-09
495 Cupaniopsis anacardioides (A.Rich) Radlk. Sapindaceae 1 Non-native
FLEPPC(I) Carrotwood x x 1 27-Feb-09
435 Cyanthillium cinereum (L.)H. Rob. Asteraceae 3 Facultative Wet Little ironweed x 25-Feb-09 595 Cyperus croceus Vahl Cyperaceae 2 Facultative Baldwin's flatsedge x 30-Jun-09 575 Cyperus distinctus Steud. Cyperaceae 4 Obligate Swamp flatsedge x 23-Apr-09
534 Dalbergia ecastaphyllum (L.) Taub. Fabaceae 3 Facultative Wet+(NWI) Coinvine x 15-Apr-09
597 Desmodium incanum DC. Fabaceae Non-native Zarzabacoa comun, beggar's ticks x 30-Jun-09
442 Desmodium incanum DC. Fabaceae 1 Non-native Zarzabacoa comun, beggar's ticks x 27-Feb-09
563 Dichanthelium commutatum (Schult.) Gould Poaceae 2 Facultative Variable witchgrass x x 23-Apr-09
593 Dichanthelium laxiflorum Gould Poaceae 1 Native Rough witchgrass x x 30-Jun-09
536 Dichanthelium portoricense (Desv. Ex Ham.) B.F. Hansen Poaceae 1 Facultative
Upland Hemlock witchgrass x 15-Apr-09
a. Dark green shading indicates mounted species. b. Light green shading indicates duplicate specimens. Orange shading indicates the two specimens are different dates or locations. c. FDEP wetland status code. d. Source is Florida Department of Environmental Protection unless otherwise noted. Other sources are Florida Exotic Pest Plant Council (FLEPPC) I and II, and National Wetland Inventory (NWI). If just native or non-native is listed then no wetland status is available. e. FLEPPC invasive exotic categories.
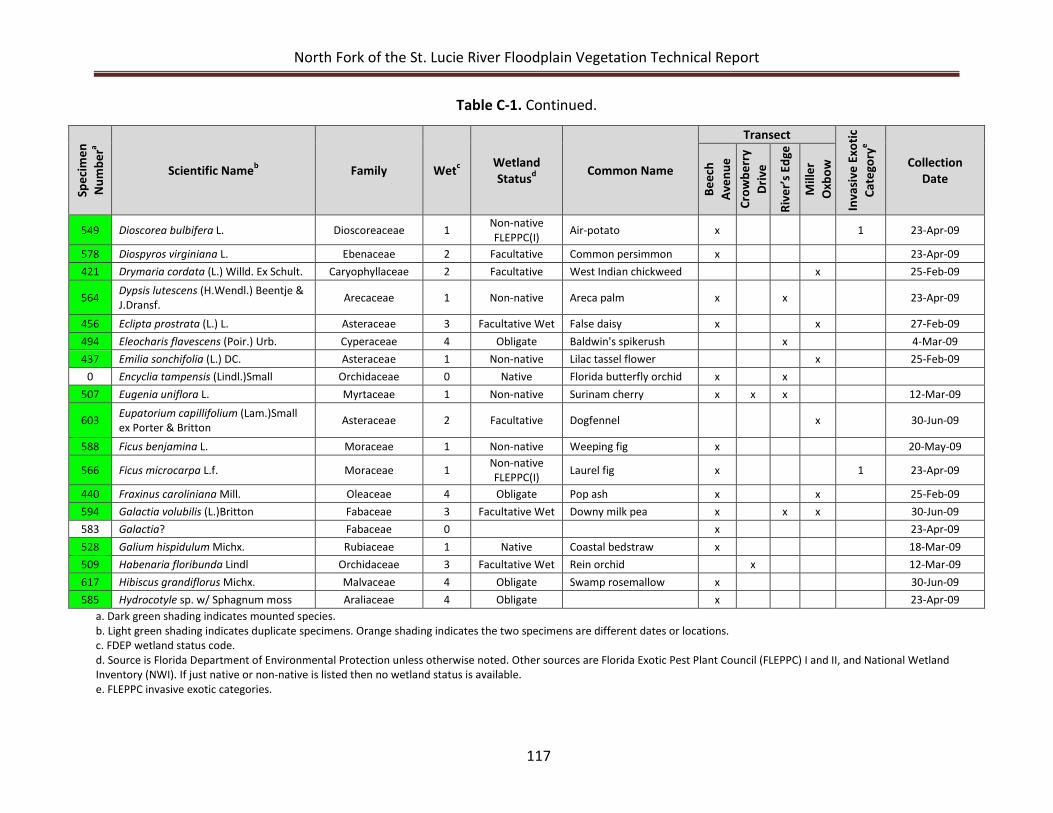
North Fork of the St. Lucie River Floodplain Vegetation Technical Report
117
Table C-1. Continued. Sp
ecim
en
Num
bera
Scientific Nameb Family Wetc Wetland Statusd Common Name
Transect
Inva
sive
Exo
tic
Cate
gory
e
Collection Date
Beec
h Av
enue
Cr
owbe
rry
Driv
e
Rive
r’s E
dge
Mill
er
Oxb
ow
549 Dioscorea bulbifera L. Dioscoreaceae 1 Non-native FLEPPC(I) Air-potato x 1 23-Apr-09
578 Diospyros virginiana L. Ebenaceae 2 Facultative Common persimmon x 23-Apr-09 421 Drymaria cordata (L.) Willd. Ex Schult. Caryophyllaceae 2 Facultative West Indian chickweed x 25-Feb-09
564 Dypsis lutescens (H.Wendl.) Beentje & J.Dransf. Arecaceae 1 Non-native Areca palm x x 23-Apr-09
456 Eclipta prostrata (L.) L. Asteraceae 3 Facultative Wet False daisy x x 27-Feb-09 494 Eleocharis flavescens (Poir.) Urb. Cyperaceae 4 Obligate Baldwin's spikerush x 4-Mar-09 437 Emilia sonchifolia (L.) DC. Asteraceae 1 Non-native Lilac tassel flower x 25-Feb-09
0 Encyclia tampensis (Lindl.)Small Orchidaceae 0 Native Florida butterfly orchid x x 507 Eugenia uniflora L. Myrtaceae 1 Non-native Surinam cherry x x x 12-Mar-09
603 Eupatorium capillifolium (Lam.)Small ex Porter & Britton Asteraceae 2 Facultative Dogfennel x 30-Jun-09
588 Ficus benjamina L. Moraceae 1 Non-native Weeping fig x 20-May-09
566 Ficus microcarpa L.f. Moraceae 1 Non-native FLEPPC(I) Laurel fig x 1 23-Apr-09
440 Fraxinus caroliniana Mill. Oleaceae 4 Obligate Pop ash x x 25-Feb-09 594 Galactia volubilis (L.)Britton Fabaceae 3 Facultative Wet Downy milk pea x x x 30-Jun-09 583 Galactia? Fabaceae 0 x 23-Apr-09 528 Galium hispidulum Michx. Rubiaceae 1 Native Coastal bedstraw x 18-Mar-09 509 Habenaria floribunda Lindl Orchidaceae 3 Facultative Wet Rein orchid x 12-Mar-09 617 Hibiscus grandiflorus Michx. Malvaceae 4 Obligate Swamp rosemallow x 30-Jun-09 585 Hydrocotyle sp. w/ Sphagnum moss Araliaceae 4 Obligate x 23-Apr-09
a. Dark green shading indicates mounted species. b. Light green shading indicates duplicate specimens. Orange shading indicates the two specimens are different dates or locations. c. FDEP wetland status code. d. Source is Florida Department of Environmental Protection unless otherwise noted. Other sources are Florida Exotic Pest Plant Council (FLEPPC) I and II, and National Wetland Inventory (NWI). If just native or non-native is listed then no wetland status is available. e. FLEPPC invasive exotic categories.
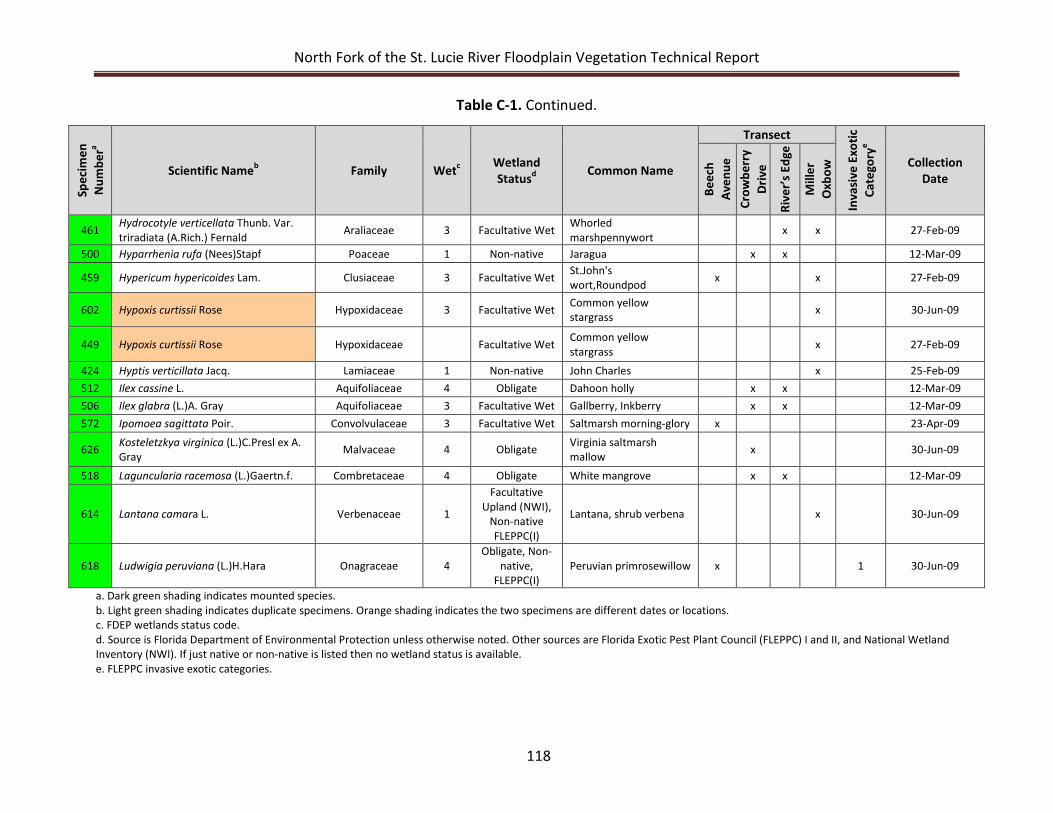
North Fork of the St. Lucie River Floodplain Vegetation Technical Report
118
Table C-1. Continued. Sp
ecim
en
Num
bera
Scientific Nameb Family Wetc Wetland Statusd Common Name
Transect
Inva
sive
Exo
tic
Cate
gory
e
Collection Date
Beec
h Av
enue
Cr
owbe
rry
Driv
e
Rive
r’s E
dge
Mill
er
Oxb
ow
461 Hydrocotyle verticellata Thunb. Var. triradiata (A.Rich.) Fernald Araliaceae 3 Facultative Wet Whorled
marshpennywort x x 27-Feb-09
500 Hyparrhenia rufa (Nees)Stapf Poaceae 1 Non-native Jaragua x x 12-Mar-09
459 Hypericum hypericoides Lam. Clusiaceae 3 Facultative Wet St.John's wort,Roundpod x x 27-Feb-09
602 Hypoxis curtissii Rose Hypoxidaceae 3 Facultative Wet Common yellow stargrass x 30-Jun-09
449 Hypoxis curtissii Rose Hypoxidaceae Facultative Wet Common yellow stargrass x 27-Feb-09
424 Hyptis verticillata Jacq. Lamiaceae 1 Non-native John Charles x 25-Feb-09 512 Ilex cassine L. Aquifoliaceae 4 Obligate Dahoon holly x x 12-Mar-09 506 Ilex glabra (L.)A. Gray Aquifoliaceae 3 Facultative Wet Gallberry, Inkberry x x 12-Mar-09 572 Ipomoea sagittata Poir. Convolvulaceae 3 Facultative Wet Saltmarsh morning-glory x 23-Apr-09
626 Kosteletzkya virginica (L.)C.Presl ex A. Gray Malvaceae 4 Obligate Virginia saltmarsh
mallow x 30-Jun-09
518 Laguncularia racemosa (L.)Gaertn.f. Combretaceae 4 Obligate White mangrove x x 12-Mar-09
614 Lantana camara L. Verbenaceae 1
Facultative Upland (NWI),
Non-native FLEPPC(I)
Lantana, shrub verbena x 30-Jun-09
618 Ludwigia peruviana (L.)H.Hara Onagraceae 4 Obligate, Non-
native, FLEPPC(I)
Peruvian primrosewillow x 1 30-Jun-09
a. Dark green shading indicates mounted species. b. Light green shading indicates duplicate specimens. Orange shading indicates the two specimens are different dates or locations. c. FDEP wetlands status code. d. Source is Florida Department of Environmental Protection unless otherwise noted. Other sources are Florida Exotic Pest Plant Council (FLEPPC) I and II, and National Wetland Inventory (NWI). If just native or non-native is listed then no wetland status is available. e. FLEPPC invasive exotic categories.
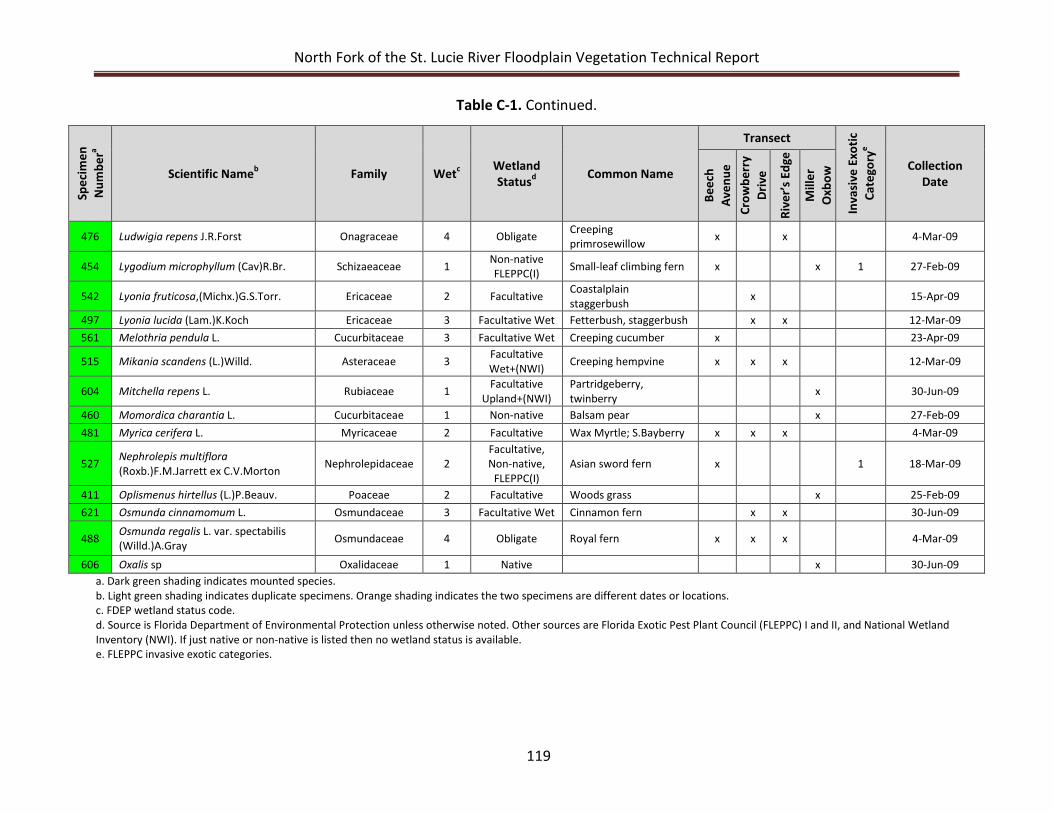
North Fork of the St. Lucie River Floodplain Vegetation Technical Report
119
Table C-1. Continued. Sp
ecim
en
Num
bera
Scientific Nameb Family Wetc Wetland Statusd Common Name
Transect
Inva
sive
Exo
tic
Cate
gory
e
Collection Date
Beec
h Av
enue
Cr
owbe
rry
Driv
e
Rive
r’s E
dge
Mill
er
Oxb
ow
476 Ludwigia repens J.R.Forst Onagraceae 4 Obligate Creeping primrosewillow x x 4-Mar-09
454 Lygodium microphyllum (Cav)R.Br. Schizaeaceae 1 Non-native FLEPPC(I) Small-leaf climbing fern x x 1 27-Feb-09
542 Lyonia fruticosa,(Michx.)G.S.Torr. Ericaceae 2 Facultative Coastalplain staggerbush x 15-Apr-09
497 Lyonia lucida (Lam.)K.Koch Ericaceae 3 Facultative Wet Fetterbush, staggerbush x x 12-Mar-09 561 Melothria pendula L. Cucurbitaceae 3 Facultative Wet Creeping cucumber x 23-Apr-09
515 Mikania scandens (L.)Willd. Asteraceae 3 Facultative Wet+(NWI) Creeping hempvine x x x 12-Mar-09
604 Mitchella repens L. Rubiaceae 1 Facultative Upland+(NWI)
Partridgeberry, twinberry x 30-Jun-09
460 Momordica charantia L. Cucurbitaceae 1 Non-native Balsam pear x 27-Feb-09 481 Myrica cerifera L. Myricaceae 2 Facultative Wax Myrtle; S.Bayberry x x x 4-Mar-09
527 Nephrolepis multiflora (Roxb.)F.M.Jarrett ex C.V.Morton Nephrolepidaceae 2
Facultative, Non-native,
FLEPPC(I) Asian sword fern x 1 18-Mar-09
411 Oplismenus hirtellus (L.)P.Beauv. Poaceae 2 Facultative Woods grass x 25-Feb-09 621 Osmunda cinnamomum L. Osmundaceae 3 Facultative Wet Cinnamon fern x x 30-Jun-09
488 Osmunda regalis L. var. spectabilis (Willd.)A.Gray Osmundaceae 4 Obligate Royal fern x x x 4-Mar-09
606 Oxalis sp Oxalidaceae 1 Native x 30-Jun-09 a. Dark green shading indicates mounted species. b. Light green shading indicates duplicate specimens. Orange shading indicates the two specimens are different dates or locations. c. FDEP wetland status code. d. Source is Florida Department of Environmental Protection unless otherwise noted. Other sources are Florida Exotic Pest Plant Council (FLEPPC) I and II, and National Wetland Inventory (NWI). If just native or non-native is listed then no wetland status is available. e. FLEPPC invasive exotic categories.
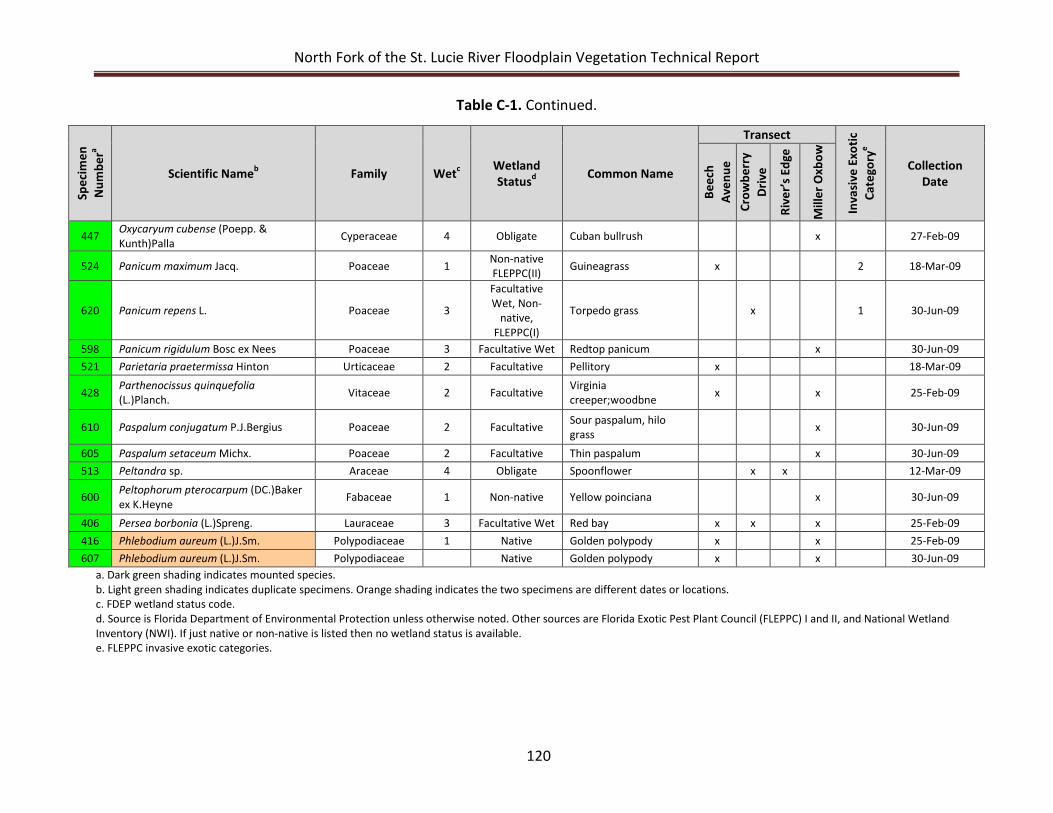
North Fork of the St. Lucie River Floodplain Vegetation Technical Report
120
Table C-1. Continued. Sp
ecim
en
Num
bera
Scientific Nameb Family Wetc Wetland Statusd Common Name
Transect
Inva
sive
Exo
tic
Cate
gory
e
Collection Date
Beec
h Av
enue
Cr
owbe
rry
Driv
e
Rive
r’s E
dge
Mill
er O
xbow
447 Oxycaryum cubense (Poepp. & Kunth)Palla Cyperaceae 4 Obligate Cuban bullrush x 27-Feb-09
524 Panicum maximum Jacq. Poaceae 1 Non-native FLEPPC(II) Guineagrass x 2 18-Mar-09
620 Panicum repens L. Poaceae 3
Facultative Wet, Non-
native, FLEPPC(I)
Torpedo grass x 1 30-Jun-09
598 Panicum rigidulum Bosc ex Nees Poaceae 3 Facultative Wet Redtop panicum x 30-Jun-09 521 Parietaria praetermissa Hinton Urticaceae 2 Facultative Pellitory x 18-Mar-09
428 Parthenocissus quinquefolia (L.)Planch. Vitaceae 2 Facultative Virginia
creeper;woodbne x x 25-Feb-09
610 Paspalum conjugatum P.J.Bergius Poaceae 2 Facultative Sour paspalum, hilo grass x 30-Jun-09
605 Paspalum setaceum Michx. Poaceae 2 Facultative Thin paspalum x 30-Jun-09 513 Peltandra sp. Araceae 4 Obligate Spoonflower x x 12-Mar-09
600 Peltophorum pterocarpum (DC.)Baker ex K.Heyne Fabaceae 1 Non-native Yellow poinciana x 30-Jun-09
406 Persea borbonia (L.)Spreng. Lauraceae 3 Facultative Wet Red bay x x x 25-Feb-09 416 Phlebodium aureum (L.)J.Sm. Polypodiaceae 1 Native Golden polypody x x 25-Feb-09 607 Phlebodium aureum (L.)J.Sm. Polypodiaceae Native Golden polypody x x 30-Jun-09
a. Dark green shading indicates mounted species. b. Light green shading indicates duplicate specimens. Orange shading indicates the two specimens are different dates or locations. c. FDEP wetland status code. d. Source is Florida Department of Environmental Protection unless otherwise noted. Other sources are Florida Exotic Pest Plant Council (FLEPPC) I and II, and National Wetland Inventory (NWI). If just native or non-native is listed then no wetland status is available. e. FLEPPC invasive exotic categories.
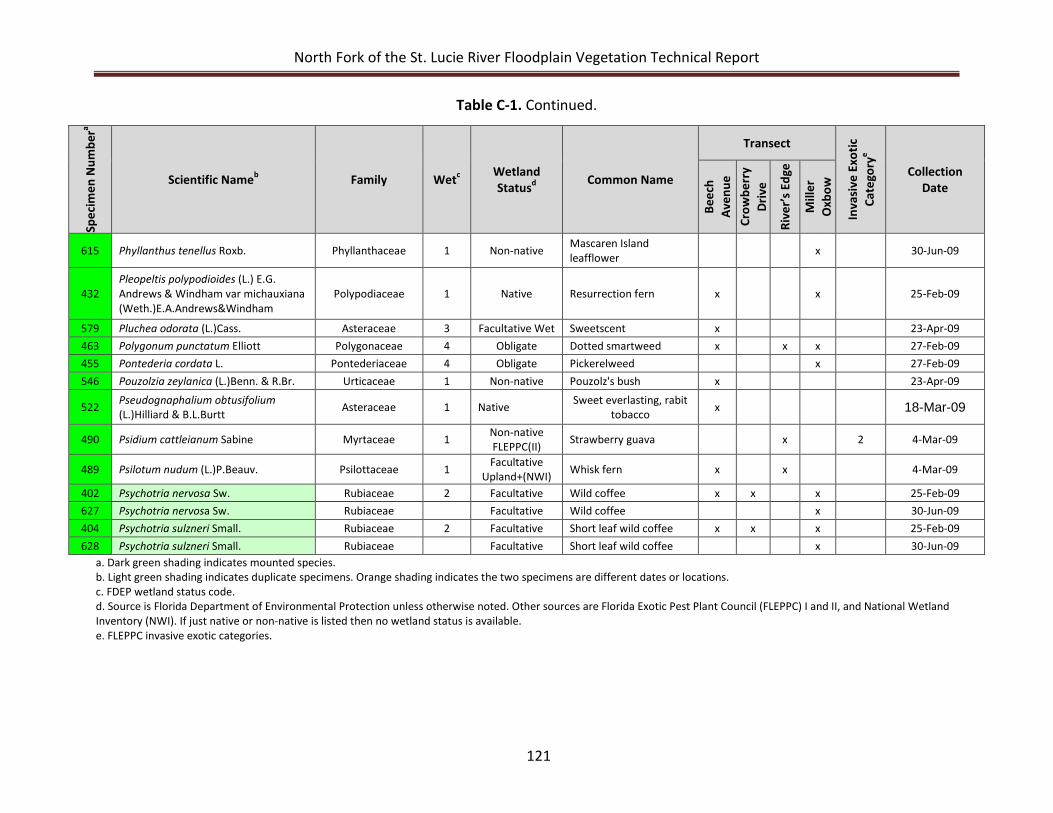
North Fork of the St. Lucie River Floodplain Vegetation Technical Report
121
Table C-1. Continued. Sp
ecim
en N
umbe
ra
Scientific Nameb Family Wetc Wetland Statusd Common Name
Transect
Inva
sive
Exo
tic
Cate
gory
e
Collection Date
Beec
h Av
enue
Cr
owbe
rry
Driv
e
Rive
r’s E
dge
Mill
er
Oxb
ow
615 Phyllanthus tenellus Roxb. Phyllanthaceae 1 Non-native Mascaren Island leafflower x 30-Jun-09
432 Pleopeltis polypodioides (L.) E.G. Andrews & Windham var michauxiana (Weth.)E.A.Andrews&Windham
Polypodiaceae 1 Native Resurrection fern x x 25-Feb-09
579 Pluchea odorata (L.)Cass. Asteraceae 3 Facultative Wet Sweetscent x 23-Apr-09 463 Polygonum punctatum Elliott Polygonaceae 4 Obligate Dotted smartweed x x x 27-Feb-09 455 Pontederia cordata L. Pontederiaceae 4 Obligate Pickerelweed x 27-Feb-09 546 Pouzolzia zeylanica (L.)Benn. & R.Br. Urticaceae 1 Non-native Pouzolz's bush x 23-Apr-09
522 Pseudognaphalium obtusifolium (L.)Hilliard & B.L.Burtt Asteraceae 1 Native Sweet everlasting, rabit
tobacco x 18-Mar-09
490 Psidium cattleianum Sabine Myrtaceae 1 Non-native FLEPPC(II) Strawberry guava x 2 4-Mar-09
489 Psilotum nudum (L.)P.Beauv. Psilottaceae 1 Facultative Upland+(NWI) Whisk fern x x 4-Mar-09
402 Psychotria nervosa Sw. Rubiaceae 2 Facultative Wild coffee x x x 25-Feb-09 627 Psychotria nervosa Sw. Rubiaceae Facultative Wild coffee x 30-Jun-09 404 Psychotria sulzneri Small. Rubiaceae 2 Facultative Short leaf wild coffee x x x 25-Feb-09 628 Psychotria sulzneri Small. Rubiaceae Facultative Short leaf wild coffee x 30-Jun-09
a. Dark green shading indicates mounted species. b. Light green shading indicates duplicate specimens. Orange shading indicates the two specimens are different dates or locations. c. FDEP wetland status code. d. Source is Florida Department of Environmental Protection unless otherwise noted. Other sources are Florida Exotic Pest Plant Council (FLEPPC) I and II, and National Wetland Inventory (NWI). If just native or non-native is listed then no wetland status is available. e. FLEPPC invasive exotic categories.
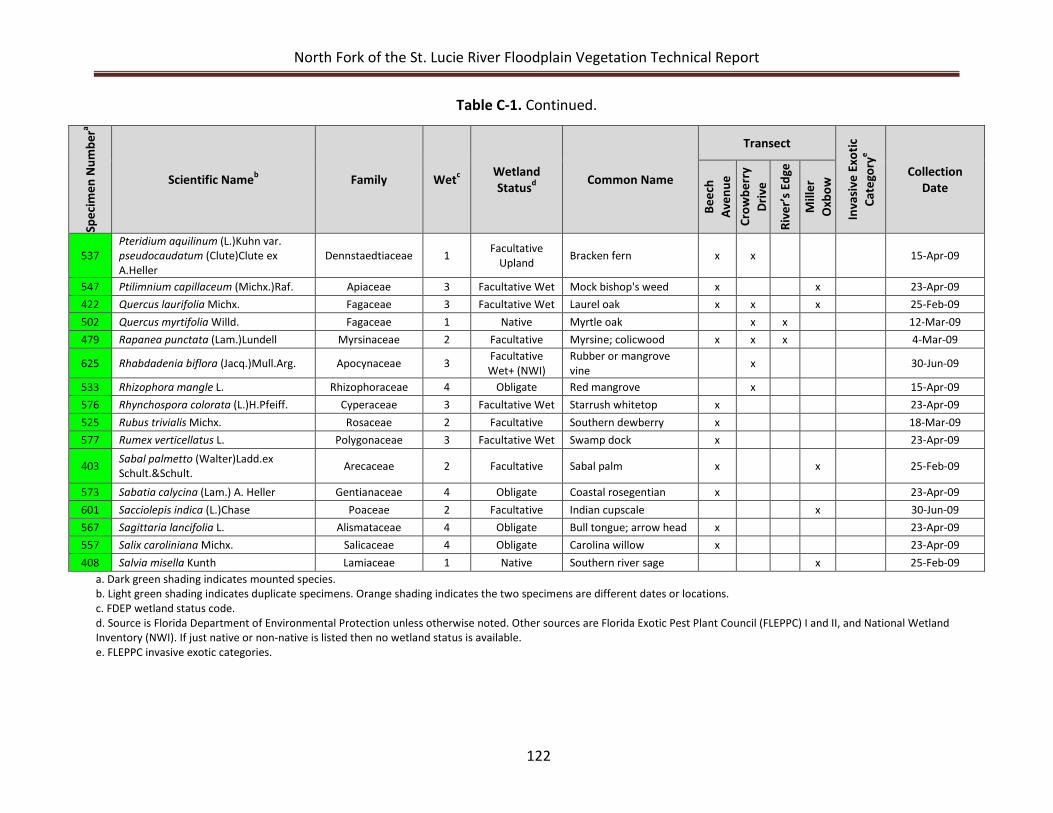
North Fork of the St. Lucie River Floodplain Vegetation Technical Report
122
Table C-1. Continued. Sp
ecim
en N
umbe
ra
Scientific Nameb Family Wetc Wetland Statusd Common Name
Transect
Inva
sive
Exo
tic
Cate
gory
e
Collection Date
Beec
h Av
enue
Cr
owbe
rry
Driv
e
Rive
r’s E
dge
Mill
er
Oxb
ow
537 Pteridium aquilinum (L.)Kuhn var. pseudocaudatum (Clute)Clute ex A.Heller
Dennstaedtiaceae 1 Facultative Upland Bracken fern x x 15-Apr-09
547 Ptilimnium capillaceum (Michx.)Raf. Apiaceae 3 Facultative Wet Mock bishop's weed x x 23-Apr-09 422 Quercus laurifolia Michx. Fagaceae 3 Facultative Wet Laurel oak x x x 25-Feb-09 502 Quercus myrtifolia Willd. Fagaceae 1 Native Myrtle oak x x 12-Mar-09 479 Rapanea punctata (Lam.)Lundell Myrsinaceae 2 Facultative Myrsine; colicwood x x x 4-Mar-09
625 Rhabdadenia biflora (Jacq.)Mull.Arg. Apocynaceae 3 Facultative Wet+ (NWI)
Rubber or mangrove vine x 30-Jun-09
533 Rhizophora mangle L. Rhizophoraceae 4 Obligate Red mangrove x 15-Apr-09 576 Rhynchospora colorata (L.)H.Pfeiff. Cyperaceae 3 Facultative Wet Starrush whitetop x 23-Apr-09 525 Rubus trivialis Michx. Rosaceae 2 Facultative Southern dewberry x 18-Mar-09 577 Rumex verticellatus L. Polygonaceae 3 Facultative Wet Swamp dock x 23-Apr-09
403 Sabal palmetto (Walter)Ladd.ex Schult.&Schult. Arecaceae 2 Facultative Sabal palm x x 25-Feb-09
573 Sabatia calycina (Lam.) A. Heller Gentianaceae 4 Obligate Coastal rosegentian x 23-Apr-09 601 Sacciolepis indica (L.)Chase Poaceae 2 Facultative Indian cupscale x 30-Jun-09 567 Sagittaria lancifolia L. Alismataceae 4 Obligate Bull tongue; arrow head x 23-Apr-09 557 Salix caroliniana Michx. Salicaceae 4 Obligate Carolina willow x 23-Apr-09 408 Salvia misella Kunth Lamiaceae 1 Native Southern river sage x 25-Feb-09
a. Dark green shading indicates mounted species. b. Light green shading indicates duplicate specimens. Orange shading indicates the two specimens are different dates or locations. c. FDEP wetland status code. d. Source is Florida Department of Environmental Protection unless otherwise noted. Other sources are Florida Exotic Pest Plant Council (FLEPPC) I and II, and National Wetland Inventory (NWI). If just native or non-native is listed then no wetland status is available. e. FLEPPC invasive exotic categories.
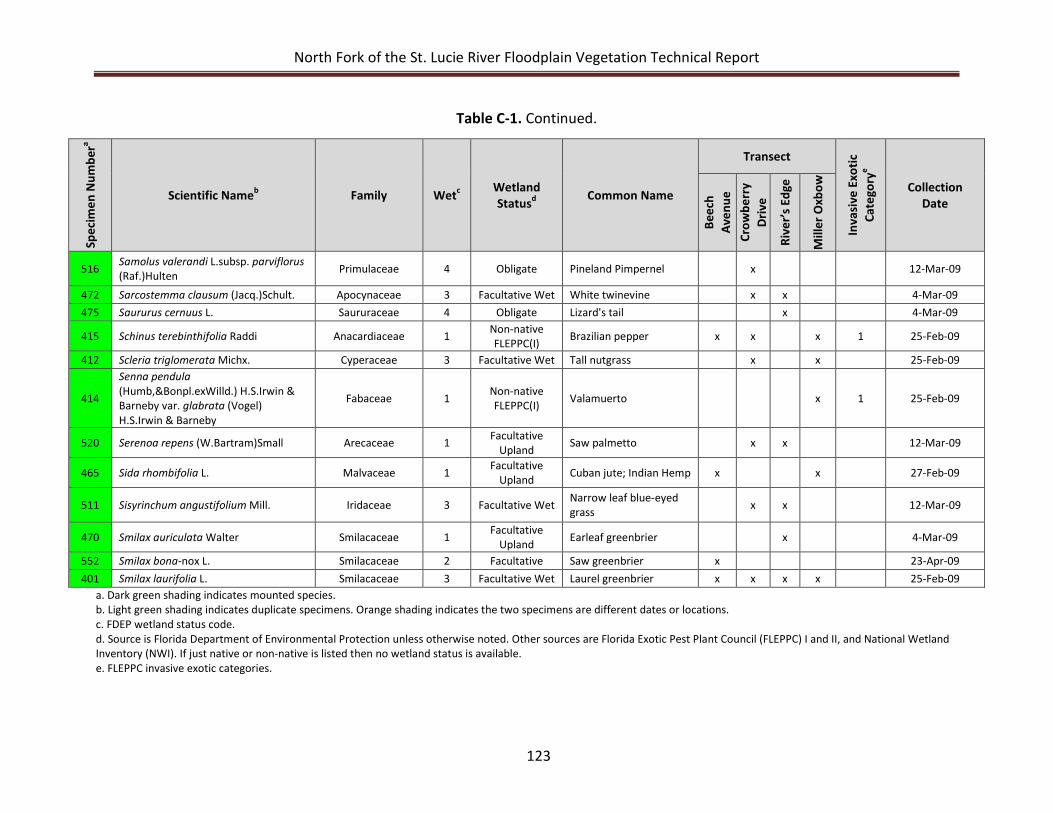
North Fork of the St. Lucie River Floodplain Vegetation Technical Report
123
Table C-1. Continued.
Spec
imen
Num
bera
Scientific Nameb Family Wetc Wetland Statusd Common Name
Transect
Inva
sive
Exo
tic
Cate
gory
e
Collection Date
Beec
h Av
enue
Cr
owbe
rry
Driv
e
Rive
r’s E
dge
Mill
er O
xbow
516 Samolus valerandi L.subsp. parviflorus (Raf.)Hulten Primulaceae 4 Obligate Pineland Pimpernel x 12-Mar-09
472 Sarcostemma clausum (Jacq.)Schult. Apocynaceae 3 Facultative Wet White twinevine x x 4-Mar-09 475 Saururus cernuus L. Saururaceae 4 Obligate Lizard's tail x 4-Mar-09
415 Schinus terebinthifolia Raddi Anacardiaceae 1 Non-native FLEPPC(I) Brazilian pepper x x x 1 25-Feb-09
412 Scleria triglomerata Michx. Cyperaceae 3 Facultative Wet Tall nutgrass x x 25-Feb-09
414
Senna pendula (Humb,&Bonpl.exWilld.) H.S.Irwin & Barneby var. glabrata (Vogel) H.S.Irwin & Barneby
Fabaceae 1 Non-native FLEPPC(I) Valamuerto x 1 25-Feb-09
520 Serenoa repens (W.Bartram)Small Arecaceae 1 Facultative Upland Saw palmetto x x 12-Mar-09
465 Sida rhombifolia L. Malvaceae 1 Facultative Upland Cuban jute; Indian Hemp x x 27-Feb-09
511 Sisyrinchum angustifolium Mill. Iridaceae 3 Facultative Wet Narrow leaf blue-eyed grass x x 12-Mar-09
470 Smilax auriculata Walter Smilacaceae 1 Facultative Upland Earleaf greenbrier x 4-Mar-09
552 Smilax bona-nox L. Smilacaceae 2 Facultative Saw greenbrier x 23-Apr-09 401 Smilax laurifolia L. Smilacaceae 3 Facultative Wet Laurel greenbrier x x x x 25-Feb-09
a. Dark green shading indicates mounted species. b. Light green shading indicates duplicate specimens. Orange shading indicates the two specimens are different dates or locations. c. FDEP wetland status code. d. Source is Florida Department of Environmental Protection unless otherwise noted. Other sources are Florida Exotic Pest Plant Council (FLEPPC) I and II, and National Wetland Inventory (NWI). If just native or non-native is listed then no wetland status is available. e. FLEPPC invasive exotic categories.
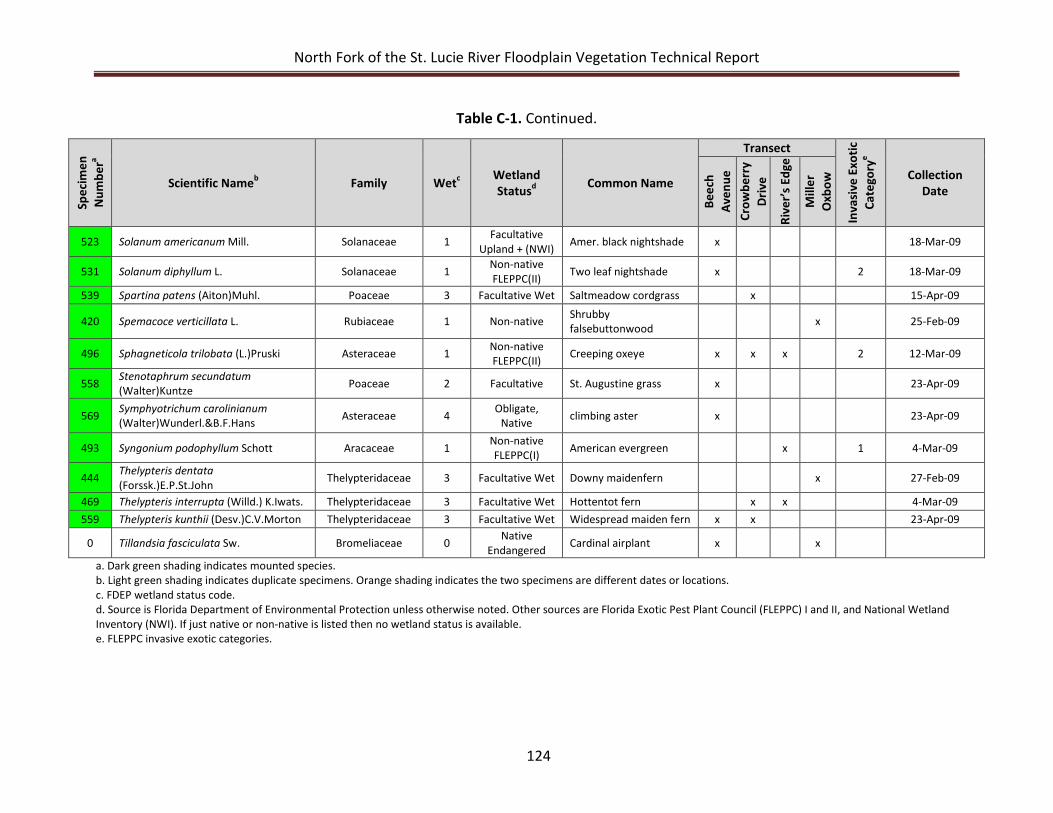
North Fork of the St. Lucie River Floodplain Vegetation Technical Report
124
Table C-1. Continued.
Spec
imen
N
umbe
ra
Scientific Nameb Family Wetc Wetland Statusd Common Name
Transect
Inva
sive
Exo
tic
Cate
gory
e
Collection Date
Beec
h Av
enue
Cr
owbe
rry
Driv
e
Rive
r’s E
dge
Mill
er
Oxb
ow
523 Solanum americanum Mill. Solanaceae 1 Facultative Upland + (NWI) Amer. black nightshade x 18-Mar-09
531 Solanum diphyllum L. Solanaceae 1 Non-native FLEPPC(II) Two leaf nightshade x 2 18-Mar-09
539 Spartina patens (Aiton)Muhl. Poaceae 3 Facultative Wet Saltmeadow cordgrass x 15-Apr-09
420 Spemacoce verticillata L. Rubiaceae 1 Non-native Shrubby falsebuttonwood x 25-Feb-09
496 Sphagneticola trilobata (L.)Pruski Asteraceae 1 Non-native FLEPPC(II) Creeping oxeye x x x 2 12-Mar-09
558 Stenotaphrum secundatum (Walter)Kuntze Poaceae 2 Facultative St. Augustine grass x 23-Apr-09
569 Symphyotrichum carolinianum (Walter)Wunderl.&B.F.Hans Asteraceae 4 Obligate,
Native climbing aster x 23-Apr-09
493 Syngonium podophyllum Schott Aracaceae 1 Non-native FLEPPC(I) American evergreen x 1 4-Mar-09
444 Thelypteris dentata (Forssk.)E.P.St.John Thelypteridaceae 3 Facultative Wet Downy maidenfern x 27-Feb-09
469 Thelypteris interrupta (Willd.) K.Iwats. Thelypteridaceae 3 Facultative Wet Hottentot fern x x 4-Mar-09 559 Thelypteris kunthii (Desv.)C.V.Morton Thelypteridaceae 3 Facultative Wet Widespread maiden fern x x 23-Apr-09
0 Tillandsia fasciculata Sw. Bromeliaceae 0 Native Endangered Cardinal airplant x x
a. Dark green shading indicates mounted species. b. Light green shading indicates duplicate specimens. Orange shading indicates the two specimens are different dates or locations. c. FDEP wetland status code. d. Source is Florida Department of Environmental Protection unless otherwise noted. Other sources are Florida Exotic Pest Plant Council (FLEPPC) I and II, and National Wetland Inventory (NWI). If just native or non-native is listed then no wetland status is available. e. FLEPPC invasive exotic categories.
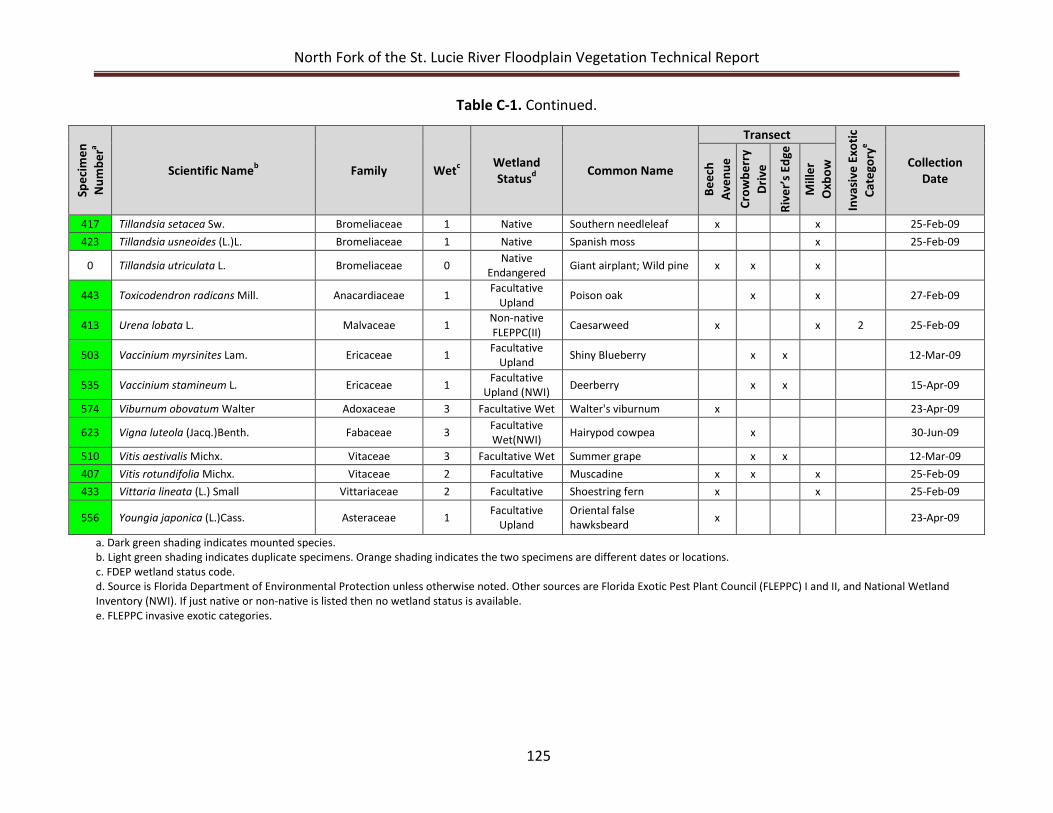
North Fork of the St. Lucie River Floodplain Vegetation Technical Report
125
Table C-1. Continued. Sp
ecim
en
Num
bera
Scientific Nameb Family Wetc Wetland Statusd Common Name
Transect
Inva
sive
Exo
tic
Cate
gory
e
Collection Date
Beec
h Av
enue
Cr
owbe
rry
Driv
e
Rive
r’s E
dge
Mill
er
Oxb
ow
417 Tillandsia setacea Sw. Bromeliaceae 1 Native Southern needleleaf x x 25-Feb-09 423 Tillandsia usneoides (L.)L. Bromeliaceae 1 Native Spanish moss x 25-Feb-09
0 Tillandsia utriculata L. Bromeliaceae 0 Native Endangered Giant airplant; Wild pine x x x
443 Toxicodendron radicans Mill. Anacardiaceae 1 Facultative Upland Poison oak x x 27-Feb-09
413 Urena lobata L. Malvaceae 1 Non-native FLEPPC(II) Caesarweed x x 2 25-Feb-09
503 Vaccinium myrsinites Lam. Ericaceae 1 Facultative Upland Shiny Blueberry x x 12-Mar-09
535 Vaccinium stamineum L. Ericaceae 1 Facultative Upland (NWI) Deerberry x x 15-Apr-09
574 Viburnum obovatum Walter Adoxaceae 3 Facultative Wet Walter's viburnum x 23-Apr-09
623 Vigna luteola (Jacq.)Benth. Fabaceae 3 Facultative Wet(NWI) Hairypod cowpea x 30-Jun-09
510 Vitis aestivalis Michx. Vitaceae 3 Facultative Wet Summer grape x x 12-Mar-09 407 Vitis rotundifolia Michx. Vitaceae 2 Facultative Muscadine x x x 25-Feb-09 433 Vittaria lineata (L.) Small Vittariaceae 2 Facultative Shoestring fern x x 25-Feb-09
556 Youngia japonica (L.)Cass. Asteraceae 1 Facultative Upland
Oriental false hawksbeard x 23-Apr-09
a. Dark green shading indicates mounted species. b. Light green shading indicates duplicate specimens. Orange shading indicates the two specimens are different dates or locations. c. FDEP wetland status code. d. Source is Florida Department of Environmental Protection unless otherwise noted. Other sources are Florida Exotic Pest Plant Council (FLEPPC) I and II, and National Wetland Inventory (NWI). If just native or non-native is listed then no wetland status is available. e. FLEPPC invasive exotic categories.
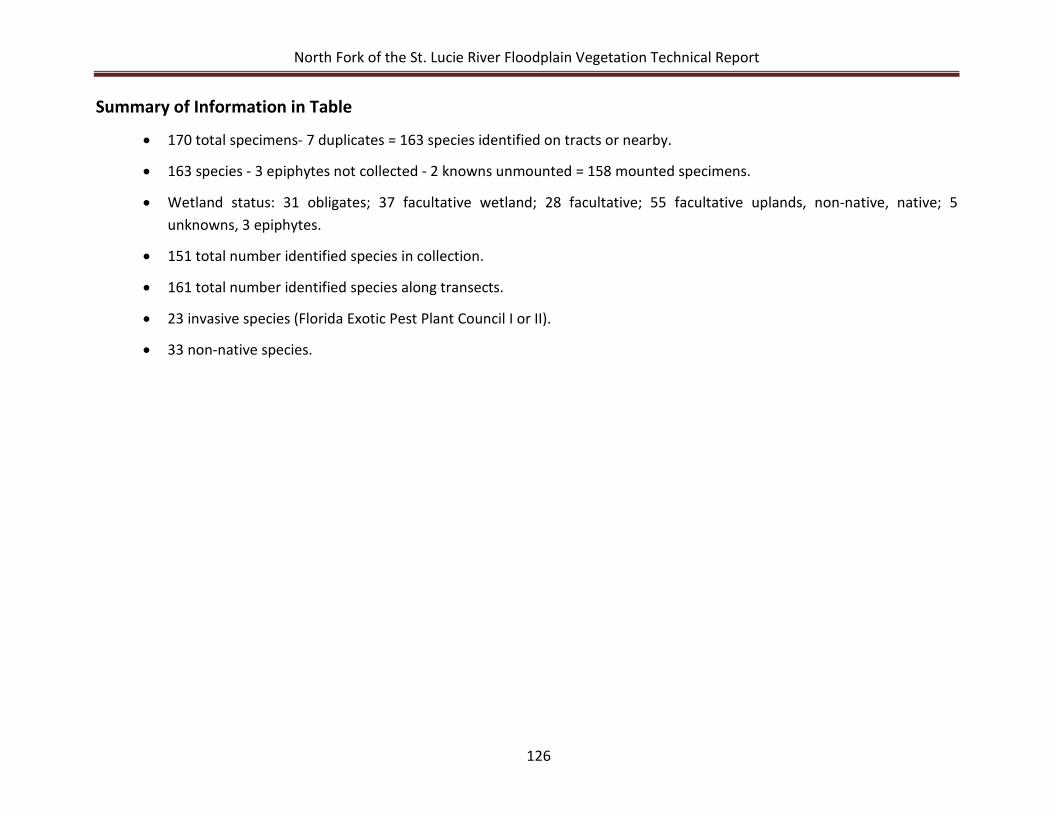
North Fork of the St. Lucie River Floodplain Vegetation Technical Report
126
Summary of Information in Table
• 170 total specimens- 7 duplicates = 163 species identified on tracts or nearby.
• 163 species - 3 epiphytes not collected - 2 knowns unmounted = 158 mounted specimens.
• Wetland status: 31 obligates; 37 facultative wetland; 28 facultative; 55 facultative uplands, non-native, native; 5 unknowns, 3 epiphytes.
• 151 total number identified species in collection.
• 161 total number identified species along transects.
• 23 invasive species (Florida Exotic Pest Plant Council I or II).
• 33 non-native species.
North Fork of the St. Lucie River Floodplain Vegetation Technical Report
127
APPENDIX D: MAJOR SOILS, SOIL ELECTRICAL CONDUCTIVITY AND SOIL
MOISTURE ON THE NORTH FORK ST. LUCIE RIVER FLOODPLAIN
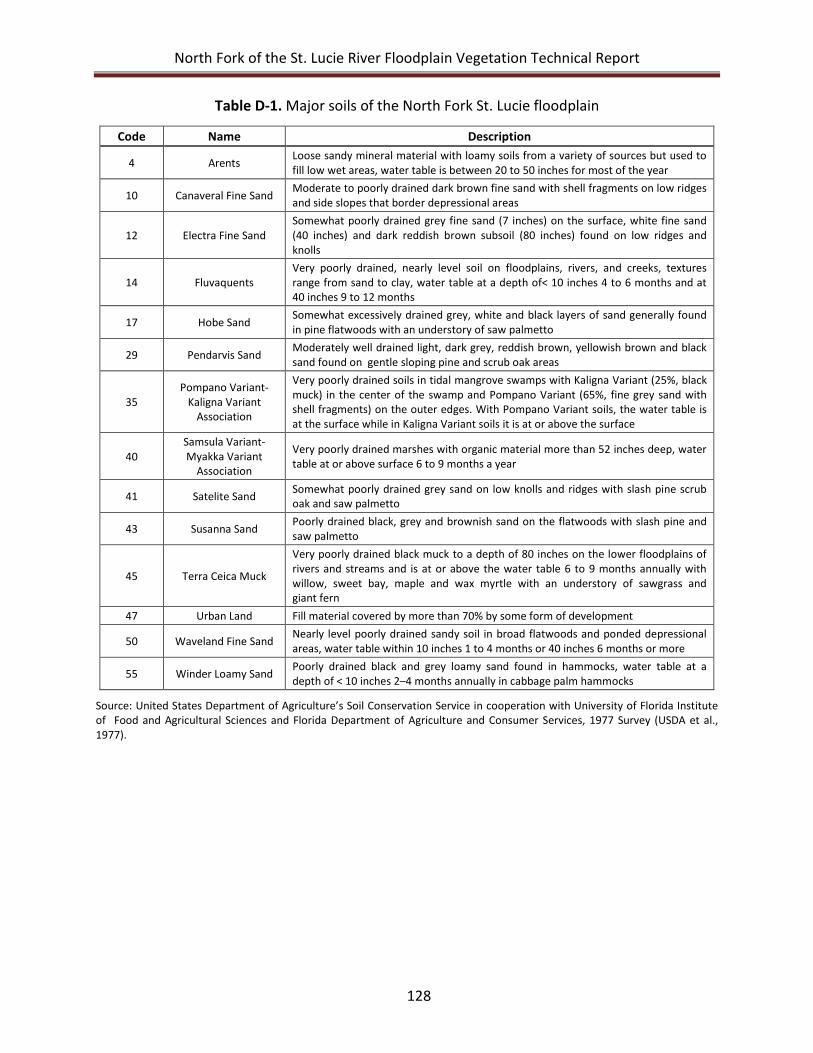
North Fork of the St. Lucie River Floodplain Vegetation Technical Report
128
Table D-1. Major soils of the North Fork St. Lucie floodplain
Code Name Description
4 Arents Loose sandy mineral material with loamy soils from a variety of sources but used to fill low wet areas, water table is between 20 to 50 inches for most of the year
10 Canaveral Fine Sand Moderate to poorly drained dark brown fine sand with shell fragments on low ridges and side slopes that border depressional areas
12 Electra Fine Sand Somewhat poorly drained grey fine sand (7 inches) on the surface, white fine sand (40 inches) and dark reddish brown subsoil (80 inches) found on low ridges and knolls
14 Fluvaquents Very poorly drained, nearly level soil on floodplains, rivers, and creeks, textures range from sand to clay, water table at a depth of< 10 inches 4 to 6 months and at 40 inches 9 to 12 months
17 Hobe Sand Somewhat excessively drained grey, white and black layers of sand generally found in pine flatwoods with an understory of saw palmetto
29 Pendarvis Sand Moderately well drained light, dark grey, reddish brown, yellowish brown and black sand found on gentle sloping pine and scrub oak areas
35 Pompano Variant-
Kaligna Variant Association
Very poorly drained soils in tidal mangrove swamps with Kaligna Variant (25%, black muck) in the center of the swamp and Pompano Variant (65%, fine grey sand with shell fragments) on the outer edges. With Pompano Variant soils, the water table is at the surface while in Kaligna Variant soils it is at or above the surface
40 Samsula Variant-Myakka Variant
Association
Very poorly drained marshes with organic material more than 52 inches deep, water table at or above surface 6 to 9 months a year
41 Satelite Sand Somewhat poorly drained grey sand on low knolls and ridges with slash pine scrub oak and saw palmetto
43 Susanna Sand Poorly drained black, grey and brownish sand on the flatwoods with slash pine and saw palmetto
45 Terra Ceica Muck
Very poorly drained black muck to a depth of 80 inches on the lower floodplains of rivers and streams and is at or above the water table 6 to 9 months annually with willow, sweet bay, maple and wax myrtle with an understory of sawgrass and giant fern
47 Urban Land Fill material covered by more than 70% by some form of development
50 Waveland Fine Sand Nearly level poorly drained sandy soil in broad flatwoods and ponded depressional areas, water table within 10 inches 1 to 4 months or 40 inches 6 months or more
55 Winder Loamy Sand Poorly drained black and grey loamy sand found in hammocks, water table at a depth of < 10 inches 2–4 months annually in cabbage palm hammocks
Source: United States Department of Agriculture’s Soil Conservation Service in cooperation with University of Florida Institute of Food and Agricultural Sciences and Florida Department of Agriculture and Consumer Services, 1977 Survey (USDA et al., 1977).
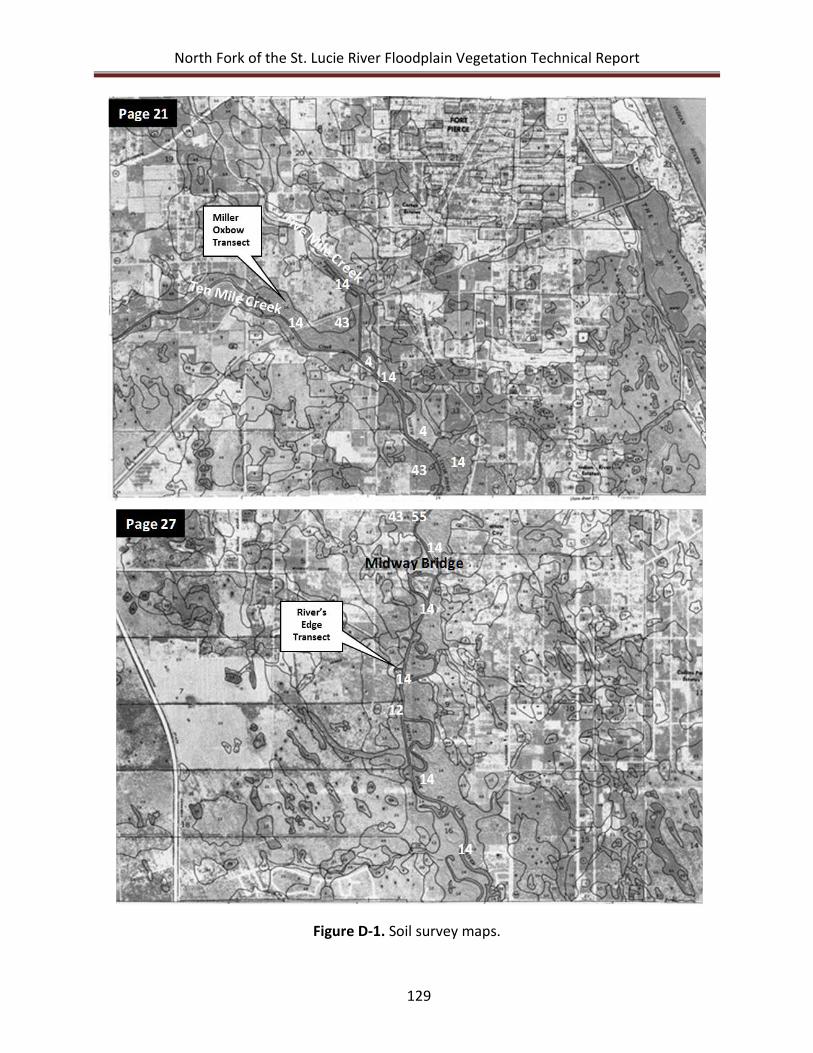
North Fork of the St. Lucie River Floodplain Vegetation Technical Report
129
Figure D-1. Soil survey maps.
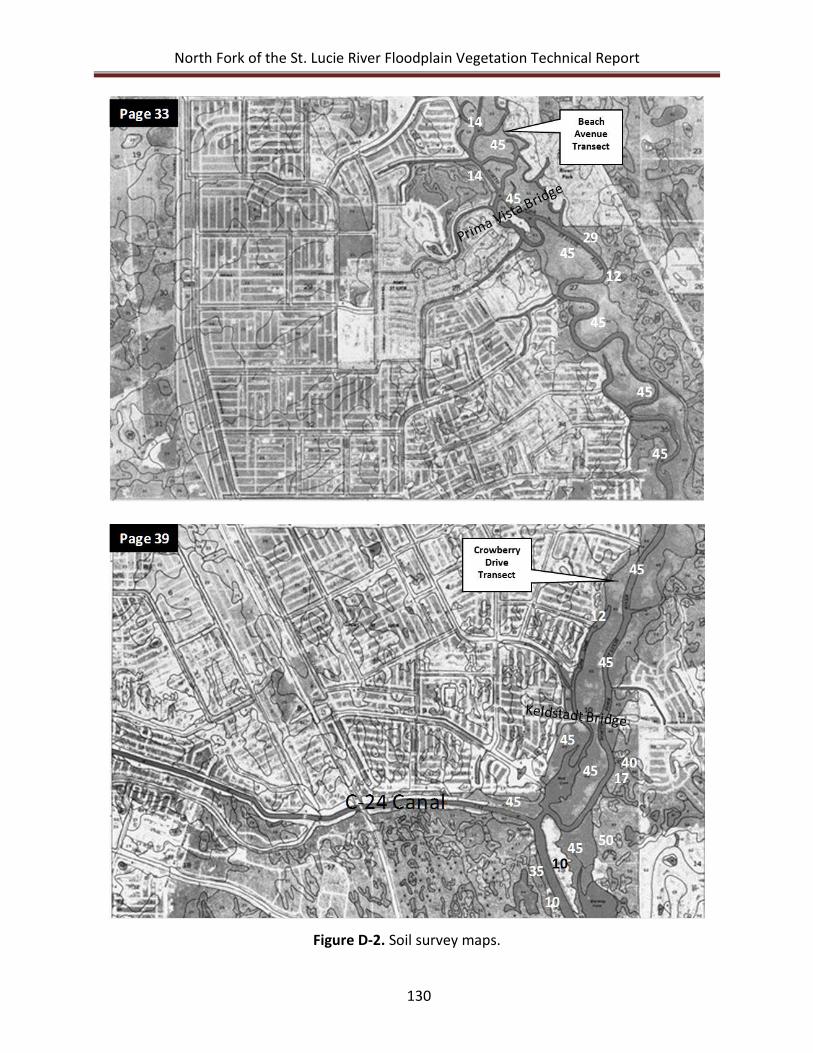
North Fork of the St. Lucie River Floodplain Vegetation Technical Report
130
Figure D-2. Soil survey maps.
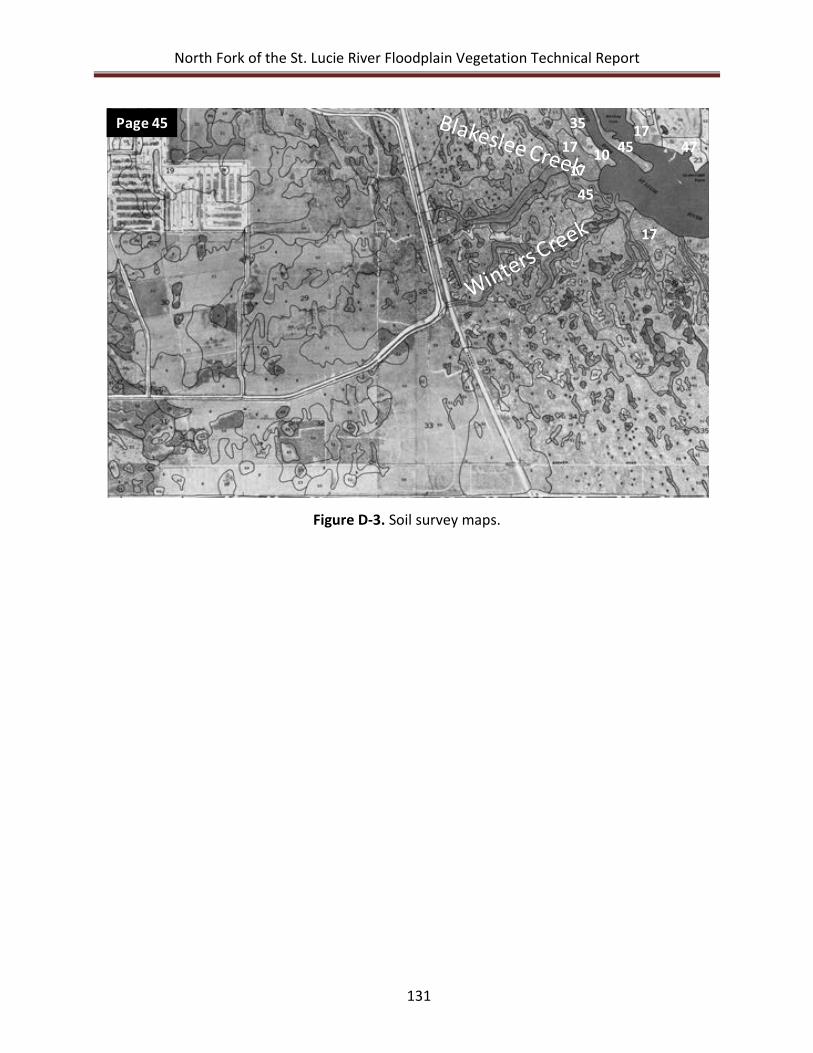
North Fork of the St. Lucie River Floodplain Vegetation Technical Report
131
Figure D-3. Soil survey maps.
Page 4545
35
1017
4717
45
17
17

North Fork of the St. Lucie River Floodplain Vegetation Technical Report
132
North Fork of the St. Lucie River Floodplain Vegetation Technical Report
133
APPENDIX E: NORTH FORK ST. LUCIE RIVER FLOODPLAIN SOIL ELECTRICAL
CONDUCTIVITY AND SOIL MOISTURE DATA SET
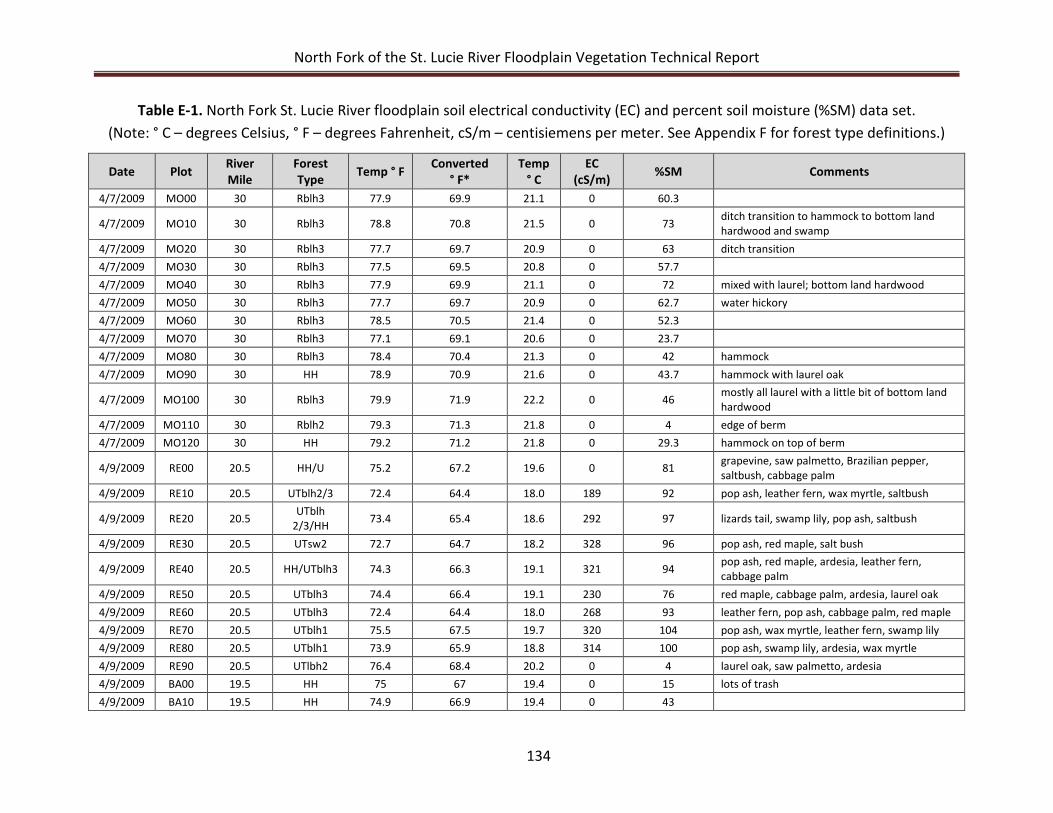
North Fork of the St. Lucie River Floodplain Vegetation Technical Report
134
Table E-1. North Fork St. Lucie River floodplain soil electrical conductivity (EC) and percent soil moisture (%SM) data set. (Note: ° C – degrees Celsius, ° F – degrees Fahrenheit, cS/m – centisiemens per meter. See Appendix F for forest type definitions.)
Date Plot River Mile
Forest Type Temp ° F Converted
° F* Temp
° C EC
(cS/m) %SM Comments
4/7/2009 MO00 30 Rblh3 77.9 69.9 21.1 0 60.3
4/7/2009 MO10 30 Rblh3 78.8 70.8 21.5 0 73 ditch transition to hammock to bottom land hardwood and swamp
4/7/2009 MO20 30 Rblh3 77.7 69.7 20.9 0 63 ditch transition 4/7/2009 MO30 30 Rblh3 77.5 69.5 20.8 0 57.7
4/7/2009 MO40 30 Rblh3 77.9 69.9 21.1 0 72 mixed with laurel; bottom land hardwood 4/7/2009 MO50 30 Rblh3 77.7 69.7 20.9 0 62.7 water hickory 4/7/2009 MO60 30 Rblh3 78.5 70.5 21.4 0 52.3
4/7/2009 MO70 30 Rblh3 77.1 69.1 20.6 0 23.7
4/7/2009 MO80 30 Rblh3 78.4 70.4 21.3 0 42 hammock 4/7/2009 MO90 30 HH 78.9 70.9 21.6 0 43.7 hammock with laurel oak
4/7/2009 MO100 30 Rblh3 79.9 71.9 22.2 0 46 mostly all laurel with a little bit of bottom land hardwood
4/7/2009 MO110 30 Rblh2 79.3 71.3 21.8 0 4 edge of berm 4/7/2009 MO120 30 HH 79.2 71.2 21.8 0 29.3 hammock on top of berm
4/9/2009 RE00 20.5 HH/U 75.2 67.2 19.6 0 81 grapevine, saw palmetto, Brazilian pepper, saltbush, cabbage palm
4/9/2009 RE10 20.5 UTblh2/3 72.4 64.4 18.0 189 92 pop ash, leather fern, wax myrtle, saltbush
4/9/2009 RE20 20.5 UTblh 2/3/HH 73.4 65.4 18.6 292 97 lizards tail, swamp lily, pop ash, saltbush
4/9/2009 RE30 20.5 UTsw2 72.7 64.7 18.2 328 96 pop ash, red maple, salt bush
4/9/2009 RE40 20.5 HH/UTblh3 74.3 66.3 19.1 321 94 pop ash, red maple, ardesia, leather fern, cabbage palm
4/9/2009 RE50 20.5 UTblh3 74.4 66.4 19.1 230 76 red maple, cabbage palm, ardesia, laurel oak 4/9/2009 RE60 20.5 UTblh3 72.4 64.4 18.0 268 93 leather fern, pop ash, cabbage palm, red maple 4/9/2009 RE70 20.5 UTblh1 75.5 67.5 19.7 320 104 pop ash, wax myrtle, leather fern, swamp lily 4/9/2009 RE80 20.5 UTblh1 73.9 65.9 18.8 314 100 pop ash, swamp lily, ardesia, wax myrtle 4/9/2009 RE90 20.5 UTlbh2 76.4 68.4 20.2 0 4 laurel oak, saw palmetto, ardesia 4/9/2009 BA00 19.5 HH 75 67 19.4 0 15 lots of trash 4/9/2009 BA10 19.5 HH 74.9 66.9 19.4 0 43
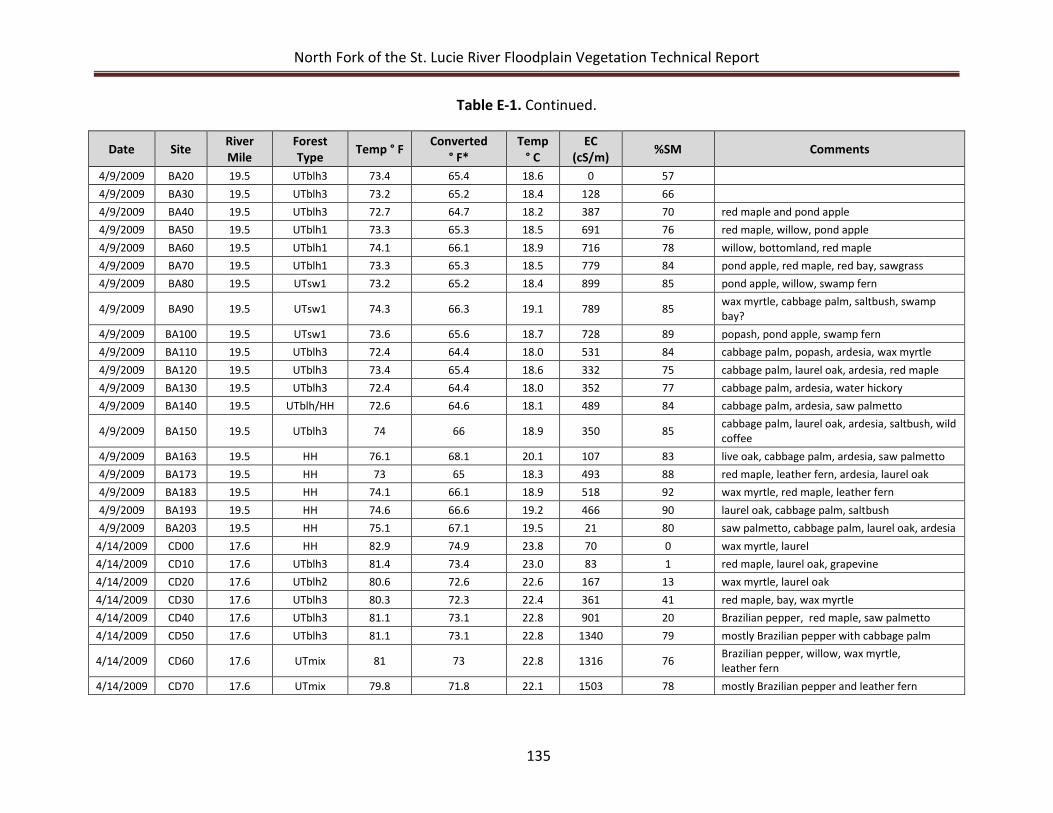
North Fork of the St. Lucie River Floodplain Vegetation Technical Report
135
Table E-1. Continued.
Date Site River Mile
Forest Type Temp ° F Converted
° F* Temp
° C EC
(cS/m) %SM Comments
4/9/2009 BA20 19.5 UTblh3 73.4 65.4 18.6 0 57
4/9/2009 BA30 19.5 UTblh3 73.2 65.2 18.4 128 66
4/9/2009 BA40 19.5 UTblh3 72.7 64.7 18.2 387 70 red maple and pond apple 4/9/2009 BA50 19.5 UTblh1 73.3 65.3 18.5 691 76 red maple, willow, pond apple 4/9/2009 BA60 19.5 UTblh1 74.1 66.1 18.9 716 78 willow, bottomland, red maple 4/9/2009 BA70 19.5 UTblh1 73.3 65.3 18.5 779 84 pond apple, red maple, red bay, sawgrass 4/9/2009 BA80 19.5 UTsw1 73.2 65.2 18.4 899 85 pond apple, willow, swamp fern
4/9/2009 BA90 19.5 UTsw1 74.3 66.3 19.1 789 85 wax myrtle, cabbage palm, saltbush, swamp bay?
4/9/2009 BA100 19.5 UTsw1 73.6 65.6 18.7 728 89 popash, pond apple, swamp fern 4/9/2009 BA110 19.5 UTblh3 72.4 64.4 18.0 531 84 cabbage palm, popash, ardesia, wax myrtle 4/9/2009 BA120 19.5 UTblh3 73.4 65.4 18.6 332 75 cabbage palm, laurel oak, ardesia, red maple 4/9/2009 BA130 19.5 UTblh3 72.4 64.4 18.0 352 77 cabbage palm, ardesia, water hickory 4/9/2009 BA140 19.5 UTblh/HH 72.6 64.6 18.1 489 84 cabbage palm, ardesia, saw palmetto
4/9/2009 BA150 19.5 UTblh3 74 66 18.9 350 85 cabbage palm, laurel oak, ardesia, saltbush, wild coffee
4/9/2009 BA163 19.5 HH 76.1 68.1 20.1 107 83 live oak, cabbage palm, ardesia, saw palmetto 4/9/2009 BA173 19.5 HH 73 65 18.3 493 88 red maple, leather fern, ardesia, laurel oak 4/9/2009 BA183 19.5 HH 74.1 66.1 18.9 518 92 wax myrtle, red maple, leather fern 4/9/2009 BA193 19.5 HH 74.6 66.6 19.2 466 90 laurel oak, cabbage palm, saltbush 4/9/2009 BA203 19.5 HH 75.1 67.1 19.5 21 80 saw palmetto, cabbage palm, laurel oak, ardesia
4/14/2009 CD00 17.6 HH 82.9 74.9 23.8 70 0 wax myrtle, laurel 4/14/2009 CD10 17.6 UTblh3 81.4 73.4 23.0 83 1 red maple, laurel oak, grapevine 4/14/2009 CD20 17.6 UTblh2 80.6 72.6 22.6 167 13 wax myrtle, laurel oak 4/14/2009 CD30 17.6 UTblh3 80.3 72.3 22.4 361 41 red maple, bay, wax myrtle 4/14/2009 CD40 17.6 UTblh3 81.1 73.1 22.8 901 20 Brazilian pepper, red maple, saw palmetto 4/14/2009 CD50 17.6 UTblh3 81.1 73.1 22.8 1340 79 mostly Brazilian pepper with cabbage palm
4/14/2009 CD60 17.6 UTmix 81 73 22.8 1316 76 Brazilian pepper, willow, wax myrtle, leather fern
4/14/2009 CD70 17.6 UTmix 79.8 71.8 22.1 1503 78 mostly Brazilian pepper and leather fern
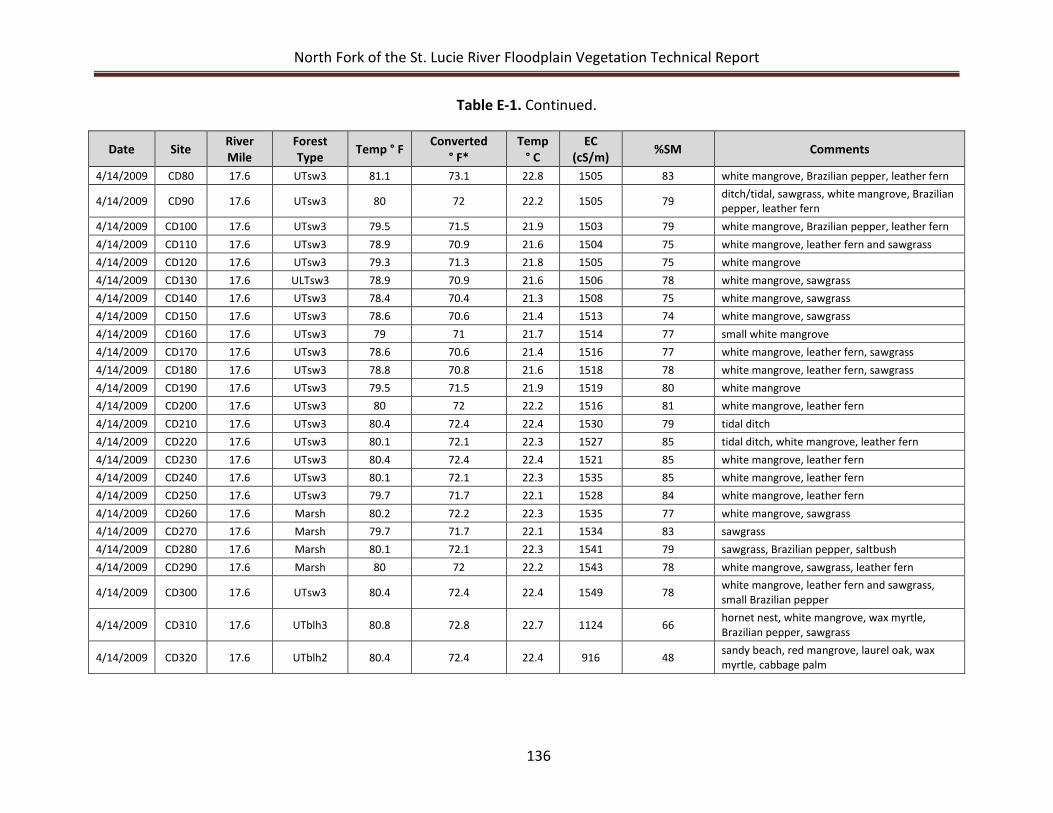
North Fork of the St. Lucie River Floodplain Vegetation Technical Report
136
Table E-1. Continued.
Date Site River Mile
Forest Type Temp ° F Converted
° F* Temp
° C EC
(cS/m) %SM Comments
4/14/2009 CD80 17.6 UTsw3 81.1 73.1 22.8 1505 83 white mangrove, Brazilian pepper, leather fern
4/14/2009 CD90 17.6 UTsw3 80 72 22.2 1505 79 ditch/tidal, sawgrass, white mangrove, Brazilian pepper, leather fern
4/14/2009 CD100 17.6 UTsw3 79.5 71.5 21.9 1503 79 white mangrove, Brazilian pepper, leather fern 4/14/2009 CD110 17.6 UTsw3 78.9 70.9 21.6 1504 75 white mangrove, leather fern and sawgrass 4/14/2009 CD120 17.6 UTsw3 79.3 71.3 21.8 1505 75 white mangrove 4/14/2009 CD130 17.6 ULTsw3 78.9 70.9 21.6 1506 78 white mangrove, sawgrass 4/14/2009 CD140 17.6 UTsw3 78.4 70.4 21.3 1508 75 white mangrove, sawgrass 4/14/2009 CD150 17.6 UTsw3 78.6 70.6 21.4 1513 74 white mangrove, sawgrass 4/14/2009 CD160 17.6 UTsw3 79 71 21.7 1514 77 small white mangrove 4/14/2009 CD170 17.6 UTsw3 78.6 70.6 21.4 1516 77 white mangrove, leather fern, sawgrass 4/14/2009 CD180 17.6 UTsw3 78.8 70.8 21.6 1518 78 white mangrove, leather fern, sawgrass 4/14/2009 CD190 17.6 UTsw3 79.5 71.5 21.9 1519 80 white mangrove 4/14/2009 CD200 17.6 UTsw3 80 72 22.2 1516 81 white mangrove, leather fern 4/14/2009 CD210 17.6 UTsw3 80.4 72.4 22.4 1530 79 tidal ditch 4/14/2009 CD220 17.6 UTsw3 80.1 72.1 22.3 1527 85 tidal ditch, white mangrove, leather fern 4/14/2009 CD230 17.6 UTsw3 80.4 72.4 22.4 1521 85 white mangrove, leather fern 4/14/2009 CD240 17.6 UTsw3 80.1 72.1 22.3 1535 85 white mangrove, leather fern 4/14/2009 CD250 17.6 UTsw3 79.7 71.7 22.1 1528 84 white mangrove, leather fern 4/14/2009 CD260 17.6 Marsh 80.2 72.2 22.3 1535 77 white mangrove, sawgrass 4/14/2009 CD270 17.6 Marsh 79.7 71.7 22.1 1534 83 sawgrass 4/14/2009 CD280 17.6 Marsh 80.1 72.1 22.3 1541 79 sawgrass, Brazilian pepper, saltbush 4/14/2009 CD290 17.6 Marsh 80 72 22.2 1543 78 white mangrove, sawgrass, leather fern
4/14/2009 CD300 17.6 UTsw3 80.4 72.4 22.4 1549 78 white mangrove, leather fern and sawgrass, small Brazilian pepper
4/14/2009 CD310 17.6 UTblh3 80.8 72.8 22.7 1124 66 hornet nest, white mangrove, wax myrtle, Brazilian pepper, sawgrass
4/14/2009 CD320 17.6 UTblh2 80.4 72.4 22.4 916 48 sandy beach, red mangrove, laurel oak, wax myrtle, cabbage palm
North Fork of the St. Lucie River Floodplain Vegetation Technical Report
137
APPENDIX F: SUMMARY OF FOREST TYPE DETERMINATIONS
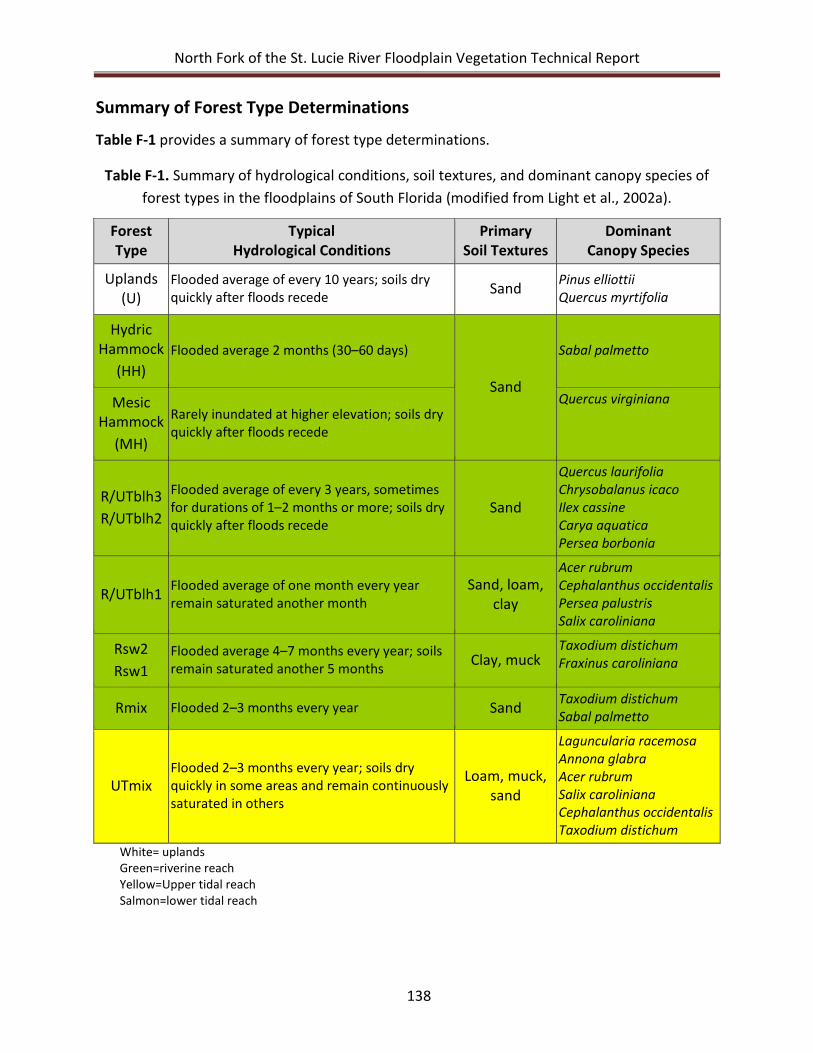
North Fork of the St. Lucie River Floodplain Vegetation Technical Report
138
Summary of Forest Type Determinations
Table F-1 provides a summary of forest type determinations.
Table F-1. Summary of hydrological conditions, soil textures, and dominant canopy species of forest types in the floodplains of South Florida (modified from Light et al., 2002a).
Forest Type
Typical Hydrological Conditions
Primary Soil Textures
Dominant Canopy Species
Uplands (U)
Flooded average of every 10 years; soils dry quickly after floods recede Sand Pinus elliottii
Quercus myrtifolia
Hydric Hammock
(HH) Flooded average 2 months (30–60 days)
Sand
Sabal palmetto
Mesic Hammock
(MH)
Rarely inundated at higher elevation; soils dry quickly after floods recede
Quercus virginiana
R/UTblh3 R/UTblh2
Flooded average of every 3 years, sometimes for durations of 1–2 months or more; soils dry quickly after floods recede
Sand
Quercus laurifolia Chrysobalanus icaco Ilex cassine Carya aquatica Persea borbonia
R/UTblh1 Flooded average of one month every year remain saturated another month
Sand, loam, clay
Acer rubrum Cephalanthus occidentalis Persea palustris Salix caroliniana
Rsw2 Rsw1
Flooded average 4–7 months every year; soils remain saturated another 5 months Clay, muck
Taxodium distichum Fraxinus caroliniana
Rmix Flooded 2–3 months every year Sand Taxodium distichum Sabal palmetto
UTmix Flooded 2–3 months every year; soils dry quickly in some areas and remain continuously saturated in others
Loam, muck, sand
Laguncularia racemosa Annona glabra Acer rubrum Salix caroliniana Cephalanthus occidentalis Taxodium distichum
White= uplands Green=riverine reach Yellow=Upper tidal reach Salmon=lower tidal reach
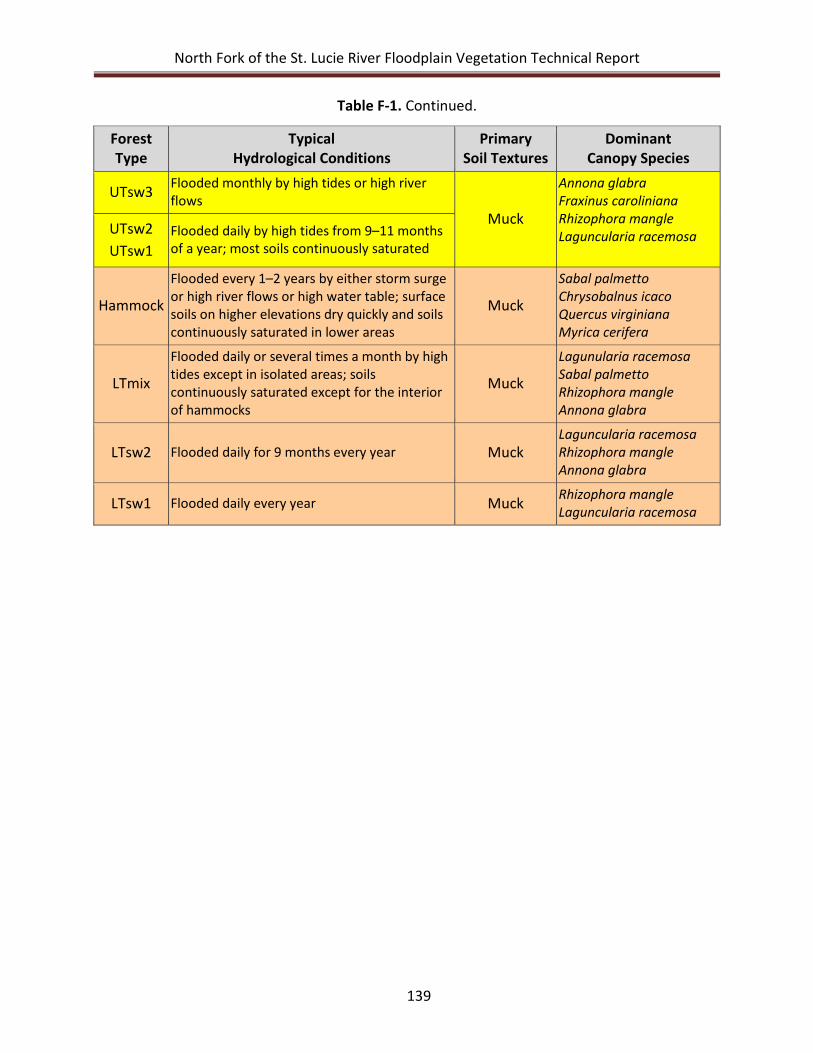
North Fork of the St. Lucie River Floodplain Vegetation Technical Report
139
Table F-1. Continued.
Forest Type
Typical Hydrological Conditions
Primary Soil Textures
Dominant Canopy Species
UTsw3 Flooded monthly by high tides or high river flows
Muck
Annona glabra Fraxinus caroliniana Rhizophora mangle Laguncularia racemosa UTsw2
UTsw1 Flooded daily by high tides from 9–11 months of a year; most soils continuously saturated
Hammock
Flooded every 1–2 years by either storm surge or high river flows or high water table; surface soils on higher elevations dry quickly and soils continuously saturated in lower areas
Muck
Sabal palmetto Chrysobalnus icaco Quercus virginiana Myrica cerifera
LTmix
Flooded daily or several times a month by high tides except in isolated areas; soils continuously saturated except for the interior of hammocks
Muck
Lagunularia racemosa Sabal palmetto Rhizophora mangle Annona glabra
LTsw2 Flooded daily for 9 months every year Muck Laguncularia racemosa Rhizophora mangle Annona glabra
LTsw1 Flooded daily every year Muck Rhizophora mangle Laguncularia racemosa
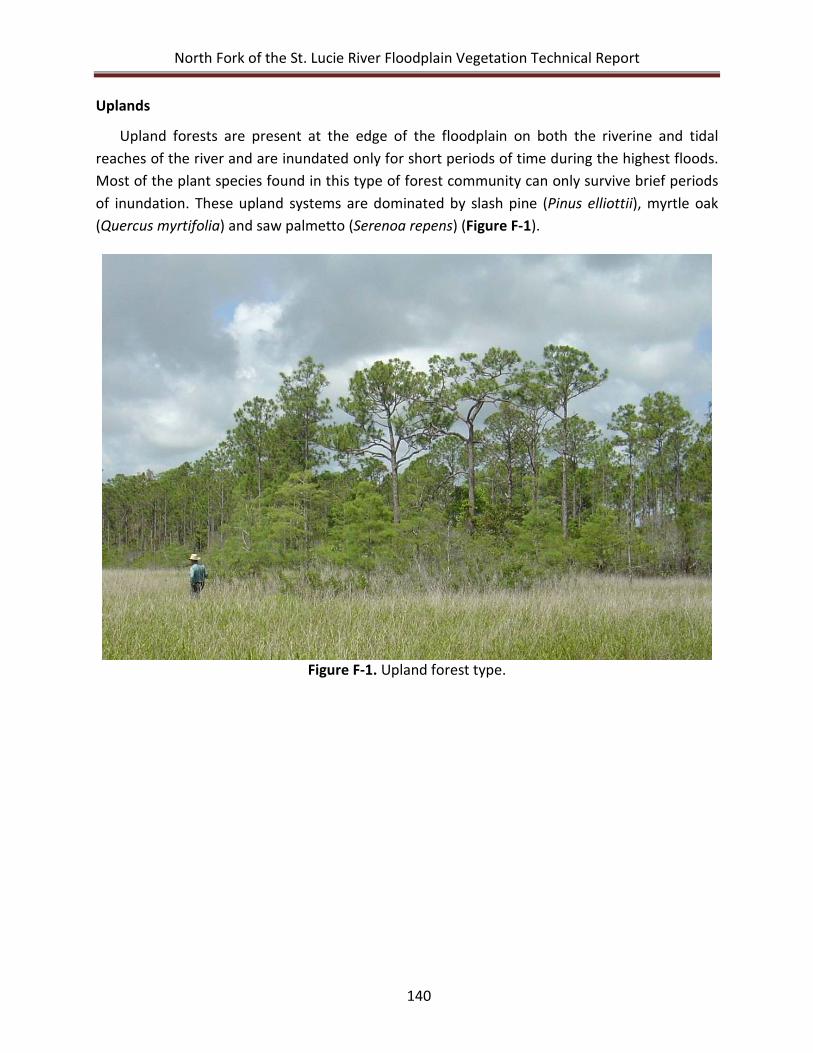
North Fork of the St. Lucie River Floodplain Vegetation Technical Report
140
Uplands
Upland forests are present at the edge of the floodplain on both the riverine and tidal reaches of the river and are inundated only for short periods of time during the highest floods. Most of the plant species found in this type of forest community can only survive brief periods of inundation. These upland systems are dominated by slash pine (Pinus elliottii), myrtle oak (Quercus myrtifolia) and saw palmetto (Serenoa repens) (Figure F-1).
Figure F-1. Upland forest type.
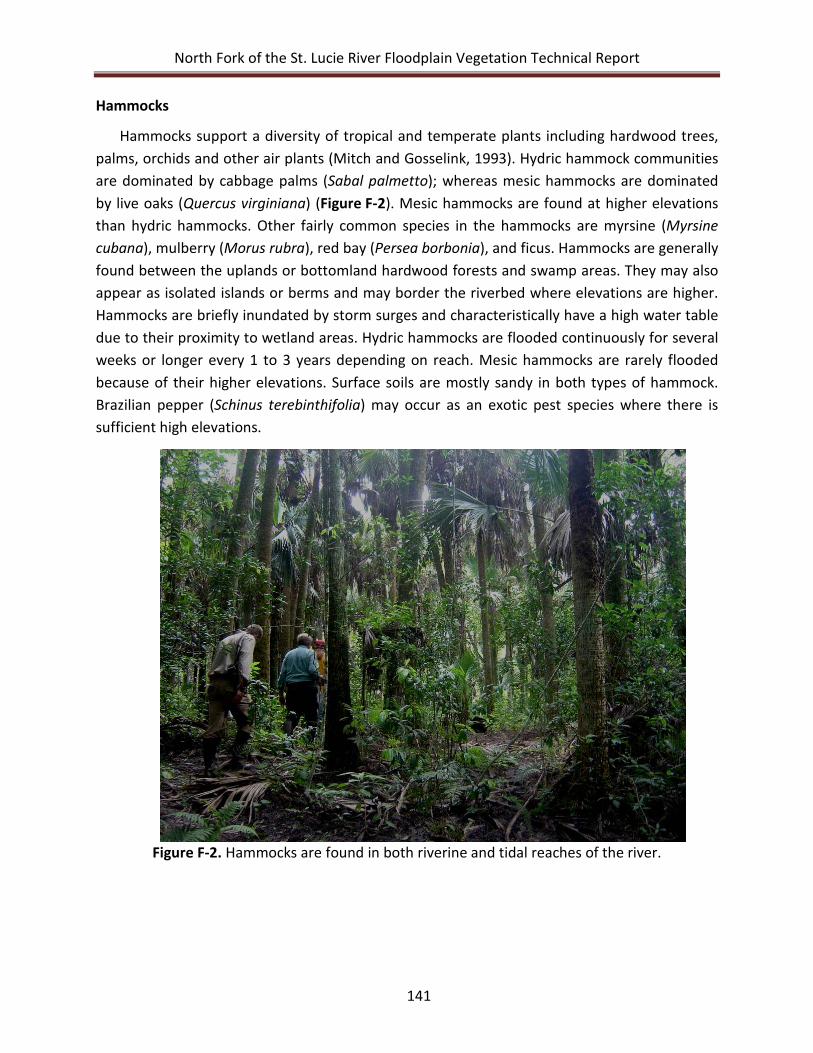
North Fork of the St. Lucie River Floodplain Vegetation Technical Report
141
Hammocks
Hammocks support a diversity of tropical and temperate plants including hardwood trees, palms, orchids and other air plants (Mitch and Gosselink, 1993). Hydric hammock communities are dominated by cabbage palms (Sabal palmetto); whereas mesic hammocks are dominated by live oaks (Quercus virginiana) (Figure F-2). Mesic hammocks are found at higher elevations than hydric hammocks. Other fairly common species in the hammocks are myrsine (Myrsine cubana), mulberry (Morus rubra), red bay (Persea borbonia), and ficus. Hammocks are generally found between the uplands or bottomland hardwood forests and swamp areas. They may also appear as isolated islands or berms and may border the riverbed where elevations are higher. Hammocks are briefly inundated by storm surges and characteristically have a high water table due to their proximity to wetland areas. Hydric hammocks are flooded continuously for several weeks or longer every 1 to 3 years depending on reach. Mesic hammocks are rarely flooded because of their higher elevations. Surface soils are mostly sandy in both types of hammock. Brazilian pepper (Schinus terebinthifolia) may occur as an exotic pest species where there is sufficient high elevations.
Figure F-2. Hammocks are found in both riverine and tidal reaches of the river.
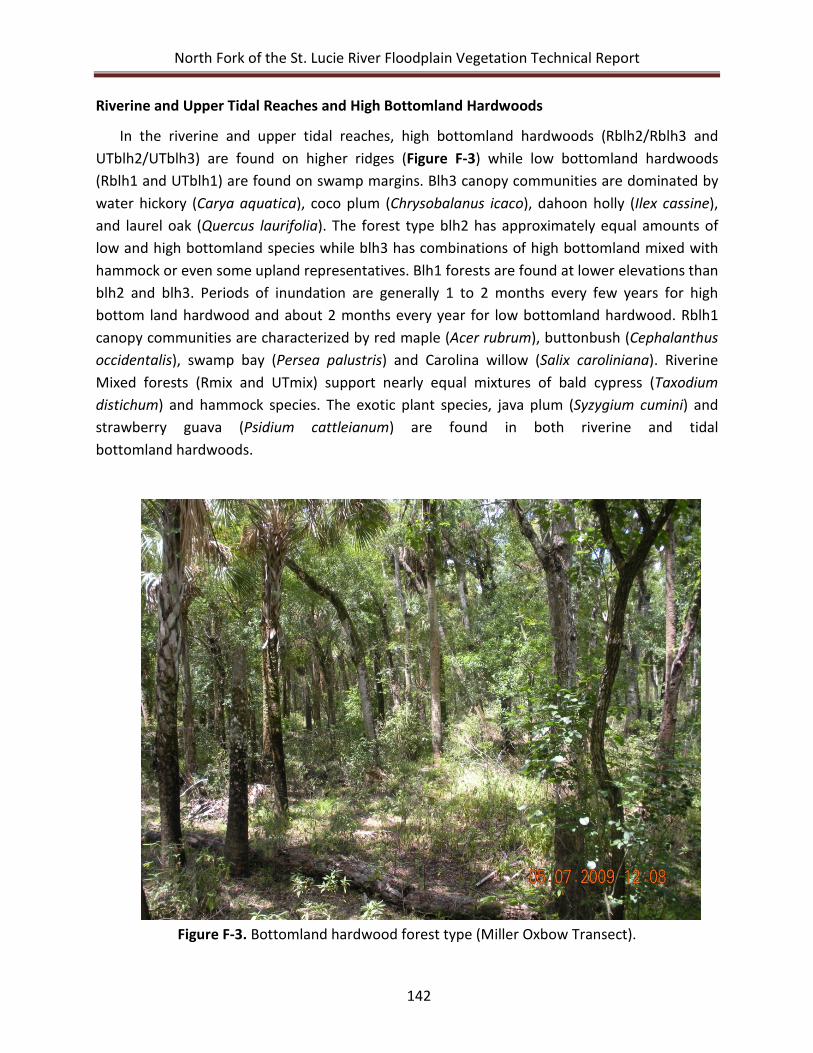
North Fork of the St. Lucie River Floodplain Vegetation Technical Report
142
Riverine and Upper Tidal Reaches and High Bottomland Hardwoods
In the riverine and upper tidal reaches, high bottomland hardwoods (Rblh2/Rblh3 and UTblh2/UTblh3) are found on higher ridges (Figure F-3) while low bottomland hardwoods (Rblh1 and UTblh1) are found on swamp margins. Blh3 canopy communities are dominated by water hickory (Carya aquatica), coco plum (Chrysobalanus icaco), dahoon holly (Ilex cassine), and laurel oak (Quercus laurifolia). The forest type blh2 has approximately equal amounts of low and high bottomland species while blh3 has combinations of high bottomland mixed with hammock or even some upland representatives. Blh1 forests are found at lower elevations than blh2 and blh3. Periods of inundation are generally 1 to 2 months every few years for high bottom land hardwood and about 2 months every year for low bottomland hardwood. Rblh1 canopy communities are characterized by red maple (Acer rubrum), buttonbush (Cephalanthus occidentalis), swamp bay (Persea palustris) and Carolina willow (Salix caroliniana). Riverine Mixed forests (Rmix and UTmix) support nearly equal mixtures of bald cypress (Taxodium distichum) and hammock species. The exotic plant species, java plum (Syzygium cumini) and strawberry guava (Psidium cattleianum) are found in both riverine and tidal bottomland hardwoods.
Figure F-3. Bottomland hardwood forest type (Miller Oxbow Transect).
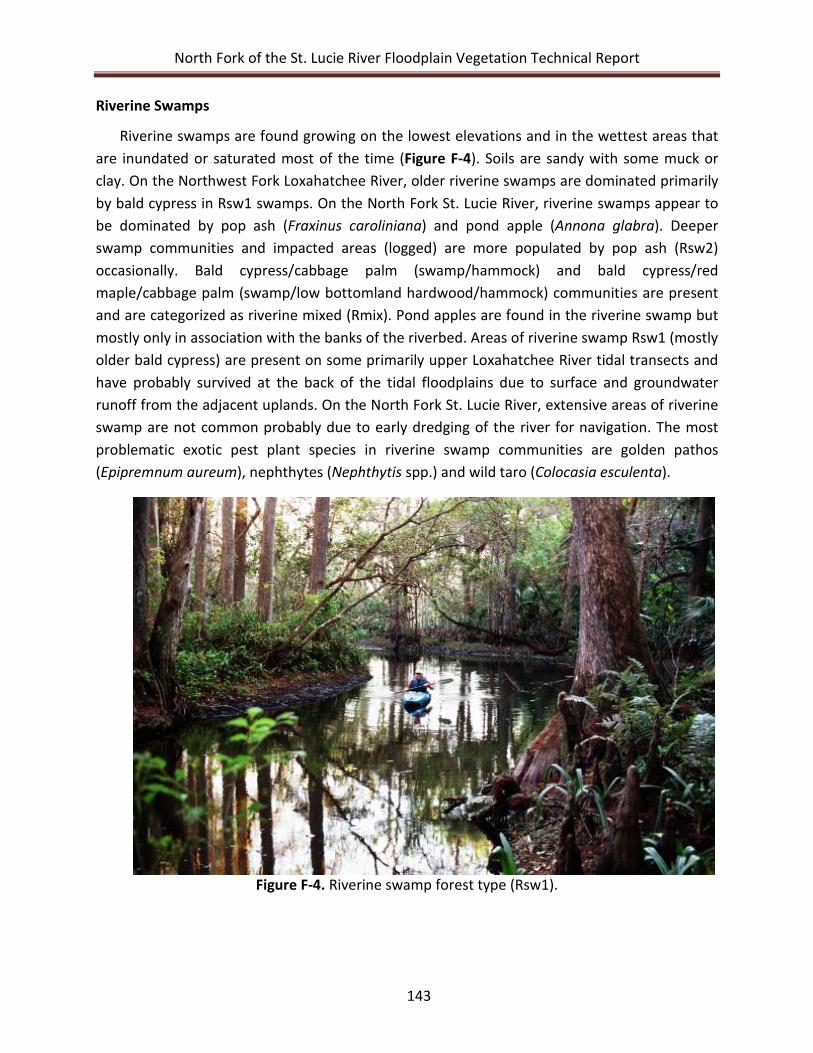
North Fork of the St. Lucie River Floodplain Vegetation Technical Report
143
Riverine Swamps
Riverine swamps are found growing on the lowest elevations and in the wettest areas that are inundated or saturated most of the time (Figure F-4). Soils are sandy with some muck or clay. On the Northwest Fork Loxahatchee River, older riverine swamps are dominated primarily by bald cypress in Rsw1 swamps. On the North Fork St. Lucie River, riverine swamps appear to be dominated by pop ash (Fraxinus caroliniana) and pond apple (Annona glabra). Deeper swamp communities and impacted areas (logged) are more populated by pop ash (Rsw2) occasionally. Bald cypress/cabbage palm (swamp/hammock) and bald cypress/red maple/cabbage palm (swamp/low bottomland hardwood/hammock) communities are present and are categorized as riverine mixed (Rmix). Pond apples are found in the riverine swamp but mostly only in association with the banks of the riverbed. Areas of riverine swamp Rsw1 (mostly older bald cypress) are present on some primarily upper Loxahatchee River tidal transects and have probably survived at the back of the tidal floodplains due to surface and groundwater runoff from the adjacent uplands. On the North Fork St. Lucie River, extensive areas of riverine swamp are not common probably due to early dredging of the river for navigation. The most problematic exotic pest plant species in riverine swamp communities are golden pathos (Epipremnum aureum), nephthytes (Nephthytis spp.) and wild taro (Colocasia esculenta).
Figure F-4. Riverine swamp forest type (Rsw1).
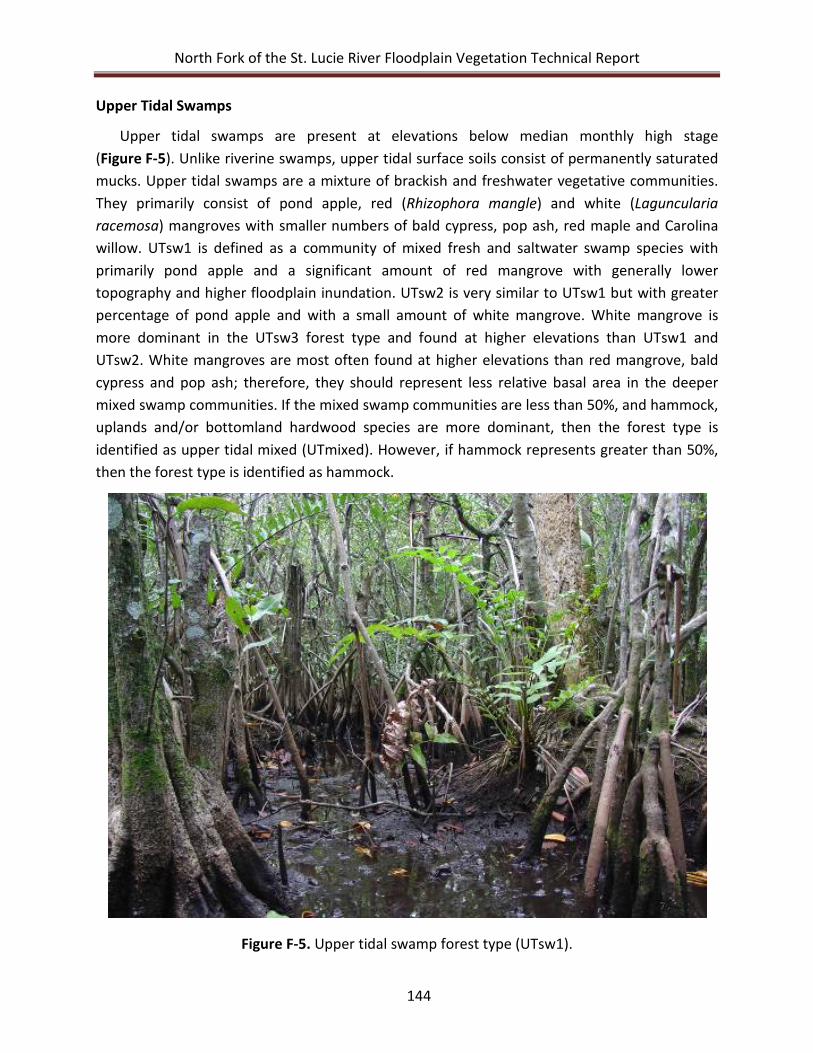
North Fork of the St. Lucie River Floodplain Vegetation Technical Report
144
Upper Tidal Swamps
Upper tidal swamps are present at elevations below median monthly high stage (Figure F-5). Unlike riverine swamps, upper tidal surface soils consist of permanently saturated mucks. Upper tidal swamps are a mixture of brackish and freshwater vegetative communities. They primarily consist of pond apple, red (Rhizophora mangle) and white (Laguncularia racemosa) mangroves with smaller numbers of bald cypress, pop ash, red maple and Carolina willow. UTsw1 is defined as a community of mixed fresh and saltwater swamp species with primarily pond apple and a significant amount of red mangrove with generally lower topography and higher floodplain inundation. UTsw2 is very similar to UTsw1 but with greater percentage of pond apple and with a small amount of white mangrove. White mangrove is more dominant in the UTsw3 forest type and found at higher elevations than UTsw1 and UTsw2. White mangroves are most often found at higher elevations than red mangrove, bald cypress and pop ash; therefore, they should represent less relative basal area in the deeper mixed swamp communities. If the mixed swamp communities are less than 50%, and hammock, uplands and/or bottomland hardwood species are more dominant, then the forest type is identified as upper tidal mixed (UTmixed). However, if hammock represents greater than 50%, then the forest type is identified as hammock.
Figure F-5. Upper tidal swamp forest type (UTsw1).
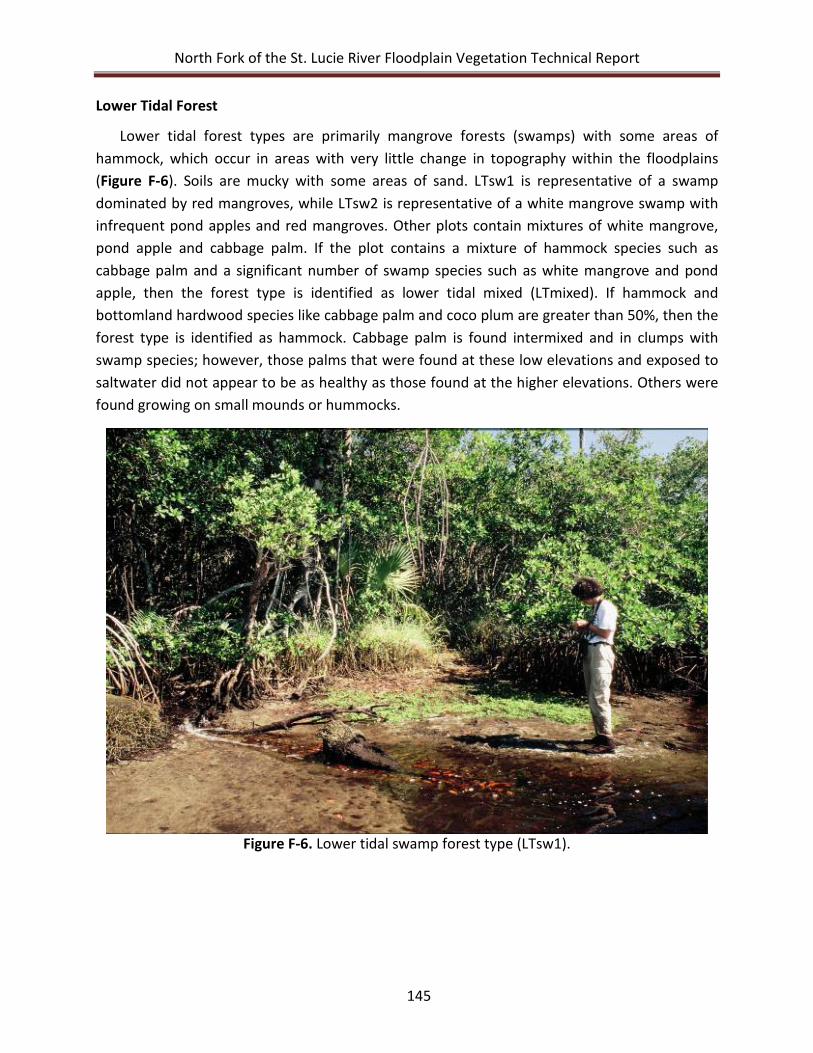
North Fork of the St. Lucie River Floodplain Vegetation Technical Report
145
Lower Tidal Forest
Lower tidal forest types are primarily mangrove forests (swamps) with some areas of hammock, which occur in areas with very little change in topography within the floodplains (Figure F-6). Soils are mucky with some areas of sand. LTsw1 is representative of a swamp dominated by red mangroves, while LTsw2 is representative of a white mangrove swamp with infrequent pond apples and red mangroves. Other plots contain mixtures of white mangrove, pond apple and cabbage palm. If the plot contains a mixture of hammock species such as cabbage palm and a significant number of swamp species such as white mangrove and pond apple, then the forest type is identified as lower tidal mixed (LTmixed). If hammock and bottomland hardwood species like cabbage palm and coco plum are greater than 50%, then the forest type is identified as hammock. Cabbage palm is found intermixed and in clumps with swamp species; however, those palms that were found at these low elevations and exposed to saltwater did not appear to be as healthy as those found at the higher elevations. Others were found growing on small mounds or hummocks.
Figure F-6. Lower tidal swamp forest type (LTsw1).
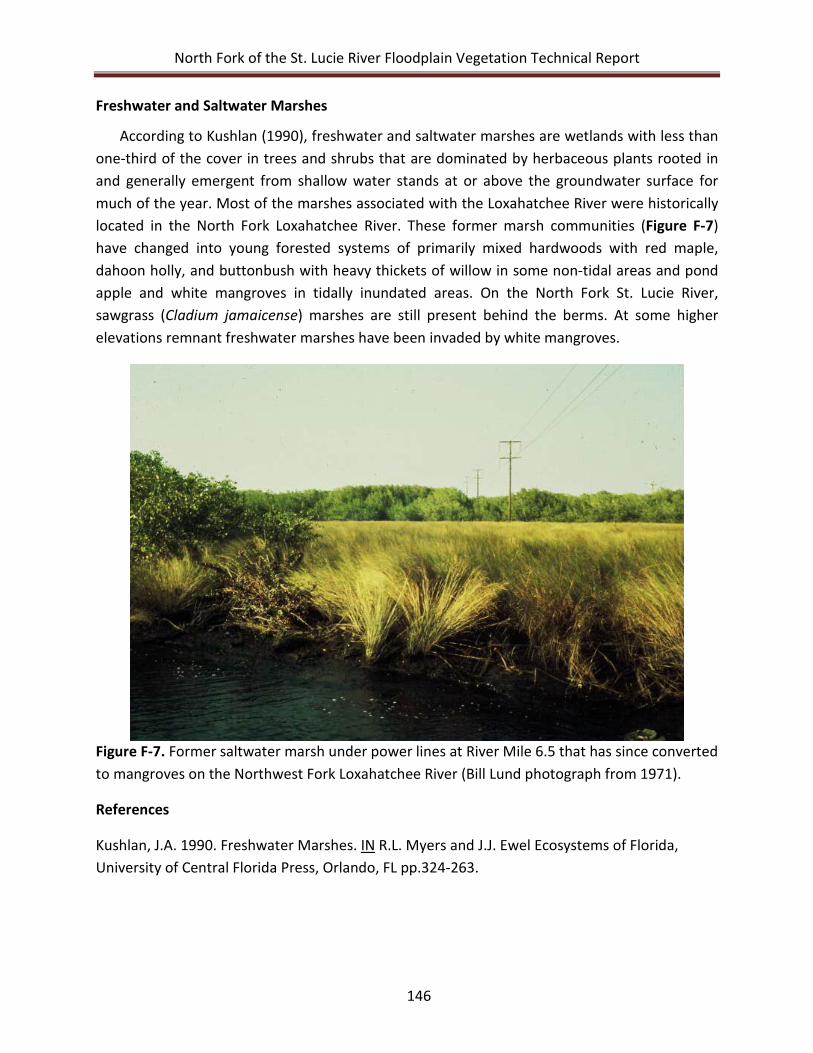
North Fork of the St. Lucie River Floodplain Vegetation Technical Report
146
Freshwater and Saltwater Marshes
According to Kushlan (1990), freshwater and saltwater marshes are wetlands with less than one-third of the cover in trees and shrubs that are dominated by herbaceous plants rooted in and generally emergent from shallow water stands at or above the groundwater surface for much of the year. Most of the marshes associated with the Loxahatchee River were historically located in the North Fork Loxahatchee River. These former marsh communities (Figure F-7) have changed into young forested systems of primarily mixed hardwoods with red maple, dahoon holly, and buttonbush with heavy thickets of willow in some non-tidal areas and pond apple and white mangroves in tidally inundated areas. On the North Fork St. Lucie River, sawgrass (Cladium jamaicense) marshes are still present behind the berms. At some higher elevations remnant freshwater marshes have been invaded by white mangroves.
Figure F-7. Former saltwater marsh under power lines at River Mile 6.5 that has since converted to mangroves on the Northwest Fork Loxahatchee River (Bill Lund photograph from 1971).
References
Kushlan, J.A. 1990. Freshwater Marshes. IN R.L. Myers and J.J. Ewel Ecosystems of Florida, University of Central Florida Press, Orlando, FL pp.324-263.
North Fork of the St. Lucie River Floodplain Vegetation Technical Report
147
APPENDIX G: NORTH FORK ST. LUCIE RIVER FLOODPLAIN DATA SETS AND
ADDITIONAL GRAPHS
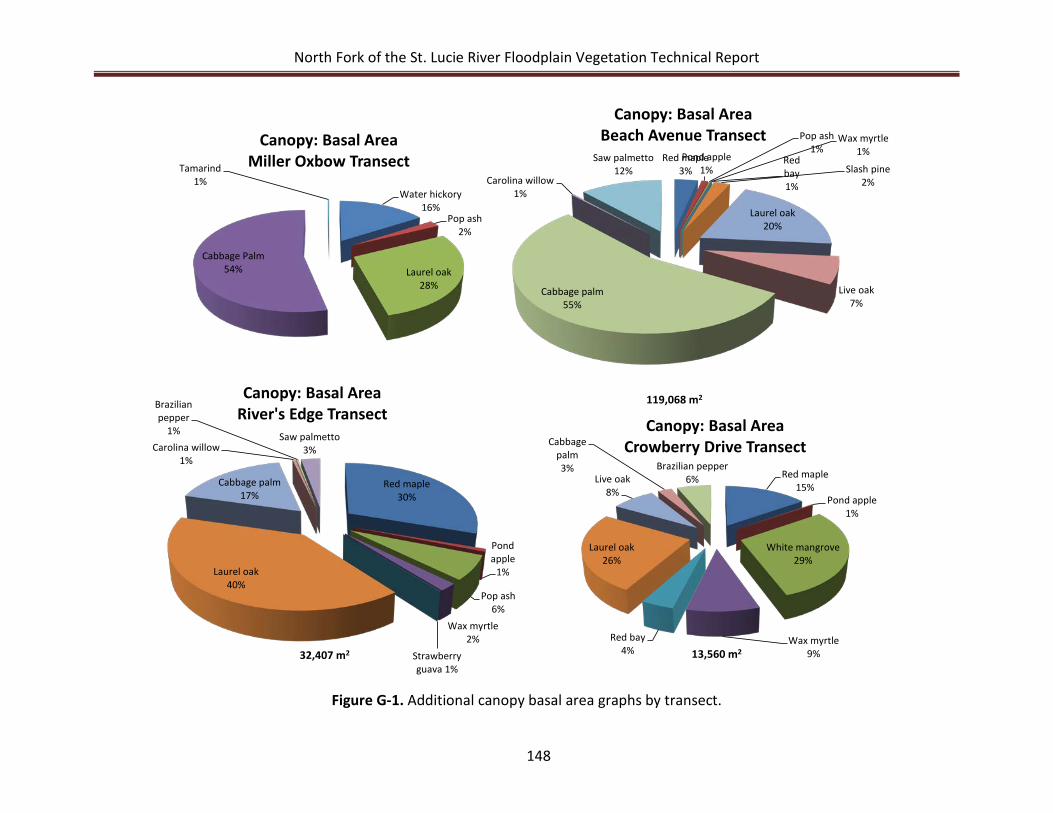
North Fork of the St. Lucie River Floodplain Vegetation Technical Report
148
Figure G-1. Additional canopy basal area graphs by transect.
Water hickory16%
Pop ash2%
Laurel oak28%
Cabbage Palm54%
Tamarind1%
Canopy: Basal AreaMiller Oxbow Transect
Red maple30%
Pond apple
1%
Pop ash6%
Wax myrtle2%
Strawberry guava 1%
Laurel oak40%
Cabbage palm17%
Carolina willow1%
Brazilian pepper
1% Saw palmetto3%
Canopy: Basal AreaRiver's Edge Transect
32,407 m2
Red maple3%Pond apple
1%
Pop ash1%
Wax myrtle1%
Red bay1%
Slash pine2%
Laurel oak20%
Live oak7%
Cabbage palm55%
Carolina willow1%
Saw palmetto12%
Canopy: Basal AreaBeach Avenue Transect
119,068 m2
Red maple15%
Pond apple1%
White mangrove29%
Wax myrtle9%
Red bay4%
Laurel oak26%
Live oak8%
Cabbage palm3% Brazilian pepper
6%
Canopy: Basal Area Crowberry Drive Transect
13,560 m2
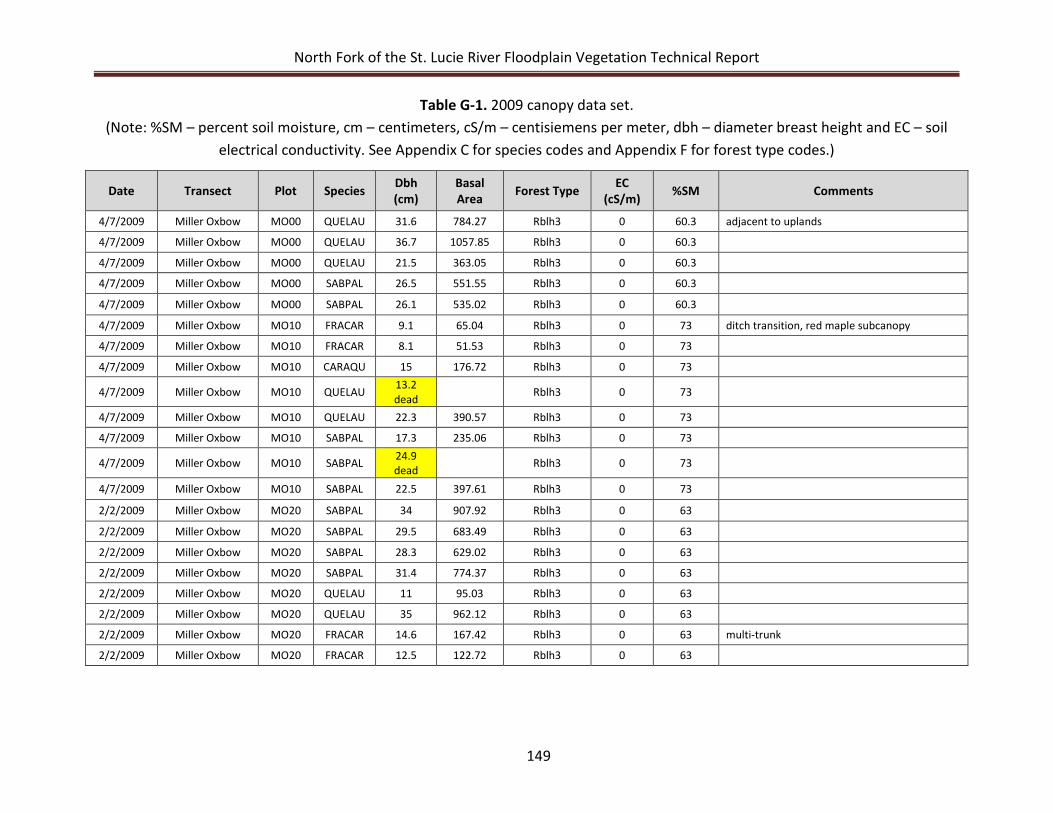
North Fork of the St. Lucie River Floodplain Vegetation Technical Report
149
Table G-1. 2009 canopy data set. (Note: %SM – percent soil moisture, cm – centimeters, cS/m – centisiemens per meter, dbh – diameter breast height and EC – soil
electrical conductivity. See Appendix C for species codes and Appendix F for forest type codes.)
Date Transect Plot Species Dbh (cm)
Basal Area Forest Type EC
(cS/m) %SM Comments
4/7/2009 Miller Oxbow MO00 QUELAU 31.6 784.27 Rblh3 0 60.3 adjacent to uplands
4/7/2009 Miller Oxbow MO00 QUELAU 36.7 1057.85 Rblh3 0 60.3 4/7/2009 Miller Oxbow MO00 QUELAU 21.5 363.05 Rblh3 0 60.3 4/7/2009 Miller Oxbow MO00 SABPAL 26.5 551.55 Rblh3 0 60.3 4/7/2009 Miller Oxbow MO00 SABPAL 26.1 535.02 Rblh3 0 60.3 4/7/2009 Miller Oxbow MO10 FRACAR 9.1 65.04 Rblh3 0 73 ditch transition, red maple subcanopy
4/7/2009 Miller Oxbow MO10 FRACAR 8.1 51.53 Rblh3 0 73 4/7/2009 Miller Oxbow MO10 CARAQU 15 176.72 Rblh3 0 73 4/7/2009 Miller Oxbow MO10 QUELAU 13.2
dead Rblh3 0 73 4/7/2009 Miller Oxbow MO10 QUELAU 22.3 390.57 Rblh3 0 73 4/7/2009 Miller Oxbow MO10 SABPAL 17.3 235.06 Rblh3 0 73 4/7/2009 Miller Oxbow MO10 SABPAL 24.9
dead Rblh3 0 73 4/7/2009 Miller Oxbow MO10 SABPAL 22.5 397.61 Rblh3 0 73 2/2/2009 Miller Oxbow MO20 SABPAL 34 907.92 Rblh3 0 63 2/2/2009 Miller Oxbow MO20 SABPAL 29.5 683.49 Rblh3 0 63 2/2/2009 Miller Oxbow MO20 SABPAL 28.3 629.02 Rblh3 0 63 2/2/2009 Miller Oxbow MO20 SABPAL 31.4 774.37 Rblh3 0 63 2/2/2009 Miller Oxbow MO20 QUELAU 11 95.03 Rblh3 0 63 2/2/2009 Miller Oxbow MO20 QUELAU 35 962.12 Rblh3 0 63 2/2/2009 Miller Oxbow MO20 FRACAR 14.6 167.42 Rblh3 0 63 multi-trunk
2/2/2009 Miller Oxbow MO20 FRACAR 12.5 122.72 Rblh3 0 63
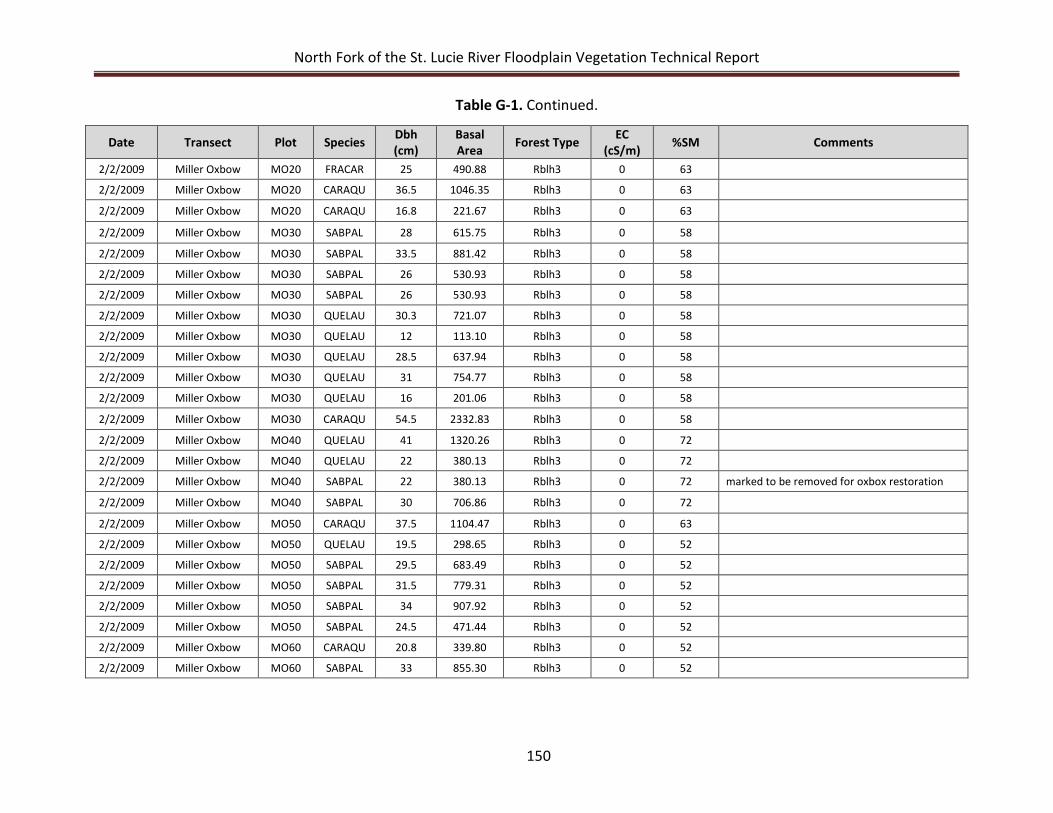
North Fork of the St. Lucie River Floodplain Vegetation Technical Report
150
Table G-1. Continued.
Date Transect Plot Species Dbh (cm)
Basal Area Forest Type EC
(cS/m) %SM Comments
2/2/2009 Miller Oxbow MO20 FRACAR 25 490.88 Rblh3 0 63 2/2/2009 Miller Oxbow MO20 CARAQU 36.5 1046.35 Rblh3 0 63 2/2/2009 Miller Oxbow MO20 CARAQU 16.8 221.67 Rblh3 0 63 2/2/2009 Miller Oxbow MO30 SABPAL 28 615.75 Rblh3 0 58 2/2/2009 Miller Oxbow MO30 SABPAL 33.5 881.42 Rblh3 0 58 2/2/2009 Miller Oxbow MO30 SABPAL 26 530.93 Rblh3 0 58 2/2/2009 Miller Oxbow MO30 SABPAL 26 530.93 Rblh3 0 58 2/2/2009 Miller Oxbow MO30 QUELAU 30.3 721.07 Rblh3 0 58 2/2/2009 Miller Oxbow MO30 QUELAU 12 113.10 Rblh3 0 58 2/2/2009 Miller Oxbow MO30 QUELAU 28.5 637.94 Rblh3 0 58 2/2/2009 Miller Oxbow MO30 QUELAU 31 754.77 Rblh3 0 58 2/2/2009 Miller Oxbow MO30 QUELAU 16 201.06 Rblh3 0 58 2/2/2009 Miller Oxbow MO30 CARAQU 54.5 2332.83 Rblh3 0 58 2/2/2009 Miller Oxbow MO40 QUELAU 41 1320.26 Rblh3 0 72 2/2/2009 Miller Oxbow MO40 QUELAU 22 380.13 Rblh3 0 72 2/2/2009 Miller Oxbow MO40 SABPAL 22 380.13 Rblh3 0 72 marked to be removed for oxbox restoration
2/2/2009 Miller Oxbow MO40 SABPAL 30 706.86 Rblh3 0 72 2/2/2009 Miller Oxbow MO50 CARAQU 37.5 1104.47 Rblh3 0 63 2/2/2009 Miller Oxbow MO50 QUELAU 19.5 298.65 Rblh3 0 52 2/2/2009 Miller Oxbow MO50 SABPAL 29.5 683.49 Rblh3 0 52 2/2/2009 Miller Oxbow MO50 SABPAL 31.5 779.31 Rblh3 0 52 2/2/2009 Miller Oxbow MO50 SABPAL 34 907.92 Rblh3 0 52 2/2/2009 Miller Oxbow MO50 SABPAL 24.5 471.44 Rblh3 0 52 2/2/2009 Miller Oxbow MO60 CARAQU 20.8 339.80 Rblh3 0 52 2/2/2009 Miller Oxbow MO60 SABPAL 33 855.30 Rblh3 0 52
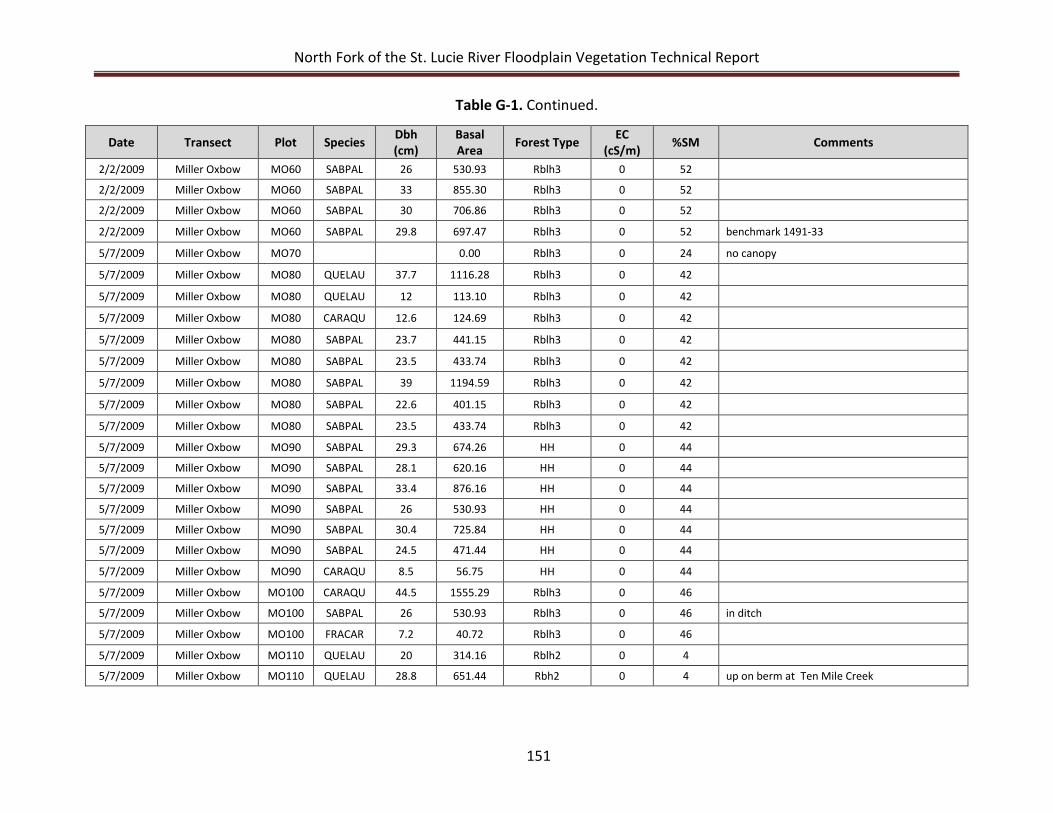
North Fork of the St. Lucie River Floodplain Vegetation Technical Report
151
Table G-1. Continued.
Date Transect Plot Species Dbh (cm)
Basal Area Forest Type EC
(cS/m) %SM Comments
2/2/2009 Miller Oxbow MO60 SABPAL 26 530.93 Rblh3 0 52 2/2/2009 Miller Oxbow MO60 SABPAL 33 855.30 Rblh3 0 52 2/2/2009 Miller Oxbow MO60 SABPAL 30 706.86 Rblh3 0 52 2/2/2009 Miller Oxbow MO60 SABPAL 29.8 697.47 Rblh3 0 52 benchmark 1491-33
5/7/2009 Miller Oxbow MO70 0.00 Rblh3 0 24 no canopy
5/7/2009 Miller Oxbow MO80 QUELAU 37.7 1116.28 Rblh3 0 42 5/7/2009 Miller Oxbow MO80 QUELAU 12 113.10 Rblh3 0 42 5/7/2009 Miller Oxbow MO80 CARAQU 12.6 124.69 Rblh3 0 42 5/7/2009 Miller Oxbow MO80 SABPAL 23.7 441.15 Rblh3 0 42 5/7/2009 Miller Oxbow MO80 SABPAL 23.5 433.74 Rblh3 0 42 5/7/2009 Miller Oxbow MO80 SABPAL 39 1194.59 Rblh3 0 42 5/7/2009 Miller Oxbow MO80 SABPAL 22.6 401.15 Rblh3 0 42 5/7/2009 Miller Oxbow MO80 SABPAL 23.5 433.74 Rblh3 0 42 5/7/2009 Miller Oxbow MO90 SABPAL 29.3 674.26 HH 0 44 5/7/2009 Miller Oxbow MO90 SABPAL 28.1 620.16 HH 0 44 5/7/2009 Miller Oxbow MO90 SABPAL 33.4 876.16 HH 0 44 5/7/2009 Miller Oxbow MO90 SABPAL 26 530.93 HH 0 44 5/7/2009 Miller Oxbow MO90 SABPAL 30.4 725.84 HH 0 44 5/7/2009 Miller Oxbow MO90 SABPAL 24.5 471.44 HH 0 44 5/7/2009 Miller Oxbow MO90 CARAQU 8.5 56.75 HH 0 44 5/7/2009 Miller Oxbow MO100 CARAQU 44.5 1555.29 Rblh3 0 46 5/7/2009 Miller Oxbow MO100 SABPAL 26 530.93 Rblh3 0 46 in ditch
5/7/2009 Miller Oxbow MO100 FRACAR 7.2 40.72 Rblh3 0 46 5/7/2009 Miller Oxbow MO110 QUELAU 20 314.16 Rblh2 0 4 5/7/2009 Miller Oxbow MO110 QUELAU 28.8 651.44 Rbh2 0 4 up on berm at Ten Mile Creek
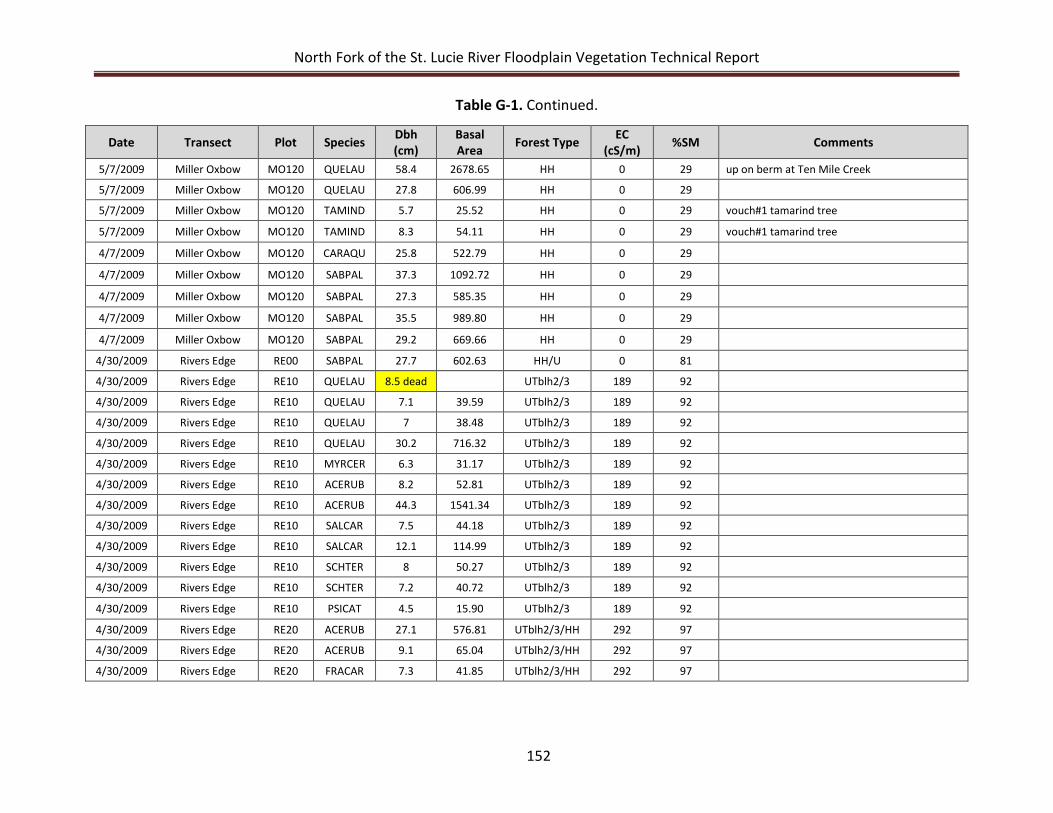
North Fork of the St. Lucie River Floodplain Vegetation Technical Report
152
Table G-1. Continued.
Date Transect Plot Species Dbh (cm)
Basal Area Forest Type EC
(cS/m) %SM Comments
5/7/2009 Miller Oxbow MO120 QUELAU 58.4 2678.65 HH 0 29 up on berm at Ten Mile Creek
5/7/2009 Miller Oxbow MO120 QUELAU 27.8 606.99 HH 0 29 5/7/2009 Miller Oxbow MO120 TAMIND 5.7 25.52 HH 0 29 vouch#1 tamarind tree
5/7/2009 Miller Oxbow MO120 TAMIND 8.3 54.11 HH 0 29 vouch#1 tamarind tree
4/7/2009 Miller Oxbow MO120 CARAQU 25.8 522.79 HH 0 29 4/7/2009 Miller Oxbow MO120 SABPAL 37.3 1092.72 HH 0 29 4/7/2009 Miller Oxbow MO120 SABPAL 27.3 585.35 HH 0 29 4/7/2009 Miller Oxbow MO120 SABPAL 35.5 989.80 HH 0 29 4/7/2009 Miller Oxbow MO120 SABPAL 29.2 669.66 HH 0 29
4/30/2009 Rivers Edge RE00 SABPAL 27.7 602.63 HH/U 0 81 4/30/2009 Rivers Edge RE10 QUELAU 8.5 dead UTblh2/3 189 92 4/30/2009 Rivers Edge RE10 QUELAU 7.1 39.59 UTblh2/3 189 92 4/30/2009 Rivers Edge RE10 QUELAU 7 38.48 UTblh2/3 189 92 4/30/2009 Rivers Edge RE10 QUELAU 30.2 716.32 UTblh2/3 189 92 4/30/2009 Rivers Edge RE10 MYRCER 6.3 31.17 UTblh2/3 189 92 4/30/2009 Rivers Edge RE10 ACERUB 8.2 52.81 UTblh2/3 189 92 4/30/2009 Rivers Edge RE10 ACERUB 44.3 1541.34 UTblh2/3 189 92 4/30/2009 Rivers Edge RE10 SALCAR 7.5 44.18 UTblh2/3 189 92 4/30/2009 Rivers Edge RE10 SALCAR 12.1 114.99 UTblh2/3 189 92 4/30/2009 Rivers Edge RE10 SCHTER 8 50.27 UTblh2/3 189 92 4/30/2009 Rivers Edge RE10 SCHTER 7.2 40.72 UTblh2/3 189 92 4/30/2009 Rivers Edge RE10 PSICAT 4.5 15.90 UTblh2/3 189 92 4/30/2009 Rivers Edge RE20 ACERUB 27.1 576.81 UTblh2/3/HH 292 97 4/30/2009 Rivers Edge RE20 ACERUB 9.1 65.04 UTblh2/3/HH 292 97 4/30/2009 Rivers Edge RE20 FRACAR 7.3 41.85 UTblh2/3/HH 292 97
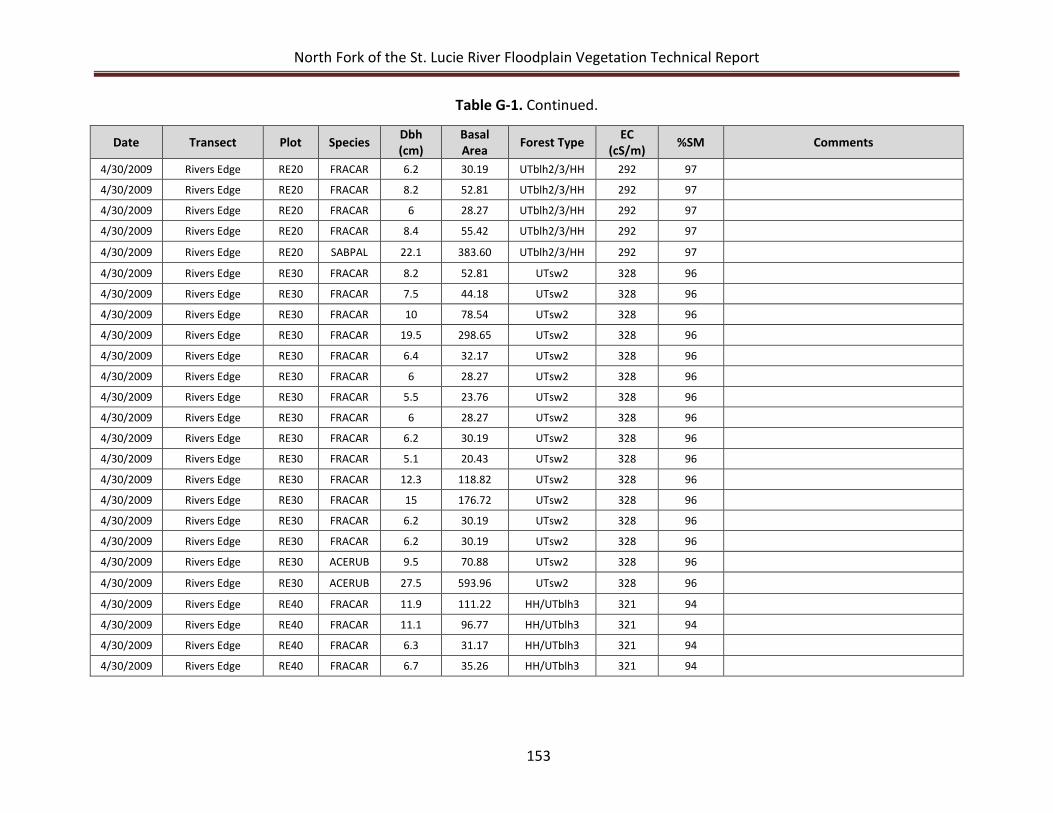
North Fork of the St. Lucie River Floodplain Vegetation Technical Report
153
Table G-1. Continued.
Date Transect Plot Species Dbh (cm)
Basal Area Forest Type EC
(cS/m) %SM Comments
4/30/2009 Rivers Edge RE20 FRACAR 6.2 30.19 UTblh2/3/HH 292 97 4/30/2009 Rivers Edge RE20 FRACAR 8.2 52.81 UTblh2/3/HH 292 97 4/30/2009 Rivers Edge RE20 FRACAR 6 28.27 UTblh2/3/HH 292 97 4/30/2009 Rivers Edge RE20 FRACAR 8.4 55.42 UTblh2/3/HH 292 97 4/30/2009 Rivers Edge RE20 SABPAL 22.1 383.60 UTblh2/3/HH 292 97 4/30/2009 Rivers Edge RE30 FRACAR 8.2 52.81 UTsw2 328 96 4/30/2009 Rivers Edge RE30 FRACAR 7.5 44.18 UTsw2 328 96 4/30/2009 Rivers Edge RE30 FRACAR 10 78.54 UTsw2 328 96 4/30/2009 Rivers Edge RE30 FRACAR 19.5 298.65 UTsw2 328 96 4/30/2009 Rivers Edge RE30 FRACAR 6.4 32.17 UTsw2 328 96 4/30/2009 Rivers Edge RE30 FRACAR 6 28.27 UTsw2 328 96 4/30/2009 Rivers Edge RE30 FRACAR 5.5 23.76 UTsw2 328 96 4/30/2009 Rivers Edge RE30 FRACAR 6 28.27 UTsw2 328 96 4/30/2009 Rivers Edge RE30 FRACAR 6.2 30.19 UTsw2 328 96 4/30/2009 Rivers Edge RE30 FRACAR 5.1 20.43 UTsw2 328 96 4/30/2009 Rivers Edge RE30 FRACAR 12.3 118.82 UTsw2 328 96 4/30/2009 Rivers Edge RE30 FRACAR 15 176.72 UTsw2 328 96 4/30/2009 Rivers Edge RE30 FRACAR 6.2 30.19 UTsw2 328 96 4/30/2009 Rivers Edge RE30 FRACAR 6.2 30.19 UTsw2 328 96 4/30/2009 Rivers Edge RE30 ACERUB 9.5 70.88 UTsw2 328 96 4/30/2009 Rivers Edge RE30 ACERUB 27.5 593.96 UTsw2 328 96 4/30/2009 Rivers Edge RE40 FRACAR 11.9 111.22 HH/UTblh3 321 94 4/30/2009 Rivers Edge RE40 FRACAR 11.1 96.77 HH/UTblh3 321 94 4/30/2009 Rivers Edge RE40 FRACAR 6.3 31.17 HH/UTblh3 321 94 4/30/2009 Rivers Edge RE40 FRACAR 6.7 35.26 HH/UTblh3 321 94
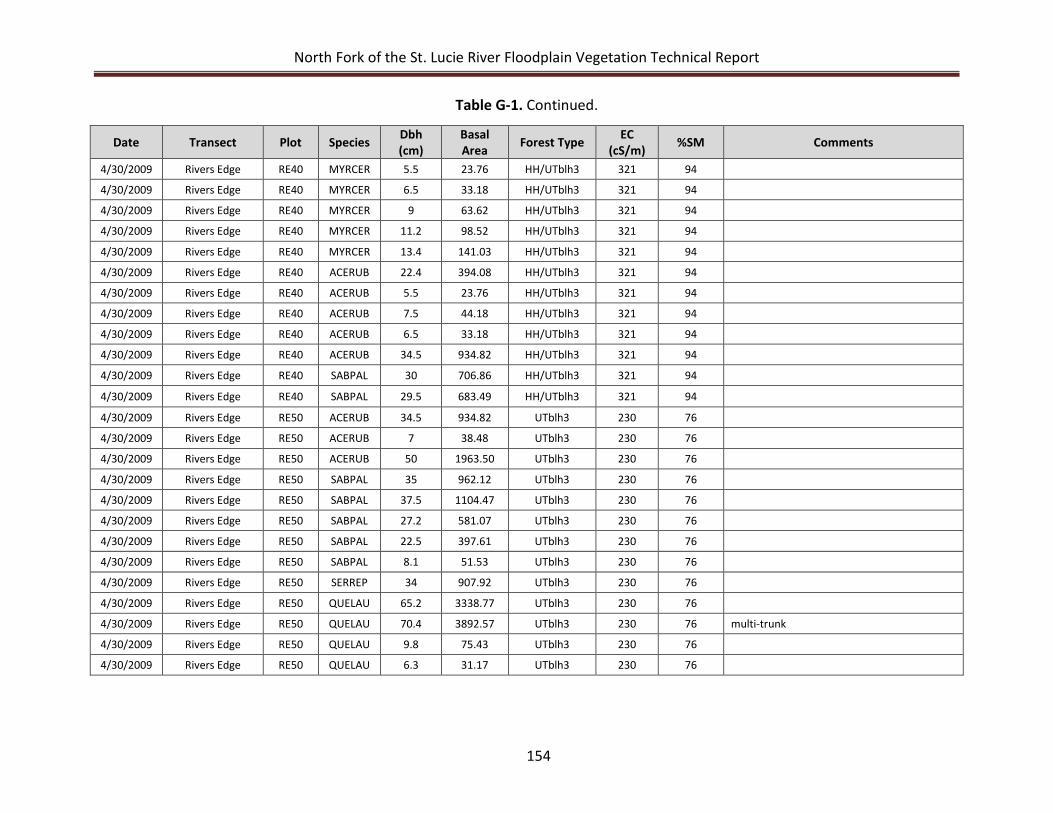
North Fork of the St. Lucie River Floodplain Vegetation Technical Report
154
Table G-1. Continued.
Date Transect Plot Species Dbh (cm)
Basal Area Forest Type EC
(cS/m) %SM Comments
4/30/2009 Rivers Edge RE40 MYRCER 5.5 23.76 HH/UTblh3 321 94 4/30/2009 Rivers Edge RE40 MYRCER 6.5 33.18 HH/UTblh3 321 94 4/30/2009 Rivers Edge RE40 MYRCER 9 63.62 HH/UTblh3 321 94 4/30/2009 Rivers Edge RE40 MYRCER 11.2 98.52 HH/UTblh3 321 94 4/30/2009 Rivers Edge RE40 MYRCER 13.4 141.03 HH/UTblh3 321 94 4/30/2009 Rivers Edge RE40 ACERUB 22.4 394.08 HH/UTblh3 321 94 4/30/2009 Rivers Edge RE40 ACERUB 5.5 23.76 HH/UTblh3 321 94 4/30/2009 Rivers Edge RE40 ACERUB 7.5 44.18 HH/UTblh3 321 94 4/30/2009 Rivers Edge RE40 ACERUB 6.5 33.18 HH/UTblh3 321 94 4/30/2009 Rivers Edge RE40 ACERUB 34.5 934.82 HH/UTblh3 321 94 4/30/2009 Rivers Edge RE40 SABPAL 30 706.86 HH/UTblh3 321 94 4/30/2009 Rivers Edge RE40 SABPAL 29.5 683.49 HH/UTblh3 321 94 4/30/2009 Rivers Edge RE50 ACERUB 34.5 934.82 UTblh3 230 76 4/30/2009 Rivers Edge RE50 ACERUB 7 38.48 UTblh3 230 76 4/30/2009 Rivers Edge RE50 ACERUB 50 1963.50 UTblh3 230 76 4/30/2009 Rivers Edge RE50 SABPAL 35 962.12 UTblh3 230 76 4/30/2009 Rivers Edge RE50 SABPAL 37.5 1104.47 UTblh3 230 76 4/30/2009 Rivers Edge RE50 SABPAL 27.2 581.07 UTblh3 230 76 4/30/2009 Rivers Edge RE50 SABPAL 22.5 397.61 UTblh3 230 76 4/30/2009 Rivers Edge RE50 SABPAL 8.1 51.53 UTblh3 230 76 4/30/2009 Rivers Edge RE50 SERREP 34 907.92 UTblh3 230 76 4/30/2009 Rivers Edge RE50 QUELAU 65.2 3338.77 UTblh3 230 76 4/30/2009 Rivers Edge RE50 QUELAU 70.4 3892.57 UTblh3 230 76 multi-trunk
4/30/2009 Rivers Edge RE50 QUELAU 9.8 75.43 UTblh3 230 76 4/30/2009 Rivers Edge RE50 QUELAU 6.3 31.17 UTblh3 230 76
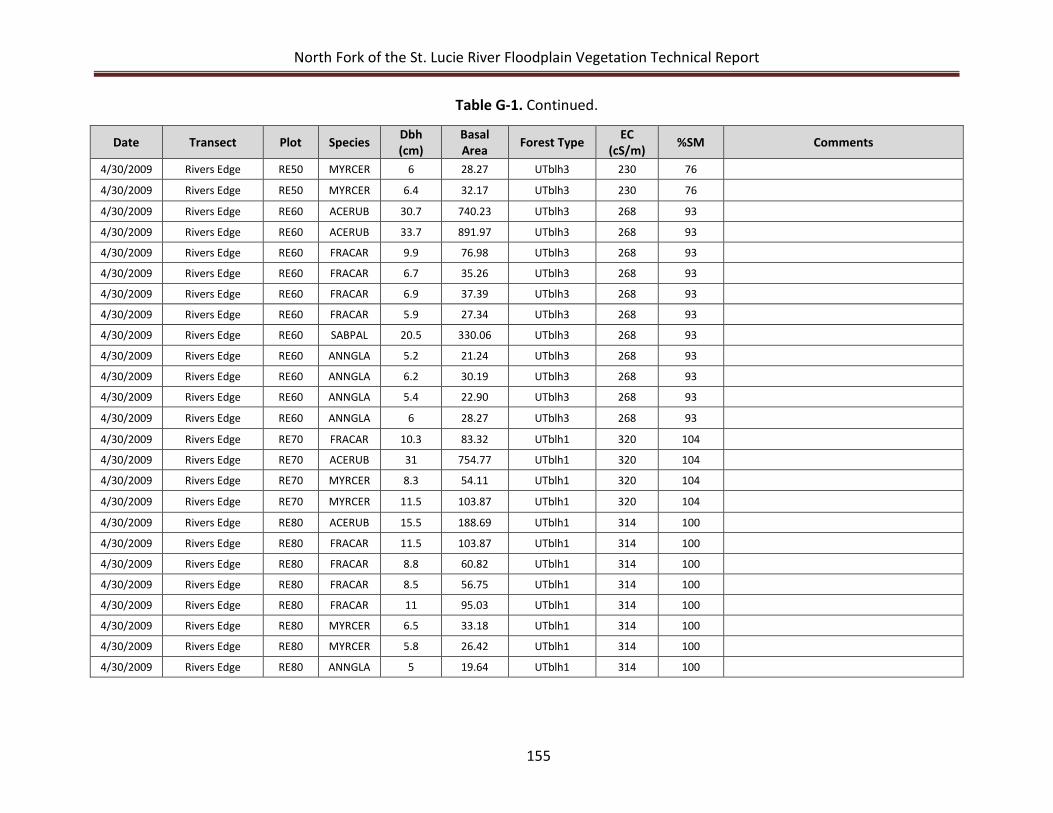
North Fork of the St. Lucie River Floodplain Vegetation Technical Report
155
Table G-1. Continued.
Date Transect Plot Species Dbh (cm)
Basal Area Forest Type EC
(cS/m) %SM Comments
4/30/2009 Rivers Edge RE50 MYRCER 6 28.27 UTblh3 230 76 4/30/2009 Rivers Edge RE50 MYRCER 6.4 32.17 UTblh3 230 76 4/30/2009 Rivers Edge RE60 ACERUB 30.7 740.23 UTblh3 268 93 4/30/2009 Rivers Edge RE60 ACERUB 33.7 891.97 UTblh3 268 93 4/30/2009 Rivers Edge RE60 FRACAR 9.9 76.98 UTblh3 268 93 4/30/2009 Rivers Edge RE60 FRACAR 6.7 35.26 UTblh3 268 93 4/30/2009 Rivers Edge RE60 FRACAR 6.9 37.39 UTblh3 268 93 4/30/2009 Rivers Edge RE60 FRACAR 5.9 27.34 UTblh3 268 93 4/30/2009 Rivers Edge RE60 SABPAL 20.5 330.06 UTblh3 268 93 4/30/2009 Rivers Edge RE60 ANNGLA 5.2 21.24 UTblh3 268 93 4/30/2009 Rivers Edge RE60 ANNGLA 6.2 30.19 UTblh3 268 93 4/30/2009 Rivers Edge RE60 ANNGLA 5.4 22.90 UTblh3 268 93 4/30/2009 Rivers Edge RE60 ANNGLA 6 28.27 UTblh3 268 93 4/30/2009 Rivers Edge RE70 FRACAR 10.3 83.32 UTblh1 320 104 4/30/2009 Rivers Edge RE70 ACERUB 31 754.77 UTblh1 320 104 4/30/2009 Rivers Edge RE70 MYRCER 8.3 54.11 UTblh1 320 104 4/30/2009 Rivers Edge RE70 MYRCER 11.5 103.87 UTblh1 320 104 4/30/2009 Rivers Edge RE80 ACERUB 15.5 188.69 UTblh1 314 100 4/30/2009 Rivers Edge RE80 FRACAR 11.5 103.87 UTblh1 314 100 4/30/2009 Rivers Edge RE80 FRACAR 8.8 60.82 UTblh1 314 100 4/30/2009 Rivers Edge RE80 FRACAR 8.5 56.75 UTblh1 314 100 4/30/2009 Rivers Edge RE80 FRACAR 11 95.03 UTblh1 314 100 4/30/2009 Rivers Edge RE80 MYRCER 6.5 33.18 UTblh1 314 100 4/30/2009 Rivers Edge RE80 MYRCER 5.8 26.42 UTblh1 314 100 4/30/2009 Rivers Edge RE80 ANNGLA 5 19.64 UTblh1 314 100
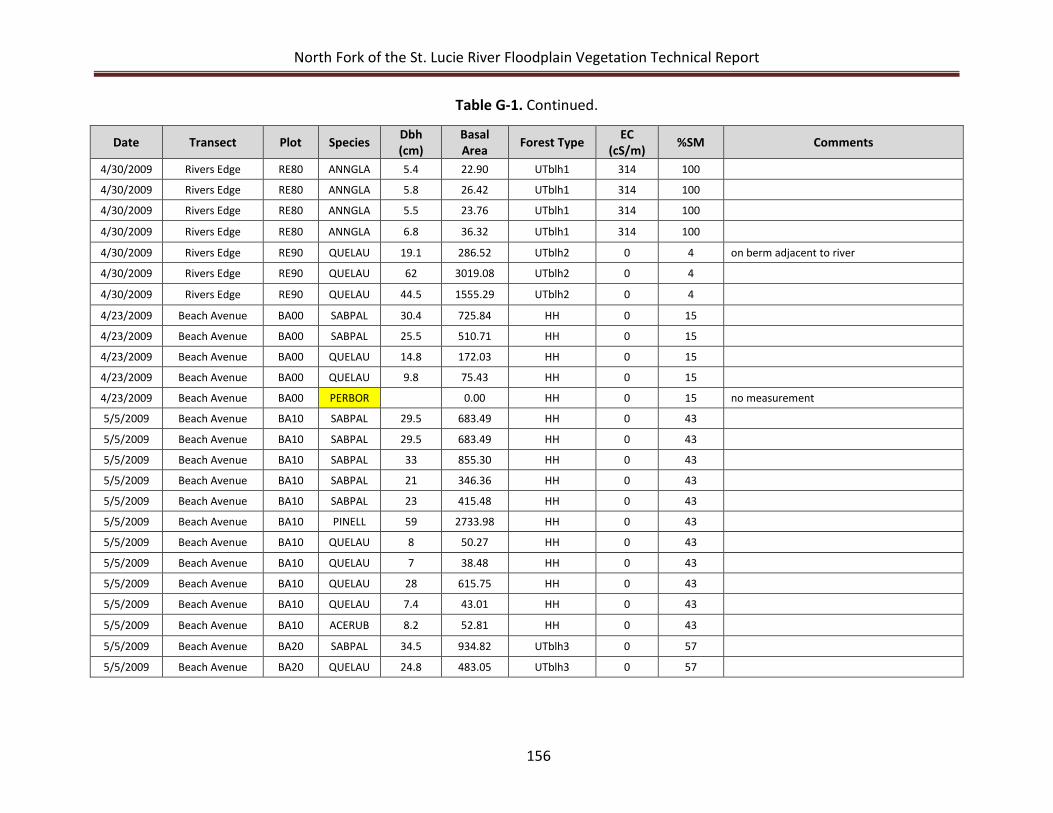
North Fork of the St. Lucie River Floodplain Vegetation Technical Report
156
Table G-1. Continued.
Date Transect Plot Species Dbh (cm)
Basal Area Forest Type EC
(cS/m) %SM Comments
4/30/2009 Rivers Edge RE80 ANNGLA 5.4 22.90 UTblh1 314 100 4/30/2009 Rivers Edge RE80 ANNGLA 5.8 26.42 UTblh1 314 100 4/30/2009 Rivers Edge RE80 ANNGLA 5.5 23.76 UTblh1 314 100 4/30/2009 Rivers Edge RE80 ANNGLA 6.8 36.32 UTblh1 314 100 4/30/2009 Rivers Edge RE90 QUELAU 19.1 286.52 UTblh2 0 4 on berm adjacent to river
4/30/2009 Rivers Edge RE90 QUELAU 62 3019.08 UTblh2 0 4 4/30/2009 Rivers Edge RE90 QUELAU 44.5 1555.29 UTblh2 0 4 4/23/2009 Beach Avenue BA00 SABPAL 30.4 725.84 HH 0 15 4/23/2009 Beach Avenue BA00 SABPAL 25.5 510.71 HH 0 15 4/23/2009 Beach Avenue BA00 QUELAU 14.8 172.03 HH 0 15 4/23/2009 Beach Avenue BA00 QUELAU 9.8 75.43 HH 0 15 4/23/2009 Beach Avenue BA00 PERBOR 0.00 HH 0 15 no measurement
5/5/2009 Beach Avenue BA10 SABPAL 29.5 683.49 HH 0 43 5/5/2009 Beach Avenue BA10 SABPAL 29.5 683.49 HH 0 43 5/5/2009 Beach Avenue BA10 SABPAL 33 855.30 HH 0 43 5/5/2009 Beach Avenue BA10 SABPAL 21 346.36 HH 0 43 5/5/2009 Beach Avenue BA10 SABPAL 23 415.48 HH 0 43 5/5/2009 Beach Avenue BA10 PINELL 59 2733.98 HH 0 43 5/5/2009 Beach Avenue BA10 QUELAU 8 50.27 HH 0 43 5/5/2009 Beach Avenue BA10 QUELAU 7 38.48 HH 0 43 5/5/2009 Beach Avenue BA10 QUELAU 28 615.75 HH 0 43 5/5/2009 Beach Avenue BA10 QUELAU 7.4 43.01 HH 0 43 5/5/2009 Beach Avenue BA10 ACERUB 8.2 52.81 HH 0 43 5/5/2009 Beach Avenue BA20 SABPAL 34.5 934.82 UTblh3 0 57 5/5/2009 Beach Avenue BA20 QUELAU 24.8 483.05 UTblh3 0 57
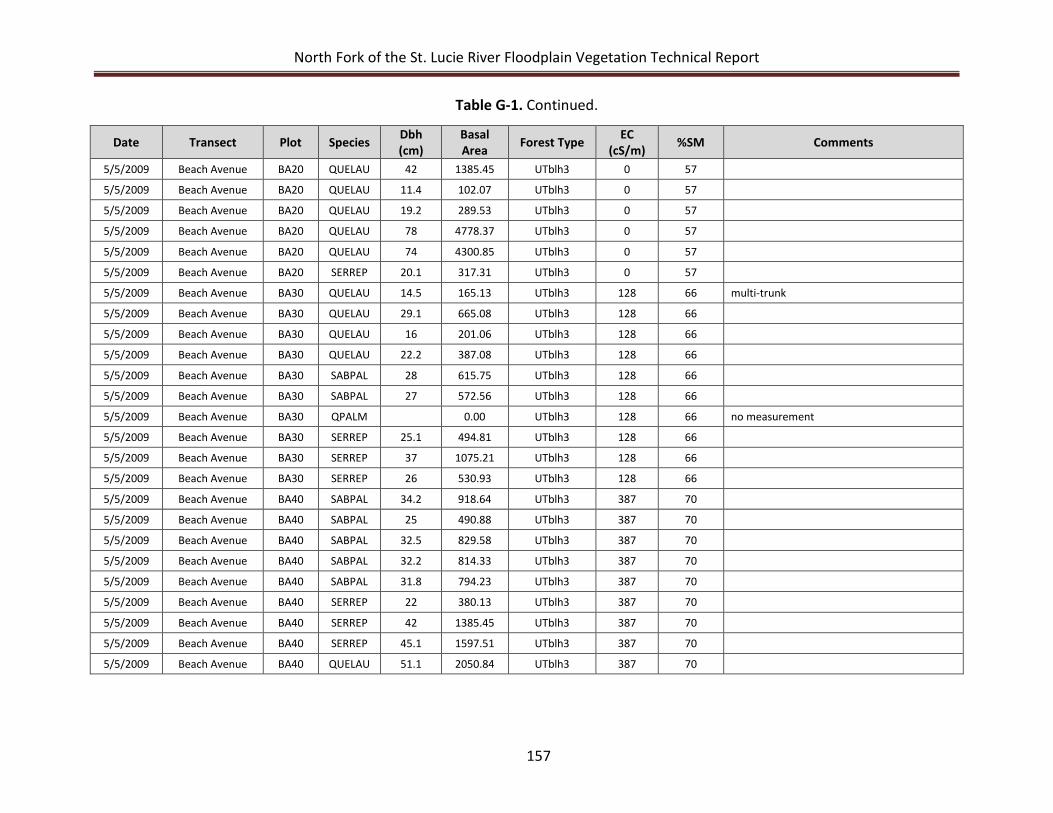
North Fork of the St. Lucie River Floodplain Vegetation Technical Report
157
Table G-1. Continued.
Date Transect Plot Species Dbh (cm)
Basal Area Forest Type EC
(cS/m) %SM Comments
5/5/2009 Beach Avenue BA20 QUELAU 42 1385.45 UTblh3 0 57 5/5/2009 Beach Avenue BA20 QUELAU 11.4 102.07 UTblh3 0 57 5/5/2009 Beach Avenue BA20 QUELAU 19.2 289.53 UTblh3 0 57 5/5/2009 Beach Avenue BA20 QUELAU 78 4778.37 UTblh3 0 57 5/5/2009 Beach Avenue BA20 QUELAU 74 4300.85 UTblh3 0 57 5/5/2009 Beach Avenue BA20 SERREP 20.1 317.31 UTblh3 0 57 5/5/2009 Beach Avenue BA30 QUELAU 14.5 165.13 UTblh3 128 66 multi-trunk
5/5/2009 Beach Avenue BA30 QUELAU 29.1 665.08 UTblh3 128 66 5/5/2009 Beach Avenue BA30 QUELAU 16 201.06 UTblh3 128 66 5/5/2009 Beach Avenue BA30 QUELAU 22.2 387.08 UTblh3 128 66 5/5/2009 Beach Avenue BA30 SABPAL 28 615.75 UTblh3 128 66 5/5/2009 Beach Avenue BA30 SABPAL 27 572.56 UTblh3 128 66 5/5/2009 Beach Avenue BA30 QPALM 0.00 UTblh3 128 66 no measurement
5/5/2009 Beach Avenue BA30 SERREP 25.1 494.81 UTblh3 128 66 5/5/2009 Beach Avenue BA30 SERREP 37 1075.21 UTblh3 128 66 5/5/2009 Beach Avenue BA30 SERREP 26 530.93 UTblh3 128 66 5/5/2009 Beach Avenue BA40 SABPAL 34.2 918.64 UTblh3 387 70 5/5/2009 Beach Avenue BA40 SABPAL 25 490.88 UTblh3 387 70 5/5/2009 Beach Avenue BA40 SABPAL 32.5 829.58 UTblh3 387 70 5/5/2009 Beach Avenue BA40 SABPAL 32.2 814.33 UTblh3 387 70 5/5/2009 Beach Avenue BA40 SABPAL 31.8 794.23 UTblh3 387 70 5/5/2009 Beach Avenue BA40 SERREP 22 380.13 UTblh3 387 70 5/5/2009 Beach Avenue BA40 SERREP 42 1385.45 UTblh3 387 70 5/5/2009 Beach Avenue BA40 SERREP 45.1 1597.51 UTblh3 387 70 5/5/2009 Beach Avenue BA40 QUELAU 51.1 2050.84 UTblh3 387 70
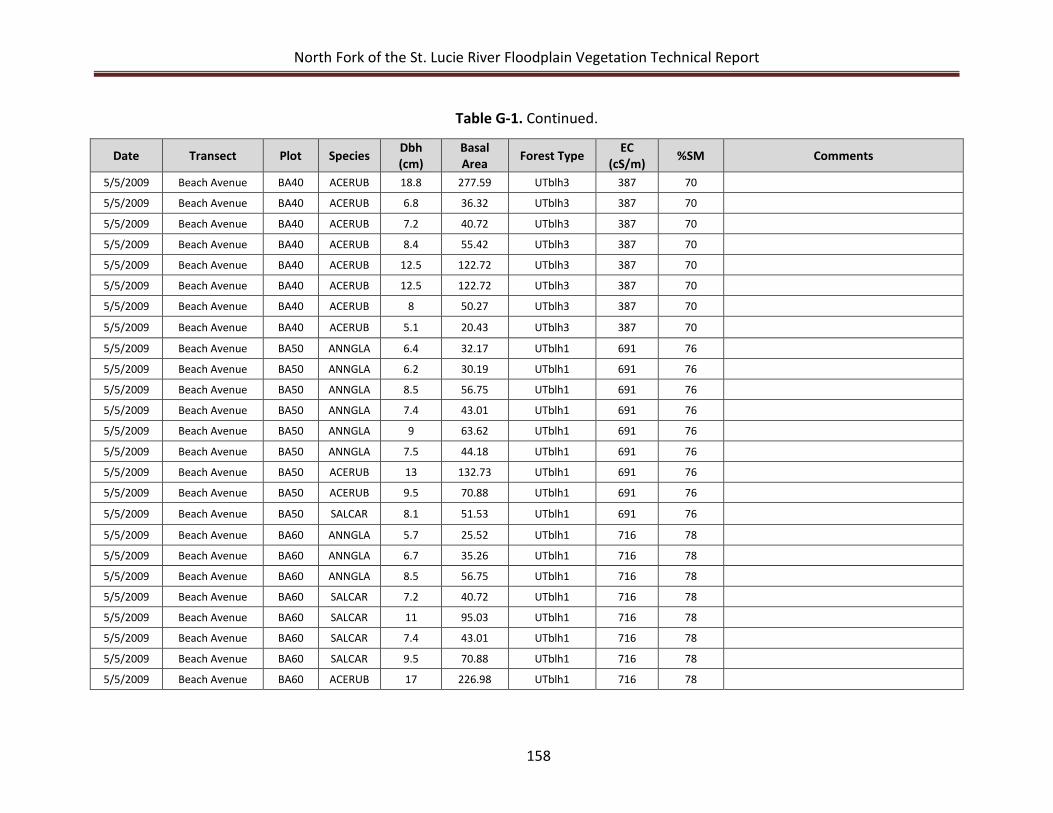
North Fork of the St. Lucie River Floodplain Vegetation Technical Report
158
Table G-1. Continued.
Date Transect Plot Species Dbh (cm)
Basal Area Forest Type EC
(cS/m) %SM Comments
5/5/2009 Beach Avenue BA40 ACERUB 18.8 277.59 UTblh3 387 70 5/5/2009 Beach Avenue BA40 ACERUB 6.8 36.32 UTblh3 387 70 5/5/2009 Beach Avenue BA40 ACERUB 7.2 40.72 UTblh3 387 70 5/5/2009 Beach Avenue BA40 ACERUB 8.4 55.42 UTblh3 387 70 5/5/2009 Beach Avenue BA40 ACERUB 12.5 122.72 UTblh3 387 70 5/5/2009 Beach Avenue BA40 ACERUB 12.5 122.72 UTblh3 387 70 5/5/2009 Beach Avenue BA40 ACERUB 8 50.27 UTblh3 387 70 5/5/2009 Beach Avenue BA40 ACERUB 5.1 20.43 UTblh3 387 70 5/5/2009 Beach Avenue BA50 ANNGLA 6.4 32.17 UTblh1 691 76 5/5/2009 Beach Avenue BA50 ANNGLA 6.2 30.19 UTblh1 691 76 5/5/2009 Beach Avenue BA50 ANNGLA 8.5 56.75 UTblh1 691 76 5/5/2009 Beach Avenue BA50 ANNGLA 7.4 43.01 UTblh1 691 76 5/5/2009 Beach Avenue BA50 ANNGLA 9 63.62 UTblh1 691 76 5/5/2009 Beach Avenue BA50 ANNGLA 7.5 44.18 UTblh1 691 76 5/5/2009 Beach Avenue BA50 ACERUB 13 132.73 UTblh1 691 76 5/5/2009 Beach Avenue BA50 ACERUB 9.5 70.88 UTblh1 691 76 5/5/2009 Beach Avenue BA50 SALCAR 8.1 51.53 UTblh1 691 76 5/5/2009 Beach Avenue BA60 ANNGLA 5.7 25.52 UTblh1 716 78 5/5/2009 Beach Avenue BA60 ANNGLA 6.7 35.26 UTblh1 716 78 5/5/2009 Beach Avenue BA60 ANNGLA 8.5 56.75 UTblh1 716 78 5/5/2009 Beach Avenue BA60 SALCAR 7.2 40.72 UTblh1 716 78 5/5/2009 Beach Avenue BA60 SALCAR 11 95.03 UTblh1 716 78 5/5/2009 Beach Avenue BA60 SALCAR 7.4 43.01 UTblh1 716 78 5/5/2009 Beach Avenue BA60 SALCAR 9.5 70.88 UTblh1 716 78 5/5/2009 Beach Avenue BA60 ACERUB 17 226.98 UTblh1 716 78
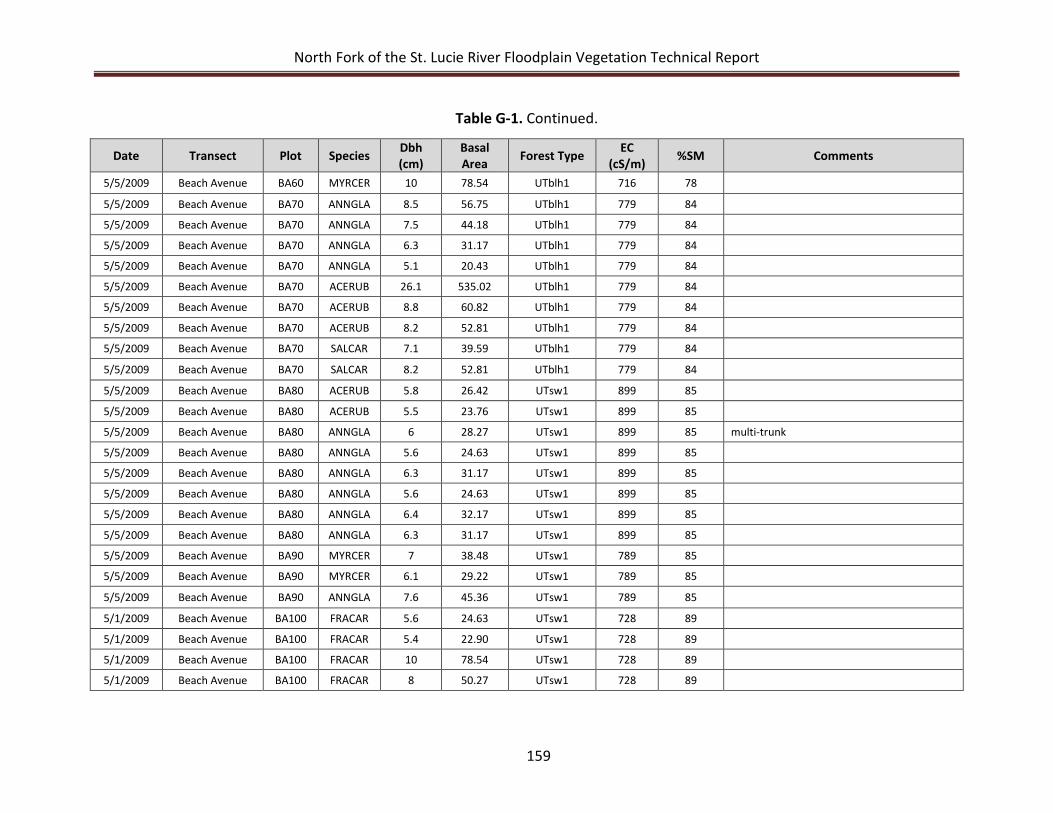
North Fork of the St. Lucie River Floodplain Vegetation Technical Report
159
Table G-1. Continued.
Date Transect Plot Species Dbh (cm)
Basal Area Forest Type EC
(cS/m) %SM Comments
5/5/2009 Beach Avenue BA60 MYRCER 10 78.54 UTblh1 716 78 5/5/2009 Beach Avenue BA70 ANNGLA 8.5 56.75 UTblh1 779 84 5/5/2009 Beach Avenue BA70 ANNGLA 7.5 44.18 UTblh1 779 84 5/5/2009 Beach Avenue BA70 ANNGLA 6.3 31.17 UTblh1 779 84 5/5/2009 Beach Avenue BA70 ANNGLA 5.1 20.43 UTblh1 779 84 5/5/2009 Beach Avenue BA70 ACERUB 26.1 535.02 UTblh1 779 84 5/5/2009 Beach Avenue BA70 ACERUB 8.8 60.82 UTblh1 779 84 5/5/2009 Beach Avenue BA70 ACERUB 8.2 52.81 UTblh1 779 84 5/5/2009 Beach Avenue BA70 SALCAR 7.1 39.59 UTblh1 779 84 5/5/2009 Beach Avenue BA70 SALCAR 8.2 52.81 UTblh1 779 84 5/5/2009 Beach Avenue BA80 ACERUB 5.8 26.42 UTsw1 899 85 5/5/2009 Beach Avenue BA80 ACERUB 5.5 23.76 UTsw1 899 85 5/5/2009 Beach Avenue BA80 ANNGLA 6 28.27 UTsw1 899 85 multi-trunk
5/5/2009 Beach Avenue BA80 ANNGLA 5.6 24.63 UTsw1 899 85 5/5/2009 Beach Avenue BA80 ANNGLA 6.3 31.17 UTsw1 899 85 5/5/2009 Beach Avenue BA80 ANNGLA 5.6 24.63 UTsw1 899 85 5/5/2009 Beach Avenue BA80 ANNGLA 6.4 32.17 UTsw1 899 85 5/5/2009 Beach Avenue BA80 ANNGLA 6.3 31.17 UTsw1 899 85 5/5/2009 Beach Avenue BA90 MYRCER 7 38.48 UTsw1 789 85 5/5/2009 Beach Avenue BA90 MYRCER 6.1 29.22 UTsw1 789 85 5/5/2009 Beach Avenue BA90 ANNGLA 7.6 45.36 UTsw1 789 85 5/1/2009 Beach Avenue BA100 FRACAR 5.6 24.63 UTsw1 728 89 5/1/2009 Beach Avenue BA100 FRACAR 5.4 22.90 UTsw1 728 89 5/1/2009 Beach Avenue BA100 FRACAR 10 78.54 UTsw1 728 89 5/1/2009 Beach Avenue BA100 FRACAR 8 50.27 UTsw1 728 89
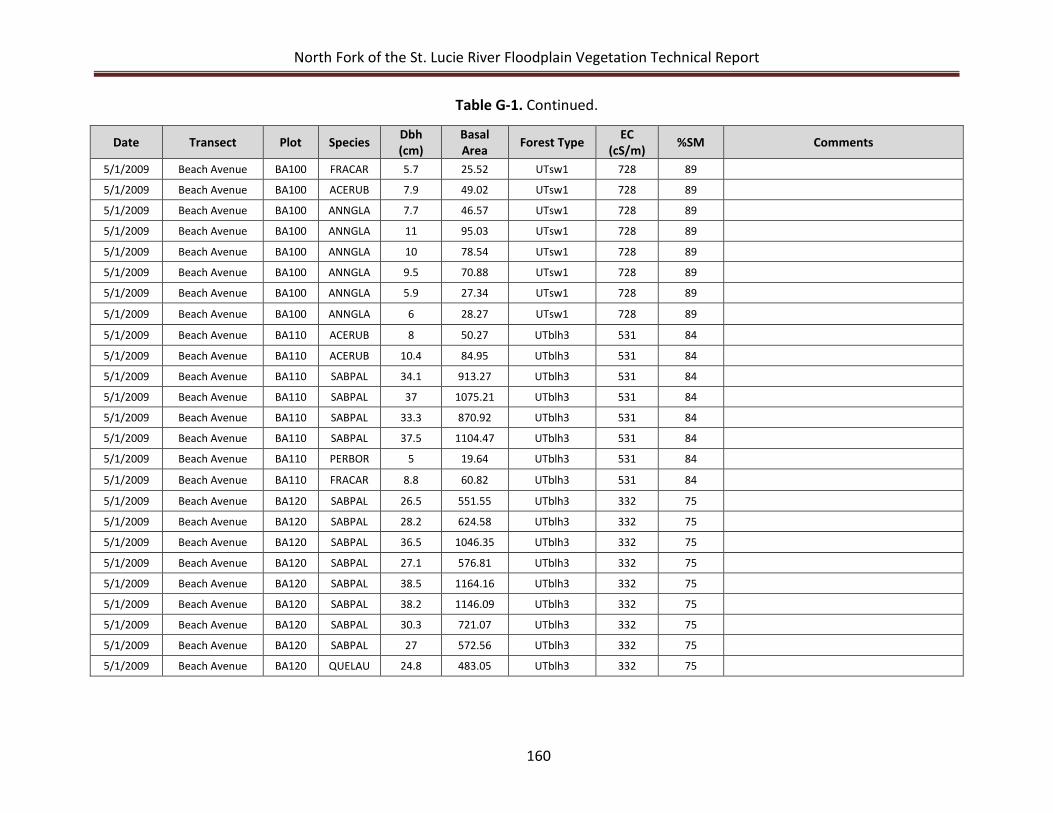
North Fork of the St. Lucie River Floodplain Vegetation Technical Report
160
Table G-1. Continued.
Date Transect Plot Species Dbh (cm)
Basal Area Forest Type EC
(cS/m) %SM Comments
5/1/2009 Beach Avenue BA100 FRACAR 5.7 25.52 UTsw1 728 89 5/1/2009 Beach Avenue BA100 ACERUB 7.9 49.02 UTsw1 728 89 5/1/2009 Beach Avenue BA100 ANNGLA 7.7 46.57 UTsw1 728 89 5/1/2009 Beach Avenue BA100 ANNGLA 11 95.03 UTsw1 728 89 5/1/2009 Beach Avenue BA100 ANNGLA 10 78.54 UTsw1 728 89 5/1/2009 Beach Avenue BA100 ANNGLA 9.5 70.88 UTsw1 728 89 5/1/2009 Beach Avenue BA100 ANNGLA 5.9 27.34 UTsw1 728 89 5/1/2009 Beach Avenue BA100 ANNGLA 6 28.27 UTsw1 728 89 5/1/2009 Beach Avenue BA110 ACERUB 8 50.27 UTblh3 531 84 5/1/2009 Beach Avenue BA110 ACERUB 10.4 84.95 UTblh3 531 84 5/1/2009 Beach Avenue BA110 SABPAL 34.1 913.27 UTblh3 531 84 5/1/2009 Beach Avenue BA110 SABPAL 37 1075.21 UTblh3 531 84 5/1/2009 Beach Avenue BA110 SABPAL 33.3 870.92 UTblh3 531 84 5/1/2009 Beach Avenue BA110 SABPAL 37.5 1104.47 UTblh3 531 84 5/1/2009 Beach Avenue BA110 PERBOR 5 19.64 UTblh3 531 84 5/1/2009 Beach Avenue BA110 FRACAR 8.8 60.82 UTblh3 531 84 5/1/2009 Beach Avenue BA120 SABPAL 26.5 551.55 UTblh3 332 75 5/1/2009 Beach Avenue BA120 SABPAL 28.2 624.58 UTblh3 332 75 5/1/2009 Beach Avenue BA120 SABPAL 36.5 1046.35 UTblh3 332 75 5/1/2009 Beach Avenue BA120 SABPAL 27.1 576.81 UTblh3 332 75 5/1/2009 Beach Avenue BA120 SABPAL 38.5 1164.16 UTblh3 332 75 5/1/2009 Beach Avenue BA120 SABPAL 38.2 1146.09 UTblh3 332 75 5/1/2009 Beach Avenue BA120 SABPAL 30.3 721.07 UTblh3 332 75 5/1/2009 Beach Avenue BA120 SABPAL 27 572.56 UTblh3 332 75 5/1/2009 Beach Avenue BA120 QUELAU 24.8 483.05 UTblh3 332 75
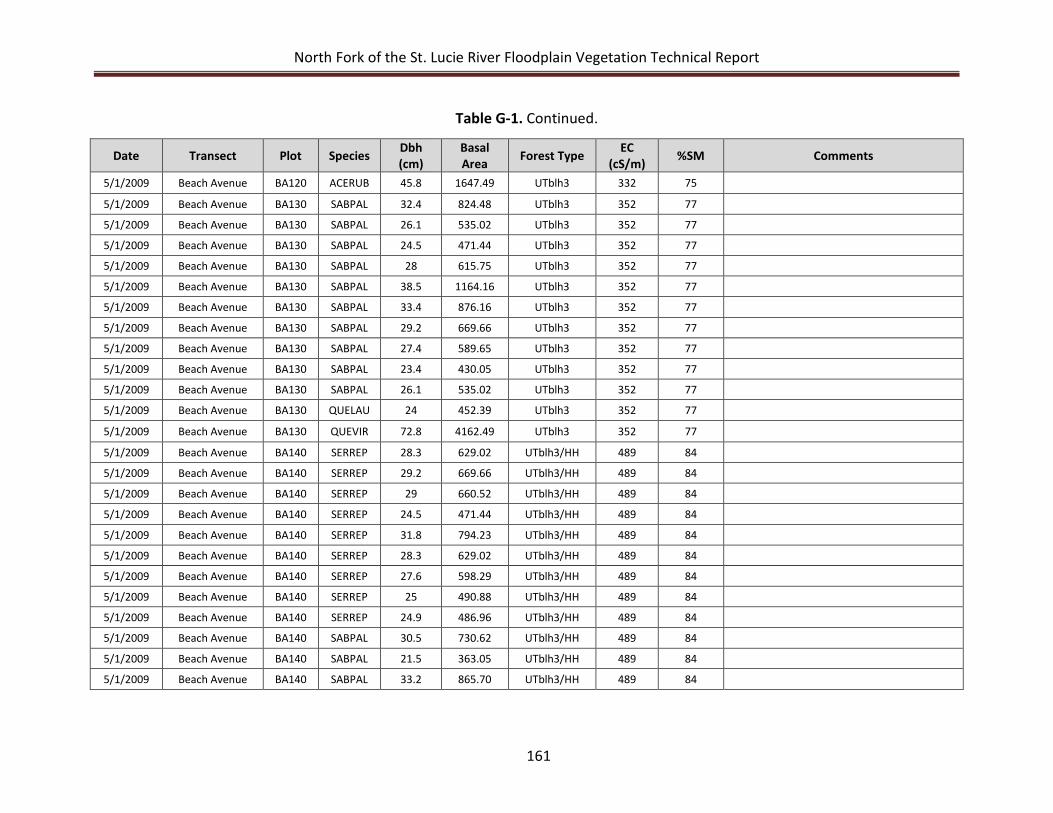
North Fork of the St. Lucie River Floodplain Vegetation Technical Report
161
Table G-1. Continued.
Date Transect Plot Species Dbh (cm)
Basal Area Forest Type EC
(cS/m) %SM Comments
5/1/2009 Beach Avenue BA120 ACERUB 45.8 1647.49 UTblh3 332 75 5/1/2009 Beach Avenue BA130 SABPAL 32.4 824.48 UTblh3 352 77 5/1/2009 Beach Avenue BA130 SABPAL 26.1 535.02 UTblh3 352 77 5/1/2009 Beach Avenue BA130 SABPAL 24.5 471.44 UTblh3 352 77 5/1/2009 Beach Avenue BA130 SABPAL 28 615.75 UTblh3 352 77 5/1/2009 Beach Avenue BA130 SABPAL 38.5 1164.16 UTblh3 352 77 5/1/2009 Beach Avenue BA130 SABPAL 33.4 876.16 UTblh3 352 77 5/1/2009 Beach Avenue BA130 SABPAL 29.2 669.66 UTblh3 352 77 5/1/2009 Beach Avenue BA130 SABPAL 27.4 589.65 UTblh3 352 77 5/1/2009 Beach Avenue BA130 SABPAL 23.4 430.05 UTblh3 352 77 5/1/2009 Beach Avenue BA130 SABPAL 26.1 535.02 UTblh3 352 77 5/1/2009 Beach Avenue BA130 QUELAU 24 452.39 UTblh3 352 77 5/1/2009 Beach Avenue BA130 QUEVIR 72.8 4162.49 UTblh3 352 77 5/1/2009 Beach Avenue BA140 SERREP 28.3 629.02 UTblh3/HH 489 84 5/1/2009 Beach Avenue BA140 SERREP 29.2 669.66 UTblh3/HH 489 84 5/1/2009 Beach Avenue BA140 SERREP 29 660.52 UTblh3/HH 489 84 5/1/2009 Beach Avenue BA140 SERREP 24.5 471.44 UTblh3/HH 489 84 5/1/2009 Beach Avenue BA140 SERREP 31.8 794.23 UTblh3/HH 489 84 5/1/2009 Beach Avenue BA140 SERREP 28.3 629.02 UTblh3/HH 489 84 5/1/2009 Beach Avenue BA140 SERREP 27.6 598.29 UTblh3/HH 489 84 5/1/2009 Beach Avenue BA140 SERREP 25 490.88 UTblh3/HH 489 84 5/1/2009 Beach Avenue BA140 SERREP 24.9 486.96 UTblh3/HH 489 84 5/1/2009 Beach Avenue BA140 SABPAL 30.5 730.62 UTblh3/HH 489 84 5/1/2009 Beach Avenue BA140 SABPAL 21.5 363.05 UTblh3/HH 489 84 5/1/2009 Beach Avenue BA140 SABPAL 33.2 865.70 UTblh3/HH 489 84
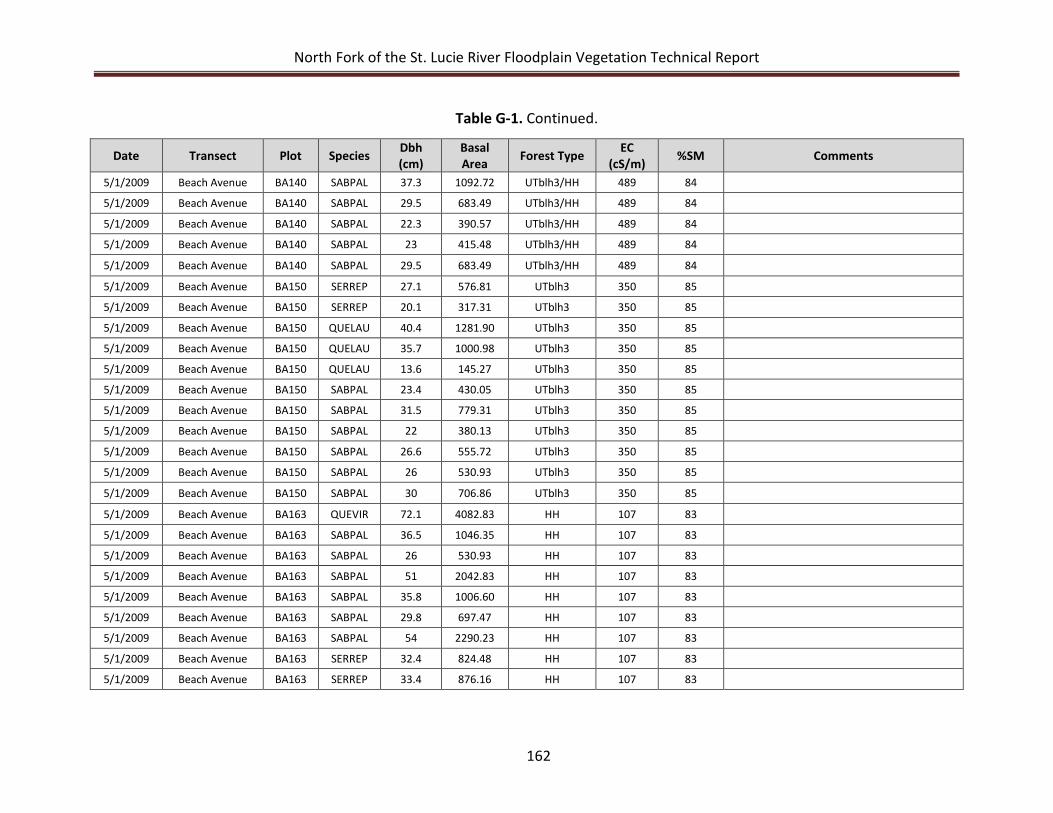
North Fork of the St. Lucie River Floodplain Vegetation Technical Report
162
Table G-1. Continued.
Date Transect Plot Species Dbh (cm)
Basal Area Forest Type EC
(cS/m) %SM Comments
5/1/2009 Beach Avenue BA140 SABPAL 37.3 1092.72 UTblh3/HH 489 84 5/1/2009 Beach Avenue BA140 SABPAL 29.5 683.49 UTblh3/HH 489 84 5/1/2009 Beach Avenue BA140 SABPAL 22.3 390.57 UTblh3/HH 489 84 5/1/2009 Beach Avenue BA140 SABPAL 23 415.48 UTblh3/HH 489 84 5/1/2009 Beach Avenue BA140 SABPAL 29.5 683.49 UTblh3/HH 489 84 5/1/2009 Beach Avenue BA150 SERREP 27.1 576.81 UTblh3 350 85 5/1/2009 Beach Avenue BA150 SERREP 20.1 317.31 UTblh3 350 85 5/1/2009 Beach Avenue BA150 QUELAU 40.4 1281.90 UTblh3 350 85 5/1/2009 Beach Avenue BA150 QUELAU 35.7 1000.98 UTblh3 350 85 5/1/2009 Beach Avenue BA150 QUELAU 13.6 145.27 UTblh3 350 85 5/1/2009 Beach Avenue BA150 SABPAL 23.4 430.05 UTblh3 350 85 5/1/2009 Beach Avenue BA150 SABPAL 31.5 779.31 UTblh3 350 85 5/1/2009 Beach Avenue BA150 SABPAL 22 380.13 UTblh3 350 85 5/1/2009 Beach Avenue BA150 SABPAL 26.6 555.72 UTblh3 350 85 5/1/2009 Beach Avenue BA150 SABPAL 26 530.93 UTblh3 350 85 5/1/2009 Beach Avenue BA150 SABPAL 30 706.86 UTblh3 350 85 5/1/2009 Beach Avenue BA163 QUEVIR 72.1 4082.83 HH 107 83 5/1/2009 Beach Avenue BA163 SABPAL 36.5 1046.35 HH 107 83 5/1/2009 Beach Avenue BA163 SABPAL 26 530.93 HH 107 83 5/1/2009 Beach Avenue BA163 SABPAL 51 2042.83 HH 107 83 5/1/2009 Beach Avenue BA163 SABPAL 35.8 1006.60 HH 107 83 5/1/2009 Beach Avenue BA163 SABPAL 29.8 697.47 HH 107 83 5/1/2009 Beach Avenue BA163 SABPAL 54 2290.23 HH 107 83 5/1/2009 Beach Avenue BA163 SERREP 32.4 824.48 HH 107 83 5/1/2009 Beach Avenue BA163 SERREP 33.4 876.16 HH 107 83
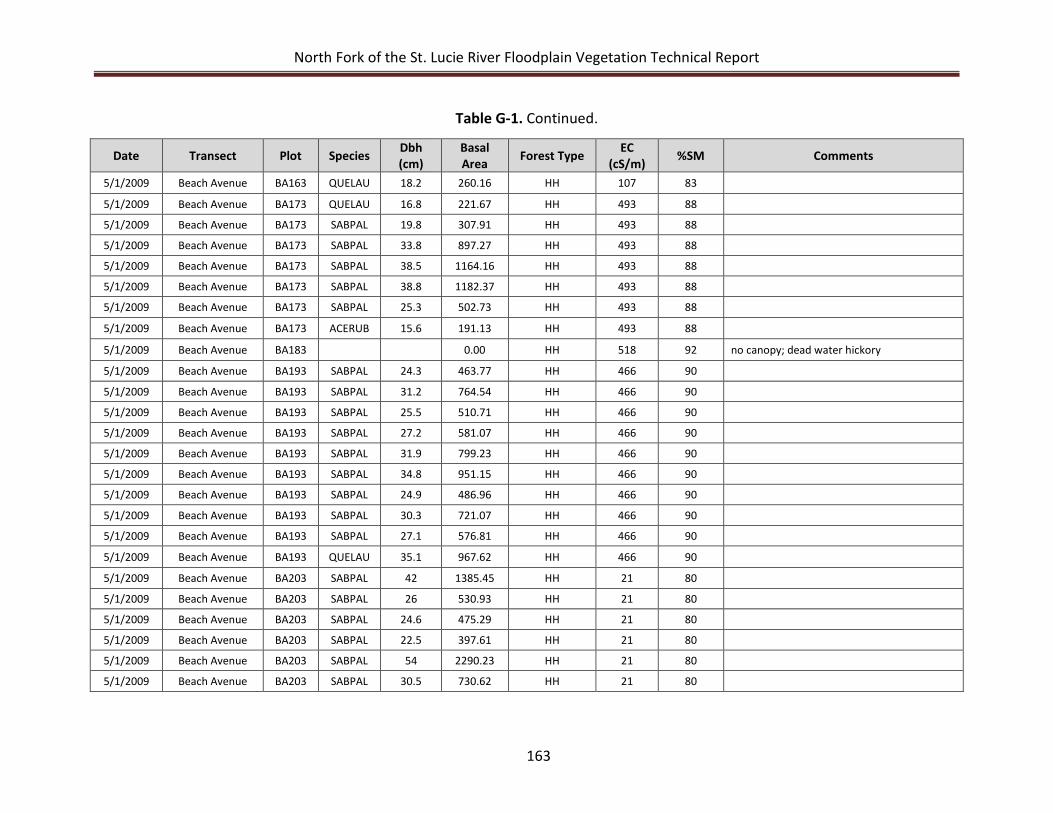
North Fork of the St. Lucie River Floodplain Vegetation Technical Report
163
Table G-1. Continued.
Date Transect Plot Species Dbh (cm)
Basal Area Forest Type EC
(cS/m) %SM Comments
5/1/2009 Beach Avenue BA163 QUELAU 18.2 260.16 HH 107 83 5/1/2009 Beach Avenue BA173 QUELAU 16.8 221.67 HH 493 88 5/1/2009 Beach Avenue BA173 SABPAL 19.8 307.91 HH 493 88 5/1/2009 Beach Avenue BA173 SABPAL 33.8 897.27 HH 493 88 5/1/2009 Beach Avenue BA173 SABPAL 38.5 1164.16 HH 493 88 5/1/2009 Beach Avenue BA173 SABPAL 38.8 1182.37 HH 493 88 5/1/2009 Beach Avenue BA173 SABPAL 25.3 502.73 HH 493 88 5/1/2009 Beach Avenue BA173 ACERUB 15.6 191.13 HH 493 88 5/1/2009 Beach Avenue BA183 0.00 HH 518 92 no canopy; dead water hickory
5/1/2009 Beach Avenue BA193 SABPAL 24.3 463.77 HH 466 90 5/1/2009 Beach Avenue BA193 SABPAL 31.2 764.54 HH 466 90 5/1/2009 Beach Avenue BA193 SABPAL 25.5 510.71 HH 466 90 5/1/2009 Beach Avenue BA193 SABPAL 27.2 581.07 HH 466 90 5/1/2009 Beach Avenue BA193 SABPAL 31.9 799.23 HH 466 90 5/1/2009 Beach Avenue BA193 SABPAL 34.8 951.15 HH 466 90 5/1/2009 Beach Avenue BA193 SABPAL 24.9 486.96 HH 466 90 5/1/2009 Beach Avenue BA193 SABPAL 30.3 721.07 HH 466 90 5/1/2009 Beach Avenue BA193 SABPAL 27.1 576.81 HH 466 90 5/1/2009 Beach Avenue BA193 QUELAU 35.1 967.62 HH 466 90 5/1/2009 Beach Avenue BA203 SABPAL 42 1385.45 HH 21 80 5/1/2009 Beach Avenue BA203 SABPAL 26 530.93 HH 21 80 5/1/2009 Beach Avenue BA203 SABPAL 24.6 475.29 HH 21 80 5/1/2009 Beach Avenue BA203 SABPAL 22.5 397.61 HH 21 80 5/1/2009 Beach Avenue BA203 SABPAL 54 2290.23 HH 21 80 5/1/2009 Beach Avenue BA203 SABPAL 30.5 730.62 HH 21 80
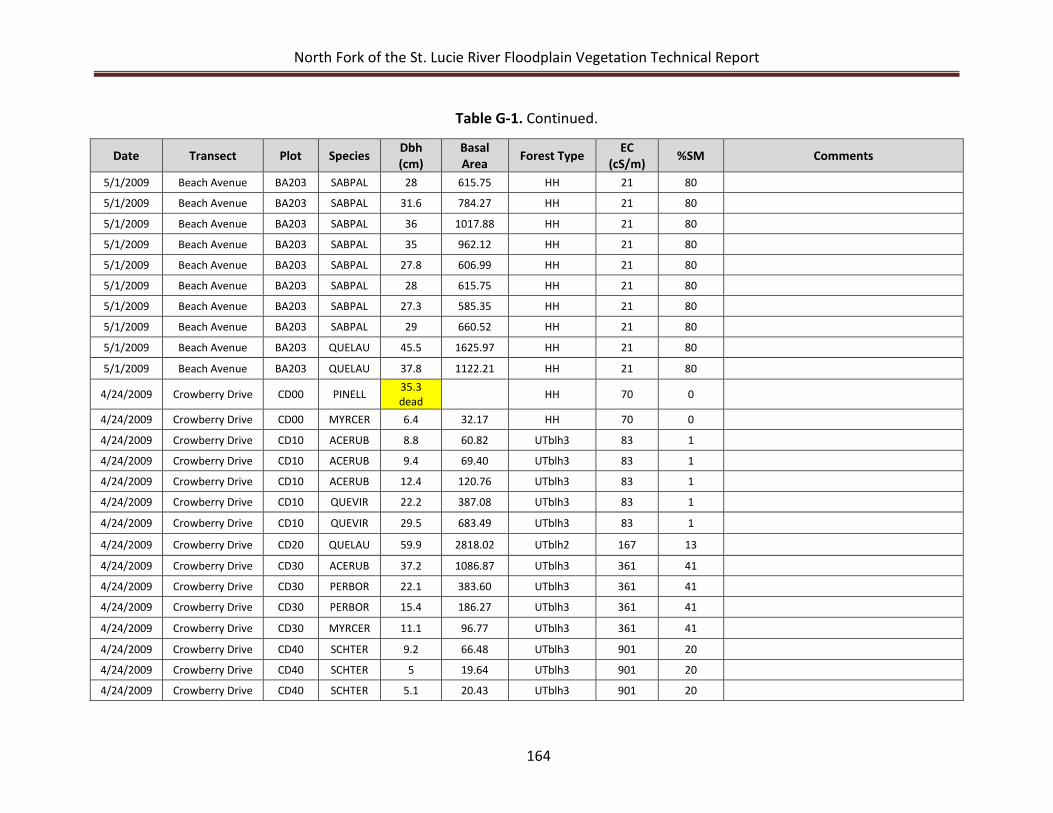
North Fork of the St. Lucie River Floodplain Vegetation Technical Report
164
Table G-1. Continued.
Date Transect Plot Species Dbh (cm)
Basal Area Forest Type EC
(cS/m) %SM Comments
5/1/2009 Beach Avenue BA203 SABPAL 28 615.75 HH 21 80 5/1/2009 Beach Avenue BA203 SABPAL 31.6 784.27 HH 21 80 5/1/2009 Beach Avenue BA203 SABPAL 36 1017.88 HH 21 80 5/1/2009 Beach Avenue BA203 SABPAL 35 962.12 HH 21 80 5/1/2009 Beach Avenue BA203 SABPAL 27.8 606.99 HH 21 80 5/1/2009 Beach Avenue BA203 SABPAL 28 615.75 HH 21 80 5/1/2009 Beach Avenue BA203 SABPAL 27.3 585.35 HH 21 80 5/1/2009 Beach Avenue BA203 SABPAL 29 660.52 HH 21 80 5/1/2009 Beach Avenue BA203 QUELAU 45.5 1625.97 HH 21 80 5/1/2009 Beach Avenue BA203 QUELAU 37.8 1122.21 HH 21 80
4/24/2009 Crowberry Drive CD00 PINELL 35.3 dead HH 70 0
4/24/2009 Crowberry Drive CD00 MYRCER 6.4 32.17 HH 70 0 4/24/2009 Crowberry Drive CD10 ACERUB 8.8 60.82 UTblh3 83 1 4/24/2009 Crowberry Drive CD10 ACERUB 9.4 69.40 UTblh3 83 1 4/24/2009 Crowberry Drive CD10 ACERUB 12.4 120.76 UTblh3 83 1 4/24/2009 Crowberry Drive CD10 QUEVIR 22.2 387.08 UTblh3 83 1 4/24/2009 Crowberry Drive CD10 QUEVIR 29.5 683.49 UTblh3 83 1 4/24/2009 Crowberry Drive CD20 QUELAU 59.9 2818.02 UTblh2 167 13 4/24/2009 Crowberry Drive CD30 ACERUB 37.2 1086.87 UTblh3 361 41 4/24/2009 Crowberry Drive CD30 PERBOR 22.1 383.60 UTblh3 361 41 4/24/2009 Crowberry Drive CD30 PERBOR 15.4 186.27 UTblh3 361 41 4/24/2009 Crowberry Drive CD30 MYRCER 11.1 96.77 UTblh3 361 41 4/24/2009 Crowberry Drive CD40 SCHTER 9.2 66.48 UTblh3 901 20 4/24/2009 Crowberry Drive CD40 SCHTER 5 19.64 UTblh3 901 20 4/24/2009 Crowberry Drive CD40 SCHTER 5.1 20.43 UTblh3 901 20
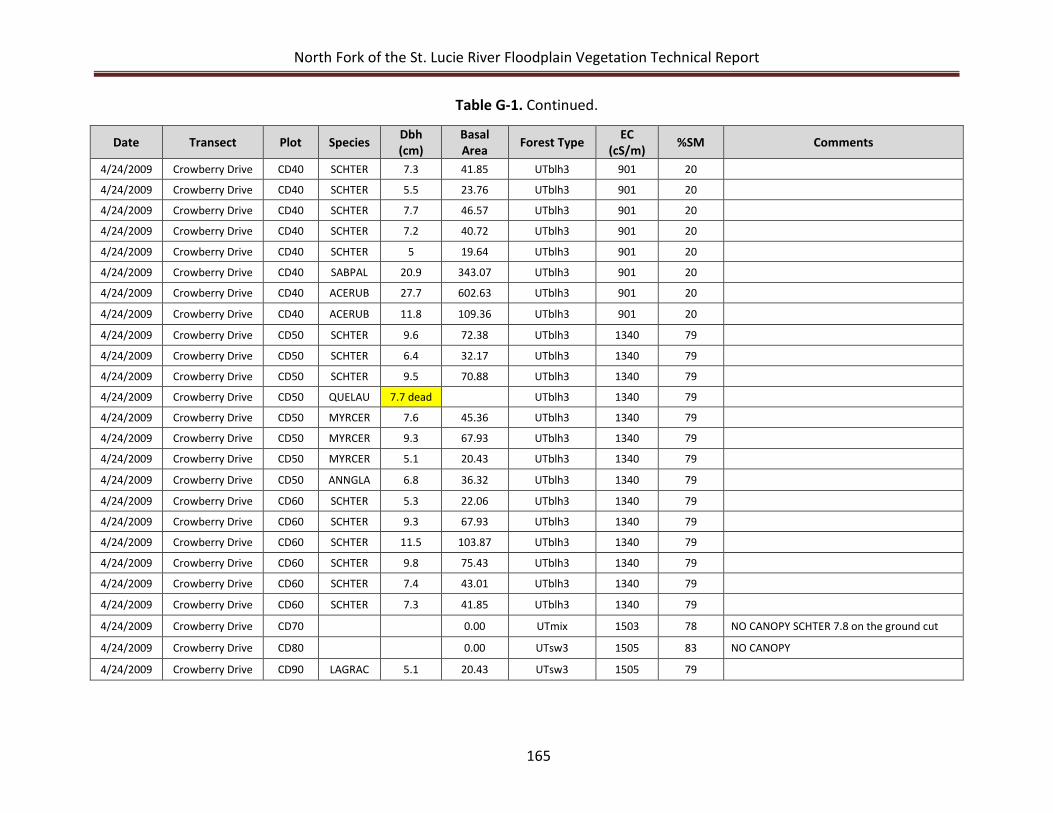
North Fork of the St. Lucie River Floodplain Vegetation Technical Report
165
Table G-1. Continued.
Date Transect Plot Species Dbh (cm)
Basal Area Forest Type EC
(cS/m) %SM Comments
4/24/2009 Crowberry Drive CD40 SCHTER 7.3 41.85 UTblh3 901 20 4/24/2009 Crowberry Drive CD40 SCHTER 5.5 23.76 UTblh3 901 20 4/24/2009 Crowberry Drive CD40 SCHTER 7.7 46.57 UTblh3 901 20 4/24/2009 Crowberry Drive CD40 SCHTER 7.2 40.72 UTblh3 901 20 4/24/2009 Crowberry Drive CD40 SCHTER 5 19.64 UTblh3 901 20 4/24/2009 Crowberry Drive CD40 SABPAL 20.9 343.07 UTblh3 901 20 4/24/2009 Crowberry Drive CD40 ACERUB 27.7 602.63 UTblh3 901 20 4/24/2009 Crowberry Drive CD40 ACERUB 11.8 109.36 UTblh3 901 20 4/24/2009 Crowberry Drive CD50 SCHTER 9.6 72.38 UTblh3 1340 79 4/24/2009 Crowberry Drive CD50 SCHTER 6.4 32.17 UTblh3 1340 79 4/24/2009 Crowberry Drive CD50 SCHTER 9.5 70.88 UTblh3 1340 79 4/24/2009 Crowberry Drive CD50 QUELAU 7.7 dead UTblh3 1340 79 4/24/2009 Crowberry Drive CD50 MYRCER 7.6 45.36 UTblh3 1340 79 4/24/2009 Crowberry Drive CD50 MYRCER 9.3 67.93 UTblh3 1340 79 4/24/2009 Crowberry Drive CD50 MYRCER 5.1 20.43 UTblh3 1340 79 4/24/2009 Crowberry Drive CD50 ANNGLA 6.8 36.32 UTblh3 1340 79 4/24/2009 Crowberry Drive CD60 SCHTER 5.3 22.06 UTblh3 1340 79 4/24/2009 Crowberry Drive CD60 SCHTER 9.3 67.93 UTblh3 1340 79 4/24/2009 Crowberry Drive CD60 SCHTER 11.5 103.87 UTblh3 1340 79 4/24/2009 Crowberry Drive CD60 SCHTER 9.8 75.43 UTblh3 1340 79 4/24/2009 Crowberry Drive CD60 SCHTER 7.4 43.01 UTblh3 1340 79 4/24/2009 Crowberry Drive CD60 SCHTER 7.3 41.85 UTblh3 1340 79 4/24/2009 Crowberry Drive CD70 0.00 UTmix 1503 78 NO CANOPY SCHTER 7.8 on the ground cut
4/24/2009 Crowberry Drive CD80 0.00 UTsw3 1505 83 NO CANOPY
4/24/2009 Crowberry Drive CD90 LAGRAC 5.1 20.43 UTsw3 1505 79
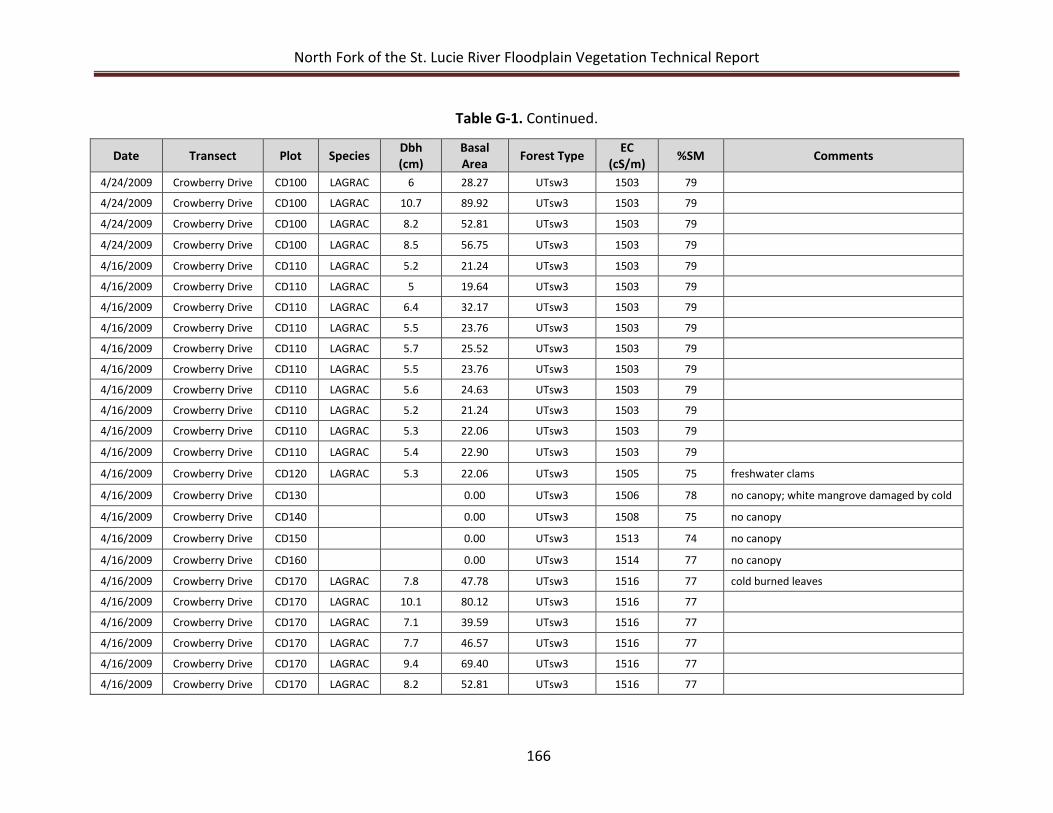
North Fork of the St. Lucie River Floodplain Vegetation Technical Report
166
Table G-1. Continued.
Date Transect Plot Species Dbh (cm)
Basal Area Forest Type EC
(cS/m) %SM Comments
4/24/2009 Crowberry Drive CD100 LAGRAC 6 28.27 UTsw3 1503 79 4/24/2009 Crowberry Drive CD100 LAGRAC 10.7 89.92 UTsw3 1503 79 4/24/2009 Crowberry Drive CD100 LAGRAC 8.2 52.81 UTsw3 1503 79 4/24/2009 Crowberry Drive CD100 LAGRAC 8.5 56.75 UTsw3 1503 79 4/16/2009 Crowberry Drive CD110 LAGRAC 5.2 21.24 UTsw3 1503 79 4/16/2009 Crowberry Drive CD110 LAGRAC 5 19.64 UTsw3 1503 79 4/16/2009 Crowberry Drive CD110 LAGRAC 6.4 32.17 UTsw3 1503 79 4/16/2009 Crowberry Drive CD110 LAGRAC 5.5 23.76 UTsw3 1503 79 4/16/2009 Crowberry Drive CD110 LAGRAC 5.7 25.52 UTsw3 1503 79 4/16/2009 Crowberry Drive CD110 LAGRAC 5.5 23.76 UTsw3 1503 79 4/16/2009 Crowberry Drive CD110 LAGRAC 5.6 24.63 UTsw3 1503 79 4/16/2009 Crowberry Drive CD110 LAGRAC 5.2 21.24 UTsw3 1503 79 4/16/2009 Crowberry Drive CD110 LAGRAC 5.3 22.06 UTsw3 1503 79 4/16/2009 Crowberry Drive CD110 LAGRAC 5.4 22.90 UTsw3 1503 79 4/16/2009 Crowberry Drive CD120 LAGRAC 5.3 22.06 UTsw3 1505 75 freshwater clams
4/16/2009 Crowberry Drive CD130 0.00 UTsw3 1506 78 no canopy; white mangrove damaged by cold
4/16/2009 Crowberry Drive CD140 0.00 UTsw3 1508 75 no canopy
4/16/2009 Crowberry Drive CD150 0.00 UTsw3 1513 74 no canopy
4/16/2009 Crowberry Drive CD160 0.00 UTsw3 1514 77 no canopy
4/16/2009 Crowberry Drive CD170 LAGRAC 7.8 47.78 UTsw3 1516 77 cold burned leaves
4/16/2009 Crowberry Drive CD170 LAGRAC 10.1 80.12 UTsw3 1516 77 4/16/2009 Crowberry Drive CD170 LAGRAC 7.1 39.59 UTsw3 1516 77 4/16/2009 Crowberry Drive CD170 LAGRAC 7.7 46.57 UTsw3 1516 77 4/16/2009 Crowberry Drive CD170 LAGRAC 9.4 69.40 UTsw3 1516 77 4/16/2009 Crowberry Drive CD170 LAGRAC 8.2 52.81 UTsw3 1516 77
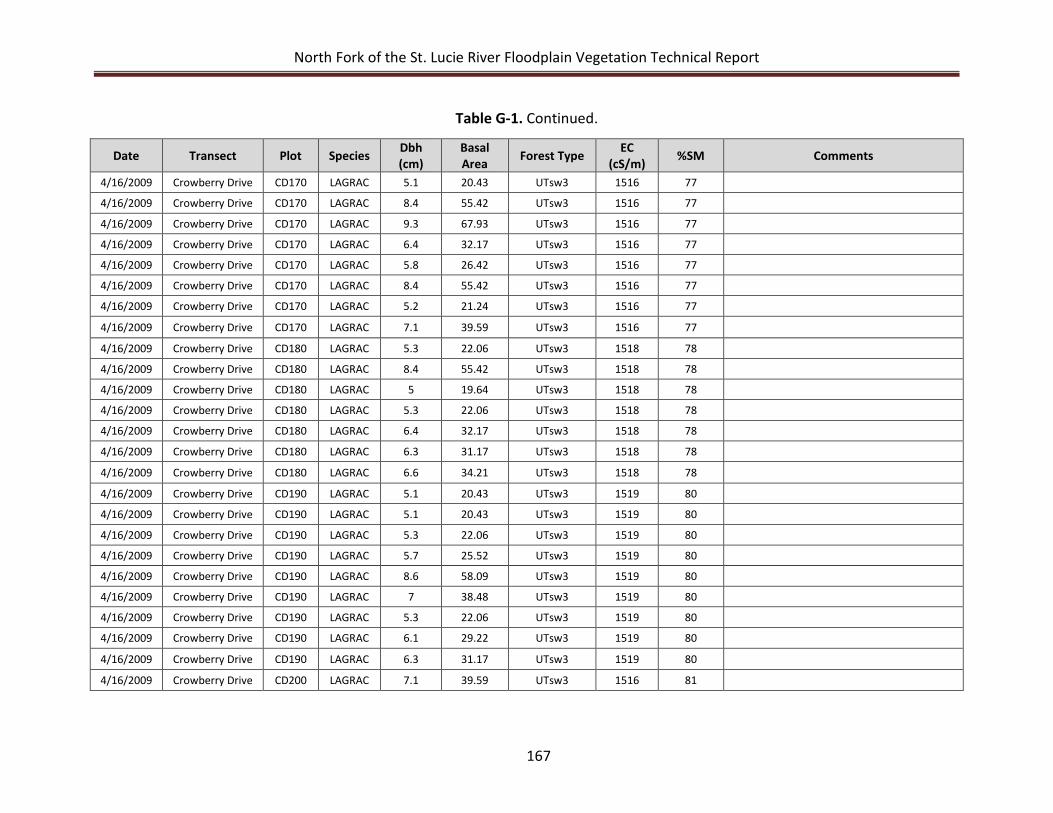
North Fork of the St. Lucie River Floodplain Vegetation Technical Report
167
Table G-1. Continued.
Date Transect Plot Species Dbh (cm)
Basal Area Forest Type EC
(cS/m) %SM Comments
4/16/2009 Crowberry Drive CD170 LAGRAC 5.1 20.43 UTsw3 1516 77 4/16/2009 Crowberry Drive CD170 LAGRAC 8.4 55.42 UTsw3 1516 77 4/16/2009 Crowberry Drive CD170 LAGRAC 9.3 67.93 UTsw3 1516 77 4/16/2009 Crowberry Drive CD170 LAGRAC 6.4 32.17 UTsw3 1516 77 4/16/2009 Crowberry Drive CD170 LAGRAC 5.8 26.42 UTsw3 1516 77 4/16/2009 Crowberry Drive CD170 LAGRAC 8.4 55.42 UTsw3 1516 77 4/16/2009 Crowberry Drive CD170 LAGRAC 5.2 21.24 UTsw3 1516 77 4/16/2009 Crowberry Drive CD170 LAGRAC 7.1 39.59 UTsw3 1516 77 4/16/2009 Crowberry Drive CD180 LAGRAC 5.3 22.06 UTsw3 1518 78 4/16/2009 Crowberry Drive CD180 LAGRAC 8.4 55.42 UTsw3 1518 78 4/16/2009 Crowberry Drive CD180 LAGRAC 5 19.64 UTsw3 1518 78 4/16/2009 Crowberry Drive CD180 LAGRAC 5.3 22.06 UTsw3 1518 78 4/16/2009 Crowberry Drive CD180 LAGRAC 6.4 32.17 UTsw3 1518 78 4/16/2009 Crowberry Drive CD180 LAGRAC 6.3 31.17 UTsw3 1518 78 4/16/2009 Crowberry Drive CD180 LAGRAC 6.6 34.21 UTsw3 1518 78 4/16/2009 Crowberry Drive CD190 LAGRAC 5.1 20.43 UTsw3 1519 80 4/16/2009 Crowberry Drive CD190 LAGRAC 5.1 20.43 UTsw3 1519 80 4/16/2009 Crowberry Drive CD190 LAGRAC 5.3 22.06 UTsw3 1519 80 4/16/2009 Crowberry Drive CD190 LAGRAC 5.7 25.52 UTsw3 1519 80 4/16/2009 Crowberry Drive CD190 LAGRAC 8.6 58.09 UTsw3 1519 80 4/16/2009 Crowberry Drive CD190 LAGRAC 7 38.48 UTsw3 1519 80 4/16/2009 Crowberry Drive CD190 LAGRAC 5.3 22.06 UTsw3 1519 80 4/16/2009 Crowberry Drive CD190 LAGRAC 6.1 29.22 UTsw3 1519 80 4/16/2009 Crowberry Drive CD190 LAGRAC 6.3 31.17 UTsw3 1519 80 4/16/2009 Crowberry Drive CD200 LAGRAC 7.1 39.59 UTsw3 1516 81
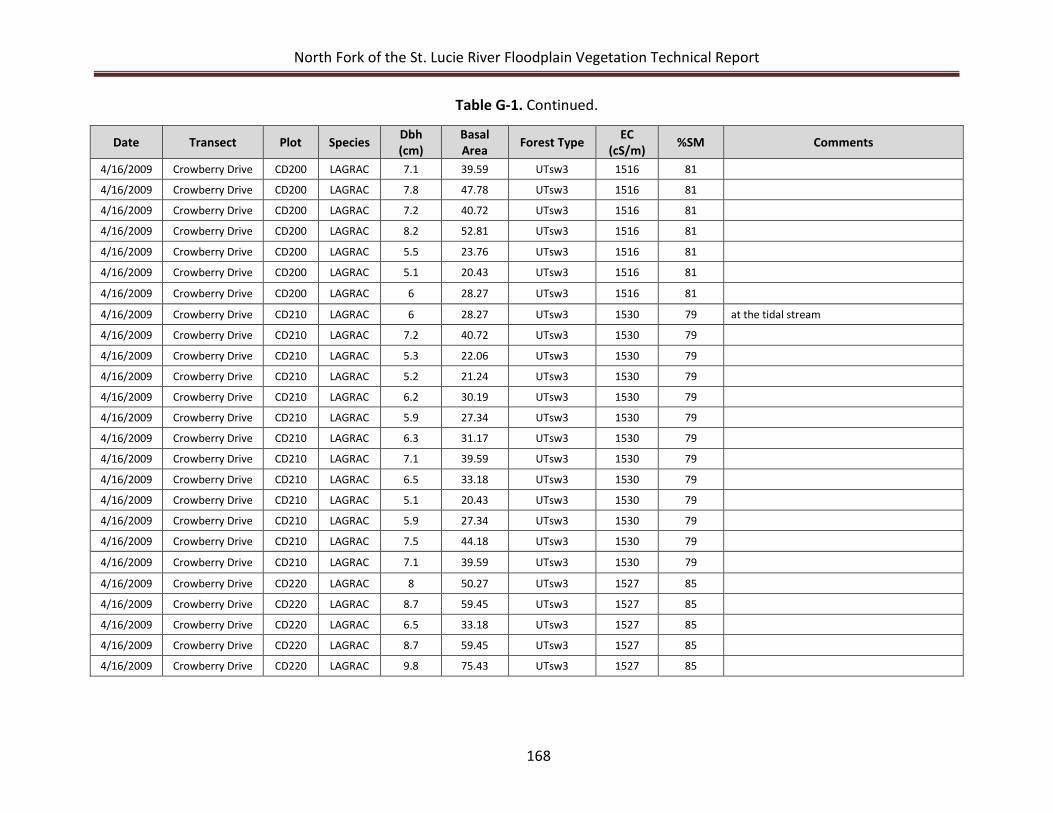
North Fork of the St. Lucie River Floodplain Vegetation Technical Report
168
Table G-1. Continued.
Date Transect Plot Species Dbh (cm)
Basal Area Forest Type EC
(cS/m) %SM Comments
4/16/2009 Crowberry Drive CD200 LAGRAC 7.1 39.59 UTsw3 1516 81 4/16/2009 Crowberry Drive CD200 LAGRAC 7.8 47.78 UTsw3 1516 81 4/16/2009 Crowberry Drive CD200 LAGRAC 7.2 40.72 UTsw3 1516 81 4/16/2009 Crowberry Drive CD200 LAGRAC 8.2 52.81 UTsw3 1516 81 4/16/2009 Crowberry Drive CD200 LAGRAC 5.5 23.76 UTsw3 1516 81 4/16/2009 Crowberry Drive CD200 LAGRAC 5.1 20.43 UTsw3 1516 81 4/16/2009 Crowberry Drive CD200 LAGRAC 6 28.27 UTsw3 1516 81 4/16/2009 Crowberry Drive CD210 LAGRAC 6 28.27 UTsw3 1530 79 at the tidal stream
4/16/2009 Crowberry Drive CD210 LAGRAC 7.2 40.72 UTsw3 1530 79 4/16/2009 Crowberry Drive CD210 LAGRAC 5.3 22.06 UTsw3 1530 79 4/16/2009 Crowberry Drive CD210 LAGRAC 5.2 21.24 UTsw3 1530 79 4/16/2009 Crowberry Drive CD210 LAGRAC 6.2 30.19 UTsw3 1530 79 4/16/2009 Crowberry Drive CD210 LAGRAC 5.9 27.34 UTsw3 1530 79 4/16/2009 Crowberry Drive CD210 LAGRAC 6.3 31.17 UTsw3 1530 79 4/16/2009 Crowberry Drive CD210 LAGRAC 7.1 39.59 UTsw3 1530 79 4/16/2009 Crowberry Drive CD210 LAGRAC 6.5 33.18 UTsw3 1530 79 4/16/2009 Crowberry Drive CD210 LAGRAC 5.1 20.43 UTsw3 1530 79 4/16/2009 Crowberry Drive CD210 LAGRAC 5.9 27.34 UTsw3 1530 79 4/16/2009 Crowberry Drive CD210 LAGRAC 7.5 44.18 UTsw3 1530 79 4/16/2009 Crowberry Drive CD210 LAGRAC 7.1 39.59 UTsw3 1530 79 4/16/2009 Crowberry Drive CD220 LAGRAC 8 50.27 UTsw3 1527 85 4/16/2009 Crowberry Drive CD220 LAGRAC 8.7 59.45 UTsw3 1527 85 4/16/2009 Crowberry Drive CD220 LAGRAC 6.5 33.18 UTsw3 1527 85 4/16/2009 Crowberry Drive CD220 LAGRAC 8.7 59.45 UTsw3 1527 85 4/16/2009 Crowberry Drive CD220 LAGRAC 9.8 75.43 UTsw3 1527 85
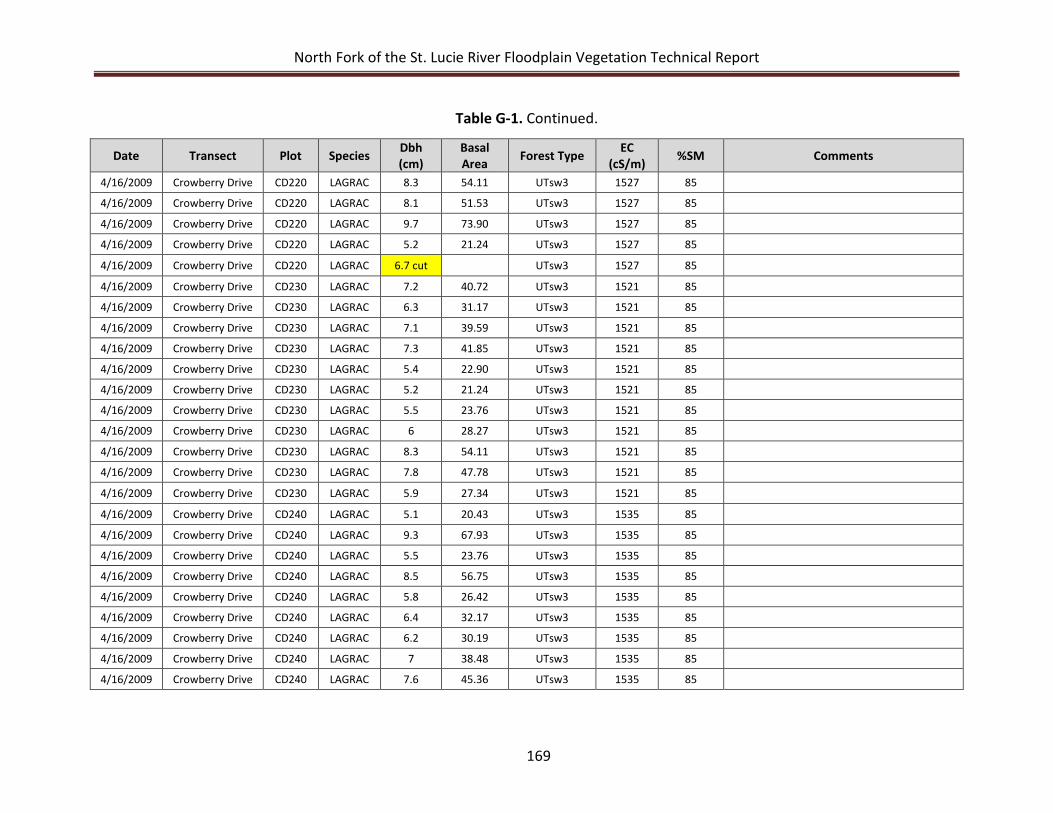
North Fork of the St. Lucie River Floodplain Vegetation Technical Report
169
Table G-1. Continued.
Date Transect Plot Species Dbh (cm)
Basal Area Forest Type EC
(cS/m) %SM Comments
4/16/2009 Crowberry Drive CD220 LAGRAC 8.3 54.11 UTsw3 1527 85 4/16/2009 Crowberry Drive CD220 LAGRAC 8.1 51.53 UTsw3 1527 85 4/16/2009 Crowberry Drive CD220 LAGRAC 9.7 73.90 UTsw3 1527 85 4/16/2009 Crowberry Drive CD220 LAGRAC 5.2 21.24 UTsw3 1527 85 4/16/2009 Crowberry Drive CD220 LAGRAC 6.7 cut UTsw3 1527 85 4/16/2009 Crowberry Drive CD230 LAGRAC 7.2 40.72 UTsw3 1521 85 4/16/2009 Crowberry Drive CD230 LAGRAC 6.3 31.17 UTsw3 1521 85 4/16/2009 Crowberry Drive CD230 LAGRAC 7.1 39.59 UTsw3 1521 85 4/16/2009 Crowberry Drive CD230 LAGRAC 7.3 41.85 UTsw3 1521 85 4/16/2009 Crowberry Drive CD230 LAGRAC 5.4 22.90 UTsw3 1521 85 4/16/2009 Crowberry Drive CD230 LAGRAC 5.2 21.24 UTsw3 1521 85 4/16/2009 Crowberry Drive CD230 LAGRAC 5.5 23.76 UTsw3 1521 85 4/16/2009 Crowberry Drive CD230 LAGRAC 6 28.27 UTsw3 1521 85 4/16/2009 Crowberry Drive CD230 LAGRAC 8.3 54.11 UTsw3 1521 85 4/16/2009 Crowberry Drive CD230 LAGRAC 7.8 47.78 UTsw3 1521 85 4/16/2009 Crowberry Drive CD230 LAGRAC 5.9 27.34 UTsw3 1521 85 4/16/2009 Crowberry Drive CD240 LAGRAC 5.1 20.43 UTsw3 1535 85 4/16/2009 Crowberry Drive CD240 LAGRAC 9.3 67.93 UTsw3 1535 85 4/16/2009 Crowberry Drive CD240 LAGRAC 5.5 23.76 UTsw3 1535 85 4/16/2009 Crowberry Drive CD240 LAGRAC 8.5 56.75 UTsw3 1535 85 4/16/2009 Crowberry Drive CD240 LAGRAC 5.8 26.42 UTsw3 1535 85 4/16/2009 Crowberry Drive CD240 LAGRAC 6.4 32.17 UTsw3 1535 85 4/16/2009 Crowberry Drive CD240 LAGRAC 6.2 30.19 UTsw3 1535 85 4/16/2009 Crowberry Drive CD240 LAGRAC 7 38.48 UTsw3 1535 85 4/16/2009 Crowberry Drive CD240 LAGRAC 7.6 45.36 UTsw3 1535 85
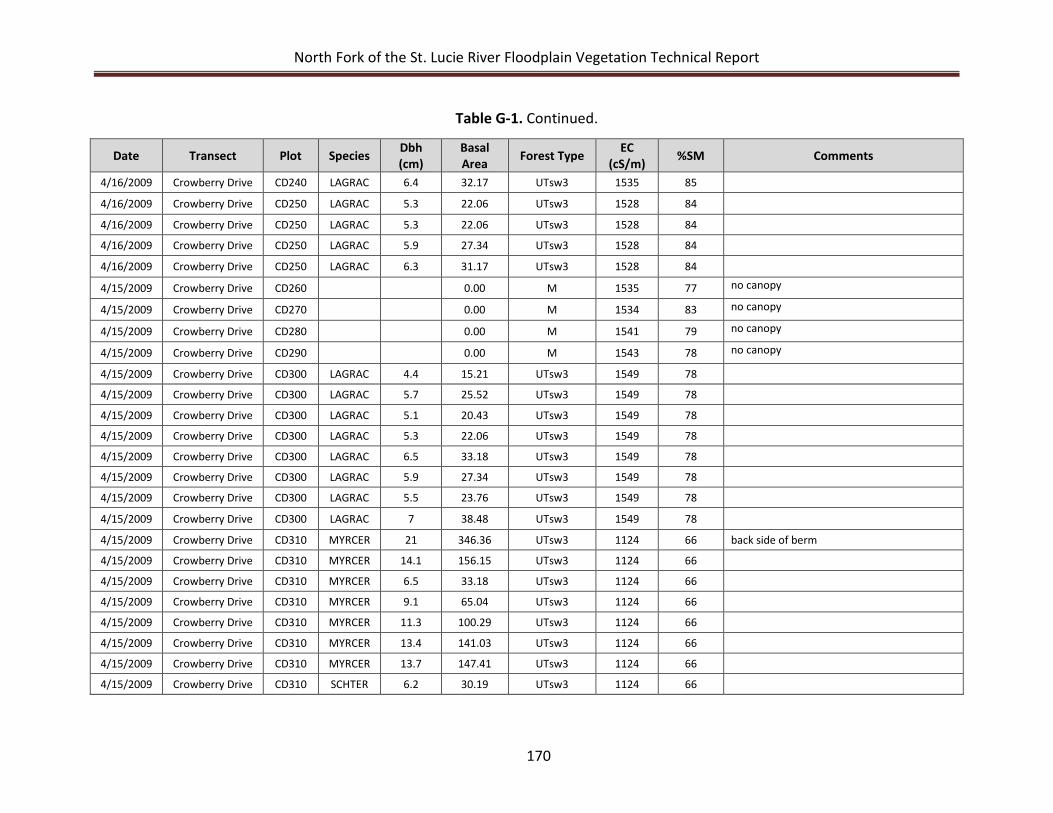
North Fork of the St. Lucie River Floodplain Vegetation Technical Report
170
Table G-1. Continued.
Date Transect Plot Species Dbh (cm)
Basal Area Forest Type EC
(cS/m) %SM Comments
4/16/2009 Crowberry Drive CD240 LAGRAC 6.4 32.17 UTsw3 1535 85 4/16/2009 Crowberry Drive CD250 LAGRAC 5.3 22.06 UTsw3 1528 84 4/16/2009 Crowberry Drive CD250 LAGRAC 5.3 22.06 UTsw3 1528 84 4/16/2009 Crowberry Drive CD250 LAGRAC 5.9 27.34 UTsw3 1528 84 4/16/2009 Crowberry Drive CD250 LAGRAC 6.3 31.17 UTsw3 1528 84 4/15/2009 Crowberry Drive CD260 0.00 M 1535 77 no canopy
4/15/2009 Crowberry Drive CD270 0.00 M 1534 83 no canopy
4/15/2009 Crowberry Drive CD280 0.00 M 1541 79 no canopy
4/15/2009 Crowberry Drive CD290 0.00 M 1543 78 no canopy
4/15/2009 Crowberry Drive CD300 LAGRAC 4.4 15.21 UTsw3 1549 78 4/15/2009 Crowberry Drive CD300 LAGRAC 5.7 25.52 UTsw3 1549 78 4/15/2009 Crowberry Drive CD300 LAGRAC 5.1 20.43 UTsw3 1549 78 4/15/2009 Crowberry Drive CD300 LAGRAC 5.3 22.06 UTsw3 1549 78 4/15/2009 Crowberry Drive CD300 LAGRAC 6.5 33.18 UTsw3 1549 78 4/15/2009 Crowberry Drive CD300 LAGRAC 5.9 27.34 UTsw3 1549 78 4/15/2009 Crowberry Drive CD300 LAGRAC 5.5 23.76 UTsw3 1549 78 4/15/2009 Crowberry Drive CD300 LAGRAC 7 38.48 UTsw3 1549 78 4/15/2009 Crowberry Drive CD310 MYRCER 21 346.36 UTsw3 1124 66 back side of berm
4/15/2009 Crowberry Drive CD310 MYRCER 14.1 156.15 UTsw3 1124 66 4/15/2009 Crowberry Drive CD310 MYRCER 6.5 33.18 UTsw3 1124 66 4/15/2009 Crowberry Drive CD310 MYRCER 9.1 65.04 UTsw3 1124 66 4/15/2009 Crowberry Drive CD310 MYRCER 11.3 100.29 UTsw3 1124 66 4/15/2009 Crowberry Drive CD310 MYRCER 13.4 141.03 UTsw3 1124 66 4/15/2009 Crowberry Drive CD310 MYRCER 13.7 147.41 UTsw3 1124 66 4/15/2009 Crowberry Drive CD310 SCHTER 6.2 30.19 UTsw3 1124 66
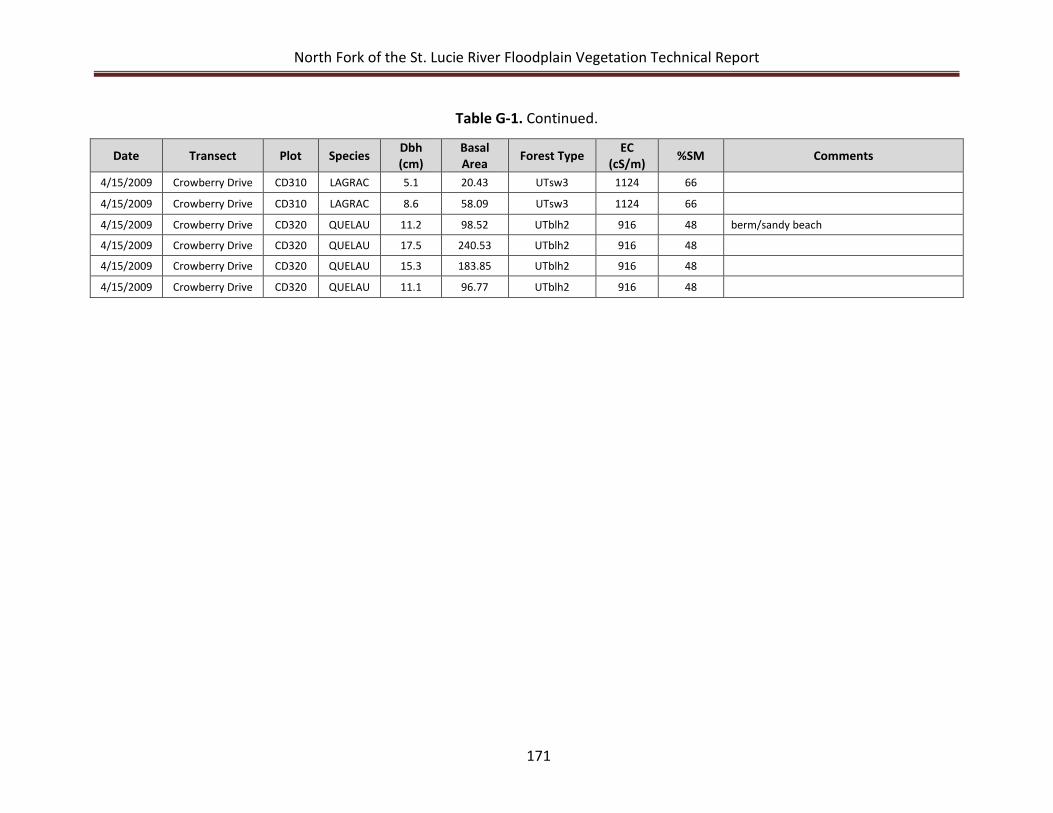
North Fork of the St. Lucie River Floodplain Vegetation Technical Report
171
Table G-1. Continued.
Date Transect Plot Species Dbh (cm)
Basal Area Forest Type EC
(cS/m) %SM Comments
4/15/2009 Crowberry Drive CD310 LAGRAC 5.1 20.43 UTsw3 1124 66 4/15/2009 Crowberry Drive CD310 LAGRAC 8.6 58.09 UTsw3 1124 66 4/15/2009 Crowberry Drive CD320 QUELAU 11.2 98.52 UTblh2 916 48 berm/sandy beach
4/15/2009 Crowberry Drive CD320 QUELAU 17.5 240.53 UTblh2 916 48 4/15/2009 Crowberry Drive CD320 QUELAU 15.3 183.85 UTblh2 916 48 4/15/2009 Crowberry Drive CD320 QUELAU 11.1 96.77 UTblh2 916 48

North Fork of the St. Lucie River Floodplain Vegetation Technical Report
172

North Fork of the St. Lucie River Floodplain Vegetation Technical Report
173
APPENDIX H: RESULTS AND ADDITIONAL MULTI-VARIATE ANALYSIS
AND GRAPHS
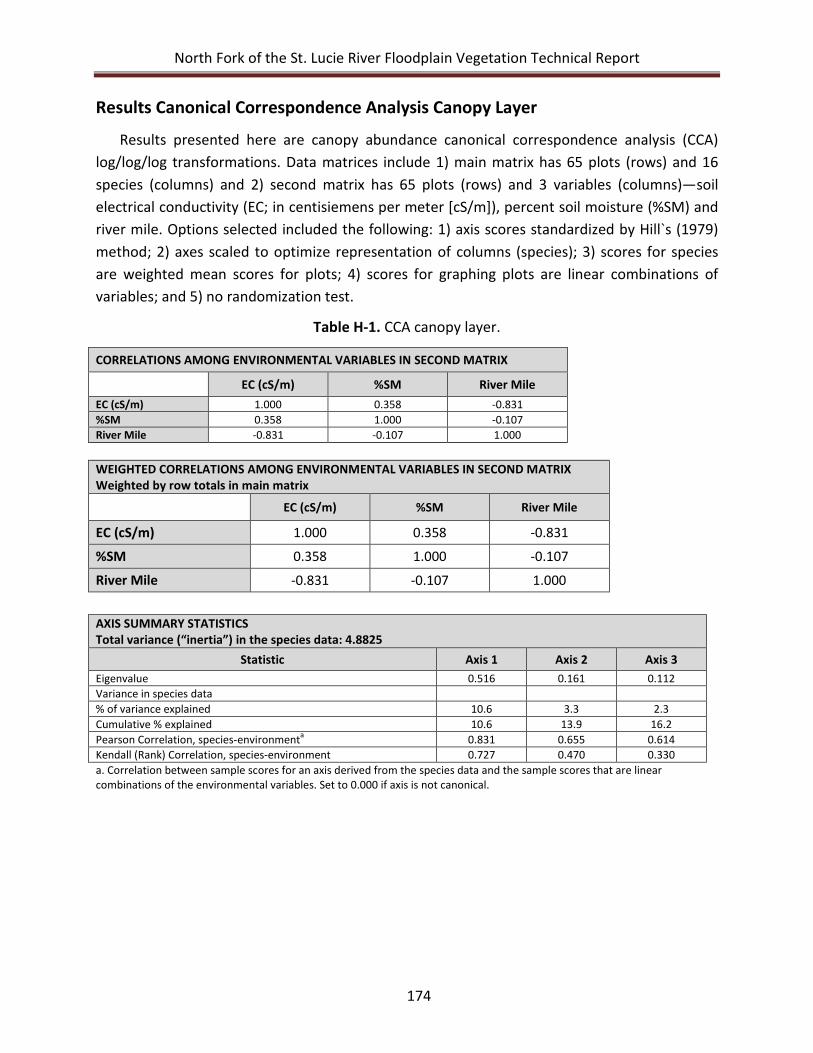
North Fork of the St. Lucie River Floodplain Vegetation Technical Report
174
Results Canonical Correspondence Analysis Canopy Layer
Results presented here are canopy abundance canonical correspondence analysis (CCA) log/log/log transformations. Data matrices include 1) main matrix has 65 plots (rows) and 16 species (columns) and 2) second matrix has 65 plots (rows) and 3 variables (columns)—soil electrical conductivity (EC; in centisiemens per meter [cS/m]), percent soil moisture (%SM) and river mile. Options selected included the following: 1) axis scores standardized by Hill`s (1979) method; 2) axes scaled to optimize representation of columns (species); 3) scores for species are weighted mean scores for plots; 4) scores for graphing plots are linear combinations of variables; and 5) no randomization test.
Table H-1. CCA canopy layer.
CORRELATIONS AMONG ENVIRONMENTAL VARIABLES IN SECOND MATRIX EC (cS/m) %SM River Mile
EC (cS/m) 1.000 0.358 -0.831 %SM 0.358 1.000 -0.107 River Mile -0.831 -0.107 1.000
WEIGHTED CORRELATIONS AMONG ENVIRONMENTAL VARIABLES IN SECOND MATRIX Weighted by row totals in main matrix
EC (cS/m) %SM River Mile
EC (cS/m) 1.000 0.358 -0.831
%SM 0.358 1.000 -0.107
River Mile -0.831 -0.107 1.000 AXIS SUMMARY STATISTICS Total variance (“inertia”) in the species data: 4.8825
Statistic Axis 1 Axis 2 Axis 3 Eigenvalue 0.516 0.161 0.112 Variance in species data % of variance explained 10.6 3.3 2.3 Cumulative % explained 10.6 13.9 16.2 Pearson Correlation, species-environmenta 0.831 0.655 0.614 Kendall (Rank) Correlation, species-environment 0.727 0.470 0.330 a. Correlation between sample scores for an axis derived from the species data and the sample scores that are linear combinations of the environmental variables. Set to 0.000 if axis is not canonical.
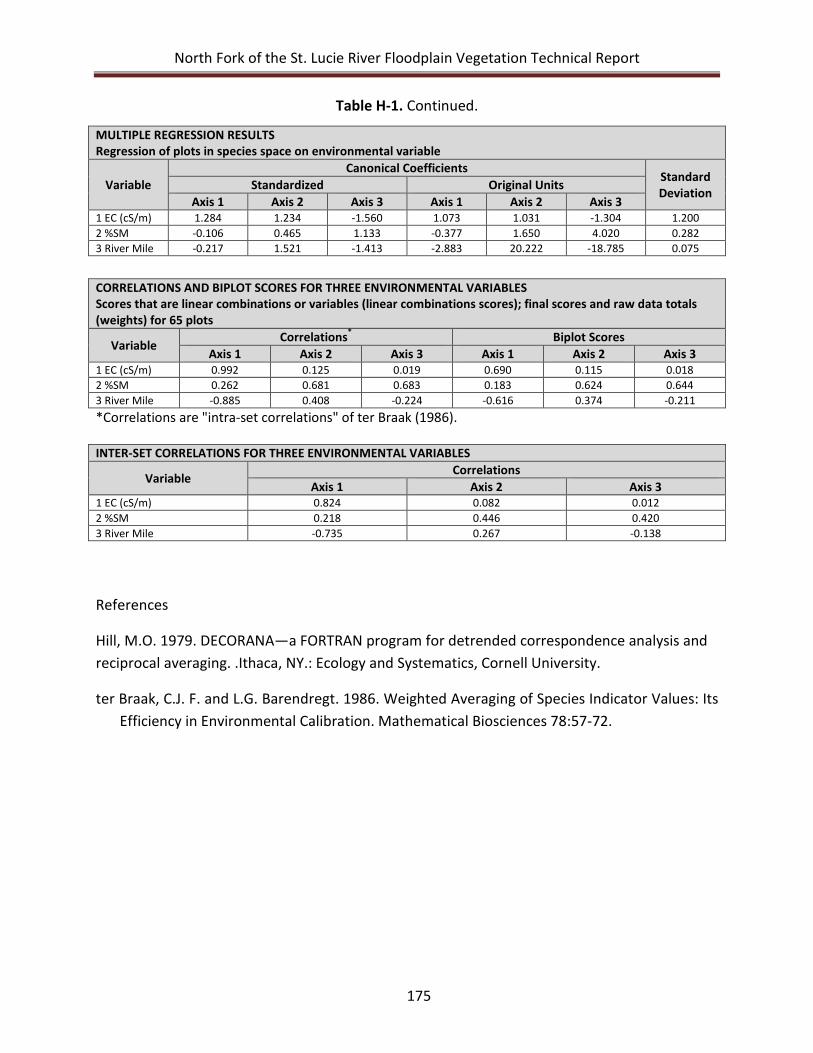
North Fork of the St. Lucie River Floodplain Vegetation Technical Report
175
Table H-1. Continued.
MULTIPLE REGRESSION RESULTS Regression of plots in species space on environmental variable
Variable Canonical Coefficients
Standard Deviation Standardized Original Units
Axis 1 Axis 2 Axis 3 Axis 1 Axis 2 Axis 3 1 EC (cS/m) 1.284 1.234 -1.560 1.073 1.031 -1.304 1.200 2 %SM -0.106 0.465 1.133 -0.377 1.650 4.020 0.282 3 River Mile -0.217 1.521 -1.413 -2.883 20.222 -18.785 0.075
CORRELATIONS AND BIPLOT SCORES FOR THREE ENVIRONMENTAL VARIABLES Scores that are linear combinations or variables (linear combinations scores); final scores and raw data totals (weights) for 65 plots
Variable Correlations* Biplot Scores
Axis 1 Axis 2 Axis 3 Axis 1 Axis 2 Axis 3 1 EC (cS/m) 0.992 0.125 0.019 0.690 0.115 0.018 2 %SM 0.262 0.681 0.683 0.183 0.624 0.644 3 River Mile -0.885 0.408 -0.224 -0.616 0.374 -0.211 *Correlations are "intra-set correlations" of ter Braak (1986). INTER-SET CORRELATIONS FOR THREE ENVIRONMENTAL VARIABLES
Variable Correlations
Axis 1 Axis 2 Axis 3 1 EC (cS/m) 0.824 0.082 0.012 2 %SM 0.218 0.446 0.420 3 River Mile -0.735 0.267 -0.138
References
Hill, M.O. 1979. DECORANA—a FORTRAN program for detrended correspondence analysis and reciprocal averaging. .Ithaca, NY.: Ecology and Systematics, Cornell University.
ter Braak, C.J. F. and L.G. Barendregt. 1986. Weighted Averaging of Species Indicator Values: Its Efficiency in Environmental Calibration. Mathematical Biosciences 78:57-72.
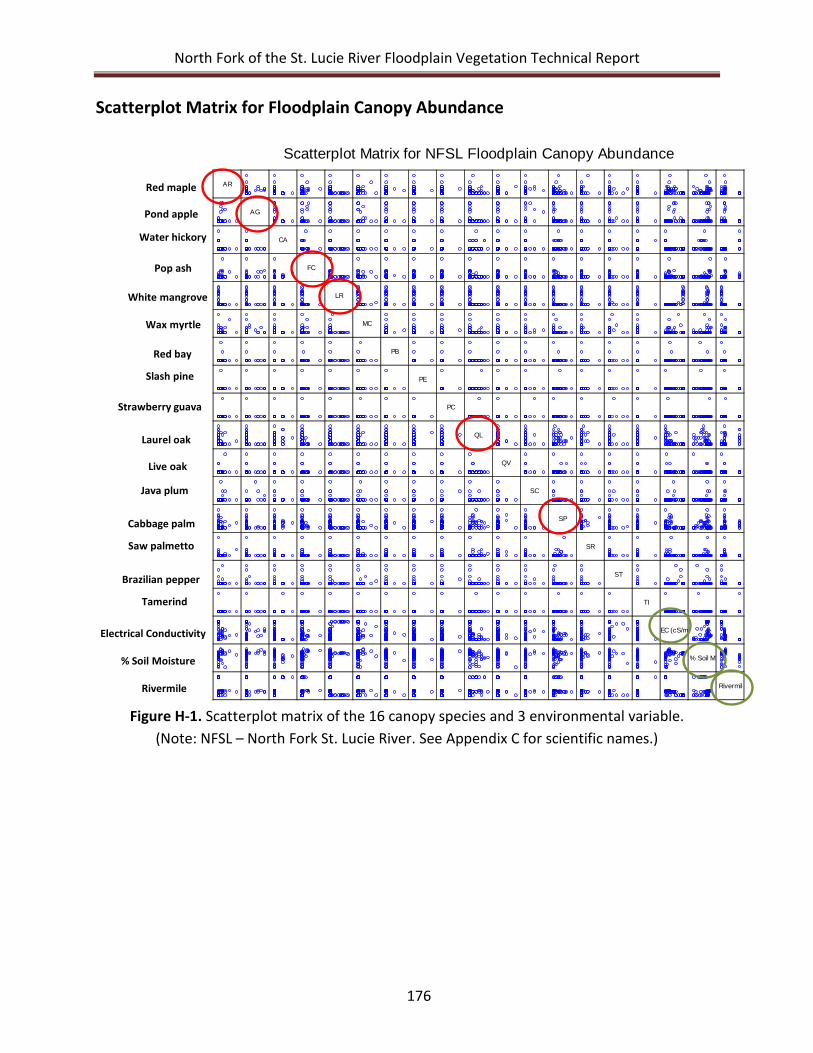
North Fork of the St. Lucie River Floodplain Vegetation Technical Report
176
Scatterplot Matrix for Floodplain Canopy Abundance
Figure H-1. Scatterplot matrix of the 16 canopy species and 3 environmental variable. (Note: NFSL – North Fork St. Lucie River. See Appendix C for scientific names.)
Scatterplot Matrix for NFSL Floodplain Canopy Abundance
AR
AG
CA
FC
LR
MC
PB
PE
PC
QL
QV
SC
SP
SR
ST
TI
EC (cS/m
% Soil M
Rivermil
Red maple
Pond apple
Pop ash
Laurel oak
Cabbage palm
Electrical Conductivity
% Soil Moisture
Rivermile
White mangrove
Water hickory
Wax myrtle
Red bay
Slash pine
Strawberry guava
Saw palmetto
Brazilian pepper
Tamerind
Java plum
Live oak
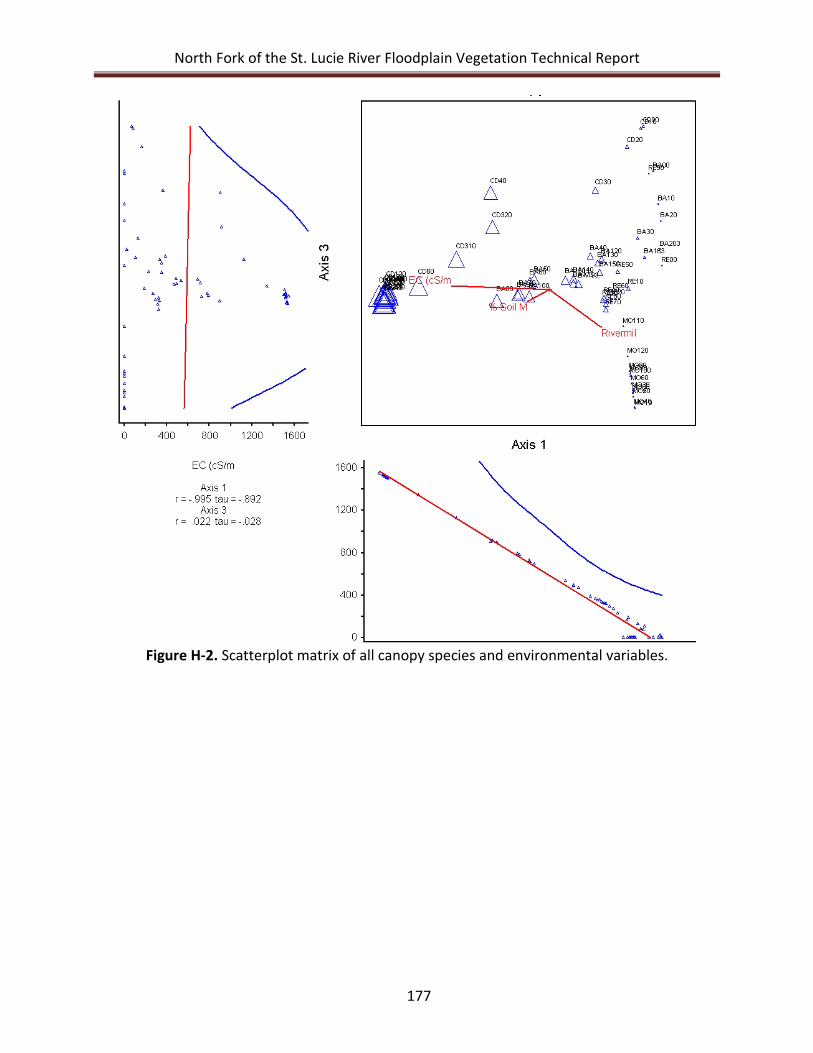
North Fork of the St. Lucie River Floodplain Vegetation Technical Report
177
Figure H-2. Scatterplot matrix of all canopy species and environmental variables.
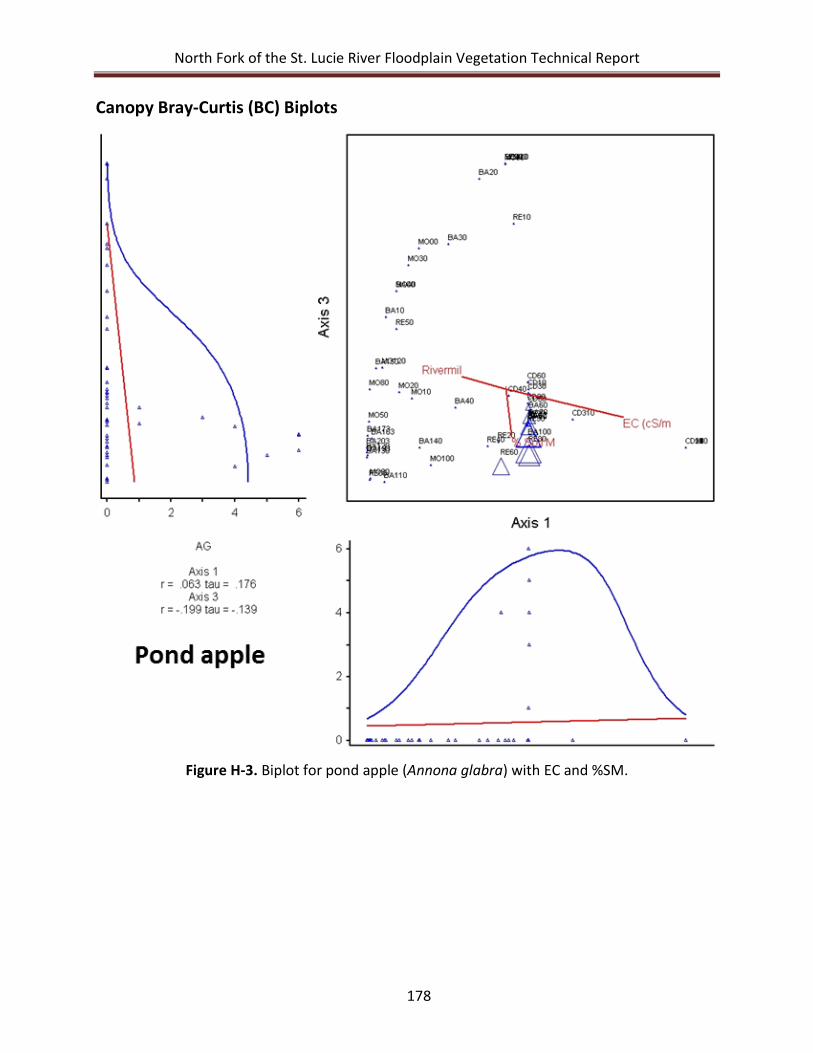
North Fork of the St. Lucie River Floodplain Vegetation Technical Report
178
Canopy Bray-Curtis (BC) Biplots
Figure H-3. Biplot for pond apple (Annona glabra) with EC and %SM.
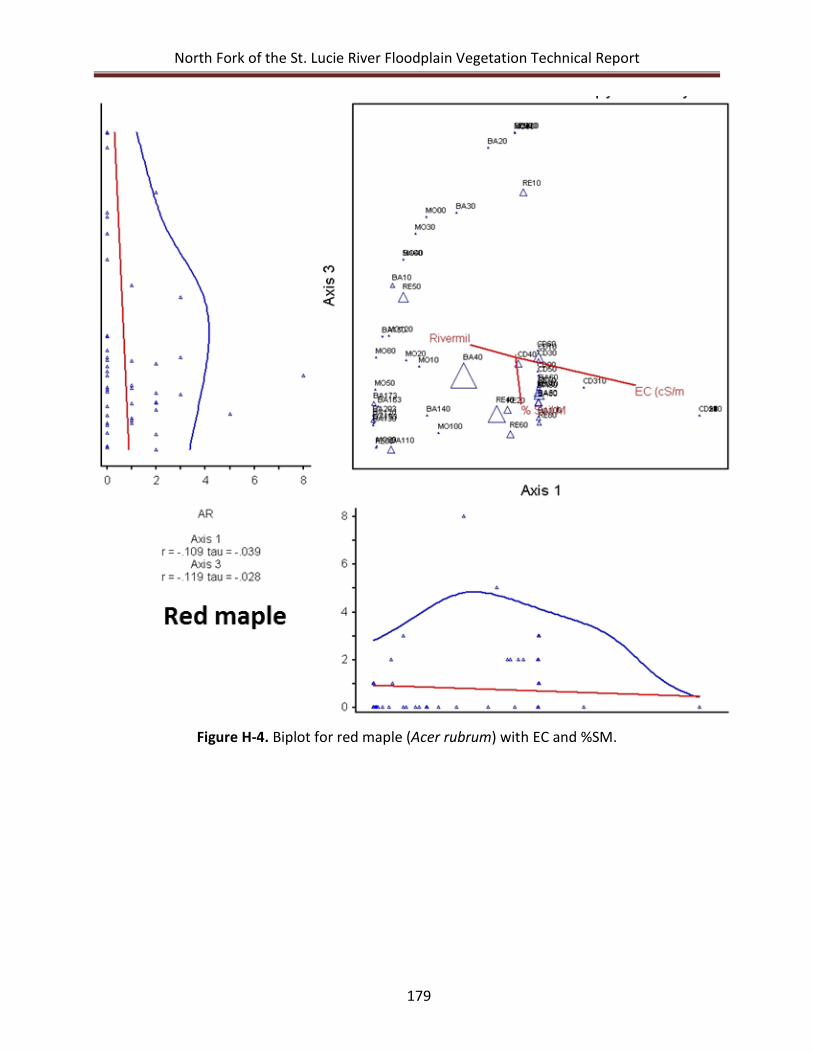
North Fork of the St. Lucie River Floodplain Vegetation Technical Report
179
Figure H-4. Biplot for red maple (Acer rubrum) with EC and %SM.
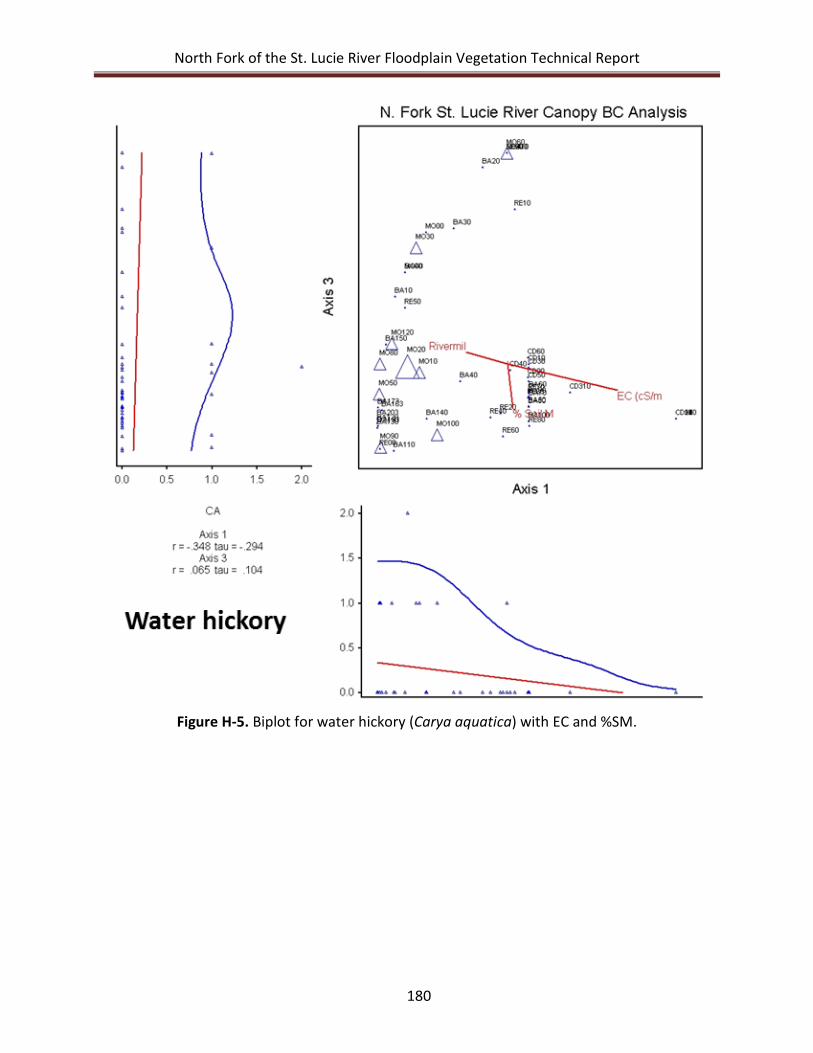
North Fork of the St. Lucie River Floodplain Vegetation Technical Report
180
Figure H-5. Biplot for water hickory (Carya aquatica) with EC and %SM.
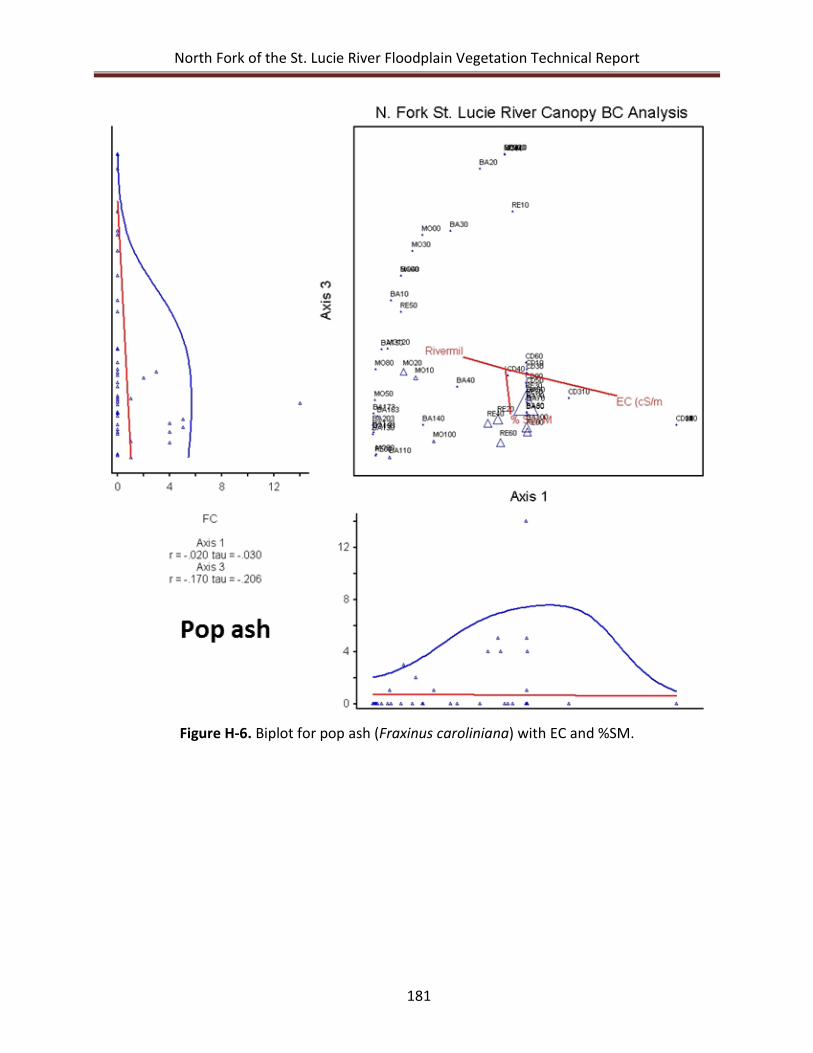
North Fork of the St. Lucie River Floodplain Vegetation Technical Report
181
Figure H-6. Biplot for pop ash (Fraxinus caroliniana) with EC and %SM.
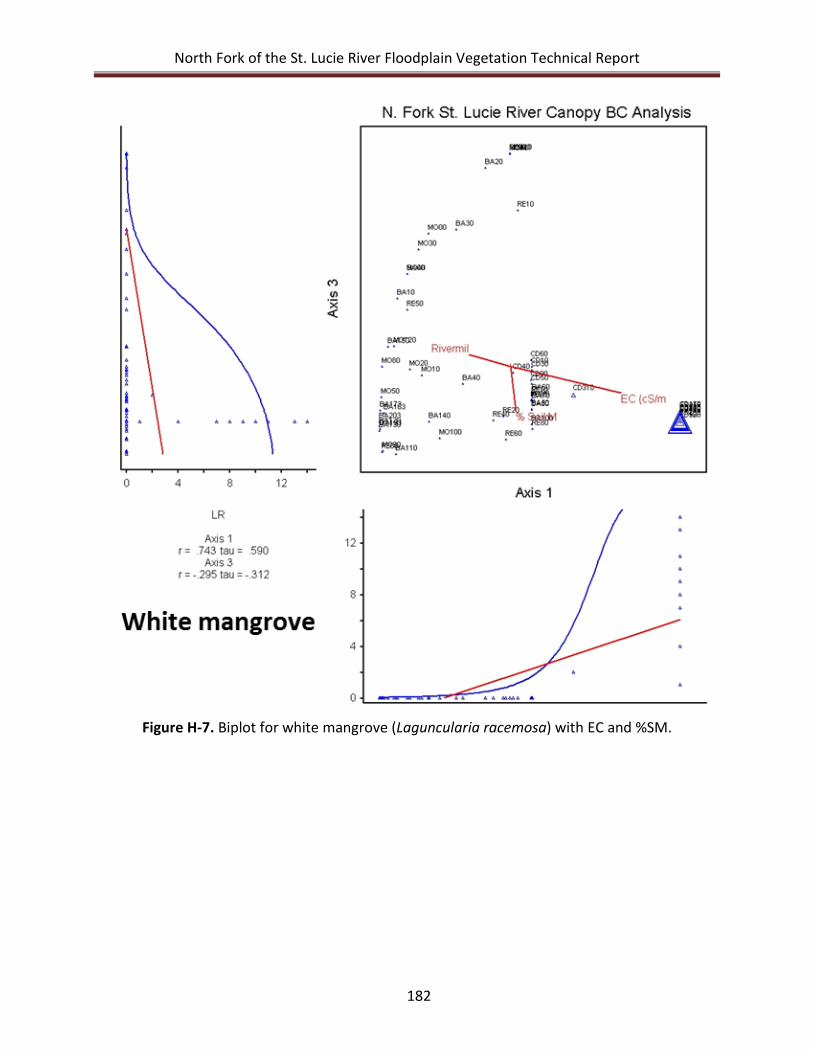
North Fork of the St. Lucie River Floodplain Vegetation Technical Report
182
Figure H-7. Biplot for white mangrove (Laguncularia racemosa) with EC and %SM.
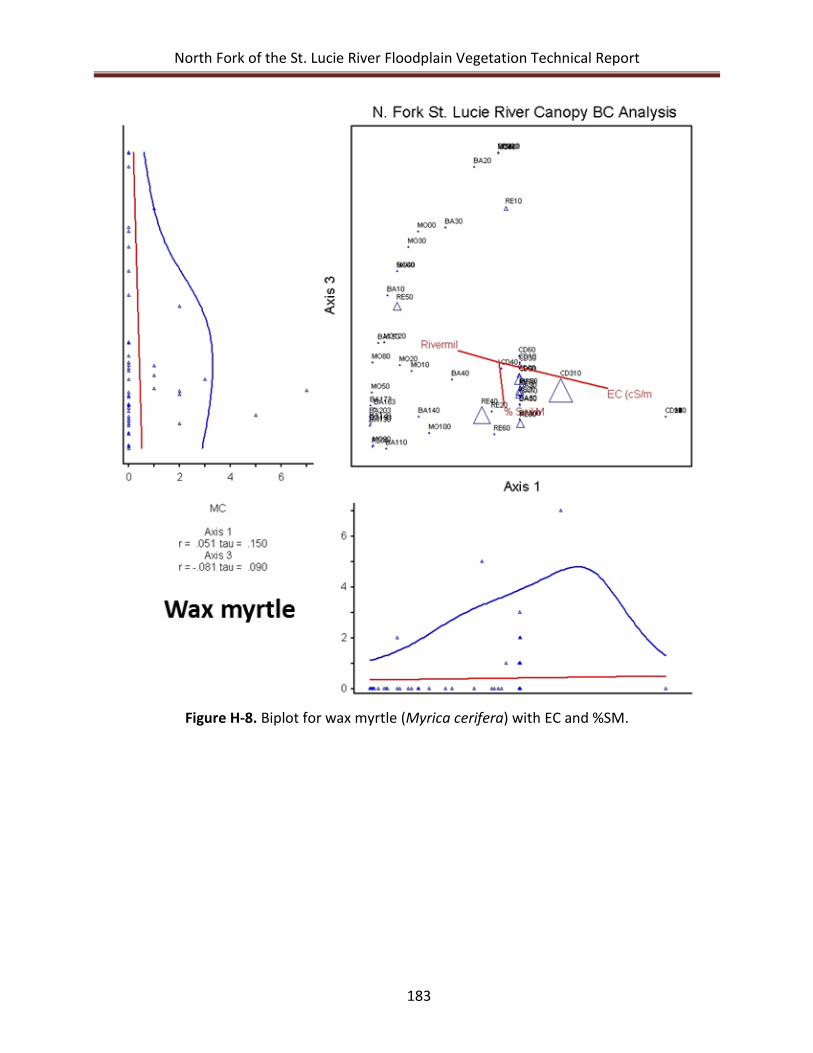
North Fork of the St. Lucie River Floodplain Vegetation Technical Report
183
Figure H-8. Biplot for wax myrtle (Myrica cerifera) with EC and %SM.
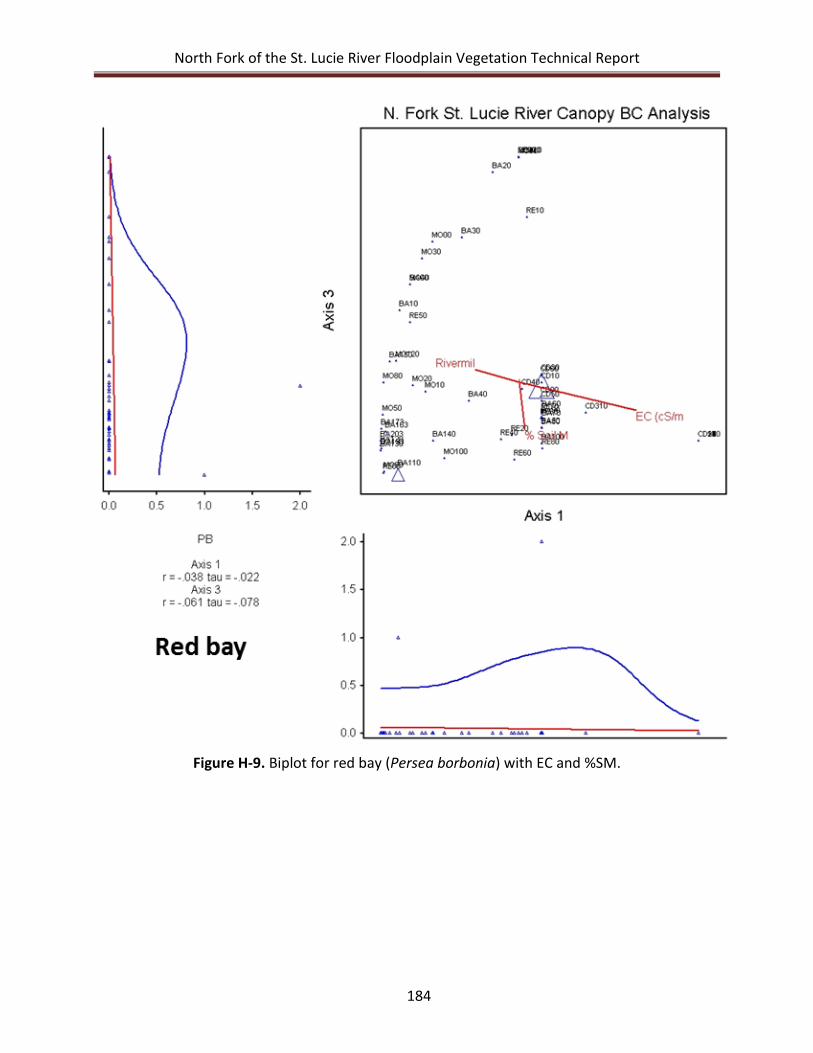
North Fork of the St. Lucie River Floodplain Vegetation Technical Report
184
Figure H-9. Biplot for red bay (Persea borbonia) with EC and %SM.
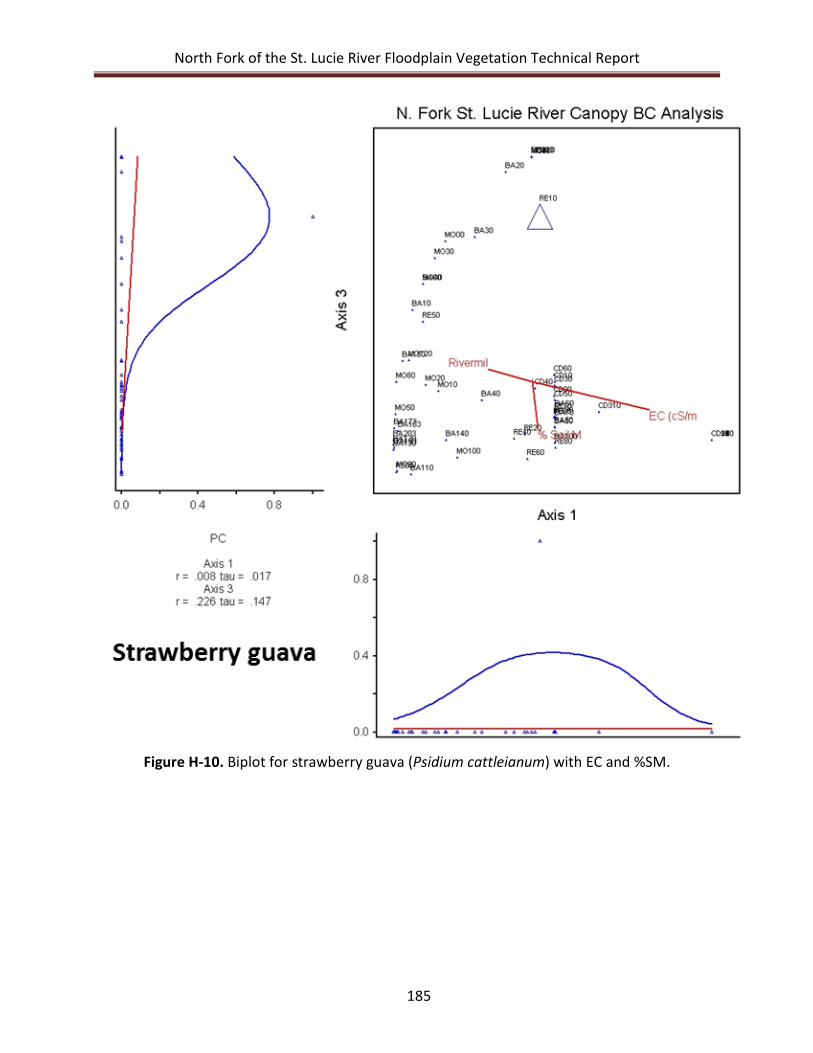
North Fork of the St. Lucie River Floodplain Vegetation Technical Report
185
Figure H-10. Biplot for strawberry guava (Psidium cattleianum) with EC and %SM.
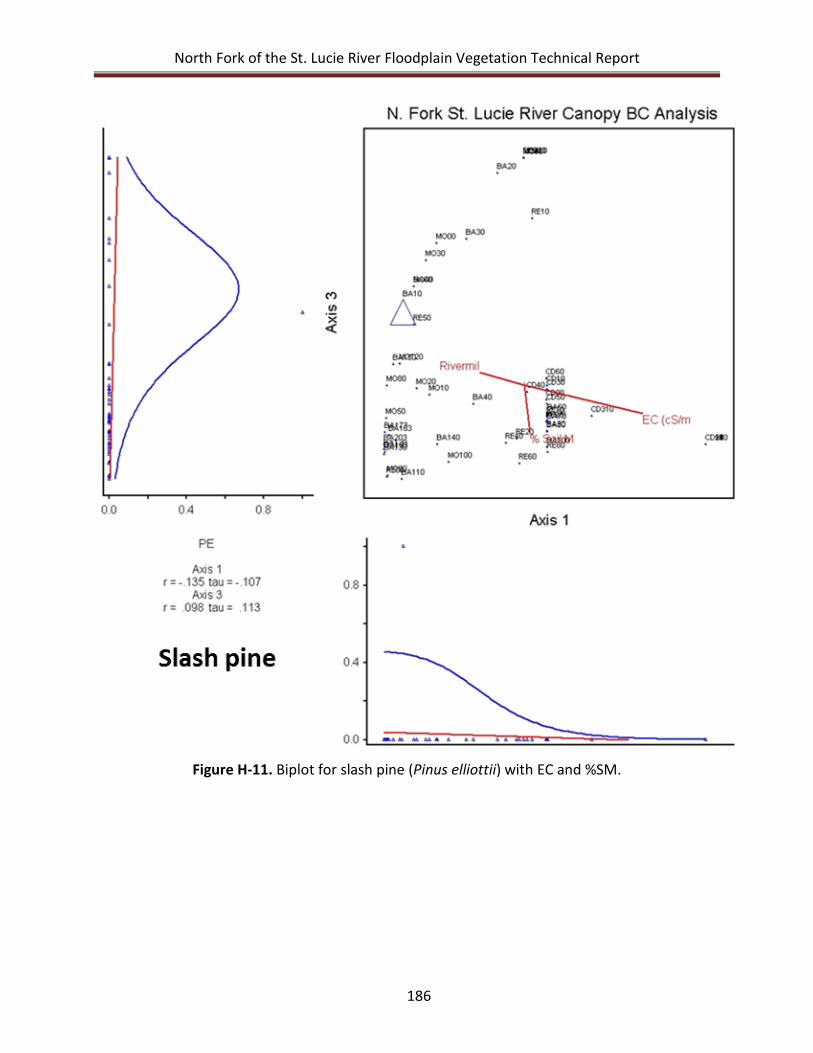
North Fork of the St. Lucie River Floodplain Vegetation Technical Report
186
Figure H-11. Biplot for slash pine (Pinus elliottii) with EC and %SM.
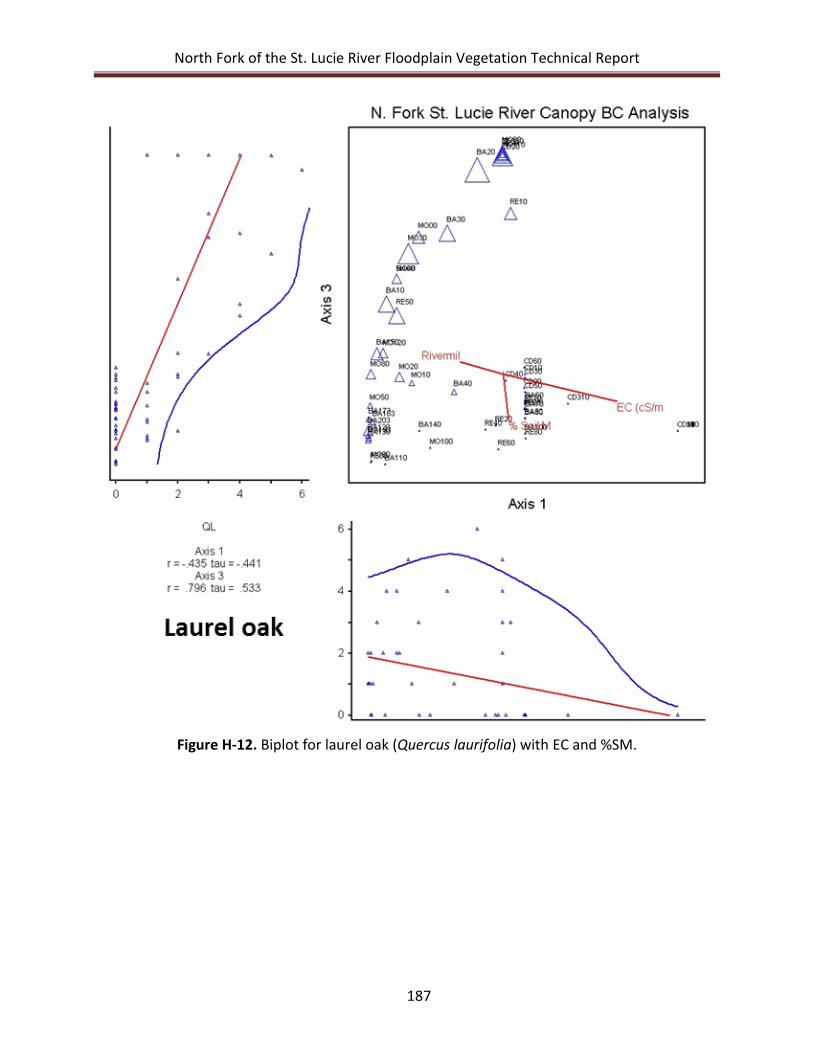
North Fork of the St. Lucie River Floodplain Vegetation Technical Report
187
Figure H-12. Biplot for laurel oak (Quercus laurifolia) with EC and %SM.
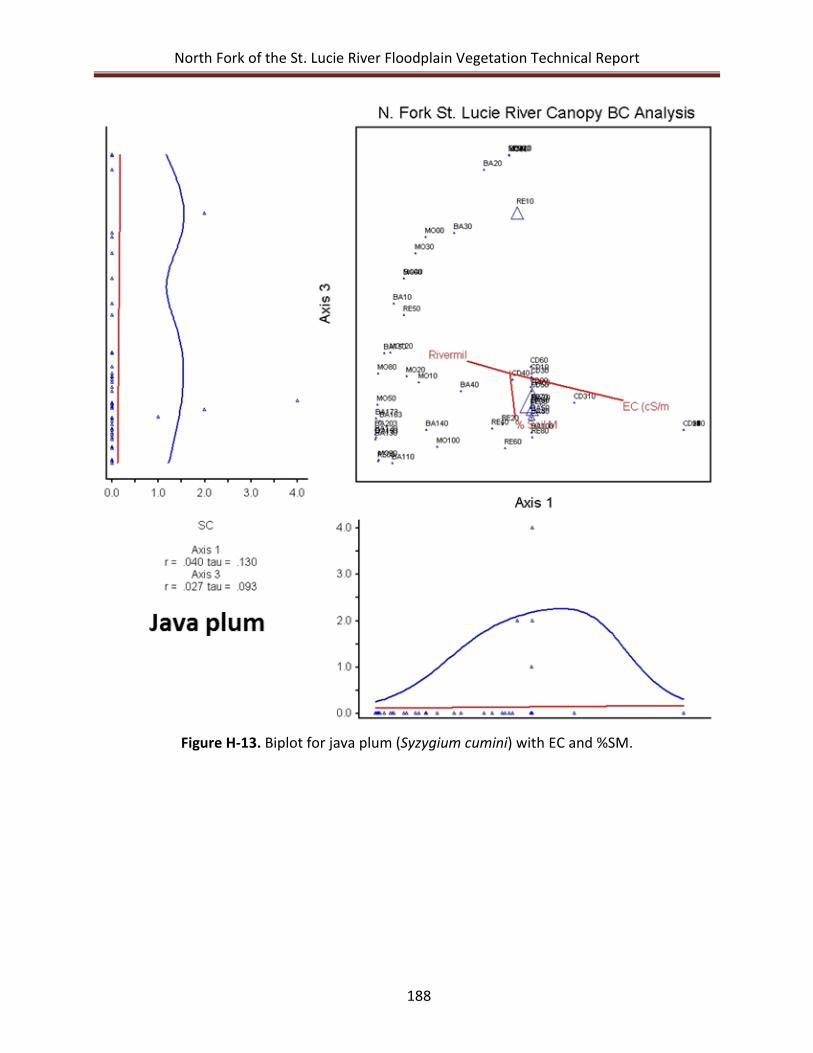
North Fork of the St. Lucie River Floodplain Vegetation Technical Report
188
Figure H-13. Biplot for java plum (Syzygium cumini) with EC and %SM.
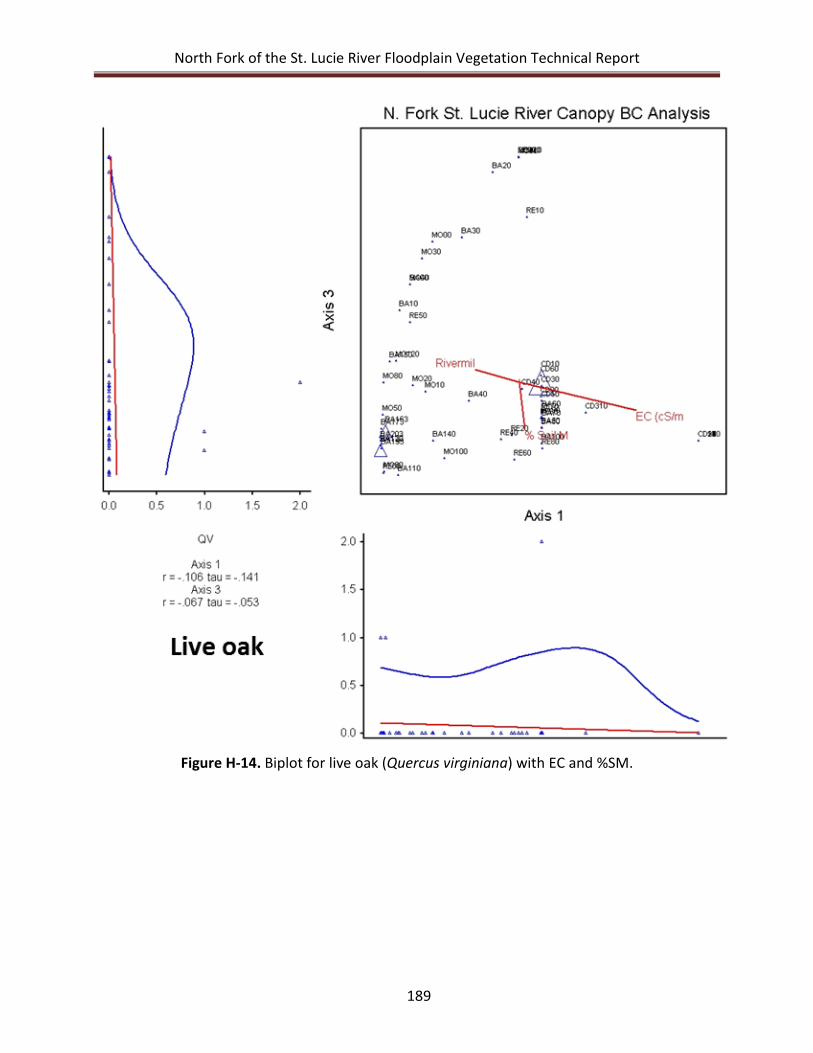
North Fork of the St. Lucie River Floodplain Vegetation Technical Report
189
Figure H-14. Biplot for live oak (Quercus virginiana) with EC and %SM.
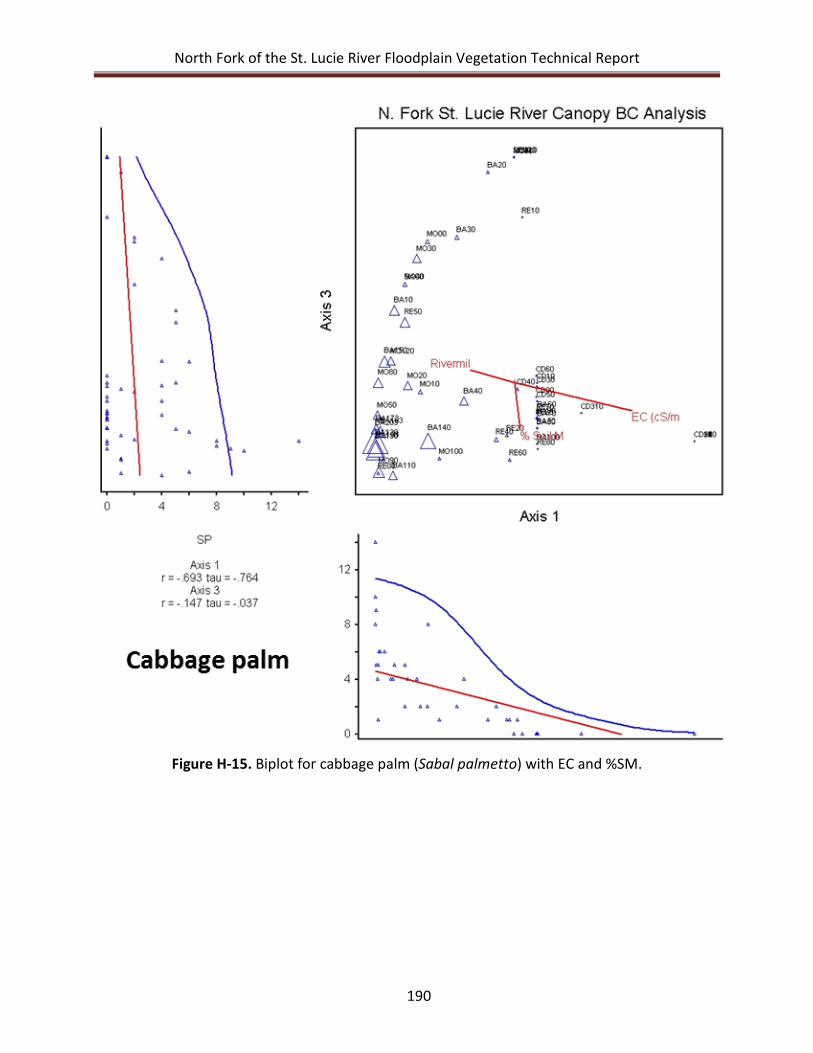
North Fork of the St. Lucie River Floodplain Vegetation Technical Report
190
Figure H-15. Biplot for cabbage palm (Sabal palmetto) with EC and %SM.
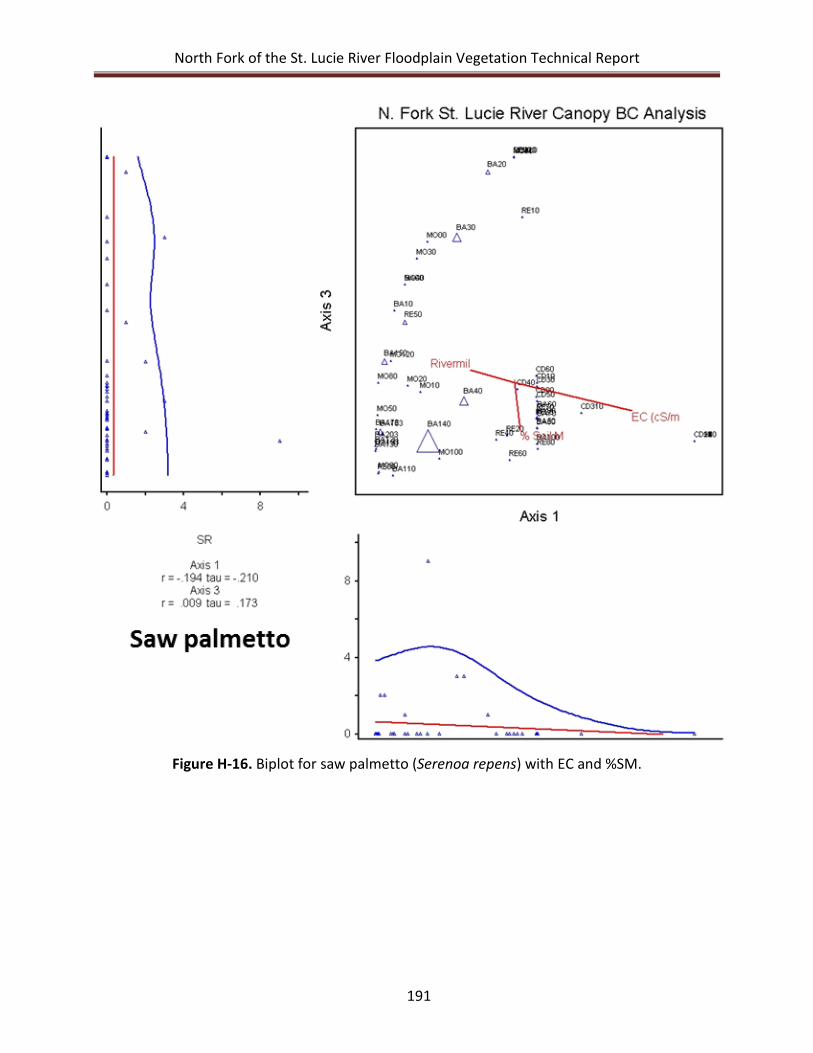
North Fork of the St. Lucie River Floodplain Vegetation Technical Report
191
Figure H-16. Biplot for saw palmetto (Serenoa repens) with EC and %SM.
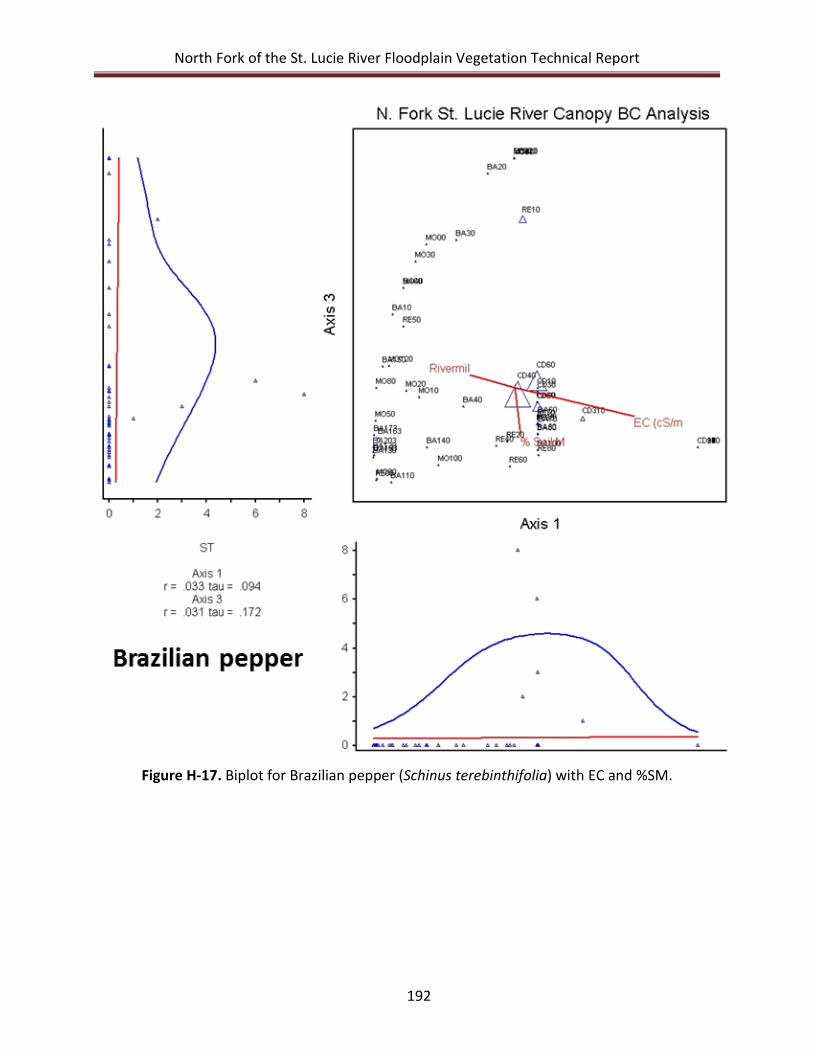
North Fork of the St. Lucie River Floodplain Vegetation Technical Report
192
Figure H-17. Biplot for Brazilian pepper (Schinus terebinthifolia) with EC and %SM.
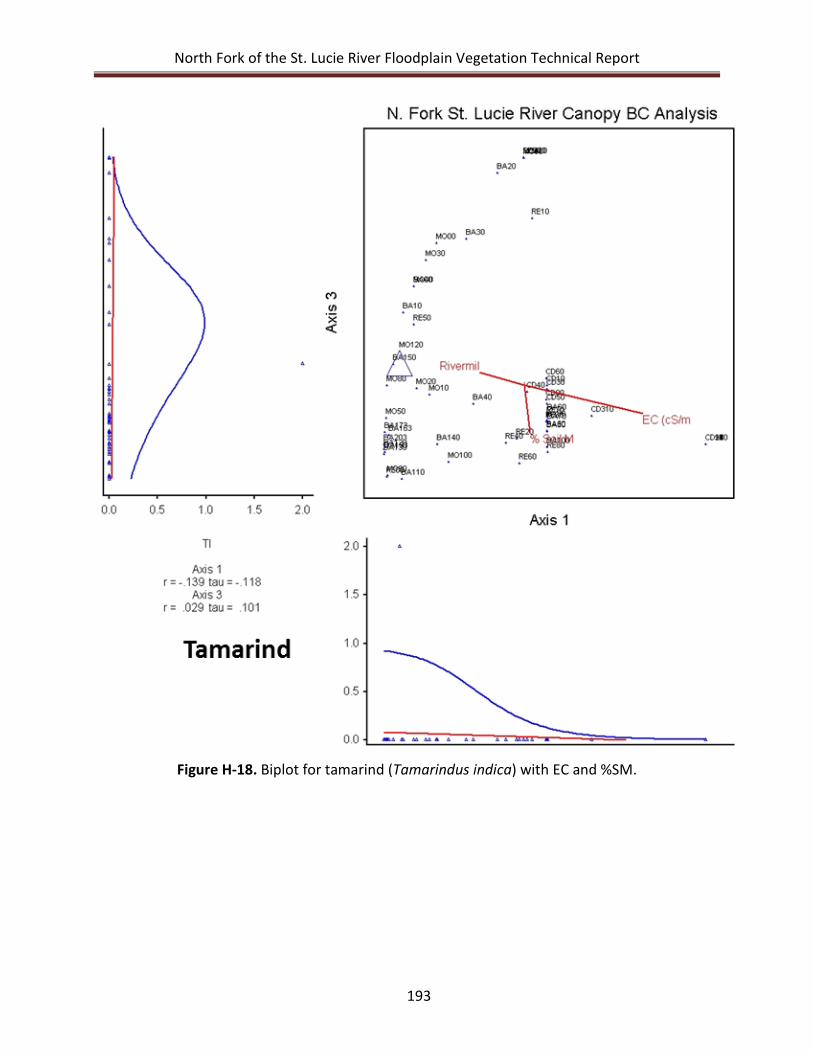
North Fork of the St. Lucie River Floodplain Vegetation Technical Report
193
Figure H-18. Biplot for tamarind (Tamarindus indica) with EC and %SM.
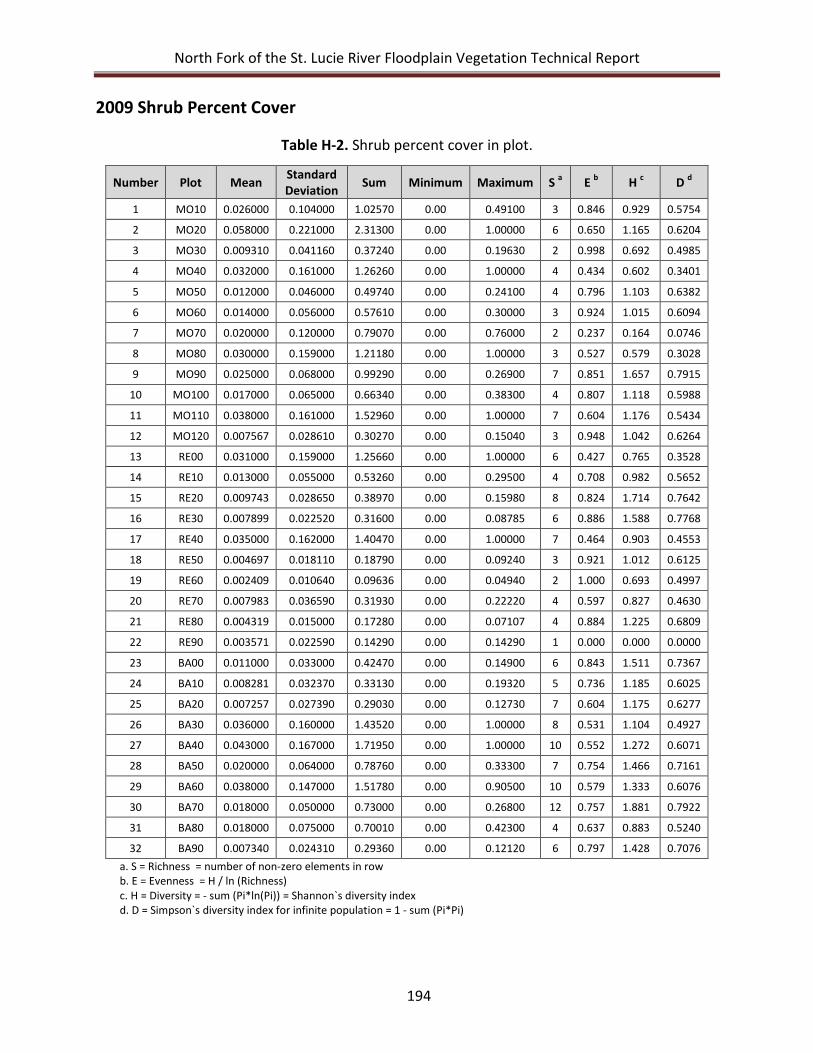
North Fork of the St. Lucie River Floodplain Vegetation Technical Report
194
2009 Shrub Percent Cover
Table H-2. Shrub percent cover in plot.
Number Plot Mean Standard Deviation Sum Minimum Maximum S a E b H c D d
1 MO10 0.026000 0.104000 1.02570 0.00 0.49100 3 0.846 0.929 0.5754
2 MO20 0.058000 0.221000 2.31300 0.00 1.00000 6 0.650 1.165 0.6204
3 MO30 0.009310 0.041160 0.37240 0.00 0.19630 2 0.998 0.692 0.4985
4 MO40 0.032000 0.161000 1.26260 0.00 1.00000 4 0.434 0.602 0.3401
5 MO50 0.012000 0.046000 0.49740 0.00 0.24100 4 0.796 1.103 0.6382
6 MO60 0.014000 0.056000 0.57610 0.00 0.30000 3 0.924 1.015 0.6094
7 MO70 0.020000 0.120000 0.79070 0.00 0.76000 2 0.237 0.164 0.0746
8 MO80 0.030000 0.159000 1.21180 0.00 1.00000 3 0.527 0.579 0.3028
9 MO90 0.025000 0.068000 0.99290 0.00 0.26900 7 0.851 1.657 0.7915
10 MO100 0.017000 0.065000 0.66340 0.00 0.38300 4 0.807 1.118 0.5988
11 MO110 0.038000 0.161000 1.52960 0.00 1.00000 7 0.604 1.176 0.5434
12 MO120 0.007567 0.028610 0.30270 0.00 0.15040 3 0.948 1.042 0.6264
13 RE00 0.031000 0.159000 1.25660 0.00 1.00000 6 0.427 0.765 0.3528
14 RE10 0.013000 0.055000 0.53260 0.00 0.29500 4 0.708 0.982 0.5652
15 RE20 0.009743 0.028650 0.38970 0.00 0.15980 8 0.824 1.714 0.7642
16 RE30 0.007899 0.022520 0.31600 0.00 0.08785 6 0.886 1.588 0.7768
17 RE40 0.035000 0.162000 1.40470 0.00 1.00000 7 0.464 0.903 0.4553
18 RE50 0.004697 0.018110 0.18790 0.00 0.09240 3 0.921 1.012 0.6125
19 RE60 0.002409 0.010640 0.09636 0.00 0.04940 2 1.000 0.693 0.4997
20 RE70 0.007983 0.036590 0.31930 0.00 0.22220 4 0.597 0.827 0.4630
21 RE80 0.004319 0.015000 0.17280 0.00 0.07107 4 0.884 1.225 0.6809
22 RE90 0.003571 0.022590 0.14290 0.00 0.14290 1 0.000 0.000 0.0000
23 BA00 0.011000 0.033000 0.42470 0.00 0.14900 6 0.843 1.511 0.7367
24 BA10 0.008281 0.032370 0.33130 0.00 0.19320 5 0.736 1.185 0.6025
25 BA20 0.007257 0.027390 0.29030 0.00 0.12730 7 0.604 1.175 0.6277
26 BA30 0.036000 0.160000 1.43520 0.00 1.00000 8 0.531 1.104 0.4927
27 BA40 0.043000 0.167000 1.71950 0.00 1.00000 10 0.552 1.272 0.6071
28 BA50 0.020000 0.064000 0.78760 0.00 0.33300 7 0.754 1.466 0.7161
29 BA60 0.038000 0.147000 1.51780 0.00 0.90500 10 0.579 1.333 0.6076
30 BA70 0.018000 0.050000 0.73000 0.00 0.26800 12 0.757 1.881 0.7922
31 BA80 0.018000 0.075000 0.70010 0.00 0.42300 4 0.637 0.883 0.5240
32 BA90 0.007340 0.024310 0.29360 0.00 0.12120 6 0.797 1.428 0.7076 a. S = Richness = number of non-zero elements in row b. E = Evenness = H / ln (Richness) c. H = Diversity = - sum (Pi*ln(Pi)) = Shannon`s diversity index d. D = Simpson`s diversity index for infinite population = 1 - sum (Pi*Pi)
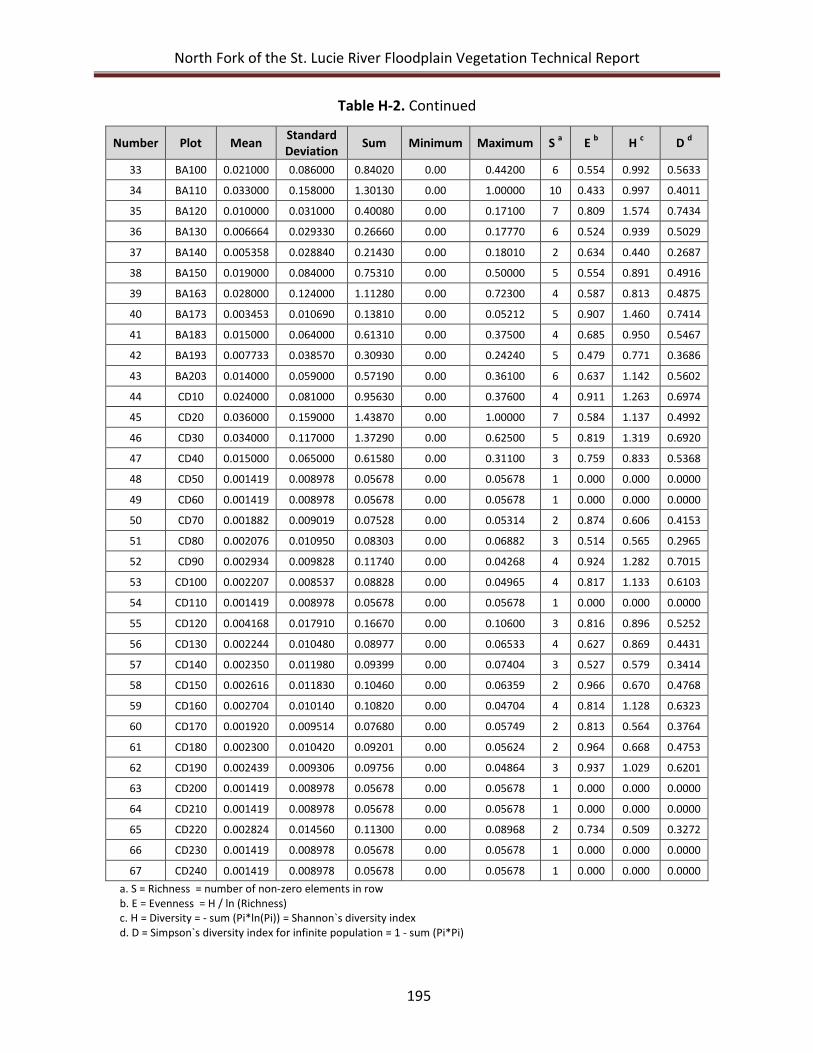
North Fork of the St. Lucie River Floodplain Vegetation Technical Report
195
Table H-2. Continued
Number Plot Mean Standard Deviation Sum Minimum Maximum S a E b H c D d
33 BA100 0.021000 0.086000 0.84020 0.00 0.44200 6 0.554 0.992 0.5633
34 BA110 0.033000 0.158000 1.30130 0.00 1.00000 10 0.433 0.997 0.4011
35 BA120 0.010000 0.031000 0.40080 0.00 0.17100 7 0.809 1.574 0.7434
36 BA130 0.006664 0.029330 0.26660 0.00 0.17770 6 0.524 0.939 0.5029
37 BA140 0.005358 0.028840 0.21430 0.00 0.18010 2 0.634 0.440 0.2687
38 BA150 0.019000 0.084000 0.75310 0.00 0.50000 5 0.554 0.891 0.4916
39 BA163 0.028000 0.124000 1.11280 0.00 0.72300 4 0.587 0.813 0.4875
40 BA173 0.003453 0.010690 0.13810 0.00 0.05212 5 0.907 1.460 0.7414
41 BA183 0.015000 0.064000 0.61310 0.00 0.37500 4 0.685 0.950 0.5467
42 BA193 0.007733 0.038570 0.30930 0.00 0.24240 5 0.479 0.771 0.3686
43 BA203 0.014000 0.059000 0.57190 0.00 0.36100 6 0.637 1.142 0.5602
44 CD10 0.024000 0.081000 0.95630 0.00 0.37600 4 0.911 1.263 0.6974
45 CD20 0.036000 0.159000 1.43870 0.00 1.00000 7 0.584 1.137 0.4992
46 CD30 0.034000 0.117000 1.37290 0.00 0.62500 5 0.819 1.319 0.6920
47 CD40 0.015000 0.065000 0.61580 0.00 0.31100 3 0.759 0.833 0.5368
48 CD50 0.001419 0.008978 0.05678 0.00 0.05678 1 0.000 0.000 0.0000
49 CD60 0.001419 0.008978 0.05678 0.00 0.05678 1 0.000 0.000 0.0000
50 CD70 0.001882 0.009019 0.07528 0.00 0.05314 2 0.874 0.606 0.4153
51 CD80 0.002076 0.010950 0.08303 0.00 0.06882 3 0.514 0.565 0.2965
52 CD90 0.002934 0.009828 0.11740 0.00 0.04268 4 0.924 1.282 0.7015
53 CD100 0.002207 0.008537 0.08828 0.00 0.04965 4 0.817 1.133 0.6103
54 CD110 0.001419 0.008978 0.05678 0.00 0.05678 1 0.000 0.000 0.0000
55 CD120 0.004168 0.017910 0.16670 0.00 0.10600 3 0.816 0.896 0.5252
56 CD130 0.002244 0.010480 0.08977 0.00 0.06533 4 0.627 0.869 0.4431
57 CD140 0.002350 0.011980 0.09399 0.00 0.07404 3 0.527 0.579 0.3414
58 CD150 0.002616 0.011830 0.10460 0.00 0.06359 2 0.966 0.670 0.4768
59 CD160 0.002704 0.010140 0.10820 0.00 0.04704 4 0.814 1.128 0.6323
60 CD170 0.001920 0.009514 0.07680 0.00 0.05749 2 0.813 0.564 0.3764
61 CD180 0.002300 0.010420 0.09201 0.00 0.05624 2 0.964 0.668 0.4753
62 CD190 0.002439 0.009306 0.09756 0.00 0.04864 3 0.937 1.029 0.6201
63 CD200 0.001419 0.008978 0.05678 0.00 0.05678 1 0.000 0.000 0.0000
64 CD210 0.001419 0.008978 0.05678 0.00 0.05678 1 0.000 0.000 0.0000
65 CD220 0.002824 0.014560 0.11300 0.00 0.08968 2 0.734 0.509 0.3272
66 CD230 0.001419 0.008978 0.05678 0.00 0.05678 1 0.000 0.000 0.0000
67 CD240 0.001419 0.008978 0.05678 0.00 0.05678 1 0.000 0.000 0.0000 a. S = Richness = number of non-zero elements in row b. E = Evenness = H / ln (Richness) c. H = Diversity = - sum (Pi*ln(Pi)) = Shannon`s diversity index d. D = Simpson`s diversity index for infinite population = 1 - sum (Pi*Pi)
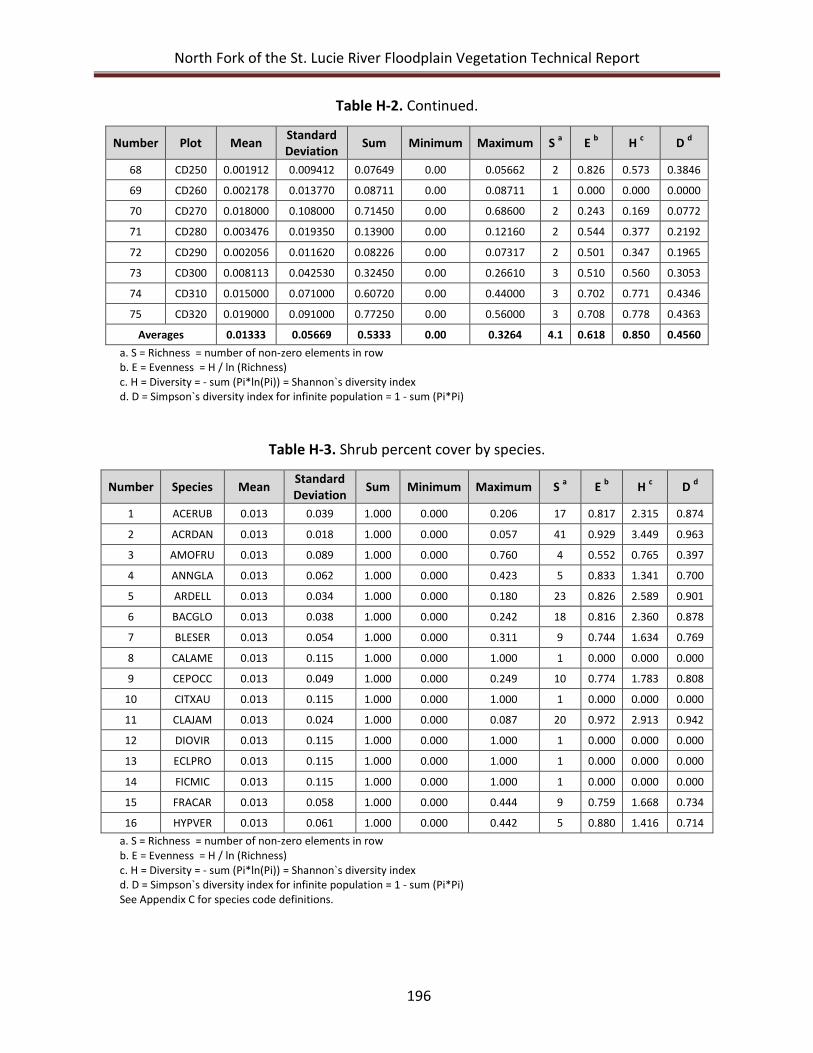
North Fork of the St. Lucie River Floodplain Vegetation Technical Report
196
Table H-2. Continued.
Number Plot Mean Standard Deviation Sum Minimum Maximum S a E b H c D d
68 CD250 0.001912 0.009412 0.07649 0.00 0.05662 2 0.826 0.573 0.3846
69 CD260 0.002178 0.013770 0.08711 0.00 0.08711 1 0.000 0.000 0.0000
70 CD270 0.018000 0.108000 0.71450 0.00 0.68600 2 0.243 0.169 0.0772
71 CD280 0.003476 0.019350 0.13900 0.00 0.12160 2 0.544 0.377 0.2192
72 CD290 0.002056 0.011620 0.08226 0.00 0.07317 2 0.501 0.347 0.1965
73 CD300 0.008113 0.042530 0.32450 0.00 0.26610 3 0.510 0.560 0.3053
74 CD310 0.015000 0.071000 0.60720 0.00 0.44000 3 0.702 0.771 0.4346
75 CD320 0.019000 0.091000 0.77250 0.00 0.56000 3 0.708 0.778 0.4363
Averages 0.01333 0.05669 0.5333 0.00 0.3264 4.1 0.618 0.850 0.4560 a. S = Richness = number of non-zero elements in row b. E = Evenness = H / ln (Richness) c. H = Diversity = - sum (Pi*ln(Pi)) = Shannon`s diversity index d. D = Simpson`s diversity index for infinite population = 1 - sum (Pi*Pi)
Table H-3. Shrub percent cover by species.
Number Species Mean Standard Deviation Sum Minimum Maximum S a E b H c D d
1 ACERUB 0.013 0.039 1.000 0.000 0.206 17 0.817 2.315 0.874
2 ACRDAN 0.013 0.018 1.000 0.000 0.057 41 0.929 3.449 0.963
3 AMOFRU 0.013 0.089 1.000 0.000 0.760 4 0.552 0.765 0.397
4 ANNGLA 0.013 0.062 1.000 0.000 0.423 5 0.833 1.341 0.700
5 ARDELL 0.013 0.034 1.000 0.000 0.180 23 0.826 2.589 0.901
6 BACGLO 0.013 0.038 1.000 0.000 0.242 18 0.816 2.360 0.878
7 BLESER 0.013 0.054 1.000 0.000 0.311 9 0.744 1.634 0.769
8 CALAME 0.013 0.115 1.000 0.000 1.000 1 0.000 0.000 0.000
9 CEPOCC 0.013 0.049 1.000 0.000 0.249 10 0.774 1.783 0.808
10 CITXAU 0.013 0.115 1.000 0.000 1.000 1 0.000 0.000 0.000
11 CLAJAM 0.013 0.024 1.000 0.000 0.087 20 0.972 2.913 0.942
12 DIOVIR 0.013 0.115 1.000 0.000 1.000 1 0.000 0.000 0.000
13 ECLPRO 0.013 0.115 1.000 0.000 1.000 1 0.000 0.000 0.000
14 FICMIC 0.013 0.115 1.000 0.000 1.000 1 0.000 0.000 0.000
15 FRACAR 0.013 0.058 1.000 0.000 0.444 9 0.759 1.668 0.734
16 HYPVER 0.013 0.061 1.000 0.000 0.442 5 0.880 1.416 0.714 a. S = Richness = number of non-zero elements in row b. E = Evenness = H / ln (Richness) c. H = Diversity = - sum (Pi*ln(Pi)) = Shannon`s diversity index d. D = Simpson`s diversity index for infinite population = 1 - sum (Pi*Pi) See Appendix C for species code definitions.
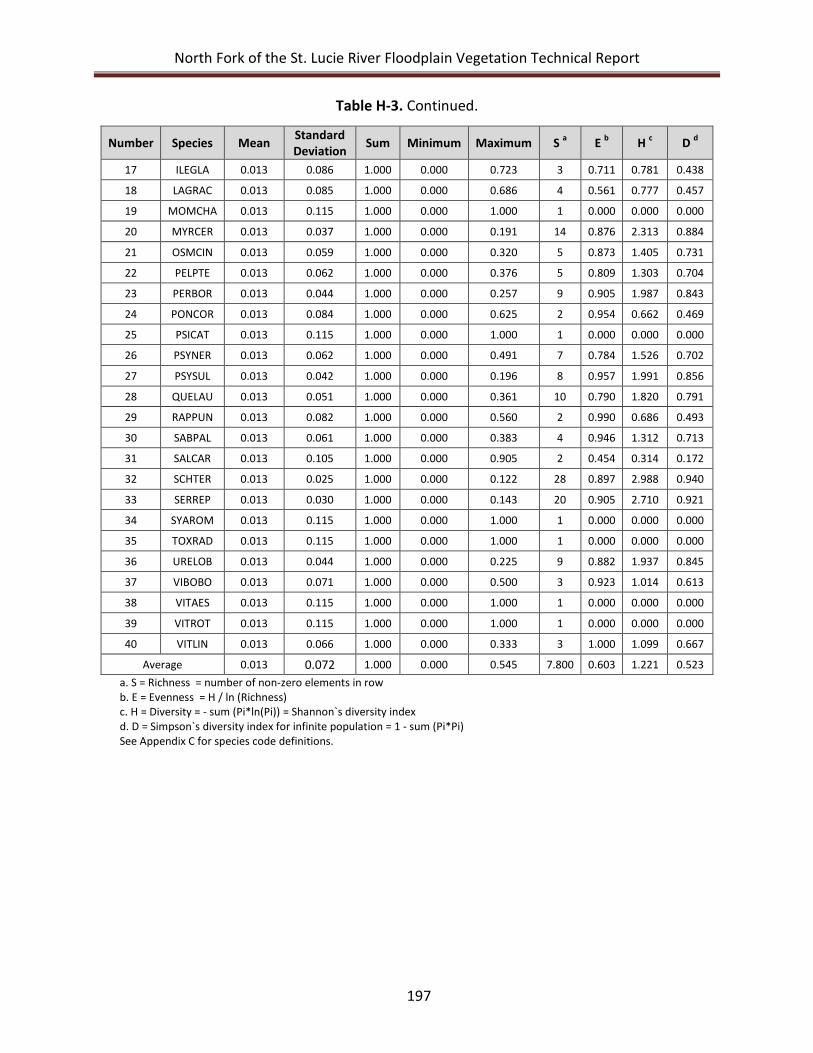
North Fork of the St. Lucie River Floodplain Vegetation Technical Report
197
Table H-3. Continued.
Number Species Mean Standard Deviation Sum Minimum Maximum S a E b H c D d
17 ILEGLA 0.013 0.086 1.000 0.000 0.723 3 0.711 0.781 0.438
18 LAGRAC 0.013 0.085 1.000 0.000 0.686 4 0.561 0.777 0.457
19 MOMCHA 0.013 0.115 1.000 0.000 1.000 1 0.000 0.000 0.000
20 MYRCER 0.013 0.037 1.000 0.000 0.191 14 0.876 2.313 0.884
21 OSMCIN 0.013 0.059 1.000 0.000 0.320 5 0.873 1.405 0.731
22 PELPTE 0.013 0.062 1.000 0.000 0.376 5 0.809 1.303 0.704
23 PERBOR 0.013 0.044 1.000 0.000 0.257 9 0.905 1.987 0.843
24 PONCOR 0.013 0.084 1.000 0.000 0.625 2 0.954 0.662 0.469
25 PSICAT 0.013 0.115 1.000 0.000 1.000 1 0.000 0.000 0.000
26 PSYNER 0.013 0.062 1.000 0.000 0.491 7 0.784 1.526 0.702
27 PSYSUL 0.013 0.042 1.000 0.000 0.196 8 0.957 1.991 0.856
28 QUELAU 0.013 0.051 1.000 0.000 0.361 10 0.790 1.820 0.791
29 RAPPUN 0.013 0.082 1.000 0.000 0.560 2 0.990 0.686 0.493
30 SABPAL 0.013 0.061 1.000 0.000 0.383 4 0.946 1.312 0.713
31 SALCAR 0.013 0.105 1.000 0.000 0.905 2 0.454 0.314 0.172
32 SCHTER 0.013 0.025 1.000 0.000 0.122 28 0.897 2.988 0.940
33 SERREP 0.013 0.030 1.000 0.000 0.143 20 0.905 2.710 0.921
34 SYAROM 0.013 0.115 1.000 0.000 1.000 1 0.000 0.000 0.000
35 TOXRAD 0.013 0.115 1.000 0.000 1.000 1 0.000 0.000 0.000
36 URELOB 0.013 0.044 1.000 0.000 0.225 9 0.882 1.937 0.845
37 VIBOBO 0.013 0.071 1.000 0.000 0.500 3 0.923 1.014 0.613
38 VITAES 0.013 0.115 1.000 0.000 1.000 1 0.000 0.000 0.000
39 VITROT 0.013 0.115 1.000 0.000 1.000 1 0.000 0.000 0.000
40 VITLIN 0.013 0.066 1.000 0.000 0.333 3 1.000 1.099 0.667
Average 0.013 0.072 1.000 0.000 0.545 7.800 0.603 1.221 0.523 a. S = Richness = number of non-zero elements in row b. E = Evenness = H / ln (Richness) c. H = Diversity = - sum (Pi*ln(Pi)) = Shannon`s diversity index d. D = Simpson`s diversity index for infinite population = 1 - sum (Pi*Pi) See Appendix C for species code definitions.
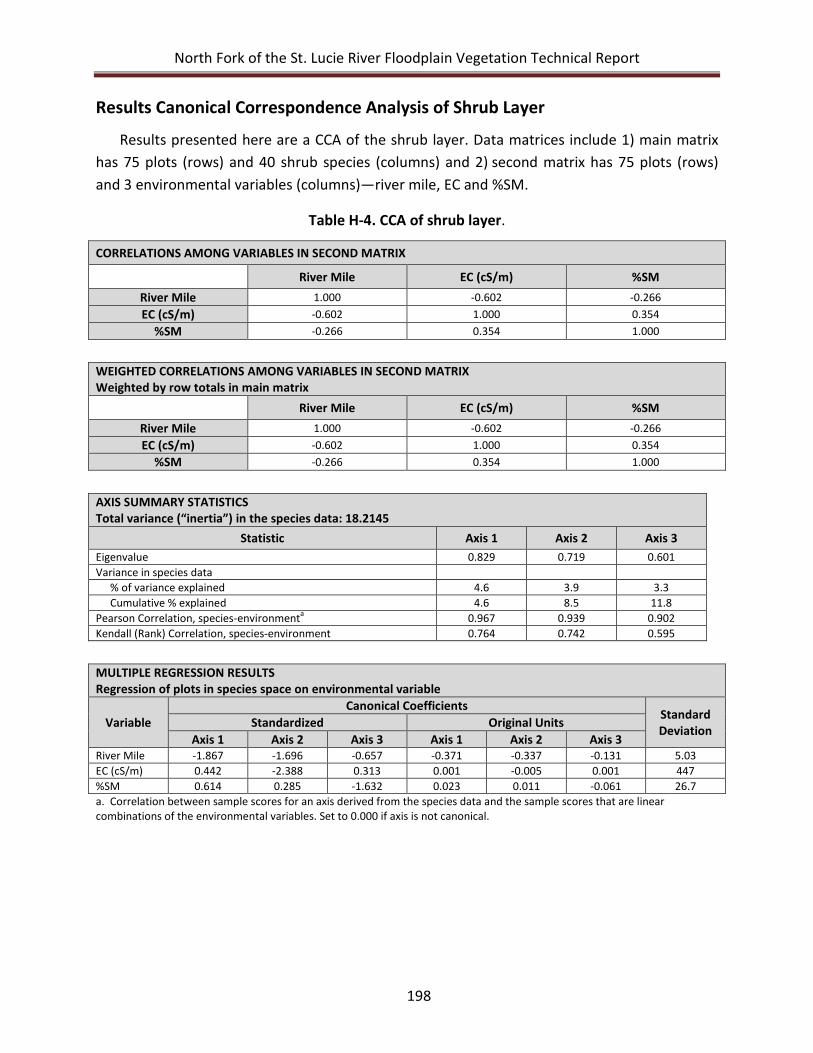
North Fork of the St. Lucie River Floodplain Vegetation Technical Report
198
Results Canonical Correspondence Analysis of Shrub Layer
Results presented here are a CCA of the shrub layer. Data matrices include 1) main matrix has 75 plots (rows) and 40 shrub species (columns) and 2) second matrix has 75 plots (rows) and 3 environmental variables (columns)—river mile, EC and %SM.
Table H-4. CCA of shrub layer.
CORRELATIONS AMONG VARIABLES IN SECOND MATRIX River Mile EC (cS/m) %SM
River Mile 1.000 -0.602 -0.266 EC (cS/m) -0.602 1.000 0.354
%SM -0.266 0.354 1.000
WEIGHTED CORRELATIONS AMONG VARIABLES IN SECOND MATRIX Weighted by row totals in main matrix
River Mile EC (cS/m) %SM River Mile 1.000 -0.602 -0.266 EC (cS/m) -0.602 1.000 0.354
%SM -0.266 0.354 1.000
AXIS SUMMARY STATISTICS Total variance (“inertia”) in the species data: 18.2145
Statistic Axis 1 Axis 2 Axis 3 Eigenvalue 0.829 0.719 0.601 Variance in species data
% of variance explained 4.6 3.9 3.3 Cumulative % explained 4.6 8.5 11.8
Pearson Correlation, species-environmenta 0.967 0.939 0.902 Kendall (Rank) Correlation, species-environment 0.764 0.742 0.595
MULTIPLE REGRESSION RESULTS Regression of plots in species space on environmental variable
Variable Canonical Coefficients
Standard Deviation Standardized Original Units
Axis 1 Axis 2 Axis 3 Axis 1 Axis 2 Axis 3 River Mile -1.867 -1.696 -0.657 -0.371 -0.337 -0.131 5.03 EC (cS/m) 0.442 -2.388 0.313 0.001 -0.005 0.001 447 %SM 0.614 0.285 -1.632 0.023 0.011 -0.061 26.7 a. Correlation between sample scores for an axis derived from the species data and the sample scores that are linear combinations of the environmental variables. Set to 0.000 if axis is not canonical.
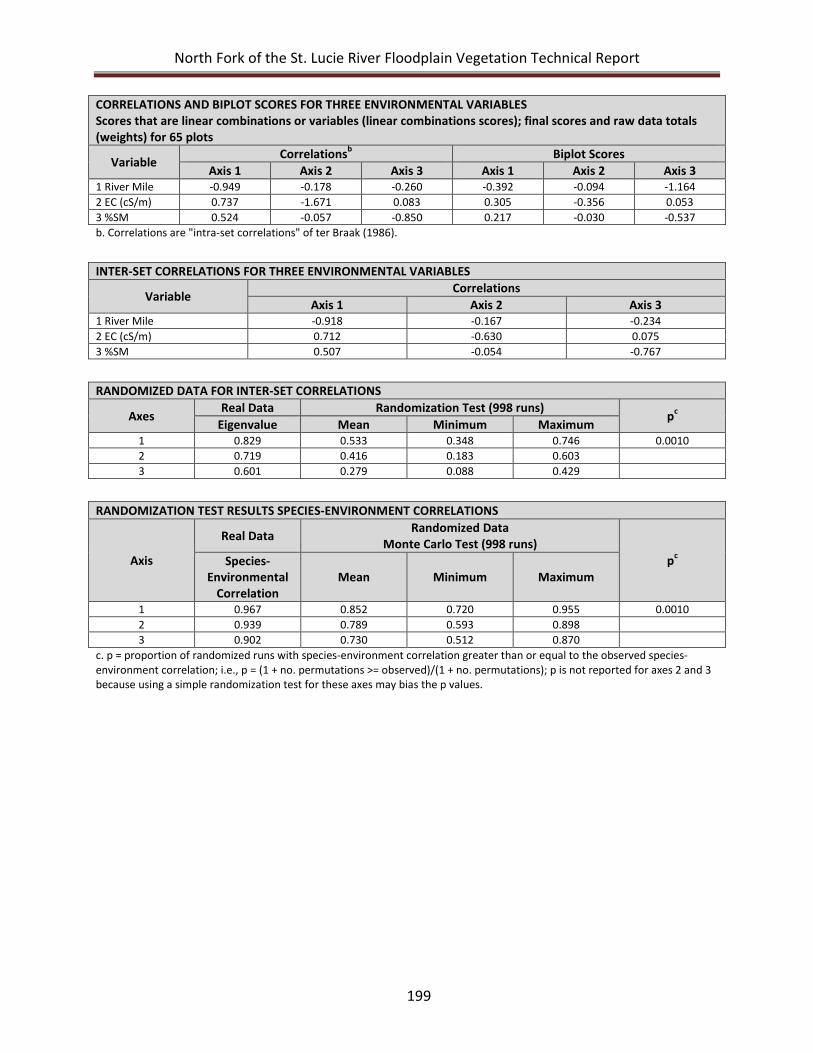
North Fork of the St. Lucie River Floodplain Vegetation Technical Report
199
CORRELATIONS AND BIPLOT SCORES FOR THREE ENVIRONMENTAL VARIABLES Scores that are linear combinations or variables (linear combinations scores); final scores and raw data totals (weights) for 65 plots
Variable Correlationsb Biplot Scores Axis 1 Axis 2 Axis 3 Axis 1 Axis 2 Axis 3
1 River Mile -0.949 -0.178 -0.260 -0.392 -0.094 -1.164 2 EC (cS/m) 0.737 -1.671 0.083 0.305 -0.356 0.053 3 %SM 0.524 -0.057 -0.850 0.217 -0.030 -0.537 b. Correlations are "intra-set correlations" of ter Braak (1986).
INTER-SET CORRELATIONS FOR THREE ENVIRONMENTAL VARIABLES
Variable Correlations
Axis 1 Axis 2 Axis 3 1 River Mile -0.918 -0.167 -0.234 2 EC (cS/m) 0.712 -0.630 0.075 3 %SM 0.507 -0.054 -0.767
RANDOMIZED DATA FOR INTER-SET CORRELATIONS
Axes Real Data Randomization Test (998 runs)
pc Eigenvalue Mean Minimum Maximum
1 0.829 0.533 0.348 0.746 0.0010 2 0.719 0.416 0.183 0.603 3 0.601 0.279 0.088 0.429
RANDOMIZATION TEST RESULTS SPECIES-ENVIRONMENT CORRELATIONS
Axis
Real Data Randomized Data Monte Carlo Test (998 runs)
pc Species-Environmental
Correlation Mean Minimum Maximum
1 0.967 0.852 0.720 0.955 0.0010 2 0.939 0.789 0.593 0.898 3 0.902 0.730 0.512 0.870
c. p = proportion of randomized runs with species-environment correlation greater than or equal to the observed species-environment correlation; i.e., p = (1 + no. permutations >= observed)/(1 + no. permutations); p is not reported for axes 2 and 3 because using a simple randomization test for these axes may bias the p values.
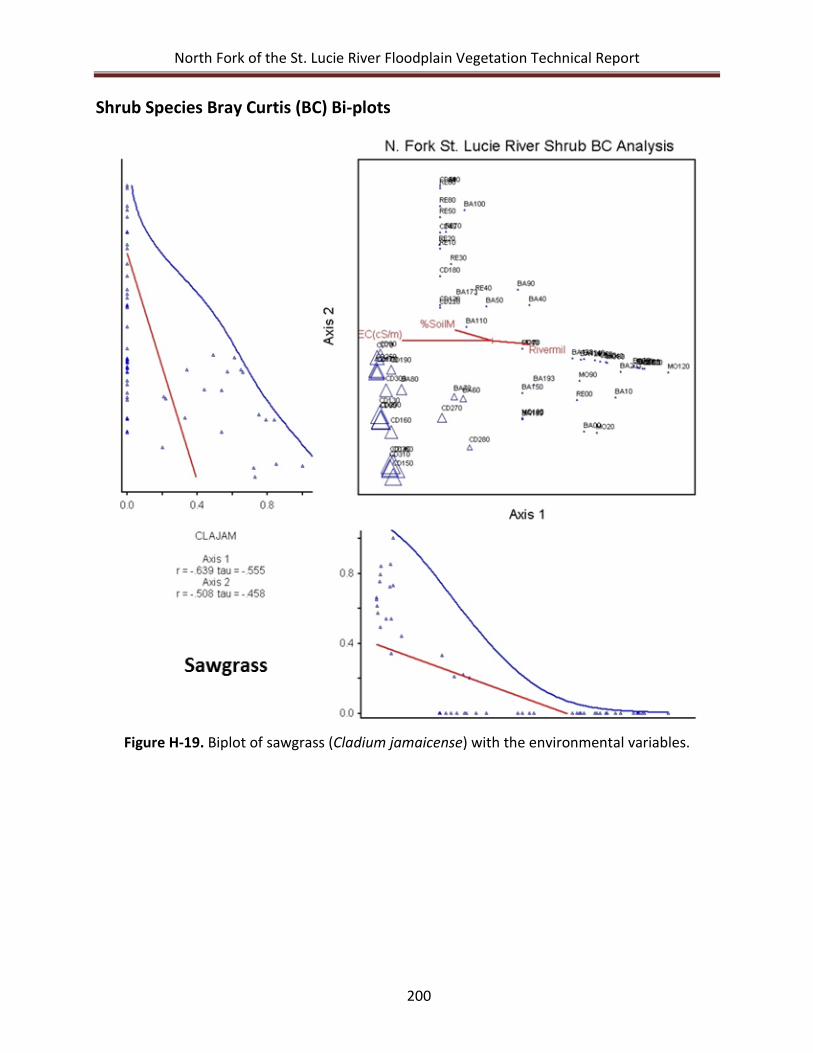
North Fork of the St. Lucie River Floodplain Vegetation Technical Report
200
Shrub Species Bray Curtis (BC) Bi-plots
Figure H-19. Biplot of sawgrass (Cladium jamaicense) with the environmental variables.
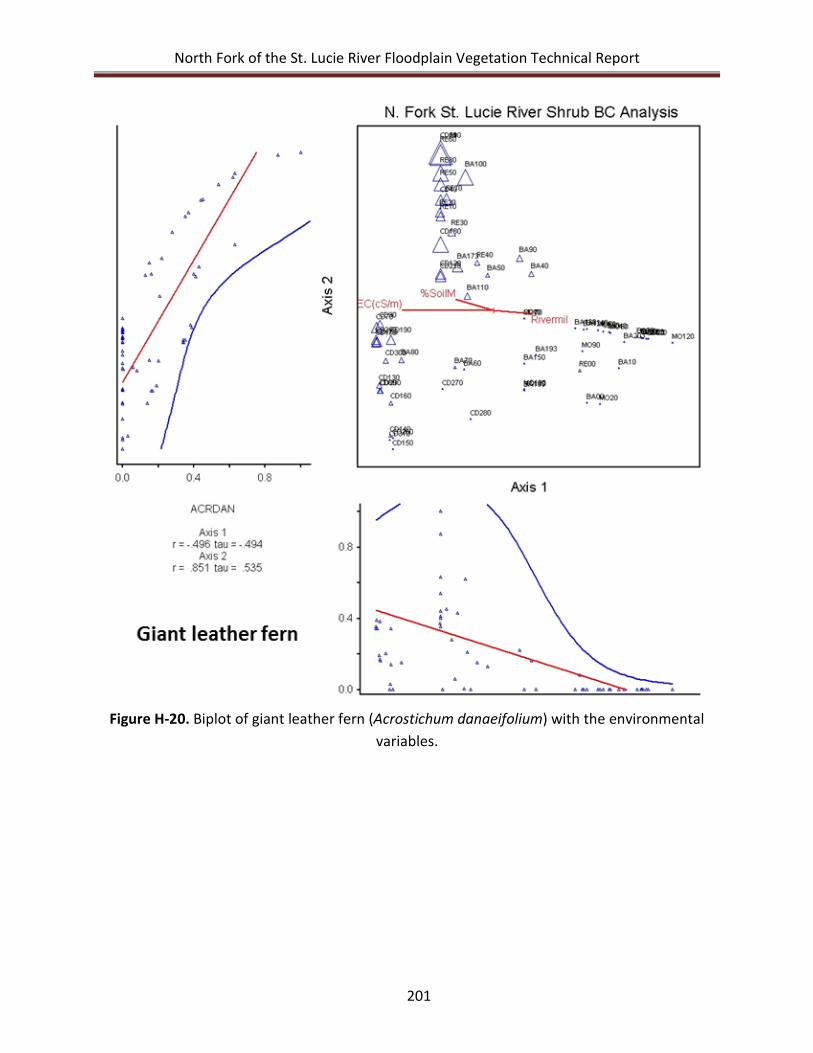
North Fork of the St. Lucie River Floodplain Vegetation Technical Report
201
Figure H-20. Biplot of giant leather fern (Acrostichum danaeifolium) with the environmental variables.

North Fork of the St. Lucie River Floodplain Vegetation Technical Report
202
North Fork of the St. Lucie River Floodplain Vegetation Technical Report
203
APPENDIX I: NORTH FORK ST. LUCIE RIVER FLOODPLAIN GRID MAPS
North Fork of the St. Lucie River Floodplain Vegetation Technical Report
204
Floodplain LIDAR
The grid maps in this appendix were developed utilizing laser imaging detection and ranging (LIDAR) data from the following website: http://www.floridadisaster.org/gis/lidar/. The mapping flights were flown in 2010 for St. Lucie County.
For this study, the grid maps are used to illustrate the changes in topography (i.e. elevation) within the floodplain and adjacent upland areas of the North Fork St. Lucie River. The changes in topography are representative of land use cover (i.e. urban versus conservation lands), changes in vegetative communities (i.e. upland, hammock, bottomland hardwood, swamp and marsh), and changes caused by anthropogenic alterations (i.e. berms). Six grid maps are provided to give a more detailed view of the North Fork St. Lucie River floodplain. River miles (for example, NF•14) and some roadways and city names have been added to assist in the identification of location. A compact disc of the ARC GIS data set is provided with the hard copy of this report to view even more detailed analysis of the floodplain area. The data set can be viewed to search for possible areas of future reconnection to improve hydrological conditions behind berms or for identifying areas in need of exotic plant control.
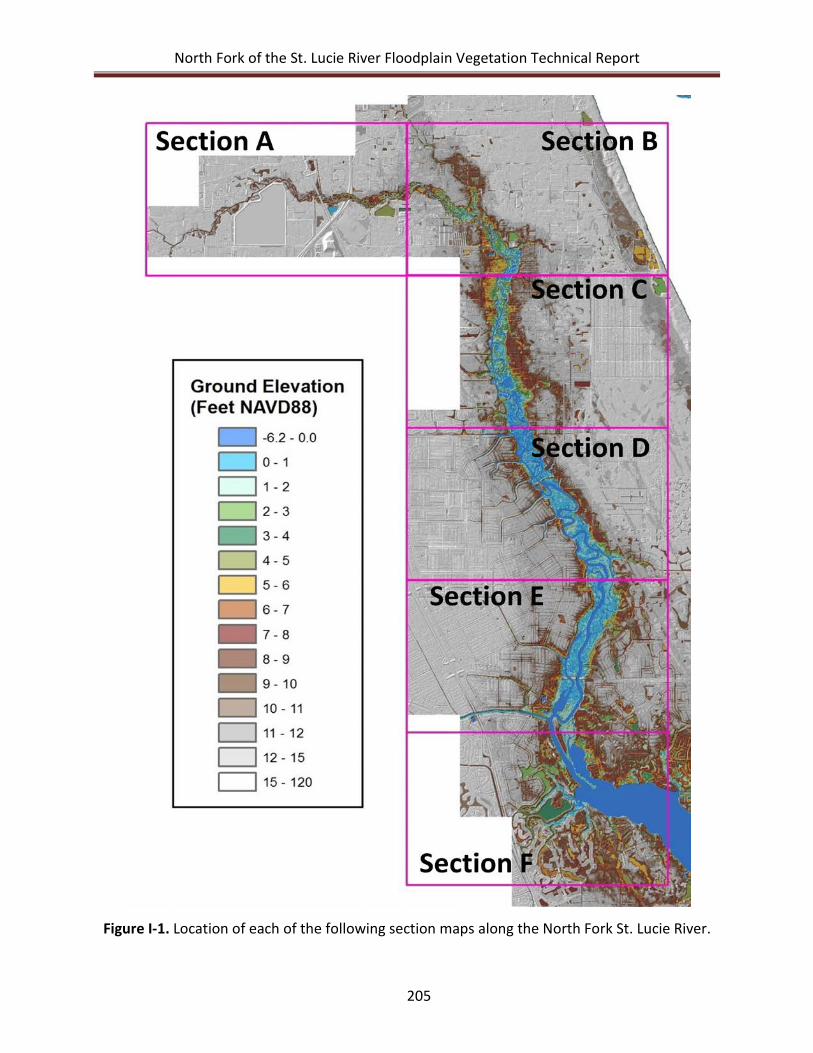
North Fork of the St. Lucie River Floodplain Vegetation Technical Report
205
Figure I-1. Location of each of the following section maps along the North Fork St. Lucie River.
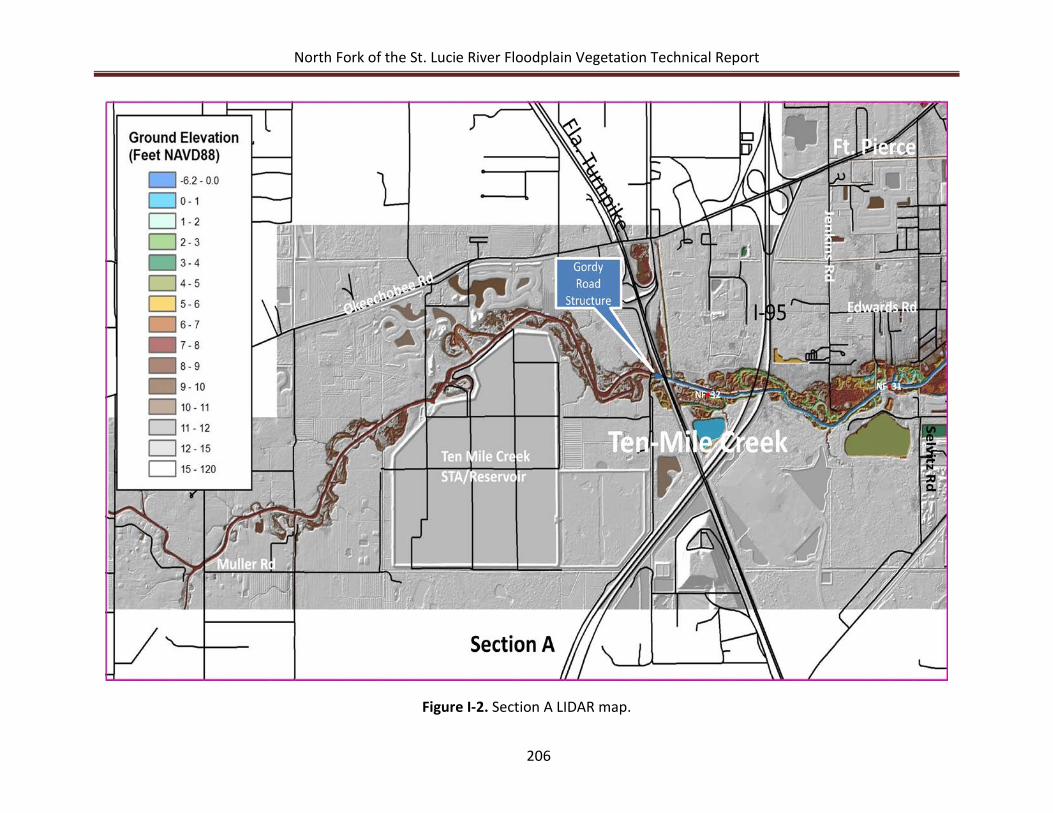
North Fork of the St. Lucie River Floodplain Vegetation Technical Report
206
Figure I-2. Section A LIDAR map.
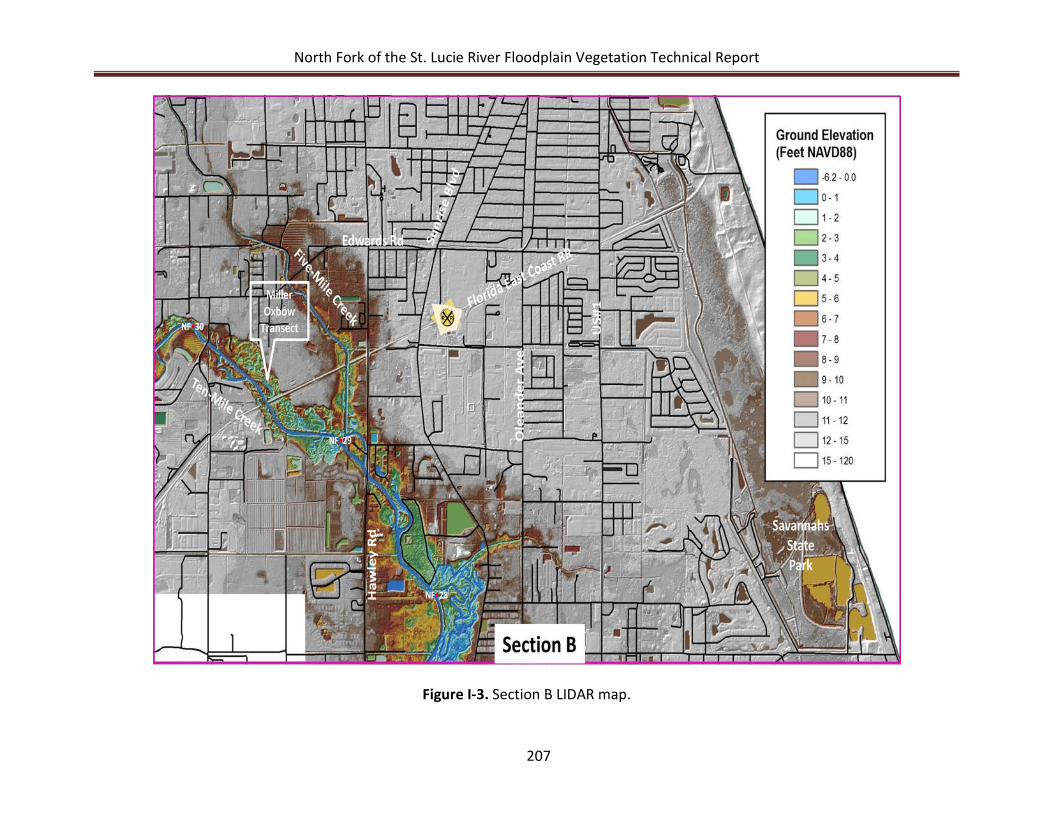
North Fork of the St. Lucie River Floodplain Vegetation Technical Report
207
Figure I-3. Section B LIDAR map.
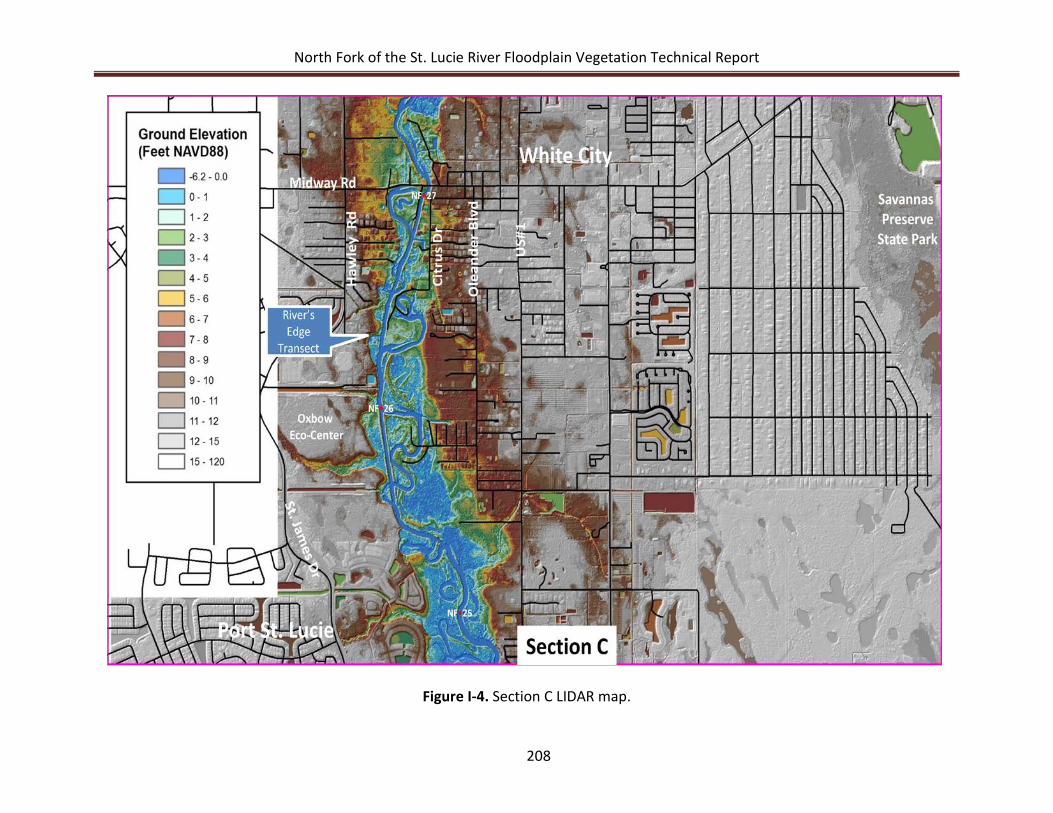
North Fork of the St. Lucie River Floodplain Vegetation Technical Report
208
Figure I-4. Section C LIDAR map.
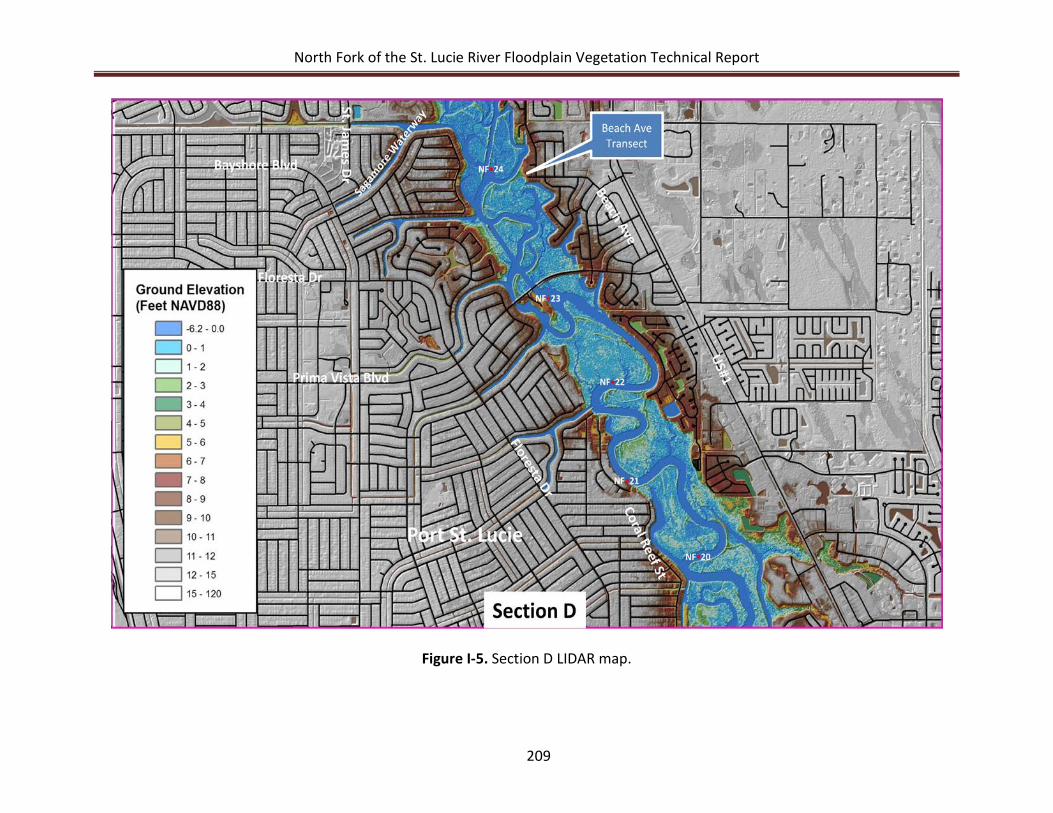
North Fork of the St. Lucie River Floodplain Vegetation Technical Report
209
Figure I-5. Section D LIDAR map.
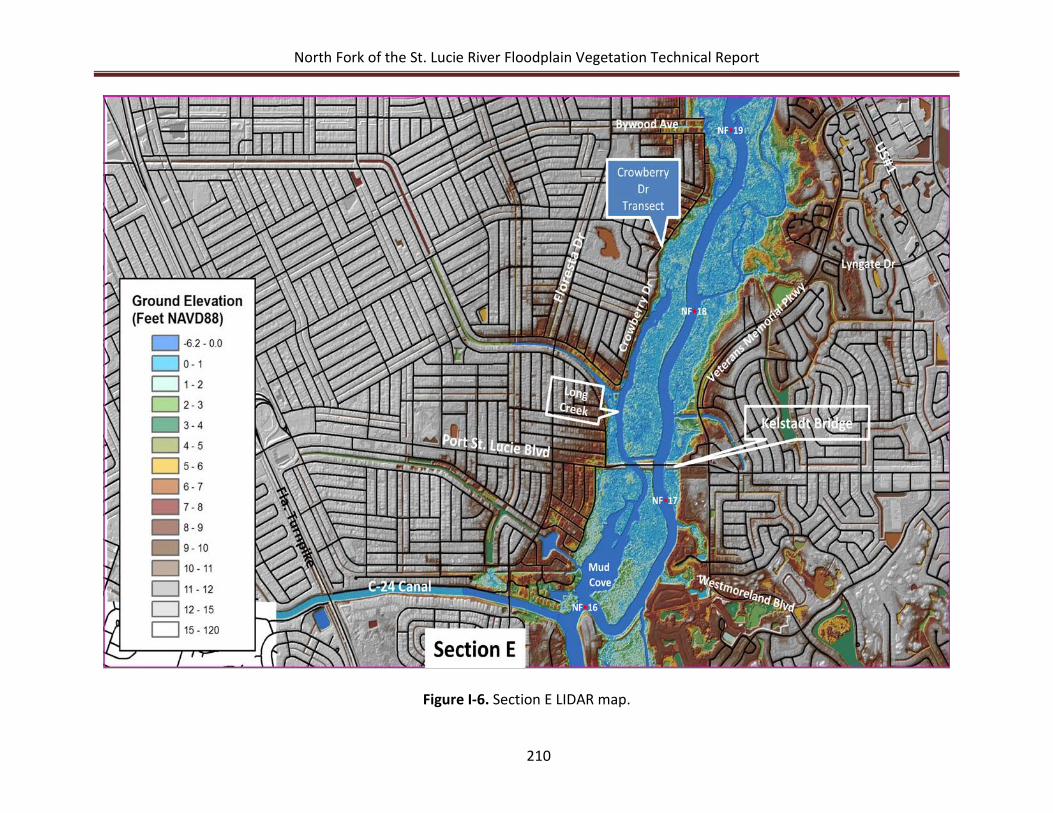
North Fork of the St. Lucie River Floodplain Vegetation Technical Report
210
Figure I-6. Section E LIDAR map.
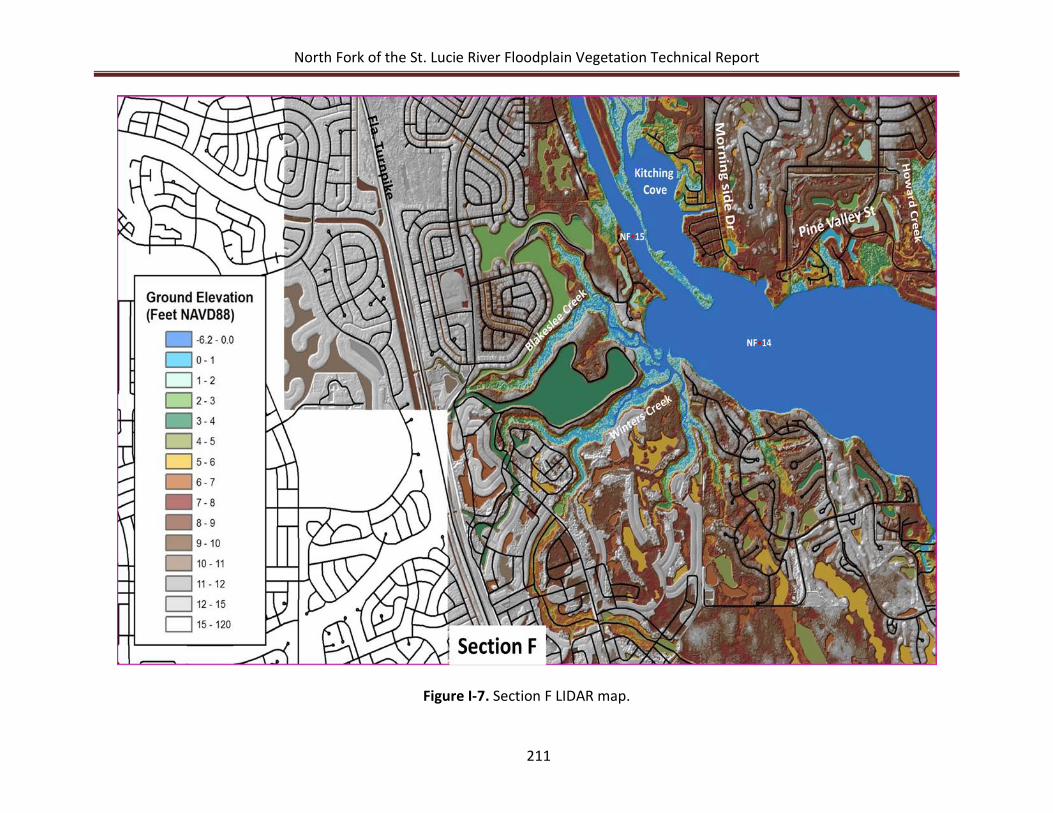
North Fork of the St. Lucie River Floodplain Vegetation Technical Report
211
Figure I-7. Section F LIDAR map.