non-invasive measurement of the microvascular properties of non-dysplastic and dysplastic oral...
TRANSCRIPT

Oral Oncology 47 (2011) 1165–1170
Contents lists available at SciVerse ScienceDirect
Oral Oncology
journal homepage: www.elsevier .com/locate /ora loncology
Non-invasive measurement of the microvascular properties of non-dysplasticand dysplastic oral leukoplakias by use of optical spectroscopy
A. Amelink a,b,⇑, H.J.C.M. Sterenborg a, J.L.N. Roodenburg b, M.J.H. Witjes b
a Center for Optical Diagnostics and Therapy, Department of Radiation Oncology, Erasmus Medical Centre, Rotterdam, The Netherlandsb Department of Oral and Maxillofacial Surgery, Division of Oncology, University Medical Centre Groningen, Groningen, The Netherlands
a r t i c l e i n f o
Article history:Received 21 June 2011Received in revised form 18 August 2011Accepted 19 August 2011Available online 13 September 2011
Keywords:Optical spectroscopyLeukoplakiaDysplasiaMicrovasculatureLight scattering
1368-8375 � 2011 Elsevier Ltd.doi:10.1016/j.oraloncology.2011.08.014
⇑ Corresponding author at: CODT, Department of RMC, P.O. Box 2040, 3000 CA Rotterdam, The Netherlan+31 10 7032141.
E-mail address: [email protected] (A. Ame
Open access under the Elsev
s u m m a r y
Differential Path-length Spectroscopy (DPS) was used to non-invasively determine the optical propertiesof oral leukoplakias in vivo. DPS yields information on microvascular parameters such as the mucosalblood content, the microvascular blood oxygenation and the average micro-vessel diameter as well ason tissue morphological parameters such as the scattering slope and scattering amplitude. DPS measure-ments were made on non-dysplastic and dysplastic oral leukoplakias using a novel fiber-optic probe, andwere correlated to the histological outcome of biopsies taken from the same location. Our data show bor-derline significant increases in mucosal blood content in dysplastic lesions compared to non-dysplasticlesions, with no changes in microvascular oxygen saturation and light scattering signatures. These resultssuggest that dysplastic and non-dysplastic leukoplakias may be discriminated non-invasively in vivothrough differences in their microvascular properties, if they can be reproducibly quantified in the pres-ence of a variable thickness keratin layer that optically shields the mucosal layer.
� 2011 Elsevier Ltd. Open access under the Elsevier OA license.
Introduction
Oral cancer is the sixth most common malignancy in the Euro-pean population and is the first in India.1 Worldwide it showsincreasing incidence and mortality rates. Globally, there are around270,000 new cases annually and 145,000 deaths, of which two-thirds occur in developing countries.2 The main risk factors fordeveloping oral cancer are tobacco and alcohol use.3,4 The detec-tion of small, early-stage oral cancer has been shown to lead to sig-nificantly reduced mortality and morbidity.5
Early detection of oral cancer and especially its precursors re-mains the best way to ensure patient survival and quality of life.Oral cancer is predominantly preceded by white (leukoplakia) orred (erythroplakia) lesions that are often present for a considerableperiod of time prior to malignant transformation and readily acces-sible for visual inspection. In spite of this visual accessibility, thepercentage of oral cancers diagnosed in the early stages remainssimilar to that of the much less accessible colon cancers (36%).6
The main problem in visual screening for oral cancer is that it is ex-tremely difficult to visually distinguish premalignant (i.e. dysplas-tic or worse) from benign (i.e. non-dysplastic) leukoplakias. Sincethe prevalence of leukoplakias is reported to be as high as 1–5%
adiation Oncology, Erasmusds. Tel.: +31 10 7032104; fax:
link).
ier OA license.
of the general population,7 while the annual malignant transfor-mation probability of leukoplakias is less than 1%,8 it is very expen-sive and highly undesirable to take biopsies from all leukoplakiaspresented during routine screening. Not only the financial side ofsuch a high false positive rate is a problem for implementing anoral screening program, but also patients may be reluctant to sub-mit to an invasive and painful biopsy when their doctor’s confi-dence as to the nature of the lesion is low. This applies even topatients who previously had oral cancer and are subjected to visualinspection several times per year because of their high chances ofdeveloping a second primary cancer; they are often unmotivated toundergo further biopsies. A non-invasive tool that would help toreduce the number of unnecessary biopsies would greatly improvethe cost effectiveness as well as patient compliance to screeningprograms for high risk patients. Moreover, such a tool might enablecost effective screening of the general population.
Differential Path-length Spectroscopy (DPS) is a fiberoptic tech-nique that uses white light and has the capability to extract rele-vant biological information from a very small and superficialtissue volume.9,10 DPS is particularly suitable for non-invasivein vivo measurements of microvascular blood content, oxygen sat-uration and microvascular diameter, which are parameters be-lieved to be relevant for the prognosis of (pre)malignanttissue.11–15 We have previously investigated the correlation be-tween DPS parameters measured in vivo on normal and cancerousoral mucosa and the histology of the corresponding biopsies.16 Inthat study we observed significant differences in the scattering
1166 A. Amelink et al. / Oral Oncology 47 (2011) 1165–1170
properties (related to tissue architecture) and absorption proper-ties (related to microvascular properties) of normal and canceroustissue. As stated previously, however, the diagnostic challenge inoral cancer screening is to discriminate non-dysplastic from dys-plastic (or worse) leukoplakias. Therefore, the aim of the presentstudy was to find distinguishing differences in the optical proper-ties of non-dysplastic and dysplastic oral leukoplakias in vivo.
Material and methods
Study population
Eighteen patients (6 males and 12 females, age 63 ± 15 years)were included. All patients had one or more leukoplakia that re-quired a biopsy for histological diagnosis. Both the number of biop-sies as well as their location was determined by the physicianbased on their clinical appearance, before the DPS measurementswere performed (i.e. DPS was not used to determine the locationof the biopsies). A total of 27 leukoplakias were measured andbiopsied in these patients. Additionally, 24 measurements wereperformed on visually unsuspicious (normal) mucosa; these loca-tions were not biopsied. All measurements were performed in anout-patient clinic. All patients were more than 18 years old andgave informed consent.
Experimental setup
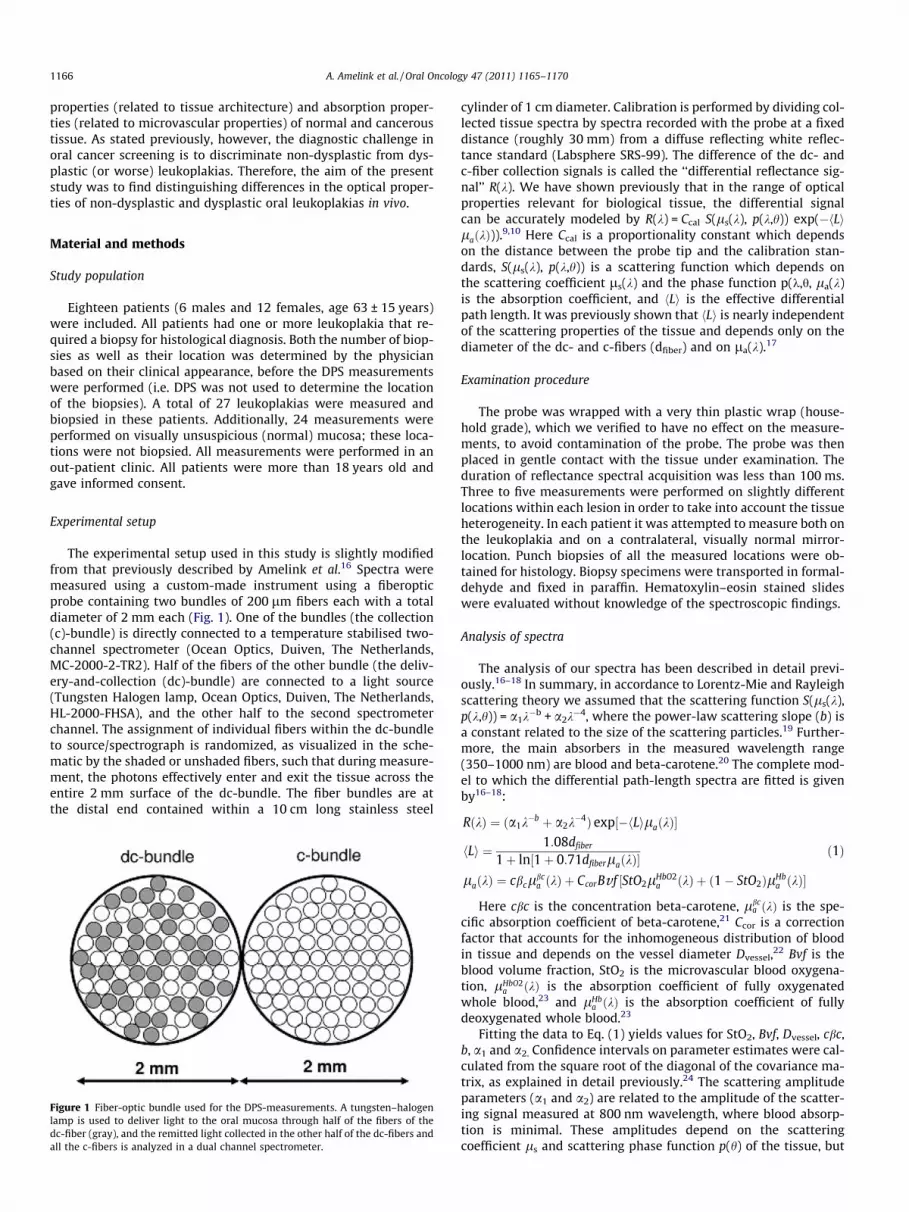
The experimental setup used in this study is slightly modifiedfrom that previously described by Amelink et al.16 Spectra weremeasured using a custom-made instrument using a fiberopticprobe containing two bundles of 200 lm fibers each with a totaldiameter of 2 mm each (Fig. 1). One of the bundles (the collection(c)-bundle) is directly connected to a temperature stabilised two-channel spectrometer (Ocean Optics, Duiven, The Netherlands,MC-2000-2-TR2). Half of the fibers of the other bundle (the deliv-ery-and-collection (dc)-bundle) are connected to a light source(Tungsten Halogen lamp, Ocean Optics, Duiven, The Netherlands,HL-2000-FHSA), and the other half to the second spectrometerchannel. The assignment of individual fibers within the dc-bundleto source/spectrograph is randomized, as visualized in the sche-matic by the shaded or unshaded fibers, such that during measure-ment, the photons effectively enter and exit the tissue across theentire 2 mm surface of the dc-bundle. The fiber bundles are atthe distal end contained within a 10 cm long stainless steel
Figure 1 Fiber-optic bundle used for the DPS-measurements. A tungsten–halogenlamp is used to deliver light to the oral mucosa through half of the fibers of thedc-fiber (gray), and the remitted light collected in the other half of the dc-fibers andall the c-fibers is analyzed in a dual channel spectrometer.
cylinder of 1 cm diameter. Calibration is performed by dividing col-lected tissue spectra by spectra recorded with the probe at a fixeddistance (roughly 30 mm) from a diffuse reflecting white reflec-tance standard (Labsphere SRS-99). The difference of the dc- andc-fiber collection signals is called the ‘‘differential reflectance sig-nal’’ R(k). We have shown previously that in the range of opticalproperties relevant for biological tissue, the differential signalcan be accurately modeled by R(k) = Ccal S(ls(k), p(k,h)) exp(�hLilaðkÞ)).
9,10 Here Ccal is a proportionality constant which dependson the distance between the probe tip and the calibration stan-dards, S(ls(k), p(k,h)) is a scattering function which depends onthe scattering coefficient ls(k) and the phase function p(k,h, la(k)is the absorption coefficient, and hLi is the effective differentialpath length. It was previously shown that hLi is nearly independentof the scattering properties of the tissue and depends only on thediameter of the dc- and c-fibers (dfiber) and on la(k).17
Examination procedure
The probe was wrapped with a very thin plastic wrap (house-hold grade), which we verified to have no effect on the measure-ments, to avoid contamination of the probe. The probe was thenplaced in gentle contact with the tissue under examination. Theduration of reflectance spectral acquisition was less than 100 ms.Three to five measurements were performed on slightly differentlocations within each lesion in order to take into account the tissueheterogeneity. In each patient it was attempted to measure both onthe leukoplakia and on a contralateral, visually normal mirror-location. Punch biopsies of all the measured locations were ob-tained for histology. Biopsy specimens were transported in formal-dehyde and fixed in paraffin. Hematoxylin–eosin stained slideswere evaluated without knowledge of the spectroscopic findings.
Analysis of spectra
The analysis of our spectra has been described in detail previ-ously.16–18 In summary, in accordance to Lorentz-Mie and Rayleighscattering theory we assumed that the scattering function S(ls(k),p(k,h)) = a1k
�b + a2k�4, where the power-law scattering slope (b) is
a constant related to the size of the scattering particles.19 Further-more, the main absorbers in the measured wavelength range(350–1000 nm) are blood and beta-carotene.20 The complete mod-el to which the differential path-length spectra are fitted is givenby16–18:
RðkÞ ¼ ða1k�b þ a2k
�4Þ exp½�hLilaðkÞ�
hLi ¼ 1:08dfiber
1þ ln½1þ 0:71dfiberlaðkÞ�laðkÞ ¼ cbclbc
a ðkÞ þ CcorBvf ½StO2lHbO2a ðkÞ þ ð1� StO2ÞlHb
a ðkÞ�
ð1Þ
Here cbc is the concentration beta-carotene, lbca ðkÞ is the spe-
cific absorption coefficient of beta-carotene,21 Ccor is a correctionfactor that accounts for the inhomogeneous distribution of bloodin tissue and depends on the vessel diameter Dvessel,22 Bvf is theblood volume fraction, StO2 is the microvascular blood oxygena-tion, lHbO2
a ðkÞ is the absorption coefficient of fully oxygenatedwhole blood,23 and lHb
a ðkÞ is the absorption coefficient of fullydeoxygenated whole blood.23
Fitting the data to Eq. (1) yields values for StO2, Bvf, Dvessel, cbc,b, a1 and a2. Confidence intervals on parameter estimates were cal-culated from the square root of the diagonal of the covariance ma-trix, as explained in detail previously.24 The scattering amplitudeparameters (a1 and a2) are related to the amplitude of the scatter-ing signal measured at 800 nm wavelength, where blood absorp-tion is minimal. These amplitudes depend on the scatteringcoefficient ls and scattering phase function p(h) of the tissue, but

Figure 2 Typical DPS measurement of (a) normal oral mucosa and (b) leukoplakia.The signal dips observed below 600 nm are due to the absorption of light by thehemoglobin in the microvascular network. The error bars represent the standarddeviations of the 10 pixels used to bin the data.
A. Amelink et al. / Oral Oncology 47 (2011) 1165–1170 1167
also depend on the distance between the probe and the calibrationstandards. Thus the absolute number of these scattering amplitudeparameters is arbitrary, but since all calibrations were performedat the exact same distance from the spectralon calibration stan-dard, a comparison between the scattering amplitudes of differentmeasurements is still valuable.
Statistical analysis
The differences in the 7 parameters between the three groupswere evaluated with a Kruskal-Wallis test, and differences be-tween the non-dysplastic and dysplastic leukoplakias were furtherevaluated with a Wilcoxon rank-sum test. These tests were useddue to the small sample size and the non-normal distribution ofthe parameters, which makes the student t-test inappropriate. p-values less than 0.05 were regarded as significant.
Linear discriminant analysis (LDA)
To evaluate the quality of discrimination between the non-dys-plastic and dysplastic lesions, linear discriminant analysis wasapplied on the subset of spectra measured on leukoplakias. Specif-ically, a logistic regression model based on the three vascularparameters was generated to predict the classification (dysplasticor non-dysplastic) of each spectrum measured on a leukoplakiausing a statistical software package (MedCalc). This model wasthen used to calculate a receiver operating characteristic (ROC)curve. When multiple measurements were performed on a singleleukoplakia, the model combines the predictions of the multiple
Table 1Average values and standard deviations (in parentheses) of blood oxygenation (StO2), vesscattering slope (b), Mie scattering amplitude (a1) and Rayleigh scattering amplitude (a2)
Parameter Normal mucosa (24) Non-dysplastic leukoplakia (15)
StO2 (%) 94 (7) 90 (9)Bvf (%) 3.6 (2.9) 2.1 (2.1)Dvessel (lm) 30 (18) 38 (25)cbc (lM) 1.6 (1.1) 1.0 (1.0)b (�) 0.8 (0.3) 1.2 (0.3)a1 (�) 1.2 (0.3) 1.1 (0.4)a2 (�) 0.01 (0.01) 0.01 (0.02)
Significance levels according to the Kruskal-Wallis test (three groups) and Wilcoxon rankindicated in parentheses.
spectra by generating a positive result (i.e. the lesion is classifiedas dysplastic) if at least one of the spectra measured on a leukpla-kia predicts the presence of dysplasia.
Results
Of the 27 leukoplakias included in this data set, 15 lesions werehistologically non-dysplastic (including hyperkeratosis, hyperpla-sia and lichen planus, often accompanied by inflammation) and12 lesions were histologically dysplastic (7 mild, 1 moderate, 2 se-vere dysplasias and 2 in situ carcinomas). Figure 2 shows typicalspectra (data points) and fits (solid lines) measured with the2 mm DPS fiber bundle probe on (a) normal oral mucosa and (b)leukoplakia. Upon fitting the spectra to Eq. (1), the 7 parameters(StO2, Bvf, Dvessel, cbc, b, a1 and a2) are extracted along with theirconfidence intervals.
Three to five measurements were performed on nearly the samelocation within each lesion. Between each of these measurementsthe probe was removed from the tissue and then replaced on thesame location with an estimated deviation of less than a few mil-limeters. This was done to check the reproducibility of the mea-surements and to take into account the intra-tumorheterogeneity that possibly already exists on a millimeter scale.A total of 76 spectra (45 non-dysplastic and 31 dysplastic) werecollected from the 27 leukoplakias. The optical parameters ex-tracted from all the spectra measured on the same location wereaveraged and these averaged values were used to optically charac-terize each location. Table 1 summarizes the average values andstandard deviations of the optical parameters for the normal, thenon-dysplastic leukoplakias and the dysplastic leukoplakias. Sig-nificant differences in the parameters are only observed for theMie scattering slope (b) and Mie scattering amplitude (a1); thesedifferences are due to differences in the scattering signatures ofnormal mucosa compared to leukoplakias. The blood volume frac-tion (Bvf) of non-dysplastic leukoplakias is borderline significantlysmaller than of normal oral mucosa (p = 0.08). No significant differ-ences are observed between non-dysplastic and dysplastic leuko-plakias for any of the measured parameters. Within that subsetof data, it is interesting to note that the microvascular oxygen sat-uration remains high for all measured locations, while the bloodvolume fraction of dysplastic lesions is borderline significantlyhigher than of non-dysplastic lesions (p = 0.08).
Figure 3 shows the result of the linear discriminant analysis(LDA). The LDA was performed on the microvascular properties(StO2, Bvf, Dvessel) only, based on the observed lack of statisticallysignificant differences in the scattering properties of non-dysplas-tic and dysplastic leukoplakias. Based on the combination of these3 parameters, non-dysplastic and dysplastic leukoplakias can bediscriminated with a sensitivity and specificity of 91% and 80%,respectively. The area under the receiver-operating characteristic(ROC) curve is 0.87, which is ‘‘good’’ but not excellent.
sel diameter (Dvessel), blood volume fraction (Bvf), betacarotene concentration (cbc),measured in normal oral mucosa, non-dysplastic and dysplastic leukoplakias.
Dysplastic leukoplakia (12) p-value (Krus.-Wal.) p-value (Wilcox.)
89 (13) 0.4 0.64.1 (3.1) 0.1 0.0823 (14) 0.3 0.21.3 (1.1) 0.3 0.61.1 (0.3) 0.001 0.60.9 (0.1) 0.01 0.60.01 (0.02) 0.3 0.4
-sum test (leukoplakias only) are also reported. The amount of sites in each group is

Figure 3 Receiver operating characteristic (ROC) curve for classification of non-dysplastic and dysplastic leukoplakias.
1168 A. Amelink et al. / Oral Oncology 47 (2011) 1165–1170
Discussion
In the present study 2 mm diameter fiber bundles were used tonon-invasively determine the microvascular and scattering proper-ties of non-dysplastic and dysplastic oral leukoplakias in vivo usingDPS. This study utilized novel fiber-optic bundles with effective fi-ber diameters of 2 mm to increase the optical interrogationdepth17 compared to our previous study, which utilized 1 mm fi-bers.16 This was necessary because leukoplakias are characterizedby the presence of (thick) keratin layers that are optically shieldingthe mucosa; as a result, in most leukoplakias, a 1 mm DPS probedoes not optically interrogate beyond this keratin layer, hampering
Figure 4 Schematic explanation for observed differences in measured Bvf, (a) for (i) normDPS, and (b) in normal oral mucosa using (i) 1 mm vs. (ii) 2 mm DPS. Normal tissue conlayer present in leukoplakias. Microvascular density (MVD) is assumed to be similar for
accurate characterization of their microvascular properties. A fiberbundle with effective diameters of 2 mm was used to increase theflexibility and reduce the fragility of the probe compared to a probethat would contain two 2 mm solid core glass rods.
We observed significant differences in the Mie scattering slope(b) and Mie scattering amplitude (a1) between normal mucosaand leukoplakias (p < 0.05 for both parameters). This is not surpris-ing since leukoplakias are also visually different from normal muco-sa; the white appearance of leukoplakias is caused by the presenceof a strongly scattering superficial keratin layer. Interestingly, theblood volume fraction (Bvf) of non-dysplastic leukoplakias isborderline significantly smaller than of normal oral mucosa(p = 0.08). This difference is probably related to the observed differ-ence in scattering properties, as explained schematically in Figure4a. Most likely the decrease in Bvf in non-dysplastic leukoplakiasis caused by the presence of a keratin layer in leukoplakias, whicheffectively increases the distance from the probe-tip to the micro-vasculature. As a result, the optically interrogated tissue volumehas on average a smaller Bvf for non-dysplastic leukoplakias thanfor normal mucosa, even though the mucosal microvascular density(MVD) may be the same for both groups. The borderline significantincrease in Bvf for dysplastic leukoplakias compared with non-dys-plastic leukoplakias could be attributed to an increase in MVD,assuming that the keratin layer thickness is on average the samein both groups. A similar explanation holds for the observed differ-ences in measured Bvf of normal oral mucosa in our previous studyusing 1 mm diameter fibers (1%)16 compared to the current studyusing 2 mm diameter fibers (3.6%). The 2 mm fiber bundles probeapproximately twice as deep as the 1 mm fibers,17 increasing theratio of mucosal/epithelial sampling volume and thereby increasingthe measured Bvf, even though the MVD has not changed (Figure4b). Note that the influence of the keratin layer on the in vivo spec-tral quantitation of Bvf could potentially be removed by removingthe keratin layer from a leukoplakia using aggressive chemicalsprior to the optical measurements. However, such chemicals cannotbe applied in humans. Furthermore, although these chemicals couldbe applied in a proof-of-concept animal study, because the tissue(and notably the microvasculature) will also react to the chemical
al oral mucosa and (ii) non-dysplastic and (iii) dysplastic leukoplakias using 2 mmsists of a bloodless epithelial layer on top of the mucosa, with an additional keratinnormal and non-dysplastic mucosa, and increased for dysplastic mucosa.

A. Amelink et al. / Oral Oncology 47 (2011) 1165–1170 1169
treatment, we believe that such an animal study would yield unrep-resentative microvascular properties.
Within the leukoplakia group, which is of diagnostic relevance,no significant differences are observed between non-dysplastic anddysplastic lesions for any of the measured parameters. Neverthe-less, as stated previously, a borderline significant difference inBvf of non-dysplastic and dysplastic leukoplakias was found(p = 0.08) which can be attributed to an increased MVD. Such atrend is in agreement with previously reported increases in MVDin dysplastic tissues compared to non-dysplastic tissues in the oralcavity,13,15 as well as with our recent findings of increased vascu-larity in dysplastic vs. non-dysplastic esophageal tissues.18 Similarto the results of our previous studies on the microvasculature ofbronchial mucosa25 and esophageal mucosa18 we did not find a de-crease in oxygen saturation of the microvascular blood of dysplas-tic tissues in the present study. Our results thus suggest that adecrease in the oxygen saturation of the microvascular blood oc-curs only in the more advanced stages of cancer, while increasedmicrovascularity seems to be an early indicator of the presenceof premalignant disease; an indicator that may be optically mea-sured in vivo.
LDA using the microvascular properties (StO2, Bvf, Dvessel)showed that non-dysplastic and dysplastic leukoplakias can be dis-criminated with a sensitivity and specificity of 91% and 80%,respectively. The area under the receiver-operating characteristic(ROC) curve is 0.87, which is ‘‘good’’ but not excellent. Althoughthis performance is certainly not sufficiently accurate for screeningpurposes, the LDA does suggest that non-dysplastic and dysplasticleukoplakias may be discriminated non-invasively through differ-ences in their microvascular properties.
The fact that in this study the Bvf of dysplastic leukoplakias, ex-tracted from the DPS spectra, were only borderline significantlylarger than of non-dysplastic leukoplakias, combined with the factthat the LDA discrimination performance was good but not excel-lent, is most likely caused by the complex architecture of leuko-plakias. A major complicating factor in the optical quantitation ofmicrovascular properties of leukoplakias is the presence of a vari-able thickness keratin layer. As stated previously, the white appear-ance of leukoplakias is due to the presence of a strongly scatteringsuperficial keratin layer; this layer ranges in thickness from severaltens to several hundreds of micrometers and, unfortunately, opti-cally shields the mucosal layer in which the microvascular changestake place as cancer starts to develop.11–15 Due to this specificmorphological challenge presented by the variable thickness(non-diagnostic and highly scattering) keratin layer in leukoplak-ias, the optimal interrogation depth will also vary strongly in theselesions. Other groups have previously demonstrated a similarinfluence of anatomical location on spectral quantitation of micro-vascular properties.20 The impact of leukoplakia plaque thicknessis very similar to (but probably much more pronounced than)the impact of anatomy on the optical assessment of microvascularproperties. We therefore believe that the main challenge in opti-cally assisted oral cancer screening is to develop an optical devicethat allows rapid quantitative assessment of microvascular proper-ties with real-time control over the optically interrogated tissuedepth, which is able to reproducibly quantitate the microvascularproperties in the presence of a variable thickness keratin layer thatoptically shields the mucosal layer.
In conclusion, we have characterized the microvascular andlight scattering properties of non-dysplastic and dysplastic oralleukoplakias, and found preliminary evidence that suggests thatthese lesions may be discriminated non-invasively through differ-ences in their microvascular properties; differences that can onlybe reproducibly quantified in leukoplakias using an optical devicefeaturing a controllable, variable interrogation depth. We are
currently developing such a device; future studies will utilize thisdevice to investigate the biological heterogeneity in keratin layerthickness as well as in microvascular properties of non-dysplasticand dysplastic leukoplakias, in order to evaluate the feasibility ofnon-invasive optical discrimination of non-dysplastic and dysplas-tic leukoplakias with high accuracy based on quantifiable differ-ences in their microvascular properties.
Conflict of interest statement
A. Amelink, J.L.N. Roodenburg and M.J.H. Witjes have no conflictof interest. H.J.C.M. Sterenborg is CEO of Luminostix, a start-upcompany that aims to commercialize DPS technology.
Acknowledgments
This research is supported by the Dutch Technology FoundationSTW, applied science division of NWO and the Technology Programof the Ministry of Economic Affairs.
References
1. Nair U, Bartsch H, Nair J. Alert for an epidemic of oral cancer due to use of thebetel quid substitutes gutkha and pan masala: a review of agents and causativemechanisms. Mutagenesis 2004;19:251–62.
2. IARC Scientific Publications: Cancer incidence in five continents, volumes I toIX. Lyon: International Agency for Research on Cancer. www-dep.iarc.fr/.
3. Balaram P, Sridhar H, Rajkumar T, Vaccarella S, Herrero R, Nandakumar A, et al.Oral cancer in southern India: the influence of smoking, drinking, paan-chewing and oral hygiene. Int J Cancer 2002;98:440–1.
4. Muwonge R, Ramadas K, Sankila R, Thara S, Thomas G, Vinoda J, et al. Role oftobacco smoking, chewing and alcohol drinking in the risk of oral cancer inTrivandrum, India: a nested case-control design using incident cancer cases.Oral Oncol 2008;44:446–54.
5. Mignogna MD, Fedele S, Lo Russo L. The world cancer report and the burden oforal cancer. Eur J Cancer Prev 2004;13:139–42.
6. Mashberg A. Diagnosis of early oral and oropharyngeal squamous carcinoma:obstacles and their amelioration. Oral Oncol 2000;36:253–5.
7. Petti S. Pooled estimate of world leukoplakia prevalence. a systematic review.Oral Oncol 2003;39:770–80.
8. Scheifele C, Reichart P. Is there a natural limit of the transformation rate of oralleukoplakia? Oral Oncol 2003;39:470–5.
9. Amelink A, Sterenborg HJCM. Measurement of the local optical properties ofturbid media by differential path-length spectroscopy. Appl Opt2004;43:3048–54.
10. Amelink A, Sterenborg HJCM, Bard MPL, Burgers SA. In vivo measurement of thelocal optical properties of tissue by use of differential path-length spectroscopy.Opt Lett 2004;29:1087–9.
11. Choi KS, Bae MK, Jeong JW, Moon HE, Kim KW. Hypoxia-induced angiogenesisduring carcinogenesis. J Biochem Mol Biol 2003;36:120–7.
12. Shibuya K, Hoshino H, Chiyo M, Yasufuku K, Lizasa T, Saitoh Y, et al.Subepithelial vascular patterns in bronchial dysplasias using a highmagnification bronchovideoscope. Thorax 2002;57:902–7.
13. Pazouki S, Chisholm DM, Carmichael AG, Farquharson M, Ogden GR, Schor SL,et al. The association between tumor progression and vascularity in the oralmucosa. J Pathol 1997;183:39–43.
14. Roy H, Gomes A, Turzhitsky V, Goldberg MJ, Rogers J, Ruderman S, et al.Spectroscopic microvascular blood detection from the endoscopically normalcolonic mucosa: biomarker for neoplasia risk. Gastroenterology2008;135:1069–78.
15. Gandolfo M, Keszler A, Lanfranchi H, Itoiz ME. Increased subepithelialvascularization and VEGF expression reveal potentially malignant changes inhuman oral mucosa lesions. Oral Surg Oral Med Oral Pathol Oral Radiol Endod2011;111:486–93.
16. Amelink A, Kaspers OP, Sterenborg HJCM, Van der Wal JE, Roodenburg JLN,Witjes MJH. Non-invasive measurement of the morphology and physiology oforal mucosa by use of optical spectroscopy. Oral Oncol 2008;44:65–71.
17. Kaspers OP, Sterenborg HJCM, Amelink A. Controlling the optical path length inturbid media using differential path-length spectroscopy: fiber diameterdependence. Appl Opt 2008;47:365–71.
18. Amelink A, Haringsma J, Sterenborg HJCM. Noninvasive measurement of theoxygen saturation of the microvascular blood in Barrett’s dysplasia by use ofoptical spectroscopy. Gastrointest Endosc 2009;70:1–6.
19. Mourant JR, Fuselier T, Boyer J, Johnson TM, Bigio IJ. Prediction andmeasurements of scattering and absorption over broad wavelength ranges intissue phantoms. Appl Opt 1997;36:949–57.
20. McGee S, Mirkovic J, Mardirossian V, Elackattu A, Yu C-C, Kabani S, et al. JBiomed Opt 2008;13:064034.

1170 A. Amelink et al. / Oral Oncology 47 (2011) 1165–1170
21. Van de Poll S. Raman spectroscopy of atherosclerosis. 2003 PhD thesisUniversity of Leiden p.123 ISBN 90-9016109-0.
22. Van Veen RLP, Verkruysse W, Sterenborg HJCM. Diffuse-reflectancespectroscopy from 500 to 1060 nm by correction for inhomogeneouslydistributed absorbers. Opt Lett 2002;27:246–8.
23. Amelink A, Christiaanse T, Sterenborg HJCM. Effect of haemoglobin extinctionspectra on optical spectroscopic measurements of blood oxygen saturation. OptLett 2009;34:1525–7.
24. Amelink A, Robinson DJ, Sterenborg HJCM. Confidence intervals on fitparameters derived from optical reflectance spectroscopy measurements. JBiomed Opt 2008;13:054044.
25. Bard MPL, Amelink A, Noordhoek Hegt V, Graveland WJ, Sterenborg HJCM,Hoogsteden HC, et al. Measurement of hypoxia-related parameters in bronchialmucosa by use of optical spectroscopy. Am J Respir Crit Care Med2005;171:1178–84.