non-fluoroscopic localization of an amagnetic stimulation catheter by multichannel...
TRANSCRIPT
Nonfluoroscopic Localization of an AmagneticStimulation Catheter by MultichannelMagnetocardiography
RICCARDO FENICI,* JUKKA NENONEN,t§ KATJA PESOLA,+§PETRI KORHONEN,+§ JYRKI LOTJONEN,t§ MARKKU MAKIJARVI,*§
LAURI TOIVONEN,+§ VELI-PEKKA POUTANEN.II PEKKA KETO,11 andTOIVO KATILAt§
From the "Clinical Physiology-Biomagnetism Research Center, Catholic University, Rome, I tal^the tLaboratory of Biomedical Engineering, Helsinki University of Technology, the ^Departmentof Medicine, Division of Cardiology, the §Medical Engineering Centre, BioMag Laboratory, and theDepartment of Radiology, Helsinki University Central Hospital, Finland.
FENICI, R., ET AL.: Nonfluoroscopic Localization of an Amagnetic Stimulation Catheter by MultichannelMagnetocardiography. This study was performed to: (1) evaluate the accuracy of noninvasive magneto-cardiographic (MCC) localization of an amagnetic stimulation catheter; (2) validate the feasibility of thismultipurpose catheter; and (3) study the characteristics of cardiac evoked fields. A stimulation catheterspecially designed to produce no magnetic disturbances was inserted into the heart of five patients afterroutine electrophysiological studies. The catheter position was documented on biplane cine x-ray images.MCG signals were then recorded in a magnetically shielded room during cardiac pacing. Noninvasive lo-calization ofthe catheter's tip and stimulated depolarization was computed from measured MCG data us-ing a moving equivalent current-dipole source in patient-specific boundary element torso models. In allfive patients, the MCG localizations were anatomically in good agreement with the catheter positions de-fined from the x-ray images. The mean distance between the position of the tip of the catheter defined fromx-rav fluoroscopy and the MCG localization was 11 ± 4 mm. The mean three-dimensional difference be-tween the MCC localization at the peak stimulus and the MCC localization, during the ventricular evokedresponse about 3 ms later, was 4 ± 1 mm calculated from signal-averaged data. The 95% confidence in-terval of heat-to-beat localization of the tip of the stimulation catheter from ten consecutive beats in thepatients was 4 ± 2 mm. The propagation velocity ofthe equivalent current dipole between 5 and 10 msafter the peak stimulus was 0.9 ± 0.2 m/s. The results show that the use of the amagnetic catheter is tech-nically feasible and reliable in clinical studies. The accurate three-dimensional localization of this multi-purpose catheter by multichannel MCG suggests that the method could be developed toward a useful clin-ical tool during electrophysiological studies. (PACE 1999; 22:1210-1220)
magnetocardiography, amagnetic pacing catheter, cardiac evoked field, noninvasive localization,boundary element modeling, equivalent current dipole
This work was supported by the EU HCM Large Scale Installa-tion in Biomagnetic Research (BIRCH) at Helsinki University ofTechnology, and by the Italian National Research Council(CNR).
Address for reprints; Jukka Nenonen. Dr, Tech.. Helsinki Uni-versity of Technology. Laboratory of Biomedical Engineering,P.O. Box 2200, 02015 HUT, Finknd. Fax: +35a-9-4513182.
Received January 5, 1998; revised July 28, 1998; accepted Oc-tober 14,1998.
Introduction
The success of catheter ablation of cardiac ar-rhythmias is totally depending on the accuracy oftarget tissue localization, which sometimes he-comes difficult during the intervention. Catheterablation may require prolonged exposure to radia-tion both for the patient and the operator. Bodysurface potential mapping and other noninvasiveimaging techniques have been used to attempt apre- and intra-operative localization of the proper
1210 August 1999 PACE, Vol. 22
MCG LOCALIZATION OF AN AMAGNETIC STIMULATK3N CATHETER
ablation site.^ ^ However, the preoperative infor-mation has in most cases been limited to a quali-tative estimate.
Magnetocardiographic [MCG) mapping isa totally noninvasive method that provides quan-titative three-dimensional location and imagingof cardiac activation.^"^^ Successful results havebeen reported, e.g., in locating abnormal ventric-ular preexcitation sites associated with theWolff-Parkinson-White syndrome,^^"^^ focalatrial and ventricular tachycardias and ventricu-lar extrasystolic heats,^^"^° and the site of a pac-ing catheter.^"'^^
A pacemapping method based on MCGrecordings was developed at the Catholic Univer-sity of Rome.^^ Tests performed with a single-channel magnetometer in an unshielded bio-magnetic catheterization lahoratory reported lo-calization accuracy ranging from 5 to 25 mm.^"The MCG pacemapping was used to locate the tipof the amagnetic pacing catheter without fluo-roscopy and to fit the catheter position with thethree-dimensional MCC coordinates of the ar-rhythmogenie target for interventional mappingrefinement.
In the present study, multichannel MCC wasapplied to evaluate the accuracy of noninvasivelocalization of the tip of an amagnotic catheter.^^MCG recordings were performed in five patientsduring cardiac pacing in the magneticallyshielded room of the BioMag Laboratory^* atHelsinki University Central Hospital (HUCH). Thetip of the stimulating catheter serves as a well-de-fined current dipole, providing an excellent testcurrent source for validation of the MCG localiza-tion method. In addition, the catheter allows de-
tailed studies of cardiac evoked fields (CEF),which arise due to myoeardial response evoked bythe catheter stimulation. MCG localization wasperformed using an equivalent current-dipole(ECD) source in patient-specific boundary-ele-ment thorax geometry.^"-^^ Besides locating thecatheter's tip at the peak stimulus and the evokedresponse due to the stimulus, further validation ofthe MCG localization method was obtained by es-timating the activation regions at the beginning ofthe spontaneous atrial and ventricular excitation.Magnetic resonance images [MRIs] of the heartwere used to present the MCG localization resultsof both evoked and spontaneous depolarizationwith the cardiac anatomy.
Methods
Patient Studies
Two male and three female patients underwentstandard electrophysiologicai studies in the Cardio-vascular Laboratory of HUCH. Two of the patientswere suffering from coronary artery disease, whilethe others did not have any heart disease. The de-mographic and clinical data of the patients are sum-marized in Table 1. After the electrophysiologicaistudies, multichannel MCG recordings were per-formed in the BioMag Laboratory of HUCH. All pa-tients were investigated in the postabsorptive drug-free state, after informed consent.
Biplane Fluoroscopy and Stimulations with theAmagnetic Catheter
The catheter applied in our study is patentedby the Italian National Research Council.^^ It fea-
Patient
P1P2P3P4P5
Age
5462494264
Sex
FemaleFemaleFemale
MaleMale
Stimulation
RVRVRVRVCS
Table 1.
Patient Information
Arrhythmia Diagnosis
SyncopeVF
SVTSVT
Sustained VT
Heart Disease
NoneCADNoneNoneCAD
EPS
NormalSustained VT
APNonsustained VTPolymorphic VT
AP = accessory pathway; CAD = coronary artery disease; CS = coronary sinus; EPS = electrophysiologicai study; RV = rightventricle; SVT = supraventricular tachycardia; VF = ventricular fibrillation; VT = ventricular tachycardia.
PACE. Vol. 22 August 1999 1211
FENICI. ET AL.
tures nonpolarizable amagnetic electrodes [bipo-lar interelectrode distance 5 mm), arranged to pro-duce no magnetic disturbance during MCG map-ping. The catheter can simultaneously provide anaccurately defined current dipole source, pace themyocardium, as well as record monophasic actionpotentials.
After the diagnostic electrophysiologicalstudies was completed, the amagnetic catheterwas inserted into the heart. The position of thecatheter tip was documented in two orthogonalfluoroscopic projections (anterior-posterior andlateral), together with a coordinate systemmarked by small lead balls. The cinefilms weretaken over the whole breathing cycle, includingfour to five cardiac cycles. In order to estimatethe error caused by heart movement due tobreathing and cardiac contraction, all differentcatheter tip locations were marked on the images.The MCG locations were then compared to thecatheter tip positions in mid-inspiration dur-ing end diastole. The parallax error of fluo-roscopy was corrected in all comparisons (see theAppendix).
The patient was then transferred to theBioMag Laboratory, where the tip ofthe stimulat-ing catheter was localized by MCG mapping. Infour patients, the catheter was placed in the apexof the right ventricle and bipolar pacing was per-formed. Stimulus amplitudes of 0.2, 2, and 10 mAwith distal cathode were used in patients Pi andP2, while a stimulus amplitude of 10 mA with dis-tal anode was applied in patients P3 and P4. In pa-tient P5, the catheter was placed in the proximalcoronary sinus, and bipolar pacing with distal an-ode was performed with 2-, 10-, and 20-mA stim-ulus amplitudes.
with a diameter of 30 cm. Here, B^ is the mag-netic-field component perpendicular to the sen-sor array surface; the otber two components B^and By are tangential to the surface. The sensorsare immersed in liquid helium inside a cylindri-cal dewar. The dewar is supported by a gantrysystem that is easy to move by air cushion and al-lows vertical adjustment and tilting by 20"" in anydirection.
Before MCG recordings, thorax coordinateframe was defined by digitizing a set of referencepoints on the chest with a magnetic three-dimen-sional digitization system (3SPACE'r' \ PolhemusInc., Colchester, VT, USA). Nine ofthe digitizedpoints were marked for later use as referencepoints in MRI (see the next section). Also, the leadballs used to define the x-ray fluoroscopy coordi-nate frame were digitized.
In our study, the cardiomagnetometer wasplaced so that the centerpoint of the sensor arraywas approximately above the right ventricle. Thedewar position was first defined in respect to thedigitized points by applying three transmittercoils. " MCG recordings were next performed for 5minutes without pacing; all patients were in nor-mal sinus rhythm. Finally, the pacing was per-formed during MCG recording using differentstimulus amplitudes.
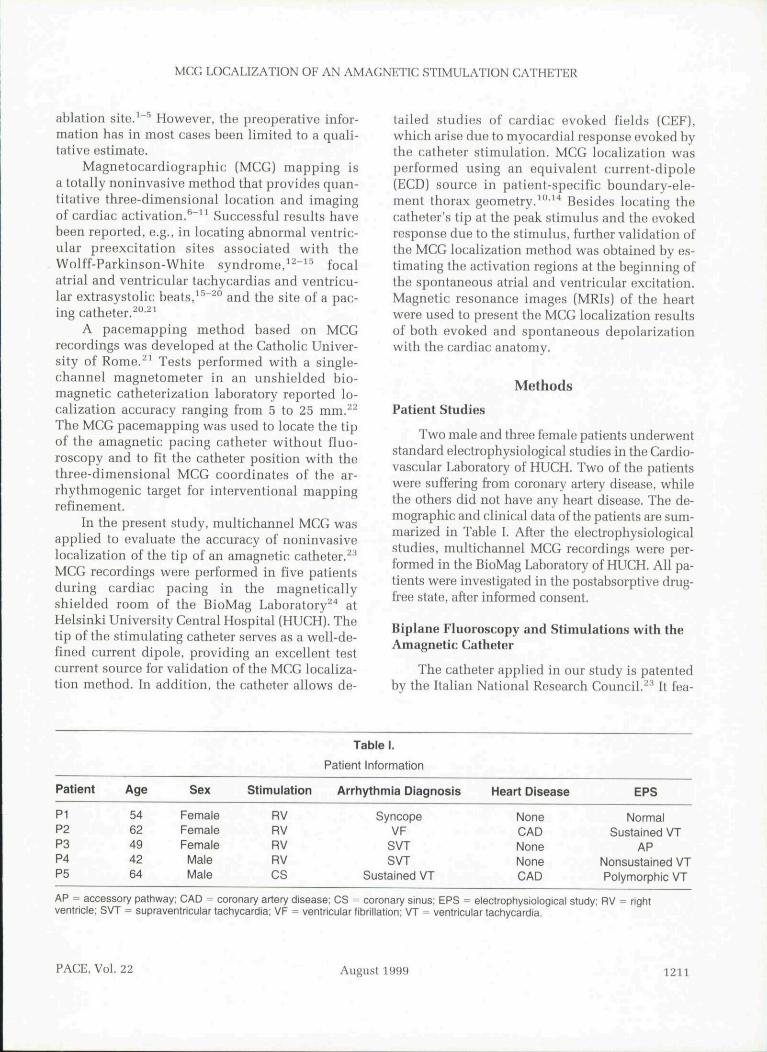
All recordings were band-pass filtered to0.03-500 Hz and digitized with the sampling rateof 2,000 Hz. A sophisticated X-windows-basedsoftware was used in acquiring the data and inmonitoring the quality of the signals. Isocontourdisplays of the spatial distribution of B^ were ex-trapolated from the measured signals^* in order toconfirm that the sensor array was correctly placedabove the heart (Fig. 1).
MCG Measurements
MCG studies were performed in the magneti-cally shielded room (Euroshield Ltd.. Eura, Fin-land) of the BioMag Laboratory of HUCH. A 67-channel cardiomagnetometer (Neuromag Ltd.,Helsinki, Finland) was used in the recordings.^'*The cardiomagnetometer has seven co-axial(baseline 80 mm; cJB /riz) and 60 planar (baseline16.2 mm, BBJdx and ^B^/ay) dc-SQUID (Super-conducting QUantum Interference Device) gra-diometers, arranged on a slightly curved surface
Magnetic Resonance Imaging
MRI was performed in a separate session. MRIdata were collected using a functional 1.5 tesla su-perconducting magnet device (Magnetom Vision,Siemens AG, Erlangen, Germany) at the Depart-ment of Radiology of HUCH. A set of 10-mm thicktransaxial slices were acquired from tbe waist tothe neck during early systole. In addition, 8- or 10-mm slices were collected transaxially or in the di-rection of the short axis of the heart to extract theendo- and epicardial surfaces more accurately.
1212 August 1999 PACE, Vol. 22
MCG LOCALIZATION OF AN AMACNETIC STIMULATION CATHETER
a ) •....
10 pT| 100 ms
Figure 1. Isocontour presentotion ofthe magnetic-field component B^ perpendicular to thesurface ofthe sensors in patient Pi. Isocontours were extrapolated from measured MCG signalswith minimum-norm estimation.^'' (Aj At the peak of 10 mA stimulus. (B) at +3 ms. and (Cj at+15 ms during the evoked response. Time instants are marked with the ticks above the temporalMCG signal recorded by the central axial channel. The steps between the contours are (A) 5 pT,(B) 1 pT. and (C) 0.5 pT (1 pT ^ 10~^^ tesla}. Positive values (solid lines) indicate magnetic fluxtowards the chest, while negative values (dashed lines) denote flux out of the chest. Sensorpositions are outlined: the circles denote to axial gradiometers, while the squares show the planargradiometer positions.
Cross-shaped markers filled with MgCl solutionwere applied in the marker positions defined dur-ing the MCG recordings in order to match the MRIand MCG coordinate frames.^*
In our study, the MRI data were used for ac-curate representation of the individual geometryof the thorax and the heart for boundary elementcomputations. They also allow accurate registra-tion of MCG localization results with respect tothe anatomy ofthe patient's heart."'' The MCG andMRI data were transferred from the BioMag Labo-ratory to the Laboratory of Biomedical Engineer-ing at Helsinki University of Technology using adirect asynchronous transfer mode (ATM) con-nection.
Boundary Element Calculations and EquivalentCurrent Dipole
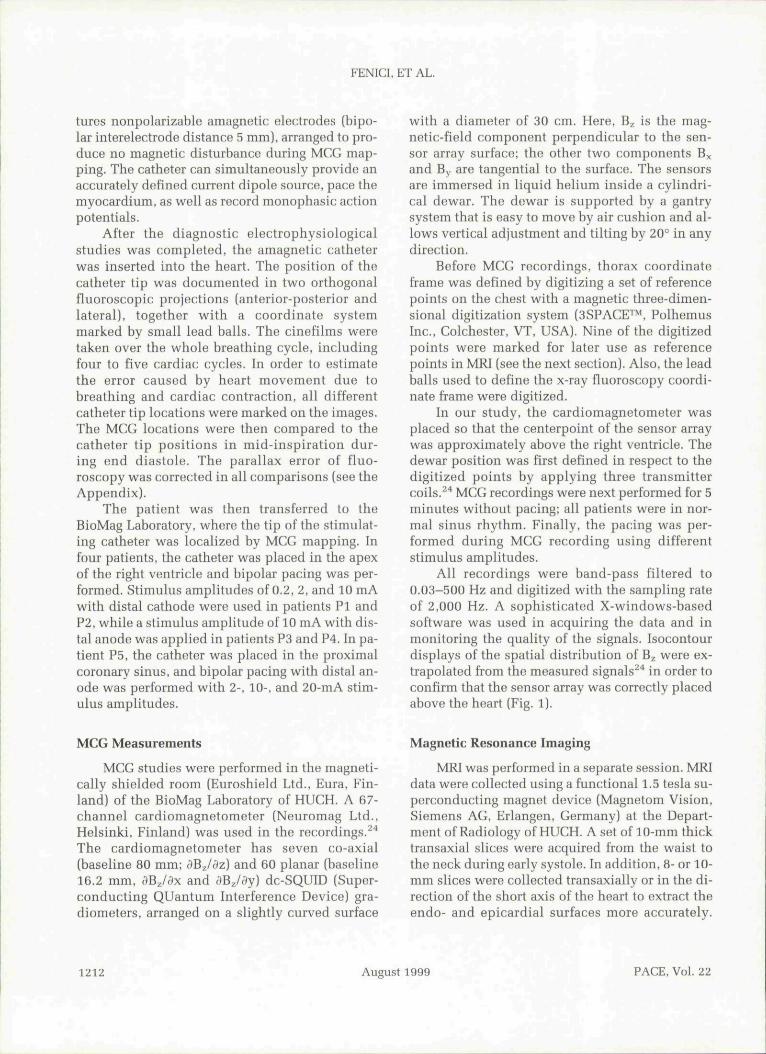
Three-dimensional MCG localization resultswere obtained by applying a moving ECD sourcein a patient-specific torso model."'•^'^ Figure 2 de-picts the torso model together with MCG localiza-tion results in patient Pi. The dipole position(x.y.z) and dipole moments (p^. py pJ were esti-mated with nonlinear least squares fitting. ' Ho-mogeneous torso models were used, and inversecomputations were performed both from raw and
Figure 2. Frontal view of the boundary element torsomodel of patient Pi. The outer thorax boundary isrepresented by 672 plane triangles, while thepericardial surface was divided into 182 triangles. Opencircles refer to the MCG localization results in sinusrhythm: (1) during initial 20 ms of atrial activation, (2)during initiai 20 ms of ventricular depolarization, andduring pacing and (3) at the stimulus peak and duringthe response 3 ms later. Outlines of measurementsensors are also depicted.
PACE, Vol. Z2 August 1999 1213
FENICI, ET AL.
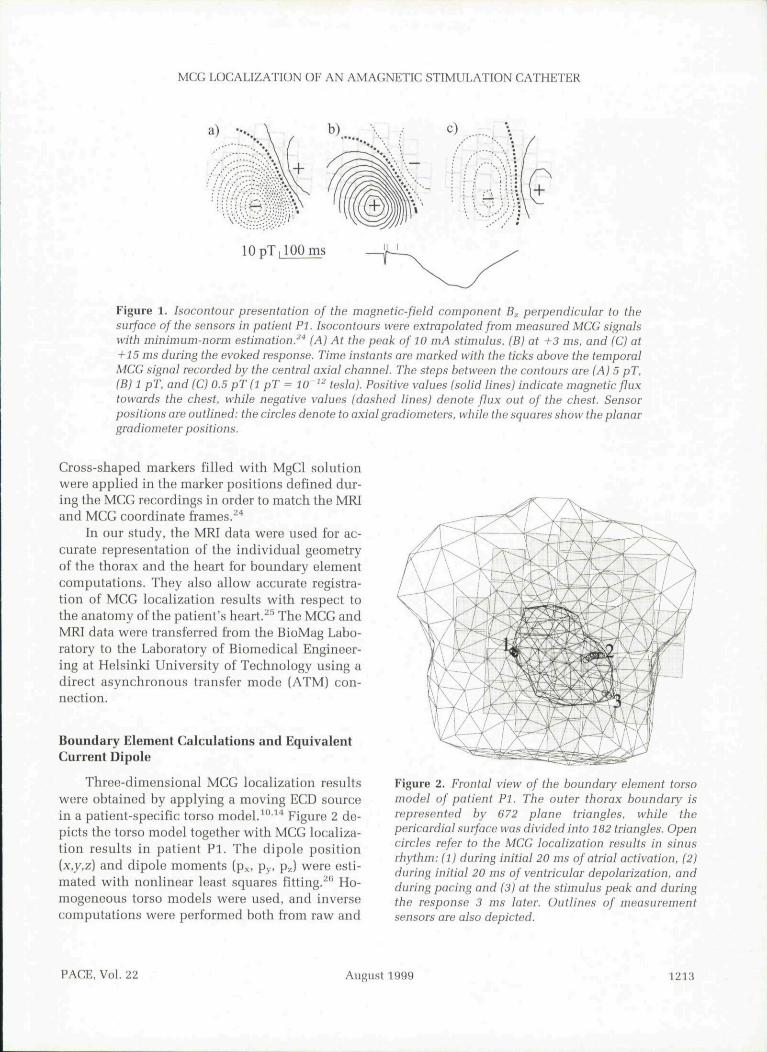
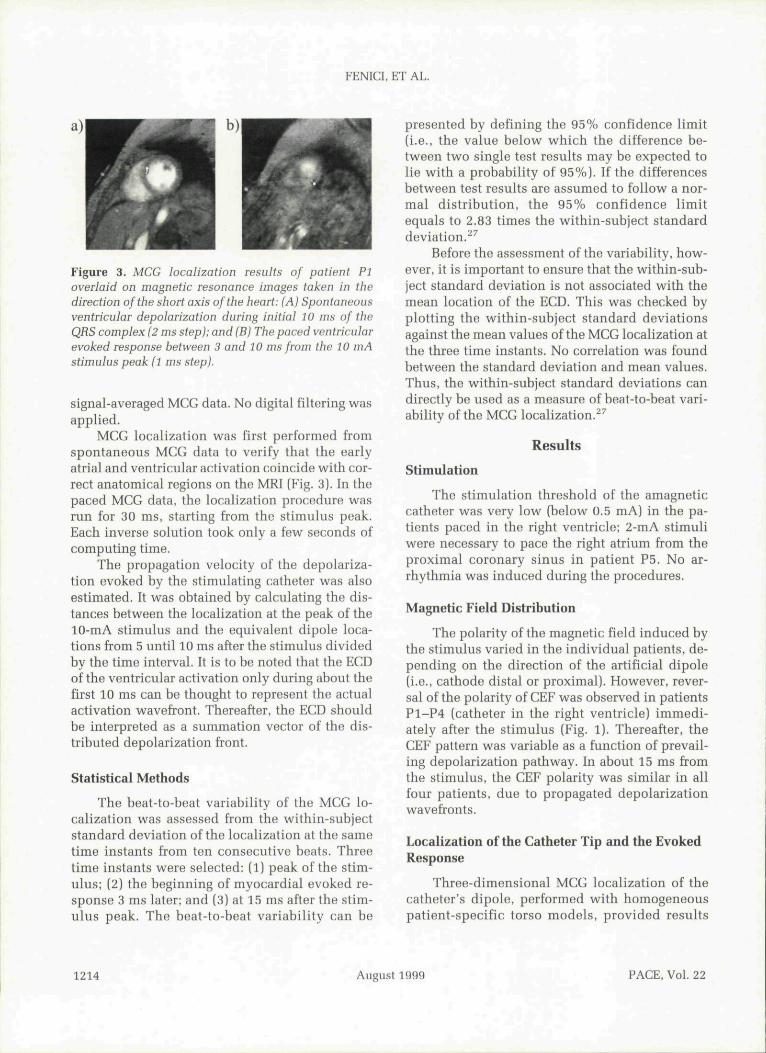
Figure 3. MCG localization results of patient PIoverlaid on magnetic resonance images taken in thedirection ofthe short axis ofthe heart: (A) Spontaneousventricular depolarization during initial 10 ms of theQRS complex (2 ms step); and (B) The paced ventricularevoked response between 3 and 10 ms from the 10 mAstimulus peak (1 ms step).
signal-averaged MCG data. No digital filtering wasapplied.
MCG localization was first performed fromspontaneous MCG data to verify that the earlyatrial and ventricular activation coincide with cor-rect anatomical regions on the MRI (Fig. 3). In thepaced MGG data, the localization procedure wasrun for 30 ms, starting from the stimulus peak.Each inverse solution took only a few seconds ofcomputing time.
The propagation velocity of the depolariza-tion evoked by the stimulating catheter was alsoestimated. It was obtained by calculating the dis-tances between the localization at the peak ofthe10-mA stimulus and the equivalent dipole loca-tions from 5 until 10 ms after the stimulus dividedby the time interval. It is to be noted that the ECDofthe ventricular activation only during about thefirst 10 ms can be thought to represent the actualactivation wavefront. Thereafter, the ECD shouldbe interpreted as a summation vector of the dis-tributed depolarization front.
Statistical Methods
The beat-to-beat variability of the MCG lo-calization was assessed from the within-subjectstandard deviation ofthe localization at the sametime instants from ten consecutive heats. Threetime instants were selected: (1) peak ofthe stim-ulus; (2) the beginning of myocardial evoked re-sponse 3 ms later; and (3) at 15 ms after the stim-ulus peak. The beat-to-beat variability can be
presented by defining the 95% confidence limit(i.e., the value below which the difference be-tween two single test results may be expected tolie with a probability of 95%). If the differencesbetween test results are assumed to follow a nor-mal distribution, the 95% confidence limitequals to 2.83 times the within-subject standarddeviation.^^
Before the assessment ofthe variability, how-ever, it is important to ensure that the within-sub-ject standard deviation is not associated with themean location of the ECD. This was checked byplotting the within-subject standard deviationsagainst the mean values ofthe MCG localization atthe three time instants. No correlation was foundbetween the standard deviation and mean values.Thus, the within-subject standard deviations candirectly be used as a measure of beat-to-beat vari-ability ofthe MCG localization.^^
Results
Stimulation
The stimulation threshold of the amagneticcatheter was very low (below 0.5 mA) in the pa-tients paced in the right ventricle; 2-mA stimuliwere necessary to pace the right atrium from theproximal coronary sinus in patient P5. No ar-rhythmia was induced during the procedures.
Magnetic Field Distribution
The polarity of the magnetic field induced bytbe stimulus varied in the individual patients, de-pending on the direction of the artificial dipole(i.e., cathode distal or proximal). However, rever-sal of the polarity of CEF was observed in patientsP1-P4 (catheter in the right ventricle) immedi-ately after the stimulus (Fig. 1). Thereafter, theCEF pattern was variable as a function of prevail-ing depolarization pathway. In about 15 ms fromthe stimulus, the CEF polarity was similar in allfour patients, due to propagated depolarizationwavefronts.
Localization ofthe Catheter Tip and the EvokedResponse
Three-dimensional MCG localization of thecatheter's dipole, performed with homogeneouspatient-specific torso models, provided results
1214 August 1999 PACE, Vol. 22
MCG LOCALIZATION OF AN AMAGNETIC STIMULATION CATHETER
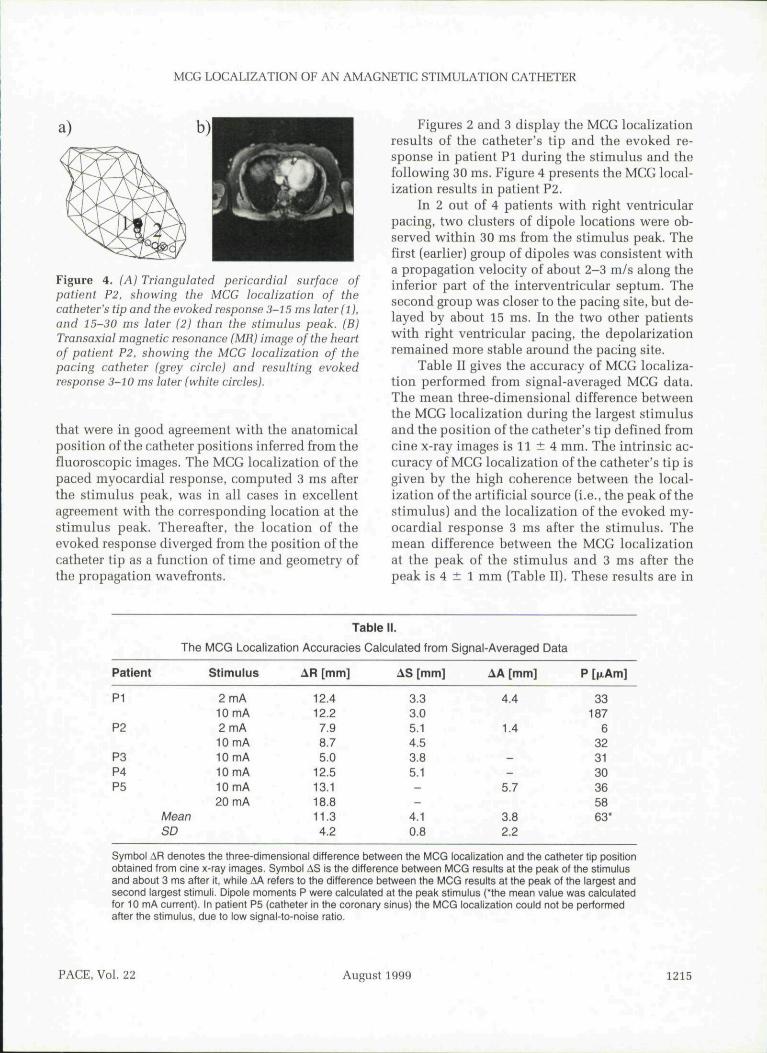
Figure 4. (A) Triangulated pericardial surface ofpatient P2. showing the MCG localization of thecatheter's tip and the evoked response 3-15 ms later (1),and 15-30 ms later (2) than the stimulus peak. (B)Transaxial magnetic resonance (MR) image ofthe heartof patient P2. showing the MCG localization of thepacing catheter (grey circle) and resulting evokedresponse 3-10 ms later (white circles).
that were in good agreement with the anatomicalposition ofthe catheter positions inferred from thefluoroscopic images. The MCG localization ofthepaced myocardial response, computed 3 ms afterthe stimulus peak, was in all cases in excellentagreement with the corresponding location at thestimulus peak. Thereafter, the location of theevoked response diverged from the position ofthecatheter tip as a function of time and geometry ofthe propagation wavefronts.
Figures 2 and 3 display the MGG localizationresults of the catheter's tip and the evoked re-sponse in patient Pi during the stimulus and thefollowing 30 ms. Figure 4 presents the MCG local-ization results in patient P2.
In 2 out of 4 patients with right ventricularpacing, two clusters of dipole locations were ob-served within 30 ms from the stimulus peak. Thefirst (earlier) group of dipoles was consistent witha propagation velocity of about 2-3 m/s along theinferior part of the interventricular septum. Thesecond group was closer to the pacing site, but de-layed by about 15 ms. In the two other patientswith right ventricular pacing, the depolarizationremained more stable around the pacing site.
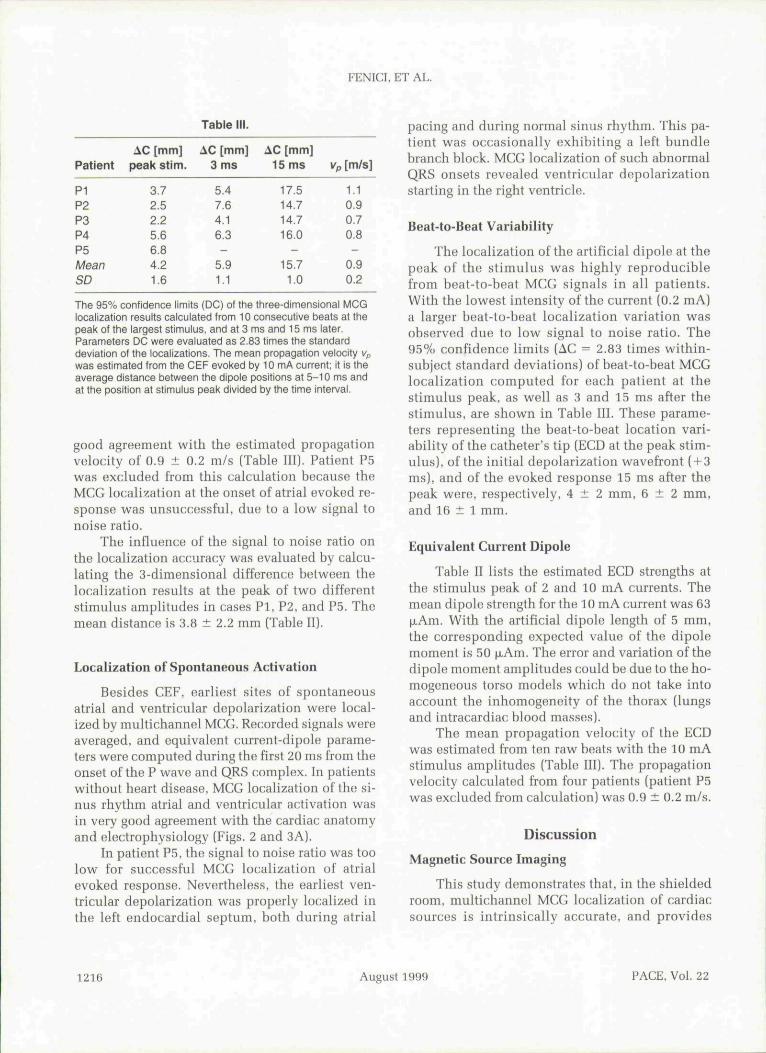
Table II gives the accuracy of MCG localiza-tion performed from signal-averaged MCG data.The mean three-dimensional difference betweenthe MCG localization during the largest stimulusand the position of the catheter's tip defined fromcine x-ray images is 11 ± 4 mm. The intrinsic ac-curacy of MCG localization ofthe catheter's tip isgiven by the high coherence between the local-ization ofthe artificial source (i.e., the peak ofthestimulus) and the localization of the evoked my-ocardial response 3 ms after the stimulus. Themean difference between the MCG localizationat the peak of the stimulus and 3 ms after thepeak is 4 ± 1 mm (Table II). These results are in
Patient
P1
P2
P3P4P5
The MCG Localization
Stimulus
2 mA10 mA2 mA10 mA10 mA10 mA10 mA20 mA
MeanSD
Tabie II.
Accuracies Calculated from
AR [mm]
12.412.27.98.75.0
12.513.118.811.34.2
AS [mm]
3.33.05.14.53.85.1——
4.10.8
Signal-Averaged Data
AA [mm]
4.4
1.4
--
5.7
3.82.2
P [txAm]
33187
6323130365863*
Symbol AR denotes the three-dimensional difference between the MCG localization and the catheter tip positionobtained from cine x-ray images. Symbol AS is the difference between MCG results at the peak of the stimulusand about 3 ms after it, while AA refers to the difference between the MCG results at the peak of the largest andsecond largest stimuli. Dipole moments P were calculated at the peak stimulus ('the mean value was calculatedfor 10 mA current). In patient P5 (catheter in the coronary sinus) the MCG localization could not be performedafter the stimulus, due to low signal-to-noise ratio.
PACE, Vol. 22 August 1999 1215
FENICI, ET AL.
Table
Patient
PIP2P3P4P5MeanSD
AC [mm]peak stim.
3.72.52.25.66.84.21.6
AC [mm]3 ms
5.47.64.16.3-
5.91.1
AC [mm]15 ms
17.514.714.716.0
15.71.0
Vp [m/s]
1.10.90.70.8-
0.90.2
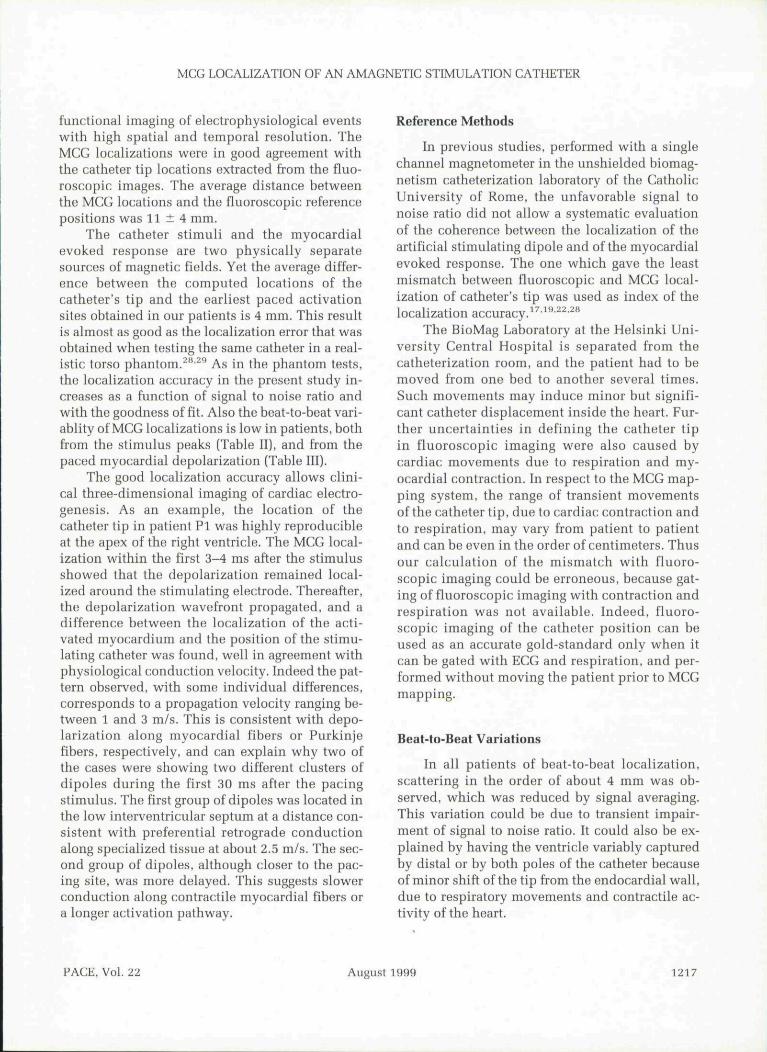
The 95% confidence limits (DC) of the three-dimensional MCGlocalization results calculated from 10 consecutive beats at thepeak of the largest stimulus, and at 3 ms and 15 ms later.Parameters DC were evaluated as 2.83 times the standarddeviation of the localizations. The mean propagation velocity Vpwas estimated from the CEF evoked by 10 mA current; it is theaverage distance between the dipole positions at 5-10 ms andat the position at stimulus peak divided by the time inten/al.
good agreement with the estimated propagationvelocity of 0.9 ± 0.2 m/s (Table III). Patient P5was excluded from this calculation because theMCG localization at the onset of atrial evoked re-sponse was unsuccessful, due to a low signal tonoise ratio.
The influence of the signal to noise ratio onthe localization accuracy was evaluated by calcu-lating the 3-dimensional difference between thelocalization results at the peak of two differentstimulus amplitudes in cases Pi, P2, and P5. Themean distance is 3.8 ± 2.2 mm (Table II).
Localization of Spontaneous Activation
Besides CEF, earliest sites of spontaneousatrial and ventricular depolarization were local-ized by multichannel MCG. Recorded signals woreaveraged, and equivalent current-dipole parame-ters were computed during the first 20 ms from theonset of tho P wave and QRS complex. In patientswithout heart disease, MCG localization ofthe si-nus rhythm atrial and ventricular activation wasin very good agreement with the cardiac anatomyand electrophysiology (Figs. 2 and 3A).
In patient P5, the signal to noise ratio was toolow for successful MCG localization of atrialevoked response. Nevertheless, the earliest ven-tricular depolarization was properly localized inthe left endocardial septum, both during atrial
pacing and during normal sinus rhythm. This pa-tient was occasionally exhibiting a left bundlebranch block. MCG localization of such abnormalQRS onsets revealed ventricular depolarizationstarting in the right ventricle.
Beat-to-Beat Variability
The localization ofthe artificial dipole at thepeak of the stimulus was highly reproduciblefrom beat-to-beat MCG signals in all patients.With the lowest intensity of the current (0.2 mA)a larger beat-to-beat localization variation wasobserved duo to low signal to noise ratio. The95% confidence limits (AC = 2.83 times within-subject standard deviations) of beat-to-beat MCGlocalization computed for each patient at thestimulus peak, as well as 3 and 15 ms aftor thestimulus, are shown in Table III. These parame-ters representing the beat-to-beat location vari-ability of the catheter's tip (ECD at the peak stim-ulus), ofthe initial depolarization wavefront (-1-3ms). and ofthe evoked response 15 ms after thepeak were, respectively, 4 ± 2 mm, 6 ± 2 mm,and 16 ± 1 mm.
Equivalent Current Dipole
Table II lists the estimated ECD strengths atthe stimulus peak of 2 and 10 mA currents. Themean dipole strength for the 10 mA current was 63jjiAm. With tbe artificial dipole length of 5 mm.the corresponding expected value of the dipolomoment is 50 |j.Am. The error and variation ofthedipole moment amplitudes could bo due to the ho-mogeneous torso models which do not take intoaccount the inhomogonoity of the thorax (lungsand intracardiac hlood masses).
The mean propagation velocity of the ECDwas estimated from ten raw boats with the 10 mAstimulus amplitudes (Table III). The propagationvelocity calculated from four patients (patient P5was excluded from calculation) was 0.9 ± 0.2 m/s.
Discussion
Magnetic Source Imaging
This study demonstrates that, in the shieldedroom, multichannel MGG localization of cardiacsources is intrinsically accurate, and provides
1216 August 1999 PACE, Vol. 22
MCG LOCALIZATION OF AN AMAGNETIC STIMULATION CATHETER
functional imaging of electrophysiologicai eventswith high spatial and temporal resolution. TheMCG localizations were in good agreement withthe catheter tip locations extracted from the fluo-roscopic images. The average distance betweenthe MCG locations and the fluoroscopic referencepositions was 11 ± 4 mm.
The catheter stimuli and the myoeardialevoked response are two physically separatesources of magnetic fields. Yet the average differ-ence hetween the computed locations of thecatheter's tip and the earliest paced activationsites ohtained in our patients is 4 mm. This resultis almost as good as the localization error that wasobtained when testing the same catheter in a real-istic torso phantom.^"• ' As in the phantom tests,the localization accuracy in the present study in-creases as a function of signal to noise ratio andwith the goodness of fit. Also the heat-to-beat vari-ablity of MCG localizations is low in patients, bothfrom the stimulus peaks (Table II), and from thepaced myoeardial depolarization [Tahle III).
The good localization accuracy allows clini-cal three-dimensional imaging of cardiac electro-genesis. As an example, the location of thecatheter tip in patieut PI was highly reproducibleat the apex of the right ventricle. The MCG local-ization within the first 3-4 ms after the stimulusshowed that the depolarization remained local-ized arouud the stimulating electrode. Thereafter,the depolarization wavefront propagated, and adifference between the localization of the acti-vated myocardium and the position of the stimu-lating catheter was found, well in agreement withphysiological conduction velocity. Indeed the pat-tern observed, with some individual differences,corresponds to a propagation velocity ranging be-tween 1 and 3 m/s. This is consistent with depo-larization along myocardial fibers or Purkinjefibers, respectively, and can explain why two ofthe cases were showing two different clusters ofdipoles during the first 30 ms after the pacingstimulus. The first group of dipoles was located inthe low interventricular septum at a distance con-sistent with preferential retrograde conductionalong specialized tissue at about 2,5 m/s. The sec-ond group of dipoles, although closer to the pac-ing site, was more delayed. This suggests slowerconduction along contractile myocardial fibers ora longer activation pathway.
Reference Methods
Iu previous studies, performed with a singlechannel magnetometer in the unshielded biomag-netism catheterization lahoratory of the CatholicUniversity of Rome, the unfavorable signal tonoise ratio did not allow a systematic evaluationof the coherence between the localization of theartificial stimulating dipole and of the myocardialevoked response. The one which gave the leastmismatch between fluoroscopic and MCG local-ization of catheter's tip was used as index of thelocalization accuracy.' •^^•^^• ''
The BioMag Lahoratory at the Helsinki Uni-versity Central Hospital is separated from thecatheterization room, and the patient had to bemoved from one bed to another several times.Such movements may induce minor but signifi-cant catheter displacement inside the heart. Fur-ther uncertainties in defining the catheter tipin fluoroscopic imaging were also caused bycardiac movements due to respiration and my-ocardial contraction. In respect to the MCC map-ping system, the range of transient movementsof the catheter tip, due to cardiac contraction andto respiration, may vary from patient to patientand can be even in the order of centimeters. Thusour calculation of the mismatch with fluoro-scopic imaging could be erroneous, because gat-ing of fluoroscopic imaging with contraction andrespiration was not available. Indeed, fluoro-scopic imaging of the catheter position can beused as an accurate gold-standard only when itcan be gated with ECC and respiration, and per-formed without moving the patient prior to MCCmapping,
Beat-to-Beat Variations
In all patients of beat-to-beat localization,scattering in the order of about 4 mm was ob-served, which was reduced by signal averaging.This variation could be due to transient impair-ment of signal to uoise ratio. It could also be ex-plained by having the ventricle variahly capturedby distal or by both poles of the catheter becauseof minor shift of the tip from the endocardial wall,due to respiratory movements and contractile ac-tivity of the heart.
PACE, VoL TI August 1999 1217

FENICL ET AL.
Modeling
Still, more accurate reconstruction of the tho-rax geometry, including the lungs and the heartcavities is likely to improve the localization accu-racy and the imaging efficacy. The missing contri-bution of such inhomogeneities could also explaina certain localization scattering, especially fordeeper and weaker sources like in patient P5.
MRl data give most accurate presentation forthorax geometry. Alternatively, thorax x-ray im-ages combined with echocardiographic of fluoro-scopic images of the heart can also be used for con-structing individual patient torso models at lowercost.'"
Limitations of the Method
The accuracy of MCG localization is directlyrelated to the signal to noise ratio in the record-ings. Earlier studies have shown that the cathetercan be localized by MCC in a catheter laboratory.However, a magnetically shielded room is usuallyneeded in order to achieve high S/N ratio for beat-to-beat localizations. This impedes, at the mo-ment, the use of fluoroscopy, which cannot be in-troduced inside a magnetically shielded room.However, multichannel MCC mapping systemsare under development in order to provide real-time mapping during electrophysiologicai study,in an unshielded catheterization laboratory.
Conclusions
The reliability of the multipurpose amagneticcatheter as an artificial intracardiac source wasfully validated in this study. The catheter can helocalized accurately by MGG, which offers a po-tential to minimize the need of fluoroscopy duringendocardial mapping. Multichannel MCC has thepotential for development of a computer-assistedpacemapping method for localization of the site oforigin of cardiac arrhythmias. Due to the specialdesign of the amagnetic catheter, simultaneousrecording of multiple monophasic action poten-tials during MCG recordings adds diagnostic po-tentiality hy increasing the spatial resolution ofelectrophysiologicai study directly on the arrhyth-mogenie area.
For future clinical application to guide elec-trophysiologicai intervention, high resolution
multichannel MCG mapping should be availablein the electrophysiology laboratory. At present,both magnetically shielded rooms and multichan-nel magnetometers are expensive. Systems with asmaller number of channels operating in a lightershielded room or even without magnetic shieldingwould evidently reduce the setup and mainte-nance cost. In addition, new high temperatureSQUID sensors working without liquid heliummight also improve the avaiiahihty of the biomag-netic technique.
The development of new dedicated softwareis necessary to automatically improve the defini-tion of the three-dimensional model of the patientheart, on the hasis of sequential catheter mapping.As compared to other navigation systems andbody surface potential mapping,'^'^'^^ the MCG-guided method provides potential for unique real-time integration of preoperative noninvasivethree-dimensional imaging of the arrhythmogeniesubstrate and intraoperative electrophysiologicaimapping with a single amagnetic catheter.
Acknowhdgments: The authors are indebted to ProfessorLuigi Donato for providing the financial support, and to Mr.Luigi Venturelli for developing the prototypes of the amagneticcatheter. We are al.so grateful to Dr. Lutz Keinharcit for valuablecomments on the mannscript.
Appendix
External markers were applied to match x-rayand MCG coordinate systems. In order to removethe error arising from parallax effect, the imaginggeometry was modeled. The x-ray source was as-sumed to be a point source with a given distancefrom the film, and the vector from the center of thex-ray projection was supposed to be orthogonal tothe film plane. The angle between the two imagingdirections was set to 90°. The distance of a se-lected marker from the film was used in botbimaging directions to estimate the position of thepatient relative to the x-ray imaging system. Twoprojections can he linked hy back-projecting themarker for which the distance from the film isknown. Next, more accurate alignment in the di-rection common to both projections [i,e., directionfrom the head to feet can be achieved utilizing theother markers found from both projections).
Since the field of view is small (about 10 X 10cm), only few markers can be seen on both projec-
1218 August 1999 PACE, Vol. 22
MCG LOCALIZATION OF AN AMACNETIC STIMULATION CATHETER
tions. Therefore, all markers cannot be back-pro-jected to a single three-dimensional point, butthey produce three-dimensional lines. For thisreason, the registration error Er^f, of x-ray and MCGcoordinate system includes point-to-point andpoint-to-line terms. The error was calculated as
gL.=Nl
J t = l
where p^ is the position of the back-projected x-ray marker and P^ is the corresponding markerdigitized in MCG coordinate system, Np is the
number of the markers present in both projections,while Nl markers can only be seen in one projec-tion producing a line 4 when hack-projected. Thefunction d() calculates the shortest distance from apoint to the line. The average registration error Ej gof all patients was 3.3 mm. Since the error compo-nent of the point-to-point term includes one moredegree of freedom than the point-to-line term, itserror values are usually higher. The error calcu-lated using only the first component of Ereg [i.6.,only taking into account markers visible in bothprojections) yielded 3.9 mm.
References
1. Windle }R, Armstrong WF, Feigenbaum H, et al.Determination of the earliest site of ventricular ac-tivation in Wolff-Parkinson-Whitc Syndromo: Ap-plication of digital continuous loop two-dimen-sional echocardiography. I Am Coll Cardiol 1986;7:1286-1294.
2. Yuan S, Blomstrom P. Pehrson S, et al. Localiza-tion of cardiac arrhythmias: Conventional nonin-vasive methods, Int J Card Imaging 1991; 7:193-205.
3. Matsumoto K, Yamamoto T, Saitou I. et al, Use ofbiplane transesophageal ochocardiographic guitloin radiofrequency catheter ablation of Wolff-Parkin.son-Whito Syndrnmn with left side KentBundle. Jpn Circ J 1993; 57:832-836.
4. Dubuc M, Nadeau R, Tremblay G, et al. Pace map-ping u.sing body surface potential maps to guidecatheter ablation of accessory pathways in patientswith Wolff-Parkinson-White Syndrome. Circula-tion 1993; 87:135-143.
5. SippensCroenewegen A, Spekhorst H, van HemelH, et al. Localization of tbe site of origin of postin-farction ventricular tachycardia by endocardialpace mapping. Circulation 1993; 88:2290-2306.
6. Siltanen P. Magnetocardiography, In PW Macfar-lane, TDW Lawrit: (eels.): Comprehensive Electro-cardiology. London, England, Fergamon Press,1989, pp. 1405-1434.
7. Nakaya Y. Magnetocardiography. Clin Phys Phys-iol Meas 1992; 13:191-229.
8. Achenbach S, Moshagc W, Bachmann K. Magneto-cardiograpby: t^linical investigation.s witb a bio-magnetic multichannel system. Physiol Meas1993; 14:61-68.
9. Oeff M. Magnetocardiograpbic mapping. In MSbenasa, M Borggrefe, G Breilbardt (eds.): CardiacMapping. Armonk, NY, Futura Publishing Co.,1993, pp. 383-388,
10, Nenonen J, Solving tbe inverse problem in magne-tocardiography. IEEE Eng Med Biol Magazine1994; 13:87-96.
11, Stroink C, Lamotbe R, Cardner MJ. Magnetocar-diograpbic and electrocardiographic mappingstudies. In H Weinstock (ed.): SQUID Sen.sors;Fundamentals, Fabrication and Applications.NATO ASI Series. Tbe Netberlands, Kluwer, 1996.
12, Nomura M, Watanabe K, Katayama M, et al. Mag-netocardiographic localization of an accessorypatbway in patients with WPW syndrome. | Car-diol 1990; 20:227-239,
13. Fenici RR, Melillo C, Masselli M. Clinical magne-tocardiograpby, Int J Card Imaging 1991; 7:151-167.
14. Nenonen I, Makljarvi M, Toivonen L, et al. Non-in-vasive niagnetocardiographic localization of ven-tricular pre-excitation in tbe Wolff-Parkinson-Wbite syndrome using a realistic torso model. EurHeart I 1993; 14:168-174,
15. Makijarvi M, Nenonen }, Toivonen L, et al. Magne-tocardiography: Supraventricular arrbythmias andpre-excitation syndromes. Eur Heart I 1993;14(Suppl. E):46-52,
16, Hombach V, Kochs M, WeissmuUer P, et al. Local-ization of ectopic ventricular depolarization by is-pect-radionuclide ventriculograpby and by mag-netocardiography, Int J Card Imaging 1991; 7:225-235.
17, Fenici R, Melillo G, Magnetocardiography: Ventri-cular arrhythmias. Eur Heart I 1993; 14(Suppl. E):53-60.
18, Oeff M, Burgboff M. Magnetocardiograpbic local-ization of tbo origin of ventricular ectopic beats.PACE 1994; 17:517-522.
19. Fenici R, Covino M, Collorino C, ct al. Magneto-cardio-graphically guided catheter ablation. J In-tervent Cardiol 1995; 8(Suppl,):825-836.
20. Moshage W, Acbenbach S, Gohl K, et al. Evalua-tion of tbe non-invasive localization accuracy ofcardiac arrhythmias attainable by multichannelmagnelocardiograpby (MGG), Inl J Gard Imaging1996; 12:47-59.
PACE, Vol, 22 August 1999 1219

FENICI, ET AL,
21. Fenici R, Melillo G, Gappelli A, et al. Magnetocar-diographic localization of a pacing catbeter. In SJWilliamson, M Hoke, G Stroink, et al. (eds.): Ad-vances in Biomagnetism, New York, NY, PlenumPress, 1989, pp. 361-364,
22. Fenici R, Melillo G, Biomagnetically localizablemultipurpose catbeter and metbod for MCGguided intracardiac electropbysiology, biopsy andablation of cardiac arrbytbmias. Int I Gard Imaging1991; 7:207-215.
23. Fenici R. Consiglio Nazionale delle Richerche:Biomagnetically localizable multipurpose catheterand method for MCG guided intracardiac electro-physiology. biopsy and ablation of cardiac ar-rhythmias. United States Patent Documents [19],Patent N.5 056 517, Oct.l5, 1991,
24. Montonen J, Abonen A, Hamaiainen M, et al, Mag-netocardiographic functional imaging studies inBioMag Laboratory. In C Aine, Y Okada, G Stroink,et al. (eds.): Advances in Biomagnetism Research:Biomag96, New York, NY, Springer Verlag (inpress),
25. Lbtjonen J, Sipila O, Nenonen J, et al. Individualboundary element models for magnetocardi-grapbic applications. Proc 18th Annu Int Gonf ofIEEE Eng Med Biol Soc, 1996: CD-rom,
26. Marquardt DW. An algorithm for least-squares es-timation of nonlinear parameters. J SIAM 1963;11:431^41,
27. Altman DG, Bland JM. Measurements in medicine:The analysis of method comparison studies.Statistician 1983; 32:307-317,
28. Fenici R, Fenici P, van Bosheide J, Amagneticcatheter for hiomagnetically guided endocardialmapping and ahlation of cardiac arrhythmias. In HReichl, A Heuberger (eds.): Micro System Tech-nologies, Berlin, Germany. VDE-Verlag GmbH,1996, pp, 711-716.
29. Fenici R, Pesola K, Makijarvi M, et al. Non-fluoro-scopic localisation of an amagnetic catheter ina realistic torso phantom hy magnetocardiograpbicand body surface potential mapping. Arcb MaiGoeur 1998; 91(SuppL III):345.
30. Lotjonen ]. Magnin I, Reissman PJ, et al. The gen-eration of tbe individual boundary element modelusing planar X-ray images. Med Biol Eng Gomput1997; 35(Suppl, l):17.
31. Gepstein L, Hayam G, Ben-Haim S. A novelmethod for nonfluoroscopic catheter-based elec-troanatomical mapping of the heart, Girculation1997; 95:1611-1622.
1220 August 1999 PACE, VoL 22