node similarity in the citation graph
TRANSCRIPT

Knowl Inf Syst (2006) 11(1): 105–129DOI 10.1007/s10115-006-0023-9
Knowledge andInformation Systems
REGULAR PAPER
Wangzhong Lu · J. Janssen · E. Milios ·N. Japkowicz · Yongzheng Zhang
Node similarity in the citation graph
Received: 16 February 2004 / Revised: 10 January 2005 / Accepted: 15 February 2005 /Published online: 22 April 2006C© Springer-Verlag London Limited 2006
Abstract Published scientific articles are linked together into a graph, the citationgraph, through their citations. This paper explores the notion of similarity basedon connectivity alone, and proposes several algorithms to quantify it. Our met-rics take advantage of the local neighborhoods of the nodes in the citation graph.Two variants of link-based similarity estimation between two nodes are described,one based on the separate local neighborhoods of the nodes, and another basedon the joint local neighborhood expanded from both nodes at the same time. Thealgorithms are implemented and evaluated on a subgraph of the citation graph ofcomputer science in a retrieval context. The results are compared with text-basedsimilarity, and demonstrate the complementarity of link-based and text-based re-trieval.
Keywords Networked information spaces · Document similarity metric ·Citation graph · Digital libraries
1 Introduction
The concept of information space has been proposed for collections of informa-tion that are organized so that the user can be aware of their structure and content,
W. Lu · E. Milios (B) · Y. ZhangFaculty of Computer Science, Dalhousie University, 6050 University Ave., Halifax,Nova Scotia, Canada, B3H 1W5E-mail: [email protected]
J. JanssenDepartment of Mathematics and Statistics, Dalhousie University, Halifax, Nova Scotia,Canada, B3H 3J5
N. JapkowiczSchool of Information Technology and Engineering, University of Ottawa, Ottawa,Ontario, Canada, K1N 6N5

106 W. Lu et al.
and use such awareness to navigate through them [6, 8, 11, 26]. Some informationspaces are designed [1, 8], however, others are self-organizing and self-evolvingby large numbers of people over a period of time. Several important informationspaces, such as the World Wide Web, are networks consisting of information en-tities and links between them that imply a relation between the entities. We callthe latter “Networked Information Spaces,” to emphasize their connectivity aspectand the growing realization in the research community that connectivity is as im-portant as content in organizing and retrieving information from such informationspaces.
In order to navigate and mine the contents of a networked information space, itis of crucial importance to be able to judge similarity between information entities.Traditionally, similarity between information entities is computed based on theircontent. However, in a networked information space, a lot of information aboutsimilarity is encoded in the link structure of the graph. This link-based similar-ity can complement the classic content-based similarity measures [4] to producea highly accurate similarity metric. Similarity is a key concept, not only in clas-sical information retrieval (for which direct methods based on indexing are moreefficient) but also for higher level tasks that involve the organization of large hy-perlinked document corpora. Such tasks include clustering [16], automatic termextraction from clusters to build thesauri, and visualization of document corpora[6].
The body of scientific literature, where information entities are articles andlinks represent references to other articles, has existed as a networked informa-tion space in paper form for a long time, and is rapidly becoming available inelectronic form through digital libraries and the World Wide Web [19]. In this pa-per, we explore various similarity metrics for the graph of the scientific literature,the citation graph, purely based on link structure. Our goal here is to investigatehow much similarity information can be extracted just from the link structure. Ourmethods are easy to compute. Moreover, they are based only on a local neighbor-hood of the information entities in the networked information space. Therefore,they are applicable even when the networked information space is too large tofit on a desktop machine, provided a mechanism is available for local navigationfrom one information entity to its neighbors. For access to the computer scienceliterature we use the electronic database Citeseer (ResearchIndex) [19].
Use of citation information to compute relatedness between scientific papershas been studied previously in contexts more limited than ours [14]. Since citationsof other papers are hand-picked by the authors as being related to their research,the reference list of a paper contains information which can be exploited to judgerelatedness. The simplest relation, a direct reference or citation, is likely to occuramong related papers which are published apart in time. It does not occur veryfrequently among papers published in the same year or very close in time. Twodifferent citation relations between papers have been specifically identified andused to calculate similarity, namely co-citation (two papers referenced by the samepaper) and bibliographic coupling (two papers citing the same paper) [24]. Twopapers are related by co-citation if they are cited together by the same paper. Smallhas studied the co-citation pattern among research papers and highlights its impor-tance in similarity computation [24]. Co-citation links are often present in two re-lated older papers. Two papers are bibliographically coupled, if they reference the

Node similarity in the citation graph 107
same paper. If two recent papers are published in the same or similar research area,a bibliographic coupling pattern is very likely to be found in their reference lists.
Bibliographic coupling and co-citation have been employed to compute sim-ilarity between research papers. But each of them is only suitable for computingsimilarity in specific cases. For instance, researchers have used co-citation fre-quency to compute relatedness between two papers, but the papers to be judgedhave to be well cited by other authors for the algorithm to work properly. Appar-ently co-citation is not efficient in judging similarity among recent papers whichhave not yet had the chance to be cited by many other authors. In terms of thedirect link pattern, if the two papers are published almost at the same time, a di-rect citation link is not likely to be found between them, even if their content isrelated. Similarly, papers which appeared in the early stages of the development ofa research specialty are not good candidates for bibliographic coupling analysis.In our metrics, we do not need to know which of these citation patterns our papersfall under. All patterns of citation relations are accounted for by using the citationgraph.
Giles et al. [19] proposed a similarity measure based on common citationsto judge the relatedness between papers. The metric, called “common citation ×inverse document frequency”(CCIDF), is conceptually similar to the text-basedsimilarity metric “term frequency × inverse document frequency”(TFIDF). TheCCIDF metric assigns a weight to each paper, which is equal to the inverse ofcitation frequency in the entire database. To find documents related to a givenpaper, all the papers which have at least one reference in common with that specificpaper are generated. The CCIDF metric is used by the automatic citation indexingsystem of Citeseer.
Our motivation for using the citation graph instead of comparing referencelists as in CCIDF is that the citation graph contains information which is muchricher than that embedded in the reference lists, and which cannot be obtainedjust by comparing reference lists from different papers. Two papers may haveno co-citation or bibliographic coupling relationship at all, but they could stillhave a strong relationship between them if their local citation graphs intersectsubstantially. For example, in Fig. 1 paper A references paper C , paper B ref-erences paper D, but A and B do not reference each other. Obviously, paper Aand paper B are not related to each other in terms of CCIDF, co-citation or bib-liographic coupling (i.e., through their direct references). But, if we expand thecitation graph a little further, we may find out that papers C and D are stronglyconnected by bibliographic coupling links, and we could infer the relationshipbetween papers A and B from papers C and D. Our method generalizes thisnotion by using both citations and references in the neighborhood of the twopapers.
Dean and Henzinger [9] present algorithms for finding pages in the WorldWide Web that are related to a given page. Their “companion algorithm” is sim-ilar to our algorithms in that it builds a neighborhood graph of the given page, itcalculates hub and authority values of the nodes in this graph and returns the topranked authority papers as the most similar papers to the given page. However,their algorithm does not, and cannot be trivially adapted to compute a similar-ity measure between two given nodes. The evaluation metric used is a precisionmetric (based on user studies) similar in nature to ours.

108 W. Lu et al.
Paper A Paper B
Paper C Paper D
Fig. 1 Relation between papers inferred from citation graph
In our work, we propose two different graph-based metrics: the maximum-flow metric and the authority vector metric. In the maximum-flow metric, one jointlocal citation graph is generated from a pair of papers to be compared by followingincoming and outgoing links from both papers. One paper is treated as a sourcenode and the other as a sink node. Flow capacities are assigned to the edges. Then,the value of the maximum flow which could be pushed through from source nodeto sink node is computed, and used to represent the similarity between the twopapers. In the authority-based metric, a local citation graph is grown separately foreach paper to be compared, by following incoming and outgoing links separatelyfor each paper. Then, authority weights [17] are computed for all nodes in eachof the local citation graphs. Each paper is then represented by a vector, whoseelements are the authority weights of the nodes in its local citation graph. Finally,similarity is computed as the vector distance between these vectors.
The motivation for using a citation graph for the evaluation of our graph-based similarity measures is twofold. Firstly, recent literature in bibliometrics[14, 15, 24, 25] suggests considerable interest in the comparison and classifica-tion of documents based on their citation environment. Secondly, the networkedinformation space formed by scientific papers and their references can be expectedto have a certain homogeneity. Therefore, such a space is more suited for the ini-tial testing of new ideas than a less homogeneous space such as the World WideWeb. To emphasize the linked structure of our information space, we chose an on-line citation index for our studies, namely Citeseer, an online database of scientific

Node similarity in the citation graph 109
papers in Computer Science. Our access to this database was only via the Internet.We built a web robot to automate this access. Application of our measures on theWorld Wide Web, which is a lot less homogeneous than the citation graph, is a fu-ture research project. The similarities and differences between the citation graphand the Web are explored in [3].
The advantages of using the particular citation graph are:
– The papers included are fairly homogeneous in length and structure, and thereferences and citations have a close relation to the semantic content of thepapers.
– The papers are in an area familiar to the authors, so the possibility exists tocompare experimental results with our own judgement.
– Access was fairly straightforward, and full papers could be retrieved easily.
The disadvantages are:
– Our data consists of a body of scientific literature, so similarity of papers canonly be judged by experts, and involves considerable time and effort.
– Citeseer contains a certain amount of “clutter” such as duplicate papers.– Citeseer itself, as well as any subset that we used for our experiments,
is not complete. In other words, the full text of the references of a pa-per in the database is not necessarily available in the database. This maywell be a feature of any citation index, though. A cursory comparison withthe science citation index, for example, showed that this well-establisheddatabase showed about the same degree of “incompleteness” as our owncollection.
In Sects. 2 and 3 we describe our metrics and the methods to compute them. InSect. 4 we evaluate the metrics and the impact of their key parameter settings. Wealso describe how the local citation graphs, which are required for the similaritymetrics, are being built. In Sect. 5 we compare the performance of the link-basedmetrics with text-based similarity metrics. Finally we discuss the results and pro-pose future research directions.
2 Authority vector metrics
In this section, we describe the similarity metrics based on a vector representationof the neighborhoods of the two papers being compared. Given two research pa-pers A and B, we construct two separate local citation graphs, graph A and graphB, for each of them. The idea is to compute the similarity of the given papersby comparing the similarity of their citation environments. It is not a trivial prob-lem to compare graphs. Rather than comparing local citation graphs directly, wewish to use the most important or “authoritative” papers to represent a specificcitation environment. The similarity between citation environments will then bebased largely on these authority papers.
2.1 Authority papers
In order to implement this approach, we need to address first how to identify theauthority papers in a given link environment. In other words, we need to find a

110 W. Lu et al.
criterion to judge the importance of a given paper. In bibliometrics, citation anal-ysis was used to measure the importance of scientific papers by Garfield [14].Garfield also proposed a well-known metric to estimate the importance of jour-nals by Impact Factor [15]. This metric, in graph-theoretic terms, amounts to apure counting of the in-degree of nodes in the citation graph to compute howimportant a journal is. In ranking search results on the World Wide Web, peo-ple face the problem of how to determine the importance of a web page. Brinand Page proposed the PageRank algorithm [5]. Kleinberg [17] proposed a mea-sure of the importance of web page by computing hub and authority weights.Kleinberg’s hub and authority measure has been shown to be more stable [23].Hubs and authorities as defined by Kleinberg’s method can be seen as follows:a hub is a paper that points to many authorities; an authority is a page that ispointed to by many hubs. Hub and authority weights are computed by an iterativealgorithm.
Intuitively, papers with high authority weight form the core of the most im-portant papers in a specific research area. Hub papers might be review papersor tutorials; their content is broad and therefore papers that cite or are cited byhub papers are generally more loosely related than those that cite or are cited byauthority papers. This intuitive notion has been confirmed by the hub/authoritycalculations done on the Web [17, 18]; web pages with high authority weight tendto be pivotal and important web pages on a certain subject, while web pages withhigh hub weight often are resource pages with many relevant links. One excep-tion worth mentioning could be the “classic” review papers, that are heavily cited,therefore making them both hubs and authorities. It is possible to detect such pa-pers and exclude them from the similarity metric, although we have not done soin our experiments. In order to get high similarity between two papers, their localcitation graphs must have a large intersection and there must be many authoritypapers in the intersection area.
Finally, we note that our metric is different from CCIDF, the citation-basedmetric used by Citeseer to locate related papers. First of all, CCIDF uses in-degreeas a measure of importance. Our metric uses authority weight, which is a moresubtle measure of importance than in-degree. In many cases, authority weightsare very close to the in-degree. In some cases, however, authority weights can bebetter than in-degree, for example when an authority paper is relatively recent, andit does not have a high in-degree, but it is cited by hub papers, or when a paperis near the fringe of the citation graph. This metric also is expected to reducethe negative effect of survey papers. These kinds of papers will be more likely tohave long list of references, hence they are linked to many papers and can thusbe wrongly treated as related to many other papers. In our authority vector metric,normalizing the vector before computing similarity will greatly lessen the negativeinfluence of those papers. The local citation graph of survey papers will be largerthan that of other research papers, and thus the vector of authority weights willhave lots of components. If a vector has lots of components and is normalized,then in general individual entries will have lesser values, since their squares needto add up to 1. This will make the inner product smaller and hence lead to lowersimilarity with other papers. Also CCIDF is based on the citation frequency overthe entire citation graph, while to compute our metric only a local citation graphis needed.
Node similarity in the citation graph 111
Authority weight distribution
0200400600800
1000
0
0.03
75
0.07
5
0.11
25
0.15
0.18
75
0.22
5
0.26
25 0.3
0.33
75
0.37
5
0.41
25
0.45
Mor
e
Bin
Fre
qu
ency
Authority weight log distribution
0
0.5
1
1.5
2
2.5
3
3.5
0
0.02
5
0.05
0.07
5
0.1
0.12
5
0.15
0.17
5
0.2
0.22
5
0.25
0.27
5
0.3
0.32
5
0.35
0.37
5
0.4
0.42
5
0.45
0.47
5
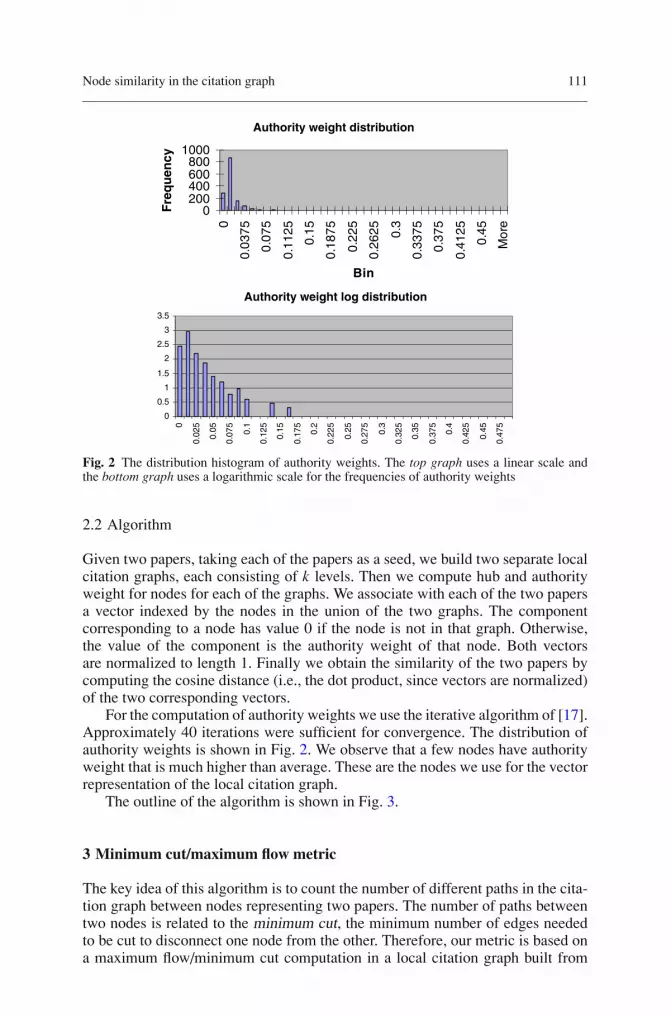
Fig. 2 The distribution histogram of authority weights. The top graph uses a linear scale andthe bottom graph uses a logarithmic scale for the frequencies of authority weights
2.2 Algorithm
Given two papers, taking each of the papers as a seed, we build two separate localcitation graphs, each consisting of k levels. Then we compute hub and authorityweight for nodes for each of the graphs. We associate with each of the two papersa vector indexed by the nodes in the union of the two graphs. The componentcorresponding to a node has value 0 if the node is not in that graph. Otherwise,the value of the component is the authority weight of that node. Both vectorsare normalized to length 1. Finally we obtain the similarity of the two papers bycomputing the cosine distance (i.e., the dot product, since vectors are normalized)of the two corresponding vectors.
For the computation of authority weights we use the iterative algorithm of [17].Approximately 40 iterations were sufficient for convergence. The distribution ofauthority weights is shown in Fig. 2. We observe that a few nodes have authorityweight that is much higher than average. These are the nodes we use for the vectorrepresentation of the local citation graph.
The outline of the algorithm is shown in Fig. 3.
3 Minimum cut/maximum flow metric
The key idea of this algorithm is to count the number of different paths in the cita-tion graph between nodes representing two papers. The number of paths betweentwo nodes is related to the minimum cut, the minimum number of edges neededto be cut to disconnect one node from the other. Therefore, our metric is based ona maximum flow/minimum cut computation in a local citation graph built from

112 W. Lu et al.
Fig. 3 Outline of the Vector-based metric computation
Global citation graph
Minimum Cut separating A , B
Local citation graph expanded from A and B
Paper APaper B
Fig. 4 Using minimum cut to compute similarity between papers
the two papers simultaneously, as shown in Fig. 4. The capacities of the edgesare chosen judiciously, to represent the fact that longer paths are less indicative ofsimilarity than shorter ones.
Finding all the possible paths between two nodes is not a simple task. Weintroduce a flow idea to compute similarity. All the paths between the two paperstogether constitute a flow. If we view the network as having one source and onesink, the amount of flow between source and sink is restricted by the number andcapacity of the links. The maximum flow from source to sink can be efficientlycomputed and is equal to the minimum capacity of a cut of the graph betweensource and sink, where a cut is a set of links and nodes that disconnect the graph[10]. Intuitively the more links and the higher the capacity of links between sourceand sink, the more flow can be sent through, and the more links will need to be cutto disconnect the source from the sink.
We use the concept of maximum flow/minimum cut to judge the relation be-tween two papers, as shown in Fig. 4. The more flow that can be pushed fromsource to sink, the higher the similarity between source and sink will be. We want
Node similarity in the citation graph 113
to deemphasize the effect of longer paths, which is done by adjusting the edge ca-pacities. The capacity of an edge is the maximum flow that can be pushed throughthe edge. An edge which is far away from the source or sink paper gets a lowercapacity weight. Therefore, edges that are in the middle of long paths will havesmall capacity, and therefore longer paths contribute less to the overall flow fromsource to sink. The detailed definition of capacity is given in Sect. 3.1.
In this metric, we do not care about the direction of each edge, since we tryto find out how strongly the two papers are connected together in an undirectedgraph grown from the papers to be compared. This is done so that paths of alltypes are taken into consideration.
3.1 Capacity assignment
The minimum flow similarity metric uses a parameter d , which is used to adjustthe capacities of the edges. Parameter d represents the relative importance of pathsof various lengths. Large values of d will tend to emphasize the importance ofshort paths, while smaller values of d will tend to equalize the importance ofshorter and longer paths.
Parameter d should be chosen so that d paths of length k are equivalent toone path of length k − 1. Specifically, parameter d represents the number of pathsof length two that are considered equivalent to a direct edge between two nodes.In other words, the similarity metric should give the same value for two adjacentnodes as for two non-adjacent nodes having d common neighbors. Note that inthe first case, the nodes can be separated by cutting one edge, while in the secondcase, d edges must be cut. This suggests that the capacity of the edge in the firstscenario should be d times as high as the capacity of the edges in the secondscenario. In view of the above, a reasonable choice for d should depend on themaximum or average degree in the graph, or the maximum or average number ofcommon neighbors of any pair of nodes.
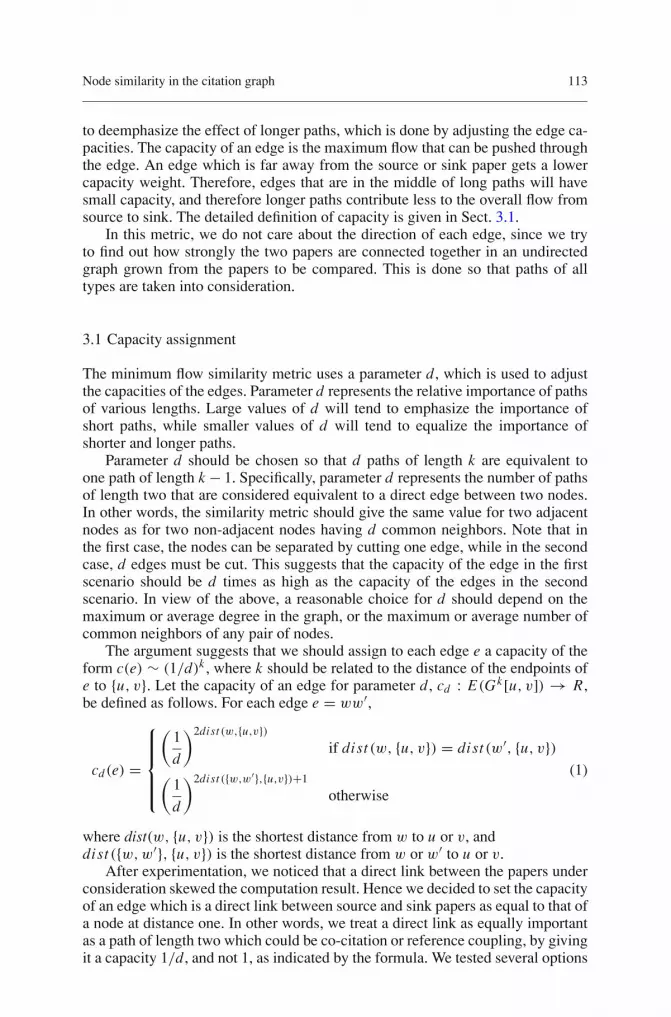
The argument suggests that we should assign to each edge e a capacity of theform c(e) ∼ (1/d)k , where k should be related to the distance of the endpoints ofe to {u, v}. Let the capacity of an edge for parameter d , cd : E(Gk[u, v]) → R,be defined as follows. For each edge e = ww′,
cd(e) =
⎧⎪⎪⎪⎨
⎪⎪⎪⎩
(1
d
)2dist (w,{u,v})if dist (w, {u, v}) = dist (w′, {u, v})
(1
d
)2dist ({w,w′},{u,v})+1
otherwise
(1)
where dist(w, {u, v}) is the shortest distance from w to u or v, anddist ({w,w′}, {u, v}) is the shortest distance from w or w′ to u or v.
After experimentation, we noticed that a direct link between the papers underconsideration skewed the computation result. Hence we decided to set the capacityof an edge which is a direct link between source and sink papers as equal to that ofa node at distance one. In other words, we treat a direct link as equally importantas a path of length two which could be co-citation or reference coupling, by givingit a capacity 1/d , and not 1, as indicated by the formula. We tested several options

114 W. Lu et al.
1/d 1/d
1/d
(1/d)2
1/d
(1/d)3 (1/d)3
1/d 1/d
Fig. 5 Example of edge weights in flow-based metric
for the assignment of capacities in our experiments. The capacities assigned inour research are based on the length of the path or the distance between edge andsource/sink papers. We mention here another option of setting edge capacities,which is based on how much you trust the edge in similarity computation. Anexample of edge weights is shown in Fig. 5.
For d = 1, paths of all lengths are given equal importance, and, by a well-known result from graph theory (see e.g. [10]), the minimum flow value equals thenumber of disjoint paths (of any length) between source and sink. Intuitively, theequal treatment of paths of all length does not lead to a good measure of similarity.Our results in Sect. 4.2 confirm this. Analysis of several large subgraphs of thecitation graph of Computer Science literature (see [2]) shows that this graph iswell-connected, and the minimum cut between two nodes will almost always fallin the neighborhood of one of the two nodes. This was also confirmed by ourresults for the case where d = 1. As shown in [20], the maximum flow in this casedepends almost completely on the degree of the source or sink.
In our experiment we tested the maximum flow metric for values of d set to 50,25, 12, 6, 3, 2, and 1 (Fig. 6). We found that the precision drops with decreasingvalues of d . Further, the results for d = 25 and d = 50 were almost identical.Therefore to get optimal precision d should be set to 25 or greater.
The results also indicate that the parameter d can be used to control the scopeof the result set. We can let the end user choose different values of d to changethe scope of the papers. For example, the user can start with a higher value of
Precision diagram for maximum flow metric with different d values
0
0.2
0.4
0.6
0.8
1
1.2
1 2 3 4 5 6 7 8 9 10No. of top similar papers
Per
cen
tag
e o
f co
rrec
tly
rela
ted
p
aper
s d=25
d=12
d=6
d=3
d=2
Fig. 6 Test results for the flow-based algorithm values of d equal to 25, 12, 6, 3, and 2
Node similarity in the citation graph 115
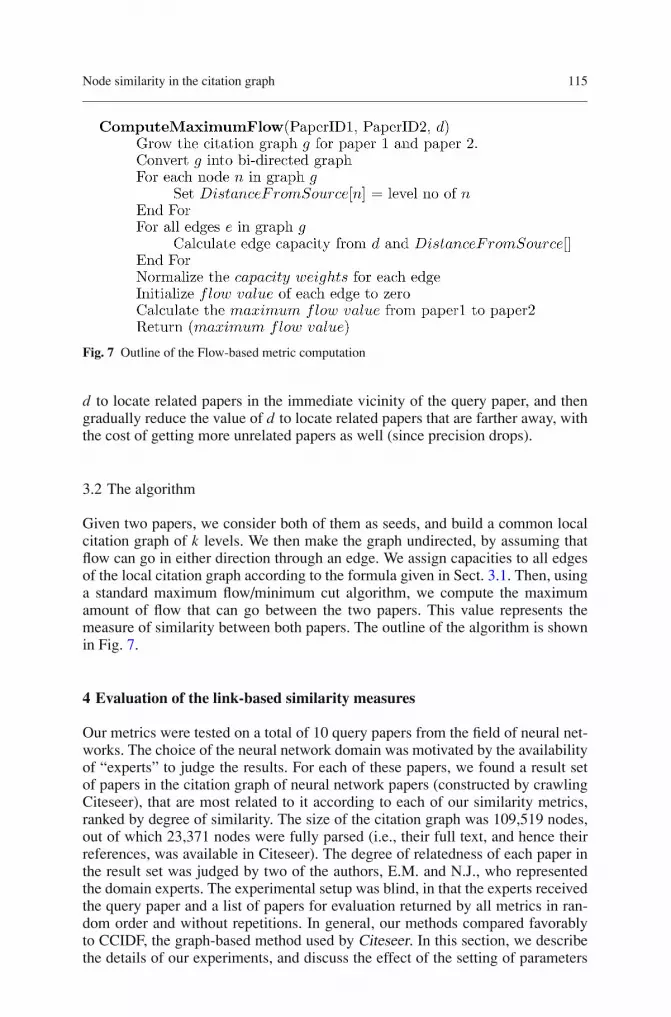
Fig. 7 Outline of the Flow-based metric computation
d to locate related papers in the immediate vicinity of the query paper, and thengradually reduce the value of d to locate related papers that are farther away, withthe cost of getting more unrelated papers as well (since precision drops).
3.2 The algorithm
Given two papers, we consider both of them as seeds, and build a common localcitation graph of k levels. We then make the graph undirected, by assuming thatflow can go in either direction through an edge. We assign capacities to all edgesof the local citation graph according to the formula given in Sect. 3.1. Then, usinga standard maximum flow/minimum cut algorithm, we compute the maximumamount of flow that can go between the two papers. This value represents themeasure of similarity between both papers. The outline of the algorithm is shownin Fig. 7.
4 Evaluation of the link-based similarity measures
Our metrics were tested on a total of 10 query papers from the field of neural net-works. The choice of the neural network domain was motivated by the availabilityof “experts” to judge the results. For each of these papers, we found a result setof papers in the citation graph of neural network papers (constructed by crawlingCiteseer), that are most related to it according to each of our similarity metrics,ranked by degree of similarity. The size of the citation graph was 109,519 nodes,out of which 23,371 nodes were fully parsed (i.e., their full text, and hence theirreferences, was available in Citeseer). The degree of relatedness of each paper inthe result set was judged by two of the authors, E.M. and N.J., who representedthe domain experts. The experimental setup was blind, in that the experts receivedthe query paper and a list of papers for evaluation returned by all metrics in ran-dom order and without repetitions. In general, our methods compared favorablyto CCIDF, the graph-based method used by Citeseer. In this section, we describethe details of our experiments, and discuss the effect of the setting of parameters

116 W. Lu et al.
and other implementation decisions on the results. In the next section, we will alsocompare our link-based similarity measures to more classical text-based ones.
All test results are shown as precision diagrams, that are obtained from the re-sponse of our domain experts. The domain experts rated each of the top 10 papersin each result set as “related,” “somewhat related” or “not related,” expressed bynumerical values 1, 0.5, and 0, respectively. In the precision diagrams, the totalscore of the first k papers in a result set is plotted as a function of k. In total, over500 papers were rated by the domain experts. The precision diagrams representthe average results over all papers considered.
We chose CCIDF as our comparative metric because it is a metric also solelybased on citation information, and because it is a metric used by the Citeseerdatabase. It should be pointed out that the retrieval task was chosen to demonstratethe validity of the proposed algorithms, and not to compete with more efficientinformation retrieval algorithms in terms of computational performance. Buildingan efficient information retrieval system that incorporates our algorithms is a topicfor future research.
4.1 Building the local citation graph
We now describe in detail how the local citation graphs are obtained. The localcitation graph will be built from one or two papers, and it will be given as input toour similarity metric computation. We use the term “layer” to represent differentsets of nodes. Nodes in layer 0 only contain the starting points corresponding tothe seed papers. Nodes in layer 1 are nodes citing or cited by layer 0 nodes. Nodesin layer 2 are nodes citing or cited by nodes in layer 1, but not by nodes in layer 0.In terms of edges, we say that edge e is in layer n if one endpoint of e is in layer nand the other endpoint is in layer n − 1. If both endpoints of an edge are in layern, we say that the edge is in layer n.5. For instance, if an edge has its endpointsin layer 1 and layer 2, we call it a layer 2 edge; if both endpoints of an edge arein layer 2, we call it a layer 2.5 edge. In terms of the local citation graph, we usethe maximum layer number to name the layer of a graph. For example, a 2.5 layergraph will include nodes in layer 0, 1, and 2, and edges in layer 0.5, 1, 1.5, 2, and2.5. The process of building our local citation graph is shown in Fig. 8.
4.2 Experimental results
In the computation of the maximum flow metric, we used local citation graphsof 2.5 and 1.5 levels. For the computation of the authority metric, we used localgraphs of 1.5 level. For CCIDF we used our global citation graph (a subgraph ofthe Citeseer citation graph) to compute the citation frequency of each paper. Theresults, based on the average precision results taken over all 10 test papers, arepresented as precision diagrams in Fig. 9.
From the precision diagrams, we can see the potential of our methods to givehighly accurate results. The high precision is quite remarkable, given the fact thatonly information about the citation graph, not about the content of the papers, isused in our methods. Moreover, the small vector and flow metrics perform sub-stantially better than CCIDF, while the big vector metric performs similarly to

Node similarity in the citation graph 117
Fig. 8 Growing the local citation graph for one or two seed papers
Comparing different graph-based similarity metrics
0
0. 2
0. 4
0. 6
0. 8
1
1. 2
1 2 3 4 5 6 7 8 9 10
No. of top similar papers
Per
cent
age
of
corr
ectl
yre
late
d p
aper
s
Small Vector
Maximum Flow(d=25)
CCIDF
Fig. 9 Test results of different metrics
CCIDF. We demonstrate these statements by a two-factor analysis of variance(ANOVA) with replications on the family of the four metrics together, and thenon all pairs of metrics. We show the F-statistic and P-value for each pairwise testin Table 1. The result of the overall ANOVA is that there is statistically significantdifference among the four metrics, F3,360 = 24.5, P-value < 0.0001.
In the remainder of this section, we discuss various observations on the exper-imental results that may be of interest.
Table 1 Pairwise ANOVA results for the four metrics
Small vector CCIDF Flow (d = 25)
Big vector F = 36.6, P < 0.0001 F = 1.07, P = 0.30 F = 28.5, P < 0.0001Small vector F = 51.8, P < 0.0001 F = 1.29, P = 0.26CCIDF F = 36.7, P < 0.0001
F = F1, 180 and P = P-value.

118 W. Lu et al.
4.2.1 The effect of a hub paper
When analyzing our results, we found one paper containing more than 1000 refer-ences, which was not judged to be similar to the given query paper by our metricsbut which was nonetheless given a high similarity rank by CCIDF. This points to areason why CCIDF may not give satisfactory results. CCIDF is based only on thecommon references between two papers. If a paper has a long list of references, itis very likely to have more papers in common with a given test paper, and henceit will receive high CCIDF value. As noted earlier, however, hub papers that arehighly cited can still cause problems to our metrics, too.
4.2.2 Overlap in the result sets from the different metrics
In addition to comparing precision curves, it is interesting to examine the amountof overlap in the result sets obtained from the various metrics. For three differentquery papers, we found that there was an overlap between 10 and 40% in theresult sets of the flow-based and vector-based metrics. Furthermore, the result setsusing CCIDF have similarly small overlap with the flow-based and vector-basedmetric result sets. This implies that the result sets from the two metrics differsubstantially, and points in the direction of possibly integrating the results frommultiple metrics.
4.2.3 The effect of graph quality
A factor that was found to influence our results is the quality of the local citationgraph. Some nodes in our local citation graphs correspond to papers for whichthe full paper, and hence also its reference list, is not available in the database.Such nodes are said to be not fully parsed. The quality of a local citation graph,in terms of its proportion of fully parsed nodes, will affect the precision of ourresults. To investigate the effect, we used the flow-based metric with d = 25 onpapers with local citation graphs of different quality. We found that the percentageof fully parsed nodes in the first layer has the most influence on precision. Basedon our test, it appears that at least 30% of the nodes in the first layer should befully parsed in order to obtain dependable results [20].
4.2.4 The effect of directly linked papers
In the result set, if one paper is citing or is cited by a query paper, we say it is adirectly linked paper to the query paper. In this section, we compare the percentageof directly linked papers in the result sets returned by the different metrics.
The importance of direct link has been noticed and studied in previous researchin library science literature. Henry Small found that a very effective predictorof strong co-citation linkages between papers is provided by the direct citationpatterns [24]. In our research we also analyze the influence of direct link on oursimilarity metric. It is easy to see how the existence of a direct link will affect boththe values of the maximum flow metric and the authority metric. For the maximumflow metric, if there is a direct link between source and sink paper, it provides ashortcut with high capacity between source and sink that can accommodate more
Node similarity in the citation graph 119
flow. For the authority metric, graphs grown from two adjacent nodes will havea larger intersection than those grown from nodes which are far apart. So it isintuitive that we will obtain a certain percentage of papers with a direct link to thequery paper in the result set.
We examined the percentage of direct link papers in the result sets of the var-ious metrics. The results verify that all metrics retrieve a certain percentage ofdirect link papers in the range from 30% for CCIDF to 60% for the flow-basedand vector-based metrics [20].
We also experimented with small adjustments to our algorithms in terms of thetreatment of the direct link. For the maximum flow metric, we performed adjust-ments to the capacity of the direct link, while leaving the capacities of all otheredges the same. Our findings were as expected, namely that we obtain more directlink papers with a higher capacity of the direct link. For the authority metric, wemodified the way in which we grow the local citation graph, so as not to use directlink information in the process of growing the local citation graph. We found thatthis affects the percentage of direct link papers very little. This result indicates thatwhen there is a direct link between papers, their local citation graphs have a largeoverlap even if the direct link itself is discarded.
4.2.5 Distance of returned papers from source paper
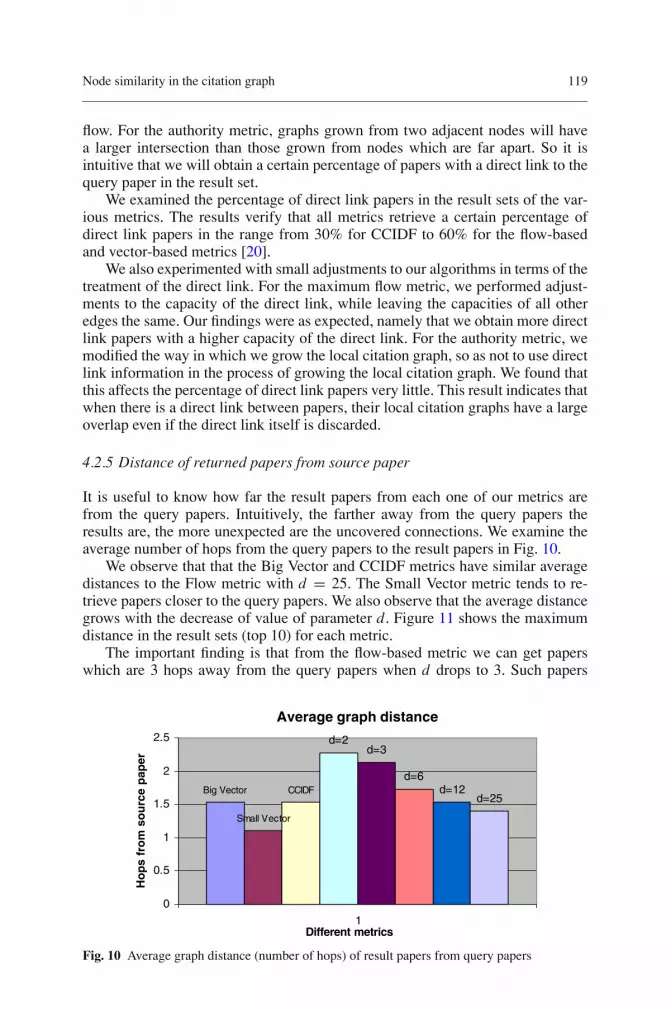
It is useful to know how far the result papers from each one of our metrics arefrom the query papers. Intuitively, the farther away from the query papers theresults are, the more unexpected are the uncovered connections. We examine theaverage number of hops from the query papers to the result papers in Fig. 10.
We observe that that the Big Vector and CCIDF metrics have similar averagedistances to the Flow metric with d = 25. The Small Vector metric tends to re-trieve papers closer to the query papers. We also observe that the average distancegrows with the decrease of value of parameter d . Figure 11 shows the maximumdistance in the result sets (top 10) for each metric.
The important finding is that from the flow-based metric we can get paperswhich are 3 hops away from the query papers when d drops to 3. Such papers
Average graph distance
Big Vector
Small Vector
CCIDF
d=2d=3
d=6d=12
d=25
0
0.5
1
1.5
2
2.5
1Different metrics
Ho
ps
fro
m s
ou
rce
pap
er
Fig. 10 Average graph distance (number of hops) of result papers from query papers

120 W. Lu et al.
Maximum graph distance
Big.V Small V. CCIDF
d=2 d=3
d=6 d=12 d=25
0
0.5
1
1.5
2
2.5
3
3.5
1Different metrics
Ho
ps
fro
m s
ou
rce
pap
er
Fig. 11 Maximum graph distance of result papers from source papers
Physical distance vs. Flow-based distance( d = 3)
0
0.5
1
1.5
2
2.5
0 1 2 3 4
Physical distance
Inve
rse
Flo
w V
alu
e
Related
Not related
Fig. 12 Visualization of test results from flow-based metric with d set to 3
cannot be found by using CCIDF, bibliographic coupling, co-citation or directlink metric. The test result of flow with d set to 3 (Fig. 12) shows related papersfound three hops away from the query papers.
4.2.6 Metrics in the formal sense
The various metrics proposed in this paper are not guaranteed to be metrics inthe formal sense (in that they satisfy the triangle inequality). There are algorithmsfor efficient indexing using distance measures that are not metrics in the formalsense. For example, FastMap [12] is a method that maps data entities to points in aEuclidean space, given a distance measure, while preserving the distance structureof the data space.

Node similarity in the citation graph 121
4.2.7 Computation time
Computation time for a single query paper on a Pentium III, 700 MHz with128 MB of RAM is about 5 h for the flow-based methods and about 2 h for thevector-based methods and CCIDF. In the vector-based methods, the vector rep-resentation of each paper in the database is computed once and stored, howeverno special file structures are used to quickly identify whether two papers have anyoverlap in their local neighborhoods (which could reduce the computation time byorders of magnitude). In the flow-based methods, the joint local citation graph isdifferent and must be grown for each pair of papers. Design of appropriate index-ing structures for quickly identifying the papers, for which the graph is connected,and therefore similarity is non-zero, is a topic of future study.
5 Comparison of link- with text-based similarity measures
In this section, we present results of the application of text-based similarity mea-sures to the same retrieval task using the same document corpus and the samequery papers that were used in the evaluation of link-based similarity measurespresented in the previous section.1 The key lesson from this comparison is thecomplementary nature of term/word-based and link-based methods.
Two variants of text-based similarity are presented, based on words and onmulti-word terms extracted using the C-value/NC-value method [13]. The firstvariant uses single-word nouns as features. The second variant uses noun phrases,obtained by the application of a linguistic filter on the sequence of part-of-speechtags of the text, and treated as candidate terms. The candidate terms are furtherranked on the basis of statistical metrics that account for the frequency of the nounphrases in the corpus, and nesting relations between noun phrases (C-value) andin addition the presence of “context” words that appear in the vicinity of candidateterms (NC-value).
Words or terms are used to define a document vector space for defining a doc-ument similarity measure. The vector space model is widely used for the measure-ment of similarity between documents [21] because of its conceptual and compu-tational simplicity. Documents and queries are represented as vectors in a vectorspace, where the dimensions correspond to “features” (words or terms). We ap-plied the following equation [21] to define the term weight.
weight(i, j) =⎧⎨
⎩
(1 + log t fi, j ) · logN
d fi, if t fi, j ≥ 1
0, if t fi, j = 0(2)
where t fi, j is the frequency of term i in document j , d fi is the number of doc-uments in which term i occurs, and N is the total number of documents in thecorpus.
Documents are ranked in the vector space model by measuring their similari-ties with the query vector using the standard cosine similarity metric.
1 This research was first presented in [22].

122 W. Lu et al.
5.1 Features used for text-based similarity
Two different methods were used to evaluate document similarity based on con-tent, term-based and word-based.
In the term-based method, we generated the corpus terms from full paperssorted by NC-value. There were 189,043 candidate terms extracted from the wholecorpus with a specific linguistic filter, but not all the terms are suitable for informa-tion retrieval [28]. For example, those terms appearing in most documents in thecorpus are not useful, because they do not help discriminate among documents.So we re-rank the list of terms, according to their Document Frequency in orderto set proper upper and lower cut-offs for selecting terms appearing with interme-diate frequency [28]. Document frequency is the number of documents in whichthe term occurs [21]. Cut-offs were determined empirically, as is common practicein information retrieval. We specified the cut-off interval (4, 250) to exclude themost frequent and the least frequent terms, leading to a subset of 6100 terms withdocument frequency between 4 and 250.
In the word-based method, we extracted all the nouns from the corpus as fea-tures. The number of nouns is 11060, after setting the cut-off interval based ondocument frequency at (12, 8700), almost twice the number of terms.
The top 10 similar papers for each query paper were judged by two domainexperts, and were assigned a score 1 (related), 0.5 (somewhat related) or 0 (notrelated).
5.2 Comparison of term-, word- and link-based methods
The term-based method gave on the average somewhat better precision than theword-based and link-based methods, as shown in Fig. 13.
To determine the statistical significance of the differences in precision curves,we performed a two-factor Analysis of Variance with replications on the rawscores from the above experiments. We show the F-statistic and P-value for each
Precision of top 10 similar papers
0
0.1
0.2
0.3
0.4
0.5
0.6
0.7
0.8
0.9
1
1 2 3 4 5 6 7 8 9 10
Paper
Pre
cisi
on
term-basedword-basedlink-based
Fig. 13 Precision comparison of three methods: term-based, word-based, and link-based

Node similarity in the citation graph 123
Table 2 Pairwise ANOVA results for the three experiments
Term-based Word-based
Word-based F1, 162 = 2.28, P-value = 0.13
Link-based F1, 162 = 3.10, P-value = 0.08 F1, 162 = 0.04, P-value = 0.85
Fig. 14 Venn diagram for the complementarity of the results from the term-based and word-based methods
pairwise test in Table 2. As we can see, the significance level of the differencebetween the term-based and word-based methods is 87% (i.e., there is probability13% that the observed difference came about by chance). The significance level ofthe difference between the term-based and link-based methods is 92% (i.e., thereis probability 8% that the observed difference came about by chance). There is nosignificant difference between the word-based and the link-based methods.
5.3 Complementarity of methods
5.3.1 Term-based vs. word-based
The word-based and term-based methods complement each other by producingdifferent sets of related papers as shown in Fig. 14. Averaged over the query pa-pers, they had 4.4 relevant papers in common against the top 10 similar papersand for the remaining non-common papers, 3.8 papers were judged as relevantwith term-based method and three papers were judged as relevant with word-basedmethod.
5.3.2 Term-based vs. link-based
The link-based and term-based methods complement each other by producing dif-ferent sets of related papers, as shown in Fig. 15. Averaged over the query papers,they had 2.4 relevant papers in common against the top 10 similar papers and forthe remaining non-common papers, 5.3 papers were judged as relevant with term-based method and 4.8 papers were judged as relevant with link-based method.

124 W. Lu et al.
Fig. 15 Venn diagram for the complementarity of the results from the term-based and link-basedmethods
Fig. 16 Venn diagram for the complementarity of the results from the word-based and link-based methods
The term-based method can get higher precision but needs time to preprocessthe texts and build an inverted index. Term- and link-based methods can be usedtogether to gain higher precision and attract more similar papers to the top similarpaper list.
5.3.3 Word-based vs. link-based
Figure 16 demonstrates that the link-based and word-based methods complementeach other too by producing different sets of related papers. Averaged over thequery papers, they had 2.8 relevant papers in the 2.9 common papers against thetop 10 similar papers and for the remaining non-common papers, 4.6 papers werejudged as relevant with word-based method and 4.4 papers were judged as relevantwith link-based method.
6 Future work
In the experiments presented here, we limited the evaluation of results to the top10 similar papers to a given query paper. It would be interesting to see whether

Node similarity in the citation graph 125
the conclusions presented here still hold if we considered instead a larger numberof top similar papers, such as 20 or 50, especially the conclusion about similarpapers found by one metric but not the others. The general problem is that reli-ably evaluating the similarity of hundreds of results requires substantial additionalamounts of the experts’ time. Making relevance judgments on research papers re-quires deep domain expertise beyond that of graduate students, while faculty andresearcher time who possess such expertise in in short supply. A way to addressthe evaluation problem is to follow the text retrieval conference (TREC) model,where an organization such as the National Institute of Standards and Technology(NIST) pools resources together to create standard corpora with associated rele-vance judgments, on which researchers from around the world could evaluate theiralgorithms.
A related issue is the size of the optimal neighborhood used in the metrics. Wenoted that a larger neighborhood does not seem to improve retrieval performancebut it may uncover unexpected relations. Defining the sense of optimal and de-termining the optimal neighborhood for the various metrics is an important futureresearch topic.
In the future, we may want to take more detailed citation information intoaccount. One direction for future work is to assign weights to the citations made inan article. Namely, citations made in the same paper have a different importance tothe author or research. We might assign different weights to references in terms ofwhere they appear (introduction, body) and how often they appear in the researchpaper as opposed to treating all the references equally.
Another direction for future research is to treat co-citation and reference cou-pling differently in computing the similarity, by assigning weights to differentedges using directed graph. In this paper we do not consider the direction andtreat co-citation and bibliographic coupling equally. Depending how much youtrust each of these two relationship in judging relatedness, one could set up anadjustable parameter to leverage the similarity judgment.
Combining text-based metric and link-based similarity metrics is worth pur-suing. One simple way is just use a weighted sum of each individual similaritymeasure to compute similarity. Another option is to use text-based methods tosimplify the citation graph by highlighting important citations, that are identifiedby analyzing the text.
Finally, there are other contexts besides the citation graph in which the link-based similarity algorithms we propose here may be applicable. One example isthe problem addressed in [7] of determining fraudulent telephone accounts byanalyzing the calling patterns. The idea of that paper is the following: someonewho has previously used a fraudulent account may set up a new one under adifferent name and address, but the calling patterns are largely the same. Thatpaper extracts the local neighborhood of the calling pattern graph for each, andcompares them using an ad-hoc way of computing the similarity. The authorityvector metric we present here has the potential to improve upon those results,especially with respect to the problem of popular nodes (toll-free numbers, in-formation numbers) that are common to a lot of calling patterns, but do not givemuch information about similarity, so they can skew the results. Similar issuesappear in the domain of tracking financial transactions for detection of financialcrime [27].

126 W. Lu et al.
7 Conclusions
Our research aims to find efficient ways to judge relatedness among research pa-pers using only citation information represented in the citation graph. Our keyhypothesis is that, if two research papers are related, it should be possible to inferthis from their local neighborhoods in the citation graph. Our work can be viewedas an effort to generalize and improve upon bibliographic coupling and co-citationanalysis, that have been shown to reflect similarity and relatedness between pa-pers. The maximum flow algorithm can be used to find out how strongly eachpair of papers is connected in the citation graph; the authority metric measuresthe similarity of the local neighborhood of two papers in the citation community.From our experiments, we conclude that both metrics are promising and effectivein finding related papers for scientific research. Our algorithms can be viewed ascomplementary to the global analysis of citation graph carried out in [2].
Acknowledgements We would like to thank Dr. Steve Lawrence from NEC Research Labora-tories for providing computer science citation information and for allowing access to the CiteseerDatabase for our robot. The experiments reported in the article were carried out off-line using acitation graph built by Yuan An. We thank Joe MacInnes and Dr. Nauzer Kalyaniwalla for help-ful discussions on the analysis of variance. Bin He and Li Dong helped with the implementationof automatic term extraction and the text-based similarity measures.
References
1. ACM Special Interest Group on Hypertext, H. and the Web (2002) Hypertext 2002 Confer-ence. ACM, http://www.cs.umd.edu/ht02/ (last accessed Sept. 7, 2002)
2. An Y (2001) Characterizing and mining the citation graph of the computer science liter-ature. Technical Report CS-2001-02, Faculty of Computer Science, Dalhousie University,Halifax, Nova Scotia, Canada
3. An Y, Janssen J, Milios E (2004) Characterizing and mining the citation graph of computerscience. Knowl Inf Syst 6(6):664–678
4. Baeza-Yates R, Ribeiro-Neto B (1999) Modern information retrieval. Addision Wesley/ACM Press, New York
5. Brin S, Page L (1998) The anatomy of a large-scale hypertextual web search engine. In:Proceedings of the 7th international world wide web conference April 1998, Brisbane,Australia, pp 107–117
6. Chen C (1999) Visualising semantic spaces and author co-citation networks in digital li-braries. Inf Process Manage 35(3):401–420
7. Cortes C, Pregibon D, Volinsky C (2001) Communities of interest. In: Proceedings of the4th international conference on advances in intelligent data analysis (IDA-2001), pp 105–114
8. Davis R, Neviett W, Foltz M (2002) Information architecture. Technical Report http://www.infoarch.ai.mit.edu/ (last accessed Sept. 7, 2002), MIT AI Lab
9. Dean J, Henzinger MR (1999) Finding related web pages in the world wide web. In: Pro-ceedings of the 8th international world wide web conference (WWW8), pp 389–401
10. Diestel R (2000) Graph theory, 2nd edn. Springer, Berlin Heidelberg, New York11. Dodge M (2002), An atlas of cyberspaces: information space maps. Technical Report
http://www.cybergeography.org/atlas/info maps.html (last accessed Sept. 7, 2002)12. Faloutsos C, Lin K-I (1995) Fastmap: A fast algorithm for indexing, data-mining and visual-
ization of traditional and multimedia datasets. In: Proceedings of the 1995 ACM SIGMODinternational conference on management of data, San Jose, California, United States
13. Frantzi K, Ananiadou S, Mima H (2000) Automatic recognition of multiword terms. Int JDigit Libr 3(2):117–132
14. Garfield E (1955) Citation indexes for science. Science 122(3159):108–111

Node similarity in the citation graph 127
15. Garfield E (1972) Citation analysis as a tool in journal evaluation. Science 178(4060):471–479
16. Kaufman L, Rousseeuw P (1990) Finding groups in data: an introduction to cluster analysis.Wiley, New York
17. Kleinberg JM (1999) Authoritative sources in a hyperlinked environment. J ACM46(5):577–603
18. Kumar S, Raghavan P, Rajagopalan S, Tomkins A (1999) Extracting large scale knowledgebases from the web. In: IEEE international conference on very large databases (VLDB),Edinburgh, Scotland
19. Lawrence S, Giles CL, Bollacker K (1999) Digital libraries and autonomous citation index-ing. IEEE Comput 32(6):67–71
20. Lu W, Janssen J, Milios E, Japkowicz N (2001) Node similarity in networked informationspaces. Technical Report CS-2001-03, Faculty of Computer Science, Dalhousie University,Halifax, Nova Scotia, Canada
21. Manning C, Schuetze H (1999) Foundations of statistical natural language processing. MITPress, Cambridge, Massachusetts
22. Milios E, Zhang Y, He B, Dong L (2003), Automatic term extraction and document similar-ity in special text corpora. In: Proceedings of the 6th conference of the pacific associationfor computational linguistics (PACLing’03), Halifax, Nova Scotia, Canada, pp 275–284
23. Ng A, Zheng A, Jordan M (2001) Stable algorithms for link analysis. In: Proceedings of the24th annual internation ACM SIGIR conference on research and devlopment in informationretrieval (SIGIR)
24. Small H (1973) Co-citation in the scientific literature: A new measure of the relationshipbetween two documents. J Am Soc Inf Sci 24:265–269
25. Small H (1986) The synthesis of specialty narratives from co-citation clusters. J Am SocInf Sci 37:97–110
26. Tjaden G (2002) The knowledge enterprise in information space. Technical Reporthttp://www.ces.btc.gatech.edu/report4.html (last accessed Sept. 7, 2002), The Centre forEnterprise Systems, Georgia Institute of Technology
27. Treasury U (n.d.) Financial Crimes Enforcement Network (FinCEN). Technical Reporthttp://www.ustreas.gov/fincen/sitemap.html (accessed Oct. 25, 2001), US Government
28. van Rijsbergen C (1999) Information retrieval. http://www.dcs.gla.ac.uk/∼iain/keith/index.htm, 2nd ed., last accessed on Apr. 17, 2002
Wangzhong Lu holds a Bachelor’s degree from Hefei Uni-versity of Technology (1993), and a Master’s degree fromDalhousie University (2001), both in computer science. From1993 to 1999 he worked as a developer with China NationalComputer Software and Technical Service Corp. in Beijing.From 2001 to 2005 he held industrial positions as a seniorsoftware architect in Atlantic Canada. He is currently withDST Systems, Charlotte, NC, as a senior data architect.
128 W. Lu et al.
Jeannette Janssen’s research area is applied graph theory.She has worked on the problem of frequency assignment incellular and digital broadcasting networks. Her current inter-est is in graph theory applied to the World Wide Web andother networked information spaces. Dr. Janssen did her Mas-ter’s studies at Eindhoven University of Technology in theNetherlands, and her doctorate at Lehigh University, USA.She is currently an associate professor at Dalhousie Univer-sity, Canada.
Evangelos Milios received a diploma in electrical engi-neering from the National Technical University of Athens,and Master’s and Ph.D. degrees in electrical engineering andcomputer science from the Massachusetts Institute of Tech-nology. He held faculty positions at the University of Torontoand York University. He is currently a professor of computerscience at Dalhousie University, Canada, where he was Direc-tor of the Graduate Program. He has served on the commit-tees of the ACM Dissertation Award, and the AAAI/SIGARTDoctoral Consortium. He has worked on the interpretationof visual and range signals for landmark-based positioning,navigation and map construction in single- and multi-agentrobotics. His current research activity is centered on Net-worked Information Spaces, Web information retrieval, andaquatic robotics. He is a senior member of the IEEE.
Nathalie Japkowicz is an associate professor at the Schoolof Information Technology and Engineering of the Universityof Ottawa. She obtained her Ph.D. from Rutgers University,her M.Sc. from the University of Toronto, and her B.Sc. fromMcGill University. Prior to joining the University of Ottawa,she taught at Ohio State University and Dalhousie Univer-sity. Her area of specialization is Machine Learning and hermost recent research interests focused on the class imbalanceproblem. She made over 50 contributions in the form of jour-nal articles, conference articles, workshop articles, magazinearticles, technical reports or edited volumes.

Node similarity in the citation graph 129
Yongzheng Zhang obtained a B.E. in computer applica-tions from Southeast University, China, in 1997 and a M.S. incomputer science from Dalhousie University in 2002. From1997 to 1999 he was an instructor and undergraduate advisorat Southeast University. He also worked as a software engi-neer in Ricom Information and Telecommunications Co. Ltd.,China. He is currently a Ph.D. candidate at Dalhousie Univer-sity. His research interests are in the areas of Information Re-trieval, Machine Learning, Natural Language Processing, andWeb Mining, particularly centered on Web Document Sum-marization. A paper based on his Master’s thesis received thebest paper award at the 2003 Canadian Artificial Intelligenceconference.