ninon nsc.pdf - uwc etd
TRANSCRIPT
DETECTION OF SELECTIVE TYROSINASE INHIBITORS
FROM SOME SOUTH AFRICAN PLANT EXTRACTS OF
LAMIACEAE FAMILY
By
Ninon Geornest Eudes Ronauld ETSASSALA
A thesis submitted in partial fulfillment of the requirements for the degree of
Master of Science
Department of Chemistry
Faculty of Natural Sciences
University of the Western Cape
Supervisor: Dr. Ahmed Mohammed
Co-supervisor: Prof. Emmanuel Iwuoha
AUGUST 2016
http://etd.uwc.ac.zahttp://etd.uwc.ac.zahttp://etd.uwc.ac.za
ABSTRACT
i
ABSTRACT
Various dermatological disorders, such as formation of black pigmented patches on the surface
of the skin arise from the over-activity of tyrosinase enzyme’s degenerative action. This enzyme
is further implicated in the involvement of melanin in malignant melanoma, the most life-
threatening skin tumors. Although, synthetic products were found effective to combat this
menace, nevertheless, overtime detrimental effect on human skin is a challenge. Investigation of
natural tyrosinase inhibitors from methanol extracts of medicinal plants of Lamiaceae family
using L-tyrosine as substrate on three different complementary assays (TLC bio-autography,
spectrophotometry and cyclic voltammetry) was carried out accordingly.
The result indicated Salvia chamelaeagnea, Salvia dolomitica, Plectranthus ecklonii,
Plectranthus namaensis, and Plectranthus zuluensis, with significant zone of inhibition against
tyrosinase on TLC bio-autography, spectrophotometry result showed that extracts of
Plectranthus ecklonii (IC50 = 21.58 𝜇g/mL), Plectranthus zuluensis (IC50 = 23.99 𝜇g/mL),
Plectranthus madagascariensis (IC50 = 23.99 𝜇g/mL) and Salvia lanceolata (IC50 = 28.83)
demonstrated good anti-tyrosinase activity when compared with kojic acid (IC50 = 3.607 μg/mL).
On the other hand, cyclic voltammetry are in consonant with above results thereby supported the
nomination of some of the extracts as strong anti-tyrosinase agents.
Salvia chamelaeagnea showed strong activity in cyclic voltammetry and clear zone of inhibition
on TLC bioautography, these reasons gave us justification for further chemical study to isolate
the bioactive constituents.
Phytochemical investigation of the bioactive extract of Salvia chamelaeagnea using different
chromatographic methods including column chromatographic and semi preparative HPLC
http://etd.uwc.ac.zahttp://etd.uwc.ac.zahttp://etd.uwc.ac.za
ABSTRACT
ii
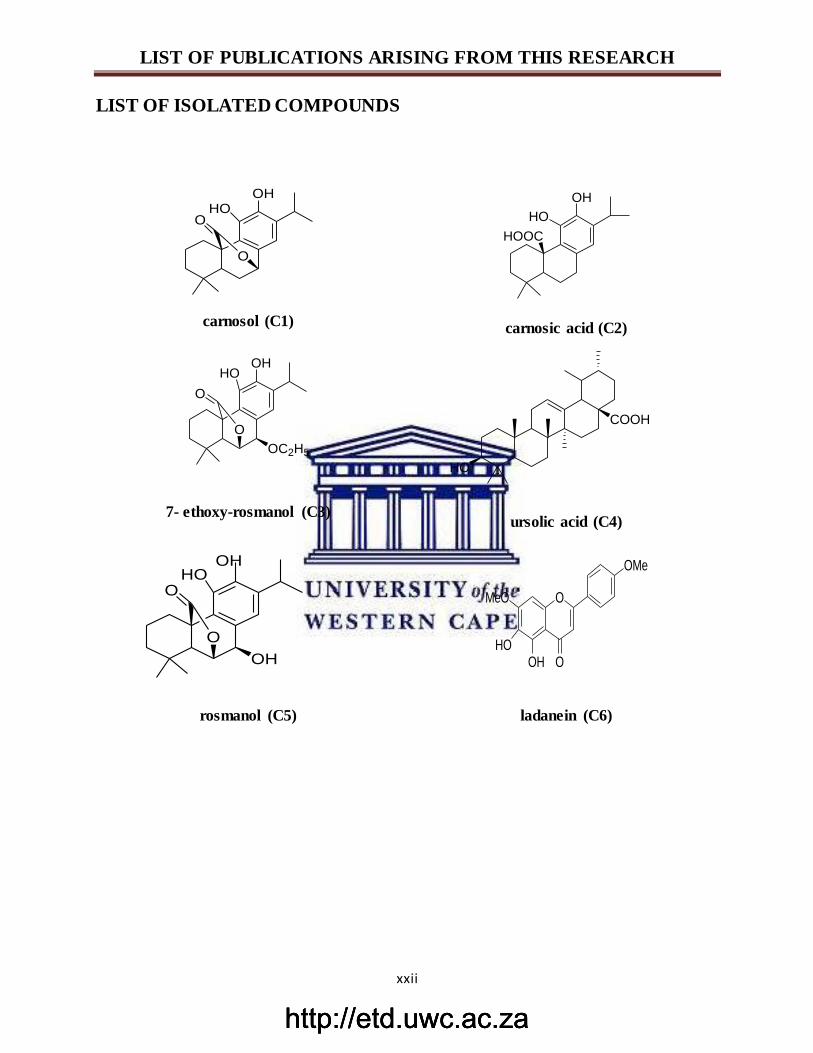
afforded six (6) known compounds viz carsonol (C1), carnosic acid (C2), 7- ethoxylrosmanol
(C3), ursolic acid (C4), rosmanol (C5) and ladanein (C6). Their chemical structures were
elucidated by analyses of spectroscopic (1H and 13C NMR) data as well as correlations with
existing literature. The methanolic extract of S. chamelaeagnea (SC) showed moderate anti-
tyrosinase (IC50 = 267.4 µg/mL) activity, total antioxidant capacities measured as: Oxygen
radicals absorbance capacity (ORAC; 14970 ± 5.16 µM TE/g), ferric-ion reducing antioxidant
power (FRAP; 9869.43 ± 7.87 µM AAE/g) and trolox equivalent absorbance capacity (TEAC;
13706.5 ± 0.95 µM TE/g). Excellent total antioxidant capacities were demonstrated by C1 and
C5 respectively as FRAP (9338.92 ± 1.72; 8622.73 ± 1.92) µM AAE/g; TEAC (16505 ± 0.86;
10641.5 ± 0.52) µM TE/g; ORAC (14550.5 ± 3.65; 14633.90 ± 3.84) µM TE/g and including the
inhibition of Fe2+ -induced lipid peroxidation (IC50 = 32.5; 30.25) µg/mL. All the compounds
except C4 are electro-active with well-defined oxidation-reduction peaks while C1 demonstrated
the highest tyrosinase inhibitory activity by strongly decreased the inhibition current with time
using cyclic voltammetry method.
The isolated compounds especially C1, C2 and C5 are well known to combat with ageing
problems and documented for their powerful activity against oxidative stress and alzheimer’s
diseases, which are ageing related symptoms. The isolation of such bioactive compounds
indicated the synergetic effect of the results of the three methods used in this thesis.
This is the first report on the evaluation of both anti-tyrosinase and total antioxidant capacities of
the isolated compounds from S. chamelaeagnea. The findings therefore can be used as
background information for exploitation of skin depigmentation and antioxidant agents from
natural source.
Keywords : Lamiaceae; tyrosinase inhibitor; cyclic voltammetry; TLC bioautography;
medicinal plants; cosmetics; antioxidant; S. chamelaeagnea.
http://etd.uwc.ac.zahttp://etd.uwc.ac.zahttp://etd.uwc.ac.za
DECLARATION
iii
DECLARATION
I, Ninon Geornest Eudes Ronauld ETSASSALA hereby declare that “Detection of Selective
Tyrosinase Inhibitors from Some South African Plant Extracts of Lamiaceae Family” is my
original work and to the best of my knowledge, it has not been submitted before for any degree
or assessment in any other University, and all the sources that I used or quoted have been
indicated and acknowledged by means of complete references.
Date…………………… Signed………………………..
http://etd.uwc.ac.zahttp://etd.uwc.ac.zahttp://etd.uwc.ac.za
ACKNOWLEDGMENTS
iv
ACKNOWLEDGEMENTS
I would like to thank my amiable Supervisor Dr. Ahmed Mohammed for his wonderful
encouragement, motivation during the period of this work. I am extremely delighted to him for
introducing me into my dreamed field of organic chemistry based on natural products for skin
anti-aging as an opportunity to rejuvenate my research career.
I would like to thank my wonderful Co-supervisor Professor Emmanuel Iwuoha for
introducing me into a very excited field of electrochemistry based on cyclic voltammetry. Again
I am very thankful for his motivation and financial support.
Special thanks to the HOD Chemistry Prof. Farouk Ameer for his academic support, and to
other staff of the Department of Chemistry, most especially, Dr. Fanelwa Ajayi, and the
Secretary, Ms Wilma Jackson. I also extend thanks to Prof. Priscilla Baker for her wonderful
encouragement, suggestion and motivations. To Dr. Tesfaye waryo for his assistance and
motivation during the course work and to Dr. Christopher Cupido, SANBI (Kirstenbosch,
South Africa) for his assistance in collection and identification of the plant species used for this
research.
I wish to express my gratitude to Dr. Olugbenga Kayode Popoola for his full assistance,
advices and for being more than a friend.
Special thanks to my colleagues Luveni Sonka, Abdulrahman Elbagory, Abobaker Ibrakaw,
Masande Yalo, Mthandazo Rondo, Mkhuseli Koki, Ndikho Nako. Above all, I give all the
glory to God for the provision of strength, wisdom towards successful completion of this work.
http://etd.uwc.ac.zahttp://etd.uwc.ac.zahttp://etd.uwc.ac.za
DEDICATION
v
DEDICATION
I would like to dedicate this dissertation to my family, especially my father Georges Etsassala
and my mother Ernestine Gayaba, who gave me their unwavering support throughout my life.
Also to my wife Grace Milounguidi, my sisters Georgea and Horcia Etsassala, friends and to
the Congolese communities.
http://etd.uwc.ac.zahttp://etd.uwc.ac.zahttp://etd.uwc.ac.za
TABLE OF CONTENTS
vi
TABLE OF CONTENTS
ABSTRACT......................................................................................................................................i
DECLARATION ............................................................................................................................ iii
ACKNOWLEDGEMENTS ............................................................................................................ iv
DEDICATION .................................................................................................................................v
TABLE OF CONTENTS................................................................................................................ vi
LIST OF FIGURES ........................................................................................................................ xi
LIST OF TABLES ........................................................................................................................ xiv
LIST OF SCHEME ...................................................................................................................... xvii
LIST OF ABBREVATIONS ...................................................................................................... xviii
LIST OF ISOLATED COMPOUNDS ........................................................................................ xxii
CHAPTER 1: INTRODUCTION ................................................................................................... 1
1.1 General overview of the use of plants as source of medicines .............................................. 1
1.2 Natural products as source of drugs ...................................................................................... 2
1.3 Cosmeceutical exploration of African medicinal plants ....................................................... 2
1.4 Historical perspective of skin pigmentation..................................................................... 4
1.5 Oxidative Stress..................................................................................................................... 6
1.6 Tyrosinase ............................................................................................................................. 7
1.7 Natural product as source of tyrosinase inhibitors ................................................................ 8
1.8 Why investigate the family Lamiaceae ................................................................................. 9
1.9 Statement of research ............................................................................................................ 9
1.10 Aims of this study ............................................................................................................. 11
1.11 Objectives of this study ..................................................................................................... 11
CHAPTER 2: A REVIEW OF SOUTH AFRICAN LAMIACEAE: TRADITIONAL,
PHYTOCHEMISTRY AND BIOLOGICAL IMPORTANCE .................................................... 13
2.1 Introduction ......................................................................................................................... 13
2.2 South African Lamiaceae family......................................................................................... 13
2.2.1 Plant Morphology: Description and distribution.............................................................. 13
2.3 Traditional and biological uses of Lamiaceae plant species ............................................... 14
2.4 Phytochemistry of Lamiaceae ............................................................................................. 16
http://etd.uwc.ac.zahttp://etd.uwc.ac.zahttp://etd.uwc.ac.za
TABLE OF CONTENTS
vii
2.5 Biological activities of Lamiaceae ...................................................................................... 26
2.5.1 Anti-tyrosinase activity .................................................................................................... 26
2.5.2 Antioxidant activities ....................................................................................................... 27
CHAPTER 3: PRELIMINARY PHYTOCHEMICAL AND BIOLOGICAL SCREENING OF
SELECTED SOUTH AFRICAN LAMIACEAE ......................................................................... 29
3.1 Introduction ......................................................................................................................... 29
3.2 Materials and methods ........................................................................................................ 30
3.2.1 Plant materials .................................................................................................................. 30
3.2.2 Preparation of plant extracts............................................................................................. 32
3.2.3 Chemical and Reagents .................................................................................................... 32
3.2.4 Apparatus ......................................................................................................................... 32
3.2.5 TLC bioautographic assay for tyrosinase inhibition ........................................................ 33
3.2.6 Tyrosinase enzyme Assay ................................................................................................ 33
3.2.7 Cyclic voltammetry measurement.................................................................................... 34
3.3 Results and Discussion........................................................................................................ 35
3.3.1 Preliminary phytochemical screening .............................................................................. 37
3.3.2 Cyclic voltammetry measurement.................................................................................... 38
3.3.3 TLC bioautographic assay for tyrosinase inhibition ........................................................ 44
3.3.4 Tyrosinase enzyme Assay ................................................................................................ 45
CHAPTER 4: ANTI-TYROSINASE AND TOTAL ANTIOXIDANT ACTIVITIES OF
ISOLATED CONSTITUENTS OF SALVIA CHAMELAEAGNEA ............................................. 48
4.1 Introduction ......................................................................................................................... 48
4.2 Background information on Salvia chamelaeagnea ........................................................... 48
4.3 CHEMICAL CHARACTERIZATION OF SALVIA CHAMELAEAGNEA
CONSTITUTUENTS................................................................................................................ 49
4.3.1 Reagents and Solvents...................................................................................................... 49
4.3.2 Chromatography ............................................................................................................... 50
4.3.2.1 Thin layer chromatography (TLC) ................................................................................ 50
4.3.2.2 Column chromatography............................................................................................... 50
4.3.2.3 Semi-preparative High Pressure Liquid Chromatography (HPLC) .............................. 50
4.3.3. Nuclear magnetic resonance (NMR) spectroscopy ......................................................... 51
4.4 Collection and identification of plant material.................................................................... 51
http://etd.uwc.ac.zahttp://etd.uwc.ac.zahttp://etd.uwc.ac.za
TABLE OF CONTENTS
viii
4.5 Extraction and Fractionation of total extract ....................................................................... 51
4.6 Isolation of pure compounds ............................................................................................... 55
4.6.1 Isolation of compound C1 – Column chromatography of main fraction SC-VII ............ 55
4.6.2 Isolation of compound C2 – Column chromatography of main fraction SC-VIII ........... 57
4.6.3 Isolation of compound C3 Column chromatography of main fraction SC-VIII-6........... 58
4.6.4 Isolation of compound C4 Column chromatography of main fraction SC-VIII-2........... 59
4.6.5 Isolation of compound C5 Column chromatography of main fraction SC-VIII-5........... 60
4.6.6 Isolation of compound C6 Column chromatography of main fraction SC-XIV.............. 61
4.7 BIOLOGICAL CHARACTERIZATION OF ISOLATED COMPOUNDS ...................... 65
4.7.1 General experimental procedure for biological assays .................................................... 65
4.7.1.1 Reagents ........................................................................................................................ 65
4.7.2 Tyrosinase enzyme assay ................................................................................................. 65
4.7.3 Cyclic voltammetry measurement.................................................................................... 66
4.7.4 Total Antioxidant capacities assays ................................................................................. 67
4.7.4.1 Ferric- ion reducing antioxidant power (FRAP) assay................................................... 67
4.7.4.2 Automated oxygen radicals absorbance capacity (ORAC) assay ................................. 67
4.7.4.3 Trolox equivalent absorbance capacity (TEAC) assay ................................................. 68
4.7.4.4 Inhibition of Fe (II) - Induced Microsomal Lipid Peroxidation assay .......................... 69
4.8 Chemical characterization: Results and discussion............................................................. 70
4.9 Biological evaluations: Results and discussion................................................................... 92
4.9.1 Evaluating the anti- tyrosinase activity of the isolated compounds .................................. 92
4.9.2 Cyclic voltammetry (CV) measurement .......................................................................... 94
4.9.2.1 Cyclic voltammetry measurement of redox peaks of isolated compounds ................... 94
4.9.2.2 Cyclic voltammetry measurement of tyrosinase inhibitory activity ............................. 97
4.9.3 Evaluating the FRAP and TEAC activity of the isolated compounds ........................... 100
4.9.4 Evaluating the ORAC activities of the isolated compounds .......................................... 101
4.9.5 Evaluating the Fe2+-induced anti-lipid peroxidation activity of the isolated compounds
................................................................................................................................................. 102
CHAPTER 5: CONCLUSION AND RECOMMENDATIONS ................................................ 105
References ................................................................................................................................... 109
http://etd.uwc.ac.zahttp://etd.uwc.ac.zahttp://etd.uwc.ac.za
LIST OF FIGURES
xi
LIST OF FIGURES
Figure 1.1: Damage caused by UV to the structural elements of the skin ……………………… 5
Figure 1.2: Effects of UV radiation on human skin …………………………………………….. 5
Figure 1.3: Effect of skin pigmentation ………………………………………………………… 6
Figure 1.4: Monophenolase and diphenolase cycle of tyrosinase………………………………. 8
Figure 3.1: TLC silica gel of the phytochemical screening of the plant species, solvent system
DCM:MeOH (9.5:05); under UV (254 nm; A), and spraying with H2SO4/ vanillin then heated
(B) ……………………………………………………………………………………………… 37
Figure 3.2: CVs recorded at 50 mV/ s in wide scan range (A), and at 25 mV/ s at the narrow
scan range (B) for the reaction mixture of tyrosine and tyrosinase in 50 mM PBS (pH 6.5) at
different times. Curve (a) 0 min, curve (b) 5 min, curve (c) 10 min, curve (d) 20 min, and then
curve (e) 30 min ………………………………………………………………………………... 39
Figure 3.3: CVs recorded at 25 mV/ s for the reaction mixtures during negative control (A) and
positive control (B) experiments, first for 50 mM PBS (pH 6.5) (curve a) and then after
consecutive addition of DMSO (left, curve b) or kojic acid (right, curve b), tyrosinase (curve c),
and tyrosine (0 min – curve d, 30 min- curve e) ………………………………………………. 40
Figure 3.4: Illustration of the effect of each group on inhibition of tyrosinase activity ………. 41
Figure 3.5: TLC silica gel bioautography of all the extracts and kojic acid (A), the active
extracts and kojic acid (B), solvent system Hex:EtOAc (9:1) and DCM:MeOH (97:3)
respectively …………………………………………………………………………………….. 45
Figure 4.1: Salvia chamelaeagnea description (A), and distribution along South Western area of
the Cape of Good Hope ………………………………………………………………………… 49
Figure 4.2: TLC silica gel of the collected fractions of SC, solvent system Hex:EtOAc (7:3) and
DCM:MeOH (9:1) ……………………………………………………………………………... 53
Figure 4.3: TLC silica gel profile of combined fractions under UV (254 nm; A & B), and
After spraying with H2SO4/ vanillin and then heated (C & D) ………………………………… 55
TLC plate (A & C) of combined fractions (I-XV) was developed using solvent system D.
TLC plate (B & D) of combined fractions (I-XV) was developed using solvent system C.
Figure 4.4: TLC silica gel of combined fractions of SC-VII, solvent system DCM:MeOH
(9.5:0.5) ………………………………………………………………………………………… 56
http://etd.uwc.ac.zahttp://etd.uwc.ac.zahttp://etd.uwc.ac.za
LIST OF FIGURES
xii
Figure 4.5: TLC silica gel of SC-VII-5 (C1), solvent system silica gel plate; solvent system
DCM:MeOH (9.5:05) ………………………………………………………………………….. 57
Figure 4.6: TLC silica gel of combined fractions of SC-VIII, solvent system DCM:MeOH
(9.5:05) …………………………………………………………………………………………. 58
Figure 4.7: HPLC chromatogram of C3………………………………………………………. 59
Figure 4.8: TLC silica gel of SC-VIII-2-17-A (Fig. 4.8 A), solvent system DCM:MeOH
(9.5:0.5) and HPLC chromatogram of C4 (Fig. 4.8B) …………………………………………. 60
Figure 4.9: HPLC chromatogram of C5 ………………………………………………………. 61
Figure 4.10: TLC silica gel of combined fractions of SC- XIV, solvent system DCM:MeOH
(9:1) …………………………………………………………………………………………….. 62
Figure 4.11: TLC silica gel of SC-XIV-5-2 (Fig. 4.11 A, solvent system DCM:MeOH (9.5:05)
and HPLC chromatogram of C6 (Fig. 11.B) …………………………………………………… 63
Figure 4.12: Chemical structure of carnosol ………………………………………………….. 70
Figure: 4.13: 1H NMR spectrum of compound 1…………………………………………….... 71
Figure: 4.14: 13C NMR spectrum of compound 1 …………………………………………….. 71
Figure 4.15: DEPT NMR spectrum of compound 1…………………………………………... 72
Figure 4.16: HMBC NMR spectrum of compound 1…………………………………………. 72
Figure 4.17: HMQC NMR spectrum of compound 1…………………………………………. 73
Figure 4.18: COSY NMR spectrum of compound 1………………………………………...... 73
Figure 4.19: Chemical structure of carnosic acid ……………………………………………... 74
Figure 4.20: 1H NMR spectrum of compound 2………………………………………………. 75
Figure 4.21: 13C NMR spectrum of compound 2……………………………………………… 75
Figure 4.22: DEPT NMR spectrum of compound 2…………………………………………... 76
Figure 4.23: HMQC spectrum of compound 2………………………………………………... 76
http://etd.uwc.ac.zahttp://etd.uwc.ac.zahttp://etd.uwc.ac.za
LIST OF FIGURES
xiii
Figure 4.24: COSY spectrum of compound 2………………………………………………… 77
Figure 4.25: Chemical structure of rosmanol …………………………………………………. 78
Figure 4.26: 1H NMR spectrum of compound 5……………………………………………… 79
Figure 4.27: 13C NMR spectrum of compound 5…………………………………………….. 79
Figure 4.28: DEPT spectrum of compound 5…………………………………………………. 80
Figure 4.29: Chemical structure of 7-ethoxyrosmanol ………………………………………... 81
Figure 4.30: 1H NMR spectrum of compound 3………………………………………………. 82
Figure 4.31: 13C NMR spectrum of compound 5……………………………………………… 82
Figure 4.32: Chemical structure of ursolic acid ……………………………………………….. 83
Figure 4.33: 1H NMR spectrum of compound 4 ………………………………………………. 84
Figure 4.34: 13C NMR spectrum of compound 4……………………………………………… 84
Figure 4.35: 1H NMR spectrum of compound 4………………………………………………. 85
Figure 4.36: Chemical structure of Ladanein …………………………………………………. 86
Figure 4.37: 1H NMR spectrum of compound 6………………………………………………. 87
Figure 4.38: 13C NMR spectrum of compound 6……………………………………………… 87
Figure 4.39: DEPT spectrum of compound 6…………………………………………………. 88
Figure 4.40: HMBC spectrum of compound 6………………………………………………... 88
Figure 4.41: HMQC spectrum of compound 6………………………………………………... 89
Figure 4.42: COSY spectrum of compound 6………………………………………………… 89
Figure 4.43 Effects of S. chamelaeagnea constituents on inhibition of tyrosinase enzyme …... 93
http://etd.uwc.ac.zahttp://etd.uwc.ac.zahttp://etd.uwc.ac.za
LIST OF FIGURES
xiv
Figure 4.44: CVs recorded at 50 mV/ s in broad scan range from -1300 to 1300 mV for 1 mg/L
of each compounds in phosphate buffer (pH 6.5) …………………………………………….. 96
Figure 4.45: CVs recorded at 25 mV/ s in wide scan range from -200 to 200 mV for each
isolated compounds in PBS for the reaction mixture of tyrosine and tyrosinase in 50 mM PBS
(pH 6.5) at different times ……………………………………………………………………... 98
Figure 4.46: Effect of S. chamelaeagnea constituents on inhibition of tyrosinase activity…… 99
Figure 4.47: Effects of S. chamelaeagnea constituents on inhibition of Fe2+-induced microsomal
lipid peroxidation ……………………………………………………………………………... 103
http://etd.uwc.ac.zahttp://etd.uwc.ac.zahttp://etd.uwc.ac.za
LIST OF TABLES
xiv
LIST OF TABLES
Table 2.1: Medicinal uses and biological activities reported on South African plant species of
Lamiaceae ……………………………………………………………………………………… 15
Table 2.2: Selected secondary metabolites with anti-ageing properties ………………………. 18
Table 2.2.1: Monoterpenes …………………………………………………………………….. 18
Table 2.2.2: Sesquiterpene …………………………………………………………………….. 18
Table 2.2.3: Abiatene diterpenoid …………………………………………………………….. 19
Table 2.2.4: Labdane diterpenoids ……………………………………………………………. 19
Table 2.2.5: Phenolic diterpenes ………………………………………………………………. 21
Table 2.2.6: Triterpenes ……………………………………………………………………….. 23
Table 2.2.7: Phenolic acid …………………………………………………………………….. 24
Table 2.2.8: Flavones ………………………………………………………………………….. 24
Table 2.2.9: Phenyl propenoid ………………………………………………………………… 26
Table 2.3: Plant species with tyrosinase inhibitory activities …………………………………. 27
Table 3.1: List of the collected plant species ………………………………………………….. 31
Table 3.2: Percentage yield of the plant extracts ……………………………………………... 36
Table 3.3: Inhibition based on charge of the extracts, positive and negative controls at 0 and 30
min in the presence of tyrosinase and tyrosine obtained by integrating the anodic area from the
corresponding CVs ……………………………………………………………………………... 43
Table 3.4: Screening of plant extracts for tyrosinase inhibitory activities …………………….. 46
Table 4.1: TLC solvent systems ……………………………………………………………….. 50
Table 4.2: Fractionation of the extract of S. chamelaeagnea (SC) ……………………………. 52
Table 4.3: Fractions obtained upon fractionation of total extract of S. chamelaeagnea ………. 54
Table 4.4: Fractions grouped from the column ………………………………………………... 56
Table 4.5: Fractions grouped from the column…………………………………………...…… 57
Table 4.6: Fractions grouped from the column………………………………………………... 61
Table 4.7: 13C NMR data of C1, C2, C3 and C5 compared to the NMR data from the literature
…………………………………………………………………………………………………... 90
Table 4.8: 1H NMR data of C1, C2, C3 and C5 compared to the NMR data from the literature
…………………………………………………………………………………………………... 91
Table 4.9: Percentage of tyrosinase inhibition and IC50 of S. chamelaeagnea constituents …... 93
http://etd.uwc.ac.zahttp://etd.uwc.ac.zahttp://etd.uwc.ac.za
LIST OF TABLES
xv
Table 4.10: Anodic peak current of S. chamelaeagnea constituents ………………………….. 95
Table 4.11: Inhibition current in the presence of the compounds, positive and negative controls 0
and 30 min after addition of tyrosinase and tyrosine based on the anodic process at 131 mV from
the corresponding CVs ………………………………………………………………………… 97
Table 4.12: Inhibition based on charge of the compounds, positive and negative controls at 0 and
30 min in the presence of tyrosinase and tyrosine obtained by integrating the anodic area from
the corresponding CVs ………………………………………………………………………... 100
Table 4.13: FRAP and TEAC antioxidant capacities of S. chamelaeagnea constituents ….… 101
Table 4.14: Oxygen radical’s antioxidant capacity of S. chamelaeagnea constituents ……… 102
Table 4.15: Lipid peroxidation of S. chamelaeagnea constituents …………………………... 103
Table 5.1: List of the isolated compounds from S. chamelaeagnea…………………………. 106
http://etd.uwc.ac.zahttp://etd.uwc.ac.zahttp://etd.uwc.ac.za
LIST OF SCHEME
xvii
LIST OF SCHEME
Scheme 4.1: A flow diagram of experimental procedure for the isolation of compounds from S. chamelaeagnea………………………………………………………………………………… 64
http://etd.uwc.ac.zahttp://etd.uwc.ac.zahttp://etd.uwc.ac.za
LIST OF ABBREVATIONS
xviii
LIST OF ABBREVATIONS
NMR Nuclear magnetic resonance
13C-NMR Carbon-13 nuclear magnetic resonance
1H-NMR Proton nuclear magnetic resonance
1D-NMR One-dimensional nuclear magnetic resonance
2D NMR Two-dimensional nuclear magnetic resonance
HMBC Heteronuclear multiple bond correlation
HMQC Heteronuclear multiple quantum coherence
COSY Correlation spectroscopy
CDCl3 Deuterated chloroform
DMSO Dimethyl sulfoxide
EtOAc Ethyl acetate
H2SO4Sulphuric acid
MeOH Methanol
KCl Potassium chloride
ABTS 2, 2- Azino-bis (3-ethylbenzo thiazoline-6-sulfonic acid) diammoniun salt
AAPH 2,2- Azibis (2-methylpropionamidine) dihydrochloride, perchloric acid
FRAP Ferric-ion reducing antioxidant power
http://etd.uwc.ac.zahttp://etd.uwc.ac.zahttp://etd.uwc.ac.za
LIST OF ABBREVATIONS
xix
ORAC Oxygen radicals absorbance capacity
TLC Thin layer chromatography
TEAC Trolox equivalent absorbance capacity
TE/g Trolox equilalent per gram
TCA Trichloroacetic acid
Trolox 6-Hydroxyl-2,5,7,8-tetramethylchroman-2-carboxylic acid
TPTZ (2,4,6-tri[2-pyridyl]-s-triazine, Iron (III) chloride hexahydrate
UV Ultraviolet
BHT Butylated hydroxytoluene
AAE/g Ascorbic acid per gram
DIW De-ionized water
DNA Deoxyribonucleic acid
ECM Extra cellular matrix
EDTA Ethylenediaminetetraacetic acid
EGCG Epigallocatechingallate
Fig Figure
g Gram
http://etd.uwc.ac.zahttp://etd.uwc.ac.zahttp://etd.uwc.ac.za
LIST OF ABBREVATIONS
xx
L Liter
mg Milligram
min Minute
HPLC High performance liquid chromatography
ROS Reactive oxygen specie
SANBI South African National Biodiversity Institute
SD Standard deviation
Spp Species
IC50 Half maximal inhibitory concentration
http://etd.uwc.ac.zahttp://etd.uwc.ac.zahttp://etd.uwc.ac.za
LIST OF PUBLICATIONS ARISING FROM THIS RESEARCH
xxii
LIST OF ISOLATED COMPOUNDS
OH
O
OHO
carnosol (C1)
OH
HO
HOOC
carnosic acid (C2) OH
HO
O
OC2H5
O
7- ethoxy-rosmanol (C3)
ursolic acid (C4)
O
OHHO
MeO
OMe
O
rosmanol (C5) ladanein (C6)
COOH
HO
OH
O
OH
OHO
http://etd.uwc.ac.zahttp://etd.uwc.ac.zahttp://etd.uwc.ac.za
LIST OF PUBLICATIONS ARISING FROM THIS RESEARCH
xxiii
1. Ninon G.E.R. Etsassala, Tesfaye Waryo, Christopher N. Cupido, Olugbenga K. Popoola,
Emmanuel I. Iwuoha, and Ahmed A. Hussein. Screening of Selected South African
Lamiaceae Plant Species against Tyrosinase using Three Complementary Assays.
Manuscript submitted
2. Ninon G.E.R. Etsassala, Tesfaye Waryo, Christopher N. Cupido, Olugbenga K. Popoola,
Emmanuel I. Iwuoha, and Ahmed A. Hussein. Antityrosinase and total antioxidant
capacities of Salvia chamelaeaegnea constituents.
Manuscript in preparation
http://etd.uwc.ac.zahttp://etd.uwc.ac.zahttp://etd.uwc.ac.za
CHAPTER 1: INTRODUCTION
1
CHAPTER 1: INTRODUCTION
1.1 General overview of the use of plants as source of medicines
Plants have been used as a source of medicine since time immemorial for the purpose of curing
numerous human afflictions (Fernnell, et al., 2004). The practice of using herbal medicine at
early stage was primitively considered either an option for the less privileged or low-income
earners (Rates, 2001). The use of folk medicine in developing countries has been a common
practice and people have been able to treat ailments using plants within their respective locality
in the mode of decoction and infusion (Rojas, et al., 2006). It has been estimated that up to 80 %
of the population living in Africa uses traditional medicine as part of their primary healthcare
system (Ekor, 2014). The use of traditional herbal remedies plays a vital role in South Africa,
and forms the backbone of rural communities (Coopoosamy & Naidoo, 2013). Up to 60 % of the
populations of the rural area in South Africa consult an approximation of 200,000 traditional
healers. This huge turnout was ascribed to affordability, accessibility and most importantly
freedom of expression of personal health status unlike orthodox medicines (Taylor, et al., 2001).
Report shown that out of 30,000 species of higher plants present in South Africa, 10 % of these
species have been found useful in traditional medicine around the country to treat different kind
of disease such as cough, diarrhea, headaches, heart related problems, inflammation and
prevention of abortion (Thring & Weitz, 2006). From the aforementioned, the beneficial usage of
traditional medicine is receiving global icon of recognition compared to the synthetic drugs due
to environmental friendly nature of the former (Iniaghe, et al., 2010).
Medicinal plants contain a wide range of substances that can promote health and alleviate disease
burden (Prajapati, et al., 2011). They have curative properties due to the presence of numerous
bioactive constituents termed secondary metabolites (Karthikeyan & Balasubramanian, 2014).
http://etd.uwc.ac.zahttp://etd.uwc.ac.zahttp://etd.uwc.ac.za
CHAPTER 1: INTRODUCTION
2
These secondary metabolites range from terpenoids, phenolics, flavonoids, tannins and alkaloids
which are of more beneficial effect to human than the plant itself (Shaukat, et al., 2013).
1.2 Natural products as source of drugs
Drugs derived from plants represent one of the most important sources of new and safe
therapeutic agents. Many medicinal plants contain bioactive compounds that serve as precursors
to synthesized drugs (Karthikeyan & Balasubramanian, 2014). Drugs derived from natural
products have assumed greater value in recent days, due to the tremendous potential they offer in
the formulation of new drugs, which may protect humankind against many diseases (Balunas &
Kinghorn, 2005; Khalid, et al., 2013). It is estimated that 25-50 % of modern drugs are derived
from plant origin with an approximation of 50 % of new drugs introduced in this time being has
a natural product origin (Kingston, 2011). In Germany, 50 % of phytomedicinal products were
sold based on the medical prescription (Rates, 2001; Bussmann, et al., 2010). Further evidence of
the importance of natural products is provided by the fact that almost half of the world’s 25 best-
selling pharmaceuticals in 1991 were either natural products or their analogues (Ashour, et al.,
2013). Nowadays, plant derived drugs are predominantly important to the world population
because of their safety profile (Vinha, et al., 2012; Nag, et al., 2013).
1.3 Cosmeceutical exploration of African medicinal plants
Traditional herbal medicines provide a very interesting source of potential new drugs and skin-
care products (Kiken & Cohen, 2002). There are innumerable South African plants that have
wide application in cosmetic industry as additives to shampoo, shaving, skin care creams, skin
disorders, treatment of burns and skin depigmenting agents (Lall & Kishore, 2014).
Egyptians were the first since the ancient time to use herbal medicine such as the whipped
ostrich eggs, olive oil, and resin mixed with milk for treating various skin ailments. Another
http://etd.uwc.ac.zahttp://etd.uwc.ac.zahttp://etd.uwc.ac.za
CHAPTER 1: INTRODUCTION
3
notable trend in the history of African medicinal plants is the usage of Eclipta prostrate
commonly known as false daisy in Egypt as the fresh juice of the plant and applied directly to the
scalp, and it is people’s believed to blacken the hair and beard (Lall & Kishore, 2014).
In Rwanda, the purpose of lightening the skin using plants is a common practice, especially
during the major ceremonies such as marriage. The leaves of numerous herbal plants have been
used by Rwandese to treat skin disease, hyperpigmentation, leprosy, eczema and skin mycosis
(Kamagaju, et al., 2013).
The leaves of the plant species of Combretaceae (Anogeissus leiocarpus, Anogeissus schimperi
and Conocarpus leiocarpus) are used in Nigeria in the treatment of skin diseases. Plumbago
zeylanica (Plumbaginaceae), Artemisia absinthium (Asteraceae), Artemisia herba-alba
(Asteraceae) are extremely popular throughout Africa and Asia as a remedy for parasitic skin
diseases, especially leprosy, scabies, acne vulgaris, sores and leg ulcers (Dweck, 1996). Other
medicinal plants with significant recognition as anti hyperpigmenting agents are Aloe species
(Xanthorrhoeaceae), Cassipourea malosana (Rhizophoraceae), Sideroxylon inerme (Sapotaceae)
(Van Wyk & Gericke, 2000; Momtaz, et al., 2008).
There are numerous popular South African plants such as Aloe ferox Mill (Bitter Aloe:
Xanthorrhoeaceae), Aspalathus linearis (Rooibos: Fabaceae), Calodendrum capense L.f. Thunb.
(Cape Chestnut: Rutaceae), Cyclopia intermedia E. Mey (Honeybush: Fabaceae), Sideroxylon
inerme L. (White milkwood: Sapotaceae) and Salvia stenophylla Burch. Ex Benth (Blue
mountain sage: Lamiaceae) which are frequently used in various skin creams for slowing down
aging process and other skin related ailments (Lall & Kishore, 2014).
http://etd.uwc.ac.zahttp://etd.uwc.ac.zahttp://etd.uwc.ac.za
CHAPTER 1: INTRODUCTION
4
1.4 Historical perspective of skin pigmentation
Skin is the largest organ of the human body, accounting for about 15 % of the total adult body
weight (Kanitakis, 2002). It serves as an important environmental interface that provides a
protective envelope which is crucial for homeostasis (Chompo, et al., 2012). The structure of the
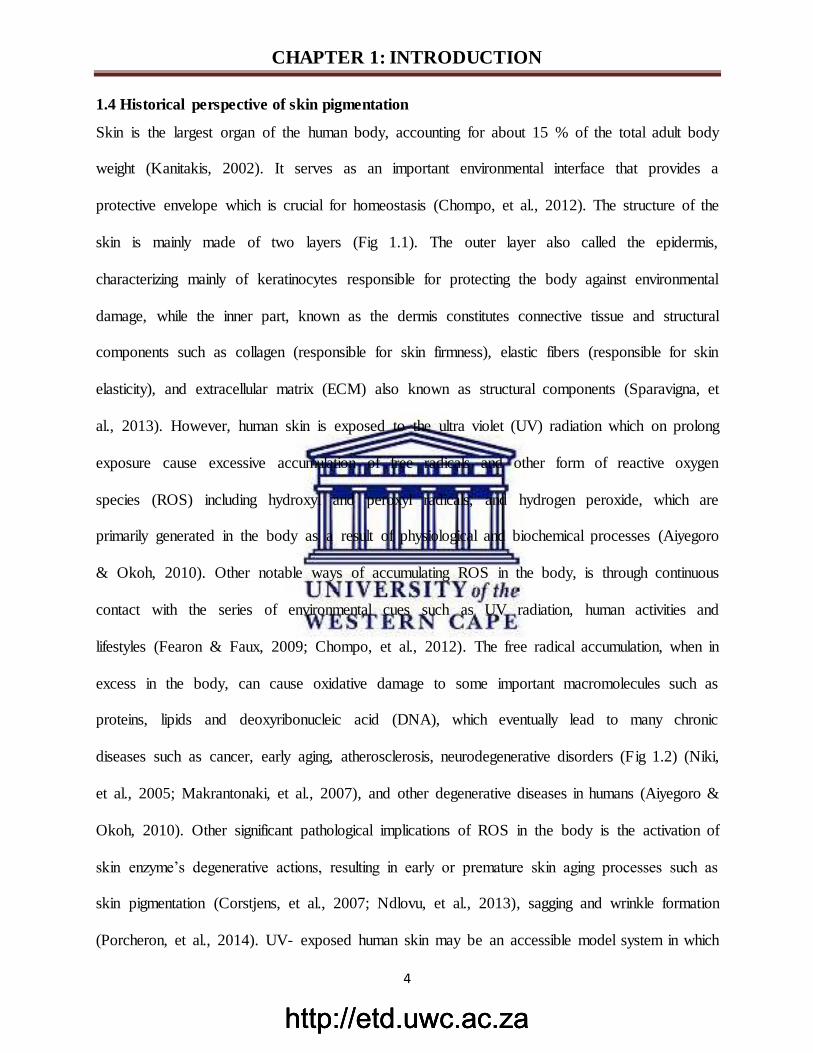
skin is mainly made of two layers (Fig 1.1). The outer layer also called the epidermis,
characterizing mainly of keratinocytes responsible for protecting the body against environmental
damage, while the inner part, known as the dermis constitutes connective tissue and structural
components such as collagen (responsible for skin firmness), elastic fibers (responsible for skin
elasticity), and extracellular matrix (ECM) also known as structural components (Sparavigna, et
al., 2013). However, human skin is exposed to the ultra violet (UV) radiation which on prolong
exposure cause excessive accumulation of free radicals and other form of reactive oxygen
species (ROS) including hydroxyl and peroxyl radicals, and hydrogen peroxide, which are
primarily generated in the body as a result of physiological and biochemical processes (Aiyegoro
& Okoh, 2010). Other notable ways of accumulating ROS in the body, is through continuous
contact with the series of environmental cues such as UV radiation, human activities and
lifestyles (Fearon & Faux, 2009; Chompo, et al., 2012). The free radical accumulation, when in
excess in the body, can cause oxidative damage to some important macromolecules such as
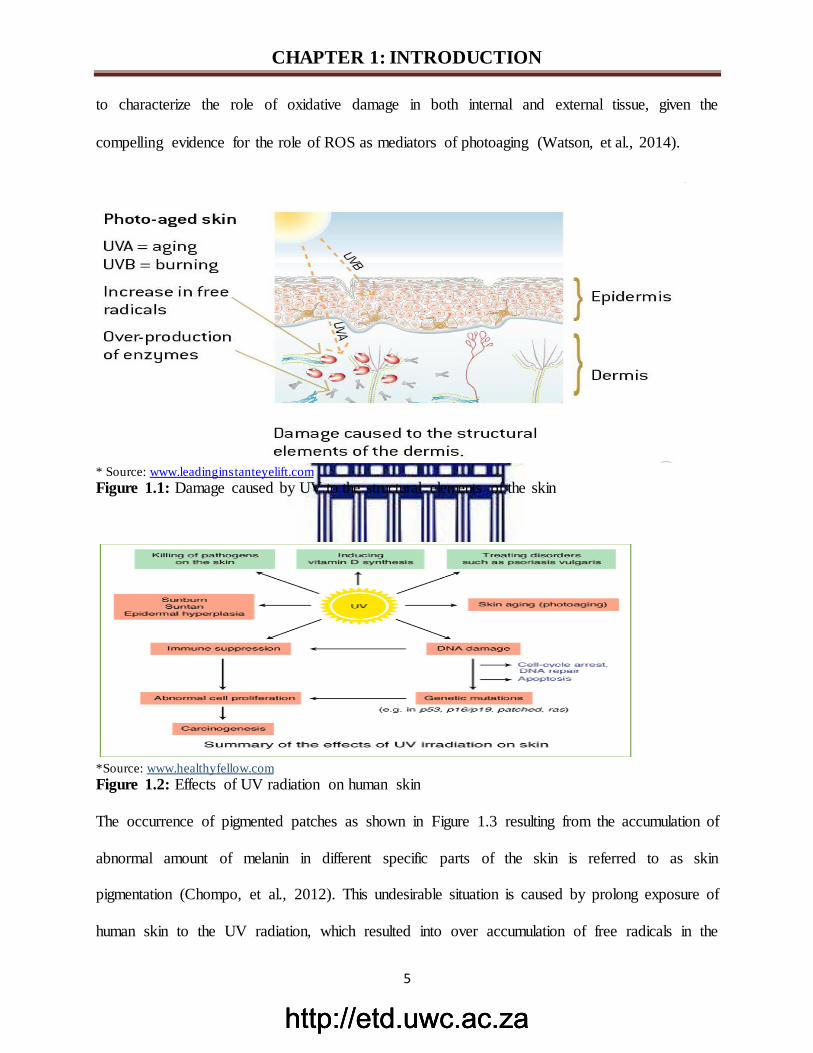
proteins, lipids and deoxyribonucleic acid (DNA), which eventually lead to many chronic
diseases such as cancer, early aging, atherosclerosis, neurodegenerative disorders (Fig 1.2) (Niki,
et al., 2005; Makrantonaki, et al., 2007), and other degenerative diseases in humans (Aiyegoro &
Okoh, 2010). Other significant pathological implications of ROS in the body is the activation of
skin enzyme’s degenerative actions, resulting in early or premature skin aging processes such as
skin pigmentation (Corstjens, et al., 2007; Ndlovu, et al., 2013), sagging and wrinkle formation
(Porcheron, et al., 2014). UV- exposed human skin may be an accessible model system in which
http://etd.uwc.ac.zahttp://etd.uwc.ac.zahttp://etd.uwc.ac.za
CHAPTER 1: INTRODUCTION
5
to characterize the role of oxidative damage in both internal and external tissue, given the
compelling evidence for the role of ROS as mediators of photoaging (Watson, et al., 2014).
* Source: www.leadinginstanteyelift.com
Figure 1.1: Damage caused by UV to the structural elements of the skin
*Source: www.healthyfellow.com
Figure 1.2: Effects of UV radiation on human skin
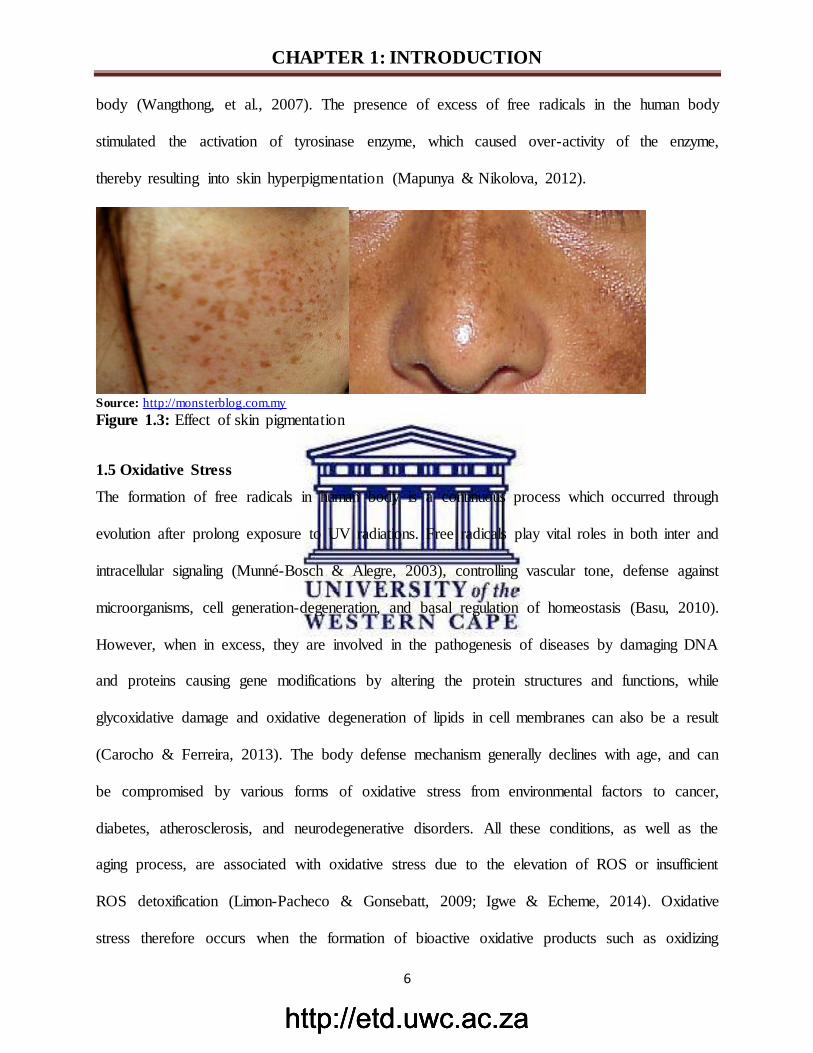
The occurrence of pigmented patches as shown in Figure 1.3 resulting from the accumulation of
abnormal amount of melanin in different specific parts of the skin is referred to as skin
pigmentation (Chompo, et al., 2012). This undesirable situation is caused by prolong exposure of
human skin to the UV radiation, which resulted into over accumulation of free radicals in the
http://etd.uwc.ac.zahttp://etd.uwc.ac.zahttp://etd.uwc.ac.za
CHAPTER 1: INTRODUCTION
6
body (Wangthong, et al., 2007). The presence of excess of free radicals in the human body
stimulated the activation of tyrosinase enzyme, which caused over-activity of the enzyme,
thereby resulting into skin hyperpigmentation (Mapunya & Nikolova, 2012).
Source: http://monsterblog.com.my
Figure 1.3: Effect of skin pigmentation
1.5 Oxidative Stress
The formation of free radicals in human body is a continuous process which occurred through
evolution after prolong exposure to UV radiations. Free radicals play vital roles in both inter and
intracellular signaling (Munné-Bosch & Alegre, 2003), controlling vascular tone, defense against
microorganisms, cell generation-degeneration, and basal regulation of homeostasis (Basu, 2010).
However, when in excess, they are involved in the pathogenesis of diseases by damaging DNA
and proteins causing gene modifications by altering the protein structures and functions, while
glycoxidative damage and oxidative degeneration of lipids in cell membranes can also be a result
(Carocho & Ferreira, 2013). The body defense mechanism generally declines with age, and can
be compromised by various forms of oxidative stress from environmental factors to cancer,
diabetes, atherosclerosis, and neurodegenerative disorders. All these conditions, as well as the
aging process, are associated with oxidative stress due to the elevation of ROS or insufficient
ROS detoxification (Limon-Pacheco & Gonsebatt, 2009; Igwe & Echeme, 2014). Oxidative
stress therefore occurs when the formation of bioactive oxidative products such as oxidizing
http://etd.uwc.ac.zahttp://etd.uwc.ac.zahttp://etd.uwc.ac.za
CHAPTER 1: INTRODUCTION
7
agents, free radicals and reactive oxygen species, greatly overwhelms the capacity of the
endogenous cellular antioxidant defense system, thus leading to potential damage of the cells and
organs and to the progression of degenerative diseases in humans (Schrader & Fahimi, 2006;
Basu, 2010).
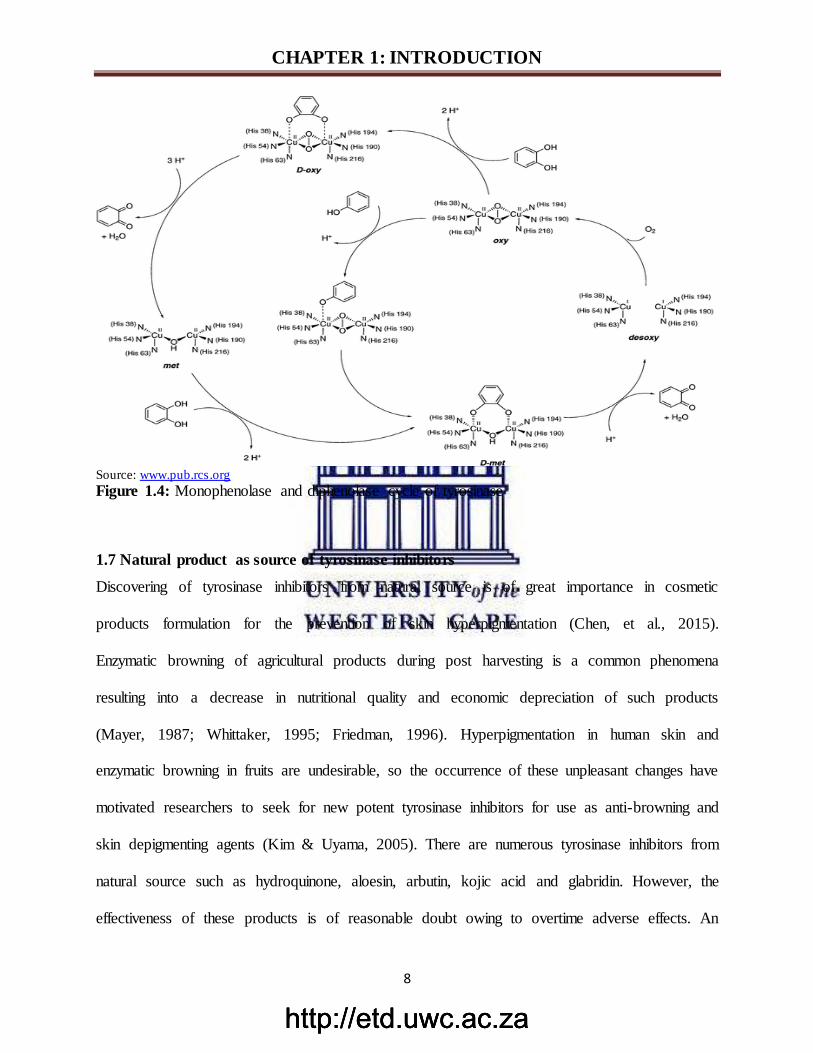
1.6 Tyrosinase
Tyrosinase is a copper-containing enzyme present in animal, plant and human tissues. It
catalyzes two distinct reactions using molecular oxygen (O2): hydroxylation of tyrosine to 3,4 –
dihydroxyphenylalamine (DOPA) by monophenolase action and oxidation of DOPA to DOPA-
quinone by diphenolase action (Figure 1.4), which is considered as rate-limiting enzyme for
controlling the production of melanin pigment that plays a vital role as a photo-protective agent
against the harmful effects of UV radiation thereby absorbing UV light and removing reactive
oxygen species (Summers, 2006; Mapunya & Nikolova, 2012). Melanin is produced naturally
during a physiological process called melanogenesis by specific cells shown as melanocytes,
which are distributed in the basal layer of the dermis (Baurin, et al., 2002).
In food industry, tyrosinase is a very important enzyme in controlling the quality of foods, fruits
and vegetables. It catalyzes the oxidation of phenolic compounds to the corresponding quinones
responsible for the browning of fruits and vegetables during post harvesting (Huang, et al.,
2006).
http://etd.uwc.ac.zahttp://etd.uwc.ac.zahttp://etd.uwc.ac.za
CHAPTER 1: INTRODUCTION
8
Source: www.pub.rcs.org Figure 1.4: Monophenolase and diphenolase cycle of tyrosinase
1.7 Natural product as source of tyrosinase inhibitors
Discovering of tyrosinase inhibitors from natural source is of great importance in cosmetic
products formulation for the prevention of skin hyperpigmentation (Chen, et al., 2015).
Enzymatic browning of agricultural products during post harvesting is a common phenomena
resulting into a decrease in nutritional quality and economic depreciation of such products
(Mayer, 1987; Whittaker, 1995; Friedman, 1996). Hyperpigmentation in human skin and
enzymatic browning in fruits are undesirable, so the occurrence of these unpleasant changes have
motivated researchers to seek for new potent tyrosinase inhibitors for use as anti-browning and
skin depigmenting agents (Kim & Uyama, 2005). There are numerous tyrosinase inhibitors from
natural source such as hydroquinone, aloesin, arbutin, kojic acid and glabridin. However, the
effectiveness of these products is of reasonable doubt owing to overtime adverse effects. An
http://etd.uwc.ac.zahttp://etd.uwc.ac.zahttp://etd.uwc.ac.za
CHAPTER 1: INTRODUCTION
9
example for this claim is carcinogenic effect demonstrated by kojic acid (Fuyuno, 2004), skin
irritation, mutagenic effects to mammalian cells and cytotoxic to melanocytes demonstrated by
hydroquinone (Curto, et al., 1999; Parvez, et al., 2006), and poor skin penetrations and stability
demonstrated by aloesin and glabridin (Hermanns, et al., 2000). Thus it is in great need to seek
for new potent tyrosinase inhibitors from natural source with reasonable human safety limits.
1.8 Why investigate the family Lamiaceae
The family Lamiaceae comprises approximately 980 species in Southern Africa which are
mainly found in the Mediterranean, Central Asia and Sub-Sahara Africa regions, and display
enormous morphological diversity (Klopper, et al., 2006). There are widely distributed in South
Africa and comprises about 255 species assigned to 35 genera (Szentmihályi, et al., 2004;
Strelitzia, 2013). Most of these plants possess aromatic sweet smell and widely used as culinary
herbs and skin-care products (Lee, et al., 2011). The South African plants species of this family
(e.g. Salvia) are used locally in the treatment of colds, coughs and bronchial infections.
Industrially, these plants are widely employed as food additives, cosmetic formulations,
aromatherapy and insecticides (Kamatou, et al., 2008). Tetradinia riparia has also been used
traditionally in the treatment of coughs, dropsy, diarrhea, fever, headaches, malaria and
toothaches (Gazim, et al., 2010), while Plectranthus ecklonii is used in the treatment of skin
disorders, nausea, vomiting and cancer (Burmistrova, et al., 2015). Other notable economic value
of plant species of this family is highlighted in the literature review presented in the next
Chapter.
1.9 Statement of research
The process of pigmentation caused by over accumulation of melanin in specific parts of the skin
is due to a prolong exposure of the human skin to the UV radiation, resulted into over
http://etd.uwc.ac.zahttp://etd.uwc.ac.zahttp://etd.uwc.ac.za
CHAPTER 1: INTRODUCTION
10
accumulation of free radicals in the body. This condition caused the stimulation of skin
degenerative action of tyrosinase enzyme resulting into the formation of unpleasant skin
pigmented patches as one of the factor of premature skin aging. Enzymatic browning of
perishable agricultural products after post harvesting is another detrimental effect of tyrosinase
enzyme, thereby reducing the nutritional quality and depreciation market value of such products.
It is noteworthy to state that tremendous effort has been achieved by scientists towards
combating the problem associated with skin pigmentation. One of such landmark achievement is
the invention of sun screen for absorbing UV radiation. Regrettably, apart from the recent
shortcomings of the usage of sunscreen, it is not affordable for the people of the continent.
Hence there is urgent need to search for more potent skin depigmenting agents that can replace
already listed agents as illustrated in section 1.6 due to their various bottlenecks.
Lamiaceae plant species are widely distributed in South Africa and are readily available for
human exploration for their potential application as anti-pigmenting agents. It is an established
fact that this family contains phenolic compounds such as flavonoids, phenolic acid and
diterpenes which are expected to play an important role in controlling undesirable skin
conditions. Numerous plant species of this family such as Lavandula species, Origanum
majorana, Ballota nigra, Eremostachys laevigota Burge have been reported to display potent
tyrosinase inhibitory activity and also as antioxidant (Lee, et al., 2011; Hashemi & Zarei, 2014).
Therefore, it is of great need in searching further for potent natural tyrosinase inhibitors from
Lamiaceae plant species with proposition of replacing unsafe products readily available in the
market. Further hypothesis was made to investigate the degree of antioxidant capacities in an in
vitro system in order to complement the natural antioxidant already existing in the body through
dietary intakes.
http://etd.uwc.ac.zahttp://etd.uwc.ac.zahttp://etd.uwc.ac.za
CHAPTER 1: INTRODUCTION
11
1.10 Aims of this study
The main aim of this project is directed towards the preliminary screening of South African
plants species belonging to Lamiaceae for their potency of tyrosinase inhibitory activity using
different complementary assays such as thin layer chromatography (TLC) bioautography,
spectrophotometry and cyclic voltammetry methods. The outcome of this screening will be used
as prerequisite to nominate the bioactive plant materials for chromatographic isolation.
Compounds emanated from such chromatographic isolation will be fully characterized
chemically and biologically, and finally established their various structure-activity relationship
between the compound (s) and their biological specificity demonstrated therefrom.
1.11 Objectives of this study
The main objectives of the study are:
Collection, documentation and identification of Lamiaceae plants.
Extraction of each plant materials with methanol.
Conduct the preliminary phytochemical screening on the methanolic extracts to identify
various classes of compounds.
Carry out the preliminary biological screening using TLC bio-autographic and
colorimetric assays on the methanolic extracts.
Investigate the tyrosinase inhibition current of the methanol extracts using cyclic
voltammetry screening.
Perform chromatographic (TLC-guided column) isolation of bioactive constituents
present in the most biologically and phytochemically active plant extract.
Perform final purification of chromatographic fractions using semi-prep HPLC to obtain
compounds in pure state.
http://etd.uwc.ac.zahttp://etd.uwc.ac.zahttp://etd.uwc.ac.za
CHAPTER 1: INTRODUCTION
12
Carry out structural elucidation of isolated compounds using different spectroscopic
techniques.
Carry out biological investigations on the isolated compounds for their in vitro total
antioxidant capacities.
Determine other biological characterization of the isolated compounds on tyrosinase
inhibitory activity using spectrophotometric and cyclic voltammetry methods.
http://etd.uwc.ac.zahttp://etd.uwc.ac.zahttp://etd.uwc.ac.za
CHAPTER 2: LITERATURE REVIEW
13
CHAPTER 2: A REVIEW OF SOUTH AFRICAN LAMIACEAE:
TRADITIONAL, PHYTOCHEMISTRY AND BIOLOGICAL
IMPORTANCE
2.1 Introduction
The aim of this chapter is to review the South African plant species of Lamiaceae from their
ethno-medicinal perspective to the existing scientific data as depicted from Scifinder. The
comprehensive review includes highlights on the phytochemistry of the family and their
respective biological and pharmacological importance as applicable to this study.
2.2 South African Lamiaceae family
Lamiaceae is a family of flowering plants with 233 to 263 genera and 6900 to 7200 species
(Kaurinovic, et al., 2010), which are classified into seven (7) subfamilies such as Ajugoideae
kostel, Lamioideae Harley, Nepetoideae (Dumort) Luerss, Prostantheroideae Luerss,
Scutillarioidea (Dumort) Caruel, Symphorematoideae Briq and Viticodeae Briq (Theodoridis, et
al., 2012). They are mainly found in Mediterranean, Central Asia and Sub-Saharan Africa region.
An approximation of 980 southern Africa species is widespread and display enormous
morphological diversity. South African floral contains about 255 species assigned to 35 genera
(Klopper, et al., 2006). Most of these plants are aromatic with fragrance smells and are widely
used as culinary herbs and skin-care cosmetics traditionally (Lee, et al., 2011).
2.2.1 Plant Morphology: Description and distribution
The leaves of the plants belonging to Lamiaceae are opposite or whorled, decussate and gland-
dotted, while the flowers are usually bisexual arranged in compact auxiliary cymes.
Zygomorphic flowers are characteristic of this family with calyxes usually persistent with 5
lobes. However, actinomorphic (regular) with 4 or 5 lobed flowers occur in some genera (Raja,
2012). The corolla is tubular and typically 2-lipped with 2 lobed upper lips and 3 lobed lip,
http://etd.uwc.ac.zahttp://etd.uwc.ac.zahttp://etd.uwc.ac.za
CHAPTER 2: LITERATURE REVIEW
14
variously colored and are hairy most of the time. The species are predominantly abundant in
summer compared to the winter in rainforest areas. The often habitats for the plants are rocky,
woodland or grassland, but also occur along forest margins and in fynbos (Strelitzia, 2013).
2.3 Traditional and biological uses of Lamiaceae plant species
The use of traditional medicine plays a vital role in South Africa and constitutes the backbone of
rural areas where 70 % of the population relies on traditional medicine for their primary health
care needs (Scott & Springfield, 2004). Numerous plant of Lamiaceae such as Salvia species
have been used in South Africa to treat different kind of diseases including fever, digestive
disorders, rheumatism, sexual debility, loss of memory, inflammation, microbial infections, and
cancer (Kamatou, et al., 2005). Salvia species have been reported to have anti-inflammatory and
antioxidant properties and their traditional usage include in the treatment of wounds (Kamatou,
et al., 2008). Plectranthus species are plant of economic and medicinal value, and numerous
species are used in South Africa as traditional medicines for the treatment of various diseases
such as cough, wounds, gastrointestinal disorders, and skin infections (Maree, et al., 2014).
Tetradenia riparia have been assessed to be very potent in the treatment of common skin
ailments in many rural communities of South Africa, and the herbal plant has been found to be
the most frequently used by traditional healers for the treatment of cough and chest related
diseases (Ndamane, et al., 2013). More details about the traditional uses of Lamiaceae plants
species are highlighted on the Table 2.1 as follows.
http://etd.uwc.ac.zahttp://etd.uwc.ac.zahttp://etd.uwc.ac.za
CHAPTER 2: LITERATURE REVIEW
15
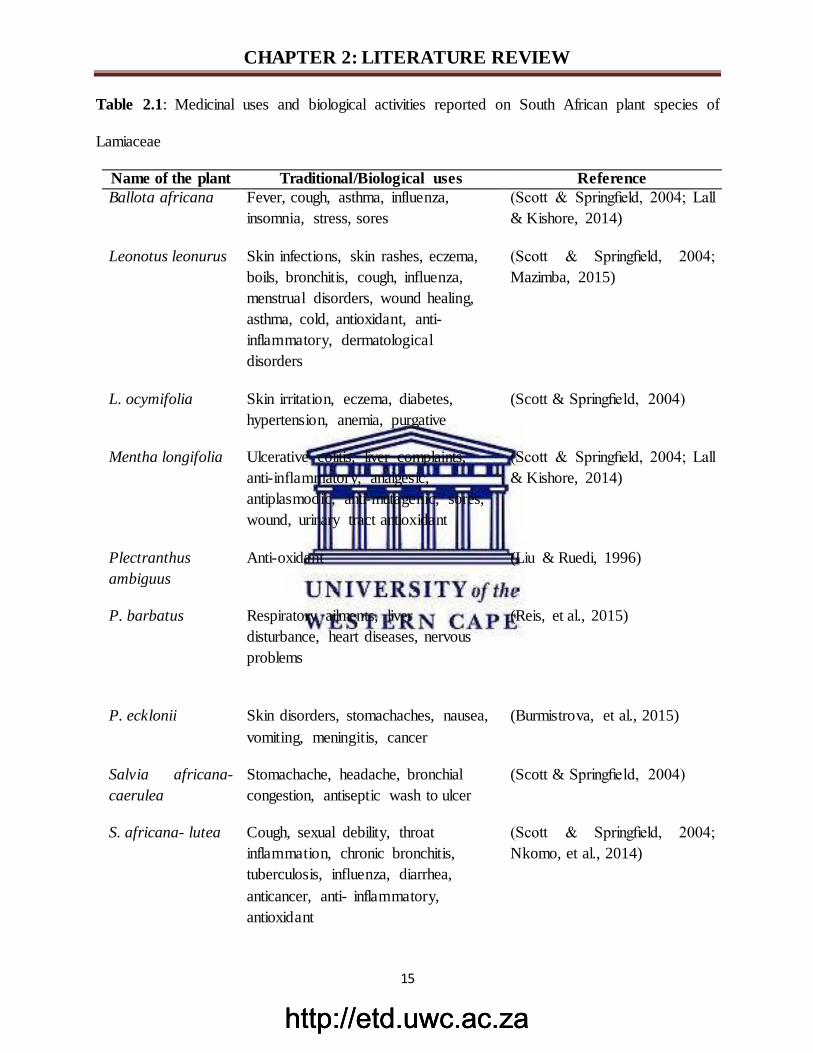
Table 2.1: Medicinal uses and biological activities reported on South African plant species of
Lamiaceae
Name of the plant Traditional/Biological uses Reference
Ballota africana Fever, cough, asthma, influenza,
insomnia, stress, sores
(Scott & Springfield, 2004; Lall
& Kishore, 2014)
Leonotus leonurus Skin infections, skin rashes, eczema,
boils, bronchitis, cough, influenza,
menstrual disorders, wound healing,
asthma, cold, antioxidant, anti-
inflammatory, dermatological
disorders
(Scott & Springfield, 2004;
Mazimba, 2015)
L. ocymifolia Skin irritation, eczema, diabetes,
hypertension, anemia, purgative
(Scott & Springfield, 2004)
Mentha longifolia Ulcerative colitis, liver complaints,
anti-inflammatory, analgesic,
antiplasmodic, anti-mutagenic, sores,
wound, urinary tract antioxidant
(Scott & Springfield, 2004; Lall
& Kishore, 2014)
Plectranthus
ambiguus
Anti-oxidant (Liu & Ruedi, 1996)
P. barbatus
Respiratory ailments, liver
disturbance, heart diseases, nervous
problems
(Reis, et al., 2015)
P. ecklonii
Skin disorders, stomachaches, nausea,
vomiting, meningitis, cancer
(Burmistrova, et al., 2015)
Salvia africana-
caerulea
Stomachache, headache, bronchial
congestion, antiseptic wash to ulcer
(Scott & Springfield, 2004)
S. africana- lutea Cough, sexual debility, throat
inflammation, chronic bronchitis,
tuberculosis, influenza, diarrhea,
anticancer, anti- inflammatory,
antioxidant
(Scott & Springfield, 2004;
Nkomo, et al., 2014)
http://etd.uwc.ac.zahttp://etd.uwc.ac.zahttp://etd.uwc.ac.za
CHAPTER 2: LITERATURE REVIEW
16
S. aurita Antioxidant, anti-inflammatory (Fisher, 2005)
S. chamelaeagnea Cough, whooping cough, bronchitis,
cold, flu, diarrhea, stomachache,
headache, fever, burn wounds,
microbial infections, antioxidant
(Huang & Van Staden, 2002;
Scott & Springfield, 2004;
Kamatou, et al., 2007)
S. disermas Sores, rheumatism, hypertension,
antioxidant, antimicrobial,
antituberculosis, anti-inflammatory,
antiplasmodial
(Fisher, 2005; Hawas, et al.,
2009)
S. dolomitica Anti-inflammatory (Kamatou, et al., 2008)
S. namaensis Antioxidant (Kamatou, et al., 2008)
S. radula Antioxidant, anti-inflammatory (Kamatou, et al., 2008)
S. repens Sores on the body, stomach problem,
diarrhea, anti-inflammatory, anti-
oxidant
(Kamatou, et al., 2005)
S. runcinata Antioxidant, fever, anti-inflammatory,
purgative, headache
(Kamatou, et al., 2005)
S. stenophylla Antioxidant, anti-inflammatory,
disinfectant, purgative, cold, cough,
chest congestion
(Kamatou, et al., 2005; Lall &
Kishore, 2014)
Tetradenia riparia Cough, whooping, bronchitis, cold,
diarrhea, headache, dropsy, fever,
stomach ache, burn wounds,
antiseptic, toothaches, skin diseases,
and antioxidant.
(Scott & Springfield, 2004;
Gairola, et al., 2009; Ndamane,
et al., 2013)
2.4 Phytochemistry of Lamiaceae
The chemistry of Lamiaceae family is still scanty with little chemical characterisation, but a
large number of diterpenoids including kauranes, abietanes, clerodanes, phyllocladenes,
neoclerodane, labdanes, pimiranes, isopimaranes, beyeranes, sesquiterpenes, and flavonoids are
http://etd.uwc.ac.zahttp://etd.uwc.ac.zahttp://etd.uwc.ac.za
CHAPTER 2: LITERATURE REVIEW
17
widely found in different species of Plectranthus genus (Abdel-Mogib & Albar, 2002). Salvia
species have been reported to be rich source of phenolic and polyphenolic compounds such as
carnosic acid (8), rosmarinic acid (21), caffeic acid (20) (Table 2.3.3 and 2.3.5) (Hamidpour, et
al., 2014). It has been reported that the genus Ballota is rich in diterpenoids especially clerodane
and tetracyclic diterpenes, the aromatic fragrance smell is an indication that characterized the
plant of this genus (Ahmad, et al., 2004). Widespread occurrence of flavonoids, labdane
diterpenoids, monoterpenoids and sesquiterpenoids in Tetradenia genus is an indication that
characterized the plant from this genus (Mazimba, 2015). Lamiaceae family is a source of
flavonoids and phenolic acid compounds such as rosmarinic acid (21), p-coumaric acid, caffeic
acid (20), ferulic acid, chlorogenic acid, luteolin (22), apigenin (23) (Table 2.3.5 and 2.4.1),
genkwanin, quercitrin, rutin, epicatechin and catechin (Lee, et al., 2011). Caffeic acid is very
common in Salvia species and the majority of phenolic acids isolated from Salvia are derivatives
of caffeic acid which is the building block of a variety of plant metabolites (Kamatou, et al.,
2009). Caffeic acid plays a vital role in the biochemistry of Lamiaceae and occurs predominantly
in a dimer form as rosmarinic acid (Table 2.3.5) (Hamidpour, et al., 2014). The chemistry and
the biological importance of the isolated compounds from Lamiaceae with skin anti-aging
properties such as anti-tyrosinase, anti-melanogenesis, antioxidant, anti-inflammatory and
antibacterial are highlighted on the tables (Table 2.2, 2.3, 2.4, … etc.) below.
http://etd.uwc.ac.zahttp://etd.uwc.ac.zahttp://etd.uwc.ac.za
CHAPTER 2: LITERATURE REVIEW
18
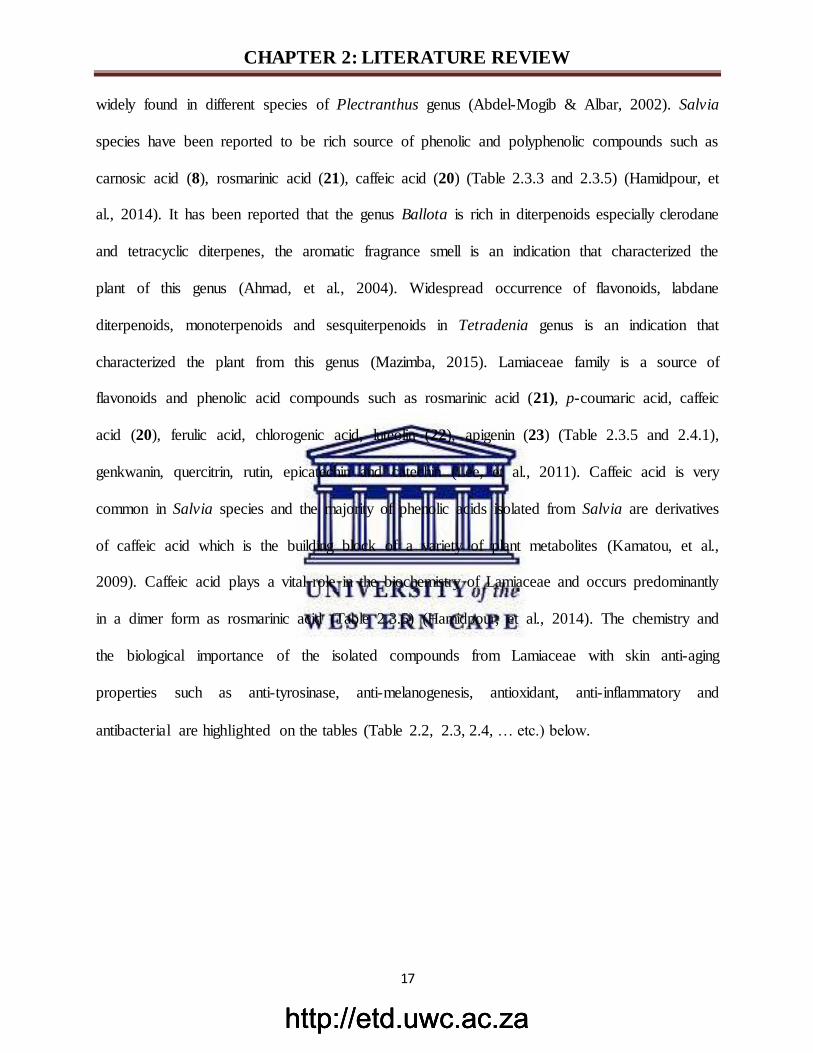
Table 2.2: Selected secondary metabolites with anti-ageing properties
Table 2.2.1: Monoterpenes
S/N Compound Plant source Biological activity Reference
1
O
O
CH3
Linalyl acetate
S. dolomitica Anti-inflammatory (Kamatou, et al., 2008)
2 OH
Linolol
S. dolomitica Anti-inflammatory (Kamatou, et al., 2008)
S: Salvia
Table 2.2.2: Sesquiterpene
S/N Compound Plant source Biological activity Reference
3 OH
∝ − bisabolol
S. runcinata Antioxidant
Anti-inflammation
(Kamatou, et al., 2008)
S: Salvia
http://etd.uwc.ac.zahttp://etd.uwc.ac.zahttp://etd.uwc.ac.za
CHAPTER 2: LITERATURE REVIEW
19
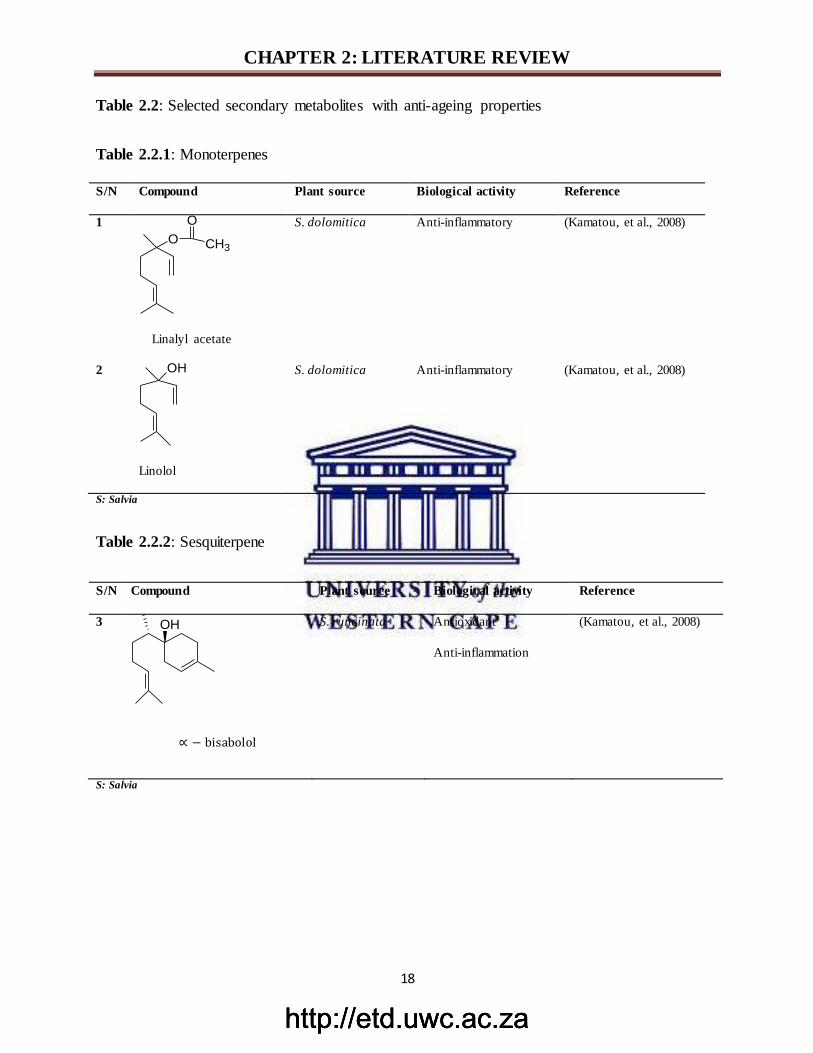
Table 2.2.3: Abiatene diterpenoid
S/N Compound Plant source Biological activity Reference
4 OHO
RO
Parvifloron D
P.ecklonii Antioxidant
(Rosa, et al., 2015)
P: Plectranthus
Table 2.2.4: Labdane diterpenoids
S/N Compound Plant source Biological activity Reference
5
O
O
O
CH3
H3CHO
Marrubin
L. leonurus
Antioxidant
(Mazimba, 2015)
6
O
O
Leoleorin C
L. leonurus
Antioxidant
(Mazimba, 2015)
L: Leonotus
http://etd.uwc.ac.zahttp://etd.uwc.ac.zahttp://etd.uwc.ac.za
CHAPTER 2: LITERATURE REVIEW
20
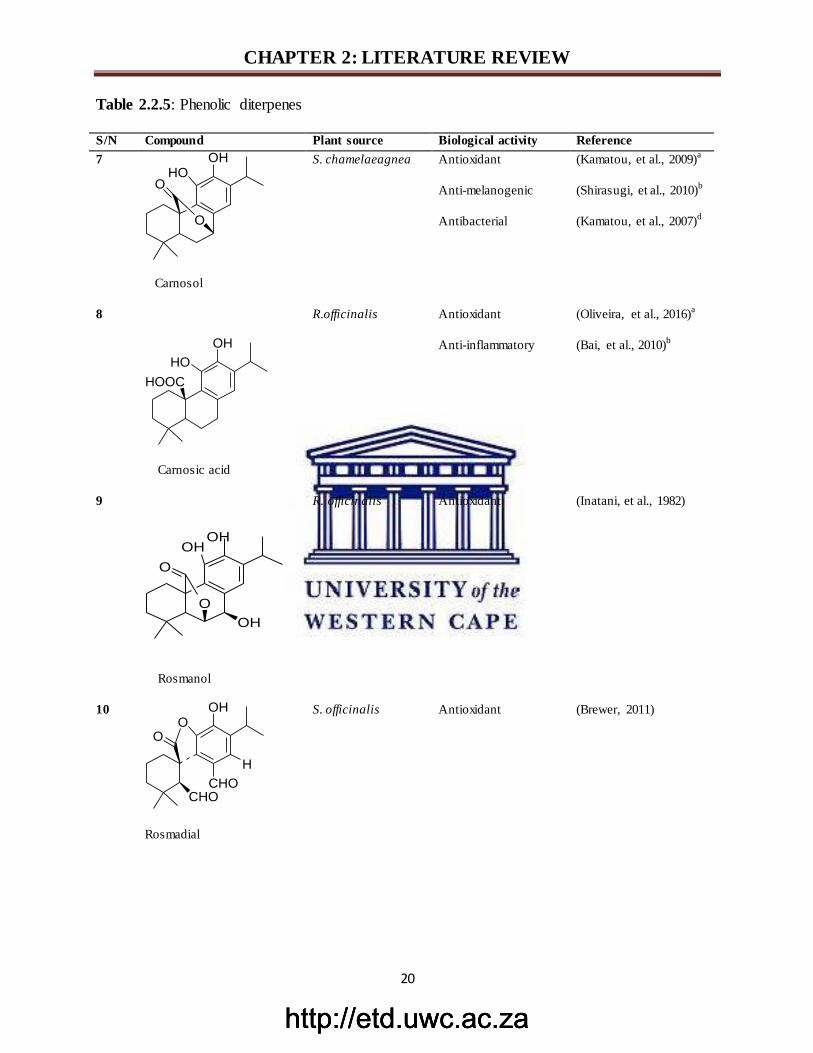
Table 2.2.5: Phenolic diterpenes
S/N Compound Plant source Biological activity Reference
7
OH
O
OHO
Carnosol
S. chamelaeagnea
Antioxidant
Anti-melanogenic
Antibacterial
(Kamatou, et al., 2009)a
(Shirasugi, et al., 2010)b
(Kamatou, et al., 2007)d
8
OH
HO
HOOC
Carnosic acid
R.officinalis Antioxidant
Anti-inflammatory
(Oliveira, et al., 2016)a
(Bai, et al., 2010)b
9
Rosmanol
R. officinalis Antioxidant (Inatani, et al., 1982)
10
OHO
H
CHOCHO
O
Rosmadial
S. officinalis
Antioxidant
(Brewer, 2011)
OHOH
O
OH
O
http://etd.uwc.ac.zahttp://etd.uwc.ac.zahttp://etd.uwc.ac.za
CHAPTER 2: LITERATURE REVIEW
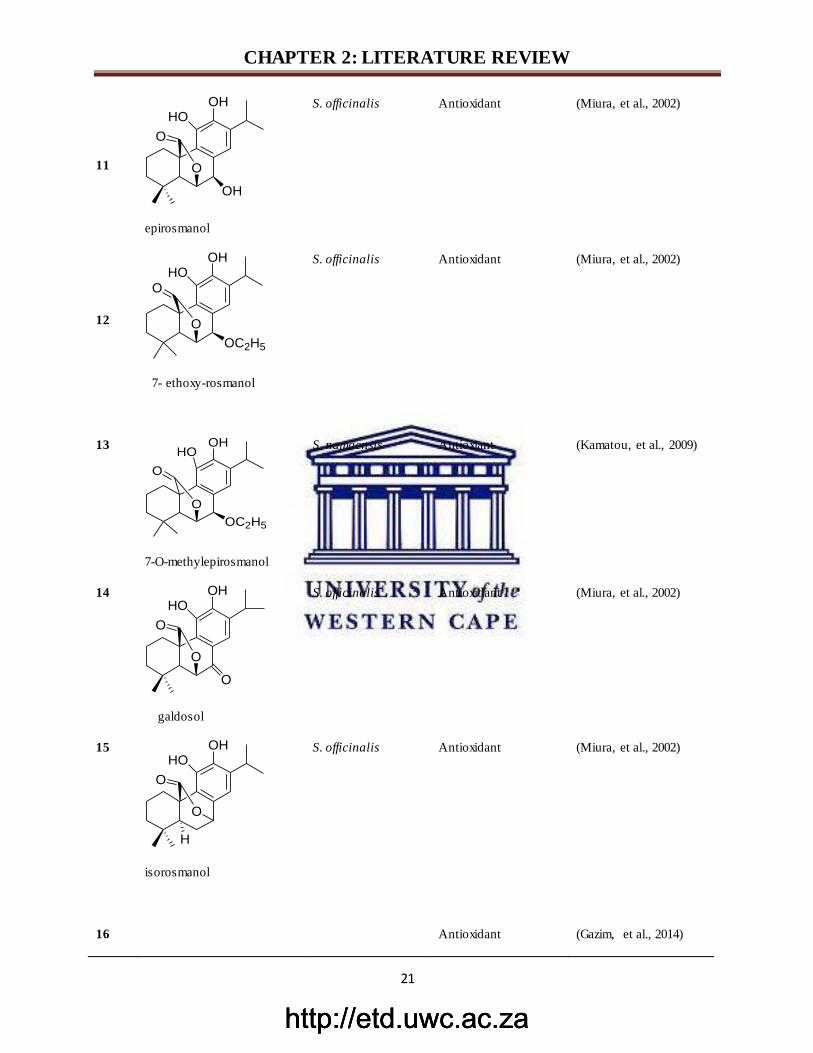
21
11
OHHO
OH
O
O
epirosmanol
S. officinalis
Antioxidant (Miura, et al., 2002)
12
OHHO
O
OC2H5
O
7- ethoxy-rosmanol
S. officinalis
Antioxidant
(Miura, et al., 2002)
13
OHHO
O
OC2H5
O
7-O-methylepirosmanol
S. namaensis
Antioxiant
(Kamatou, et al., 2009)
14 OHHO
O
O
O
galdosol
S. officinalis
Antioxidant (Miura, et al., 2002)
15 OHHO
O
H
O
isorosmanol
S. officinalis
Antioxidant (Miura, et al., 2002)
16
Antioxidant
(Gazim, et al., 2014)
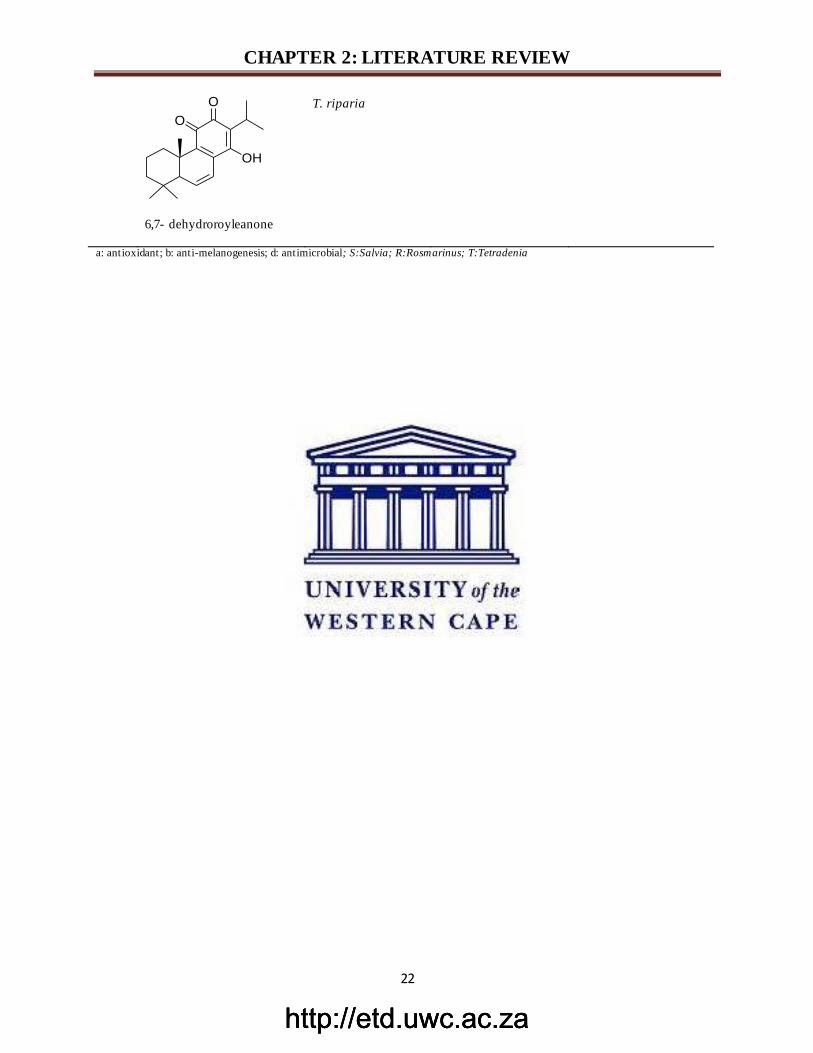
http://etd.uwc.ac.zahttp://etd.uwc.ac.zahttp://etd.uwc.ac.za
CHAPTER 2: LITERATURE REVIEW
22
O
O
OH
6,7- dehydroroyleanone
T. riparia
a: antioxidant; b: anti-melanogenesis; d: antimicrobial; S:Salvia; R:Rosmarinus; T:Tetradenia
http://etd.uwc.ac.zahttp://etd.uwc.ac.zahttp://etd.uwc.ac.za
CHAPTER 2: LITERATURE REVIEW
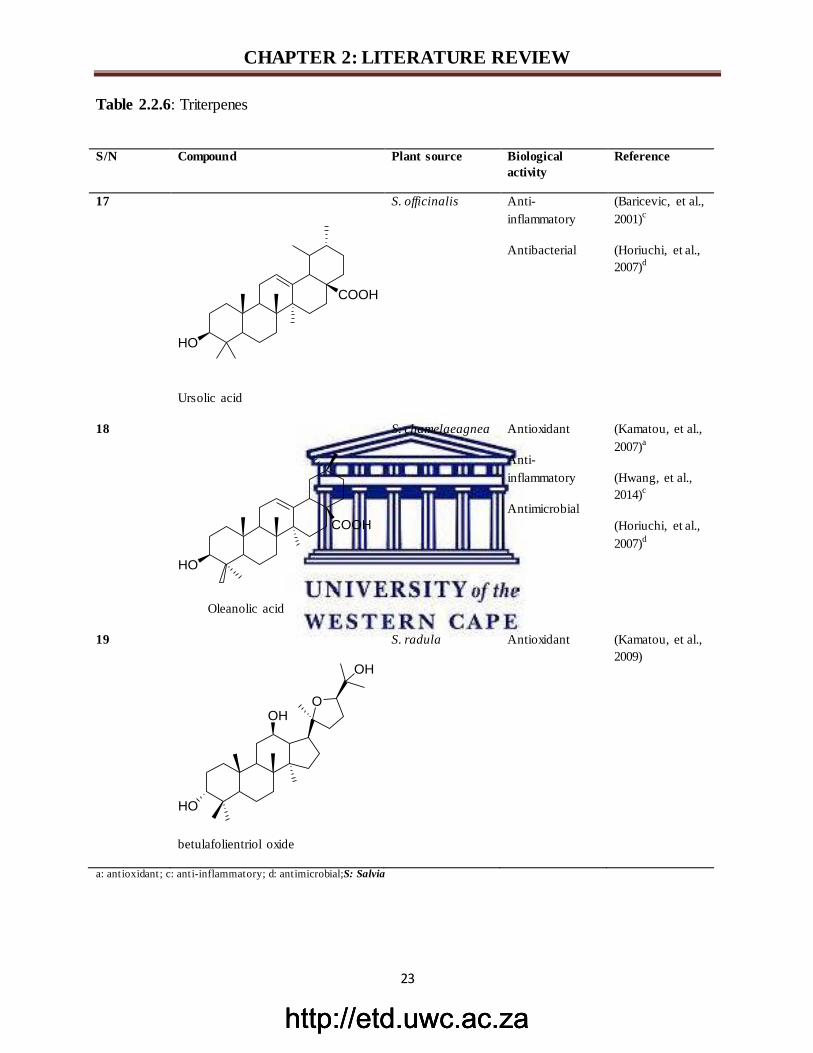
23
Table 2.2.6: Triterpenes
S/N Compound Plant source Biological
activity
Reference
17
Ursolic acid
S. officinalis
Anti-
inflammatory
Antibacterial
(Baricevic, et al.,
2001)c
(Horiuchi, et al.,
2007)d
18
HO
COOH
Oleanolic acid
S. chamelaeagnea
Antioxidant
Anti-
inflammatory
Antimicrobial
(Kamatou, et al.,
2007)a
(Hwang, et al.,
2014)c
(Horiuchi, et al.,
2007)d
19
HO
OHO
OH
betulafolientriol oxide
S. radula Antioxidant (Kamatou, et al.,
2009)
a: antioxidant; c: anti-inflammatory; d: antimicrobial;S: Salvia
COOH
HO
http://etd.uwc.ac.zahttp://etd.uwc.ac.zahttp://etd.uwc.ac.za
CHAPTER 2: LITERATURE REVIEW
24
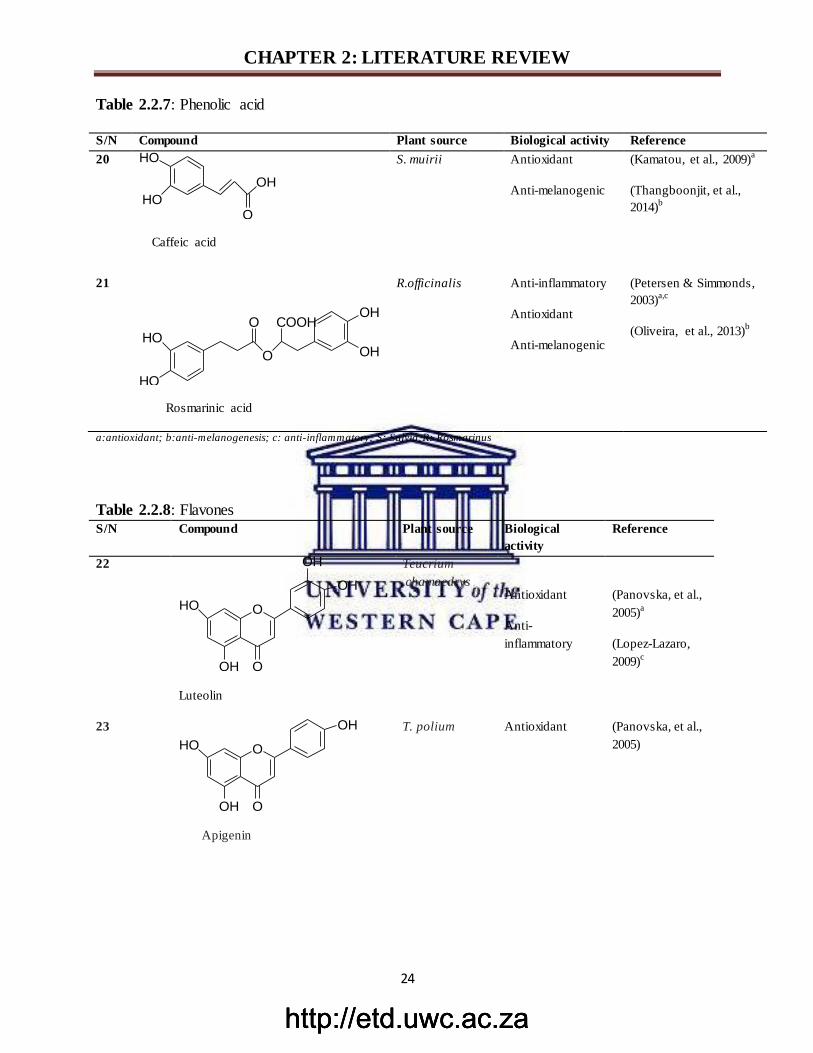
Table 2.2.7: Phenolic acid
S/N Compound Plant source Biological activity Reference
20
HO
HO
OH
O
Caffeic acid
S. muirii Antioxidant
Anti-melanogenic
(Kamatou, et al., 2009)a
(Thangboonjit, et al.,
2014)b
21
HO
HO
O
O
OH
OH
COOH
Rosmarinic acid
R.officinalis Anti-inflammatory
Antioxidant
Anti-melanogenic
(Petersen & Simmonds,
2003)a,c
(Oliveira, et al., 2013)b
a:antioxidant; b:anti-melanogenesis; c: anti-inflammatory; S: Salvia;R: Rosmarinus
Table 2.2.8: Flavones
S/N Compound Plant source Biological
activity
Reference
22
O
OH
HO
O
OH
OH
Luteolin
Teucrium
.chamaedrys
Antioxidant
Anti-
inflammatory
(Panovska, et al.,
2005)a
(Lopez-Lazaro,
2009)c
23
O
OH
HO
O
OH
Apigenin
T. polium Antioxidant (Panovska, et al.,
2005)
http://etd.uwc.ac.zahttp://etd.uwc.ac.zahttp://etd.uwc.ac.za
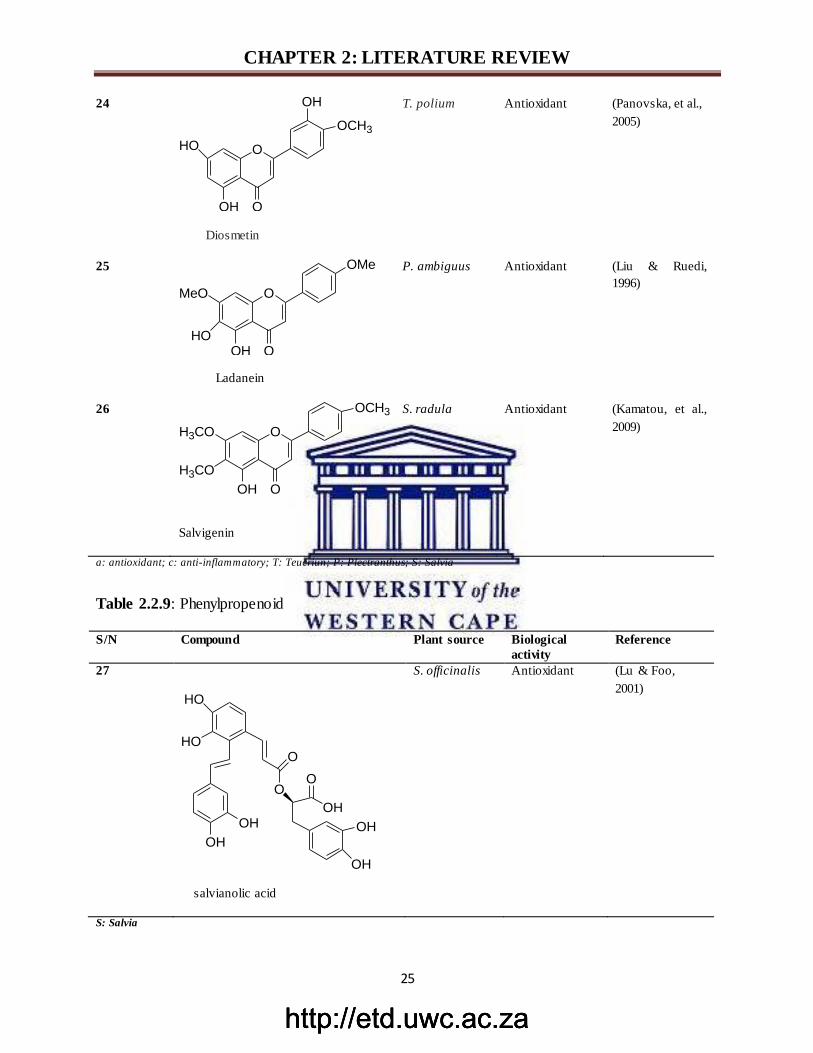
CHAPTER 2: LITERATURE REVIEW
25
24
O
OH
HO
O
OH
OCH3
Diosmetin
T. polium Antioxidant (Panovska, et al.,
2005)
25
O
OHHO
MeO
OMe
O
Ladanein
P. ambiguus Antioxidant
(Liu & Ruedi,
1996)
26
O
O
H3CO
H3CO
OCH3
OH
Salvigenin
S. radula Antioxidant (Kamatou, et al.,
2009)
a: antioxidant; c: anti-inflammatory; T: Teucriun; P: Plectranthus; S: Salvia
Table 2.2.9: Phenylpropenoid
S/N Compound Plant source Biological
activity
Reference
27
HO
HO
O
O
OH
OH
O
OH
OH
OH
salvianolic acid
S. officinalis Antioxidant
(Lu & Foo,
2001)
S: Salvia
http://etd.uwc.ac.zahttp://etd.uwc.ac.zahttp://etd.uwc.ac.za
CHAPTER 2: LITERATURE REVIEW
26
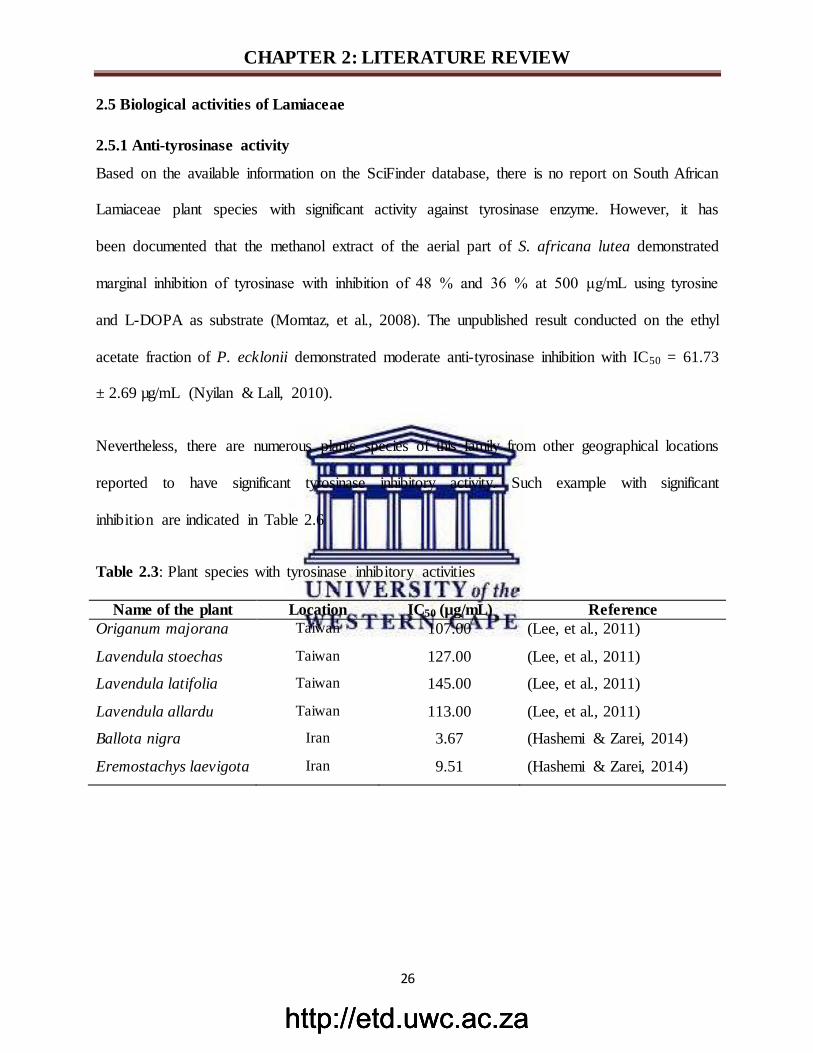
2.5 Biological activities of Lamiaceae
2.5.1 Anti-tyrosinase activity
Based on the available information on the SciFinder database, there is no report on South African
Lamiaceae plant species with significant activity against tyrosinase enzyme. However, it has
been documented that the methanol extract of the aerial part of S. africana lutea demonstrated
marginal inhibition of tyrosinase with inhibition of 48 % and 36 % at 500 μg/mL using tyrosine
and L-DOPA as substrate (Momtaz, et al., 2008). The unpublished result conducted on the ethyl
acetate fraction of P. ecklonii demonstrated moderate anti-tyrosinase inhibition with IC50 = 61.73
± 2.69 µg/mL (Nyilan & Lall, 2010).
Nevertheless, there are numerous plants species of this family from other geographical locations
reported to have significant tyrosinase inhibitory activity. Such example with significant
inhibition are indicated in Table 2.6
Table 2.3: Plant species with tyrosinase inhibitory activities
Name of the plant Location IC50 (µg/mL) Reference
Origanum majorana Taiwan 107.00 (Lee, et al., 2011)
Lavendula stoechas Taiwan 127.00 (Lee, et al., 2011)
Lavendula latifolia Taiwan 145.00 (Lee, et al., 2011)
Lavendula allardu Taiwan 113.00 (Lee, et al., 2011)
Ballota nigra Iran 3.67 (Hashemi & Zarei, 2014)
Eremostachys laevigota Iran 9.51 (Hashemi & Zarei, 2014)
http://etd.uwc.ac.zahttp://etd.uwc.ac.zahttp://etd.uwc.ac.za
CHAPTER 2: LITERATURE REVIEW
27
2.5.2 Antioxidant activities
The family Lamiaceae is considered to be a promising source of natural antioxidants by the fact
that polyphenolic sincluding carnosol (7), rosmanol (10) (Table 2.3.3) are the predominant
components of this family and it has been reported to possess good antioxidant activities
(Kamatou, et al., 2009). It has been established that there is a relationship between the chemical
structure and antioxidant activity demonstrated by each constituents. The increase in number of
hydroxyl groups in the aromatic ring increased with the free radical-scavenging and antioxidant
activities (Lee, et al., 2011). The South African Salvia species were found to display good
antioxidant activity with DPPH (IC50 1.66-74.50 µg/mL), while ABTS.+ showed IC50 values
between the range of 11.88 to 69.26 (Kamatou, et al., 2008). The antioxidant values displayed by
the South African Salvia are mainly attributed to the presence of phenolics including phenolic
acid such as rosmarinic acid (21), carnosic acid (8) and carnosol (7) as indicated in Table 2.3.3
and 2.3.5 (Huang & Van Staden, 2002; Petersen & Simmonds, 2003). Other compounds that
may contribute to the antioxidant activities of Salvia include the presence of polyphenolic
compounds such as flavonoids (Exarchou, et al., 2002; Kouřimská, et al., 2013). Teucrium
species have been reported to possess radical scavenging activity as well as antioxidant activity
in an in vitro system (Panovska, et al., 2005).
http://etd.uwc.ac.zahttp://etd.uwc.ac.zahttp://etd.uwc.ac.za
CHAPTER 3: PHYTOCHEMICAL AND BIOLOGICAL SCREENING
29
CHAPTER 3: PRELIMINARY PHYTOCHEMICAL AND BIOLOGICAL
SCREENING OF SELECTED SOUTH AFRICAN LAMIACEAE
3.1 Introduction
This chapter describes the preliminary phytochemical and biological investigation of South
African Lamiaceae collected in the Cape floristic region.
The preliminary phytochemical screening was carried out with TLC using different solvent
system and detection the spot physically (UV, short and long wavelengths) and chemically using
vanillin/H2SO4 spray.
The preliminary biological (anti-tyrosinase activity) screening of the methanolic extracts of 25
South African Lamiaceae involved the following methods:
TLC bioautography, a quick and simple screening method for detection of tyrosinase
inhibitors. It is commonly used for bio-guided fractionation of tyrosinase inhibitors from
mixtures or extracts (Wangthong, et al., 2007).
Spectrophotometric measurement as the most widely used and reliable methodfor
detection of tyrosinase inhibitors due to its best sensitivity, selectivity and versatility
(Xia, et al., 2013).
Cyclic voltammetry measurement, an electrochemical technique in which the current is
measuring between a working and counter electrode as a function of the potential
(Aristov & Habekost, 2015). CV is commonly used for detection of phenolic compounds,
antioxidant agents (Dobes, et al., 2013; Magarelli, et al., 2013). However, this method
has not been reported previously to measure or predict tyrosinase activity of plant
extracts. So this is the first report on screening of tyrosinase inhibitors from natural
source using cyclic voltammetry as a tool for detection of tyrosinase inhibitors.
http://etd.uwc.ac.zahttp://etd.uwc.ac.zahttp://etd.uwc.ac.za
CHAPTER 3: PHYTOCHEMICAL AND BIOLOGICAL SCREENING
30
3.2 Materials and methods
3.2.1 Plant materials
Some of the plant materials used in this study were sourced from Kirstenbosch Garden Centre
and the Nursery at the Cape Flats Nature Reserve, Bellville, while others were collected in the
Cape Flats Nature Reserve and Hantam National Botanical Garden, Nieuwoudtville (Table 3.1).
The wild collected plants were identified at the Compton Herbarium, Kirstenbosch by Dr.
Christopher Cupido (SANBI, Kirstenbosch); a voucher specimen of each plant was deposited at
the Compton Herbarium at Kirstenbosch.
http://etd.uwc.ac.zahttp://etd.uwc.ac.zahttp://etd.uwc.ac.za
CHAPTER 3: PHYTOCHEMICAL AND BIOLOGICAL SCREENING
31
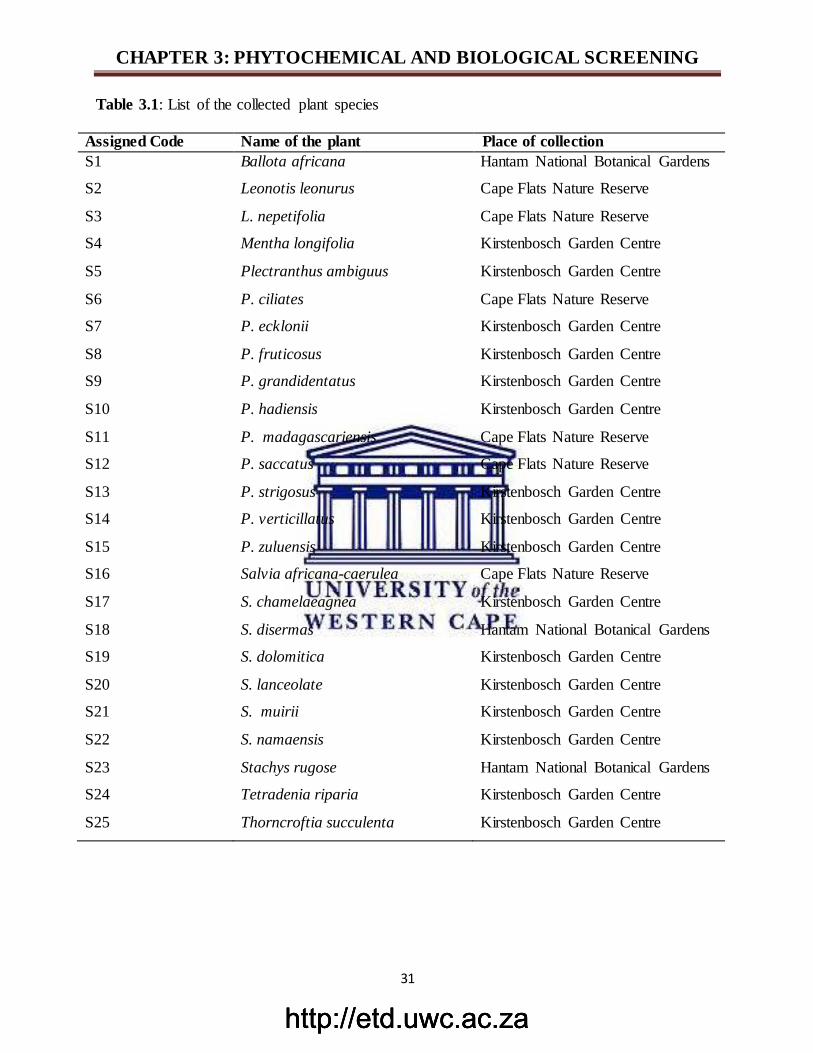
Table 3.1: List of the collected plant species
Assigned Code Name of the plant Place of collection
S1 Ballota africana Hantam National Botanical Gardens
S2 Leonotis leonurus Cape Flats Nature Reserve
S3 L. nepetifolia Cape Flats Nature Reserve
S4 Mentha longifolia Kirstenbosch Garden Centre
S5 Plectranthus ambiguus Kirstenbosch Garden Centre
S6 P. ciliates Cape Flats Nature Reserve
S7 P. ecklonii Kirstenbosch Garden Centre
S8 P. fruticosus Kirstenbosch Garden Centre
S9 P. grandidentatus Kirstenbosch Garden Centre
S10 P. hadiensis Kirstenbosch Garden Centre
S11 P. madagascariensis Cape Flats Nature Reserve
S12 P. saccatus Cape Flats Nature Reserve
S13 P. strigosus Kirstenbosch Garden Centre
S14 P. verticillatus Kirstenbosch Garden Centre
S15 P. zuluensis Kirstenbosch Garden Centre
S16 Salvia africana-caerulea Cape Flats Nature Reserve
S17 S. chamelaeagnea Kirstenbosch Garden Centre
S18 S. disermas Hantam National Botanical Gardens
S19 S. dolomitica Kirstenbosch Garden Centre
S20 S. lanceolate Kirstenbosch Garden Centre
S21 S. muirii Kirstenbosch Garden Centre
S22 S. namaensis Kirstenbosch Garden Centre
S23 Stachys rugose Hantam National Botanical Gardens
S24 Tetradenia riparia Kirstenbosch Garden Centre
S25 Thorncroftia succulenta Kirstenbosch Garden Centre
http://etd.uwc.ac.zahttp://etd.uwc.ac.zahttp://etd.uwc.ac.za
CHAPTER 3: PHYTOCHEMICAL AND BIOLOGICAL SCREENING
32
3.2.2 Preparation of plant extracts
The fresh aerial parts of the fresh plant materials were blended and extracted with methanol for
24 hours at room temperature (25 oC). The methanol extracts were filtered and evaporated to
dryness under reduced pressure at 40 oC. The extracts were kept under cold conditions for further
use.
3.2.3 Chemical and Reagents
The mushroom tyrosinase (EC 1.14.18.1) 5771 Unit/mg, L-Tyrosine and Kojic acid were
purchased from Sigma Aldrich (Cape Town, South Africa). Organic solvents such as methanol
(MeOH), ethanol (EtOH), hexane, dichloromethane (DCM), ethyl acetate (EtOAc), and dimethyl
sulfoxide (DMSO) were supplied by Merck (Cape Town, South Africa). Thin layer
chromatography (TLC) was conducted on normal-phase silica gel 60 PF254 pre-coated aluminium
plates (Merck, Cape Town, South Africa).
3.2.4 Apparatus
All spectrophotometry experiments were performed using the enzyme-linked immunosorbent
assay (ELISA) on AccuReader M 965/965+, Metertech Inc. version 1.11, Taipei, Taiwan. The
cyclic voltammetry was performed using BASI EPSILON system as potentiostat. Three
electrodes were used such as glass carbon electrode as a working electrode, a platinum (Pt) wire
electrode as a counter electrode and an auxiliary electrode Ag/AgCl as reference electrode. The
cyclic voltammetry experiments were recorded at 50 mV/s or 25 mV/s in two different potential
ranges comprised between -1300 and 1300 mV; -200 and 200 mV. All experiments were
performed at room temperature.
http://etd.uwc.ac.zahttp://etd.uwc.ac.zahttp://etd.uwc.ac.za
CHAPTER 3: PHYTOCHEMICAL AND BIOLOGICAL SCREENING
33
3.2.5 TLC bioautographic assay for tyrosinase inhibition
The TLC bioautographic assay of tyrosinase inhibition was performed as described previously
(Wangthong, et al., 2007) with slight modifications. Phosphate buffer (PBS) was prepared by
mixing two stock solutions of monosodium phosphate 50 mM and disodium phosphate 50 mM to
the pH 6.5.Tyrosinase solution was prepared by dissolving 1 mL of 1000 U enzyme in 1 mL of
phosphate buffer. The substrate was prepared by dissolving 0.0036 g of L-tyrosine in 10 mL
phosphate buffer. Extracts and kojic acid were dissolved in methanol to a stock solution of 1
mg/mL, 15 µL of the extracts and kojic acid (as positive control) were spotted onto the TLC
plate and the plate was developed using two different solvent systems Hex:EtOAc (9:1) and
DCM:MeOH (97:3). The developed plate was sprayed with tyrosinase and incubated at room
temperature for 5 min, followed by L-tyrosine (20 mM) and left at room temperature for 30 min,
then photographed.
3.2.6 Tyrosinase enzyme Assay
This assay was performed using spectrophotometric method as previously described (Popoola, et
al., 2015). Samples were dissolved in DMSO to a stock solution of 1 mg/mL, and further
dilutions were done with 50 mM sodium phosphate buffer (pH 6.5) for all working solutions.
Kojic acid was used as positive control. In the wells of a 96-well plate, 70 µL of each sample
working solution was combined with 30 𝜇L of tyrosinase (500 Units/mL in sodium phosphate
buffer) in triplicate. After incubation at room temperature for 5 min, 110 𝜇L of substrate (2 mM
L-Tyrosine) was added to each well. Incubation commenced for 30 min at room temperature and
the enzyme activity was determined by measuring the absorbance at 490 nm. The percentage of
tyrosinase inhibition was calculated as follows:
(%) = [(A - B) - (C - D)]/ (A - B) × 100 (1)
http://etd.uwc.ac.zahttp://etd.uwc.ac.zahttp://etd.uwc.ac.za
CHAPTER 3: PHYTOCHEMICAL AND BIOLOGICAL SCREENING
34
Where A is the absorbance of the control with the enzyme, B is the absorbance of the control
without the enzyme, C is the absorbance of the test sample with the enzyme and D is the
absorbance of the test sample without the enzyme.
3.2.7 Cyclic voltammetry measurement
Cyclic voltammetry was used for monitoring the behavior (increase or decrease) of the inhibition
current with time in the presence of kojic acid or extract(s).
It was performed using the BAS100B electro-chemical analyzer, a glassy carbon electrode
(GCE) as working electrode, Ag/AgCl as a reference electrode and platinum (Pt) as a counter
electrode. Cyclic voltammograms (CVs) were recorded at two different scan rates 50 mV/s and
25 mV/s within the potential window ranging from -1300 to 1300 mV and from -200 to 200 mV.
Both extracts and kojic acid were made to a stock solution of 10 mg/mL with DMSO. Tyrosinase
and L-tyrosine were diluted in phosphate buffer to a working concentration and the experiments
were carried out at room temperature.
In CV experiments, glassy carbon electrode was polished with emery paper and Alumina powder
(1.0, 0.3, 0.05 µm) to a minor finish, and then sonicated in doubly purified using ethanol and
distilled water for 15 min each. After each CV scan, the electrode was re-polished using the same
procedure to maintain the consistency of the surface area of the electrode.
To a cell containing 10 mL of 50 mM PBS at pH 6.5, a fixed volume of extracts and tyrosinase
enzyme were added (700 𝜇L) and (300 𝜇L) respectively, to which a specific volume of the L-
tyrosine (1100 𝜇L) was also added. To understand the activity of the control either positive or
negative, the extract was replaced with kojic acid and DMSO. Cyclic voltammetry of each
addition was recorded.
http://etd.uwc.ac.zahttp://etd.uwc.ac.zahttp://etd.uwc.ac.za
CHAPTER 3: PHYTOCHEMICAL AND BIOLOGICAL SCREENING
35
3.3 Results and Discussion
In the search of discovering new natural tyrosinase inhibitors, three complementary methods
such as TLC bioautography, spectrophotometric and cyclic voltammetry were used for screening
the selected plant extracts against tyrosinase. However, ELISA is predominantly used, the TLC
bioautography has been reported for the same purpose while the use of cyclic voltammetry for
the detection of tyrosinase inhibitors was limited to detect phenolic compounds through
electrochemical measurement.
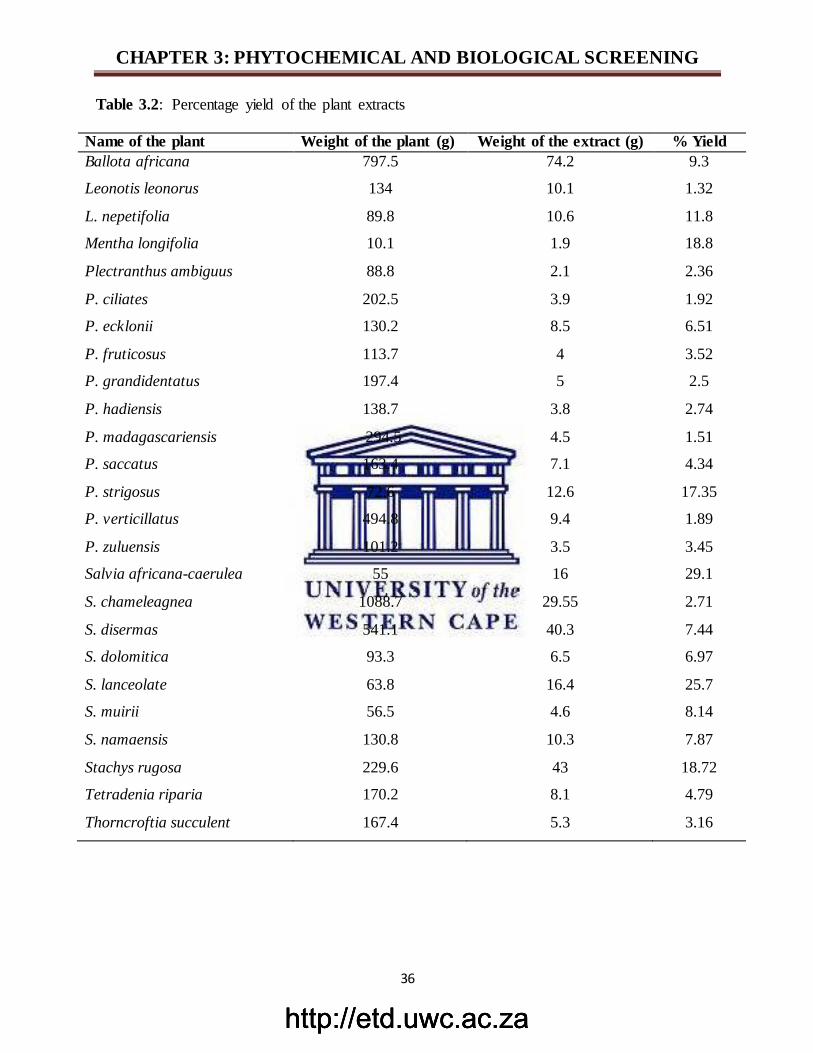
http://etd.uwc.ac.zahttp://etd.uwc.ac.zahttp://etd.uwc.ac.za
CHAPTER 3: PHYTOCHEMICAL AND BIOLOGICAL SCREENING
36
Table 3.2: Percentage yield of the plant extracts
Name of the plant Weight of the plant (g) Weight of the extract (g) % Yield
Ballota africana 797.5 74.2 9.3
Leonotis leonorus 134 10.1 1.32
L. nepetifolia 89.8 10.6 11.8
Mentha longifolia 10.1 1.9 18.8
Plectranthus ambiguus 88.8 2.1 2.36
P. ciliates 202.5 3.9 1.92
P. ecklonii 130.2 8.5 6.51
P. fruticosus 113.7 4 3.52
P. grandidentatus 197.4 5 2.5
P. hadiensis 138.7 3.8 2.74
P. madagascariensis 294.5 4.5 1.51
P. saccatus 163.4 7.1 4.34
P. strigosus 72.6 12.6 17.35
P. verticillatus 494.8 9.4 1.89
P. zuluensis 101.2 3.5 3.45
Salvia africana-caerulea 55 16 29.1
S. chameleagnea 1088.7 29.55 2.71
S. disermas 541.1 40.3 7.44
S. dolomitica 93.3 6.5 6.97
S. lanceolate 63.8 16.4 25.7
S. muirii 56.5 4.6 8.14
S. namaensis 130.8 10.3 7.87
Stachys rugosa 229.6 43 18.72
Tetradenia riparia 170.2 8.1 4.79
Thorncroftia succulent 167.4 5.3 3.16
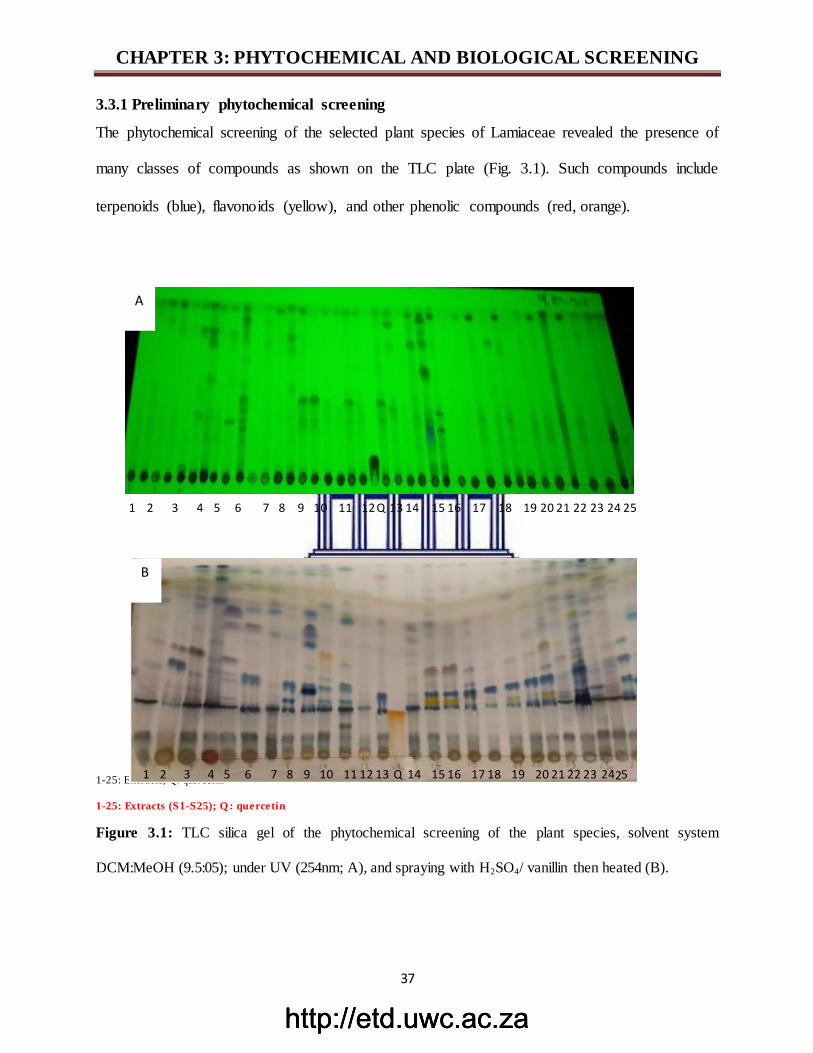
http://etd.uwc.ac.zahttp://etd.uwc.ac.zahttp://etd.uwc.ac.za
CHAPTER 3: PHYTOCHEMICAL AND BIOLOGICAL SCREENING
37
3.3.1 Preliminary phytochemical screening
The phytochemical screening of the selected plant species of Lamiaceae revealed the presence of
many classes of compounds as shown on the TLC plate (Fig. 3.1). Such compounds include
terpenoids (blue), flavonoids (yellow), and other phenolic compounds (red, orange).
1-25: Extracts; Q: quercetin
1-25: Extracts (S1-S25); Q : quercetin
Figure 3.1: TLC silica gel of the phytochemical screening of the plant species, solvent system
DCM:MeOH (9.5:05); under UV (254nm; A), and spraying with H2SO4/ vanillin then heated (B).
1 2 3 4 5 6 7 8 9 10 11 12 13 14 15 16 17 18 19 20 21 22 23 24 5 25
Q
1 2 3 4 5 6 7 8 9 10 11 12 13 14 15 16 17 18 19 20 21 22 23 24 25 Q
A
B
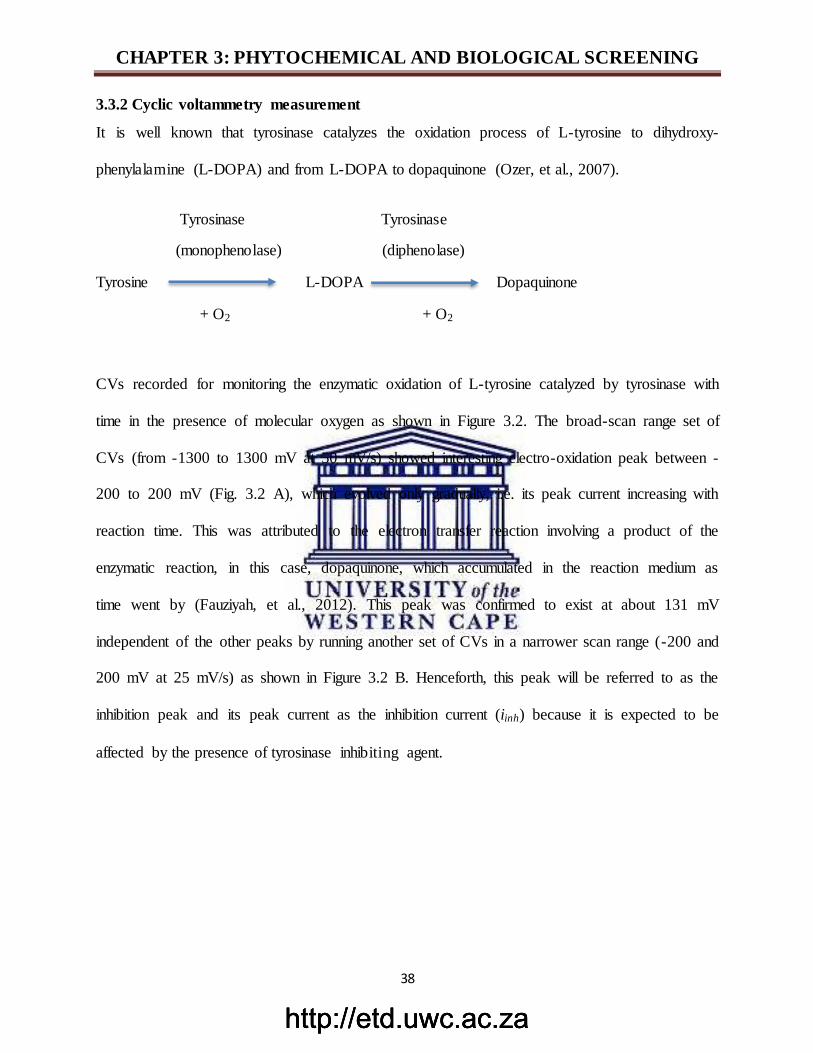
http://etd.uwc.ac.zahttp://etd.uwc.ac.zahttp://etd.uwc.ac.za
CHAPTER 3: PHYTOCHEMICAL AND BIOLOGICAL SCREENING
38
3.3.2 Cyclic voltammetry measurement
It is well known that tyrosinase catalyzes the oxidation process of L-tyrosine to dihydroxy-
phenylalamine (L-DOPA) and from L-DOPA to dopaquinone (Ozer, et al., 2007).
Tyrosinase Tyrosinase
(monophenolase) (diphenolase)
Tyrosine L-DOPA Dopaquinone
+ O2 + O2
CVs recorded for monitoring the enzymatic oxidation of L-tyrosine catalyzed by tyrosinase with
time in the presence of molecular oxygen as shown in Figure 3.2. The broad-scan range set of
CVs (from -1300 to 1300 mV at 50 mV/s) showed interesting electro-oxidation peak between -
200 to 200 mV (Fig. 3.2 A), which evolved only gradually, i.e. its peak current increasing with
reaction time. This was attributed to the electron transfer reaction involving a product of the
enzymatic reaction, in this case, dopaquinone, which accumulated in the reaction medium as
time went by (Fauziyah, et al., 2012). This peak was confirmed to exist at about 131 mV
independent of the other peaks by running another set of CVs in a narrower scan range (-200 and
200 mV at 25 mV/s) as shown in Figure 3.2 B. Henceforth, this peak will be referred to as the
inhibition peak and its peak current as the inhibition current (iinh) because it is expected to be
affected by the presence of tyrosinase inhibiting agent.
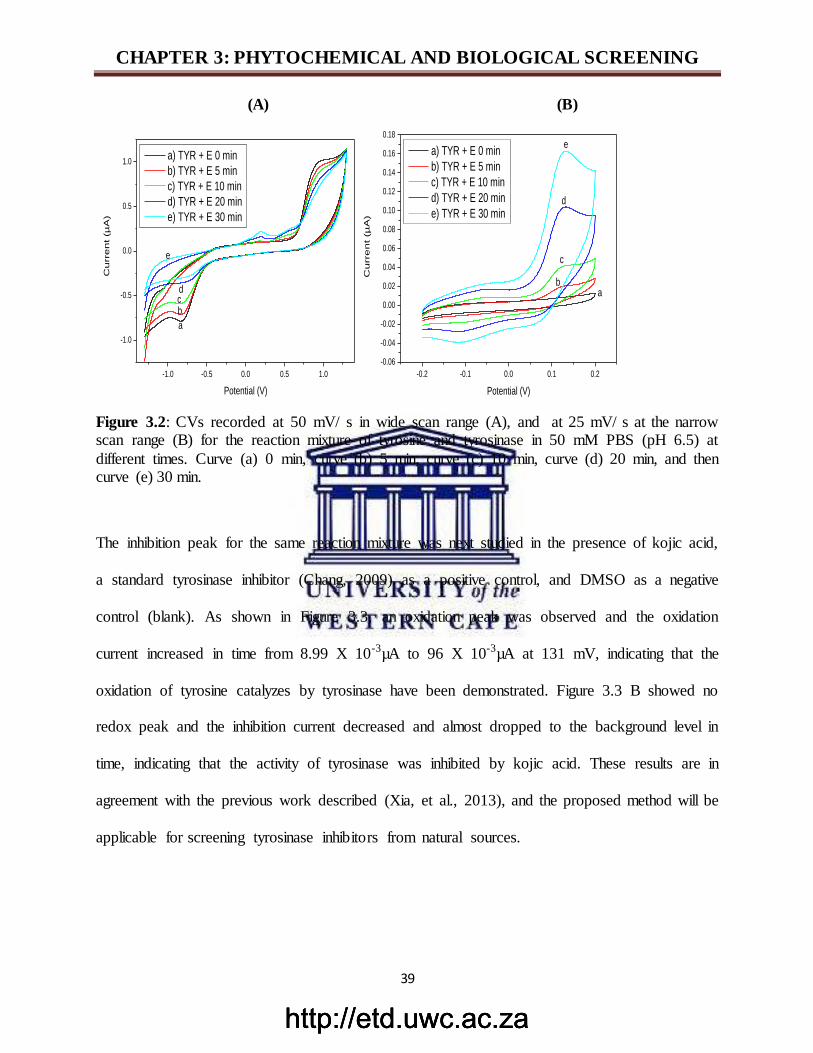
http://etd.uwc.ac.zahttp://etd.uwc.ac.zahttp://etd.uwc.ac.za
CHAPTER 3: PHYTOCHEMICAL AND BIOLOGICAL SCREENING
39
(A) (B)
-1.0 -0.5 0.0 0.5 1.0
-1.0
-0.5
0.0
0.5
1.0
Cu
rre
nt (µ
A)
Potential (V)
a) TYR + E 0 min
b) TYR + E 5 min
c) TYR + E 10 min
d) TYR + E 20 min
e) TYR + E 30 min
e
a
bcd
-0.2 -0.1 0.0 0.1 0.2
-0.06
-0.04
-0.02
0.00
0.02
0.04
0.06
0.08
0.10
0.12
0.14
0.16
0.18e
d
c
b
a) TYR + E 0 min
b) TYR + E 5 min
c) TYR + E 10 min
d) TYR + E 20 min
e) TYR + E 30 min
Cu
rre
nt (µ
A)
Potential (V)
a
Figure 3.2: CVs recorded at 50 mV/ s in wide scan range (A), and at 25 mV/ s at the narrow scan range (B) for the reaction mixture of tyrosine and tyrosinase in 50 mM PBS (pH 6.5) at
different times. Curve (a) 0 min, curve (b) 5 min, curve (c) 10 min, curve (d) 20 min, and then curve (e) 30 min.
The inhibition peak for the same reaction mixture was next studied in the presence of kojic acid,
a standard tyrosinase inhibitor (Chang, 2009) as a positive control, and DMSO as a negative
control (blank). As shown in Figure 3.3, an oxidation peak was observed and the oxidation
current increased in time from 8.99 X 10⁻³µA to 96 X 10-3µA at 131 mV, indicating that the
oxidation of tyrosine catalyzes by tyrosinase have been demonstrated. Figure 3.3 B showed no
redox peak and the inhibition current decreased and almost dropped to the background level in
time, indicating that the activity of tyrosinase was inhibited by kojic acid. These results are in
agreement with the previous work described (Xia, et al., 2013), and the proposed method will be
applicable for screening tyrosinase inhibitors from natural sources.
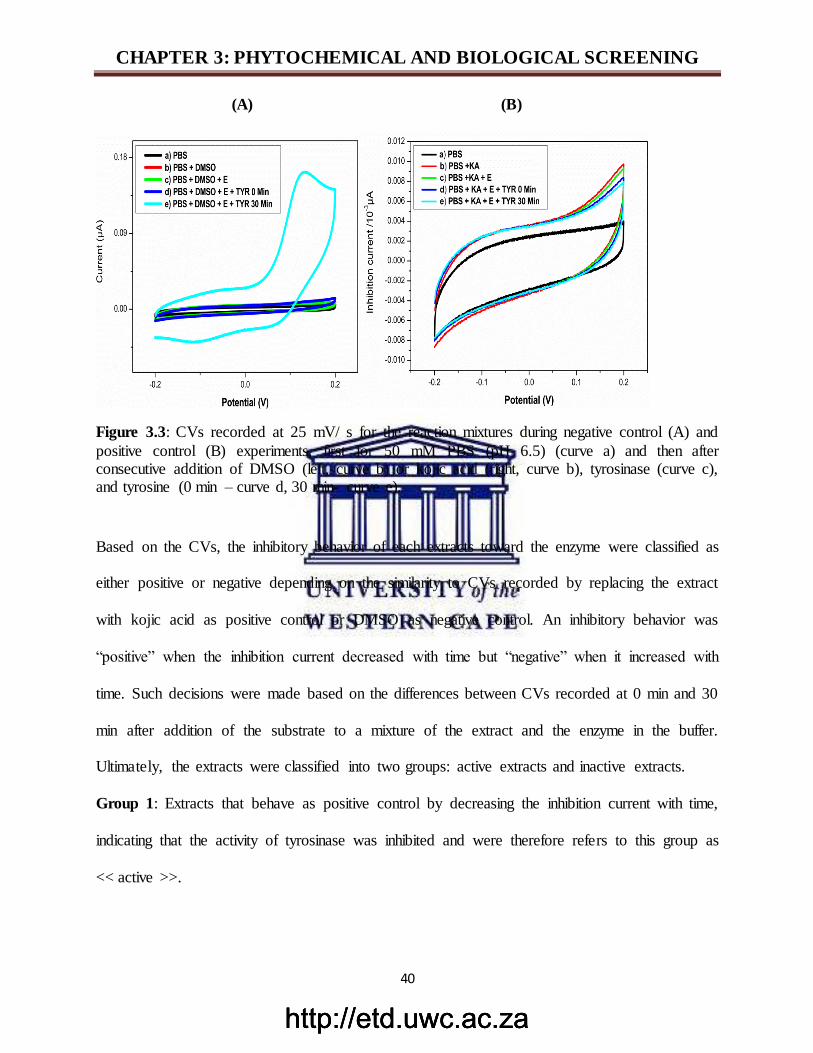
http://etd.uwc.ac.zahttp://etd.uwc.ac.zahttp://etd.uwc.ac.za
CHAPTER 3: PHYTOCHEMICAL AND BIOLOGICAL SCREENING
40
(A) (B)
Figure 3.3: CVs recorded at 25 mV/ s for the reaction mixtures during negative control (A) and
positive control (B) experiments, first for 50 mM PBS (pH 6.5) (curve a) and then after consecutive addition of DMSO (left, curve b) or kojic acid (right, curve b), tyrosinase (curve c), and tyrosine (0 min – curve d, 30 min- curve e).
Based on the CVs, the inhibitory behavior of each extracts toward the enzyme were classified as
either positive or negative depending on the similarity to CVs recorded by replacing the extract
with kojic acid as positive control or DMSO as negative control. An inhibitory behavior was
“positive” when the inhibition current decreased with time but “negative” when it increased with
time. Such decisions were made based on the differences between CVs recorded at 0 min and 30
min after addition of the substrate to a mixture of the extract and the enzyme in the buffer.
Ultimately, the extracts were classified into two groups: active extracts and inactive extracts.
Group 1: Extracts that behave as positive control by decreasing the inhibition current with time,
indicating that the activity of tyrosinase was inhibited and were therefore refers to this group as
<< active >>.
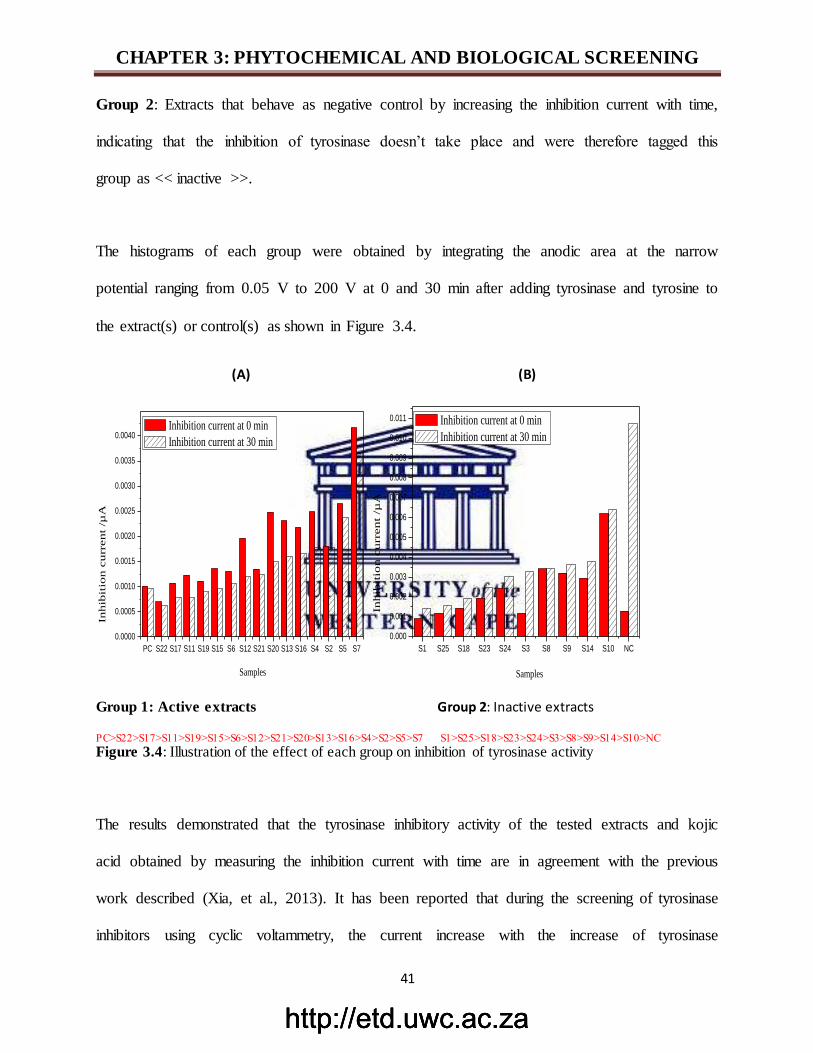
http://etd.uwc.ac.zahttp://etd.uwc.ac.zahttp://etd.uwc.ac.za
CHAPTER 3: PHYTOCHEMICAL AND BIOLOGICAL SCREENING
41
Group 2: Extracts that behave as negative control by increasing the inhibition current with time,
indicating that the inhibition of tyrosinase doesn’t take place and were therefore tagged this
group as << inactive >>.
The histograms of each group were obtained by integrating the anodic area at the narrow
potential ranging from 0.05 V to 200 V at 0 and 30 min after adding tyrosinase and tyrosine to
the extract(s) or control(s) as shown in Figure 3.4.
(A) (B)
PC S22 S17 S11 S19 S15 S6 S12 S21 S20 S13 S16 S4 S2 S5 S7
0.0000
0.0005
0.0010
0.0015
0.0020
0.0025
0.0030
0.0035
0.0040
Samples
Inhib
itio
n c
urr
ent
/µA
Inhibition current at 0 min
Inhibition current at 30 min
S1 S25 S18 S23 S24 S3 S8 S9 S14 S10 NC
0.000
0.001
0.002
0.003
0.004
0.005
0.006
0.007
0.008
0.009
0.010
0.011
Samples
Inh
ibit
ion
cu
rren
t /µ
A
Inhibition current at 0 min
Inhibition current at 30 min
Group 1: Active extracts Group 2: Inactive extracts
PC>S22>S17>S11>S19>S15>S6>S12>S21>S20>S13>S16>S4>S2>S5>S7 S1>S25>S18>S23>S24>S3>S8>S9>S14>S10>NC
Figure 3.4: Illustration of the effect of each group on inhibition of tyrosinase activity
The results demonstrated that the tyrosinase inhibitory activity of the tested extracts and kojic
acid obtained by measuring the inhibition current with time are in agreement with the previous
work described (Xia, et al., 2013). It has been reported that during the screening of tyrosinase
inhibitors using cyclic voltammetry, the current increase with the increase of tyrosinase
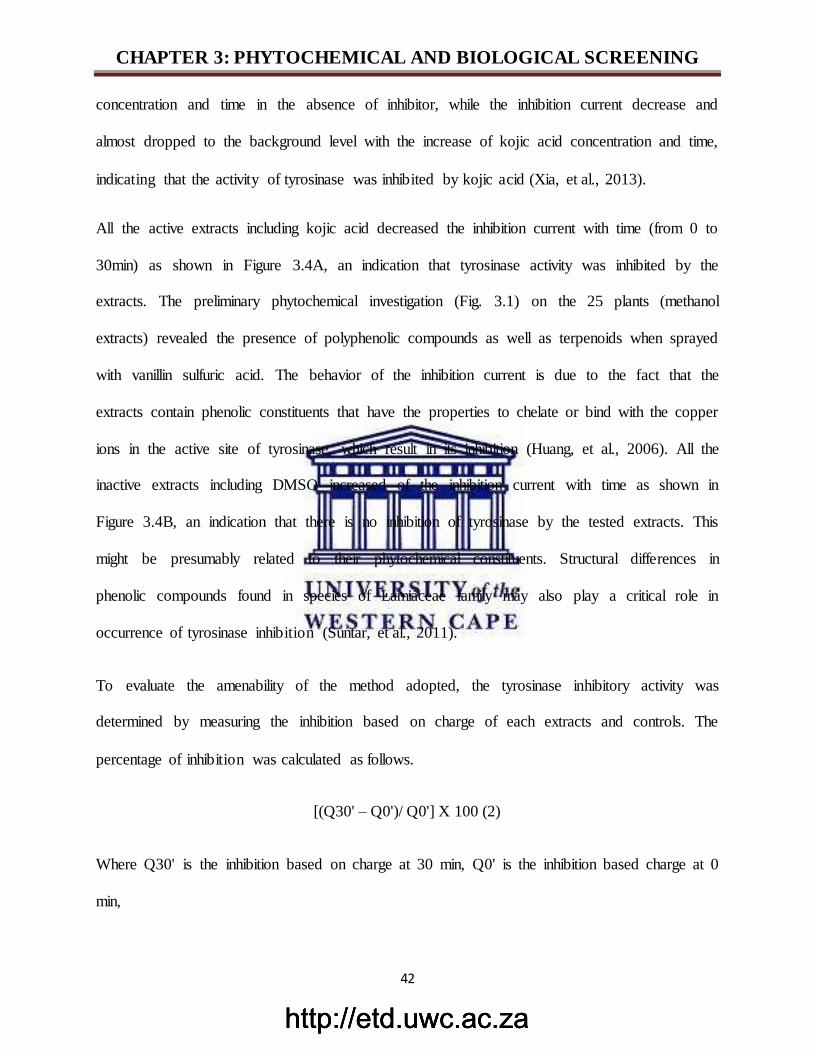
http://etd.uwc.ac.zahttp://etd.uwc.ac.zahttp://etd.uwc.ac.za
CHAPTER 3: PHYTOCHEMICAL AND BIOLOGICAL SCREENING
42
concentration and time in the absence of inhibitor, while the inhibition current decrease and
almost dropped to the background level with the increase of kojic acid concentration and time,
indicating that the activity of tyrosinase was inhibited by kojic acid (Xia, et al., 2013).
All the active extracts including kojic acid decreased the inhibition current with time (from 0 to
30min) as shown in Figure 3.4A, an indication that tyrosinase activity was inhibited by the
extracts. The preliminary phytochemical investigation (Fig. 3.1) on the 25 plants (methanol
extracts) revealed the presence of polyphenolic compounds as well as terpenoids when sprayed
with vanillin sulfuric acid. The behavior of the inhibition current is due to the fact that the
extracts contain phenolic constituents that have the properties to chelate or bind with the copper
ions in the active site of tyrosinase, which result in its inhibition (Huang, et al., 2006). All the
inactive extracts including DMSO increased of the inhibition current with time as shown in
Figure 3.4B, an indication that there is no inhibition of tyrosinase by the tested extracts. This
might be presumably related to their phytochemical constituents. Structural differences in
phenolic compounds found in species of Lamiaceae family may also play a critical role in
occurrence of tyrosinase inhibition (Suntar, et al., 2011).
To evaluate the amenability of the method adopted, the tyrosinase inhibitory activity was
determined by measuring the inhibition based on charge of each extracts and controls. The
percentage of inhibition was calculated as follows.
[(Q30' – Q0')/ Q0'] X 100 (2)
Where Q30' is the inhibition based on charge at 30 min, Q0' is the inhibition based charge at 0
min,
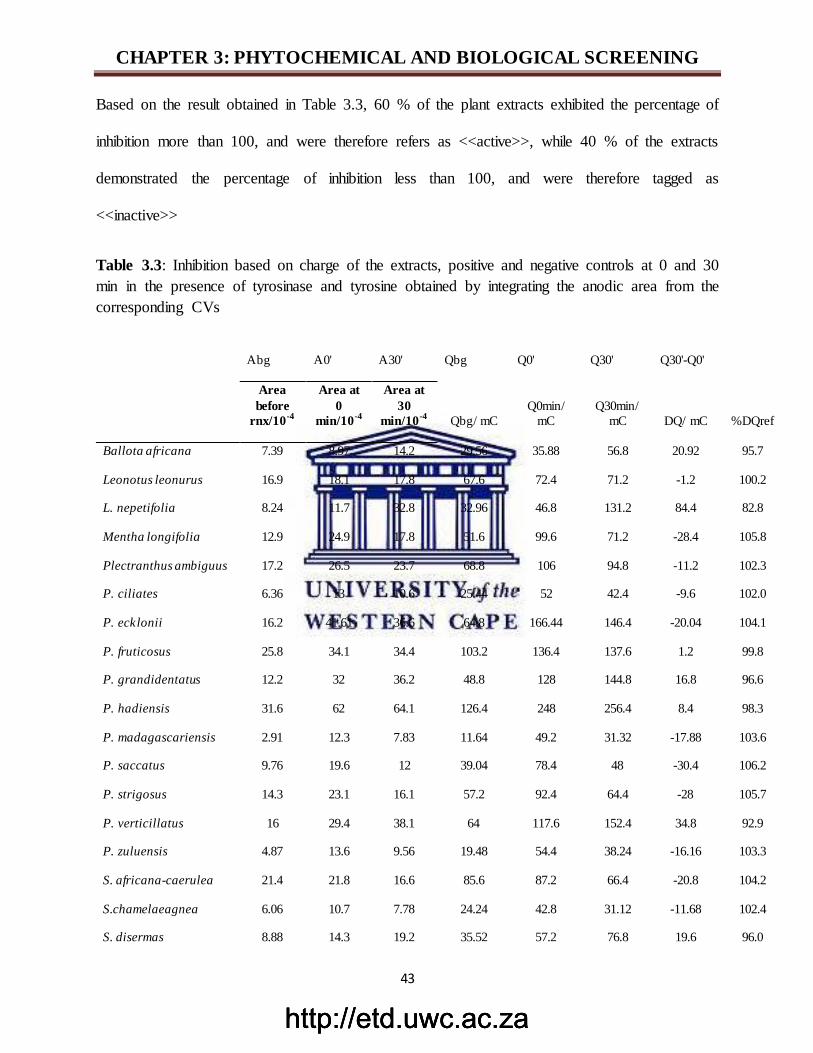
http://etd.uwc.ac.zahttp://etd.uwc.ac.zahttp://etd.uwc.ac.za
CHAPTER 3: PHYTOCHEMICAL AND BIOLOGICAL SCREENING
43
Based on the result obtained in Table 3.3, 60 % of the plant extracts exhibited the percentage of
inhibition more than 100, and were therefore refers as <<active>>, while 40 % of the extracts
demonstrated the percentage of inhibition less than 100, and were therefore tagged as
<<inactive>>
Table 3.3: Inhibition based on charge of the extracts, positive and negative controls at 0 and 30
min in the presence of tyrosinase and tyrosine obtained by integrating the anodic area from the
corresponding CVs
Abg A0' A30' Qbg Q0' Q30' Q30'-Q0'
Area
before
rnx/10-4
Area at
0
min/10-4
Area at
30
min/10-4
Qbg/ mC
Q0min/
mC
Q30min/
mC DQ/ mC %DQref
Ballota africana 7.39 8.97 14.2 29.56 35.88 56.8 20.92 95.7
Leonotus leonurus 16.9 18.1 17.8 67.6 72.4 71.2 -1.2 100.2
L. nepetifolia 8.24 11.7 32.8 32.96 46.8 131.2 84.4 82.8
Mentha longifolia 12.9 24.9 17.8 51.6 99.6 71.2 -28.4 105.8
Plectranthus ambiguus 17.2 26.5 23.7 68.8 106 94.8 -11.2 102.3
P. ciliates 6.36 13 10.6 25.44 52 42.4 -9.6 102.0
P. ecklonii 16.2 41.61 36.6 64.8 166.44 146.4 -20.04 104.1
P. fruticosus 25.8 34.1 34.4 103.2 136.4 137.6 1.2 99.8
P. grandidentatus 12.2 32 36.2 48.8 128 144.8 16.8 96.6
P. hadiensis 31.6 62 64.1 126.4 248 256.4 8.4 98.3
P. madagascariensis 2.91 12.3 7.83 11.64 49.2 31.32 -17.88 103.6
P. saccatus 9.76 19.6 12 39.04 78.4 48 -30.4 106.2
P. strigosus 14.3 23.1 16.1 57.2 92.4 64.4 -28 105.7
P. verticillatus 16 29.4 38.1 64 117.6 152.4 34.8 92.9
P. zuluensis 4.87 13.6 9.56 19.48 54.4 38.24 -16.16 103.3
S. africana-caerulea 21.4 21.8 16.6 85.6 87.2 66.4 -20.8 104.2
S.chamelaeagnea 6.06 10.7 7.78 24.24 42.8 31.12 -11.68 102.4
S. disermas 8.88 14.3 19.2 35.52 57.2 76.8 19.6 96.0
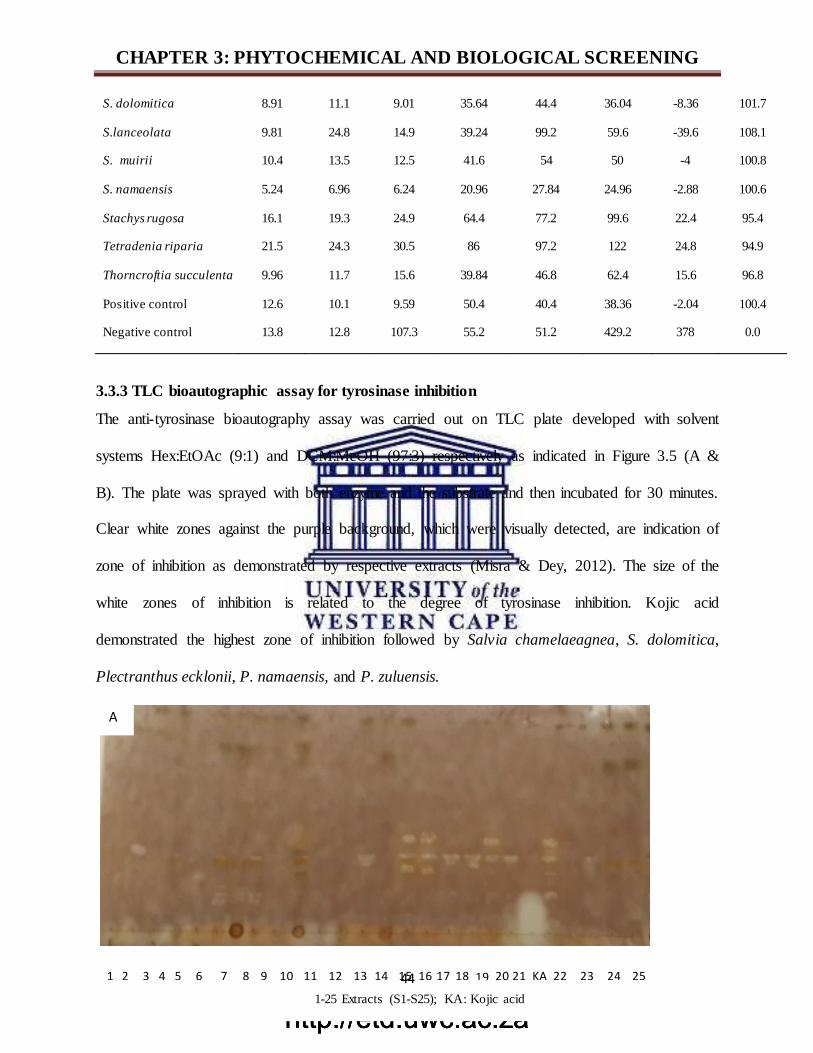
http://etd.uwc.ac.zahttp://etd.uwc.ac.zahttp://etd.uwc.ac.za
CHAPTER 3: PHYTOCHEMICAL AND BIOLOGICAL SCREENING
44
S. dolomitica 8.91 11.1 9.01 35.64 44.4 36.04 -8.36 101.7
S.lanceolata 9.81 24.8 14.9 39.24 99.2 59.6 -39.6 108.1
S. muirii 10.4 13.5 12.5 41.6 54 50 -4 100.8
S. namaensis 5.24 6.96 6.24 20.96 27.84 24.96 -2.88 100.6
Stachys rugosa 16.1 19.3 24.9 64.4 77.2 99.6 22.4 95.4
Tetradenia riparia 21.5 24.3 30.5 86 97.2 122 24.8 94.9
Thorncroftia succulenta 9.96 11.7 15.6 39.84 46.8 62.4 15.6 96.8
Positive control 12.6 10.1 9.59 50.4 40.4 38.36 -2.04 100.4
Negative control 13.8 12.8 107.3 55.2 51.2 429.2 378 0.0
3.3.3 TLC bioautographic assay for tyrosinase inhibition
The anti-tyrosinase bioautography assay was carried out on TLC plate developed with solvent
systems Hex:EtOAc (9:1) and DCM:MeOH (97:3) respectively as indicated in Figure 3.5 (A &
B). The plate was sprayed with both enzyme and the substrate and then incubated for 30 minutes.
Clear white zones against the purple background, which were visually detected, are indication of
zone of inhibition as demonstrated by respective extracts (Misra & Dey, 2012). The size of the
white zones of inhibition is related to the degree of tyrosinase inhibition. Kojic acid
demonstrated the highest zone of inhibition followed by Salvia chamelaeagnea, S. dolomitica,
Plectranthus ecklonii, P. namaensis, and P. zuluensis.
1 2 3 4 5 6 7 8 9 10 11 12 13 14 15 16 KA 17 18 19 20 21 22 23 24 25
A
1-25 Extracts (S1-S25); KA: Kojic acid
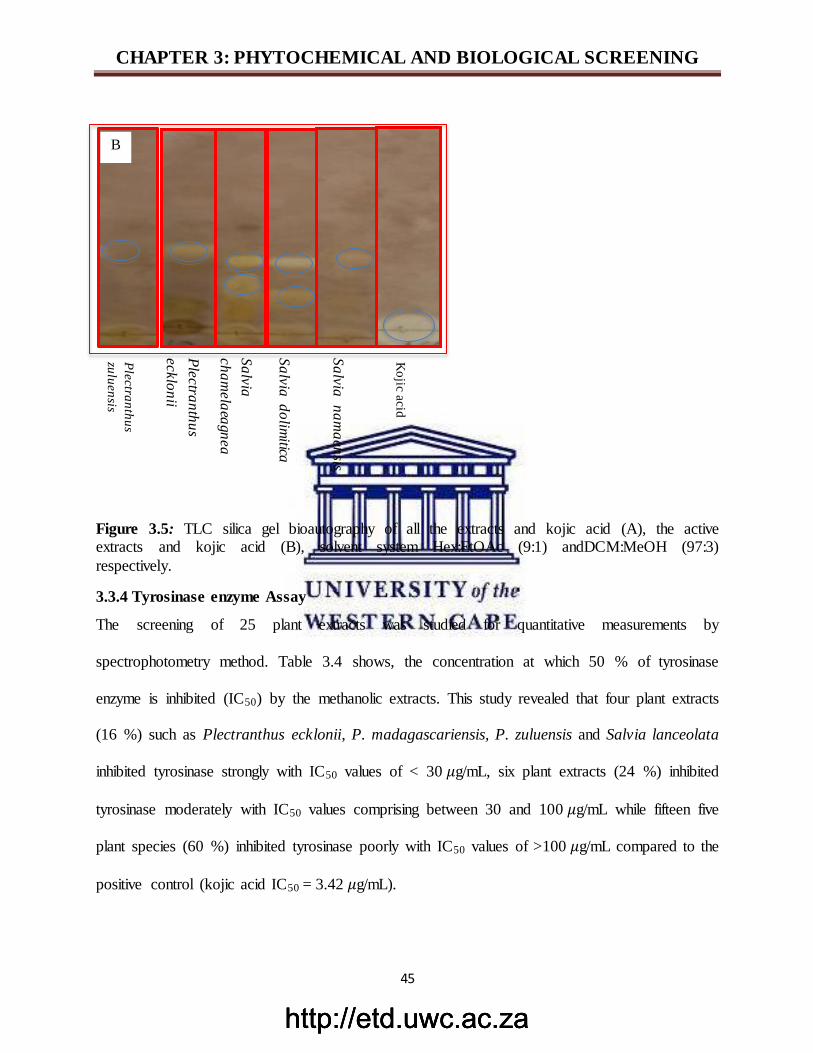
http://etd.uwc.ac.zahttp://etd.uwc.ac.zahttp://etd.uwc.ac.za
CHAPTER 3: PHYTOCHEMICAL AND BIOLOGICAL SCREENING
45
Figure 3.5: TLC silica gel bioautography of all the extracts and kojic acid (A), the active extracts and kojic acid (B), solvent system Hex:EtOAc (9:1) andDCM:MeOH (97:3)
respectively.
3.3.4 Tyrosinase enzyme Assay
The screening of 25 plant extracts was studied for quantitative measurements by
spectrophotometry method. Table 3.4 shows, the concentration at which 50 % of tyrosinase
enzyme is inhibited (IC50) by the methanolic extracts. This study revealed that four plant extracts
(16 %) such as Plectranthus ecklonii, P. madagascariensis, P. zuluensis and Salvia lanceolata
inhibited tyrosinase strongly with IC50 values of < 30 𝜇g/mL, six plant extracts (24 %) inhibited
tyrosinase moderately with IC50 values comprising between 30 and 100 𝜇g/mL while fifteen five
plant species (60 %) inhibited tyrosinase poorly with IC50 values of >100 𝜇g/mL compared to the
positive control (kojic acid IC50 = 3.42 𝜇g/mL).
Ko
jic a
cid
Ple
ctra
nth
us
ecklo
nii
Sa
lvia
ch
am
ela
eagn
ea
Sa
lvia
do
limitica
Sa
lvia
na
ma
en
sis
Ple
ctra
nth
us
zulu
en
sis
B
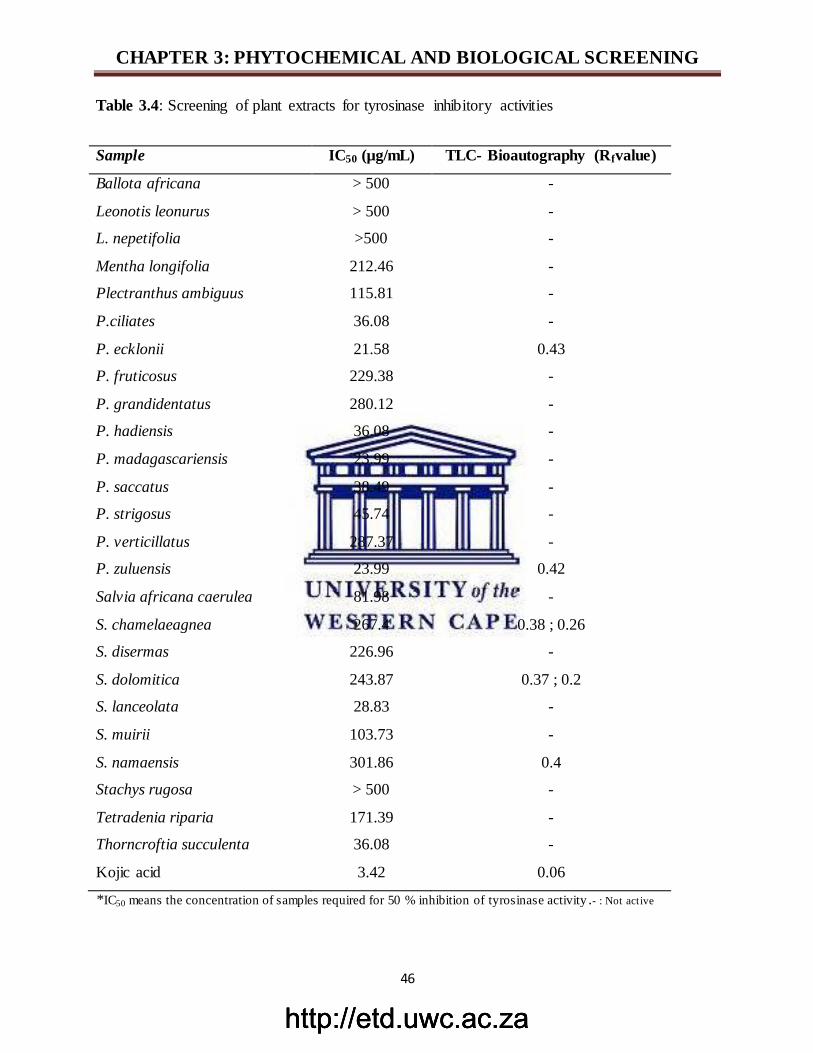
http://etd.uwc.ac.zahttp://etd.uwc.ac.zahttp://etd.uwc.ac.za
CHAPTER 3: PHYTOCHEMICAL AND BIOLOGICAL SCREENING
46
Table 3.4: Screening of plant extracts for tyrosinase inhibitory activities
Sample IC50 (µg/mL) TLC- Bioautography (Rfvalue)
Ballota africana > 500 -
Leonotis leonurus > 500 -
L. nepetifolia >500 -
Mentha longifolia 212.46 -
Plectranthus ambiguus 115.81 -
P.ciliates 36.08 -
P. ecklonii 21.58 0.43
P. fruticosus 229.38 -
P. grandidentatus 280.12 -
P. hadiensis 36.08 -
P. madagascariensis 23.99 -
P. saccatus 38.49 -
P. strigosus 45.74 -
P. verticillatus 287.37 -
P. zuluensis 23.99 0.42
Salvia africana caerulea 81.98 -
S. chamelaeagnea 267.4 0.38 ; 0.26
S. disermas 226.96 -
S. dolomitica 243.87 0.37 ; 0.2
S. lanceolata 28.83 -
S. muirii 103.73 -
S. namaensis 301.86 0.4
Stachys rugosa > 500 -
Tetradenia riparia 171.39 -
Thorncroftia succulenta 36.08 -
Kojic acid 3.42 0.06
*IC50 means the concentration of samples required for 50 % inhibition of tyrosinase activity .- : Not active
http://etd.uwc.ac.zahttp://etd.uwc.ac.zahttp://etd.uwc.ac.za
CHAPTER 3: PHYTOCHEMICAL AND BIOLOGICAL SCREENING
47
To summarize the outcome of the findings from the screening of plant materials for tyrosinase
inhibitors using three complementary methods, cyclic voltammetry commonly used as suitable
tool for detection of phenolic and antioxidant compounds through electrochemical measurement
(Dobes, et al., 2013), was used for the first time for detection of tyrosinase inhibitors based on
the behavior of each extracts toward tyrosinase and tyrosine by increasing or decreasing the
inhibition current with time as controls. CVs developed nominated Leonotis leonurus,
Plectranthus madagascariensis, P. saccatus, P. zuluensis P. saccatus, P. ecklonii, S. lanceolata,
S. dolomitica and Salvia chamelaeagnea, as strong tyrosinase inhibitors due to the fact that they
strongly decreased the inhibition current with time in the comparative manner with kojic acid.
TLC bioautography, known as a quick and simple technique for screening of tyrosinase
inhibitors (Wangthong, et al., 2007) was developed to detect extracts which have the potency to
inhibit tyrosinase activity. Five extracts such as P. ecklonii, P. zuluensis, S. chamelaeagnea, S.
dolimitica, and S. namaensis, demonstrated very clear white zone of inhibition on TLC plate.
The appeared of white spots against a browning-purple background onto the TLC plate is an
indication of the inhibition of the conversion of tyrosinase catalyzed by tyrosine to melanin
(Misra & Dey, 2012). Spectrophotometric method nominated P. ecklonii, P. madagascariensis,
P. zuluensis and S. lanceolata as strong tyrosinase inhibitors.
These three complementary methods showed significant level of agreement as indicated,
suggesting how reliable of the methods adopted by the investigation. For instance, P. zuluensis
and P. ecklonii were identified by the three methods carried out, while two out of the three
assays nominated P. madagascariensis, S. chamelaeaegnea, S. namaensis, S. lanceolata,and S.
dolomitica as natural plants for anti-tyrosinase activities.
http://etd.uwc.ac.zahttp://etd.uwc.ac.zahttp://etd.uwc.ac.za
CHAPTER 4: ANTI-TYROSINASE AND TOTAL ANTIOXIDANT ACTIVITIES OF ISOLATED COMPOUNDS
48
CHAPTER 4: ANTI-TYROSINASE AND TOTAL ANTIOXIDANT
ACTIVITIES OF ISOLATED CONSTITUENTS OF SALVIA
CHAMELAEAGNEA
4.1 Introduction
The preliminary phytochemical, bioautography, cyclic voltammetry and spectrophotometry
screening of 25 plant species of Lamiaceae family carried out in Chapter 3 nominated S.
chamelaeagnea as one of the most biologically active extract. However, the clear zone of
inhibition in TLC-bioautography determined the final selection of this species. Thus,
chromatographic isolation of compounds responsible for these biological profiles was carried out
to elucidate their chemical structures and establish various biological specificity demonstrated by
each compounds.
4.2 Background information on Salvia chamelaeagnea
Salvia chamelaeagnea (Lamiaceae; Salvia) is a flowering plant, commonly known as “sage”, a
slow growing evergreen shrub growing up to 2 m with a spread of about 1 m originating from the
South Western area of the Cape of Good Hope (Fig 4.1 B). In its natural habitat, S.
chamelaeagnea develops into attractive foliage and flowering landscape plant, with small mid-
green egg shaped leaves and masses of bright blue or white flowers (Fig 4.1 A) (Kamatou, et al.,
2007). This plant has been used for medicinal purposes such as treating coughs and colds, colic
and heartburn. History also documented that extract of this plant exhibit pharmaceutical effect
against various microbial and bacterial infections (Kamatou, et al., 2008; Strelitzia, 2013)
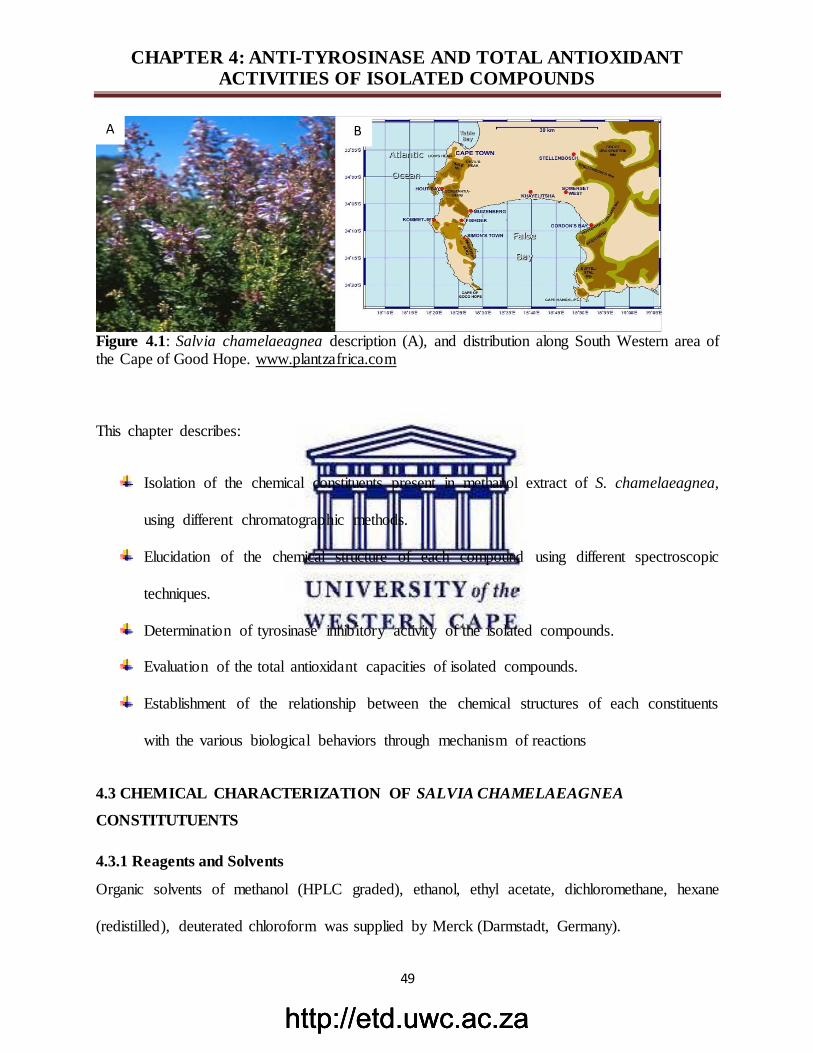
http://etd.uwc.ac.zahttp://etd.uwc.ac.zahttp://etd.uwc.ac.za
CHAPTER 4: ANTI-TYROSINASE AND TOTAL ANTIOXIDANT ACTIVITIES OF ISOLATED COMPOUNDS
49
Figure 4.1: Salvia chamelaeagnea description (A), and distribution along South Western area of the Cape of Good Hope. www.plantzafrica.com
This chapter describes:
Isolation of the chemical constituents present in methanol extract of S. chamelaeagnea,
using different chromatographic methods.
Elucidation of the chemical structure of each compound using different spectroscopic
techniques.
Determination of tyrosinase inhibitory activity of the isolated compounds.
Evaluation of the total antioxidant capacities of isolated compounds.
Establishment of the relationship between the chemical structures of each constituents
with the various biological behaviors through mechanism of reactions
4.3 CHEMICAL CHARACTERIZATION OF SALVIA CHAMELAEAGNEA
CONSTITUTUENTS
4.3.1 Reagents and Solvents
Organic solvents of methanol (HPLC graded), ethanol, ethyl acetate, dichloromethane, hexane
(redistilled), deuterated chloroform was supplied by Merck (Darmstadt, Germany).
A B
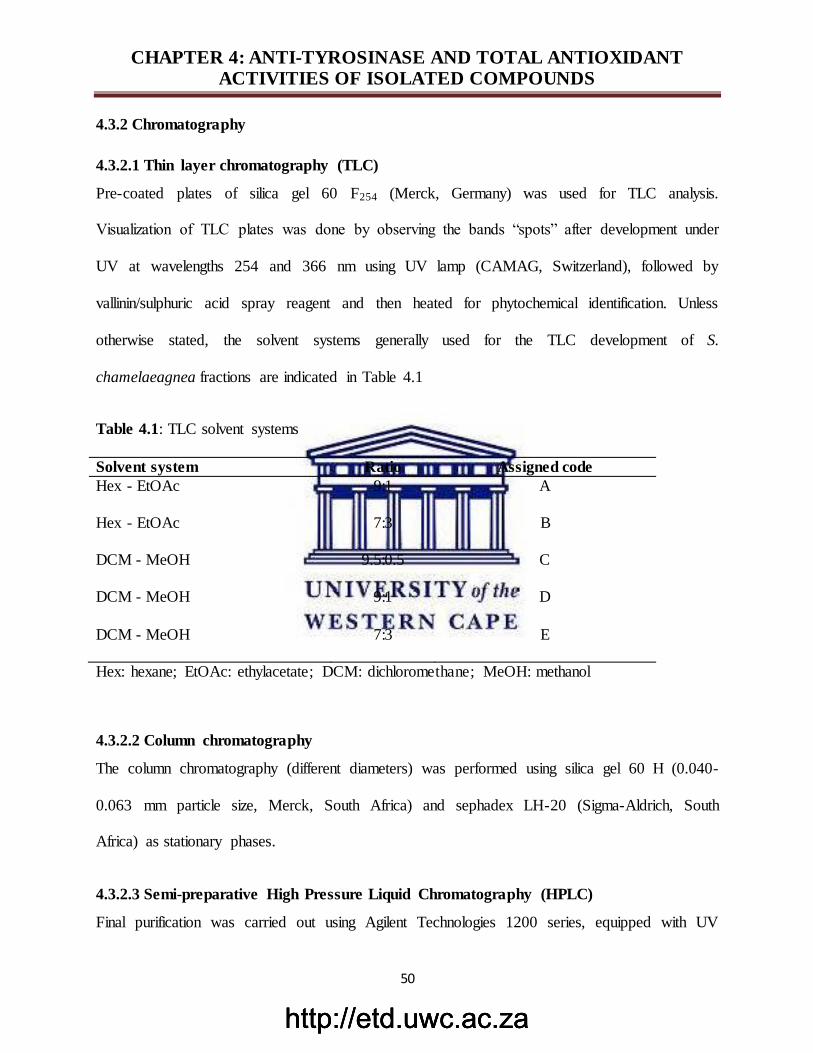
http://etd.uwc.ac.zahttp://etd.uwc.ac.zahttp://etd.uwc.ac.za
CHAPTER 4: ANTI-TYROSINASE AND TOTAL ANTIOXIDANT ACTIVITIES OF ISOLATED COMPOUNDS
50
4.3.2 Chromatography
4.3.2.1 Thin layer chromatography (TLC)
Pre-coated plates of silica gel 60 F254 (Merck, Germany) was used for TLC analysis.
Visualization of TLC plates was done by observing the bands “spots” after development under
UV at wavelengths 254 and 366 nm using UV lamp (CAMAG, Switzerland), followed by
vallinin/sulphuric acid spray reagent and then heated for phytochemical identification. Unless
otherwise stated, the solvent systems generally used for the TLC development of S.
chamelaeagnea fractions are indicated in Table 4.1
Table 4.1: TLC solvent systems
Solvent system Ratio Assigned code
Hex - EtOAc 9:1 A
Hex - EtOAc 7:3 B
DCM - MeOH 9.5:0.5 C
DCM - MeOH 9:1 D
DCM - MeOH 7:3 E
Hex: hexane; EtOAc: ethylacetate; DCM: dichloromethane; MeOH: methanol
4.3.2.2 Column chromatography
The column chromatography (different diameters) was performed using silica gel 60 H (0.040-
0.063 mm particle size, Merck, South Africa) and sephadex LH-20 (Sigma-Aldrich, South
Africa) as stationary phases.
4.3.2.3 Semi-preparative High Pressure Liquid Chromatography (HPLC)
Final purification was carried out using Agilent Technologies 1200 series, equipped with UV
http://etd.uwc.ac.zahttp://etd.uwc.ac.zahttp://etd.uwc.ac.za
CHAPTER 4: ANTI-TYROSINASE AND TOTAL ANTIOXIDANT ACTIVITIES OF ISOLATED COMPOUNDS
51
detector, manual injector, quaternary pump (G1311A), vacuum degasser (G1322A), column
compartment (G1316A) and reversed phase C18 column SUPELCO (25 x 1.0 cm, 5 𝜇𝑚). The
flow rate was set at 1.5 mL/min. All experiments were done at room temperature (20 o C).
4.3.3. Nuclear magnetic resonance (NMR) spectroscopy
NMR spectra were recorded at 20oC, using deuterated chloroform on a Bruker Avance 400 MHz
NMR spectrometer (Germany), Chemical shifts of 1H (𝛿H) and 13C (𝛿C) in ppm were determined
relative to tetramethylsilane (TMS) as internal reference.
4.4 Collection and identification of plant material
The plant material used in this study was collected from the Cape Flats Nature Reserve as
mentioned in chapter 3.
4.5 Extraction and Fractionation of total extract
The aerial parts of the fresh plant material (1.0887 Kg) were blended and extracted with
methanol (4.5 L) at room temperature (25 oC) for 24 hours. The methanol extract was filtered
and evaporated to dryness under reduced pressure at 40 oC to yield 29.55 g (2.71 %). The
extracts were kept under cold conditions for further use. The total extract of S. chamelaeagnea
(29 g) was applied to a silica gel column (30 x 18 cm) and eluted using gradient of hexane and
ethyl acetate in order of increasing polarity as indicated in Table 4.2. Sixty four (64) fractions
(500 mL each) were collected during the process and numbered 1-64.
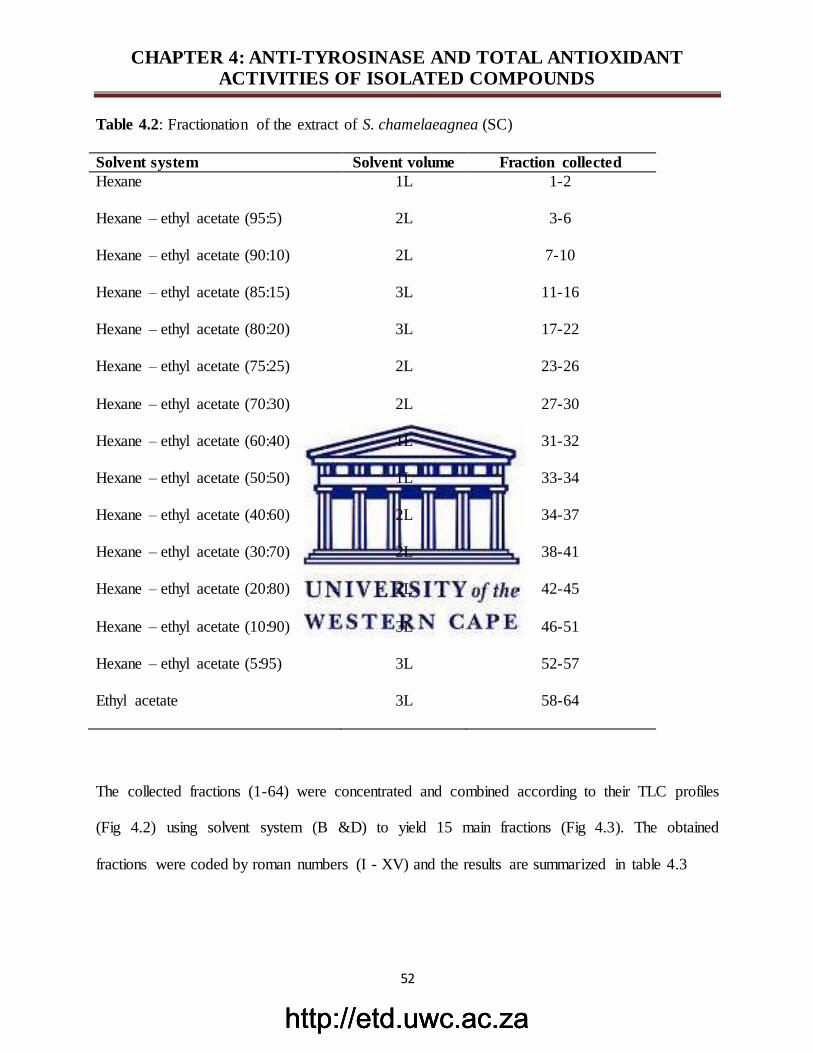
http://etd.uwc.ac.zahttp://etd.uwc.ac.zahttp://etd.uwc.ac.za
CHAPTER 4: ANTI-TYROSINASE AND TOTAL ANTIOXIDANT ACTIVITIES OF ISOLATED COMPOUNDS
52
Table 4.2: Fractionation of the extract of S. chamelaeagnea (SC)
Solvent system Solvent volume Fraction collected
Hexane 1L 1-2
Hexane – ethyl acetate (95:5) 2L 3-6
Hexane – ethyl acetate (90:10) 2L 7-10
Hexane – ethyl acetate (85:15) 3L 11-16
Hexane – ethyl acetate (80:20) 3L 17-22
Hexane – ethyl acetate (75:25) 2L 23-26
Hexane – ethyl acetate (70:30) 2L 27-30
Hexane – ethyl acetate (60:40) 1L 31-32
Hexane – ethyl acetate (50:50) 1L 33-34
Hexane – ethyl acetate (40:60) 2L 34-37
Hexane – ethyl acetate (30:70) 2L 38-41
Hexane – ethyl acetate (20:80) 2L 42-45
Hexane – ethyl acetate (10:90) 3L 46-51
Hexane – ethyl acetate (5:95) 3L 52-57
Ethyl acetate 3L 58-64
The collected fractions (1-64) were concentrated and combined according to their TLC profiles
(Fig 4.2) using solvent system (B &D) to yield 15 main fractions (Fig 4.3). The obtained
fractions were coded by roman numbers (I - XV) and the results are summarized in table 4.3
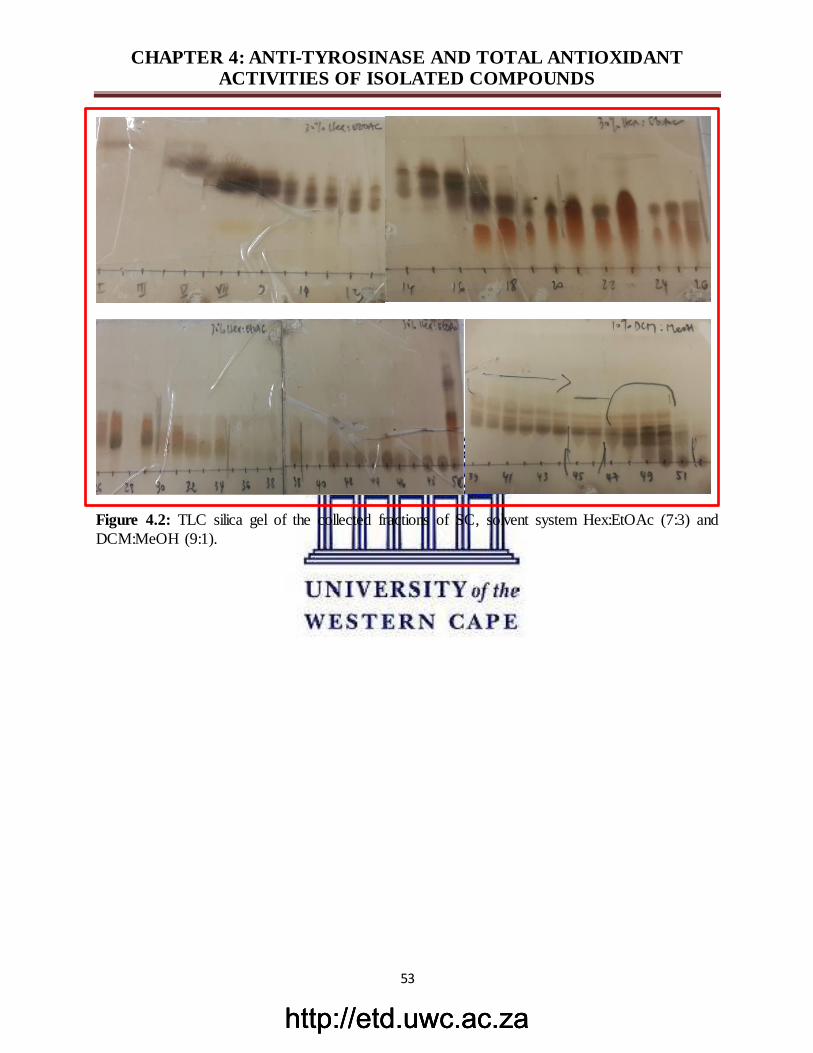
http://etd.uwc.ac.zahttp://etd.uwc.ac.zahttp://etd.uwc.ac.za
CHAPTER 4: ANTI-TYROSINASE AND TOTAL ANTIOXIDANT ACTIVITIES OF ISOLATED COMPOUNDS
53
Figure 4.2: TLC silica gel of the collected fractions of SC, solvent system Hex:EtOAc (7:3) and
DCM:MeOH (9:1).
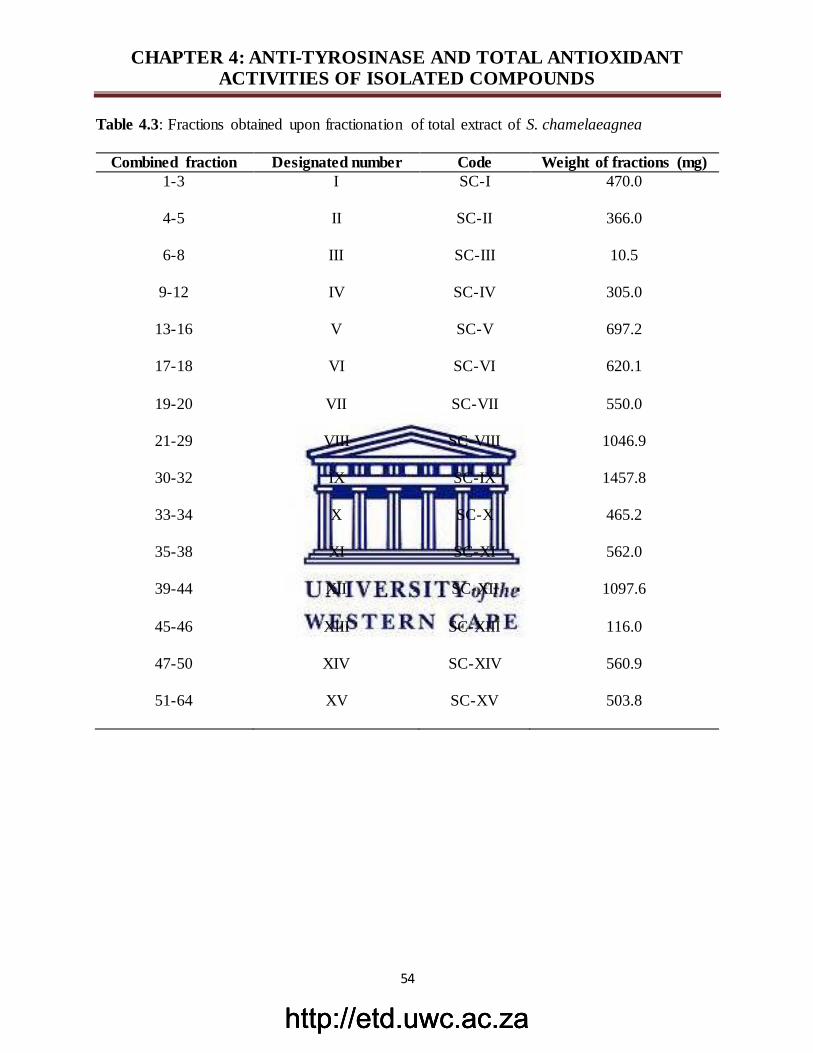
http://etd.uwc.ac.zahttp://etd.uwc.ac.zahttp://etd.uwc.ac.za
CHAPTER 4: ANTI-TYROSINASE AND TOTAL ANTIOXIDANT ACTIVITIES OF ISOLATED COMPOUNDS
54
Table 4.3: Fractions obtained upon fractionation of total extract of S. chamelaeagnea
Combined fraction Designated number Code Weight of fractions (mg)
1-3 I SC-I 470.0
4-5 II SC-II 366.0
6-8 III SC-III 10.5
9-12 IV SC-IV 305.0
13-16 V SC-V 697.2
17-18 VI SC-VI 620.1
19-20 VII SC-VII 550.0
21-29 VIII SC-VIII 1046.9
30-32 IX SC-IX 1457.8
33-34 X SC-X 465.2
35-38 XI SC-XI 562.0
39-44 XII SC-XII 1097.6
45-46 XIII SC-XIII 116.0
47-50 XIV SC-XIV 560.9
51-64 XV SC-XV 503.8
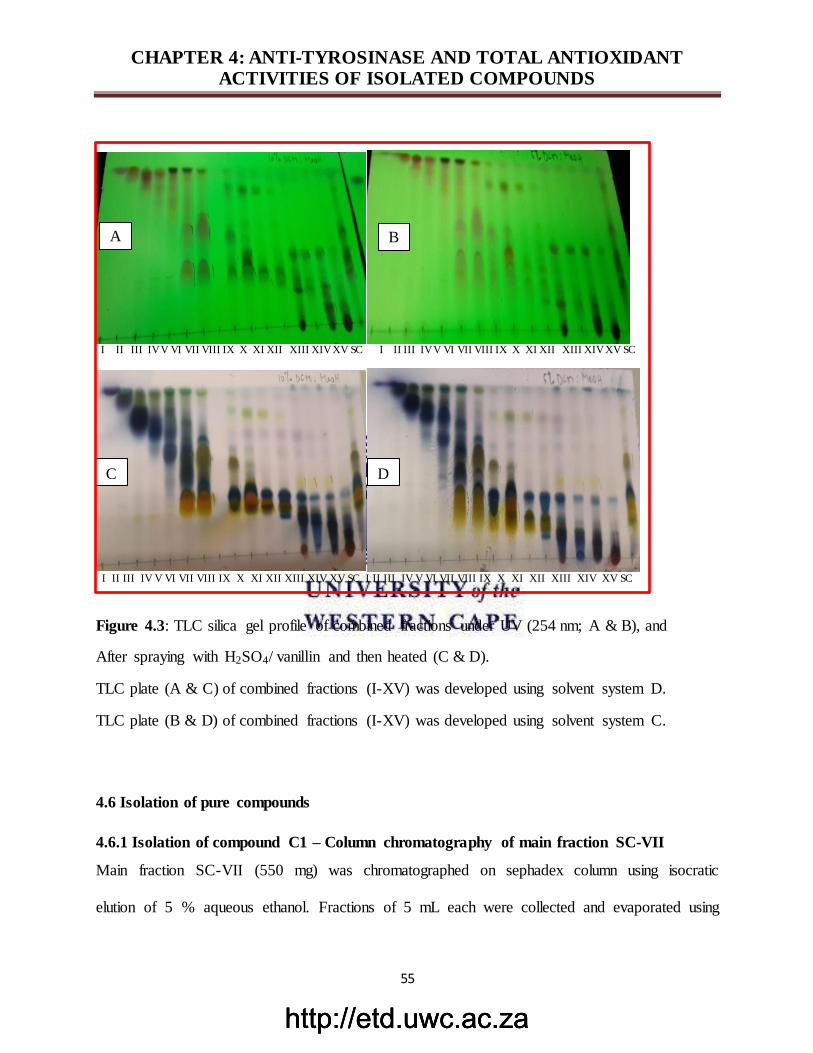
http://etd.uwc.ac.zahttp://etd.uwc.ac.zahttp://etd.uwc.ac.za
CHAPTER 4: ANTI-TYROSINASE AND TOTAL ANTIOXIDANT ACTIVITIES OF ISOLATED COMPOUNDS
55
I II III IV V VI VII VIII IX X XI XII XIII XIV XV SC I II III IV V VI VII VIII IX X XI XII XIII XIV XV SC
I II III IV V VI VII VIII IX X XI XII XIII XIV XV SC I II III IV V VI VII VIII IX X XI XII XIII XIV XV SC
Figure 4.3: TLC silica gel profile of combined fractions under UV (254 nm; A & B), and
After spraying with H2SO4/ vanillin and then heated (C & D).
TLC plate (A & C) of combined fractions (I-XV) was developed using solvent system D.
TLC plate (B & D) of combined fractions (I-XV) was developed using solvent system C.
4.6 Isolation of pure compounds
4.6.1 Isolation of compound C1 – Column chromatography of main fraction SC-VII
Main fraction SC-VII (550 mg) was chromatographed on sephadex column using isocratic
elution of 5 % aqueous ethanol. Fractions of 5 mL each were collected and evaporated using
A B
C
B
D
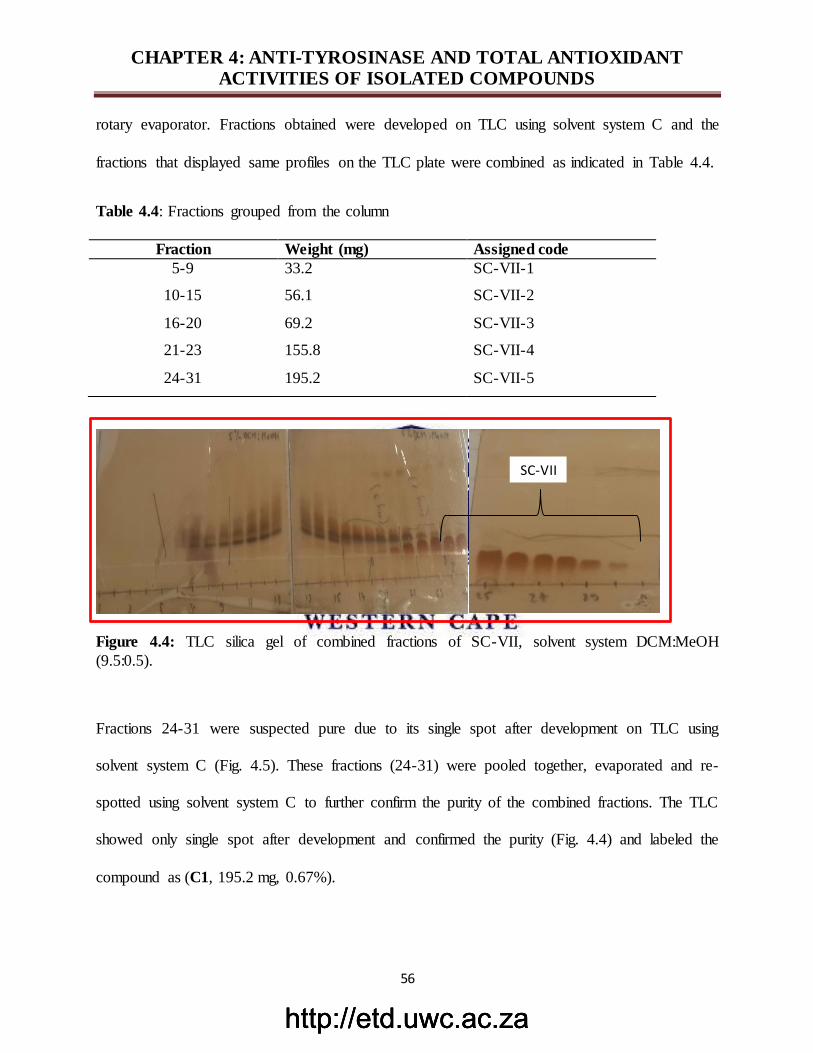
http://etd.uwc.ac.zahttp://etd.uwc.ac.zahttp://etd.uwc.ac.za
CHAPTER 4: ANTI-TYROSINASE AND TOTAL ANTIOXIDANT ACTIVITIES OF ISOLATED COMPOUNDS
56
rotary evaporator. Fractions obtained were developed on TLC using solvent system C and the
fractions that displayed same profiles on the TLC plate were combined as indicated in Table 4.4.
Table 4.4: Fractions grouped from the column
Fraction Weight (mg) Assigned code
5-9 33.2 SC-VII-1
10-15 56.1 SC-VII-2
16-20 69.2 SC-VII-3
21-23 155.8 SC-VII-4
24-31 195.2 SC-VII-5
Figure 4.4: TLC silica gel of combined fractions of SC-VII, solvent system DCM:MeOH
(9.5:0.5).
Fractions 24-31 were suspected pure due to its single spot after development on TLC using
solvent system C (Fig. 4.5). These fractions (24-31) were pooled together, evaporated and re-
spotted using solvent system C to further confirm the purity of the combined fractions. The TLC
showed only single spot after development and confirmed the purity (Fig. 4.4) and labeled the
compound as (C1, 195.2 mg, 0.67%).
SC-VII
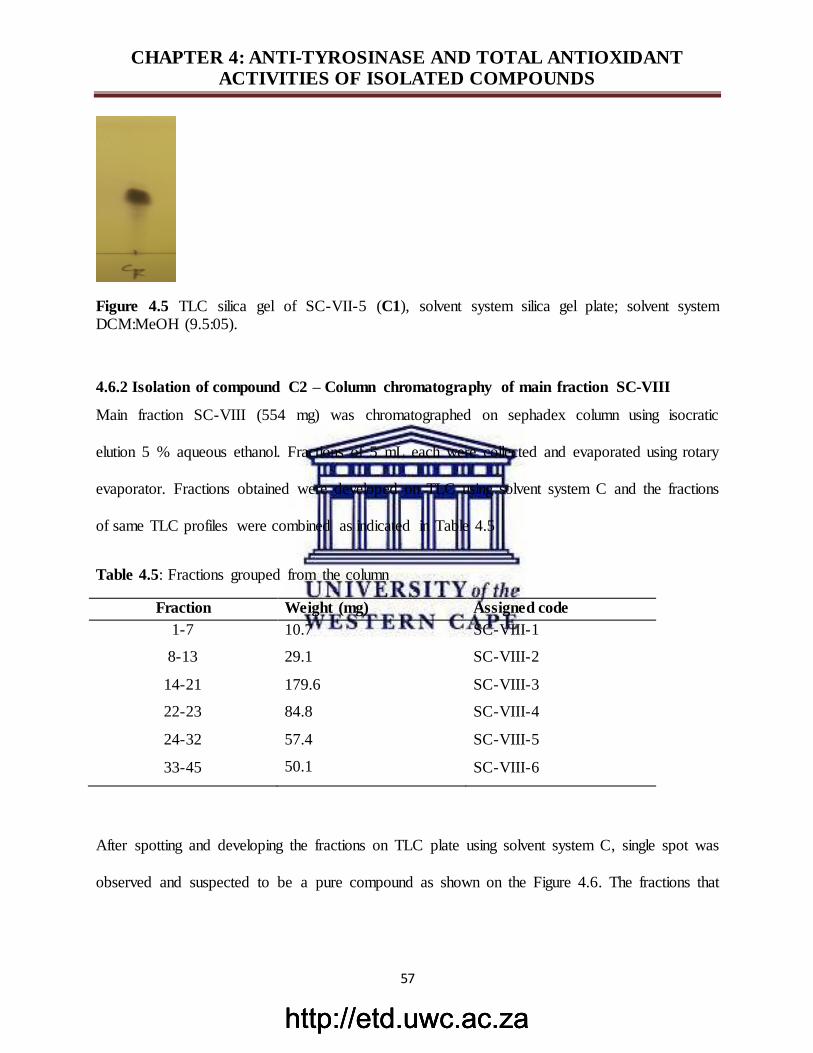
http://etd.uwc.ac.zahttp://etd.uwc.ac.zahttp://etd.uwc.ac.za
CHAPTER 4: ANTI-TYROSINASE AND TOTAL ANTIOXIDANT ACTIVITIES OF ISOLATED COMPOUNDS
57
Figure 4.5 TLC silica gel of SC-VII-5 (C1), solvent system silica gel plate; solvent system DCM:MeOH (9.5:05).
4.6.2 Isolation of compound C2 – Column chromatography of main fraction SC-VIII
Main fraction SC-VIII (554 mg) was chromatographed on sephadex column using isocratic
elution 5 % aqueous ethanol. Fractions of 5 mL each were collected and evaporated using rotary
evaporator. Fractions obtained were developed on TLC using solvent system C and the fractions
of same TLC profiles were combined as indicated in Table 4.5
Table 4.5: Fractions grouped from the column
Fraction Weight (mg) Assigned code
1-7 10.7 SC-VIII-1
8-13 29.1 SC-VIII-2
14-21 179.6 SC-VIII-3
22-23 84.8 SC-VIII-4
24-32
33-45
57.4 SC-VIII-5
SC-VIII-6
After spotting and developing the fractions on TLC plate using solvent system C, single spot was
observed and suspected to be a pure compound as shown on the Figure 4.6. The fractions that
50.1
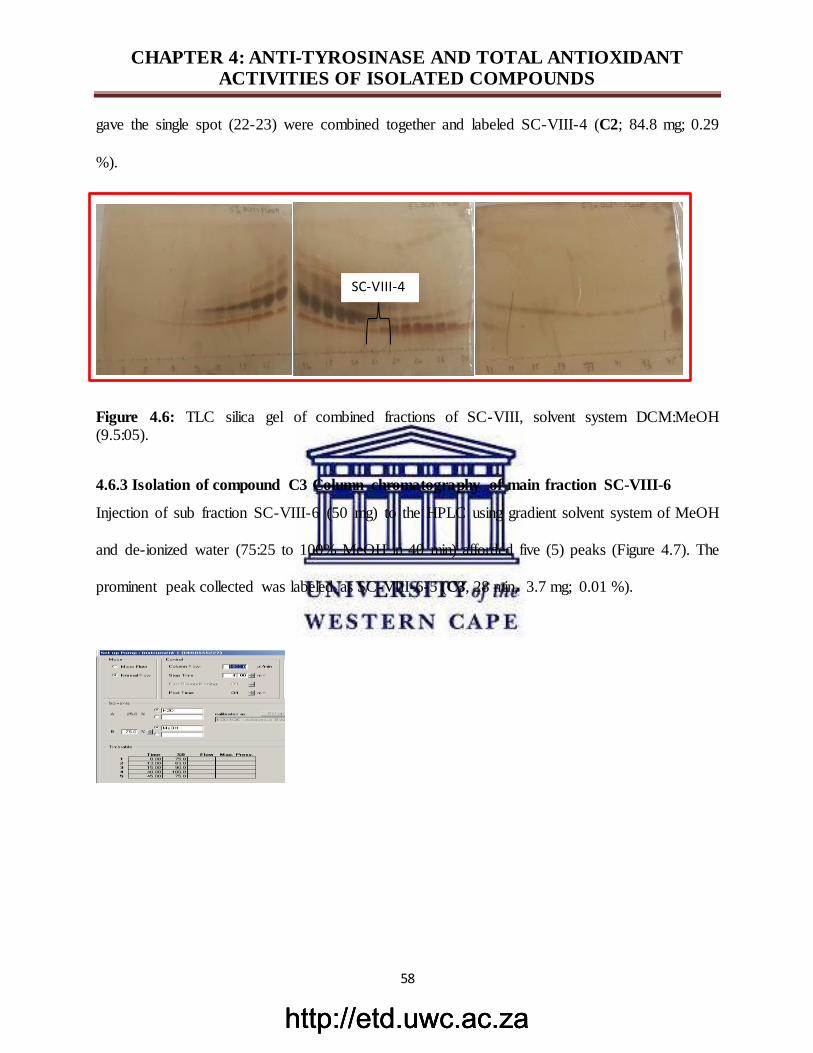
http://etd.uwc.ac.zahttp://etd.uwc.ac.zahttp://etd.uwc.ac.za
CHAPTER 4: ANTI-TYROSINASE AND TOTAL ANTIOXIDANT ACTIVITIES OF ISOLATED COMPOUNDS
58
gave the single spot (22-23) were combined together and labeled SC-VIII-4 (C2; 84.8 mg; 0.29
%).
Figure 4.6: TLC silica gel of combined fractions of SC-VIII, solvent system DCM:MeOH (9.5:05).
4.6.3 Isolation of compound C3 Column chromatography of main fraction SC-VIII-6
Injection of sub fraction SC-VIII-6 (50 mg) to the HPLC using gradient solvent system of MeOH
and de-ionized water (75:25 to 100% MeOH in 40 min) afforded five (5) peaks (Figure 4.7). The
prominent peak collected was labeled as SC-VIII-6-5 (C3, 28 min, 3.7 mg; 0.01 %).
SC-VIII-4
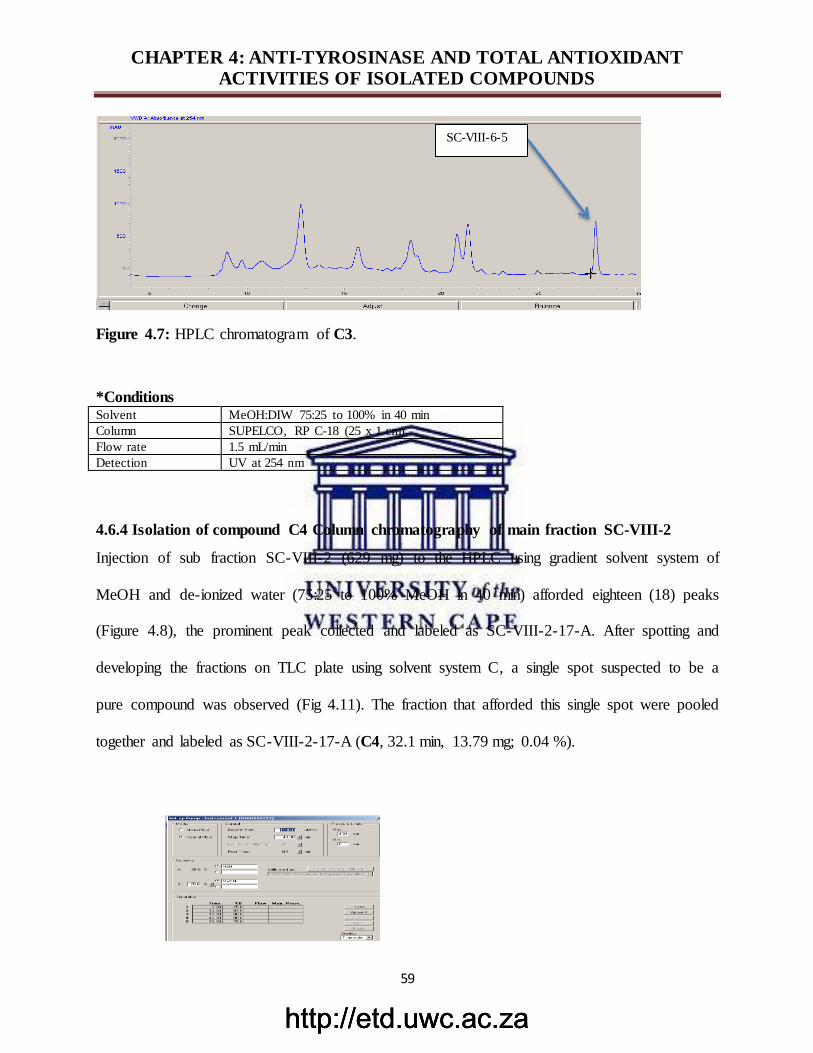
http://etd.uwc.ac.zahttp://etd.uwc.ac.zahttp://etd.uwc.ac.za
CHAPTER 4: ANTI-TYROSINASE AND TOTAL ANTIOXIDANT ACTIVITIES OF ISOLATED COMPOUNDS
59
Figure 4.7: HPLC chromatogram of C3.
*Conditions Solvent MeOH:DIW 75:25 to 100% in 40 min
Column SUPELCO, RP C-18 (25 x 1 cm)
Flow rate 1.5 mL/min
Detection UV at 254 nm
4.6.4 Isolation of compound C4 Column chromatography of main fraction SC-VIII-2
Injection of sub fraction SC-VIII-2 (629 mg) to the HPLC using gradient solvent system of
MeOH and de-ionized water (75:25 to 100% MeOH in 40 min) afforded eighteen (18) peaks
(Figure 4.8), the prominent peak collected and labeled as SC-VIII-2-17-A. After spotting and
developing the fractions on TLC plate using solvent system C, a single spot suspected to be a
pure compound was observed (Fig 4.11). The fraction that afforded this single spot were pooled
together and labeled as SC-VIII-2-17-A (C4, 32.1 min, 13.79 mg; 0.04 %).
SC-VIII-6-5
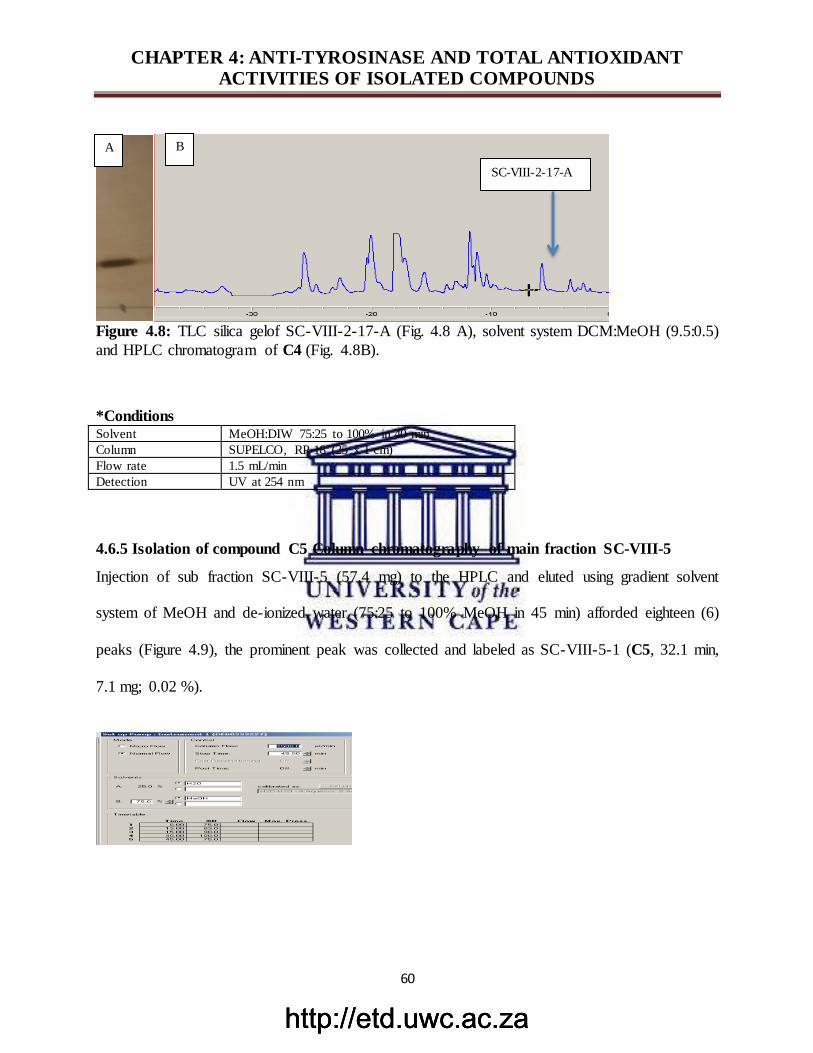
http://etd.uwc.ac.zahttp://etd.uwc.ac.zahttp://etd.uwc.ac.za
CHAPTER 4: ANTI-TYROSINASE AND TOTAL ANTIOXIDANT ACTIVITIES OF ISOLATED COMPOUNDS
60
Figure 4.8: TLC silica gelof SC-VIII-2-17-A (Fig. 4.8 A), solvent system DCM:MeOH (9.5:0.5)
and HPLC chromatogram of C4 (Fig. 4.8B).
*Conditions Solvent MeOH:DIW 75:25 to 100% in 40 min
Column SUPELCO, RP-18 (25 x 1 cm)
Flow rate 1.5 mL/min
Detection UV at 254 nm
4.6.5 Isolation of compound C5 Column chromatography of main fraction SC-VIII-5
Injection of sub fraction SC-VIII-5 (57.4 mg) to the HPLC and eluted using gradient solvent
system of MeOH and de-ionized water (75:25 to 100% MeOH in 45 min) afforded eighteen (6)
peaks (Figure 4.9), the prominent peak was collected and labeled as SC-VIII-5-1 (C5, 32.1 min,
7.1 mg; 0.02 %).
SC-VIII-2-17-A
B A
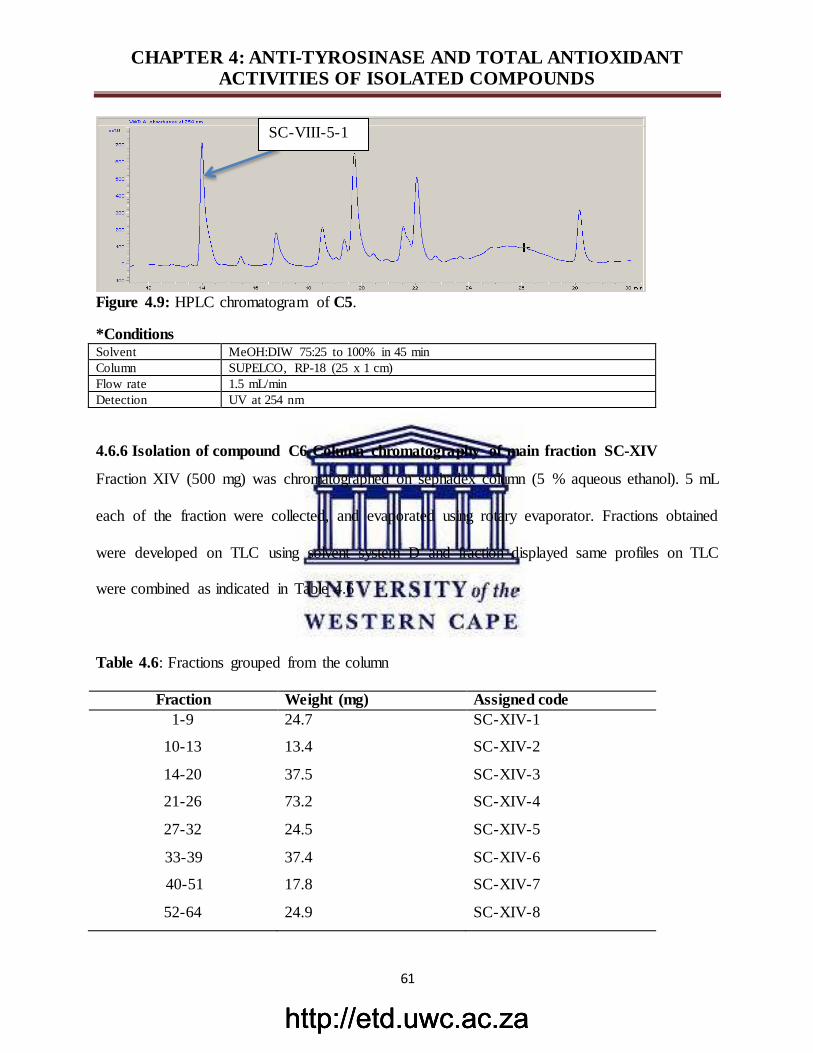
http://etd.uwc.ac.zahttp://etd.uwc.ac.zahttp://etd.uwc.ac.za
CHAPTER 4: ANTI-TYROSINASE AND TOTAL ANTIOXIDANT ACTIVITIES OF ISOLATED COMPOUNDS
61
Figure 4.9: HPLC chromatogram of C5.
*Conditions Solvent MeOH:DIW 75:25 to 100% in 45 min
Column SUPELCO, RP-18 (25 x 1 cm)
Flow rate 1.5 mL/min
Detection UV at 254 nm
4.6.6 Isolation of compound C6 Column chromatography of main fraction SC-XIV
Fraction XIV (500 mg) was chromatographed on sephadex column (5 % aqueous ethanol). 5 mL
each of the fraction were collected, and evaporated using rotary evaporator. Fractions obtained
were developed on TLC using solvent system D and fraction displayed same profiles on TLC
were combined as indicated in Table 4.6
Table 4.6: Fractions grouped from the column
Fraction Weight (mg) Assigned code
1-9 24.7 SC-XIV-1
10-13 13.4 SC-XIV-2
14-20 37.5 SC-XIV-3
21-26 73.2 SC-XIV-4
27-32
33-39
40-51
52-64
24.5
37.4
17.8
24.9
SC-XIV-5
SC-XIV-6
SC-XIV-7
SC-XIV-8
SC-VIII-5-1
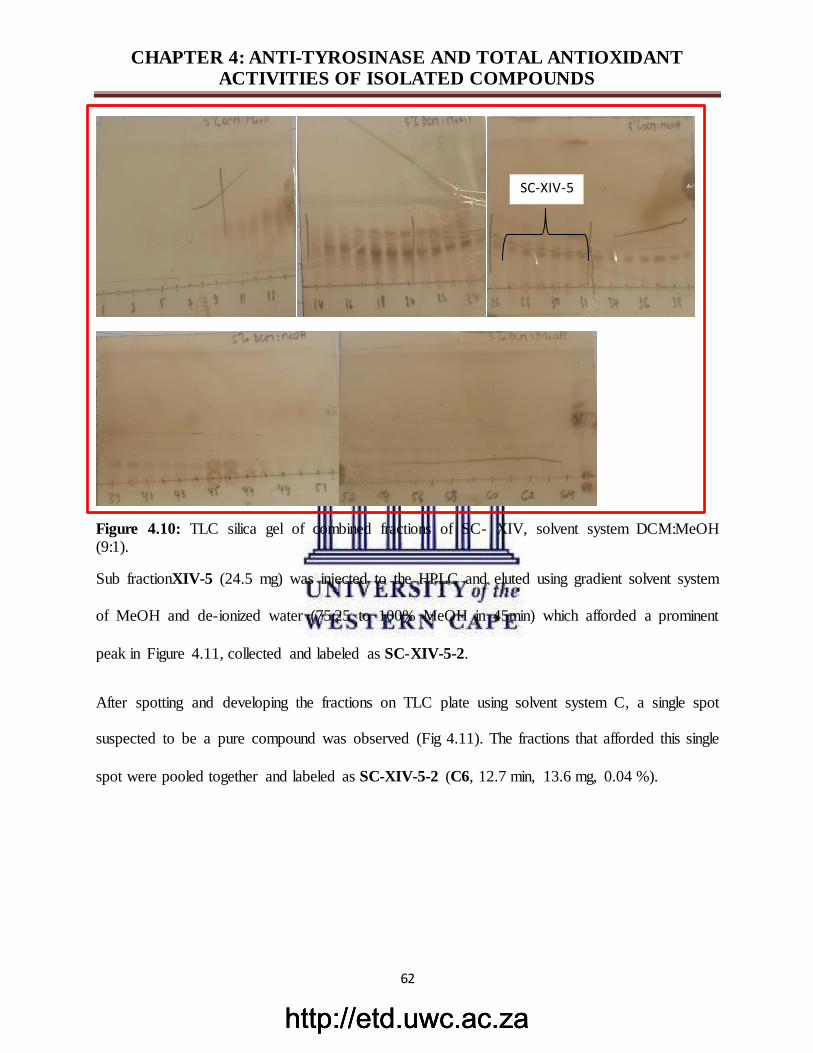
http://etd.uwc.ac.zahttp://etd.uwc.ac.zahttp://etd.uwc.ac.za
CHAPTER 4: ANTI-TYROSINASE AND TOTAL ANTIOXIDANT ACTIVITIES OF ISOLATED COMPOUNDS
62
Figure 4.10: TLC silica gel of combined fractions of SC- XIV, solvent system DCM:MeOH (9:1).
Sub fractionXIV-5 (24.5 mg) was injected to the HPLC and eluted using gradient solvent system
of MeOH and de-ionized water (75:25 to 100% MeOH in 45min) which afforded a prominent
peak in Figure 4.11, collected and labeled as SC-XIV-5-2.
After spotting and developing the fractions on TLC plate using solvent system C, a single spot
suspected to be a pure compound was observed (Fig 4.11). The fractions that afforded this single
spot were pooled together and labeled as SC-XIV-5-2 (C6, 12.7 min, 13.6 mg, 0.04 %).
SC-XIV-5
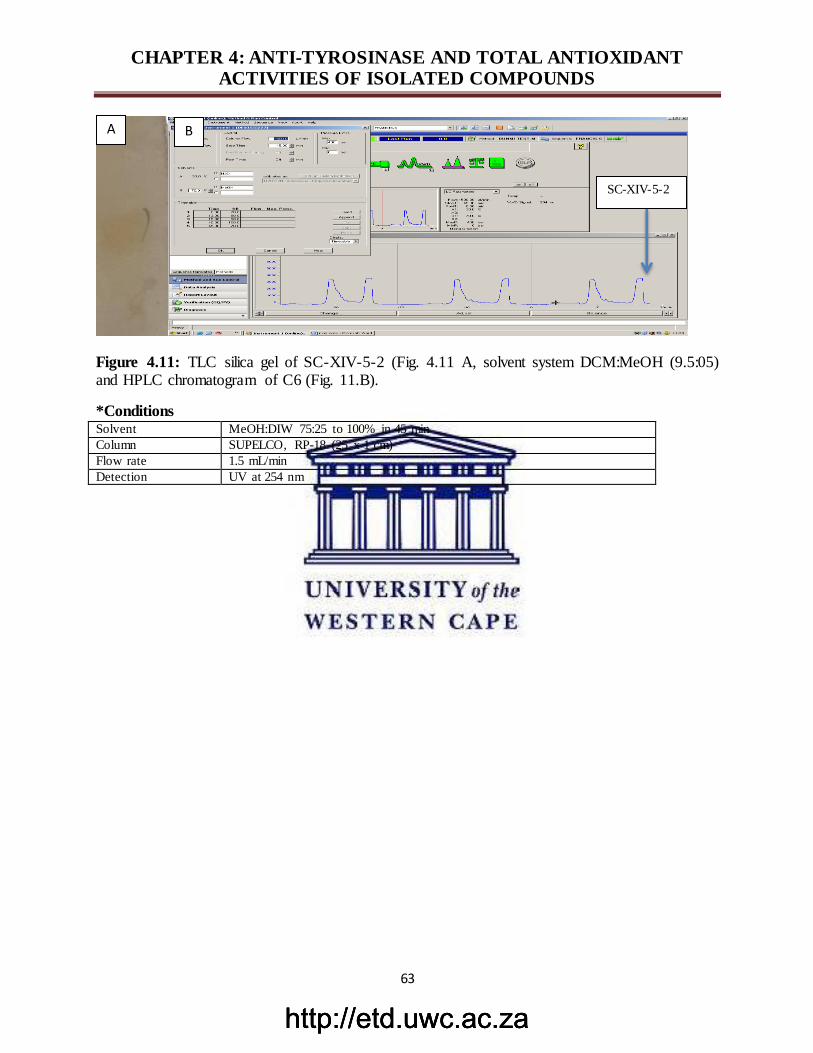
http://etd.uwc.ac.zahttp://etd.uwc.ac.zahttp://etd.uwc.ac.za
CHAPTER 4: ANTI-TYROSINASE AND TOTAL ANTIOXIDANT ACTIVITIES OF ISOLATED COMPOUNDS
63
Figure 4.11: TLC silica gel of SC-XIV-5-2 (Fig. 4.11 A, solvent system DCM:MeOH (9.5:05) and HPLC chromatogram of C6 (Fig. 11.B).
*Conditions Solvent MeOH:DIW 75:25 to 100% in 45 min
Column SUPELCO, RP-18 (25 x 1 cm)
Flow rate 1.5 mL/min
Detection UV at 254 nm
A B
SC-XIV-5-2
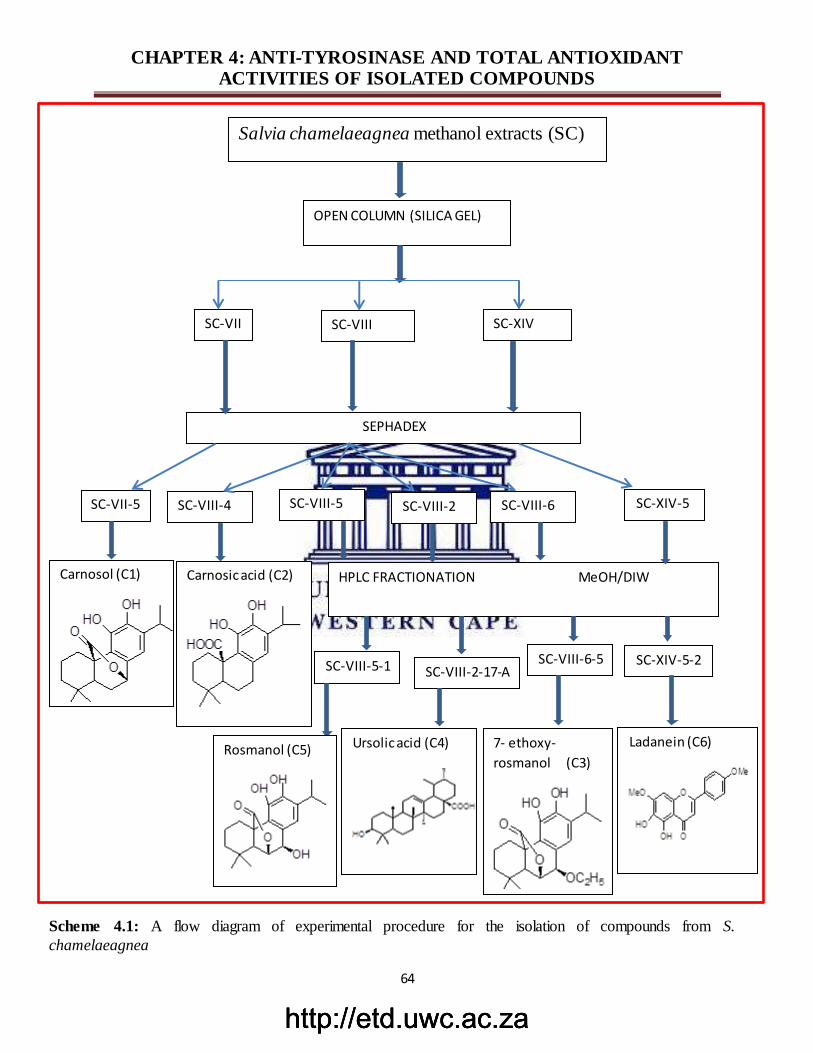
http://etd.uwc.ac.zahttp://etd.uwc.ac.zahttp://etd.uwc.ac.za
CHAPTER 4: ANTI-TYROSINASE AND TOTAL ANTIOXIDANT ACTIVITIES OF ISOLATED COMPOUNDS
64
Salvia chamelaeagnea methanol extracts (SC)
OPEN COLUMN (SILICA GEL)
SC-VII SC-VIII SC-XIV
SEPHADEX
SC-VII-5
Carnosol (C1)
SC-VIII-4
Carnosic acid (C2)
SC-VIII-5
SC-VIII-5-1
Rosmanol (C5)
SC-VIII-6
HPLC FRACTIONATION MeOH/DIW
SC-VIII-6-5
7- ethoxy-
rosmanol (C3)
SC-XIV-5
SC-XIV-5-2
Ladanein (C6)
SC-VIII-2
SC-VIII-2-17-A
Ursolic acid (C4)
Scheme 4.1: A flow diagram of experimental procedure for the isolation of compounds from S.
chamelaeagnea
*All silica gel column fractionations were done using gradient solvent system of Hex/EtOAc/MeOH. * All sephadex column fractionations were done using
isocratic elution of aq. EtOH.
http://etd.uwc.ac.zahttp://etd.uwc.ac.zahttp://etd.uwc.ac.za
CHAPTER 4: ANTI-TYROSINASE AND TOTAL ANTIOXIDANT ACTIVITIES OF ISOLATED COMPOUNDS
65
4.7 BIOLOGICAL CHARACTERIZATION OF ISOLATED COMPOUNDS
4.7.1 General experimental procedure for biological assays
4.7.1.1 Reagents
Standards (purity > 99.0%) for the total antioxidant capacities (ORAC, FRAP & TEAC),
inhibition of Fe2+-induced lipid peroxidation, and anti-tyrosinase assays such as kojic acid,
EGCG (epigallocatechingallate), trolox (6-hydroxyl-2, 5, 7, 8- tetramethylchroman-2-carboxylic
acid), and other reagents including ABTS (2,2- azino-bis (3-ethylbenzo thiazoline-6-sulfonic
acid) diammonium salt), potassium peroxodisulphate, fluorescein sodium salt, AAPH (2,2-
Azobis (2-methylpropionamidine) dihydrochloride, perchloric acid, TPTZ (2,4,6-tri[2-pyridyl]-s-
triazine, iron (III) chloride hexahydrate, copper sulphate, hydrogen peroxide, were secured from
Sigma-Aldrich, Inc. (Cape Town, South Africa). All antioxidant assays including FRAP, TEAC,
lipid peroxidation, and tyrosinase inhibition were measured by Multiskan spectrum plate reader,
while automated ORAC assay was determined using Floroskan spectrum plate reader.
4.7.2 Tyrosinase enzyme assay
This assay was performed using the method previously described (Chompo, et al., 2012) with
slight modifications. Samples were dissolved in DMSO (dimethyl sulphoxide) to a stock solution
of 1 mg/mL (w/v). Further dilutions were done with phosphate buffer (pH 6.5) for all working
solutions to the concentrations of 1000, 500, 100, 50, 10 μg/mL. Kojic acid was used as a
positive control. In each well of a 96-well plate, 70 μL of each sample working solution
(extract/pure compounds) was combined with 30 μL of tyrosinase [from mushroom, 500
Units/mL in phosphate buffer (pH 6.5)] in triplicate. After incubation at room temperature for 5
minutes, 110 μL of substrate (2 mM L-tyrosine) was added to each well. The sample control was
http://etd.uwc.ac.zahttp://etd.uwc.ac.zahttp://etd.uwc.ac.za
CHAPTER 4: ANTI-TYROSINASE AND TOTAL ANTIOXIDANT ACTIVITIES OF ISOLATED COMPOUNDS
66
made up of each sample with phosphate buffer in the absence of tyrosinase enzyme. The reacting
mixture was then incubated for 30 minutes at room temperature. The enzyme activity was
determined by measuring the absorbance at 490 nm using plate reader. The percentage of
tyrosinase inhibition was calculated as follows.
[(A – B) – (C – D)] / (A – B) X 100 (1)
Where A is the absorbance of the control with the enzyme, B is the absorbance of the control
without the enzyme, C is the absorbance of the test sample with the enzyme and D is the
absorbance of the test sample without the enzyme.
4.7.3 Cyclic voltammetry measurement
Cyclic voltammetry was used for monitoring the oxidation-reduction potentials of the isolated
compounds, and the behavior (increase or decrease) of the inhibition current with time in the
presence of kojic acid or compound(s).
It was performed using the BAS100B electro-chemical analyzer, a glassy carbon electrode
(GCE) as working electrode, Ag/AgCl as a reference electrode and platinum (Pt) as a counter
electrode. Cyclic voltammograms (CVs) were recorded at two different scan rates 50 mV/s and
25 mV/s within the potential window ranging from -1300 to 1300 mV and from -200 to 200 mV.
Both compounds and kojic acid were made to a stock solution of 1 mg/mL with DMSO.
Tyrosinase and L-tyrosine were diluted in phosphate buffer to a working concentration and the
experiments were carried out at room temperature. To a cell containing 10 mL of 50 mM PBS at
pH 6.5, a fixed volume of compound and tyrosinase enzyme were added (700 𝜇L) and (300 𝜇L)
respectively, to which a specific volume of the L-tyrosine (1100 𝜇L) was also added. To
http://etd.uwc.ac.zahttp://etd.uwc.ac.zahttp://etd.uwc.ac.za
CHAPTER 4: ANTI-TYROSINASE AND TOTAL ANTIOXIDANT ACTIVITIES OF ISOLATED COMPOUNDS
67
understand the activity of the control either positive or negative, the compound was replaced
with kojic acid and DMSO. Cyclic voltammetry of each addition was recorded.
4.7.4 Total Antioxidant capacities assays
4.7.4.1 Ferric-ion reducing antioxidant power (FRAP) assay
The FRAP assay was carried out in accordance to the method described previously (Benzie &
Strain, 1996). In a 96-well plate, 10 μL of the stock solution (1 mg/mL w/v) of the isolated
compounds (C1 – C6) and a methanol extract (SC) were mixed with 300 μL FRAP reagent. The
FRAP reagent was prepared by mixing (10:1:1, v/v/v) of acetate buffer (300 mM, pH 3.6),
tripyridyl triazine (TPTZ) (10 mM in 40 mM HCl) and FeCl3.6H2O (20mM), Incubation
commenced at room temperature for 30 min, and the plate was read at a wavelength of 593 nm in
a Multiskan spectrum plate reader (Thermo Fisher Scientific). L-Ascorbic (Sigma Aldrich, South
Africa) was used as a standard with concentrations varying between 0 and 1000 μM. Further
dilutions were done to the samples that were highly concentrated and such dilution factors were
recorded and used for calculations of the affected samples. The results were expressed as μM
ascorbic acid equivalents per milligram dry weight (μM AAE/g) of the test samples.
4.7.4.2 Automated oxygen radicals absorbance capacity (ORAC) assay
ORAC assay was done according to the previous method (Prior, et al., 2003) with slight
modifications (Cao & Prior, 1998). The method measures the antioxidant scavenging capacity of
thermal decomposition generated by peroxyl radical of 2,2-azobis (2-amino-propane)
dihydrochloride (AAPH) as peroxyradical (ORAC ROO.) generator. The loss of fluorescence of
fluorescein (probe) was an indication of the extent of its oxidation through reaction with the
peroxyl radical. The protective effect of an antioxidant was measured by assessing the
fluorescence area under the curve (AUC) plot relative to that of blank in which no antioxidant
http://etd.uwc.ac.zahttp://etd.uwc.ac.zahttp://etd.uwc.ac.za
CHAPTER 4: ANTI-TYROSINASE AND TOTAL ANTIOXIDANT ACTIVITIES OF ISOLATED COMPOUNDS
68
was present. The analyzer was programmed to record the fluorescence of fluorescein every 2
minutes after AAPH was added. The fluorescein solution and sample were added in the wells of
an illuminated 96 well plate, 12 μL of each of sample (in stock solution of 1 mg/mL was
combined with 138 μL of a fluorescein working solution followed by addition of 50 μL of 150
mg of AAPH prepared in-situ in 6 mL phosphate buffer. Absorbance was measured with
Fluoroskan spectrum plate reader with the excitation wavelength set as 485 nm and the emission
wavelength at 530 nm. A calibration curve was used, using a trolox stock solution of
concentration in the range of 83 - 417 μM (R2=0.9514). The ORAC values were calculated using
a regression equation (Y = a + bX +Cx2) between Trolox concentration (Y in μM) and the net
area under the fluorescence decay curve (X). ORAC values were expressed as micromoles of
trolox equivalents (TE) per milligram of test sample. Samples without perfect curve were further
diluted and the dilution factors were used for the calculation of such samples.
4.7.4.3 Trolox equivalent absorbance capacity (TEAC) assay
The total antioxidant activity of the test sample was measured using previously described
methods (Pellegrini, et al., 1999). The stock solutions which contain 7 mM ABTS and 140 mM
K2S2O8 was prepared and kept at -2 oC. The working solution was then prepared by adding 88 μL
K2S2O8 solution to 5 mL ABTS solution. The two solutions were mixed and allowed to react for
24 hours at room temperature in the dark. Trolox was used as the standard with concentrations
ranging between 0 and 500 μM. After 24 hours, the ABTS mix solution was diluted with ethanol
to read a start-up absorbance (control) of approximately 2.0 (±0.1). The stock solution (1
mg/mL) of a methanol extract (SC) and purified compounds (25 μL) were allowed to react with
300 μL ABTS in the dark at room temperature for 30 min. The absorbance was read at 734 nm at
http://etd.uwc.ac.zahttp://etd.uwc.ac.zahttp://etd.uwc.ac.za
CHAPTER 4: ANTI-TYROSINASE AND TOTAL ANTIOXIDANT ACTIVITIES OF ISOLATED COMPOUNDS
69
25 oC in the plate reader. The results were expressed as μM trolox equivalents per milligram dry
weight (μM/TE/g) of the test samples.
4.7.4.4 Inhibition of Fe (II) - Induced Microsomal Lipid Peroxidation assay
A method described by (Snijman, et al., 2009)with a few modifications was adopted. The
reaction mixture contained microsomes (1mg of protein/mL in 0.01 M potassium phosphate
buffer; pH 7.4, supplemented with 1.15 % KCl). The positive control includes microsomes,
buffer and ferrous sulphate, in the absence of the samples to be tested.
The sample stock solutions (SC and C1-C6) were prepared in DMSO (1mg/mL, w/v). The
working sample solutions were prepared in 0.01 M potassium phosphate buffer pH 7.4,
supplemented with 1.15 % KCl diluted to100, 50 and 10 μg/mL concentrations. 100 μL of each
sample (working solutions) were dissolved in potassium phosphate buffer and pre-incubated with
500 μL microsomes a 37 oC for 30 minutes in a shaking water bath. 200 μL of KCl-buffer were
added to the mixture, followed by 200 μL of a 2.5 mM ferrous sulfate solution and incubated at
37 oC for 1 hour in a shaking water bath. The reaction was terminated with 10 % trichloroacetic
acid (TCA) solution (1 mL) containing 125 μL butylated hydroxytoluene (BHT, 0.01 %) and 1
mM ethylene diamine tetra acetic acid (EDTA). Samples were centrifuged at 2000 rpm for 15
minutes, and 1 mL of each supernatant was mixed with 1 mL of 0.67 % thiobarbituric acid
(TBA) solution. The reaction mixture was then incubated in a water bath at 90 oC for 20 minutes
and the absorbance were measured at 532 nm using plate reader. The percentage inhibition of
TBARS formation relative to the positive control was calculated by
[(Acontrol – Asample)/ Acontrol X 100)] (2)
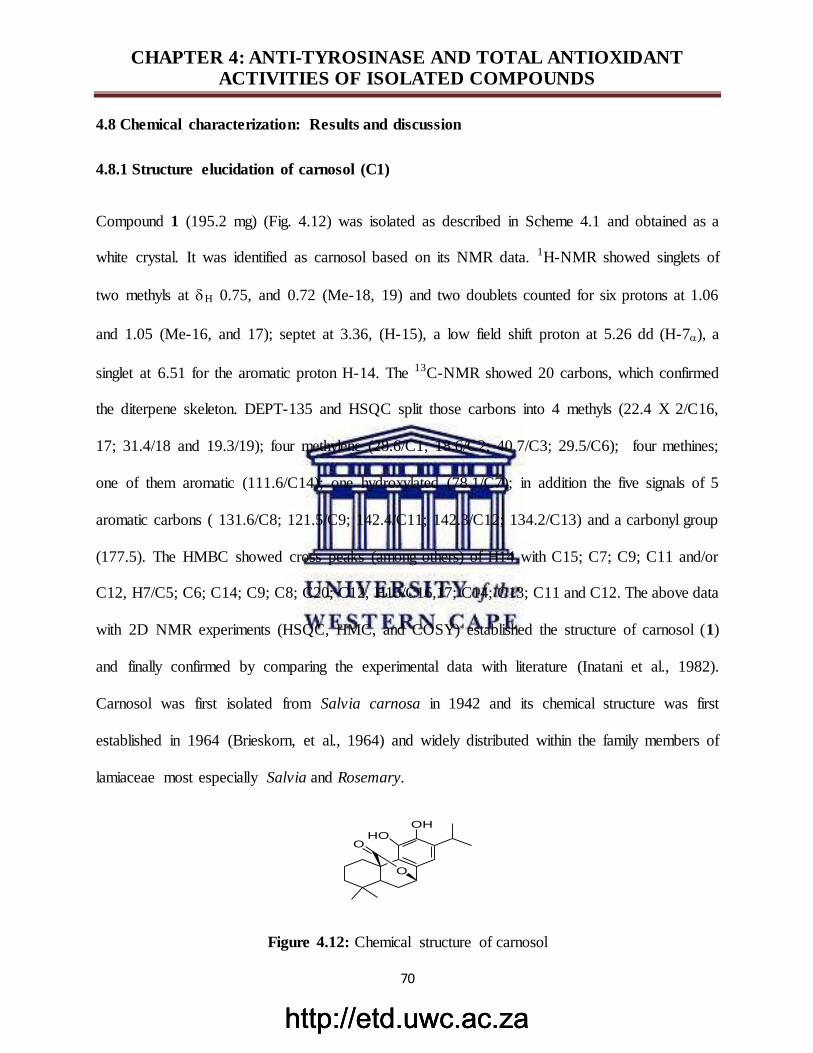
http://etd.uwc.ac.zahttp://etd.uwc.ac.zahttp://etd.uwc.ac.za
CHAPTER 4: ANTI-TYROSINASE AND TOTAL ANTIOXIDANT ACTIVITIES OF ISOLATED COMPOUNDS
70
4.8 Chemical characterization: Results and discussion
4.8.1 Structure elucidation of carnosol (C1)
Compound 1 (195.2 mg) (Fig. 4.12) was isolated as described in Scheme 4.1 and obtained as a
white crystal. It was identified as carnosol based on its NMR data. 1H-NMR showed singlets of
two methyls at H 0.75, and 0.72 (Me-18, 19) and two doublets counted for six protons at 1.06
and 1.05 (Me-16, and 17); septet at 3.36, (H-15), a low field shift proton at 5.26 dd (H-7), a
singlet at 6.51 for the aromatic proton H-14. The 13C-NMR showed 20 carbons, which confirmed
the diterpene skeleton. DEPT-135 and HSQC split those carbons into 4 methyls (22.4 X 2/C16,
17; 31.4/18 and 19.3/19); four methylene (28.6/C1; 18.6/C2; 40.7/C3; 29.5/C6); four methines;
one of them aromatic (111.6/C14); one hydroxylated (78.1/C7); in addition the five signals of 5
aromatic carbons ( 131.6/C8; 121.5/C9; 142.4/C11; 142.3/C12; 134.2/C13) and a carbonyl group
(177.5). The HMBC showed cross peaks (among others) of H14 with C15; C7; C9; C11 and/or
C12, H7/C5; C6; C14; C9; C8; C20; C12, H15/C16,17; C14; C13; C11 and C12. The above data
with 2D NMR experiments (HSQC, HMC, and COSY) established the structure of carnosol (1)
and finally confirmed by comparing the experimental data with literature (Inatani et al., 1982).
Carnosol was first isolated from Salvia carnosa in 1942 and its chemical structure was first
established in 1964 (Brieskorn, et al., 1964) and widely distributed within the family members of
lamiaceae most especially Salvia and Rosemary.
OH
O
OHO
Figure 4.12: Chemical structure of carnosol
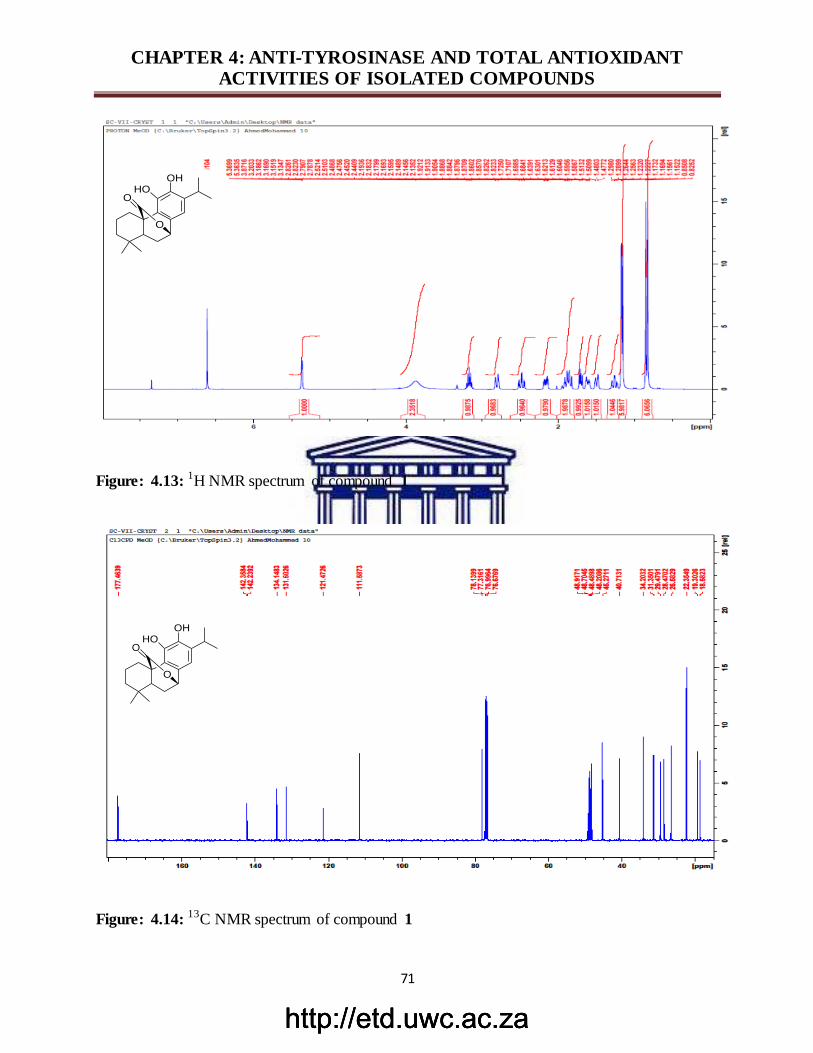
http://etd.uwc.ac.zahttp://etd.uwc.ac.zahttp://etd.uwc.ac.za
CHAPTER 4: ANTI-TYROSINASE AND TOTAL ANTIOXIDANT ACTIVITIES OF ISOLATED COMPOUNDS
71
Figure: 4.13: 1H NMR spectrum of compound 1
Figure: 4.14: 13C NMR spectrum of compound 1
OH
O
OHO
OH
O
OHO
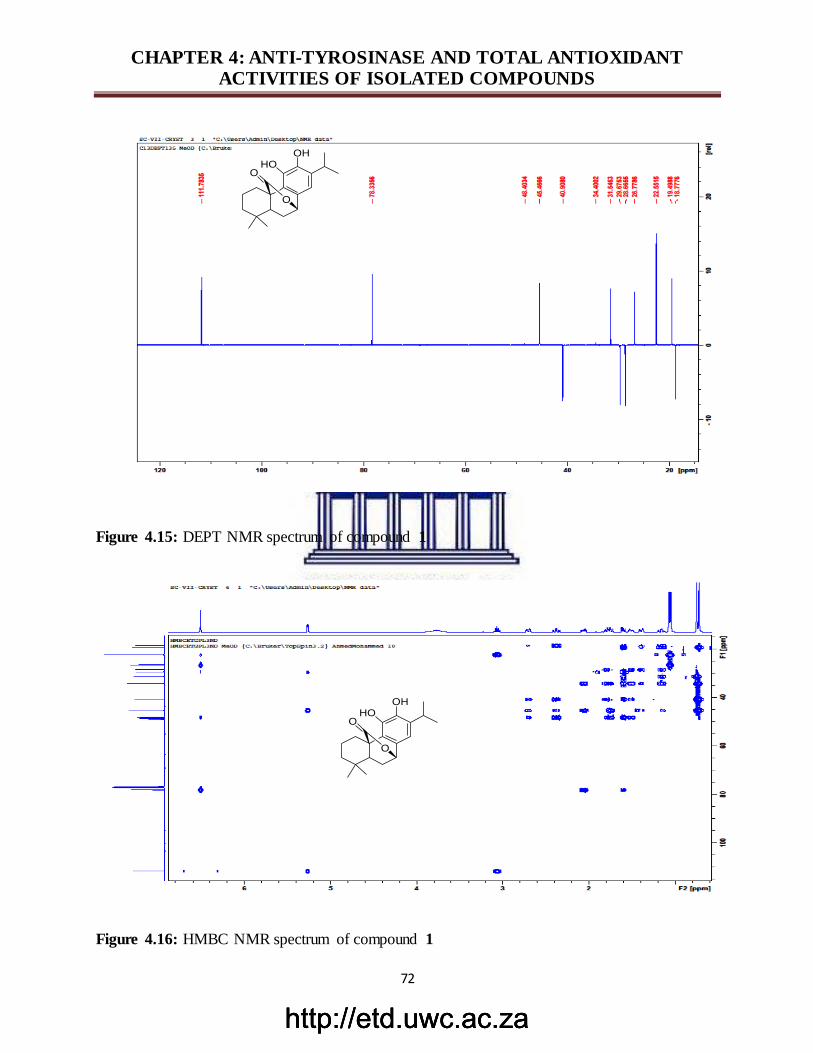
http://etd.uwc.ac.zahttp://etd.uwc.ac.zahttp://etd.uwc.ac.za
CHAPTER 4: ANTI-TYROSINASE AND TOTAL ANTIOXIDANT ACTIVITIES OF ISOLATED COMPOUNDS
72
Figure 4.15: DEPT NMR spectrum of compound 1
Figure 4.16: HMBC NMR spectrum of compound 1
OH
O
OHO
OH
O
OHO
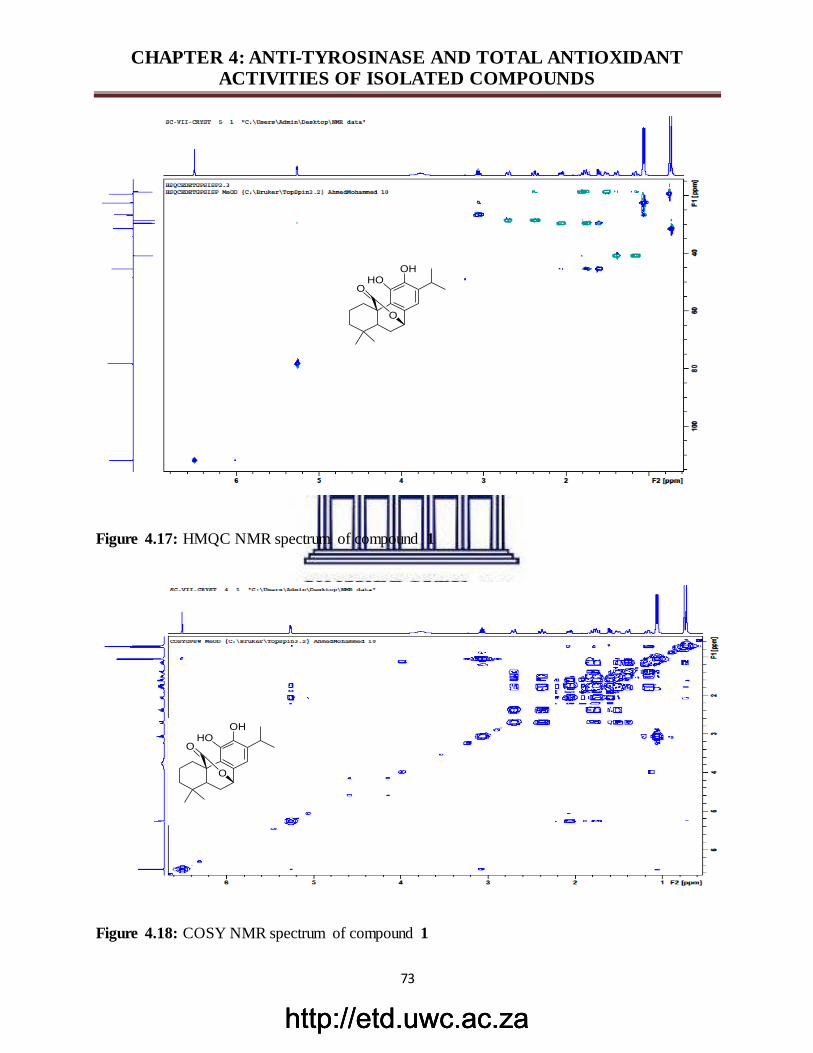
http://etd.uwc.ac.zahttp://etd.uwc.ac.zahttp://etd.uwc.ac.za
CHAPTER 4: ANTI-TYROSINASE AND TOTAL ANTIOXIDANT ACTIVITIES OF ISOLATED COMPOUNDS
73
Figure 4.17: HMQC NMR spectrum of compound 1
Figure 4.18: COSY NMR spectrum of compound 1
OH
O
OHO
OH
O
OHO
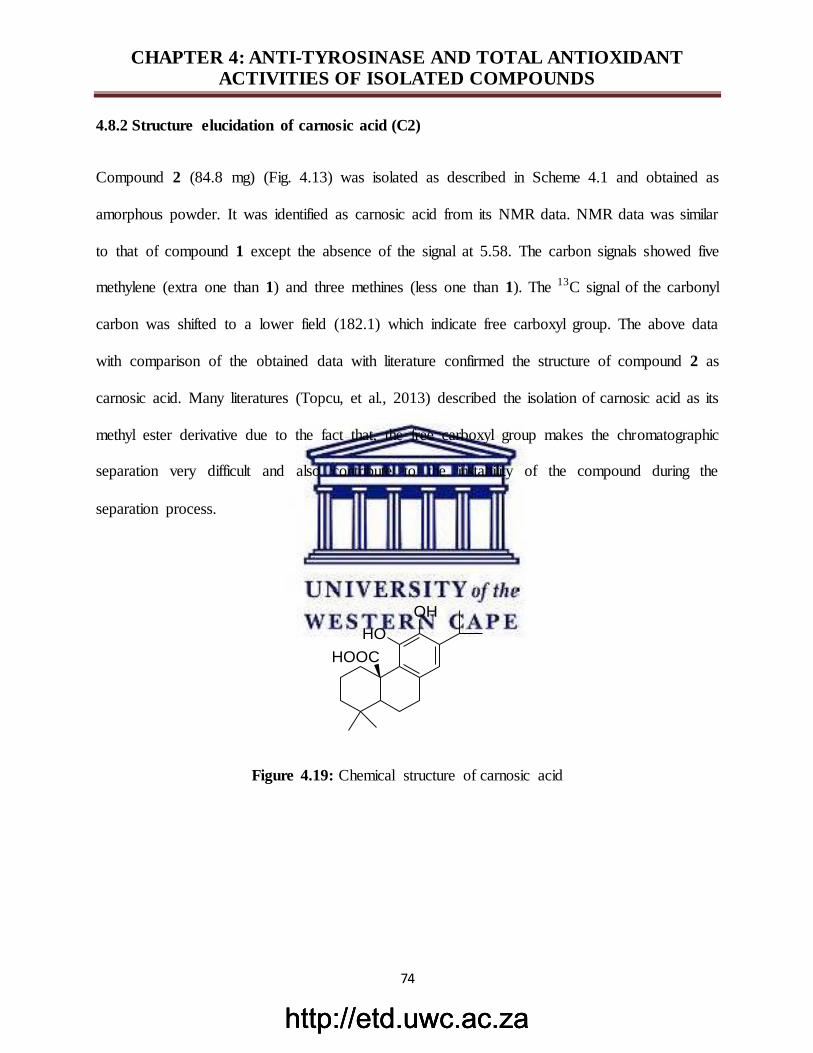
http://etd.uwc.ac.zahttp://etd.uwc.ac.zahttp://etd.uwc.ac.za
CHAPTER 4: ANTI-TYROSINASE AND TOTAL ANTIOXIDANT ACTIVITIES OF ISOLATED COMPOUNDS
74
4.8.2 Structure elucidation of carnosic acid (C2)
Compound 2 (84.8 mg) (Fig. 4.13) was isolated as described in Scheme 4.1 and obtained as
amorphous powder. It was identified as carnosic acid from its NMR data. NMR data was similar
to that of compound 1 except the absence of the signal at 5.58. The carbon signals showed five
methylene (extra one than 1) and three methines (less one than 1). The 13C signal of the carbonyl
carbon was shifted to a lower field (182.1) which indicate free carboxyl group. The above data
with comparison of the obtained data with literature confirmed the structure of compound 2 as
carnosic acid. Many literatures (Topcu, et al., 2013) described the isolation of carnosic acid as its
methyl ester derivative due to the fact that, the free carboxyl group makes the chromatographic
separation very difficult and also contribute to the instability of the compound during the
separation process.
OH
HO
HOOC
Figure 4.19: Chemical structure of carnosic acid
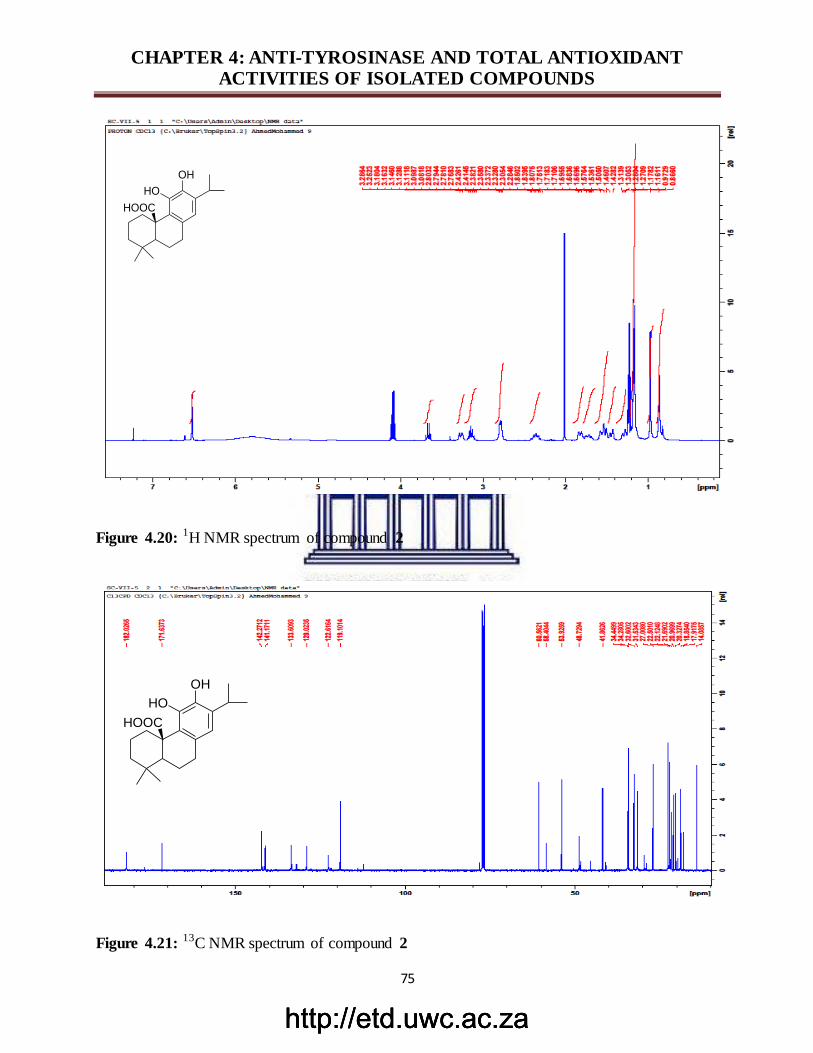
http://etd.uwc.ac.zahttp://etd.uwc.ac.zahttp://etd.uwc.ac.za
CHAPTER 4: ANTI-TYROSINASE AND TOTAL ANTIOXIDANT ACTIVITIES OF ISOLATED COMPOUNDS
75
Figure 4.20: 1H NMR spectrum of compound 2
Figure 4.21: 13C NMR spectrum of compound 2
OH
HO
HOOC
OH
HO
HOOC
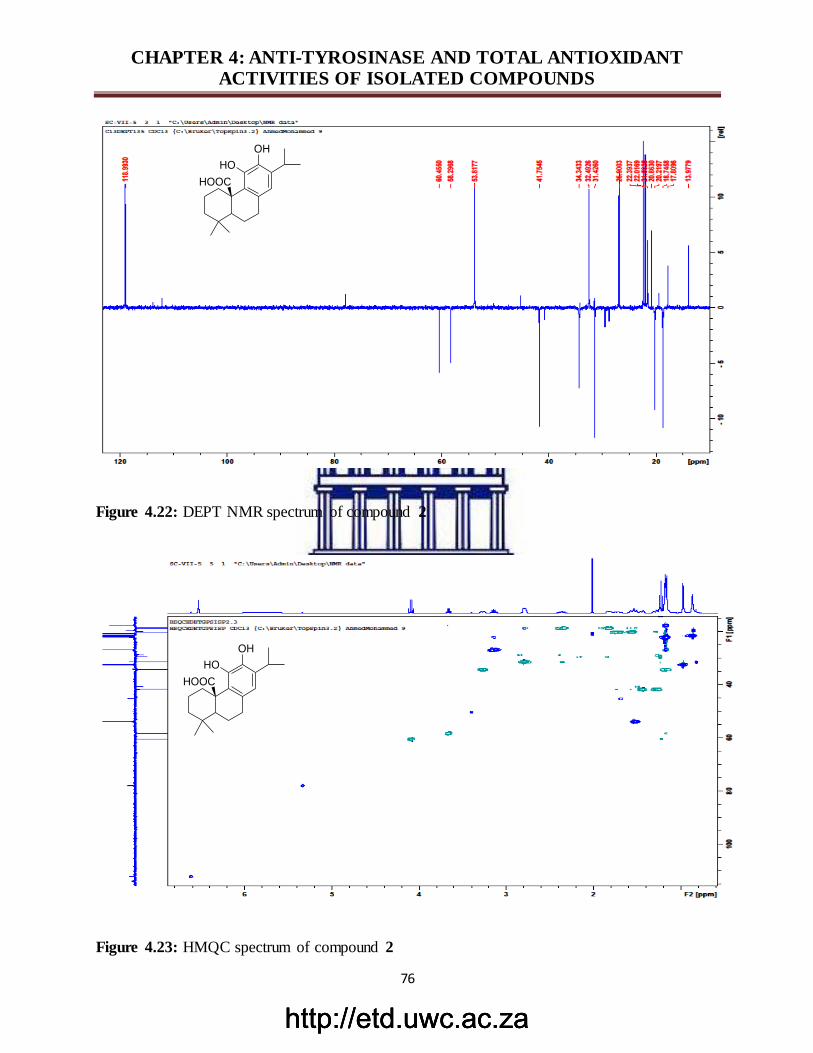
http://etd.uwc.ac.zahttp://etd.uwc.ac.zahttp://etd.uwc.ac.za
CHAPTER 4: ANTI-TYROSINASE AND TOTAL ANTIOXIDANT ACTIVITIES OF ISOLATED COMPOUNDS
76
Figure 4.22: DEPT NMR spectrum of compound 2
Figure 4.23: HMQC spectrum of compound 2
OH
HO
HOOC
OH
HO
HOOC
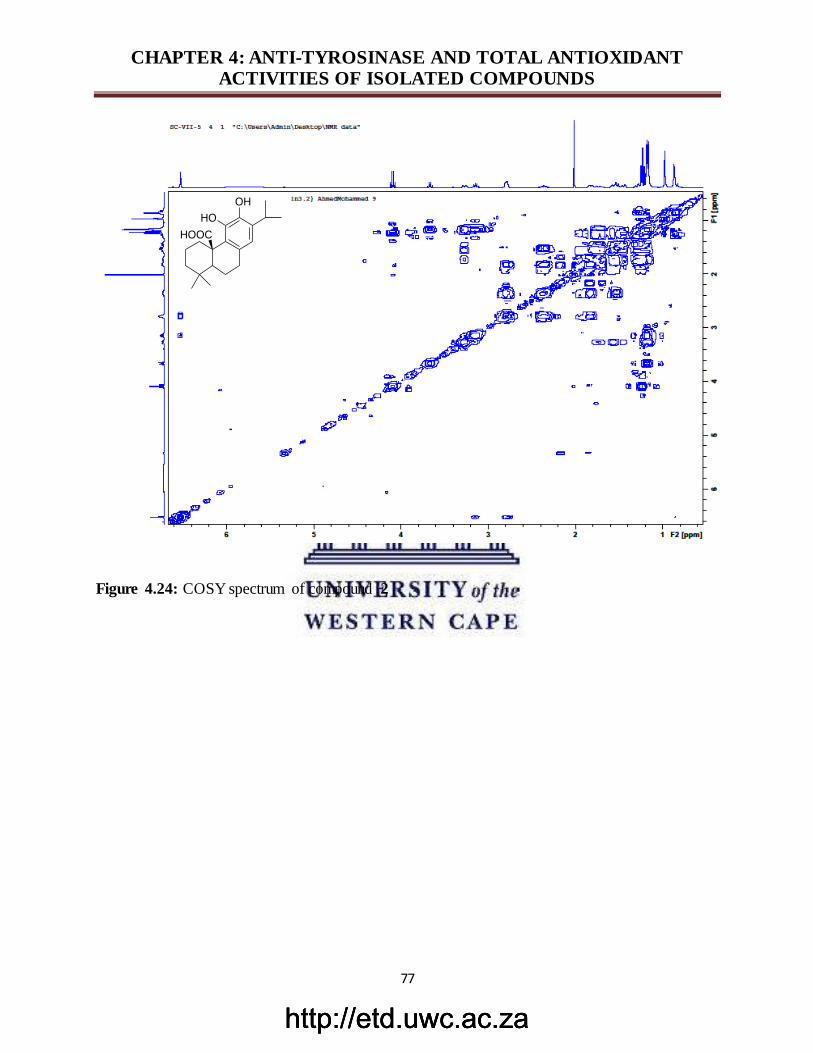
http://etd.uwc.ac.zahttp://etd.uwc.ac.zahttp://etd.uwc.ac.za
CHAPTER 4: ANTI-TYROSINASE AND TOTAL ANTIOXIDANT ACTIVITIES OF ISOLATED COMPOUNDS
77
Figure 4.24: COSY spectrum of compound 2
OH
HO
HOOC
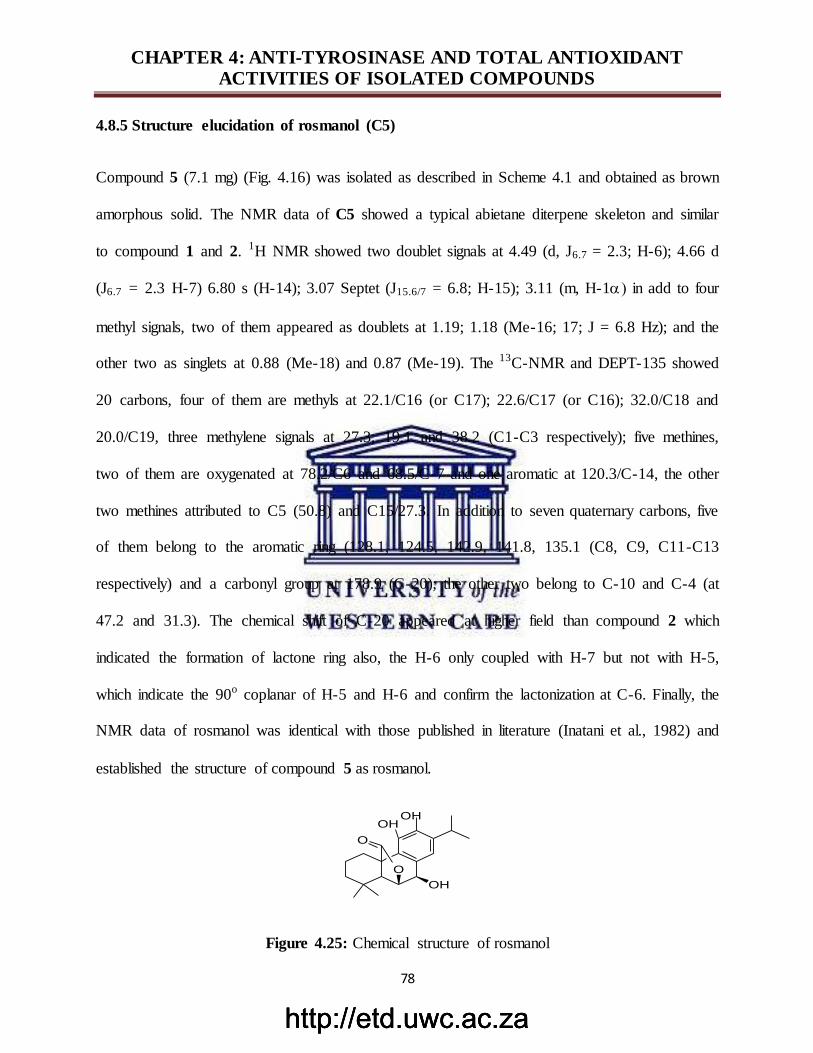
http://etd.uwc.ac.zahttp://etd.uwc.ac.zahttp://etd.uwc.ac.za
CHAPTER 4: ANTI-TYROSINASE AND TOTAL ANTIOXIDANT ACTIVITIES OF ISOLATED COMPOUNDS
78
4.8.5 Structure elucidation of rosmanol (C5)
Compound 5 (7.1 mg) (Fig. 4.16) was isolated as described in Scheme 4.1 and obtained as brown
amorphous solid. The NMR data of C5 showed a typical abietane diterpene skeleton and similar
to compound 1 and 2. 1H NMR showed two doublet signals at 4.49 (d, J6.7 = 2.3; H-6); 4.66 d
(J6.7 = 2.3 H-7) 6.80 s (H-14); 3.07 Septet (J15.6/7 = 6.8; H-15); 3.11 (m, H-1 in add to four
methyl signals, two of them appeared as doublets at 1.19; 1.18 (Me-16; 17; J = 6.8 Hz); and the
other two as singlets at 0.88 (Me-18) and 0.87 (Me-19). The 13C-NMR and DEPT-135 showed
20 carbons, four of them are methyls at 22.1/C16 (or C17); 22.6/C17 (or C16); 32.0/C18 and
20.0/C19, three methylene signals at 27.3; 19.1 and 38.2 (C1-C3 respectively); five methines,
two of them are oxygenated at 78.2/C6 and 68.5/C-7 and one aromatic at 120.3/C-14, the other
two methines attributed to C5 (50.8) and C15/27.3. In addition to seven quaternary carbons, five
of them belong to the aromatic ring (128.1, 124.5, 142.9, 141.8, 135.1 (C8, C9, C11-C13
respectively) and a carbonyl group at 178.9 (C-20); the other two belong to C-10 and C-4 (at
47.2 and 31.3). The chemical shift of C-20 appeared at higher field than compound 2 which
indicated the formation of lactone ring also, the H-6 only coupled with H-7 but not with H-5,
which indicate the 90o coplanar of H-5 and H-6 and confirm the lactonization at C-6. Finally, the
NMR data of rosmanol was identical with those published in literature (Inatani et al., 1982) and
established the structure of compound 5 as rosmanol.
OHOH
O
OH
O
Figure 4.25: Chemical structure of rosmanol
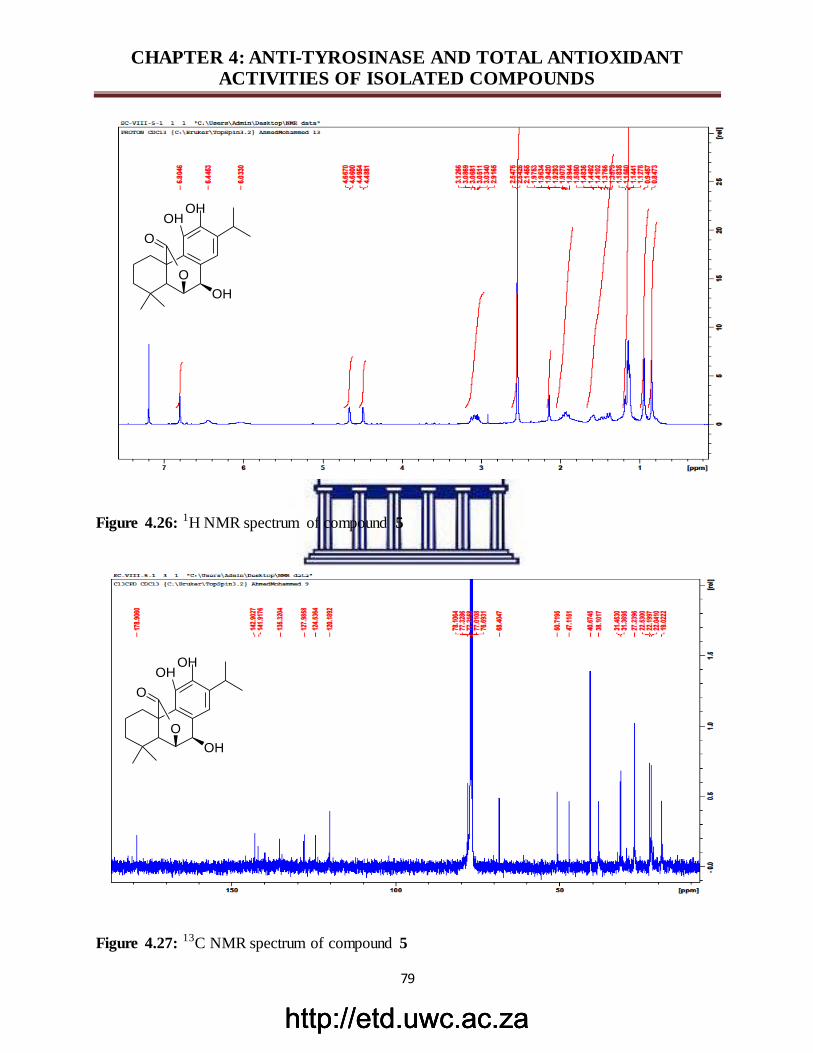
http://etd.uwc.ac.zahttp://etd.uwc.ac.zahttp://etd.uwc.ac.za
CHAPTER 4: ANTI-TYROSINASE AND TOTAL ANTIOXIDANT ACTIVITIES OF ISOLATED COMPOUNDS
79
Figure 4.26: 1H NMR spectrum of compound 5
Figure 4.27: 13C NMR spectrum of compound 5
OHOH
O
OH
O
OHOH
O
OH
O
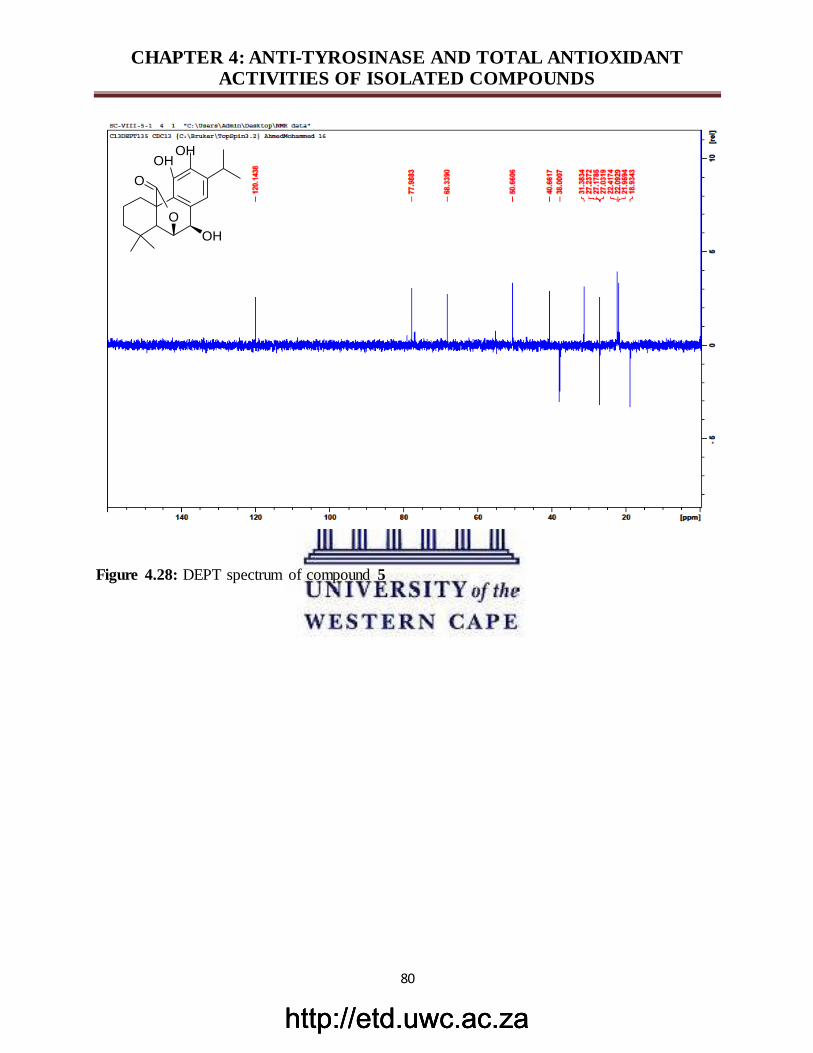
http://etd.uwc.ac.zahttp://etd.uwc.ac.zahttp://etd.uwc.ac.za
CHAPTER 4: ANTI-TYROSINASE AND TOTAL ANTIOXIDANT ACTIVITIES OF ISOLATED COMPOUNDS
80
Figure 4.28: DEPT spectrum of compound 5
OHOH
O
OH
O
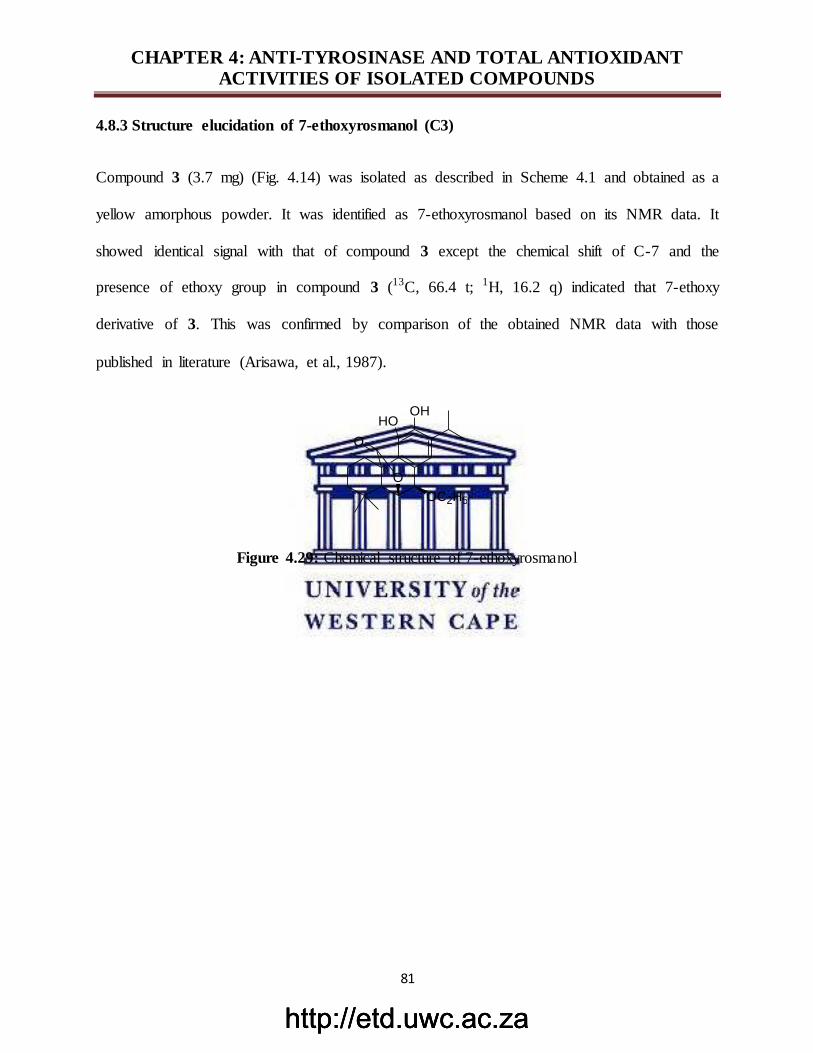
http://etd.uwc.ac.zahttp://etd.uwc.ac.zahttp://etd.uwc.ac.za
CHAPTER 4: ANTI-TYROSINASE AND TOTAL ANTIOXIDANT ACTIVITIES OF ISOLATED COMPOUNDS
81
4.8.3 Structure elucidation of 7-ethoxyrosmanol (C3)
Compound 3 (3.7 mg) (Fig. 4.14) was isolated as described in Scheme 4.1 and obtained as a
yellow amorphous powder. It was identified as 7-ethoxyrosmanol based on its NMR data. It
showed identical signal with that of compound 3 except the chemical shift of C-7 and the
presence of ethoxy group in compound 3 (13C, 66.4 t; 1H, 16.2 q) indicated that 7-ethoxy
derivative of 3. This was confirmed by comparison of the obtained NMR data with those
published in literature (Arisawa, et al., 1987).
OHHO
O
OC2H5
O
Figure 4.29: Chemical structure of 7-ethoxyrosmanol
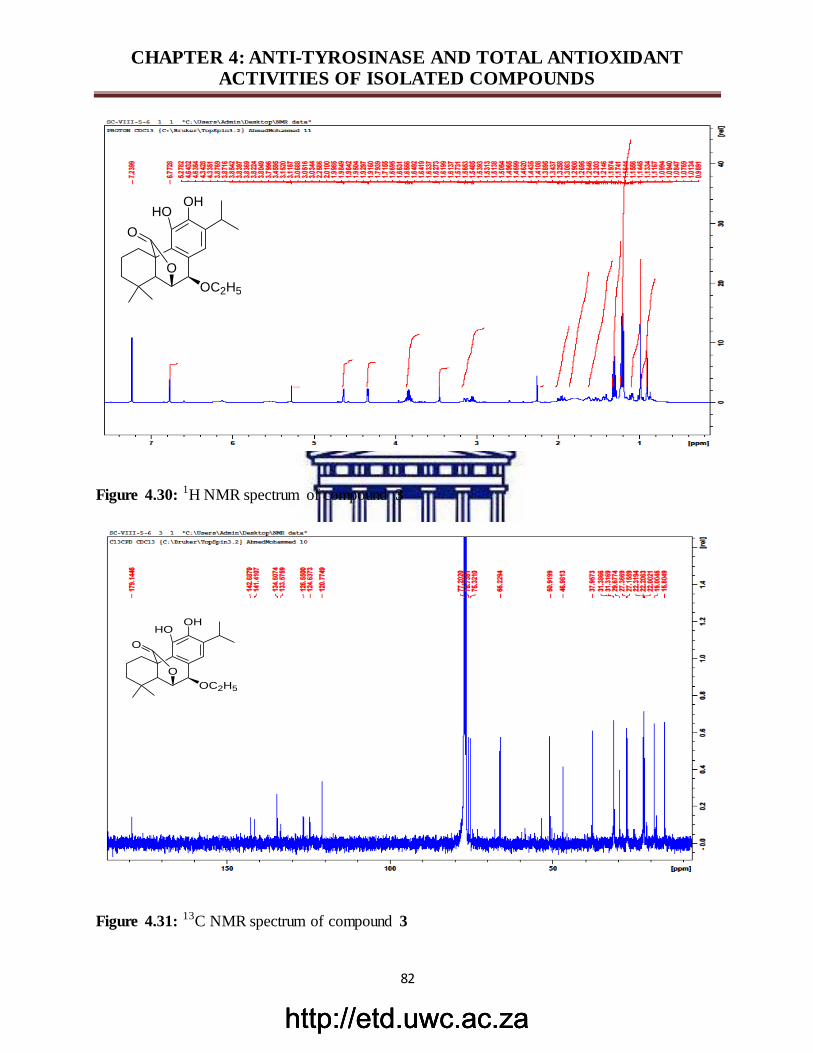
http://etd.uwc.ac.zahttp://etd.uwc.ac.zahttp://etd.uwc.ac.za
CHAPTER 4: ANTI-TYROSINASE AND TOTAL ANTIOXIDANT ACTIVITIES OF ISOLATED COMPOUNDS
82
Figure 4.30: 1H NMR spectrum of compound 3
Figure 4.31: 13C NMR spectrum of compound 3
OHHO
O
OC2H5
O
OHHO
O
OC2H5
O
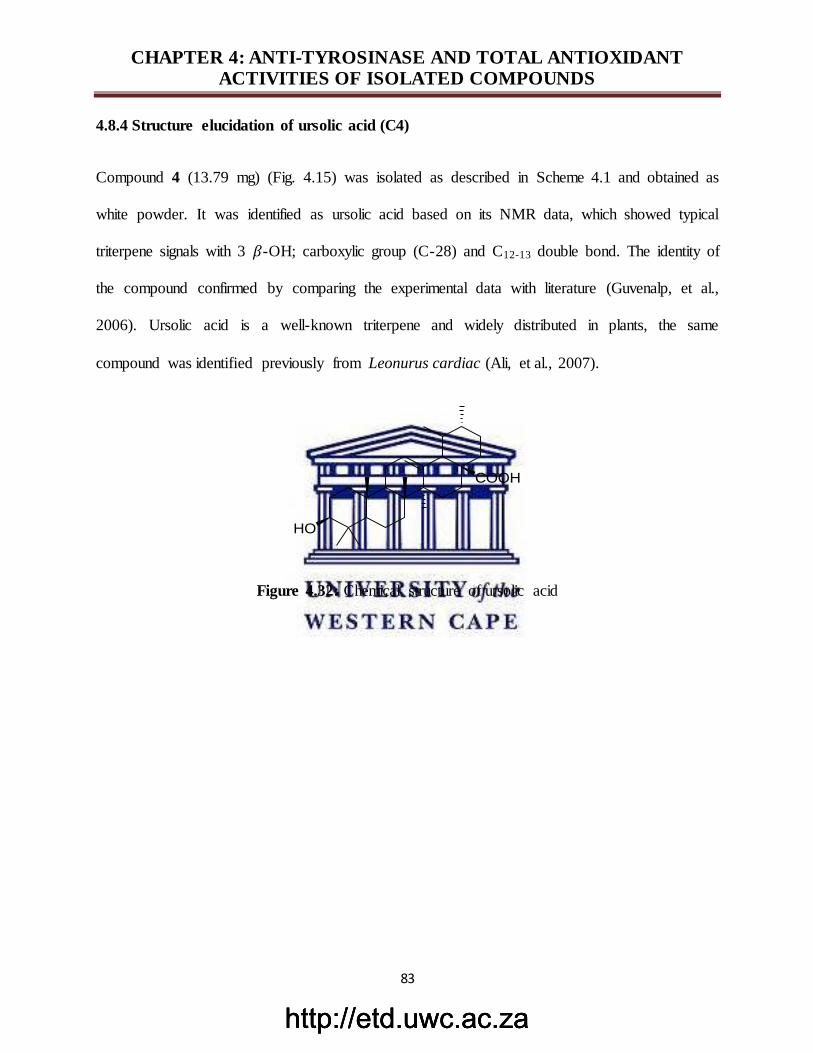
http://etd.uwc.ac.zahttp://etd.uwc.ac.zahttp://etd.uwc.ac.za
CHAPTER 4: ANTI-TYROSINASE AND TOTAL ANTIOXIDANT ACTIVITIES OF ISOLATED COMPOUNDS
83
4.8.4 Structure elucidation of ursolic acid (C4)
Compound 4 (13.79 mg) (Fig. 4.15) was isolated as described in Scheme 4.1 and obtained as
white powder. It was identified as ursolic acid based on its NMR data, which showed typical
triterpene signals with 3 𝛽-OH; carboxylic group (C-28) and C12-13 double bond. The identity of
the compound confirmed by comparing the experimental data with literature (Guvenalp, et al.,
2006). Ursolic acid is a well-known triterpene and widely distributed in plants, the same
compound was identified previously from Leonurus cardiac (Ali, et al., 2007).
Figure 4.32: Chemical structure of ursolic acid
COOH
HO
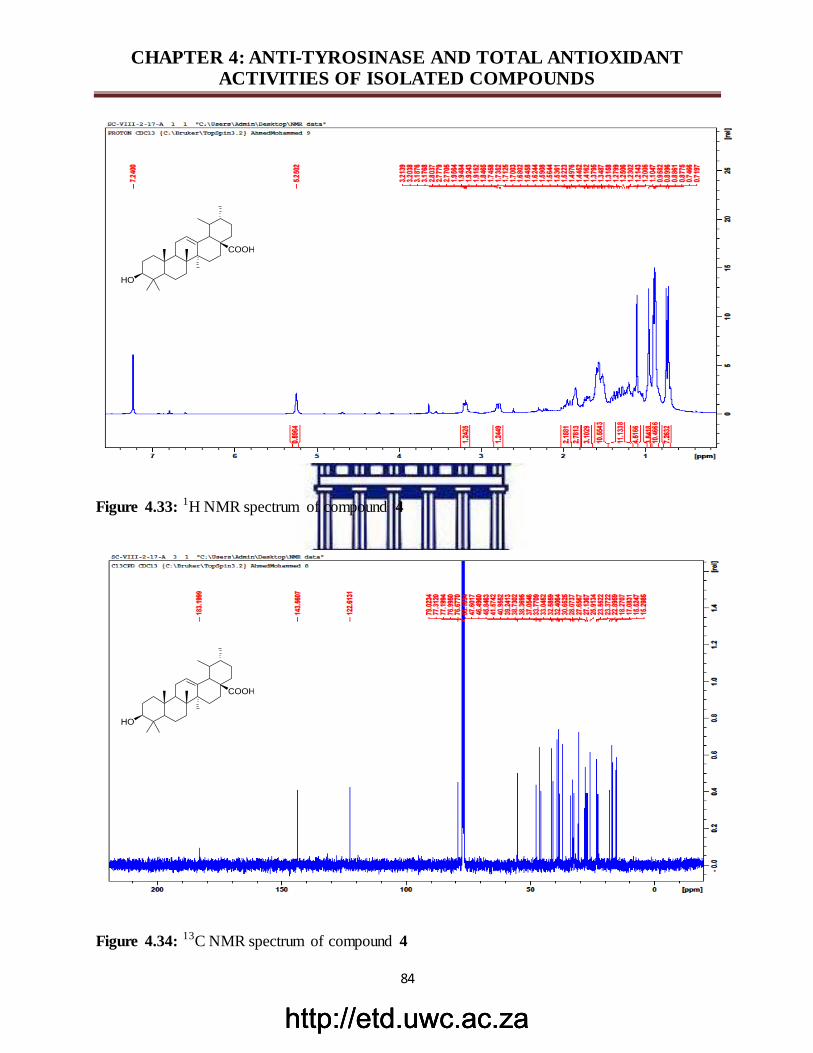
http://etd.uwc.ac.zahttp://etd.uwc.ac.zahttp://etd.uwc.ac.za
CHAPTER 4: ANTI-TYROSINASE AND TOTAL ANTIOXIDANT ACTIVITIES OF ISOLATED COMPOUNDS
84
Figure 4.33: 1H NMR spectrum of compound 4
Figure 4.34: 13C NMR spectrum of compound 4
COOH
HO
COOH
HO
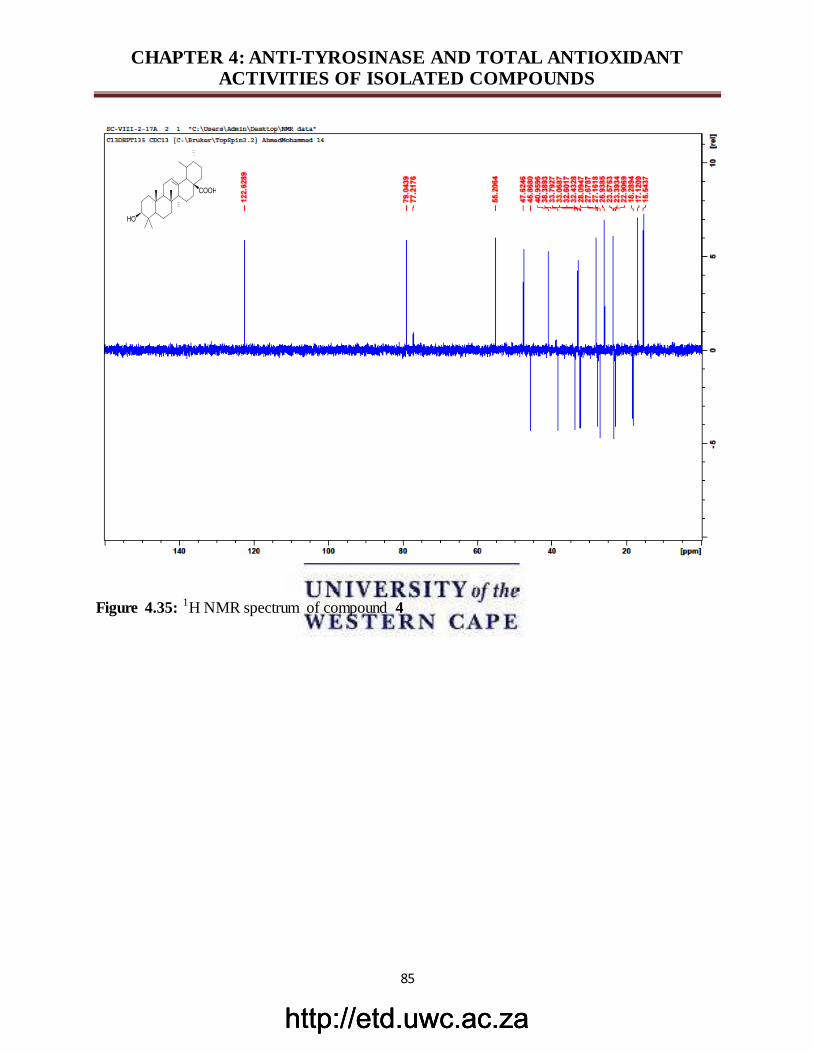
http://etd.uwc.ac.zahttp://etd.uwc.ac.zahttp://etd.uwc.ac.za
CHAPTER 4: ANTI-TYROSINASE AND TOTAL ANTIOXIDANT ACTIVITIES OF ISOLATED COMPOUNDS
85
Figure 4.35: 1H NMR spectrum of compound 4
COOH
HO
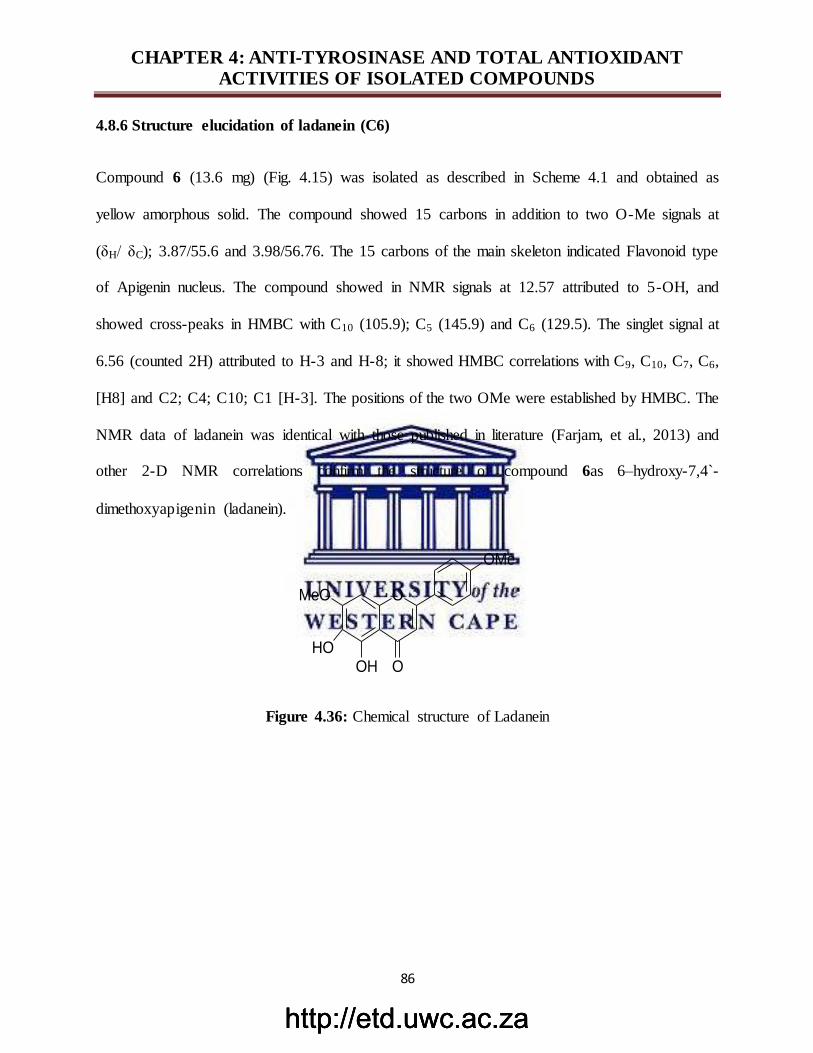
http://etd.uwc.ac.zahttp://etd.uwc.ac.zahttp://etd.uwc.ac.za
CHAPTER 4: ANTI-TYROSINASE AND TOTAL ANTIOXIDANT ACTIVITIES OF ISOLATED COMPOUNDS
86
4.8.6 Structure elucidation of ladanein (C6)
Compound 6 (13.6 mg) (Fig. 4.15) was isolated as described in Scheme 4.1 and obtained as
yellow amorphous solid. The compound showed 15 carbons in addition to two O-Me signals at
(δH/ δC); 3.87/55.6 and 3.98/56.76. The 15 carbons of the main skeleton indicated Flavonoid type
of Apigenin nucleus. The compound showed in NMR signals at 12.57 attributed to 5-OH, and
showed cross-peaks in HMBC with C10 (105.9); C5 (145.9) and C6 (129.5). The singlet signal at
6.56 (counted 2H) attributed to H-3 and H-8; it showed HMBC correlations with C9, C10, C7, C6,
[H8] and C2; C4; C10; C1 [H-3]. The positions of the two OMe were established by HMBC. The
NMR data of ladanein was identical with those published in literature (Farjam, et al., 2013) and
other 2-D NMR correlations confirm the structure of compound 6as 6–hydroxy-7,4`-
dimethoxyapigenin (ladanein).
O
OHHO
MeO
OMe
O
Figure 4.36: Chemical structure of Ladanein
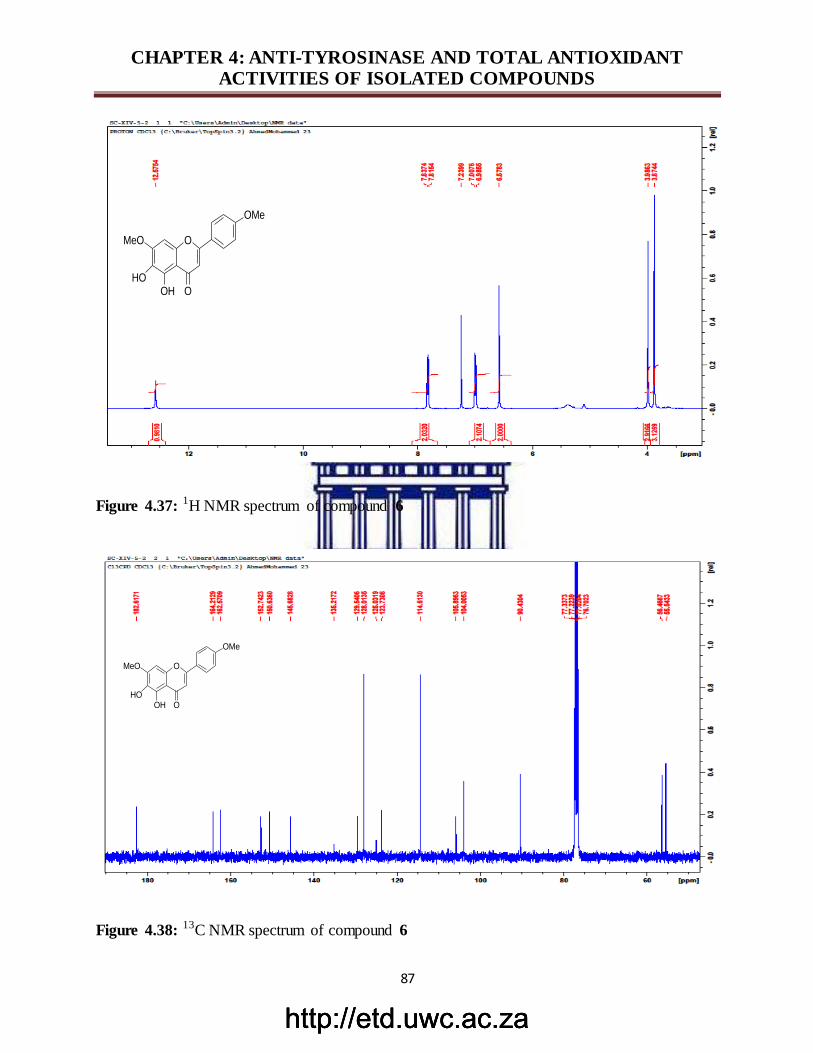
http://etd.uwc.ac.zahttp://etd.uwc.ac.zahttp://etd.uwc.ac.za
CHAPTER 4: ANTI-TYROSINASE AND TOTAL ANTIOXIDANT ACTIVITIES OF ISOLATED COMPOUNDS
87
Figure 4.37: 1H NMR spectrum of compound 6
Figure 4.38: 13C NMR spectrum of compound 6
O
OHHO
MeO
OMe
O
O
OHHO
MeO
OMe
O
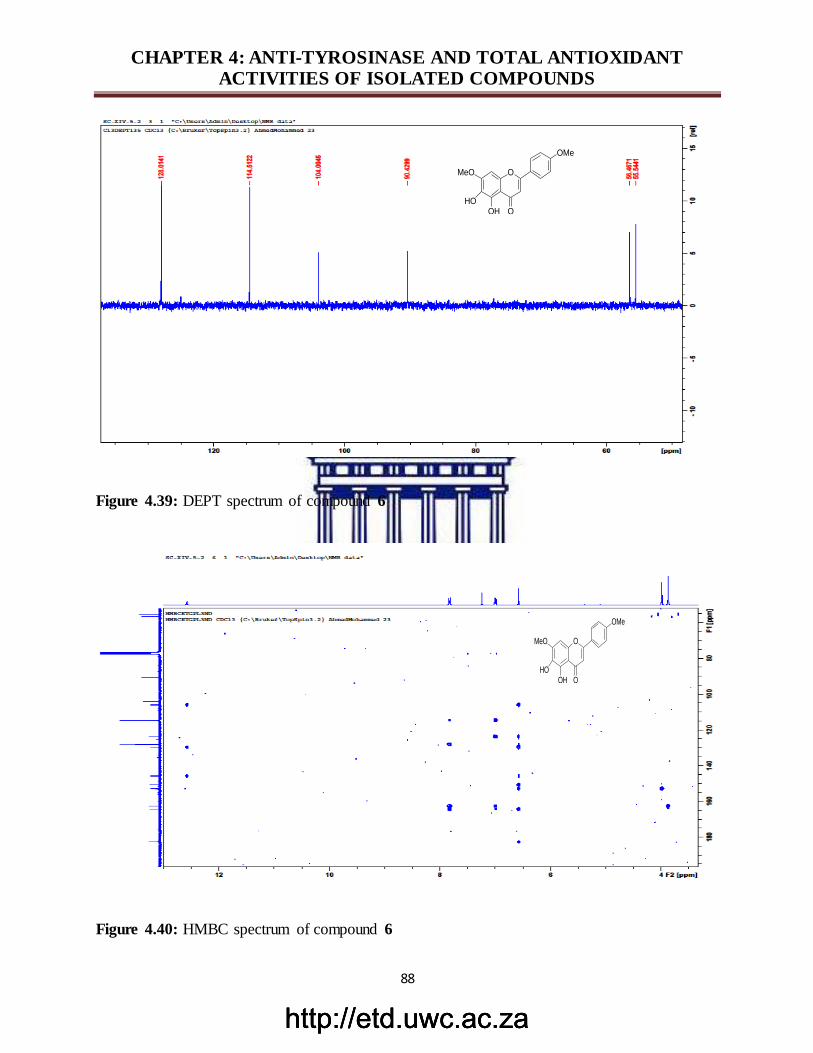
http://etd.uwc.ac.zahttp://etd.uwc.ac.zahttp://etd.uwc.ac.za
CHAPTER 4: ANTI-TYROSINASE AND TOTAL ANTIOXIDANT ACTIVITIES OF ISOLATED COMPOUNDS
88
Figure 4.39: DEPT spectrum of compound 6
Figure 4.40: HMBC spectrum of compound 6
O
OHHO
MeO
OMe
O
O
OHHO
MeO
OMe
O
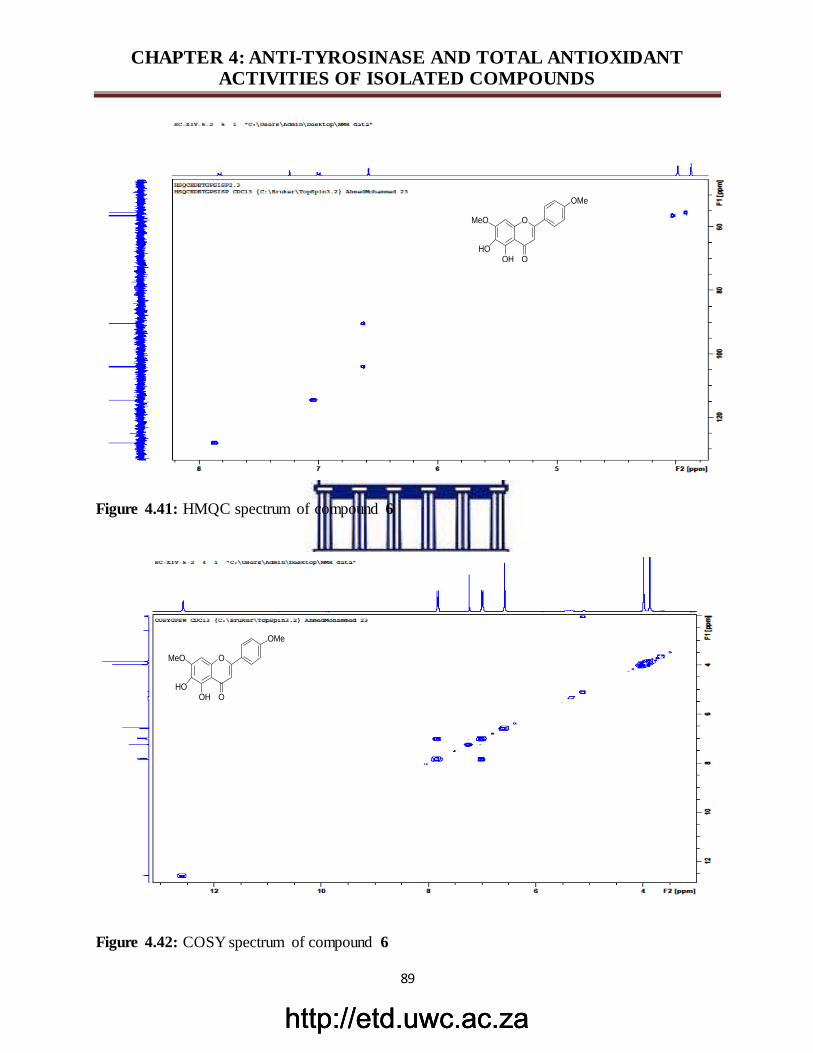
http://etd.uwc.ac.zahttp://etd.uwc.ac.zahttp://etd.uwc.ac.za
CHAPTER 4: ANTI-TYROSINASE AND TOTAL ANTIOXIDANT ACTIVITIES OF ISOLATED COMPOUNDS
89
Figure 4.41: HMQC spectrum of compound 6
Figure 4.42: COSY spectrum of compound 6
O
OHHO
MeO
OMe
O
O
OHHO
MeO
OMe
O
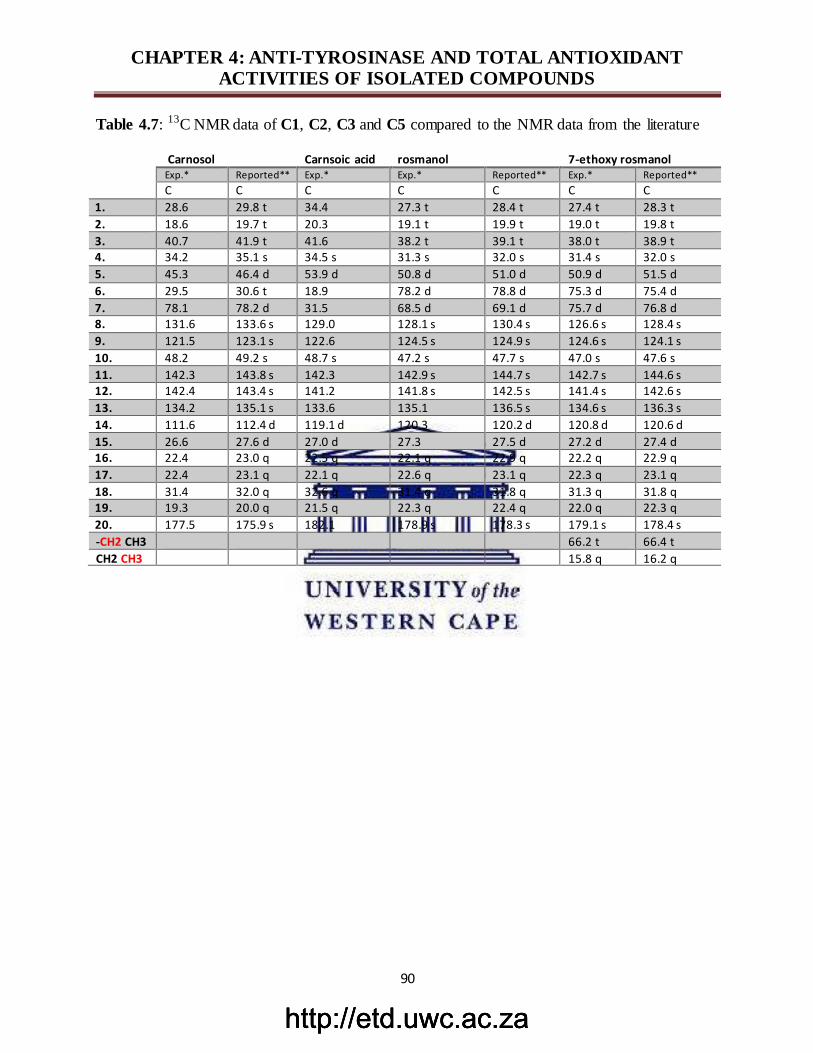
http://etd.uwc.ac.zahttp://etd.uwc.ac.zahttp://etd.uwc.ac.za
CHAPTER 4: ANTI-TYROSINASE AND TOTAL ANTIOXIDANT ACTIVITIES OF ISOLATED COMPOUNDS
90
Table 4.7: 13C NMR data of C1, C2, C3 and C5 compared to the NMR data from the literature
Carnosol Carnsoic acid rosmanol 7-ethoxy rosmanol Exp.* Reported** Exp.* Exp.* Reported** Exp.* Reported**
C C C C C C C
1. 28.6 29.8 t 34.4 27.3 t 28.4 t 27.4 t 28.3 t
2. 18.6 19.7 t 20.3 19.1 t 19.9 t 19.0 t 19.8 t
3. 40.7 41.9 t 41.6 38.2 t 39.1 t 38.0 t 38.9 t 4. 34.2 35.1 s 34.5 s 31.3 s 32.0 s 31.4 s 32.0 s
5. 45.3 46.4 d 53.9 d 50.8 d 51.0 d 50.9 d 51.5 d
6. 29.5 30.6 t 18.9 78.2 d 78.8 d 75.3 d 75.4 d
7. 78.1 78.2 d 31.5 68.5 d 69.1 d 75.7 d 76.8 d 8. 131.6 133.6 s 129.0 128.1 s 130.4 s 126.6 s 128.4 s
9. 121.5 123.1 s 122.6 124.5 s 124.9 s 124.6 s 124.1 s
10. 48.2 49.2 s 48.7 s 47.2 s 47.7 s 47.0 s 47.6 s
11. 142.3 143.8 s 142.3 142.9 s 144.7 s 142.7 s 144.6 s 12. 142.4 143.4 s 141.2 141.8 s 142.5 s 141.4 s 142.6 s
13. 134.2 135.1 s 133.6 135.1 136.5 s 134.6 s 136.3 s
14. 111.6 112.4 d 119.1 d 120.3 120.2 d 120.8 d 120.6 d
15. 26.6 27.6 d 27.0 d 27.3 27.5 d 27.2 d 27.4 d 16. 22.4 23.0 q 22.5 q 22.1 q 22.9 q 22.2 q 22.9 q
17. 22.4 23.1 q 22.1 q 22.6 q 23.1 q 22.3 q 23.1 q
18. 31.4 32.0 q 32.6 q 31.4 q 31.8 q 31.3 q 31.8 q 19. 19.3 20.0 q 21.5 q 22.3 q 22.4 q 22.0 q 22.3 q
20. 177.5 175.9 s 182.1 178.9 s 178.3 s 179.1 s 178.4 s
-CH2 CH3 66.2 t 66.4 t
CH2 CH3 15.8 q 16.2 q
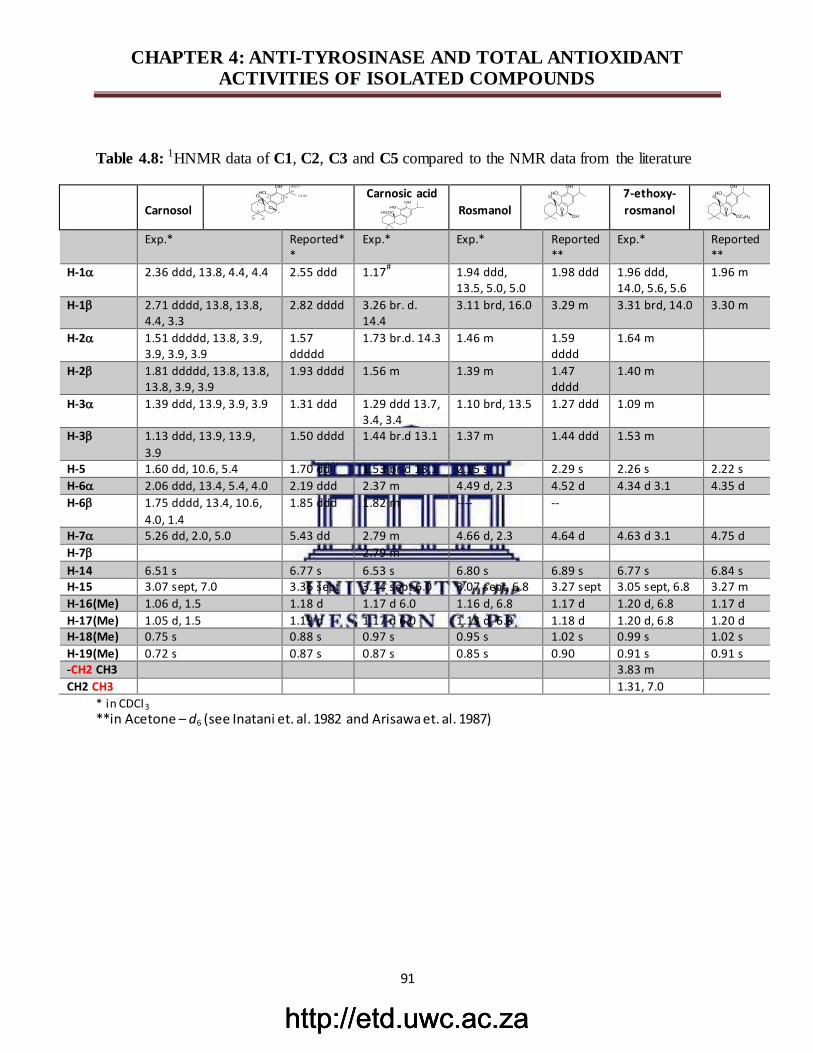
http://etd.uwc.ac.zahttp://etd.uwc.ac.zahttp://etd.uwc.ac.za
CHAPTER 4: ANTI-TYROSINASE AND TOTAL ANTIOXIDANT ACTIVITIES OF ISOLATED COMPOUNDS
91
Table 4.8: 1HNMR data of C1, C2, C3 and C5 compared to the NMR data from the literature
Carnosol
OH
O
OHO
1
47
11 13
16(17)
17(16)
15
18 19
20
Carnosic acidOH
HO
HOOC
Rosmanol
7-ethoxy-
rosmanol
Exp.* Reported**
Exp.* Exp.* Reported**
Exp.* Reported**
H-1 2.36 ddd, 13.8, 4.4, 4.4 2.55 ddd 1.17# 1.94 ddd,
13.5, 5.0, 5.0 1.98 ddd 1.96 ddd,
14.0, 5.6, 5.6 1.96 m
H-1 2.71 dddd, 13.8, 13.8, 4.4, 3.3
2.82 dddd 3.26 br. d. 14.4
3.11 brd, 16.0 3.29 m 3.31 brd, 14.0 3.30 m
H-2 1.51 ddddd, 13.8, 3.9, 3.9, 3.9, 3.9
1.57 ddddd
1.73 br.d. 14.3 1.46 m 1.59 dddd
1.64 m
H-2 1.81 ddddd, 13.8, 13.8, 13.8, 3.9, 3.9
1.93 dddd 1.56 m 1.39 m 1.47 dddd
1.40 m
H-3 1.39 ddd, 13.9, 3.9, 3.9 1.31 ddd 1.29 ddd 13.7, 3.4, 3.4
1.10 brd, 13.5 1.27 ddd 1.09 m
H-3 1.13 ddd, 13.9, 13.9,
3.9
1.50 dddd 1.44 br.d 13.1 1.37 m 1.44 ddd 1.53 m
H-5 1.60 dd, 10.6, 5.4 1.70 dd 1.53 br.d 13.1 2.15 s 2.29 s 2.26 s 2.22 s
H-6 2.06 ddd, 13.4, 5.4, 4.0 2.19 ddd 2.37 m 4.49 d, 2.3 4.52 d 4.34 d 3.1 4.35 d
H-6 1.75 dddd, 13.4, 10.6,
4.0, 1.4
1.85 ddd 1.82 m ---- --
H-7 5.26 dd, 2.0, 5.0 5.43 dd 2.79 m 4.66 d, 2.3 4.64 d 4.63 d 3.1 4.75 d
H-7 2.79 m
H-14 6.51 s 6.77 s 6.53 s 6.80 s 6.89 s 6.77 s 6.84 s H-15 3.07 sept, 7.0 3.36 sept 3.14 sept 6.0 3.07 sept, 6.8 3.27 sept 3.05 sept, 6.8 3.27 m
H-16(Me) 1.06 d, 1.5 1.18 d 1.17 d 6.0 1.16 d, 6.8 1.17 d 1.20 d, 6.8 1.17 d
H-17(Me) 1.05 d, 1.5 1.19 d 1.17 d 6.0 1.13 d, 6.8 1.18 d 1.20 d, 6.8 1.20 d H-18(Me) 0.75 s 0.88 s 0.97 s 0.95 s 1.02 s 0.99 s 1.02 s
H-19(Me) 0.72 s 0.87 s 0.87 s 0.85 s 0.90 0.91 s 0.91 s -CH2 CH3 3.83 m
CH2 CH3 1.31, 7.0
* in CDCl3
**in Acetone – d6 (see Inatani et. al. 1982 and Arisawa et. al. 1987)
OH
O
OHO
OH
OH
O
OHO
OC2H5
http://etd.uwc.ac.zahttp://etd.uwc.ac.zahttp://etd.uwc.ac.za
CHAPTER 4: ANTI-TYROSINASE AND TOTAL ANTIOXIDANT ACTIVITIES OF ISOLATED COMPOUNDS
92
4.9 Biological evaluations: Results and discussion
In this study, an in vitro investigation were carried out to determine the anti-tyrosinase activity
and the total antioxidant capacities of a methanol extract of S. chamelaeagnea and its 6 isolated
constituents (C1-C6). Spectrophotometry and cyclic voltammetry assays were carried out for the
evaluation of tyrosinase inhibitory activities with kojic acid as a positive control, while the
FRAP, TEAC, ORAC and Fe2+- induced lipid peroxidation assays were used to evaluate the
antioxidant and oxidative damage modulatory capacities of the extract and isolated compounds
while, trolox, ascorbic acid and EGCG were used as reference.
4.9.1 Evaluating the anti-tyrosinase activity of the isolated compounds
The methanolic extract (SC) and the isolated compounds (C1-C6) were evaluated for their
tyrosinase inhibitory activity at different concentration as illustrated in Table 4.9. The result
revealed that C1 demonstrated the highest tyrosinase inhibitory activity (IC50 = 455.5 μg/mL)
among the isolated compounds tested. Recently, tyrosinase inhibitors have received great
attention, due to its alleviating properties to deliver skin lightening and anti-aging benefits,
caused by undesirable skin hyperpigmentation (Narayanaswamy, et al., 2011). The results
showed anti-tyrosinase activity in order of C1>C3>C4>C2>C6>C5 as illustrated in Table 4.9.
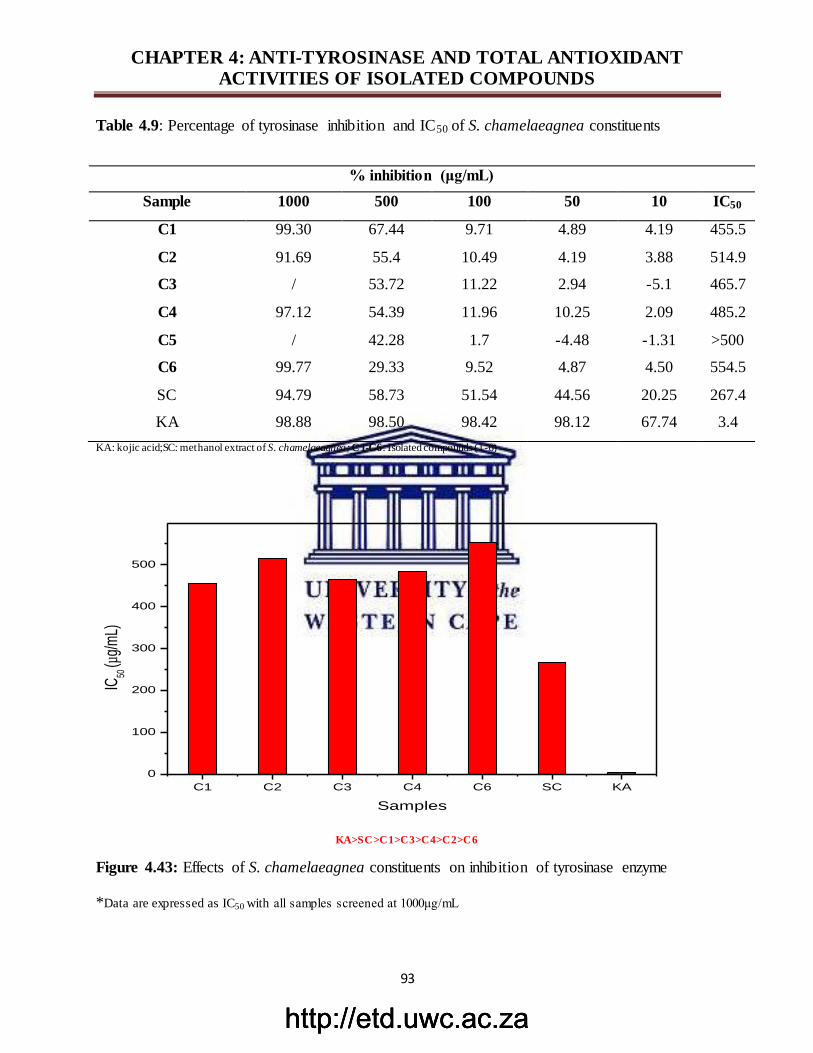
http://etd.uwc.ac.zahttp://etd.uwc.ac.zahttp://etd.uwc.ac.za
CHAPTER 4: ANTI-TYROSINASE AND TOTAL ANTIOXIDANT ACTIVITIES OF ISOLATED COMPOUNDS
93
Table 4.9: Percentage of tyrosinase inhibition and IC50 of S. chamelaeagnea constituents
% inhibition (μg/mL)
Sample 1000 500 100 50 10 IC50
C1 99.30 67.44 9.71 4.89 4.19 455.5
C2 91.69 55.4 10.49 4.19 3.88 514.9
C3 / 53.72 11.22 2.94 -5.1 465.7
C4 97.12 54.39 11.96 10.25 2.09 485.2
C5 / 42.28 1.7 -4.48 -1.31 >500
C6 99.77 29.33 9.52 4.87 4.50 554.5
SC 94.79 58.73 51.54 44.56 20.25 267.4
KA 98.88 98.50 98.42 98.12 67.74 3.4
KA: kojic acid;SC: methanol extract of S. chamelaeagnea; C1-C6: Isolated compounds (1-6)
C1 C2 C3 C4 C6 SC KA
0
100
200
300
400
500
IC50
(µg/
mL)
Samples
KA>SC>C1>C3>C4>C2>C6
Figure 4.43: Effects of S. chamelaeagnea constituents on inhibition of tyrosinase enzyme
*Data are expressed as IC50 with all samples screened at 1000μg/mL
http://etd.uwc.ac.za
CHAPTER 4: ANTI-TYROSINASE AND TOTAL ANTIOXIDANT ACTIVITIES OF ISOLATED COMPOUNDS
94
4.9.2 Cyclic voltammetry (CV) measurement
4.9.2.1 Cyclic voltammetry measurement of redox peaks of isolated compounds
CV is the most common reliable technique used for the characterization of redox system. It gives
information about the number of redox states as well as qualitative information about the
stability of these oxidation states and the electron transfer kinetics (Sochor, et al., 2013).
CV on glassy carbon electrode recorded for monitoring the oxidation-reduction potentials of
isolated compounds (C1-C6) and extract at the broad scan range from -1300 to 1300 mV at 50
mV/s indicated all the compounds except C4 are electro-active with well-defined oxidation-
reduction peaks. The electro-activity of these compounds are illustrated by the fact that redox
peaks are shown on Figure 4.35, an indication that the compounds possessed hydroxyl groups
which are susceptible to be oxidized to their corresponding quinone, and reduced back to the
initial compound. This electro-oxidation can be attributed to the electron transfer reaction
involving to the oxidized product. Therefore, CV is a suitable method for the detection of
phenolic compounds (Magarelli, et al., 2013). It has been reported that compound with the ability
to be oxidized more easily appear to be in higher amount as antioxidant capacity is more
extensive (Dobes, et al., 2013). There is a relationship between electrochemical behavior of
compounds with antioxidant activity and their resulting antioxidant power capacity, and it is
known that low oxidation potential corresponds to the high antioxidant power (Sochor, et al.,
2013). C1 demonstrated the highest electron transfer capacity with the highest anodic peak
current value (0.7 µA), which is in agreement with TEAC (16505.0 ± 0.86 µM TE/g) and FRAP
(9338.92 ± 1.72 µM AAE/g). The mechanism of these two antioxidant assays (FRAP & TEAC)
are measure of electron transfer as well as that of CV. The results obtained therefore are in
agreement with C1 demonstrated highest values for the 3 assays that measure electron transfer
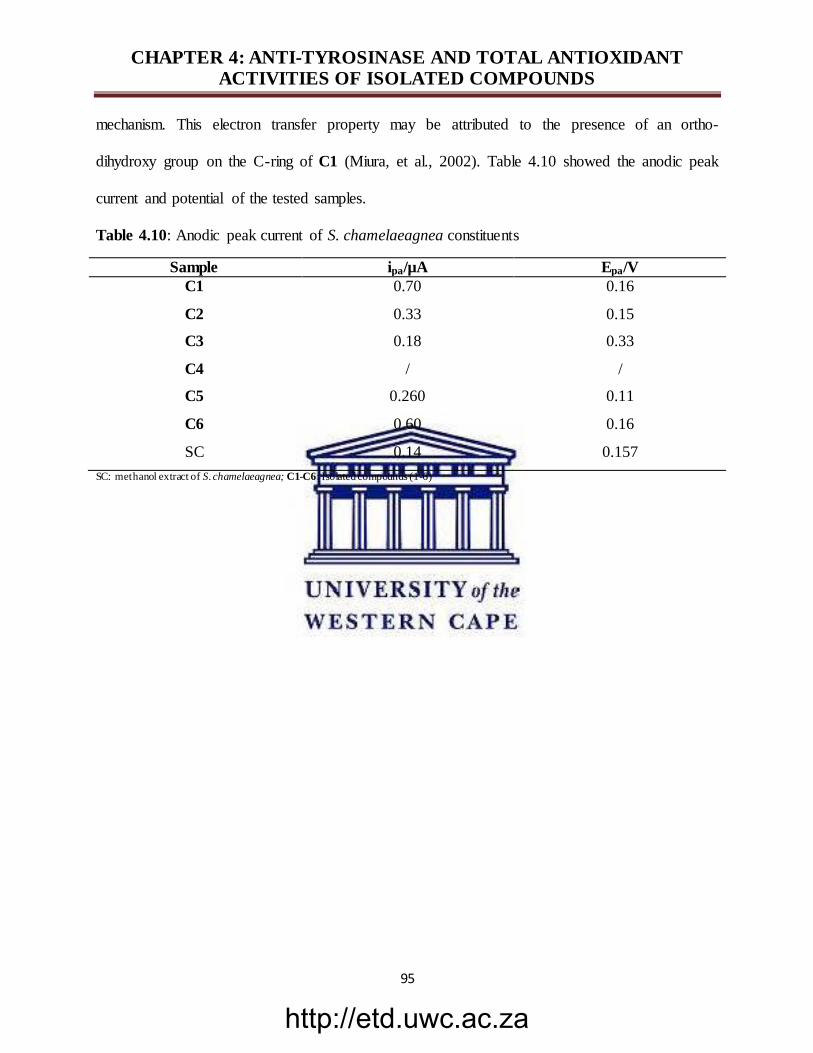
http://etd.uwc.ac.za
CHAPTER 4: ANTI-TYROSINASE AND TOTAL ANTIOXIDANT ACTIVITIES OF ISOLATED COMPOUNDS
95
mechanism. This electron transfer property may be attributed to the presence of an ortho-
dihydroxy group on the C-ring of C1 (Miura, et al., 2002). Table 4.10 showed the anodic peak
current and potential of the tested samples.
Table 4.10: Anodic peak current of S. chamelaeagnea constituents
Sample ipa/µA Epa/V
C1 0.70 0.16
C2 0.33 0.15
C3 0.18 0.33
C4 / /
C5 0.260 0.11
C6 0.60 0.16
SC 0.14 0.157
SC: methanol extract of S. chamelaeagnea; C1-C6: Isolated compounds (1-6)
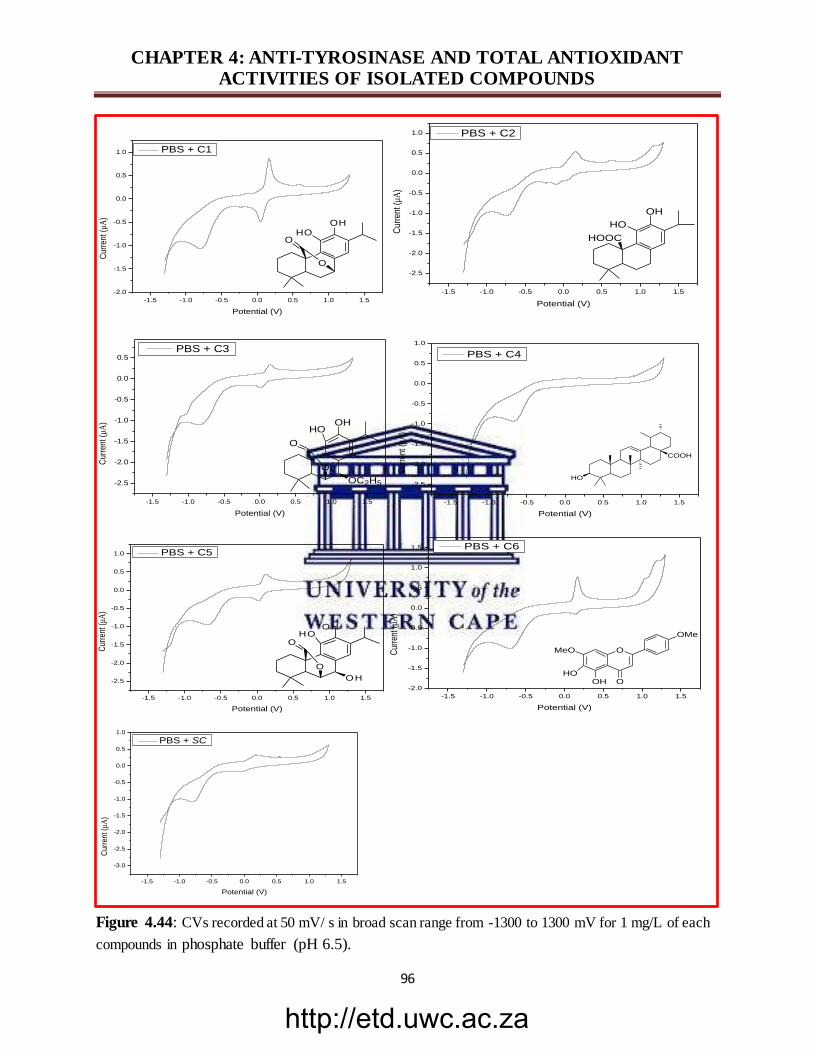
http://etd.uwc.ac.za
CHAPTER 4: ANTI-TYROSINASE AND TOTAL ANTIOXIDANT ACTIVITIES OF ISOLATED COMPOUNDS
96
-1.5 -1.0 -0.5 0.0 0.5 1.0 1.5
-2.0
-1.5
-1.0
-0.5
0.0
0.5
1.0
OH
O
OHO
Cur
rent
(µ
A)
Potential (V)
PBS + C1
-1.5 -1.0 -0.5 0.0 0.5 1.0 1.5
-2.5
-2.0
-1.5
-1.0
-0.5
0.0
0.5
1.0
OH
HO
HOOC
Cur
rent
(µ
A)
Potential (V)
PBS + C2
-1.5 -1.0 -0.5 0.0 0.5 1.0 1.5
-2.5
-2.0
-1.5
-1.0
-0.5
0.0
0.5
OHHO
O
OC2H5
O
Cur
rent
(µ
A)
Potential (V)
PBS + C3
-1.5 -1.0 -0.5 0.0 0.5 1.0 1.5
-2.5
-2.0
-1.5
-1.0
-0.5
0.0
0.5
1.0
COOH
HO
Cur
rent
(µA
)
Potential (V)
PBS + C4
-1.5 -1.0 -0.5 0.0 0.5 1.0 1.5
-2.5
-2.0
-1.5
-1.0
-0.5
0.0
0.5
1.0
OH
O
OH
OHO
Cur
rent
(µA
)
Potential (V)
PBS + C5
-1.5 -1.0 -0.5 0.0 0.5 1.0 1.5
-2.0
-1.5
-1.0
-0.5
0.0
0.5
1.0
1.5
O
OHHO
MeO
OMe
O
Cur
rent
(µA
)
Potential (V)
PBS + C6
-1.5 -1.0 -0.5 0.0 0.5 1.0 1.5
-3.0
-2.5
-2.0
-1.5
-1.0
-0.5
0.0
0.5
1.0
Cu
rre
nt (
µA
)
Potential (V)
PBS + SC
Figure 4.44: CVs recorded at 50 mV/ s in broad scan range from -1300 to 1300 mV for 1 mg/L of each
compounds in phosphate buffer (pH 6.5).
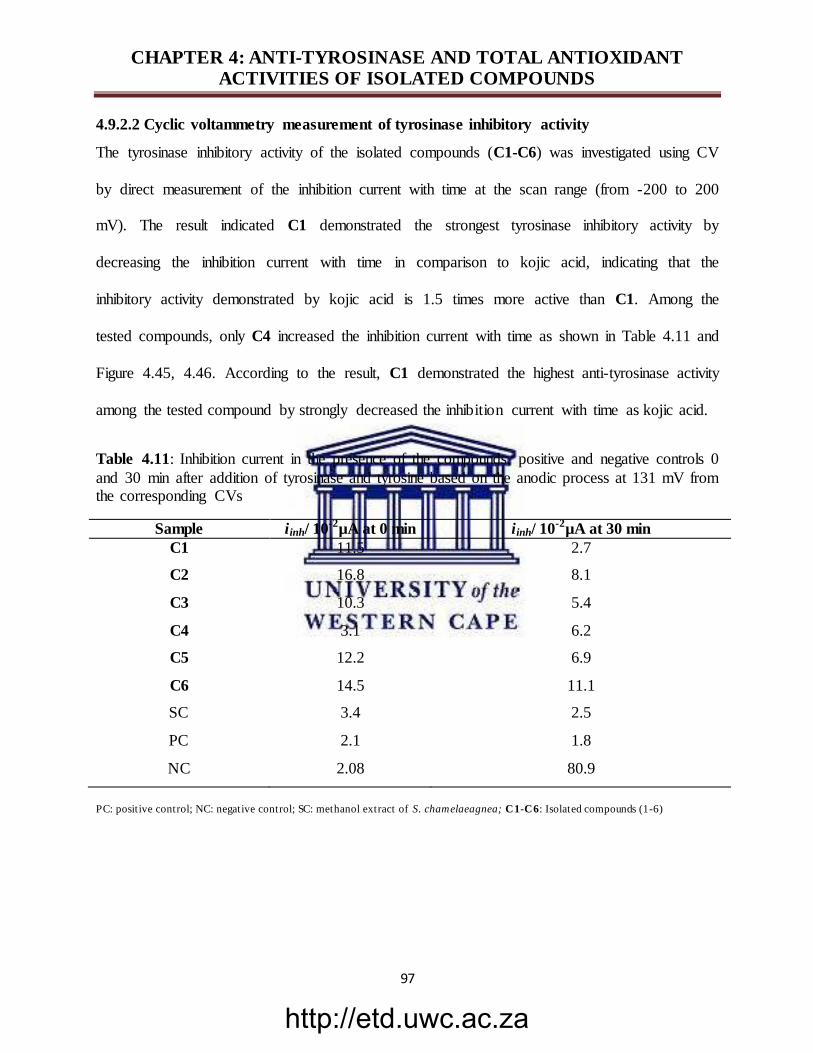
http://etd.uwc.ac.za
CHAPTER 4: ANTI-TYROSINASE AND TOTAL ANTIOXIDANT ACTIVITIES OF ISOLATED COMPOUNDS
97
4.9.2.2 Cyclic voltammetry measurement of tyrosinase inhibitory activity
The tyrosinase inhibitory activity of the isolated compounds (C1-C6) was investigated using CV
by direct measurement of the inhibition current with time at the scan range (from -200 to 200
mV). The result indicated C1 demonstrated the strongest tyrosinase inhibitory activity by
decreasing the inhibition current with time in comparison to kojic acid, indicating that the
inhibitory activity demonstrated by kojic acid is 1.5 times more active than C1. Among the
tested compounds, only C4 increased the inhibition current with time as shown in Table 4.11 and
Figure 4.45, 4.46. According to the result, C1 demonstrated the highest anti-tyrosinase activity
among the tested compound by strongly decreased the inhibition current with time as kojic acid.
Table 4.11: Inhibition current in the presence of the compounds, positive and negative controls 0
and 30 min after addition of tyrosinase and tyrosine based on the anodic process at 131 mV from the corresponding CVs
Sample iinh/ 10-2µA at 0 min iinh/ 10-2µA at 30 min
C1 11.5 2.7
C2 16.8 8.1
C3 10.3 5.4
C4 3.1 6.2
C5 12.2 6.9
C6 14.5 11.1
SC 3.4 2.5
PC 2.1 1.8
NC 2.08 80.9
PC: positive control; NC: negative control; SC: methanol extract of S. chamelaeagnea; C1-C6: Isolated compounds (1-6)
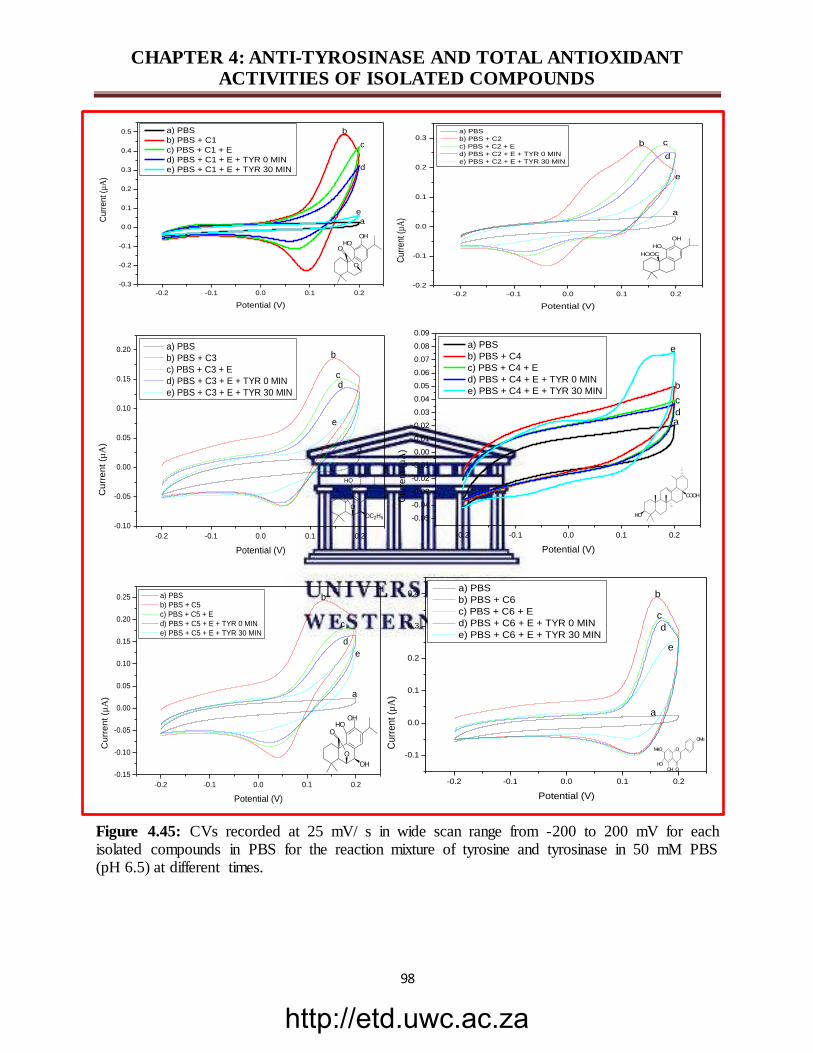
http://etd.uwc.ac.za
CHAPTER 4: ANTI-TYROSINASE AND TOTAL ANTIOXIDANT ACTIVITIES OF ISOLATED COMPOUNDS
98
-0.2 -0.1 0.0 0.1 0.2
-0.3
-0.2
-0.1
0.0
0.1
0.2
0.3
0.4
0.5
OH
O
OHO
Cu
rre
nt (µ
A)
Potential (V)
a) PBS
b) PBS + C1
c) PBS + C1 + E
d) PBS + C1 + E + TYR 0 MIN
e) PBS + C1 + E + TYR 30 MIN
a
b
c
d
e
-0.2 -0.1 0.0 0.1 0.2
-0.2
-0.1
0.0
0.1
0.2
0.3
OH
HO
HOOC
Cur
rent
(µ
A)
Potential (V)
a) PBS
b) PBS + C2
c) PBS + C2 + E
d) PBS + C2 + E + TYR 0 MIN
e) PBS + C2 + E + TYR 30 MIN
b c
d
e
a
-0.2 -0.1 0.0 0.1 0.2
-0.10
-0.05
0.00
0.05
0.10
0.15
0.20
OHHO
O
OC2H5
O
C
urr
en
t (µ
A)
Potential (V)
a) PBS
b) PBS + C3
c) PBS + C3 + E
d) PBS + C3 + E + TYR 0 MIN
e) PBS + C3 + E + TYR 30 MIN
b
a
cd
e
-0.2 -0.1 0.0 0.1 0.2
-0.05
-0.04
-0.03
-0.02
-0.01
0.00
0.01
0.02
0.03
0.04
0.05
0.06
0.07
0.08
0.09
COOH
HO
Cu
rre
nt (µ
A)
Potential (V)
a) PBS
b) PBS + C4
c) PBS + C4 + E
d) PBS + C4 + E + TYR 0 MIN
e) PBS + C4 + E + TYR 30 MIN
e
b
c
ad
-0.2 -0.1 0.0 0.1 0.2
-0.15
-0.10
-0.05
0.00
0.05
0.10
0.15
0.20
0.25
OH
O
OH
OHO
Cu
rre
nt (µ
A)
Potential (V)
a) PBS
b) PBS + C5
c) PBS + C5 + E
d) PBS + C5 + E + TYR 0 MIN
e) PBS + C5 + E + TYR 30 MIN
b
c
d
e
a
-0.2 -0.1 0.0 0.1 0.2
-0.1
0.0
0.1
0.2
0.3
0.4
O
OHHO
MeO
OMe
O
C
urr
en
t (µ
A)
Potential (V)
a) PBS
b) PBS + C6
c) PBS + C6 + E
d) PBS + C6 + E + TYR 0 MIN
e) PBS + C6 + E + TYR 30 MIN
b
e
a
c
d
Figure 4.45: CVs recorded at 25 mV/ s in wide scan range from -200 to 200 mV for each isolated compounds in PBS for the reaction mixture of tyrosine and tyrosinase in 50 mM PBS (pH 6.5) at different times.
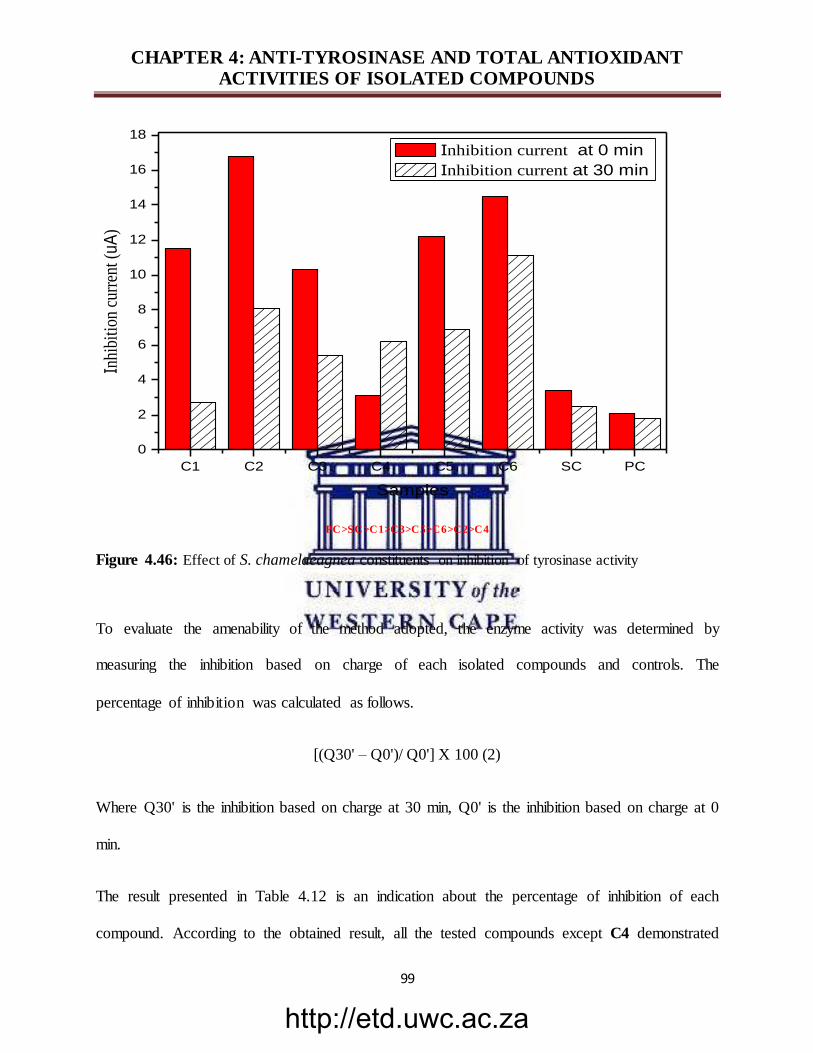
http://etd.uwc.ac.za
CHAPTER 4: ANTI-TYROSINASE AND TOTAL ANTIOXIDANT ACTIVITIES OF ISOLATED COMPOUNDS
99
C1 C2 C3 C4 C5 C6 SC PC
0
2
4
6
8
10
12
14
16
18
In
hibi
tion
cur
rent
(u
A)
Samples
Inhibition current at 0 min
Inhibition current at 30 min
PC>SC>C1>C3>C5>C6>C2>C4
Figure 4.46: Effect of S. chamelaeagnea constituents on inhibition of tyrosinase activity
To evaluate the amenability of the method adopted, the enzyme activity was determined by
measuring the inhibition based on charge of each isolated compounds and controls. The
percentage of inhibition was calculated as follows.
[(Q30' – Q0')/ Q0'] X 100 (2)
Where Q30' is the inhibition based on charge at 30 min, Q0' is the inhibition based on charge at 0
min.
The result presented in Table 4.12 is an indication about the percentage of inhibition of each
compound. According to the obtained result, all the tested compounds except C4 demonstrated
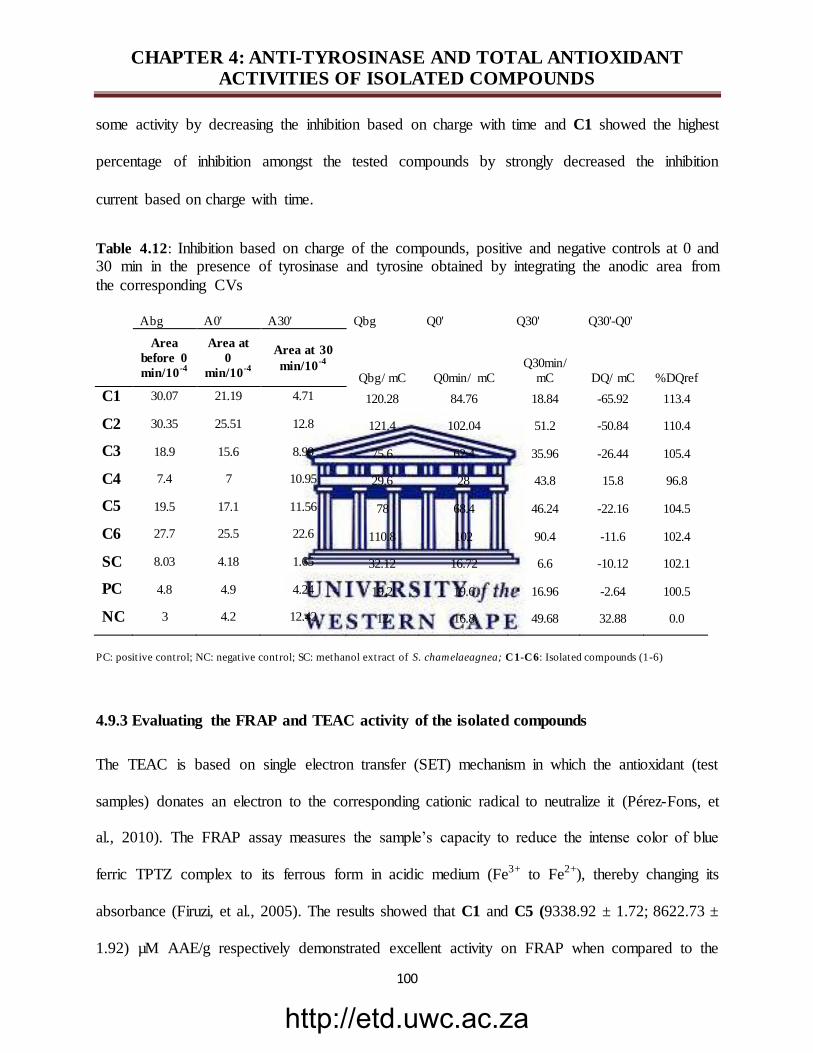
http://etd.uwc.ac.za
CHAPTER 4: ANTI-TYROSINASE AND TOTAL ANTIOXIDANT ACTIVITIES OF ISOLATED COMPOUNDS
100
some activity by decreasing the inhibition based on charge with time and C1 showed the highest
percentage of inhibition amongst the tested compounds by strongly decreased the inhibition
current based on charge with time.
Table 4.12: Inhibition based on charge of the compounds, positive and negative controls at 0 and 30 min in the presence of tyrosinase and tyrosine obtained by integrating the anodic area from
the corresponding CVs
Abg A0' A30' Qbg Q0' Q30' Q30'-Q0'
Area
before 0
min/10-4
Area at
0
min/10-4
Area at 30
min/10-4
Qbg/ mC Q0min/ mC
Q30min/
mC DQ/ mC %DQref
C1 30.07 21.19 4.71 120.28 84.76 18.84 -65.92 113.4
C2 30.35 25.51 12.8 121.4 102.04 51.2 -50.84 110.4
C3 18.9 15.6 8.99 75.6 62.4 35.96 -26.44 105.4
C4 7.4 7 10.95 29.6 28 43.8 15.8 96.8
C5 19.5 17.1 11.56 78 68.4 46.24 -22.16 104.5
C6 27.7 25.5 22.6 110.8 102 90.4 -11.6 102.4
SC 8.03 4.18 1.65 32.12 16.72 6.6 -10.12 102.1
PC 4.8 4.9 4.24 19.2 19.6 16.96 -2.64 100.5
NC 3 4.2 12.42 12 16.8 49.68 32.88 0.0
PC: positive control; NC: negative control; SC: methanol extract of S. chamelaeagnea; C1-C6: Isolated compounds (1-6)
4.9.3 Evaluating the FRAP and TEAC activity of the isolated compounds
The TEAC is based on single electron transfer (SET) mechanism in which the antioxidant (test
samples) donates an electron to the corresponding cationic radical to neutralize it (Pérez-Fons, et
al., 2010). The FRAP assay measures the sample’s capacity to reduce the intense color of blue
ferric TPTZ complex to its ferrous form in acidic medium (Fe3+ to Fe2+), thereby changing its
absorbance (Firuzi, et al., 2005). The results showed that C1 and C5 (9338.92 ± 1.72; 8622.73 ±
1.92) µM AAE/g respectively demonstrated excellent activity on FRAP when compared to the
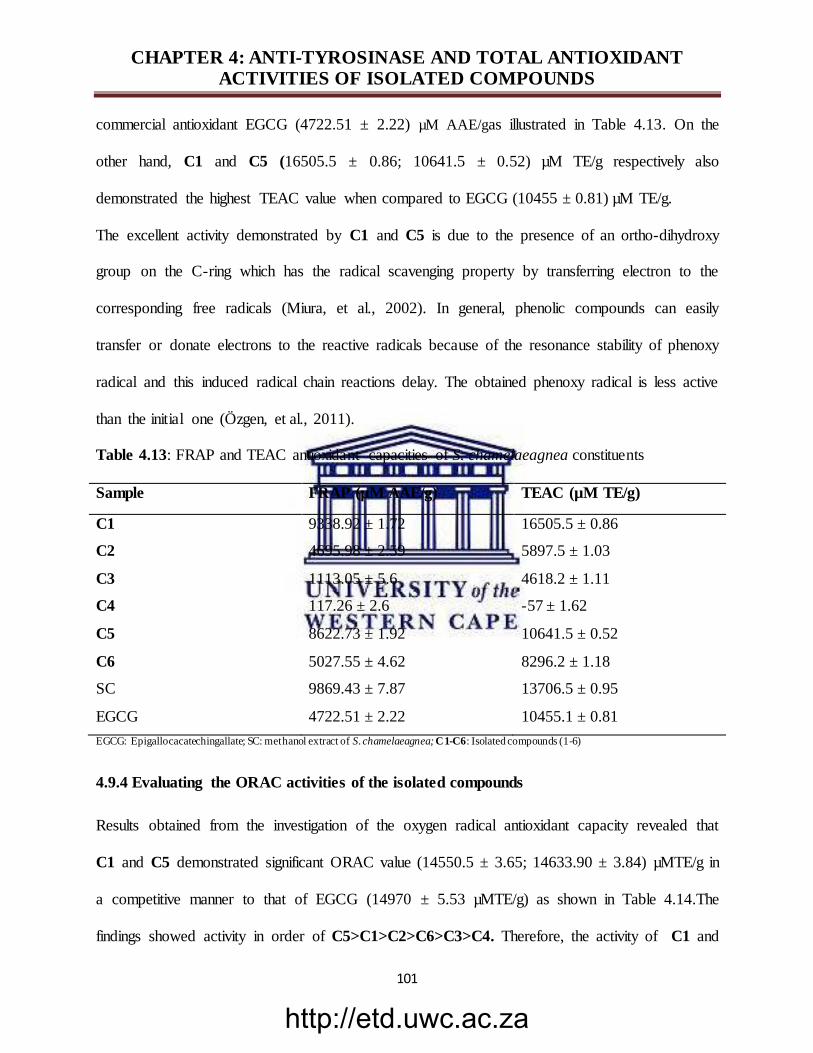
http://etd.uwc.ac.za
CHAPTER 4: ANTI-TYROSINASE AND TOTAL ANTIOXIDANT ACTIVITIES OF ISOLATED COMPOUNDS
101
commercial antioxidant EGCG (4722.51 ± 2.22) µM AAE/gas illustrated in Table 4.13. On the
other hand, C1 and C5 (16505.5 ± 0.86; 10641.5 ± 0.52) µM TE/g respectively also
demonstrated the highest TEAC value when compared to EGCG (10455 ± 0.81) µM TE/g.
The excellent activity demonstrated by C1 and C5 is due to the presence of an ortho-dihydroxy
group on the C-ring which has the radical scavenging property by transferring electron to the
corresponding free radicals (Miura, et al., 2002). In general, phenolic compounds can easily
transfer or donate electrons to the reactive radicals because of the resonance stability of phenoxy
radical and this induced radical chain reactions delay. The obtained phenoxy radical is less active
than the initial one (Özgen, et al., 2011).
Table 4.13: FRAP and TEAC antioxidant capacities of S. chamelaeagnea constituents
Sample FRAP (µM AAE/g) TEAC (µM TE/g)
C1 9338.92 ± 1.72 16505.5 ± 0.86
C2
C3
4695.98 ± 2.59
1113.05 ± 5.6
5897.5 ± 1.03
4618.2 ± 1.11
C4
C5
117.26 ± 2.6
8622.73 ± 1.92
-57 ± 1.62
10641.5 ± 0.52
C6 5027.55 ± 4.62 8296.2 ± 1.18
SC 9869.43 ± 7.87 13706.5 ± 0.95
EGCG 4722.51 ± 2.22 10455.1 ± 0.81
EGCG: Epigallocacatechingallate; SC: methanol extract of S. chamelaeagnea; C1-C6: Isolated compounds (1-6)
4.9.4 Evaluating the ORAC activities of the isolated compounds
Results obtained from the investigation of the oxygen radical antioxidant capacity revealed that
C1 and C5 demonstrated significant ORAC value (14550.5 ± 3.65; 14633.90 ± 3.84) µMTE/g in
a competitive manner to that of EGCG (14970 ± 5.53 µMTE/g) as shown in Table 4.14.The
findings showed activity in order of C5>C1>C2>C6>C3>C4. Therefore, the activity of C1 and
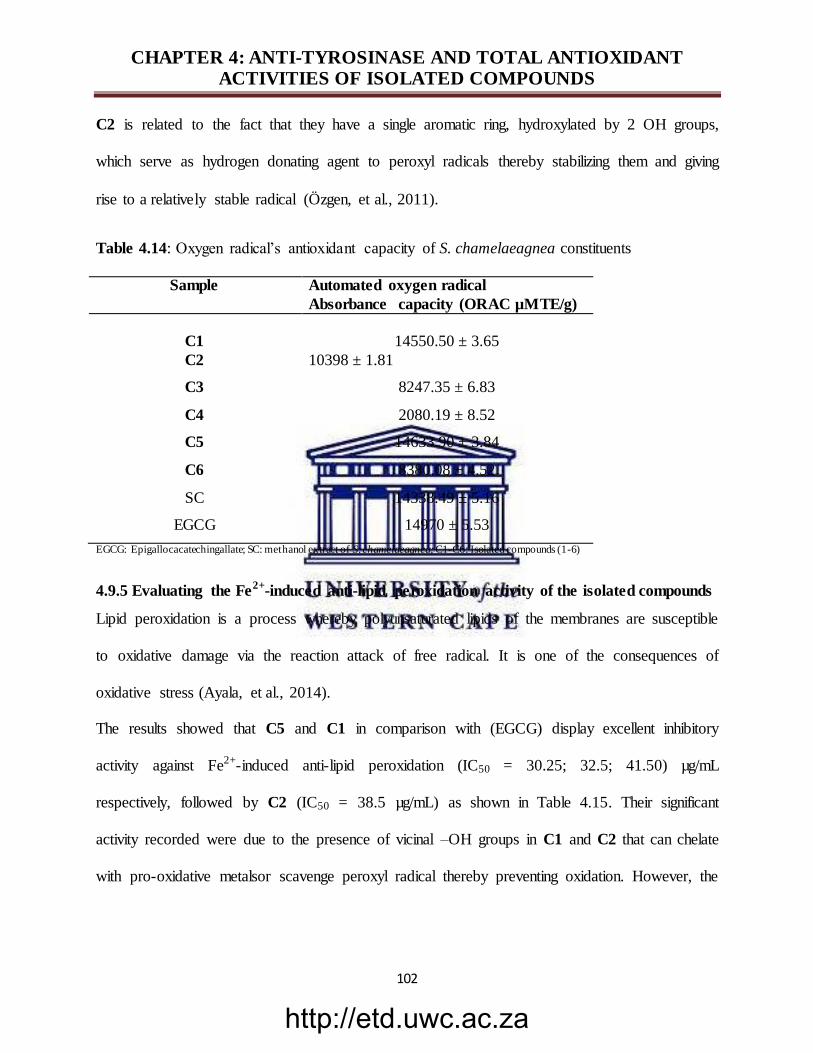
http://etd.uwc.ac.za
CHAPTER 4: ANTI-TYROSINASE AND TOTAL ANTIOXIDANT ACTIVITIES OF ISOLATED COMPOUNDS
102
C2 is related to the fact that they have a single aromatic ring, hydroxylated by 2 OH groups,
which serve as hydrogen donating agent to peroxyl radicals thereby stabilizing them and giving
rise to a relatively stable radical (Özgen, et al., 2011).
Table 4.14: Oxygen radical’s antioxidant capacity of S. chamelaeagnea constituents
Sample Automated oxygen radical
Absorbance capacity (ORAC µMTE/g)
C1
14550.50 ± 3.65
C2
C3
10398 ± 1.81
8247.35 ± 6.83
C4
C5
2080.19 ± 8.52
14633.90 ± 3.84
C6 8380.08 ± 4.52
SC 14338.49 ± 5.16
EGCG 14970 ± 5.53
EGCG: Epigallocacatechingallate; SC: methanol extract of S. chamelaeagnea; C1-C6: Isolated compounds (1-6)
4.9.5 Evaluating the Fe2+-induced anti-lipid peroxidation activity of the isolated compounds
Lipid peroxidation is a process whereby polyunsaturated lipids of the membranes are susceptible
to oxidative damage via the reaction attack of free radical. It is one of the consequences of
oxidative stress (Ayala, et al., 2014).
The results showed that C5 and C1 in comparison with (EGCG) display excellent inhibitory
activity against Fe2+-induced anti-lipid peroxidation (IC50 = 30.25; 32.5; 41.50) µg/mL
respectively, followed by C2 (IC50 = 38.5 µg/mL) as shown in Table 4.15. Their significant
activity recorded were due to the presence of vicinal –OH groups in C1 and C2 that can chelate
with pro-oxidative metalsor scavenge peroxyl radical thereby preventing oxidation. However, the
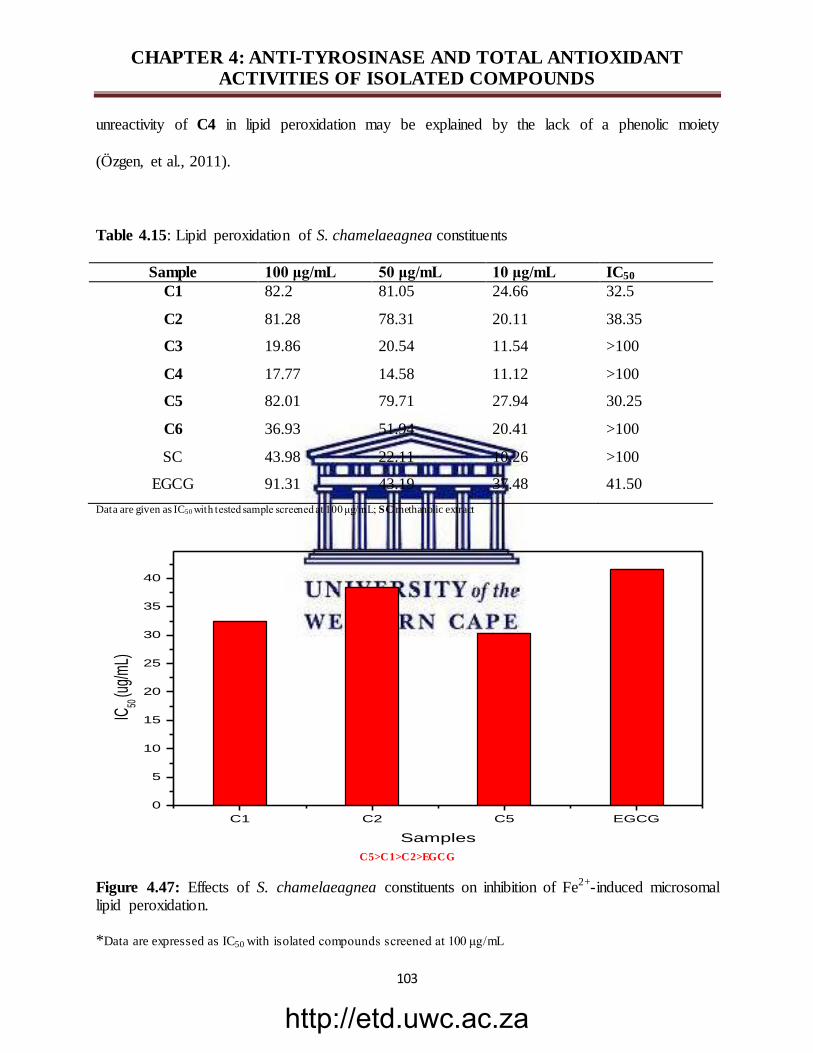
http://etd.uwc.ac.za
CHAPTER 4: ANTI-TYROSINASE AND TOTAL ANTIOXIDANT ACTIVITIES OF ISOLATED COMPOUNDS
103
unreactivity of C4 in lipid peroxidation may be explained by the lack of a phenolic moiety
(Özgen, et al., 2011).
Table 4.15: Lipid peroxidation of S. chamelaeagnea constituents
Sample 100 μg/mL 50 μg/mL 10 μg/mL IC50
C1 82.2 81.05 24.66 32.5
C2
C3
81.28
19.86
78.31
20.54
20.11
11.54
38.35
>100
C4
C5
17.77
82.01
14.58
79.71
11.12
27.94
>100
30.25
C6 36.93 51.94 20.41 >100
SC 43.98 22.11 10.26 >100
EGCG 91.31 43.19 37.48 41.50
Data are given as IC50 with tested sample screened at 100 μg/mL; SC methanolic extract
C1 C2 C5 EGCG
0
5
10
15
20
25
30
35
40
IC50
(ug/
mL)
Samples
C5>C1>C2>EGCG
Figure 4.47: Effects of S. chamelaeagnea constituents on inhibition of Fe2+-induced microsomal lipid peroxidation.
*Data are expressed as IC50 with isolated compounds screened at 100 μg/mL
http://etd.uwc.ac.za
CHAPTER 4: ANTI-TYROSINASE AND TOTAL ANTIOXIDANT ACTIVITIES OF ISOLATED COMPOUNDS
104
Six known compounds were tested for total antioxidant activity, most of them have been shown
to possess antioxidant activity and have been implicated as inhibitors of lipid peroxidation.
Excellent total antioxidant activities were demonstrated by C1, C5 and C2 respectively as FRAP
(9338.92 ± 1.72; 8622.73 ± 1.92; 4695.98 ± 2.59) µM AAE/g; TEAC (16505 ± 0.86; 10641.5 ±
0.52; 5897.5 ± 1.03) µM TE/g; ORAC (14550.5 ± 3.65; 14633.90 ± 3.84; 10398 ± 1.81) µM
TE/g and including the inhibition of Fe2+ -induced lipid peroxidation (IC50 = 32.5; 30.25; 38.35)
µg/mL, and dedicated them as potent antioxidant agents. It has been reported that the antioxidant
activity of Salvia and Rosemary is related to the presence of carnosic acid and carnosol, which
account for approximatively 90 % of the total antioxidant activity of the plant (Kamatou, et al.,
2009). C1, C2 and C5 have been reported to exhibit remarkably strong antioxidant activity
(Miura, et al., 2002), which corroborate with our findings. C2 has been reported to have strong
antioxidant activity with TEAC value of (5600.0 ± 1.0 µM TE/g) (Erkan, et al., 2008) and
ORAC (6489 µM TE/g)(Ibarra, et al., 2010), which is due to the presence of the ortho-dihydroxy
group in the C ring (Miura, et al., 2002). These findings are in agreement with our result with
TEAC (5897.5 ± 1.03 µM TE/g) and ORAC (10398 ± 1.81) µM TE/g). C1has been reported to
be the most potent antioxidant phenolic diterpenoid of Lamiaceae such sage (Masuda, et al.,
2005). It can be confirmed by the result obtained during our research where C1 demonstrated the
highest antioxidant activity on TEAC and FRAP due to its higher capacity of transferring
electron to the corresponding cationic radical, while C5 demonstrated the potent antioxidant
activity on ORAC and LPO. This is the first report on the total antioxidant activity of the isolated
constituents of S. chamelaeagnea and the obtained result is a good indication for the
establishment of the relationship between the chemical structure and the antioxidant activity of
the compounds in term of electron transfer or hydrogen transfer agents.
http://etd.uwc.ac.za
CHAPTER 5: CONCLUSION AND RECOMMENDATIONS
105
CHAPTER 5: CONCLUSION AND RECOMMENDATIONS
The aim of this study was directed towards the preliminary screening of twenty five (25) South
African Lamiaceae for their potency of tyrosinase inhibitory activity using different three
complementary assays. The outcome of this screening nominated S. chamelaeagnea, the
bioactive plant materials for chromatographic isolation of such metabolites responsible for the
biological activity demonstrated at the preliminary stage. The extraction procedure of the 25
plant materials were successfully carried out using methanol, after which the methanol extracts
were filtered and concentrated under vacuum.
The preliminary phytochemical screening using solvent system DCM: MeOH (97:3) on TLC
showed S. chameleagnea to possess variety of class of compounds varying from terpenoids,
flavonoids, and other phenolic compounds (Kamatou, et al., 2007).
The preliminary biological screening of the plant extracts against tyrosinase indicated Salvia
chamelaeagnea, Salvia dolomitica, Plectranthus ecklonii, Plectranthus namaensis, and
Plectranthus zuluensis, with significant zone of inhibition against tyrosinase on TLC bio-
autography, spectrophotometry result showed that extracts of Plectranthus zuluensis (IC50 =
23.99 𝜇g/mL), P. ecklonii (IC50 = 21.58 𝜇g/mL), Thorncroftia succulent (IC50 = 36.08 𝜇g/mL),
and P. madagascariensis (IC50 = 23.99 𝜇g/mL) demonstrated good anti-tyrosinase activity
when compared with kojic acid (IC50 = 3.607 μg/mL). On the other hand, cyclic voltammetry
indicated kojic acid as the strongest tyrosinase inhibitory activity by decreasing the inhibition
current with time, followed by the extracts of P. madagascariensis, P. zuluensis, S.
chamelaeagnea and S. dolomitica. Some level of agreement between these assays was therefore
observed and considered significant.
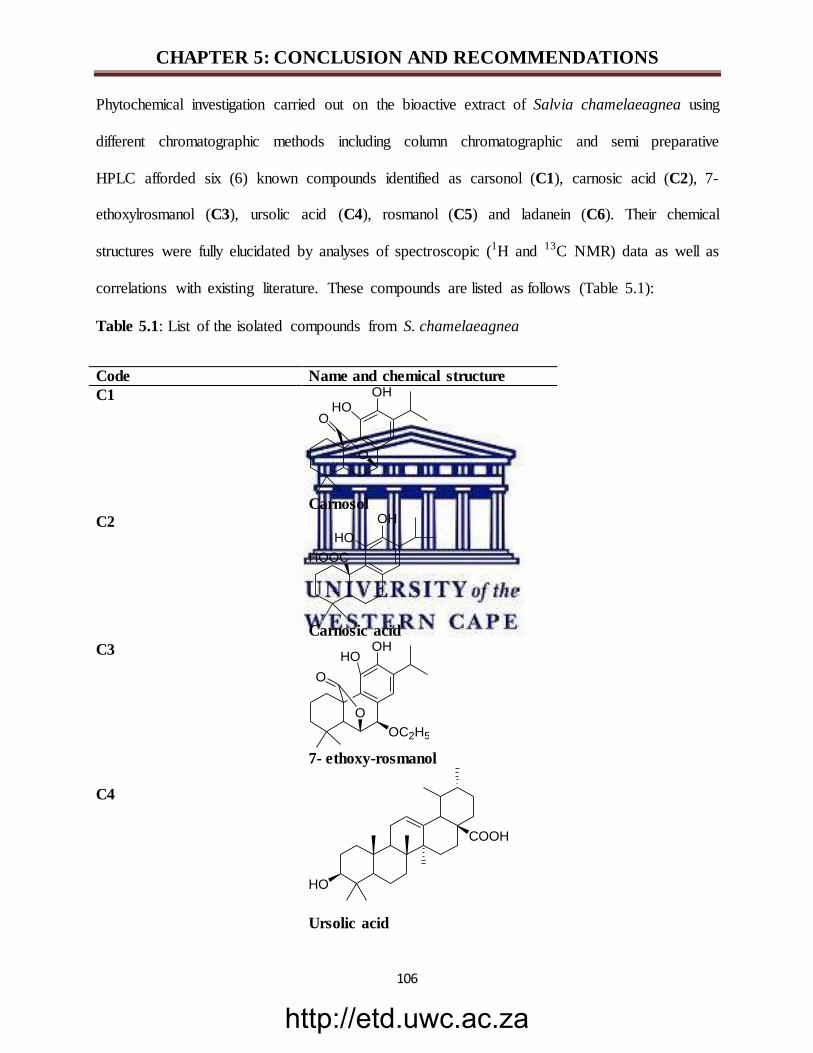
http://etd.uwc.ac.za
CHAPTER 5: CONCLUSION AND RECOMMENDATIONS
106
Phytochemical investigation carried out on the bioactive extract of Salvia chamelaeagnea using
different chromatographic methods including column chromatographic and semi preparative
HPLC afforded six (6) known compounds identified as carsonol (C1), carnosic acid (C2), 7-
ethoxylrosmanol (C3), ursolic acid (C4), rosmanol (C5) and ladanein (C6). Their chemical
structures were fully elucidated by analyses of spectroscopic (1H and 13C NMR) data as well as
correlations with existing literature. These compounds are listed as follows (Table 5.1):
Table 5.1: List of the isolated compounds from S. chamelaeagnea
Code Name and chemical structure
C1 OH
O
OHO
Carnosol
C2 OH
HO
HOOC
Carnosic acid
C3
OHHO
O
OC2H5
O
7- ethoxy-rosmanol
C4
Ursolic acid
COOH
HO
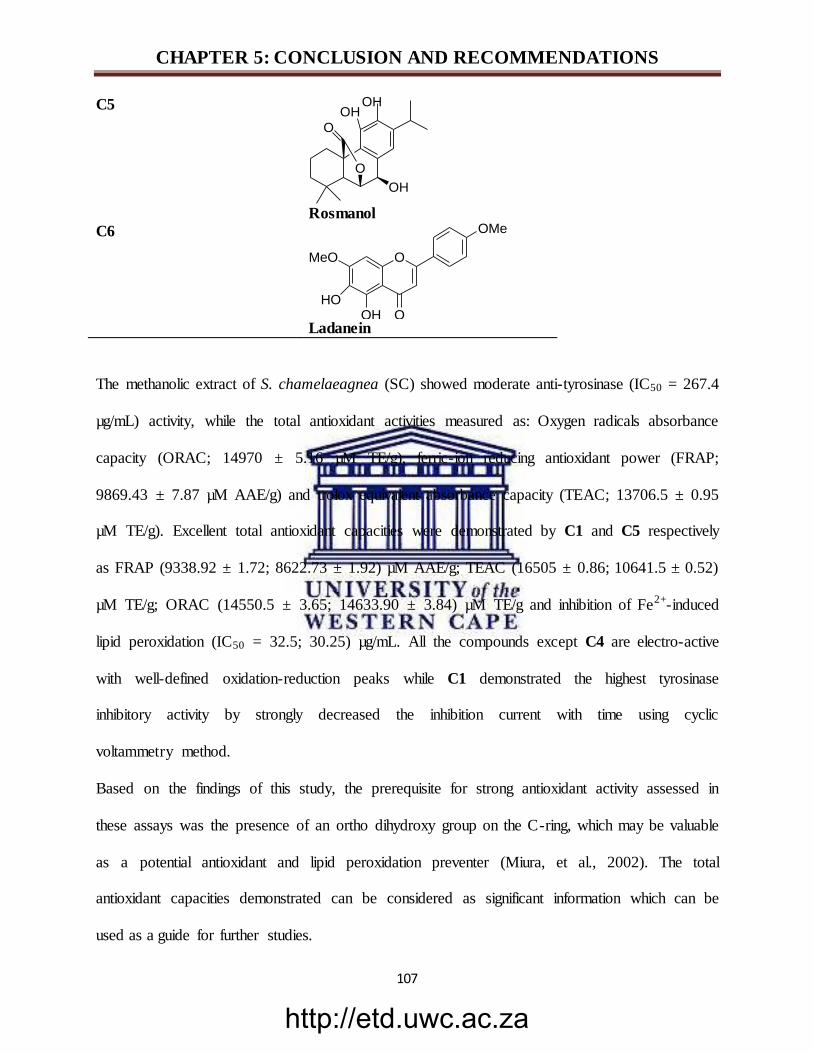
http://etd.uwc.ac.za
CHAPTER 5: CONCLUSION AND RECOMMENDATIONS
107
C5 OHOH
O
OH
O
Rosmanol
C6
O
OHHO
MeO
OMe
O Ladanein
The methanolic extract of S. chamelaeagnea (SC) showed moderate anti-tyrosinase (IC50 = 267.4
µg/mL) activity, while the total antioxidant activities measured as: Oxygen radicals absorbance
capacity (ORAC; 14970 ± 5.16 µM TE/g), ferric-ion reducing antioxidant power (FRAP;
9869.43 ± 7.87 µM AAE/g) and trolox equivalent absorbance capacity (TEAC; 13706.5 ± 0.95
µM TE/g). Excellent total antioxidant capacities were demonstrated by C1 and C5 respectively
as FRAP (9338.92 ± 1.72; 8622.73 ± 1.92) µM AAE/g; TEAC (16505 ± 0.86; 10641.5 ± 0.52)
µM TE/g; ORAC (14550.5 ± 3.65; 14633.90 ± 3.84) µM TE/g and inhibition of Fe2+-induced
lipid peroxidation (IC50 = 32.5; 30.25) µg/mL. All the compounds except C4 are electro-active
with well-defined oxidation-reduction peaks while C1 demonstrated the highest tyrosinase
inhibitory activity by strongly decreased the inhibition current with time using cyclic
voltammetry method.
Based on the findings of this study, the prerequisite for strong antioxidant activity assessed in
these assays was the presence of an ortho dihydroxy group on the C-ring, which may be valuable
as a potential antioxidant and lipid peroxidation preventer (Miura, et al., 2002). The total
antioxidant capacities demonstrated can be considered as significant information which can be
used as a guide for further studies.
http://etd.uwc.ac.za
CHAPTER 5: CONCLUSION AND RECOMMENDATIONS
108
From the above, it is recommended that
Further studies on this plant should be carried out to investigate the compound(s)
responsible for the tyrosinase inhibitory activity demonstrated by the extract S.
chamelaeagnea.
Further improvement is required in the electrochemical method as a new method for
detection of tyrosinase inhibitors.
Applications of these chemical constituents in cosmetic, pharmaceutical and food
industry will require proof of its antioxidant and skin-enzyme inhibitory effects in an in
vivo model. Further analyses such as cytotoxicity and effects of the compounds on
melanoma cells, carcinogenic and mutagenic effect, as well as clinical trials are
recommended in the purpose of translation the current findings into final cosmetic,
pharmaceutical and food product formulations.
http://etd.uwc.ac.za
REFERENCES
109
References
Abdel-Mogib, M., Albar, H.A. and Batterjee, S.M. 2002. Chemistry of the Genus
Plectranthus. Molecules, 7(2), pp. 271-301.
Ahmad, V.U., Farooq, U., Abbaskhan, A., Hussain, J., Abbasi, M.A., Nawaz, S.A. and
Choudhary, M.I. 2004. Four new diterpenoids from Ballota limbata. Chemical &
Pharmaceutical Bulletin, 52(4), pp. 441-3.
Ali, S.M., Ibrahim, S.A., Jalil, S. and Choudhary, M.I. 2007. Ursolic Acid: A potent inhibitor
of superoxides produced in the cellular system Phytotherapy Research, 21, pp. 558–561.
Aiyegoro, A.O. and Okoh, I.A. 2010. Preliminary phytochemical screening and in vitro
antioxidant activities of the aqueous extract of Helichrysum longifoium. BMC Complementary &
Alternative Medicine, 10(21), pp. 21-28.
Al-Jaber, N.A., Awaad, A.S. and Moses, J.E. 2011. Review on some antioxidant plants
growing in Arab world. Journal of Saudi Chemical Society, 15(4), pp. 293–307.
Arisawa, M., Hayashi, T., Ohmura, K., Nagayama, K., Shimizu, M. and Morita, M . 1987.
Chemical and pharmaceutical studies on medicinal plants in Paraguay: Studies on “romero,” part
2. Journal of Natural Products, 50(6), pp. 1164-1166.
Aristov, A. and Habekost, A. 2015. Cyclic voltammetry - A versatile electrochemical method
investigating electron transfer process. World Journal of Chemical Education, 3(5), pp. 115-119.
Ashour, A., El-Sharkawy, S., Amer, M., Bar, A.F., Kondo, R. and Shimizu, K. 2013.
Melanin biosynthesis inhibitory activity of compounds isolated from unused parts of Ammi
visinaga. Journal of Cosmetics, Dermatological Sciences & Applications, 3(3), pp. 40-43.
Ayala, A., Muñoz, M. and Argüelles, S. 2014. Lipid peroxidation: production, metabolism, and
signaling mechanisms of malondialdehyde and 4-Hydroxy-2-Nonenal. Oxidative Medicine &
Cellular Longevity, 8, pp. 1-32.
http://etd.uwc.ac.za
REFERENCES
110
Badria, FA., and El Gayyar, M.A. 2001. A new type of tyrosinase inhibitors from natural
products as potential treatments for hyperpigmentation. Bollottino Chimico
Farmaceutico,140(4), pp. 267-271.
Bai, N., He, K., Roller, M., Lai, C.S., Shao, X., Pan, N.H. and Ho, C.T. 2010. Flavonoids and
phenolic compounds from Rosmarinus officinalis. Agricultural & Food Chemistry, 58(9), pp.
5363–5367.
Balunas, M.J. and Kinghorn, A.D. 2005. Drug discovery from medicinal plants. Life sciences,
78(5), pp. 431-441.
Baricevic, D., Sosa, S., Loggia, R.D., Tubaro, A., Simonovska, B., Krasna, A. and Zupancic,
A. 2001. Topical anti-inflammatory activity of Salvia officinalis L. leaves: The relevance of
ursolic acid. Journal of Ethnopharmacology, 75(2-3), pp. 125– 132.
Bartosz, M., Kedziora, J. and Bartosz, G. 1996. The copper complex of captopril is not a
superoxide dismutase mimic. Artefacts in DMPO spin trapping. Free Radical Research,24(5),
pp. 391-396.
Basu, S. 2010. Fatty acid oxidaton and isoprostanes: Oxidative strain and oxidative stress.
Prostaglandins, Leukotrienes & Essential Fatty Acids. 82(4-6), pp. 219-225.
Baurin, N., Arnoult, E., Scior, T., Do, Q.T. and Bernard, P. 2002. Preliminary screening of
some tropical plants for anti-tyrosinase activity. Journal of Ethnopharmacology, 82(2-3), pp.
155-158.
Benzie, I. and Strain, J. 1996. The ferric reducing ability of plasma (FRAP) as a measure of
"antioxidant power": The FRAP Assay. Analytical Biochemistry, 238(1), pp. 70-76.
Brewer, M. 2011. Natural antioxidants: Sources, compounds, mechanisms of action, and
potential applications. Comprehensive Reviews in Food Science & Food Safety, 10(4), pp. 221-
246.
http://etd.uwc.ac.za
REFERENCES
111
Brieskorn, C.H., Fuchs, A., Brendenberg, J.B., McChesney, J.D. and Wenkert, E. 1964. The
Structure of Carnosol, Journal of Organic Chemistry 29, pp. 2293-2298.
Burmistrova, O., Perdomoa, J., Simões, M.F., Rijo, P., Quintana, J. and Estevez, F. 2015.
The abietane diterpenoid parvifloron D from Plectranthus ecklonii is a potent apoptotic inducer
in human leukemia cells. phytomedicine, 22(11), pp. 1009-1016.
Bussmann, R.W., Glenn, A., Meyer, K., Kuhlman, A. and Townesmith, A. 2010. Herbal
mixtures in traditional medicine in Northern Peru. Journal of Ethnobiology & Ethnomedicine,
6(1), pp. 10.
Cao, G. and Prior, R. 1998. Measurement of oxygen radical absorbance capacity in biological
samples. Methods in Enzymology, 22(5), pp. 749-760.
Carocho, M. and Ferreira, I. 2013. A review on antioxidants, prooxidants and related
controversy: Natural and synthetic compounds, screening and analysis methodologies and future
perspectives. Food & Chemical Toxicology, 51, pp. 15-25.
Checker, R., Sandur, S.K., Sharma, D., Patwardhan, R.S., Jayakumar, S., Kohli, V., Sethi,
G., Aggarwal, B.B. and Sainis, K.B. 2012. Potent anti-inflammatory activity of ursolic acid, a
triterpenoid antioxidant, is mediated through suppression of NF-κB, AP-1 and NF-AT. PLoS
ONE, 7(2), pp. e31318.
Chen, W.C., Tseng, T.S., Hisiao, N.W., Lin, Y.L., Wen, Z.H., Tsai, C.C., Lee, Y.C., Lin,
H.H. and Tsai, K.C. 2015. Discovering of highly potent tyrosinase inhibitor, T1, with
significant anti-melanogenesis ability by zebrafish in vivo assay and computational molecular
modeling. Scientific Report, 10, pp. 1-8.
Chompo, J., Upadhyay, A., Fukuta, M. and Tawata, S. 2012. Effect of Alpinia Zerumbet
components on antioxidant and skin disease-related enzymes. BMCComplementary &
Alternative Medicine, 12, pp. 106-114.
http://etd.uwc.ac.za
REFERENCES
112
Coopoosamy, R.M. and Naidoo, K.K. 2013. A comparative study of three aloe species used to
treat skin diseases in South African rural communities. Journal of Alternative & complementary
Medicine, 19(5), pp. 425-428.
Corstjens, H., Declercq, L., Hellemans, L., Sente, I. and Maes, D . 2007. Prevention of
oxidative damage that contributes to the loss of bioenergetics capacity in ageing skin.
Experimental Gerontology, 42(9), pp. 924-9.
Costin, G.E. and Hearing, V.J. 2007. Human skin pigmentation: melanocytes modulate skin
color in response to stress. Faseb, 21(4), pp. 976-994.
Curto, E. V., Kwong, C., Hermersdorfer, H., Glatt, H., Santis, C., Virador, V., Hearing,
V.J.J. and Dooley, T.P. 1999. Inhibitors of mammalian melanocyte tyrosinase: In vitro
comparisons of alkyl esters of gentisic acid with other putative inhibitors. Biochemical
Pharmacology, 57(6), pp. 663–672.
Dobes, J., Zitka, O., Sochor, J., Ruttkay-Nedecky, B., Babula, P., Beklova, M., Kynicky, J.,
Hubalek, J., Klejdus, B., Kizek, R. and Adam, V. 2013. Electrochemical tools for
determination of phenolic compounds in plants. A review. International Journal of
Electrochemistry Sciences, 8, pp. 4520 - 4542.
D’Orazio, J., Jarrett, S., Amaro-Ortiz, A. and Scott, T. 2013. UV radiation and the skin.
International Journal of Molecular Sciences, 14(6), pp. 1222–1248.
Dweck, A.C. 1996. Ethnobotanical plants from Africa. Cosmetics & Toiletries Magazine
Ekor, M. 2014. The growing use of herbal medicines: issues relating to adverse reactions and
challenges in monitoring safety. Frontiers in Pharmacology, 4, pp. 177-187.
Erkan, N., Ayranci, G., Ayranci, E. 2008. Antioxidant activities of rosemary (Rosmarinus
Officinalis L.) extract, blackseed (Nigella sativa L.) essential oil, carnosic acid, rosmarinic acid
and sesamol.Food Chemistry, 110, pp. 76-82
http://etd.uwc.ac.za
REFERENCES
113
Espín, J.C. and Wichers, H.J. 2001. Effect of captopril on mushroom tyrosinase activity in
vitro. Biochimica Biophysica Acta, 1544(1-2), pp. 289-300.
Exarchou, V., Nenadis, N., Tsimidou, M., Gerothanassis, I.P., Troganis, A. and Boskou, D.
2002. Antioxidant activities and phenolic composition of extracts from Greek Oregano, Greek
Sage, and summer savory. Journal of Agricultural & Food Chemistry, 50, pp. 5294-5299.
Farjam, M., Rustaiyan, A., Rustaiyan, E. and Rustaiyan, A. 2013. Labdane-type diterpene
and two flavones from Salvia sharifii Rech. f. Iranian Journal of Pharmaceutical Research,
12(2), pp. 395-399.
Fauziyah, R.S., Gobikrishnan, S., Indrawan, N., Park, S.H., Park, J.H., Min, K., Yoo, Y.J.
and Park, D.H. 2012. A Study on the electrochemical synthesis of L-DOPA using
oxidoreductase enzymes: Optimization of an electrochemical process. Journal of Microbiology
&Biotechnology, 22(10), pp. 1446-1451.
Fearon, M.I. and Faux, P.S. 2009. Oxidative stress and cardiovascular disease: Novel tools
give (free) radical insight. Journal of Molecular & Cellular Cardiology, 47(3), pp. 372-381.
Fernnell, C.W., Lindsey, K.L., McGaw, L.J., Sparg, S.G., Stafford, G.I., Elgorashi, E.E.,
Grace, O.M. and Van stand, F. 2004. Assessing African medicinal plants for efficacy and
safety: Pharmacology screening and toxicology. Journal of Ethnopharmacology, 94(2-3), pp.
205-17.
Fisher, V. 2005. Indigenous Salvia species - An investigation of the antimicrobial activity,
antioxidant activity and chemical composition of leaf extracts. Msc dissertation University of the
Witwatersrand, johannesburg, South Africa.
Friedman, M. 1996. Food browning and its prevention: An overview. Journal of Agriculture &
Food Chemistry, 44(3), pp. 631–653.
http://etd.uwc.ac.za
REFERENCES
114
Fuyuno, I. 2004. Spotlight turns on cosmetics for Asian skin. Nature, 432(10), pp. 938-1038.
Gad, A.S. and Sayd, A.F. 2015. Antioxidant properties of Rosemary and its potential uses as
natural antioxidant in dairy products: A review. Food & Nutrition Sciences, 6(1), pp. 179-193.
Gairola, S., Naidoo, Y., Bhatt, A. and Nicholas, A. 2009. An investigation of the foliar
trichomes of Tetradenia riparia (Hochst.) Codd [Lamiaceae]: An important medicinal plant in
Southern Africa. Flora, 204(4), pp. 325-330.
Gazim, Z.C., Amorim, A.C.L., Hovell, A.M.C., Rezende, C.M., Nascimento, I.A., Ferreira,
G.A. and Cortez, D.A.G. 2010. Seasonal variation, chemical composition, and analgesic and
antimicrobial activities of the essential oil from leaves of Tetradenia riparia (Hochst.) Codd in
Southern Brazil. Molecules, 15(8), pp. 5509-5524.
Georges, A., Chinnappan, S., Chintamaneni, M., Kotak C.V., Choudhary, Y., Kueper, T.
and Radhakrishnan, A.K. 2014. Anti-inflammatory effects of Polygonum minus (Huds)
extract (Lineminus™) in in-vitro enzyme assays and carrageenan induced paw edema.
BMCComplementary & Alternative Medicine, 14, pp. 355-369.
Guvenalp, Z., Kilic, N., Kazaz, C., Kaya, Y. and Demirezer, O. 2006. Chemical constituents
of Galium tortumense. Turkey Journal of Chemisty, 30, pp. 515-523.
Hamidpour, M., Hamidpour, R., Hamidpour, S. and Shahlari, M. 2014. Chemistry,
pharmacology, and medicinal property of Sage (Salvia) to prevent and cure illnesses such as
obesity, diabetes, depression, dementia, lupus, autism, heart disease, and cancer. Journal of
Traditional & Complementary Medicine, 4(2), pp. 82–88.
Hashemi, F. and Zarei, M.A. 2014. Tyrosinase inhibitory activity within hexane extract of ten
screened plants from Kurdistan province of Iran. International Journal of Advanced Biological
& Biomedical Research, 2(11), pp. 2795-2799.
Hawas, U.W., Gamal-Eldeen, A.M., El-Toumy, S.A.A., Meyer, J.J.M. and Hussein, A.A.
2009. Inhibition of the initiation stage of carcinogenesis by Salvia disermas constituents. Journal
of Nature Research, 64(11-12), pp. 831-839.
http://etd.uwc.ac.za
REFERENCES
115
Horiuchi, K., Shiota, S., Hatano, T., Yoshida, T., Kuroda, T. and Tsuchiya, T. 2007.
Antimicrobial activity of oleanolic acid from Salvia officinalis and related compounds on
vancomycin-resistant enterococci (VRE). Biological & Pharmaceutical Bulletin, 30(6), pp.
1147-1149.
Hermanns, J. F., Pierard-Franchimont, C. and Pierard, G. E. 2000. Skin colour assessment
in safety testing of cosmetics. An overview. International Journal of Cosmetic, 22(1), pp. 67-71.
Huang, L. and Staden, J. 2002. Salvia chamelaeagnea can be micropropated and its callus
induced to produce rosmarinic acid. South African Journal of Botany, 68(2), pp. 177-180.
Huang, X.H., Chen, Q.X., Wang, Q., Song, K.K., Wang, J., Sha, L. and Guan, X. 2006.
Inhibition of the activity of mushroom tyrosinase by alkylbenzoic acids. Food Chemistry, 94(1),
pp. 1-6.
Hwang, Y., Song, J., Kim, H. & Hwang, K. 2014. Oleanolic acid regulates NF-κB signaling by
suppressing MafK expression in raw 264.7 cells. Biochemistry & Molecular Biology Reports,
47(9), pp. 524–529.
Igwe, O.M. and Echeme, J.O. 2014. Isolation, structural elucidation and anti-lipid peroxidation
activity of 3-(5-Hydroxyphenyl)-4-Methyl-Chromen-3-YI) propanoic acid from the stem bark of
Brachstegia eurycoma Harms. International Research Journal of Pure & Applied Chemistry,
4(4), pp. 447-455.
Inatani, R., N, Nakatani, N. F. H. and Seto, H. 1982. Structure of a new antioxidative phenolic
diterpene isolated from Rosemary (Rosmarinus officinalis L.). Journal ofAgricultural &
Biological Chemistry, 46(6), pp. 1661-1666.
Iniaghe, O.M., Malomo, S.O. and Adebayo, J.O. 2010. Proximate composition and
phytochemical constitution of leaves of some Acalypha species. Pakistan Journal of Nutrution,
8(3), pp. 256-8.
http://etd.uwc.ac.za
REFERENCES
116
Kamagaju, L., Morandini, R., Bizuru, E., Nyetera, P., Nduwayezu, J.B., Stevigny, C.,
Ghanem, G. and Duez, P. 2013. Tyrosinase modulation by five Rwandese herbal medicines
traditionally used for skin treatment. Journal of Ethnopharmacology, 146(3), pp. 824-834.
Kamatou, G.P.P., Makunga, N.P., Ramogola, W.P.N. and Viljoen, A.M . 2008. South African
Salvia species: A review of biological activities and phytochemistry. Journal of
Ethnopharmacology, 119(3), pp. 664-672.
Kamatou, G.P.P., Van Vuuren, S.F., Van Heerden, F.R., Seaman, T. and Viljoen, A.M.
2007. Antibacterial and antimycobacterial activities of South African Salvia species and isolated
compounds from S. chamelaeagnea. South African Journal of Botany, 73(4), pp. 552-557.
Kamatou, G.P., Viljoen, A.M., Gono-Bwalya, A.B., van Zyl, R.L., van Vuuren, S.F.,
Lourens, A.C., Başer, K.H., Demirci, B., Lindsey, K.L., Van Staden, J. and Steenkamp, P.
2005. The in vitro pharmacological activities and a chemical investigation of three South African
Salvia species. Journal of Ethnopharmacology, 102(3), pp. 382-90.
Kamatou, G., Viljoen, A. and Steenkamp, P. 2009. Antioxidant, antiinflammatory activities
and HPLC analysis of South African Salvia species. Food Chemistry, 119(2), pp. 684-688.
Kanitakis, J. 2002. Anatomy, histology and immunohistochemistry of normal human
skin.European Journal of Dermatology, 12(4), pp. 390-399.
Kaurinovic, B., Vlaisavljevic, S., Popovic, M., Vastag, D. and Brenesel, M.D. 2010.
Antioxidant properties of Marrubium peregrinum L. (Lamiaceae) essential oil. Molecules, 15(9),
pp. 5943-5955.
Karthikeyan, M. and Balasubramanian, T. 2014. Phytochemical analysis of Cynanchum
callialatum through GCMS and LCMS.. Homeopathy & Ayurvedic Medicine, 3(1), pp. 1-6.
Kermasha, S., Bao, H. and Bisakowski, B. 2001. Biocatalysis of tyrosinase using catechin as
substrate in selected organic solvent media. Journal of Molecular Catalysis B: Enzymatic,11(4-
6), pp. 929-938.
http://etd.uwc.ac.za
REFERENCES
117
Khalid, S., Rizwan, G.H., Yasin, H., Perveen, R., Abrar, H., Shareef, H., Fatima, K. and
Ahmed, M. 2013. Medicinal importance of Holoptela (Roxb). Planch Its biological and
pharmacological activities. Natural Products Chemistry & Research , 2(1), pp. 1-4.
Kiken, D.A. and Cohen, D.E. 2002. Contact dermatitis to botanical extracts. American Journal
of Contact Dermatitis, 13(3), pp. 148-152.
Kim, Y.J. and Uyama, H. 2005. Tyrosinase inhibitors from natural and synthtic sources:
Structure, inhibition mechanism and perspective for the future. Cellular & Molecular Life
Sciences, 62(15), pp. 1707-1723.
Kingston, D.G.I. 2011. Modern natural products drug discovery and its relevance to biodiversity
conservation. Journal of Natural Products, 74(3), pp. 496–511.
Klopper, R.R., Chatelain, C., Banninger, V., Habashi, C., Steyn, H.M., De Wet, B.C.,
Arnold, T.H., Gautier, L., Smith, G.F. and Spichiger, R. 2006. Checklist of the flowering
plants of Sub-Saharan Africa. An index of accepted names and synonyms. Southern African
Botanical Diversity Network (ed), Pretoria: SANBI.
Kouřimská, L., Chrpová, D., Nový, P. and Pánek, J. 2013. The effect of concentration on the
antioxidant activity of selected culinary herbs. Journal of Medicinal Plants Research, 7(13), pp.
766-771.
Kubo, I., Kinst-Hori, I., Ishiguro, K., Chaudhuri, S.K., Sanchez, Y. and Oruga T. 1994.
Tyrosinase inhibitory flavonoids from Heterotheca inuloides and their structural functions.
Bioorganic & Medicinal Chemistry Letters, 4(12), pp. 1443-1446.
Lall, N. and Kishore, N. 2014. Are plants used for skin care in South Africa fully explored.
Journal of Ethnopharmacology, 153(1), pp. 61-84.
Lazaro, M. 2009. Distribution and biological activities of the flavonoid luteolin. Mini-Reviews
in Medicinal Chemistry, 9(1), pp. 31-59.
http://etd.uwc.ac.za
REFERENCES
118
Lee, C.J., Chen, L.G., Chang, T.L., Ke, W.M., Lo, Y.F. and Wang, C.C. 2011. The
correlation between skin-care effects and phytochemical contents in Lamiaceae plants. Food
Chemistry, 124(3), pp. 833-841.
Limon-Pacheco, J. and Gonsebatt, M.E. 2009. The role of antioxidant-related enzymes in
protective responses to environmentally induced oxidative stress. Mutation Research, 674(1-2),
pp. 137-147.
Liu, G. and Ruedi, P. 1996. Phyllocladanes (13B-kauranes) from Plectranthus ambiguus.
Phytochemistry, 41(6), pp. 1563-1568.
Lu, Y. and Foo, L. 2001. Salvianolic acid L, a potent phenolic antioxidant from Salvia
officinalis. Tetrahedron Letters, 42(46), pp. 8223-8225.
Magarelli, G., Gomes da Silva, J., Filho, I.A.S., Lopes, I.S.D., SouzaDe, J.R., Hoffmann,
L.V. and Pires de Castro, C.S. 2013. Development and validation of a voltammetric method for
determination of total phenolic acids in cotton cultivars. Microchemical Journal, 109, pp. 23–28.
Makrantonaki, E., Zouboulis, C.C. and German National Genome Research Network 2.
2007. The skin as a mirror of the aging process in the human organism-state of the art and results
of the aging research in the German National Genome Research Network 2 (NGFN-2).
Experimental Gerontology, 42(9), pp. 879-86.
Mapunya, M.B., Nikolova, R.V. and Lall, N. 2012. Melanogenesis and antityrosinase activity
of selected south african plants. Evidence Based Complementary & Alternative Medicine, 24, pp.
1-6.
Maree, J.E., Khondkar, P., Kwapong, A.A., Oyedemi, B.L., Aljarba, T.M., Stapleton, P.,
Viljoen, A.M. and Gibbons, S. 2014. Bioactive acetophenones from Plectranthus venteri.
Phytochemistry Letters, 10, p. cxli-cxliv.
Masuda, T., Kirikihira, T., Takeda, Y. 2005. Recovery of antioxidant activity from carnosol
quinone: Antioxidants obtained from a water-promoted conversion of carnosol quinone. Journal
of Agriculture & Food Chemistry. 53, pp. 6831-6834.
http://etd.uwc.ac.za
REFERENCES
119
Mayer, A.M. 1987. Polyphenol oxidases in plants: Recent progress. Phytochemistry, 26, pp. 11-
20.
Mazimba, O. 2015. Leonotis leonurus: A herbal medicine review. Journal of pharmacognosy &
phytochemistry, 3(6), pp. 74-82.
Misra, B.B. and Dey, S. 2012. TLC-Bioautographic evaluation of In vitro anti-tyrosinase and
anti-cholinesterase potentials of Sandalwood oil. Natural Product Communication, 8(2), pp. 253-
256.
Miura, K., Kikuzaki, H. and Nakatani, N. 2002. Antioxidant activity of chemical components
from Sage (Salvia officinalis L.) and Thyme (Thymus vulgaris L.) measured by the officinalis L.
and Thyme (Thymus vulgaris L.). Journal of Agricultural & Food Chemistry, 50(7), pp. 1845-
1851.
Momtaz, S., Lall, N. and Basson, A. 2008. Inhibitory activities of mushroom tyrosine and
DOPA oxidation by plant extracts. South African Journal of Botany, 74(4), pp. 577-582.
Munné-Bosch, S. and Alegre, L. 2003. Drought-induced changes in the redox state of α-
tocopherol, ascorbate, and the diterpene carnosic acid in chloroplasts of Labiatae species
differing in carnosic acid contents. Plant Physiology, 131(4), p. 1816–1825.
Nag, S., Paul, A. and Dutta, R. 2013. Photochemical analysis of methanol extracts of leaves of
some medicinal plants. International Journal of Science Research Publication, 3(1), pp. 1-5.
Narayanaswamy, N., Duraisamy, A. and Balakrishnan, K.P. 2011. Screening of some
medicinal plants for their antityrosinase and antioxidant activities. International Journal of
PharmTech Research,3(2), pp. 1107-1112.
Ndamane, Y., Kambizi, L., Songca, S. and Oluwafemi, O. 2013. Antibacteria effectiveness of
Tetradenia riparia extract, a plant traditionally used in the Eastern Cape province to treat
diseases of the respiratory system. Journal of Medicinal Plants Research, 37(7), pp. 2755-2760.
http://etd.uwc.ac.za
REFERENCES
120
Ndlovu, G., Fouche, G., Tselanyane, M., Cordier, W. and Steenkamp, V. 2013. In vitro
determination of the anti-aging potential of four African medicinal plants. BMC Complementary
and Alternative Medicine, 13(304), pp. 1-7.
Niki, S., Paul, A. and Dutta, R. 2005. Lipid peroxidation: Mechanisms, inhibition, and
biological effects. Biochemical & Biophysical Research Communications, 338(1), pp. 668-676.
Nkomo, M., Katerere, D.R., Vismer, H.F., Cruz, T., Balayssac, S., Malet-Martino, M. and
Makunga, N.P. 2014. Fusarium inhibition by wild populations of the medicinal plant Salvia
africana-lutea L. linked to metabolomic profiling. BMC Complementary & Alternative
Medicine, pp. 14-99.
Nyilan, M. and Lall, M. 2010. Antilisterial bioactivity and /orbiofilm-formation by compounds
from Plectranthus ecklonii Benth. and Acacia karroo Hayne. Doctor of Philosophiae: Plant
Science University of Pretoria, pp. 1-150.
Oliveira, G., Oliveira, A., Conceição, E. and Leles, M . 2016. Multiresponse optimization of an
extraction procedure of carnosol and rosmarinic and carnosic acids from rosemary. Food
Chemistry, pp. 465–473.
Oliveira, K., Palú, E., Weffort-Santos, A. and Oliveira, B. 2013. Influence of rosmarinic acid
and Salvia officinalis extracts on melanogenesis of B16F10 cells. Revista Brasileira de
Farmacognosia, 23(2), pp. 249-258.
Ozer, O., Mutlu, B. and Kivcak, B. 2007. Antityrosinase activity of some plant extracts and
formulations containing ellagic acid. Pharmaceutical Biology, 45(6), pp. 519-524.
Özgen, U., Mavi, A., Terzi, Z., Kazaz, C., Aşçı, A., Kaya, Y. and Seçen, H. 2011.
Relationship between chemical structure and antioxidant activity of luteolin and its glycosides
isolated from thymus sipyleus subsp. sipyleus var. sipyleus. Records of Natural Products, 5(1),
pp. 12-21 .
http://etd.uwc.ac.za
REFERENCES
121
Panovska, T., Kulevanova, S. and Stefova, M ., 2005. In vitro antioxidant activity of some
Teucrium species (Lamiaceae). Acta Pharmaceutica, 55, pp. 207–214.
Parvez, S., Kang, M., Chung, H.S., Cho, C., Hong, M.C., Shin, M.K. and Bae, H. 2006.
Survey and mechanism of skin depigmenting and lightening agents. Phytotherapy Research,
20(11), pp. 921-934.
Pellegrini, N., Re, R., Yang, M. and Rice-Evans, C. 1999. Screening of dietary carotenoid rich
fruit extracts for antioxidant activities applying ABTS radical cation decolorisation assay.
Methods in Enzymology, 299, pp. 379-389.
Pérez-Fons, L., Garzón, M. and Micol, V. 2010. Relationship between the antioxidant capacity
and effect of rosemary (Rosmarinus officinalis L.) polyphenols on membrane phospholipid
order.Journal of Agricultural &Food Chemistry, 58(1), pp. 161-71.
Petersen, M. and Simmonds, M . 2003. Rosmarinic acid. Phytochemistry, 62(2), pp. 121-125.
Popoola, O., Marnewich, J.L., Rautenbach, F., Ameer, F., Iwuoha, E.I. and Hussein AA.
2015. Inhibition of oxidative stress and skin aging-related enzymes by prenylated chalcones and
other flavonoids from Helichrysum teretifolium. Molecules, 20(4), pp. 7143-7155.
Porcheron, A., Latreille, J., Jdid, R., Tschachler, E. and Morizot, F. 2014. Influence of skin
ageing features on Chinese women's perception of facial age and attractiveness. International
Journal of Cosmetic Science, 36(4), pp. 312-320.
Prajapati, R., Kalariya, M., Umbarkar, R., Parmar, S. and Sheth, N . 2011. Colocasia
esculenta: A potent indigeous plant. International Journal of Nutrition, Pharmacology,
Neurological Diseases, 1(2), pp. 90-96.
Prior, R.L., Hoang, H., Gu, L., Wu, X., Bacchiocca, M., Howard, L., Hampschwoodill, M.,
Huang, D., Ou, B. and Jacob, R. 2003. Assays for hydrophilic antioxidant capacity (ORACFL).
Journal of Agricultural & Food Chemistry, 51(11), pp. 3273-3279.
http://etd.uwc.ac.za
REFERENCES
122
Raja, R. 2012. Medicinally potential plants of Lamiaceae family: An overview. Research
Journal of Medicinal Plants, 6, pp. 203-213.
Rates, S.M.K. 2001. Plants as source of drugs. Toxicon, 39(5), pp. 603-613.
Reis, A., Viccini, L. and Marçal de Sousa, S. 2015. Contributions to cytogenetics of
Plectranthus barbatus Andr. (Lamiaceae): A medicinal plant. Comparative Cytogenetics, 9(3),
pp. 451–463.
Rice, L., Brits, G., Potgieter, C. and Van Staden, J. 2011. Plectranthus: A plant of future.
South African Journal of Botany , 77, pp. 947-959
Rojas, J.J., Ochoa, V.J., Ocampo, A.S. and Muñoz, J.F. 2006. Screening for antimicrobial
activity of ten medicinal plants used in Colombian folkloric medicine: A possible alternative in
the treatment of non-nosocomial infections. BMCComplementary & Alternative Medicine, 6(2),
pp. 1-6.
Rosa, S., Correia, V., Ribeiro, I., Rijo, P., Simões, F., Saraiva, N. and Fernandes, A. 2015.
In vitro antioxidant properties of the diterpenes parvifloron D and 7α-acetoxy-6β-
hydroxyroyleanone. Biomedical & Biopharmaceutical Research , 12(1), pp. 59-67.
Schrader, M. and Fahimi, H.D. 2006. Peroxisomes and oxidative stress. Biochimica &
Biophysica Acta, 1763(12), pp. 1755-1766.
Scott, G., Springfield, E.P. and Coldrey, N. 2004. A pharmacognostical study of 26 South
African plant species used as traditional medicines. Pharmaceutical Biology, 42(3), pp. 186-213.
Shaukat, K., Ghazala, H.R., Hina, Y., Rehana, P., Hina, A., Huma, S., Kaneez, F. and
Maryam, A. 2013. Medicinal importance of holoptela integrifolia (Roxb.). Planch its biological
and pharmacological activities. Natural Products chemistry & Research, 2(1), pp. 1-4.
Shirasugi, I., Sakakibara, Y., Yamasaki, M., Nishiyama, K., Matsui, T., Liu, M.C. and
Suiko, M. 2010. Novel screening method for potential skin-whitening compounds by a
luciferase reporter assay. Bioscience, Biotechnology, & Biochemistry, 74(11), p. 2253–2258.
http://etd.uwc.ac.za
REFERENCES
123
Sima, V.H., Patris, S., Aydogmus, Z., Sarakbi, A., Sandulescu, R and Kauffmann, J.M .
2011. Tyrosinase immobilized magnetic nanobeads for the amperometric assay of enzyme
inhibitors: Application to the skin whitening agents. Talanta, 83(3), pp. 980-987.
Snijman, P.W., Joubert, E., Ferreira, D., Li, X., Ding, Y., Green, I.R. and Gelderblom,
W.C.A.2009. Antioxidant activity of the dihydrochalcones aspalathin and nothofagin and their
corresponding flavones in relation to other rooibos (Aspalathus linearis) flavonoids,
epigallocatechin gallate, and trolox.Journal of Agricultural & Chemistry, 57(15), pp. 6678-6684.
Sochor, J., Dobes, J., Krystofova, O., Ruttkay-Nedecky, B., Babula, P., Pohanka, M.,
Jurikova, T., Zitka, O., Adam, V., Klejdus, B. and Kizek, R. 2013. Electrochemistry as a tool
for studying antioxidant properties. International Journal of Electrochemistry Sciences, 8, pp.
8464-8489.
Summers B. 2006. A lightening tour of skin-brightening options. Pharmaceutical & Cosmetic
Review, pp. 29–33.
Suntar, I., Akkol, EK., Senol, F.S., Keles, H. and Orhan, I.E. 2011. Investigating wound
healing, tyrosinase inhibitory and antioxidant activities of the ethanol extracts of Salvia
cryptantha and Salvia cyanescens using in vivo and in vitro experimental models. Journal of
Ethnopharmacology, 135(1), pp. 71-77.
Sparavigna, A., Tenconi, B., Deponti, I., Scarci, F. and Caserini, M . 2013. An innovative
concept gel to prevent skin aging. Journal of Cosmetics, Dermatological Sciences &
Applications, 3(4), pp. 271-280.
Strelitzia. 2013. Plants of the greater Cape floristic Region. Snijman, D.A (ed). Pretoria:
SANBI.
http://etd.uwc.ac.za
REFERENCES
124
Szentmihályi, K., Then, M. and Csedo, C. 2004. Comparative study on tannins, flavonoids,
terpenes and mineral elements of some Salvia species. Acta Hortorticulturae, 629, pp. 463-470.
Tavares da Mota, G.S., Arantes, A.B, Sacchetti, G., Spannoletti, A., Ziosi, P., Scalambra,
E., Vertuani, S. and Manfredini, S. 2014. Antioxidant activity of cosmetic formulations based
on novel extracts from seeds of Brazilian Araucaria angustifolia (Bertoll) Kuntze. Journal of
Cosmetics, Dermatological Sciences & Applications, 4, pp. 190-202.
Taylor, J.L.S., Rabe, T., Mc Gaw, L.J., Jager, A.K. and Van staden, J. 2001. Towards the
science validation of trditional medicinal plants. Plant Growth Regulation, 34(1), pp. 23-37.
Thangboonjit, W., Limsaeng-u-rai, S., Pluemsamran, T. and Panich, U. 2014. Comparative
evaluation of antityrosinase and antioxidant activities of dietary phenolics and their activities in
melanoma cells exposed to UVA. Siriraj Medical Journal, 66(1), pp. 1-6.
Theodoridis, S., Stefanaki, A., Tezcan, M., Aki, C., Kokkini, S. and Vlachonasios, K.E.
2012. DNA barcoding in native plants of the Labiatae (Lamiaceae) family from Chios Island
(Greece) and the adjacent Çeşme-Karaburun Peninsula (Turkey). Molecular Ecology Resources,
12(4), pp. 620-33.
Thring, T.S. and Weitz, F.M. 2006. Medicinal plant use in the Bredasdorp/Elim region of the
Southern Overberg in the Western Cape Province of South Africa. Journal of
Ethnopharmacology , 103(2), pp. 261-75.
Topcu, G., Ozturk, M., Kusman, T., Demirkoz, A.A.B., Kolak, U. and Ulubelen, A. 2013.
Terpenoids, essential oil composition, fatty acid profile, and biological activities of Anatolian
Salvia fruticosa Mill.Turkish Journal of Chemistry, 37, pp. 619 – 632.
Van Wyk, B.E. and Gericke, N. 2000. People’s Plants. A guide to useful plants of Southern
Africa. Briza Publications, Pretoria. pp. 352.
http://etd.uwc.ac.za
REFERENCES
125
Vinha, A.F., Soares, M.O., Castro, A., Santos, A., Oliveira, M.B. and Machado, M . 2012.
Phytochemical characterizationand radical scavenging activity of aqueous extracts of medicinal
plants from portugal. European Journal Medicinal Plants, 2(4), pp. 335-347.
Xia, N., Zhang, L., Feng, Q., Deng, D., Sun, X. and Liu, L. 2013. Amplified voltammetric
detection of tyrosinase and its activity with dopamine-gold nanoparticles as redox probes.
International Journal of Electrochemistry, 8, pp. 5487-5495.
Wangthong, S., Tonsiripakdee, I., Monhaphol, T., Nonthabenjawan, R. and
Wanichwecharungruang, P.S. 2007. TLC developing technique for tyrosinase inhibitor
detection. Biomedical Chromatography, 21(1), pp. 94-100.
Watson, R.E.B., Gibbs, N.K., Griffiths, C.E.M. and Sheraft, M.J. 2014. Damage to skin
extracellular matrix induced by UV exposure. Antioxidant & Redox Signaling,21(7), pp. 1063-
1077.
Whittaker, J. 1995. In food enzymes, structure and mechanism. New York, pp. 1-6