niche expansion and the niche variation hypothesis: does the degree of individual variation increase...
TRANSCRIPT
vol. 172, no. 6 the american naturalist december 2008 �
Notes and CommentsNiche Expansion and the Niche Variation Hypothesis: Does the Degree of
Individual Variation Increase in Depauperate Assemblages?
Gabriel C. Costa,1,* Daniel O. Mesquita,2,† Guarino R. Colli,3,‡ and Laurie J. Vitt1,§
1. Sam Noble Oklahoma Museum of Natural History and ZoologyDepartment, University of Oklahoma, Norman, Oklahoma 73072;2. Departamento de Engenharia e Meio Ambiente, UniversidadeFederal da Paraıba, CEP 58297-000, Rio Tinto, Paraıba, Brazil;3. Departamento de Zoologia, Universidade de Brasılia, CEP70910-900, Brasılia, Distrito Federal, Brazil
Submitted May 5, 2008; Accepted July 1, 2008;Electronically published October 24, 2008
Online enhancement: appendix.
abstract: The niche expansion and niche variation hypothesespredict that release from interspecific competition will promote nicheexpansion in depauperate assemblages. Niche expansion can occurby different mechanisms, including an increase in within-individual,among-individual, or bimodal variation (sexual dimorphism). Herewe explore whether populations with larger niche breadth have ahigher degree of diet variation. We also test whether populationsfrom depauperate lizard assemblages differ in dietary resource usewith respect to variation within and/or among individuals and sexualdimorphism. We found support for the niche expansion and nichevariation hypotheses. Populations in assemblages with low phylo-genetic diversity had a higher degree of individual variation, sug-gesting a tendency for niche expansion. We also found evidencesuggesting that the mechanism causing niche expansion is an increasein variation among individuals rather than an increase in within-individual variation or an increase in bimodal variation due to sexualdimorphism.
Keywords: Cerrado, individual specialization, islands, lizards, nichevariation hypothesis, niche width.
* Corresponding author; e-mail: [email protected].
† E-mail: [email protected].
‡ E-mail: [email protected].
§ E-mail: [email protected].
Am. Nat. 2008. Vol. 172, pp. 868–877. � 2008 by The University of Chicago.0003-0147/2008/17206-50423$15.00. All rights reserved.DOI: 10.1086/592998
The niche variation hypothesis (NVH; Van Valen 1965)predicts that populations with wider niches are more var-iable than populations with narrower niches. The greaterniche variation exhibited by generalist populations sug-gests that trade-offs might limit individual niche breadth,with the consequence that individual specialists may bemore fit than individual generalists (Van Valen 1965; Souleand Stewart 1970; Bolnick et al. 2007). Indeed, the degreeto which populations represent collections of specializedindividuals rather than ecological equivalents has beenlargely overlooked, and a recent review suggested that in-dividual specialization might be a widespread phenome-non (Bolnick et al. 2003).
Several assessments of the NVH brought heavy criticism,and numerous studies using different organisms havefailed to find any relationship between population nichebreadth and variance among individuals (i.e., Dennisonand Baker 1991; Diaz 1994; Simberloff et al. 2000; Meiriet al. 2005). Recently, Bolnick et al. (2007) suggested thatthe major problem with previous tests of the NVH wasthat they overemphasized morphological variation. Al-though the NVH was originally developed to test for mor-phological variability, Bolnick et al. (2007) argued that theincreased variation in resource use does not necessarilyneed to be mirrored by an increase in morphological var-iation. If a phenotypic trait (morphological, behavioral,etc.) allows an individual to use a novel set of resourcesthat minimize intraspecific competition, this trait mightbe favored by selection (Bolnick et al. 2003). In their anal-ysis, Bolnick et al. (2007) used direct measures of dietaryresource use instead of morphology as a surrogate andfound that more generalized populations also exhibitedhigher among-individual variation, supporting generalpredictions extracted from the NVH (Bolnick et al. 2007).
Numerous studies argued that many island vertebratesexpand niche dimensions when released from constraintsof mainland competitors (reviewed in Grant 1998; Whit-taker 1998). This phenomenon is often referred to as“niche expansion” (MacArthur et al. 1972; Pianka 1994;Ricklefs and Miller 1999). This increase in niche breadth
Niche Expansion and Niche Variation 869
could be achieved either by all individuals shifting to usea larger spectrum of available resources or by each indi-vidual continuing to use a narrow range of resources butdiverging from conspecifics to minimize intraspecific com-petition. Under the latter scenario, larger niche breadthwould be achieved by an increase in among-individualvariation (Van Valen 1965).
Together, the niche expansion and niche variation hy-potheses generate two major predictions: (1) release frominterspecific competition will promote niche expansion indepauperate assemblages, and (2) niche expansion will oc-cur via increased variation among individuals. The resultsof Bolnick et al. (2007) supported the latter prediction,but they did not test whether release in interspecific com-petition was responsible for the niche expansion. In a re-cent study, Mesquita et al. (2007) found little evidence forniche expansion in populations from depauperate lizardassemblages. However, demonstrating niche expansionmay be difficult because variation in resource availabilityfrom different localities may influence niche width. Thishas been observed with respect to habitat niche breadth:because some islands have much lower habitat diversitythan comparable mainland areas, the island populationsmight actually offer narrower niches (i.e., Grant 1971).Nevertheless, populations with similar niche breadths canstill exhibit different levels of individual variation inde-pendent of resource availability. It just depends on howindividual resource use contrasts with the entire popula-tion resource use (Bolnick et al. 2002). Therefore, a bettertest for the predictions of niche expansion and niche var-iation hypotheses should compare the degree of individualvariation among populations (see fig. 1 for a graphicalmodel). For example, differences in the degree of individ-ual variation between island and mainland populationswould constitute evidence for a tendency for niche ex-pansion and could identify the underlying mechanism forsuch expansion.
It has also been suggested that sexual dimorphism candecrease competition by increasing discontinuous varia-tion in a bimodal manner (Rothstein 1973; Patterson 1983;Shine 1989). Therefore, depauperate assemblages shouldbe more likely to show an increase in sexual dimorphismin which sexes would differ in resource use rather thanhigher individual specialization. Ebenman and Nilsson(1982) examined within- and between-sex variation in is-land and mainland populations of chaffinches (Fringillacoelebs) and found that partitioning of habitat use by sexeswas more pronounced in island than in mainlandenvironments.
Here, we use a large data set on lizard diets from anatural system that mimics an island/mainland system(Mesquita et al. 2007) to test whether populations fromdepauperate assemblages have a higher degree of diet var-
iation among individuals and exhibit greater sexual di-morphism in dietary resource use and whether popula-tions with larger niche breadth are associated with a higherdegree of diet variation.
Methods
Study System
As our study system, we use lizard populations from theBrazilian Cerrado. The Cerrado is the second-largest bi-ome in South America, originally occupying about 20%of Brazil’s land surface (Ab’Saber 1977; Ratter et al. 1997;Silva and Bates 2002). It is located mainly in central Braziland shares contact zones with almost all other Brazilianbiomes. The core area of the Cerrado consists of savannavegetation distributed in a gradient from open grasslandto forested sites with closed canopy (Eiten 1972). A recentoverview of the Cerrado fauna and flora was done byOliveira and Marquis (2002).
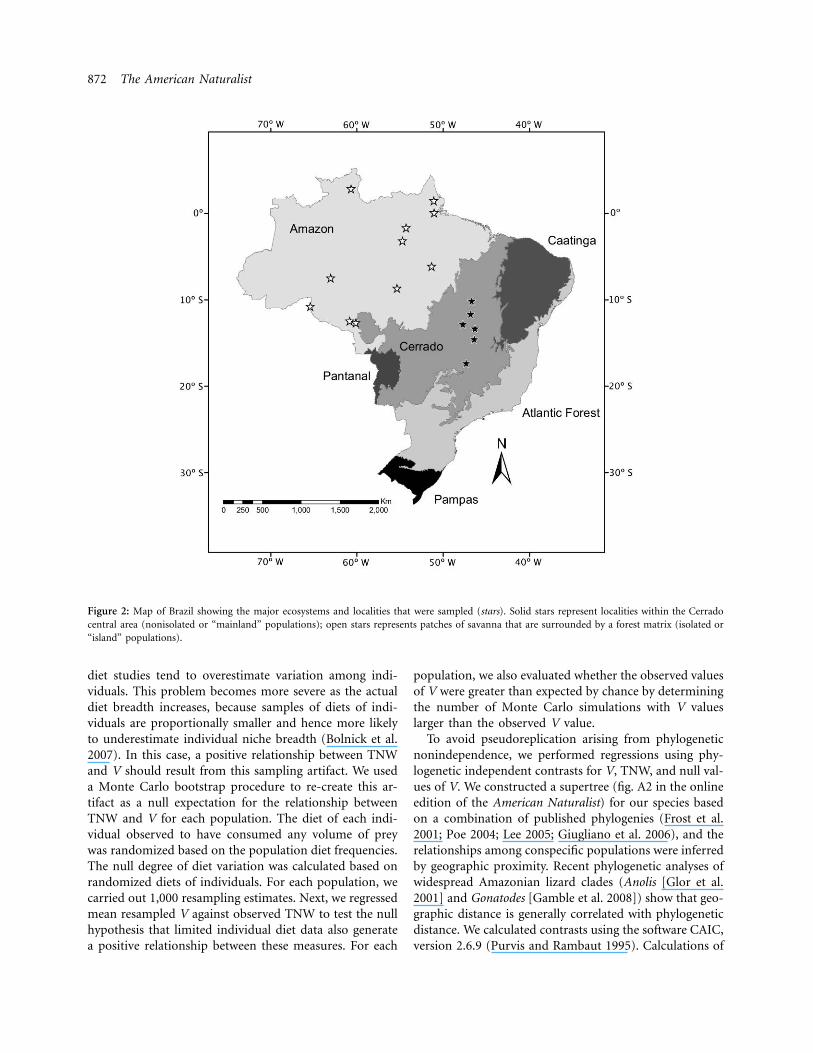
Isolated patches of Cerrado in a forest matrix withinAmazonia provide species-depauperate islands that con-tain a subset (lower diversity) of the Cerrado fauna andflora (Eiten 1978; Gainsbury and Colli 2003; Mesquita etal. 2007). The origin of these patches is attributed to globalclimatic fluctuations, which have promoted extremechanges in the vegetation cover of tropical regions. Duringglacial periods (dry climate), savannas expanded and re-placed forest, whereas during interglacial periods (humidclimate), savannas retreated as forest expanded (Haffer1969; Van der Hammen and Absy 1994). Consequently,isolated areas are considered vestiges of a large savannathat extended from central Brazil to the Guianas (Prance1996). We use the terms “island” to refer to the isolateddepauperate assemblages and “mainland” to refer to thespecies-rich nonisolated assemblages in the Cerradoregion.
During a 6-year period, from 1998 to 2004, we sampled11 islands in Amazonia and six mainland sites within thecore of Cerrado (fig. 2). With the exception of Ameivaameiva, no other open-area lizard species occurs in theadjacent forest; likewise, forest species do not occupy openareas (Mesquita et al. 2007). Lizard faunas were highlysimilar between island and mainland, with several speciesand/or lineages occurring in both. Further, species richnessin island areas was lower than in mainland areas (Gains-bury and Colli 2003; Mesquita et al. 2007). Tables A1 andA2 in the online edition of the American Naturalist re-spectively show lists of species from open areas and speciesfrom surrounding forest, and figure A1 in the online edi-tion of the American Naturalist shows satellite images ofsome of the studied areas. These natural characteristics
Niche Expansion and Niche Variation 871
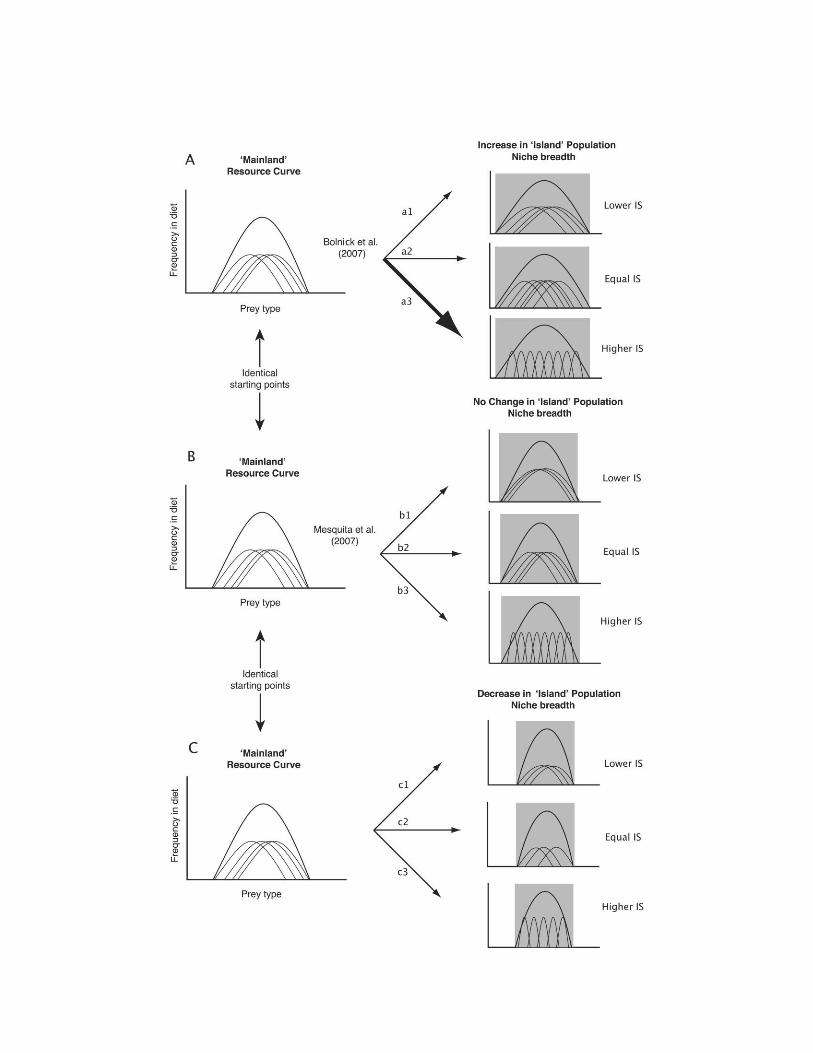
Figure 1: Three different scenarios and subsequent predictions from the niche expansion and niche variation hypotheses. A, Comparisons between“mainland” and “island” populations show that niche breadth increases in island populations. This niche expansion could be achieved by allindividuals shifting to use a larger spectrum of available resources, resulting in a lower degree of individual specialization (IS; a1), an unchangeddegree of IS but with decreased between-individual overlap (a2), or each individual continuing to use a narrow range of resources but divergingfrom conspecifics to minimize intraspecific competition (higher IS; a3). Bolnick et al. (2007) demonstrated that scenario a3 occurs. However, theydid not assess whether niche expansion was a result of competitive release. B, No difference in niche breadth is found between mainland and islandpopulations, and individuals shift to use a larger spectrum of available resources (lower IS; b1), individuals in islands continue to use resourcessimilarly to individuals in mainland populations (equal IS; b2), or individuals in island population diverge from conspecifics (higher IS; b3). C,Niche breadth decreases in island populations, and individuals present lower IS (c1), equal IS (c2), or higher IS (c3). Niche expansion might notoccur because variation in resource availability from different localities may influence niche width. Therefore, no difference or narrower niche breadthin islands may be a result of lower resource availability (e.g., Grant 1971). Lower or higher IS regardless of niche breadth may be evidence thatniche expansion would occur in case there were no differences in resource availability.
provide an ideal situation to test the predictions of theniche expansion and niche variation hypotheses.
Diet Data
Details of lizard and diet collection methods are providedby Mesquita et al. (2007). Briefly, we analyzed stomachcontents of each individual under a stereomicroscope,identifying prey items by order. Because most prey arearthropods, ordinal-level identifications separate preymorphotypes quite well. For all prey items, we recordedbody length and width (to 0.01 mm) of intact prey itemswith digital calipers and estimated individual prey volume(Vol) as an ellipsoid:
2
4 l wVol p p ,( )( )3 2 2
where w p prey width and l p prey length. We then usedthe prey volume of each prey type in analyses.
Because we are examining variation among individualswithin populations, we selected only species for which wehad large sample sizes (120 individuals). We also used aresampling procedure to determine whether our resultswere influenced by sample size (described below). Withthese considerations, we restricted our analysis to Ameivaameiva, Anolis spp., Cnemidophorus spp., Tropidurus spp.,Gymnodactylus carvalhoi, Micrablepharus maximiliani, andVanzosaura rubricauda. Species of Anolis, Cnemidophorus,and Tropidurus varied among sites, but species within eachgenus are relatively similar in body size and ecology. Intotal we used 28 populations from isolated areas and 15populations from nonisolated areas (table A3 in the onlineedition of the American Naturalist).
Niche Width and Individual Diet Variation
To calculate dietary niche breadth and the degree of in-dividual diet variation, we followed the methods described
by Bolnick et al. (2007). We calculated the total niche width(TNW) for each population by using the Shannon-Weaverdiversity index, following Roughgarden (1979). To mea-sure diet variation among individuals, we calculated thesimilarity between the diet proportions of each individualand the averaged population diet distribution. Propor-tional similarity is calculated as
PS p 1 � 0.5 Fp � q F p min (p , q ),� �i ij j ij ij j
where pij is the proportion of prey type j in the diet ofindividual i and qj is the proportion of prey type j in theoverall population’s diet. We calculated qj by averagingproportions across individuals to control for uneven vol-ume of prey across individuals (Bolnick et al. 2002). Foreach population, mean PSi represents the average level ofdiet overlap between individuals and the population as awhole, that is, the degree of individual specialization (IS;Bolnick et al. 2002, 2007). We also used a more intuitivemeasure, the index V, defined as (Bolnick etV p 1 � ISal. 2007). This index ranges from 0, when all individualsuse the full range of resources used by the population, tohigher decimal values, when each individual uses a uniqueportion of the population diet distribution.
To test whether larger niche breadth is achieved by in-crease in diet variation among individuals, we regressedthe values of V on TNW for each population. To testwhether populations released from interspecific compe-tition will have a higher degree of diet variation, we usedANOVAs to compare the mean V values for island versusmainland populations. Also, to search for differences be-tween island and mainland populations that could be hid-den by among-species variation, we contrasted the averageV for island versus mainland by using Wilcoxon signed-rank tests paired by species of the same genus.
Stomach size or resource competition may constrain thenumber of prey recorded per individual. Thus, gut con-tents (a short-term measure) may underestimate the long-term diversity of prey eaten by an individual. Therefore,
872 The American Naturalist
Figure 2: Map of Brazil showing the major ecosystems and localities that were sampled (stars). Solid stars represent localities within the Cerradocentral area (nonisolated or “mainland” populations); open stars represents patches of savanna that are surrounded by a forest matrix (isolated or“island” populations).
diet studies tend to overestimate variation among indi-viduals. This problem becomes more severe as the actualdiet breadth increases, because samples of diets of indi-viduals are proportionally smaller and hence more likelyto underestimate individual niche breadth (Bolnick et al.2007). In this case, a positive relationship between TNWand V should result from this sampling artifact. We useda Monte Carlo bootstrap procedure to re-create this ar-tifact as a null expectation for the relationship betweenTNW and V for each population. The diet of each indi-vidual observed to have consumed any volume of preywas randomized based on the population diet frequencies.The null degree of diet variation was calculated based onrandomized diets of individuals. For each population, wecarried out 1,000 resampling estimates. Next, we regressedmean resampled V against observed TNW to test the nullhypothesis that limited individual diet data also generatea positive relationship between these measures. For each
population, we also evaluated whether the observed valuesof V were greater than expected by chance by determiningthe number of Monte Carlo simulations with V valueslarger than the observed V value.
To avoid pseudoreplication arising from phylogeneticnonindependence, we performed regressions using phy-logenetic independent contrasts for V, TNW, and null val-ues of V. We constructed a supertree (fig. A2 in the onlineedition of the American Naturalist) for our species basedon a combination of published phylogenies (Frost et al.2001; Poe 2004; Lee 2005; Giugliano et al. 2006), and therelationships among conspecific populations were inferredby geographic proximity. Recent phylogenetic analyses ofwidespread Amazonian lizard clades (Anolis [Glor et al.2001] and Gonatodes [Gamble et al. 2008]) show that geo-graphic distance is generally correlated with phylogeneticdistance. We calculated contrasts using the software CAIC,version 2.6.9 (Purvis and Rambaut 1995). Calculations of
Niche Expansion and Niche Variation 873
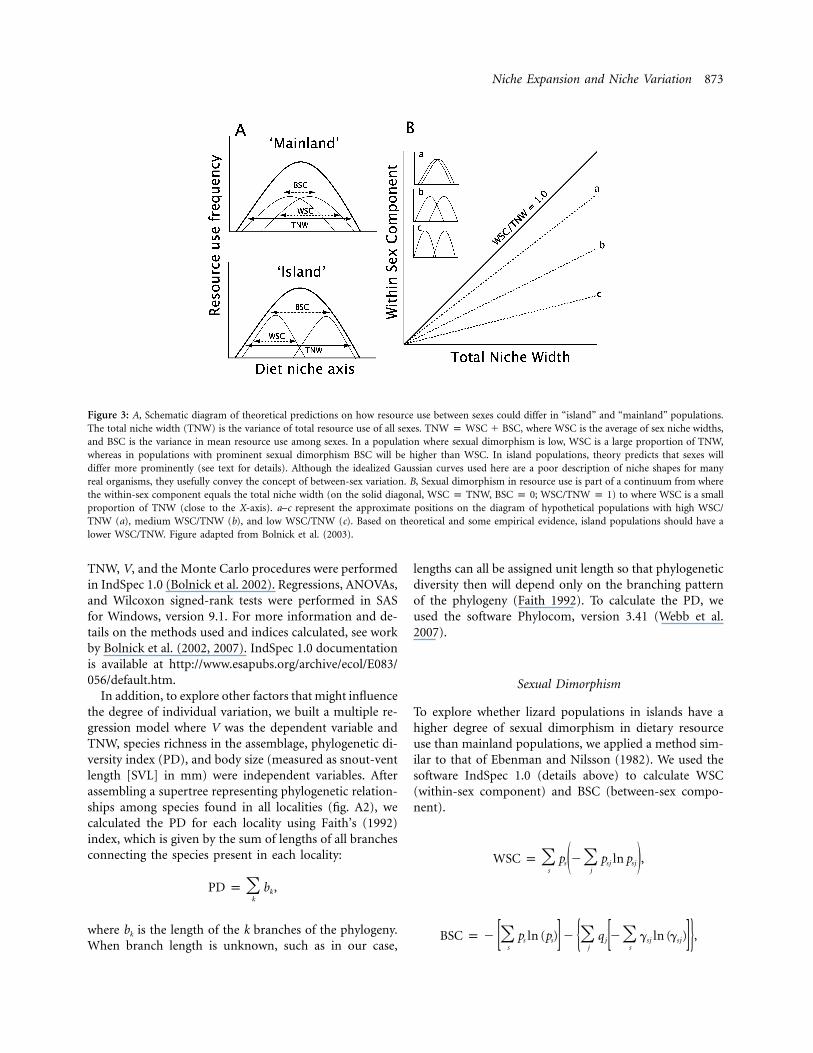
Figure 3: A, Schematic diagram of theoretical predictions on how resource use between sexes could differ in “island” and “mainland” populations.The total niche width (TNW) is the variance of total resource use of all sexes. TNW p WSC � BSC, where WSC is the average of sex niche widths,and BSC is the variance in mean resource use among sexes. In a population where sexual dimorphism is low, WSC is a large proportion of TNW,whereas in populations with prominent sexual dimorphism BSC will be higher than WSC. In island populations, theory predicts that sexes willdiffer more prominently (see text for details). Although the idealized Gaussian curves used here are a poor description of niche shapes for manyreal organisms, they usefully convey the concept of between-sex variation. B, Sexual dimorphism in resource use is part of a continuum from wherethe within-sex component equals the total niche width (on the solid diagonal, WSC p TNW, BSC p 0; WSC/TNW p 1) to where WSC is a smallproportion of TNW (close to the X-axis). a–c represent the approximate positions on the diagram of hypothetical populations with high WSC/TNW (a), medium WSC/TNW (b), and low WSC/TNW (c). Based on theoretical and some empirical evidence, island populations should have alower WSC/TNW. Figure adapted from Bolnick et al. (2003).
TNW, V, and the Monte Carlo procedures were performedin IndSpec 1.0 (Bolnick et al. 2002). Regressions, ANOVAs,and Wilcoxon signed-rank tests were performed in SASfor Windows, version 9.1. For more information and de-tails on the methods used and indices calculated, see workby Bolnick et al. (2002, 2007). IndSpec 1.0 documentationis available at http://www.esapubs.org/archive/ecol/E083/056/default.htm.
In addition, to explore other factors that might influencethe degree of individual variation, we built a multiple re-gression model where V was the dependent variable andTNW, species richness in the assemblage, phylogenetic di-versity index (PD), and body size (measured as snout-ventlength [SVL] in mm) were independent variables. Afterassembling a supertree representing phylogenetic relation-ships among species found in all localities (fig. A2), wecalculated the PD for each locality using Faith’s (1992)index, which is given by the sum of lengths of all branchesconnecting the species present in each locality:
PD p b ,� kk
where bk is the length of the k branches of the phylogeny.When branch length is unknown, such as in our case,
lengths can all be assigned unit length so that phylogeneticdiversity then will depend only on the branching patternof the phylogeny (Faith 1992). To calculate the PD, weused the software Phylocom, version 3.41 (Webb et al.2007).
Sexual Dimorphism
To explore whether lizard populations in islands have ahigher degree of sexual dimorphism in dietary resourceuse than mainland populations, we applied a method sim-ilar to that of Ebenman and Nilsson (1982). We used thesoftware IndSpec 1.0 (details above) to calculate WSC(within-sex component) and BSC (between-sex compo-nent).
WSC p p � p ln p ,� �s sj sj( )s j
BSC p � p ln (p) � q � g ln (g ) ,� � �s s j sj sj[ ] { [ ]}s j s
874 The American Naturalist
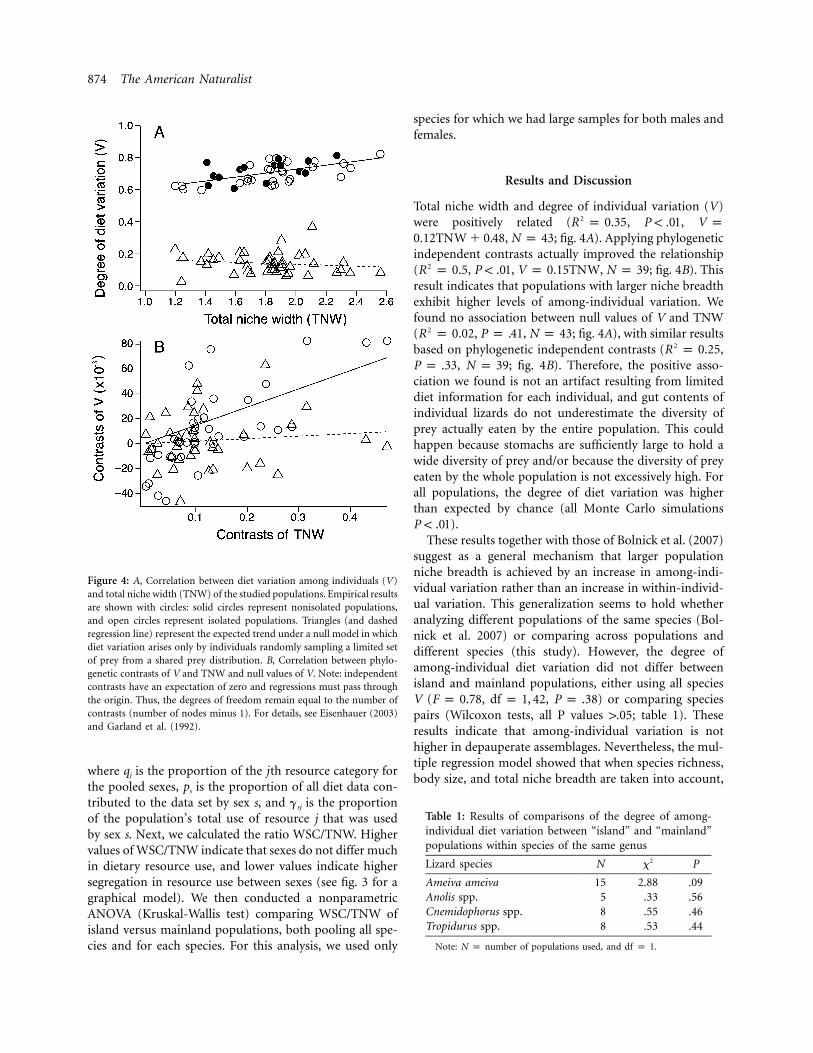
Figure 4: A, Correlation between diet variation among individuals (V)and total niche width (TNW) of the studied populations. Empirical resultsare shown with circles: solid circles represent nonisolated populations,and open circles represent isolated populations. Triangles (and dashedregression line) represent the expected trend under a null model in whichdiet variation arises only by individuals randomly sampling a limited setof prey from a shared prey distribution. B, Correlation between phylo-genetic contrasts of V and TNW and null values of V. Note: independentcontrasts have an expectation of zero and regressions must pass throughthe origin. Thus, the degrees of freedom remain equal to the number ofcontrasts (number of nodes minus 1). For details, see Eisenhauer (2003)and Garland et al. (1992).
Table 1: Results of comparisons of the degree of among-individual diet variation between “island” and “mainland”populations within species of the same genus
Lizard species N x2 P
Ameiva ameiva 15 2.88 .09Anolis spp. 5 .33 .56Cnemidophorus spp. 8 .55 .46Tropidurus spp. 8 .53 .44
Note: N p number of populations used, and df p 1.
where qj is the proportion of the jth resource category forthe pooled sexes, ps is the proportion of all diet data con-tributed to the data set by sex s, and gsj is the proportionof the population’s total use of resource j that was usedby sex s. Next, we calculated the ratio WSC/TNW. Highervalues of WSC/TNW indicate that sexes do not differ muchin dietary resource use, and lower values indicate highersegregation in resource use between sexes (see fig. 3 for agraphical model). We then conducted a nonparametricANOVA (Kruskal-Wallis test) comparing WSC/TNW ofisland versus mainland populations, both pooling all spe-cies and for each species. For this analysis, we used only
species for which we had large samples for both males andfemales.
Results and Discussion
Total niche width and degree of individual variation (V)were positively related ( , ,2R p 0.35 P ! .01 V p
, ; fig. 4A). Applying phylogenetic0.12TNW � 0.48 N p 43independent contrasts actually improved the relationship( , , , ; fig. 4B). This2R p 0.5 P ! .01 V p 0.15TNW N p 39result indicates that populations with larger niche breadthexhibit higher levels of among-individual variation. Wefound no association between null values of V and TNW( , , ; fig. 4A), with similar results2R p 0.02 P p .41 N p 43based on phylogenetic independent contrasts ( ,2R p 0.25
, ; fig. 4B). Therefore, the positive asso-P p .33 N p 39ciation we found is not an artifact resulting from limiteddiet information for each individual, and gut contents ofindividual lizards do not underestimate the diversity ofprey actually eaten by the entire population. This couldhappen because stomachs are sufficiently large to hold awide diversity of prey and/or because the diversity of preyeaten by the whole population is not excessively high. Forall populations, the degree of diet variation was higherthan expected by chance (all Monte Carlo simulations
).P ! .01These results together with those of Bolnick et al. (2007)
suggest as a general mechanism that larger populationniche breadth is achieved by an increase in among-indi-vidual variation rather than an increase in within-individ-ual variation. This generalization seems to hold whetheranalyzing different populations of the same species (Bol-nick et al. 2007) or comparing across populations anddifferent species (this study). However, the degree ofamong-individual diet variation did not differ betweenisland and mainland populations, either using all speciesV ( , , ) or comparing speciesF p 0.78 df p 1, 42 P p .38pairs (Wilcoxon tests, all P values 1.05; table 1). Theseresults indicate that among-individual variation is nothigher in depauperate assemblages. Nevertheless, the mul-tiple regression model showed that when species richness,body size, and total niche breadth are taken into account,
Niche Expansion and Niche Variation 875
Table 2: Results of multiple regression model
Variable b SE t P
TNW .12 .02 4.48 !.01Richness .01 !.01 3.12 !.01PD �.33 .15 �2.20 .03SVL !.01 !.01 .41 .69Intercept .46 .05 9.34 !.01
Note: The model explores the effects of total niche width (TNW), species
richness in the assemblage, Faith’s (1992) phylogenetic diversity index (PD),
and body size (snout-vent length [SVL] in mm) on the degree of individual
variation. Full model , , , , , b p2F p 9.96 r p 0.51 df p 4 P ! 0.01 N p 43
regression coefficient, and t p t statistic.
Table 3: Results of comparison of resource use between sexes in the “islands”and “mainland” populations
SpeciesIsland meanWSC/TNW
Mainland meanWSC/TNW N x2 P
All species .91 .94 17 .45 .50Ameiva ameiva .88 .90 4 .60 .44Anolis spp. .85 .94 4 2.4 .12Cnemidophorus spp. .98 .97 3 1.5 .22Tropidurus spp. .92 .96 6 .42 .51
Note: WSC p within-sex component, TNW p total niche width, and Np sample size,
or number of populations used.
PD has a negative regression coefficient (table 2), indi-cating that higher V values are achieved in lower-PD as-semblages. This is a very interesting result, which suggeststhat assemblages with less phylogenetic diversity may bereleased from interspecific competition and respond aspredicted by the niche expansion and niche variation hy-potheses. Although PD tends to be correlated with speciesrichness (Torres and Diniz-Filho 2004), areas with similarspecies richness may have different values of PD dependingon the lineages present and diversity within lineages. Re-duction of phylogenetic diversity may provide the neces-sary competitive release, independent of species richness,if reduction of PD is caused by the loss of related speciesthat are more likely to compete for resources.
Another important implication of this analysis is thatit indicates that species richness per se may not be a goodproxy of interspecific competition. This has been observedpreviously, for instance, in plankton and plant systems,where different explanations have been proposed for thelack of relationship between richness and interspecificcompetition. Because of allelopathy, the strength of com-petitive interactions in plankton systems is not related tothe total number of species present but instead to whichspecies are present (for details, see Graneli and Hansen2006 and references therein). In addition, some species ofphytoplankton can facilitate the coexistence of others byadding chemicals to the water. In some instances, the de-gree of competition will be related not to species richness
or composition but instead to the species composition atan earlier time (see Roelke and Buyukates 2001 and ref-erences therein). In plants, a new mechanism termed“lumpy coexistence” was recently proposed (Scheffer andvan Nes 2006). In this case, competition between specieswithin lumps along a resource gradient is very low, despitespecies richness. However, competition is very intense be-tween lumps along the resource gradient, regardless ofspecies richness within each lump (Scheffer and van Nes2006). Among lizards, classical literature on Caribbeananoles highlights the importance of interspecific compe-tition (e.g., Schoener 1983). However, a recent review us-ing data for more than 50 lizard assemblages distributedworldwide pointed out that in general, lizard assemblagesare not structured by interspecific competition when com-pared to assemblages in null models (Luiselli 2008). Fur-thermore, when structure is indeed found, it does not seemto be related to species richness (Luiselli 2008). Therefore,although the detailed mechanisms on how interspecificcompetition may affect lizard assemblages still must bedetermined, our study and recent evidence suggest thatspecies richness may not play a major role.
Our multiple regression analysis also showed that therewas no effect of body size on the degree of individualvariation. Previous work has shown that larger predatorstend to consume prey that are more variable in size (Vezina1985; Costa et al. 2008). However, a recent study using alarge data set on predaceous lizards showed that largerpredators avoid very small prey and therefore tend to con-sume a narrower diversity of prey (Costa et al. 2008). Ourresults add to those studies by pointing out that althoughlarger lizards tend to eat less diverse and more variable-sized prey, populations of larger lizards do not differ frompopulations of smaller lizards in the degree of variationamong individuals.
Our sexual dimorphism analysis showed that overallthere are no differences in resource use between sexes(table 3). Both island and mainland populations exhibitvery high WSC/TNW ratios, indicating that males andfemales utilize resources in a similar way. The role of sexual
876 The American Naturalist
dimorphism in the NVH is controversial, with some stud-ies supporting the model (Ebenman and Nilsson 1982;Simberloff et al. 2000; Pearson et al. 2002) and others notsupporting it (Dunham et al. 1978; Blondel et al. 2002;Meiri et al. 2005). Meiri et al. (2005) argued that thesmaller variability and similar degree of sexual size di-morphism in insular populations of carnivores might re-sult from differences in the number and perhaps the sizedistribution of potential prey, which may be smaller onislands. A later study comparing island and adjacent-main-land populations of mustelids also reached the same con-clusions (Meiri et al. 2007). This might be the case in oursystem, where there is no difference in niche breadth be-tween island and mainland (Mesquita et al. 2007), but wefound evidence that areas with lower phylogenetic diversityhave a higher degree of individual variation, suggestingthat niche width properties might be constrained by re-source availability.
In summary, we found support for predictions of theniche expansion and niche variation hypotheses. Popu-lations in assemblages with low phylogenetic diversity dif-fer in the degree of individual variation, suggesting a ten-dency for niche expansion, although a wider niche itselfwas not observed in the island assemblages of this system(Mesquita et al. 2007). However, niche breadth may beinfluenced by differences in resource availability in thedifferent environments (Grant 1971; Meiri et al. 2005).Therefore, we suggest that comparisons of degree of in-dividual variation may be a better indicator of the tendencyof niche expansion than comparisons of niche width. Wealso found evidence for the mechanism underlying nicheexpansion. An increase in variation among individualsrather than an increase in within-individual variation oran increase in discontinuous variation, such as in sexualdimorphism, may cause niche expansion.
Acknowledgments
We thank D. Bolnick, M. Kaspari, J. Kelly, and D. Shepardfor critical reading earlier versions of the manuscript; S.Meiri, R. Powell, and D. Roelke for insightful reviews; andS. Balbino, C. Batista, J. Caldwell, K. Colli, D. Diniz, F.Franca, A. Gainsbury, A. Garda, A. Peres Jr., G. Vieira, H.Wiederhecker, and M. Zatz for help with the fieldwork.Fieldwork was funded by various agencies and institutions,including Programa Nacional de Diversidade Biologica(PRONABIO), Fundacao o Boticario de Protecao a Na-tureza, Conservation International do Brasil, and NationalScience Foundation grant DEB-0415430 to L.J.V. and J. P.Caldwell. G.C.C. is supported by a Fulbright/CAPES (Coor-denacao de Aperfeicoamento de Pessoal de Nıvel Superior)PhD fellowship (15053155-2018/04-7), and G.R.C. (302343/88-1) and D.O.M. (150296/2005-3) are supported by Con-
selho Nacional de Desenvolvimento Cientıfico e Tecnol-ogico grants.
Literature Cited
Ab’Saber, A. N. 1977. Os domınios morfoclimaticos da America doSul: primeira aproximacao. Geomorfologia 52:1–21.
Blondel, J., P. Perret, M. C. Ansett, and C. Thebaud. 2002. Evolutionof sexual size dimorphism in birds: test of hypothesis using bluetits in contrasted Mediterranean habitats. Journal of EvolutionaryBiology 15:440–450.
Bolnick, D. I., L. H. Yang, J. A. Fordyce, J. M. Davis, and R. Svanback.2002. Measuring individual-level resource specialization. Ecology83:2936–2941.
Bolnick, D. I., R. Svanback, J. A. Fordyce, L. H. Yang, J. M. Davis,C. D. Hulsey, and M. L. Forister. 2003. The ecology of individuals:incidence and implications of individual specialization. AmericanNaturalist 161:1–28.
Bolnick, D. I., R. Svanback, M. S. Araujo, and L. Persson. 2007.Comparative support for the niche variation hypothesis that moregeneralized populations also are more heterogeneous. Proceedingsof the National Academy of Sciences of the USA 104:10075–10079.
Costa, G. C., L. J. Vitt, E. R. Pianka, D. O. Mesquita, and G. R. Colli.2008. Optimal foraging constrains macroecological patterns: bodysize and dietary niche breadth in lizards. Global Ecology and Bio-geography 17:670–677.
Cunha, O. R., F. P. Nascimento, and T. C. S. Avila-Pires. 1985. Osrepteis da area de Carajas, Para, Brasil (Testudines e Squamata).Publicacoes Avulsas do Museu Paraense Emılio Goeldi 40:9–92.
Dennison, M. D., and A. J. Baker. 1991. Morphometric variabilityin continental and Atlantic island populations of chaffinches (Frin-gilla coelebs). Evolution 45:29–39.
Diaz, M. 1994. Variability in seed size selection by granivorous pas-serines: effects of bird size, bird size variability, and ecologicalplasticity. Oecologia (Berlin) 99:1–6.
Dunham, A. E., D. W. Tinkle, and J. W. Gibbons. 1978. Body sizein island lizards: a cautionary tale. Ecology 59:1230–1238.
Ebenman, B., and S. G. Nilsson. 1982. Components of niche widthin a territorial bird species: habitat utilization in males and femalesof the chaffinch (Fringilla coelebs) on islands and mainland. Amer-ican Naturalist 119:331–344.
Eisenhauer, J. G. 2003. Regression through the origin. Teaching Sta-tistics 25:76–81.
Eiten, G. 1972. The Cerrado vegetation of Brazil. Botanical Review38:201–341.
———. 1978. Delimitation of the Cerrado concept. Vegetatio 36:169–178.
Faith, D. P. 1992. Conservation evaluation and phylogenetic diversity.Biological Conservation 61:1–10.
Frost, D. R., M. T. Rodriguez, T. Grant, and T. A. Titus. 2001. Phy-logenetics of the lizard genus Tropidurus (Squamata: Tropiduridae:Tropidurinae): direct optimization, descriptive efficiency, and sen-sitivity analysis of congruence between molecular data and mor-phology. Molecular Phylogenetics and Evolution 21:352–371.
Gainsbury, A. M., and G. R. Colli. 2003. Lizard assemblages fromnatural Cerrado enclaves in southwestern Amazonia: the role ofstochastic extinctions and isolation. Biotropica 35:503–519.
Gamble, T., A. M. Simmons, G. R. Colli, and L. J. Vitt. 2008. Tertiaryclimate change and the diversification of the Amazonian gecko
Niche Expansion and Niche Variation 877
genus Gonatodes (Sphaerodactylidae, Squamata). Molecular Phy-logenetics and Evolution 46:269–277.
Garland, T., P. H. Harvey, and A. R. Ives. 1992. Procedures for theanalysis of comparative data using phylogenetically independentcontrasts. Systematic Biology 41:18–32.
Giugliano, L. G., E. P. B. Contel, and G. R. Colli. 2006. Geneticvariability and phylogenetic relationships of Cnemidophorus parecis(Squamata, Teiidae) from Cerrado isolates in southwestern Ama-zonia. Biochemical Systematics and Ecology 34:383–391.
Glor, R. E., L. J. Vitt, and A. Larson. 2001. A molecular phylogeneticanalysis of diversification in Amazonian Anolis lizards. MolecularEcology 10:2661–2668.
Graneli, E., and P. J. Hansen. 2006. Allelopathy in harmful algae: amechanism to compete for resources? Pages 189–201 in E. Graneliand J. T. Turner, eds. Ecology of harmful algae. Springer, Berlin.
Grant, P. R. 1971. Variation in tarsus length of birds in island andmainland regions. Evolution 25:599–614.
———. 1998. Evolution on islands. Oxford University Press, Oxford.Haffer, J. 1969. Speciation in Amazonian forest birds. Science 165:
131–137.Lee, M. S. Y. 2005. Squamate phylogeny, taxon sampling, and data
congruence. Organisms, Diversity and Evolution 5:25–45.Luiselli, L. 2008. Do lizard communities partition the trophic niche?
a worldwide meta-analysis using null models. Oikos 117:321–330.MacArthur, R. H., J. M. Diamond, and J. R. Karr. 1972. Density
compensation in island faunas. Ecology 53:330–342.Meiri, S., T. Dayan, and D. Simberloff. 2005. Variability and sexual
size dimorphism in carnivores: testing the niche variation hy-pothesis. Ecology 86:1432–1440.
———. 2007. Guild composition and mustelid morphology: char-acter displacement but no character release. Journal of Biogeog-raphy 34:2148–2158.
Mesquita, D. O., G. R. Colli, and L. J. Vitt. 2007. Ecological releasein lizard assemblages of Neotropical savannas. Oecologia (Berlin)153:185–195.
Nascimento, F. P., T. C. S. Avila-Pires, and O. R. Cunha. 1987. Osrepteis da area de Carajas, Para, Brasil (Squamata). Boletim doMuseu Paraense Emılio Goeldi, NS, Zoologia 3:33–65.
———. 1988. Repteis Squamata de Rondonia e Mato Grosso col-etados atraves do Programa Polonoroeste. Boletim do Museu Par-aense Emılio Goeldi, NS, Zoologia 4:21–66.
Oliveira, P. S., and R. J. Marquis. 2002. The Cerrados of Brazil:ecology and natural history of a Neotropical savanna. ColumbiaUniversity Press, New York.
Patterson, B. D. 1983. Grasshopper mandibles and the niche variationhypothesis. Evolution 37:375–388.
Pearson, D., R. Shine, and A. Williams. 2002. Geographic variationin sexual size dimorphism within a single snake species (Moreliaspilota, Pythonidae). Oecologia (Berlin) 131:418–426.
Pianka, E. R. 1994. Evolutionary ecology. Harper Collins, New York.Poe, S. 2004. Phylogeny of anoles. Herpetological Monographs 18:
37–89.Prance, G. T. 1996. Islands in Amazonia. Philosophical Transactions
of the Royal Society B: Biological Sciences 351:823–833.Purvis, A., and A. Rambaut. 1995. Comparative analysis by inde-
pendent contrasts (CAIC): an Apple Macintosh application foranalysing comparative data. Computer Applications in Biosciences11:247–251.
Ratter, J., J. Ribeiro, and S. Bridgewater. 1997. The Brazilian Cerradovegetation and threats to its biodiversity. Annals of Botany 80:223–230.
Ricklefs, R. E., and G. L. Miller. 1999. Ecology. 4th ed. W. H. Freeman,New York.
Roelke, D., and Y. Buyukates. 2001. The diversity of harmful algalbloom-triggering mechanisms and the complexity of bloom ini-tiation. Human and Ecological Risk Assessment 7:1347–1362.
Rothstein, S. I. 1973. The niche variation model: is it valid? AmericanNaturalist 107:598–620.
Roughgarden, J. 1979. Theory of population genetics and evolution-ary ecology: an introduction. Macmillan, New York.
Scheffer, M., and E. H. van Nes. 2006. Self-organized similarity, theevolutionary emergence of groups of similar species. Proceedingsof the National Academy of Sciences of the USA 103:6230–6235.
Schoener, T. W. 1983. Field experiments on interspecific competition.American Naturalist 122:240–285.
Shine, R. 1989. Ecological causes for the evolution of sexual dimor-phism: a review of the evidence. Quarterly Review of Biology 64:419–461.
Silva, J. M. C., and J. M. Bates. 2002. Biogeographic patterns andconservation in the South American Cerrado: a tropical savannahotspot. BioScience 52:225–233.
Simberloff, D., T. Dayan, C. Jones, and G. Ogura. 2000. Characterdisplacement and release in the small Indian mongoose, Herpestesjavanicus. Ecology 81:2086–2099.
Soule, M., and B. R. Stewart. 1970. The “niche variation” hypothesis:a test and alternatives. American Naturalist 104:85–97.
Torres, N. M., and J. A. F. Diniz-Filho. 2004. Phylogenetic autocor-relation and evolutionary diversity of carnivora (Mammalia) inconservation units of the New World. Genetics and MolecularBiology 27:511–516.
Van der Hammen, T., and M. L. Absy. 1994. Amazonia during thelast glacial. Palaeogeography, Palaeoclimatology, Palaeoecology109:247–261.
Van Valen, L. 1965. Morphological variation and width of ecologicalniche. American Naturalist 99:377–389.
Vanzolini, P. E. 1986. Levantamento herpetologico da area do Estadode Rondonia sob a influencia da Rodovia BR 364. Conselho Na-cional do Desenvolvimento Cientıfico e Tecnologico, Distrito Fed-eral, Brasılia.
Vezina, A. F. 1985. Empirical relationships between predator andprey size among terrestrial vertebrate predators. Oecologia (Berlin)67:555–565.
Webb, C. O., D. D. Ackerly, and S. W. Kembel. 2007. Phylocom:software for the analysis of community phylogenetic structureand trait evolution. Version 3.41. http://www.phylodiversity.net/phylocom/.
Whittaker, R. J. 1998. Island biogeography: ecology, evolution, andconservation. Oxford University Press, Oxford.
Associate Editor: Daniel RoelkeEditor: Monica Geber