‘next-base’ effect on pcr amplification
TRANSCRIPT
JOBNAME: No Job Name PAGE: 1 SESS: 8 OUTPUT: Wed Dec 7 17:01:47 2011 SUM: D2AD605F/v2451/blackwell/journals/emi4_v0_i0/emi4_318
‘Next-base’ effect on PCR amplificationemi4_318 1..7
Eitan Ben-Dov,1,2† Orr H. Shapiro1† andAriel Kushmaro1,3*1Department of Biotechnology Engineering, Ben-GurionUniversity of the Negev, PO Box 653, Be’er Sheva84105, Israel.2Achva Academic College MP Shikmim, 79800, Israel.3National Institute for Biotechnology in the Negev,Ben-Gurion University of the Negev, PO Box 653,Be’er-Sheva 84105, Israel.
Summary
The base adjacent to the 3� end of universal PCRprimers targeting the 16S rRNA gene is often variableand apparently biases the microbial community com-position as represented by PCR-based surveys. Totest this hypothesis, four templates of 44 bases eachand two complementary primers (21 bases) weredesigned to differ only in the bases adjacent to theprimers, and their amplification efficiencies wereevaluated using quantitative PCR. For extension tem-peratures of 72°C, 73°C and 74°C, improvement ininitial amplification efficiency was observed for tem-plates with guanine or cytosine at the position con-tiguous to the primers. However, no clear preferencewas observed when extension temperature waslowered to 70°C. Shortening the primers by one base,so that the variable position was located two basepairs downstream from the primer, attenuated but didnot eliminate this bias. A conformational change ofthe quaternary polymerase – primer – template –dNTP complex upon commencing of polymerizationis thought to be a rate-limiting step. A possible expla-nation for the observed bias is the stabilization of thiscomplex by the adjacent guanine or cytosine. Reduc-ing PCR extension temperature to 70°C minimizesamplification biases caused by variable template-contiguous bases to the 3� end of universal PCRprimers. Next-base nucleotide composition should betaken in consideration in designing primers targeting16S rRNA or other functional genes used in microbialecology studies.
Introduction
PCR amplification of 16S rRNA genes is biased at almostevery step: DNA extraction, selection of primers and theamplification itself (Suzuki and Giovannoni, 1996; Hansenet al., 1998; Polz and Cavanaugh, 1998; Martin-Laurentet al., 2001). It can occur because the DNA of differentbacterial species contains segments outside the templateregion that inhibit the initial phase of the PCR to varyingdegrees (Hansen et al., 1998) and the primer annealing tothe template (Suzuki and Giovannoni, 1996). Single inter-nal primer – template mismatch can also affect the PCRextension efficiency depending on proximity to the primer3′ end and type of the mismatch (Bru et al., 2008; Wuet al., 2009). Inosine substitutions at the internal selectedpositions display variable results that depend on differentbase pairing (Wu et al., 2009). At the 3′-ultimate positionof 16S rRNA universal primers, inosine substitutionenables specific PCR amplification and increases thediversity of PCR amplicons, as compared with non-modified primers (Ben-Dov et al., 2006), but biased effectof adjacent nucleotide to the 3′ end of the primer was alsoobserved (Brands et al., 2010; Ben-Dov et al., 2011).
Results and discussion
Here, we studied the dependence of PCR extension effi-ciency on different template-contiguous bases at the 3′end of the primers, which is termed ‘next-base effect’. Toassess the impact of different template-contiguous basesto the 3′ end of the primer, four short (44 bases) oligo-templates were designed that differ only at the base adja-cent to the primers (Table 1). Each pair of primers (21F-Aand 21R-A; Table 1) was designed so that for each of thefour oligo-templates the same first nucleotide will be incor-porated to each forward and reverse primer through PCR.In addition, both of the primers had the same GC-contentand all four oligo-templates designed to be identical infree energy of secondary structures (predicted/calculatedin http://www.genebee.msu.su/services/rna2reduced.html) to avoid biased PCR amplification (Polz andCavanaugh, 1998). Amplification efficiency of the fourtemplates was measured by quantitative PCR (qPCR) atdifferent concentrations (2.5, 0.25 and 0.025 nM) andextension temperatures (70°C, 72°C, 73°C and 74°C)(Table 2; Fig. 1), and a possible way to overcome biasednext-base effect was suggested.
Initial amplification efficiencies of the oligo-templatesevaluated by quantitative cycle (Cq) value were
Received 13 June, 2011; revised 17 November, 2011; accepted 25November, 2011. *For correspondence. E-mail [email protected];Tel. (+972) 8647 9024; Fax (+972) 8647 2983. †These authors con-tributed equally to the manuscript.
11
emi4_318
Environmental Microbiology Reports (2011) doi:10.1111/j.1758-2229.2011.00318.x
© 2011 Society for Applied Microbiology and Blackwell Publishing Ltd
1
2
3
4
5
6
7
8
9
10
11
12
131415
16
17
18
19
20
21
22
23
24
25
26
27
28
29
30
31
32
33
34
35
36
37
38
39
40
41
42
43
44
45
46474849
505152
53
54
55
56
57
58
59
60
61
62
63
64
65
66
67
68
69
70
71
72
73
747576
77
78
79
80
81
82
83
84
85
86
87
88
89
90
91
92
93
94
95
96
97
98
JOBNAME: No Job Name PAGE: 2 SESS: 8 OUTPUT: Wed Dec 7 17:01:47 2011 SUM: C3DB0E1C/v2451/blackwell/journals/emi4_v0_i0/emi4_318
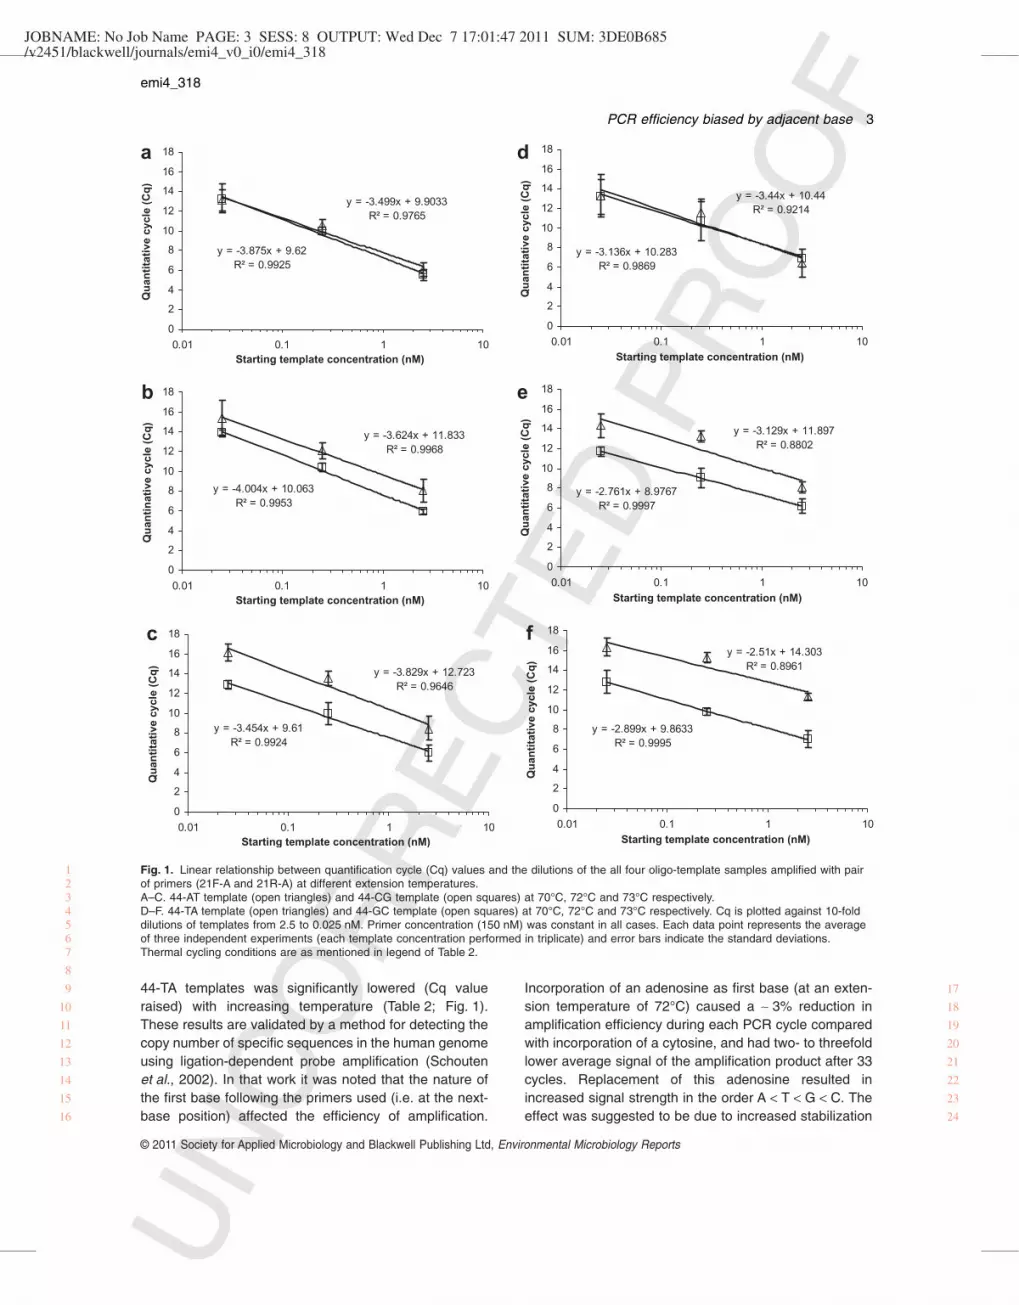
significantly improved at extension temperatures between72°C and 74°C when the first incorporated base wasguanine (44-GC template) or cytosine (44-CG template) incomparison to adenosine (44-AT template) or thymidine(44-TA template) (Table 2; Fig. 1). Average ratio of the Cqvalue between A/T (44-AT + 44-TA) templates and C/G(44-CG + 44-GC) templates dropped from 2.6-fold at74°C, to 1.2-fold at 72°C. No clear preference wasobserved at extension temperature of 70°C (Table 2;Fig. 1). Lower templates concentration (0.0025 nM)returned inconclusive results due to higher standarddeviations (Table 2). Poor linearity of Cq values across
dilution series might be caused by too high or too lowtemplate copy number present in assays as mentioned byqPCR troubleshooting guides. Evaluating the qPCRassay with too little template will give inconsistent resultsbecause it is beyond the limit of detection for the assay(Gundry and Poulson, 2011). As expected, Cq value con-tinuously increased for all four templates when their con-centrations were lowered. Conversely, initial amplificationefficiency as measured by Cq value for 44-CG and 44-GCtemplates remained constant at different extension tem-peratures (for each given template concentration)whereas the initial amplification efficiency for 44-AT and
Table 1. Primers and oligonucleotides templates used for the amplification.
Primer/tamplatea Sequence (5′–3′)b
20F-T AGCATGACAAGTCTGATGGT20R-T TCGAAGGATCCAGACTAGTT21F-A AGCATGACAAGTCTGATGGTA21R-A TCGAAGGATCCAGACTAGTTA120-F AGACTGACGAGTCTGATAGTA120-R TCGAAGGATCCAGACTAGTTA44-AT AGCATGACAAGTCTGATGGTAATTAACTAGTCTGGATCCTTCGA44-TA AGCATGACAAGTCTGATGGTATATAACTAGTCTGGATCCTTCGA44-CG AGCATGACAAGTCTGATGGTACGTAACTAGTCTGGATCCTTCGA44-GC AGCATGACAAGTCTGATGGTAGCTAACTAGTCTGGATCCTTCGA120-TA AGACTGACGAGTCTGATAGTATATCAGATTGAACGCTGGCGGC
AGGCCTGGATCCTGCAAGTCGAACGGTAACAGGAAGAAGCTTGCTTCTTTGCTGTATAACTAGTCTGGATCCTTCGA
120-GC AGACTGACGAGTCTGATAGTAGATCAGATTGAACGCTGGCGGCAGGCCTGGATCCTGCAAGTCGAACGGTAACAGGAAGAAGCTTGCTTCTTTGCTGTCTAACTAGTCTGGATCCTTCGA
a. F and R correspond to forward and reverse primers respectively.b. Different bases in oligo-templates are marked in bold.
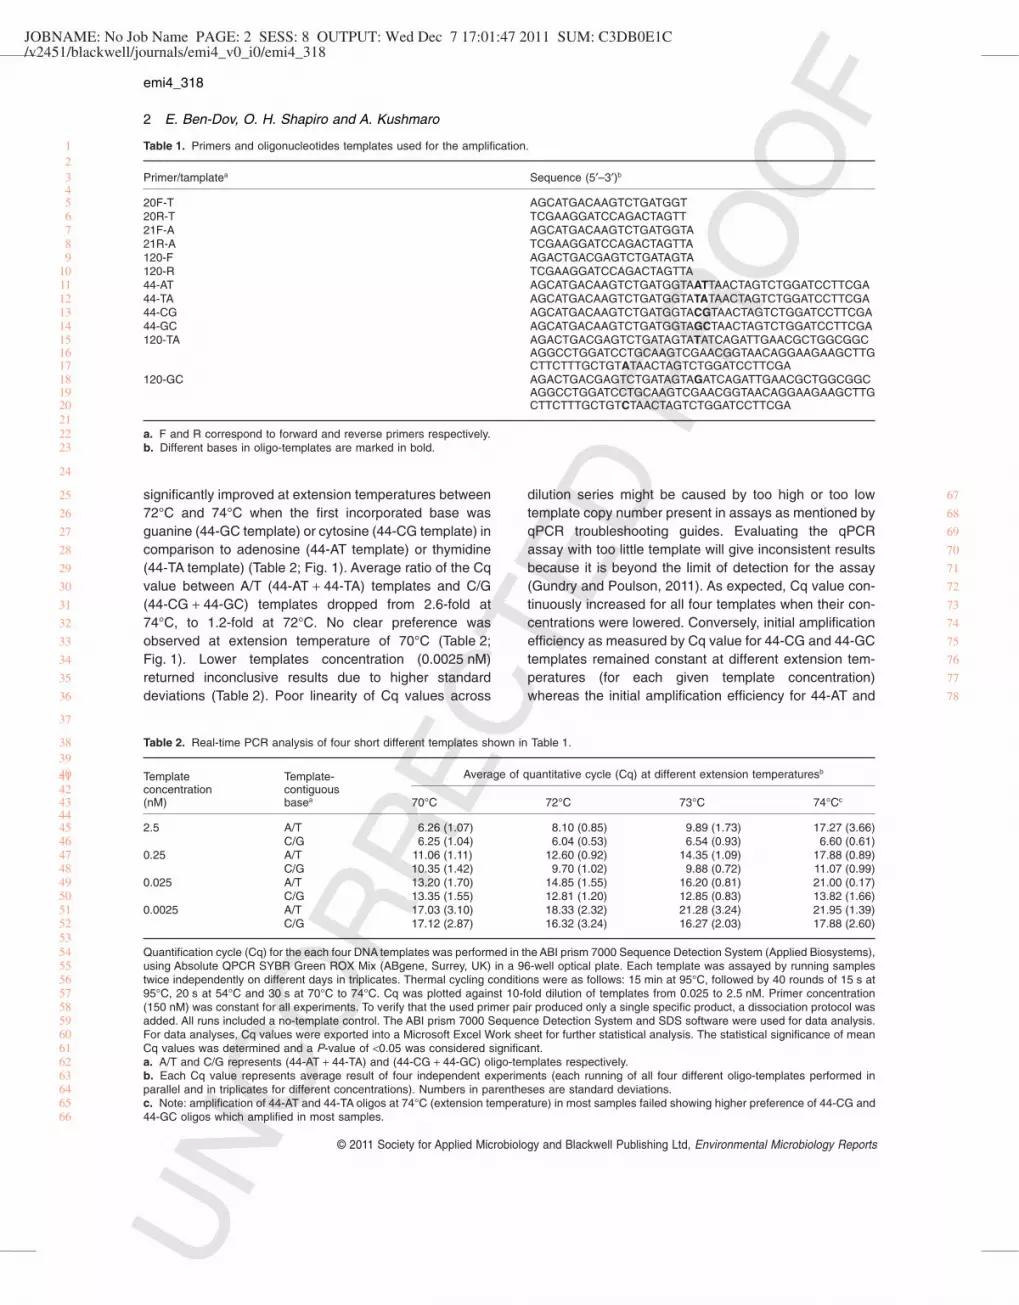
Table 2. Real-time PCR analysis of four short different templates shown in Table 1.
Templateconcentration(nM)
Template-contiguousbasea
Average of quantitative cycle (Cq) at different extension temperaturesb
70°C 72°C 73°C 74°Cc
2.5 A/T 6.26 (1.07) 8.10 (0.85) 9.89 (1.73) 17.27 (3.66)C/G 6.25 (1.04) 6.04 (0.53) 6.54 (0.93) 6.60 (0.61)
0.25 A/T 11.06 (1.11) 12.60 (0.92) 14.35 (1.09) 17.88 (0.89)C/G 10.35 (1.42) 9.70 (1.02) 9.88 (0.72) 11.07 (0.99)
0.025 A/T 13.20 (1.70) 14.85 (1.55) 16.20 (0.81) 21.00 (0.17)C/G 13.35 (1.55) 12.81 (1.20) 12.85 (0.83) 13.82 (1.66)
0.0025 A/T 17.03 (3.10) 18.33 (2.32) 21.28 (3.24) 21.95 (1.39)C/G 17.12 (2.87) 16.32 (3.24) 16.27 (2.03) 17.88 (2.60)
Quantification cycle (Cq) for the each four DNA templates was performed in the ABI prism 7000 Sequence Detection System (Applied Biosystems),using Absolute QPCR SYBR Green ROX Mix (ABgene, Surrey, UK) in a 96-well optical plate. Each template was assayed by running samplestwice independently on different days in triplicates. Thermal cycling conditions were as follows: 15 min at 95°C, followed by 40 rounds of 15 s at95°C, 20 s at 54°C and 30 s at 70°C to 74°C. Cq was plotted against 10-fold dilution of templates from 0.025 to 2.5 nM. Primer concentration(150 nM) was constant for all experiments. To verify that the used primer pair produced only a single specific product, a dissociation protocol wasadded. All runs included a no-template control. The ABI prism 7000 Sequence Detection System and SDS software were used for data analysis.For data analyses, Cq values were exported into a Microsoft Excel Work sheet for further statistical analysis. The statistical significance of meanCq values was determined and a P-value of <0.05 was considered significant.a. A/T and C/G represents (44-AT + 44-TA) and (44-CG + 44-GC) oligo-templates respectively.b. Each Cq value represents average result of four independent experiments (each running of all four different oligo-templates performed inparallel and in triplicates for different concentrations). Numbers in parentheses are standard deviations.c. Note: amplification of 44-AT and 44-TA oligos at 74°C (extension temperature) in most samples failed showing higher preference of 44-CG and44-GC oligos which amplified in most samples.
123456789
1011121314151617181920212223
24
25
26
27
28
29
30
31
32
33
34
35
36
37
3839404142434445464748495051525354555657585960616263646566
67
68
69
70
71
72
73
74
75
76
77
78
emi4_318
2 E. Ben-Dov, O. H. Shapiro and A. Kushmaro
© 2011 Society for Applied Microbiology and Blackwell Publishing Ltd, Environmental Microbiology Reports
JOBNAME: No Job Name PAGE: 3 SESS: 8 OUTPUT: Wed Dec 7 17:01:47 2011 SUM: 3DE0B685/v2451/blackwell/journals/emi4_v0_i0/emi4_318
44-TA templates was significantly lowered (Cq valueraised) with increasing temperature (Table 2; Fig. 1).These results are validated by a method for detecting thecopy number of specific sequences in the human genomeusing ligation-dependent probe amplification (Schoutenet al., 2002). In that work it was noted that the nature ofthe first base following the primers used (i.e. at the next-base position) affected the efficiency of amplification.
Incorporation of an adenosine as first base (at an exten-sion temperature of 72°C) caused a ~ 3% reduction inamplification efficiency during each PCR cycle comparedwith incorporation of a cytosine, and had two- to threefoldlower average signal of the amplification product after 33cycles. Replacement of this adenosine resulted inincreased signal strength in the order A < T < G < C. Theeffect was suggested to be due to increased stabilization
y = -3.499x + 9.9033R² = 0.9765
y = -3.875x + 9.62R² = 0.9925
0
2
4
6
8
10
12
14
16
18
0.01 0.1 1 10Starting template concentration (nM)
Qu
anti
tati
ve c
ycle
(C
q)
a
y = -3.44x + 10.44R² = 0.9214
y = -3.136x + 10.283R² = 0.9869
0
2
4
6
8
10
12
14
16
18
0.01 0.1 1 10
Starting template concentration (nM)
Qu
anti
tati
ve c
ycle
(C
q)
d
y = -3.624x + 11.833R² = 0.9968
y = -4.004x + 10.063R² = 0.9953
0
2
4
6
8
10
12
14
16
18
0.01 0.1 1 10Starting template concentration (nM)
Qu
anti
nat
ive
cycl
e (C
q)
b
y = -3.129x + 11.897R² = 0.8802
y = -2.761x + 8.9767R² = 0.9997
0
2
4
6
8
10
12
14
16
18
0.01 0.1 1 10
Starting template concentration (nM)
Qu
anti
tati
ve c
ycle
(C
q)
e
y = -3.829x + 12.723R² = 0.9646
y = -3.454x + 9.61R² = 0.9924
0
2
4
6
8
10
12
14
16
18
0.01 0.1 1 10Starting template concentration (nM)
Qu
anti
tati
ve c
ycle
(C
q)
cy = -2.51x + 14.303
R² = 0.8961
y = -2.899x + 9.8633R² = 0.9995
0
2
4
6
8
10
12
14
16
18
0.01 0.1 1 10Starting template concentration (nM)
Qu
anti
tati
ve c
ycle
(C
q)
f
Fig. 1. Linear relationship between quantification cycle (Cq) values and the dilutions of the all four oligo-template samples amplified with pairof primers (21F-A and 21R-A) at different extension temperatures.A–C. 44-AT template (open triangles) and 44-CG template (open squares) at 70°C, 72°C and 73°C respectively.D–F. 44-TA template (open triangles) and 44-GC template (open squares) at 70°C, 72°C and 73°C respectively. Cq is plotted against 10-folddilutions of templates from 2.5 to 0.025 nM. Primer concentration (150 nM) was constant in all cases. Each data point represents the averageof three independent experiments (each template concentration performed in triplicate) and error bars indicate the standard deviations.Thermal cycling conditions are as mentioned in legend of Table 2.
1234567
8
9
10
11
12
13
14
15
16
17
18
19
20
21
22
23
24
emi4_318
PCR efficiency biased by adjacent base 3
© 2011 Society for Applied Microbiology and Blackwell Publishing Ltd, Environmental Microbiology Reports
JOBNAME: No Job Name PAGE: 4 SESS: 8 OUTPUT: Wed Dec 7 17:01:47 2011 SUM: C184F9F9/v2451/blackwell/journals/emi4_v0_i0/emi4_318
of annealed primers by elongation with a C or G as com-pared with the incorporation of an A. Primers that are notsufficiently elongated will be melted during the transitionfrom annealing temperature to the elongation tempera-ture, but might also be more easily displaced by thecomplementary strand (Schouten et al., 2002).
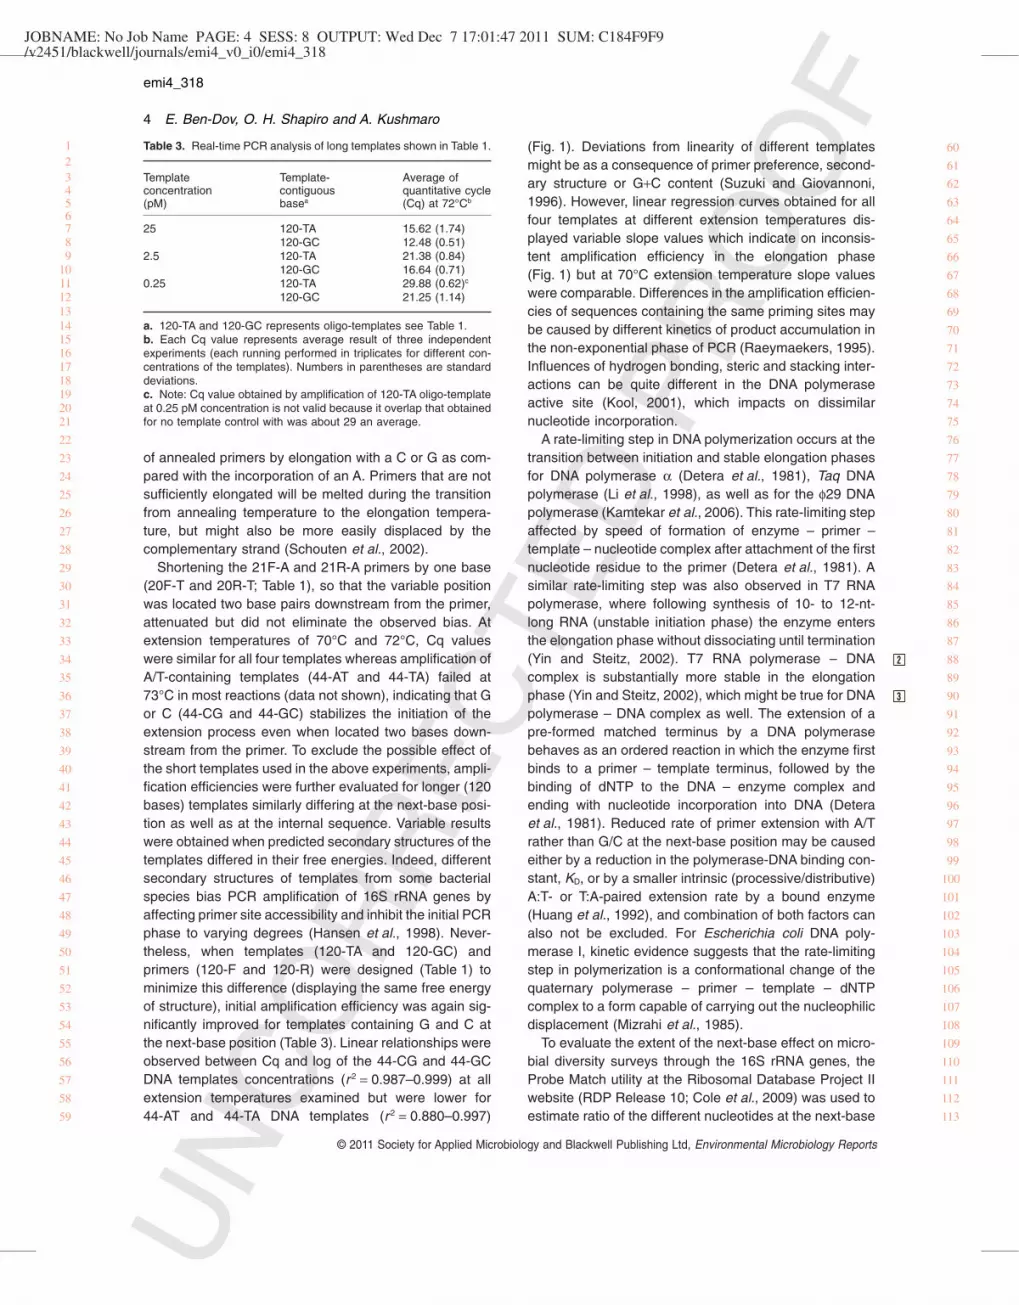
Shortening the 21F-A and 21R-A primers by one base(20F-T and 20R-T; Table 1), so that the variable positionwas located two base pairs downstream from the primer,attenuated but did not eliminate the observed bias. Atextension temperatures of 70°C and 72°C, Cq valueswere similar for all four templates whereas amplification ofA/T-containing templates (44-AT and 44-TA) failed at73°C in most reactions (data not shown), indicating that Gor C (44-CG and 44-GC) stabilizes the initiation of theextension process even when located two bases down-stream from the primer. To exclude the possible effect ofthe short templates used in the above experiments, ampli-fication efficiencies were further evaluated for longer (120bases) templates similarly differing at the next-base posi-tion as well as at the internal sequence. Variable resultswere obtained when predicted secondary structures of thetemplates differed in their free energies. Indeed, differentsecondary structures of templates from some bacterialspecies bias PCR amplification of 16S rRNA genes byaffecting primer site accessibility and inhibit the initial PCRphase to varying degrees (Hansen et al., 1998). Never-theless, when templates (120-TA and 120-GC) andprimers (120-F and 120-R) were designed (Table 1) tominimize this difference (displaying the same free energyof structure), initial amplification efficiency was again sig-nificantly improved for templates containing G and C atthe next-base position (Table 3). Linear relationships wereobserved between Cq and log of the 44-CG and 44-GCDNA templates concentrations (r 2 = 0.987–0.999) at allextension temperatures examined but were lower for44-AT and 44-TA DNA templates (r 2 = 0.880–0.997)
(Fig. 1). Deviations from linearity of different templatesmight be as a consequence of primer preference, second-ary structure or G+C content (Suzuki and Giovannoni,1996). However, linear regression curves obtained for allfour templates at different extension temperatures dis-played variable slope values which indicate on inconsis-tent amplification efficiency in the elongation phase(Fig. 1) but at 70°C extension temperature slope valueswere comparable. Differences in the amplification efficien-cies of sequences containing the same priming sites maybe caused by different kinetics of product accumulation inthe non-exponential phase of PCR (Raeymaekers, 1995).Influences of hydrogen bonding, steric and stacking inter-actions can be quite different in the DNA polymeraseactive site (Kool, 2001), which impacts on dissimilarnucleotide incorporation.
A rate-limiting step in DNA polymerization occurs at thetransition between initiation and stable elongation phasesfor DNA polymerase a (Detera et al., 1981), Taq DNApolymerase (Li et al., 1998), as well as for the f29 DNApolymerase (Kamtekar et al., 2006). This rate-limiting stepaffected by speed of formation of enzyme – primer –template – nucleotide complex after attachment of the firstnucleotide residue to the primer (Detera et al., 1981). Asimilar rate-limiting step was also observed in T7 RNApolymerase, where following synthesis of 10- to 12-nt-long RNA (unstable initiation phase) the enzyme entersthe elongation phase without dissociating until termination(Yin and Steitz, 2002). T7 RNA polymerase – DNAcomplex is substantially more stable in the elongationphase (Yin and Steitz, 2002), which might be true for DNApolymerase – DNA complex as well. The extension of apre-formed matched terminus by a DNA polymerasebehaves as an ordered reaction in which the enzyme firstbinds to a primer – template terminus, followed by thebinding of dNTP to the DNA – enzyme complex andending with nucleotide incorporation into DNA (Deteraet al., 1981). Reduced rate of primer extension with A/Trather than G/C at the next-base position may be causedeither by a reduction in the polymerase-DNA binding con-stant, KD, or by a smaller intrinsic (processive/distributive)A:T- or T:A-paired extension rate by a bound enzyme(Huang et al., 1992), and combination of both factors canalso not be excluded. For Escherichia coli DNA poly-merase I, kinetic evidence suggests that the rate-limitingstep in polymerization is a conformational change of thequaternary polymerase – primer – template – dNTPcomplex to a form capable of carrying out the nucleophilicdisplacement (Mizrahi et al., 1985).
To evaluate the extent of the next-base effect on micro-bial diversity surveys through the 16S rRNA genes, theProbe Match utility at the Ribosomal Database Project IIwebsite (RDP Release 10; Cole et al., 2009) was used toestimate ratio of the different nucleotides at the next-base
Table 3. Real-time PCR analysis of long templates shown in Table 1.
Templateconcentration(pM)
Template-contiguousbasea
Average ofquantitative cycle(Cq) at 72°Cb
25 120-TA 15.62 (1.74)120-GC 12.48 (0.51)
2.5 120-TA 21.38 (0.84)120-GC 16.64 (0.71)
0.25 120-TA 29.88 (0.62)c
120-GC 21.25 (1.14)
a. 120-TA and 120-GC represents oligo-templates see Table 1.b. Each Cq value represents average result of three independentexperiments (each running performed in triplicates for different con-centrations of the templates). Numbers in parentheses are standarddeviations.c. Note: Cq value obtained by amplification of 120-TA oligo-templateat 0.25 pM concentration is not valid because it overlap that obtainedfor no template control with was about 29 an average.
123456789
101112131415161718192021
22
23
24
25
26
27
28
29
30
31
32
33
34
35
36
37
38
39
40
41
42
43
44
45
46
47
48
49
50
51
52
53
54
55
56
57
58
59
60
61
62
63
64
65
66
67
68
69
70
71
72
73
74
75
76
77
78
79
80
81
82
83
84
85
86
87
88
89
90
91
92
93
94
95
96
97
98
99
100
101
102
103
104
105
106
107
108
109
110
111
112
113
22
33
emi4_318
4 E. Ben-Dov, O. H. Shapiro and A. Kushmaro
© 2011 Society for Applied Microbiology and Blackwell Publishing Ltd, Environmental Microbiology Reports
JOBNAME: No Job Name PAGE: 5 SESS: 8 OUTPUT: Wed Dec 7 17:01:47 2011 SUM: 198B6F42/v2451/blackwell/journals/emi4_v0_i0/emi4_318
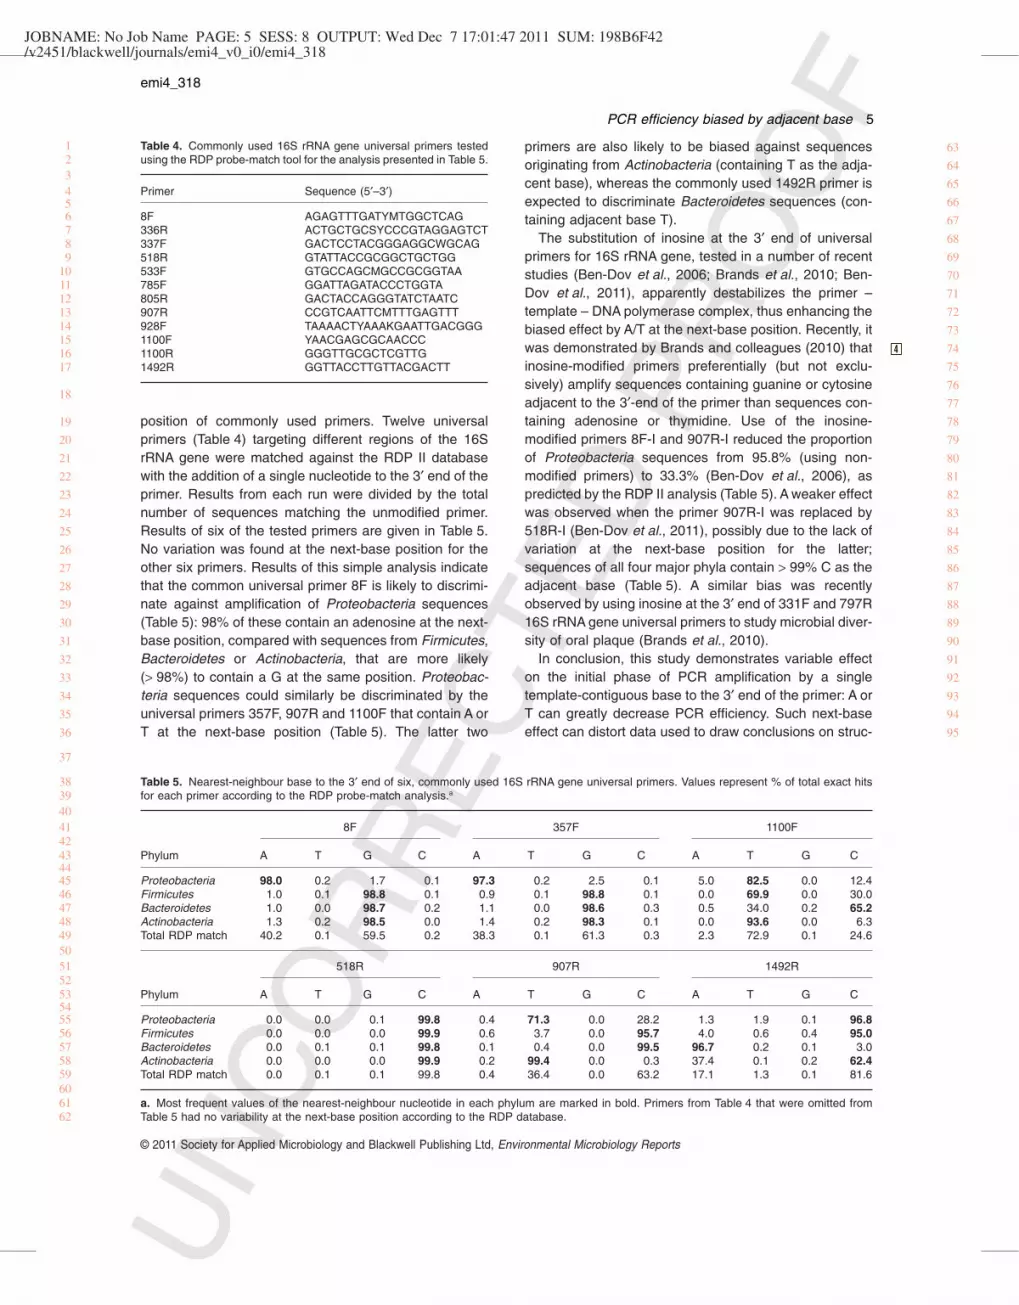
position of commonly used primers. Twelve universalprimers (Table 4) targeting different regions of the 16SrRNA gene were matched against the RDP II databasewith the addition of a single nucleotide to the 3′ end of theprimer. Results from each run were divided by the totalnumber of sequences matching the unmodified primer.Results of six of the tested primers are given in Table 5.No variation was found at the next-base position for theother six primers. Results of this simple analysis indicatethat the common universal primer 8F is likely to discrimi-nate against amplification of Proteobacteria sequences(Table 5): 98% of these contain an adenosine at the next-base position, compared with sequences from Firmicutes,Bacteroidetes or Actinobacteria, that are more likely(> 98%) to contain a G at the same position. Proteobac-teria sequences could similarly be discriminated by theuniversal primers 357F, 907R and 1100F that contain A orT at the next-base position (Table 5). The latter two
primers are also likely to be biased against sequencesoriginating from Actinobacteria (containing T as the adja-cent base), whereas the commonly used 1492R primer isexpected to discriminate Bacteroidetes sequences (con-taining adjacent base T).
The substitution of inosine at the 3′ end of universalprimers for 16S rRNA gene, tested in a number of recentstudies (Ben-Dov et al., 2006; Brands et al., 2010; Ben-Dov et al., 2011), apparently destabilizes the primer –template – DNA polymerase complex, thus enhancing thebiased effect by A/T at the next-base position. Recently, itwas demonstrated by Brands and colleagues (2010) thatinosine-modified primers preferentially (but not exclu-sively) amplify sequences containing guanine or cytosineadjacent to the 3′-end of the primer than sequences con-taining adenosine or thymidine. Use of the inosine-modified primers 8F-I and 907R-I reduced the proportionof Proteobacteria sequences from 95.8% (using non-modified primers) to 33.3% (Ben-Dov et al., 2006), aspredicted by the RDP II analysis (Table 5). A weaker effectwas observed when the primer 907R-I was replaced by518R-I (Ben-Dov et al., 2011), possibly due to the lack ofvariation at the next-base position for the latter;sequences of all four major phyla contain > 99% C as theadjacent base (Table 5). A similar bias was recentlyobserved by using inosine at the 3′ end of 331F and 797R16S rRNA gene universal primers to study microbial diver-sity of oral plaque (Brands et al., 2010).
In conclusion, this study demonstrates variable effecton the initial phase of PCR amplification by a singletemplate-contiguous base to the 3′ end of the primer: A orT can greatly decrease PCR efficiency. Such next-baseeffect can distort data used to draw conclusions on struc-
Table 4. Commonly used 16S rRNA gene universal primers testedusing the RDP probe-match tool for the analysis presented in Table 5.
Primer Sequence (5′–3′)
8F AGAGTTTGATYMTGGCTCAG336R ACTGCTGCSYCCCGTAGGAGTCT337F GACTCCTACGGGAGGCWGCAG518R GTATTACCGCGGCTGCTGG533F GTGCCAGCMGCCGCGGTAA785F GGATTAGATACCCTGGTA805R GACTACCAGGGTATCTAATC907R CCGTCAATTCMTTTGAGTTT928F TAAAACTYAAAKGAATTGACGGG1100F YAACGAGCGCAACCC1100R GGGTTGCGCTCGTTG1492R GGTTACCTTGTTACGACTT
Table 5. Nearest-neighbour base to the 3′ end of six, commonly used 16S rRNA gene universal primers. Values represent % of total exact hitsfor each primer according to the RDP probe-match analysis.a
Phylum
8F 357F 1100F
A T G C A T G C A T G C
Proteobacteria 98.0 0.2 1.7 0.1 97.3 0.2 2.5 0.1 5.0 82.5 0.0 12.4Firmicutes 1.0 0.1 98.8 0.1 0.9 0.1 98.8 0.1 0.0 69.9 0.0 30.0Bacteroidetes 1.0 0.0 98.7 0.2 1.1 0.0 98.6 0.3 0.5 34.0 0.2 65.2Actinobacteria 1.3 0.2 98.5 0.0 1.4 0.2 98.3 0.1 0.0 93.6 0.0 6.3Total RDP match 40.2 0.1 59.5 0.2 38.3 0.1 61.3 0.3 2.3 72.9 0.1 24.6
Phylum
518R 907R 1492R
A T G C A T G C A T G C
Proteobacteria 0.0 0.0 0.1 99.8 0.4 71.3 0.0 28.2 1.3 1.9 0.1 96.8Firmicutes 0.0 0.0 0.0 99.9 0.6 3.7 0.0 95.7 4.0 0.6 0.4 95.0Bacteroidetes 0.0 0.1 0.1 99.8 0.1 0.4 0.0 99.5 96.7 0.2 0.1 3.0Actinobacteria 0.0 0.0 0.0 99.9 0.2 99.4 0.0 0.3 37.4 0.1 0.2 62.4Total RDP match 0.0 0.1 0.1 99.8 0.4 36.4 0.0 63.2 17.1 1.3 0.1 81.6
a. Most frequent values of the nearest-neighbour nucleotide in each phylum are marked in bold. Primers from Table 4 that were omitted fromTable 5 had no variability at the next-base position according to the RDP database.
123456789
1011121314151617
18
19
20
21
22
23
24
25
26
27
28
29
30
31
32
33
34
35
36
37
38394041424344454647484950515253545556575859606162
63
64
65
66
67
68
69
70
71
72
73
74
75
76
77
78
79
80
81
82
83
84
85
86
87
88
89
90
91
92
93
94
95
44
emi4_318
PCR efficiency biased by adjacent base 5
© 2011 Society for Applied Microbiology and Blackwell Publishing Ltd, Environmental Microbiology Reports

JOBNAME: No Job Name PAGE: 6 SESS: 8 OUTPUT: Wed Dec 7 17:01:47 2011 SUM: 70D68937/v2451/blackwell/journals/emi4_v0_i0/emi4_318
tures of microbial communities in a PCR-based approach,due to bias in the estimation of the relative proportionsbetween groups possessing different template-contiguous bases to the 3′ end primers. These differencescould also bias qPCR assays by leading to underestimatethe actual gene copy number, if sequences containing Aor T are measured against sequences containing G or Cat the next-base position and vice-versa. These findingsshould be taken into consideration when conducting PCR-based microbial diversity surveys using universal primerstargeting the 16S rRNA gene or other genes for whichsimilar data may be available. A simple way to attenuatethis bias for existing primers is by reducing the extensiontemperature from the commonly used 72°C to 70°C inPCR and qPCR amplifications. In addition, a preferableapproach could be to shorten the 3′ end of the known 16SrRNA gene primers by one or even two bases (extendingthe 5′ end if necessary to preserve an appropriate meltingtemperature) so that a highly conserved next-base posi-tion is created. Finally, composition of bases adjacent tothe primers should be taken in consideration whendesigning new universal PCR primers.
Acknowledgements
This investigation was supported by a grant (WT-901) fromthe BMBF-MOST Cooperation in Water Technologies and byLevi Eshkol scholarships (to O.H.S.) from the Israeli Ministryof Science, Culture and Sports. We thank Professor AriehZaritsky for critical reading of this manuscript.
References
Ben-Dov, E., Shapiro, O.H., Siboni, N., and Kushmaro, A.(2006) Advantage of using inosine at the 3′ termini of 16SrRNA gene universal primers for the study of microbialdiversity. Appl Environ Microbiol 72: 6902–6906.
Ben-Dov, E., Siboni, N., Shapiro, O.H., Arotsker, L., andKushmaro, A. (2011) Substitution by inosine at the3′-ultimate and penultimate positions of 16S rRNA geneuniversal primers. Microb Ecol 61: 1–6.
Brands, B., Vianna, M.E., Seyfarth, I., Conrads, G., and Horz,H.-P. (2010) Complementary retrieval of 16S rRNA genesequences using broad-range primers with inosine at the3′-terminus: implications for the study of microbial diversity.FEMS Microbiol Ecol 71: 157–167.
Bru, D., Martin-Laurent, F., and Philippot, L. (2008) Quantifi-cation of the detrimental effect of a single primer – templatemismatch by real-time PCR using the 16S rRNA gene asan example. Appl Environ Microbiol 74: 1660–1663.
Cole, J.R., Wang, Q., Cardenas, E., Fish, J., Chai, B., Farris,R.J., et al. (2009) The Ribosomal Database Project:
improved alignments and new tools for rRNA analysis.Nucleic Acids Res 37: D141–D145.
Detera, S.D., Becerra, S.P., Swack, J.A., and Wilson, S.H.(1981) Studies on the Mechanism of DNA Polymerase a.J Biol Chem 256: 6933–6943.
Gundry, C.N., and Poulson, M.D. (2011) Obtaining maximumPCR sensitivity and specificity. In PCR Troubleshootingand Optimization: The Essential Guide. Kennedy, S., andOswald, N. (eds). Norfolk, UK: Caister Academic Press, pp.79–96.
Hansen, M.C., Tolker-Neilson, T., Givskov, M., and Molin, S.(1998) Biased 16S rDNA PCR amplification caused byinterference from DNA flanking template region. FEMSMicrobiol Ecol 26: 141–149.
Huang, M.M., Arnheim, N., and Goodman, M.F. (1992) Exten-sion of base mispairs by Taq DNA polymerase: implicationsfor single nucleotide discrimination in PCR. Nucleic AcidsRes 20: 4567–4573.
Kamtekar, S., Berman, A.J., Wang, J., Lázaro, J.M., de Vega,M., Blanco, L., et al. (2006) The f29 DNA polymerase:protein-primer structure suggests a model for the initiationto elongation transition. EMBO J 25: 1335–1343.
Kool, E.T. (2001) Hydrogen bonding, base stacking, andsteric effects in DNA replication. Annu Rev Biophys BiomolStruct 30: 1–22.
Li, Y., Korolev, S., and Waksman, G. (1998) Crystal structureof open and closed form of binary and ternary complexes ofthe large fragment of Thermus aquaticus DNA polymeraseI. EMBO J 17: 7514–7525.
Martin-Laurent, F., Philippot, L., Hallet, S., Chaussod, R.,Germon, J.C., Soulas, G., and Catroux, G. (2001) DNAextraction from soils: old bias for new microbial diversityanalysis methods. Appl Environ Microbiol 67: 2354–2359.
Mizrahi, V., Henrie, R.N., Marlier, J.F., Johnson, K.A., andBenkovic, S.J. (1985) Rate-limiting steps in the DNA Poly-merase I reaction pathway. Biochemistry 24: 4010–4118.
Polz, M.F., and Cavanaugh, C.M. (1998) Bias in template-to-product ratios in multitemplate PCR. Appl Environ Micro-biol 64: 3724–3730.
Raeymaekers, L. (1995) A commentary on the practical appli-cations of quantitative PCR. Genome Res 5: 91–94.
Schouten, J.P., McElgunn, C.J., Waaijer, R., Zwijnenburg, D.,Diepvens, F., and Pals, G. (2002) Relative quantification of40 nucleic acid sequences by multiplex ligation-dependentprobe amplification. Nucleic Acids Res 30: e57.
Suzuki, M.T., and Giovannoni, S.J. (1996) Bias caused bytemplate annealing in the amplification of mixtures of 16SrRNA genes by PCR. Appl Environ Microbiol 62: 625–630.
Wu, J.H., Hong, P.Y., and Liu, W.T. (2009) Quantitative effectsof position and type of single mismatch on single baseprimer extension. J Microbiol Methods 77: 267–275.
Yin, Y.W., and Steitz, T.A. (2002) Transcription in T7 RNApolymerase structural basis for the transition from initiationto elongation. Science 298: 1387–1395.
1
2
3
4
5
6
7
8
9
10
11
12
13
14
15
16
17
18
19
20
21
22
23
24252627282930
31
323334353637383940414243444546474849505152
5354555657585960616263646566676869707172737475767778798081828384858687888990919293949596979899
100101102103104105106107108
emi4_318
6 E. Ben-Dov, O. H. Shapiro and A. Kushmaro
© 2011 Society for Applied Microbiology and Blackwell Publishing Ltd, Environmental Microbiology Reports
JOBNAME: No Job Name PAGE: 7 SESS: 8 OUTPUT: Wed Dec 7 17:01:47 2011 SUM: 2FFD1871/v2451/blackwell/journals/emi4_v0_i0/emi4_318
Toppan Best-set Premedia LimitedJournal Code: EMI4 Proofreader: JasonArticle No: 318 Delivery date: 7 December 2011Page Extent: 6 Copyeditor: Trista
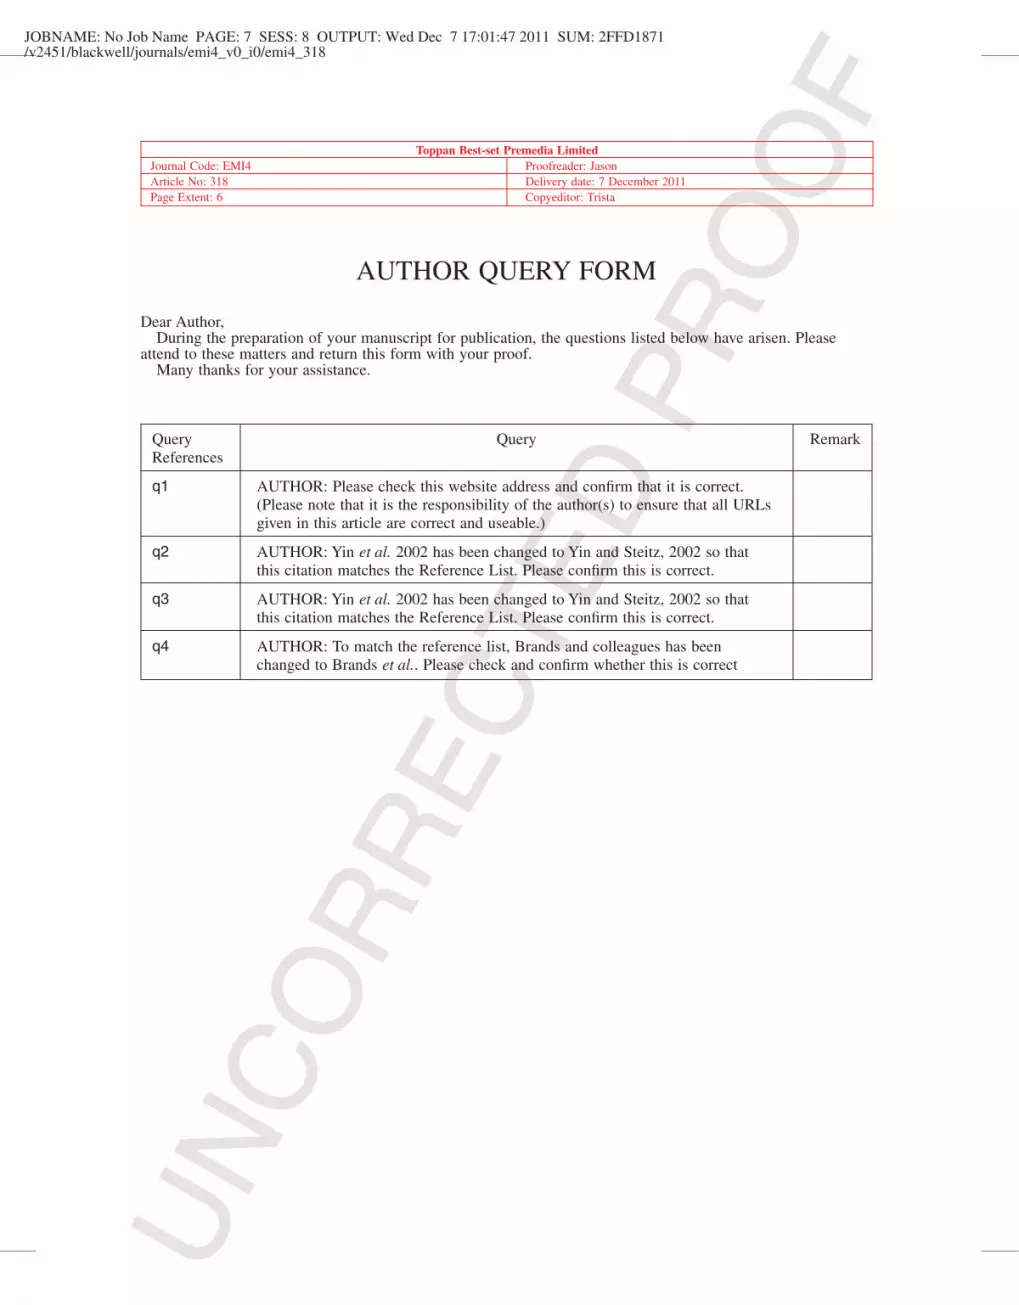
AUTHOR QUERY FORM
Dear Author,During the preparation of your manuscript for publication, the questions listed below have arisen. Please
attend to these matters and return this form with your proof.Many thanks for your assistance.
QueryReferences
Query Remark
q1 AUTHOR: Please check this website address and confirm that it is correct.(Please note that it is the responsibility of the author(s) to ensure that all URLsgiven in this article are correct and useable.)
q2 AUTHOR: Yin et al. 2002 has been changed to Yin and Steitz, 2002 so thatthis citation matches the Reference List. Please confirm this is correct.
q3 AUTHOR: Yin et al. 2002 has been changed to Yin and Steitz, 2002 so thatthis citation matches the Reference List. Please confirm this is correct.
q4 AUTHOR: To match the reference list, Brands and colleagues has beenchanged to Brands et al.. Please check and confirm whether this is correct
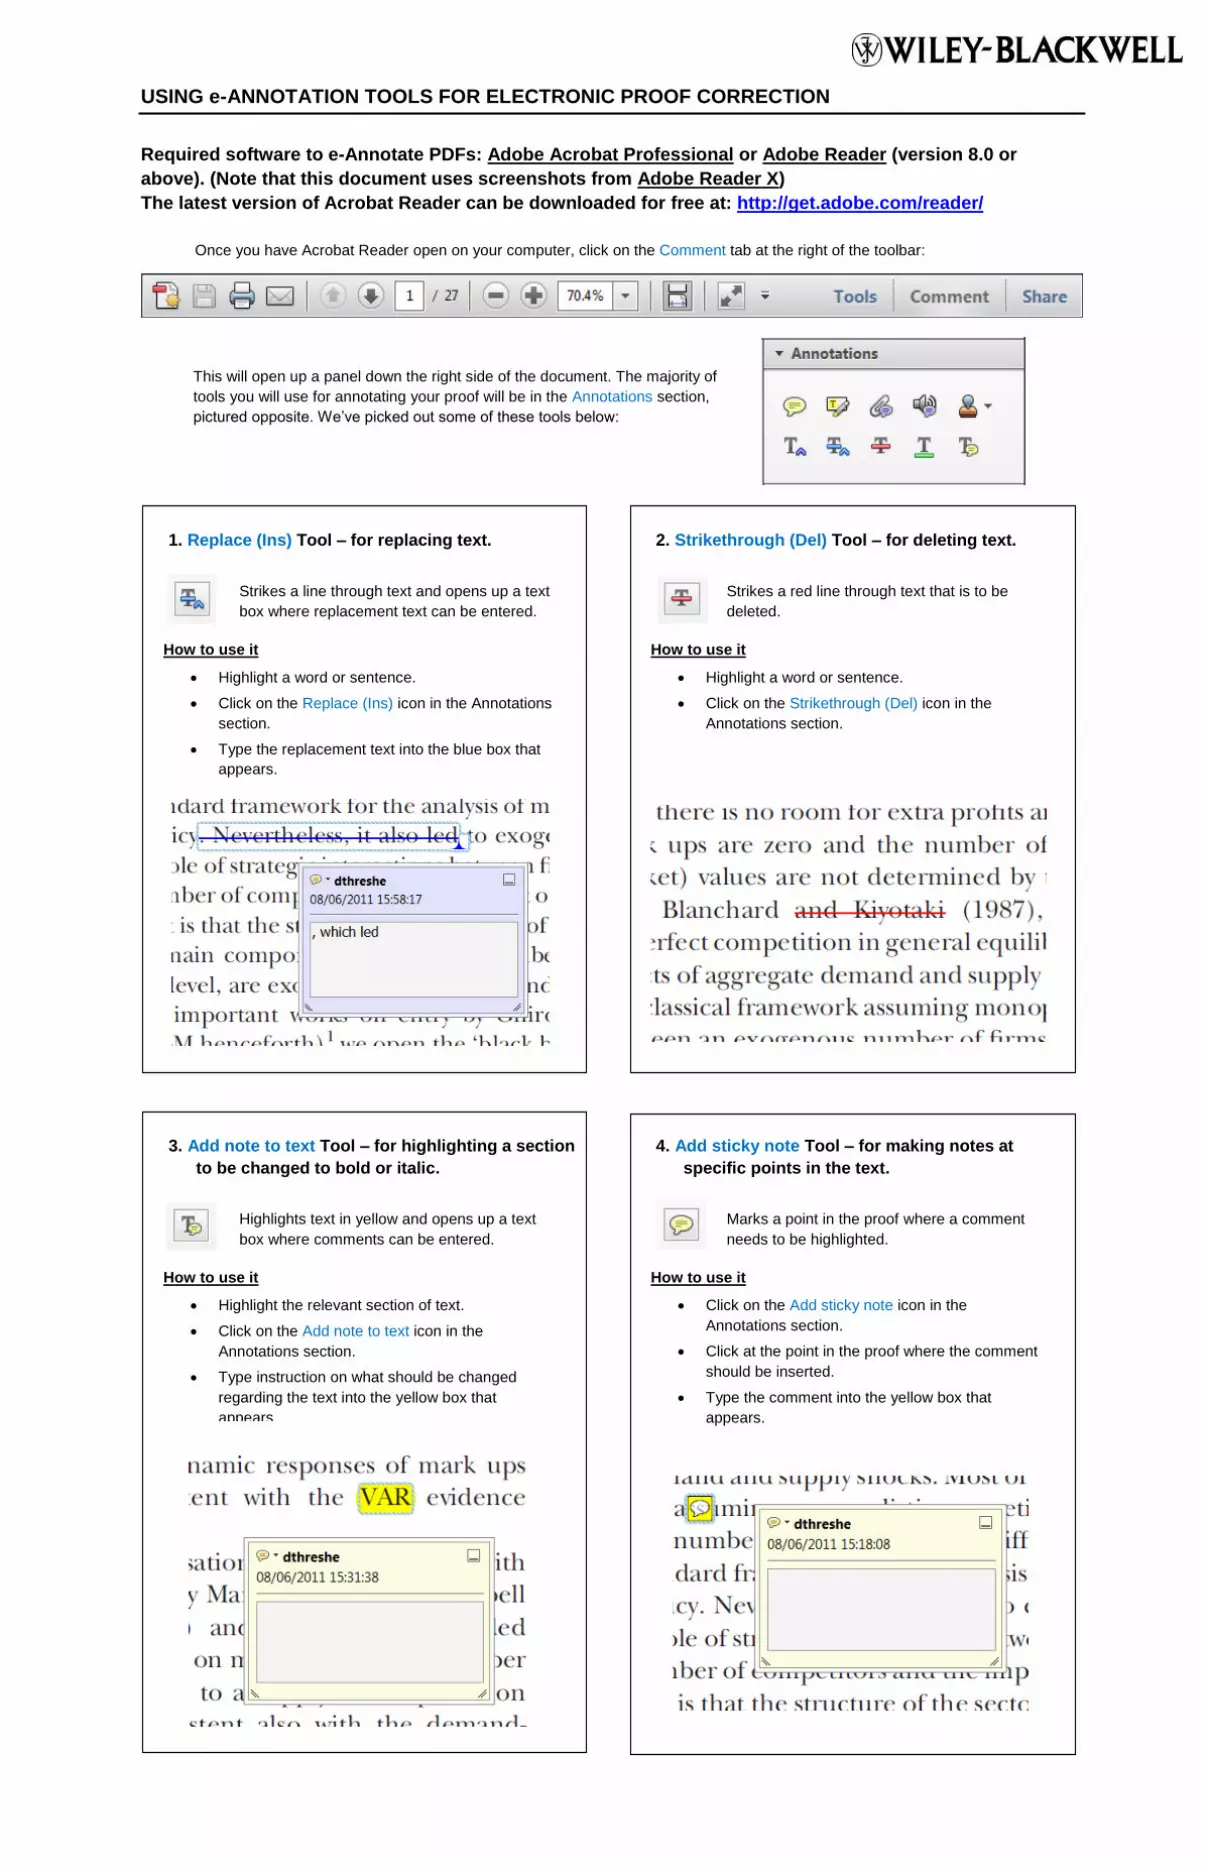
USING e-ANNOTATION TOOLS FOR ELECTRONIC PROOF CORRECTION
Required software to e-Annotate PDFs: Adobe Acrobat Professional or Adobe Reader (version 8.0 or
above). (Note that this document uses screenshots from Adobe Reader X)
The latest version of Acrobat Reader can be downloaded for free at: http://get.adobe.com/reader/
Once you have Acrobat Reader open on your computer, click on the Comment tab at the right of the toolbar:
1. Replace (Ins) Tool – for replacing text.
Strikes a line through text and opens up a text
box where replacement text can be entered.
How to use it
Highlight a word or sentence.
Click on the Replace (Ins) icon in the Annotations
section.
Type the replacement text into the blue box that
appears.
This will open up a panel down the right side of the document. The majority of
tools you will use for annotating your proof will be in the Annotations section,
pictured opposite. We’ve picked out some of these tools below:
2. Strikethrough (Del) Tool – for deleting text.
Strikes a red line through text that is to be
deleted.
How to use it
Highlight a word or sentence.
Click on the Strikethrough (Del) icon in the
Annotations section.
3. Add note to text Tool – for highlighting a section
to be changed to bold or italic.
Highlights text in yellow and opens up a text
box where comments can be entered.
How to use it
Highlight the relevant section of text.
Click on the Add note to text icon in the
Annotations section.
Type instruction on what should be changed
regarding the text into the yellow box that
appears.
4. Add sticky note Tool – for making notes at
specific points in the text.
Marks a point in the proof where a comment
needs to be highlighted.
How to use it
Click on the Add sticky note icon in the
Annotations section.
Click at the point in the proof where the comment
should be inserted.
Type the comment into the yellow box that
appears.
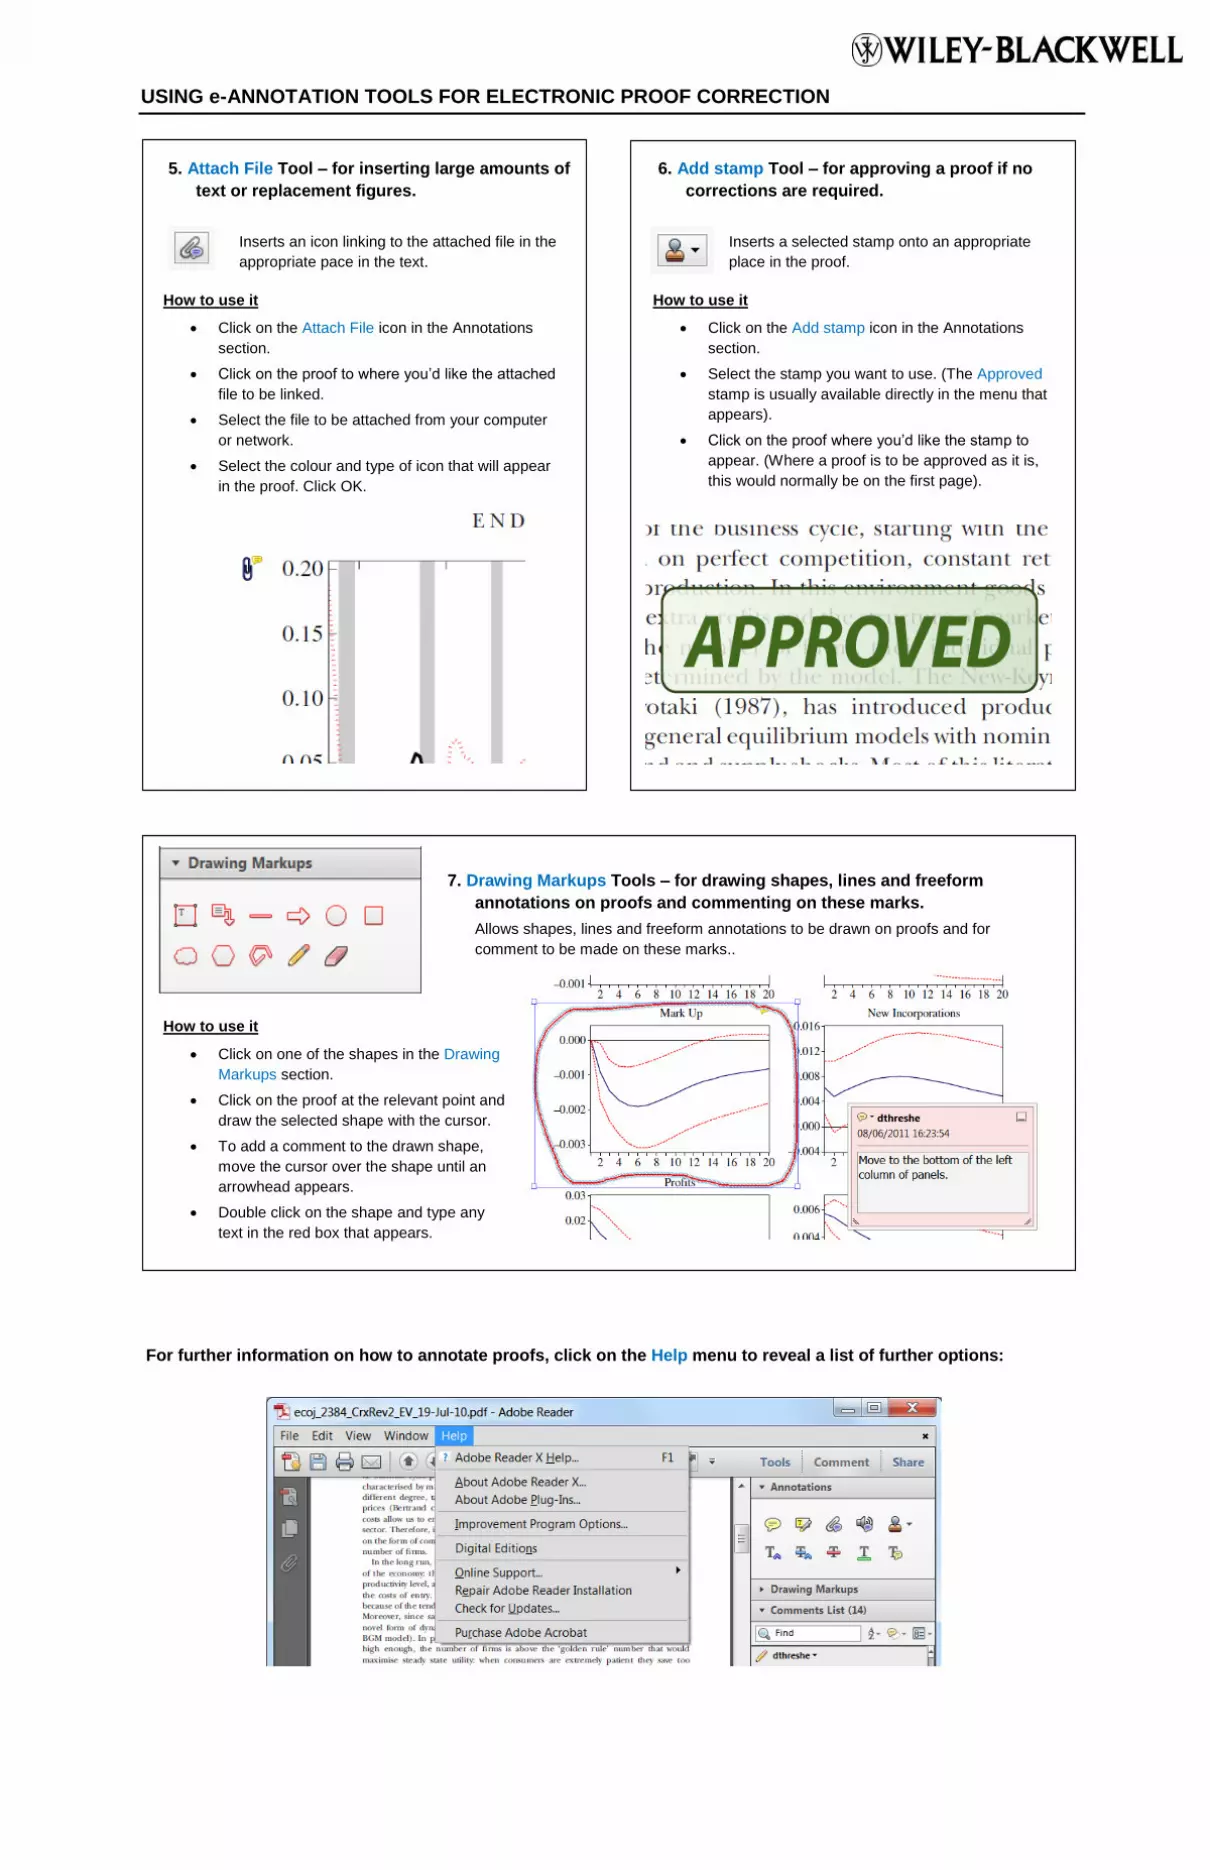
USING e-ANNOTATION TOOLS FOR ELECTRONIC PROOF CORRECTION
For further information on how to annotate proofs, click on the Help menu to reveal a list of further options:
5. Attach File Tool – for inserting large amounts of
text or replacement figures.
Inserts an icon linking to the attached file in the
appropriate pace in the text.
How to use it
Click on the Attach File icon in the Annotations
section.
Click on the proof to where you’d like the attached
file to be linked.
Select the file to be attached from your computer
or network.
Select the colour and type of icon that will appear
in the proof. Click OK.
6. Add stamp Tool – for approving a proof if no
corrections are required.
Inserts a selected stamp onto an appropriate
place in the proof.
How to use it
Click on the Add stamp icon in the Annotations
section.
Select the stamp you want to use. (The Approved
stamp is usually available directly in the menu that
appears).
Click on the proof where you’d like the stamp to
appear. (Where a proof is to be approved as it is,
this would normally be on the first page).
7. Drawing Markups Tools – for drawing shapes, lines and freeform
annotations on proofs and commenting on these marks.
Allows shapes, lines and freeform annotations to be drawn on proofs and for
comment to be made on these marks..
How to use it
Click on one of the shapes in the Drawing
Markups section.
Click on the proof at the relevant point and
draw the selected shape with the cursor.
To add a comment to the drawn shape,
move the cursor over the shape until an
arrowhead appears.
Double click on the shape and type any
text in the red box that appears.