news release
TRANSCRIPT
Corning Incorporated www.corning.com
© 2021 Corning Incorporated. All Rights Reserved.
News Release FOR RELEASE – April 27, 2021
Corning’s First-Quarter Results Reflect Strong Start to 2021
Core sales grew 29% year over year; core EPS increased 125% year over year
Free cash flow grew year over year to $372 million
All segments grew double digits year over year with momentum expected to continue throughout 2021
CORNING, N.Y. — Corning Incorporated (NYSE: GLW) today announced results for the first quarter ended March 31, 2021. Corning reported a strong first quarter:
• GAAP and core sales were $3.3 billion, year-over-year increases of 38% and 29%, respectively
• GAAP EPS was $0.67, reflecting strong performance and a non-cash, mark-to-market gain associated with the company’s currency-hedging contracts
• Core EPS grew 125% year over year to $0.45 • All segments grew sales and net income by double-digit percentages year over year
o Environmental Technologies grew sales 38% and net income 111% o Specialty Materials grew sales 28% and net income 78% o Optical Communications grew sales 18% and net income 283% o Life Sciences grew sales 16% and net income 26% o Display Technologies grew sales 15% and net income 40%
• Free cash flow of $372 million grew $691 million year over year and equates to 39% of 2020 total
• Profitability was impacted by approximately $50 million due to elevated freight and logistic costs and global supply chain disruptions
Wendell P. Weeks, chairman and chief executive officer, said, “We are off to an outstanding start in 2021. Our success in the first quarter is yet another proof point that we have built a stronger, more resilient company. And we’re confident that we can build on these results to maintain momentum throughout the year.” Weeks continued, “Corning is uniquely qualified to address some of the world’s toughest challenges. Our innovative capabilities put us at the heart of multiple trends that are reshaping the world. This provides a powerful source of long-term growth as we drive more Corning content into the industries we serve.” Weeks concluded, “We remain steadfast in our commitment to support our people, customers, and communities by applying the strength of our products and resources.”
Corning’s First-Quarter Results Reflect Strong Start to 2021 Page 2
© 2021 Corning Incorporated. All Rights Reserved.
Market-Access Platform Highlights Corning continues to advance important growth initiatives across its Market-Access Platforms. Highlights include: • Automotive – Environmental Technologies furthered the adoption of its gasoline particulate
filter (GPF) innovations, highlighted by its launch of a new generation of GPFs that help vehicles, including hybrids, achieve even lower levels of fine-particulate tailpipe emissions as regulatory limits tighten. Automotive Glass Solutions is meeting growing demand through its large-scale facility in Hefei, China, while collaborating with leading OEMs. Corning is addressing a combined $100-per-car content opportunity across emissions, technical glass products, and auto-glass solutions, including patented 3D Corning® ColdForm™ Technology. The world premiere event for the new all-electric EQS from Mercedes-EQ highlighted its MBUX Hyperscreen – featuring an almost 5-foot-wide Corning Gorilla Glass for Automotive Interiors cover.
• Mobile Consumer Electronics – Fast Company named Corning the most innovative company in the consumer electronics category for 2021, touting Ceramic Shield as “virtually indestructible” and recognizing Corning® Gorilla® Glass Victus™, the most durable Gorilla Glass to date. Demand for these innovations is strong. During Q1, more than 25 smartphones and 12 laptops launched featuring Gorilla Glasses. Additionally, Advanced Optics is capturing strong demand for its industry-leading extreme ultraviolet (EUV) products as semiconductor manufacturing rapidly adopts EUV technology. In 2020, EUV systems accounted for more than 30% of all semiconductor lithography equipment expenditures. EUV systems are expected to grow significantly over the next five years in both absolute dollars and as a share of equipment expenditures.
• Optical Communications – Verizon and AT&T – winners in the recent $81 billion 5G spectrum auction that demonstrated the value of using spectrum efficiently – are collaborating with Corning and investing in their fiber networks to meet growing customer demand. Corning is continuing to innovate to reduce the cost and speed the deployment of 5G, hyperscale data centers, and fiber-to-the-home. Verizon recently named Corning a leading network partner for 5G radio nodes in retail and other venue deployments of millimeter-wavelength systems. And Corning’s fiber optic cable manufacturing facility in Hickory, North Carolina, is leveraging Verizon 5G Edge with Amazon Web Services to explore how 5G can reshape manufacturing.
• Life Sciences – New long-term supply agreements executed in the first quarter support
increased production to meet growing demand in diagnostics, bioproduction, and lab research. In addition, Corning doubled its vial production in the first quarter over fourth quarter 2020. Through March 31, the company has shipped enough Corning Valor® Glass vials for hundreds of millions of COVID-19 vaccine doses. Corning expanded its contract with the U.S. government to $261 million, a $57 million increase from the $204 million awarded to Corning in June 2020. The funding is enabling Corning to substantially expand domestic manufacturing capacity and help accelerate delivery of COVID-19 vaccines.

Corning’s First-Quarter Results Reflect Strong Start to 2021 Page 3
© 2021 Corning Incorporated. All Rights Reserved.
• Display – Corning experienced the most favorable first-quarter pricing environment in more than a decade and announced a moderate increase to its display glass substrate prices for the second quarter. Demand for IT products is expected to grow meaningfully for the second consecutive year, and overall retail demand for TVs remains high. Demand for large-size TVs continues to grow – 75-inch sets were up more than 60% in 2020. These TVs are most efficiently made on the largest fabs, and Corning is well positioned to drive more content into the market in 2021 with the company’s three Gen 10.5 plants.
Financial Outlook Tony Tripeny, executive vice president and chief financial officer, said, “Corning had an excellent quarter. We delivered sales, EPS, and cash flow above our expectations. We are off to a great start, and we expect this momentum to continue throughout the year.” Tripeny added, “Multiple events disrupted global supply chains in the first quarter, and we experienced elevated freight and logistic costs that impacted profitability. We expect that these costs will normalize longer term and will begin to decline in the second quarter as we take mitigating actions. We will continue to do what it takes to deliver for our customers.” The company reiterated its commitment to financial stewardship and prudent capital allocation. Corning’s priorities are to generate strong cash flow and use cash to grow, extend market leadership, and reward shareholders. In February, Corning announced a quarterly dividend increase of 9% to $0.24 per share. In April, Corning resumed share repurchases, buying back 4% of its outstanding shares from Samsung Display Co., Ltd.
For the second quarter, the company expects core sales to be in the range of $3.3 billion to $3.5 billion and core EPS in the range of $0.49 to $0.53. Corning anticipates strong demand and positive momentum across its businesses to continue throughout 2021.
First-Quarter 2021 Results and Comparisons (In millions, except per share amounts)
Q1 2021 Q4 2020 %
change Q1 2020 %
change GAAP Net Sales $ 3,290 $ 3,350 (2%) $ 2,391 38% GAAP Net Income (Loss) $ 599 $ 252 138% $ (96) ** GAAP EPS $ 0.67 $ 0.28 139% $ (0.16) ** Core Sales* $ 3,263 $ 3,328 (2%) $ 2,529 29% Core Net Income* $ 402 $ 462 (13%) $ 177 127% Core EPS* $ 0.45 $ 0.52 (13%) $ 0.20 125%
*Core performance measures are non-GAAP financial measures. The reconciliation between GAAP and non-GAAP measures is provided in the tables following this news release, as well as on the company’s website. The largest difference between our GAAP and core results stemmed from non-cash, mark-to-market gains associated with the company’s currency-hedging contracts. **Not Meaningful

Corning’s First-Quarter Results Reflect Strong Start to 2021 Page 4
© 2021 Corning Incorporated. All Rights Reserved.
First-Quarter 2021 Segment Results
Display Technologies
Q1 2021 Q4 2020 %
change Q1 2020 %
change Net Sales $ 863 $ 841 3% $ 751 15% Net Income Before Tax $ 269 $ 274 (2%) $ 192 40% Net Income $ 213 $ 217 (2%) $ 152 40% In Display Technologies, first-quarter sales were $863 million, up 3% sequentially and 15% year over year. Corning’s volume grew by a low-single digit percentage sequentially. Glass prices were consistent with the fourth quarter. The company announced a moderate increase to its display glass substrate prices for the second quarter. Optical Communications
Q1 2021 Q4 2020 %
change Q1 2020 %
change Net Sales $ 937 $ 976 (4%) $ 791 18% Net Income Before Tax $ 142 $ 179 (21%) $ 37 284% Net Income $ 111 $ 141 (21%) $ 29 283%
In Optical Communications, first-quarter sales were $937 million, up 18% year over year. Sales increased in both enterprise and carrier networks, driven by the accelerated pace of data center builds, network capacity expansion, and fiber-to-the-home projects. Specialty Materials
Q1 2021 Q4 2020 %
change Q1 2020 %
change Net Sales $ 451 $ 545 (17%) $ 352 28% Net Income Before Tax $ 115 $ 173 (34%) $ 65 77% Net Income $ 91 $ 136 (33%) $ 51 78% In Specialty Materials, first-quarter sales of $451 million increased 28% year over year due to strong demand for premium cover materials, strength in the IT market, and the growing importance of semiconductor-related optical glasses.

Corning’s First-Quarter Results Reflect Strong Start to 2021 Page 5
© 2021 Corning Incorporated. All Rights Reserved.
Environmental Technologies
Q1 2021 Q4 2020 %
change Q1 2020 %
change Net Sales $ 441 $ 445 (1%) $ 320 38% Net Income Before Tax $ 94 $ 118 (20%) $ 44 114% Net Income $ 74 $ 93 (20%) $ 35 111% In Environmental Technologies, first-quarter sales of $441 million increased 38% year over year, driven by improving markets and more Corning content. Diesel sales grew 44% year over year, driven by demand in China and North America. Life Sciences
Q1 2021 Q4 2020 %
change Q1 2020 %
change Net Sales $ 300 $ 274 9% $ 258 16% Net Income Before Tax $ 61 $ 53 15% $ 48 27% Net Income $ 48 $ 42 14% $ 38 26% In Life Sciences, first-quarter sales were $300 million, up 16% year over year. Performance was driven by strong demand across all regions, ongoing recovery in academic and pharmaceutical research labs, and continued strong demand for bioproduction products and diagnostic-related consumables. First-Quarter Conference Call Information The company will host a first-quarter conference call on Tuesday, April 27, at 8:30 a.m. EDT. To participate, please call toll-free (877) 710-0209 or for international access, call (315) 625-3068 approximately 10 to 15 minutes prior to the start of the call. The Access Code is 524 7014. To listen to a live audio webcast of the call, go to Corning’s website at http://www.corning.com/investor_relations, click “Events,” and follow the instructions. Presentation of Information in this News Release This news release includes non-GAAP financial measures. Non-GAAP financial measures are not in accordance with, or an alternative to, GAAP. Corning’s non-GAAP financial measures exclude the impact of items that are driven by general economic conditions and events that do not reflect the underlying fundamentals and trends in the company’s operations. The company believes presenting non-GAAP financial measures assists in analyzing financial performance without the impact of items that may obscure trends in the company’s underlying performance. Definitions of these non-GAAP financial measures and reconciliations of these non-GAAP financial measures to the most directly comparable GAAP financial measures can be found on the Company’s website by going to the Investor Relations page and clicking “Quarterly Results” under the “Financials and Filings” tab. These reconciliations also accompany this news release.
Corning’s First-Quarter Results Reflect Strong Start to 2021 Page 6
© 2021 Corning Incorporated. All Rights Reserved.
Caution Concerning Forward-Looking Statements The statements contained in this release that are not historical facts or information and contain words such as “will,” “believe,” “anticipate,” “expect,” “intend,” “plan,” “seek,” “see,” “would,” and “target” and similar expressions are forward-looking statements. These forward-looking statements are made pursuant to the safe harbor provisions of the Private Securities Litigation Reform Act of 1995 and include estimates and assumptions related to economic, competitive and legislative developments. Such statements relate to future events that by their nature address matters that are, to different degrees, uncertain. These estimates are subject to change and uncertainty which are, in many instances, beyond our control. There can be no assurance that future developments will be in accordance with management’s expectations. Actual results could differ materially from those expected by us, depending on the outcome of various factors. We do not undertake to update forward-looking statements. Although the Company believes that these forward-looking statements are based upon reasonable assumptions regarding, among other things, current estimates and forecasts, general economic conditions, its knowledge of its business, and key performance indicators that impact the Company, actual results could differ materially. The Company does not undertake to update forward-looking statements. Some of the risks, uncertainties and other factors that could cause actual results to differ materially from those expressed in or implied by the forward-looking statements include, but are not limited to: the duration and severity of the COVID-19 pandemic, and its ultimate impact across our businesses on demand, operations and our global supply chains; the effects of acquisitions, dispositions and other similar transactions; global business, financial, economic and political conditions; tariffs and import duties; currency fluctuations between the U.S. dollar and other currencies, primarily the Japanese yen, new Taiwan dollar, euro, Chinese yuan and South Korean won; product demand and industry capacity; competitive products and pricing; availability and costs of critical components and materials; new product development and commercialization; order activity and demand from major customers; the amount and timing of our cash flows and earnings and other conditions, which may affect our ability to pay our quarterly dividend at the planned level or to repurchase shares at planned levels; possible disruption in commercial activities due to terrorist activity, cyber-attack, armed conflict, political or financial instability, natural disasters, or major health concerns; loss of intellectual property due to theft, cyber-attack, or disruption to our information technology infrastructure; unanticipated disruption to equipment, facilities, IT systems or operations; effect of regulatory and legal developments; ability to pace capital spending to anticipated levels of customer demand; rate of technology change; ability to enforce patents and protect intellectual property and trade secrets; adverse litigation; product and components performance issues; retention of key personnel; customer ability, most notably in the Display Technologies segment, to maintain profitable operations and obtain financing to fund ongoing operations and manufacturing expansions and pay receivables when due; loss of significant customers; changes in tax laws and regulations; the impacts of audits by taxing authorities; the potential impact of legislation, government regulations, and other government action and investigations; and other risks detailed in Corning’s SEC filings. For a complete listing of risks and other factors, please reference the risk factors and forward-looking statements described in our annual reports on Form 10-K and quarterly reports on Form 10-Q.
Corning’s First-Quarter Results Reflect Strong Start to 2021 Page 7
© 2021 Corning Incorporated. All Rights Reserved.
Web Disclosure In accordance with guidance provided by the SEC regarding the use of company websites and social media channels to disclose material information, Corning Incorporated (“Corning”) wishes to notify investors, media, and other interested parties that it uses its website (http://www.corning.com/worldwide/en/about-us/news-events.html) to publish important information about the company, including information that may be deemed material to investors, or supplemental to information contained in this or other press releases. The list of websites and social media channels that the company uses may be updated on Corning’s media and website from time to time. Corning encourages investors, media, and other interested parties to review the information Corning may publish through its website and social media channels as described above, in addition to the company’s SEC filings, press releases, conference calls, and webcasts. About Corning Incorporated Corning (www.corning.com) is one of the world's leading innovators in materials science, with a 170-year track record of life-changing inventions. Corning applies its unparalleled expertise in glass science, ceramic science, and optical physics along with its deep manufacturing and engineering capabilities to develop category-defining products that transform industries and enhance people's lives. Corning succeeds through sustained investment in RD&E, a unique combination of material and process innovation, and deep, trust-based relationships with customers who are global leaders in their industries. Corning's capabilities are versatile and synergistic, which allows the company to evolve to meet changing market needs, while also helping our customers capture new opportunities in dynamic industries. Today, Corning's markets include optical communications, mobile consumer electronics, display, automotive, and life sciences. Media Relations Contact: Pamela Porter (607) 974-9980 [email protected] Investor Relations Contact: Ann H.S. Nicholson (607) 974-6716 [email protected] Follow Corning: RSS Feeds | Facebook | Twitter | YouTube
© 2021 Corning Incorporated. All Rights Reserved.
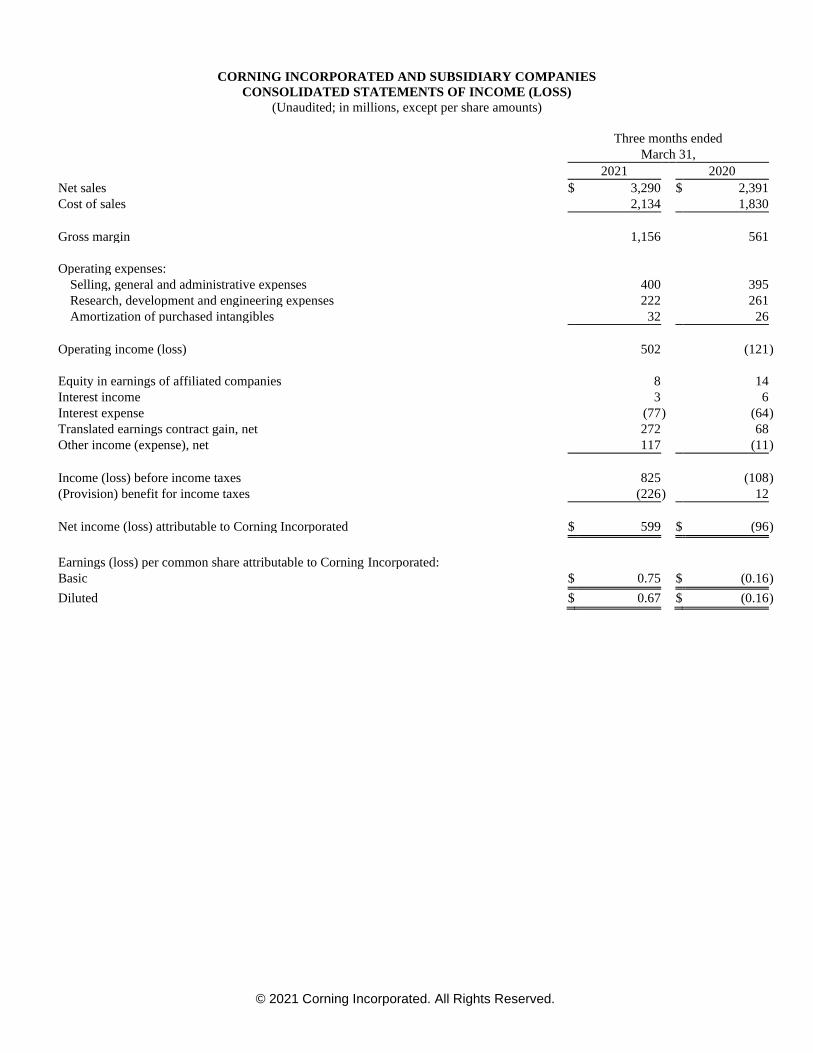
CORNING INCORPORATED AND SUBSIDIARY COMPANIES
CONSOLIDATED STATEMENTS OF INCOME (LOSS)
(Unaudited; in millions, except per share amounts)
Three months ended
March 31,
2021 2020
Net sales $ 3,290 $ 2,391
Cost of sales 2,134 1,830
Gross margin 1,156 561
Operating expenses:
Selling, general and administrative expenses 400 395
Research, development and engineering expenses 222 261
Amortization of purchased intangibles 32 26
Operating income (loss) 502 (121 )
Equity in earnings of affiliated companies 8 14
Interest income 3 6
Interest expense (77 ) (64 )
Translated earnings contract gain, net 272 68
Other income (expense), net 117 (11 )
Income (loss) before income taxes 825 (108 )
(Provision) benefit for income taxes (226 ) 12
Net income (loss) attributable to Corning Incorporated $ 599 $ (96 )
Earnings (loss) per common share attributable to Corning Incorporated:
Basic $ 0.75 $ (0.16 )
Diluted $ 0.67 $ (0.16 )
© 2021 Corning Incorporated. All Rights Reserved.
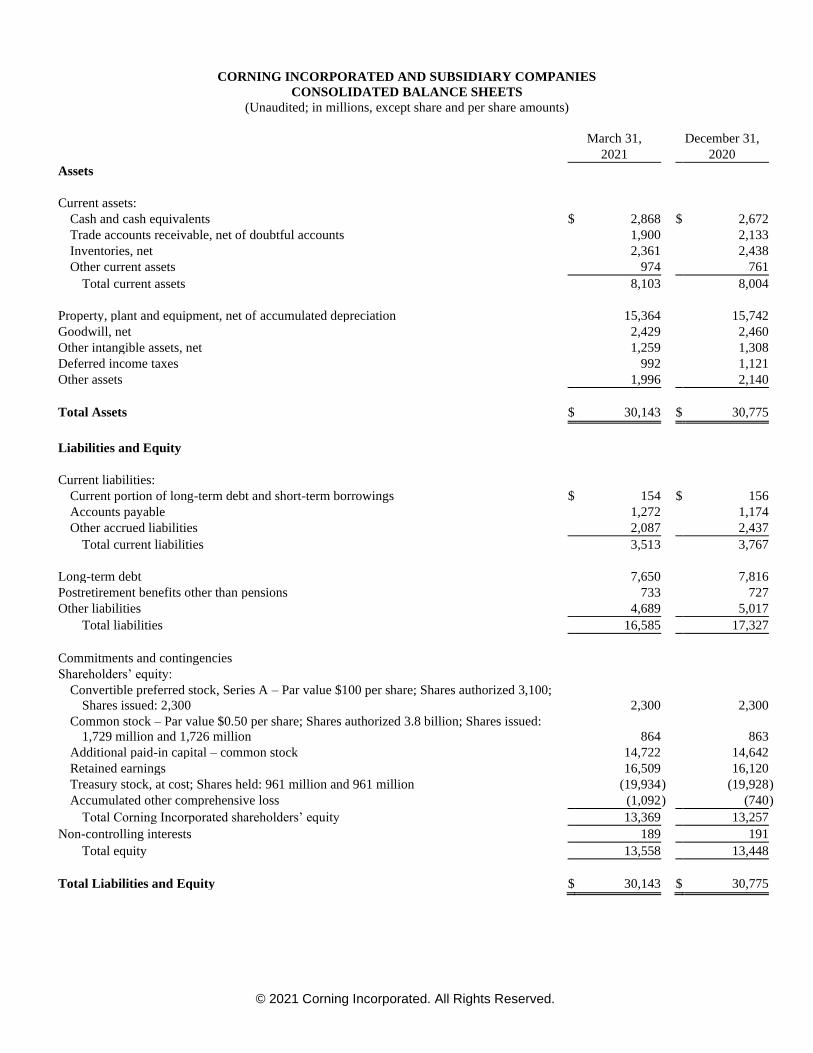
CORNING INCORPORATED AND SUBSIDIARY COMPANIES
CONSOLIDATED BALANCE SHEETS
(Unaudited; in millions, except share and per share amounts)
March 31, December 31,
2021 2020
Assets
Current assets:
Cash and cash equivalents $ 2,868 $ 2,672
Trade accounts receivable, net of doubtful accounts 1,900 2,133
Inventories, net 2,361 2,438
Other current assets 974 761
Total current assets 8,103 8,004
Property, plant and equipment, net of accumulated depreciation 15,364 15,742
Goodwill, net 2,429 2,460
Other intangible assets, net 1,259 1,308
Deferred income taxes 992 1,121
Other assets 1,996 2,140
Total Assets $ 30,143 $ 30,775
Liabilities and Equity
Current liabilities:
Current portion of long-term debt and short-term borrowings $ 154 $ 156
Accounts payable 1,272 1,174
Other accrued liabilities 2,087 2,437
Total current liabilities 3,513 3,767
Long-term debt 7,650 7,816
Postretirement benefits other than pensions 733 727
Other liabilities 4,689 5,017
Total liabilities 16,585 17,327
Commitments and contingencies
Shareholders’ equity:
Convertible preferred stock, Series A – Par value $100 per share; Shares authorized 3,100;
Shares issued: 2,300 2,300 2,300
Common stock – Par value $0.50 per share; Shares authorized 3.8 billion; Shares issued:
1,729 million and 1,726 million 864 863
Additional paid-in capital – common stock 14,722 14,642
Retained earnings 16,509 16,120
Treasury stock, at cost; Shares held: 961 million and 961 million (19,934 ) (19,928 )
Accumulated other comprehensive loss (1,092 ) (740 )
Total Corning Incorporated shareholders’ equity 13,369 13,257
Non-controlling interests 189 191
Total equity 13,558 13,448
Total Liabilities and Equity $ 30,143 $ 30,775
© 2021 Corning Incorporated. All Rights Reserved.
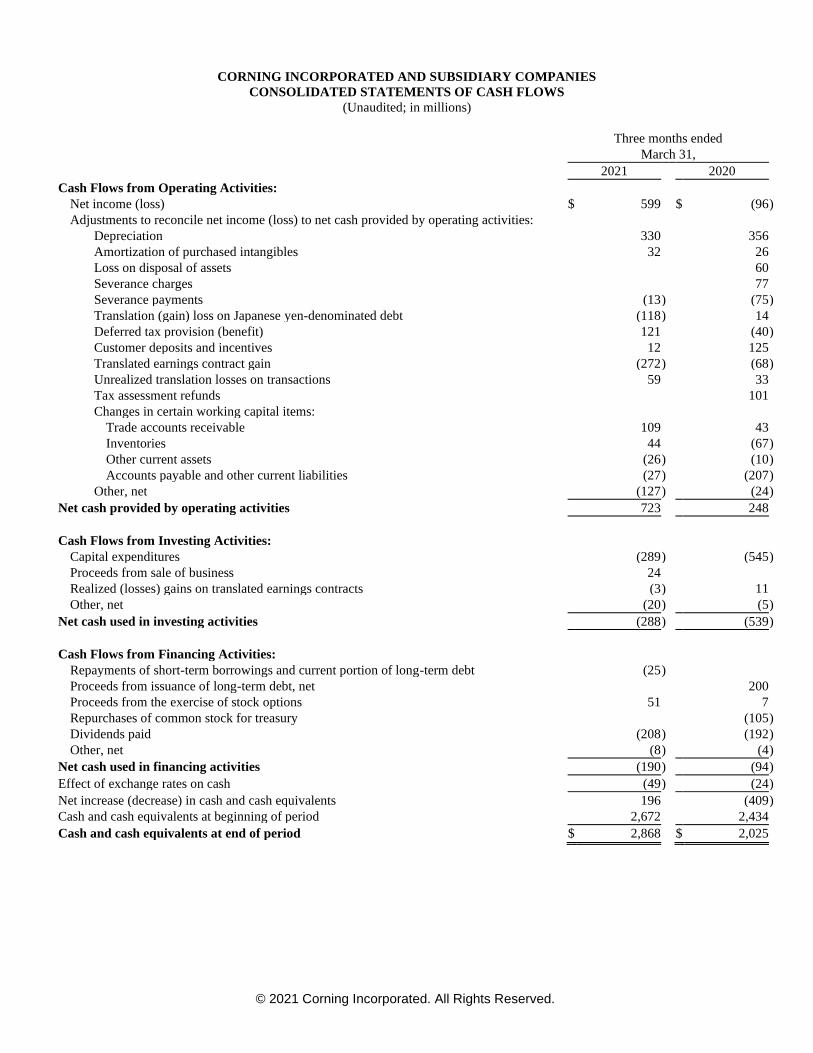
CORNING INCORPORATED AND SUBSIDIARY COMPANIES
CONSOLIDATED STATEMENTS OF CASH FLOWS
(Unaudited; in millions)
Three months ended
March 31,
2021 2020
Cash Flows from Operating Activities:
Net income (loss) $ 599 $ (96 )
Adjustments to reconcile net income (loss) to net cash provided by operating activities:
Depreciation 330 356
Amortization of purchased intangibles 32 26
Loss on disposal of assets 60
Severance charges 77
Severance payments (13 ) (75 )
Translation (gain) loss on Japanese yen-denominated debt (118 ) 14
Deferred tax provision (benefit) 121 (40 )
Customer deposits and incentives 12 125
Translated earnings contract gain (272 ) (68 )
Unrealized translation losses on transactions 59 33
Tax assessment refunds 101
Changes in certain working capital items:
Trade accounts receivable 109 43
Inventories 44 (67 )
Other current assets (26 ) (10 )
Accounts payable and other current liabilities (27 ) (207 )
Other, net (127 ) (24 )
Net cash provided by operating activities 723 248
Cash Flows from Investing Activities:
Capital expenditures (289 ) (545 )
Proceeds from sale of business 24
Realized (losses) gains on translated earnings contracts (3 ) 11
Other, net (20 ) (5 )
Net cash used in investing activities (288 ) (539 )
Cash Flows from Financing Activities:
Repayments of short-term borrowings and current portion of long-term debt (25 )
Proceeds from issuance of long-term debt, net 200
Proceeds from the exercise of stock options 51 7
Repurchases of common stock for treasury (105 )
Dividends paid (208 ) (192 )
Other, net (8 ) (4 )
Net cash used in financing activities (190 ) (94 )
Effect of exchange rates on cash (49 ) (24 )
Net increase (decrease) in cash and cash equivalents 196 (409 )
Cash and cash equivalents at beginning of period 2,672 2,434
Cash and cash equivalents at end of period $ 2,868 $ 2,025

© 2021 Corning Incorporated. All Rights Reserved.
CORNING INCORPORATED AND SUBSIDIARY COMPANIES
(Unaudited)
GAAP Earnings (Loss) per Common Share
The following table sets forth the computation of basic and diluted earnings (loss) per common share (in millions, except per share
amounts):
Three months ended
March 31,
2021 2020
Net income (loss) attributable to Corning Incorporated $ 599 $ (96 )
Less: Series A convertible preferred stock dividend 24 24
Net income (loss) available to common stockholders – basic 575 (120 )
Add: Series A convertible preferred stock dividend 24
Net income (loss) available to common stockholders – diluted $ 599 $ (120 )
Weighted-average common shares outstanding - basic 766 760
Effect of dilutive securities:
Stock options and other dilutive securities 17
Series A convertible preferred stock 115
Weighted-average common shares outstanding - diluted 898 760
Basic earnings (loss) per common share $ 0.75 $ (0.16 )
Diluted earnings (loss) per common share $ 0.67 $ (0.16 )
Core Earnings per Common Share
The following table sets forth the computation of core basic and core diluted earnings per common share (in millions, except per
share amounts):
Three months ended
March 31,
2021 2020
Core net income attributable to Corning Incorporated $ 402 $ 177
Less: Series A convertible preferred stock dividend 24 24
Core net income available to common stockholders - basic 378 153
Add: Series A convertible preferred stock dividend 24 24
Core net income available to common stockholders - diluted $ 402 $ 177
Weighted-average common shares outstanding - basic 766 760
Effect of dilutive securities:
Stock options and other dilutive securities 17 6
Series A convertible preferred stock 115 115
Weighted-average common shares outstanding - diluted 898 881
Core basic earnings per common share $ 0.49 $ 0.20
Core diluted earnings per common share $ 0.45 $ 0.20

© 2021 Corning Incorporated. All Rights Reserved.
Use of Non-GAAP Financial Measures
CORE PERFORMANCE MEASURES
In managing the Company and assessing financial performance, certain measures provided by the consolidated financial
statements are adjusted to exclude specific items to report core performance measures. These items include gains and losses on
translated earnings contracts, acquisition-related costs, certain discrete tax items and other tax-related adjustments, restructuring,
impairment losses, and other charges and credits, certain litigation-related expenses, pension mark-to-market adjustments and
other items which do not reflect on-going operating results of the Company or its equity affiliates. Corning utilizes constant-
currency reporting for the Display Technologies, Environmental Technologies, Specialty Materials and Life Sciences segments for
the Japanese yen, South Korean won, Chinese yuan, new Taiwan dollar and the euro. The Company believes that the use of
constant-currency reporting allows investors to understand the results without the volatility of currency fluctuations and reflects
the underlying economics of the translated earnings contracts used to mitigate the impact of changes in currency exchange rates on
earnings and cash flows. Corning also believes that reporting core performance measures provides investors greater transparency
to the information used by the management team to make financial and operational decisions.
Core performance measures are not prepared in accordance with Generally Accepted Accounting Principles in the United States
(“GAAP”). We believe investors should consider these non-GAAP measures in evaluating results as they are more indicative of
core operating performance and how management evaluates operational results and trends. These measures are not, and should not,
be viewed as a substitute for GAAP reporting measures. With respect to the Company’s outlook for future periods, it is not
possible to provide reconciliations for these non-GAAP measures because the Company does not forecast the movement of foreign
currencies against the U.S. dollar, or other items that do not reflect ongoing operations, nor does it forecast items that have not yet
occurred or are out of the Company’s control. As a result, the Company is unable to provide outlook information on a GAAP
basis.
For a reconciliation of non-GAAP performance measures to their most directly comparable GAAP financial measure, please see
“Reconciliation of Non-GAAP Measures”.

© 2021 Corning Incorporated. All Rights Reserved.
CORNING INCORPORATED AND SUBSIDIARY COMPANIES
RECONCILIATION OF NON-GAAP FINANCIAL MEASURE TO GAAP FINANCIAL MEASURE
Three Months Ended March 31, 2021 and 2020
(Unaudited; amounts in millions, except per share amounts)
Three months ended March 31, 2021
Income
before Effective
Net Equity income Net tax Per
sales earnings taxes income rate (a) share
As reported - GAAP $ 3,290 $ 8 $ 825 $ 599 27.4 % $ 0.67
Constant-currency adjustment (1) (27 ) (6 ) 5 0.01
Translation gain on Japanese yen-
denominated debt (2) (118 ) (90 ) (0.10 )
Translated earnings contract gain (3) (272 ) (209 ) (0.23 )
Acquisition-related costs (4) 47 35 0.04
Discrete tax items and other tax-related
adjustments (5) 37 0.04
Litigation, regulatory and other legal
matters (6) 8 8 0.01
Pension mark-to-market adjustment (7) 5 4 0.00
Loss on investments (8) 35 27 0.03
Gain on sale of business (9) (14 ) (14 ) (0.02 )
Core performance measures $ 3,263 $ 8 $ 510 $ 402 21.2 % $ 0.45
(a) Based upon statutory tax rates in the specific jurisdiction for each event.
Three months ended March 31, 2020
(Loss)
income
before Effective
Net Equity income Net (loss) tax Per
sales earnings taxes income rate (a) share
As reported - GAAP $ 2,391 $ 14 $ (108 ) $ (96 ) 11.1 % $ (0.16 )
Constant-currency adjustment (1) 33 19 (22 ) (0.03 )
Translation loss on Japanese yen-
denominated debt (2) 14 11 0.01
Translated earnings contract gain (3) (58 ) (45 ) (0.06 )
Acquisition-related costs (4) 28 21 0.03
Discrete tax items and other tax-related
adjustments (5) 37 0.05
Restructuring, impairment and other charges
and credits (10) 225 166 0.22
Cumulative adjustment related to customer
contract (11) 105 105 105 0.14
Core performance measures $ 2,529 $ 14 $ 225 $ 177 21.3 % $ 0.20
(a) Based upon statutory tax rates in the specific jurisdiction for each event.
See Reconciliation of Non-GAAP Financial Measures, “Items which we exclude from GAAP measures to arrive at Core
Performance measures” for the descriptions of the footnoted reconciling items.
© 2021 Corning Incorporated. All Rights Reserved.
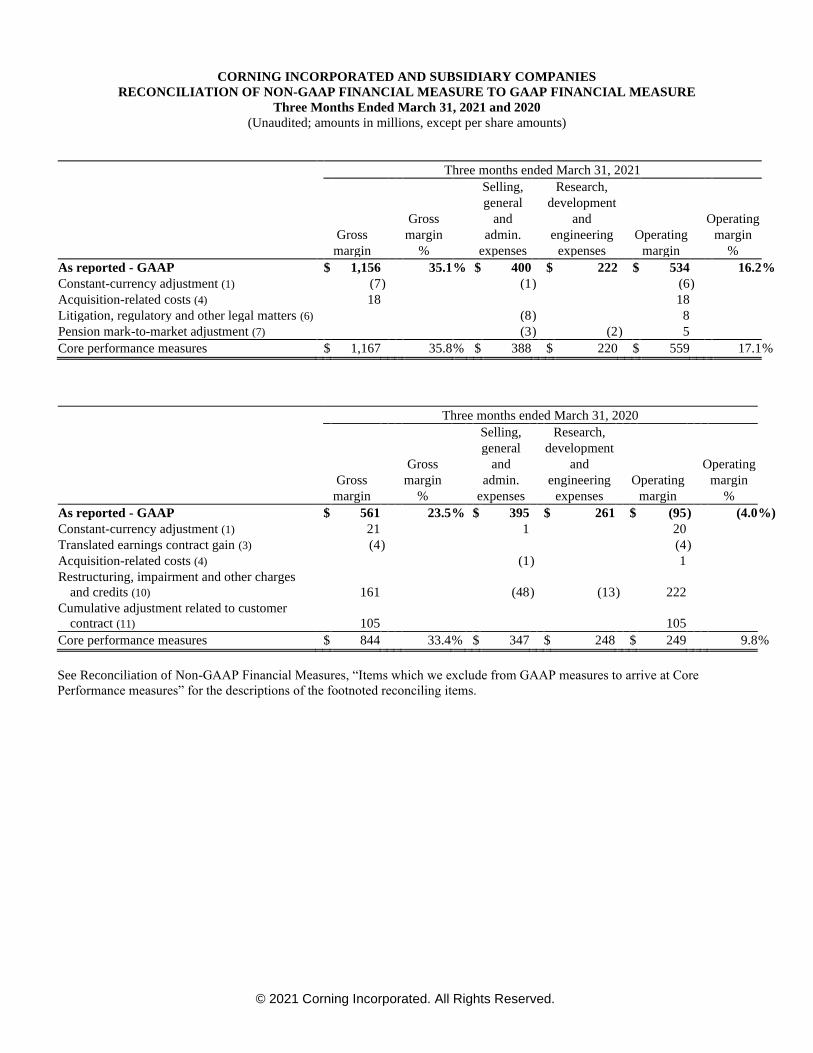
CORNING INCORPORATED AND SUBSIDIARY COMPANIES
RECONCILIATION OF NON-GAAP FINANCIAL MEASURE TO GAAP FINANCIAL MEASURE
Three Months Ended March 31, 2021 and 2020
(Unaudited; amounts in millions, except per share amounts)
Three months ended March 31, 2021
Selling, Research,
general development
Gross and and Operating
Gross margin admin. engineering Operating margin
margin % expenses expenses margin %
As reported - GAAP $ 1,156 35.1 % $ 400 $ 222 $ 534 16.2 %
Constant-currency adjustment (1) (7 ) (1 ) (6 )
Acquisition-related costs (4) 18 18
Litigation, regulatory and other legal matters (6) (8 ) 8
Pension mark-to-market adjustment (7) (3 ) (2 ) 5
Core performance measures $ 1,167 35.8 % $ 388 $ 220 $ 559 17.1 %
Three months ended March 31, 2020
Selling, Research,
general development
Gross and and Operating
Gross margin admin. engineering Operating margin
margin % expenses expenses margin %
As reported - GAAP $ 561 23.5 % $ 395 $ 261 $ (95 ) (4.0 %)
Constant-currency adjustment (1) 21 1 20
Translated earnings contract gain (3) (4 ) (4 )
Acquisition-related costs (4) (1 ) 1
Restructuring, impairment and other charges
and credits (10) 161 (48 ) (13 ) 222
Cumulative adjustment related to customer
contract (11) 105 105
Core performance measures $ 844 33.4 % $ 347 $ 248 $ 249 9.8 %
See Reconciliation of Non-GAAP Financial Measures, “Items which we exclude from GAAP measures to arrive at Core
Performance measures” for the descriptions of the footnoted reconciling items.

© 2021 Corning Incorporated. All Rights Reserved.
CORNING INCORPORATED AND SUBSIDIARY COMPANIES
RECONCILIATION OF NON-GAAP FINANCIAL MEASURE TO GAAP FINANCIAL MEASURE
Three Months Ended March 31, 2021 and 2020
(Unaudited; amounts in millions)
Three months ended
March 31,
2021 2020
Cash flows from operating activities $ 723 $ 248
Realized (losses) gains on translated earnings contracts (3 ) 11
Translation losses on cash balances (59 ) (33 )
Adjusted cash flows from operating activities $ 661 $ 226
Less: Capital expenditures $ 289 $ 545
Free cash flow $ 372 $ (319 )
© 2021 Corning Incorporated. All Rights Reserved.
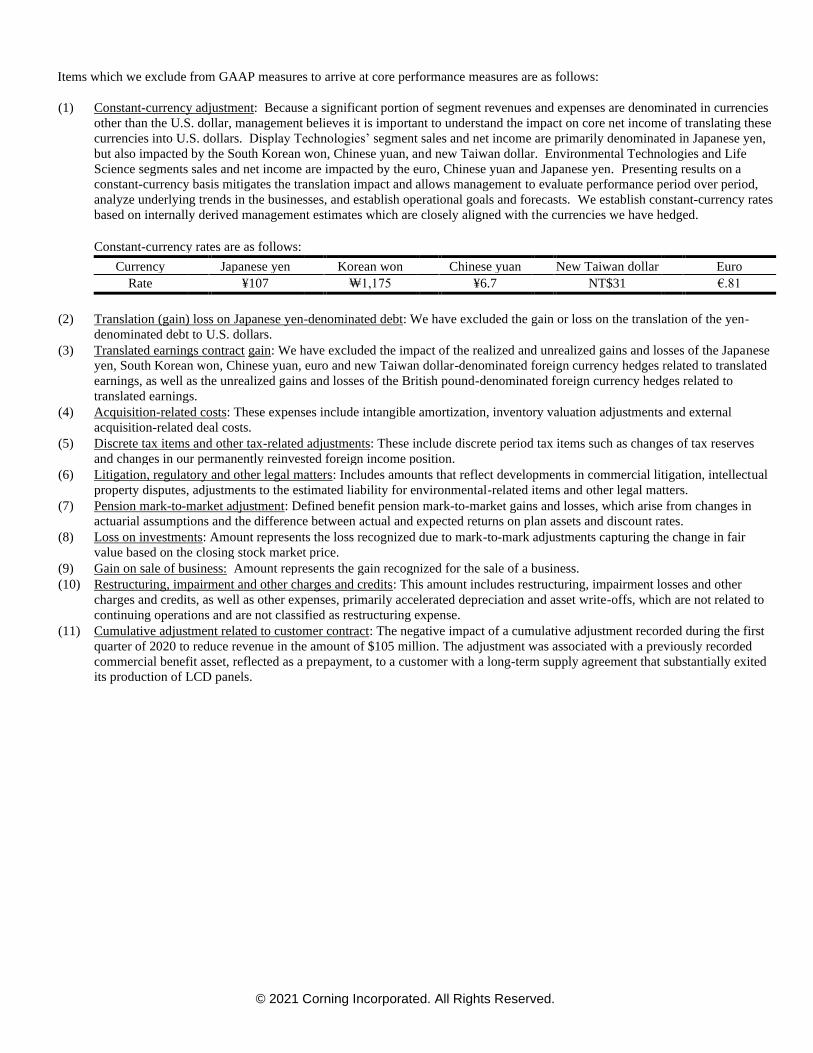
Items which we exclude from GAAP measures to arrive at core performance measures are as follows:
(1) Constant-currency adjustment: Because a significant portion of segment revenues and expenses are denominated in currencies
other than the U.S. dollar, management believes it is important to understand the impact on core net income of translating these
currencies into U.S. dollars. Display Technologies’ segment sales and net income are primarily denominated in Japanese yen,
but also impacted by the South Korean won, Chinese yuan, and new Taiwan dollar. Environmental Technologies and Life
Science segments sales and net income are impacted by the euro, Chinese yuan and Japanese yen. Presenting results on a
constant-currency basis mitigates the translation impact and allows management to evaluate performance period over period,
analyze underlying trends in the businesses, and establish operational goals and forecasts. We establish constant-currency rates
based on internally derived management estimates which are closely aligned with the currencies we have hedged.
Constant-currency rates are as follows:
Currency Japanese yen Korean won Chinese yuan New Taiwan dollar Euro
Rate ¥107 ₩1,175 ¥6.7 NT$31 €.81
(2) Translation (gain) loss on Japanese yen-denominated debt: We have excluded the gain or loss on the translation of the yen-
denominated debt to U.S. dollars.
(3) Translated earnings contract gain: We have excluded the impact of the realized and unrealized gains and losses of the Japanese
yen, South Korean won, Chinese yuan, euro and new Taiwan dollar-denominated foreign currency hedges related to translated
earnings, as well as the unrealized gains and losses of the British pound-denominated foreign currency hedges related to
translated earnings.
(4) Acquisition-related costs: These expenses include intangible amortization, inventory valuation adjustments and external
acquisition-related deal costs.
(5) Discrete tax items and other tax-related adjustments: These include discrete period tax items such as changes of tax reserves
and changes in our permanently reinvested foreign income position.
(6) Litigation, regulatory and other legal matters: Includes amounts that reflect developments in commercial litigation, intellectual
property disputes, adjustments to the estimated liability for environmental-related items and other legal matters.
(7) Pension mark-to-market adjustment: Defined benefit pension mark-to-market gains and losses, which arise from changes in
actuarial assumptions and the difference between actual and expected returns on plan assets and discount rates.
(8) Loss on investments: Amount represents the loss recognized due to mark-to-mark adjustments capturing the change in fair
value based on the closing stock market price.
(9) Gain on sale of business: Amount represents the gain recognized for the sale of a business.
(10) Restructuring, impairment and other charges and credits: This amount includes restructuring, impairment losses and other
charges and credits, as well as other expenses, primarily accelerated depreciation and asset write-offs, which are not related to
continuing operations and are not classified as restructuring expense.
(11) Cumulative adjustment related to customer contract: The negative impact of a cumulative adjustment recorded during the first
quarter of 2020 to reduce revenue in the amount of $105 million. The adjustment was associated with a previously recorded
commercial benefit asset, reflected as a prepayment, to a customer with a long-term supply agreement that substantially exited
its production of LCD panels.