new primers to amplify the fungal its2 region - evaluation by 454-sequencing of artificial and...
TRANSCRIPT
R E S EA RCH AR T I C L E
New primers to amplify the fungal ITS2 region – evaluation by454-sequencing of artificial and natural communities
Katarina Ihrmark, Inga T.M. Bodeker, Karelyn Cruz-Martinez, Hanna Friberg, Ariana Kubartova,Jessica Schenck, Ylva Strid, Jan Stenlid, Mikael Brandstrom-Durling, Karina E. Clemmensen &Bjorn D. Lindahl
Department of Forest Mycology and Plant Pathology, Swedish University of Agricultural Sciences, Uppsala, Sweden
Correspondence: Bjorn Lindahl, Department
of Forest Mycology and Pathology, Swedish
University of Agricultural Sciences, Box 7026,
SE-750 07 Uppsala, Sweden. Tel.:
+46 18 672725; fax: +46 18 673599;
e-mail: [email protected]
Received 11 May 2012; revised 15 June
2012; accepted 22 June 2012.
Final version published online 27 July 2012.
DOI: 10.1111/j.1574-6941.2012.01437.x
Editor: Ian C. Anderson
Keywords
fungal communities; PCR bias; diversity;
barcoding.
Abstract
With recent methodological advances, molecular markers are increasingly used
for semi-quantitative analyses of fungal communities. The aim to preserve
quantitative relationships between genotypes through PCR places new demands
on primers to accurately match target sites and provide short amplicons. The
internal transcribed spacer (ITS) region of the ribosome encoding genes is a
commonly used marker for many fungal groups. Here, we describe three new
primers – fITS7, gITS7 and fITS9, which may be used to amplify the fungal
ITS2 region by targeting sites in the 5.8S encoding gene. We evaluated the
primers and compared their performance with the commonly used ITS1f pri-
mer by 454-sequencing of both artificially assembled templates and field sam-
ples. When the entire ITS region was amplified using the ITS1f/ITS4 primer
combination, we found strong bias against species with longer amplicons. This
problem could be overcome by using the new primers, which produce shorter
amplicons and better preserve the quantitative composition of the template. In
addition, the new primers yielded more diverse amplicon communities than
the ITS1f primer.
Introduction
During the last 20 years, analysis of microbial communi-
ties based on amplification and sequencing of genetic
markers has revolutionized fungal ecology (Horton &
Bruns, 2001; Hibbett et al., 2009). High-throughput
methods, such as 454-pyrosequencing (Margulies et al.,
2005), enable sequencing of complex fungal communities
without prior cloning of amplicons and open up new
possibilities to identify community components, even at
low relative abundances. The high sequence output may
be used to quantify relative abundances of amplicons,
assuming that amplicon composition reflects the abun-
dance of specific templates in the samples. Even though
translation between genetic markers, biomass and activity
is often problematic (Amend et al., 2010), these new
sequencing methods open up new avenues for ecological
research by providing detailed and at least semi-quantita-
tive information on community composition. A future
development towards sequencing of environmental DNA
and RNA without prior PCR amplification may be
envisaged (Urich et al., 2008), but current analysis of
microbial communities depends on reliable PCR primers
to target specific genetic markers.
Molecular identification of fungi largely relies on
amplification of the internal transcribed spacer (ITS)
regions of the ribosome encoding genes. The ITS regions
have high evolutionary rates and are flanked by highly
conserved regions with suitable target sites for universal
primers (Begerow et al., 2010). Recently, the ITS region
was selected as the universal genetic barcode for fungi
(Schoch et al., 2012). PCR-based methods were early used
to identify pathogenic and mutualistic fungi, growing in
association with plant hosts (White et al., 1990; Gardes &
Bruns, 1993). Analyses were then restricted to samples
strongly dominated by single fungal genotypes, and a
major challenge was to avoid amplification of the plant
host DNA and co-colonizing fungi, to obtain a single,
fungal PCR product. The primers ITS1f (Gardes & Bruns,
1993), which targets a site in the ribosomal small subunit
(SSU) encoding region, and ITS4 (White et al., 1990),
which targets an ITS-flanking site in the ribosomal large
ª 2012 Federation of European Microbiological Societies FEMS Microbiol Ecol 82 (2012) 666–677Published by Blackwell Publishing Ltd. All rights reserved
MIC
ROBI
OLO
GY
EC
OLO
GY
subunit (LSU) encoding region, were devised based on
the scarce sequence information that was available at the
time. The ITS1f primer was designed based on nine fun-
gal sequences only, whereof six belonged to Boletales!With this in mind, these primers have proven highly suc-
cessful in amplifying the ITS region from a wide range of
fungal diversity, including representatives of all fungal
phyla. These primers have been used extensively, not only
in ecological studies, but also to yield phylogenetic mark-
ers for taxonomical studies. As databases of reference
sequences build up, ITS-sequencing has often turned out
to be more reliable than morphological features to iden-
tify fungal fruit bodies and cultures.
Whereas the currently used ITS primers were devel-
oped to yield PCR products from mono-specific samples,
amplification of complex fungal communities adds new
challenges. When communities are amplified, there is
competition for primers between different templates, and
also minor mismatches may disfavour taxa to the extent
that they are outcompeted from the amplicon pool. Com-
parison with sequence databases suggests that the cur-
rently used ITS primers are hampered with mismatches
relative to their target sequences for many fungal taxa
(Bellemain et al., 2010). Sequencing of environmental
samples indicates that a significant fraction of fungal
diversity remains to be discovered and described (Hibbett
et al., 2011), and by relying on primers that were devel-
oped based on limited information on primer site varia-
tion, there is a risk that important novel branches on the
fungal tree of life remain undiscovered. Furthermore, the
access to general primers without mismatches becomes
pivotal when the composition of a PCR product is to be
interpreted quantitatively and amplification bias between
species has to be minimized.
The primer ITS1f, which is commonly used in combi-
nation with the ITS4 primer to produce amplicons that
span the entire ITS region, is highly successful in amplify-
ing fungal sequences even in the presence of large
amounts of DNA from other organisms. However, for
many fungal species, the ITS1f primer displays
mismatches in relation to its target site (Bellemain
et al., 2010). Therefore, we present three alternative
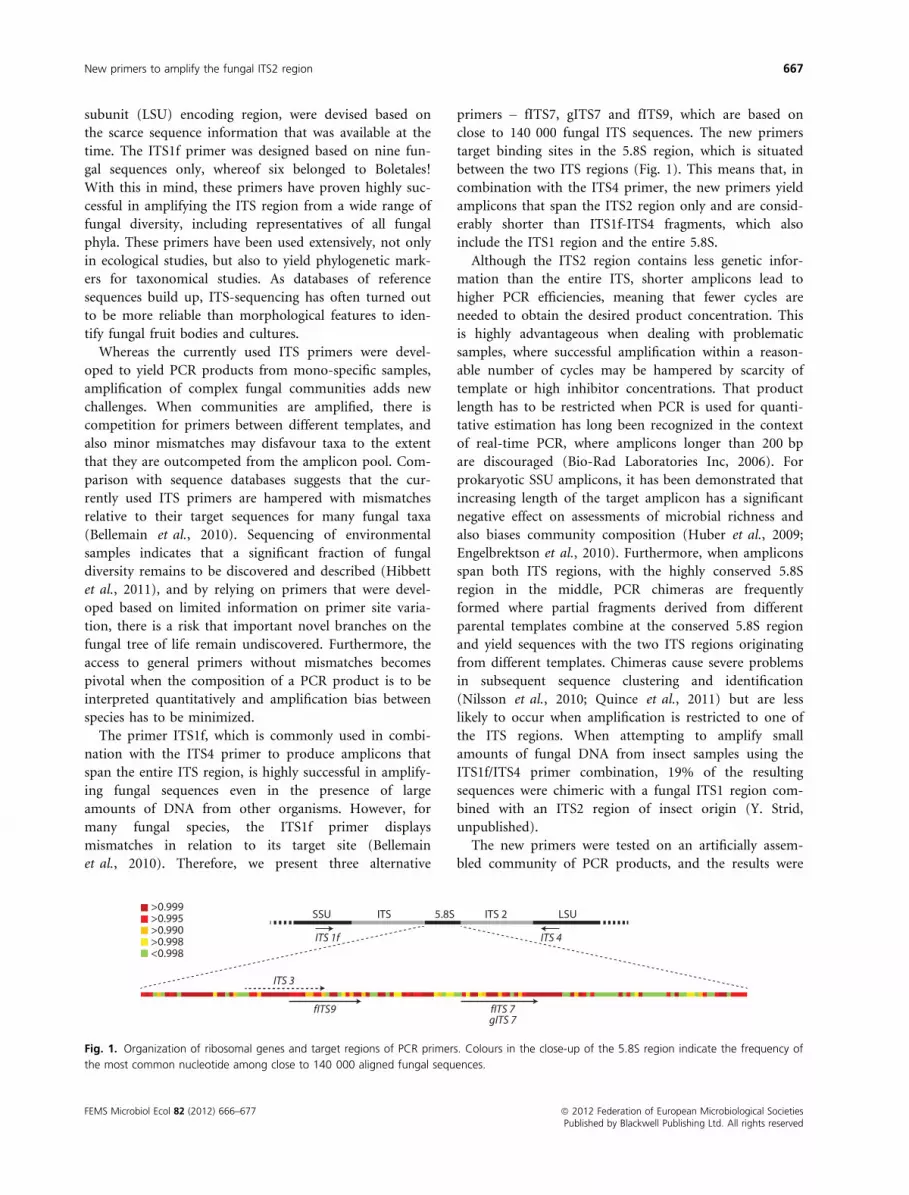
primers – fITS7, gITS7 and fITS9, which are based on
close to 140 000 fungal ITS sequences. The new primers
target binding sites in the 5.8S region, which is situated
between the two ITS regions (Fig. 1). This means that, in
combination with the ITS4 primer, the new primers yield
amplicons that span the ITS2 region only and are consid-
erably shorter than ITS1f-ITS4 fragments, which also
include the ITS1 region and the entire 5.8S.
Although the ITS2 region contains less genetic infor-
mation than the entire ITS, shorter amplicons lead to
higher PCR efficiencies, meaning that fewer cycles are
needed to obtain the desired product concentration. This
is highly advantageous when dealing with problematic
samples, where successful amplification within a reason-
able number of cycles may be hampered by scarcity of
template or high inhibitor concentrations. That product
length has to be restricted when PCR is used for quanti-
tative estimation has long been recognized in the context
of real-time PCR, where amplicons longer than 200 bp
are discouraged (Bio-Rad Laboratories Inc, 2006). For
prokaryotic SSU amplicons, it has been demonstrated that
increasing length of the target amplicon has a significant
negative effect on assessments of microbial richness and
also biases community composition (Huber et al., 2009;
Engelbrektson et al., 2010). Furthermore, when amplicons
span both ITS regions, with the highly conserved 5.8S
region in the middle, PCR chimeras are frequently
formed where partial fragments derived from different
parental templates combine at the conserved 5.8S region
and yield sequences with the two ITS regions originating
from different templates. Chimeras cause severe problems
in subsequent sequence clustering and identification
(Nilsson et al., 2010; Quince et al., 2011) but are less
likely to occur when amplification is restricted to one of
the ITS regions. When attempting to amplify small
amounts of fungal DNA from insect samples using the
ITS1f/ITS4 primer combination, 19% of the resulting
sequences were chimeric with a fungal ITS1 region com-
bined with an ITS2 region of insect origin (Y. Strid,
unpublished).
The new primers were tested on an artificially assem-
bled community of PCR products, and the results were
fITS9
ITS 3
fITS 7
>0.999>0.995>0.990>0.998<0.998
LSUSSU ITS 5.8S ITS 2
ITS 4ITS 1f
gITS 7
Fig. 1. Organization of ribosomal genes and target regions of PCR primers. Colours in the close-up of the 5.8S region indicate the frequency of
the most common nucleotide among close to 140 000 aligned fungal sequences.
FEMS Microbiol Ecol 82 (2012) 666–677 ª 2012 Federation of European Microbiological SocietiesPublished by Blackwell Publishing Ltd. All rights reserved
New primers to amplify the fungal ITS2 region 667
evaluated by 454-sequencing. Primer specificity was also
evaluated with more diverse templates from field samples.
Materials and methods
Primer design
All fungal ITS sequences at NCBI-INSD were down-
loaded, and the 5.8S region was extracted and aligned
using the BLASTN algorithm with a gap open penalty of 25
and an ascomycete query sequence, resulting in 138 546
sequences aligned across 146 bp (Fig. 1). The alignment
was compared with 5.8S sequences from selected plants,
and two regions were chosen as targets for new primers
(Fig. 1, Tables 1 and 2). One of the new primers, which
we designate fITS9 (f stands for ‘fungi’), overlaps partly
in target site with the ITS3 primer (White et al., 1990;
Fig. 1). The fITS9 primer is degenerated at two positions
and contains two inosine residues (Table 1). For the
other target site, two different primer versions were con-
structed. The gITS7 primer is degenerated at two posi-
tions (g stands either for ‘general’ or for the degeneration
to include G at position 13), whereas the fITS7 primer is
degenerated at one position only, to obtain higher speci-
ficity for fungi (Table 2). Primers were tested on various
fungal templates, and optimal primer concentrations and
annealing temperatures were established by real-time PCR
using the SYBR Green PCR kit (Life Technologies, Carls-
bad, CA) on an iQ5 system (Bio-Rad, Hercules, CA).
Artificial template
Eleven fungal species, well distributed over the fungal
phylogeny, were selected. To test for the effects of primer
mismatches on amplification, some species known from
sequence databases to have mismatches in the fITS9 pri-
mer site were included (Table 3). DNA was extracted
from fungal cultures or sporocarps according to the fol-
lowing protocol: a small amount of fungal tissue was
added to 1 mL extraction buffer (3% CTAB, 2.6 M NaCl,
0.15 M Tris–HCl, 2 mM EDTA, pH 8) and homogenized
with a pestle. After 1 h incubation at 65 °C, spinning,
extraction with chloroform and precipitation by equal
volume of isopropanol, the pellet was washed with etha-
nol and dissolved in 50 lL of water. The entire ITS
regions and flanking parts of the SSU and LSU was PCR
amplified as 773–1353 bp fragments using primers
according to Table 3. As these primers target sites outside
the ITS1f and ITS4 primers, the long fragments included
primer sites for all primers used in subsequent tests. PCR
amplification was conducted in a 2720 Thermal Cycler
(Life Technologies) in 50 lL reactions [0.25 ng lL�1
template, 200 lM of each nucleotide, 2.75 mM MgCl2,
primers at 200 nM, 0.025 U lL�1 polymerase (DreamTaq
Green, Thermo Scientific, Waltham, MA) in buffer,
5 min at 94 °C; 35 cycles of (30 s at 94 °C; 30 s at
50–67 °C; 30 s at 72 °C); 7 min at 72 °C]. The ampli-
cons were purified using the GeneJet PCR Purification kit
(Thermo Scientific, Waltham, MA), and their concentra-
tion determined with a Qubit Fluorometer (Life Technol-
ogies). The entire fragments were sequenced by
Macrogene Inc., Seoul, Korea (NCBI accession numbers
are provided in Table 3).
Two mixed templates were assembled by adding the
PCR products from all species: (1) all species were added
at equal concentrations or (2) species were added with an
order of magnitude difference in concentration between
them, so that the most abundant template in the mixture
had 104 times higher concentration than the least abun-
dant. PCR was conducted using the ITS4 primer (White
et al., 1990) extended with 8 bp sample identification tags
in combination with either ITS1f (Gardes & Bruns, 1993),
gITS7 or fITS9. The sample identifying tags were designed
using the BARCRAWL software (Frank, 2009).
Each of the two artificial templates was amplified with
the three different forward primers and 20 technical repli-
cates, totalling 120 PCRs, all with unique identification
tags. PCR amplification was conducted as described pre-
viously but with only 25 cycles as well as different primer
concentrations (300 nM tagged ITS4 and either of
300 nM ITS1f, 500 nM gITS7, or 1000 nM fITS9) and
annealing temperatures (58 °C for ITS1f; 56 °C for gITS7;
55 °C for fITS9). PCR products were purified using the
AMPure kit (Beckman Coulter, Brea, CA). Concentra-
tions were established using a NanoDrop 2000 spectro-
photometer (Thermo Scientific), and PCR products were
mixed in equal molar proportion into a general sample,
which was further purified using Agarose gel electropho-
resis and the QIAquick Gel Extraction kit (Qiagen,
Hilden, Germany), freeze-dried and subjected to
454-sequencing after addition of sequencing adaptors by
ligation. Adaptor ligation and sequencing was performed
by LGC Genomics GmbH (Berlin, Germany) on a GL
FLX Titanium system (Roche, Basel, Switzerland).
Field samples
DNA was extracted from three samples each of soil, wood,
wheat roots and hay. Soil samples were collected in late
summer from a subarctic birch forest in northern Sweden,
with each sample consisting of eight pooled cores from the
organic horizon. Winter wheat roots were sampled in early
spring from a field in central Sweden, with each sample
consisting of 10 pooled root systems. One of the hay sam-
ples consisted of preconserved forage and the two other of
postconserved haylage from a grass-dominated ley in Swe-
ª 2012 Federation of European Microbiological Societies FEMS Microbiol Ecol 82 (2012) 666–677Published by Blackwell Publishing Ltd. All rights reserved
668 K. Ihrmark et al.

den. Wood samples were collected from decaying Norway
spruce logs by drilling. From the root samples, DNA was
extracted using the DNeasy Plant Mini kit (Qiagen),
whereas from the other samples, DNA was extracted with
CTAB buffer as described earlier. Soil samples were further
purified with the Wizard DNA clean-up system (Promega,
Madison, WI), and wood samples were purified using the
JetQuick DNA purification kit (Genomed GmbH, Lohne,
Germany).
The DNA samples were subjected to PCR amplification
and sequencing as described previously, but the primer
fITS7 was also included (500 nM, 57 °C annealing
Table 1. Primer sequence and target site for the primer fITS9
Frequency among
fungi (%)
G 99.7 A 99.8 A 99.6 C 99.9 G 99.4 C 99.2 A 99.8 G 99.8 C 99.2 G 96.9 A 99.9 A 99.9 A 97.3 T 98.3 G 99.8 C 99.0 G 99.9 A 99.9
T 0.7 T 0.7 A 3.0 T 1.4 C 1.6 T 0.9
C 0.7
G 0.5
fITS9 primer sequence G A A C G C A G C R A A I I G Y G A
Pinus sylvestris
(AF037003)
G A A C G T A C C G A A A T G C G A
Picea glauca
(AF136618)
G A A C G T A G C G A A A T G C G A
Betula pendula
(AJ006445)
G A A C G T A G C G A A A T G C G A
Vaccinium vitis-idaea
(GU361898)
G A A C G T A G C G A A A T G C G A
Triticum aestivum
(FJ196304)
G A A C G T A G C G A A A T G C G A
Stellaria media
(EU785985)
G A A C G T A G C G A A A T G C G A
Dicranum fuscescens
(HQ830331)
G A A C G C A G C G A A A T G C G A
Marchantia polymorpha
(AY342317)
G A A C G C A G C G A A A T G C G A
Trebouxia simplex
(EU558676)
G A A C G C A G C G A A A T G C G A
Fungal nucleotide frequencies are based on close to 140 000 sequences (only frequencies > 0.5% are shown). Selected plant sequences are
included for comparison.
Table 2. Primer sequences and target site for the primers gITS7 and fITS7
Frequency
among
fungi (%)
G 99.8 T 98.9 G 99.9 A 99.9 A 98.3 T 99.0 C 99.9 A 99.9 T 99.9 C 99.4 G 99.6 A 99.9 A 93.5 T 99.9 C 99.1 T 99.6 T 99.9 T 99.9 G 99.9
C 1.0 G 1.6 C 0.9 T 0.5 G 6.5 T 0.8
gITS7 primer
sequence
G T G A R T C A T C G A R T C T T T G
fITS7 primer
sequence
G T G A R T C A T C G A A T C T T T G
Pinus sylvestris
(AF037003)
G T G A A T C A T C G A G T T T T T G
Picea glauca
(AF136618)
G T G A A T C A T C G A G T T T T T G
Betula pendula
(AJ006445)
G T G A A C C A T C G A G T C T T T G
Vaccinium
vitis-idaea
(GU361898)
G T G A A C C A T C G A G T C T T T G
Triticum
aestivum
(FJ196304)
G C G A A C C A T C G A G T C T T T G
Stellaria media
(EU785985)
G C G A A T C A T C G A G T C T T T G
Dicranum
fuscescens
(HQ830331)
G C G A A T C A T C G A G T C T T T G
Marchantia
polymorpha
(AY342317)
G C G A A T C A T C G A G T T T T T G
Trebouxia
simplex
(EU558676)
G T G A A T C A T C G A A T C T T T G
Fungal nucleotide frequencies are based on close to 140 000 sequences (only frequencies > 0.5% are shown). Selected plant sequences are
included for comparison.
FEMS Microbiol Ecol 82 (2012) 666–677 ª 2012 Federation of European Microbiological SocietiesPublished by Blackwell Publishing Ltd. All rights reserved
New primers to amplify the fungal ITS2 region 669
temperature). Each of the 12 samples was, thus, amplified
using four different forward primers and with five PCR
replicates. However, for the field samples, all PCR repli-
cates used the same sample identification tag. DNA was
also extracted from wood colonizing bark beetles, which
are suspected to act as fungal dispersal agents. Four sam-
ples from different bark beetle species were amplified
using the fITS9/ITS4 primer combination with 58 °Cannealing temperature. PCR products were purified using
the PCR-M kit (Viogene-Biotek, New Taipei City, Tai-
wan), cloned into E. coli cells using the TOPO-TA kit
(Life Technologies), re-amplified and sequenced by Macro-
gene Inc., Seoul, Korea.
Sequence analysis
Sequences were analysed using the SCATA pipeline
(scata.mykopat.slu.se). Sequences with an average quality
score below 20 or with score below 10 at any position
were discarded using the high-quality region extraction
option. Sequences from the artificial templates were
trimmed at the ITS4 and gITS7 primer sites (primer
sequences were also removed). By trimming at the gITS7
primer site, which was conserved among all templates in
the artificial communities, all sequences were cropped to
equal length, regardless of which primer was used for
amplification. Thus, clustering was based on 38 bp of the
LSU, the entire ITS2 region (122–245 bp) and 50–55 bp
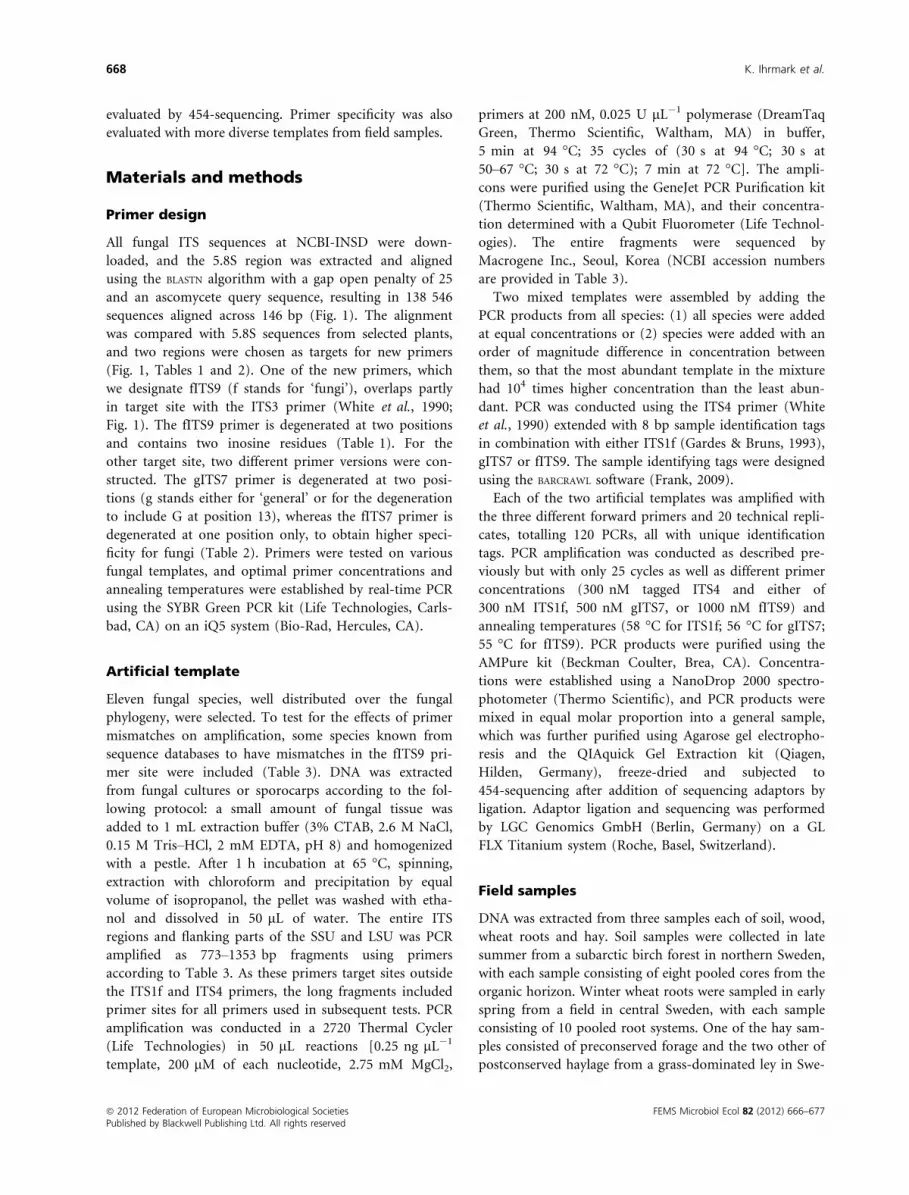
Table 3. Species used to assemble an artificial community template for primer testing
Species Phylum, order
ITS1f-4
length (bp) Primers* Primer target sites†NCBI
accession
Amanita crocea (F) Basidiomycota, Agaricales 624 NSA3 – NLC2 ITS1f CTTGGTCATTTAGAGGAAGTAA JQ912665
f/gITS7 GTGAATCATCGAATCTTTG
fITS9 GAACACAGCGAAATGTGA
Cortinarius
purpurascens (C)
Basidiomycota, Agaricales 719 NSA3 – NLC2 ITS1f CTTGGTCATTTAGAGGAAGTAA JQ912666
f/gITS7 GTGAATCATCGAATCTTTG
fITS9 GAACGCAGCGAAATGCGT
Sistotrema
brinkmannii (C)
Basidiomycota, Cantharellales 671 NSA3 – NLC2 ITS1f CTTGGTCATTTAGAGGAAGTAA JQ912675
f/gITS7 GTGAATCATCGAATCTTTG
fITS9 GAACGCAGCGAAATGCGA
Melampsora
laricis-populina (S)
Basidiomycota, Pucciniales 721 BMB CR – NLC2 ITS1f CTTGGTCATTTAGAGGAAGTA JQ912668
f/gITS7 GTGAATCATCGAATCTTTG
fITS9 GAACACAGTGAAATGTGA
Fusarium poae (C) Ascomycota, Hypocreales 575 NSA3 – NLC2 ITS1f CTCGGTCATTTAGAGGAAGTAA JQ912669
f/gITS7 GTGAATCATCGAATCTTTG
fITS9 GAACGCAGCAAAATGCGA
Hymenoscyphus
albidus (C)
Ascomycota, Helotiales 910 NSA3 – NLC2 ITS1f CTTGGTCATTTAGAGGAAGTAA JQ912670
f/gITS7 GTGAATCATCGAATCTTTG
fITS9 GAACGCAGCGAAATGCGA
Rhizina undulata (C) Ascomycota, Pezizales 662 NSA3 – NLC2 ITS1f CTTGGTCATTTAGAGGAAGTAA JQ912674
f/gITS7 GTGAATCATCGAATCTTTG
fITS9 GAACGCAGCGAAATGCGA
Debaryomyces
hansenii (C)
Ascomycota,
Saccharomycetales
677 NSA3 – NLC2 ITS1f CTTGGTCATTTAGAGGAAGTAA JQ912667
f/gITS7 GTGAATCATCGAATCTTTG
fITS9 GAACGCAGCGAAATGCGA
Archaeorhizomyces
finlayi (C)
Ascomycota,
Archaeorhizomycetales
515 NSA3 – NLC2 ITS1f CTTGGTCATTTAGAGGAAGTAA JQ912673
f/gITS7 GTGAATCATCGAATCTTTG
fITS9 GAACGCAGCGAAGCGCGA
Umbelopsis sp. (C) Mucoromycotina, Mucorales 656 BMB CR – LR1 ITS1f CTTGGTCGTTTAGAGGAAGTAA JQ912671
f/gITS7 GTGAATCATCGAATCTTTG
fITS9 GAACGCAGCGAAATGCGA
Mucor hiemales (C) Mucoromycotina, Mucorales 681 BMB CR – LR1 ITS1f CTAGGCTATTTAGAGGAAGTAA JQ912672
f/gITS7 GTGAATCATCGA G TCTTTG
fITS9 GAACGTAGCAAAGTGCGA
(F) indicates that DNA was extracted from fruit body material, whereas (C) indicates that a pure culture was used and (S) indicates that spores
were used. The length of PCR products obtain with the primers ITS1f/ITS4 is indicated. For construction of the template, longer PCR products
were produced using the indicated primers. Primer site sequences are indicated with mismatching bases in boxes. The shaded box in the Mucor
f/gITS7 binding site indicates a mismatch with fITS7 but not with gITS7.
*NSA3, NLC2 Martin & Rygiewicz, 2005; BMB CR Lane et al., 1985; LR1 van Tuinen et al., 1998.†All species matches the ITS4 primer site, except A. finlayi TCCTCGCCTTATTGATATGC.
ª 2012 Federation of European Microbiological Societies FEMS Microbiol Ecol 82 (2012) 666–677Published by Blackwell Publishing Ltd. All rights reserved
670 K. Ihrmark et al.
of the 5.8S unit. Sequences were then compared for simi-
larity using BLAST as a search engine. Pairwise alignments
were scored using a scoring function with 1 in penalty
for mismatch, 0 for gap opening and 1 for gap extension.
Homopolymers were collapsed to 3 bp before clustering.
Sequences were assembled into clusters (species) by single
linkage clustering with 2.5% maximum distance allowed
for sequences to enter clusters. Sequences that only
occurred once in the entire data set (global singletons)
were excluded in further analyses.
Variance in species relative abundances between the 20
replicated PCRs was partitioned into two components;
one because of random community distortion during
PCR amplification and one as a result of random sam-
pling of amplicons for 454-sequencing. The sampling of
amplicons for sequencing was considered a Bernoulli trial,
and the variance in species frequency was calculated as:
pð1� pÞn
where p is the average frequency of the species and n is
the average number of reads among the 20 replicate sam-
ples. The residual variance was assumed to be associated
with random distortion of the community during PCR
amplification.
After identification and trimming of the ITS4 primer
and associated sample tags from the field sample
sequences, the shortest sequence derived with the gITS7
primer was 211 bp (with the exception of a small number
of shorter reads assigned to a Candida sp.). To equalize
lengths, all sequences were trimmed to 210 bp. Thus,
clustering was based on 38 bp of the LSU, 108–172 bp of
the ITS2 region and 0–64 bp of the 5.8S unit. Clustering
was performed as described previously, but with the clus-
tering distance set to 1.5%. Representative sequences of
all clusters (OTUs) were compared with all fungal
sequences in the NCBI nr database by BLASTN using the
MASSBLASTER (part of the PLUTOF software; Abarenkov et al.,
2010). OTUs with no or few good matches to fungal ITS
sequences were compared with the entire NCBI nr data-
base manually, and those of nonfungal origin were
removed before further analyses. To investigate
differences in OTU composition between amplicons
derived from the same sample but with different primers,
Bray–Curtis dissimilarities were calculated in PC-ORD
(v. 5.33d) based on relative abundances of amplicons.
Variation in Bray–Curtis dissimilarity between different
pairwise combinations of forward primers was analysed
for statistical significance by ANOVA. To investigate the
effect of primer choice on amplicon diversity, amplicon
communities from each sample were randomly rarefied to
the size of the smallest (which was always that obtained
with the ITS1f primer) using Excel 2010 (Microsoft, Red-
mond, WA). OTU richness, Shannon index and evenness
(Shannon index/ln OTU richness) were calculated as
averages of 10 random rarefactions. Effects of forward
primer on diversity parameters were tested for statistical
significance by ANOVA with ‘sample’ included as an
explaining variable. The analysis was repeated without
ITS1f samples, to gain precision by enabling a lower
degree of rarefaction. A more detailed analysis also
included the interaction term primer 9 substrate.
Results
Artificial templates
Sequencing of the artificial communities after amplifica-
tion with the primers ITS1f, fITS9 or gITS7 in combina-
tion with ITS4 yielded 670 260 reads, of which 65%
passed the quality filtering. Sequence data is available as a
single, nonfiltered file at the NCBI Sequence Read Archive
with accession number SRA052087. A list of sample iden-
tifying tags is included as Table S1, Supporting Informa-
tion. A small proportion of the reads was attributed to
contamination by nontarget fungi (3.3%) and PCR chi-
meras (10 reads) and was removed prior to further analy-
ses. The reads were unevenly distributed over the
sequenced samples. For samples with mixed species, the
number of reads per sample ranged from 80 to 14 792
(average 3471). It is noteworthy that samples labelled
with identifier tags starting with A had, on average, three
times as many reads as samples with tags starting with T.
Although supplied to the species mix in equal propor-
tions, fungal species with mismatches in their primer sites
all had low representation among the reads. The excep-
tion was Fusarium poae, which amplified well with the
ITS1f primer in spite of a mismatch at the very 5′ end of
the primer (Table 3). Archaeorhizomyces finlayi was disfa-
voured with all primers owing to a mismatch at the ITS4
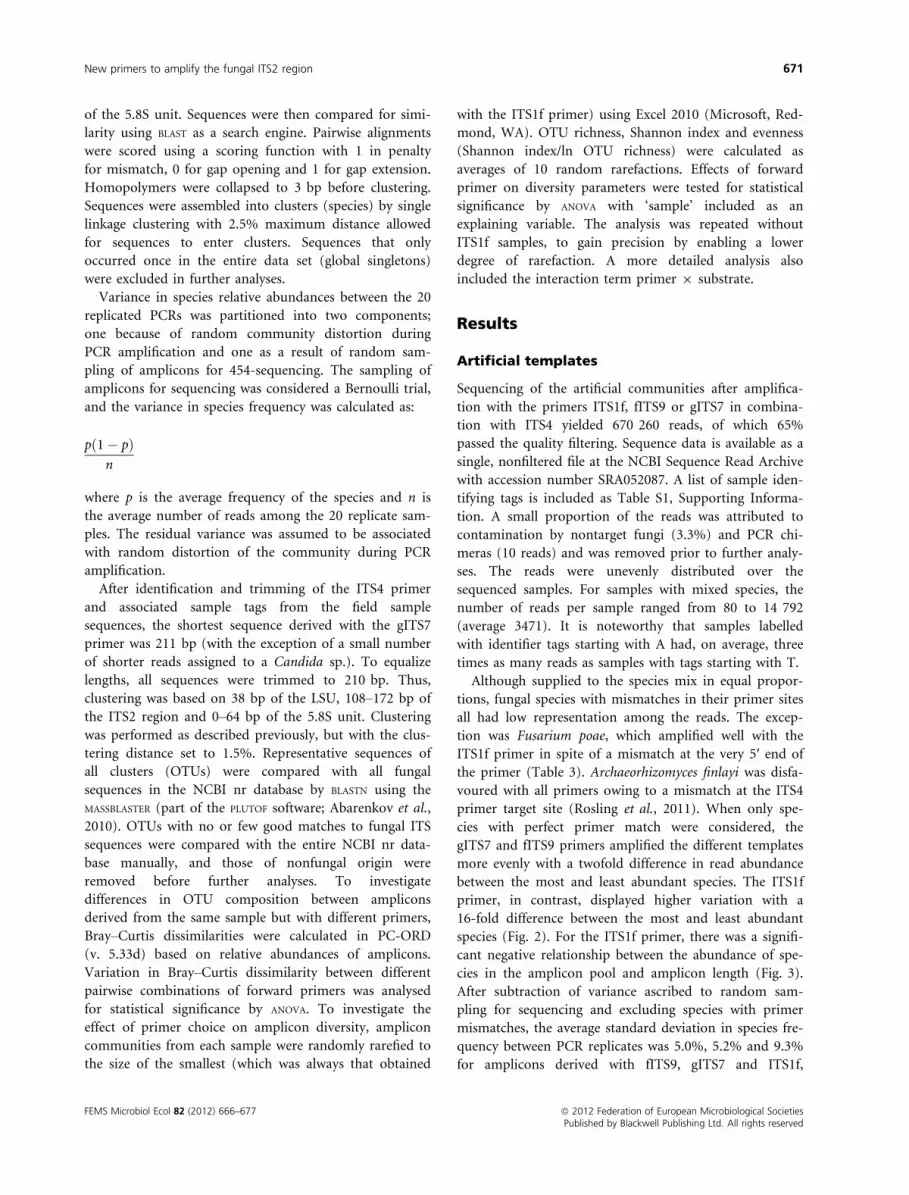
primer target site (Rosling et al., 2011). When only spe-
cies with perfect primer match were considered, the
gITS7 and fITS9 primers amplified the different templates
more evenly with a twofold difference in read abundance
between the most and least abundant species. The ITS1f
primer, in contrast, displayed higher variation with a
16-fold difference between the most and least abundant
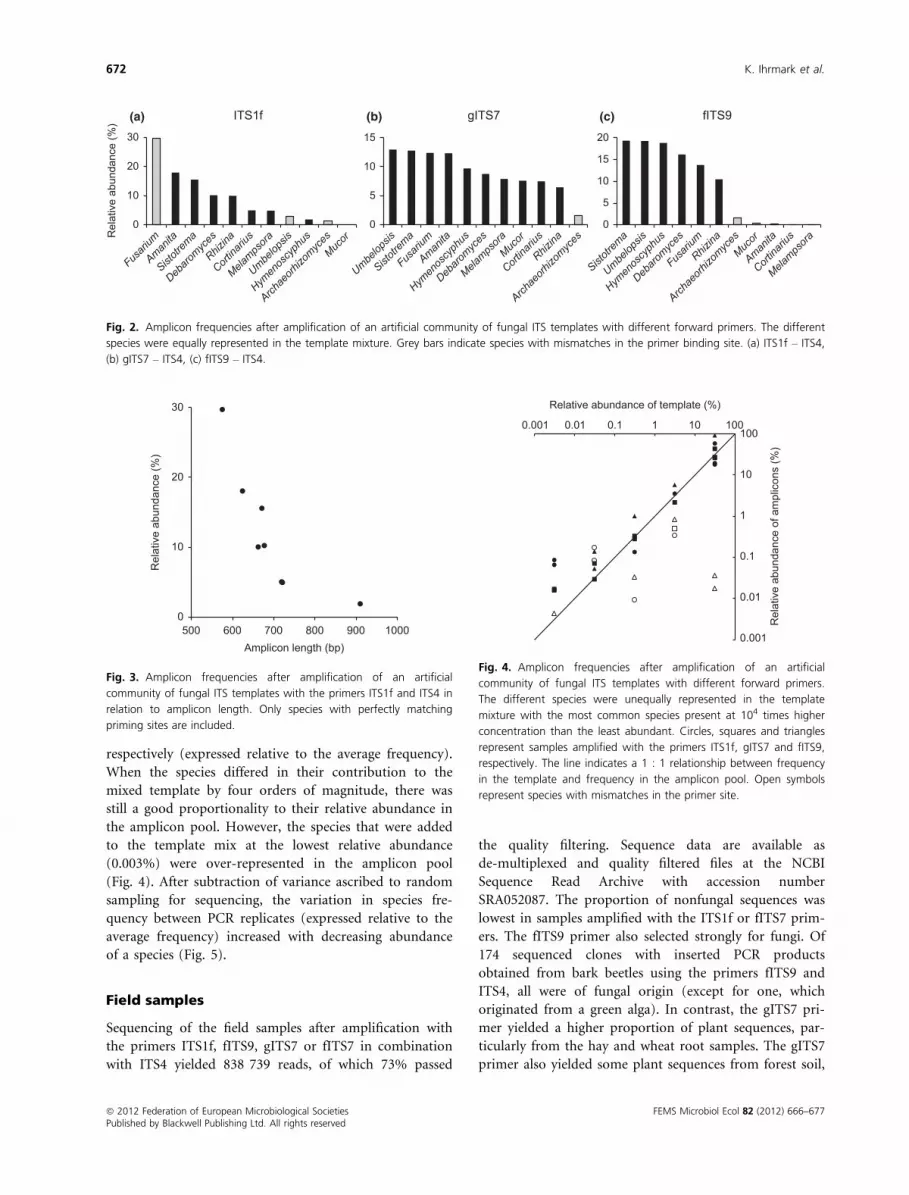
species (Fig. 2). For the ITS1f primer, there was a signifi-
cant negative relationship between the abundance of spe-
cies in the amplicon pool and amplicon length (Fig. 3).
After subtraction of variance ascribed to random sam-
pling for sequencing and excluding species with primer
mismatches, the average standard deviation in species fre-
quency between PCR replicates was 5.0%, 5.2% and 9.3%
for amplicons derived with fITS9, gITS7 and ITS1f,
FEMS Microbiol Ecol 82 (2012) 666–677 ª 2012 Federation of European Microbiological SocietiesPublished by Blackwell Publishing Ltd. All rights reserved
New primers to amplify the fungal ITS2 region 671
respectively (expressed relative to the average frequency).
When the species differed in their contribution to the
mixed template by four orders of magnitude, there was
still a good proportionality to their relative abundance in
the amplicon pool. However, the species that were added
to the template mix at the lowest relative abundance
(0.003%) were over-represented in the amplicon pool
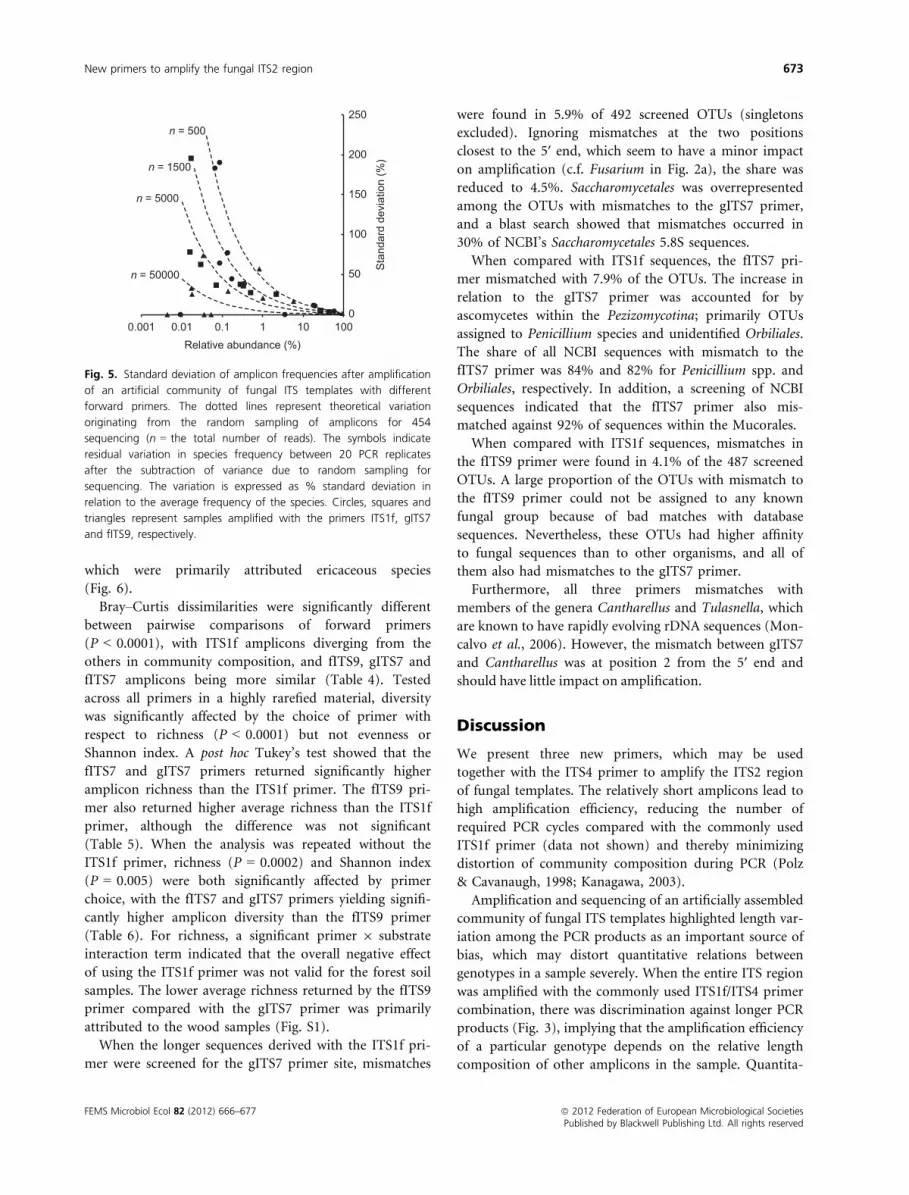
(Fig. 4). After subtraction of variance ascribed to random
sampling for sequencing, the variation in species fre-
quency between PCR replicates (expressed relative to the
average frequency) increased with decreasing abundance
of a species (Fig. 5).
Field samples
Sequencing of the field samples after amplification with
the primers ITS1f, fITS9, gITS7 or fITS7 in combination
with ITS4 yielded 838 739 reads, of which 73% passed
the quality filtering. Sequence data are available as
de-multiplexed and quality filtered files at the NCBI
Sequence Read Archive with accession number
SRA052087. The proportion of nonfungal sequences was
lowest in samples amplified with the ITS1f or fITS7 prim-
ers. The fITS9 primer also selected strongly for fungi. Of
174 sequenced clones with inserted PCR products
obtained from bark beetles using the primers fITS9 and
ITS4, all were of fungal origin (except for one, which
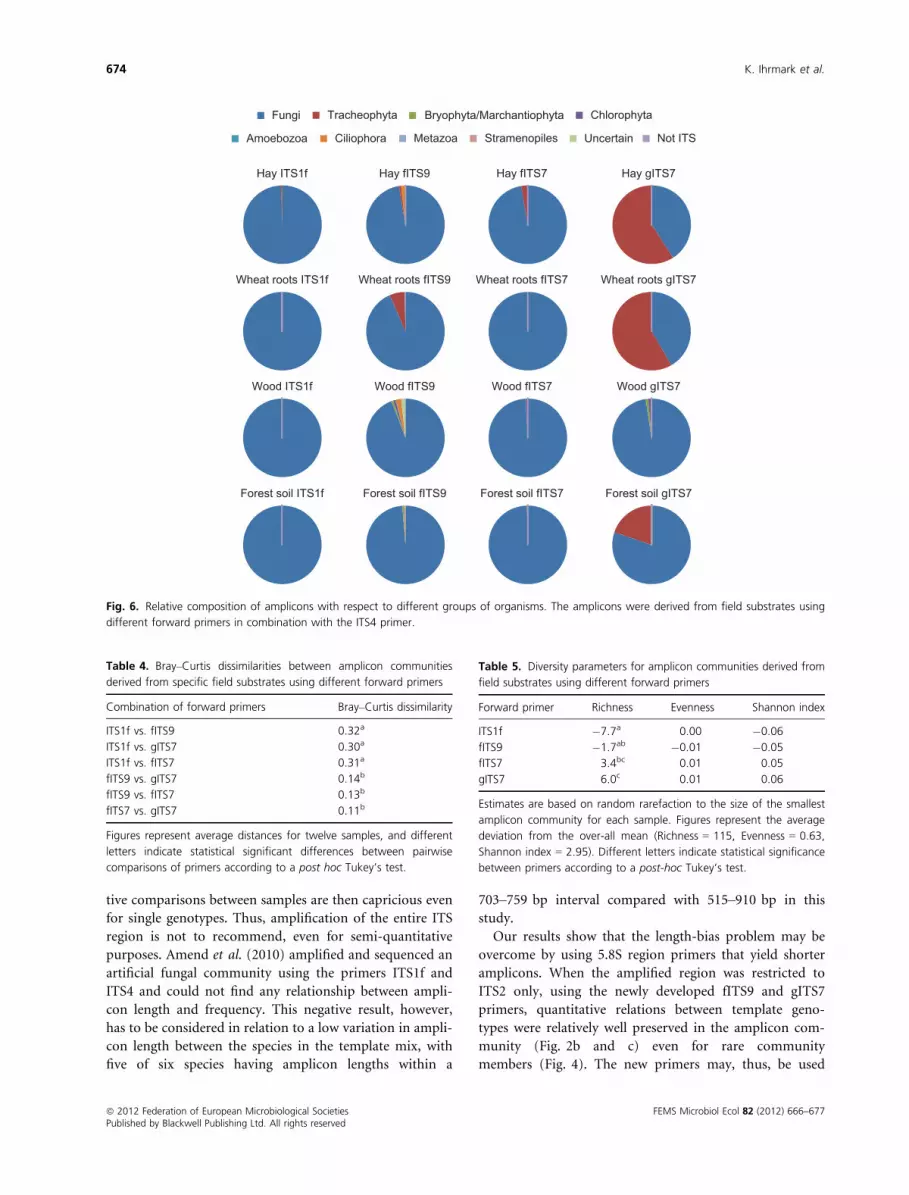
originated from a green alga). In contrast, the gITS7 pri-
mer yielded a higher proportion of plant sequences, par-
ticularly from the hay and wheat root samples. The gITS7
primer also yielded some plant sequences from forest soil,
ITS1f
0
10
20
30
Fusarium
Amanita
Sistotrema
Debaromyces
Rhizina
Cortinarius
Melampsora
Umbelopsis
Hymenoscyphus
Archaeorhizomyces
Mucor
gITS7
0
5
10
15
Fusarium
Amanita
Sistotrema
Debaromyces
Rhizina
Cortinarius
Melampsora
Umbelopsis
Hymenoscyphus
Archaeorhizomyces
Mucor
fITS9
0
5
10
15
20
Fusarium
Amanita
Sistotrema
Debaromyces
Rhizina
Cortinarius
Melampsora
Umbelopsis
Hymenoscyphus
Archaeorhizomyces
Mucor
(c)(b)(a)R
elat
ive
abun
danc
e (%
)
Fig. 2. Amplicon frequencies after amplification of an artificial community of fungal ITS templates with different forward primers. The different
species were equally represented in the template mixture. Grey bars indicate species with mismatches in the primer binding site. (a) ITS1f – ITS4,
(b) gITS7 – ITS4, (c) fITS9 – ITS4.
0
10
20
30
500 600 700 800 900 1000
Rel
ativ
e ab
unda
nce
(%)
Amplicon length (bp)
Fig. 3. Amplicon frequencies after amplification of an artificial
community of fungal ITS templates with the primers ITS1f and ITS4 in
relation to amplicon length. Only species with perfectly matching
priming sites are included.
0.001
0.01
0.1
1
10
1000.001 0.01 0.1 1 10 100
Rel
ativ
e ab
unda
nce
of a
mpl
icon
s (%
)
Relative abundance of template (%)
Fig. 4. Amplicon frequencies after amplification of an artificial
community of fungal ITS templates with different forward primers.
The different species were unequally represented in the template
mixture with the most common species present at 104 times higher
concentration than the least abundant. Circles, squares and triangles
represent samples amplified with the primers ITS1f, gITS7 and fITS9,
respectively. The line indicates a 1 : 1 relationship between frequency
in the template and frequency in the amplicon pool. Open symbols
represent species with mismatches in the primer site.
ª 2012 Federation of European Microbiological Societies FEMS Microbiol Ecol 82 (2012) 666–677Published by Blackwell Publishing Ltd. All rights reserved
672 K. Ihrmark et al.
which were primarily attributed ericaceous species
(Fig. 6).
Bray–Curtis dissimilarities were significantly different
between pairwise comparisons of forward primers
(P < 0.0001), with ITS1f amplicons diverging from the
others in community composition, and fITS9, gITS7 and
fITS7 amplicons being more similar (Table 4). Tested
across all primers in a highly rarefied material, diversity
was significantly affected by the choice of primer with
respect to richness (P < 0.0001) but not evenness or
Shannon index. A post hoc Tukey’s test showed that the
fITS7 and gITS7 primers returned significantly higher
amplicon richness than the ITS1f primer. The fITS9 pri-
mer also returned higher average richness than the ITS1f
primer, although the difference was not significant
(Table 5). When the analysis was repeated without the
ITS1f primer, richness (P = 0.0002) and Shannon index
(P = 0.005) were both significantly affected by primer
choice, with the fITS7 and gITS7 primers yielding signifi-
cantly higher amplicon diversity than the fITS9 primer
(Table 6). For richness, a significant primer 9 substrate
interaction term indicated that the overall negative effect
of using the ITS1f primer was not valid for the forest soil
samples. The lower average richness returned by the fITS9
primer compared with the gITS7 primer was primarily
attributed to the wood samples (Fig. S1).
When the longer sequences derived with the ITS1f pri-
mer were screened for the gITS7 primer site, mismatches
were found in 5.9% of 492 screened OTUs (singletons
excluded). Ignoring mismatches at the two positions
closest to the 5′ end, which seem to have a minor impact
on amplification (c.f. Fusarium in Fig. 2a), the share was
reduced to 4.5%. Saccharomycetales was overrepresented
among the OTUs with mismatches to the gITS7 primer,
and a blast search showed that mismatches occurred in
30% of NCBI’s Saccharomycetales 5.8S sequences.
When compared with ITS1f sequences, the fITS7 pri-
mer mismatched with 7.9% of the OTUs. The increase in
relation to the gITS7 primer was accounted for by
ascomycetes within the Pezizomycotina; primarily OTUs
assigned to Penicillium species and unidentified Orbiliales.
The share of all NCBI sequences with mismatch to the
fITS7 primer was 84% and 82% for Penicillium spp. and
Orbiliales, respectively. In addition, a screening of NCBI
sequences indicated that the fITS7 primer also mis-
matched against 92% of sequences within the Mucorales.
When compared with ITS1f sequences, mismatches in
the fITS9 primer were found in 4.1% of the 487 screened
OTUs. A large proportion of the OTUs with mismatch to
the fITS9 primer could not be assigned to any known
fungal group because of bad matches with database
sequences. Nevertheless, these OTUs had higher affinity
to fungal sequences than to other organisms, and all of
them also had mismatches to the gITS7 primer.
Furthermore, all three primers mismatches with
members of the genera Cantharellus and Tulasnella, which
are known to have rapidly evolving rDNA sequences (Mon-
calvo et al., 2006). However, the mismatch between gITS7
and Cantharellus was at position 2 from the 5′ end and
should have little impact on amplification.
Discussion
We present three new primers, which may be used
together with the ITS4 primer to amplify the ITS2 region
of fungal templates. The relatively short amplicons lead to
high amplification efficiency, reducing the number of
required PCR cycles compared with the commonly used
ITS1f primer (data not shown) and thereby minimizing
distortion of community composition during PCR (Polz
& Cavanaugh, 1998; Kanagawa, 2003).
Amplification and sequencing of an artificially assembled
community of fungal ITS templates highlighted length var-
iation among the PCR products as an important source of
bias, which may distort quantitative relations between
genotypes in a sample severely. When the entire ITS region
was amplified with the commonly used ITS1f/ITS4 primer
combination, there was discrimination against longer PCR
products (Fig. 3), implying that the amplification efficiency
of a particular genotype depends on the relative length
composition of other amplicons in the sample. Quantita-
0
50
100
150
200
250
0.001 0.01 0.1 1 10 100
Sta
ndar
d de
viat
ion
(%)
Relative abundance (%)
n = 500
n = 5000
n = 50000
n = 1500
Fig. 5. Standard deviation of amplicon frequencies after amplification
of an artificial community of fungal ITS templates with different
forward primers. The dotted lines represent theoretical variation
originating from the random sampling of amplicons for 454
sequencing (n = the total number of reads). The symbols indicate
residual variation in species frequency between 20 PCR replicates
after the subtraction of variance due to random sampling for
sequencing. The variation is expressed as % standard deviation in
relation to the average frequency of the species. Circles, squares and
triangles represent samples amplified with the primers ITS1f, gITS7
and fITS9, respectively.
FEMS Microbiol Ecol 82 (2012) 666–677 ª 2012 Federation of European Microbiological SocietiesPublished by Blackwell Publishing Ltd. All rights reserved
New primers to amplify the fungal ITS2 region 673
tive comparisons between samples are then capricious even
for single genotypes. Thus, amplification of the entire ITS
region is not to recommend, even for semi-quantitative
purposes. Amend et al. (2010) amplified and sequenced an
artificial fungal community using the primers ITS1f and
ITS4 and could not find any relationship between ampli-
con length and frequency. This negative result, however,
has to be considered in relation to a low variation in ampli-
con length between the species in the template mix, with
five of six species having amplicon lengths within a
703–759 bp interval compared with 515–910 bp in this
study.
Our results show that the length-bias problem may be
overcome by using 5.8S region primers that yield shorter
amplicons. When the amplified region was restricted to
ITS2 only, using the newly developed fITS9 and gITS7
primers, quantitative relations between template geno-
types were relatively well preserved in the amplicon com-
munity (Fig. 2b and c) even for rare community
members (Fig. 4). The new primers may, thus, be used
Hay ITS1f Hay fITS9 Hay fITS7 Hay gITS7
Wheat roots ITS1f Wheat roots fITS9 Wheat roots fITS7 Wheat roots gITS7
Wood ITS1f Wood fITS9 Wood fITS7 Wood gITS7
Forest soil ITS1f Forest soil fITS9 Forest soil fITS7 Forest soil gITS7
Fungi Tracheophyta Bryophyta/Marchantiophyta Chlorophyta
Amoebozoa Ciliophora Metazoa Stramenopiles Uncertain Not ITS
Fig. 6. Relative composition of amplicons with respect to different groups of organisms. The amplicons were derived from field substrates using
different forward primers in combination with the ITS4 primer.
Table 4. Bray–Curtis dissimilarities between amplicon communities
derived from specific field substrates using different forward primers
Combination of forward primers Bray–Curtis dissimilarity
ITS1f vs. fITS9 0.32a
ITS1f vs. gITS7 0.30a
ITS1f vs. fITS7 0.31a
fITS9 vs. gITS7 0.14b
fITS9 vs. fITS7 0.13b
fITS7 vs. gITS7 0.11b
Figures represent average distances for twelve samples, and different
letters indicate statistical significant differences between pairwise
comparisons of primers according to a post hoc Tukey’s test.
Table 5. Diversity parameters for amplicon communities derived from
field substrates using different forward primers
Forward primer Richness Evenness Shannon index
ITS1f �7.7a 0.00 �0.06
fITS9 �1.7ab �0.01 �0.05
fITS7 3.4bc 0.01 0.05
gITS7 6.0c 0.01 0.06
Estimates are based on random rarefaction to the size of the smallest
amplicon community for each sample. Figures represent the average
deviation from the over-all mean (Richness = 115, Evenness = 0.63,
Shannon index = 2.95). Different letters indicate statistical significance
between primers according to a post-hoc Tukey’s test.
ª 2012 Federation of European Microbiological Societies FEMS Microbiol Ecol 82 (2012) 666–677Published by Blackwell Publishing Ltd. All rights reserved
674 K. Ihrmark et al.
for semi-quantitative analyses of between-sample differ-
ences in fungal community composition. It should be
stressed, however, that translation from ITS template
abundance to fungal biomass or activity is not trivial
because of interspecific differences in genome ITS copy
numbers and density of nuclei in biomass. Therefore, one
has to be very careful when conclusions are drawn based
on within-sample differences in ITS abundance between
community components (Amend et al., 2010).
Most likely, the length biases originated during the first
PCR amplification but may have been further augmented
during the emulsion PCR, which is conducted during
preparation of samples for 454-sequencing. The emulsion
PCR is claimed to be less prone to length biases than
ordinary PCR, but when amplicons of mixed origin are
subjected to 454-sequencing, it is recommended to keep
the variation in amplicon length within a 150 bp span
(454 Life Sciences Corp., 2011). This is possible when
amplifying the ITS2 region, but not always when the
entire ITS region is targeted.
The PCR cycling programs used in this test were based
on standard parameter settings commonly used in many
laboratories. It might be possible to overcome some of
the biases experienced in connection with long PCR
products by increasing the elongation time. Elongation
times were not optimized in the present study, but it
seems unlikely that the observed 16-fold difference in
amplicon abundance ascribed to template length variation
could be fully ameliorated by extending the duration of
PCR cycles.
Single mismatches close to the 5′ end of the primers,
even 14 bp from the 3′ end in the case of the Amanita
template, drastically reduced amplification efficiency and
resulted in a two orders of magnitude decrease in ampli-
con abundance (Fig. 2). Unexpectedly large effects of mis-
matches far from the 3′ end have previously been
observed during amplification of SSU markers from bac-
terial communities (Engelbrektson et al., 2010). Although
a primer with such a minute mismatch would be likely to
yield a fine PCR product from a single-species template,
competition between templates for primers may increase
the demand for primer accuracy in mixed templates.
Thus, degeneration at a single position (Table 2) allowed
the gITS7 primer to readily amplify various plant tem-
plates, in contrast to the fITS7 primer, which specifically
amplified fungal templates (Fig. 6). The fITS9 primer
selected strongly in favour of fungi because of a single
mismatch with most plant templates closer to the 5′ end(Table 1), but some templates from plants and protozoa
were still amplified. Using the fITS9 primer, it was possi-
ble to derive nonchimeric ITS sequences from the fungal
community associated with bark beetles – something
which has previously been a major challenge (Y. Strid,
unpublished).
The sensitivity to primer mismatches further empha-
sizes the risk of selection biases (Bellemain et al., 2010)
and makes the design of primers to amplify all members
of the fungal kingdom, but yet to discriminate against
nonfungal templates, a major challenge. The gITS7 primer
mismatches with some species within Saccharomycetales,
and the fITS7 primer excludes most Penicillium species as
well as species within the Orbiliales and Mucorales. In
addition, some groups of unidentifiable sequences, seem-
ingly of fungal origin, did not match with any of the new
primers. Mismatches at both of these conserved primer
sites could indicate rapid evolution of the 5.8 region in
some groups, similar to the situation in the genus Tulas-
nella (Moncalvo et al., 2006), which is also not targeted
by the new primers.
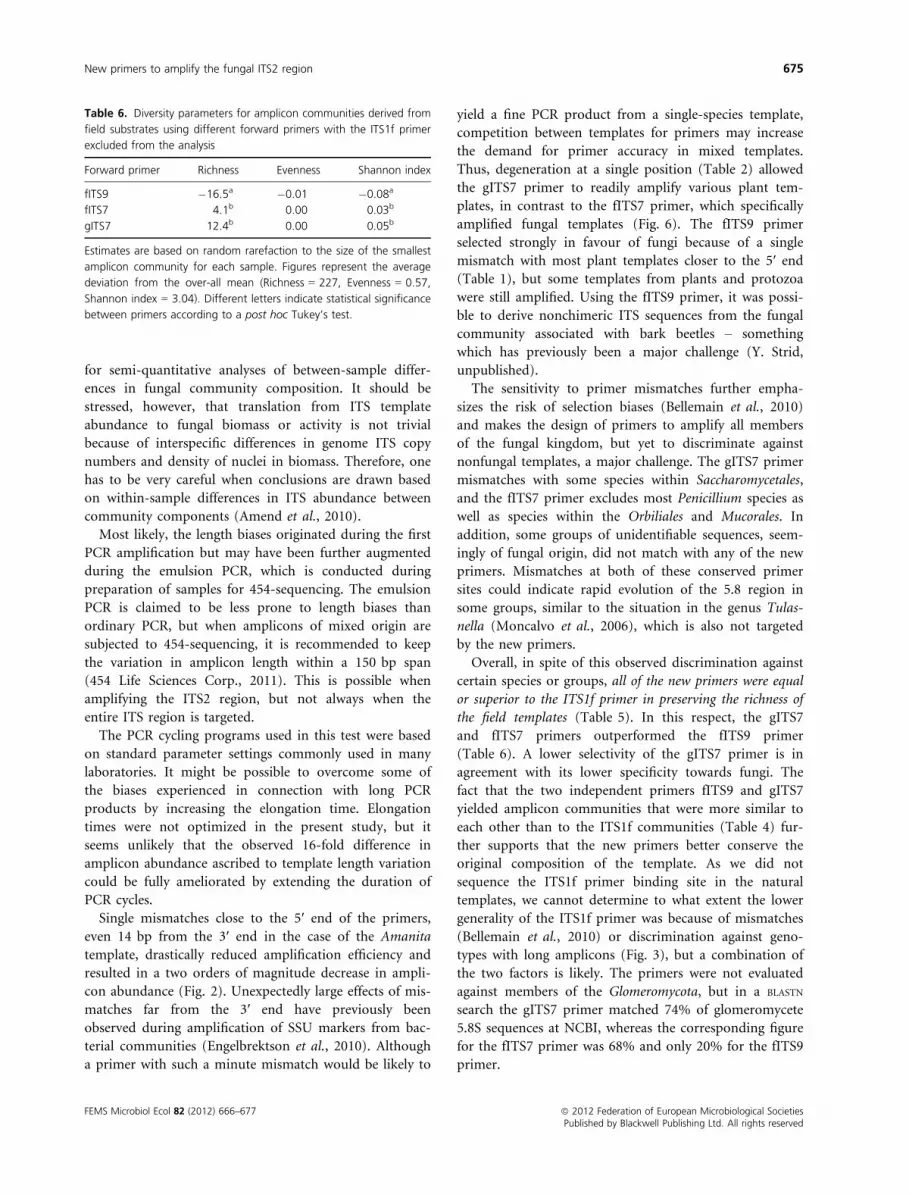
Overall, in spite of this observed discrimination against
certain species or groups, all of the new primers were equal
or superior to the ITS1f primer in preserving the richness of
the field templates (Table 5). In this respect, the gITS7
and fITS7 primers outperformed the fITS9 primer
(Table 6). A lower selectivity of the gITS7 primer is in
agreement with its lower specificity towards fungi. The
fact that the two independent primers fITS9 and gITS7
yielded amplicon communities that were more similar to
each other than to the ITS1f communities (Table 4) fur-
ther supports that the new primers better conserve the
original composition of the template. As we did not
sequence the ITS1f primer binding site in the natural
templates, we cannot determine to what extent the lower
generality of the ITS1f primer was because of mismatches
(Bellemain et al., 2010) or discrimination against geno-
types with long amplicons (Fig. 3), but a combination of
the two factors is likely. The primers were not evaluated
against members of the Glomeromycota, but in a BLASTN
search the gITS7 primer matched 74% of glomeromycete
5.8S sequences at NCBI, whereas the corresponding figure
for the fITS7 primer was 68% and only 20% for the fITS9
primer.
Table 6. Diversity parameters for amplicon communities derived from
field substrates using different forward primers with the ITS1f primer
excluded from the analysis
Forward primer Richness Evenness Shannon index
fITS9 �16.5a �0.01 �0.08a
fITS7 4.1b 0.00 0.03b
gITS7 12.4b 0.00 0.05b
Estimates are based on random rarefaction to the size of the smallest
amplicon community for each sample. Figures represent the average
deviation from the over-all mean (Richness = 227, Evenness = 0.57,
Shannon index = 3.04). Different letters indicate statistical significance
between primers according to a post hoc Tukey’s test.
FEMS Microbiol Ecol 82 (2012) 666–677 ª 2012 Federation of European Microbiological SocietiesPublished by Blackwell Publishing Ltd. All rights reserved
New primers to amplify the fungal ITS2 region 675
The higher generality of the new primers comes with a
price – they contain degenerate bases. The use of degen-
erate primers calls for extra careful optimization of the
PCR protocol, in that the number of cycles has to be
minimized for each sample so that the PCR is interrupted
while still in the exponential phase (Polz & Cavanaugh,
1998). Otherwise, when one of the primer variants is
depleted, templates matching other variants will continue
to amplify and increase their relative abundance in the
product. Therefore, when using degenerate primers, one
should aim for ‘weak to medium-strong’ PCR products
rather than strong bands on the gel.
Even when identical templates are analysed, the com-
munities after PCR amplification and 454-sequencing will
differ because of random errors in the analyses. When
expressed as a fraction of the average frequency, the varia-
tion between PCR replicates is expected to be higher for
rare species because of stochastic variation in the random
selection of amplicons for sequencing, and even more so
when the total number of sequences from each sample
is low. After correction for this sampling error, some
variation remained, which has to be ascribed random dis-
tortion of community composition during PCR amplifica-
tion. This error was also larger, in relation to the
frequency, for rare species. For species with a relative
abundance above 0.1%, the standard deviation ascribed to
random PCR distortion was usually below 50%, regardless
of which primer combination was used. By pooling three
PCRs for each sample, the standard deviation could be
reduced below 30%, which seems reasonable for most eco-
logical studies. For species with a relative abundance
above 1%, the standard deviation ascribed to random
PCR distortion was lower than 25%, and results from
sequencing of a single PCR would be fairly reliable. At a
sequencing depth of 5000 reads per sample, the error
ascribed to random sampling of amplicons is of the same
magnitude as the error ascribed to random PCR distor-
tion, and it would not seem sensible to sequence much
deeper for community studies, unless a large number of
PCRs are pooled from each sample to even out distortion.
If the focus is on dominant community members, 1500
reads per sample would suffice.
An interesting observation is the correlation between
the number of obtained 454-reads and the identity of the
last base in the sample identifier tag. As it seems, the liga-
tion of sequencing adaptors, which are adjoined to the
sample identifier tag, is biased towards certain terminal
sequences (Alon et al., 2011) and disfavours sequences
that begin with T residues. Such ligation biases do not
shift the relative abundance of taxa within samples but
lead to unequal representation of samples among the total
reads. Unless all used tags begin with the same nucleo-
tide, this issue has to be taken into account during pool-
ing of PCR products.
Conclusions
During PCR amplification of full-length fungal ITS frag-
ments, community composition may be severely distorted
because of discrimination against taxa with long ampli-
cons. Using primers in the 5.8S region to amplify the
ITS2 region only, such distortion may be reduced.
Quantitative relations between different templates are
then reasonably well preserved both for common and rare
taxa, even though the relative precision is lower for less
frequent taxa. Furthermore, the new primers fITS7 and
gITS7 return a more diverse amplicon community than
the ITS1f primer, presumably due to a combination of
better nucleotide matching to primer sites and reduced
discrimination against long templates. The primers fITS9
and fITS7 were found to be more or less specific to fungi,
whereas the gITS7 primer also amplified many plants
(but not conifers). On the other hand, the gITS7 primer
yielded the most diverse amplicon communities.
Acknowledgements
Funding from Swedish University of Agricultural Sciences
and the Swedish Research Council FORMAS is gratefully
acknowledged. Also thanks to Dr. Gerald Nyakatura at
LGC Genomics, for helpful assistance in association with
454-sequencing, and to Erica Sterkenburg, Juan Santos-
Gonzales, Anna Rosling, Roger Finlay and the entire
NordForsk funded network ‘Fungi in Boreal Forest Soils’,
for valuable discussions and helpful advice.
References
Abarenkov K, Tedersoo L, Nilsson RH et al. (2010) PlutoF-a
web based workbench for ecological and taxonomic
research, with an online implementation for fungal ITS
sequences. Evol Bioinform 6: 189–196.Alon S, Vigneault F, Eminaga S, Christodoulou DC, Seidman
JG, Church GM & Eisenberg E (2011) Barcoding bias in
high-throughput multiplex sequencing of miRNA. Genome
Res 21: 1506–1511.Amend AS, Seifert KA & Bruns TD (2010) Quantifying
microbial communities with 454 pyrosequencing: does read
abundance count? Mol Ecol 19: 5555–5565.Begerow D, Nilsson H, Unterseher M & Maier W (2010)
Current state and perspectives of fungal DNA barcoding
and rapid identification procedures. Appl Microbiol
Biotechnol 87: 99–108.Bellemain E, Carlsen T, Brochmann C, Coissac E, Taberlet P &
Kauserud H (2010) ITS as an environmental DNA barcode
ª 2012 Federation of European Microbiological Societies FEMS Microbiol Ecol 82 (2012) 666–677Published by Blackwell Publishing Ltd. All rights reserved
676 K. Ihrmark et al.
for fungi: an in silico approach reveals potential PCR biases.
BMC Microbiol 10: 189.
Bio-Rad Laboratories Inc (2006) Real-Time PCR Applications
Guide. Bio-Rad Laboratories Inc., Hercules, CA.
Engelbrektson A, Kunin V, Wrighton KC, Zvenigorodsky N,
Chen F, Ochman H & Hugenholtz P (2010) Experimental
factors affecting PCR-based estimates of microbial species
richness and evenness. ISME J 4: 642–647.Frank DN (2009) BARCRAWL and BARTAB: software for
design and implementation of barcoded primers for highly
multiplexed DNA sequencing. BMC Bioinformatics 10: 362.
Gardes M & Bruns TD (1993) ITS primers with enhanced
specificity for basidiomycetes – application to the
identification of mycorrhizae and rusts. Mol Ecol 2:
113–118.Hibbett DS, Ohman A & Kirk PM (2009) Fungal ecology
catches fire. New Phytol 184: 279–282.Hibbett DS, Ohman A, Glotzer D, Nuhn M, Kirk P & Nilsson
RH (2011) Progress in molecular and morphological taxon
discovery in Fungi and options for formal classification of
environmental sequences. Fungal Biol Rev 25: 38–47.Horton TR & Bruns TD (2001) The molecular revolution in
ectomycorrhizal ecology: peeking into the black-box. Mol
Ecol 10: 1855–1871.Huber JA, Morrison HG, Huse SM, Neal PR, Sogin ML &
Welch DBM (2009) Effect of PCR amplicon size on
assessments of clone library microbial diversity and
community structure. Environ Microbiol 11: 1292–1302.Kanagawa T (2003) Bias and artifacts in multitemplate
polymerase chain reactions (PCR). J Biosci Bioeng 96: 317–323.Lane DJ, Pace B, Olsen GJ, Stahl DA, Sogin ML & Pace NR
(1985) Rapid-determination of 16S ribosomal-RNA
sequences for phylogenetic analyses. P Natl Acad Sci USA
82: 6955–6959.454 Life Sciences Corp. (2011) 454 Sequencing System –
Guidelines for Amplicon Experimental Design. 454 Life
Sciences Corp. (Roche), Branford.
Margulies M, Egholm M, Altman WE et al. (2005) Genome
sequencing in microfabricated high-density picolitre
reactors. Nature 437: 376–380.Martin KJ & Rygiewicz PT (2005) Fungal-specific PCR primers
developed for analysis of the ITS region of environmental
DNA extracts. BMC Microbiol 5: 28.
Moncalvo J-M, Nilsson RH, Koster B et al. (2006) The
cantharelloid clade: dealing with incongruent gene trees
and phylogenetic reconstruction methods. Mycologia 98:
937–948.Nilsson RH, Abarenkov K, Veldre V, Nylinder S, deWit P,
Brosche S, Alfredsson JF, Ryberg M & Kristiansson E (2010)
An open source chimera checker for the fungal ITS region.
Mol Ecol Resour 10: 1076–1081.Polz MF & Cavanaugh CM (1998) Bias in template-to-product
ratios in multitemplate PCR. Appl Environ Microbiol 64:
3724–3730.Quince C, Lanzen A, Davenport RJ & Turnbaugh PJ (2011)
Removing noise from pyrosequenced amplicons. BMC
Bioinformatics 12: 38.
Rosling A, Cox F, Cruz-Martinez K, Ihrmark K, Grelet G-A,
Lindahl BD, Menkis A & James TY (2011)
Archaeorhizomycetes: unearthing an ancient class of
ubiquitous soil fungi. Science 333: 876–879.Schoch CL, Seifert KA, Huhndorf S, Robert V, Spouge JL,
Levesque CA, Chen W & Fungal Barcoding Consortium
(2012) Nuclear ribosomal internal transcribed spacer (ITS)
region as a universal DNA barcode marker for Fungi. P Natl
Acad Sci USA 109: 6241–6246.Urich T, Lanzen A, Qi J, Huson DH, Schleper C & Schuster
SC (2008) Simultaneous assessment of soil microbial
community structure and function through analysis of the
meta-transcriptome. PLoS ONE 3: e2527.
van Tuinen D, Jacquot E, Zhao B & Gianinazzi-Pearson V
(1998) Characterization of root colonization profiles by a
microcosm community of arbuscular mycorrhizal fungi
using 25S rDNA-targeted nested PCR. Mol Ecol 7: 879–887.White TJ, Bruns T, Lee S & Taylor J (1990) Amplification and
direct sequencing of fungal ribosomal RNA genes for
phylogenetics. PCR Protocols: A Guide to Methods and
Applications (Innis MA, Gelfland DH, Sninsky JJ & White
TJ, eds), pp. 315–322. Academic Press, San Diego, CA.
Supporting Information
Additional Supporting Information may be found in the
online version of this article:
Fig. S1. Interaction effects of primer choice and substrate
type on OTU richness of ITS-amplicon communities. (a)
With the ITS1f primer included, (b) without the ITS1f
primer.
Table S1. A list of sample identifying tags.
Please note: Wiley-Blackwell is not responsible for the
content or functionality of any supporting materials sup-
plied by the authors. Any queries (other than missing
material) should be directed to the corresponding author
for the article.
FEMS Microbiol Ecol 82 (2012) 666–677 ª 2012 Federation of European Microbiological SocietiesPublished by Blackwell Publishing Ltd. All rights reserved
New primers to amplify the fungal ITS2 region 677