new closed-form approximation for skin chromophore mapping
TRANSCRIPT

Journal of Biomedical Optics 16(4), 046012 (April 2011)
New closed-form approximation for skinchromophore mapping
Petri Valisuo,a Ilkka Kaartinen,b Valery Tuchin,c and Jarmo AlanderaaUniversity of Vaasa, Department of Electrical and Energy Engineering, Automation Technology, Wolffintie 34,Vaasa, 65101 FinlandbTampere University Hospital, Department of Plastic Surgery, Tampere, FinlandcSaratov State University, Institute of Precise Mechanics and Control of RAS, Saratov, Russia
Abstract. The concentrations of blood and melanin in skin can be estimated based on the reflectance of light.Many models for this estimation have been built, such as Monte Carlo simulation, diffusion models, and thedifferential modified Beer–Lambert law. The optimization-based methods are too slow for chromophore mappingof high-resolution spectral images, and the differential modified Beer–Lambert is not often accurate enough.Optimal coefficients for the differential Beer–Lambert model are calculated by differentiating the diffusion model,optimized to the normal skin spectrum. The derivatives are then used in predicting the difference in chromophoreconcentrations from the difference in absorption spectra. The accuracy of the method is tested both computationallyand experimentally using a Monte Carlo multilayer simulation model, and the data are measured from the palm of ahand during an Allen’s test, which modulates the blood content of skin. The correlations of the given and predictedblood, melanin, and oxygen saturation levels are correspondingly r = 0.94, r = 0.99, and r = 0.73. The predictionof the concentrations for all pixels in a 1-megapixel image would take ∼20 min, which is orders of magnitudefaster than the methods based on optimization during the prediction. C©2011 Society of Photo-Optical Instrumentation Engineers(SPIE). [DOI: 10.1117/1.3562976]
Keywords: diffusion theory; Monte Carlo methods; Beer–Lambert law; integrating sphere biomedical engineering; optics; photonics;biological tissues; multispectral imaging; medical imaging; dermal imaging.
Paper 10651R received Dec. 10, 2010; revised manuscript received Feb. 16, 2011; accepted for publication Feb. 17, 2011; publishedonline Apr. 7, 2011.
1 IntroductionThe reflectance spectra of human skin can be used to studyits physical structure and chemical contents. The reflectancespectra measurement is a fast and convenient method forobtaining dermal information. The spectra can be measuredusing a spectrophotometer or with a multiband digital imagingdevice. In reflectance spectroscopy, the skin is illuminated witha light source and the spectra of the reflected light is measured.Often visible and near-infrared (NIR) light are used formeasurements because they penetrate deeper into the skin thanthe longer or shorter wavelengths. The measured reflectancespectra can be used in estimation of the distributions of theskin chromophores, such as melanin and hemoglobin. Thesechromophore maps may help in diagnosing and following up onskin disorders. Therefore, chromophore mapping is a commontopic in the skin-imaging literature.1–7 Several commercial tech-nologies have been developed especially for measuring the skinchromophore concentrations, such as DermaSpectrometer R©,Mexameter R©, Chromameter R©,6 EMM-01,7 SIAScopy R©,8 andTIVI R© imaging.9 Comparative measurements of erythema andmelanin indexes using the EMM-01 and Mexameter MX-16(Courage + Khazaka electronic GmbH, Cologne, Germany)devices as well as color measurements with the MinoltaChromameter CR-200b (Higashi-Ku, Japan) were performedin Ref. 7.
Address all correspondence to: Petri Valisuo, University of Vaasa, Department ofElectrical and Energy Engineering, Automation Technology, Wolffintie 34, Vaasa,L nsi-Suomi 65101 Finland. Tel: 358445804320; Fax: 358-6-324 8677; E-mail:[email protected].
Because the light interaction in skin is complicated, there isno single method for chromophore concentration estimation thatis the best for all purposes. Therefore, many different methodsare frequently used in skin analysis. These methods are listedin recently published reviews.10, 11 One of the most versatilemethods for this purpose is Monte Carlo simulation, for exam-ple, the Monte Carlo multilayer (MCML) software.12–14 It isrelatively easy to include the absorption of all important skinchromophores and scattering factors into the model. Notwith-standing the long simulation times, the model has been usedfor many purposes, such as in the development of the pulseoximeter,15 melanoma diagnostics,16–18 melanin- and blood-concentration measurements,19, 20 skin-treatment planning,21
and determination of the information depth of the skinreflectance.22
Another often-used method for modeling light transportin skin is the diffusion approximation of the light transportequation.23, 24 Diffusion approximation is expressed as a math-ematical formula that can be calculated much faster than theMCML model but it is less versatile. However, solving of in-verse problems is required by means of an optimization algo-rithm, such as that of Levenberg–Marquardt (LMA).
Most solutions, aiming at even faster processing, are basedon the Beer–Lambert law (BLL), which is the profound theorybehind chemometry. The BLL states that the absorption A, oflight transmitted through a substance, whose thickness is d is
1083-3668/2011/16(4)/046012/10/$25.00 C© 2011 SPIE
Journal of Biomedical Optics April 2011 � Vol. 16(4)046012-1

Valisuo et al.: New closed-form approximation for skin chromophore mapping
directly proportional to the absorption coefficient, μa of thesubstance.
A = μad. (1)
The absorption coefficient is the product of the molar extinc-tion coefficient ε and the concentration c of the chromophore
μa = c ε. (2)
This law strictly holds only for light transmission when scat-tering is negligible. However, the scattering in skin is strong;thus, Beer–Lambert as such does not hold. On the other hand,the backscattering makes it possible to use the reflection-measurement setup instead of transmission, which is much moreconvenient for in vivo measurements. The goal for many re-searchers has been to modify either the BLL or the reflectance-measurement setup so that the BLL could be applied.
In scattering media, the photons do not follow direct path.Therefore, the thickness, d, must be replaced with a mean path-length, p, of the photon, which is usually unknown, and dependson the absorption and scattering. Furthermore, photons are scat-tered in all directions, and only a small amount of them arecaptured by the detector, resulting in a scattering loss, whichis often modeled as an additive term G. The modified Beer–Lambert law (MBLL), takes also into account these additionalparameters,25, 26
A = μa p + G. (3)
Because of the constant, unknown term, G, the absolute ab-sorption coefficient values cannot be solved from known absorp-tions. If it is assumed that the scattering loss is constant, then theterm G disappears when examining the differences of absorp-tions. Therefore, the MBLL is often used in a differential form,known as differential modified Beer–Lambert law (dMBLL),
∂
∂μaA = ∂
∂μaμa p. (4)
The dMBLL, shown in Eq. (4), is described in Ref. 27, as wellas the error caused by assuming G as constant when it is not. Ifthe pathlength, p, is not dependent on μa, then the derivative ofabsorption is just the pathlength and the dMBLL is linear. If ei-ther p or G is dependent on μa, both A and ∂ A/∂μa are nonlinear.In many papers, ∂ A/∂μa is assumed to be linear.3, 27–29
Mourant et al. found that in a special measurement setup,where light is illuminated from one optical fiber and collectedfrom another so that the distance between the fibers is between1.5 and 2.2 mm, the mean pathlength of the photons is onlyslightly dependent on the changes on the scattering coefficient.30
In this case, the dMBLL holds well, provided that the p(μa) canbe modeled. Mourant et al. used a model p(μa) = x0 + x−x2μa
1 ,where xi are experimental coefficients.
Amelink and Sterenberg31 made a special measurement de-vice where light is fed using one emitter fiber and detected bytwo fibers, simultaneously. The first detector fiber (de) is theemitter fiber itself, and the second (d) is a separate fiber locatedclose to the emitter. The difference of the two detected signals is
said to mostly contain the effect of the single scattered photons.In this case, the average pathlength p is constant, the dMBLLis linear, and actually, the Beer–Lambert could be applied assuch.31
Unfortunately, these special measurement setups cannot beused for chromophore mapping because they lack the spatialdimensions. A method that is fast and accurate enough for chro-mophore mapping of images with high spatial and modest spec-tral resolution is needed in a skin-imaging system, such as theSpectrocutometer.4, 32 The new approach taken in this paper isto apply dMBLL to solve chromophore maps from digital im-ages, linearizing the dMBLL model around an operating pointdeduced from the normal skin spectra of the individual. For thelinearized model the partial derivatives of the absorption by theabsorption coefficients of each chromophore are needed. Thesederivatives are obtained by constructing a two-layer skin modelusing the Beer–Lambert law and diffusion model and by differ-entiating the model analytically. The constructed model is firstfitted to one selected absorption spectrum, using LMA optimiza-tion, to find the chromophore concentrations. The derivativesare then used to find the differences of the chromophore con-centrations for the other spectra using dMBLL in closed form.The method is tested by comparing it to the MCML simulationmodel.
2 Materials and MethodsMelanin, oxyhemoglobin, and deoxyhemoglobin are the mostimportant chromophores in skin. In healthy skin, melanin is de-posited in epidermis, whereas hemoglobin is dissolved in blood,which is located deeper in the skin, in the dermis. The absorptionof the epidermis is μa,epe, where μa,e = cmεm is the absorptioncoefficient of epidermis, which equals to the concentration ofmelanin, cm, times the extinction coefficient of melanin, εm.The absorption coefficient of blood, μb, depends on the ab-sorption coefficients of the chromophores in blood, oxygenatedhemoglobin, μa,HBo, and deoxygenated hemoglobin, μa,HBd. Theabsorption of blood is therefore μa,bpd = (μa,HBo + μa,HBd)pd
where pd is the average pathlength of photons in dermis. Usu-ally, the absorption coefficient of dermis itself, is modeled asskin baseline, μa,dpd. Therefore, the equation describing the at-tenuation of skin, can be written as follows:
A = μa,e pe + μa,b pd + μa,d pd + G. (5)
The epidermis is weakly absorbing by itself, but the melanindeposited primarily in the bottom of the epidermis, in stratumbasale, absorb light strongly. Because the epidermis is thin,de ≈ 100 μm, and it is the topmost layer, the mean pathlengthof a remitted photon in the epidermis is not affected much bythe absorption of dermis or epidermis. Therefore, the derivativeof Eq. (5) by the absorption in the epidermis, is approximately
∂ A
∂μa,e≈ pe. (6)
On the other hand, the mean pathlength in dermis, pd, isdependent on the absorption coefficient in blood and in dermis. Ifμa,b, is high, then only the photons remitted from the superficiallayers in the dermis will survive back and the average pathlengthin the dermis will be short. Therefore, the derivative of Eq. (5)
Journal of Biomedical Optics April 2011 � Vol. 16(4)046012-2

Valisuo et al.: New closed-form approximation for skin chromophore mapping
by the absorption in blood, μa,b, is more complicated,
∂ A
∂μa,b= pd + μa,b p′
d + μa,d p′d, (7)
where p′d = ∂pd/∂μa,b. The first term corresponds to the basic
Beer–Lambert law. The second term adds a nonlinear componentdue to the nonconstant pathlength. The third term is cross-talkfrom absorption of dermis to absorption of blood.
2.1 Diffusion ModelEquation (7) cannot be used for calculating concentrationchanges because pd is not known. The model based on diffu-sion theory, introduced by Farrell et al.24 and Patterson et al.,23
can be used for obtaining the partial derivatives needed. Thediffusion model assumes a pencil-beam-shaped light source. Itis further assumed that the light beam can be replaced witha point source located at the depth of the mean free path,z0 = 1/(μ′
s + μa), under the skin surface and the correspond-ing image source at the height of 2 zb + z0 from the skin sur-face, where zb = (2 K)D is the height of the virtual boundary,where K is the internal reflection, which is assumed to be K= (1 + rd)/(1 − rd), where rd is the reflectance coefficient mis-match in the air-tissue boundary and D = z0/3 is the diffusivitycoefficient. The diffusion reflectance can be modeled by meansof transport albedo μ′
a = μ′s/(μ′
s + μa), and internal reflectionK. A more accurate model is obtained by assuming that there isa point source in every point along the pencil beam in the tissue,in which intensity along the depth, z, is I (z) = μ′
aμ′te
−μ′tz , where
μ′t = μa + μ′
s is the total interaction coefficient. Therefore, thetotal reflectance, Rd, of infinite narrow beam is24
Rd = μ′a
2
1 + e−4/(3K )T
1 + T, (8)
where
T = √3(1 − μ′
a). (9)
The absorption, Ad, of radiation in tissue is
Ad = log(1/Rd). (10)
The derivative of Eq. (10) by absorption coefficient, μa, is
∂ Ad
∂μa= z0
2(T + 1)
[2(T + 1) + 3z0μ
′s
T
+4K z0μ′s(T + 1)e−4/(3K T )
T (e−4/(3K T ) + 1)
].
(11)
The epidermis and dermis are the two most important layersfor optical skin models. The dermis can be further subdivided,but it may not be always necessary. Here, the skin model assumesa thin epidermis layer situated on top of the dermis layer. Theabsorption in epidermis, Ae, is modeled simply using BLL, sothat Ae = μa,epe, where the average pathlength in epidermis,pe, is slightly longer than the thickness of the epidermis, de.
The absorption of dermis is modeled using the diffusion model,described in Eq. (10). The specular reflectance is assumed to bewavelength-independent constant.
Fig. 1 Edge losses and edge-loss compensation. The gray lines showthe detected reflectance as a function of wavelength, from bottom totop, ra is 0, 0.1, 0.2, 0.3, . . . , 1.5 cm. The lower solid thick line showsthe simulated detected reflectance, whereas the lower thick dashedline shows measured spectra. The upper thick and dashed lines showthe simulated and measured spectra after edge loss compensation.
2.2 Edge LossesOne of the data sets used in this paper is measured using anintegrating sphere, which is often used as an optical probe forreflection measurements. However, it introduces some nonidealcharacteristics that must be taken into account. The integratingsphere illuminates the target at the area of its aperture, which isthe radius ra. It collects the specular and diffuse reflectance onlyfrom the area covered by the aperture. However, part of the dif-fuse reflectance is remitted from the area behind the edge of theaperture and part of the reflectance is therefore lost. To reduceedge losses, some integrating spheres contain a lens system thatcan be used either in focusing the illumination into a narrowcollimated beam or limiting the detection area. To estimate theedge losses of an integrating sphere with a lens system used forillumination, an MCML simulation was performed with a colli-mated circular light beam of radius rb = 0.15 cm and apertureof radius ra = 0.5 cm, which are the properties of the integratingsphere used in the Allen’s test measurements. The result of theMCML simulation is a radial cross section of the reflectanceintensity. The intensity of the total collected reflectance can beobtained by integrating the reflectance intensity curve over acircle of radius ra. The detected reflectance and the edge lossesshould be the same in a symmetrical case, where the integratingsphere is used for providing diffuse light in the circular area, ofradius, ra, and the lens system is used for limiting the detectionin the circular area of radius, rb The results of the simulation areshown in Fig. 1.
The detection efficacy of the integrating sphere was calcu-lated by dividing the reflectance obtained using the real apertureradius with the reflectance using very large aperture radius, cap-turing virtually all reflected signal,
η(λ) = R(λ)|ra=0.6 cm
R(λ)|ra=1.5 cm. (12)
According to MCML simulation, the losses are negligiblewhen wavelength, λ, is smaller than λt = 580 nm. When λ
> λt, η(λ) can be modeled as an exponent function. Therefore,
Journal of Biomedical Optics April 2011 � Vol. 16(4)046012-3

Valisuo et al.: New closed-form approximation for skin chromophore mapping
Fig. 2 Detection efficacy due to edge losses. The solid line showsthe simulated detection efficacy and dashed line shows the detectionefficacy model.
the detection efficacy is
η(λ) ={
1 if λ ≤ λt
EL + (1 − EL)ek(λt−λ) if λ ≤ λt,(13)
where EL is the edge loss coefficient, describing the maximumdetection efficacy in the NIR range, and k is an experimentalconstant. For simulated skin parameters and given integratingsphere geometry, EL = 0.8 and k = 0.02. The simulated andmodeled η(λ) are shown in Fig. 2.
The detection efficacy model was further tested by plottingone spectra from the Allen’s test data, before and after the edgeloss compensation. These measured spectra are also shown inFig. 1.
2.3 Total Skin Reflectance ModelThe total absorption of the skin, when the diffusion model ofthe dermis, the Beer–Lambert model of the epidermis, the edgelosses, and the specular reflections are taken into account, isshown in Fig. 3. The reflectance from epidermis to the air isassumed to be independent on the wavelength and is accountedfor by increasing the specular reflection coefficient Rs. The scat-tering from epidermis to dermis is neglected in the model.
The parameters of the model are the specular reflection Rs,
the absorption of the epidermis Ae, the absorption of the dermisAd, and the edge loss coefficient E. From Eqs. (8) and (9), it isapparent that the absorption in Eq. (10) is directly determinedby the internal reflectance of because K, and the transport albedoμ′
a. The transport albedo, in turn, is a sum of all absorption andscattering properties of skin because μa = μ′
s/(μ′s + μa). The
absorption coefficient is a function of absolute chromophoreconcentrations, because μ′
a = ∑i εi (λ)ci , where εi is the
a priori known molar extinction coefficient of chromophorei. Therefore, the transport albedo can be calculated as follows:
μ′a(λ, c) = μ′
s(λ)
μ′s(λ) + ∑
i εi (λ)ci, (14)
where c = [c1, c2, . . .]T is a vector containing the concentrationsof all chromophores included in the model.
Because μ′a is a function of λ and c, so are T(λ, c), Rd(λ, c)
and Ad(λ, c) as well. The BLL model of epidermis is Ae(λ,cm)
S
Edge losses
IR
+
Dermis
I0
Epidermis
Epidermis
Ie = Id/eAe
Idr = Ie E
Isr = I0Rs
Ie = I0(1 −Rs)
Id = Ie/eAe
Id = Idiff /eAd
Fig. 3 Photon path model. The incident light beam, I0, is first di-vided in two parts, the diffuse reflected part, Ie, and the specularly re-flected part, Isr. The diffuse reflected beam, Ie, travels through epidermisand is partly absorbed. The transmitted part, Id, enters into the dermisand is partly reflected back. The reflected intensity, I ′
d, goes throughepidermis the second time. The diffuse and specular reflections arecollected by a detector, which potentially causes edge losses to thediffuse reflected part of light, I ′
e. The absorption of epidermis, Ae, iscalculated by the Beer–Lambert law and the absorption of dermis, Ad,is obtained from the diffusion theory.
= εm(λ)cm. The parameters for the edge-loss model, E(λ) areEL and k. The total skin reflectance model can used in solvingthe concentrations, by adapting it to the measured reflectancespectrum, by minimizing the following square error over allspectral channels, i:
ESS(c, Rs, EL, k)
=∑i
[Rmeasured(λi )−Rpredicted(λi , c, Rs, EL , k)
]2. (15)
The ESS can be minimized by finding optimal values for theparameters with LMA algorithm, for example. When the skinmodel is optimized, the derivative shown in Eq. (10) can beobtained.
The absorption difference between two locations of skin cannow be written using Eqs. (6) and (11) as a Taylor series,
�A = ∂
∂μaA
(�μa,b + �μa,d
) + 2pe�μa,e. (16)
The specular reflection is canceled when measuring the dif-ference of two absorption spectra; therefore, it may be ignored.The possible edge loss needs to be compensated before applyingEq. (16). To keep the system linear, the higher order terms of theTaylor series cannot be used. The chromophore concentrations
Journal of Biomedical Optics April 2011 � Vol. 16(4)046012-4

Valisuo et al.: New closed-form approximation for skin chromophore mapping
Fig. 4 MCML skin-simulation model structure. The depths of the layersin millimeters are given along z-axis, in the left hand side. The layersof the skin model are shown in the right hand side. The incident andremitted light beams are shown in the top. The banana-shaped areais a schematic of the typical path for the photons contributing to theremittance shown by the arrow.
can be solved when the absorption coefficients, μ′a, are replaced
by concentrations and extinction coefficients,
�A = ∂
∂μaA (�cHBoεHBo + �cHBdεHBd + �cbaseεbase)
+2pe�cmεm.
(17)
Equation (17) contains four unknown concentrations. Theycan be solved by measuring the absorption change, �A, in atleast at four different wavelengths, and finding an least-mean-squares (LMS) solution for each absorption. The wavelengthsshould be selected so that the equations are linearly independent.This can be arranged by selecting the wavelength sufficiently faraway from each other. The absorption coefficients have uniquespectra because they depend on the spectra of the extinctioncoefficients, ε.
2.4 Reference Data Using Monte Carlo SimulationTo validate the proposed chromophore mapping technique, itwas compared to the MCML simulation model. The MCMLmodel consists of the model structure and the parameters. Thestructure is assumed to consists of homogeneous layers (shownin Fig. 4). The model was originally developed by Tuchinet al.,33 adopted by Reuss,15 and used, among others, byus.20, 22, 34
The parameters of each layer are the thickness, d, the ab-sorption coefficient, μa, the scattering coefficient, μs, and theanisotropy, g. To be able to estimate the absorption coefficients,the skin chromophores and their concentrations are needed. Inaddition to hemoglobin and melanin, bilirubin and β-carotenemay also affect to the concentration prediction. Water is only sig-nificant above 800 nm; it does not influence the skin color. Theskin model was tuned to match palm skin over a range of differ-ent blood concentrations using the Allen’s test, as described inRef. 34. The nominal blood concentration is 150 g/l. The
hemoglobin molar concentration in blood can therefore be cal-culated by dividing the concentration in grams/liter with themolar mass of hemoglobin; therefore,
cHb,blood = 150 g/l
64500 g/mol= 2.326 mol/l. (18)
The concentration of hemoglobin in skin is obtained by mul-tiplying the hemoglobin concentration with the amount of bloodin skin, the blood fraction, fb. Therefore,
CHb,skin = fb CHb,blood. (19)
The typical value for fb was 0.05 according to Reuss inRef. 15. We have observed lower fb values in our earlier studies,including, Ref. 34 where fb ∈ [0.0016, 0.0045].
Often the absorption coefficient of melanin is modeled asfollows:
μa,m = fm(1.70×10¹²)λ−3.48 (1/cm), (20)
where λ is the wavelength in nanometers. The melanin frac-tion, fm, is estimated instead of estimating the concentration ofmelanin molecules.35 This is because the size, structure, and theabsorption efficiency of the melanin molecules may vary. There-fore, the absorption coefficient for given melanin concentrationis not well defined.
The scattering of the tissue was modeled as a combination ofMie and Rayleigh scattering, as follows:36
μs(λ) = μs,Mie(λ) + μs,Rayleigh(λ)
= 2×10⁵×λ−15 + 2×10¹²×λ−4.0. (21)
The skin without blood, the skin baseline, was simulatedusing following formula:37
μa,d(λ) = 7.84×10⁸×λ−3.255 (22)
The variations in bilirubin concentration can potentially dis-turb the prediction of hemoglobin concentration or oxygen sat-uration. Therefore, the bilirubin concentration was varied inMCML simulation even though the prediction of the bilirubincontent was not tried. The nominal bilirubin concentration inblood is CBr = 10 μM/1. The bilirubin concentration was keptconstant during “Blood” and “Melanin” data set simulation, andrandom values between the range, shown in Table 1 were se-lected in the simulation of the “Random” data set.
The above skin model is used to generate four data sets,described in Table 1. The first two data sets are used for ob-taining the numerical derivative of absorption by the melaninor blood concentrations for reference. The melanin set, contains32 simulated skin spectra where all variables, except melaninconcentration were kept constant. The melanin concentrationwas linearly distributed within a given range. In the blood dataset, which also contains 32 simulated spectra, all variables ex-cept blood volume fraction, fb, were kept constant. The bloodfraction, fb, was a linearly distributed within a given range. Therandom data set contains 104 simulated spectra, where inde-pendent random values were selected for melanin and bloodconcentrations from the given ranges.
Journal of Biomedical Optics April 2011 � Vol. 16(4)046012-5
Valisuo et al.: New closed-form approximation for skin chromophore mapping
Table 1 Simulated data sets and the range of the parameters duringthe simulation.
Data-set Number of
name samples Range
Melanin 32 fm ∈ [0.01, 0.04]
fb = 0.005
Os = 0.8
CBr = 10 μM/1
Blood 32 fm = 0.02
fb ∈ [0.0, 0.010]
Os = 0.8
CBr = 10 μM/1
Random 104 fm ∈ [0.0, 0.05]
fb ∈ [0.0, 0.025]
Os ∈ [0.6, 1]
CBr ∈ [2.5, 25] μM/1
Each simulated spectra, in each data set, contains 78 wave-lengths in the range λ ∈ [380, 1050] nm. The simulations weremade by tracking 106 photons for each simulated wavelength.The plain MCML simulation estimates the reflectance of aninfinite thin pencil beam.
2.5 Allen’s Test DataIn addition to the simulated data, the proposed algorithm wasalso validated using a measured data set. The measured data setconsists of the reflectance spectra of the human skin from thepalm of the hand from 20 persons, 5 locations each. From eachlocation, a series of 10 consequent samples were measured at therate of ∼1.8 samples per second. The measurements were car-ried out using an HR4000 spectrometer (Ocean Optics, Dunedin,Florida) and an ISP-REF integrating sphere (Ocean Optics). Themeasurement of the reflectance of the palm was acquired so thatthe test person placed his or her hand very lightly on the in-tegrating sphere. The skin was illuminated with a diffuse lightfield over the whole aperture of the sphere, in which radiusra = 0.5 cm, using a light source, built in the sphere. The re-flectance was collected in the middle of the aperture, from thecircular area, in which the radius is rb = 0.15 cm. The experimentis further described in Ref. 34.
3 Results3.1 Numerical Versus Analytical DerivativesTo validate the analytical derivatives shown in Eqs. (6) and (11),they were compared to corresponding numerical derivatives ob-tained from the MCML data sets, melanin and blood, shown inTable 1. These data sets contain the absorption spectra when
a single-chromophore concentration, either melanin or blood,is perturbed within a range, and all other parameters are keptunchanged. A third-order polynomial was fitted to the simulatedA(c) curves, using statistical software package, R, and functionaldata analysis toolbox.38 The derivatives of A(c) were now easilyobtained by differentiating the corresponding polynomials. Tostudy these polynomials and the first-order derivative over fullreflectance spectra, the absorptions were differentiated by theconcentrations instead of the absorption coefficients, and theprocedure was repeated over the spectral range of λ ∈ [380,1050] nm. The derivative of the absorption, A, by the absorptioncoefficient μ, and the derivative by the concentration are directlyrelated because
∂
∂μA(λ,μ) = 1
ε(λ)
∂
∂cA(λ, c). (23)
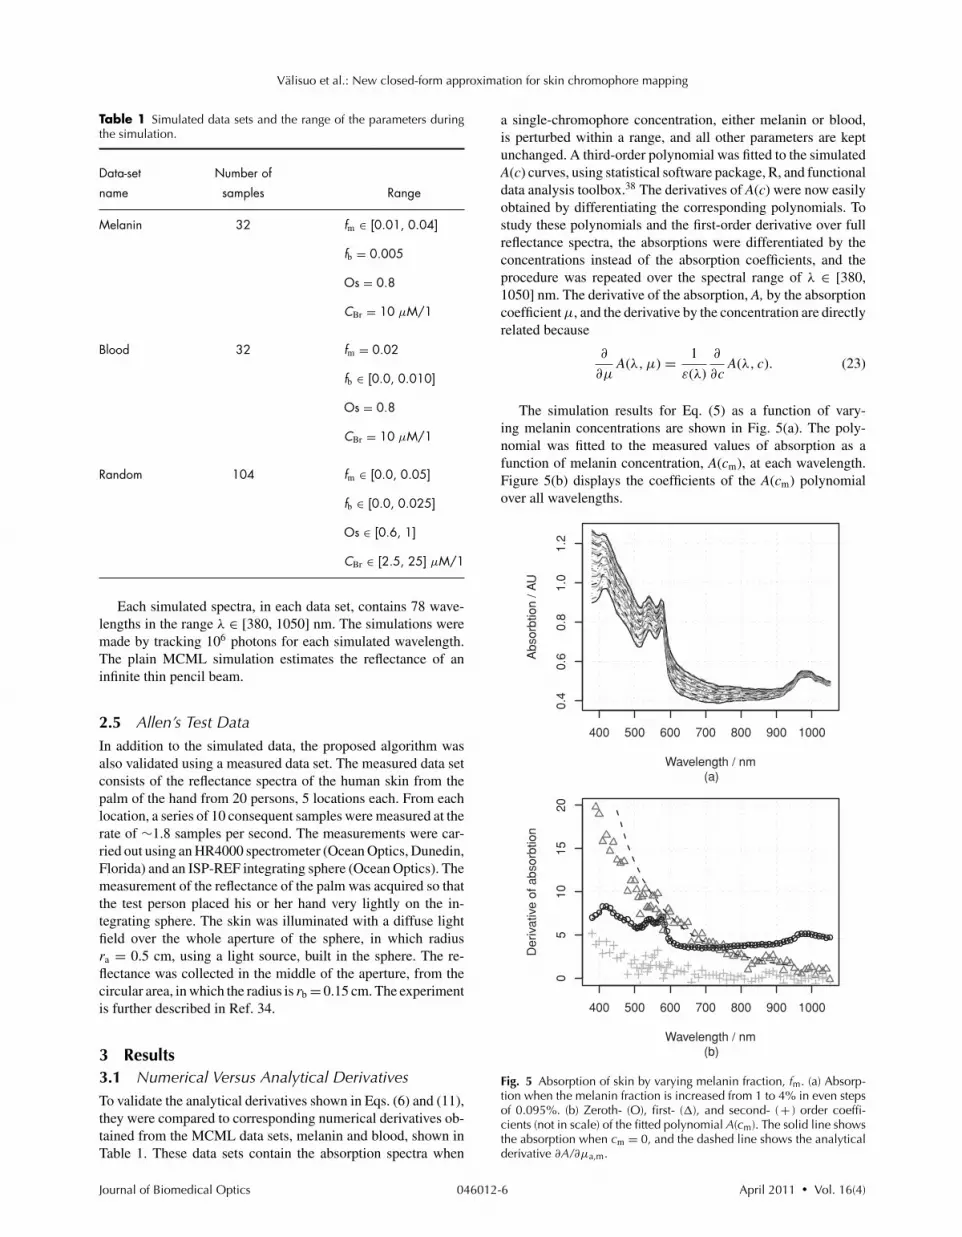
The simulation results for Eq. (5) as a function of vary-ing melanin concentrations are shown in Fig. 5(a). The poly-nomial was fitted to the measured values of absorption as afunction of melanin concentration, A(cm), at each wavelength.Figure 5(b) displays the coefficients of the A(cm) polynomialover all wavelengths.
400 500 600 700 800 900 1000
0.4
0.6
0.8
1.0
1.2
(a)Wavelength / nm
Abs
orbt
ion
/ AU
400 500 600 700 800 900 1000
05
1015
20
(b)Wavelength / nm
Der
ivat
ive
of a
bsor
btio
n
Fig. 5 Absorption of skin by varying melanin fraction, fm. (a) Absorp-tion when the melanin fraction is increased from 1 to 4% in even stepsof 0.095%. (b) Zeroth- (O), first- (�), and second- ( + ) order coeffi-cients (not in scale) of the fitted polynomial A(cm). The solid line showsthe absorption when cm = 0, and the dashed line shows the analyticalderivative ∂A/∂μa,m.
Journal of Biomedical Optics April 2011 � Vol. 16(4)046012-6
Valisuo et al.: New closed-form approximation for skin chromophore mapping
400 500 600 700 800 900 1000
0.4
0.6
0.8
1.0
(a)Wavelength / nm
Abs
orbt
ion
/ AU
400 500 600 700 800 900 1000
020
4060
8010
0
(b)Wavelength / nm
Der
ivat
ive
of a
bsor
btio
n
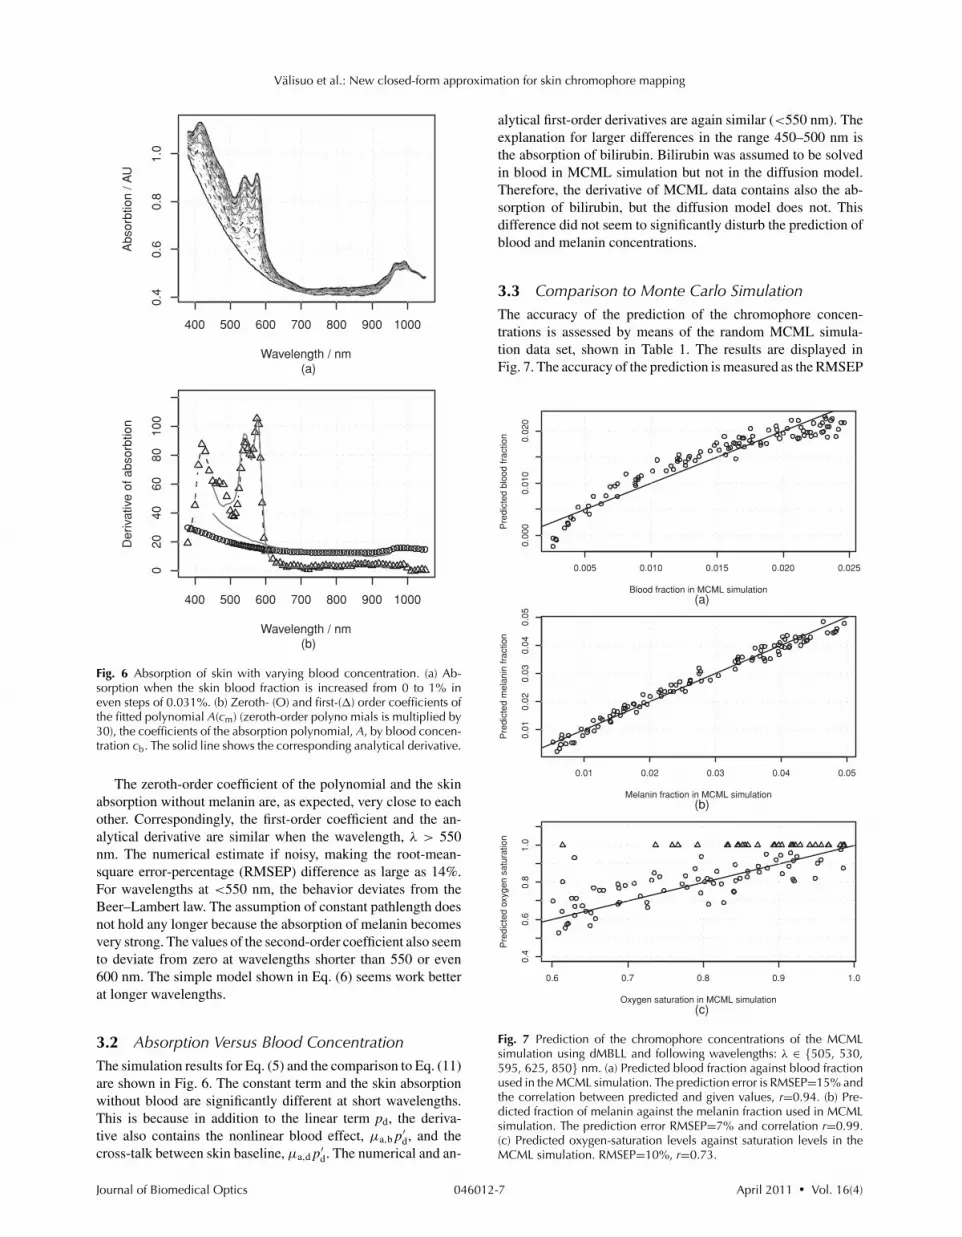
Fig. 6 Absorption of skin with varying blood concentration. (a) Ab-sorption when the skin blood fraction is increased from 0 to 1% ineven steps of 0.031%. (b) Zeroth- (O) and first-(�) order coefficients ofthe fitted polynomial A(cm) (zeroth-order polyno mials is multiplied by30), the coefficients of the absorption polynomial, A, by blood concen-tration cb. The solid line shows the corresponding analytical derivative.
The zeroth-order coefficient of the polynomial and the skinabsorption without melanin are, as expected, very close to eachother. Correspondingly, the first-order coefficient and the an-alytical derivative are similar when the wavelength, λ > 550nm. The numerical estimate if noisy, making the root-mean-square error-percentage (RMSEP) difference as large as 14%.For wavelengths at <550 nm, the behavior deviates from theBeer–Lambert law. The assumption of constant pathlength doesnot hold any longer because the absorption of melanin becomesvery strong. The values of the second-order coefficient also seemto deviate from zero at wavelengths shorter than 550 or even600 nm. The simple model shown in Eq. (6) seems work betterat longer wavelengths.
3.2 Absorption Versus Blood ConcentrationThe simulation results for Eq. (5) and the comparison to Eq. (11)are shown in Fig. 6. The constant term and the skin absorptionwithout blood are significantly different at short wavelengths.This is because in addition to the linear term pd, the deriva-tive also contains the nonlinear blood effect, μa,b p′
d, and thecross-talk between skin baseline, μa,d p′
d. The numerical and an-
alytical first-order derivatives are again similar (<550 nm). Theexplanation for larger differences in the range 450–500 nm isthe absorption of bilirubin. Bilirubin was assumed to be solvedin blood in MCML simulation but not in the diffusion model.Therefore, the derivative of MCML data contains also the ab-sorption of bilirubin, but the diffusion model does not. Thisdifference did not seem to significantly disturb the prediction ofblood and melanin concentrations.
3.3 Comparison to Monte Carlo SimulationThe accuracy of the prediction of the chromophore concen-trations is assessed by means of the random MCML simula-tion data set, shown in Table 1. The results are displayed inFig. 7. The accuracy of the prediction is measured as the RMSEP
0.005 0.010 0.015 0.020 0.025
0.00
00.
010
0.02
0
(a)Blood fraction in MCML simulation
Pre
dict
ed b
lood
frac
tion
0.01 0.02 0.03 0.04 0.05
0.01
0.02
0.03
0.04
0.05
(b)Melanin fraction in MCML simulation
Pre
dict
ed m
elan
in fr
actio
n
0.6 0.7 0.8 0.9 1.0
0.4
0.6
0.8
1.0
(c)Oxygen saturation in MCML simulation
Pre
dict
ed o
xyge
n sa
tura
tion
Fig. 7 Prediction of the chromophore concentrations of the MCMLsimulation using dMBLL and following wavelengths: λ ∈ {505, 530,595, 625, 850} nm. (a) Predicted blood fraction against blood fractionused in the MCML simulation. The prediction error is RMSEP=15% andthe correlation between predicted and given values, r=0.94. (b) Pre-dicted fraction of melanin against the melanin fraction used in MCMLsimulation. The prediction error RMSEP=7% and correlation r=0.99.(c) Predicted oxygen-saturation levels against saturation levels in theMCML simulation. RMSEP=10%, r=0.73.
Journal of Biomedical Optics April 2011 � Vol. 16(4)046012-7

Valisuo et al.: New closed-form approximation for skin chromophore mapping
Fig. 8 Predictions of the chromophore concentrations of the Allen’stest data set. Solid lines are predictions made by fitting the diffusionmodel to the full spectra. Dashed lines are obtained by fitting the dif-fusion model to selected five wavelengths, λ ∈ {505, 530, 595, 625,850} nm. The predictions shown in the dotted lines are obtained byfitting the dMBLL model to the dif ference of the spectra. The referencespectrum is the one measured at time T = 4.4 s. (a) Fraction of oxyhe-moglobin (o) in upper curve and the fraction of deoxyhemoglobin (�)in lower curve, (b) Predicted fraction of melanin ( + ) in skin, and (c)Predicted oxygen saturation levels.
error and Pearson correlation coefficient between the predictedand given values. The prediction of the melanin content is themost accurate. Blood-prediction performance is slightly weakerthan prediction for melanin because the relationship betweenthe blood concentration and absorption is curved. The predic-tion of oxygen saturation is the weakest. Often the concentrationof deoxyhemoglobin is very low, and even small absolute errorscause large relative errors. Sometimes even slightly negativevalues were observed. If negative concentration was observed,then it was saturated to zero. The samples shown as trianglesare these kinds of fixed predictions.
Table 2 The Speeds of different implementations.
Number of Execution Time for
Method wavelengths time/spectrum 1 megapixel
MCML 285 25 min NA
MCML 5 26 s NA
Diffusion 285 1.1 s 12 days
Diffusion 5 0.53 s 6 days
dMBLL 5 1.2 ms 20 min
3.4 Allen’s Test DataThe algorithm was applied to the experimental Allen’s test datato study its performance for measured data. The results areshown in Fig. 8. The prediction of each chromophore was donewith three different methods. First by fitting the skin modelto the spectra by optimizing the chromophore concentrationswith LMA (solid line). Then the same method was repeated,but now only five selected wavelengths were used (dashedlines). The third method is to use the analytical derivative andEq. (17) to solve the linearized skin model around and operatingpoint. The spectrum measured at time T = 4.4 s was used as anoperating point.
3.5 Execution SpeedTo evaluate the speed benefit gained by using a closed-formdMBLL solution, the predictions done above were bench-marked. The diffusion model and the dMBLL implementationswere programmed with a statistical software package, called R.The MCML program was programmed with C. The predictionswere run in a normal desktop PC. The processor of the PC wasIntel R©Core 2 CPU 6600 using a 2.40-GHz clock frequency. Wealso estimated how long it would take to process every pixel ina 1-megapixel image. The results of the benchmarks are shownin Table 2.
4 DiscussionThe absolute blood concentration in dermis is perhaps not a clin-ically significant parameter because it varies all the time. Thelocal and global blood circulation regulation change the bloodperfusion in skin due to body and ambient temperature changes,due to physical exercise and the activity of metabolism, andfor many other reasons not directly related to skin. Therefore,we have used the difference of the absorption between the nor-mal skin and a skin disorder in measuring the severity of thedisorder. The method developed here, represented by Eq. (17)can be used for finding the corresponding difference in chro-mophore concentrations behind the change of absorption. How-ever, the absolute concentrations in the reference area are alsoneeded because the derivative of absorption of dermis [shown inEq. (10)] depends on the absolute concentration.
The fitting of the diffusion model to the average spectra ofnormal skin using LMA is a suitable method for determining
Journal of Biomedical Optics April 2011 � Vol. 16(4)046012-8
Valisuo et al.: New closed-form approximation for skin chromophore mapping
the normal operating point, around which the skin absorptioncan be linearized. The proposed method forms a simple rela-tionship between the chromophore concentrations and the ab-sorption. Many similar methods are based on heuristics of theshape of the spectral curves. Our method is based on solv-ing a simple matrix equation where the transformation matrixis calculated from the analytical derivatives of the diffusionmodel. The method can be easily adapted to any set of chro-mophores and arbitrary wavelengths. The transformation ma-trix is optimized case by case. The numerical derivative of theMCML model could be used as well, but it is much slowerto compute. The proposed model is accurate near the operat-ing point, but the error increases when the difference in chro-mophore concentration becomes larger. The accuracy of themeasurement may be further increased by using several refer-ence points, in case the difference of concentrations is abnor-mally high.
The method can adapt to different wavelengths, but the accu-racy is different in different wavelengths. The five wavelengthsused in this paper form one good subset of wavelengths, be-cause the accuracy is sufficient and they can all be producedusing commonly available light-emitting diodes. Therefore, aspectral imaging system for chromophore mapping can be eas-ily constructed. The accuracy may be still improved by optimiz-ing the wavelengths. The proposed model should not be usedfor wavelengths of <550 nm because the model of epidermisdiffers significantly from MCML simulation. More research isneeded to correct this problem in the future.
Here, the model also takes into account the specular reflec-tions from the surface of the skin. In practice, the specular reflec-tion can vary between skin locations, causing additional error.These reflections can be removed from the image by placing apolarizing filter in front of the light source and placing the sec-ond filter orthogonally in front of the camera lens, as describedin Ref. 25 (Chap. 7). In this way, specular reflections and singlescattered photons are filtered away. The polarization of the mul-tiple scattered photons is lost, and therefore, part of them willpass through a second filter into the camera. When using thesecross-polarizing filters, special attention must be paid to cali-bration, because the typical white references may reflect lightmainly retaining the polarization. Therefore, the camera maymeasure even higher reflectance for red and NIR from skin thanfrom the white reference.
The execution speeds of the optimization methods are un-suitably slow to the chromophore mapping purposes at the res-olutions of contemporary cameras. The LMS algorithm is fastenough, but then the system needs to be linearized. When thesystem is linearized around a proper operating point, case bycase, the linearizion does not cause too much error.
The proposed method for compensating the edge losses ofthe integrating sphere works for the optical properties used inthe MCML simulation. However, the method is not validatedfor optical scattering and absorption coefficients, which differsignificantly from those of normal skin. The simulations coveronly one probe geometry, where light is illuminated through acollimated beam, which radius rb = 0.15 cm, and the apertureradius of the integrating sphere was ra = 0.5 cm. More studiesare needed to find out if it is enough to only optimize the modelparameters EL and k or change the whole model, when the probegeometry changes.
5 ConclusionIn this research, a method is proposed to build a linear model,based on the differential Beer–Lambert law to efficiently mapthe chromophore concentrations in the spectral image of humanskin. The proposed algorithm calculates an optimal linear modelaround an operating point, taking into account the spectra of theselected wavelengths, the concentrations of these chromophoresin the selected operating point, and the available wavelengths.The system is validated against a data set created with a MCMLsimulation and a spectrometer measurement during the Allen’stest, which modulates the blood fraction in skin.
The accuracy of the measurement is good enough for manypurposes. The RMSEP in predicting the blood and melanin frac-tion was correspondingly 15 and 7%, and the Pearson correlationcoefficients were r = 0.94 and r = 0.99. The prediction of theoxygen saturation is more error prone because the concentra-tion of the deoxygenated hemoglobin is small. Therefore, theprediction of the oxygen-saturation levels is more difficult andthe Pearson correlation between given and predicted values is r= 0.73. The error percentage is still low: RMSEP = 10% be-cause the oxygen saturation levels were only predicted in therange of Os ∈ [0.6, 1.0], and therefore, the errors are smallcompared to the actual value.
The proposed method is orders of magnitude faster than themethods based on optimization during prediction. Therefore therendering of high-resolution spectral images is also possible.
AcknowledgmentsThe authors wish to thank an anonymous proofreaders of Jour-nal of Biomedical optics. The received comments were veryconstructed and helped to further improve the article.
References1. I. Konishi, Y. Ito, N. Sakauchi, M. Kobayashi, and Y. Tsunazawa, “A
new optical imager for hemoglobin distribution in human skin,” Opt.Rev. 10, 592–595 (2003).
2. D. Jakovels and J. Spigulis, “2-D mapping of skin chromophores inthe spectral range 500–700 nm,” J. Biophoton. 3, 125–129 (2010).
3. T. Yamamoto, H. Takiwaki, S. Arase, and H. Ohshima, “Derivationand clinical application of special imaging by means of digital camerasand ImageJ freeware for quantification of erythema and pigmentation,”Skin Res. Technol. 14, 26–34 (2008).
4. I. S. Kaartinen, P. O. Valisuo, J. T. Alander, and H. O. Kuokka-nen,“Objective scar assessment-a new method using standardized digitalimaging and spectral modelling,” Burns 37(1), 74–81 February 2011.
5. M. Kobayashi, Y. Ito, N. Sakauchi, I. Oda, I. Konishi, and Y.Tsunazawa, “Analysis of nonlinear relation for skin hemoglobin imag-ing,” Opt. Express 9, 802–812 (2001).
6. P. Clarys, K. Alewaeters, R. Lambrecht, and A. O. Barel,“Skin color measurements: comparison between three instruments: theChromameter R©, the DermaSpectrometer R© and the Mexameter R©,” SkinRes. Technol. 6, 230–238 (2000).
7. L. E. Dolotov, Y. P. Sinichkin, V. V. Tuchin, S. R. Utz, G. B.Altshuler, and I. V. Yaroslavsky, “Design and evaluation of a novelportable erythema-melanin-meter,” Lasers Surg. Med. 34, 127–135(2004).
8. M. Moncrieff, S. Cotton, E. Claridge, and P. Hall, “Spectrophotometricintracutaneous analysis: a new technique for imaging pigmented skinlesions,” Br. J. Dermatol. 146, 448–457 (2002).
9. G. E. Nilsson, H. Zhai, H. P. Chan, S. Farahmand, and H. I. Maibach,“Cutaneous bioengineering instrumentation standardization: the tissueviability imager,” Skin Res. Technol. 15, 6–13 (2009).
Journal of Biomedical Optics April 2011 � Vol. 16(4)046012-9

Valisuo et al.: New closed-form approximation for skin chromophore mapping
10. G. V. G. Baranoski and A. Krishnaswamy, “Light interaction withhuman skin: from believable images to predictable models,” in SiggraphAsia 08, ACM, New York, pp. 1–80 (2008).
11. T. Igarashi, K. Nishino, and S. Nayar, “The appearance of humanskin: A survey,” Found. Trends Comput. Graphics Vis. 3, 1–95 (2007).
12. S. A. Prahl, M. Keijzer, S. L. Jacques, and A. J. Welch, “A Monte Carlomodel of light propagation in tissue,” Dosim. Laser Radiat. Med. Biol.IS 5, 102–111 (1989).
13. L. Wang, S. L. Jacques, and L. Zheng, “MCML—Monte Carlo model-ing of light transport in multi-layered tissues,” Comput. Methods Prog.Biomed. 47, 131–146 (1995).
14. L. H. Wang, S. L. Jacques, and L. Q. Zheng, “CONV—Convolution forresponses to a finite diameter photon beam incident on multi-layeredtissues,” Comput. Methods Prog. Biomed. 54, 141–150 (1997).
15. J. L. Reuss, “Multilayer modeling of reflectance pulse oximetry,” IEEETrans. Biomed. Eng. 52, 153–159 (February 2005).
16. E. Claridge, S. Cotton, P. Hall, and M. Moncrieff, “From colour totissue histology: physics based interpretation of images of pigmentedskin lesions,” in Medical Image Computing and Computer-AssistedIntervention—MICCAI 2002, Lecture Notes in Computer Science,Vol. 2488, Takeyoshi Dohi and Ron Kikinis, Eds., pp. 730–738,Springer Berlin (2002).
17. E. Claridge and S. Preece, “An inverse method for the recovery of tissueparameters from colour images,” in Processing in Medical Imaging,Vol. 2732, pp. 306–317, Springer, Ambleside, UK (2003).
18. S. J. Preece and E. Claridge, “Spectral filter optimization for the re-covery of parameters which describe human skin,” IEEE Trans. PatternAnal. Mach. Intell. 26, 913–922 (July 2004).
19. M. Shimada, Y. Yamada, M. Itoh, and T. Yatagai, “Melanin and bloodconcentration in human skin studied by multiple regression analysis:experiments,” Phy. Med. Biol. 46, 2385–2395 (2001).
20. P. Valisuo, T. Mantere, and J. Alander, “Solving optical skin simulationmodel parameters using genetic algorithm,” in Proc. of 2nd Int. Conf.on BioMedical Engineering and Informatics, pp. 376–380 (2009).
21. M. J. C. van Gemert, S. L. Jacques, H. J. C. M. Sterenborg, andW. M. Star, “Skin optics,” IEEE Trans. Biomed. Eng. 36, 1146–1154(December 1989).
22. P. Valisuo and J. Alander, “The effect of the shape and location ofthe light source in diffuse reflectance measurements,” in Proc. of 21stIEEE Int. Symp. on Computer-Based Medical Systems, IEEE ComputerSociety, pp. 81–86 (2008).
23. M. S. Patterson, B. Chance, and B. C. Wilson, “Time resolved re-flectance and transmittance for the noninvasive measurement of tissueoptical properties,” Appl. Opt. 28, 2331–2336 (1989).
24. T. J. Farrell, M. S. Patterson, and B. Wilson, “A diffusion theory modelof spatially resolved, steady-state diffuse reflectance for the noninvasive
determination of tissue optical properties in vivo,” Med. Phy. 19, 879–888 (1992).
25. V. V. Tuchin, Tissue Optics: Light Scattering Methods and Instrumentsfor Medical Diagnosis, SPIE Press, Bellingham, WA (2007).
26. M. Shimada, Y. Masuda, Y. Yamada, M. Itoh, M. Takahashi, andT. Yatagai, “Explanation of human skin color by multiple linear regres-sion analysis based on the modified Lambert–Beer law,” Opt. Rev. 7,348–352 (2000).
27. L. Kocsis, P. Herman, and A. Eke, “The modified Beer–Lambert lawrevisited,” Phy. Med. Biol. 51, N91–N98 (2006).
28. M. G. Sowa, A. Matas, B. J. Schattka, and H. H. Mantsch, “Spec-troscopic assessment of cutaneous hemodynamics in the presence ofhigh epidermal melanin concentration,” Clin. Chim. Acta 317, 203–212(2002).
29. G. N. Stamatas, B. Z. Zmudzka, N. Kollias, and J. Z. Beer, “In vivomeasurement of skin erythema and pigmentation: new means of im-plementation of diffuse reflectance spec-troscopy with a commercialinstrument,” Br. J. Dermatol. 159, 683–690 (2008).
30. J. R. Mourant, T. M. Johnson, G. Los, and I. J. Bigio, “Non-invasivemeasurement of chemotherapy drug concentrations in tissue: prelim-inary demonstrations of in vivo measurements,” Phys. Med. Biol. 44,1397–1418 (1999).
31. A. Amelink and H. J. C. M. Sterenborg, “Measurement of the local opti-cal properties of turbid media by differential path-length spectroscopy,”Appl. Opt. 43, 3048–3054 (2004).
32. I. S. Kaartinen, P. O. Valisuo, V. Bochko, J. T. Alander, and H. O.Kuokkanen, “How to assess scar hypertrophy? A comparison of sub-jective scales and spectrocutometry — a new objective method,” WoundRepair Regen. (in press).
33. V. V. Tuchin, S. R. Utz, and I. V. Yaroslavsky, “Tissue op-tics, light distribution, and spectroscopy,” Opt. Eng. 33, 3178–3188(October 1994).
34. P. Valisuo, I. Kaartinen, H. Kuokkanen, and J. Alander, “The colour ofblood in skin: a comparison of Allen’s test and photonics simulations,”Skin Res. Technol. 16, 390–396 (November 2010).
35. S. L. Jacques and D. J. McAuliffe, “The melanosome: threshold tem-perature for explosive vaporization and internal absorption coefficientduring pulsed laser irradiation,” Photochem. Photobiol. 53, 769–775(1991).
36. S. L. Jacques, “Origins of tissue optical properties in the UVA, visi-ble, and NIR regions,” Adv. Opt. Imaging Photon Migrat. 2, 364–369(1996).
37. I. S. Saidi, “Transcutaneous optical measurement of hyperbilirubinemiain neonates,” PhD Thesis, Rice University, Houston (1992).
38. J. O. Ramsay and B. W. Silverman, “Functional data analysis,” Stat.Comput. 8, 401–403 (1998).
Journal of Biomedical Optics April 2011 � Vol. 16(4)046012-10