ne 145th brt sepa appendix c air quality technical report
TRANSCRIPT
SEPA Environmental Checklist
APPENDIX C
Air Quality Technical Report
Air Quality Technical Report
March 2021
SR 522/NE 145th BRT Project
Page ii | AE 0055-17 | Air Quality Technical Report March 2021
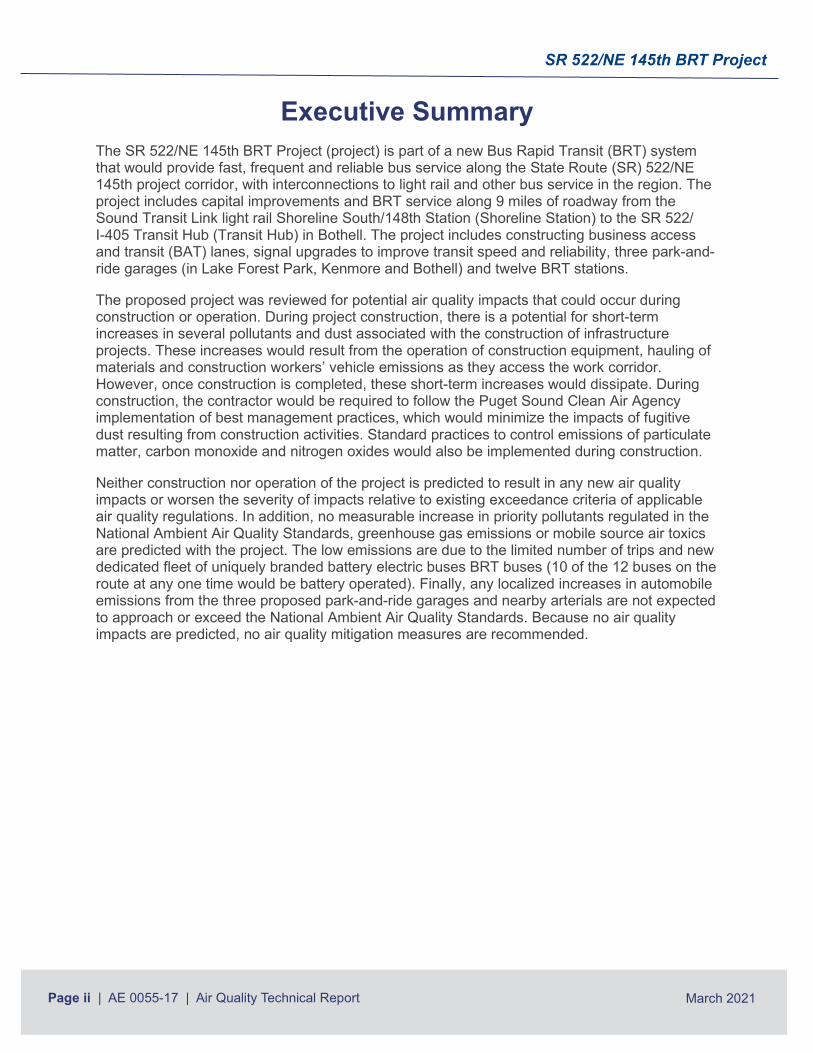
Executive Summary The SR 522/NE 145th BRT Project (project) is part of a new Bus Rapid Transit (BRT) system that would provide fast, frequent and reliable bus service along the State Route (SR) 522/NE 145th project corridor, with interconnections to light rail and other bus service in the region. The project includes capital improvements and BRT service along 9 miles of roadway from the Sound Transit Link light rail Shoreline South/148th Station (Shoreline Station) to the SR 522/ I-405 Transit Hub (Transit Hub) in Bothell. The project includes constructing business access and transit (BAT) lanes, signal upgrades to improve transit speed and reliability, three park-and-ride garages (in Lake Forest Park, Kenmore and Bothell) and twelve BRT stations.
The proposed project was reviewed for potential air quality impacts that could occur during construction or operation. During project construction, there is a potential for short-term increases in several pollutants and dust associated with the construction of infrastructure projects. These increases would result from the operation of construction equipment, hauling of materials and construction workers’ vehicle emissions as they access the work corridor. However, once construction is completed, these short-term increases would dissipate. During construction, the contractor would be required to follow the Puget Sound Clean Air Agency implementation of best management practices, which would minimize the impacts of fugitive dust resulting from construction activities. Standard practices to control emissions of particulate matter, carbon monoxide and nitrogen oxides would also be implemented during construction.
Neither construction nor operation of the project is predicted to result in any new air quality impacts or worsen the severity of impacts relative to existing exceedance criteria of applicable air quality regulations. In addition, no measurable increase in priority pollutants regulated in the National Ambient Air Quality Standards, greenhouse gas emissions or mobile source air toxics are predicted with the project. The low emissions are due to the limited number of trips and new dedicated fleet of uniquely branded battery electric buses BRT buses (10 of the 12 buses on the route at any one time would be battery operated). Finally, any localized increases in automobile emissions from the three proposed park-and-ride garages and nearby arterials are not expected to approach or exceed the National Ambient Air Quality Standards. Because no air quality impacts are predicted, no air quality mitigation measures are recommended.
SR 522/NE 145th BRT Project
Page iii | AE 0055-17 | Air Quality Technical Report March 2021
Table of Contents 1 INTRODUCTION ....................................................................................................................... 1
2 PROJECT DESCRIPTION ....................................................................................................... 1
3 INTRODUCTION TO AIR QUALITY ........................................................................................ 5
3.1 Greenhouse gases .............................................................................................. 6
3.2 Mobile Source Air Toxics .................................................................................... 6
4 AIR QUALITY REGULATORY OVERVIEW ............................................................................ 6
4.1 Ambient air quality standards .............................................................................. 7
5 EXISTING AIR QUALITY ......................................................................................................... 9
6 AIR QUALITY IMPACTS .......................................................................................................... 9
6.1 Long-term air quality impacts .............................................................................. 9 6.1.1 Criteria pollutants and odor ..................................................................... 9 6.1.2 Greenhouse gases .................................................................................10 6.1.3 Mobile source air toxics ..........................................................................10
6.2 Short-term construction-related impacts .............................................................11 6.2.1 Fugitive dust ...........................................................................................12 6.2.2 Criteria pollutants and GHG emissions ...................................................12 6.2.3 Odors .....................................................................................................12
7 AIR QUALITY MITIGATION ................................................................................................... 12
8 REFERENCES ........................................................................................................................ 14
List of Figures Figure 2-1 SR 522/NE 145th BRT Project ............................................................................ 4
List of Tables Table 4-1 Ambient air quality standards .............................................................................. 8 Table 6-1 Pollutants generated by construction activities ...................................................11
SR 522/NE 145th BRT Project
Page iv | AE 0055-17 | Air Quality Technical Report March 2021
Acronyms and Abbreviations µg/m3 micrograms per cubic meter AADT Average Annual Daily Traffic BAT business access and transit BEB Battery Electric Bus BMPs best management practices BRT bus rapid transit CAA Clean Air Act CH4 methane CO carbon monoxide CO2 carbon dioxide CO2e carbon dioxide equivalent Ecology (Washington State) Department of Ecology EPA (U.S.) Environmental Protection Agency FHWA Federal Highway Administration GHG greenhouse gas MSATS Mobile Source Air Toxics NAAQS National Ambient Air Quality Standards N2O nitrous oxide NF3 nitrogen trifluoride NO2 nitrogen dioxide NOx nitrogen oxides Pb lead PM particulate matter ppm parts per million PSCAA Puget Sound Clean Air Agency SEPA State Environmental Policy Act SF6 sulfur hexafluoride SO2 sulfur dioxide SR State Route TSP transit signal priority VMT vehicle miles traveled VOCs volatile organic compounds WSDOT Washington State Department of Transportation
SR 522/NE 145th BRT Project
Page 1 | AE 0055-17 | Air Quality Technical Report March 2021
1 INTRODUCTION This technical report provides a qualitative analysis of air quality for the Sound Transit State Route (SR) 522/NE 145th Bus Rapid Transit (BRT) Project (project). The objective of the analysis was to review air quality regulations, discuss air quality in the Puget Sound area and along the BRT project corridor and demonstrate whether the proposed project would likely result in air quality impacts.
This technical report includes a discussion of anticipated air quality during project construction, air quality protection measures Sound Transit would implement during construction, as well as long-term air quality expected during project operations.
2 PROJECT DESCRIPTION The project is part of a new BRT system that would provide fast, frequent, and reliable bus service along the SR 522/NE 145th project corridor, with interconnections to light rail and other bus service in the region. The project would provide BRT service (to be called “Stride”) along about 9 miles of roadway between the Sound Transit Link light rail Shoreline South/148th Station1 and the SR 522/I-405 Transit Hub. The transit hub is in the design phase and is being provided by the Washington Department of Transportation (WSDOT) I-405/SR 522 Vicinity to SR 527 Express Toll Lanes Improvement Project.
The project would include business access and transit (BAT) lanes, transit queue bypass lanes, signal upgrades and transit signal priority (TSP) for transit speed and reliability, three new park-and-ride garages (Lake Forest Park, Kenmore and Bothell) and 12 BRT stations2 between the Sound Transit Link light rail Shoreline South/148th Station and the SR 522/I-405 Transit Hub.
The project would also include constructing or re-constructing sidewalks where BAT lanes and transit queue bypass lanes are constructed and at some intersections in the immediate vicinity of BRT stations. Some transit queue bypass lanes and BAT lanes result in roadway widening. Intersection and sidewalk construction includes upgrading curb ramps to current Americans with Disabilities Act standards.
Right-of-way acquisitions and easements would occur to allow for construction and operation of the BRT service and related access improvements. Stormwater management would be provided as needed to comply with pertinent law and codes. Utility connections would be provided as necessary.
1 Environmental review of the Shoreline South/148th station occurred as part of the Sound Transit Lynnwood Link Extension Project State Environmental Policy Act Environmental Impact Statement. 2 Each station proposed as part of this project includes an eastbound platform and a westbound platform.
SR 522/NE 145th BRT Project
Page 2 | AE 0055-17 | Air Quality Technical Report March 2021
Most BRT station platforms (e.g., the sidewalk that the bus shelter sits upon) would be double-length platforms (accommodating two 60-foot coaches) to accommodate shared use by Sound Transit with King County Metro (Metro) and Community Transit buses (the three transit agencies operating in the corridor). SR 522/NE 145th BRT service would be provided with 12 three-door articulated coaches with the Stride brand, including 10 Battery Electric Buses (BEBs) and 2 diesel hybrid buses. Service headways (the amount of time between bus arrivals at a stop) would be 10 minutes, which translates to 12 total BRT vehicles per hour along the project corridor. Sound Transit would prioritize use of the BEBs for this service as much as possible, and the BEBs (rather than the diesel hybrid buses) would be the bus type used for most of the service, all day. The span of service would be 19 hours on Monday through Saturday and 17 hours on Sunday. The estimated 2042 ridership forecast for the SR 522/NE 145th BRT system is approximately 8,900 riders per day.
Station shelters would have a consistent look and feel throughout the BRT system, but individual platform design would vary based on site conditions and transit integration assumptions at each location. Each station would include Stride-branded shelters, lighting, and most platforms would be elevated 9 inches to ease boarding and alighting. Platform types would be either flow-through (sidewalk passes through the platform) or pass-behind (sidewalk passes behind the platform). The project would also include intelligent transportation system elements: off-board fare payment, electronic rider information with bus arrival times, Computer-Aided Dispatch/Automatic Vehicle Location, TSP, and enhanced safety and security at certain stations.
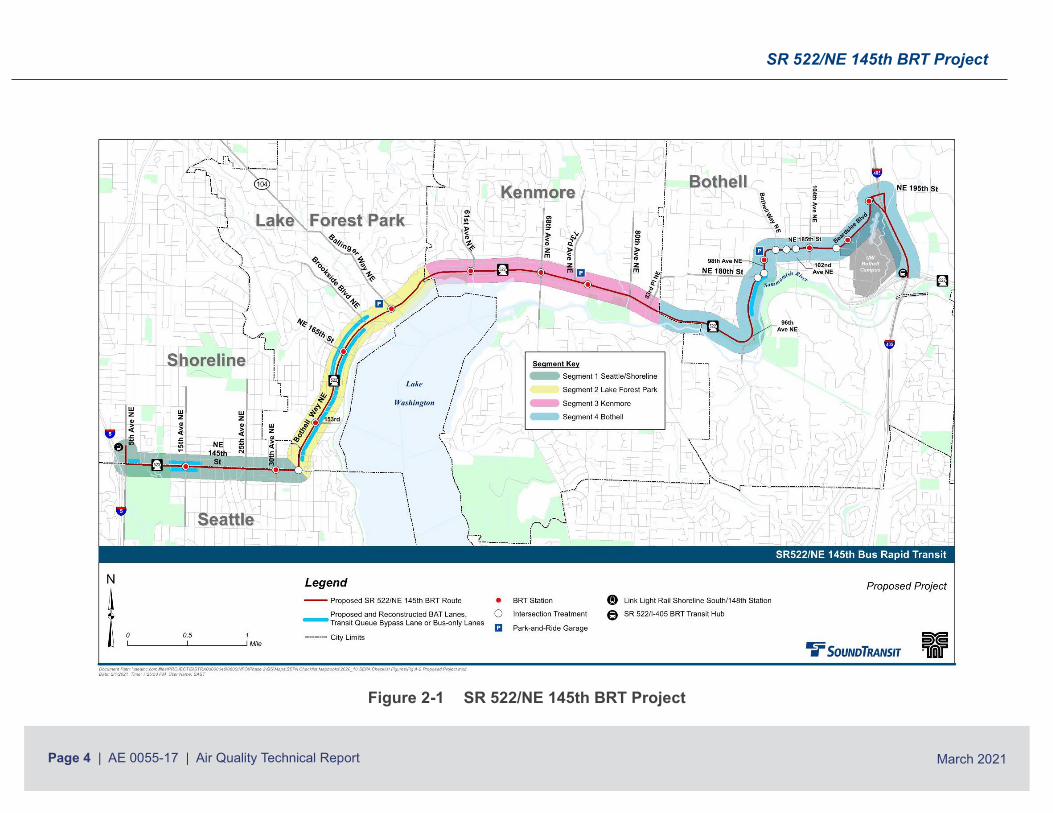
Figure 2-1 (SR 522/NE 145th BRT Project) shows the proposed project, including the route, station locations and park-and-ride garage locations. The State Environmental Policy Act (SEPA) Checklist document includes layouts for the three park-and-ride garages. This report reflects the project as described and as shown in the Conceptual Engineering Design Plans (see Appendix A of the SEPA Checklist).
The following is a summary of the proposed project’s major elements, by segment:
• Segment 1: Seattle/Shoreline (NE 145th Street): westbound transit queue bypass lane on NE 145th Street between a point east of 8th Avenue NE and 5th Avenue NE, transit queue bypass lanes on NE 145th Street at 15th Avenue NE in each direction, two stations (15th Avenue NE and 30th Avenue NE), and an additional lane eastbound on NE 145th Street approaching SR 522 to provide a shared bus left-turn/general-purpose traffic through lane.
• Segment 2: Lake Forest Park: northbound/eastbound BAT lane from approximately NE 145th Street to south of Brookside Boulevard NE; reconstructed BAT lane southbound/westbound between Beach Drive and 38th Avenue NE; a new 300-stall park-and-ride garage located at the Lake Forest Park Town Center; three stations (NE 153rd Street, NE 165th Street and Lake Forest Park Town Center); retaining walls in certain locations; and minor roadway, roadside and intersection improvements in certain locations where other improvements would occur.
• Segment 3: Kenmore: three stations (61st Avenue NE, 68th Avenue NE and the Kenmore Park-and-Ride) and a new park-and-ride garage providing 300 additional stalls at the Kenmore Park-and-Ride, including vehicle access modification.
SR 522/NE 145th BRT Project
Page 3 | AE 0055-17 | Air Quality Technical Report March 2021
• Segment 4: Bothell: northbound/eastbound center bus-only lane to bus-only left-turn lane along SR 522 beginning approximately 700 feet south of Hall Road (just north of the Yakima Fruit Market & Nursery) to 98th Avenue NE; four stations (98th Avenue NE at NE 182nd Street, NE 185th Street at 104th Avenue NE, Beardslee Boulevard at University of Washington Bothell/Cascadia College, and Beardslee Boulevard near NE 195th Street); a new park-and-ride garage at a site (northwest of where 98th Avenue NE would meet NE 185th Street) providing 300 net additional parking spaces; new traffic signal and intersection reconstruction on NE 185th Street at 104th Avenue NE and at Beardslee Boulevard; and sidewalks, planting strips and minor intersection improvements at certain locations where other improvements would occur.
SR 522/NE 145th BRT Project
Page 4 | AE 0055-17 | Air Quality Technical Report March 2021
Figure 2-1 SR 522/NE 145th BRT Project
SR 522/NE 145th BRT Project
Page 5 | AE 0055-17 | Air Quality Technical Report March 2021
3 INTRODUCTION TO AIR QUALITY The Clean Air Act (CAA) of 1970 identified six criteria pollutants of concern: carbon monoxide (CO), ozone, lead (Pb), nitrogen dioxide (NO2), sulfur dioxide (SO2) and particulate matter (PM), including PM10 and PM2.5. Of these, the pollutants of primary concern when evaluating potential air quality impacts of transportation projects such as this one are CO, ozone and PM.
CO is a colorless, odorless, tasteless and toxic air pollutant produced in the incomplete combustion of carbon-containing fuels, such as gasoline, natural gas, oil, coal and wood. CO pollution tends to be localized near the point where the emission occurred. Generally, contributions from motor vehicles are the most significant source; therefore, the highest CO levels typically occur near signalized intersections and areas with high levels of traffic congestion. In the 1960s, vehicle emissions led to increased and unhealthful ambient CO concentrations in many cities. Improvements to motor vehicle technology have resulted in a marked reduction in CO from vehicles, even with an overall notable increase in vehicle miles traveled (VMT).
Ozone is produced when emissions of nitrogen oxides (NOx) (several nitrogen and oxygen gases and compounds) and volatile organic compounds (VOCs) from mobile sources (i.e., gasoline and diesel vehicles) and industrial sources interact with ultraviolet radiation from the sun. When ozone is located higher up in the stratosphere, it forms a protective layer that shields the Earth from too much of the sun's harmful ultraviolet radiation. However, when ozone is formed near ground level, it can be problematic for people with respiratory conditions, such as asthma, and can cause shortness of breath, wheezing and coughing.
Particulate matter, or PM, is one of the air quality criteria pollutants outlined in the CAA that is generated, in part, by motor vehicles. Particulate matter can consist of particles of wood smoke, diesel smoke, dust, pollen and other materials. It has traditionally been measured in two forms: PM10 and PM2.5. PM10 is defined as all matter smaller than 10 microns in diameter, and PM2.5 is material that is smaller than 2.5 microns in diameter. There is increasing interest in PM, because it is a significant pollutant coming from diesel vehicles, which are critical to both the transit and transportation freight industries. Forms of PM have been identified as probable carcinogens and listed as air toxic compounds by the U.S. Environmental Protection Agency (EPA).
The remaining criteria pollutants (Pb and SO2) are emitted at much lower levels than CO, PM and the ozone precursors—VOCs and NOx. The criteria pollutant lead, or Pb, was a concern before unleaded fuels were introduced, but it is no longer an issue because of the use of unleaded fuels. However, because lead persists in the environment and is still a source of air pollution, albeit not from most modern motor vehicles, and continues to be listed as a pollutant, a comprehensive air quality analysis continues to include lead as a potential impact. Finally, because this BRT system will use mostly electric buses, which do not emit any Pb or SO2, emissions of these pollutants would be negligible and would fall well below the levels stated in all state and federal standards.
SR 522/NE 145th BRT Project
Page 6 | AE 0055-17 | Air Quality Technical Report March 2021
3.1 Greenhouse gases Greenhouse gas (GHG) emissions are air pollutants with distinctive features that make them different from other air pollutants. GHGs include carbon dioxide (CO2), methane (CH4), nitrous oxide (N2O), nitrogen trifluoride (NF3), hydrofluorocarbons, perfluorocarbons and sulfur hexafluoride (SF6). GHGs, in particular CO2, are emitted by a vast number of sources, including natural and human-made. Carbon dioxide equivalent (CO2e) is the preferred measure for determining GHG emissions rates. GHG emissions are typically expressed in a common metric so that their impacts can be directly compared.
GHG emissions mix rapidly and uniformly in the atmosphere and contribute to global concentrations regardless of the origin. For example, a ton of CO2 emitted from Seattle has the same effect on global concentrations as a ton emitted in Los Angeles. GHG emissions adversely affect the environment by contributing to global climate change. In Washington, this can result in such environmental impacts as rising sea levels and changes in precipitation patterns that can alter water regimes in rivers and groundwaters of the state.
SEPA requires state and local agencies to identify, disclose and consider the probable environmental impacts related to their projects including those involving “new” GHGs. “New” GHGs are defined as any GHG emissions that will result from the project that are in addition to or above and beyond current emission levels.
3.2 Mobile Source Air Toxics EPA has identified a list of 21 Hazardous Air Pollutants as Mobile Source Air Toxics (MSATS). EPA and the Federal Highway Administration (FHWA) have prioritized for consideration a subset of seven compounds of the MSATS due to their potential for adverse health effects. They are acetaldehyde, acrolein, benzene, 1,3-butadiene, formaldehyde, naphthalene and polycyclic organic matter. Detailed evaluation of impacts from projects related to MSATS is required only for federally funded projects (which this project is not) and projects with substantially more overall traffic than that which occurs or will occur along the proposed project corridor. A qualitative MSATS discussion is provided in this report to aid in the understanding of overall transportation-related air quality.
For more information on MSATS, see the EPA Mobile Source Pollution and Related Health Effects website (EPA 2019).
4 AIR QUALITY REGULATORY OVERVIEW The following agency guidelines were considered in the preparation of this technical report:
• CAA and Ambient Air Quality Standards: Under the CAA, EPA established the National Ambient Air Quality Standards (NAAQS) for the six CAA criteria air pollutants of concern, discussed above.
• Washington Department of Ecology: The Washington State Department of Ecology (Ecology) has established ambient air quality standards for pollutants.
SR 522/NE 145th BRT Project
Page 7 | AE 0055-17 | Air Quality Technical Report March 2021
• Puget Sound Clean Air Agency (PSCAA) Regulation 1, Section 9.15, Fugitive Dust Control Measures: All construction sites in the Puget Sound region are required to implement emissions controls to minimize fugitive dust and odors during construction.
4.1 Ambient air quality standards Air quality along the project route is regulated by three agencies: EPA, Ecology and the PSCAA.
• The PSCAA and Ecology work together to monitor air quality within the Puget Sound region.
• In addition to establishing the NAAQS noted above, EPA has oversight authority over the PSCAA and Ecology. EPA developed the NAAQS to protect public health and welfare.
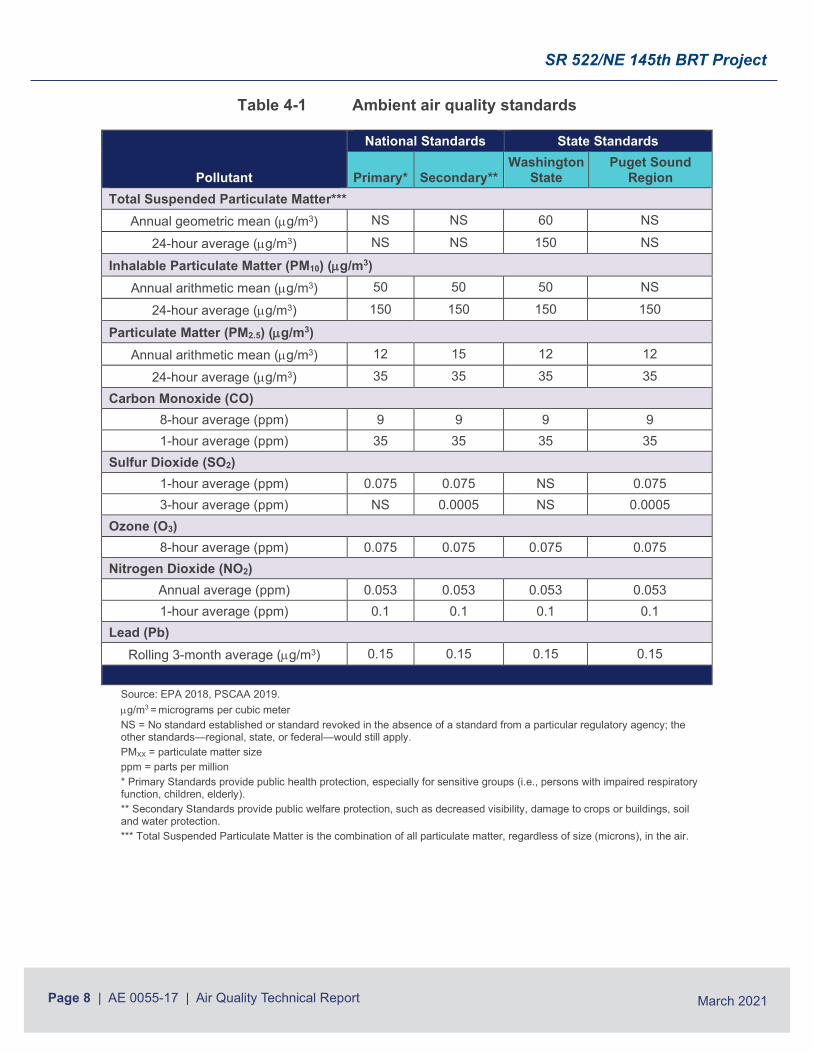
The NAAQS contain the thresholds for the six criteria air pollutants CO, NO2, PM10 /PM2.5, SO2, ozone and Pb. Ecology and the PSCAA have also established state and local ambient air quality standards for these pollutants. For reference, Table 4-1 (Ambient air quality standards) provides a summary of the NAAQS, as well as the criteria for pollutants from Ecology for Washington state and from the PSCAA for the Puget Sound region.
Areas that meet the NAAQS for pollutants of concern are classified as “attainment” areas, and those areas that are not in compliance with the NAAQS are classified as “nonattainment” areas. Areas that were formerly classified as nonattainment areas but have since demonstrated attainment with the NAAQS are classified as “maintenance” areas, until it is proven that the area would remain in compliance with the NAAQS. Areas that have successfully completed the maintenance period can be reclassified to attainment, reducing the need for additional air quality studies for most projects.
SR 522/NE 145th BRT Project
Page 8 | AE 0055-17 | Air Quality Technical Report March 2021
Table 4-1 Ambient air quality standards
Pollutant
National Standards State Standards
Primary* Secondary** Washington
State Puget Sound
Region Total Suspended Particulate Matter***
Annual geometric mean (µg/m3) NS NS 60 NS
24-hour average (µg/m3) NS NS 150 NS
Inhalable Particulate Matter (PM10) (µg/m3) Annual arithmetic mean (µg/m3) 50 50 50 NS
24-hour average (µg/m3) 150 150 150 150
Particulate Matter (PM2.5) (µg/m3) Annual arithmetic mean (µg/m3) 12 15 12 12
24-hour average (µg/m3) 35 35 35 35 Carbon Monoxide (CO)
8-hour average (ppm) 9 9 9 9 1-hour average (ppm) 35 35 35 35
Sulfur Dioxide (SO2) 1-hour average (ppm) 0.075 0.075 NS 0.075 3-hour average (ppm) NS 0.0005 NS 0.0005
Ozone (O3) 8-hour average (ppm) 0.075 0.075 0.075 0.075
Nitrogen Dioxide (NO2) Annual average (ppm) 0.053 0.053 0.053 0.053 1-hour average (ppm) 0.1 0.1 0.1 0.1
Lead (Pb) Rolling 3-month average (µg/m3) 0.15 0.15 0.15 0.15
Source: EPA 2018, PSCAA 2019. µg/m3 = micrograms per cubic meter NS = No standard established or standard revoked in the absence of a standard from a particular regulatory agency; the other standards—regional, state, or federal—would still apply. PMXX = particulate matter size ppm = parts per million * Primary Standards provide public health protection, especially for sensitive groups (i.e., persons with impaired respiratory function, children, elderly). ** Secondary Standards provide public welfare protection, such as decreased visibility, damage to crops or buildings, soil and water protection. *** Total Suspended Particulate Matter is the combination of all particulate matter, regardless of size (microns), in the air.

SR 522/NE 145th BRT Project
Page 9 | AE 0055-17 | Air Quality Technical Report March 2021
5 EXISTING AIR QUALITY The project area is in attainment for all of the pollutants of concern described in Section 4.1.
The north Seattle, Shoreline, Lake Forest Park, Kenmore and Bothell areas, which include the proposed project corridor (the “project area”), were designated nonattainment areas for CO and ozone in 1987. Based on long-term monitoring results, which showed no exceedances of the NAAQS for several years, EPA redesignated the project area as a maintenance area for CO and ozone in the late 1990s. Former nonattainment areas are required to continue to maintain air quality by adhering to a “maintenance plan” developed as part of the EPA’s redesignation process. Based on the requirements established in the maintenance plan, the project area and the entire Puget Sound region have maintained attainment for CO and ozone. Importantly, in October 2016, the maintenance plan was successfully completed, so that the area is no longer designated a maintenance area for CO or ozone. The project area does not have a history of exceedances for the other priority pollutant—particulate matter (PM10 and PM2.5).
Because the project area is now classified as “in attainment” for all of the criteria pollutants, further conformity analysis of criteria pollutants is not required for this project.
6 AIR QUALITY IMPACTS As described in the following subsections, the project’s overall effect on air quality is predicted to be so small that it would not be measurable, and therefore no air quality impacts would be expected for this project.
6.1 Long-term air quality impacts This section discusses the potential for long-term air quality impacts, as related to the project’s operations, according to three types of air pollutants. The first subsection describes the criteria pollutants of the NAAQS and potential odor from operations. The second subsection provides a brief discussion of GHG emissions, and the third covers MSATS.
6.1.1 Criteria pollutants and odor
Operation of the project would include the use of the dedicated fleet of BRT buses. Ten of the 12 buses operating on the route would be BEBs and therefore would have no operational air emissions. Diesel emissions from the other two BRT buses would be a source of air pollution. The primary pollutants emitted or formed by diesel motor vehicles are CO, PM and ozone precursors (NOx, CO and VOCs), which are subject to regional, state and federal controls. As previously stated, because the project is located in the Puget Sound region, it is no longer within a CO or ozone maintenance area. Therefore, an analysis of these pollutants is not required for this project.
SR 522/NE 145th BRT Project
Page 10 | AE 0055-17 | Air Quality Technical Report March 2021
The project would add approximately 220 bus trips and less than 900 general-purpose vehicle trips per day3 through a corridor with existing average annual daily traffic (AADT) volumes of 40,000 to 53,000 vehicles. WSDOT requires modeling of air quality only for those projects of air quality concern. To be considered a project of concern, a project must add capacity or realign roads with more than 125,000 AADT and 8 percent trucks, must have more than 10,000 truck AADT (8 percent of 125,000), or must contribute to substantial increases or concentrations of diesel exhaust emissions (WSDOT 2019). The existing AADTs for the project corridor are far below these minimum requirements; therefore, no air quality modeling was required. The fact that the project corridor has less than half the traffic necessary to require an air study supports the finding of no air quality impacts.
The operation of the proposed project is not expected to result in any new odors along the project corridor. The dedicated fleet of BRT buses would consist of new buses with the most current pollution control systems and are unlikely to be considered a source of odor. The 10 BEBs would not produce any odors.
6.1.2 Greenhouse gases
GHGs include many of the same pollutants covered under the priority pollutants and the MSATS, as discussed below. Following the same reasoning as provided for criteria pollutants in Section 6.1.1, once it is operational, the proposed project is not predicted to result in an increase in the overall GHG emissions in the project corridor. It should be noted that the project would provide a high-capacity transit alternative to personal vehicles for transportation along the project corridor, and that replacing personal vehicle use with regional mass transit is one means of reducing overall GHG levels.
This analysis did not include estimation of GHG emissions using a worksheet similar to the one King County has developed and the City of Seattle plans to use. The King County GHG Emissions Worksheet calculates GHG emissions based on categories of construction types for residential and commercial buildings. This construction types for this project, including roadway improvements, stations and garages, do not match any of the categories in the worksheet; therefore, GHG emissions were not quantitatively estimated using the King County GHG Emissions Worksheet.
6.1.3 Mobile source air toxics
The MSATS analysis for this project followed the recommendations for quantitative analysis as provided by FHWA for a minor widening project (WSDOT 2019) in a corridor with less than 140,000 to 150,000 AADT (which this corridor is, as noted above). For a project such as this, the volume of MSATS emitted would be directly proportional to the VMT. The overall VMT estimated with the project is not expected to be meaningfully different than the VMT without the project. Although the project may improve efficiency in the BAT lanes, the project would not add any capacity to the general-purpose lanes in the corridor. Because the project would not
3 The estimated 220 bus trips (110 trips in each direction) are based on the following project operation assumptions: 1 early morning bus in operation each direction just before 5 a.m.; 12 buses in operation with 15-minute headways from 5 a.m. to 6 a.m. and 10-minute headways from 6 a.m. to 11 p.m.; and 3 BRT buses in each direction between 11 p.m. and midnight. New general-purpose vehicle trips associated with the three 300-space park-and-ride garages would result in less than 900 trips (3 garages x 300 spaces at each garage), because many trips to and from the garages would be already-existing local trips and would occur with or without the new garages.
SR 522/NE 145th BRT Project
Page 11 | AE 0055-17 | Air Quality Technical Report March 2021
improve the flow of general-purpose traffic in the corridor, there would be no notable increase in overall AADT along the corridor because of the project. In addition, the operations of the three park-and-ride garages, with only 300 parking spots each, would not be predicted to have any measurable effect on the overall AADT in the corridor or on the total VMT. With no change in the AADT predicted along the corridor, any slight change in the overall VMT as a result of BRT operations is not predicted to lead to higher emissions of MSATS.
In addition, the overall MSATS emissions from all vehicles along the project corridor would likely be lower in the future than present levels as a result of EPA’s national control programs, which are projected to reduce annual MSATS emissions by more than 90 percent between 2010 and 2050 (FHWA 2016). Local conditions may differ from these national projections in terms of fleet mix and turnover, VMT growth rates and local control measures. However, the magnitude of the EPA-projected reduction of MSATS is so great (even after accounting for VMT growth) that MSATS emissions along the project corridor are likely to be lower in the future in nearly all cases. In summary, given the overall reduction in emissions under the EPA control programs, future emissions would likely be lower than current levels, even with the higher traffic volumes from operations of the BRT buses and from vehicles using the park-and-ride garages.
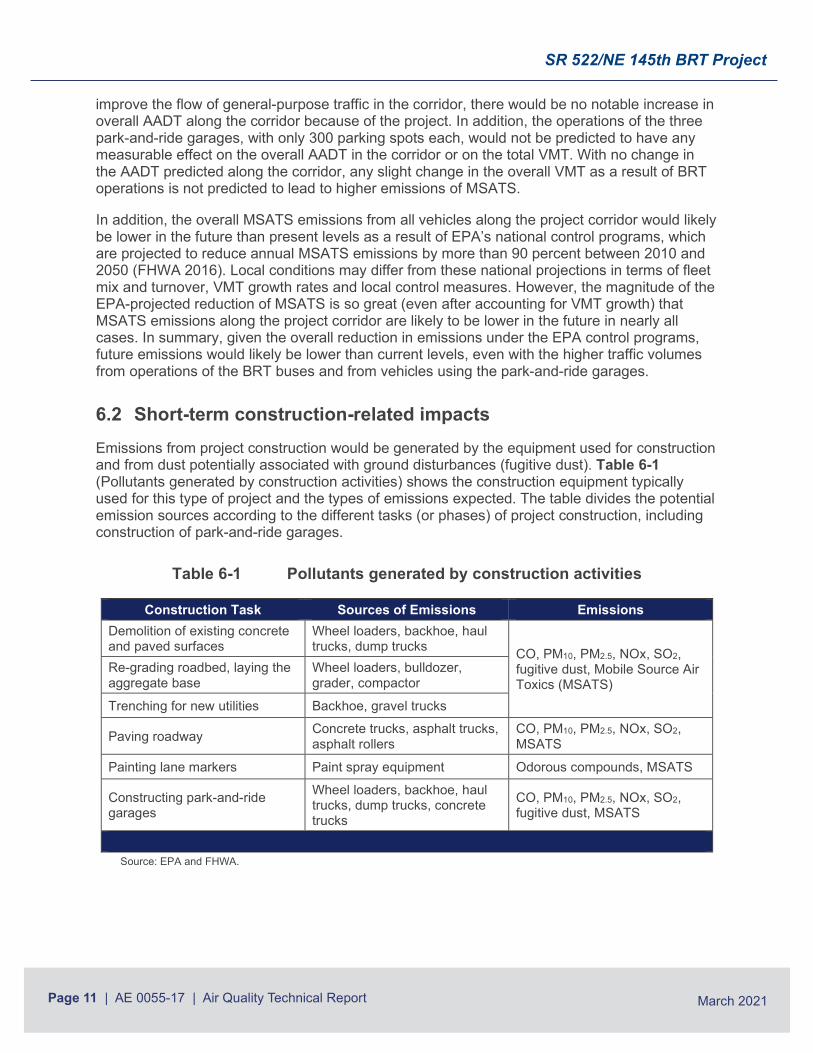
6.2 Short-term construction-related impacts Emissions from project construction would be generated by the equipment used for construction and from dust potentially associated with ground disturbances (fugitive dust). Table 6-1 (Pollutants generated by construction activities) shows the construction equipment typically used for this type of project and the types of emissions expected. The table divides the potential emission sources according to the different tasks (or phases) of project construction, including construction of park-and-ride garages.
Table 6-1 Pollutants generated by construction activities
Construction Task Sources of Emissions Emissions Demolition of existing concrete and paved surfaces
Wheel loaders, backhoe, haul trucks, dump trucks CO, PM10, PM2.5, NOx, SO2,
fugitive dust, Mobile Source Air Toxics (MSATS)
Re-grading roadbed, laying the aggregate base
Wheel loaders, bulldozer, grader, compactor
Trenching for new utilities Backhoe, gravel trucks
Paving roadway Concrete trucks, asphalt trucks, asphalt rollers
CO, PM10, PM2.5, NOx, SO2, MSATS
Painting lane markers Paint spray equipment Odorous compounds, MSATS
Constructing park-and-ride garages
Wheel loaders, backhoe, haul trucks, dump trucks, concrete trucks
CO, PM10, PM2.5, NOx, SO2, fugitive dust, MSATS
Source: EPA and FHWA.
SR 522/NE 145th BRT Project
Page 12 | AE 0055-17 | Air Quality Technical Report March 2021
The following sections provide a qualitative discussion of fugitive dust, criteria pollutants, GHG emissions and odors related to construction.
6.2.1 Fugitive dust
During periods of demolition and site preparation, dust from excavation and grading could cause temporary, localized increases in the ambient concentrations of fugitive dust and associated, suspended PM. Sources of fugitive dust include clearing and site preparation along the project corridor for paving and installation of structures, as well as dust from trucks carrying uncovered loads of soils. Trucks traveling along the project corridor could also deposit mud on local streets, which could result in an additional source of airborne dust after the mud dries. The distribution of PM would depend on the size of the particles as well as wind speed and direction. Larger dust particles would settle near the source, and fine particles would be dispersed over greater distances. Construction activity could cause localized fugitive dust impacts at residences and businesses near the construction corridor. The magnitude of potential dust impacts would vary during construction based on the type of activity and the equipment in use.
6.2.2 Criteria pollutants and GHG emissions
Construction activities would require the use of diesel-powered heavy trucks and construction equipment. These engines would emit CO, PM, NOX, CO2, CH4, N2O and VOCs that could temporarily degrade local air quality in the immediate vicinity of the activity. The criteria pollutants and GHG emissions generated from construction would vary over the construction period, with the largest impact occurring during periods of intense construction activities, such as clearing, grading and paving.
6.2.3 Odors
Certain construction activities could cause odors detectable to some people near the activity, especially during excavation and paving operations. Because use of tar and asphalt is expected to be minimal, odors from this source are not expected to be a major issue for the project. Furthermore, any odors would be temporary and localized, and would be quickly dispersed below detectable thresholds as the distance from the sites increases.
7 AIR QUALITY MITIGATION BRT operations along the project corridor would generate some emissions; however, these are not predicted to result in any new long-term air quality impacts, as noted above. Because no air quality impacts have been predicted, no operational mitigation for air quality priority pollutants, GHGs or MSATS would be required for the project. In addition, providing a high-capacity, virtually all-electric alternative to personal vehicles for transportation along a busy corridor (as would result from the proposed project) is one of many critical elements in the Puget Sound region’s efforts to reduce overall GHG emissions and GHG levels in the atmosphere.
SR 522/NE 145th BRT Project
Page 13 | AE 0055-17 | Air Quality Technical Report March 2021
The PSCAA requires the implementation of best management practices (BMPs) to minimize the impacts of fugitive dust resulting from construction activities. Sound Transit would manage construction to follow PSSCA regulations and control air emissions of criteria pollutants and GHGs, and no mitigation would be required. Typical BMPs for construction that Sound Transit would employ as needed include:
• Spraying exposed soil with a dust control agent, such as water, as necessary to reduce emissions of PM10 and the deposition of PM.
• Covering all transported loads of soil and wet materials before transport or providing adequate freeboard (i.e., space from the top of the material to the top of the truck) to reduce emissions of PM10 and the deposition of particulates during transport. The current requirement allows for a freeboard of 6 inches, and Sound Transit would require that contractors comply with this regulation as it exists today or as it may be amended in the future.
• Providing wheel washes, where feasible, to reduce dust and mud that would be carried off-site by vehicles and to decrease PM on area roadways and remove dust and mud that are deposited on paved, public roads.
• Routing and scheduling high volumes of construction traffic, where practicable, to reduce additional congestion during peak travel periods and reduce CO, NOX and CO2 emissions.
• Requiring appropriate emissions-control devices on all construction equipment powered by gasoline or diesel fuel to reduce CO and NOX emissions in vehicular exhaust.
• Using well-maintained heavy equipment to reduce CO and NOX emissions, which may also reduce GHG emissions.
• Covering and installing mulch or plant vegetation as soon as practicable after grading to reduce windblown particulates in the area.
• Encouraging contractors to employ emissions-reduction technologies and practices for both on-road and off-road equipment and vehicles (e.g., retrofitting equipment with diesel control technology and/or using ultra-low sulfur diesel).
• Implementing idling restrictions for construction trucks.
• Locating construction equipment and truck-staging zones away from sensitive receptors (e.g., residences or medical or long-term care facilities), as practicable, and in consideration of other factors such as noise and safety.
• Ensuring that all stationary equipment used for the construction activities would comply with PSCAA regulations requiring the best available measures to control the emissions of odor‐bearing air contaminants.
SR 522/NE 145th BRT Project
Page 14 | AE 0055-17 | Air Quality Technical Report March 2021
8 REFERENCES Federal Highway Administration (FHWA). 2016. Updated Interim Guidance on Mobile Source Air Toxic Analysis in NEPA Documents. October. (Website: https://www.fhwa.dot.gov/environMent/air_quality/air_toxics/policy_and_guidance/msat/). Accessed September 9, 2019.
Puget Sound Clean Air Agency (PSCAA). 2019. 2018 Air Quality Data Summary. (Website: https://pscleanair.gov/DocumentCenter/View/3830/Air-Quality-Data-Summary-2018?bidId=). Accessed September 9, 2019.
U.S. Environmental Protection Agency (EPA). 2018. NAAQS Table. (Website: https://www.epa.gov/criteria-air-pollutants/naaqs-table). Accessed September 9, 2019.
U.S. Environmental Protection Agency (EPA). 2019. Mobile Source Pollution and Related Health Effects. (Website: https://www.epa.gov/mobile-source-pollution). Accessed September 9, 2019.
Washington Geospatial Open Data Portal. 2019. Washington State Department of Transportation. (Website: http://geo.wa.gov/datasets/f024c102e9a04b81bc24b90040d1db66_0?geometry=122.388%2C47.740%2C122.094%2C47.780&selectedAttribute=AADT&where=UPPER(RouteIdentifier)%20like%20%27%25522%25%27). Verified August 12, 2020.
Washington State Department of Transportation (WSDOT). 2018. WSDOT Guidance - Project-Level Greenhouse Gas Evaluations under NEPA and SEPA. (Website: https://www.wsdot.wa.gov/sites/default/files/2019/02/08/ENV-ANE-GHGGuidance.pdf). Accessed December 26, 2019.
WSDOT. 2019. Environmental Manual M 31-11.21. June. (Website: https://www.wsdot.wa.gov/publications/manuals/fulltext/M31-11/em.pdf). Accessed September 9, 2019.