nature of selective constraints on synonymous codon usage of rice differs in gc-poor and gc-rich...
TRANSCRIPT
) 71–81www.elsevier.com/locate/gene
Gene 400 (2007
Nature of selective constraints on synonymous codon usage of ricediffers in GC-poor and GC-rich genes
Pamela Mukhopadhyay, Surajit Basak, Tapash Chandra Ghosh ⁎
Bioinformatics Centre, Bose Institute, P 1/12, C.I.T. Scheme VII M, Kolkata-700 054, India
Received 22 February 2007; received in revised form 28 April 2007; accepted 31 May 2007
Available onli
Received by M. Di Giulio
ne 16 June 2007
Abstract
Synonymous codon usage and cellular tRNA abundance are thought to be co-evolved in optimizing translational efficiencies in highlyexpressed genes. Here in this communication by taking the advantage of publicly available gene expression data of rice and Arabidopsis wedemonstrated that tRNA gene copy number is not the only driving force favoring translational selection in all highly expressed genes of rice. Wefound that forces favoring translational selection differ between GC-rich and GC-poor classes of genes. Supporting our results we also showedthat, in highly expressed genes of GC-poor class there is a perfect correspondence between majority of preferred codons and tRNA gene copynumber that confers translational efficiencies to this group of genes. However, tRNA gene copy number is not fully consistent with models oftranslational selection in GC-rich group of genes, where constraints on mRNA secondary structure play a role to optimize codon usage in highlyexpressed genes.© 2007 Elsevier B.V. All rights reserved.
Keywords: Codon usage; tRNA abundance; mRNA folding stability; Translational efficiencies
1. Introduction
In most species synonymous codons are not used with equalfrequencies; the phenomenon known as codon usage bias.Codon bias is generally governed by a balance betweenmutation, genetic drift and natural selection (Bulmer, 1991;Sharp et al., 1993; Akashi and Eyre-Walker, 1998; Gupta andGhosh, 2001; Basak and Ghosh, 2005). The codon usage biasvaries considerably among organisms and even within the genesof the same organism (Grantham et al., 1980a,b, 1981; Gouyand Gautier, 1982). There is a positive correlation between thegene expression level and the level of codon usage bias onsynonymous sites in a number of eukaryotic genomes, such asC. elegans (Duret, 2000) and Drosophila (Akashi, 1995;Moriyama and Powell, 1997; Powell and Moriyama, 1997)consistent with models of translational selection on codon usage
Abbreviations: HEG, highly expressed genes; LEG, lowly expressed genes;RSCU, relative synonymous codon usage.⁎ Corresponding author. Tel.: +91 33 2355 6626; fax: +91 33 2355 3886.E-mail address: [email protected] (T.C. Ghosh).
0378-1119/$ - see front matter © 2007 Elsevier B.V. All rights reserved.doi:10.1016/j.gene.2007.05.027
(Akashi, 2001; Duret and Mouchiroud, 1999).The abovefindings emphasized that codon usage is generally biasedtowards “preferred” codon that generally corresponds to themost abundant tRNA species (Ikemura, 1992). Even consider-ing unicellular organisms, such as E. coli and S. cerevisiae, itwas found that the codons translated by the most abundanttRNA are the most frequently used (Ikemura, 1981, 1982).However, very recent analysis of S. cerevisiae genome byconsidering the experimentally determined gene expressiondata has challenged the translational selection hypothesiscorrelating codon usage bias and tRNA abundance of highlyexpressed genes (Kahali et al., 2007). This hypothesis has notbeen confirmed in higher eukaryotes (Kanaya et al., 2001).Codon usage in mammals is mainly determined by the spatialarrangement of genomic G+C-content, i.e., the isochorestructure (Sharp et al., 1995). Heterogeneity in base composi-tion is a causative factor of codon usage bias in warm bloodedvertebrates where natural selection drives the formation of GC-rich isochores (Bernardi and Bernardi, 1985; Bernardi, 2004).Similar elevation in GC content has also been reported inGramineae (Carels and Bernardi, 2000) leading to the formation
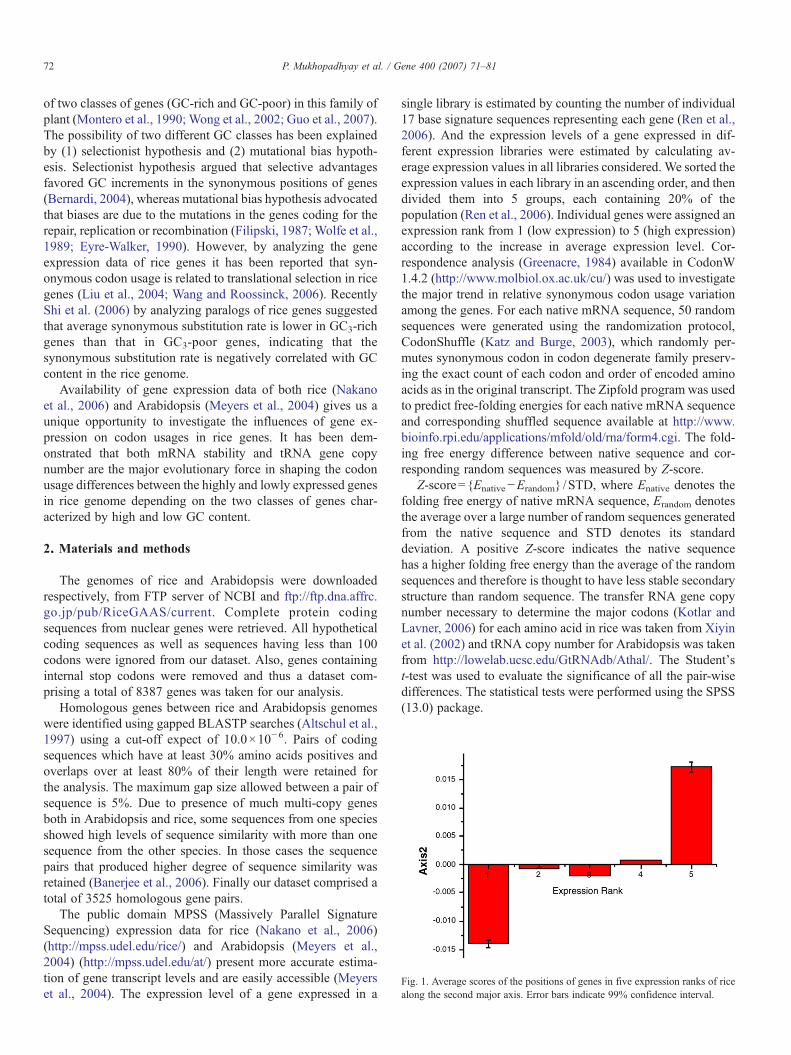
Fig. 1. Average scores of the positions of genes in five expression ranks of ricealong the second major axis. Error bars indicate 99% confidence interval.
72 P. Mukhopadhyay et al. / Gene 400 (2007) 71–81
of two classes of genes (GC-rich and GC-poor) in this family ofplant (Montero et al., 1990; Wong et al., 2002; Guo et al., 2007).The possibility of two different GC classes has been explainedby (1) selectionist hypothesis and (2) mutational bias hypoth-esis. Selectionist hypothesis argued that selective advantagesfavored GC increments in the synonymous positions of genes(Bernardi, 2004), whereas mutational bias hypothesis advocatedthat biases are due to the mutations in the genes coding for therepair, replication or recombination (Filipski, 1987; Wolfe et al.,1989; Eyre-Walker, 1990). However, by analyzing the geneexpression data of rice genes it has been reported that syn-onymous codon usage is related to translational selection in ricegenes (Liu et al., 2004; Wang and Roossinck, 2006). RecentlyShi et al. (2006) by analyzing paralogs of rice genes suggestedthat average synonymous substitution rate is lower in GC3-richgenes than that in GC3-poor genes, indicating that thesynonymous substitution rate is negatively correlated with GCcontent in the rice genome.
Availability of gene expression data of both rice (Nakanoet al., 2006) and Arabidopsis (Meyers et al., 2004) gives us aunique opportunity to investigate the influences of gene ex-pression on codon usages in rice genes. It has been dem-onstrated that both mRNA stability and tRNA gene copynumber are the major evolutionary force in shaping the codonusage differences between the highly and lowly expressed genesin rice genome depending on the two classes of genes char-acterized by high and low GC content.
2. Materials and methods
The genomes of rice and Arabidopsis were downloadedrespectively, from FTP server of NCBI and ftp://ftp.dna.affrc.go.jp/pub/RiceGAAS/current. Complete protein codingsequences from nuclear genes were retrieved. All hypotheticalcoding sequences as well as sequences having less than 100codons were ignored from our dataset. Also, genes containinginternal stop codons were removed and thus a dataset com-prising a total of 8387 genes was taken for our analysis.
Homologous genes between rice and Arabidopsis genomeswere identified using gapped BLASTP searches (Altschul et al.,1997) using a cut-off expect of 10.0×10⁻⁶. Pairs of codingsequences which have at least 30% amino acids positives andoverlaps over at least 80% of their length were retained forthe analysis. The maximum gap size allowed between a pair ofsequence is 5%. Due to presence of much multi-copy genesboth in Arabidopsis and rice, some sequences from one speciesshowed high levels of sequence similarity with more than onesequence from the other species. In those cases the sequencepairs that produced higher degree of sequence similarity wasretained (Banerjee et al., 2006). Finally our dataset comprised atotal of 3525 homologous gene pairs.
The public domain MPSS (Massively Parallel SignatureSequencing) expression data for rice (Nakano et al., 2006)(http://mpss.udel.edu/rice/) and Arabidopsis (Meyers et al.,2004) (http://mpss.udel.edu/at/) present more accurate estima-tion of gene transcript levels and are easily accessible (Meyerset al., 2004). The expression level of a gene expressed in a
single library is estimated by counting the number of individual17 base signature sequences representing each gene (Ren et al.,2006). And the expression levels of a gene expressed in dif-ferent expression libraries were estimated by calculating av-erage expression values in all libraries considered. We sorted theexpression values in each library in an ascending order, and thendivided them into 5 groups, each containing 20% of thepopulation (Ren et al., 2006). Individual genes were assigned anexpression rank from 1 (low expression) to 5 (high expression)according to the increase in average expression level. Cor-respondence analysis (Greenacre, 1984) available in CodonW1.4.2 (http://www.molbiol.ox.ac.uk/cu/) was used to investigatethe major trend in relative synonymous codon usage variationamong the genes. For each native mRNA sequence, 50 randomsequences were generated using the randomization protocol,CodonShuffle (Katz and Burge, 2003), which randomly per-mutes synonymous codon in codon degenerate family preserv-ing the exact count of each codon and order of encoded aminoacids as in the original transcript. The Zipfold program was usedto predict free-folding energies for each native mRNA sequenceand corresponding shuffled sequence available at http://www.bioinfo.rpi.edu/applications/mfold/old/rna/form4.cgi. The fold-ing free energy difference between native sequence and cor-responding random sequences was measured by Z-score.
Z-score={Enative−Erandom} /STD, where Enative denotes thefolding free energy of native mRNA sequence, Erandom denotesthe average over a large number of random sequences generatedfrom the native sequence and STD denotes its standarddeviation. A positive Z-score indicates the native sequencehas a higher folding free energy than the average of the randomsequences and therefore is thought to have less stable secondarystructure than random sequence. The transfer RNA gene copynumber necessary to determine the major codons (Kotlar andLavner, 2006) for each amino acid in rice was taken from Xiyinet al. (2002) and tRNA copy number for Arabidopsis was takenfrom http://lowelab.ucsc.edu/GtRNAdb/Athal/. The Student'st-test was used to evaluate the significance of all the pair-wisedifferences. The statistical tests were performed using the SPSS(13.0) package.
73P. Mukhopadhyay et al. / Gene 400 (2007) 71–81
3. Results
The main factor driving codon usage in rice is the strongmutational bias towards G and C as revealed from the relativesynonymous codon usage (RSCU) values which supports theearlier observation by Liu et al. (2004). This is also evidentwhen we subjected our dataset using correspondence analysis(CoA) on RSCU values of 8387 coding sequences of riceclassified in five different ranks according to the geneexpression levels. The first (A×1) and the second (A×2) axesgenerated by CoA, account for 51.41% and 4.61% of the totalvariations respectively. The positions of the genes along the firstmajor axis are strongly correlated with GC3 (R=0.995;pb10−4). Fig. 1 represents average scores of the positions ofgenes in five expression ranks along the second major axis.From Fig. 1, it is clearly evident that the highly (expressionrank 5) and lowly (expression rank 1) expressed genes areseparated on the two opposite ends of axis2. The analysis ofvariance (ANOVA) showed that the genes are significantlydiscriminated on the second axis (A×2), F=40.466, pb10−6
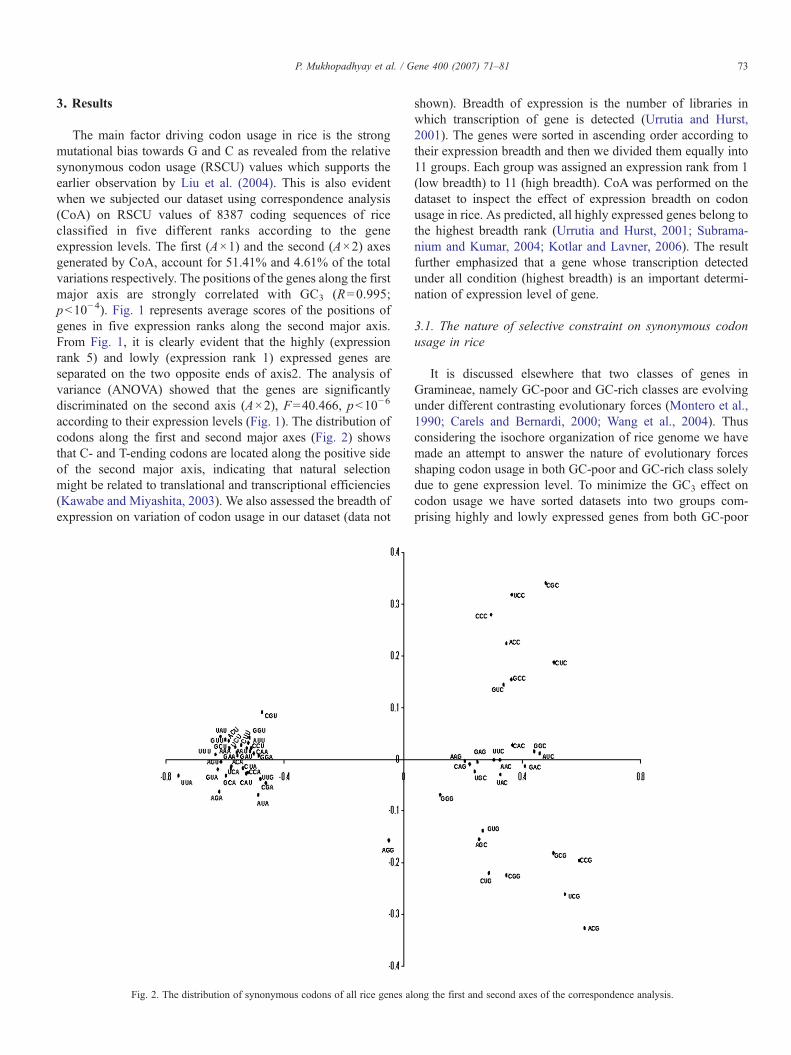
according to their expression levels (Fig. 1). The distribution ofcodons along the first and second major axes (Fig. 2) showsthat C- and T-ending codons are located along the positive sideof the second major axis, indicating that natural selectionmight be related to translational and transcriptional efficiencies(Kawabe and Miyashita, 2003). We also assessed the breadth ofexpression on variation of codon usage in our dataset (data not
Fig. 2. The distribution of synonymous codons of all rice genes al
shown). Breadth of expression is the number of libraries inwhich transcription of gene is detected (Urrutia and Hurst,2001). The genes were sorted in ascending order according totheir expression breadth and then we divided them equally into11 groups. Each group was assigned an expression rank from 1(low breadth) to 11 (high breadth). CoA was performed on thedataset to inspect the effect of expression breadth on codonusage in rice. As predicted, all highly expressed genes belong tothe highest breadth rank (Urrutia and Hurst, 2001; Subrama-nium and Kumar, 2004; Kotlar and Lavner, 2006). The resultfurther emphasized that a gene whose transcription detectedunder all condition (highest breadth) is an important determi-nation of expression level of gene.
3.1. The nature of selective constraint on synonymous codonusage in rice
It is discussed elsewhere that two classes of genes inGramineae, namely GC-poor and GC-rich classes are evolvingunder different contrasting evolutionary forces (Montero et al.,1990; Carels and Bernardi, 2000; Wang et al., 2004). Thusconsidering the isochore organization of rice genome we havemade an attempt to answer the nature of evolutionary forcesshaping codon usage in both GC-poor and GC-rich class solelydue to gene expression level. To minimize the GC3 effect oncodon usage we have sorted datasets into two groups com-prising highly and lowly expressed genes from both GC-poor
ong the first and second axes of the correspondence analysis.
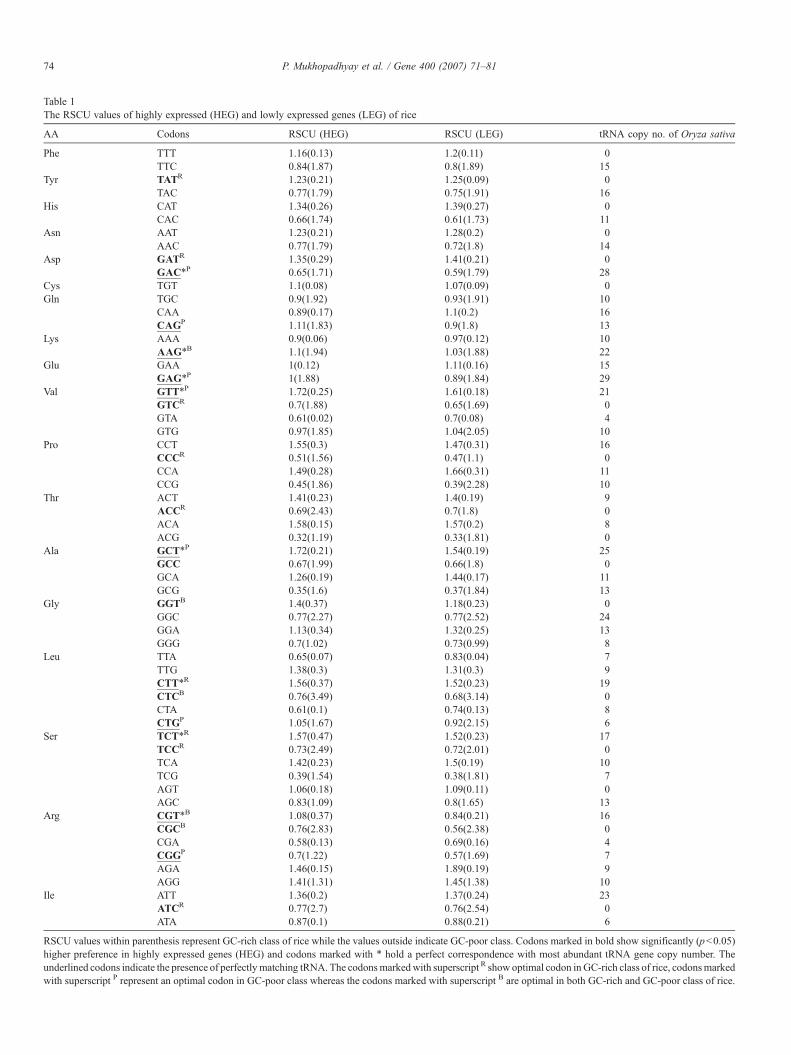
Table 1The RSCU values of highly expressed (HEG) and lowly expressed genes (LEG) of rice
AA Codons RSCU (HEG) RSCU (LEG) tRNA copy no. of Oryza sativa
Phe TTT 1.16(0.13) 1.2(0.11) 0TTC 0.84(1.87) 0.8(1.89) 15
Tyr TATR 1.23(0.21) 1.25(0.09) 0TAC 0.77(1.79) 0.75(1.91) 16
His CAT 1.34(0.26) 1.39(0.27) 0CAC 0.66(1.74) 0.61(1.73) 11
Asn AAT 1.23(0.21) 1.28(0.2) 0AAC 0.77(1.79) 0.72(1.8) 14
Asp GATR 1.35(0.29) 1.41(0.21) 0GAC⁎P 0.65(1.71) 0.59(1.79) 28
Cys TGT 1.1(0.08) 1.07(0.09) 0Gln TGC 0.9(1.92) 0.93(1.91) 10
CAA 0.89(0.17) 1.1(0.2) 16CAGP 1.11(1.83) 0.9(1.8) 13
Lys AAA 0.9(0.06) 0.97(0.12) 10AAG⁎B 1.1(1.94) 1.03(1.88) 22
Glu GAA 1(0.12) 1.11(0.16) 15GAG⁎P 1(1.88) 0.89(1.84) 29
Val GTT⁎P 1.72(0.25) 1.61(0.18) 21GTCR 0.7(1.88) 0.65(1.69) 0GTA 0.61(0.02) 0.7(0.08) 4GTG 0.97(1.85) 1.04(2.05) 10
Pro CCT 1.55(0.3) 1.47(0.31) 16CCCR 0.51(1.56) 0.47(1.1) 0CCA 1.49(0.28) 1.66(0.31) 11CCG 0.45(1.86) 0.39(2.28) 10
Thr ACT 1.41(0.23) 1.4(0.19) 9ACCR 0.69(2.43) 0.7(1.8) 0ACA 1.58(0.15) 1.57(0.2) 8ACG 0.32(1.19) 0.33(1.81) 0
Ala GCT⁎P 1.72(0.21) 1.54(0.19) 25GCC 0.67(1.99) 0.66(1.8) 0GCA 1.26(0.19) 1.44(0.17) 11GCG 0.35(1.6) 0.37(1.84) 13
Gly GGTB 1.4(0.37) 1.18(0.23) 0GGC 0.77(2.27) 0.77(2.52) 24GGA 1.13(0.34) 1.32(0.25) 13GGG 0.7(1.02) 0.73(0.99) 8
Leu TTA 0.65(0.07) 0.83(0.04) 7TTG 1.38(0.3) 1.31(0.3) 9CTT⁎R 1.56(0.37) 1.52(0.23) 19CTCB 0.76(3.49) 0.68(3.14) 0CTA 0.61(0.1) 0.74(0.13) 8CTGP 1.05(1.67) 0.92(2.15) 6
Ser TCT⁎R 1.57(0.47) 1.52(0.23) 17TCCR 0.73(2.49) 0.72(2.01) 0TCA 1.42(0.23) 1.5(0.19) 10TCG 0.39(1.54) 0.38(1.81) 7AGT 1.06(0.18) 1.09(0.11) 0AGC 0.83(1.09) 0.8(1.65) 13
Arg CGT⁎B 1.08(0.37) 0.84(0.21) 16CGCB 0.76(2.83) 0.56(2.38) 0CGA 0.58(0.13) 0.69(0.16) 4CGGP 0.7(1.22) 0.57(1.69) 7AGA 1.46(0.15) 1.89(0.19) 9AGG 1.41(1.31) 1.45(1.38) 10
Ile ATT 1.36(0.2) 1.37(0.24) 23ATCR 0.77(2.7) 0.76(2.54) 0ATA 0.87(0.1) 0.88(0.21) 6
RSCU values within parenthesis represent GC-rich class of rice while the values outside indicate GC-poor class. Codons marked in bold show significantly (pb0.05)higher preference in highly expressed genes (HEG) and codons marked with ⁎ hold a perfect correspondence with most abundant tRNA gene copy number. Theunderlined codons indicate the presence of perfectlymatching tRNA. The codonsmarkedwith superscript R show optimal codon in GC-rich class of rice, codonsmarkedwith superscript P represent an optimal codon in GC-poor class whereas the codons marked with superscript B are optimal in both GC-rich and GC-poor class of rice.
74 P. Mukhopadhyay et al. / Gene 400 (2007) 71–81
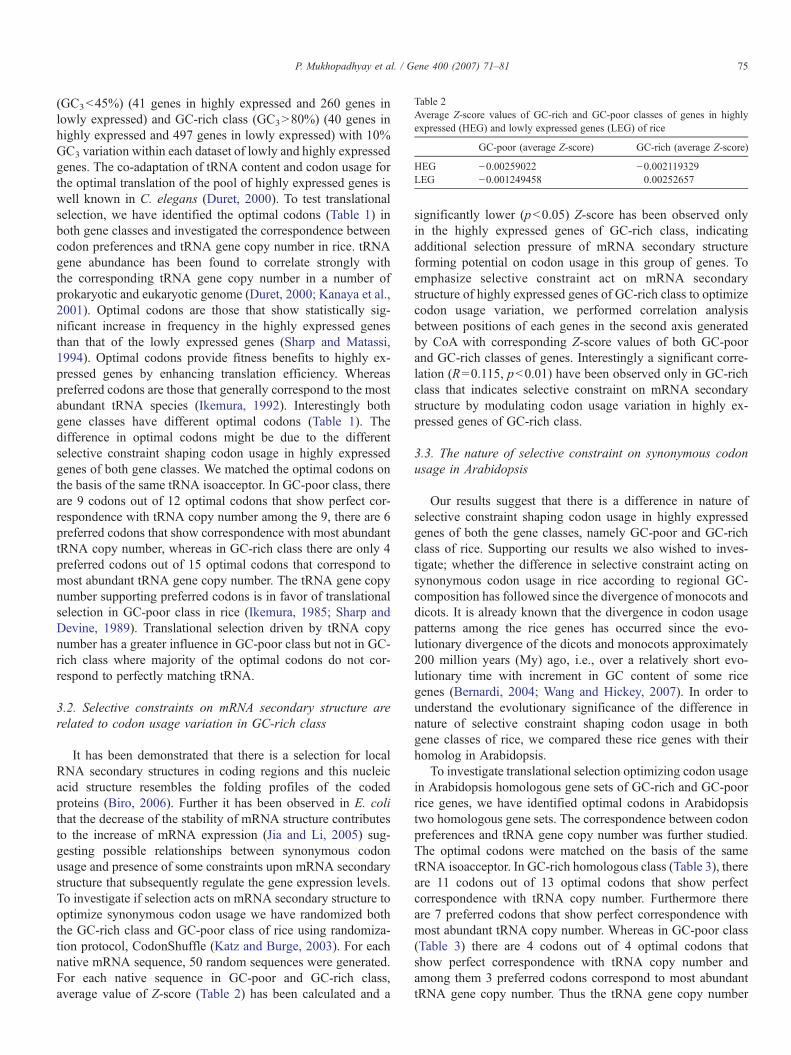
Table 2Average Z-score values of GC-rich and GC-poor classes of genes in highlyexpressed (HEG) and lowly expressed genes (LEG) of rice
GC-poor (average Z-score) GC-rich (average Z-score)
HEG −0.00259022 −0.002119329LEG −0.001249458 0.00252657
75P. Mukhopadhyay et al. / Gene 400 (2007) 71–81
(GC3b45%) (41 genes in highly expressed and 260 genes inlowly expressed) and GC-rich class (GC3N80%) (40 genes inhighly expressed and 497 genes in lowly expressed) with 10%GC3 variation within each dataset of lowly and highly expressedgenes. The co-adaptation of tRNA content and codon usage forthe optimal translation of the pool of highly expressed genes iswell known in C. elegans (Duret, 2000). To test translationalselection, we have identified the optimal codons (Table 1) inboth gene classes and investigated the correspondence betweencodon preferences and tRNA gene copy number in rice. tRNAgene abundance has been found to correlate strongly withthe corresponding tRNA gene copy number in a number ofprokaryotic and eukaryotic genome (Duret, 2000; Kanaya et al.,2001). Optimal codons are those that show statistically sig-nificant increase in frequency in the highly expressed genesthan that of the lowly expressed genes (Sharp and Matassi,1994). Optimal codons provide fitness benefits to highly ex-pressed genes by enhancing translation efficiency. Whereaspreferred codons are those that generally correspond to the mostabundant tRNA species (Ikemura, 1992). Interestingly bothgene classes have different optimal codons (Table 1). Thedifference in optimal codons might be due to the differentselective constraint shaping codon usage in highly expressedgenes of both gene classes. We matched the optimal codons onthe basis of the same tRNA isoacceptor. In GC-poor class, thereare 9 codons out of 12 optimal codons that show perfect cor-respondence with tRNA copy number among the 9, there are 6preferred codons that show correspondence with most abundanttRNA copy number, whereas in GC-rich class there are only 4preferred codons out of 15 optimal codons that correspond tomost abundant tRNA gene copy number. The tRNA gene copynumber supporting preferred codons is in favor of translationalselection in GC-poor class in rice (Ikemura, 1985; Sharp andDevine, 1989). Translational selection driven by tRNA copynumber has a greater influence in GC-poor class but not in GC-rich class where majority of the optimal codons do not cor-respond to perfectly matching tRNA.
3.2. Selective constraints on mRNA secondary structure arerelated to codon usage variation in GC-rich class
It has been demonstrated that there is a selection for localRNA secondary structures in coding regions and this nucleicacid structure resembles the folding profiles of the codedproteins (Biro, 2006). Further it has been observed in E. colithat the decrease of the stability of mRNA structure contributesto the increase of mRNA expression (Jia and Li, 2005) sug-gesting possible relationships between synonymous codonusage and presence of some constraints upon mRNA secondarystructure that subsequently regulate the gene expression levels.To investigate if selection acts on mRNA secondary structure tooptimize synonymous codon usage we have randomized boththe GC-rich class and GC-poor class of rice using randomiza-tion protocol, CodonShuffle (Katz and Burge, 2003). For eachnative mRNA sequence, 50 random sequences were generated.For each native sequence in GC-poor and GC-rich class,average value of Z-score (Table 2) has been calculated and a
significantly lower (pb0.05) Z-score has been observed onlyin the highly expressed genes of GC-rich class, indicatingadditional selection pressure of mRNA secondary structureforming potential on codon usage in this group of genes. Toemphasize selective constraint act on mRNA secondarystructure of highly expressed genes of GC-rich class to optimizecodon usage variation, we performed correlation analysisbetween positions of each genes in the second axis generatedby CoA with corresponding Z-score values of both GC-poorand GC-rich classes of genes. Interestingly a significant corre-lation (R=0.115, pb0.01) have been observed only in GC-richclass that indicates selective constraint on mRNA secondarystructure by modulating codon usage variation in highly ex-pressed genes of GC-rich class.
3.3. The nature of selective constraint on synonymous codonusage in Arabidopsis
Our results suggest that there is a difference in nature ofselective constraint shaping codon usage in highly expressedgenes of both the gene classes, namely GC-poor and GC-richclass of rice. Supporting our results we also wished to inves-tigate; whether the difference in selective constraint acting onsynonymous codon usage in rice according to regional GC-composition has followed since the divergence of monocots anddicots. It is already known that the divergence in codon usagepatterns among the rice genes has occurred since the evo-lutionary divergence of the dicots and monocots approximately200 million years (My) ago, i.e., over a relatively short evo-lutionary time with increment in GC content of some ricegenes (Bernardi, 2004; Wang and Hickey, 2007). In order tounderstand the evolutionary significance of the difference innature of selective constraint shaping codon usage in bothgene classes of rice, we compared these rice genes with theirhomolog in Arabidopsis.
To investigate translational selection optimizing codon usagein Arabidopsis homologous gene sets of GC-rich and GC-poorrice genes, we have identified optimal codons in Arabidopsistwo homologous gene sets. The correspondence between codonpreferences and tRNA gene copy number was further studied.The optimal codons were matched on the basis of the sametRNA isoacceptor. In GC-rich homologous class (Table 3), thereare 11 codons out of 13 optimal codons that show perfectcorrespondence with tRNA copy number. Furthermore thereare 7 preferred codons that show perfect correspondence withmost abundant tRNA copy number. Whereas in GC-poor class(Table 3) there are 4 codons out of 4 optimal codons thatshow perfect correspondence with tRNA copy number andamong them 3 preferred codons correspond to most abundanttRNA gene copy number. Thus the tRNA gene copy number
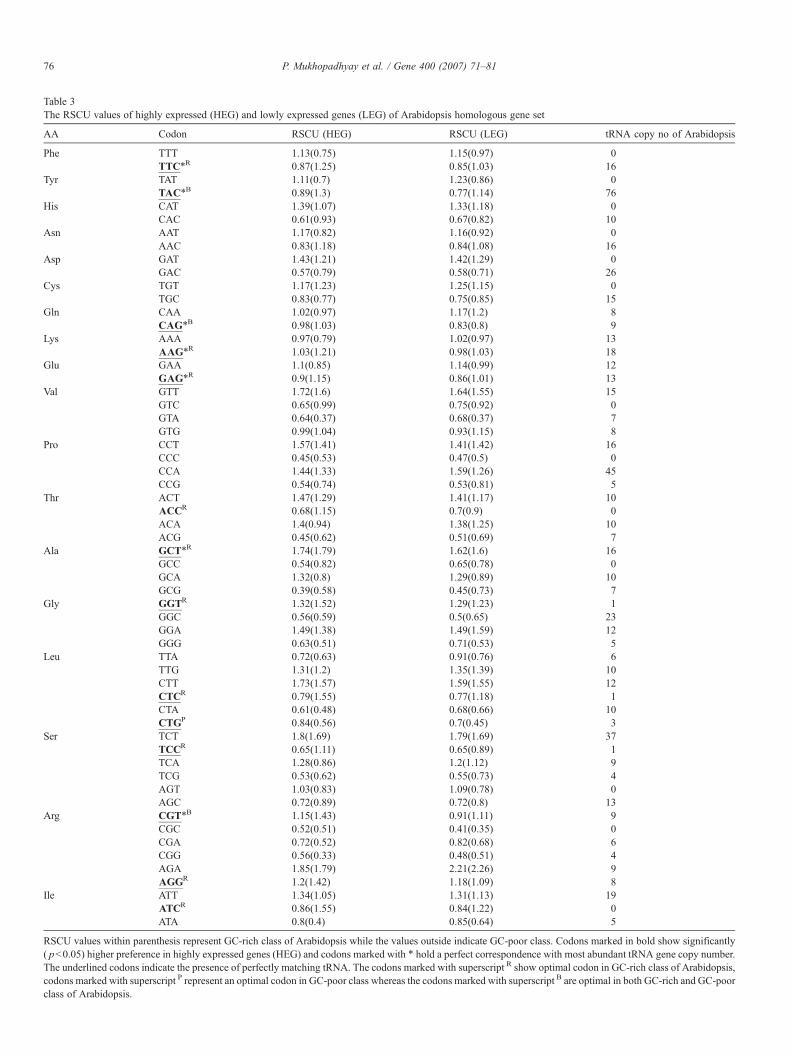
Table 3The RSCU values of highly expressed (HEG) and lowly expressed genes (LEG) of Arabidopsis homologous gene set
AA Codon RSCU (HEG) RSCU (LEG) tRNA copy no of Arabidopsis
Phe TTT 1.13(0.75) 1.15(0.97) 0TTC⁎R 0.87(1.25) 0.85(1.03) 16
Tyr TAT 1.11(0.7) 1.23(0.86) 0TAC⁎B 0.89(1.3) 0.77(1.14) 76
His CAT 1.39(1.07) 1.33(1.18) 0CAC 0.61(0.93) 0.67(0.82) 10
Asn AAT 1.17(0.82) 1.16(0.92) 0AAC 0.83(1.18) 0.84(1.08) 16
Asp GAT 1.43(1.21) 1.42(1.29) 0GAC 0.57(0.79) 0.58(0.71) 26
Cys TGT 1.17(1.23) 1.25(1.15) 0TGC 0.83(0.77) 0.75(0.85) 15
Gln CAA 1.02(0.97) 1.17(1.2) 8CAG⁎B 0.98(1.03) 0.83(0.8) 9
Lys AAA 0.97(0.79) 1.02(0.97) 13AAG⁎R 1.03(1.21) 0.98(1.03) 18
Glu GAA 1.1(0.85) 1.14(0.99) 12GAG⁎R 0.9(1.15) 0.86(1.01) 13
Val GTT 1.72(1.6) 1.64(1.55) 15GTC 0.65(0.99) 0.75(0.92) 0GTA 0.64(0.37) 0.68(0.37) 7GTG 0.99(1.04) 0.93(1.15) 8
Pro CCT 1.57(1.41) 1.41(1.42) 16CCC 0.45(0.53) 0.47(0.5) 0CCA 1.44(1.33) 1.59(1.26) 45CCG 0.54(0.74) 0.53(0.81) 5
Thr ACT 1.47(1.29) 1.41(1.17) 10ACCR 0.68(1.15) 0.7(0.9) 0ACA 1.4(0.94) 1.38(1.25) 10ACG 0.45(0.62) 0.51(0.69) 7
Ala GCT⁎R 1.74(1.79) 1.62(1.6) 16GCC 0.54(0.82) 0.65(0.78) 0GCA 1.32(0.8) 1.29(0.89) 10GCG 0.39(0.58) 0.45(0.73) 7
Gly GGTR 1.32(1.52) 1.29(1.23) 1GGC 0.56(0.59) 0.5(0.65) 23GGA 1.49(1.38) 1.49(1.59) 12GGG 0.63(0.51) 0.71(0.53) 5
Leu TTA 0.72(0.63) 0.91(0.76) 6TTG 1.31(1.2) 1.35(1.39) 10CTT 1.73(1.57) 1.59(1.55) 12CTCR 0.79(1.55) 0.77(1.18) 1CTA 0.61(0.48) 0.68(0.66) 10CTGP 0.84(0.56) 0.7(0.45) 3
Ser TCT 1.8(1.69) 1.79(1.69) 37TCCR 0.65(1.11) 0.65(0.89) 1TCA 1.28(0.86) 1.2(1.12) 9TCG 0.53(0.62) 0.55(0.73) 4AGT 1.03(0.83) 1.09(0.78) 0AGC 0.72(0.89) 0.72(0.8) 13
Arg CGT⁎B 1.15(1.43) 0.91(1.11) 9CGC 0.52(0.51) 0.41(0.35) 0CGA 0.72(0.52) 0.82(0.68) 6CGG 0.56(0.33) 0.48(0.51) 4AGA 1.85(1.79) 2.21(2.26) 9AGGR 1.2(1.42) 1.18(1.09) 8
Ile ATT 1.34(1.05) 1.31(1.13) 19ATCR 0.86(1.55) 0.84(1.22) 0ATA 0.8(0.4) 0.85(0.64) 5
RSCU values within parenthesis represent GC-rich class of Arabidopsis while the values outside indicate GC-poor class. Codons marked in bold show significantly( pb0.05) higher preference in highly expressed genes (HEG) and codons marked with ⁎ hold a perfect correspondence with most abundant tRNA gene copy number.The underlined codons indicate the presence of perfectly matching tRNA. The codons marked with superscript R show optimal codon in GC-rich class of Arabidopsis,codons marked with superscript P represent an optimal codon in GC-poor class whereas the codons marked with superscript B are optimal in both GC-rich and GC-poorclass of Arabidopsis.
76 P. Mukhopadhyay et al. / Gene 400 (2007) 71–81
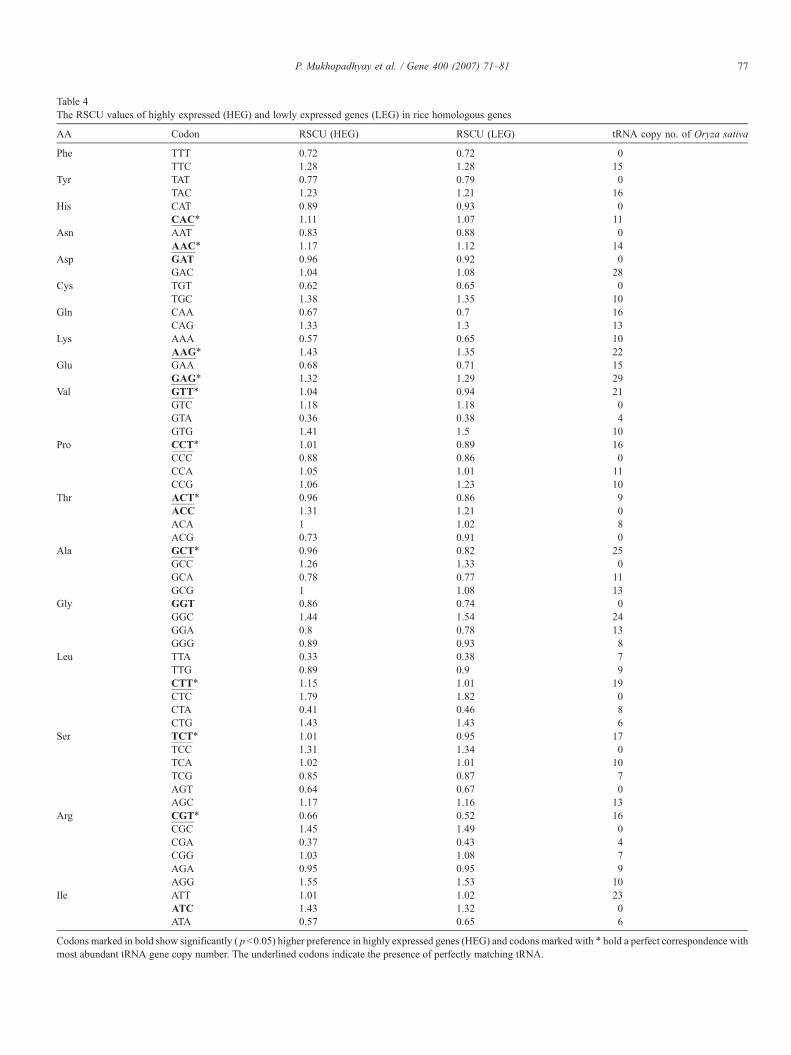
Table 4The RSCU values of highly expressed (HEG) and lowly expressed genes (LEG) in rice homologous genes
AA Codon RSCU (HEG) RSCU (LEG) tRNA copy no. of Oryza sativa
Phe TTT 0.72 0.72 0TTC 1.28 1.28 15
Tyr TAT 0.77 0.79 0TAC 1.23 1.21 16
His CAT 0.89 0.93 0CAC⁎ 1.11 1.07 11
Asn AAT 0.83 0.88 0AAC⁎ 1.17 1.12 14
Asp GAT 0.96 0.92 0GAC 1.04 1.08 28
Cys TGT 0.62 0.65 0TGC 1.38 1.35 10
Gln CAA 0.67 0.7 16CAG 1.33 1.3 13
Lys AAA 0.57 0.65 10AAG⁎ 1.43 1.35 22
Glu GAA 0.68 0.71 15GAG⁎ 1.32 1.29 29
Val GTT⁎ 1.04 0.94 21GTC 1.18 1.18 0GTA 0.36 0.38 4GTG 1.41 1.5 10
Pro CCT⁎ 1.01 0.89 16CCC 0.88 0.86 0CCA 1.05 1.01 11CCG 1.06 1.23 10
Thr ACT⁎ 0.96 0.86 9ACC 1.31 1.21 0ACA 1 1.02 8ACG 0.73 0.91 0
Ala GCT⁎ 0.96 0.82 25GCC 1.26 1.33 0GCA 0.78 0.77 11GCG 1 1.08 13
Gly GGT 0.86 0.74 0GGC 1.44 1.54 24GGA 0.8 0.78 13GGG 0.89 0.93 8
Leu TTA 0.33 0.38 7TTG 0.89 0.9 9CTT⁎ 1.15 1.01 19CTC 1.79 1.82 0CTA 0.41 0.46 8CTG 1.43 1.43 6
Ser TCT⁎ 1.01 0.95 17TCC 1.31 1.34 0TCA 1.02 1.01 10TCG 0.85 0.87 7AGT 0.64 0.67 0AGC 1.17 1.16 13
Arg CGT⁎ 0.66 0.52 16CGC 1.45 1.49 0CGA 0.37 0.43 4CGG 1.03 1.08 7AGA 0.95 0.95 9AGG 1.55 1.53 10
Ile ATT 1.01 1.02 23ATC 1.43 1.32 0ATA 0.57 0.65 6
Codons marked in bold show significantly ( pb0.05) higher preference in highly expressed genes (HEG) and codons marked with ⁎ hold a perfect correspondence withmost abundant tRNA gene copy number. The underlined codons indicate the presence of perfectly matching tRNA.
77P. Mukhopadhyay et al. / Gene 400 (2007) 71–81
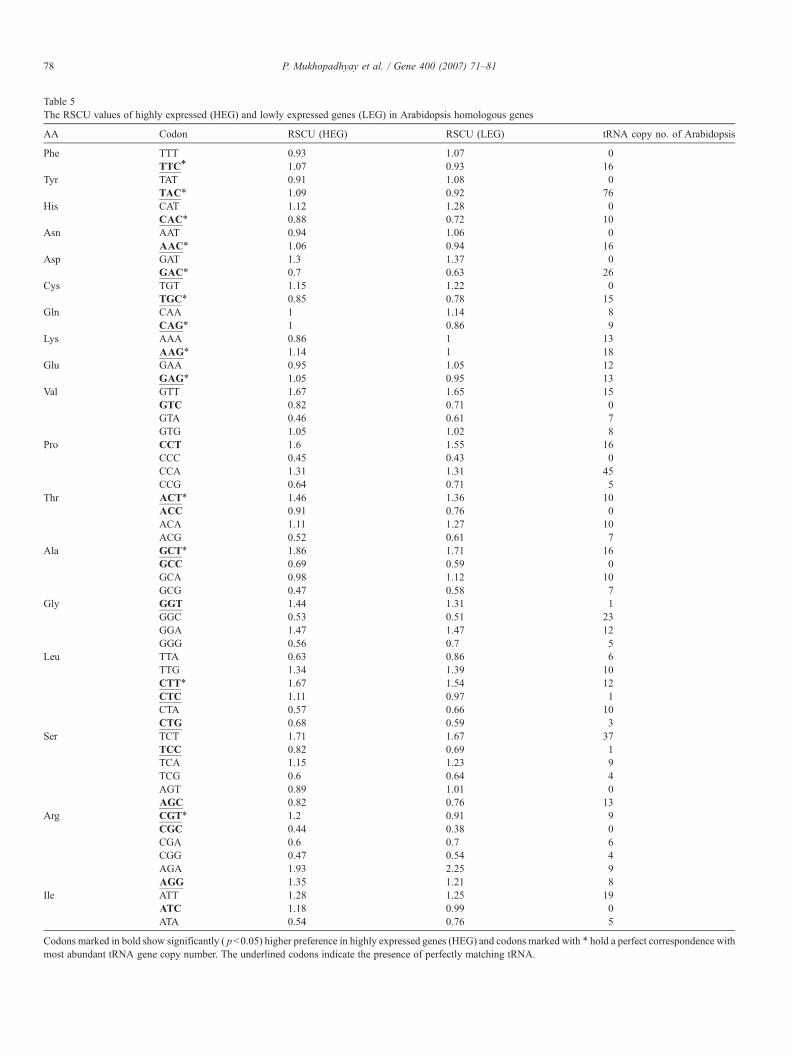
Table 5The RSCU values of highly expressed (HEG) and lowly expressed genes (LEG) in Arabidopsis homologous genes
AA Codon RSCU (HEG) RSCU (LEG) tRNA copy no. of Arabidopsis
Phe TTT 0.93 1.07 0TTC⁎ 1.07 0.93 16
Tyr TAT 0.91 1.08 0TAC⁎ 1.09 0.92 76
His CAT 1.12 1.28 0CAC⁎ 0.88 0.72 10
Asn AAT 0.94 1.06 0AAC⁎ 1.06 0.94 16
Asp GAT 1.3 1.37 0GAC⁎ 0.7 0.63 26
Cys TGT 1.15 1.22 0TGC⁎ 0.85 0.78 15
Gln CAA 1 1.14 8CAG⁎ 1 0.86 9
Lys AAA 0.86 1 13AAG⁎ 1.14 1 18
Glu GAA 0.95 1.05 12GAG⁎ 1.05 0.95 13
Val GTT 1.67 1.65 15GTC 0.82 0.71 0GTA 0.46 0.61 7GTG 1.05 1.02 8
Pro CCT 1.6 1.55 16CCC 0.45 0.43 0CCA 1.31 1.31 45CCG 0.64 0.71 5
Thr ACT⁎ 1.46 1.36 10ACC 0.91 0.76 0ACA 1.11 1.27 10ACG 0.52 0.61 7
Ala GCT⁎ 1.86 1.71 16GCC 0.69 0.59 0GCA 0.98 1.12 10GCG 0.47 0.58 7
Gly GGT 1.44 1.31 1GGC 0.53 0.51 23GGA 1.47 1.47 12GGG 0.56 0.7 5
Leu TTA 0.63 0.86 6TTG 1.34 1.39 10CTT⁎ 1.67 1.54 12CTC 1.11 0.97 1CTA 0.57 0.66 10CTG 0.68 0.59 3
Ser TCT 1.71 1.67 37TCC 0.82 0.69 1TCA 1.15 1.23 9TCG 0.6 0.64 4AGT 0.89 1.01 0AGC 0.82 0.76 13
Arg CGT⁎ 1.2 0.91 9CGC 0.44 0.38 0CGA 0.6 0.7 6CGG 0.47 0.54 4AGA 1.93 2.25 9AGG 1.35 1.21 8
Ile ATT 1.28 1.25 19ATC 1.18 0.99 0ATA 0.54 0.76 5
Codons marked in bold show significantly ( pb0.05) higher preference in highly expressed genes (HEG) and codons marked with ⁎ hold a perfect correspondence withmost abundant tRNA gene copy number. The underlined codons indicate the presence of perfectly matching tRNA.
78 P. Mukhopadhyay et al. / Gene 400 (2007) 71–81
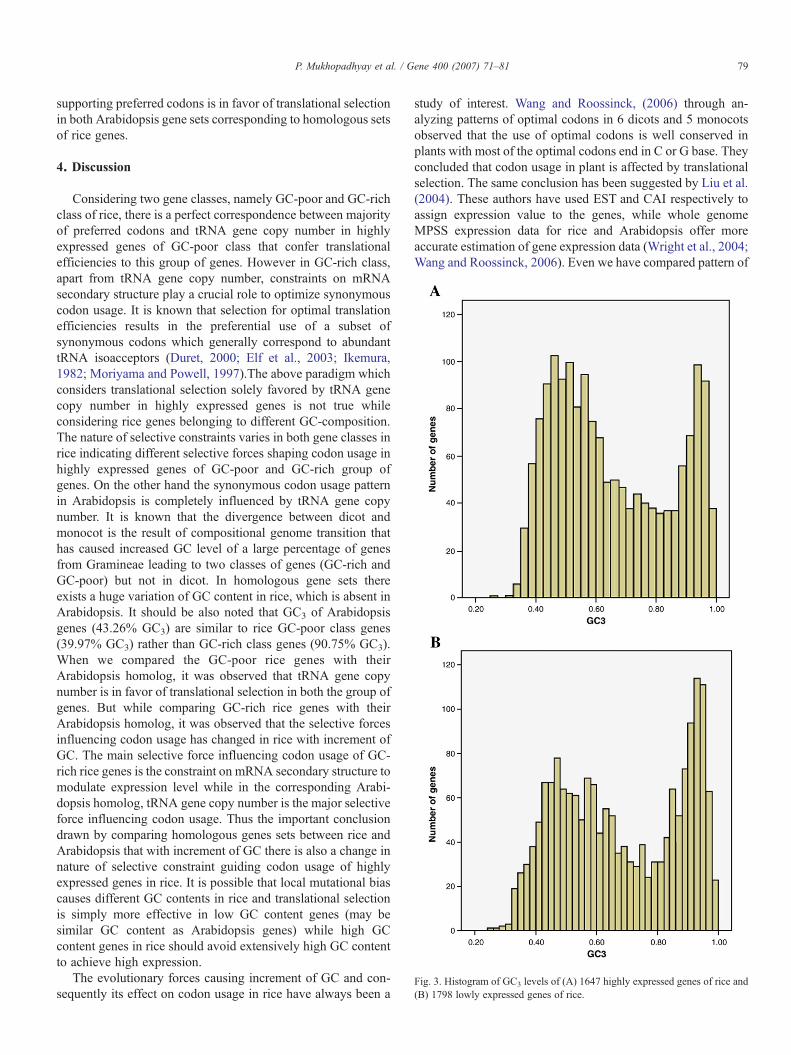
Fig. 3. Histogram of GC3 levels of (A) 1647 highly expressed genes of rice and(B) 1798 lowly expressed genes of rice.
79P. Mukhopadhyay et al. / Gene 400 (2007) 71–81
supporting preferred codons is in favor of translational selectionin both Arabidopsis gene sets corresponding to homologous setsof rice genes.
4. Discussion
Considering two gene classes, namely GC-poor and GC-richclass of rice, there is a perfect correspondence between majorityof preferred codons and tRNA gene copy number in highlyexpressed genes of GC-poor class that confer translationalefficiencies to this group of genes. However in GC-rich class,apart from tRNA gene copy number, constraints on mRNAsecondary structure play a crucial role to optimize synonymouscodon usage. It is known that selection for optimal translationefficiencies results in the preferential use of a subset ofsynonymous codons which generally correspond to abundanttRNA isoacceptors (Duret, 2000; Elf et al., 2003; Ikemura,1982; Moriyama and Powell, 1997).The above paradigm whichconsiders translational selection solely favored by tRNA genecopy number in highly expressed genes is not true whileconsidering rice genes belonging to different GC-composition.The nature of selective constraints varies in both gene classes inrice indicating different selective forces shaping codon usage inhighly expressed genes of GC-poor and GC-rich group ofgenes. On the other hand the synonymous codon usage patternin Arabidopsis is completely influenced by tRNA gene copynumber. It is known that the divergence between dicot andmonocot is the result of compositional genome transition thathas caused increased GC level of a large percentage of genesfrom Gramineae leading to two classes of genes (GC-rich andGC-poor) but not in dicot. In homologous gene sets thereexists a huge variation of GC content in rice, which is absent inArabidopsis. It should be also noted that GC3 of Arabidopsisgenes (43.26% GC3) are similar to rice GC-poor class genes(39.97% GC3) rather than GC-rich class genes (90.75% GC3).When we compared the GC-poor rice genes with theirArabidopsis homolog, it was observed that tRNA gene copynumber is in favor of translational selection in both the group ofgenes. But while comparing GC-rich rice genes with theirArabidopsis homolog, it was observed that the selective forcesinfluencing codon usage has changed in rice with increment ofGC. The main selective force influencing codon usage of GC-rich rice genes is the constraint on mRNA secondary structure tomodulate expression level while in the corresponding Arabi-dopsis homolog, tRNA gene copy number is the major selectiveforce influencing codon usage. Thus the important conclusiondrawn by comparing homologous genes sets between rice andArabidopsis that with increment of GC there is also a change innature of selective constraint guiding codon usage of highlyexpressed genes in rice. It is possible that local mutational biascauses different GC contents in rice and translational selectionis simply more effective in low GC content genes (may besimilar GC content as Arabidopsis genes) while high GCcontent genes in rice should avoid extensively high GC contentto achieve high expression.
The evolutionary forces causing increment of GC and con-sequently its effect on codon usage in rice have always been a
study of interest. Wang and Roossinck, (2006) through an-alyzing patterns of optimal codons in 6 dicots and 5 monocotsobserved that the use of optimal codons is well conserved inplants with most of the optimal codons end in C or G base. Theyconcluded that codon usage in plant is affected by translationalselection. The same conclusion has been suggested by Liu et al.(2004). These authors have used EST and CAI respectively toassign expression value to the genes, while whole genomeMPSS expression data for rice and Arabidopsis offer moreaccurate estimation of gene expression data (Wright et al., 2004;Wang and Roossinck, 2006). Even we have compared pattern of
80 P. Mukhopadhyay et al. / Gene 400 (2007) 71–81
optimal codons in homologous set of genes (3525 homologousgenes) between Rice and Arabidopsis, and observed that thereare 9 T-ending codons followed by 4 C-ending codons out of 15optimal codons in rice. There are 11 preferred codons out of 15optimal codons in rice (Table 4) that match with most abundanttRNA copy number. Whereas in Arabidopsis (Table 5) thereare 14 C-ending codons followed by 6 T-ending codons out of25 optimal codons, and 13 preferred codons that correspondto most abundant tRNA copy number. Thus the observedcorrespondence between majority of optimal codon and tRNAcopy number in rice and Arabidopsis is consistent on models oftranslational selection. We found that there is a preference forboth C-ending and T-ending optimal codons in homologousgenes of rice and Arabidopsis which is consistent with thehypothesis that the CT richness i.e. the increased use ofpyrimidines in plants is related with natural selection whichmight be related to translational and transcriptional efficiencies(Kawabe and Miyashita, 2003). However, it has recently beenargued that large variation in synonymous codon usage in rice isnot related to selection acting on the translational efficiency(Wang and Hickey, 2007). But reaching such conclusionrequires exploration of whole genome expression data. In thepresent study we have utilized the whole genome expressiondata to infer the presence of translational selection in the ricegenome. Similar to Sharp and Li (1987), we also observedsignificant reduction in synonymous substitution rate for highlyexpressed genes compared to lowly expressed genes (pb0.001)(data not shown). This result indicates the influence of trans-lational selection on synonymous codon usage according toexpression level of genes. Fig. 3 clearly depicts that both highlyand lowly expressed genes of rice have got wide variation in GCcontent. Possibly, the strong mutational bias present in the ricegenome is swamped by the comparatively weaker effect oftranslational selection, which prevented Wang and Hickey(2007) to observe the influence of translational selection onsynonymous codon usage in rice genome.
Acknowledgement
The authors are thankful to the Department of Biotechnol-ogy, Government of India for the financial help.
References
Akashi, H., 1995. Inferring weak selection from patterns of polymorphism anddivergence at “silent” sites in Drosophila DNA. Genetics 139, 1067–1076.
Akashi, H., 2001. Gene expression and molecular evolution. Curr. Opin. Genet.Dev. 11, 660–666.
Akashi, H., Eyre-Walker, A., 1998. Translational selection and molecular evo-lution. Curr. Opin. Genet. Dev. 8, 688–693.
Altschul, S.F., Madden, T.L., Schaffer, A.A., Zhang, J., Zhang, Z., Miller, W.,Lipman, D.J., 1997. Gapped BLAST and PSI-BLAST: a new generation ofprotein database search programs. Nucleic Acids Res. 25, 3389–3402.
Banerjee, T., Gupta, S.K., Ghosh, T.C., 2006. Compositional transitions bet-ween Oryza sativa and Arabidopsis thaliana genes linked to the functionalchange of encoded proteins. Plant Sci. 170, 267–273.
Basak, S., Ghosh, T.C., 2005. On the origin of genomic adaptation at hightemperature for prokaryotic organisms. Biochem. Biophys. Res. Commun.330, 629–632.
Bernardi, G., 2004. Structural and Evolutionary Genomics, Natural Selection inGenome Evolution. Elsevier, The Netherlands.
Bernardi, G., Bernardi, G., 1985. Codon usage and genome composition. J. Mol.Biol. 22, 363–365.
Biro, J.C., 2006. Indications that “codon boundaries” are physico-chemicallydefined and that protein-folding information is contained in the redundantexon bases. Theor. Biol. Med. Model. 3, 28.
Bulmer, M., 1991. The selection-mutation-drift theory of synonymous codonusage. Genetics 129, 897–907.
Carels, N., Bernardi, G., 2000. Two classes of genes in plants. Genetics 154,1819–1825.
Duret, L., 2000. tRNA gene number and codon usage in the C. elegans genomeare co-adapted for optimal translation of highly expressed genes. TrendsGenet. 16, 287–289.
Duret, L., Mouchiroud, D., 1999. Expression pattern and, surprisingly, genelength shape codon usage in Caenorhabditis, Drosophila, and Arabidopsis.Proc. Natl. Acad. Sci. U. S. A. 96, 4482–4487.
Elf, J., Nilsson, D., Tenson, T., Ehrenberg, M., 2003. Selective charging of tRNAisoacceptors explains patterns of codon usage. Science 300, 1718–1722.
Eyre-Walker, A., 1990. Recombination and mammalian genome evolution.Proc. R. Soc. Lond., B. 252, 237–243.
Filipski, J., 1987. Correlation between molecular clock ticking, codon usage,fidelity of DNA repair, chromosome banding and chromatin compactnessin germline cells. FEBS Lett. 217, 184–186.
Gouy, M., Gautier, C., 1982. Codon usage in bacteria: correlation with geneexpressivity. Nucleic Acids Res. 10, 7055–7074.
Grantham, R., Gautier, C., Gouy, M., 1980a. Codon frequencies in 119 indi-vidual genes confirm consistent choices of degenerate bases according togenome type. Nucleic Acids Res. 8, 1893–1912.
Grantham, R., Gautier, C., Guoy, M., Mercier, R., 1980b. Codon catalog usageand the genome hypothesis. Nucleic Acids Res. 8, 49r–62r.
Grantham, R., Gautier, C., Guoy, M., Jacobzone, M., Mercier, R., 1981. Codoncatalog usage is a genome strategy modulated for gene expressivity. NucleicAcids Res. 9, 43r–74r.
Greenacre, M.J., 1984. Theory and Applications of Correspondence Analysis.Academic Press, London, UK.
Guo, X., Bao, J., Fan, L., 2007. Evidence of selectively driven codon usage inrice: Implications for GC content evolution of Gramineae genes. FEBS Lett.581, 1015–1021.
Gupta, S.K., Ghosh, T.C., 2001. Gene expressivity is the main factor in dictatingthe codon usage variation among the genes in Pseudomonas aeruginosa.Gene 273, 63–70.
Ikemura, T., 1981. Correlation between the abundance of Escherichia colitransfer RNAs and the occurrence of the respective codons in its proteingenes. J. Mol. Biol. 146, 1–21.
Ikemura, T., 1982. Correlation between the abundance of yeast transfer RNAsand the occurrence of the respective codons in protein genes. Differences insynonymous codon choice patterns of yeast and Escherichia coli withreference to the abundance of isoaccepting transfer RNAs. J. Mol. Biol. 158,573–597.
Ikemura, T., 1985. Codon usage and tRNA content in unicellular andmulticellular organisms. Mol. Biol. Evol. 2, 13–34.
Ikemura, T., 1992. In: Hatfield, D.L., Lee, B.J., Pirtle, R.M. (Eds.), TransferRNA in Protein Synthesis. CRC, Boca Raton, FL, pp. 87–111.
Jia, M., Li, Y., 2005. The relationship among gene expression, folding freeenergy and codon usage bias in Escherichia coli. FEBS Lett. 579,5333–5337.
Kahali, B., Basak, S., Ghosh, T.C., 2007. Reinvestigating the codon and aminoacid usage of S. cerevisiae genome: a new insight from protein secondarystructure analysis. Biochem. Biophys. Res. Commun. 354, 693–699.
Kanaya, Y., Yamada, Y., Kinouchi, M., Kudo, Y., Ikemura, T., 2001. Codonusage and tRNA genes in eukaryotes: correlation of codon usage diversitywith translation efficiency and with CG-dinucleotide usage as assessed bymultivariate analysis. J. Mol. Evol. 53, 290–298.
Katz, L., Burge, C.B., 2003. Widespread selection for local RNA secondarystructure in coding regions of bacterial genes. Genome Res. 13, 2042–2051.
Kawabe, A., Miyashita, N.T., 2003. Patterns of codon usage bias in three dicotand four monocot plant species. Genes Genet. Syst. 78, 343–352.
81P. Mukhopadhyay et al. / Gene 400 (2007) 71–81
Kotlar, D., Lavner, Y., 2006. The action of selection on codon bias in the humangenome is related to frequency, complexity, and chronology of amino acids.BMC Genomics 7, 67.
Liu, Q., Feng, Y., Zhao, X., Dong, H., Xue, Q., 2004. Synonymous codon usagebias in Oryza sativa. Plant Sci. 167, 101–105.
Meyers, B.C., Tej, S.S., Vu, T.H., Haudenschild, C.D., Agrawal, V., Edberg,S.B., Ghazal, H., Decola, S., 2004. The use of MPSS for whole-genometranscriptional analysis in Arabidopsis. Genome Res. 14, 1641–1653.
Montero, L.M., Salinas, J., Matassi, G., Bernardi, G., 1990. Gene distributionand isochore organization in the nuclear genome of plant. Nucleic AcidsRes. 18, 1859–1867.
Moriyama, E.N., Powell, J.R., 1997. Synonymous substitution rates inDrosophila: mitochondrial versus nuclear genes. J. Mol. Evol. 45, 378–391.
Nakano, M., Nobuta, K., Vemaraju, K., Tej, S.S., Skogen, J.W., Meyers, B.C.,2006. Plant MPSS databases: signature-based transcriptional resources foranalyses of mRNA and small RNA. Nucleic Acids Res. 34, D731–D735.
Powell, J.R., Moriyama, E.N., 1997. Evolution of codon usage bias inDrosophila. Proc. Natl. Acad. Sci. U. S. A. 94, 7784–7790.
Ren, X.-Y., Vorst, O., Fiers, M.W.E.J., Stiekema,W.J., Nap, J.-P., 2006. In plants,highly expressed genes are the least compact. Trends Genet. 22, 528–532.
Sharp, P.M., Li, W.H., 1987. The rate of synonymous substitution inenterobacterial genes is inversely related to codon usage bias. Mol. Biol.Evol. 4, 222–230.
Sharp, P.M., Devine, K.M., 1989. Codon usage and gene expression level inDictyostelium discoideum: highly expressed genes do ‘prefer’ optimalcodons. Nucleic Acids Res. 17, 5029–5039.
Sharp, P.M., Matassi, G., 1994. Codon usage and genome evolution. Curr. Opin.Genet. Dev. 4, 851–860.
Sharp, P.M., Stenico, M., Peden, J.F., 1993. Codon usage: mutational bias,translational selection, or both? Biochem. Soc. Trans. 21, 835–841.
Sharp, P.M., Averof, M., Lloyd, A.T., Matassi, G., Peden, J.F., 1995. DNAsequence evolution: the sounds of silence. Philos. Trans. R. Soc. Lond., BBiol. Sci. 349, 241–247.
Shi, X., Wang, X., Li, Z., Zhu, Q., Tang, W., Ge, S., Luo, J., 2006. Nucleotidesubstitution pattern in rice paralogues: implication for negative correlationbetween the synonymous substitution rate and codon usage bias. Gene 376,199–206.
Subramanium, S., Kumar, S., 2004. Gene expression intensity shapesevolutionary rates of the proteins encoded by the vertebrate genome.Genetics 168, 373–381.
Urrutia, A.O., Hurst, L.D., 2001. Codon usage bias covaries with expressionbreadth and the rate of synonymous evolution in humans, but this is notevidence for selection. Genetics 159, 1191–1199.
Wang, H.C., Hickey, D.A., 2007. Rapid divergence of codon usage patternswithin the rice genome. BMC Evol. Biol. 7.
Wang, L., Roossinck, M.J., 2006. Comparative analysis of expressed sequencesreveals a conserved pattern of optimal codon usage in plants. Plant Mol.Biol. 61, 699–710.
Wang, H.C., Singer, G.A., Hickey, D.A., 2004. Mutational bias affects proteinevolution in flowering plants. Mol. Biol. Evol. 21, 90–96.
Wolfe, K.H., Gouy, M., Yang, Y., Sharp, P.M., Li, W.H., 1989. Date of themonocot–dicot divergence estimated from chloroplast DNA sequence data.Proc. Natl. Acad. Sci. U.S.A. 86, 6201–6205.
Wong, G.K., Wang, J., Tao, L., Tan, J., Zhang, J., Passey, D.A., Yu, J., 2002.Compositional gradients in Gramineae genes. Genome Res. 12, 851–856.
Wright, S.I., Yau, C.B., Looseley, M., Meyers, B.C., 2004. Effects of geneexpression on molecular evolution in Arabidopsis thaliana and Arabidopsislyrata. Mol. Biol. Evol. 21, 1719–1726.
Xiyin, W., Xiaoli, S., Bailin, H., 2002. The transfer RNA genes in Oryza sativaL. ssp. Indica. Sci. China, Ser. C: Life Sci. 45, 504–511.