hs-spme-gc×gc-qms volatile metabolite profiling of chrysolina herbacea frass and mentha spp. leaves
TRANSCRIPT

ORIGINAL PAPER
HS-SPME-GC×GC-qMS volatile metabolite profilingof Chrysolina herbacea frass and Mentha spp. leaves
Chiara Cordero & Simon Atsbaha Zebelo & Giorgio Gnavi & Alessandra Griglione &
Carlo Bicchi & Massimo E. Maffei & Patrizia Rubiolo
Received: 28 September 2011 /Revised: 10 November 2011 /Accepted: 20 November 2011 /Published online: 6 December 2011# Springer-Verlag 2011
Abstract Headspace solid-phase microextraction (HS-SPME) comprehensive two-dimensional (2D) gas chroma-tography combined with quadrupole-mass spectrometry(GC×GC-qMS) with dedicated comparative data elabora-tion was applied to separate chemical patterns arising fromthe interaction between some Mentha species and the herbi-vore Chrysolina herbacea, also known as the mint bug.Upon feeding on different Mentha species (Mentha spicataL., Mentha×piperita L. and Mentha longifolia L.), C. her-bacea produced frass (faeces) which were characterized by atypical volatile fraction. HS-SPME GC×GC-qMS analysisof the complex volatile fraction of both mint leaf and C.herbacea frass was submitted to advanced fingerprintinganalysis of 2D chromatographic data. 1,8-Cineole, foundin the leaves of all the Mentha species examined, wasoxidized, and C. herbacea frass yielded high rates of severalhydroxy-1,8-cineoles, including 2α-hydroxy-, 3α-hydroxy-,3β-hydroxy- and 9-hydroxy-1,8-cineole. Upon insect feed-ing, several unknown oxidized monoterpenes, a p-menthane
diol and three unknown phenylpropanoids were alsodetected in the frass volatiles. In M. longifolia, the occur-rence of the monoterpene piperitenone oxide was found tobe toxic and associated with insect death. The results of thiswork show that high throughput techniques such as HS-SPME and GC×GC-qMS fingerprint analysis are ideal toolsto analyze complex volatile matrices, and provide a sensi-tive method for the direct comparison and chemical visual-ization of plant and insect emitted volatile components.
Keywords Plant–insect interaction .Chrysolina herbacea .
Mentha spicata L. .Mentha×piperita L. .Mentha longifoliaL. . Volatile fraction . HS-SPME-GC×GC-qMS . Fingerprintanalysis
Introduction
Analysis of compounds arising from multitrophic interac-tions among different living organisms requires the selectionof sample preparation and analytical strategies suitable togive reliable results helpful to understanding the biologicalphenomenon. When dealing with organisms belonging todifferent kingdoms, multitrophic interactions generate a lev-el of complexity that requires high throughput strategiesable to provide information on both the identity and theabsolute and/or relative abundance distribution of specificmarkers. This information has to be obtained from a repre-sentative and appropriate amount of sample matrix (depend-ing on their concentration) after suitable separation (orisolation, when necessary) and detection.
Headspace solid-phase microextraction (HS-SPME)combined with comprehensive two-dimensional (2D) GCand quadrupole-mass spectrometry (GC×GC-qMS) withdedicated comparative data elaboration is particularly
Chiara Cordero and Simon Atsbaha Zebelo contributed equally to thiswork.
Electronic supplementary material The online version of this article(doi:10.1007/s00216-011-5600-4) contains supplementary material,which is available to authorized users.
C. Cordero :A. Griglione : C. Bicchi : P. Rubiolo (*)Dipartimento di Scienza e Tecnologia del Farmaco,,Università degli Studi di Torino,Via Pietro Giuria n°9,10125 Torino, Italye-mail: [email protected]
S. A. Zebelo :G. Gnavi :M. E. MaffeiUnità di Fisiologia Vegetale, Dipartimento di Biologia Vegetale,Università degli Studi di Torino, Centro della Innovazione,Via Quarello 11/A,10135 Torino, Italy
Anal Bioanal Chem (2012) 402:1941–1952DOI 10.1007/s00216-011-5600-4

suitable to solving complex problems such as chemicalpatterns arising from multitrophic interactions. HS-SPMEis a suitable sampling technique because (a) it is easy tostandardize and gives reliable profiles suitable for compar-ison; (b) it affords the concentration of trace and minorcomponents while minimizing possible artefacts formationand losses, frequently produced with conventional extrac-tion procedures (e.g. solvent extraction); and (c) it reducessample manipulation to a minimum. Conversely, this tech-nique can sometimes produce analyte discriminations due tothe nature of the fibre, only partly compensated by theadoption of a multicomponent fibre coating, and last butnot least, might influence an effective direct quantitativecomparison between plant and insect samples compositiondue to their highly different nature.
GC×GC-qMS is currently adopted as separation tech-nique not only because of its high separation power andsensitivity but also for its ability to produce more widelydistributed and rationalized peak patterns [1] for chemicallycorrelated group of analytes. GC×GC peak patterns can becombined with novel advanced data mining methods able todelineate sample fingerprints, with different discriminationpotential, and to locate compounds (known and unknown)comparatively important for differential analyses [2, 3].
Data mining approaches aiming to elaborate GC×GCpatterns are classified as ‘non-targeted’ methods [4] en-abling an effective cross-sample analysis to discover rele-vant chemical cues (such as compositional similarities ordifferences) from multiple samples. Non-targeted cross-sample analysis evaluates each and every constituent in eachand every sample by generating characteristic feature(s) foreach and every constituent [5]. Detector intensities and massspectroscopic profiles (total and/or selected ion) were usedas characteristic features since they indicate analyte abun-dance and provide information on the identity thus afford-ing, during the comparative elaboration, the ability to matchreliably the corresponding features of the same analyte in allsamples.
An example illustrating the above considerations is themultitrophic interaction between Mentha species (family:Lamiaceae) and their specialist herbivore insects. Theseplants, which store defence secondary metabolites, poseapparent chemical barriers to potential herbivore colonistsand seem accessible to relatively few insect lineages, possi-bly pre-adapted by use of chemically similar or related hostplants [6]. Insects may respond to plants by choosing dif-ferent feeding sites, by altering their consumption rates orby induction of physiological/detoxification enzymes [7].As some insects become adapted to plant metabolites, inter-actions between the two kingdoms occasionally lead tohighly specific relationships, as in the case of some Menthaspecies and the herbivore Chrysolina herbacea (mint bug ormint beetle) [8]. This model is ideal to develop new
sensitive methods of analytical and bioanalytical investiga-tions aimed to reveal multiple markers and code the com-plexity of the interaction.
Previous studies have shown that C. herbacea is perfectlyadapted to the blend of terpenoids emitted by undamagedMentha aquatica and uses this blend as a cue to locate theplants, while the plant was found to respond to herbivorywith the modulation of terpenoid biosynthesis and geneexpression and production of specific deterrent molecules[9]. Furthermore, feeding by C. herbacea on M. aquaticawas found to induce a significant increase of jasmonicacid (JA), JA precursor, cis-(+)-12-oxophytodienoic acid(OPDA), and JA conjugate, (3R,7S)-jasmonoyl-L-isoleucine(JA-Ile), in M. aquatica leaves [10].
An open question is how insects tolerate or detoxify thehigh amount of terpenoids ingested and catabolise/biotrans-form them during the digestive process. To shed light on thistopic, C. herbacea was fed with fresh leaves of three mintsspecies characterized by different blends of volatile mono-terpenoids: Mentha spicata L., characterized by carvone[11], Mentha×piperita L., containing menthol and men-thone [12], and a chemotype of Mentha longifolia L., espe-cially rich in piperitenone oxide [13].
The volatile fraction composition of the insect frass wasalso investigated and compared to that of intact leaves.Several significant variables were taken in consideration,including (a) the low amounts of frass produced by eachinsect, necessitating several insects to collect a few milli-grams of frass in order to obtain a workable sample, and (b)the different nature of frass (semi-liquid) and leaves (solid).Therefore, peak patterns from leaves and frass samples werecompared to obtain information on feature relative abun-dance (semi-quantitative differences); the procedure con-sisted of a preliminary screening for relevant features, todetect qualitative differences between sample patterns, by avisual comparison method [1], followed by a more compre-hensive approach, to focus the more relevant chemical dif-ferences (known as comprehensive template matchingfingerprinting [3]).
The aim of this work was to develop a highly sensitiveand direct comparative analysis method to reveal volatilemetabolites emitted by C. herbacea frass as a function ofMentha spp. fed leaf volatiles in order to assess the ability ofthe insect to feed on plant toxic compounds and to study therole of frass volatiles from an ecological viewpoint.
Experimental
Plant material and growth conditions
M. spicata L., M.×piperita L. and M. longifolia L. wereidentified by Prof. Massimo Maffei, and a voucher specimen
1942 C. Cordero et al.

of each species is deposited at the Herbarium Taurinensis ofthe Department of Plant Biology, University of Turin. Sto-lons of M. spicata, M.×piperita and M. longifolia weresurface sterilized with 70% ethanol (Sigma-Aldrich, St.Louis, MO, USA) for 20 s, with sodium hypochlorite (1%v/v available chlorine; Sigma-Aldrich) for 5 min, and wererinsed three times with sterile distilled water. Plants weregrown in plastic pots with sterilized peat and vermiculite (v/v 4:1) at 23 °C and 60% humidity using daylight fluorescenttubes at 270 μE m−2 s−1 with a photophase of 16 h and wereused in all assay before full bloom.
Insect collection and rearing
Adults of C. herbacea (Duftschmid 1825; order: Coleoptera,family: Chrysomelidae, subfamily: Chrysomelinae) werecollected by hand from infested mint fields in the Turinprovince area. After collection, beetles were reared at22 °C in ventilated glass chambers and fed with M. spicataL., M.×piperita L. and M. longifolia five-node cuttings.
Leaf and frass HS-SPME sampling
Intact leaves (about 50 mg) from living plants of Menthaspecies were carefully picked-off immediately before theanalysis and gently placed in hermetically sealed 2.0-mLvials for HS-SPME sampling. Frass fluid collected frominsects feeding on Mentha species suitable to produce a 3–5-mg sample were transferred to a 2.0-mL headspace vials,weighed and hermetically sealed before HS-SPME sam-pling. A different phase ratio in sampling leaves and frasswas applied in order to obtain an indication, although highlyapproximate, of the relative component abundance in thetwo matrices.
The SPME sampling device, containing divinylbenzene/carboxen/polydimethylsiloxane (DVB/CAR/PDMS) df 50/30 μm, 2 cm length fibre, was manually inserted into thesealed vial and the fibre exposed to the matrix headspacevolatiles for 20 min at room temperature.
Control over consistency of performance for SPMEwas obtained by the equilibrium in-fibre internal stan-dardization procedure [14, 15]. The Internal Standardloading onto the SPME device was as follows: the SPMEdevice was manually inserted into a 20-mL sealed vialcontaining 2 mL of ultra-pure water, to which 2 μL of α-thujone (ISTD) standard working solution at 7.0 μg/mL wasadded. α-Thujone is known to be absent in mint volatilefraction [11]. The fibre was exposed to the headspace atroom temperature for 20 min, followed by exposure to thefrass headspace for a second time for 20 min at roomtemperature.
Instrumentation
GC×GC analyses were carried out on an Agilent 6890 GCunit coupled to an Agilent 5975 MS detector operating in EImode at 70 eV (Agilent Technologies, Little Falls, DE,USA). The transfer line was set at 270 °C, while the ionsource temperature was set at 230 °C. A ‘Standard Tune’option was used. The full scan acquisition was set at m/z35–250, with the fast scanning option applied (10,000 amu/s).The system was provided with a two-stage thermal modu-lator (KT 2004 loop modulator, Zoex Corporation, Houston,TX, USA) cooled with liquid nitrogen and with the hot jetpulse time set at 400 ms with modulation times of 4 and 5 s.The hot-jet temperature programme was from 160 °C to250 °C at 3 °C/min. Data were acquired by Agilent MSDChemStation software (ver D.02.00.275; Agilent Technolo-gies, Little Falls, DE, USA) and processed using GC Imagesoftware (ver 2.1b0; GC Image, LLC Lincoln NE, USA).
GC×GC-qMS operating conditions
GC×GC column set consisted of a 1D SE52 column (95%polydimethylsiloxane, 5% phenyl; 30 m×0.25 mm ID,0.25 μm df) coupled with a 2D OV1701 column (86%polydimethylsiloxane, 7% phenyl, 7% cyanopropyl; 1 m×0.1 mm ID, 0.10 μm df; MEGA, Legnano, Italy) with a loopdimension of 1.0 m.
One microlitre of the n-alkanes standard solution at10 ng/μL (n-C9 to n-C25; Sigma-Aldrich, Milan, Italy)was automatically injected into the GC with an AgilentALS 7683B injection system (injector, split/splitless; mode,split; split ratio, 1/100; temperature, 280 °C). The HS-SPMEsampled analytes were recovered through thermal desorp-tion of the fibre for 10 min directly into the GC injector[injector, split/splitless; mode, split; split ratio, 1/10; tem-perature, 250 °C; carrier gas, helium; flow mode, constantflow; flow rate, 1.0 mL/min (initial head pressure,280 KPa); temperature program, 45 °C (1 min) to 260 °C(5 min) at 2.5 °C/min; modulation period, 4 s].
Volatiles were identified by comparing their linear reten-tion indices (IS
T) to those reported in an in-house database, acommercially available database [16] or from literature [17],and by comparing EI-MS fragmentation pattern similaritywith compounds collected in commercial and in-house data-bases or, when available, with authentic standard confirma-tion. An Identity Spectrum Match factor above 850 resultingfrom the NIST Identity Spectrum Search algorithm (NISTMS Search 2.0) was determined to be acceptable for positiveidentification. MW information is also reported for thoseanalytes where it was possible to recognize at least themolecular weight (MW) and/or a diagnostic fragmentationpattern, referred to a known skeleton reasonably derivedfrom bio-transformation of plant secondary metabolites.
Volatiles of Chrysolina herbacea frass and Mentha spp. leaves 1943

All compounds whose standards were not available in theauthors' laboratory were indicated in Table 1 as tentativelyidentified with an asterisk. Unknown mass spectra areshown in Electronic Supplementary Material Figure S1.
Data elaboration
Comparative visualization of GC×GC sample patterns
The comparative visualization procedure was adopted forthe preliminary processing of 2D chromatograms to locatefeatures that indicate differences in volatiles compositionbetween leaf and frass samples. This approach is an exten-sion of conventional image-comparison techniques, such asside-by-side and flicker between images [18], and consistsof metadata subtraction of a sample (or analyzed) 2D-chromatogram from a reference to reveal quali-quantitativedifferences in analytes distribution. GC×GC raw data can berepresented as an a [m, n] matrix where a is the analyzedchromatogram with indexed pixels, and m is the 1D and nthe 2D retention time corresponding to the detector re-sponse, generating a three-dimensional image assigned toeach pixel. For a correct and reliable visual comparison,corresponding peaks from 2D chromatogram pairs are prop-erly aligned and normalized in terms of response [19].
In the first step, one of the chromatograms is transformedinto the retention times plane to minimize the mean-squaremisalignment of the reliable peaks. Affine transformations(with scaling, translation and shearing) were used to find thebest fit between the peak pattern in the reference image anddetected peaks in the analyzed chromatogram. After align-ment, pairs can be visually inspected to reveal composition-al differences.
In the visual comparison, a colourized fuzzy differencevisualization is applied, which uses the hue-intensity-saturation (HIS) colourspace to colour each pixel in theretention times plane. The method first computes the differ-ence at each data point. The pixel hue is set to green whenthe difference is positive and red when it is negative. Thepixel intensity is set to the largest of the two values. Thepixel saturation is set to the magnitude of the differencebetween the data points. Peaks are visible because large-valued data points yield bright pixels and small-valued datapoints yield dark pixels. If the difference is large, the colouris saturated with red or green (depending on the largest datapoint); if the difference is small, the colour saturation is low,producing a grey level from black to white depending onintensity. Peaks with large differences therefore appear redor green, and peaks with small differences appear white orgrey. The fuzzy difference is computed as the differencebetween a data point and a small region of data points inthe other chromatogram divided by the largest of the twovalues in computing the saturation. Thus, the colours are
saturated with red or green only when the relative differencerather than the absolute difference is large. Differences areevidenced by white circles that indicate features to be in-vestigated as potential bio-transformation and/or degrada-tion products. Numbers in Fig. 1 correspond to thecompounds in Table 1.
Comprehensive template matching fingerprinting
The high number of apparent differences required a finger-printing method to evaluate the most significant differencesand to catalogue them comprehensively.
An advanced, effective and reliable non-targeted analysisapproach known as comprehensive template matching fin-gerprinting [2, 20] was adopted for a comprehensive com-parative analysis of 2D chromatographic data and tocorrectly interpret visual differences. This method considersas comparative feature, each individual 2D peak togetherwith its time coordinates, detector response and MS frag-mentation pattern, and includes it in a sample template thatcan be used to compare plots directly and comprehensively.The method implies that (a) a template is created by record-ing retention times, detector responses and MS fragmenta-tion patterns of the 2D peaks from a source chromatogram;(b) the template is compared to the peak pattern of the nextsample (analyzed chromatogram) in the set, to establishcorrespondences between peaks of the same analyte; (c)the template is eventually transformed in the retention timesplane to compensate for retention times shifts; (d) positivematches are confirmed through their retention time coher-ence and mass spectroscopic match factors (NIST algorithmsimilarity or identity); and (e) peaks in the analyzed chro-matogram without correspondences are added to the tem-plate and the ‘up-dated’ template adopted for the furthercomparative steps. This procedure is applied to the entireset of sample chromatograms to generate a consensus tem-plate of non-targeted peaks to adopt for the cross compari-son of samples.
Results
One of the major challenges posed by multitrophic interac-tions is the discrimination of chemical patterns produced bythe interacting organisms. The chemical patterns and theircontribution to metabolic interactions between Mentha spe-cies and C. herbacea were analysed in an attempt to eluci-date these multitrophic interactions.
As a first step, the comparative visualizations of thevolatile fractions of (a) M. spicata, (b) M.×piperita and (c)M. longifolia leaf volatiles (reference image) vs. thecorresponding C. herbacea frass volatile fraction were eval-uated (Fig. 1). Plots were obtained by comparing volatilepatterns of frass samples (analyzed chromatogram) to those
1944 C. Cordero et al.

Tab
le1
Con
sensus
templatepeak
listfrom
2Dchromatog
ramsfing
erprintin
gof
mintleaves
andthecorrespo
ndingfrasssamples
collected
after30
min
ofairexpo
sure
ID No.
Com
poun
dname
PeakI
(1D)
(min)
PeakII
(2D)(s)
I ST
Menthaspicata
Mentha×piperita
Menthalong
ifolia
Leaf
Frass
Leaf
Frass
Leaf
Frass
Norm.
volume
PV%
Norm.
volume
PV%
Norm.
volume
PV%
Norm.
volume
PV%
Norm.
volume
PV%
Norm.
volume
PV
%
1(Z)-3-Hexen-1-al
9.35
0.84
816
210.71
0.20
n.d.
n.d.
n.d.
n.d.
n.d.
n.d.
36.02
2.06
n.d.
n.d.
2(E)-2-Hexen-1-al
11.69
1.26
859
218.86
0.21
n.d.
n.d.
5.64
0.01
n.d.
n.d.
10.68
0.61
n.d.
n.d.
3(E)-Hex-3-en-1-ol
11.75
1.64
860
1,47
1.92
1.40
n.d.
n.d.
2.22
<0.01
7.24
0.05
3.11
0.18
n.d.
n.d.
4(E)-2-Hexen-1-ol
12.29
1.56
870
82.95
0.08
n.d.
n.d.
67.98
0.08
5.10
0.04
98.35
5.62
n.d.
n.d.
5α-Thu
jene
15.42
0.72
927
84.59
0.08
n.d.
n.d.
126.56
0.15
30.51
0.22
n.d.
n.d.
n.d.
n.d.
6α-Pinene
15.75
0.76
933
1,06
2.85
1.01
12.21
0.26
324.33
0.37
11.28
0.08
2.19
0.13
3.51
0.20
7Cam
phene
16.62
0.80
949
16.40
0.02
n.d.
n.d.
5.59
0.01
n.d.
n.d.
n.d.
n.d.
n.d.
n.d.
8β-Pinene
18.02
0.88
974
459.19
0.44
17.67
0.38
496.10
0.57
47.03
0.33
1.43
0.08
9.19
0.51
91-Octen-3-ol
18.22
1.60
978
54.95
0.05
n.d.
n.d.
36.45
0.04
n.d.
n.d.
n.d.
n.d.
n.d.
n.d.
10Sabinene
18.22
0.88
978
995.12
0.95
7.19
0.15
275.20
0.32
75.11
0.53
2.60
0.15
5.12
0.29
11Myrcene
18.89
0.93
990
836.17
0.80
16.85
0.36
69.43
0.08
16.39
0.12
2.21
0.13
9.70
0.54
123-Octanol
19.15
1.52
995
115.81
0.11
n.d.
n.d.
25.08
0.03
n.d.
n.d.
2.87
0.16
n.d.
n.d.
13α-Phelland
rene
19.49
0.84
1,00
114
.25
0.01
n.d.
n.d.
18.24
0.02
1.18
0.01
n.d.
n.d.
n.d.
n.d.
14(Z)-Hex-3-eny
lacetate
19.82
1.30
1,00
749
7.06
0.47
n.d.
n.d.
290.32
0.33
6.09
0.04
38.51
2.20
n.d.
n.d.
15α-Terpinene
20.42
0.97
1,01
726
.54
0.03
n.d.
n.d.
66.52
0.08
5.82
0.04
n.d.
n.d.
n.d.
n.d.
16p-Cym
ene
20.95
1.14
1,02
733
.43
0.03
7.82
0.17
96.25
0.11
14.58
0.10
4.22
0.24
1.67
0.09
17Lim
onene
21.22
1.14
1,03
114
,312
.94
13.63
197.80
4.22
383.77
0.44
143.28
1.01
4.39
0.25
4.86
0.27
181,8-Cineole
21.29
1.09
1,03
392
9.65
0.89
18.41
0.39
4,00
3.42
4.59
127.99
0.91
13.40
0.76
n.d.
n.d.
19(Z)-β-Ocimene
22.22
1.01
1,04
917
4.46
0.17
8.35
0.18
10.48
0.01
7.94
0.06
n.d.
n.d.
6.51
0.36
20γ-Terpinene
22.75
1.05
1,05
82.39
<0.01
1.56
0.03
114.26
0.13
10.57
0.07
n.d.
n.d.
n.d.
n.d.
21Sabinenehy
drate
23.42
1.60
1,07
012
.57
0.01
n.d.
n.d.
944.95
1.08
77.38
0.55
n.d.
n.d.
n.d.
n.d.
22α-Terpino
lene
24.69
1.01
1,09
278
.61
0.07
n.d.
n.d.
51.77
0.06
5.59
0.04
n.d.
n.d.
n.d.
n.d.
23p-Cym
enene
24.75
1.30
1,09
355
.72
0.05
10.03
0.21
5.46
0.01
14.59
0.10
n.d.
n.d.
n.d.
n.d.
242-Non
anol
25.02
1.56
1,09
88.03
0.01
n.d.
n.d.
3.09
n.d.
n.d.
n.d.
n.d.
n.d.
n.d.
n.d.
25Linaloo
l25
.29
1.68
1,10
214
2.88
0.14
n.d.
n.d.
273.12
0.31
8.14
0.06
n.d.
n.d.
n.d.
n.d.
26Non
anal
25.55
1.52
1,10
720
.38
0.02
10.35
0.22
7.82
0.01
6.28
0.04
n.d.
n.d.
4.68
0.26
27Allo
-ocimene
27.02
1.18
1,13
325
2.70
0.24
7.86
0.17
7.77
0.01
5.67
0.04
n.d.
n.d.
4.73
0.26
28cis-Lim
oneneox
ide
27.35
1.43
1,13
836
.75
0.03
n.d.
n.d.
n.d.
n.d.
n.d.
n.d.
n.d.
n.d.
n.d.
n.d.
29tran
s-Lim
oneneox
ide
27.55
1.47
1,14
280
.57
0.08
n.d.
n.d.
n.d.
n.d.
n.d.
n.d.
n.d.
n.d.
n.d.
n.d.
30Unk
nown
mon
oterpene
MW
152I
27.55
1.30
1,14
2n.d.
n.d.
n.d.
n.d.
n.d.
n.d.
66.39
0.47
n.d.
n.d.
n.d.
n.d.
Volatiles of Chrysolina herbacea frass and Mentha spp. leaves 1945

Tab
le1
(con
tinued)
ID No.
Com
poun
dname
PeakI
(1D)
(min)
PeakII
(2D)(s)
I ST
Menthaspicata
Mentha×piperita
Menthalong
ifolia
Leaf
Frass
Leaf
Frass
Leaf
Frass
Norm.
volume
PV%
Norm.
volume
PV%
Norm.
volume
PV%
Norm.
volume
PV%
Norm.
volume
PV%
Norm.
volume
PV
%
31Unk
nown
mon
oterpene
MW
152II
27.69
2.06
1,14
4n.d.
n.d.
5.11
0.11
18.68
0.02
274.52
1.94
n.d.
n.d.
n.d.
n.d.
32Isop
ulegol
27.95
1.81
1,14
9n.d.
n.d.
n.d.
n.d.
76.47
0.09
17.45
0.12
n.d.
n.d.
n.d.
n.d.
33Menthon
e28
.55
1.73
1,15
95.44
0.01
n.d.
n.d.
14,502
.36
16.64
268.29
1.90
n.d.
n.d.
n.d.
n.d.
34Menthofuran
29.09
1.39
1,16
913
.05
0.01
7.85
0.17
504.68
0.58
181.41
1.28
88.05
5.03
n.d.
n.d.
35Isom
enthon
e29
.15
1.77
1,17
077
.87
0.07
7.18
0.15
10,641
.47
12.21
1.86
0.01
n.d.
n.d.
n.d.
n.d.
36Neo-m
enthol
29.49
1.89
1,17
6n.d.
n.d.
10.22
0.22
3.40
<0.01
611.00
4.32
n.d.
n.d.
n.d.
n.d.
37Dill
ethera
29.69
1.60
1,17
9n.d.
n.d.
n.d.
n.d.
n.d.
n.d.
24.71
0.17
n.d.
n.d.
n.d.
n.d.
38Menthol
30.15
1.89
1,18
7n.d.
n.d.
n.d.
n.d.
22,525
.94
25.85
8,44
9.77
59.77
10.60
0.61
5.21
0.29
39Isom
enthol
30.49
1.73
1,19
3n.d.
n.d.
n.d.
n.d.
337.05
0.39
69.13
0.49
n.d.
n.d.
n.d.
n.d.
40α-Terpineol
30.69
1.85
1,19
753
.47
0.05
n.d.
n.d.
95.44
0.11
n.d.
n.d.
5.07
0.29
n.d.
n.d.
41Neoisom
enthol
a30
.75
1.73
1,19
8n.d.
n.d.
n.d.
n.d.
29.52
0.03
16.70
0.12
n.d.
n.d.
n.d.
n.d.
42Dihyd
rocarveol
30.95
1.98
1,20
195
1.88
0.91
72.83
1.55
n.d.
n.d.
n.d.
n.d.
n.d.
n.d.
n.d.
n.d.
43Decanal
31.42
1.56
1,21
015
.03
0.01
11.68
0.25
22.07
0.03
13.39
0.09
n.d.
n.d.
4.87
0.27
44Dihyd
rocarvon
e31
.49
1.94
1,211
90.87
0.01
95.66
2.04
n.d.
n.d.
n.d.
n.d.
n.d.
n.d.
n.d.
n.d.
454,7-Dim
ethy
lbenzofuran
31.89
1.85
1,21
8n.d.
n.d.
n.d.
n.d.
6.93
0.01
n.d.
n.d.
73.63
4.20
n.d.
n.d.
462α
-Hyd
roxy
-1,8-
cineolea
32.42
2.40
1,22
8n.d.
n.d.
7.54
0.16
n.d.
n.d.
83.35
0.59
n.d.
n.d.
8.43
0.47
47tran
s-Carveol
32.49
2.15
1,22
91,19
1.19
1.13
306.58
6.54
n.d.
n.d.
4.67
0.03
n.d.
n.d.
n.d.
n.d.
48cis-Carveol
32.95
1.94
1,23
88.30
0.01
18.69
0.40
n.d.
n.d.
n.d.
n.d.
n.d.
n.d.
n.d.
n.d.
49(Z)-3-Hexenyl
isov
aleratea
33.22
1.35
1,24
310
6.19
0.10
4.54
0.10
10.34
0.01
6.11
0.04
n.d.
n.d.
1.67
0.09
503α
-Hyd
roxy
-1,8-
cineolea
33.35
2.53
1,24
5n.d.
n.d.
15.66
0.33
n.d.
n.d.
n.d.
n.d.
n.d.
n.d.
n.d.
n.d.
51Pulegon
e33
.49
1.85
1,24
840
3.66
0.38
6.15
0.13
9.85
0.01
n.d.
n.d.
n.d.
n.d.
n.d.
n.d.
523β-H
ydroxy
-1,8-
cineolea
33.55
2.44
1,24
9n.d.
n.d.
n.d.
n.d.
n.d.
n.d.
131.26
0.93
n.d.
n.d.
n.d.
n.d.
53Carvo
ne33
.82
2.06
1,25
457
,917
.53
55.14
656.97
14.01
n.d.
n.d.
386.74
2.74
n.d.
n.d.
n.d.
n.d.
54Piperito
ne34
.09
2.36
1,25
9n.d.
n.d.
n.d.
n.d.
605.32
0.69
38.04
0.27
n.d.
n.d.
27.79
1.55
559-Hyd
roxy
-1,8-
cineolea
34.55
2.23
1,26
7n.d.
n.d.
12.28
0.26
n.d.
n.d.
6.90
0.05
n.d.
n.d.
3.91
0.22
56Neomenthyl
acetate
35.15
1.64
1,27
8n.d.
n.d.
n.d.
n.d.
59.59
0.07
6.95
0.05
n.d.
n.d.
n.d.
n.d.
57Menthyl
acetate
36.35
1.52
1,30
03.41
<0.01
n.d.
n.d.
1.84
<0.01
134.44
0.95
n.d.
n.d.
n.d.
n.d.
1946 C. Cordero et al.

Tab
le1
(con
tinued)
ID No.
Com
poun
dname
PeakI
(1D)
(min)
PeakII
(2D)(s)
I ST
Menthaspicata
Mentha×piperita
Menthalong
ifolia
Leaf
Frass
Leaf
Frass
Leaf
Frass
Norm.
volume
PV%
Norm.
volume
PV%
Norm.
volume
PV%
Norm.
volume
PV%
Norm.
volume
PV%
Norm.
volume
PV
%
58Neodihy
drocarvy
lacetatea
36.95
1.68
1,31
2n.d.
n.d.
13.03
0.28
n.d.
n.d.
n.d.
n.d.
n.d.
n.d.
n.d.
n.d.
59Isod
ihyd
rocarvyl
acetatea
38.15
1.60
1,33
53.90
<0.01
136.58
2.91
n.d.
n.d.
n.d.
n.d.
n.d.
n.d.
n.d.
n.d.
60Unk
nown
sesquiterpeneMW
204
38.29
1.18
1,33
711.83
0.01
n.d.
n.d.
2.54
<0.01
n.d.
n.d.
n.d.
n.d.
n.d.
n.d.
61tran
s-p-Menthane-2,3-
diol
a38
.55
2.99
1,34
2n.d.
n.d.
n.d.
n.d.
n.d.
n.d.
139.10
0.98
n.d.
n.d.
n.d.
n.d.
62tran
s-Carvy
lacetate
38.62
1.64
1,34
418
.57
0.02
7.41
0.16
n.d.
n.d.
n.d.
n.d.
n.d.
n.d.
n.d.
n.d.
63Eug
enol
39.35
2.48
1,35
8n.d.
n.d.
29.56
0.63
n.d.
n.d.
n.d.
n.d.
n.d.
n.d.
n.d.
n.d.
64α-Cub
ebenea
39.42
1.26
1,35
9113.36
0.11
n.d.
n.d.
58.88
0.07
n.d.
n.d.
n.d.
n.d.
n.d.
n.d.
65Unk
nownMW
174
39.49
2.10
1,36
028
1.66
0.27
n.d.
n.d.
n.d.
n.d.
20.36
0.14
n.d.
n.d.
n.d.
n.d.
66cis-Carvy
lacetate
39.95
1.68
1,36
914
.54
0.02
51.77
1.10
n.d.
n.d.
n.d.
n.d.
n.d.
n.d.
n.d.
n.d.
67Unk
nown
phenylprop
anoid
MW
148I
40.02
3.16
1,37
134
.02
0.03
n.d.
n.d.
n.d.
n.d.
20.73
0.15
n.d.
n.d.
n.d.
n.d.
68Piperiteno
neox
idea
40.35
2.57
1,37
7n.d.
n.d.
n.d.
n.d.
n.d.
n.d.
n.d.
n.d.
366.73
20.94
n.d.
n.d.
69α-Cop
aene
40.55
1.26
1,38
161
.36
0.06
n.d.
n.d.
59.42
0.07
n.d.
n.d.
n.d.
n.d.
n.d.
n.d.
70β-Bou
rbon
enea
41.35
1.35
1,39
61,113.00
1.06
18.92
0.40
186.73
0.21
n.d.
n.d.
n.d.
n.d.
n.d.
n.d.
71β-Elemenea
41.62
1.39
1,40
11,55
2.61
1.48
18.77
0.40
213.86
0.25
n.d.
n.d.
n.d.
n.d.
n.d.
n.d.
72Unk
nown
phenylprop
anoid
MW
148II
41.89
3.16
1,40
763
.29
0.06
n.d.
n.d.
n.d.
n.d.
8.39
0.06
n.d.
n.d.
n.d.
n.d.
73cis-Jasm
one
41.89
2.31
1,40
725
.20
0.02
n.d.
n.d.
n.d.
n.d.
n.d.
n.d.
n.d.
n.d.
n.d.
n.d.
74Unk
nown
phenylprop
anoid
MW
148III
42.15
3.28
1,41
224
.84
0.02
n.d.
n.d.
n.d.
n.d.
9.40
0.07
n.d.
n.d.
n.d.
n.d.
75Unk
nown
phenylprop
anoid
MW
148IV
42.35
3.32
1,41
610
1.78
0.10
n.d.
n.d.
n.d.
n.d.
16.20
0.11
n.d.
n.d.
n.d.
n.d.
76α-Gurjunene
42.62
1.30
1,42
274
.79
0.07
n.d.
n.d.
75.66
0.09
n.d.
n.d.
n.d.
n.d.
n.d.
n.d.
77β-Carioph
yllene
43.15
1.52
1,43
22,68
9.85
2.56
23.36
0.50
4,68
6.50
5.38
17.50
0.12
19.77
1.13
n.d.
n.d.
78Aromadendrene
43.89
1.39
1,44
7n.d.
n.d.
n.d.
n.d.
77.63
0.09
n.d.
n.d.
n.d.
n.d.
n.d.
n.d.
79α-Hum
ulene
44.82
1.47
1,46
638
2.06
0.36
5.13
0.11
301.64
0.35
n.d.
n.d.
n.d.
n.d.
n.d.
n.d.
80α-Amorph
enea
45.89
1.39
1,48
842
5.81
0.41
n.d.
n.d.
176.22
0.20
n.d.
n.d.
n.d.
n.d.
n.d.
n.d.
Volatiles of Chrysolina herbacea frass and Mentha spp. leaves 1947
Tab
le1
(con
tinued)
ID No.
Com
poun
dname
PeakI
(1D)
(min)
PeakII
(2D)(s)
I ST
Menthaspicata
Mentha×piperita
Menthalong
ifolia
Leaf
Frass
Leaf
Frass
Leaf
Frass
Norm.
volume
PV%
Norm.
volume
PV%
Norm.
volume
PV%
Norm.
volume
PV%
Norm.
volume
PV%
Norm.
volume
PV
%
81Germacrene
D46
.22
1.60
1,49
53,06
4.95
2.92
9.11
0.19
1,15
5.97
1.33
7.06
0.05
6.28
0.36
n.d.
n.d.
82α-Muu
rolene
a46
.75
1.47
1,50
633
1.00
0.32
n.d.
n.d.
145.76
0.17
n.d.
n.d.
n.d.
n.d.
n.d.
n.d.
83Bicyclogerm
acrene
a46
.89
1.52
1,50
944
0.83
0.42
2.98
0.06
462.00
0.53
n.d.
n.d.
n.d.
n.d.
n.d.
n.d.
84γ-Cadinenea
47.69
1.43
1,52
641
9.80
0.40
5.45
0.12
220.56
0.25
n.d.
n.d.
3.33
0.19
n.d.
n.d.
85δ-Cadinenea
48.09
1.43
1,53
455
2.14
0.53
6.34
0.14
330.15
0.38
7.08
0.05
4.22
0.24
n.d.
n.d.
86Cadina-1,4-dienea
48.55
1.47
1,54
446
.75
0.04
n.d.
n.d.
24.45
0.03
n.d.
n.d.
n.d.
n.d.
n.d.
n.d.
87α-Cadinenea
48.82
1.47
1,55
020
0.35
0.19
n.d.
n.d.
89.85
0.10
n.d.
n.d.
n.d.
n.d.
n.d.
n.d.
88epi-Cub
enol
a52
.42
1.89
1,62
751
.78
0.05
10.43
0.22
n.d.
n.d.
n.d.
n.d.
n.d.
n.d.
n.d.
n.d.
89α-Cadinol
a53
.55
1.98
1,65
18.85
0.01
n.d.
n.d.
5.74
0.01
n.d.
n.d.
n.d.
n.d.
n.d.
n.d.
Eachun
-targetedpeak
isrepo
rted
with
itsnu
mber(IDNo.),compo
undname(w
henidentified),1
Dand2Dretentiontim
es,linearretentionindices(IST),no
rmalized
2Dvo
lumeandthepeak
volume
percentage
(PV%).Dataarethemeanof
threereplicates.Boldfacenu
mbers
indicate
new
compo
unds
metabolized
byChrysolinaherbacea
ndno
tdetected
aCom
poun
dstentativelyidentifiedon
thebasisof
theirmassspectroscopicandlin
earretentionindices
1948 C. Cordero et al.

of the leaves of mint species (reference chromatogram)picked from living plants after chromatogram scaling andnormalization. An average number of 10–14 features werehighlighted for M. spicata (Fig. 1a) and M.×piperita(Fig. 1b), enabling the next investigation step implying,where possible, the identification of the corresponding 2Dpeaks and/or the extraction of retention data and MS frag-mentation pattern for unknown analytes. M. longifoliaresults required dedicated considerations; few differenceswere detectable between the leaf–frass chromatograms pair,as revealed by the visual comparison (Fig. 1c). The colour-ized fuzzy ratio visualization shows that leaves produced amore intense chromatogram than frass; i.e. several referenceimage volatiles (red 2D peaks) are represented over the 2Dplane, while only few analyzed image peaks (green spots)referred to highly abundant analytes in the frass sample are
reported. In addition, C. herbacea bugs stopped feeding andeventually died after a few hours of feeding onM. longifolialeaves, probably due to the presence of leaf toxiccompounds.
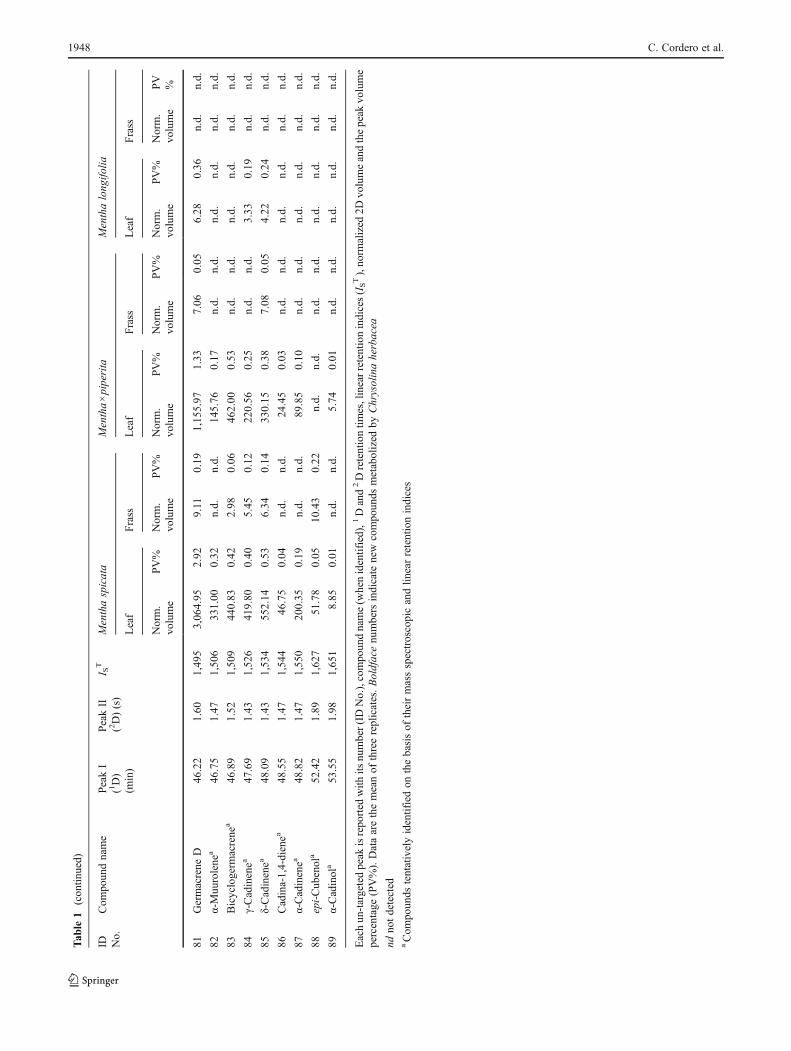
Consensus template peak list obtained by applying thecomprehensive template matching procedure on 2D chro-matograms of M. spicata, M.×piperita and M. longifolialeaves used to feed C. herbacea and the corresponding frassvolatile fraction are listed in Table 1. Each un-targeted peakis reported with its compound name (when identified), 1Dand 2D retention times, linear retention indices (IS
T), thenormalized 2D volumes and the percent response, i.e. 2Dpeak volume percentage (PV%) estimated on the total ioncurrent signal. The identification of each compound wasconsidered reliable when a coherence of linear retentionindices, mass spectra similarity and co-injection of an au-thentic standard was verified.
As expected, the major component of M. spicata wascarvone, and the main components of M.×piperita werementhol and menthone, whereas the main component ofM. longifolia was piperitenone oxide (Table 1). The com-prehensive peak list was then elaborated in view of thecomparative visualization results by focusing the attentionon those 2D peaks (formerly defined features) that variedgreatly, in terms of relative abundance (2D PV%) from leafto frass and vice versa. Structure formulae of some signifi-cant compounds are reported in Fig. 2.
The distribution of the most informative features revealedin frass samples, obtained from bugs feeding on M. spicata
Fig. 1 Comparative visualization represented as colourized fuzzy ratioof leaf (reference image) vs. frass (analyzed image) from three differentmint species: (a) Mentha spicata, (b) Mentha×piperita and (c) Menthalongifolia. Red colourization indicates 2D peaks more abundant in thereference image, while intense green peaks indicate those more abun-dant in the analyzed chromatogram. White circles indicate minutiaefeatures to be investigated as potential bio-transformation and/or deg-radation products. Numbers correspond to compound numbers ofTable 1
Fig. 2 Terpenoids significantly characterizing the volatile fraction ofleaves and frass. 1, carvone; 2, menthol; 3, menthone; 4, piperitenoneoxide; 5, 1,8-cineole; 6, 2α-hydroxy-1,8-cineole; 7, 3α-hydroxy-1,8-cineole; 8, 9-hydroxy-1,8-cineole; 9, 3β-hydroxy-1,8-cineole
Volatiles of Chrysolina herbacea frass and Mentha spp. leaves 1949

(Fig. 3a), M.×piperita (Fig. 3b) and M. longifolia (Fig. 3c),not present in the volatiles pattern from leaves (left side) andthose revealed in leaf samples only are depicted in Fig. 3.Variations are represented as the difference between 2D PV% from frass to leaf.
Several new compounds were found in the frass volatilefraction from M. spicata. Most of these were oxidationproducts of plants terpenoids (e.g. 1,8-cineole and its 2α-hydroxy, 3α-hydroxy and 9-hydroxy derivatives), acetyla-tion products (e.g. neo-dihydrocarvyl acetate and iso-dihy-drocarvyl acetate) and an unknown oxidized monoterpenoid(MW152 II). Many leaf volatiles were not found in the frassvolatiles, including several green leaf volatiles and threesesquiterpene hydrocarbons (Fig. 3a and Table 1). The con-tent of all other leaf volatiles was reduced in the frassvolatile fraction (Table 1).
The insect frass volatile fraction resulting from M.×piperita presented significant variation with neo-menthol,carvone, three unknown monoterpenes, three 1,8-cineolehydroxylated derivatives (2α-hydroxy, 3β-hydroxy and 9-hydroxy), a p-menthane diol and three unknown phenyl-propanoids (Fig. 3b and Table 1). Some terpenoids original-ly present in the leaf fraction were probably metabolized by
the insect, among them α-terpineol and a series of sesqui-terpene hydrocarbons (Fig. 3b and Table 1). The amount ofmost of the remaining leaf compounds was decreased in thefrass volatile fraction (Table 1).
A few compounds were found in the frass volatiles de-rived from M. longifolia, among these two alkanals, twomonoterpenes and two hydroxylated cineole derivatives(Fig. 3c and Table 1). Most of the major leaf volatiles werenot present in the frass volatile fraction (Fig. 3c and Table 1),while other leaf components (e.g. α- and β-pinene, sabineneand myrcene) increased in the frass compared to the leaves(Table 1). Spectroscopic data of unknown Mentha spp.volatiles are provided as Electronic Supplementary MaterialFigure S1.
Discussion
The set of techniques here applied successfully contributedto clarify the volatile variations when C. herbacea feeds onsome Mentha species. Advanced fingerprinting procedures(i.e. comparative visualization and comprehensive templatematching) revealed informative features from a complex
Fig. 3 Distribution of the main features revealed by the comprehensivetemplate matching fingerprinting for (a) Mentha spicata, (b) Menthapiperita and (c) Mentha longifolia. Variations are represented as thedifference between 2D peak volumes percentage (PV%) from frass to
leaf. The first group (left) collects compounds revealed in frass samplesand not in leaves, the second (right) those revealed in the leaf volatilesprofile only
1950 C. Cordero et al.

GC×GC-qMS dataset [1, 3]. In particular, their potentials toprovide further and specific discrimination between leafvolatiles of different mint species and C. herbacea frasswere assessed.
Specifically, HS-SPME in combination with GC×GC-qMS allowed the study of the volatile fraction compositionof C. herbacea frass, and the comparison of the obtainedresults to those of fed species belonging to the Menthagenus to investigate the possible metabolic transformation.Moreover, the comparative approach based on differentialpattern visualization allowed us (a) to run qualitative anal-ysis (based on retention time location over the Euclidean 2Dplane) and evaluate compound abundance based on detectorintensity/response; (b) to obtain information on differentialsample composition, leaving out chemical identifications;and (c) to monitor simultaneously several related or unre-lated biological markers. Furthermore, the ability of C.herbacea to metabolize many leaf volatile terpenoids (e.g.those present inM. spicata andM.×piperita) producing newcompounds, most of them being oxygenated derivatives ofleaf volatiles, was shown.
1,8-Cineole (eucalyptol) oxidation was found to occur inall plant species considered in this work. This compound isone of the common components of essential oils from Men-tha species [21] and shows a significant bioactivity as amosquito feeding deterrent, ovipositional repellent and tox-icant against stored-grain beetles [22]. Oxidation of 1,8-cineole resulted in high rates of several hydroxy-1,8-cin-eoles [23]. 3-Hydroxycineole, the α- and β-isomers, havebeen reported as metabolites of the commonly occurring1,8-cineole, arising from either animal, insect or microbialbio-transformation [17, 24]. Many insects feeding on plantsthat store 1,8-cineole are able to metabolize it into severalhydroxyl derivatives [17, 25]. For example, faeces of grass-hoppers feeding on the Lamiaceae Pityrodia jamesii containa mixture of hydroxycineoles, of which 3α-hydroxy-1,8-cineole is the predominant isomer [26]. Southwell et al.[17] were the first to raise the question of whether thefunction of 1,8-cineole hydroxylation was detoxification ormetabolism for the production of semiochemicals. Possums[27], Leichhardt's grasshopper [26] and perhaps the pyrgobeetle [28] have been proposed to use hydroxycineoles aspheromonal markers. This is also a possibility for C. herba-cea, and a study is under way in this respect.
The monoterpenoids carvone and Z-carveol weredetected in C. herbacea frass after feeding on M.×piperita,a mint species that does not contain these two terpenesbut accumulates limonene [29]. Several microorganismshave been found to transform limonene to Z-carveoland carvone [30–34]. For example, Rhodococcus opacusPWD4 cells hydroxylated limonene at position 6 formingenantiomerically pure carveol, while Rhodococcusgloberulus PWD8 catalyzed its conversion into carvone
[30]. Since microorganisms possess metabolic propertiesthat are absent in insects, they may act as ‘microbialbrokers’, enabling phytophagous insects to overcome bio-chemical barriers to herbivory [35, 36]. Thus, microbialdegradation of plant toxic compounds can occur in insectguts and contribute to the carbon and energy requirement ofthe host [37]. A current study on C. herbacea microbialpopulation revealed the presence of more than 200 bacterialisolates from the insect digestive tract, with most of thespecies showing ability to biotransform terpenoids (Atsbahaet al., unpublished).
Feeding on M. longifolia was found to cause death of C.herbacea. The main constituent of this mint is piperitenoneoxide, which has been found to be highly active (LC50,9.95 mg l−1) when screened on the insect Culex pipienslarvae [38] and on the root-knot nematode Meloidogynesp. [39]. The toxicity of piperitenone oxide is one of thepossible explanations of the inability of C. herbacea to feedon M. longifolia and justifies the low rate of leaf terpenoidconversion found in the frass volatile fraction.
Conclusions
The strategy and the techniques adopted here have beenshown to be effective to discriminate terpenoids transformedby the digestive process of insect herbivores from moleculesstored in the secretory tissues of fed plants. These techni-ques can therefore lead to discovery of new compounds andmetabolites with specific structures, thus contributing tobetter understanding of the ecology and phytochemistry ofplant–insect interactions. High throughput techniques suchas HS-SPME and GC×GC-qMS can be used as reliable toolsto analyze complex volatile matrixes like those generated byplant–insect interactions.
Acknowledgement This work was partly supported by the DoctorateSchool of Pharmaceutical and Biomolecular Sciences of the Universityof Turin.
References
1. Cordero C, Bicchi C, Rubiolo P (2008) Group-type and fingerprintanalysis of roasted food matrices (coffee and hazelnut samples) bycomprehensive two-dimensional gas chromatography. J AgricFood Chem 56:7655–7666
2. Cordero C, Liberto E, Bicchi C, Rubiolo P, Reichenbach SE, TianX, Tao QP (2010) Targeted and non-targeted approaches for com-plex natural sample profiling by GCxGC-qMS. J Chromatogr Sci48:251–261
3. Cordero C, Liberto E, Bicchi C, Rubiolo P, Schieberle P,Reichenbach SE, Tao QP (2010) Profiling food volatiles bycomprehensive two-dimensional gas chromatography coupledwith mass spectrometry: advanced fingerprinting approachesfor comparative analysis of the volatile fraction of roasted
Volatiles of Chrysolina herbacea frass and Mentha spp. leaves 1951

hazelnuts (Corylus avellana L.) from different origins. J Chroma-togr A 1217:5848–5858
4. Pierce KM, Hoggard JC, Mohler RE, Synovec RE (2008) Recentadvancements in comprehensive two-dimensional separations withchemometrics. J Chromatogr A 1184:341–352
5. Reichenbach S, Tian X, Cordero C, Tao QP (2011) Features fornon-targeted cross-sample analysis with comprehensive two-dimensional chromatography. J Chromatogr A. doi:10.1016/j.chroma.2011.07.046
6. Farrell BD, Mitter C (1994) Adaptive radiation in insects andplants—time and opportunity. Am Zool 34:57–69
7. Scriber JM (2002) Evolution of insect-plant relationships: chemi-cal constraints, coadaptation, and concordance of insect/planttraits. Entomol Exp Appl 104:217–235
8. Bienkowski AO (2009) Feeding behavior of leaf-beetles (Coleop-tera, Chrysomelidae). Zool Z 88:1471–1480
9. Zebelo SA, Bertea CM, Bossi S, Occhipinti A, Gnavi G, MaffeiME (2011) Chrysolina herbacea modulates terpenoid biosynthesisof Mentha aquatica L. PLoS ONE 6(3):e17195
10. Occhipinti A, Zebelo SA, Capuzzo A, Maffei M, Gnavi G (2011)Chrysolina herbacea modulates jasmonic acid, cis-(+)-12-oxophy-todienoic acid, (3R,7S)-jasmonoyl-l-isoleucine, and salicylic acidof local and systemic leaves in the host plant Mentha aquatica. JPlant Interact 6:99–101
11. Lawrence BM (2007) Mint: the genus Mentha. CRC, Boca Raton12. Maffei M, Sacco T (1987) Chemical and morphometrical compar-
ison between 2 peppermint notomorphs. Planta Med 53:214–21613. Maffei M (1988) A chemotype of Mentha longifolia (L.) Hudson
particularly rich in piperitenone oxide. Flav Fragr J 3:23–2614. Wang YX, O'Reilly J, Chen Y, Pawliszyn J (2005) Equilibrium in-
fibre standardisation technique for solid-phase microextraction. JChromatogr A 1072:13–17
15. Setkova L, Risticevic S, Linton CM, Ouyang G, Bragg LM, Pawlis-zyn J (2007) Solid-phase microextraction-gas chromatography-time-of-flight mass spectrometry utilized for the evaluation of the new-generation super elastic fiber assemblies. Anal Chim Acta 581:221–231
16. Adams R (2001) Identification of essential oil component by gaschromatography/quadrupole mass spectroscopy. Allured Publish-ing Corporation, Carol Stream
17. Southwell IA, Russell MF, Maddox CDA, Wheeler GS (2003) Dif-ferential metabolism of 1,8-cineole in insects. J Chem Ecol 29:83–94
18. Lemkin P, Merril C, Lipkin L, Van Keuren M, Oertel W, ShapiroB, Wade M, Schultz M, Smith E (1979) Software aids for theanalysis of 2D gel electrophoresis images. Comput Biomed Res12:517–524
19. Hollingsworth BV, Reichenbach SE, Tao QP, Visvanathan A(2006) Comparative visualization for comprehensive two-dimensional gas chromatography. J Chromatogr A 1105:51–58
20. Reichenbach SE, Ni MT, Kottapalli V, Visvanathan A (2004)Information technologies for comprehensive two-dimensional gaschromatography. Chemom Intell Lab Syst 71:107–120
21. Croteau R, Alonso WR, Koepp AE, Johnson MA (1994) Biosyn-thesis of monoterpenes—partial-purification, characterization, andmechanism of action of 1,8-cineole synthase. Arch Biochem Bio-phys 309:184–192
22. ObengOfori D, Reichmuth CH, Bekele J, Hassanali A (1997)Biological activity of 1,8 cineole, a major component of essential
oil of Ocimum kenyense (Ayobangira) against stored product bee-tles. J Appl Entomol 121:237–243
23. Duisken M, Sandner F, Blomeke B, Hollender J (2005) Metabo-lism of 1.8-cineole by human cytochrome P450 enzymes: identi-fication of a new hydroxylated metabolite. Biochim Biophys Acta,Gen Subj 1722:304–311
24. Carman RM, Robinson WT, Wallis CJ (2005) The 3-hydroxycineoles. Austr J Chem 58:785–791
25. Schmidt S, Walter GH, Moore CJ (2000) Host plant adaptations inmyrtaceous-feeding Pergid sawflies: essential oils and the mor-phology and behaviour of Pergagrapta larvae (Hymenoptera,Symphyta, Pergidae). Biol Linn Soc 70:15–26
26. Fletcher MT, Lowe LM, Kitching W, Konig WA (2000) Chemistryof Leichhardt's grasshopper, Petasida ephippigera, and its hostplants, Pityrodia jamesii, P. ternifolia, and P. pungens. J ChemEcol 26:2275–2290
27. Carman RM, Klika KD (1992) Partially racemic compounds asbrushtail possum urinary metabolites. Austr J Chem 45:651–657
28. Southwell IA, Maddox CDA, Zalucki MP (1995) Metabolism of1,8-cineole in tea tree (Melaleuca alternifolia andMelaleuca linar-iifolia) by pyrgo beetle (Paropsisterna tigrina). J Chem Ecol21:439–453
29. Maffei M, Chialva F, Sacco T (1989) Glandular trichomes andessential oils in developing peppermint leaves. New Phytol111:707–716
30. Duetz WA, Fjallman AHM, Ren SY, Jourdat C, Witholt B (2001)Biotransformation of D-limonene to (+) trans-carveol by toluene-grown Rhodococcus opacus PWD4 cells. Appl Environ Microbiol67:2829–2832
31. Krings U, Berger RG (2010) Terpene bioconversion—how does itsfuture look? Nat Prod Comm 5:1507–1522
32. Duetz WA, Bouwmeester H, van Beilen JB, Witholt B (2003)Biotransformation of limonene by bacteria, fungi, yeasts, andplants. Appl Microbiol Biotechnol 61:269–277
33. Abraham WR, Hoffmann HMR, Kieslich K, Reng G, Stumpf B(1985) Microbial transformations of some monoterpenoids andsesquiterpenoids. Ciba Found Symp 111:146–160
34. Bicas JL, Fontanille P, Pastore GM, Larroche C (2008) Character-ization of monoterpene biotransformation in two pseudomonads. JAppl Microbiol 105:1991–2001
35. Dillon RJ, Dillon VM (2004) The gut bacteria of insects: non-pathogenic interactions. Annu Rev Entomol 49:71–92
36. Shi WB, Syrenne R, Sun JZ, Yuan JS (2010) Molecularapproaches to study the insect gut symbiotic microbiota at the‘omics’ age. Insect Sci 17:199–219
37. Brune A, Miambi E, Breznak JA (1995) Roles of oxygen and theintestinal microflora in the metabolism of lignin-derived phenyl-propanoids and other monoaromatic compounds by termites. ApplEnviron Microbiol 61:2688–2695
38. Koliopoulos G, Pitarokili D, Kioulos E, Michaelakis A, Tzakou O(2010) Chemical composition and larvicidal evaluation of Mentha,Salvia, and Melissa essential oils against the West Nile virusmosquito Culex pipiens. Parasitol Res 107:327–335
39. Duschatzky CB, Martinez AN, Almeida NV, Bonivardo SL (2004)Nematicidal activity of the essential oils of several Argentinaplants against the root-knot nematode. J Essent Oil Res 16:626–628
1952 C. Cordero et al.