na1onal broadband baseline survey & infrastructure blueprint
TRANSCRIPT
Na$onalBroadbandBaselineSurvey&InfrastructureBlueprint
1
Table of Contents 1. Introduction ......................................................................................................................................................12. The MoICT&NG GIS Portal ................................................................................................................................33. PESTLE & SWOT Analysis ...............................................................................................................................10
3.1.Political Aspects ........................................................................................................................................................103.2.Economic Aspects .....................................................................................................................................................123.3.Social, technological & environmental aspects .......................................................................................................153.4.Legal Aspects .............................................................................................................................................................163.5.Conclusion .................................................................................................................................................................18
4. Benchmarking Uganda’s Broadband Value Chain ........................................................................................194.1.Content Rights in Uganda ..........................................................................................................................................214.2.Online Services in Uganda ........................................................................................................................................234.3.Enabling Technologies & Services in Uganda ...........................................................................................................264.4.Connectivity ...............................................................................................................................................................30
4.4.1.First Mile: International Connectivity ...........................................................................................................314.4.2.Middle Mile: National Backbone .................................................................................................................324.4.3.Last Mile ....................................................................................................................................................334.4.4.Cost of mobile broadband .........................................................................................................................34
4.5.User Interface ............................................................................................................................................................364.6.Demand for Broadband .............................................................................................................................................374.7.Broadband Value Chain Conclusion ..........................................................................................................................38
5. Broadband Policies & Strategies ...................................................................................................................395.1.Foundational Policies and Strategies .......................................................................................................................395.2.Policies that provide high level guidance .................................................................................................................395.3.Subject Specific Policies & Strategies ......................................................................................................................405.4.Broadband Policy Recommendations .......................................................................................................................45
6. Institutional Arrangements ............................................................................................................................486.1.Oversight function .....................................................................................................................................................496.2.Policy Formulation and Coordination ........................................................................................................................506.3.Policy implementation ...............................................................................................................................................536.4.Recommendations .....................................................................................................................................................55
7. Laws, Regulations and other Regulatory Instruments .................................................................................577.1.The Uganda Communications Act, 2013 ...................................................................................................................57
7.1.1.Licensing and Market Structure .................................................................................................................587.1.2.Fair Competition ........................................................................................................................................597.1.3.Interconnection, Roaming, and Sharing of Facilities ....................................................................................597.1.4.Rights of Way to Land ................................................................................................................................617.1.5.Spectrum ...................................................................................................................................................637.1.6.Universal Service ........................................................................................................................................647.1.7.Consumer Protection .................................................................................................................................647.1.8.Type Approval ............................................................................................................................................657.1.9.Tariffs .........................................................................................................................................................657.1.10.Numbering ...............................................................................................................................................65
7.2.National Information Technology Authority, Uganda Act, 2009 ................................................................................657.3.Electronic Transactions Act, 2011 .............................................................................................................................667.4.Electronic Signatures Act, 2011 ................................................................................................................................677.5.Computer Misuse Act, 2011 ......................................................................................................................................677.6.Access to Information Act, 2005 ...............................................................................................................................677.7.Data Protection and Privacy Act, 2019 .....................................................................................................................677.8.Content .......................................................................................................................................................................687.9.Interception and Monitoring .....................................................................................................................................697.10.Critical Infrastructure ..............................................................................................................................................707.11.Recommendations ...................................................................................................................................................70
8. Spectrum Management .................................................................................................................................74
2
8.1.The UCC Frequency Table ..........................................................................................................................................758.2.Detailed comments on frequency allocation table ...................................................................................................77
8.2.1.Low band (0 to 1 GHz) ...............................................................................................................................778.2.2.Mid band (1 GHz to 6 GHz) ........................................................................................................................788.2.3.High band (Greater than 6 GHz) .................................................................................................................818.2.4.Recommendations .....................................................................................................................................83
8.3.Best practices in emerging spectrum management ................................................................................................848.3.1.United States (Americas) ............................................................................................................................848.3.2.United Kingdom (Europe) ...........................................................................................................................858.3.3.New Zealand (Australasia) ..........................................................................................................................868.3.4.South Africa (Africa) ...................................................................................................................................878.3.5.South Korea (East Asia) .............................................................................................................................88
8.4.Notable achievements related to spectrum access in Africa ..................................................................................898.5.Spectrum auctions in Africa ......................................................................................................................................90
8.5.1.Kenya ........................................................................................................................................................918.5.2.Nigeria .......................................................................................................................................................918.5.3.Mozambique ..............................................................................................................................................928.5.4.South Africa ...............................................................................................................................................928.5.5.Ghana ........................................................................................................................................................938.5.6.Senegal .....................................................................................................................................................938.5.7.Tanzania ....................................................................................................................................................938.5.8.Angola .......................................................................................................................................................948.5.9.Botswana ..................................................................................................................................................948.5.10.Lessons learned and recommendations ...................................................................................................94
8.6.Assessing impact of alternative broadband access models ...................................................................................958.6.1.Dynamic spectrum access .........................................................................................................................978.6.2.Current TVWS regulation ..........................................................................................................................1008.6.3.License-exempt spectrum .......................................................................................................................101
8.7.Current standards ....................................................................................................................................................1018.7.1.Band 2.4 GHz (2400 – 2483.5 MHz) ........................................................................................................1018.7.2.Band 5 GHz (5150 – 5855 MHz) ..............................................................................................................1028.7.3.Band 6 GHz (5925 – 7125 MHz) ..............................................................................................................1028.7.4.Band 17 GHz (17.1 – 17.3 GHz) ..............................................................................................................1038.7.5.Band 24 GHz (24.0 – 24.25 GHz) ............................................................................................................1038.7.6.V-Band 60 GHz (57 – 66 GHz) .................................................................................................................103
8.8.Economic arguments ...............................................................................................................................................1048.9.Community networks ..............................................................................................................................................1058.10.Low-earth orbit platforms and high-altitude platform systems .........................................................................1078.11.Recommendations .................................................................................................................................................108
9. Broadband Blueprint ....................................................................................................................................1109.1.Broadband Demand .................................................................................................................................................1149.2.Expanding Mobile Broadband Coverage .................................................................................................................1169.3.Expanding Fibre Routes to connect all district capitals ........................................................................................1199.4.Ten Year Investment Plan ........................................................................................................................................1239.5.Economic Impact of the 10-Year investment plan .................................................................................................124
10.Conclusions .................................................................................................................................................12511.References ...................................................................................................................................................12812.Appendix ......................................................................................................................................................132
12.1.List of ISPs in Uganda ...........................................................................................................................................13212.2.Cost for UXIP services ...........................................................................................................................................13312.3.List or RAN Site Interventions ...............................................................................................................................13412.4.List or Fibre Route Interventions ..........................................................................................................................15012.5.Detailed comments on Frequency Allocation Table .............................................................................................15312.6.Community Networks: Global, Regional, and National Recognition ....................................................................157
12.6.1.Global Recognition .................................................................................................................................15712.6.2.Regional Recognition .............................................................................................................................15712.6.3.National Recognition..............................................................................................................................158
3
List of Tables Table 1: ICT Sector taxes in Uganda ............................................................................................................10Table 2: ICT Sector tax and excise duty revenues ........................................................................................11Table 3: Impact of 10% higher broadband penetration of GDP growth and taxation .....................................11Table 4: Simulation of the impact of dropping the Excise duty on airtime .....................................................12Table 5: Gross domestic product by economic activity Current prices (billion shillings) .................................13Table 6: Impact of a 10-Percent Increase in Mobile Broadband Penetration on GDP Growth .......................14Table 7: Effect of a 10-percent Increase in Mobile Broadband Penetration on Selected African Economies ..14Table 8: Uganda Panel data survey 2019/20 - Individual Characteristics ......................................................16Table 9: Uganda Panel data survey 2019/20 - Household Characteristics ....................................................16Table 10: Different institutions and laws shaping the Internet Value Chain ....................................................20Table 11: Performance in ICT Regulatory Outlook ........................................................................................21Table 12: Performance in e-government index in the United Nations E-Government Survey ........................24Table 13: Performance in e-Participation index in the United Nations E-Government Survey ........................25Table 14: Secure Internet servers (per 1 million people) ................................................................................26Table 15: Electronic Banking in Uganda .......................................................................................................26Table 16: Mobile money transactions Trends ................................................................................................27Table 17: Performance in Mobile Money Regulatory INDEX (2020) ...............................................................28Table 18: estimated Facebook users in uganda in 2021 ...............................................................................29Table 19: Used international bandwidth .......................................................................................................32Table 20: National fibre routes ......................................................................................................................32Table 21: Number of IXPs and Data Centres ................................................................................................33Table 22: Last mile KPI’s ..............................................................................................................................34Table 23: MTN Uganda Operating expenses breakdown (Rm) .....................................................................35Table 24:MTN Cost per GB .........................................................................................................................35Table 25: MTN’s operations compared. .......................................................................................................36Table 26: MTN Key performance indicators foR MTN Q4 2020 ....................................................................37Table 27: Summary of Broadband Value Chain Benchmarking .....................................................................38Table 28: Link of Uganda’s ICT policies to the Broadband Value Chain ........................................................41Table 29: Policy Outputs and gaps ..............................................................................................................42Table 30: Broadband Policy Recommendations ...........................................................................................46Table 31: institutions responsible for policy formulation and co-ordination ....................................................51Table 32:Summary of Recommendations ....................................................................................................55Table 33: Summary of Legal and regulatory Recommendations ...................................................................71Table 34: example for 890-942 MHz Allocation ............................................................................................75Table 35: South Africa’s Spectrum Table structure .......................................................................................75Table 36: Current IMT allocations in Region 1 ..............................................................................................76Table 37: Region 1 Low band ITU spectrum allocations for the UHF band ...................................................78Table 38: Region 1 Mid band ITU spectrum allocations for the L-Band ........................................................79Table 39: Region 1 Mid band ITU spectrum allocations for the S-Band ........................................................80Table 40: Region 1 Mid band ITU spectrum allocations for the C-Band ........................................................81Table 41: Region 1 High band ITU spectrum allocations ..............................................................................83Table 42: Summary of Shared Access License bands ..................................................................................85Table 43: Matching technology to population density in Uganda ..................................................................99
4
Table 44 Original and new names for Wi-Fi technologies ............................................................................101Table 45: Summary recommendations .......................................................................................................108Table 46: Broadband Blueprint: expanding mobile broadband coverage ....................................................111Table 47: Broadband Blueprint: Improving the broadband ecosystem ........................................................111Table 48: Broadband Demand ...................................................................................................................114Table 49:Revenues of MTN Uganda ...........................................................................................................115Table 50:Revenues of Airtel Uganda ..........................................................................................................115Table 51: 4G Rollout and Impact ................................................................................................................118Table 52: Impact of proposed fibre interventions ........................................................................................122Table 53: 10—Year Investment plan ...........................................................................................................123Table 54: Expected increase in broadband penetration ..............................................................................124Table 55: Effect of a 9-percent Increase in Mobile Broadband Penetration .................................................124Table 56: Broadband Blueprint..................................................................................................................126
5
List of Figures Figure 1: UBP -Broadband stats by admin boundaries ..................................................................................4Figure 2: UBP RAN site Interventions for Uganda ..........................................................................................5Figure 3: UBP -Impact of RAN site Interventions ............................................................................................6Figure 4: UBP -New Fibre link Interventions ...................................................................................................7Figure 5: UBP -Impact of New Fibre link Interventions ....................................................................................7Figure 6: Uganda Broadband Portal (UBP) -Broadband map of Uganda ........................................................8Figure 7: UBP -Sub-County level Broadband statistics ..................................................................................8Figure 8: UBP -Sub-County level intervention planning ..................................................................................8Figure 9: UBP -Intervention list for new RAN sites ..........................................................................................9Figure 10: UBP Intervention list for Fibre Routes ............................................................................................9Figure 11: Easing of ICT sector specific taxes to boost the economy ...........................................................15Figure 12: Broadband Value Chain ...............................................................................................................19Figure 13: Internet use in Uganda (UNHS 2019/2020) .................................................................................22Figure 14: Approach to the analysis of the Connectivity segment of the Internet Value Chain .......................30Figure 15: Operational (blue) and planned (red) FIbre routes and 4G coverage (Sources UCC) .....................31Figure 16: A rationalized institutional framework for Uganda’s broadband ecosystem ..................................49Figure 17: Spectrum access approaches .....................................................................................................97Figure 18: Cost comparison of technologies2 ..............................................................................................98Figure 19: Matching population density to the most cost-effective technology2 ...........................................98Figure 20: Matching population density to technology Zone A ...................................................................100Figure 21: New Proposed RAN sites ..........................................................................................................116Figure 22: Example of a New RAN sitE ......................................................................................................117Figure 23: Cost parameters for new RAN Sites ..........................................................................................117Figure 24: Existing and planned fibre .........................................................................................................119Figure 25: Example of fibre to district capitals following the road network ..................................................120Figure 26: second Example of fibre connecting to district capitals .............................................................120Figure 27: Cost of rural fibre rollout ............................................................................................................121Figure 28: Comparing expected tax revenues to cost of investment..........................................................124
6
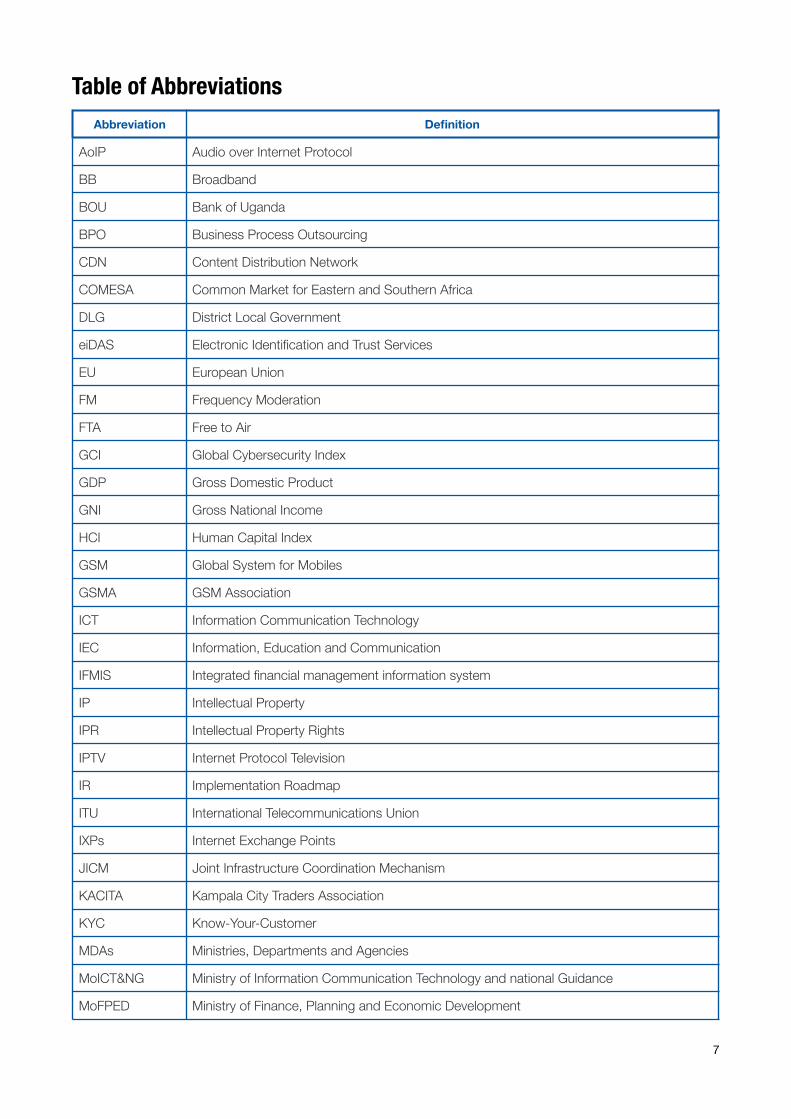
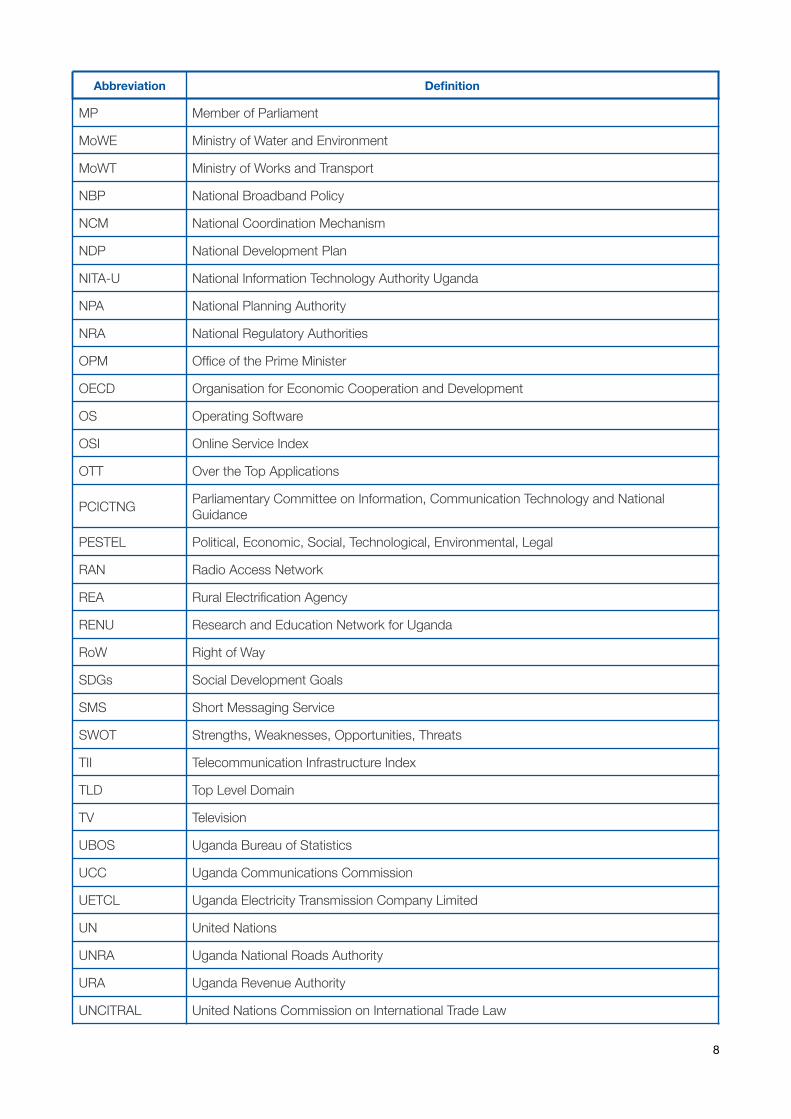
Table of Abbreviations Abbreviation Definition
AoIP Audio over Internet Protocol
BB Broadband
BOU Bank of Uganda
BPO Business Process Outsourcing
CDN Content Distribution Network
COMESA Common Market for Eastern and Southern Africa
DLG District Local Government
eiDAS Electronic Identification and Trust Services
EU European Union
FM Frequency Moderation
FTA Free to Air
GCI Global Cybersecurity Index
GDP Gross Domestic Product
GNI Gross National Income
HCI Human Capital Index
GSM Global System for Mobiles
GSMA GSM Association
ICT Information Communication Technology
IEC Information, Education and Communication
IFMIS Integrated financial management information system
IP Intellectual Property
IPR Intellectual Property Rights
IPTV Internet Protocol Television
IR Implementation Roadmap
ITU International Telecommunications Union
IXPs Internet Exchange Points
JICM Joint Infrastructure Coordination Mechanism
KACITA Kampala City Traders Association
KYC Know-Your-Customer
MDAs Ministries, Departments and Agencies
MoICT&NG Ministry of Information Communication Technology and national Guidance
MoFPED Ministry of Finance, Planning and Economic Development
7
MP Member of Parliament
MoWE Ministry of Water and Environment
MoWT Ministry of Works and Transport
NBP National Broadband Policy
NCM National Coordination Mechanism
NDP National Development Plan
NITA-U National Information Technology Authority Uganda
NPA National Planning Authority
NRA National Regulatory Authorities
OPM Office of the Prime Minister
OECD Organisation for Economic Cooperation and Development
OS Operating Software
OSI Online Service Index
OTT Over the Top Applications
PCICTNG Parliamentary Committee on Information, Communication Technology and National Guidance
PESTEL Political, Economic, Social, Technological, Environmental, Legal
RAN Radio Access Network
REA Rural Electrification Agency
RENU Research and Education Network for Uganda
RoW Right of Way
SDGs Social Development Goals
SMS Short Messaging Service
SWOT Strengths, Weaknesses, Opportunities, Threats
TII Telecommunication Infrastructure Index
TLD Top Level Domain
TV Television
UBOS Uganda Bureau of Statistics
UCC Uganda Communications Commission
UETCL Uganda Electricity Transmission Company Limited
UN United Nations
UNRA Uganda National Roads Authority
URA Uganda Revenue Authority
UNCITRAL United Nations Commission on International Trade Law
Abbreviation Definition
8
VAT Value added tax
VoD Video on Demand
VSAT Very-small-aperture terminal
WG Working Group
WDI World Development Indicators
Abbreviation Definition
9
Executive Summary The main objectives of this study was to establish the national broadband baseline and to subsequently develop a 10-year National Broadband Infrastructure Blueprint (2022-2032). This study, commissioned by the Ministry of ICT and National Guidance (MoICT&NG), was funded through the World Bank’s Regional Communications Infrastructure Program (RCIP).
Under the third National Development Plan (2020/21 – 2024/25) (NDPIII), Uganda has adopted a quasi-market approach in which “government needs to increase efficient and planned participation in the economy in order to direct development”. The National Broadband Infrastructure Blueprint will provide MoICT&NG, its agencies, and private and public sector stakeholders with a consistent and known framework for policy, regulation, planning, deployment, and management of broadband infrastructure including spectrum. A clear and consistent framework will be a major step in actualizing the aspirations of the Digital Uganda Vision (2021) that include improved global competitiveness and attracting investments to enable universal access to broadband.
The study was framed in terms of the broadband value chain, enabling a more granular examination of what is at play at each stage of the value chain. This approach makes it easier to link gaps and weak links in the value chain to the broadband ecosystem so that better policy, institutional arrangements, laws and regulations can be designed. Using a consistent value chain approach also means that Uganda’s current status can be benchmarked against other countries. Countries that employ best practice in parts of the value chain and ecosystem become points of reference as Uganda looks to refine its approach to broadband.
Uganda’s economy has been negatively affected by the COVID-19 pandemic with lower production and consumption, and a reduction in remittances. The COVID-19 pandemic, however, highlighted the importance of the ICT sector and demonstrated the efficiency gains that digitalization of work processes can bring. What sets the ICT sector apart is its role as an economic enabler. ICT processes can bring efficiencies to all other sectors of the economy, ranging from mining to e-Government. Greater broadband penetration and use is linked to increased productivity, employment and economic growth.
Uganda urgently needs investment in order to drive digital transformation across all facets of the economy. Investment requirements in Uganda range from better access to broadband infrastructure to cheaper smartphones to data centres. Because of the need for an increase in locally stored content and service provisioning with less reliance on out-of-country core services and related third parties, infrastructure planning is a critical piece of the broadband superstructure to allow online services to remain available in the event of Internet blackouts.
The Baseline The First Mile, international connectivity to neighbouring countries, is adequate. Used International bandwidth however lags leading countries in the region, pointing to significant opportunity for growth in Uganda. Bandwidth usage is driven by content providers and Internet backbone providers. Achieving parity with countries like Kenya will require releasing Uganda from the inhibiting factors identified in this study.
The Middle Mile, comprising the key elements of national backbones, internet exchange points (IXPs), content distribution network (CDN) caches, and data centres, still has a lot of limitations. While fibre routes are an important indicator, access to fibre nodes (where users can be
10
connected) is limited, with only 29% of the population living within 10km of such nodes. Uganda has only one IXP and one carrier neutral data centre. Raxio Data Centre is Uganda’s first Tier-III carrier-neutral data centre. Investment in national fibre routes and increased fibre node density will improve Middle Mile connectivity and support wider and faster Last Mile connectivity.
The Last Mile faces multiple challenges. Mobile broadband is cheap in absolute terms but not affordable in relative terms. Uganda is the 12th cheapest country for 300 MB and 1GB monthly usage out of 54 countries in Africa. However, expressed in terms of GNI per capita, Uganda only ranks 27th and 28th. Broadband adoption is low despite good broadband coverage and relatively fast download speeds. Various factors point to affordability as one of the main obstacles to wider broadband adoption.
Smartphone penetration is low. Only 30% of phones in Uganda are smartphones (UCC, June 2021). Smartphone penetration is impacted by affordability, availability of fast mobile broadband and ability to charge phones at home. Demand for broadband is limited, pointing to a high growth potential. MTN’s data for the financial year ending in December 2020 reveals that only a third of mobile subscribers are active data users. Mobile is still mostly a voice and SMS market and broadband services still have considerable growth potential.
The low rate of digitalization of the Uganda economy and government administration point to environmental considerations not being a top priority. Globally, there is increased advocacy for institutions to carry out environmentally friendly operations which has led to the increased use of digital transactions, such as paperless invoices leading ultimately towards a cashless economy. Other examples include a focus on energy efficient and environmentally conscious construction.
The challenge of cost It is important for the government to see the ICT sector as an engine for growth and not as a mechanism to extract taxes. Companies in the ICT sector in Uganda pay more taxes than companies from other sectors. Excise duties on airtime, value added services and mobile money all place a higher tax burden on the ICT sector relative to the rest of the economy. This distorts investment and slows down the digital transformation of the economy. A 10% increase in broadband adoption would mean higher GDP and more tax revenues for the state. A 10% higher broadband penetration could add up to USD 916 million in GDP and USD 108 million in taxes through productivity gains across all sectors. Dropping excise duties altogether combined with a 10% increase in broadband penetration would raise more revenues for the state and this does not even account for additional multiplier effects throughout the economy.
The ecosystem The number of policy documents that relate to the broadband value chain in Uganda is overwhelming, and not necessarily always consistent, making rationalization and consolidation urgent so that all stakeholders can refer to a single clear source that articulates policy. Where derived documents from the main one are generated, the linkage and the reason for such expansion should be clear. The Digital Uganda Vision is now the core reference document under Vision 2040, and most of the earlier policies, outside the need to evaluate and learn lessons from them, should be retired. Revisions should ensure that the National Strategy on 4IR and other key sectoral strategies and operational policies are parented by the Digital Uganda Vision. Competition, critical infrastructure, and rights-of-way for public utilities (including dig-once
11
requirements) are major national level policies that need to be developed/concluded and implemented urgently.
Alignment of policy objectives across government ministries is still a challenge that needs to be addressed. The most visible example raised by stakeholders relates to the efforts within MoICT&NG to reduce access costs to ICT goods and services for users; and running counter to this, action from the Ministry of Finance and Economic Planning to raise more revenue by imposing more or higher taxes on ICT goods and services.
There is need for better coordination and collaborative approaches among the institutions that set direction and provide policy and operational oversight in the sector, and to ensure that the perennial underfunding compounded by high taxation across the ICT sector is addressed. To create a unity of purpose, the MoICT&NG may need an internal review to eliminate mission drift and ‘turf wars’ among its departments and agencies. The private sector is a key stakeholder and should be more routinely included in policy and strategy discussions. The MoICT&NG should also provide the lead in the periodic assessment of the broadband value chain, and its contribution to Uganda’s socioeconomic transformation.
One of the challenges MoICT&NG and all other arms and levels of government face is the shortage of competent human resources due to competition for such people from the private sector. Measures, such as remuneration outside the standard civil service pay structure, should be implemented in order to retain the professional competences required to capacitate and service MDAs’ transition to a fully-integrated e-government system that is citizen-centric. The absence of adequate competent human resource in the ICT arena is especially acute across other Ministries and District Local Governments (DLGs), the key points of delivery of e-services. The demands of the Parish-centric Socio-economic Development Model underscore the urgency of addressing this cross-cutting challenge.
While Uganda has gone a long way in establishing the legal and regulatory environment to support broadband penetration and adoption, a lot still needs to be done to address various disabling gaps and barriers. It is important to create a more flexible and easy licensing regime that allows for more innovation and competition especially in the services markets and in areas that are underserved. The establishment of an efficient and fair regulatory regime for obtaining rights-of-way in collaboration with all interested parties is also key. Sharing of facilities to reduce capex and opex and resultant end-user prices needs to be more effectively enforced. Intellectual property rights laws need to be reviewed keeping in mind the changes brought about by the broadband value chain, and matters such as artificial intelligence, and the importance of data, among others. Similarly, the legal and regulatory regimes that impact on the delicate balance of protecting rights of free speech and the surveillance mechanisms available, should be reviewed. Finally, cross-cutting laws that extend beyond the ICT sector to ensure a more holistic approach to establishing a good ecosystem should be promulgated as a matter of urgency. These include laws addressing competition; consumer protection; and critical infrastructure.
Spectrum Uganda, through the Uganda Communications Commission, has developed a new Frequency Allocation Table that is generally consistent with current international best practice. Moving ahead, it is important to provide an online version that is constantly kept up to date, and contains all key notes, references, and information to guide users. Allocating a healthy spectrum mix for different
12
applications creates opportunity for alternative approaches and technologies to ensure universal broadband access in different environments and different population densities. As an example, TVWS in the 470 to 694 MHz UHF band will also support the needs for coverage in low density rural areas for alternative access models such as wireless ISPs and community networks. In addition, spectrum for WiFi in the 6 GHz band will provide valuable capacity for already congested WiFi networks and allow offloading from congested mobile networks to WiFi networks. Guiding principles for spectrum allocation need to be established so that any approach used at any particular time ensures a balance among the desired outcomes of increasing broadband access at prices affordable to consumers; ensuring fair competition; eliminating hoarding; and ensuring efficient utilisation. It should be particularly noted that auctions designed to maximise state revenues risk serious harm to consumers
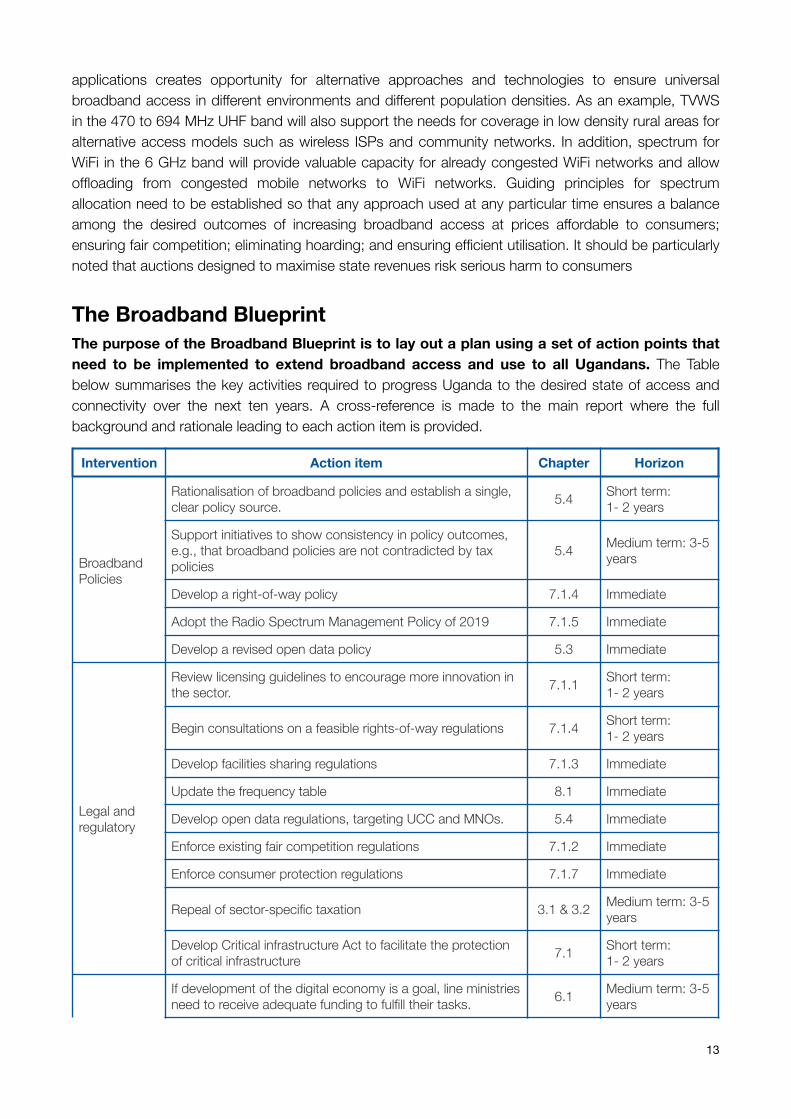
The Broadband Blueprint The purpose of the Broadband Blueprint is to lay out a plan using a set of action points that need to be implemented to extend broadband access and use to all Ugandans. The Table below summarises the key activities required to progress Uganda to the desired state of access and connectivity over the next ten years. A cross-reference is made to the main report where the full background and rationale leading to each action item is provided.
Intervention Action item Chapter Horizon
Broadband Policies
Rationalisation of broadband policies and establish a single, clear policy source. 5.4 Short term:
1- 2 years
Support initiatives to show consistency in policy outcomes, e.g., that broadband policies are not contradicted by tax policies
5.4 Medium term: 3-5 years
Develop a right-of-way policy 7.1.4 Immediate
Adopt the Radio Spectrum Management Policy of 2019 7.1.5 Immediate
Develop a revised open data policy 5.3 Immediate
Legal and regulatory
Review licensing guidelines to encourage more innovation in the sector. 7.1.1 Short term:
1- 2 years
Begin consultations on a feasible rights-of-way regulations 7.1.4 Short term: 1- 2 years
Develop facilities sharing regulations 7.1.3 Immediate
Update the frequency table 8.1 Immediate
Develop open data regulations, targeting UCC and MNOs. 5.4 Immediate
Enforce existing fair competition regulations 7.1.2 Immediate
Enforce consumer protection regulations 7.1.7 Immediate
Repeal of sector-specific taxation 3.1 & 3.2 Medium term: 3-5 years
Develop Critical infrastructure Act to facilitate the protection of critical infrastructure 7.1 Short term:
1- 2 years
If development of the digital economy is a goal, line ministries need to receive adequate funding to fulfill their tasks. 6.1 Medium term: 3-5
years
13
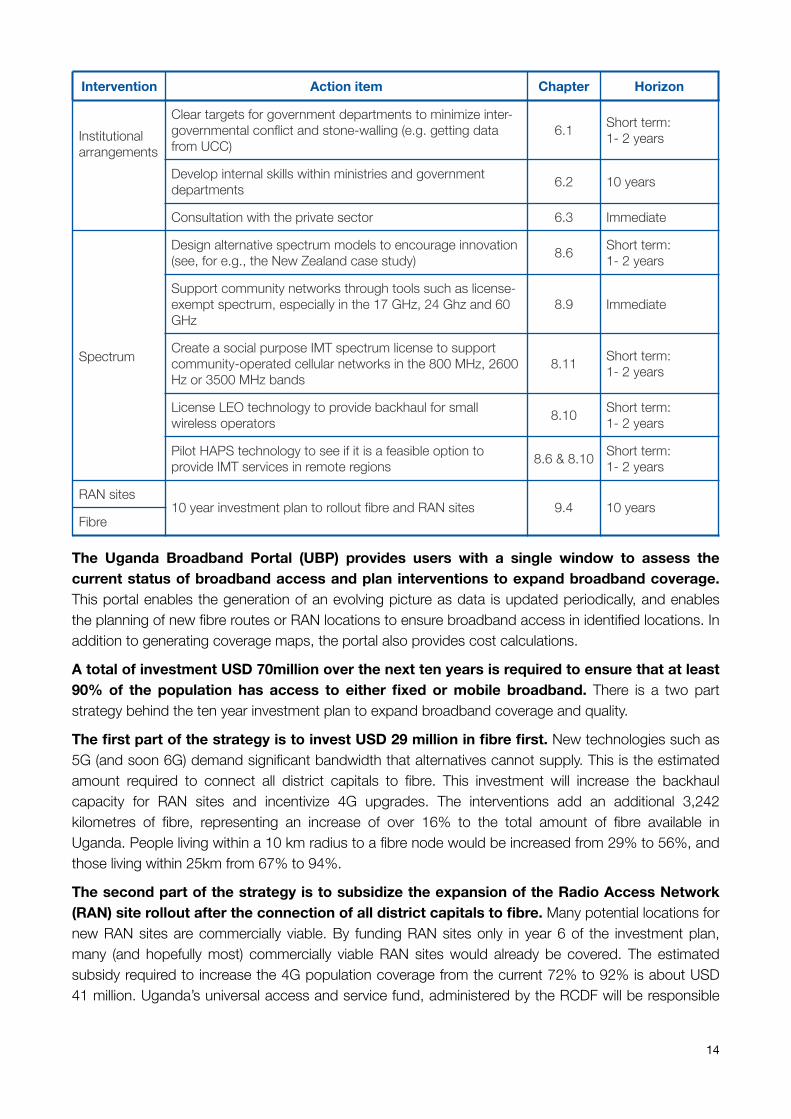
The Uganda Broadband Portal (UBP) provides users with a single window to assess the current status of broadband access and plan interventions to expand broadband coverage. This portal enables the generation of an evolving picture as data is updated periodically, and enables the planning of new fibre routes or RAN locations to ensure broadband access in identified locations. In addition to generating coverage maps, the portal also provides cost calculations.
A total of investment USD 70million over the next ten years is required to ensure that at least 90% of the population has access to either fixed or mobile broadband. There is a two part strategy behind the ten year investment plan to expand broadband coverage and quality.
The first part of the strategy is to invest USD 29 million in fibre first. New technologies such as 5G (and soon 6G) demand significant bandwidth that alternatives cannot supply. This is the estimated amount required to connect all district capitals to fibre. This investment will increase the backhaul capacity for RAN sites and incentivize 4G upgrades. The interventions add an additional 3,242 kilometres of fibre, representing an increase of over 16% to the total amount of fibre available in Uganda. People living within a 10 km radius to a fibre node would be increased from 29% to 56%, and those living within 25km from 67% to 94%.
The second part of the strategy is to subsidize the expansion of the Radio Access Network (RAN) site rollout after the connection of all district capitals to fibre. Many potential locations for new RAN sites are commercially viable. By funding RAN sites only in year 6 of the investment plan, many (and hopefully most) commercially viable RAN sites would already be covered. The estimated subsidy required to increase the 4G population coverage from the current 72% to 92% is about USD 41 million. Uganda’s universal access and service fund, administered by the RCDF will be responsible
Institutional arrangements
Clear targets for government departments to minimize inter-governmental conflict and stone-walling (e.g. getting data from UCC)
6.1 Short term: 1- 2 years
Develop internal skills within ministries and government departments 6.2 10 years
Consultation with the private sector 6.3 Immediate
Spectrum
Design alternative spectrum models to encourage innovation (see, for e.g., the New Zealand case study) 8.6 Short term:
1- 2 years
Support community networks through tools such as license-exempt spectrum, especially in the 17 GHz, 24 Ghz and 60 GHz
8.9 Immediate
Create a social purpose IMT spectrum license to support community-operated cellular networks in the 800 MHz, 2600 Hz or 3500 MHz bands
8.11 Short term: 1- 2 years
License LEO technology to provide backhaul for small wireless operators 8.10 Short term:
1- 2 years
Pilot HAPS technology to see if it is a feasible option to provide IMT services in remote regions 8.6 & 8.10 Short term:
1- 2 years
RAN sites 10 year investment plan to rollout fibre and RAN sites 9.4 10 years
Fibre
Intervention Action item Chapter Horizon
14

for this intervention. In total 503 new RAN sites would be subsidised, bringing 4G coverage to 9 million more Ugandans.
It is evident that Uganda has all the underpinning requirements for an inclusive fully digitalised economy, provided there is consistent and coordinated political will and leadership to deal with the remaining barriers and gaps highlighted in this Report. None of the gaps or challenges identified is insurmountable.
15
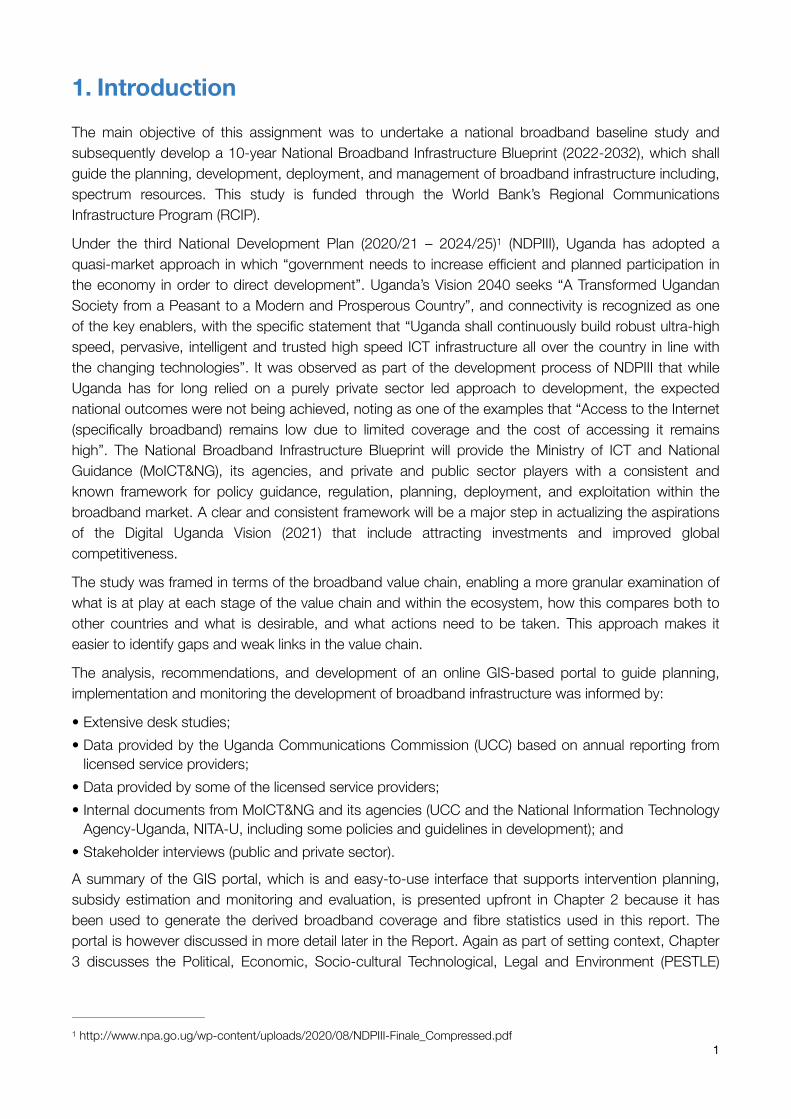
1. Introduction The main objective of this assignment was to undertake a national broadband baseline study and subsequently develop a 10-year National Broadband Infrastructure Blueprint (2022-2032), which shall guide the planning, development, deployment, and management of broadband infrastructure including, spectrum resources. This study is funded through the World Bank’s Regional Communications Infrastructure Program (RCIP).
Under the third National Development Plan (2020/21 – 2024/25) (NDPIII), Uganda has adopted a 1
quasi-market approach in which “government needs to increase efficient and planned participation in the economy in order to direct development”. Uganda’s Vision 2040 seeks “A Transformed Ugandan Society from a Peasant to a Modern and Prosperous Country”, and connectivity is recognized as one of the key enablers, with the specific statement that “Uganda shall continuously build robust ultra-high speed, pervasive, intelligent and trusted high speed ICT infrastructure all over the country in line with the changing technologies”. It was observed as part of the development process of NDPIII that while Uganda has for long relied on a purely private sector led approach to development, the expected national outcomes were not being achieved, noting as one of the examples that “Access to the Internet (specifically broadband) remains low due to limited coverage and the cost of accessing it remains high”. The National Broadband Infrastructure Blueprint will provide the Ministry of ICT and National Guidance (MoICT&NG), its agencies, and private and public sector players with a consistent and known framework for policy guidance, regulation, planning, deployment, and exploitation within the broadband market. A clear and consistent framework will be a major step in actualizing the aspirations of the Digital Uganda Vision (2021) that include attracting investments and improved global competitiveness.
The study was framed in terms of the broadband value chain, enabling a more granular examination of what is at play at each stage of the value chain and within the ecosystem, how this compares both to other countries and what is desirable, and what actions need to be taken. This approach makes it easier to identify gaps and weak links in the value chain.
The analysis, recommendations, and development of an online GIS-based portal to guide planning, implementation and monitoring the development of broadband infrastructure was informed by:
• Extensive desk studies; • Data provided by the Uganda Communications Commission (UCC) based on annual reporting from
licensed service providers; • Data provided by some of the licensed service providers; • Internal documents from MoICT&NG and its agencies (UCC and the National Information Technology
Agency-Uganda, NITA-U, including some policies and guidelines in development); and • Stakeholder interviews (public and private sector).
A summary of the GIS portal, which is and easy-to-use interface that supports intervention planning, subsidy estimation and monitoring and evaluation, is presented upfront in Chapter 2 because it has been used to generate the derived broadband coverage and fibre statistics used in this report. The portal is however discussed in more detail later in the Report. Again as part of setting context, Chapter 3 discusses the Political, Economic, Socio-cultural Technological, Legal and Environment (PESTLE)
http://www.npa.go.ug/wp-content/uploads/2020/08/NDPIII-Finale_Compressed.pdf1
1
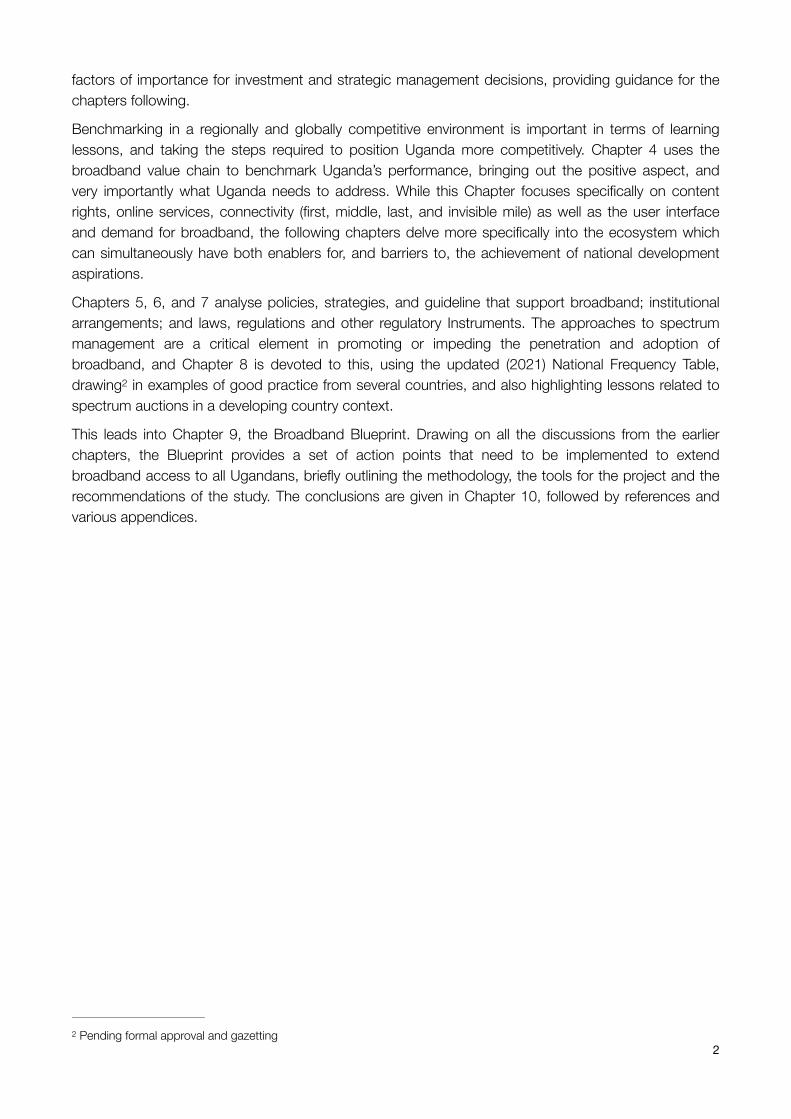
factors of importance for investment and strategic management decisions, providing guidance for the chapters following.
Benchmarking in a regionally and globally competitive environment is important in terms of learning lessons, and taking the steps required to position Uganda more competitively. Chapter 4 uses the broadband value chain to benchmark Uganda’s performance, bringing out the positive aspect, and very importantly what Uganda needs to address. While this Chapter focuses specifically on content rights, online services, connectivity (first, middle, last, and invisible mile) as well as the user interface and demand for broadband, the following chapters delve more specifically into the ecosystem which can simultaneously have both enablers for, and barriers to, the achievement of national development aspirations.
Chapters 5, 6, and 7 analyse policies, strategies, and guideline that support broadband; institutional arrangements; and laws, regulations and other regulatory Instruments. The approaches to spectrum management are a critical element in promoting or impeding the penetration and adoption of broadband, and Chapter 8 is devoted to this, using the updated (2021) National Frequency Table, drawing in examples of good practice from several countries, and also highlighting lessons related to 2
spectrum auctions in a developing country context.
This leads into Chapter 9, the Broadband Blueprint. Drawing on all the discussions from the earlier chapters, the Blueprint provides a set of action points that need to be implemented to extend broadband access to all Ugandans, briefly outlining the methodology, the tools for the project and the recommendations of the study. The conclusions are given in Chapter 10, followed by references and various appendices.
Pending formal approval and gazetting2
2
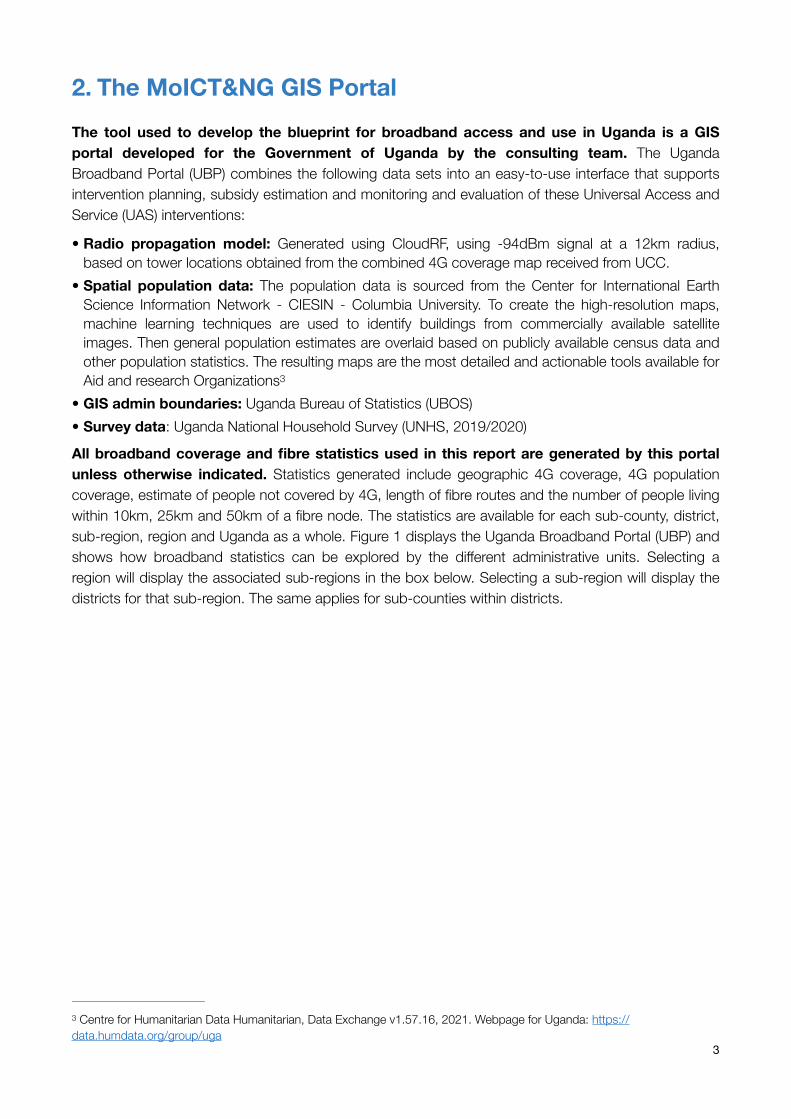
2. The MoICT&NG GIS Portal The tool used to develop the blueprint for broadband access and use in Uganda is a GIS portal developed for the Government of Uganda by the consulting team. The Uganda Broadband Portal (UBP) combines the following data sets into an easy-to-use interface that supports intervention planning, subsidy estimation and monitoring and evaluation of these Universal Access and Service (UAS) interventions:
• Radio propagation model: Generated using CloudRF, using -94dBm signal at a 12km radius, based on tower locations obtained from the combined 4G coverage map received from UCC.
• Spatial population data: The population data is sourced from the Center for International Earth Science Information Network - CIESIN - Columbia University. To create the high-resolution maps, machine learning techniques are used to identify buildings from commercially available satellite images. Then general population estimates are overlaid based on publicly available census data and other population statistics. The resulting maps are the most detailed and actionable tools available for Aid and research Organizations 3
• GIS admin boundaries: Uganda Bureau of Statistics (UBOS) • Survey data: Uganda National Household Survey (UNHS, 2019/2020)
All broadband coverage and fibre statistics used in this report are generated by this portal unless otherwise indicated. Statistics generated include geographic 4G coverage, 4G population coverage, estimate of people not covered by 4G, length of fibre routes and the number of people living within 10km, 25km and 50km of a fibre node. The statistics are available for each sub-county, district, sub-region, region and Uganda as a whole. Figure 1 displays the Uganda Broadband Portal (UBP) and shows how broadband statistics can be explored by the different administrative units. Selecting a region will display the associated sub-regions in the box below. Selecting a sub-region will display the districts for that sub-region. The same applies for sub-counties within districts.
Centre for Humanitarian Data Humanitarian, Data Exchange v1.57.16, 2021. Webpage for Uganda: https://3
data.humdata.org/group/uga 3
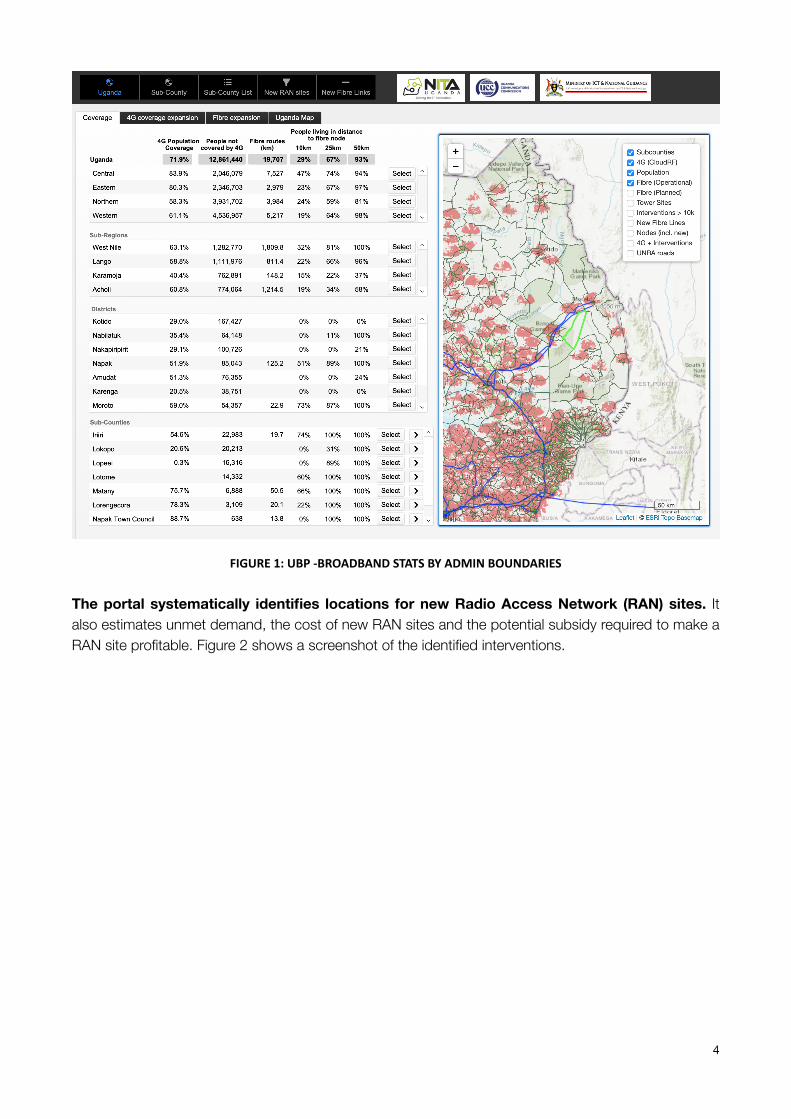
FIGURE1:UBP-BROADBANDSTATSBYADMINBOUNDARIES
The portal systematically identifies locations for new Radio Access Network (RAN) sites. It also estimates unmet demand, the cost of new RAN sites and the potential subsidy required to make a RAN site profitable. Figure 2 shows a screenshot of the identified interventions.
4
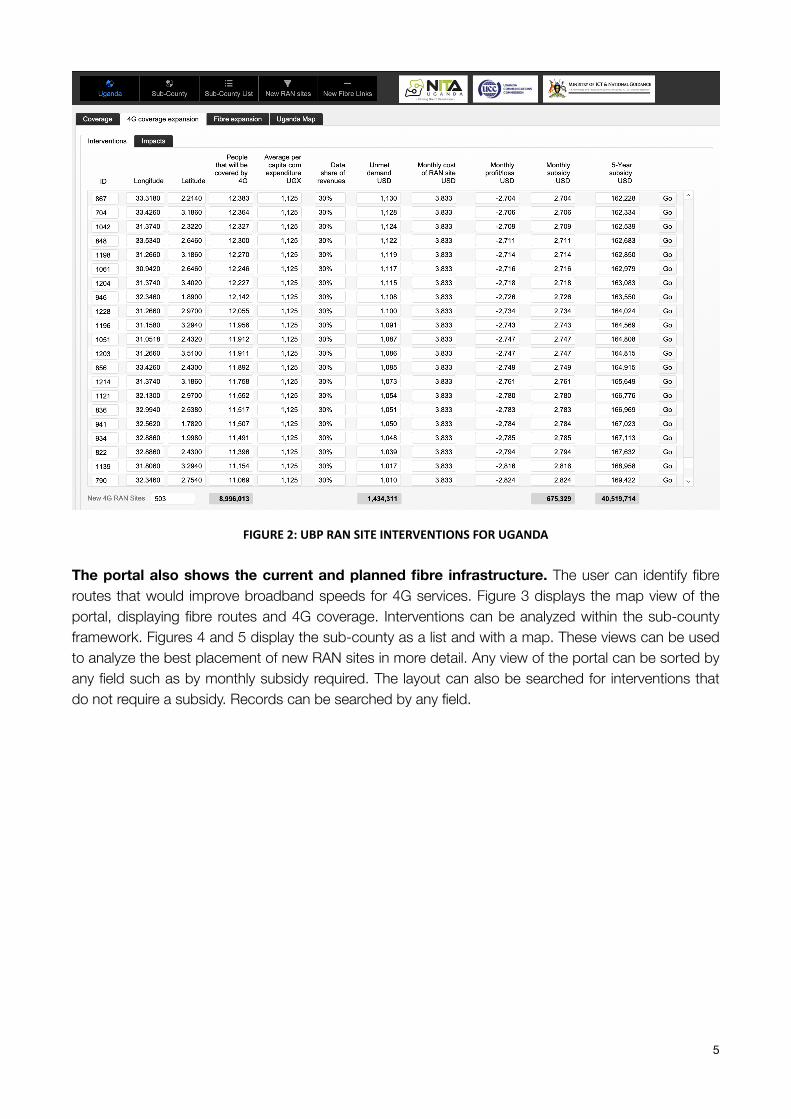
FIGURE2:UBPRANSITEINTERVENTIONSFORUGANDA
The portal also shows the current and planned fibre infrastructure. The user can identify fibre routes that would improve broadband speeds for 4G services. Figure 3 displays the map view of the portal, displaying fibre routes and 4G coverage. Interventions can be analyzed within the sub-county framework. Figures 4 and 5 display the sub-county as a list and with a map. These views can be used to analyze the best placement of new RAN sites in more detail. Any view of the portal can be sorted by any field such as by monthly subsidy required. The layout can also be searched for interventions that do not require a subsidy. Records can be searched by any field.
5
FIGURE3:UBP-IMPACTOFRANSITEINTERVENTIONS
6
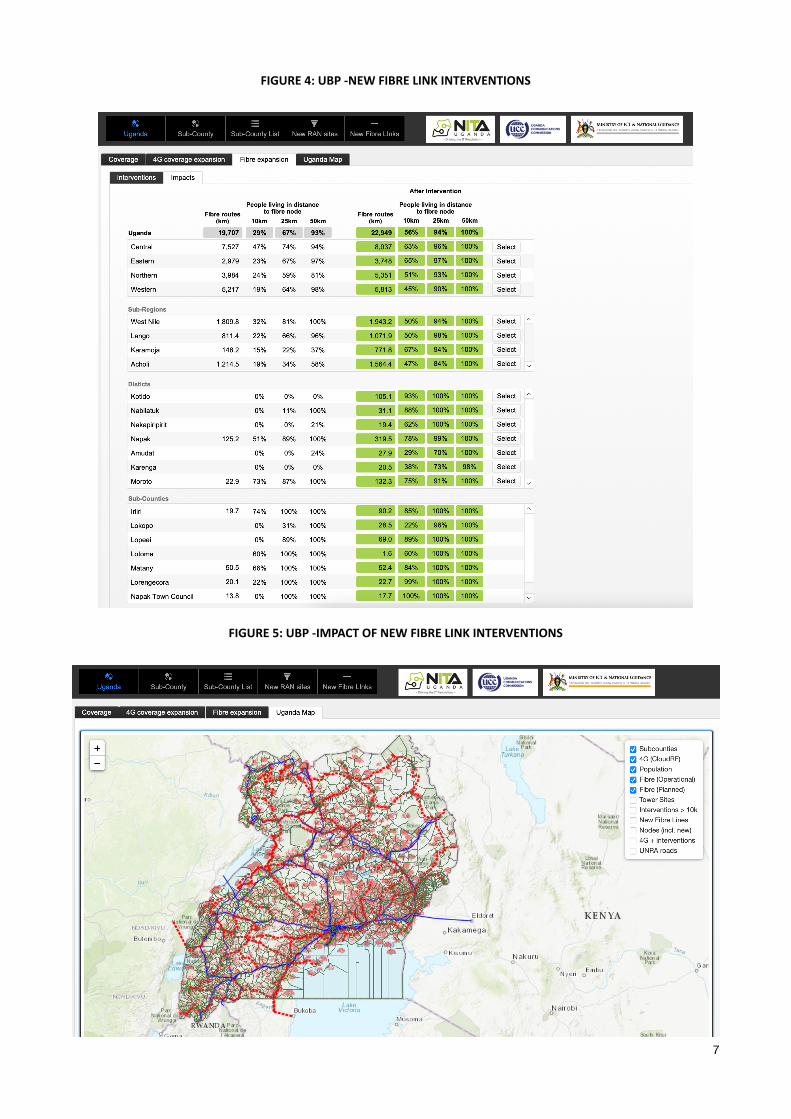
FIGURE4:UBP-NEWFIBRELINKINTERVENTIONS
FIGURE5:UBP-IMPACTOFNEWFIBRELINKINTERVENTIONS
7
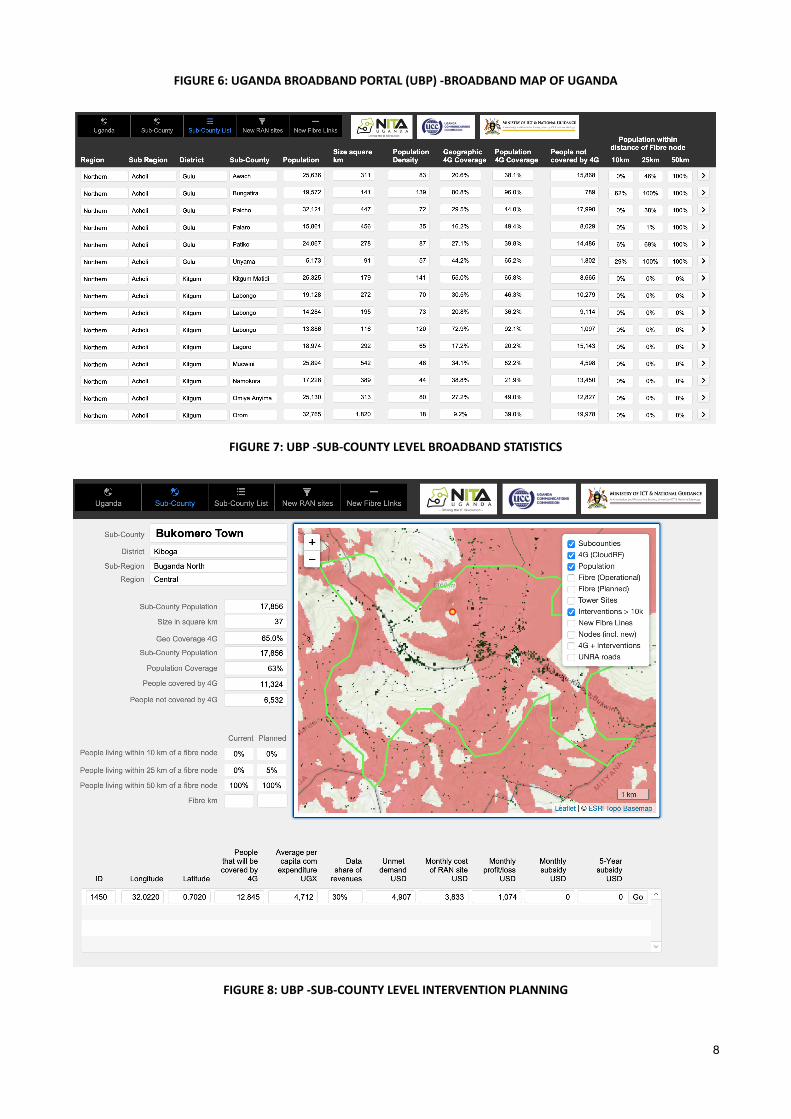
FIGURE6:UGANDABROADBANDPORTAL(UBP)-BROADBANDMAPOFUGANDA
FIGURE7:UBP-SUB-COUNTYLEVELBROADBANDSTATISTICS
FIGURE8:UBP-SUB-COUNTYLEVELINTERVENTIONPLANNING
8
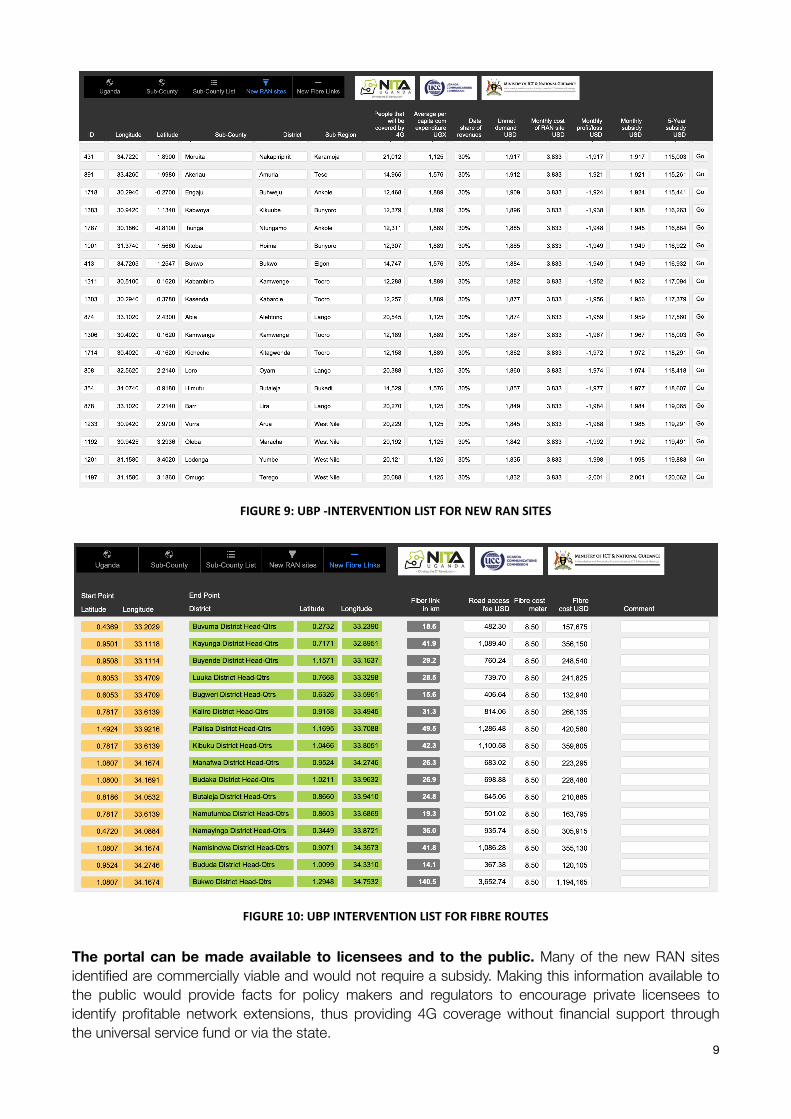
FIGURE9:UBP-INTERVENTIONLISTFORNEWRANSITES
FIGURE10:UBPINTERVENTIONLISTFORFIBREROUTES
The portal can be made available to licensees and to the public. Many of the new RAN sites identified are commercially viable and would not require a subsidy. Making this information available to the public would provide facts for policy makers and regulators to encourage private licensees to identify profitable network extensions, thus providing 4G coverage without financial support through the universal service fund or via the state.
9
3. PESTLE & SWOT Analysis The PESTLE framework analyses the Political, Economic, Socio-cultural Technological, Legal and Environmental factors of importance for investment and strategic management decisions. The PESTLE analysis is used in this chapter as a guide to the following chapters that will analyze the various components in more detail. SWOT stands for Strengths, Weaknesses, Opportunities and Threats. It is used as another lens on the analysis of the data in addition to the PESTLE framework.
3.1.Political Aspects
NDPIII identifies the ICT sector as a strategic pillar for economic growth. The Government of Uganda (GoU) developed the third National Development Plan (NDPIII), which focuses on leveraging both Government and private sector strengths for the socio-economic growth of the country. NDPIII lists the key pillars required to achieve its objectives. One of the key pillars is Information and Communications Technology (ICT), and Innovation. It is important to note that this is the first time the Government of Uganda has considered ICT as a program/key pillar in the national planning of the nation. Uganda’s ICT policies will be discussed in more detail in Chapter 5.
Uganda urgently needs investment in order to drive digital transformation across all facets of the economy. Because of the need for increased locally stored content and service provisioning with less reliance on out-of-country core services and related third parties, infrastructure planning is a critical piece of the broadband superstructure in order to allow for online services to continue running in the event of Internet blackouts.
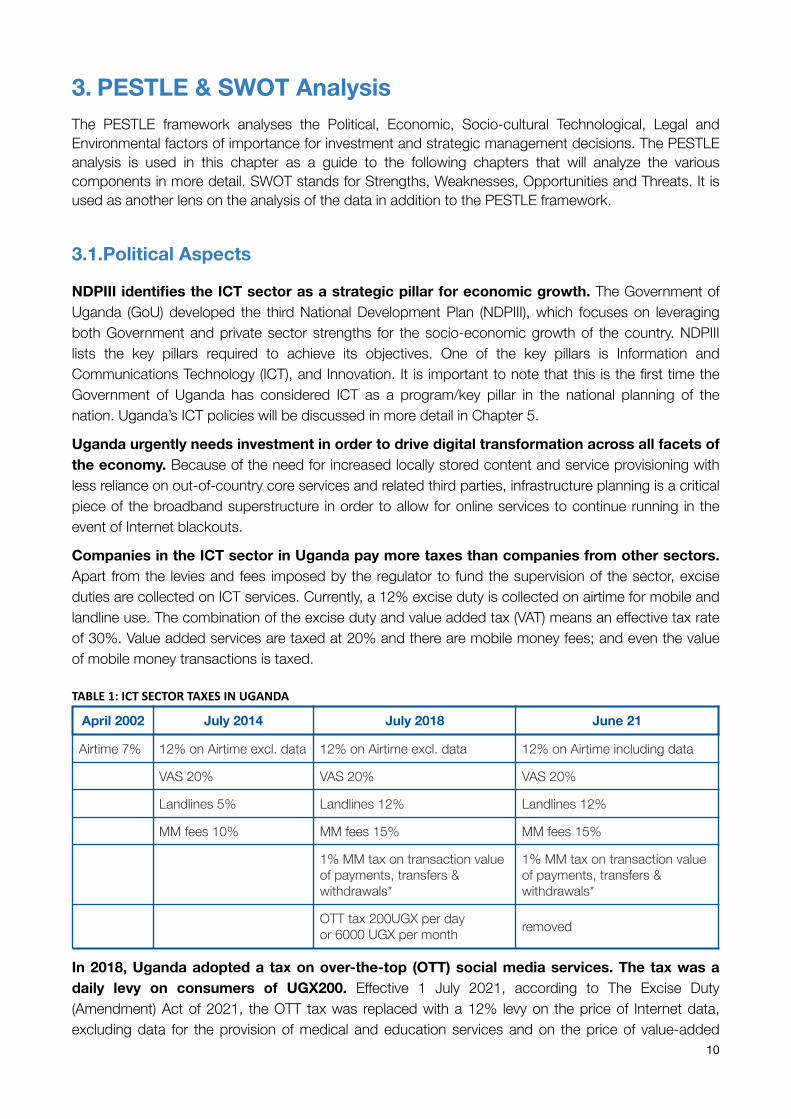
Companies in the ICT sector in Uganda pay more taxes than companies from other sectors. Apart from the levies and fees imposed by the regulator to fund the supervision of the sector, excise duties are collected on ICT services. Currently, a 12% excise duty is collected on airtime for mobile and landline use. The combination of the excise duty and value added tax (VAT) means an effective tax rate of 30%. Value added services are taxed at 20% and there are mobile money fees; and even the value of mobile money transactions is taxed.
TABLE1:ICTSECTORTAXESINUGANDA
In 2018, Uganda adopted a tax on over-the-top (OTT) social media services. The tax was a daily levy on consumers of UGX200. Effective 1 July 2021, according to The Excise Duty (Amendment) Act of 2021, the OTT tax was replaced with a 12% levy on the price of Internet data, excluding data for the provision of medical and education services and on the price of value-added
April 2002 July 2014 July 2018 June 21
Airtime 7% 12% on Airtime excl. data 12% on Airtime excl. data 12% on Airtime including data
VAS 20% VAS 20% VAS 20%
Landlines 5% Landlines 12% Landlines 12%
MM fees 10% MM fees 15% MM fees 15%
1% MM tax on transaction value of payments, transfers & withdrawals*
1% MM tax on transaction value of payments, transfers & withdrawals*
OTT tax 200UGX per day or 6000 UGX per month removed
10
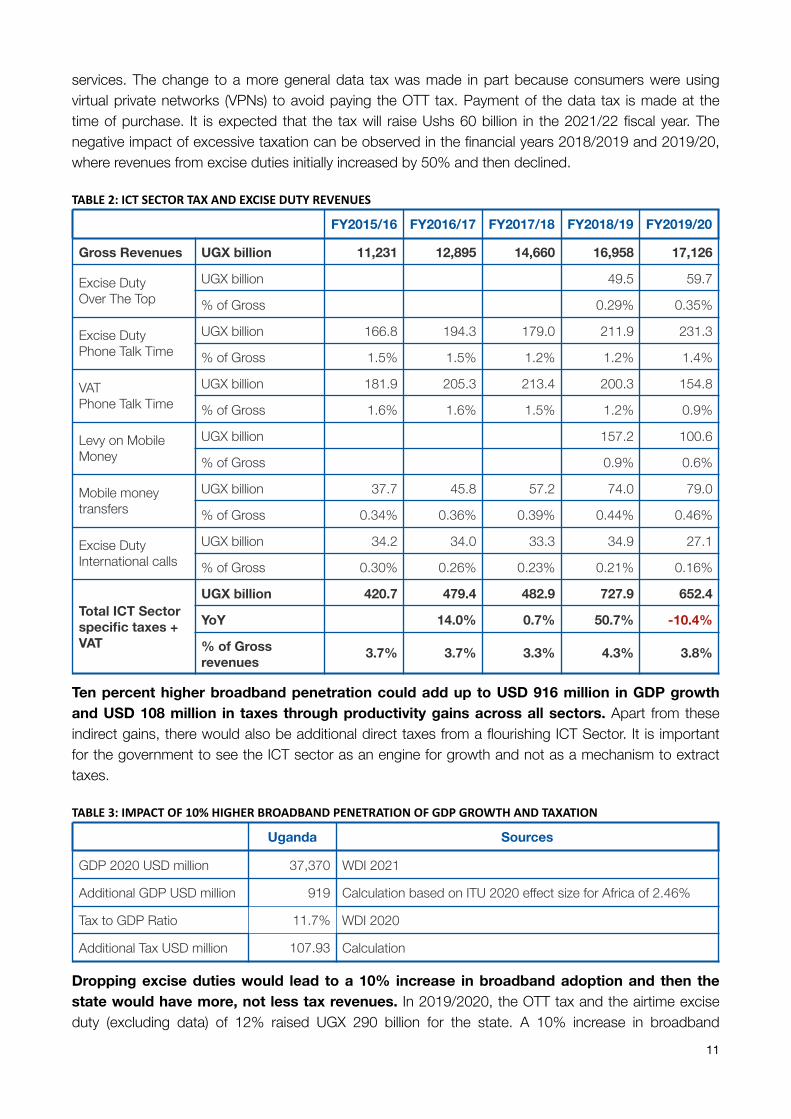
services. The change to a more general data tax was made in part because consumers were using virtual private networks (VPNs) to avoid paying the OTT tax. Payment of the data tax is made at the time of purchase. It is expected that the tax will raise Ushs 60 billion in the 2021/22 fiscal year. The negative impact of excessive taxation can be observed in the financial years 2018/2019 and 2019/20, where revenues from excise duties initially increased by 50% and then declined.
TABLE2:ICTSECTORTAXANDEXCISEDUTYREVENUES
Ten percent higher broadband penetration could add up to USD 916 million in GDP growth and USD 108 million in taxes through productivity gains across all sectors. Apart from these indirect gains, there would also be additional direct taxes from a flourishing ICT Sector. It is important for the government to see the ICT sector as an engine for growth and not as a mechanism to extract taxes.
TABLE3:IMPACTOF10%HIGHERBROADBANDPENETRATIONOFGDPGROWTHANDTAXATION
Dropping excise duties would lead to a 10% increase in broadband adoption and then the state would have more, not less tax revenues. In 2019/2020, the OTT tax and the airtime excise duty (excluding data) of 12% raised UGX 290 billion for the state. A 10% increase in broadband
FY2015/16 FY2016/17 FY2017/18 FY2018/19 FY2019/20
Gross Revenues UGX billion 11,231 12,895 14,660 16,958 17,126
Excise Duty Over The Top
UGX billion 49.5 59.7
% of Gross revenues
0.29% 0.35%
Excise Duty Phone Talk Time
UGX billion 166.8 194.3 179.0 211.9 231.3
% of Gross revenues
1.5% 1.5% 1.2% 1.2% 1.4%
VAT Phone Talk Time
UGX billion 181.9 205.3 213.4 200.3 154.8
% of Gross revenues
1.6% 1.6% 1.5% 1.2% 0.9%
Levy on Mobile Money
UGX billion 157.2 100.6
% of Gross revenues
0.9% 0.6%
Mobile money transfers
UGX billion 37.7 45.8 57.2 74.0 79.0
% of Gross revenues
0.34% 0.36% 0.39% 0.44% 0.46%
Excise Duty International calls
UGX billion 34.2 34.0 33.3 34.9 27.1
% of Gross revenues
0.30% 0.26% 0.23% 0.21% 0.16%
Total ICT Sector specific taxes + VAT
UGX billion 420.7 479.4 482.9 727.9 652.4
YoY 14.0% 0.7% 50.7% -10.4%
% of Gross revenues 3.7% 3.7% 3.3% 4.3% 3.8%
Uganda Sources
GDP 2020 USD million 37,370 WDI 2021
Additional GDP USD million 919 Calculation based on ITU 2020 effect size for Africa of 2.46%
Tax to GDP Ratio 11.7% WDI 2020
Additional Tax USD million 107.93 Calculation
11
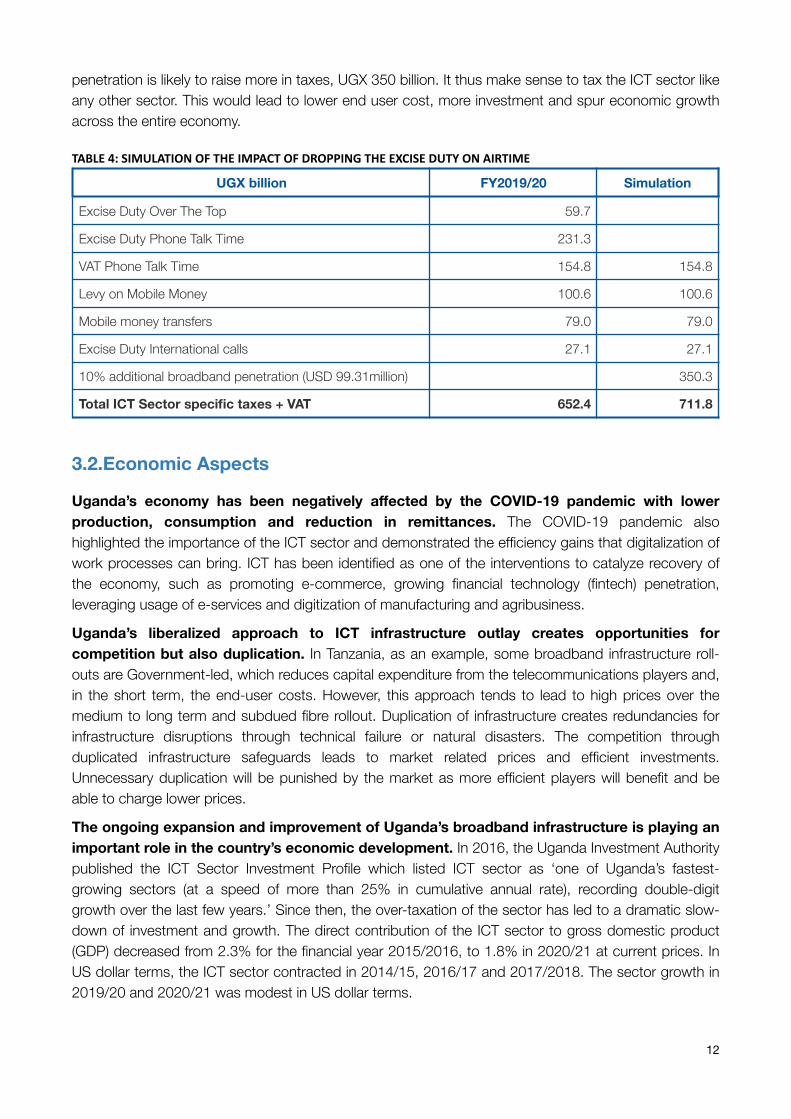
penetration is likely to raise more in taxes, UGX 350 billion. It thus make sense to tax the ICT sector like any other sector. This would lead to lower end user cost, more investment and spur economic growth across the entire economy.
TABLE4:SIMULATIONOFTHEIMPACTOFDROPPINGTHEEXCISEDUTYONAIRTIME
3.2.Economic Aspects
Uganda’s economy has been negatively affected by the COVID-19 pandemic with lower production, consumption and reduction in remittances. The COVID-19 pandemic also highlighted the importance of the ICT sector and demonstrated the efficiency gains that digitalization of work processes can bring. ICT has been identified as one of the interventions to catalyze recovery of the economy, such as promoting e-commerce, growing financial technology (fintech) penetration, leveraging usage of e-services and digitization of manufacturing and agribusiness.
Uganda’s liberalized approach to ICT infrastructure outlay creates opportunities for competition but also duplication. In Tanzania, as an example, some broadband infrastructure roll-outs are Government-led, which reduces capital expenditure from the telecommunications players and, in the short term, the end-user costs. However, this approach tends to lead to high prices over the medium to long term and subdued fibre rollout. Duplication of infrastructure creates redundancies for infrastructure disruptions through technical failure or natural disasters. The competition through duplicated infrastructure safeguards leads to market related prices and efficient investments. Unnecessary duplication will be punished by the market as more efficient players will benefit and be able to charge lower prices.
The ongoing expansion and improvement of Uganda’s broadband infrastructure is playing an important role in the country’s economic development. In 2016, the Uganda Investment Authority published the ICT Sector Investment Profile which listed ICT sector as ‘one of Uganda’s fastest-growing sectors (at a speed of more than 25% in cumulative annual rate), recording double-digit growth over the last few years.’ Since then, the over-taxation of the sector has led to a dramatic slow-down of investment and growth. The direct contribution of the ICT sector to gross domestic product (GDP) decreased from 2.3% for the financial year 2015/2016, to 1.8% in 2020/21 at current prices. In US dollar terms, the ICT sector contracted in 2014/15, 2016/17 and 2017/2018. The sector growth in 2019/20 and 2020/21 was modest in US dollar terms.
UGX billion FY2019/20 Simulation
Excise Duty Over The Top 59.7
Excise Duty Phone Talk Time 231.3
VAT Phone Talk Time 154.8 154.8
Levy on Mobile Money 100.6 100.6
Mobile money transfers 79.0 79.0
Excise Duty International calls 27.1 27.1
10% additional broadband penetration (USD 99.31million) 350.3
Total ICT Sector specific taxes + VAT 652.4 711.8
12
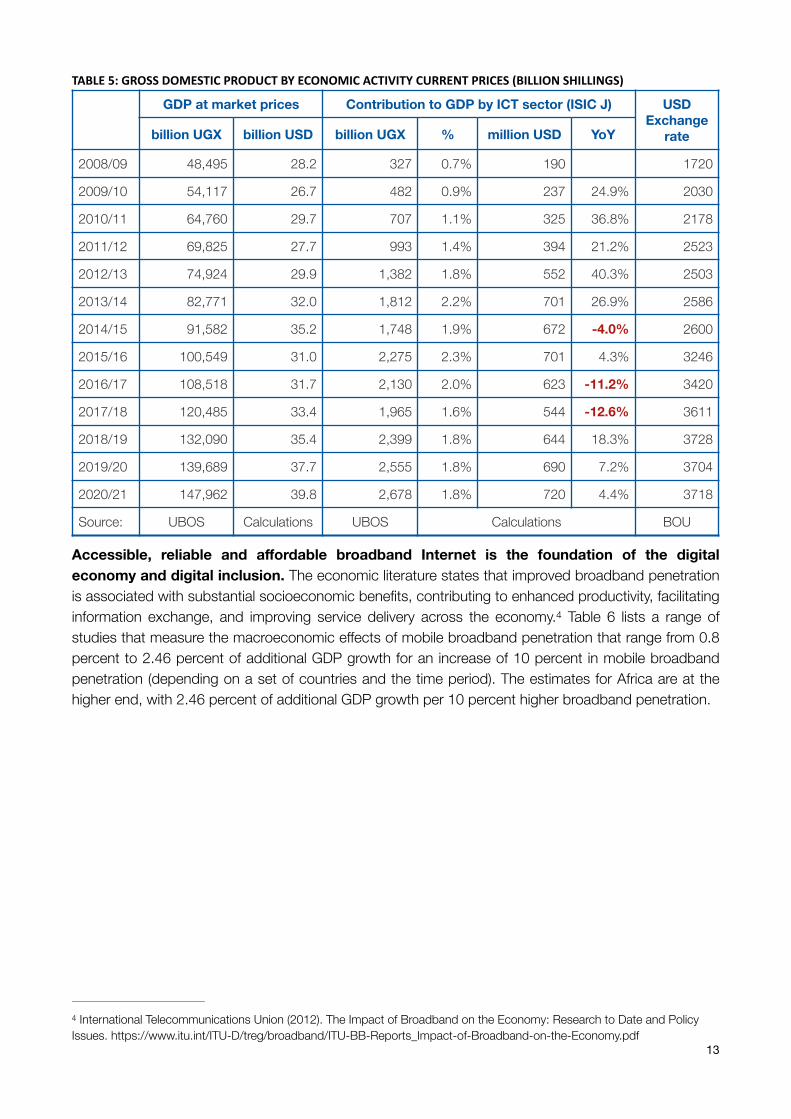
TABLE5:GROSSDOMESTICPRODUCTBYECONOMICACTIVITYCURRENTPRICES(BILLIONSHILLINGS)
Accessible, reliable and affordable broadband Internet is the foundation of the digital economy and digital inclusion. The economic literature states that improved broadband penetration is associated with substantial socioeconomic benefits, contributing to enhanced productivity, facilitating information exchange, and improving service delivery across the economy. Table 6 lists a range of 4
studies that measure the macroeconomic effects of mobile broadband penetration that range from 0.8 percent to 2.46 percent of additional GDP growth for an increase of 10 percent in mobile broadband penetration (depending on a set of countries and the time period). The estimates for Africa are at the higher end, with 2.46 percent of additional GDP growth per 10 percent higher broadband penetration.
GDP at market prices Contribution to GDP by ICT sector (ISIC J) USD Exchange
ratebillion UGX billion USD billion UGX % million USD YoY
2008/09 48,495 28.2 327 0.7% 190 1720
2009/10 54,117 26.7 482 0.9% 237 24.9% 2030
2010/11 64,760 29.7 707 1.1% 325 36.8% 2178
2011/12 69,825 27.7 993 1.4% 394 21.2% 2523
2012/13 74,924 29.9 1,382 1.8% 552 40.3% 2503
2013/14 82,771 32.0 1,812 2.2% 701 26.9% 2586
2014/15 91,582 35.2 1,748 1.9% 672 -4.0% 2600
2015/16 100,549 31.0 2,275 2.3% 701 4.3% 3246
2016/17 108,518 31.7 2,130 2.0% 623 -11.2% 3420
2017/18 120,485 33.4 1,965 1.6% 544 -12.6% 3611
2018/19 132,090 35.4 2,399 1.8% 644 18.3% 3728
2019/20 139,689 37.7 2,555 1.8% 690 7.2% 3704
2020/21 147,962 39.8 2,678 1.8% 720 4.4% 3718
Source: UBOS Calculations UBOS Calculations BOU
International Telecommunications Union (2012). The Impact of Broadband on the Economy: Research to Date and Policy 4
Issues. https://www.itu.int/ITU-D/treg/broadband/ITU-BB-Reports_Impact-of-Broadband-on-the-Economy.pdf 13
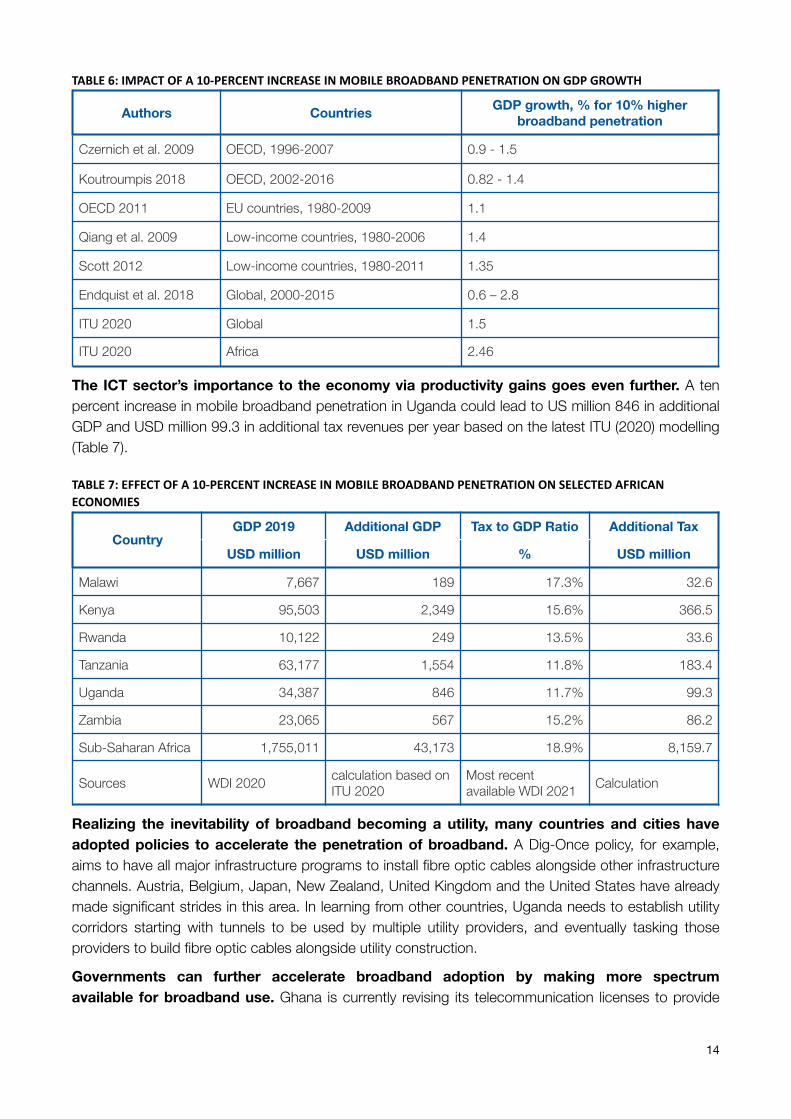
TABLE6:IMPACTOFA10-PERCENTINCREASEINMOBILEBROADBANDPENETRATIONONGDPGROWTH
The ICT sector’s importance to the economy via productivity gains goes even further. A ten percent increase in mobile broadband penetration in Uganda could lead to US million 846 in additional GDP and USD million 99.3 in additional tax revenues per year based on the latest ITU (2020) modelling (Table 7).
TABLE7:EFFECTOFA10-PERCENTINCREASEINMOBILEBROADBANDPENETRATIONONSELECTEDAFRICANECONOMIES
Realizing the inevitability of broadband becoming a utility, many countries and cities have adopted policies to accelerate the penetration of broadband. A Dig-Once policy, for example, aims to have all major infrastructure programs to install fibre optic cables alongside other infrastructure channels. Austria, Belgium, Japan, New Zealand, United Kingdom and the United States have already made significant strides in this area. In learning from other countries, Uganda needs to establish utility corridors starting with tunnels to be used by multiple utility providers, and eventually tasking those providers to build fibre optic cables alongside utility construction.
Governments can further accelerate broadband adoption by making more spectrum available for broadband use. Ghana is currently revising its telecommunication licenses to provide
Authors Countries GDP growth, % for 10% higher broadband penetration
Czernich et al. 2009 OECD, 1996-2007 0.9 - 1.5
Koutroumpis 2018 OECD, 2002-2016 0.82 - 1.4
OECD 2011 EU countries, 1980-2009 1.1
Qiang et al. 2009 Low-income countries, 1980-2006 1.4
Scott 2012 Low-income countries, 1980-2011 1.35
Endquist et al. 2018 Global, 2000-2015 0.6 – 2.8
ITU 2020 Global 1.5
ITU 2020 Africa 2.46
CountryGDP 2019 Additional GDP Tax to GDP Ratio Additional Tax
USD million USD million % USD million
Malawi 7,667 189 17.3% 32.6
Kenya 95,503 2,349 15.6% 366.5
Rwanda 10,122 249 13.5% 33.6
Tanzania 63,177 1,554 11.8% 183.4
Uganda 34,387 846 11.7% 99.3
Zambia 23,065 567 15.2% 86.2
Sub-Saharan Africa 1,755,011 43,173 18.9% 8,159.7
Sources WDI 2020 calculation based on ITU 2020
Most recent available WDI 2021 Calculation
14
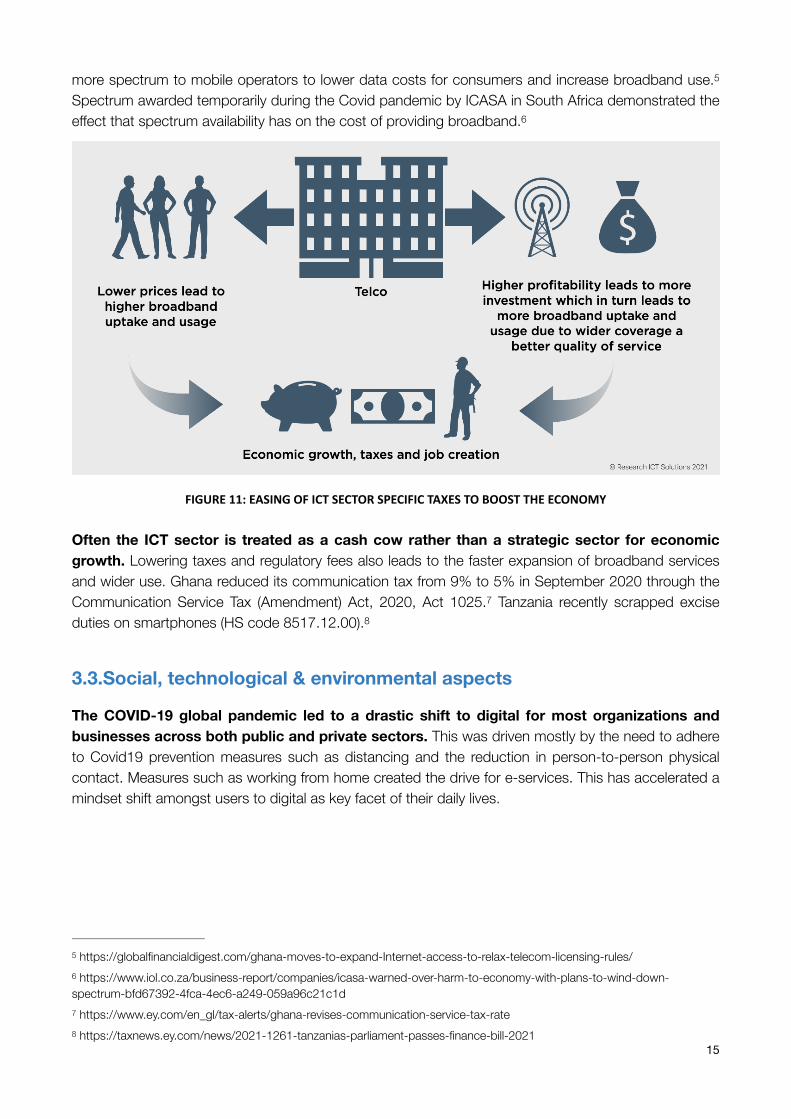
more spectrum to mobile operators to lower data costs for consumers and increase broadband use. 5
Spectrum awarded temporarily during the Covid pandemic by ICASA in South Africa demonstrated the effect that spectrum availability has on the cost of providing broadband. 6
FIGURE11:EASINGOFICTSECTORSPECIFICTAXESTOBOOSTTHEECONOMY
Often the ICT sector is treated as a cash cow rather than a strategic sector for economic growth. Lowering taxes and regulatory fees also leads to the faster expansion of broadband services and wider use. Ghana reduced its communication tax from 9% to 5% in September 2020 through the Communication Service Tax (Amendment) Act, 2020, Act 1025. Tanzania recently scrapped excise 7
duties on smartphones (HS code 8517.12.00). 8
3.3.Social, technological & environmental aspects
The COVID-19 global pandemic led to a drastic shift to digital for most organizations and businesses across both public and private sectors. This was driven mostly by the need to adhere to Covid19 prevention measures such as distancing and the reduction in person-to-person physical contact. Measures such as working from home created the drive for e-services. This has accelerated a mindset shift amongst users to digital as key facet of their daily lives.
https://globalfinancialdigest.com/ghana-moves-to-expand-Internet-access-to-relax-telecom-licensing-rules/5
https://www.iol.co.za/business-report/companies/icasa-warned-over-harm-to-economy-with-plans-to-wind-down-6
spectrum-bfd67392-4fca-4ec6-a249-059a96c21c1d https://www.ey.com/en_gl/tax-alerts/ghana-revises-communication-service-tax-rate7
https://taxnews.ey.com/news/2021-1261-tanzanias-parliament-passes-finance-bill-20218
15
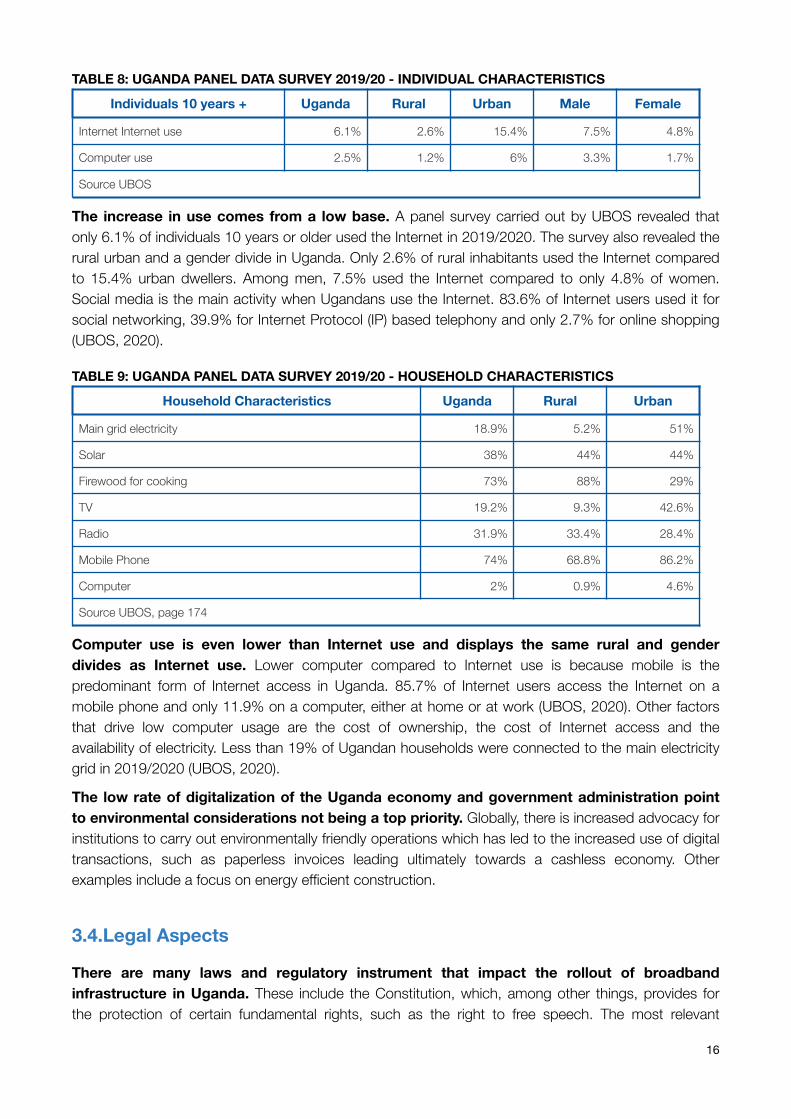
TABLE 8: UGANDA PANEL DATA SURVEY 2019/20 - INDIVIDUAL CHARACTERISTICS
The increase in use comes from a low base. A panel survey carried out by UBOS revealed that only 6.1% of individuals 10 years or older used the Internet in 2019/2020. The survey also revealed the rural urban and a gender divide in Uganda. Only 2.6% of rural inhabitants used the Internet compared to 15.4% urban dwellers. Among men, 7.5% used the Internet compared to only 4.8% of women. Social media is the main activity when Ugandans use the Internet. 83.6% of Internet users used it for social networking, 39.9% for Internet Protocol (IP) based telephony and only 2.7% for online shopping (UBOS, 2020).
TABLE 9: UGANDA PANEL DATA SURVEY 2019/20 - HOUSEHOLD CHARACTERISTICS
Computer use is even lower than Internet use and displays the same rural and gender divides as Internet use. Lower computer compared to Internet use is because mobile is the predominant form of Internet access in Uganda. 85.7% of Internet users access the Internet on a mobile phone and only 11.9% on a computer, either at home or at work (UBOS, 2020). Other factors that drive low computer usage are the cost of ownership, the cost of Internet access and the availability of electricity. Less than 19% of Ugandan households were connected to the main electricity grid in 2019/2020 (UBOS, 2020).
The low rate of digitalization of the Uganda economy and government administration point to environmental considerations not being a top priority. Globally, there is increased advocacy for institutions to carry out environmentally friendly operations which has led to the increased use of digital transactions, such as paperless invoices leading ultimately towards a cashless economy. Other examples include a focus on energy efficient construction.
3.4.Legal Aspects
There are many laws and regulatory instrument that impact the rollout of broadband infrastructure in Uganda. These include the Constitution, which, among other things, provides for the protection of certain fundamental rights, such as the right to free speech. The most relevant
Individuals 10 years + Uganda Rural Urban Male Female
Internet Internet use 6.1% 2.6% 15.4% 7.5% 4.8%
Computer use 2.5% 1.2% 6% 3.3% 1.7%
Source UBOS
Household Characteristics Uganda Rural Urban
Main grid electricity 18.9% 5.2% 51%
Solar 38% 44% 44%
Firewood for cooking 73% 88% 29%
TV 19.2% 9.3% 42.6%
Radio 31.9% 33.4% 28.4%
Mobile Phone 74% 68.8% 86.2%
Computer 2% 0.9% 4.6%
Source UBOS, page 174
16
legislation enacted by Parliament impacting the rollout and use of broadband services in Uganda is the Uganda Communications Act, 2013 and the regulations and other regulatory instruments made under the Act by the Uganda Communications Commission (UCC). In 2019, a set of 18 regulations was made to implement the Uganda Communications Act revoking many of the regulations that were made in 2005. The regulations altered the market structure and the licensing framework and regulated regulatory issues that had previously been regulated such as spectrum management and some that had not such as consumer protection. The following matters are significant to the broadband ecosystem and are discussed in detail in Chapter 7 below:
• Licensing • Fair Competition • Interconnection, Roaming, and Sharing of Infrastructure • Rights of Way to Land • Spectrum • Universal Service • Consumer Protection • Tariffs • Numbering
Other laws impacting the adoption and use of broadband include the National Information Technology Authority, Uganda Act, 2009 and the various laws that the National Information Technology Authority-Uganda (NITA-U) is charged with implementing, including the Electronic Transactions Act, 2011, the Electronic Signatures Act, 2011, the Computer Misuse Act, 2011, and the Data Protection and Privacy Act, 2019. Other laws that may impact on broadband may include those related to the protection of critical infrastructure, consumer rights, fair competition, access to banking and electronic payments, and fair taxes.
The most urgent issues that can be effected by the UCC to facilitate a more robust broadband ecosystem are to:
• Create a more flexible and easy licensing regime that allows for more innovation and competition, especially in the services markets and in areas that are underserved;
• Create an efficient and fair regulatory regime for obtaining rights-of-way in collaboration with all interested parties;
• Effectively enforce a robust facilities sharing regulatory regime; and • Make changes to the spectrum planning and licensing regimes, as discussed in Chapter 8 in this
report.
In addition, the intellectual property rights laws need to be reviewed keeping in mind the changes brought about the broadband value chain, and matters such as artificial intelligence, and the importance of data, among others. Similarly, the legal and regulatory regimes that impact the delicate balance of protecting rights of free speech and the surveillance mechanisms available, should be reviewed. Finally, the following cross-cutting laws that extend beyond the ICT sector, and ensure a more holistic approach to establishing a good ecosystem should be promulgated:
• Competition; • Consumer Protection; and • Critical Infrastructure.
17
Uganda’s legal and regulatory framework is complex and is analyzed in more detail in Chapter 7 of this report.
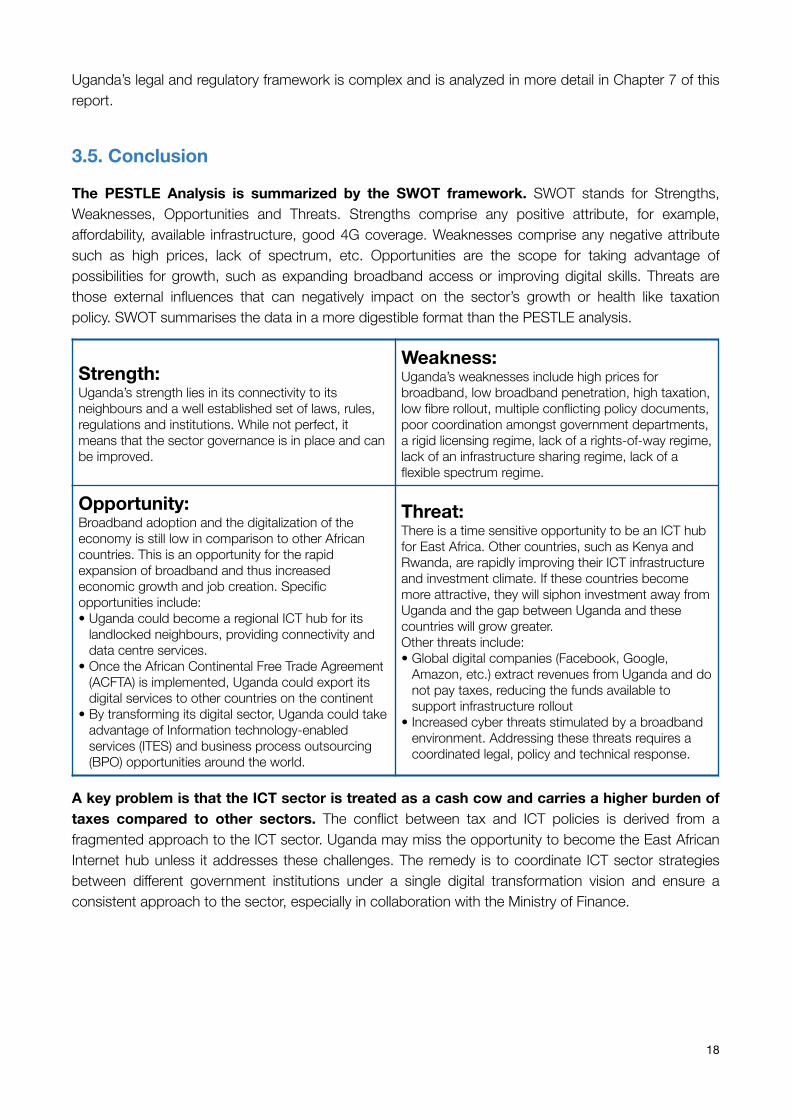
3.5. Conclusion
The PESTLE Analysis is summarized by the SWOT framework. SWOT stands for Strengths, Weaknesses, Opportunities and Threats. Strengths comprise any positive attribute, for example, affordability, available infrastructure, good 4G coverage. Weaknesses comprise any negative attribute such as high prices, lack of spectrum, etc. Opportunities are the scope for taking advantage of possibilities for growth, such as expanding broadband access or improving digital skills. Threats are those external influences that can negatively impact on the sector’s growth or health like taxation policy. SWOT summarises the data in a more digestible format than the PESTLE analysis.
A key problem is that the ICT sector is treated as a cash cow and carries a higher burden of taxes compared to other sectors. The conflict between tax and ICT policies is derived from a fragmented approach to the ICT sector. Uganda may miss the opportunity to become the East African Internet hub unless it addresses these challenges. The remedy is to coordinate ICT sector strategies between different government institutions under a single digital transformation vision and ensure a consistent approach to the sector, especially in collaboration with the Ministry of Finance.
Strength: Uganda’s strength lies in its connectivity to its neighbours and a well established set of laws, rules, regulations and institutions. While not perfect, it means that the sector governance is in place and can be improved.
Weakness: Uganda’s weaknesses include high prices for broadband, low broadband penetration, high taxation, low fibre rollout, multiple conflicting policy documents, poor coordination amongst government departments, a rigid licensing regime, lack of a rights-of-way regime, lack of an infrastructure sharing regime, lack of a flexible spectrum regime.
Opportunity: Broadband adoption and the digitalization of the economy is still low in comparison to other African countries. This is an opportunity for the rapid expansion of broadband and thus increased economic growth and job creation. Specific opportunities include: • Uganda could become a regional ICT hub for its
landlocked neighbours, providing connectivity and data centre services.
• Once the African Continental Free Trade Agreement (ACFTA) is implemented, Uganda could export its digital services to other countries on the continent
• By transforming its digital sector, Uganda could take advantage of Information technology-enabled services (ITES) and business process outsourcing (BPO) opportunities around the world.
Threat: There is a time sensitive opportunity to be an ICT hub for East Africa. Other countries, such as Kenya and Rwanda, are rapidly improving their ICT infrastructure and investment climate. If these countries become more attractive, they will siphon investment away from Uganda and the gap between Uganda and these countries will grow greater. Other threats include: • Global digital companies (Facebook, Google,
Amazon, etc.) extract revenues from Uganda and do not pay taxes, reducing the funds available to support infrastructure rollout
• Increased cyber threats stimulated by a broadband environment. Addressing these threats requires a coordinated legal, policy and technical response.
18
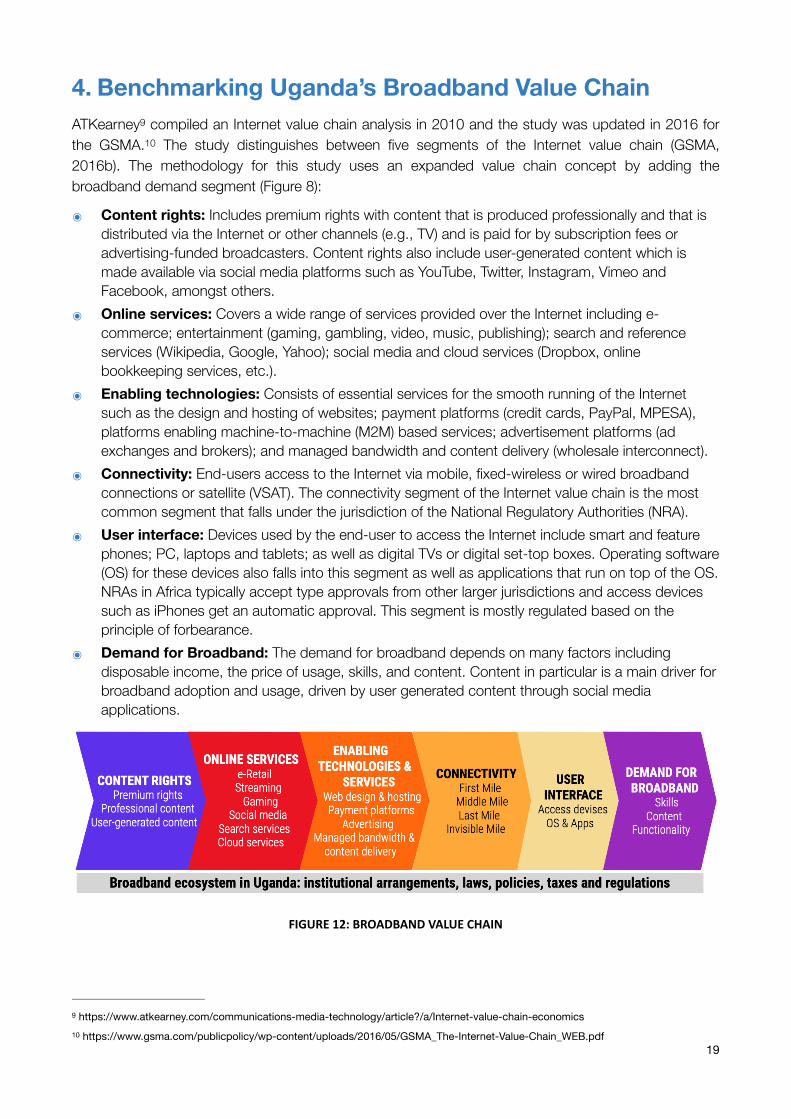
4. Benchmarking Uganda’s Broadband Value Chain ATKearney compiled an Internet value chain analysis in 2010 and the study was updated in 2016 for 9
the GSMA. The study distinguishes between five segments of the Internet value chain (GSMA, 10
2016b). The methodology for this study uses an expanded value chain concept by adding the broadband demand segment (Figure 8):
๏ Content rights: Includes premium rights with content that is produced professionally and that is distributed via the Internet or other channels (e.g., TV) and is paid for by subscription fees or advertising-funded broadcasters. Content rights also include user-generated content which is made available via social media platforms such as YouTube, Twitter, Instagram, Vimeo and Facebook, amongst others.
๏ Online services: Covers a wide range of services provided over the Internet including e-commerce; entertainment (gaming, gambling, video, music, publishing); search and reference services (Wikipedia, Google, Yahoo); social media and cloud services (Dropbox, online bookkeeping services, etc.).
๏ Enabling technologies: Consists of essential services for the smooth running of the Internet such as the design and hosting of websites; payment platforms (credit cards, PayPal, MPESA), platforms enabling machine-to-machine (M2M) based services; advertisement platforms (ad exchanges and brokers); and managed bandwidth and content delivery (wholesale interconnect).
๏ Connectivity: End-users access to the Internet via mobile, fixed-wireless or wired broadband connections or satellite (VSAT). The connectivity segment of the Internet value chain is the most common segment that falls under the jurisdiction of the National Regulatory Authorities (NRA).
๏ User interface: Devices used by the end-user to access the Internet include smart and feature phones; PC, laptops and tablets; as well as digital TVs or digital set-top boxes. Operating software (OS) for these devices also falls into this segment as well as applications that run on top of the OS. NRAs in Africa typically accept type approvals from other larger jurisdictions and access devices such as iPhones get an automatic approval. This segment is mostly regulated based on the principle of forbearance.
๏ Demand for Broadband: The demand for broadband depends on many factors including disposable income, the price of usage, skills, and content. Content in particular is a main driver for broadband adoption and usage, driven by user generated content through social media applications.
FIGURE12:BROADBANDVALUECHAIN
https://www.atkearney.com/communications-media-technology/article?/a/Internet-value-chain-economics9
https://www.gsma.com/publicpolicy/wp-content/uploads/2016/05/GSMA_The-Internet-Value-Chain_WEB.pdf10
19
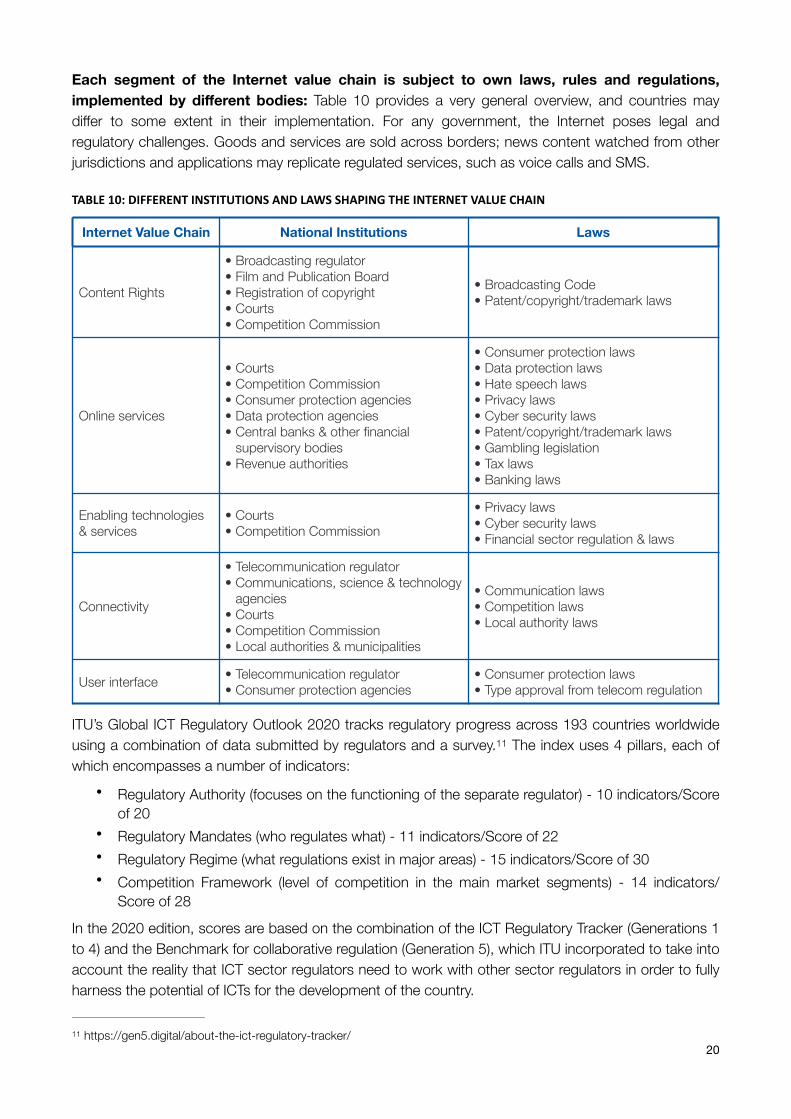
Each segment of the Internet value chain is subject to own laws, rules and regulations, implemented by different bodies: Table 10 provides a very general overview, and countries may differ to some extent in their implementation. For any government, the Internet poses legal and regulatory challenges. Goods and services are sold across borders; news content watched from other jurisdictions and applications may replicate regulated services, such as voice calls and SMS.
TABLE10:DIFFERENTINSTITUTIONSANDLAWSSHAPINGTHEINTERNETVALUECHAIN
ITU’s Global ICT Regulatory Outlook 2020 tracks regulatory progress across 193 countries worldwide using a combination of data submitted by regulators and a survey. The index uses 4 pillars, each of 11
which encompasses a number of indicators: • Regulatory Authority (focuses on the functioning of the separate regulator) - 10 indicators/Score
of 20 • Regulatory Mandates (who regulates what) - 11 indicators/Score of 22 • Regulatory Regime (what regulations exist in major areas) - 15 indicators/Score of 30 • Competition Framework (level of competition in the main market segments) - 14 indicators/
Score of 28
In the 2020 edition, scores are based on the combination of the ICT Regulatory Tracker (Generations 1 to 4) and the Benchmark for collaborative regulation (Generation 5), which ITU incorporated to take into account the reality that ICT sector regulators need to work with other sector regulators in order to fully harness the potential of ICTs for the development of the country.
Internet Value Chain National Institutions Laws
Content Rights
• Broadcasting regulator • Film and Publication Board • Registration of copyright • Courts • Competition Commission
• Broadcasting Code • Patent/copyright/trademark laws
Online services
• Courts • Competition Commission • Consumer protection agencies • Data protection agencies • Central banks & other financial
supervisory bodies • Revenue authorities
• Consumer protection laws • Data protection laws • Hate speech laws • Privacy laws • Cyber security laws • Patent/copyright/trademark laws • Gambling legislation • Tax laws • Banking laws
Enabling technologies & services
• Courts • Competition Commission
• Privacy laws • Cyber security laws • Financial sector regulation & laws
Connectivity
• Telecommunication regulator • Communications, science & technology
agencies • Courts • Competition Commission • Local authorities & municipalities
• Communication laws • Competition laws • Local authority laws
User interface • Telecommunication regulator • Consumer protection agencies
• Consumer protection laws • Type approval from telecom regulation
https://gen5.digital/about-the-ict-regulatory-tracker/11
20
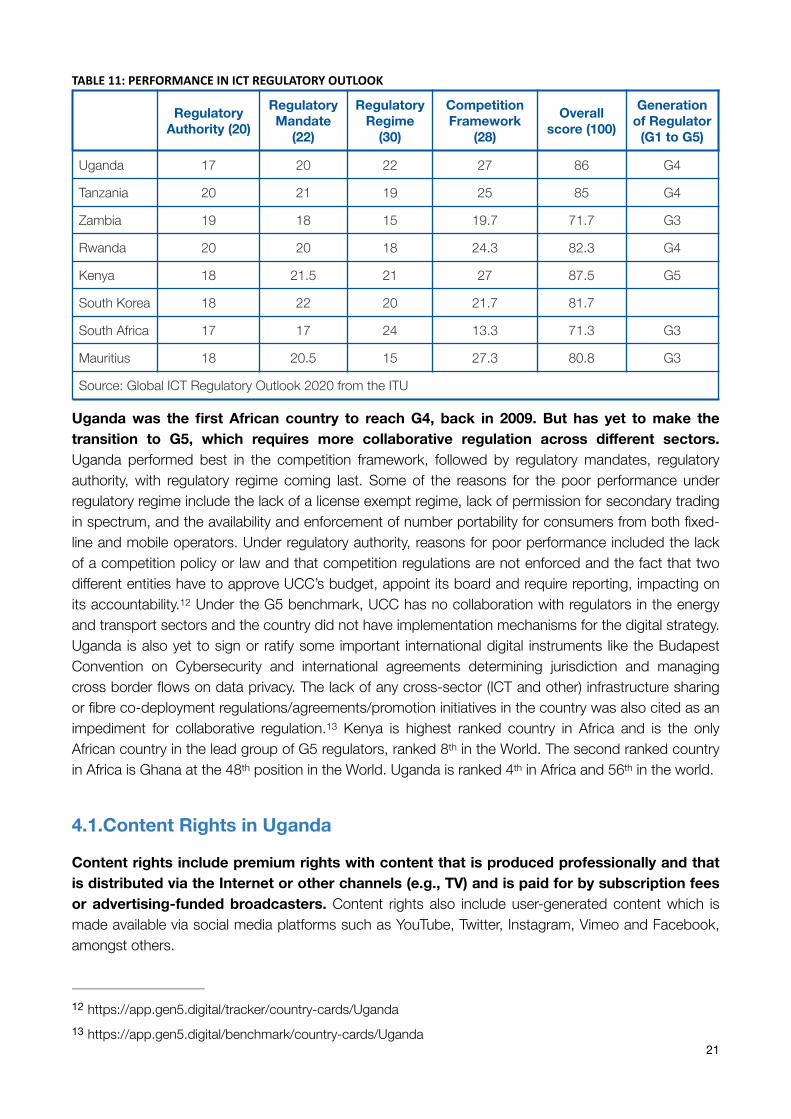
TABLE11:PERFORMANCEINICTREGULATORYOUTLOOK
Uganda was the first African country to reach G4, back in 2009. But has yet to make the transition to G5, which requires more collaborative regulation across different sectors. Uganda performed best in the competition framework, followed by regulatory mandates, regulatory authority, with regulatory regime coming last. Some of the reasons for the poor performance under regulatory regime include the lack of a license exempt regime, lack of permission for secondary trading in spectrum, and the availability and enforcement of number portability for consumers from both fixed-line and mobile operators. Under regulatory authority, reasons for poor performance included the lack of a competition policy or law and that competition regulations are not enforced and the fact that two different entities have to approve UCC’s budget, appoint its board and require reporting, impacting on its accountability. Under the G5 benchmark, UCC has no collaboration with regulators in the energy 12
and transport sectors and the country did not have implementation mechanisms for the digital strategy. Uganda is also yet to sign or ratify some important international digital instruments like the Budapest Convention on Cybersecurity and international agreements determining jurisdiction and managing cross border flows on data privacy. The lack of any cross-sector (ICT and other) infrastructure sharing or fibre co-deployment regulations/agreements/promotion initiatives in the country was also cited as an impediment for collaborative regulation. Kenya is highest ranked country in Africa and is the only 13
African country in the lead group of G5 regulators, ranked 8th in the World. The second ranked country in Africa is Ghana at the 48th position in the World. Uganda is ranked 4th in Africa and 56th in the world.
4.1.Content Rights in Uganda
Content rights include premium rights with content that is produced professionally and that is distributed via the Internet or other channels (e.g., TV) and is paid for by subscription fees or advertising-funded broadcasters. Content rights also include user-generated content which is made available via social media platforms such as YouTube, Twitter, Instagram, Vimeo and Facebook, amongst others.
Regulatory Authority (20)
Regulatory Mandate
(22)
Regulatory Regime
(30)
Competition Framework
(28)
Overall score (100)
Generation of Regulator
(G1 to G5)
Uganda 17 20 22 27 86 G4
Tanzania 20 21 19 25 85 G4
Zambia 19 18 15 19.7 71.7 G3
Rwanda 20 20 18 24.3 82.3 G4
Kenya 18 21.5 21 27 87.5 G5
South Korea 18 22 20 21.7 81.7
South Africa 17 17 24 13.3 71.3 G3
Mauritius 18 20.5 15 27.3 80.8 G3
Source: Global ICT Regulatory Outlook 2020 from the ITU
https://app.gen5.digital/tracker/country-cards/Uganda12
https://app.gen5.digital/benchmark/country-cards/Uganda1321
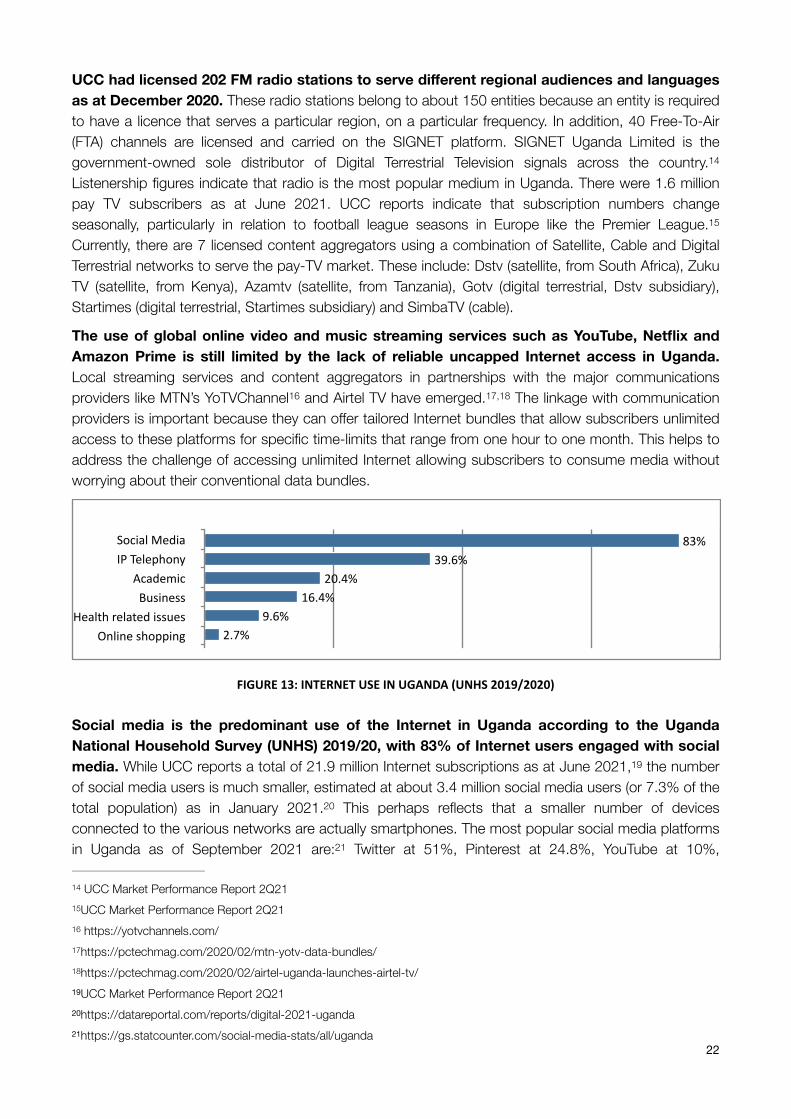
UCC had licensed 202 FM radio stations to serve different regional audiences and languages as at December 2020. These radio stations belong to about 150 entities because an entity is required to have a licence that serves a particular region, on a particular frequency. In addition, 40 Free-To-Air (FTA) channels are licensed and carried on the SIGNET platform. SIGNET Uganda Limited is the government-owned sole distributor of Digital Terrestrial Television signals across the country. 14
Listenership figures indicate that radio is the most popular medium in Uganda. There were 1.6 million pay TV subscribers as at June 2021. UCC reports indicate that subscription numbers change seasonally, particularly in relation to football league seasons in Europe like the Premier League. 15
Currently, there are 7 licensed content aggregators using a combination of Satellite, Cable and Digital Terrestrial networks to serve the pay-TV market. These include: Dstv (satellite, from South Africa), Zuku TV (satellite, from Kenya), Azamtv (satellite, from Tanzania), Gotv (digital terrestrial, Dstv subsidiary), Startimes (digital terrestrial, Startimes subsidiary) and SimbaTV (cable).
The use of global online video and music streaming services such as YouTube, Netflix and Amazon Prime is still limited by the lack of reliable uncapped Internet access in Uganda. Local streaming services and content aggregators in partnerships with the major communications providers like MTN’s YoTVChannel and Airtel TV have emerged. , The linkage with communication 16 17 18
providers is important because they can offer tailored Internet bundles that allow subscribers unlimited access to these platforms for specific time-limits that range from one hour to one month. This helps to address the challenge of accessing unlimited Internet allowing subscribers to consume media without worrying about their conventional data bundles.
FIGURE13:INTERNETUSEINUGANDA(UNHS2019/2020)
Social media is the predominant use of the Internet in Uganda according to the Uganda National Household Survey (UNHS) 2019/20, with 83% of Internet users engaged with social media. While UCC reports a total of 21.9 million Internet subscriptions as at June 2021, the number 19
of social media users is much smaller, estimated at about 3.4 million social media users (or 7.3% of the total population) as in January 2021. This perhaps reflects that a smaller number of devices 20
connected to the various networks are actually smartphones. The most popular social media platforms in Uganda as of September 2021 are: Twitter at 51%, Pinterest at 24.8%, YouTube at 10%, 21
SocialMediaIPTelephony
AcademicBusiness
HealthrelatedissuesOnlineshopping 2.7%
9.6%16.4%
20.4%39.6%
83%
UCC Market Performance Report 2Q2114
UCC Market Performance Report 2Q2115
https://yotvchannels.com/ 16
https://pctechmag.com/2020/02/mtn-yotv-data-bundles/ 17
https://pctechmag.com/2020/02/airtel-uganda-launches-airtel-tv/ 18
UCC Market Performance Report 2Q2119
https://datareportal.com/reports/digital-2021-uganda 20
https://gs.statcounter.com/social-media-stats/all/uganda 21
22
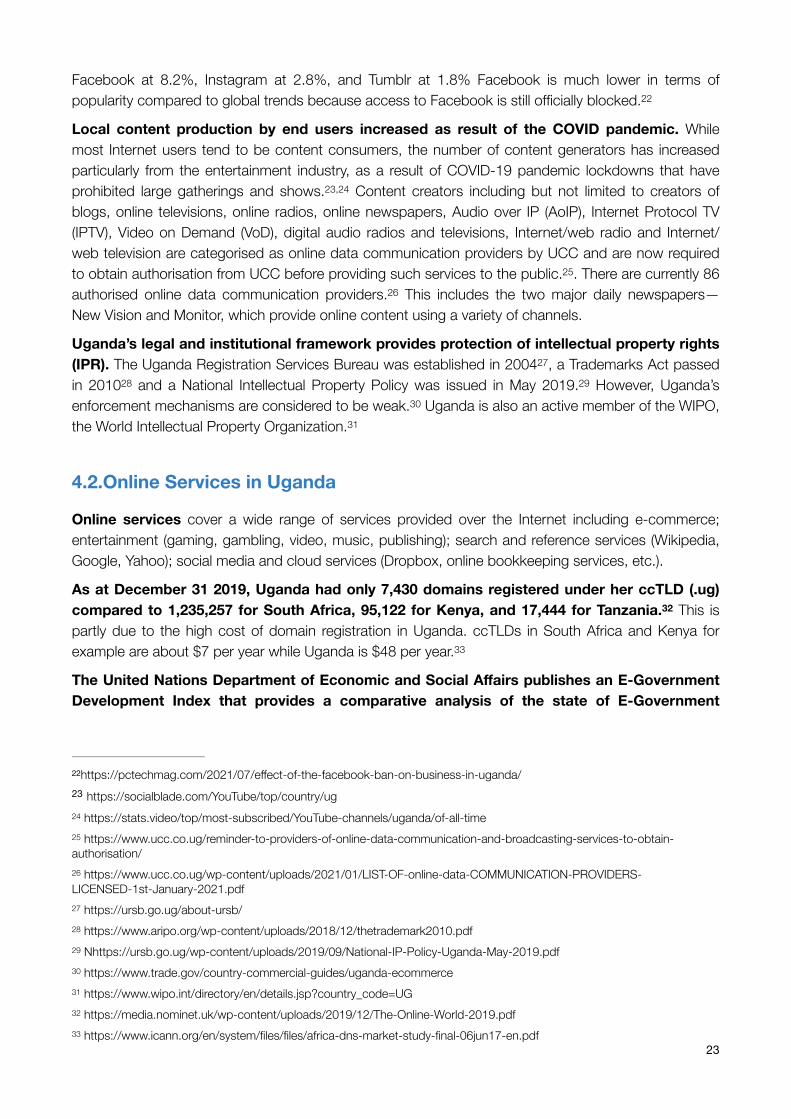
Facebook at 8.2%, Instagram at 2.8%, and Tumblr at 1.8% Facebook is much lower in terms of popularity compared to global trends because access to Facebook is still officially blocked. 22
Local content production by end users increased as result of the COVID pandemic. While most Internet users tend to be content consumers, the number of content generators has increased particularly from the entertainment industry, as a result of COVID-19 pandemic lockdowns that have prohibited large gatherings and shows. , Content creators including but not limited to creators of 23 24
blogs, online televisions, online radios, online newspapers, Audio over IP (AoIP), Internet Protocol TV (IPTV), Video on Demand (VoD), digital audio radios and televisions, Internet/web radio and Internet/web television are categorised as online data communication providers by UCC and are now required to obtain authorisation from UCC before providing such services to the public. . There are currently 86 25
authorised online data communication providers. This includes the two major daily newspapers—26
New Vision and Monitor, which provide online content using a variety of channels.
Uganda’s legal and institutional framework provides protection of intellectual property rights (IPR). The Uganda Registration Services Bureau was established in 2004 , a Trademarks Act passed 27
in 2010 and a National Intellectual Property Policy was issued in May 2019. However, Uganda’s 28 29
enforcement mechanisms are considered to be weak. Uganda is also an active member of the WIPO, 30
the World Intellectual Property Organization. 31
4.2.Online Services in Uganda
Online services cover a wide range of services provided over the Internet including e-commerce; entertainment (gaming, gambling, video, music, publishing); search and reference services (Wikipedia, Google, Yahoo); social media and cloud services (Dropbox, online bookkeeping services, etc.).
As at December 31 2019, Uganda had only 7,430 domains registered under her ccTLD (.ug) compared to 1,235,257 for South Africa, 95,122 for Kenya, and 17,444 for Tanzania. This is 32
partly due to the high cost of domain registration in Uganda. ccTLDs in South Africa and Kenya for example are about $7 per year while Uganda is $48 per year. 33
The United Nations Department of Economic and Social Affairs publishes an E-Government Development Index that provides a comparative analysis of the state of E-Government
https://pctechmag.com/2021/07/effect-of-the-facebook-ban-on-business-in-uganda/22
https://socialblade.com/YouTube/top/country/ug23
https://stats.video/top/most-subscribed/YouTube-channels/uganda/of-all-time24
https://www.ucc.co.ug/reminder-to-providers-of-online-data-communication-and-broadcasting-services-to-obtain-25
authorisation/ https://www.ucc.co.ug/wp-content/uploads/2021/01/LIST-OF-online-data-COMMUNICATION-PROVIDERS-26
LICENSED-1st-January-2021.pdf https://ursb.go.ug/about-ursb/27
https://www.aripo.org/wp-content/uploads/2018/12/thetrademark2010.pdf28
Nhttps://ursb.go.ug/wp-content/uploads/2019/09/National-IP-Policy-Uganda-May-2019.pdf 29
https://www.trade.gov/country-commercial-guides/uganda-ecommerce30
https://www.wipo.int/directory/en/details.jsp?country_code=UG31
https://media.nominet.uk/wp-content/uploads/2019/12/The-Online-World-2019.pdf32
https://www.icann.org/en/system/files/files/africa-dns-market-study-final-06jun17-en.pdf33
23
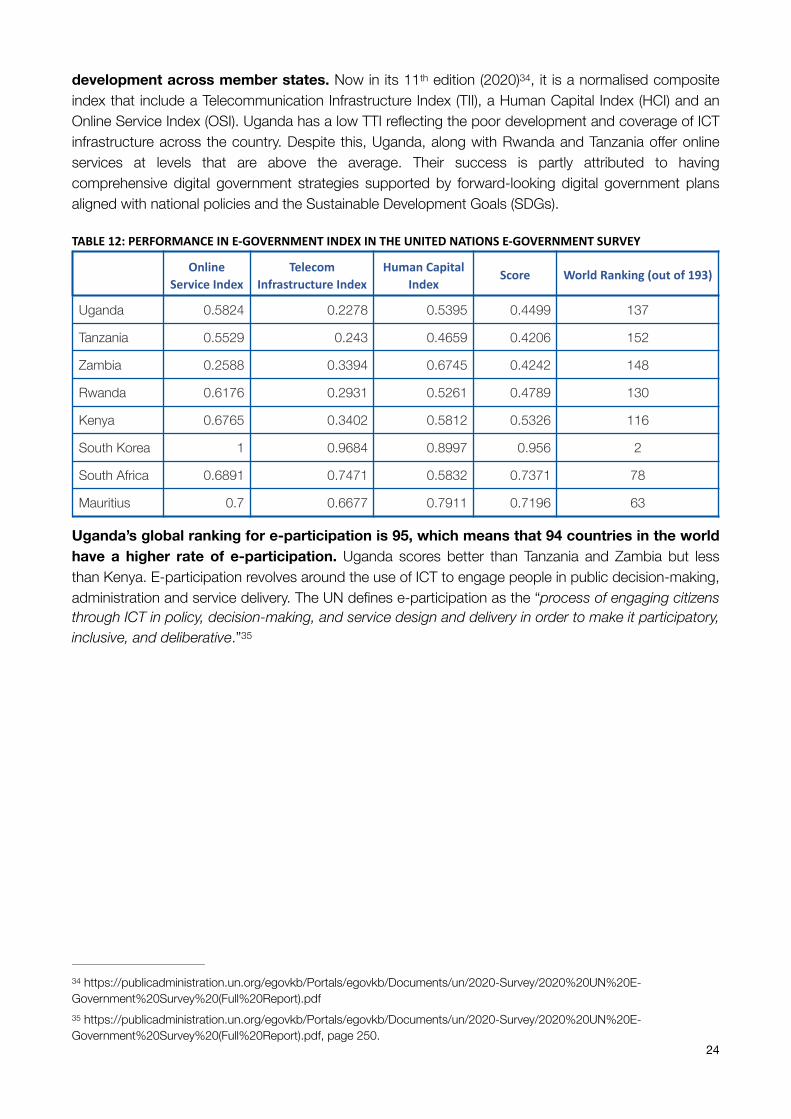
development across member states. Now in its 11th edition (2020) , it is a normalised composite 34
index that include a Telecommunication Infrastructure Index (TII), a Human Capital Index (HCI) and an Online Service Index (OSI). Uganda has a low TTI reflecting the poor development and coverage of ICT infrastructure across the country. Despite this, Uganda, along with Rwanda and Tanzania offer online services at levels that are above the average. Their success is partly attributed to having comprehensive digital government strategies supported by forward-looking digital government plans aligned with national policies and the Sustainable Development Goals (SDGs).
TABLE12:PERFORMANCEINE-GOVERNMENTINDEXINTHEUNITEDNATIONSE-GOVERNMENTSURVEY
Uganda’s global ranking for e-participation is 95, which means that 94 countries in the world have a higher rate of e-participation. Uganda scores better than Tanzania and Zambia but less than Kenya. E-participation revolves around the use of ICT to engage people in public decision-making, administration and service delivery. The UN defines e-participation as the “process of engaging citizens through ICT in policy, decision-making, and service design and delivery in order to make it participatory, inclusive, and deliberative.” 35
OnlineServiceIndex
TelecomInfrastructureIndex
HumanCapitalIndex
Score WorldRanking(outof193)
Uganda 0.5824 0.2278 0.5395 0.4499 137
Tanzania 0.5529 0.243 0.4659 0.4206 152
Zambia 0.2588 0.3394 0.6745 0.4242 148
Rwanda 0.6176 0.2931 0.5261 0.4789 130
Kenya 0.6765 0.3402 0.5812 0.5326 116
South Korea 1 0.9684 0.8997 0.956 2
South Africa 0.6891 0.7471 0.5832 0.7371 78
Mauritius 0.7 0.6677 0.7911 0.7196 63
https://publicadministration.un.org/egovkb/Portals/egovkb/Documents/un/2020-Survey/2020%20UN%20E-34
Government%20Survey%20(Full%20Report).pdf https://publicadministration.un.org/egovkb/Portals/egovkb/Documents/un/2020-Survey/2020%20UN%20E-35
Government%20Survey%20(Full%20Report).pdf, page 250.24
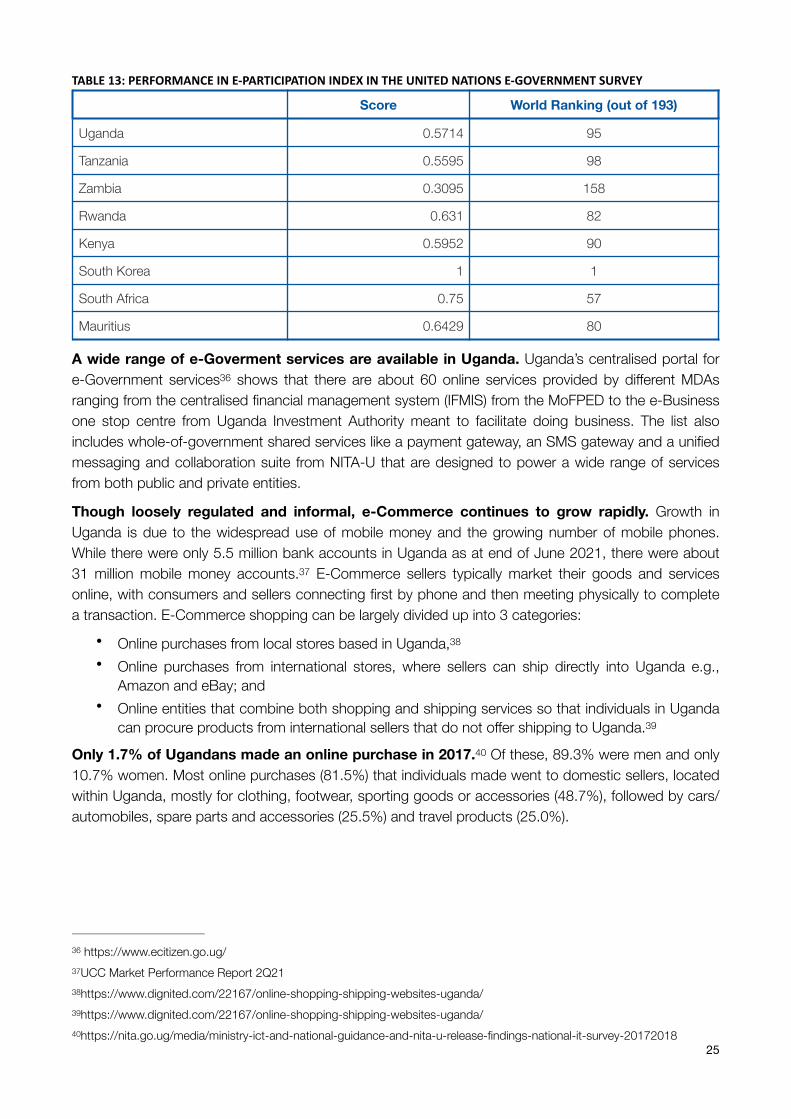
TABLE13:PERFORMANCEINE-PARTICIPATIONINDEXINTHEUNITEDNATIONSE-GOVERNMENTSURVEY
A wide range of e-Goverment services are available in Uganda. Uganda’s centralised portal for e-Government services shows that there are about 60 online services provided by different MDAs 36
ranging from the centralised financial management system (IFMIS) from the MoFPED to the e-Business one stop centre from Uganda Investment Authority meant to facilitate doing business. The list also includes whole-of-government shared services like a payment gateway, an SMS gateway and a unified messaging and collaboration suite from NITA-U that are designed to power a wide range of services from both public and private entities.
Though loosely regulated and informal, e-Commerce continues to grow rapidly. Growth in Uganda is due to the widespread use of mobile money and the growing number of mobile phones. While there were only 5.5 million bank accounts in Uganda as at end of June 2021, there were about 31 million mobile money accounts. E-Commerce sellers typically market their goods and services 37
online, with consumers and sellers connecting first by phone and then meeting physically to complete a transaction. E-Commerce shopping can be largely divided up into 3 categories:
• Online purchases from local stores based in Uganda, 38
• Online purchases from international stores, where sellers can ship directly into Uganda e.g., Amazon and eBay; and
• Online entities that combine both shopping and shipping services so that individuals in Uganda can procure products from international sellers that do not offer shipping to Uganda. 39
Only 1.7% of Ugandans made an online purchase in 2017. Of these, 89.3% were men and only 40
10.7% women. Most online purchases (81.5%) that individuals made went to domestic sellers, located within Uganda, mostly for clothing, footwear, sporting goods or accessories (48.7%), followed by cars/automobiles, spare parts and accessories (25.5%) and travel products (25.0%).
Score World Ranking (out of 193)
Uganda 0.5714 95
Tanzania 0.5595 98
Zambia 0.3095 158
Rwanda 0.631 82
Kenya 0.5952 90
South Korea 1 1
South Africa 0.75 57
Mauritius 0.6429 80
https://www.ecitizen.go.ug/ 36
UCC Market Performance Report 2Q2137
https://www.dignited.com/22167/online-shopping-shipping-websites-uganda/ 38
https://www.dignited.com/22167/online-shopping-shipping-websites-uganda/ 39
https://nita.go.ug/media/ministry-ict-and-national-guidance-and-nita-u-release-findings-national-it-survey-2017201840
25
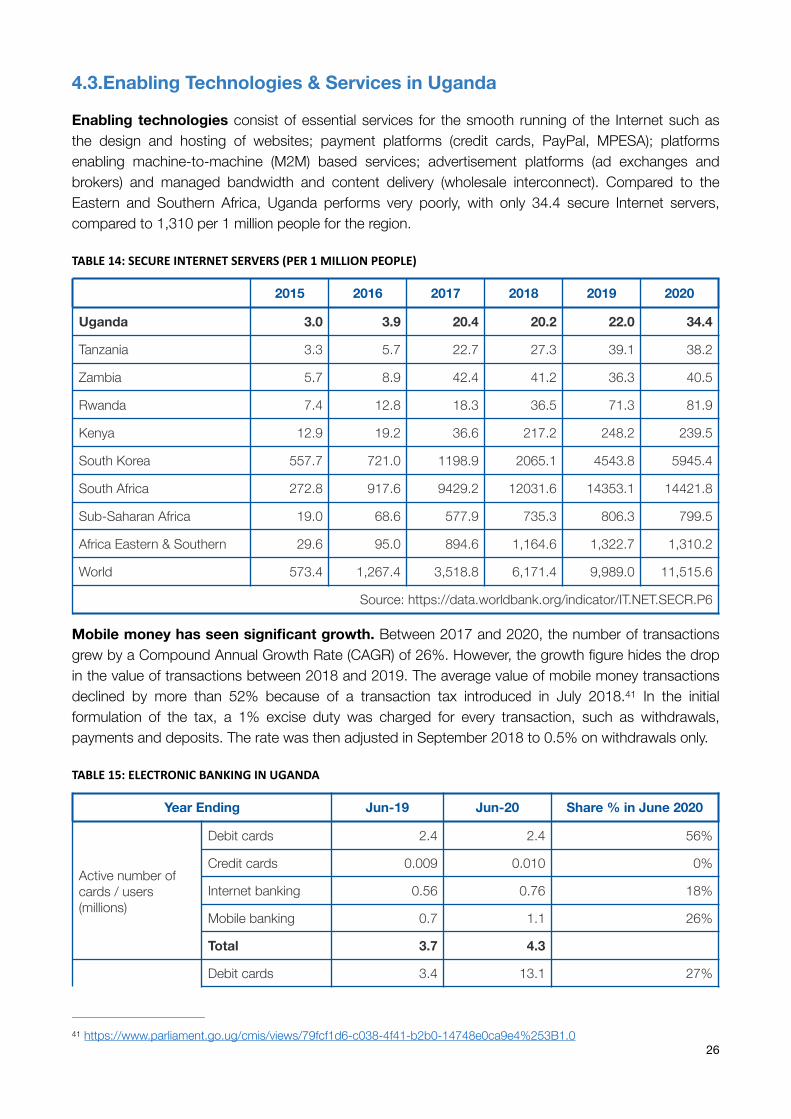
4.3.Enabling Technologies & Services in Uganda
Enabling technologies consist of essential services for the smooth running of the Internet such as the design and hosting of websites; payment platforms (credit cards, PayPal, MPESA); platforms enabling machine-to-machine (M2M) based services; advertisement platforms (ad exchanges and brokers) and managed bandwidth and content delivery (wholesale interconnect). Compared to the Eastern and Southern Africa, Uganda performs very poorly, with only 34.4 secure Internet servers, compared to 1,310 per 1 million people for the region.
TABLE14:SECUREINTERNETSERVERS(PER1MILLIONPEOPLE)
Mobile money has seen significant growth. Between 2017 and 2020, the number of transactions grew by a Compound Annual Growth Rate (CAGR) of 26%. However, the growth figure hides the drop in the value of transactions between 2018 and 2019. The average value of mobile money transactions declined by more than 52% because of a transaction tax introduced in July 2018. In the initial 41
formulation of the tax, a 1% excise duty was charged for every transaction, such as withdrawals, payments and deposits. The rate was then adjusted in September 2018 to 0.5% on withdrawals only.
TABLE15:ELECTRONICBANKINGINUGANDA
2015 2016 2017 2018 2019 2020
Uganda 3.0 3.9 20.4 20.2 22.0 34.4
Tanzania 3.3 5.7 22.7 27.3 39.1 38.2
Zambia 5.7 8.9 42.4 41.2 36.3 40.5
Rwanda 7.4 12.8 18.3 36.5 71.3 81.9
Kenya 12.9 19.2 36.6 217.2 248.2 239.5
South Korea 557.7 721.0 1198.9 2065.1 4543.8 5945.4
South Africa 272.8 917.6 9429.2 12031.6 14353.1 14421.8
Sub-Saharan Africa 19.0 68.6 577.9 735.3 806.3 799.5
Africa Eastern & Southern 29.6 95.0 894.6 1,164.6 1,322.7 1,310.2
World 573.4 1,267.4 3,518.8 6,171.4 9,989.0 11,515.6
Source: https://data.worldbank.org/indicator/IT.NET.SECR.P6
Year Ending Jun-19 Jun-20 Share % in June 2020
Active number of cards / users (millions)
Debit cards 2.4 2.4 56%
Credit cards 0.009 0.010 0%
Internet banking 0.56 0.76 18%
Mobile banking 0.7 1.1 26%
Total 3.7 4.3
Debit cards 3.4 13.1 27%
https://www.parliament.go.ug/cmis/views/79fcf1d6-c038-4f41-b2b0-14748e0ca9e4%253B1.0 41
26
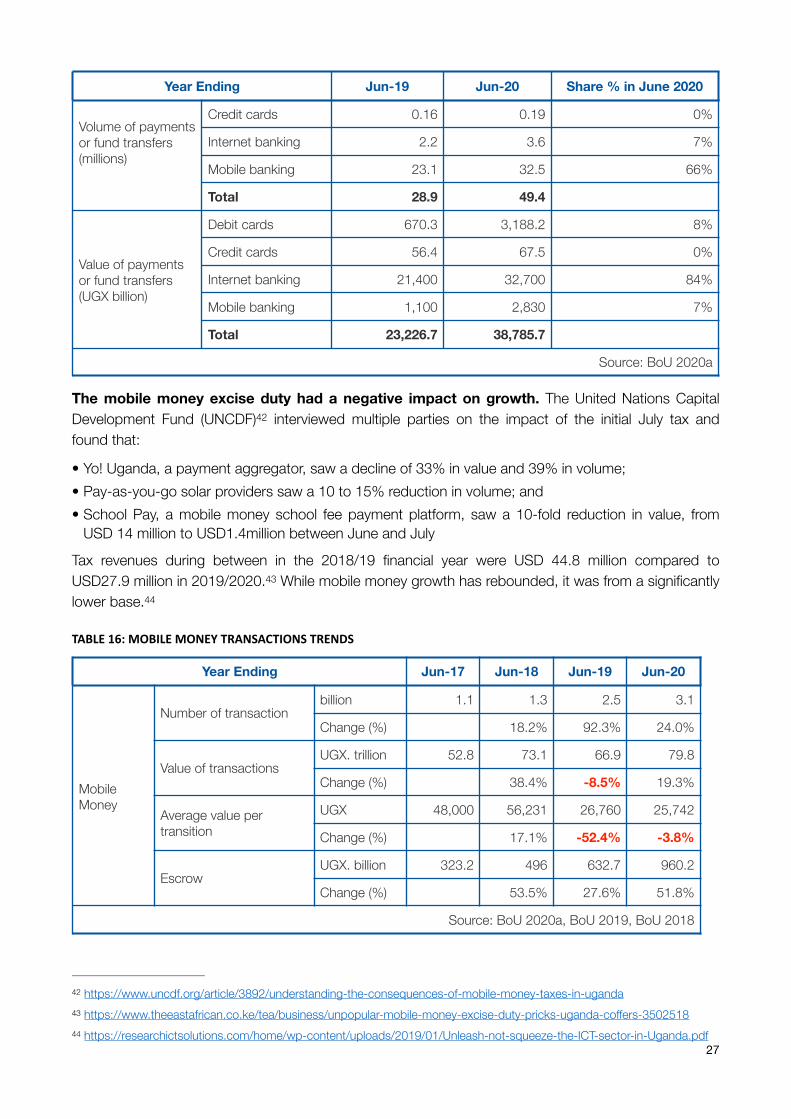
The mobile money excise duty had a negative impact on growth. The United Nations Capital Development Fund (UNCDF) interviewed multiple parties on the impact of the initial July tax and 42
found that:
• Yo! Uganda, a payment aggregator, saw a decline of 33% in value and 39% in volume; • Pay-as-you-go solar providers saw a 10 to 15% reduction in volume; and • School Pay, a mobile money school fee payment platform, saw a 10-fold reduction in value, from
USD 14 million to USD1.4million between June and July
Tax revenues during between in the 2018/19 financial year were USD 44.8 million compared to USD27.9 million in 2019/2020. While mobile money growth has rebounded, it was from a significantly 43
lower base. 44
TABLE16:MOBILEMONEYTRANSACTIONSTRENDS
Volume of payments or fund transfers (millions)
Credit cards 0.16 0.19 0%
Internet banking 2.2 3.6 7%
Mobile banking 23.1 32.5 66%
Total 28.9 49.4
Value of payments or fund transfers (UGX billion)
Debit cards 670.3 3,188.2 8%
Credit cards 56.4 67.5 0%
Internet banking 21,400 32,700 84%
Mobile banking 1,100 2,830 7%
Total 23,226.7 38,785.7
Source: BoU 2020a
Year Ending Jun-19 Jun-20 Share % in June 2020
Year Ending Jun-17 Jun-18 Jun-19 Jun-20
Mobile Money
Number of transactionbillion 1.1 1.3 2.5 3.1
Change (%) 18.2% 92.3% 24.0%
Value of transactionsUGX. trillion 52.8 73.1 66.9 79.8
Change (%) 38.4% -8.5% 19.3%
Average value per transition
UGX 48,000 56,231 26,760 25,742
Change (%) 17.1% -52.4% -3.8%
Escrow UGX. billion 323.2 496 632.7 960.2
Change (%) 53.5% 27.6% 51.8%
Source: BoU 2020a, BoU 2019, BoU 2018
https://www.uncdf.org/article/3892/understanding-the-consequences-of-mobile-money-taxes-in-uganda 42
https://www.theeastafrican.co.ke/tea/business/unpopular-mobile-money-excise-duty-pricks-uganda-coffers-3502518 43
https://researchictsolutions.com/home/wp-content/uploads/2019/01/Unleash-not-squeeze-the-ICT-sector-in-Uganda.pdf 44
27
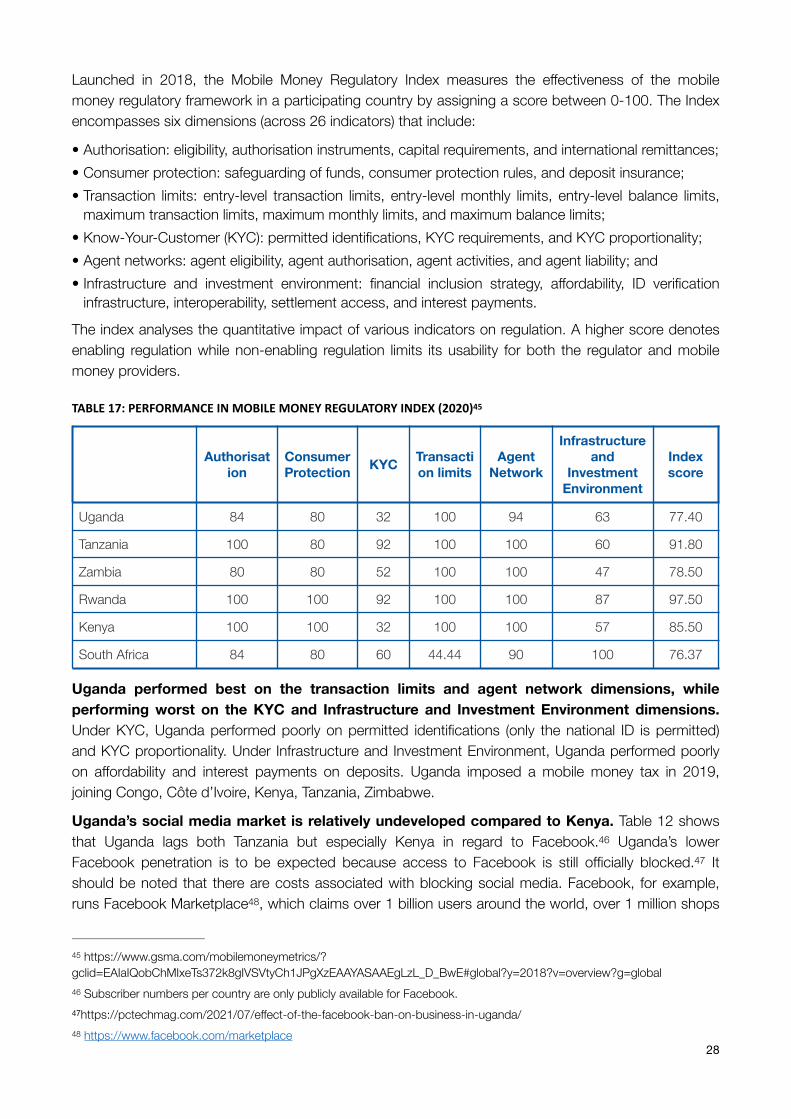
Launched in 2018, the Mobile Money Regulatory Index measures the effectiveness of the mobile money regulatory framework in a participating country by assigning a score between 0-100. The Index encompasses six dimensions (across 26 indicators) that include:
• Authorisation: eligibility, authorisation instruments, capital requirements, and international remittances; • Consumer protection: safeguarding of funds, consumer protection rules, and deposit insurance; • Transaction limits: entry-level transaction limits, entry-level monthly limits, entry-level balance limits,
maximum transaction limits, maximum monthly limits, and maximum balance limits; • Know-Your-Customer (KYC): permitted identifications, KYC requirements, and KYC proportionality; • Agent networks: agent eligibility, agent authorisation, agent activities, and agent liability; and • Infrastructure and investment environment: financial inclusion strategy, affordability, ID verification
infrastructure, interoperability, settlement access, and interest payments.
The index analyses the quantitative impact of various indicators on regulation. A higher score denotes enabling regulation while non-enabling regulation limits its usability for both the regulator and mobile money providers.
TABLE17:PERFORMANCEINMOBILEMONEYREGULATORYINDEX(2020) 45
Uganda performed best on the transaction limits and agent network dimensions, while performing worst on the KYC and Infrastructure and Investment Environment dimensions. Under KYC, Uganda performed poorly on permitted identifications (only the national ID is permitted) and KYC proportionality. Under Infrastructure and Investment Environment, Uganda performed poorly on affordability and interest payments on deposits. Uganda imposed a mobile money tax in 2019, joining Congo, Côte d’Ivoire, Kenya, Tanzania, Zimbabwe.
Uganda’s social media market is relatively undeveloped compared to Kenya. Table 12 shows that Uganda lags both Tanzania but especially Kenya in regard to Facebook. Uganda’s lower 46
Facebook penetration is to be expected because access to Facebook is still officially blocked. It 47
should be noted that there are costs associated with blocking social media. Facebook, for example, runs Facebook Marketplace , which claims over 1 billion users around the world, over 1 million shops 48
Authorisation
Consumer Protection KYC Transacti
on limitsAgent
Network
Infrastructure and
Investment Environment
Index score
Uganda 84 80 32 100 94 63 77.40
Tanzania 100 80 92 100 100 60 91.80
Zambia 80 80 52 100 100 47 78.50
Rwanda 100 100 92 100 100 87 97.50
Kenya 100 100 32 100 100 57 85.50
South Africa 84 80 60 44.44 90 100 76.37
https://www.gsma.com/mobilemoneymetrics/?45
gclid=EAIaIQobChMIxeTs372k8gIVSVtyCh1JPgXzEAAYASAAEgLzL_D_BwE#global?y=2018?v=overview?g=global Subscriber numbers per country are only publicly available for Facebook. 46
https://pctechmag.com/2021/07/effect-of-the-facebook-ban-on-business-in-uganda/47
https://www.facebook.com/marketplace 48
28
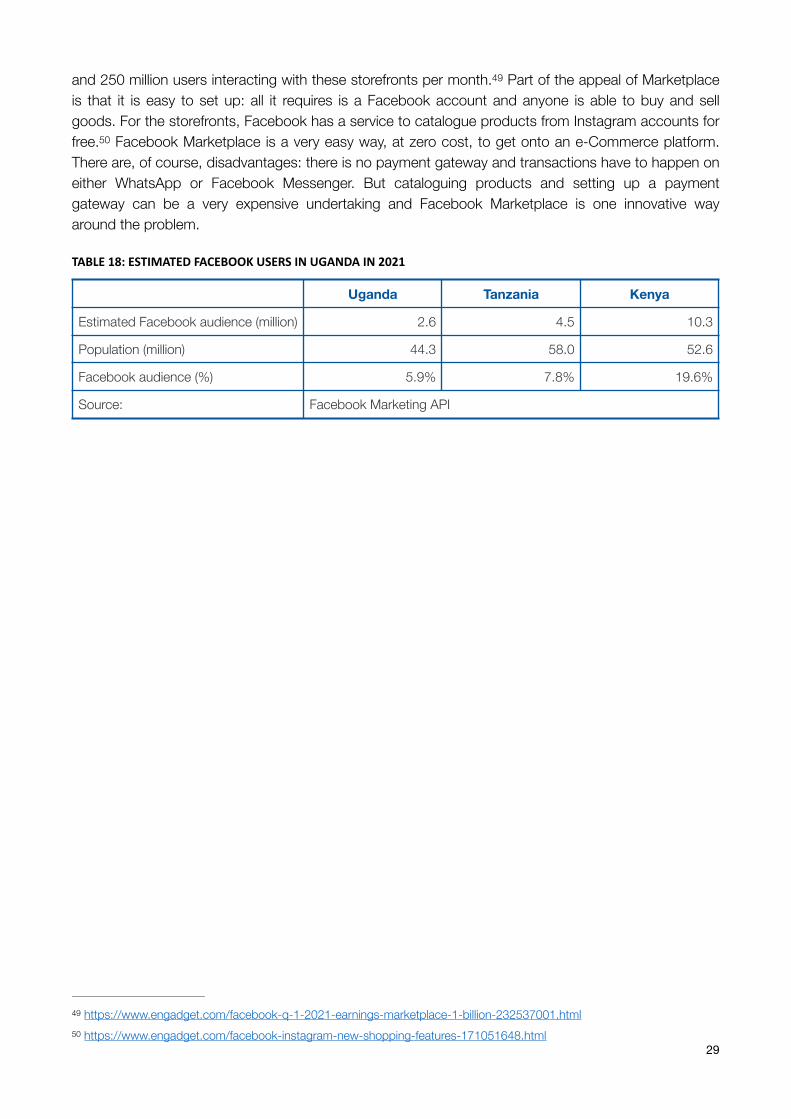
and 250 million users interacting with these storefronts per month. Part of the appeal of Marketplace 49
is that it is easy to set up: all it requires is a Facebook account and anyone is able to buy and sell goods. For the storefronts, Facebook has a service to catalogue products from Instagram accounts for free. Facebook Marketplace is a very easy way, at zero cost, to get onto an e-Commerce platform. 50
There are, of course, disadvantages: there is no payment gateway and transactions have to happen on either WhatsApp or Facebook Messenger. But cataloguing products and setting up a payment gateway can be a very expensive undertaking and Facebook Marketplace is one innovative way around the problem.
TABLE18:ESTIMATEDFACEBOOKUSERSINUGANDAIN2021
Uganda Tanzania Kenya
Estimated Facebook audience (million) 2.6 4.5 10.3
Population (million) 44.3 58.0 52.6
Facebook audience (%) 5.9% 7.8% 19.6%
Source: Facebook Marketing API
https://www.engadget.com/facebook-q-1-2021-earnings-marketplace-1-billion-232537001.html 49
https://www.engadget.com/facebook-instagram-new-shopping-features-171051648.html 50
29
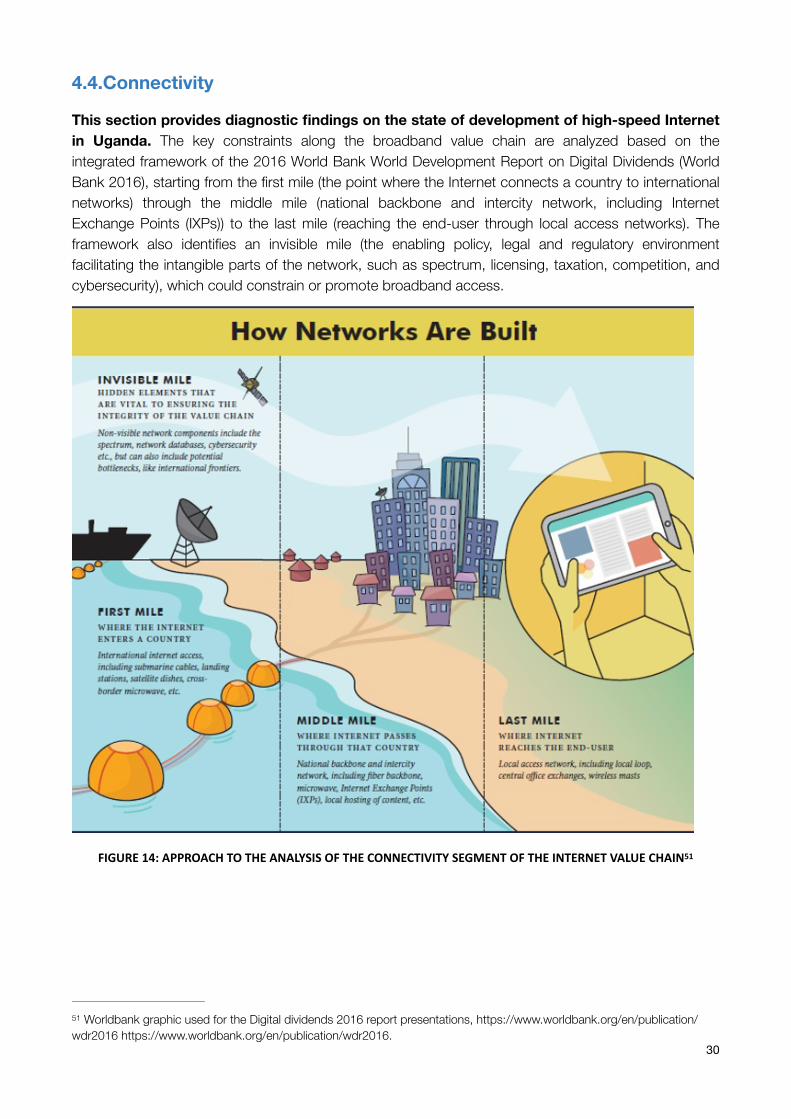
4.4.Connectivity
This section provides diagnostic findings on the state of development of high-speed Internet in Uganda. The key constraints along the broadband value chain are analyzed based on the integrated framework of the 2016 World Bank World Development Report on Digital Dividends (World Bank 2016), starting from the first mile (the point where the Internet connects a country to international networks) through the middle mile (national backbone and intercity network, including Internet Exchange Points (IXPs)) to the last mile (reaching the end-user through local access networks). The framework also identifies an invisible mile (the enabling policy, legal and regulatory environment facilitating the intangible parts of the network, such as spectrum, licensing, taxation, competition, and cybersecurity), which could constrain or promote broadband access.
FIGURE14:APPROACHTOTHEANALYSISOFTHECONNECTIVITYSEGMENTOFTHEINTERNETVALUECHAIN 51
Worldbank graphic used for the Digital dividends 2016 report presentations, https://www.worldbank.org/en/publication/51
wdr2016 https://www.worldbank.org/en/publication/wdr2016.30
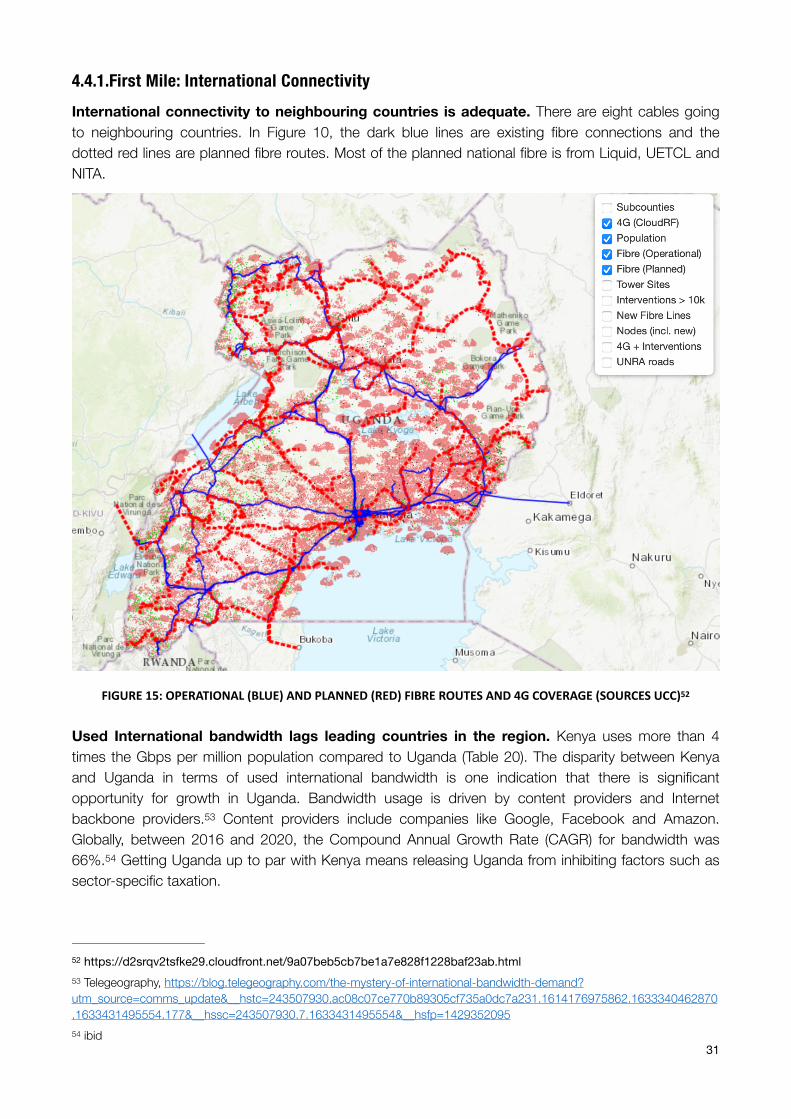
4.4.1.First Mile: International Connectivity International connectivity to neighbouring countries is adequate. There are eight cables going to neighbouring countries. In Figure 10, the dark blue lines are existing fibre connections and the dotted red lines are planned fibre routes. Most of the planned national fibre is from Liquid, UETCL and NITA.
FIGURE15:OPERATIONAL(BLUE)ANDPLANNED(RED)FIBREROUTESAND4GCOVERAGE(SOURCESUCC) 52
Used International bandwidth lags leading countries in the region. Kenya uses more than 4 times the Gbps per million population compared to Uganda (Table 20). The disparity between Kenya and Uganda in terms of used international bandwidth is one indication that there is significant opportunity for growth in Uganda. Bandwidth usage is driven by content providers and Internet backbone providers. Content providers include companies like Google, Facebook and Amazon. 53
Globally, between 2016 and 2020, the Compound Annual Growth Rate (CAGR) for bandwidth was 66%. Getting Uganda up to par with Kenya means releasing Uganda from inhibiting factors such as 54
sector-specific taxation.
https://d2srqv2tsfke29.cloudfront.net/9a07beb5cb7be1a7e828f1228baf23ab.html52
Telegeography, https://blog.telegeography.com/the-mystery-of-international-bandwidth-demand?53
utm_source=comms_update&__hstc=243507930.ac08c07ce770b89305cf735a0dc7a231.1614176975862.1633340462870.1633431495554.177&__hssc=243507930.7.1633431495554&__hsfp=1429352095
ibid54
31
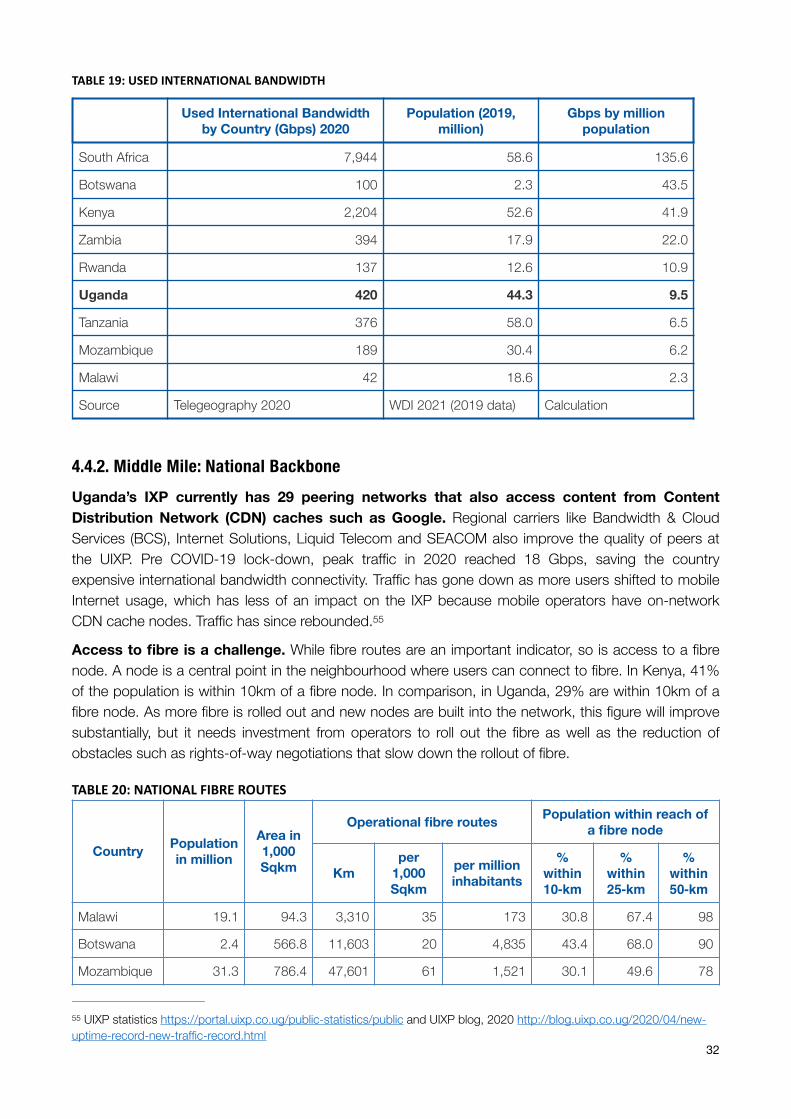
TABLE19:USEDINTERNATIONALBANDWIDTH
4.4.2. Middle Mile: National Backbone Uganda’s IXP currently has 29 peering networks that also access content from Content Distribution Network (CDN) caches such as Google. Regional carriers like Bandwidth & Cloud Services (BCS), Internet Solutions, Liquid Telecom and SEACOM also improve the quality of peers at the UIXP. Pre COVID-19 lock-down, peak traffic in 2020 reached 18 Gbps, saving the country expensive international bandwidth connectivity. Traffic has gone down as more users shifted to mobile Internet usage, which has less of an impact on the IXP because mobile operators have on-network CDN cache nodes. Traffic has since rebounded. 55
Access to fibre is a challenge. While fibre routes are an important indicator, so is access to a fibre node. A node is a central point in the neighbourhood where users can connect to fibre. In Kenya, 41% of the population is within 10km of a fibre node. In comparison, in Uganda, 29% are within 10km of a fibre node. As more fibre is rolled out and new nodes are built into the network, this figure will improve substantially, but it needs investment from operators to roll out the fibre as well as the reduction of obstacles such as rights-of-way negotiations that slow down the rollout of fibre.
TABLE20:NATIONALFIBREROUTES
Used International Bandwidth by Country (Gbps) 2020
Population (2019, million)
Gbps by million population
South Africa 7,944 58.6 135.6
Botswana 100 2.3 43.5
Kenya 2,204 52.6 41.9
Zambia 394 17.9 22.0
Rwanda 137 12.6 10.9
Uganda 420 44.3 9.5
Tanzania 376 58.0 6.5
Mozambique 189 30.4 6.2
Malawi 42 18.6 2.3
Source Telegeography 2020 WDI 2021 (2019 data) Calculation
Country Population in million
Area in 1,000 Sqkm
Operational fibre routes Population within reach of a fibre node
Kmper
1,000 Sqkm
per million inhabitants
% within 10-km
% within 25-km
% within 50-km
Malawi 19.1 94.3 3,310 35 173 30.8 67.4 98
Botswana 2.4 566.8 11,603 20 4,835 43.4 68.0 90
Mozambique 31.3 786.4 47,601 61 1,521 30.1 49.6 78
UIXP statistics https://portal.uixp.co.ug/public-statistics/public and UIXP blog, 2020 http://blog.uixp.co.ug/2020/04/new-55
uptime-record-new-traffic-record.html 32
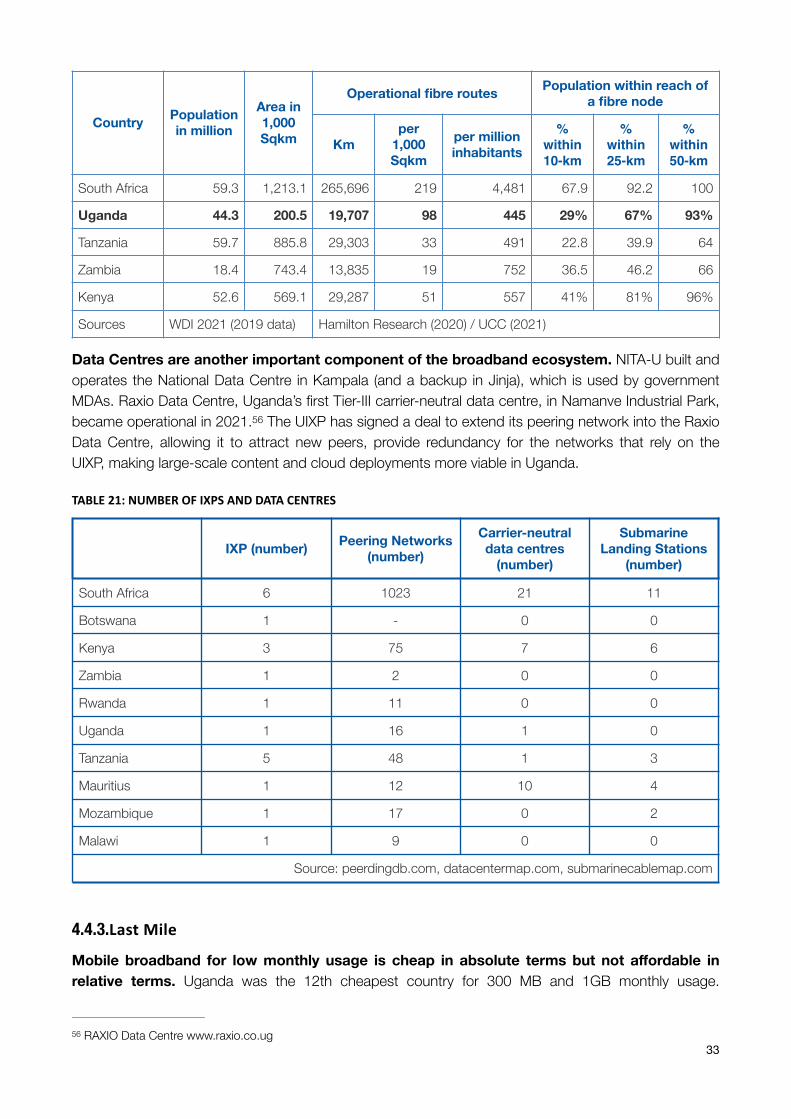
Data Centres are another important component of the broadband ecosystem. NITA-U built and operates the National Data Centre in Kampala (and a backup in Jinja), which is used by government MDAs. Raxio Data Centre, Uganda’s first Tier-III carrier-neutral data centre, in Namanve Industrial Park, became operational in 2021. The UIXP has signed a deal to extend its peering network into the Raxio 56
Data Centre, allowing it to attract new peers, provide redundancy for the networks that rely on the UIXP, making large-scale content and cloud deployments more viable in Uganda.
TABLE21:NUMBEROFIXPSANDDATACENTRES
4.4.3.LastMile
Mobile broadband for low monthly usage is cheap in absolute terms but not affordable in relative terms. Uganda was the 12th cheapest country for 300 MB and 1GB monthly usage.
South Africa 59.3 1,213.1 265,696 219 4,481 67.9 92.2 100
Uganda 44.3 200.5 19,707 98 445 29% 67% 93%
Tanzania 59.7 885.8 29,303 33 491 22.8 39.9 64
Zambia 18.4 743.4 13,835 19 752 36.5 46.2 66
Kenya 52.6 569.1 29,287 51 557 41% 81% 96%
Sources WDI 2021 (2019 data) Hamilton Research (2020) / UCC (2021)
Country Population in million
Area in 1,000 Sqkm
Operational fibre routes Population within reach of a fibre node
Kmper
1,000 Sqkm
per million inhabitants
% within 10-km
% within 25-km
% within 50-km
IXP (number) Peering Networks (number)
Carrier-neutral data centres
(number)
Submarine Landing Stations
(number)
South Africa 6 1023 21 11
Botswana 1 - 0 0
Kenya 3 75 7 6
Zambia 1 2 0 0
Rwanda 1 11 0 0
Uganda 1 16 1 0
Tanzania 5 48 1 3
Mauritius 1 12 10 4
Mozambique 1 17 0 2
Malawi 1 9 0 0
Source: peerdingdb.com, datacentermap.com, submarinecablemap.com
RAXIO Data Centre www.raxio.co.ug56
33
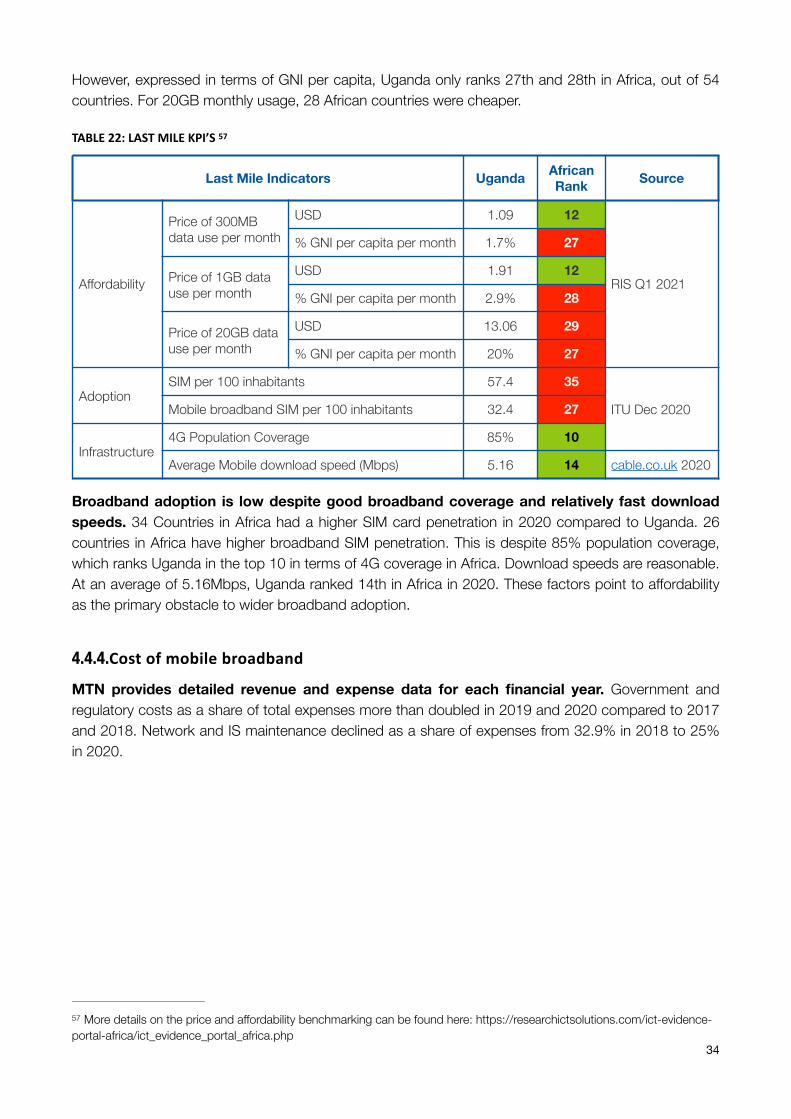
However, expressed in terms of GNI per capita, Uganda only ranks 27th and 28th in Africa, out of 54 countries. For 20GB monthly usage, 28 African countries were cheaper.
TABLE22:LASTMILEKPI’S 57
Broadband adoption is low despite good broadband coverage and relatively fast download speeds. 34 Countries in Africa had a higher SIM card penetration in 2020 compared to Uganda. 26 countries in Africa have higher broadband SIM penetration. This is despite 85% population coverage, which ranks Uganda in the top 10 in terms of 4G coverage in Africa. Download speeds are reasonable. At an average of 5.16Mbps, Uganda ranked 14th in Africa in 2020. These factors point to affordability as the primary obstacle to wider broadband adoption.
4.4.4.Costofmobilebroadband MTN provides detailed revenue and expense data for each financial year. Government and regulatory costs as a share of total expenses more than doubled in 2019 and 2020 compared to 2017 and 2018. Network and IS maintenance declined as a share of expenses from 32.9% in 2018 to 25% in 2020.
Last Mile Indicators Uganda African Rank Source
Affordability
Price of 300MB data use per month
USD 1.09 12
RIS Q1 2021
% GNI per capita per month 1.7% 27
Price of 1GB data use per month
USD 1.91 12
% GNI per capita per month 2.9% 28
Price of 20GB data use per month
USD 13.06 29
% GNI per capita per month 20% 27
AdoptionSIM per 100 inhabitants 57.4 35
ITU Dec 2020Mobile broadband SIM per 100 inhabitants 32.4 27
Infrastructure 4G Population Coverage 85% 10
Average Mobile download speed (Mbps) 5.16 14 cable.co.uk 2020
More details on the price and affordability benchmarking can be found here: https://researchictsolutions.com/ict-evidence-57
portal-africa/ict_evidence_portal_africa.php34
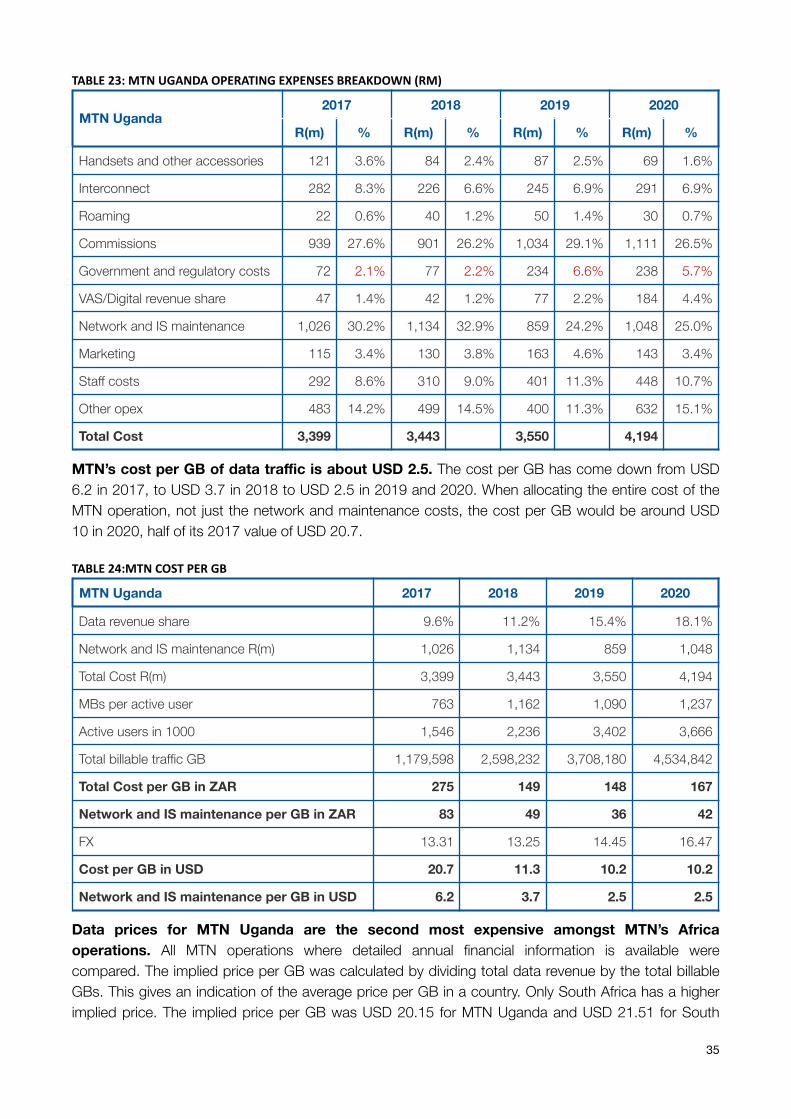
TABLE23:MTNUGANDAOPERATINGEXPENSESBREAKDOWN(RM)
MTN’s cost per GB of data traffic is about USD 2.5. The cost per GB has come down from USD 6.2 in 2017, to USD 3.7 in 2018 to USD 2.5 in 2019 and 2020. When allocating the entire cost of the MTN operation, not just the network and maintenance costs, the cost per GB would be around USD 10 in 2020, half of its 2017 value of USD 20.7.
TABLE24:MTNCOSTPERGB
Data prices for MTN Uganda are the second most expensive amongst MTN’s Africa operations. All MTN operations where detailed annual financial information is available were compared. The implied price per GB was calculated by dividing total data revenue by the total billable GBs. This gives an indication of the average price per GB in a country. Only South Africa has a higher implied price. The implied price per GB was USD 20.15 for MTN Uganda and USD 21.51 for South
MTN Uganda2017 2018 2019 2020
R(m) % R(m) % R(m) % R(m) %
Handsets and other accessories 121 3.6% 84 2.4% 87 2.5% 69 1.6%
Interconnect 282 8.3% 226 6.6% 245 6.9% 291 6.9%
Roaming 22 0.6% 40 1.2% 50 1.4% 30 0.7%
Commissions 939 27.6% 901 26.2% 1,034 29.1% 1,111 26.5%
Government and regulatory costs 72 2.1% 77 2.2% 234 6.6% 238 5.7%
VAS/Digital revenue share 47 1.4% 42 1.2% 77 2.2% 184 4.4%
Network and IS maintenance 1,026 30.2% 1,134 32.9% 859 24.2% 1,048 25.0%
Marketing 115 3.4% 130 3.8% 163 4.6% 143 3.4%
Staff costs 292 8.6% 310 9.0% 401 11.3% 448 10.7%
Other opex 483 14.2% 499 14.5% 400 11.3% 632 15.1%
Total Cost 3,399 3,443 3,550 4,194
MTN Uganda 2017 2018 2019 2020
Data revenue share 9.6% 11.2% 15.4% 18.1%
Network and IS maintenance R(m) 1,026 1,134 859 1,048
Total Cost R(m) 3,399 3,443 3,550 4,194
MBs per active user 763 1,162 1,090 1,237
Active users in 1000 1,546 2,236 3,402 3,666
Total billable traffic GB 1,179,598 2,598,232 3,708,180 4,534,842
Total Cost per GB in ZAR 275 149 148 167
Network and IS maintenance per GB in ZAR 83 49 36 42
FX 13.31 13.25 14.45 16.47
Cost per GB in USD 20.7 11.3 10.2 10.2
Network and IS maintenance per GB in USD 6.2 3.7 2.5 2.5
35
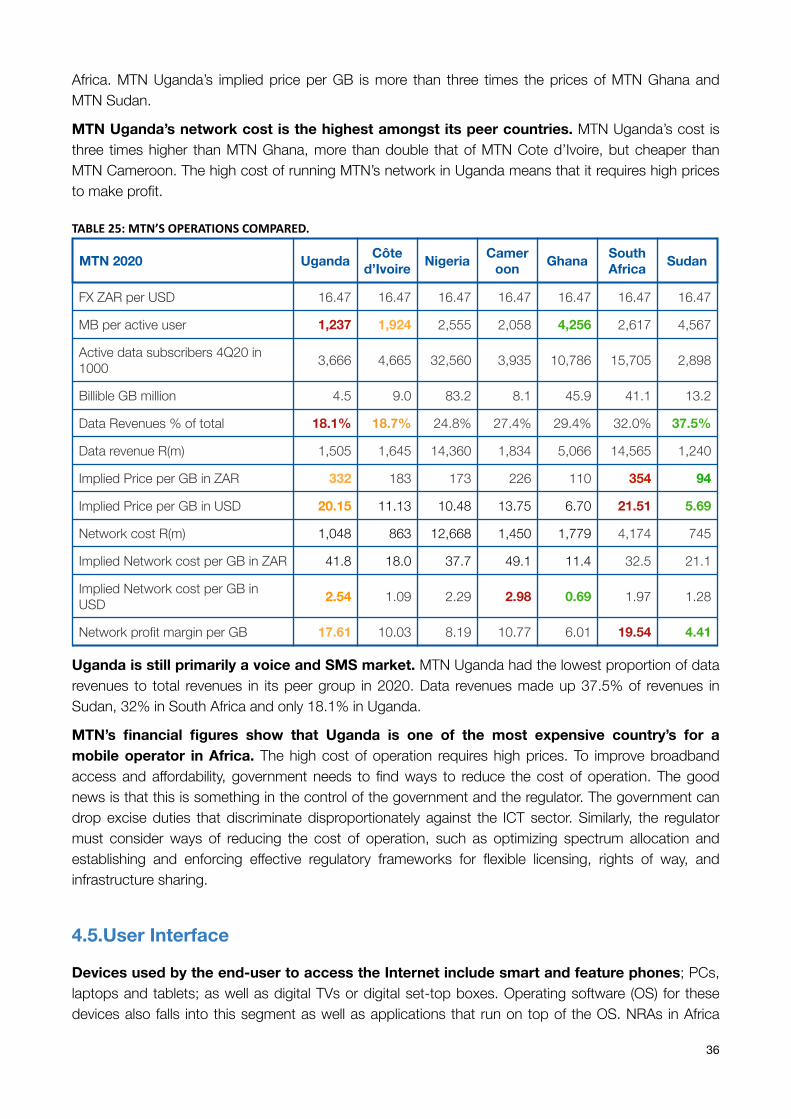
Africa. MTN Uganda’s implied price per GB is more than three times the prices of MTN Ghana and MTN Sudan.
MTN Uganda’s network cost is the highest amongst its peer countries. MTN Uganda’s cost is three times higher than MTN Ghana, more than double that of MTN Cote d’Ivoire, but cheaper than MTN Cameroon. The high cost of running MTN’s network in Uganda means that it requires high prices to make profit.
TABLE25:MTN’SOPERATIONSCOMPARED.
Uganda is still primarily a voice and SMS market. MTN Uganda had the lowest proportion of data revenues to total revenues in its peer group in 2020. Data revenues made up 37.5% of revenues in Sudan, 32% in South Africa and only 18.1% in Uganda.
MTN’s financial figures show that Uganda is one of the most expensive country’s for a mobile operator in Africa. The high cost of operation requires high prices. To improve broadband access and affordability, government needs to find ways to reduce the cost of operation. The good news is that this is something in the control of the government and the regulator. The government can drop excise duties that discriminate disproportionately against the ICT sector. Similarly, the regulator must consider ways of reducing the cost of operation, such as optimizing spectrum allocation and establishing and enforcing effective regulatory frameworks for flexible licensing, rights of way, and infrastructure sharing.
4.5.User Interface
Devices used by the end-user to access the Internet include smart and feature phones; PCs, laptops and tablets; as well as digital TVs or digital set-top boxes. Operating software (OS) for these devices also falls into this segment as well as applications that run on top of the OS. NRAs in Africa
MTN 2020 Uganda Côte d’Ivoire Nigeria Camer
oon Ghana South Africa Sudan
FX ZAR per USD 16.47 16.47 16.47 16.47 16.47 16.47 16.47
MB per active user 1,237 1,924 2,555 2,058 4,256 2,617 4,567
Active data subscribers 4Q20 in 1000 3,666 4,665 32,560 3,935 10,786 15,705 2,898
Billible GB million 4.5 9.0 83.2 8.1 45.9 41.1 13.2
Data Revenues % of total 18.1% 18.7% 24.8% 27.4% 29.4% 32.0% 37.5%
Data revenue R(m) 1,505 1,645 14,360 1,834 5,066 14,565 1,240
Implied Price per GB in ZAR 332 183 173 226 110 354 94
Implied Price per GB in USD 20.15 11.13 10.48 13.75 6.70 21.51 5.69
Network cost R(m) 1,048 863 12,668 1,450 1,779 4,174 745
Implied Network cost per GB in ZAR 41.8 18.0 37.7 49.1 11.4 32.5 21.1
Implied Network cost per GB in USD 2.54 1.09 2.29 2.98 0.69 1.97 1.28
Network profit margin per GB 17.61 10.03 8.19 10.77 6.01 19.54 4.41
36
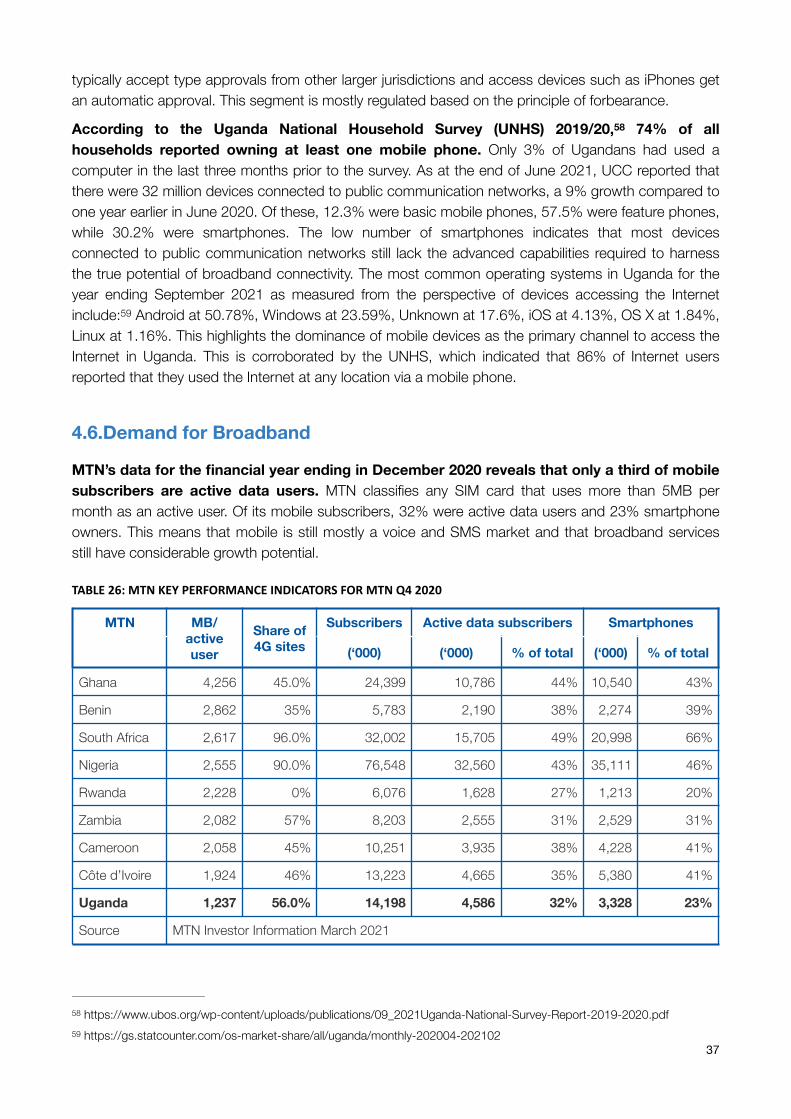
typically accept type approvals from other larger jurisdictions and access devices such as iPhones get an automatic approval. This segment is mostly regulated based on the principle of forbearance.
According to the Uganda National Household Survey (UNHS) 2019/20, 74% of all 58
households reported owning at least one mobile phone. Only 3% of Ugandans had used a computer in the last three months prior to the survey. As at the end of June 2021, UCC reported that there were 32 million devices connected to public communication networks, a 9% growth compared to one year earlier in June 2020. Of these, 12.3% were basic mobile phones, 57.5% were feature phones, while 30.2% were smartphones. The low number of smartphones indicates that most devices connected to public communication networks still lack the advanced capabilities required to harness the true potential of broadband connectivity. The most common operating systems in Uganda for the year ending September 2021 as measured from the perspective of devices accessing the Internet include: Android at 50.78%, Windows at 23.59%, Unknown at 17.6%, iOS at 4.13%, OS X at 1.84%, 59
Linux at 1.16%. This highlights the dominance of mobile devices as the primary channel to access the Internet in Uganda. This is corroborated by the UNHS, which indicated that 86% of Internet users reported that they used the Internet at any location via a mobile phone.
4.6.Demand for Broadband
MTN’s data for the financial year ending in December 2020 reveals that only a third of mobile subscribers are active data users. MTN classifies any SIM card that uses more than 5MB per month as an active user. Of its mobile subscribers, 32% were active data users and 23% smartphone owners. This means that mobile is still mostly a voice and SMS market and that broadband services still have considerable growth potential.
TABLE26:MTNKEYPERFORMANCEINDICATORSFORMTNQ42020
MTN MB/ active user
Share of 4G sites
Subscribers Active data subscribers Smartphones
(‘000) (‘000) % of total (‘000) % of total
Ghana 4,256 45.0% 24,399 10,786 44% 10,540 43%
Benin 2,862 35% 5,783 2,190 38% 2,274 39%
South Africa 2,617 96.0% 32,002 15,705 49% 20,998 66%
Nigeria 2,555 90.0% 76,548 32,560 43% 35,111 46%
Rwanda 2,228 0% 6,076 1,628 27% 1,213 20%
Zambia 2,082 57% 8,203 2,555 31% 2,529 31%
Cameroon 2,058 45% 10,251 3,935 38% 4,228 41%
Côte d’Ivoire 1,924 46% 13,223 4,665 35% 5,380 41%
Uganda 1,237 56.0% 14,198 4,586 32% 3,328 23%
Source MTN Investor Information March 2021
https://www.ubos.org/wp-content/uploads/publications/09_2021Uganda-National-Survey-Report-2019-2020.pdf58
https://gs.statcounter.com/os-market-share/all/uganda/monthly-202004-20210259
37
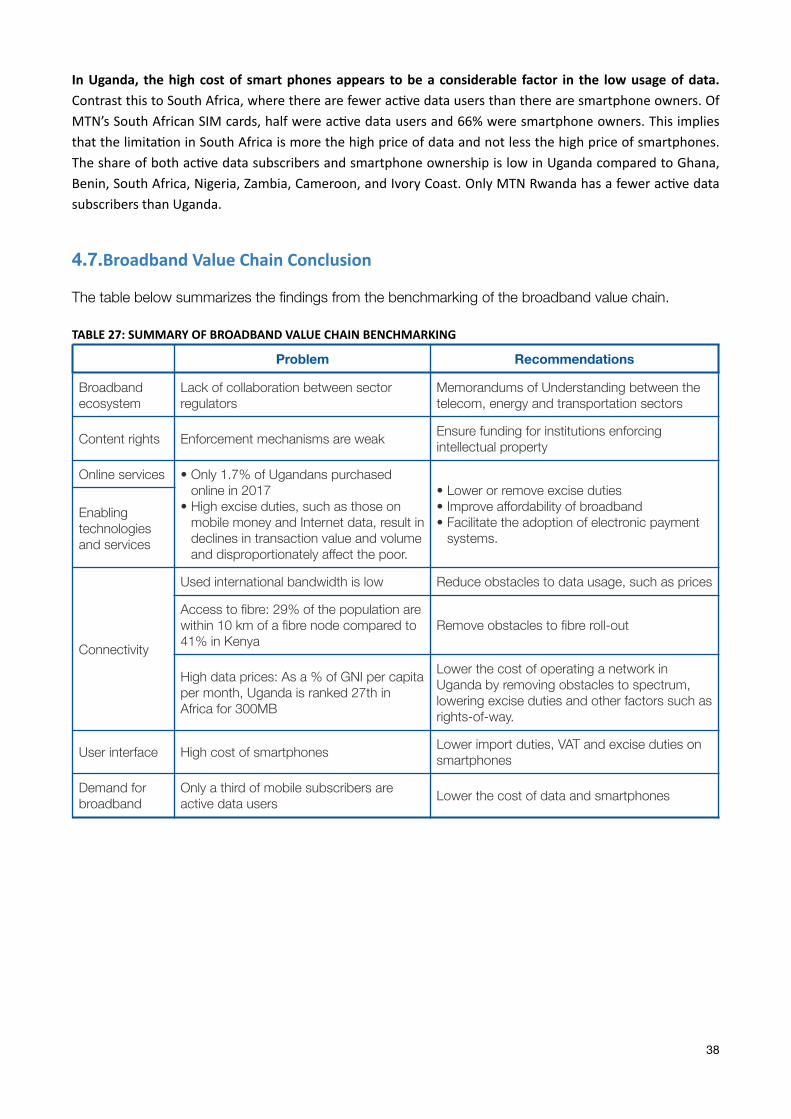
InUganda, thehighcostof smartphonesappears tobeaconsiderable factor in the lowusageofdata.ContrastthistoSouthAfrica,wheretherearefeweracKvedatausersthantherearesmartphoneowners.OfMTN’sSouthAfricanSIMcards,halfwereacKvedatausersand66%weresmartphoneowners.ThisimpliesthatthelimitaKoninSouthAfricaismorethehighpriceofdataandnotlessthehighpriceofsmartphones.TheshareofbothacKvedatasubscribersandsmartphoneownershipislowinUgandacomparedtoGhana,Benin,SouthAfrica,Nigeria,Zambia,Cameroon,andIvoryCoast.OnlyMTNRwandahasafeweracKvedatasubscribersthanUganda.
4.7.BroadbandValueChainConclusion
The table below summarizes the findings from the benchmarking of the broadband value chain.
TABLE27:SUMMARYOFBROADBANDVALUECHAINBENCHMARKING
Problem Recommendations
Broadband ecosystem
Lack of collaboration between sector regulators
Memorandums of Understanding between the telecom, energy and transportation sectors
Content rights Enforcement mechanisms are weak Ensure funding for institutions enforcing intellectual property
Online services • Only 1.7% of Ugandans purchased online in 2017
• High excise duties, such as those on mobile money and Internet data, result in declines in transaction value and volume and disproportionately affect the poor.
• Lower or remove excise duties • Improve affordability of broadband • Facilitate the adoption of electronic payment
systems.
Enabling technologies and services
Connectivity
Used international bandwidth is low Reduce obstacles to data usage, such as prices
Access to fibre: 29% of the population are within 10 km of a fibre node compared to 41% in Kenya
Remove obstacles to fibre roll-out
High data prices: As a % of GNI per capita per month, Uganda is ranked 27th in Africa for 300MB
Lower the cost of operating a network in Uganda by removing obstacles to spectrum, lowering excise duties and other factors such as rights-of-way.
User interface High cost of smartphones Lower import duties, VAT and excise duties on smartphones
Demand for broadband
Only a third of mobile subscribers are active data users Lower the cost of data and smartphones
38
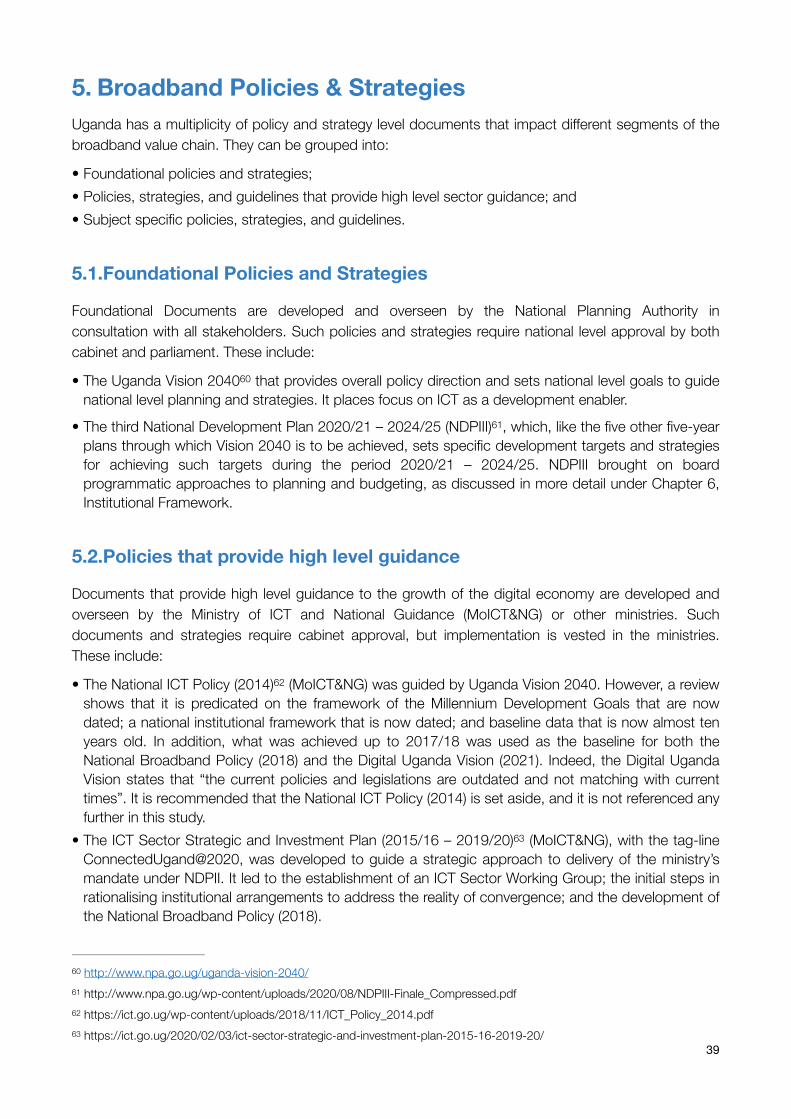
5. Broadband Policies & Strategies Uganda has a multiplicity of policy and strategy level documents that impact different segments of the broadband value chain. They can be grouped into:
• Foundational policies and strategies; • Policies, strategies, and guidelines that provide high level sector guidance; and • Subject specific policies, strategies, and guidelines.
5.1.Foundational Policies and Strategies
Foundational Documents are developed and overseen by the National Planning Authority in consultation with all stakeholders. Such policies and strategies require national level approval by both cabinet and parliament. These include:
• The Uganda Vision 2040 that provides overall policy direction and sets national level goals to guide 60
national level planning and strategies. It places focus on ICT as a development enabler.
• The third National Development Plan 2020/21 – 2024/25 (NDPIII) , which, like the five other five-year 61
plans through which Vision 2040 is to be achieved, sets specific development targets and strategies for achieving such targets during the period 2020/21 – 2024/25. NDPIII brought on board programmatic approaches to planning and budgeting, as discussed in more detail under Chapter 6, Institutional Framework.
5.2.Policies that provide high level guidance
Documents that provide high level guidance to the growth of the digital economy are developed and overseen by the Ministry of ICT and National Guidance (MoICT&NG) or other ministries. Such documents and strategies require cabinet approval, but implementation is vested in the ministries. These include:
• The National ICT Policy (2014) (MoICT&NG) was guided by Uganda Vision 2040. However, a review 62
shows that it is predicated on the framework of the Millennium Development Goals that are now dated; a national institutional framework that is now dated; and baseline data that is now almost ten years old. In addition, what was achieved up to 2017/18 was used as the baseline for both the National Broadband Policy (2018) and the Digital Uganda Vision (2021). Indeed, the Digital Uganda Vision states that “the current policies and legislations are outdated and not matching with current times”. It is recommended that the National ICT Policy (2014) is set aside, and it is not referenced any further in this study.
• The ICT Sector Strategic and Investment Plan (2015/16 – 2019/20) (MoICT&NG), with the tag-line 63
ConnectedUgand@2020, was developed to guide a strategic approach to delivery of the ministry’s mandate under NDPII. It led to the establishment of an ICT Sector Working Group; the initial steps in rationalising institutional arrangements to address the reality of convergence; and the development of the National Broadband Policy (2018).
http://www.npa.go.ug/uganda-vision-2040/ 60
http://www.npa.go.ug/wp-content/uploads/2020/08/NDPIII-Finale_Compressed.pdf61
https://ict.go.ug/wp-content/uploads/2018/11/ICT_Policy_2014.pdf62
https://ict.go.ug/2020/02/03/ict-sector-strategic-and-investment-plan-2015-16-2019-20/63
39
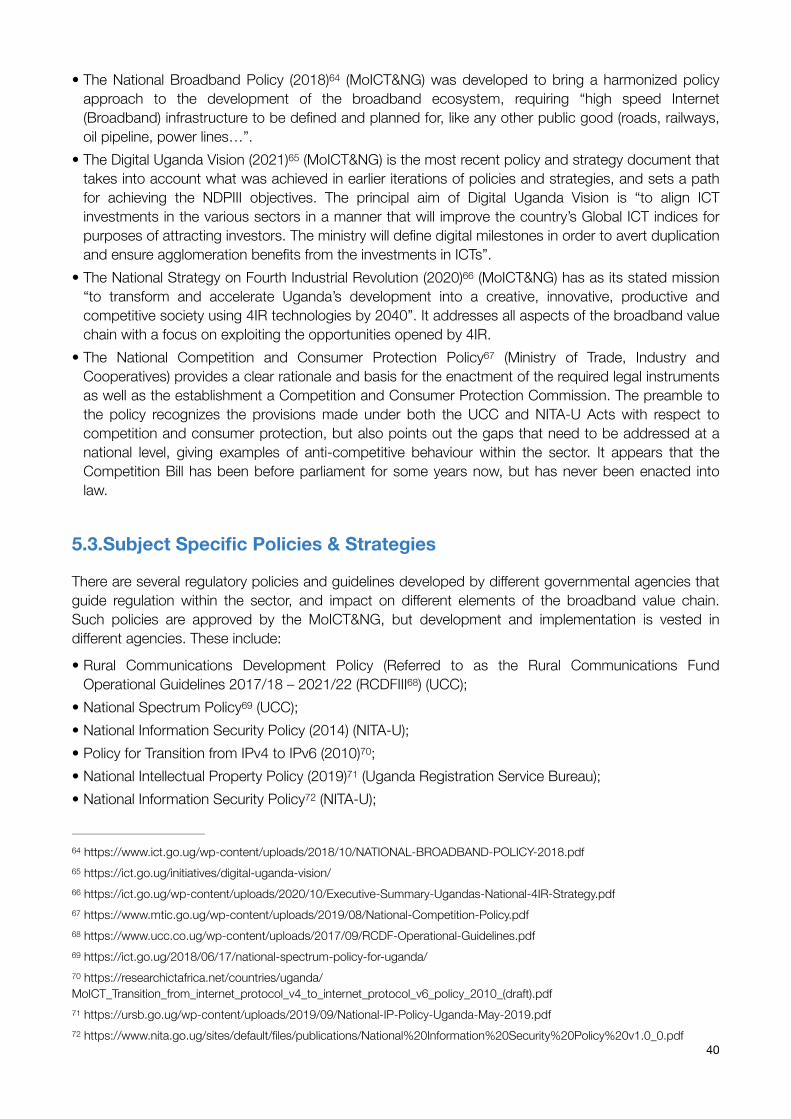
• The National Broadband Policy (2018) (MoICT&NG) was developed to bring a harmonized policy 64
approach to the development of the broadband ecosystem, requiring “high speed Internet (Broadband) infrastructure to be defined and planned for, like any other public good (roads, railways, oil pipeline, power lines…”.
• The Digital Uganda Vision (2021) (MoICT&NG) is the most recent policy and strategy document that 65
takes into account what was achieved in earlier iterations of policies and strategies, and sets a path for achieving the NDPIII objectives. The principal aim of Digital Uganda Vision is “to align ICT investments in the various sectors in a manner that will improve the country’s Global ICT indices for purposes of attracting investors. The ministry will define digital milestones in order to avert duplication and ensure agglomeration benefits from the investments in ICTs”.
• The National Strategy on Fourth Industrial Revolution (2020) (MoICT&NG) has as its stated mission 66
“to transform and accelerate Uganda’s development into a creative, innovative, productive and competitive society using 4IR technologies by 2040”. It addresses all aspects of the broadband value chain with a focus on exploiting the opportunities opened by 4IR.
• The National Competition and Consumer Protection Policy (Ministry of Trade, Industry and 67
Cooperatives) provides a clear rationale and basis for the enactment of the required legal instruments as well as the establishment a Competition and Consumer Protection Commission. The preamble to the policy recognizes the provisions made under both the UCC and NITA-U Acts with respect to competition and consumer protection, but also points out the gaps that need to be addressed at a national level, giving examples of anti-competitive behaviour within the sector. It appears that the Competition Bill has been before parliament for some years now, but has never been enacted into law.
5.3.Subject Specific Policies & Strategies
There are several regulatory policies and guidelines developed by different governmental agencies that guide regulation within the sector, and impact on different elements of the broadband value chain. Such policies are approved by the MoICT&NG, but development and implementation is vested in different agencies. These include:
• Rural Communications Development Policy (Referred to as the Rural Communications Fund Operational Guidelines 2017/18 – 2021/22 (RCDFIII ) (UCC); 68
• National Spectrum Policy (UCC); 69
• National Information Security Policy (2014) (NITA-U); • Policy for Transition from IPv4 to IPv6 (2010) ; 70
• National Intellectual Property Policy (2019) (Uganda Registration Service Bureau); 71
• National Information Security Policy (NITA-U); 72
https://www.ict.go.ug/wp-content/uploads/2018/10/NATIONAL-BROADBAND-POLICY-2018.pdf64
https://ict.go.ug/initiatives/digital-uganda-vision/65
https://ict.go.ug/wp-content/uploads/2020/10/Executive-Summary-Ugandas-National-4IR-Strategy.pdf66
https://www.mtic.go.ug/wp-content/uploads/2019/08/National-Competition-Policy.pdf67
https://www.ucc.co.ug/wp-content/uploads/2017/09/RCDF-Operational-Guidelines.pdf68
https://ict.go.ug/2018/06/17/national-spectrum-policy-for-uganda/69
https://researchictafrica.net/countries/uganda/70
MoICT_Transition_from_internet_protocol_v4_to_internet_protocol_v6_policy_2010_(draft).pdf https://ursb.go.ug/wp-content/uploads/2019/09/National-IP-Policy-Uganda-May-2019.pdf71
https://www.nita.go.ug/sites/default/files/publications/National%20Information%20Security%20Policy%20v1.0_0.pdf72
40
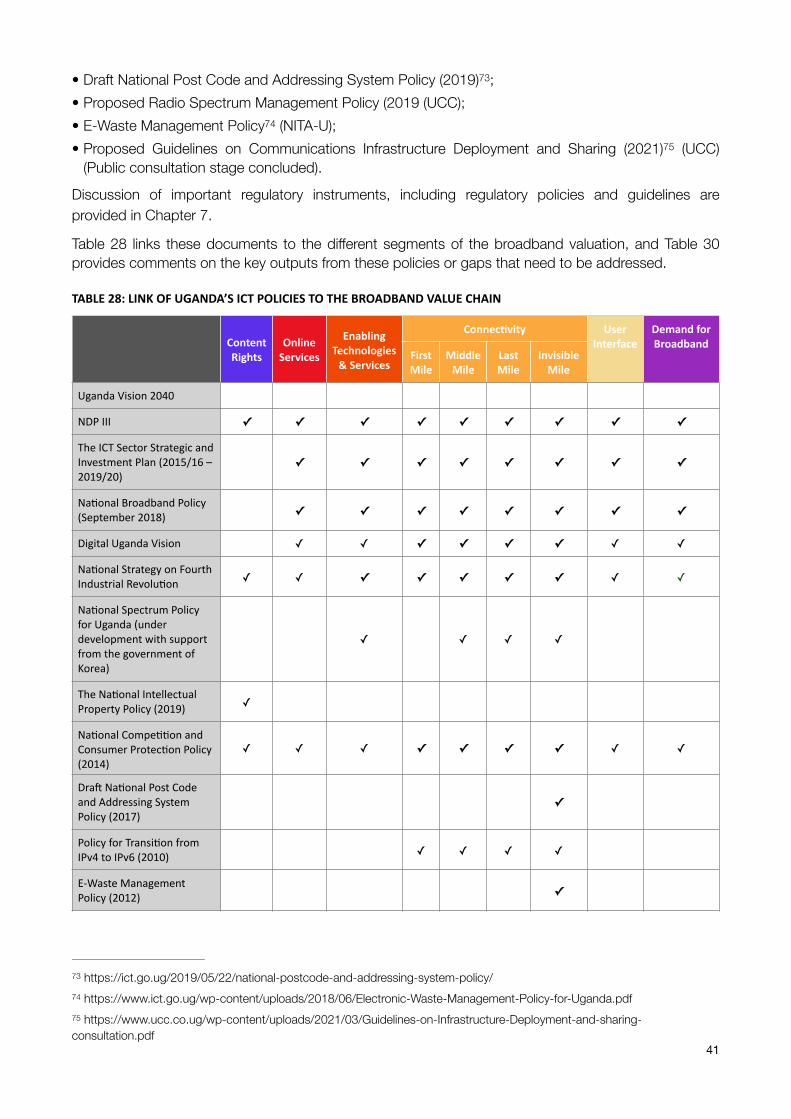
• Draft National Post Code and Addressing System Policy (2019) ; 73
• Proposed Radio Spectrum Management Policy (2019 (UCC); • E-Waste Management Policy (NITA-U); 74
• Proposed Guidelines on Communications Infrastructure Deployment and Sharing (2021) (UCC) 75
(Public consultation stage concluded).
Discussion of important regulatory instruments, including regulatory policies and guidelines are provided in Chapter 7.
Table 28 links these documents to the different segments of the broadband valuation, and Table 30 provides comments on the key outputs from these policies or gaps that need to be addressed.
TABLE28:LINKOFUGANDA’SICTPOLICIESTOTHEBROADBANDVALUECHAIN
ContentRights
OnlineServices
EnablingTechnologies&Services
Connec$vity UserInterface
DemandforBroadband
FirstMile
MiddleMile
LastMile
InvisibleMile
UgandaVision2040
NDPIII ✓ ✓ ✓ ✓ ✓ ✓ ✓ ✓ ✓
TheICTSectorStrategicandInvestmentPlan(2015/16–2019/20)
✓ ✓ ✓ ✓ ✓ ✓ ✓ ✓
NaKonalBroadbandPolicy(September2018) ✓ ✓ ✓ ✓ ✓ ✓ ✓ ✓
DigitalUgandaVision ✓ ✓ ✓ ✓ ✓ ✓ ✓ ✓
NaKonalStrategyonFourthIndustrialRevoluKon ✓ ✓ ✓ ✓ ✓ ✓ ✓ ✓ ✓
NaKonalSpectrumPolicyforUganda(underdevelopmentwithsupportfromthegovernmentofKorea)
✓ ✓ ✓ ✓
TheNaKonalIntellectualPropertyPolicy(2019) ✓
NaKonalCompeKKonandConsumerProtecKonPolicy(2014)
✓ ✓ ✓ ✓ ✓ ✓ ✓ ✓ ✓
Dra]NaKonalPostCodeandAddressingSystemPolicy(2017)
✓
PolicyforTransiKonfromIPv4toIPv6(2010) ✓ ✓ ✓ ✓
E-WasteManagementPolicy(2012) ✓
https://ict.go.ug/2019/05/22/national-postcode-and-addressing-system-policy/73
https://www.ict.go.ug/wp-content/uploads/2018/06/Electronic-Waste-Management-Policy-for-Uganda.pdf74
https://www.ucc.co.ug/wp-content/uploads/2021/03/Guidelines-on-Infrastructure-Deployment-and-sharing-75
consultation.pdf41
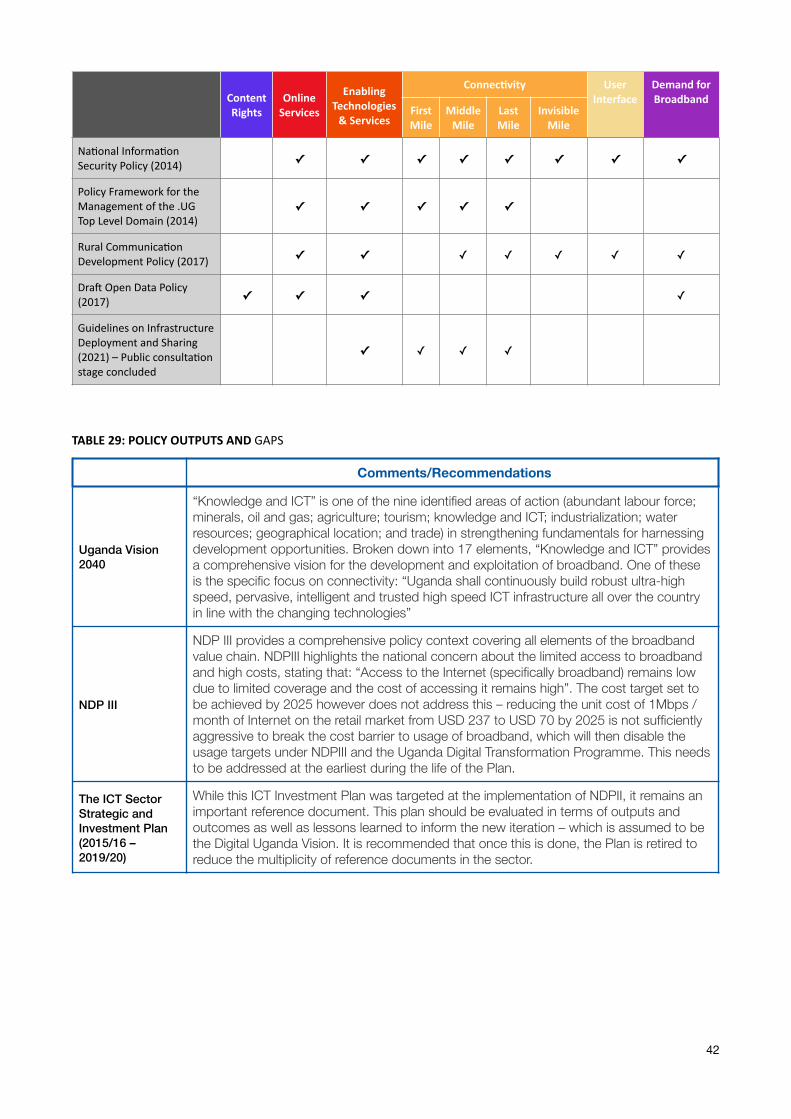
TABLE29:POLICYOUTPUTSANDGAPS
NaKonalInformaKonSecurityPolicy(2014) ✓ ✓ ✓ ✓ ✓ ✓ ✓ ✓
PolicyFrameworkfortheManagementofthe.UGTopLevelDomain(2014)
✓ ✓ ✓ ✓ ✓
RuralCommunicaKonDevelopmentPolicy(2017) ✓ ✓ ✓ ✓ ✓ ✓ ✓
Dra]OpenDataPolicy(2017) ✓ ✓ ✓ ✓
GuidelinesonInfrastructureDeploymentandSharing(2021)–PublicconsultaKonstageconcluded
✓ ✓ ✓ ✓
ContentRights
OnlineServices
EnablingTechnologies&Services
Connec$vity UserInterface
DemandforBroadband
FirstMile
MiddleMile
LastMile
InvisibleMile
Comments/Recommendations
Uganda Vision 2040
“Knowledge and ICT” is one of the nine identified areas of action (abundant labour force; minerals, oil and gas; agriculture; tourism; knowledge and ICT; industrialization; water resources; geographical location; and trade) in strengthening fundamentals for harnessing development opportunities. Broken down into 17 elements, “Knowledge and ICT” provides a comprehensive vision for the development and exploitation of broadband. One of these is the specific focus on connectivity: “Uganda shall continuously build robust ultra-high speed, pervasive, intelligent and trusted high speed ICT infrastructure all over the country in line with the changing technologies”
NDP III
NDP III provides a comprehensive policy context covering all elements of the broadband value chain. NDPIII highlights the national concern about the limited access to broadband and high costs, stating that: “Access to the Internet (specifically broadband) remains low due to limited coverage and the cost of accessing it remains high”. The cost target set to be achieved by 2025 however does not address this – reducing the unit cost of 1Mbps /month of Internet on the retail market from USD 237 to USD 70 by 2025 is not sufficiently aggressive to break the cost barrier to usage of broadband, which will then disable the usage targets under NDPIII and the Uganda Digital Transformation Programme. This needs to be addressed at the earliest during the life of the Plan.
The ICT Sector Strategic and Investment Plan (2015/16 – 2019/20)
While this ICT Investment Plan was targeted at the implementation of NDPII, it remains an important reference document. This plan should be evaluated in terms of outputs and outcomes as well as lessons learned to inform the new iteration – which is assumed to be the Digital Uganda Vision. It is recommended that once this is done, the Plan is retired to reduce the multiplicity of reference documents in the sector.
42
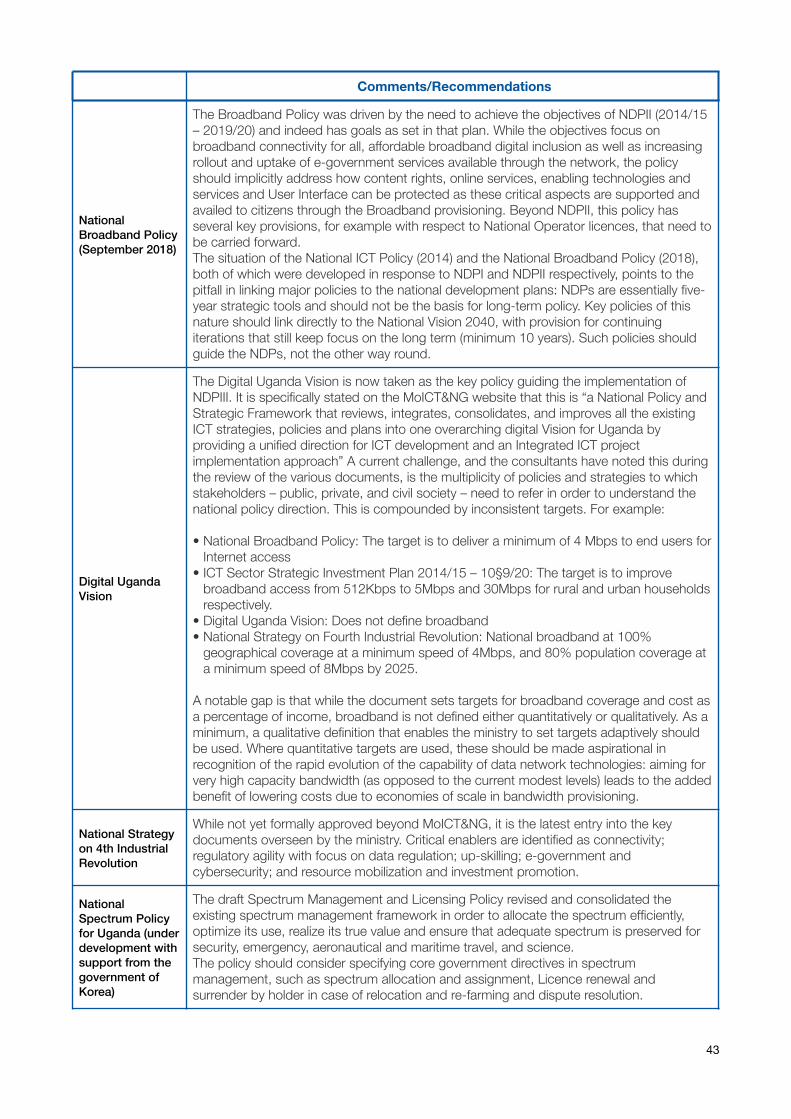
National Broadband Policy (September 2018)
The Broadband Policy was driven by the need to achieve the objectives of NDPII (2014/15 – 2019/20) and indeed has goals as set in that plan. While the objectives focus on broadband connectivity for all, affordable broadband digital inclusion as well as increasing rollout and uptake of e-government services available through the network, the policy should implicitly address how content rights, online services, enabling technologies and services and User Interface can be protected as these critical aspects are supported and availed to citizens through the Broadband provisioning. Beyond NDPII, this policy has several key provisions, for example with respect to National Operator licences, that need to be carried forward. The situation of the National ICT Policy (2014) and the National Broadband Policy (2018), both of which were developed in response to NDPI and NDPII respectively, points to the pitfall in linking major policies to the national development plans: NDPs are essentially five-year strategic tools and should not be the basis for long-term policy. Key policies of this nature should link directly to the National Vision 2040, with provision for continuing iterations that still keep focus on the long term (minimum 10 years). Such policies should guide the NDPs, not the other way round.
Digital Uganda Vision
The Digital Uganda Vision is now taken as the key policy guiding the implementation of NDPIII. It is specifically stated on the MoICT&NG website that this is “a National Policy and Strategic Framework that reviews, integrates, consolidates, and improves all the existing ICT strategies, policies and plans into one overarching digital Vision for Uganda by providing a unified direction for ICT development and an Integrated ICT project implementation approach” A current challenge, and the consultants have noted this during the review of the various documents, is the multiplicity of policies and strategies to which stakeholders – public, private, and civil society – need to refer in order to understand the national policy direction. This is compounded by inconsistent targets. For example:
• National Broadband Policy: The target is to deliver a minimum of 4 Mbps to end users for Internet access
• ICT Sector Strategic Investment Plan 2014/15 – 10§9/20: The target is to improve broadband access from 512Kbps to 5Mbps and 30Mbps for rural and urban households respectively.
• Digital Uganda Vision: Does not define broadband • National Strategy on Fourth Industrial Revolution: National broadband at 100%
geographical coverage at a minimum speed of 4Mbps, and 80% population coverage at a minimum speed of 8Mbps by 2025.
A notable gap is that while the document sets targets for broadband coverage and cost as a percentage of income, broadband is not defined either quantitatively or qualitatively. As a minimum, a qualitative definition that enables the ministry to set targets adaptively should be used. Where quantitative targets are used, these should be made aspirational in recognition of the rapid evolution of the capability of data network technologies: aiming for very high capacity bandwidth (as opposed to the current modest levels) leads to the added benefit of lowering costs due to economies of scale in bandwidth provisioning.
National Strategy on 4th Industrial Revolution
While not yet formally approved beyond MoICT&NG, it is the latest entry into the key documents overseen by the ministry. Critical enablers are identified as connectivity; regulatory agility with focus on data regulation; up-skilling; e-government and cybersecurity; and resource mobilization and investment promotion.
National Spectrum Policy for Uganda (under development with support from the government of Korea)
The draft Spectrum Management and Licensing Policy revised and consolidated the existing spectrum management framework in order to allocate the spectrum efficiently, optimize its use, realize its true value and ensure that adequate spectrum is preserved for security, emergency, aeronautical and maritime travel, and science. The policy should consider specifying core government directives in spectrum management, such as spectrum allocation and assignment, Licence renewal and surrender by holder in case of relocation and re-farming and dispute resolution.
Comments/Recommendations
43
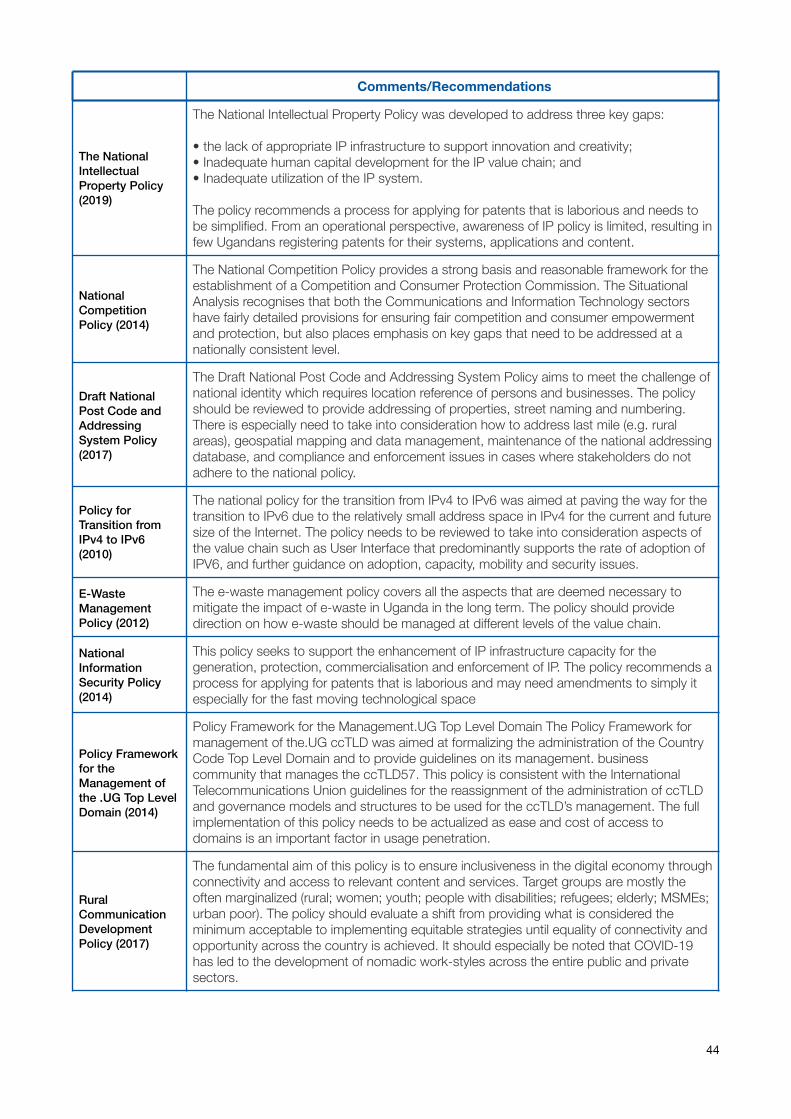
The National Intellectual Property Policy (2019)
The National Intellectual Property Policy was developed to address three key gaps:
• the lack of appropriate IP infrastructure to support innovation and creativity; • Inadequate human capital development for the IP value chain; and • Inadequate utilization of the IP system.
The policy recommends a process for applying for patents that is laborious and needs to be simplified. From an operational perspective, awareness of IP policy is limited, resulting in few Ugandans registering patents for their systems, applications and content.
National Competition Policy (2014)
The National Competition Policy provides a strong basis and reasonable framework for the establishment of a Competition and Consumer Protection Commission. The Situational Analysis recognises that both the Communications and Information Technology sectors have fairly detailed provisions for ensuring fair competition and consumer empowerment and protection, but also places emphasis on key gaps that need to be addressed at a nationally consistent level.
Draft National Post Code and Addressing System Policy (2017)
The Draft National Post Code and Addressing System Policy aims to meet the challenge of national identity which requires location reference of persons and businesses. The policy should be reviewed to provide addressing of properties, street naming and numbering. There is especially need to take into consideration how to address last mile (e.g. rural areas), geospatial mapping and data management, maintenance of the national addressing database, and compliance and enforcement issues in cases where stakeholders do not adhere to the national policy.
Policy for Transition from IPv4 to IPv6 (2010)
The national policy for the transition from IPv4 to IPv6 was aimed at paving the way for the transition to IPv6 due to the relatively small address space in IPv4 for the current and future size of the Internet. The policy needs to be reviewed to take into consideration aspects of the value chain such as User Interface that predominantly supports the rate of adoption of IPV6, and further guidance on adoption, capacity, mobility and security issues.
E-Waste Management Policy (2012)
The e-waste management policy covers all the aspects that are deemed necessary to mitigate the impact of e-waste in Uganda in the long term. The policy should provide direction on how e-waste should be managed at different levels of the value chain.
National Information Security Policy (2014)
This policy seeks to support the enhancement of IP infrastructure capacity for the generation, protection, commercialisation and enforcement of IP. The policy recommends a process for applying for patents that is laborious and may need amendments to simply it especially for the fast moving technological space
Policy Framework for the Management of the .UG Top Level Domain (2014)
Policy Framework for the Management.UG Top Level Domain The Policy Framework for management of the.UG ccTLD was aimed at formalizing the administration of the Country Code Top Level Domain and to provide guidelines on its management. business community that manages the ccTLD57. This policy is consistent with the International Telecommunications Union guidelines for the reassignment of the administration of ccTLD and governance models and structures to be used for the ccTLD’s management. The full implementation of this policy needs to be actualized as ease and cost of access to domains is an important factor in usage penetration.
Rural Communication Development Policy (2017)
The fundamental aim of this policy is to ensure inclusiveness in the digital economy through connectivity and access to relevant content and services. Target groups are mostly the often marginalized (rural; women; youth; people with disabilities; refugees; elderly; MSMEs; urban poor). The policy should evaluate a shift from providing what is considered the minimum acceptable to implementing equitable strategies until equality of connectivity and opportunity across the country is achieved. It should especially be noted that COVID-19 has led to the development of nomadic work-styles across the entire public and private sectors.
Comments/Recommendations
44
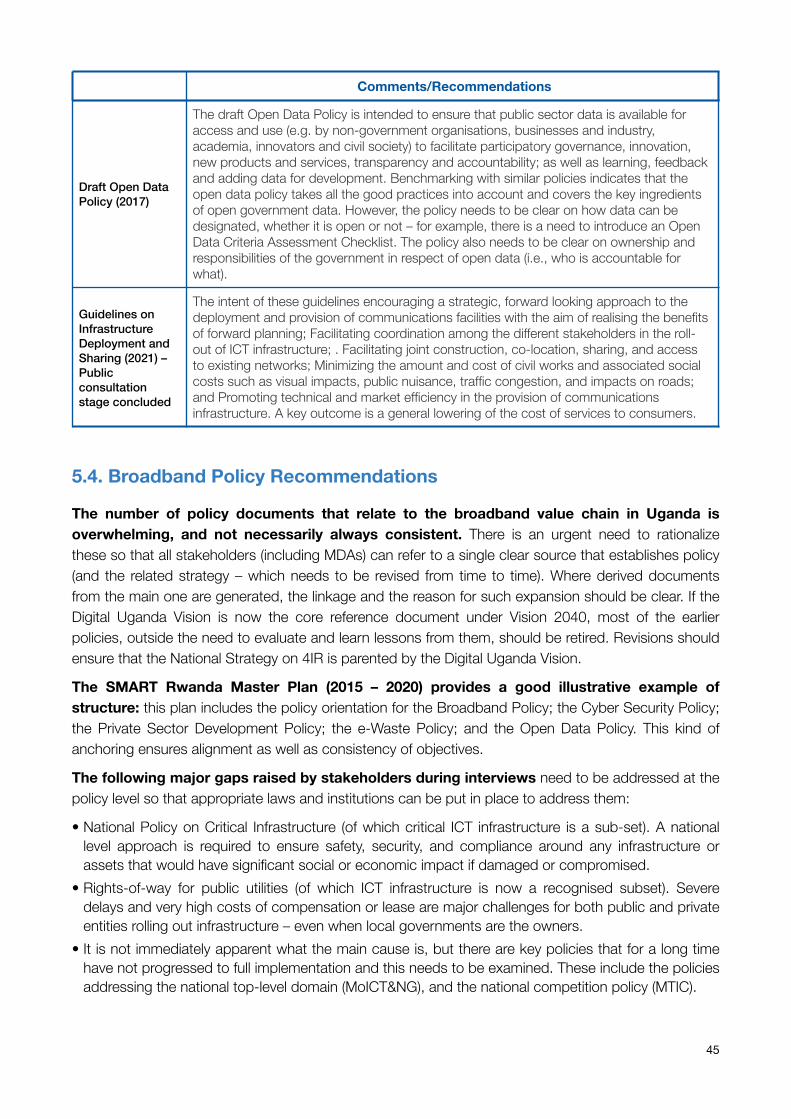
5.4. Broadband Policy Recommendations
The number of policy documents that relate to the broadband value chain in Uganda is overwhelming, and not necessarily always consistent. There is an urgent need to rationalize these so that all stakeholders (including MDAs) can refer to a single clear source that establishes policy (and the related strategy – which needs to be revised from time to time). Where derived documents from the main one are generated, the linkage and the reason for such expansion should be clear. If the Digital Uganda Vision is now the core reference document under Vision 2040, most of the earlier policies, outside the need to evaluate and learn lessons from them, should be retired. Revisions should ensure that the National Strategy on 4IR is parented by the Digital Uganda Vision.
The SMART Rwanda Master Plan (2015 – 2020) provides a good illustrative example of structure: this plan includes the policy orientation for the Broadband Policy; the Cyber Security Policy; the Private Sector Development Policy; the e-Waste Policy; and the Open Data Policy. This kind of anchoring ensures alignment as well as consistency of objectives.
The following major gaps raised by stakeholders during interviews need to be addressed at the policy level so that appropriate laws and institutions can be put in place to address them:
• National Policy on Critical Infrastructure (of which critical ICT infrastructure is a sub-set). A national level approach is required to ensure safety, security, and compliance around any infrastructure or assets that would have significant social or economic impact if damaged or compromised.
• Rights-of-way for public utilities (of which ICT infrastructure is now a recognised subset). Severe delays and very high costs of compensation or lease are major challenges for both public and private entities rolling out infrastructure – even when local governments are the owners.
• It is not immediately apparent what the main cause is, but there are key policies that for a long time have not progressed to full implementation and this needs to be examined. These include the policies addressing the national top-level domain (MoICT&NG), and the national competition policy (MTIC).
Draft Open Data Policy (2017)
The draft Open Data Policy is intended to ensure that public sector data is available for access and use (e.g. by non-government organisations, businesses and industry, academia, innovators and civil society) to facilitate participatory governance, innovation, new products and services, transparency and accountability; as well as learning, feedback and adding data for development. Benchmarking with similar policies indicates that the open data policy takes all the good practices into account and covers the key ingredients of open government data. However, the policy needs to be clear on how data can be designated, whether it is open or not – for example, there is a need to introduce an Open Data Criteria Assessment Checklist. The policy also needs to be clear on ownership and responsibilities of the government in respect of open data (i.e., who is accountable for what).
Guidelines on Infrastructure Deployment and Sharing (2021) – Public consultation stage concluded
The intent of these guidelines encouraging a strategic, forward looking approach to the deployment and provision of communications facilities with the aim of realising the benefits of forward planning; Facilitating coordination among the different stakeholders in the roll-out of ICT infrastructure; . Facilitating joint construction, co-location, sharing, and access to existing networks; Minimizing the amount and cost of civil works and associated social costs such as visual impacts, public nuisance, traffic congestion, and impacts on roads; and Promoting technical and market efficiency in the provision of communications infrastructure. A key outcome is a general lowering of the cost of services to consumers.
Comments/Recommendations
45
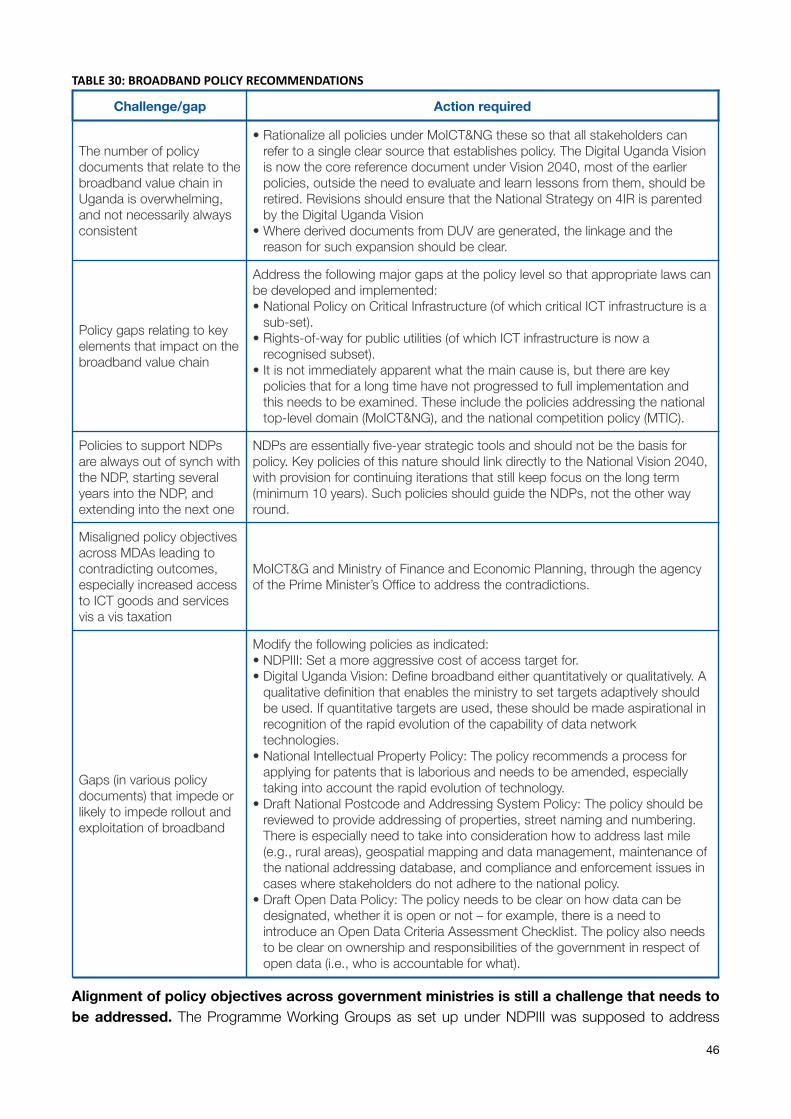
TABLE30:BROADBANDPOLICYRECOMMENDATIONS
Alignment of policy objectives across government ministries is still a challenge that needs to be addressed. The Programme Working Groups as set up under NDPIII was supposed to address
Challenge/gap Action required
The number of policy documents that relate to the broadband value chain in Uganda is overwhelming, and not necessarily always consistent
• Rationalize all policies under MoICT&NG these so that all stakeholders can refer to a single clear source that establishes policy. The Digital Uganda Vision is now the core reference document under Vision 2040, most of the earlier policies, outside the need to evaluate and learn lessons from them, should be retired. Revisions should ensure that the National Strategy on 4IR is parented by the Digital Uganda Vision
• Where derived documents from DUV are generated, the linkage and the reason for such expansion should be clear.
Policy gaps relating to key elements that impact on the broadband value chain
Address the following major gaps at the policy level so that appropriate laws can be developed and implemented: • National Policy on Critical Infrastructure (of which critical ICT infrastructure is a
sub-set). • Rights-of-way for public utilities (of which ICT infrastructure is now a
recognised subset). • It is not immediately apparent what the main cause is, but there are key
policies that for a long time have not progressed to full implementation and this needs to be examined. These include the policies addressing the national top-level domain (MoICT&NG), and the national competition policy (MTIC).
Policies to support NDPs are always out of synch with the NDP, starting several years into the NDP, and extending into the next one
NDPs are essentially five-year strategic tools and should not be the basis for policy. Key policies of this nature should link directly to the National Vision 2040, with provision for continuing iterations that still keep focus on the long term (minimum 10 years). Such policies should guide the NDPs, not the other way round.
Misaligned policy objectives across MDAs leading to contradicting outcomes, especially increased access to ICT goods and services vis a vis taxation
MoICT&G and Ministry of Finance and Economic Planning, through the agency of the Prime Minister’s Office to address the contradictions.
Gaps (in various policy documents) that impede or likely to impede rollout and exploitation of broadband
Modify the following policies as indicated: • NDPIII: Set a more aggressive cost of access target for. • Digital Uganda Vision: Define broadband either quantitatively or qualitatively. A
qualitative definition that enables the ministry to set targets adaptively should be used. If quantitative targets are used, these should be made aspirational in recognition of the rapid evolution of the capability of data network technologies.
• National Intellectual Property Policy: The policy recommends a process for applying for patents that is laborious and needs to be amended, especially taking into account the rapid evolution of technology.
• Draft National Postcode and Addressing System Policy: The policy should be reviewed to provide addressing of properties, street naming and numbering. There is especially need to take into consideration how to address last mile (e.g., rural areas), geospatial mapping and data management, maintenance of the national addressing database, and compliance and enforcement issues in cases where stakeholders do not adhere to the national policy.
• Draft Open Data Policy: The policy needs to be clear on how data can be designated, whether it is open or not – for example, there is a need to introduce an Open Data Criteria Assessment Checklist. The policy also needs to be clear on ownership and responsibilities of the government in respect of open data (i.e., who is accountable for what).
46
this alongside its other objectives. The most visible example raised by stakeholders relates to the efforts within MoICT&NG and its associated agencies to reduce access costs to ICT goods and services for users; and running counter to this, action from the Ministry of Finance and Economic Planning to raise more revenue by imposing taxes on ICT goods and services. The most recent example is the 12% excise duty on data.
The situation of the National ICT Policy (2014) and the National Broadband Policy (2018) points to the pitfall in linking major policies to the national development plans. NDPs are essentially five-year strategic tools and should not be the basis for policy. Key policies of this nature should link directly to the National Vision 2040, with provision for continuing iterations that still keep focus on the long term (minimum 10 years). Such policies should guide the NDPs, not the other way round.
Some gaps and recommendations identified in Table 20 that need to be addressed include:
• NDPIII: A more aggressive cost of access target to consumers is needed – reducing the unit cost of 1Mbps /month of Internet on the retail market from USD 237 to USD 70 by 2025 is not sufficiently aggressive to break the cost barrier to usage of broadband, which will then disable the usage targets under NDPIII, and therefore the Uganda Digital Transformation Programme.
• Digital Uganda Vision: While the document sets targets for broadband coverage and cost as a percentage of income, broadband is not defined either quantitatively or qualitatively. As a minimum, a qualitative definition that enables the ministry to set targets adaptively should be used. Where quantitative targets are used, these should be made aspirational in recognition of the rapid evolution of the capability of data network technologies.
• National Intellectual Property Policy: The policy recommends a process for applying for patents that is laborious and needs to be amended, especially taking into account the rapid evolution of technology.
• Draft National Postcode and Addressing System Policy: The policy should be reviewed to provide addressing of properties, street naming and numbering. There is especially need to take into consideration how to address last mile (e.g., rural areas), geospatial mapping and data management, maintenance of the national addressing database, and compliance and enforcement issues in cases where stakeholders do not adhere to the national policy.
• Draft Open Data Policy: The policy needs to be clear on how data can be designated, whether it is open or not – for example, there is a need to introduce an Open Data Criteria Assessment Checklist. The policy also needs to be clear on ownership and responsibilities of the government in respect of open data (i.e., who is accountable for what).
47
6. Institutional Arrangements
Broadband Institutional arrangements are defined as the formal and informal cooperation structures that support and link public and private organizations to help fulfill their respective mandates, and which are used to establish the legal, organizational and productive frameworks to allow for sustainable management of Uganda’s broadband ecosystem, in particular, and the digital economy in general. These arrangements are an important component of the ‘Invisible Mile’ and also embrace the policies, systems, and processes that organizations use to legislate, plan and manage their activities efficiently and to effectively coordinate with others in order to fulfill their respective mandates. Institutional arrangements include the responsible organizations, their human resources, funding, equipment and supplies, leadership, effectiveness, and the communication links between and among organizations.
The guiding principles for establishment of good, mutually reinforcing institutional arrangements include the following: 76
• Mandate specification: ensuring clear definition and delineation of the different roles, responsibilities and terms of reference of each player in the ICT industry, paying attention to avoid ambiguity, overlaps, lacunas and misinterpretation.
• Effective coordination: enhancing the voluntary or forced alignment of tasks and efforts of relevant stakeholders within a national setting to avoid mission drift, duplication of infrastructure, roles and responsibilities while fostering efficiencies across the sector.
• Collaboration: encouraging productive, mutually beneficial linkages among key stakeholders to facilitate improvements in the development, regulation, servicing, management and use of the broadband ecosystem.
• Agility and Adaptiveness: the ability to move quickly, address, and take advantage of institutional, technological and other advancements in support of the development and delivery of industry products and services.
• Participation, Inclusion and Partnership: empowering, through representation in government and other mechanisms; facilitating free, active and meaningful participation in decision-making processes. Meaningful and free participation of stakeholders, including citizens, in decision-making processes could contribute to the overall adaptability and stability of institutions and promote innovative policy dialogues.
• Economy (Performance): improving the overall efficiency of the national Broadband Ecosystem to avoid expensive and unnecessary operations.
• Transparency and Accountability: identifying and sharing relevant information to create a clear understanding of the national broadband ecosystem and facilitating trust amongst different stakeholders as well as timely accountability for the resources employed.
The governance and institutional framework of the broadband ecosystem and overall ICT sector in Uganda can be viewed from four main perspectives. These include:
• Oversight function; • Policy formulation and coordination; • Policy implementation; and • Enabling regulation.
Adopted from UN’s National Institutional Arrangements: Instruments, Principles and Guidelines, UN Committee of Experts 76
on Global Geospatial Information Management, 201748
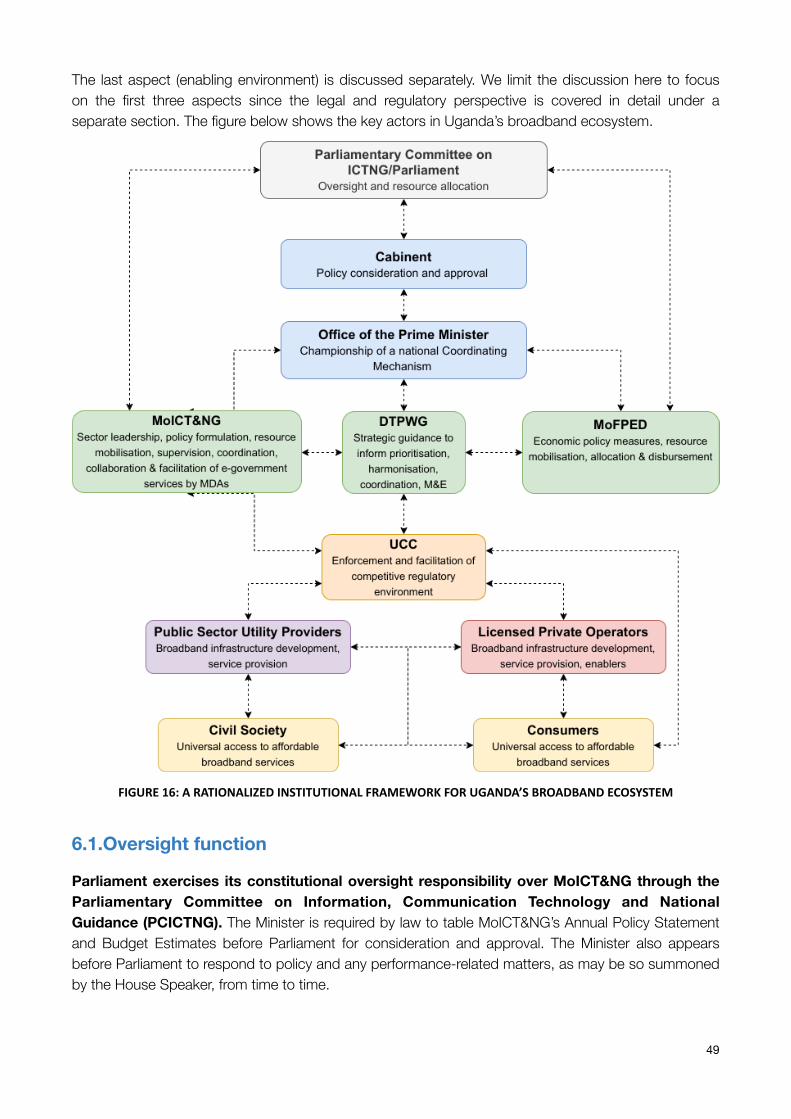
The last aspect (enabling environment) is discussed separately. We limit the discussion here to focus on the first three aspects since the legal and regulatory perspective is covered in detail under a separate section. The figure below shows the key actors in Uganda’s broadband ecosystem.
FIGURE16:ARATIONALIZEDINSTITUTIONALFRAMEWORKFORUGANDA’SBROADBANDECOSYSTEM
6.1.Oversight function
Parliament exercises its constitutional oversight responsibility over MoICT&NG through the Parliamentary Committee on Information, Communication Technology and National Guidance (PCICTNG). The Minister is required by law to table MoICT&NG’s Annual Policy Statement and Budget Estimates before Parliament for consideration and approval. The Minister also appears before Parliament to respond to policy and any performance-related matters, as may be so summoned by the House Speaker, from time to time.
49
The current PCICTNG of the 11th Parliament was only recently constituted, following the general elections that were held in January 2021. As a Standing Committee, its tenure lasts only for one Parliamentary Session. The Committee currently comprises of 29 Members of Parliament (MPs) and is primarily concerned with ensuring accountability for the proper use of public resources to provide required services. A major risk associated with this Committee, as with all political organs, is for members to approach their mandate using ‘political lenses’ which may diminish the objectivity of their decisions. A possible welcome development, however, is the fact that the 11th Parliament is comprised largely of youthful representatives of the people who are more likely to appreciate the digital economy better than their predecessors. At the same time, an ICT professional was recently appointed by the President to be the new Permanent Secretary (PS) of MoICT&NG. This should augur well for the strategic leadership towards digitalization of Uganda.
The MoICT&NG exercises functional oversight over Uganda’s Broadband Ecosystem. MoICT&NG was established in June 2006, taking over the Communications docket previously under the erstwhile Ministry of Works, Transport and Communications (MoWTC), and some years later, the functions under the previous Ministry of Information. As the lead ministry, it is formally mandated to provide strategic and technical leadership, overall coordination, support and advocacy on all matters of policy, laws, regulations and strategy for the ICT sector. To this end, the Ministry has a senior, and two junior ministers, that oversee the technical teams headed by the PS, and receives annual budget allocations through Parliamentary appropriations drawn on the Consolidated Fund. The Ministry of Finance, Planning and Economic Development (MoFPED) champions economic policy measures such as taxation on ICT equipment and services, resource mobilisation, allocation and disbursement.
Regrettably, neither MoICT&NG nor the agencies under its supervision ever receive the funding required to execute their annual work plans. For FY 2020/21, the ICT & National Guidance sector received only UGX162.9 billion (0.36% of the overall national budget amounting to UGX45.5 trillion). Inadequate funding and human resource provision adversely impact capacity to fulfil institutional mandates. NITA-U, for instance, has operated with less than 50 percent of the approved staff establishment. Skills gaps remain in core technical areas such as information/cyber security, cloud computing, networking, etc. where there is dependency on costly expatriates.
6.2.Policy Formulation and Coordination
MoICT&NG is also responsible for national policy formulation and coordination for the ICT industry. Policy formulation is the development of effective and acceptable courses of action for addressing what has been placed on the policy agenda. Policy is formulated as a high-level strategic intervention but has to be understood and operationalized at lower levels to guide the planning, development decisions and actions by other stakeholders at different levels. A conducive policy platform should anticipate significant changes in the business environment and set high standards of compliance by the different sector players.
The National Planning Authority (NPA) is an important player in policy formulation given its responsibility for championing integrated national planning to set priority areas, and the shift from sector-centric planning (operational under NDP II) to programme-based planning (NDP III). Under NDP III, MoICT&NG is the Lead for the Digital Transformation Programme Working Group (DTPWG). This has replaced the former ICT Sector Working Group (ICTSWG) that previously was expected to play a role in harmonizing, coordinating, monitoring, evaluating and reporting on the sector vision and goals, policy frameworks, plans, and performance of all sector actors. The sector approach was discarded
50
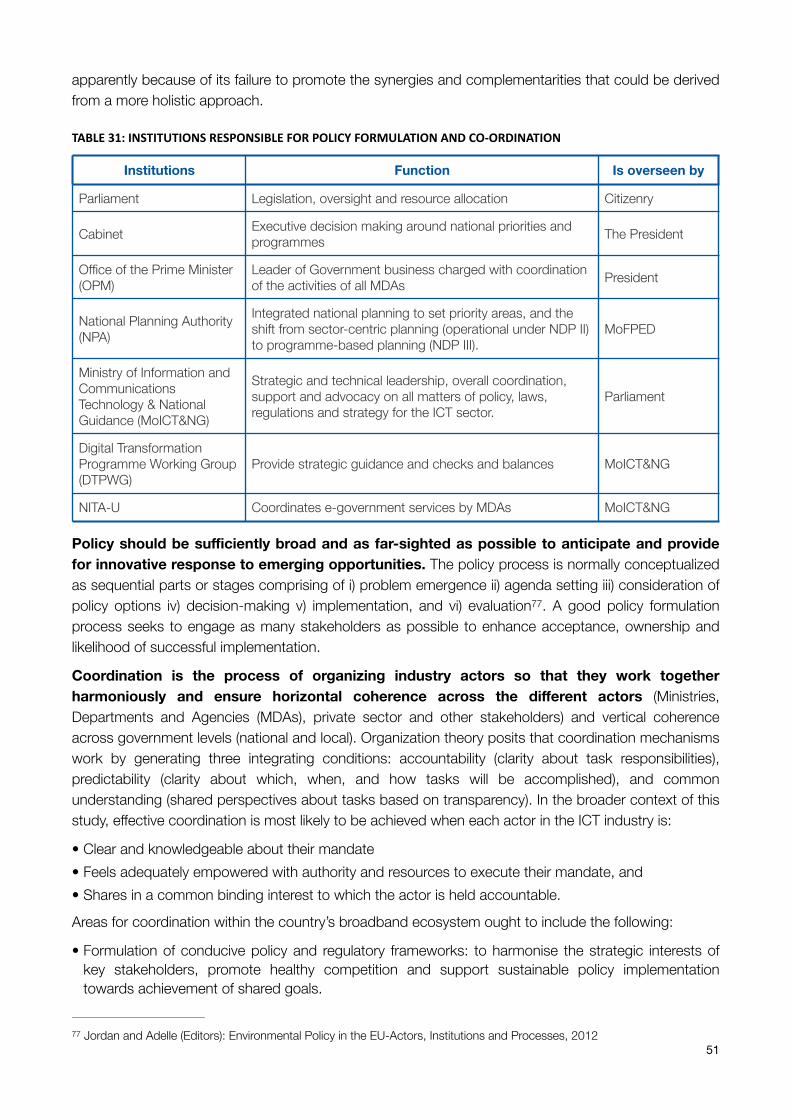
apparently because of its failure to promote the synergies and complementarities that could be derived from a more holistic approach.
TABLE31:INSTITUTIONSRESPONSIBLEFORPOLICYFORMULATIONANDCO-ORDINATION
Policy should be sufficiently broad and as far-sighted as possible to anticipate and provide for innovative response to emerging opportunities. The policy process is normally conceptualized as sequential parts or stages comprising of i) problem emergence ii) agenda setting iii) consideration of policy options iv) decision-making v) implementation, and vi) evaluation . A good policy formulation 77
process seeks to engage as many stakeholders as possible to enhance acceptance, ownership and likelihood of successful implementation.
Coordination is the process of organizing industry actors so that they work together harmoniously and ensure horizontal coherence across the different actors (Ministries, Departments and Agencies (MDAs), private sector and other stakeholders) and vertical coherence across government levels (national and local). Organization theory posits that coordination mechanisms work by generating three integrating conditions: accountability (clarity about task responsibilities), predictability (clarity about which, when, and how tasks will be accomplished), and common understanding (shared perspectives about tasks based on transparency). In the broader context of this study, effective coordination is most likely to be achieved when each actor in the ICT industry is:
• Clear and knowledgeable about their mandate • Feels adequately empowered with authority and resources to execute their mandate, and • Shares in a common binding interest to which the actor is held accountable.
Areas for coordination within the country’s broadband ecosystem ought to include the following:
• Formulation of conducive policy and regulatory frameworks: to harmonise the strategic interests of key stakeholders, promote healthy competition and support sustainable policy implementation towards achievement of shared goals.
Institutions Function Is overseen by
Parliament Legislation, oversight and resource allocation Citizenry
Cabinet Executive decision making around national priorities and programmes The President
Office of the Prime Minister (OPM)
Leader of Government business charged with coordination of the activities of all MDAs President
National Planning Authority (NPA)
Integrated national planning to set priority areas, and the shift from sector-centric planning (operational under NDP II) to programme-based planning (NDP III).
MoFPED
Ministry of Information and Communications Technology & National Guidance (MoICT&NG)
Strategic and technical leadership, overall coordination, support and advocacy on all matters of policy, laws, regulations and strategy for the ICT sector.
Parliament
Digital Transformation Programme Working Group (DTPWG)
Provide strategic guidance and checks and balances MoICT&NG
NITA-U Coordinates e-government services by MDAs MoICT&NG
Jordan and Adelle (Editors): Environmental Policy in the EU-Actors, Institutions and Processes, 201277
51
• Securing Right of Way (ROW): calls for harmonising levels of understanding as well as levelling of the interests of key MDAs (Works & Transport, Lands, Housing & Urban Development, MoICT&NG, Water & Environment, UNRA, UCC, NITA-U, UETCL, National Parks etc.); Local Government Authorities; Land Owners, and Communities.
• Infrastructure Development: to eliminate or at least minimise multiple/repeated digging up and interference with existing infrastructure of roads, railways/ports, water and electricity by the public utilities agencies, on the one hand, and private sector developers including mobile network operators, on the other hand. Also, harmonisation and utilisation of available capacity to eliminate redundancies, and promote efficiencies within the system or sector.
• Economic Decision-making: on major economic policy measures (such as determination of tariffs, taxation, and pricing) that have significant impact on supply and demand for Broadband and Internet services.
Key parameters in ensuring effective coordination include:
• Proactive, confident and credible leadership • A coordination framework built on a foundation of generally accepted principles (discussed in an
earlier section) • Willingness to share (mindset) • Human and financial resources; • Enabling policy and regulatory environment, and • A culture of transparency and accountability.
The Office of the Prime Minister (OPM) is mandated, under the Constitution, to be the Leader of Government Business and should, therefore, be championing efforts designed to promote harmonisation, coordination and collaboration in Uganda’s Broadband Ecosystem, in liaison with MoICT&NG. Regrettably, the country currently lacks a strong coordination mechanism to harmonise the decisions and actions of key actors in the country’s BB Ecosystem resulting in duplication, wastage and ultimately, unnecessarily high cost of access to Internet services by consumers.
OPM has not been able to formulate and operationalize an effective national coordination mechanism that binds MDAs as well as private sector players to common standards of compliance and accountability in a digital economy. The OPM has a large number of political leaders (9 in all) as well as a Directorate responsible for Strategic Coordination & Implementation. It is not clear whether this failure reflects lack of political will or lack of resources (financial and technical).
MoICT&NG has not invoked its administrative and position authority including having senior level representatives on the Boards of UCC and NITA-U as well as servicing the DTPWG, to ensure effective coordination of the BB Broadband Ecosystem. Instead, senior ministry officials seem to think that there is need for the enactment of an enabling law to empower them to execute this role. The Consultant does not concur with this view, believing instead, that the current Policy already empowers the supervising ministry to ensure harmonisation, coordination and collaboration in the BB Ecosystem.
The tendency for senior-level representatives on the DTPWG to delegate junior officers to sit-in for them at the meetings of the Working Group undermines the capacity of this organ to influence strategic issues such as coordination and collaboration.
52
6.3.Policy implementation
National Broadband Policy (NBP) implementers include UCC (the regulator), NITA-U (e-Government Services), public sector utility providers (UNRA, UETCL, REA, NWSC), and private telecommunications providers. A major challenge is bridging the significant gap between good policies and their effective and efficient implementation. Ideally, the public sector actors should be focused on catalyzing the broadband ecosystem and on creating the appropriate enabling environment for private sector growth. As noted above, the major challenges experienced by stakeholders emanate from the absence of an effective coordination mechanism that can facilitate harmonisation and collaboration in broadband infrastructure development. UCC has recently developed draft Guidelines on Infrastructure Deployment and Sharing. The objective of these Guidelines is to foster the efficient 78
provision and utilisation of communications infrastructure by:
• Encouraging a strategic, forward-looking approach to the deployment and provision of communications facilities with the aim of realising the benefits of forward planning.
• Facilitating coordination among the different stakeholders in the roll-out of ICT infrastructure. • Facilitating joint construction, co-location, sharing, and access to existing networks • Minimizing the amount and cost of civil works and associated social costs such as visual impacts,
public nuisance, traffic congestion, and impacts on roads. • Promote technical and market efficiency in the provision of communications infrastructure.
All operators of telecommunication services will be obliged to comply with the regulations once approved. This is a very welcome development.
Inter-ministry conflict impacted institutional performance. Within the Ministry itself, resolution of cases of inter-departmental mission drift is part of the challenges that the new Permanent Secretary has started to address. Furthermore, there has been conflict in some instances where Ministry officials have attempted to assume responsibility for implementation of projects that should otherwise be handled by UCC or NITA-U. MoICT&NG, either due to perceived frustration or vested economic interest, has previously attempted to drift into assuming responsibility for implementation of some infrastructure development projects. Indeed, some school of thought within the ministry seem to still be actively considering this option. A major motivation for this tendency may be related to the desire to control the often-significant budgets of these projects as well as the desire to remain professionally engaged and relevant.
This strategy is risky and dangerous for a number of reasons. First, it is likely to generate conflict of interest when the ministry responsible for policy guidance is also an implementer of programmes, in competition with say, the regulator. The oversight and supervisory functions will most likely suffer on account of the lack of objectivity likely to emerge within the ministry. Secondly, some technical personnel in the implementing agencies may get frustrated and opt to leave for ‘other pastures’ including going abroad, thereby compounding the already challenging staffing situation in these agencies. Furthermore, the limitations of the civil service culture may undermine the focus on timeliness, urgency and value-for-money considerations that underpin good business practices. A case in point is the pervasive expectation by civil servants, at all levels, that they must be induced and remunerated to attend official meetings that otherwise are entirely within their normal job descriptions. Many civil servants feel obligated to supplement their salaries and wages with extra-official commercial pursuits that are often undertaken at the expense of their formal contracts and time. The inevitable
The Uganda Communications Commission Guidelines on Infrastructure Deployment and Sharing, Draft of February 202178
53
outcome of letting the policy making organs to get involved in project implementation is that the quality-of-service delivery is likely to decline, much to the frustration of industry actors and consumers. There has also been conflict between UCC and NITA-U as well as within NITA-U itself, reflecting divergent understanding of the institutional and organisational mandates as well as personality issues.
Consolidation of government ministries is taking place. Government commissioned a review of 157 MDAs with the objective of rationalizing the number and mandates of the public sector agencies, improve performance and reduce the cost of service delivery. Accordingly, Cabinet on the 22nd February, 202l took a decision to merge, mainstream and rationalize 18 Ministries and up to 77 Government Agencies, Commissions, Authorities and Public Expenditure to facilitate efficient and effective service delivery. Cabinet also approved an Implementation Roadmap (lR) for the implementation process, to be spread over a period of 2 years (FYs 2021/22 – 2022/23). NITA-U is among the Agencies to move back to MoICT&NG. The new Ministry structure is yet to be determined by the Public Service Ministry but the Ministry acknowledges that some NITA-U staff may not be retained due to redundancy while other technical personnel may opt for ‘greener pastures' elsewhere. In the energy sector, the Uganda Electricity Generation Company Limited, Uganda Electricity Transmission Company Limited and Uganda Electricity Distribution Company Limited will be consolidated to form one electricity company. The Rural Electrification Agency (REA) has already moved back to the Ministry of Energy and Mineral Development as a department. The main objective of the reform is to eliminate structural and functional duplications and overlaps, wasteful expenditures and realize resultant short term and long-term savings, in line with the approved IR 79
Corruption amongst local government authorities is a challenge. A major problem that infrastructure developers have to confront is the attitude of Local Government authorities who often see the proposed BB infrastructure investment in their areas of jurisdiction as an opportunity to generate some tax income for the authorities, and ‘side income’ for the individuals involved (corruption). On the positive side, UECTL has availed its excess aerial fibre optical capacity to a number of private mobile telecommunications operators, contributing to uninterrupted communications within Uganda as well as across borders (Kenya and Rwanda). UCC also reported that it was now receiving reports from infrastructure developers such as Uganda National Roads Authority (UNRA) in a timelier manner. This now enables UCC to link up with the contractors to harmonise development of ICT infrastructure, especially digging of ducts and laying the fibre. UCC has also collaborated with Posta Uganda to leverage the latter’s countrywide network and expand Internet access by rural communities. At the data network level, the collaborative efforts by the University-led Research and Education Network for Uganda (RENU) has resulted in a dramatic reduction of the cost of international bandwidth, and improvement in the quality of connectivity for its member institutions. Since RENU’s inception, the unit cost of international bandwidth to RENU member institutions has dropped from more than US$ 3,300 per Mbps per month in 2006 to as low as US$ 20 per Mbps per month depending on the bandwidth capacity consumed by a particular institution. This kind of collaboration is very welcome and should be a model for putting in place a sustainable national BB Blueprint.
Consultation by government with the private sector is minimal. Another area of concern is the generally little consultation of the private sector ICT stakeholders by Government officials to inform major economic decisions. Local assemblers and manufacturers of ICT devices, for instance, are also complaining that despite the devices being assembled in-country, they are still being taxed. The taxes in, turn, are passed onto the consumers resulting in higher prices for devices, thereby constraining access and usage. Interest groups representing civil society play an important role in moderating
Ministry of Public Service: Ministerial Statement on Rationalization of Government Agencies, 11 Aug. 202179
54
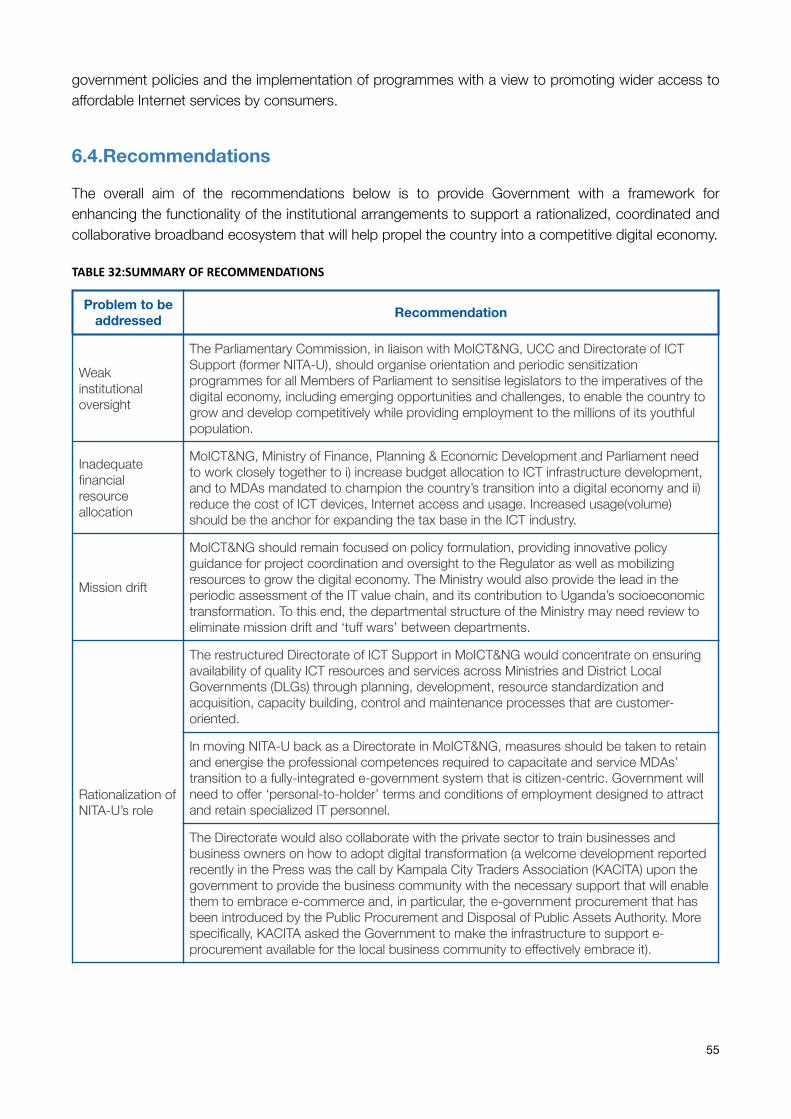
government policies and the implementation of programmes with a view to promoting wider access to affordable Internet services by consumers.
6.4.Recommendations
The overall aim of the recommendations below is to provide Government with a framework for enhancing the functionality of the institutional arrangements to support a rationalized, coordinated and collaborative broadband ecosystem that will help propel the country into a competitive digital economy.
TABLE32:SUMMARYOFRECOMMENDATIONS
Problem to be addressed Recommendation
Weak institutional oversight
The Parliamentary Commission, in liaison with MoICT&NG, UCC and Directorate of ICT Support (former NITA-U), should organise orientation and periodic sensitization programmes for all Members of Parliament to sensitise legislators to the imperatives of the digital economy, including emerging opportunities and challenges, to enable the country to grow and develop competitively while providing employment to the millions of its youthful population.
Inadequate financial resource allocation
MoICT&NG, Ministry of Finance, Planning & Economic Development and Parliament need to work closely together to i) increase budget allocation to ICT infrastructure development, and to MDAs mandated to champion the country’s transition into a digital economy and ii) reduce the cost of ICT devices, Internet access and usage. Increased usage(volume) should be the anchor for expanding the tax base in the ICT industry.
Mission drift
MoICT&NG should remain focused on policy formulation, providing innovative policy guidance for project coordination and oversight to the Regulator as well as mobilizing resources to grow the digital economy. The Ministry would also provide the lead in the periodic assessment of the IT value chain, and its contribution to Uganda’s socioeconomic transformation. To this end, the departmental structure of the Ministry may need review to eliminate mission drift and ‘tuff wars’ between departments.
Rationalization of NITA-U’s role
The restructured Directorate of ICT Support in MoICT&NG would concentrate on ensuring availability of quality ICT resources and services across Ministries and District Local Governments (DLGs) through planning, development, resource standardization and acquisition, capacity building, control and maintenance processes that are customer-oriented.
In moving NITA-U back as a Directorate in MoICT&NG, measures should be taken to retain and energise the professional competences required to capacitate and service MDAs’ transition to a fully-integrated e-government system that is citizen-centric. Government will need to offer ‘personal-to-holder’ terms and conditions of employment designed to attract and retain specialized IT personnel.
The Directorate would also collaborate with the private sector to train businesses and business owners on how to adopt digital transformation (a welcome development reported recently in the Press was the call by Kampala City Traders Association (KACITA) upon the government to provide the business community with the necessary support that will enable them to embrace e-commerce and, in particular, the e-government procurement that has been introduced by the Public Procurement and Disposal of Public Assets Authority. More specifically, KACITA asked the Government to make the infrastructure to support e-procurement available for the local business community to effectively embrace it).
55
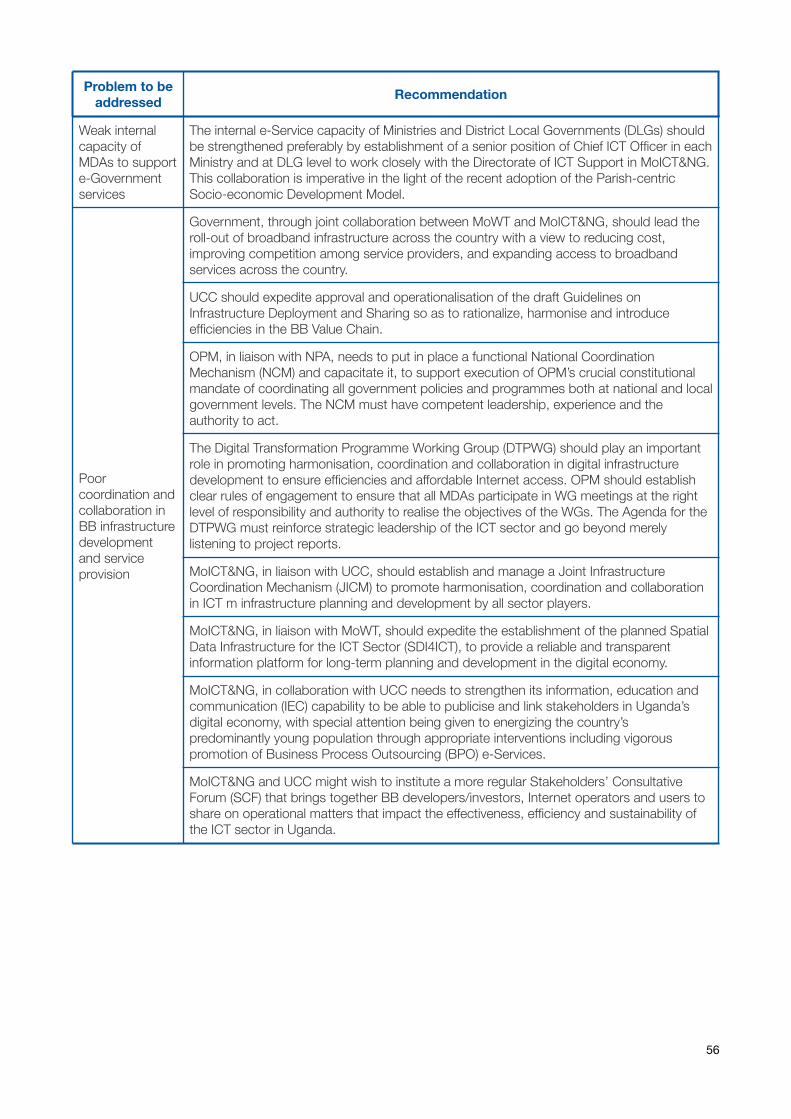
Weak internal capacity of MDAs to support e-Government services
The internal e-Service capacity of Ministries and District Local Governments (DLGs) should be strengthened preferably by establishment of a senior position of Chief ICT Officer in each Ministry and at DLG level to work closely with the Directorate of ICT Support in MoICT&NG. This collaboration is imperative in the light of the recent adoption of the Parish-centric Socio-economic Development Model.
Poor coordination and collaboration in BB infrastructure development and service provision
Government, through joint collaboration between MoWT and MoICT&NG, should lead the roll-out of broadband infrastructure across the country with a view to reducing cost, improving competition among service providers, and expanding access to broadband services across the country.
UCC should expedite approval and operationalisation of the draft Guidelines on Infrastructure Deployment and Sharing so as to rationalize, harmonise and introduce efficiencies in the BB Value Chain.
OPM, in liaison with NPA, needs to put in place a functional National Coordination Mechanism (NCM) and capacitate it, to support execution of OPM’s crucial constitutional mandate of coordinating all government policies and programmes both at national and local government levels. The NCM must have competent leadership, experience and the authority to act.
The Digital Transformation Programme Working Group (DTPWG) should play an important role in promoting harmonisation, coordination and collaboration in digital infrastructure development to ensure efficiencies and affordable Internet access. OPM should establish clear rules of engagement to ensure that all MDAs participate in WG meetings at the right level of responsibility and authority to realise the objectives of the WGs. The Agenda for the DTPWG must reinforce strategic leadership of the ICT sector and go beyond merely listening to project reports.
MoICT&NG, in liaison with UCC, should establish and manage a Joint Infrastructure Coordination Mechanism (JICM) to promote harmonisation, coordination and collaboration in ICT m infrastructure planning and development by all sector players.
MoICT&NG, in liaison with MoWT, should expedite the establishment of the planned Spatial Data Infrastructure for the ICT Sector (SDI4ICT), to provide a reliable and transparent information platform for long-term planning and development in the digital economy.
MoICT&NG, in collaboration with UCC needs to strengthen its information, education and communication (IEC) capability to be able to publicise and link stakeholders in Uganda’s digital economy, with special attention being given to energizing the country’s predominantly young population through appropriate interventions including vigorous promotion of Business Process Outsourcing (BPO) e-Services.
MoICT&NG and UCC might wish to institute a more regular Stakeholders’ Consultative Forum (SCF) that brings together BB developers/investors, Internet operators and users to share on operational matters that impact the effectiveness, efficiency and sustainability of the ICT sector in Uganda.
Problem to be addressed Recommendation
56
7. Laws, Regulations and other Regulatory Instruments There are many laws and regulations that impact on the rollout of broadband infrastructure in Uganda. Above all others, of course, is the Constitution, 1995, which establishes Uganda as a republic with executive, legislative and judicial branches of government. The Constitution also provides for local government at the district level. Chapter Four concerns the protection of fundamental and human rights, such as equality, life, and personal liberty. In particular, relevance to the broadband value chain are the following articles:
• In Article 26 provides for the protection from deprivation of property. This is relevant to the rollout of broadband infrastructure especially in relation to the acquisition of rights of way over land and the requirements for interconnection, roaming and facilities sharing, discussed below. Chapter fifteen of the Constitution comprises specific provisions relating to land. Article 237(2)(a) provides that “the Government or a local government may, subject to article 26 … acquire land in the public interest” on the conditions of acquisition as prescribed by Parliament.
• Article 29 provides for the protection of, amongst others, freedom of speech and expression, which includes the freedom of the press and other media.
• Articles 30 and 34 provide rights in respect of education. • Article 41 provides for the right of access to information in the possession of the State, subject to
laws made by Parliament.
The most relevant legislation enacted by Parliament impacting the rollout and use of broadband services in Uganda is the Uganda Communications Act, 2013 and the regulations and other regulatory instruments made under the Act. Other relevant laws, discussed below, include the National Information Technology Authority, Uganda Act, 2009 and the various laws that the National Information Technology Authority-Uganda (NITA-U) is charged with implementing. Other laws that may impact on broadband may include those related to the protection of critical infrastructure, consumer rights, fair competition, access to banking and electronic payments, and fair taxes.
7.1.The Uganda Communications Act, 2013
The Uganda Communications Act, 2013, which replaced the Uganda Communications Act, Cap. 106 and the Electronic Media Act, Cap.104, provides for the establishment and operation of the Uganda Communications Commission (UCC), which is responsible for regulating the communications industry. The Act concerns the licensing of communications service providers (including telecommunications, broadcasting and postal providers as well as video and cinema operators), the management and use of spectrum, and the regulation of other issues, such as competition and interconnection. The objectives of the Act are “to develop a modern communications sector, which includes telecommunications, broadcasting, radio communications, postal communications, data communication and infrastructure” by, inter alia-
• Enhancing national coverage of communications services; • Reducing the role of Government as an operator and minimizing subsidies paid by the Government; • Encouraging the participation of the private sector; and • Enabling competition through licensing and regulations to achieve rapid network expansion,
competition and competitively priced quality services.
The Act also establishes the Rural Communications Development Fund.
57
The Act provides that the Minister may make regulations. It also provides that any statutory instrument made under the repealed Electronic Media Act and Uganda Communications Act remain in force until revoked. In 2019, a set of 18 regulations was made to implement the 2013 Uganda Communications Act revoking many of the regulations that were made in 2005. The regulations altered the licensing framework and dealt with issues that had previously been regulated such as spectrum management and some that had not such as consumer protection. The following matters are significant to the broadband ecosystem and are discussed in the following sections.
• Licensing and Market Structure • Fair Competition • Interconnection, Roaming, and Sharing of Facilities • Rights of Way to Land • Spectrum • Universal Service • Consumer Protection • Type Approval • Tariffs • Numbering
7.1.1.Licensing and Market Structure In 2019, the Minister in consultation with the UCC, reviewed the licensing framework after the passage of the National Broadband Policy 2018. After the review, the Minister published the Uganda Communications (Licensing) Regulations 2019 and then, the Revised Application Guidelines for Telecom Sectors. The following licenses are now available.
• National Telecommunications Operator - Licensee must cover 90% of the geographic area of Uganda and deploy Internet access of at least 8 Mbps.
• Public Infrastructure Provider - Licence to roll out infrastructure either nationally or regionally. • Public Service Provider - Licence to provide services either nationally or regionally. Also, the licence
will specify one of two types of services, namely Voice and Data Services or Capacity Resale Services.
• Communal Access Operator - License to Provide Communal Access Services.
The terms of the licences are pretty standard, setting out the term of the licence, licence fees, and universal service obligations, amongst others. There are some provisions, however, that have been used to disrupt the provision of broadband services in Uganda, during both the 2016 and 2021 election cycles. These provisions resulted in the UCC ordering licensees to interrupt access to certain social media sites and in one instance resulted in a total blackout. The 2019 Licensing Regulations provide the UCC with the power to designate other telecommunications license for “services or operations for public pay, communications network services and private networks or any other telecommunications services or operations”. No other licenses have yet been designated. In 2019, the Uganda Communications (Fees and Fines) Regulations, 2019 were also made, setting out, amongst other things, licence fees. These Regulations were amended twice in 2020.
Recommendations: It is recommended that the UCC review its licensing guidelines to encourage innovation and allow more flexibility in the licensing of services and in the imposition of fees. An example in this regard might be the designation of research or education broadband network licenses
58
in support of research and education in Uganda. Separate licensing may also be developed for specific types of services, such as satellite services (See Nigeria’s commercial satellite communications guidelines for licensing and type approval of space services as a good example reference ). The 80
guidelines might also include procedures so that interested parties may request the designation of a new and innovative types of licenses. The regulatory framework should also include a listing of categories of licence exempt activities along with standards. These issues and the need for regulatory flexibility is also discussed below in section 18.6 in the chapter on spectrum. Employing regulatory flexibility will facilitate innovation in the industry and allow the UCC to respond to such innovations in real time. This, in turn, will help drive the supply and demand side of broadband ecosystem.
It was noted in a Report prepared for the World Bank in respect of broadband connectivity for 81
higher education institutions in Africa, “[t]he partial or total shutdown of selected services and quite often the Internet severely disrupts operations and, where it occurs periodically, is a disincentive for investment: it leads to loss in revenue that cannot necessarily be recovered without taking governments to court.” It is therefore recommended that licence conditions be amended to make 82
such shut downs unavailable or provide more robust conditions for such shut downs.
7.1.2.Fair Competition The Uganda Communications (Competition) Regulations, 2019 were made to provide clarity on what acts constitute fair and unfair competition, merger control, and to provide for enforcement procedures in respect of unfair competition. The competition regulations are quite comprehensive, however, there appears that there has been little enforcement since they were placed before Parliament in 2020.
Recommendations: From many of the comments received in consultations, it seems that the regulator has not yet dealt with the concentration of two dominant players in the telecommunications market in Uganda. This failure has resulted, in the past, in players exiting the market as well as the perpetuation of an anti-competitive environment that does not allow smaller competitors to thrive.
Therefore, the first recommendation is that the UCC begin to aggressively enforce the fair competition regulations. This includes the determination of those competitors who are dominant and have significant market power as well as the initiation of proceedings to investigate anticompetitive conduct.
The second recommendation is the fast tracking of a general competition law. This should be followed by the establishment of an effective and efficient competition law enforcing organisation.
7.1.3. Interconnection, Roaming, and Sharing of Facilities Compulsory interconnection of networks is essential to the broadband ecosystem. Compulsory roaming on networks of, and sharing of facilities in networks is also essential to ensuring a
Nigerian Communications Commission Commercial satellite communications guidelines. https://www.ncc.gov.ng/docman-80
main/legal-regulatory/guidelines/819-guidelines-on-commercial-satellite-communications-2018/file World Bank and Knowledge Consulting Ltd. 2021. Feasibility Study to Connect All African Higher Education Institutions to 81
High-Speed Internet. World Bank, Washington, DC. © World Bank. https://openknowledge.worldbank.org/handle/10986/36042
See, for example “Africa’s Internet Shutdowns”, http://pcmlp.socleg.ox.ac.uk/wp-content/uploads/2019/10/Internet-82
Shutdown-Workshop-Report-171019.pdf; and https://cipesa.org/2019/03/despots-and-disruptions-five-dimensions-of-Internet-shutdowns-in-africa/.
59
competitive market. This, in turn, facilitates greater investment in broadband networks and services while at the same time avoiding underutilization of networks and services that are overlapping.
The Uganda Communications (Interconnection and Access) Regulations, 2019 apply to interconnection between telecommunications operators and the sharing of communications infrastructure and services, inter alia. The regulations provide an obligation to interconnect on an unbundled basis. More stringent provisions may be imposed where the UCC determines that a licensee has significant market power. The regulations also provide for interconnection at the quality determined by the UCC and on just, reasonable, and non-discriminatory terms. The regulations also provide that licensees who own or control infrastructure such as ducts and trenches and lines, poles and masts, international submarine cable and gateways, must share facilities with other operators. Physical colocation for interconnection and local loop access is also mandated. The regulations also provide for compulsory interconnection with mobile virtual network operators.
In addition to the making of regulations by the Minister, the Communications Act also provides that one of the functions of the UCC is “to encourage and promote infrastructure sharing amongst licensees and to provide regulatory guidelines”. It also provides that the “Commission shall issue minimum guidelines in accordance with which telecommunications operators shall negotiate interconnection agreements”. The UCC published The Uganda Communications Commission Guidelines on National Roaming, 2019. These guidelines require mobile operators to offer national roaming services to other licensees engaged in the provision of mobile communications services. In March 2021, the UCC published a Consultation on the Proposed Guidelines on Communications Infrastructure Deployment and Sharing. The proposed Guidelines are aimed at establishing a framework that will guide and foster the deployment and sharing of communications infrastructure in Uganda.
The guidelines require that every operator:
• Coordinate and share infrastructure with other operators, on fair, reasonable and non-discriminatory terms;
• Accept a request from another operator for co-construction of physical infrastructure on fair and reasonable terms; and
• Provide access to or co-location with infrastructure on fair, reasonable and non-discriminatory terms.
The guidelines also require roll-out plans and concluded leasing and sharing agreements to be submitted to the UCC.
Section 17 of the Proposed Guidelines requires that the UCC collaborate with other Government ministries, departments and agencies (MDAs) to establish procedures for the consideration of applications for civil works within the scope of infrastructure deployment and sharing. If land, buildings and infrastructure are owned by Government, including MDAs and local government and an access request fails, joint operators may request assistance from the UCC. Although these provisions in the Proposed Guidelines recognize the issue that there is little necessary coordination amongst providers of public infrastructure, it does not address the outstanding issues in a comprehensive manner. In this regard, some recommendations under the heading, rights of way to land, are made below. The Guidelines have not been finalised as of the date of this report.
Recommendations: Many operators, especially those who are not dominant, have commented there is a lack of an effective and efficient regulatory framework for interconnection and especially, facilities sharing. It is also clear that there is little effective enforcement of the regulations and guidelines in place.
60
First, it is recommended that the finalisation and implementation of the Proposed Guidelines on infrastructure sharing be made a priority. The following should be included.
• Clear and strict regulation of the pricing of infrastructure sharing, interconnection and roaming to ensure the facilitation of more competition;
• Effective dig once rule, forcing network licensees to cooperate; and • Establishment of a database of infrastructure ensuring efficient and transparent processes.
Second, it is also recommended that regulations and/or guidelines for the sharing of infrastructure with other sectors be promulgated. This infrastructure includes towers, ducts, poles, and buildings owned by persons in other sectors, such as broadcasting, roads and other public works. The regulations and/or guidelines should be made in consultation with the Ministries of Lands, Housing and Urban Development, Works and Transport, Water and Environment, Local Government, Finance, Planning and Economic Development, and Government agencies such as the Civil Aviation Authority, Electricity Regulatory Authority, Uganda National Roads Authority, National Planning Authority, and local governments, amongst others. To facilitate this, a cross sector infrastructure committee or working group may be established.
Third, it is recommended that the UCC effectively regulate the pricing of interconnection, roaming, and sharing. This will include the imposition of asymmetric call termination rates, among other things, and the enforcement of cost based wholesale pricing to service providers, such as mobile virtual network operators (MVNSs), in order to facilitate more robust competition.
Finally, the development of a critical infrastructure law (including a critical information infrastructure law), discussed more fully below, should also be undertaken.
7.1.4.Rights of Way to Land Telecommunications network operators, those who roll out broadband networks, require, in some instances, the right to use the land of other persons. Sometimes this is public land, such as rights of way adjacent to roads or railways that are already owned by the Government. Sometimes it is private land where there may be no current right or way or there may be an exclusive right of way granted to a single network operator.
Under the 2013 Communications Act, there is no guarantee for a right of way for any network operator in Uganda. There also are no regulations or guidelines in place to guide the various interested parties in these matters. What there is, is a patchwork of various laws and regulatory frameworks that network operators must wade through in order to be able to roll out broadband infrastructure. These include negotiating use of an existing public right of way if any, negotiating use of private right of way with private owners where necessary, conducting environmental assessments, and obtaining building permits from local authorities. This is not only time consuming, but also costly. It is also not unusual. Most countries have rules for negotiating rights of way by telecommunications operators that involve similar regulatory frameworks. However, in Uganda, there are changes that can be made to the legal and regulatory environments that will make the rollout of broadband infrastructure quicker and less costly, while at the same time protecting the rights of land owners and others who have an interest in that land, such as local communities.
The Uganda Communications Act of 1997, which was repealed by the current 2013 Act, provided for the designation of a public operator, who had a host of rights and responsibilities in
61
respect of the placement of telecommunications lines on private land and public land. No provisions in regard to rights of way found their way into the 2013 Act, however.
Section 42 of the Land Act 1988 provides for the acquisition of land by the Government or a local government in accordance with the constitutional provisions, articles 26 and 237(2). Section 71 provides that all “land … shall be subject to all existing public rights of way which shall be reserved to and vested in the Government on behalf of the public; and all such rights of way shall be maintained by the public uninterrupted unless they are terminated or altered by the direction of the Minister in writing”. And section 73 provides that where it is necessary to execute public works, on any land, an authorised undertaker shall enter into mutual agreement with the occupier or owner of the land in accordance with the Land Act and where no agreement is reached, the Minister responsible for land may, compulsorily acquire land in accordance with section 42. Unfortunately, however, the definition of public works does not include telecommunications network facilities.
Recommendations: Many licensees consulted have concerns about the lack of a coordinated regulatory framework for rights of way. Licensees, of course, want a guaranteed (and cheap or free) right of way. On the other hand, however, there are valid competing concerns from local governments, other government agencies, land and building owners and communities.
In carrying out these recommendations, it is important that all parties be consulted. These parties include the Ministries of Lands, Housing and Urban Development, Works and Transport, Water and Environment, Local Government, Finance, Planning and Economic Development; government agencies such as the Civil Aviation Authority, Electricity Regulatory Authority, Uganda National Roads Authority, National Planning Authority, and NITA-U; local governments; land owners; local communities; and any other interested parties.
The first recommendation is that The Uganda Communications Act should be amended to include a variation of the provisions that were set out in Part VIII of the 1997 Uganda Communications Act. The provisions will have to be adapted to apply to a competitive market. The Act should also provide for prompt payment of fair and adequate compensation and a right of access to a court of law by any person who has an interest or right over the property. This is required by the Constitution.
The second recommendation is that The Land Act should be amended to include telecommunications network facilities are included in the definition of public works. The time has come to recognise broadband as a public work on par with, for example, water and electricity.
The third recommendation is that the Minister, in consulting with the UCC, make regulations and/or guidelines setting out a comprehensive regulatory framework for the negotiation of rights of way. The regulations should make the process streamlined, quick and easy. They should also include protections and obligations for operators on the one hand and other affected parties, such as local governments, land owners and communities, on the other hand. The regulations or guidelines should provide for the following, in consultation with Ministries of Lands, Housing and Urban Development, Works and Transport, Water and Environment, Local Government, Finance, Planning and Economic Development.
Require all public works, including networks operators and other public works providers, to share rights of way, subject to the regulations and guidelines:
• Require all public works, including networks operators and other public works providers, to share rights of way, subject to the regulations and guidelines;
• Clear and strict regulation of the pricing of new rights of way and use of existing rights of way;
62
• Ban the granting of exclusive rights of way by private or public land owners; • Effective dig once rule, forcing network licensees and other public works providers to cooperate; • Establishment of a database of all public works infrastructure and existing rights of way ensuring
efficient and transparent processes; • Establish simple, easy and consistent procedures that will be used by local authorities in respect of
building permits; • Rules for the acquisition of rights of way where land is private, including rules for reasonable
compensation; • Rules for the acquisition of rights of way where land is public, including rules for reasonable
compensation; and • Rules for acquiring use rights to public rights of way, such as public roads, railways and other public
works.
7.1.5.Spectrum The following regulatory instruments govern spectrum management and use in Uganda.
• In accordance with now repealed Uganda Communications Act of 1997, regulations were made in 2005. These regulations included the Communications (Radio) Regulations, 2005, which are still in effect.
• In 2009, the UCC published the Radio Spectrum Policy Guidelines for Uganda, as a guide for the use of the spectrum in a proper manner.
• In 2010, the UCC also issued Guidelines on Radio Spectrum Hoarding to discourage radio spectrum hoarding and ensure compliance with license conditions.
• In 2010, the UCC developed an Radio Station Inspection Framework in Uganda, outlining technical procedures to be followed in the implementation of radio station inspections to determine spectrum user compliance in accordance with the Uganda Communications Act, the Uganda Communications (Radio) Regulations, 2005 and the Spectrum Policy Guidelines.
• In 2017, the UCC published The Uganda Communications Commission Radio Spectrum Management Guidelines, to set out the objectives, principles and associated proclamations to guide the UCC in the management of the spectrum in order to extract maximum social-economic value for Uganda.
• In 2019, the UCC published the Framework for Spectrum Assignment to Telecommunications Services in Uganda, 2019. The Guidelines highlight the approaches to be used in assigning spectrum to telecommunications services and proposed terms and conditions for radio spectrum authorisation to telecommunication operators.
• In 2019, the UCC published the Proposed Radio Spectrum Management Policy for Uganda. This proposed policy seeks to set out the key objectives and principles that will guide the management of the radio frequency spectrum over a five-year period. This policy was not finalised as of the date of this report.
The UCC has issued these regulatory instruments to facilitate introduction and use of different technologies in Uganda including:
• Technical Requirements for the use of the 863-870 MHz (868 MHz) Band for Industrial, Scientific and Medical (ISM) in Uganda, 2008;
• Guidelines for the use of wireless Short-Range Devices in Uganda, 2010; • Standard for TV White Spaces Access and Use in Uganda, 2019.
63
Recommendations: One of the most important regulatory issues for the rollout of mobile broadband in 2021 is the efficient and effective management and use of spectrum. It is recommended that the Proposed Radio Spectrum Management Policy published for public for comment in 2019, be considered, amended as appropriate, adopted, and implemented as a matter of urgency (as guidelines). Further specific recommendations regarding spectrum policy and regulation are set out in the Chapter 8 below.
7.1.6.Universal Service The Rural Communications Development Fund was established in terms of the now repealed Uganda Communications Act of 1997. These regulatory instruments were also adopted.
• Communications (Establishment and Management of the Rural Communications Development Fund) Instrument, 2002; and
• Communications (Establishment and Management of the Rural Communications Development Fund) (Amendment) Instrument, 2002.
In 2019, regulations regarding universal service were enacted, which also revoked the regulatory instruments listed above. The Uganda Communications (Universal Service and Access Fund) Regulations, 2019 establishes the Universal Service and Access Fund. The fund is funded by gross annual revenues collected from licensees in terms of the Communications Act. Recently, the UCC called for expressions of interest for the provision of consultancy services to develop the Uganda Communications Universal Service Access Fund Strategic Plan.
The Uganda Communications (Universal Service) Regulations, 2019 provide the UCC with the power to impose universal service obligations on licensees. The only obligations imposed in respect to universal service currently is the 90% geographical area in the licence conditions for National Telecommunications Operator licenses. For spectrum authorisations, obligations in respect of average speeds have been imposed in some bands.
Recommendations: It is recommended that the Uganda Communications Universal Service Access Fund Strategic Plan, which has been contemplated by the UCC, be developed urgently. The Plan should include projects and programmes that will impact the most positively on the broadband ecosystem. This might include supply side measures such as providing broadband infrastructure in key access points such as schools and hospitals. It may also include programmes and projects on the demand side, such as providing support for local innovations to ensure local and relevant content and service and training and education required to support the use of broadband services.
7.1.7.Consumer Protection The Uganda Communications (Consumer Protection) Regulations 2019 set out the procedures that allow consumers to file complaints and set out certain prohibited practices such as unsolicited telemarketing calls and denials of access or service by licensees. The regulations also require equality of treatment and protection of consumer information as well as protections of harmful content and protection of minors. There is no general consumer protection law in Uganda.
Recommendations: It has been mentioned in consultations that there has been little enforcement of these regulations. It is recommended that the regulations that are in place be implemented efficiently and effectively. It is also recommended that the Government consider enacting a general consumer protection law.
64
7.1.8.Type Approval There are both regulations and guidelines for type approval of all telecommunications terminal equipment and radio communications equipment intended to be connected to communications networks, as follows:
• The Uganda Communications (Equipment Type Approval) Regulations, 2019; and • Guidelines on Type Approval of Telecommunications and Radio Communications Equipment in
Uganda.
Recommendations: The regulations appear to be sufficient to cover all types of equipment, including end user equipment. However, there appears to be an issue of end user equipment that is not type approved entering the country. It is recommended, therefore, that the UCC consult with the National Bureau of Standards (which issues certificates of conformity in respect of imported equipment) to investigate where enforcement mechanisms may need to be enhanced.
7.1.9.Tariffs The Telecommunications (Tariffs and Accounting) Regulations, 2005 are regulations that apply to the pricing of telecommunications services and accounting by telecommunications operators.
7.1.10.Numbering The UCC has published the Uganda National Numbering Plan Guidelines. It has not, however, regulated number portability.
Recommendations: The issue of number portability should be addressed by the UCC to enhance competition in the industry.
7.2.National Information Technology Authority, Uganda Act, 2009
The National Information Technology Authority, Uganda Act, 2009 provides for the establishment and operation of NITA-U. The main object of NITA-U is to provide information technology services to Government. It also is tasked to:
• Promote standardisation in the planning, acquisition, implementation, delivery, support and maintenance of information technology equipment and services, to ensure uniformity in quality, adequacy and reliability of information technology usage throughout Uganda;
• Provide guidance and other assistance as may be required to other users and providers of information technology;
• Promote cooperation, coordination and rationalization among users and providers of information technology at national and local level so as to avoid duplication of efforts and ensure optimal utilisation of scarce resources;
• Promote and be the focal point of co-operation for information technology users and providers at regional and international levels; and
• Promote access to and utilisation of information technology by the special interest groups.
It has a wide array of functions and powers spelt out in the Act related to both coordinating IT usage in Government, the facilitation of e-Government, as well as regulating IT services in Uganda. It does so by, inter alia, regulations made in terms of the Act by the Minister, which include, amongst others.
65
• National Information Technology Authority, Uganda (Authentication of Information Technology Training) Regulations, 2016 - These Regulations provided for the authentication of IT training providers, which is required to provide IT training.
• National Information Technology Authority, Uganda (Certification of Providers of Information Technology Products and Services) Regulations, 2016 - These Regulations provide for the certification of IT products and services providers, which is required to provide IT services and products.
• National Information Technology Authority, Uganda (E-Government) Regulations, 2015 - These Regulations are designed to promote e-Government. In furtherance of this, NITA-U must establish a national data center and a government web portal. The Regulations also provide for all public bodies to use the National Data Transmission Backbone and Electronic Government Infrastructure.
• National Information Technology Authority, Uganda (National Databank) Regulations, 2019 - These regulations provide for the establishment and operation of a national databank, and require every data controller to link its database to the national databank.
• NITA-U also has responsibilities set out in other legislation, such as the Electronic Transactions Act, Electronic Signatures Act, Computer Misuse Act, and the Data Protection and Privacy Act.
7.3.Electronic Transactions Act, 2011
The Electronic Transactions Act, 2011 was passed to provide the regulatory framework to facilitate electronic transactions, providing the legal certainty and public confidence in the use of such transactions. It was modeled, in part, on the UNCITRAL Model Law on Electronic Commerce. Part II of the Act provides the basic framework for the legal recognition of electronic transactions, signatures, and documents. Part III makes the Act applicable to Government services. Part IV provides for protections for consumers. And Part V provides for the limitation of liability for service providers in respect of third-party activity. It also provides a mechanism for persons who have a problem about such third-party activity to make a complaint to the service provider and if a service provider fails to act on a complaint, the complainant can appeal to NITA-U, under the Electronic Transaction Regulations, 2013.
The Electronic Transactions Act and Regulations of 2013 are sufficient to provide legal certainty for the recognition of electronic transactions. Many countries have more recently amended their electronic transaction legislation taking into account the Regulation on Electronic Identification and Trust Services (eiDAS) of the European Parliament and the Council Regulation 910/2014 on electronic identification and trust services for electronic transactions and the new Electronic Identification and Trust Services for Electronic Transactions Act of 2016. The Regulation and Act provide a common foundation for secure electronic interaction between citizens, businesses and public authorities, simpler and more secure transactions and consolidate the traditional electronic transactions and digital signature acts.
Recommendations: It may be time to review this legislation, along with the Electronic Signatures Act, in line with international best practices. Other benchmarking instruments might include the UNCITRAL Model Law on Electronic Transferable Records (2017), the East Africa Community Electronic Transactions Act and the Common Market for Eastern and Southern Africa (COMESA) Model Law on Electronic Transactions.
66
7.4.Electronic Signatures Act, 2011
The Electronic Signatures Act, 2011 provides the legal framework for the use of electronic and digital signatures. It outlines how such signatures are to be created and secured and what are the requirements for a compliant electronic signature. The Act gives digital and handwritten signatures equal legal recognition and sets an obligation for all public and private institutions to accept digitally signed documents. The Electronic Signatures Regulations, 2013 were made in terms of the Electronic Signatures Act and concern the licensing and conduct of certification service providers. The Electronic Signatures Act and Regulations operate in tandem with the Electronic Transactions Act and Regulations.
Recommendations: The Electronic Signature Act and Regulations may need to be amended as discussed above. Furthermore, it may be that the two Acts should be consolidate to form a unified legal and regulatory framework for electronic transactions and signatures.
7.5.Computer Misuse Act, 2011
The Computer Misuse Act, 2011 sets out offences, such as unlawful access, abuse or misuse of information systems, and sets out procedures for investigating and prosecuting such offences. This Act is important for the protection of, inter alia, the right to privacy guaranteed by the Constitution.
Recommendations: While most of the provisions of the Computer Misuse Act are sufficient, it may be timely to review the provisions taking recent international best practices into consideration. The Budapest Convention on Cybercrime and related Additional Protocol to the Convention on Cybercrime could inform such a review.
7.6.Access to Information Act, 2005
The Access to Information Act 2005, and related Access to Information Regulations adopted in 2011 require all MDAs to appoint information officers to handle request for public information. These provisions apply to NITA-U, the UCC as well as all other MDAs. It is reported that there have been difficulties in the implementation of this regulatory framework since its inception. In 83
addition, there is no existing open data policy adopted, as discussed above in Chapter 5 of this document. As discussed above, it is recommended that such a policy be adopted as a matter of urgency, followed by its implementation, which will include specific initiatives discussed herein, such as access to spectrum data, data about rights of way and data about existing and planned broadband infrastructure.
7.7.Data Protection and Privacy Act, 2019
The Data Protection and Privacy Act, 2019 also supports the privacy protections enshrined in the Constitution, Article 27, which provides for the protection of privacy in a person’s home, correspondences, communication or other property. The Act focuses on the protection of privacy by regulating the collection, processing and storage of personal data. It largely is molded on the privacy
World Bank, “Open Data Readiness Assessment - Prepared for the Government of Uganda”. http://83
opendatatoolkit.worldbank.org/docs/odra/odra_uganda.pdf.67
legislation in the UK. The Data Protection and Privacy Regulations, 2021 are intended to implement the principles set out in the Act, and provide specifics for the manner for objecting to the collection and processing of data and compliant procedures, among others. The Act and Regulations will be operationalised by the Personal Data Protection Office, which is an independent office under NITA-U.
7.8. Content
Many laws and regulations have the potential to impact on content delivered through the broadband ecosystem. Regulations include the Uganda Communications (Content) Regulations, 2019, which applies to all content in telecommunications and radio communications and broadcasting and postal services. The regulation of content is overseen by the Contents Committee of the UCC established in terms of the Communications Act. The Contents Committee is required, among other things, to enforce the Broadcasting Code. The regulations have extensive provisions relating to what content is prohibited, including content using offensive language, presenting sexual matters, and depicting violence in an offensive manner. It also details provisions relating to political elections, the promotion of local content, the coverage of public events, protections for children, and procedures for complaint handling.
The Uganda Communications (Text and MultiMedia Messaging) Regulations, 2019 prohibit unsolicited messages. They also make the transmission of prohibited third-party content, the responsibility of operators. Prohibited content includes content objectionable on the grounds of public interest, public morality, public order, public security, national harmony or otherwise prohibited by law. The regulations also detail matters such as providing information to customers, privacy, and an opt-out right. The UCC has adopted a number of regulatory instruments related to content:
• Standards for General Broadcast Programming in Uganda; • The Advertising Standards; • Standards for Religious Broadcast Programming in Uganda; • Best Practice Guidelines for Electronic Media Broadcasters for: Coverage and Broadcast of Live
Events; and • Guidelines on the use of Media during the General Elections and Campaigns 2021.
The Press and Journalists Act, 1995 provides for the right to publish subject to its provisions. It establishes a Media Council to license and regulate the media and journalists. It has extensive provisions limiting press freedom. However, a recent decision of the Constitutional Court dismissed a petition filed challenging provisions as both vague and a violation of fundamental rights, such as the right to free speech.
Other legislation that might impact on electronic content, include the regulation of electronic payment systems. The legislation that has the biggest impact on electronic banking and payment systems in Uganda is the National Payment Systems Act, 2020. The Act gives the Bank of Uganda powers and functions in the regulating, supervising, licensing and oversight of payment systems to ensure safely and efficiency. Payment systems and payment services must be licensed by the Bank of Uganda in accordance the National Payment Systems Regulations, 2021. Other regulatory instruments include:
• The National Payment Systems (Agents) Regulations, 2021; • The National Payment Systems (Sandbox) Regulations, 2021; • The National Payment Systems Oversight Framework, June 2021; and
68
• Mobile Money Guidelines, 2013.
Other laws that might impact on content include Intellectual property laws. Theses include the Trade Marks Act, 2010, Copyright and Neighboring Rights Act, 2006, Geographical Indications Act, 2013, Plant Varieties Act, 2014 and Industrial Property Act, 2014. More recently, the National Intellectual Property Policy was published in 2019, identifying a number of difficulties with the promotion and protection of property rights in Uganda, including weak enforcement mechanisms. Also, although Uganda has a number of laws protecting intellectual property rights, there are no specific laws that relate to, for example, disputes regarding the registration of domain names or dealing with issues such as peer-to-peer file sharing.
Recommendations: It may be time for Uganda to conduct a holistic review of legislation regulating content to ensure greater protection of fundamental rights keeping in mind the nature of, among other things, the broadband value chain. It has also been suggested that to much regulation (prohibition) of content is counter to the promotion of growth of the content sector in Uganda. It is therefore, recommended that the UCC review its various content regulations and other regulatory instruments to ensure that it is facilitating the growth of the content sector in Uganda.
7.9. Interception and Monitoring
The Regulation of Interception of Communications Act, 2010 sets out the prohibition of interception of communications over telecommunications or radio systems. It also sets out exceptions to the prohibition. It provides for the establishment of a Monitoring Centre, which is able to monitor and intercept communications. Monitoring and interception is to be carried out under a warrant of interception granted in terms of the Act. The Act also requires UCC licensees to provide assistance, including making sure their networks can be monitored and to store certain information. And it requires the registration of SIM cards. The following regulations have been made under the Uganda Communications Act, 2013:
• The Uganda Communications (Intelligent Network Monitoring System) Regulations, 2019; • The Uganda Communications (Emergency Response) Regulations, 2019; • The Uganda Communications (Centralised Equipment Identification Register) Regulations, 2019; • Other legislation that gives powers of monitoring and interception include the following; and • The Anti-Terrorism Act, 2002 gives security officers powers to intercept communications of person
suspected of terrorist activities.
Anti-Pornography Act, 2014 criminalises the production, trafficking, publishing, broadcast, procurement, import, export, selling, or abetting any form of pornography. This Act anticipates that all Internet service providers will install software to monitor and filter pornography. A recent decision of the Constitutional Court of Uganda declared certain provisions of the Act unconstitutional and in particular found that the definition of pornography was not precise enough leading to inconsistent application. Provisions relating to powers of the Pornography Control Committee relating to search and seizure without judicial oversight were also declared unconstitutional.
Recommendations: It may be time for Uganda to conduct a holistic review of legislation allowing monitoring and interception to ensure greater protection of fundamental rights.
69
7.10.Critical Infrastructure
There is key infrastructure in a country that should be protected by legislation. This includes infrastructure that is essential to the protection of the sovereignty of the people of Uganda as well as to essential services such as water and electricity supply. It also includes the infrastructure that entails the broadband ecosystem. One of the comments made by licensees in consultations is that their physical infrastructure is compromised by acts of vandalism and theft. While it is important to protect the physical infrastructure, it is also important to protect information infrastructure.
Recommendations: The Ministry has made regulations creating a computer emergency response team, The Uganda Communications (Computer Emergency Response Team) Regulations, 2019. However, there is no comprehensive policy and law in Uganda that will facilitate the protection of critical infrastructure and critical information infrastructure. It is recommended that these be developed in line with best practices as soon as practicable.
7.11.Recommendations
There are a number of recommendations made to the legal and regulatory frameworks currently in place in Uganda, that will either remove some roadblocks to or facilitate a more robust broadband ecosystem. The most urgent include the following that can be affected by the UCC.
• Create a more flexible licensing regime that allows for more innovation and competition, especially in the services markets and in areas that are underserved;
• Create an efficient and fair regulatory regime for obtaining rights of way in collaboration with all interested parties;
• Effectively enforce a robust facilities sharing regulatory regime; and • Make changes to the spectrum plan and licensing regimes, as discussed in section 8 below.
In addition, the intellectual property rights laws need to be reviewed keeping in mind the changes brought about the broadband value chain, and matters such as artificial intelligence, the importance of data, among others. Similarly, the legal and regulatory regimes that impact on the delicate balance of protecting rights of free speech, amongst others and the surveillance mechanisms available, should be reviews. Finally, the following laws should be promulgated as a matter of urgency: competition; consumer protection; and critical infrastructure.
70
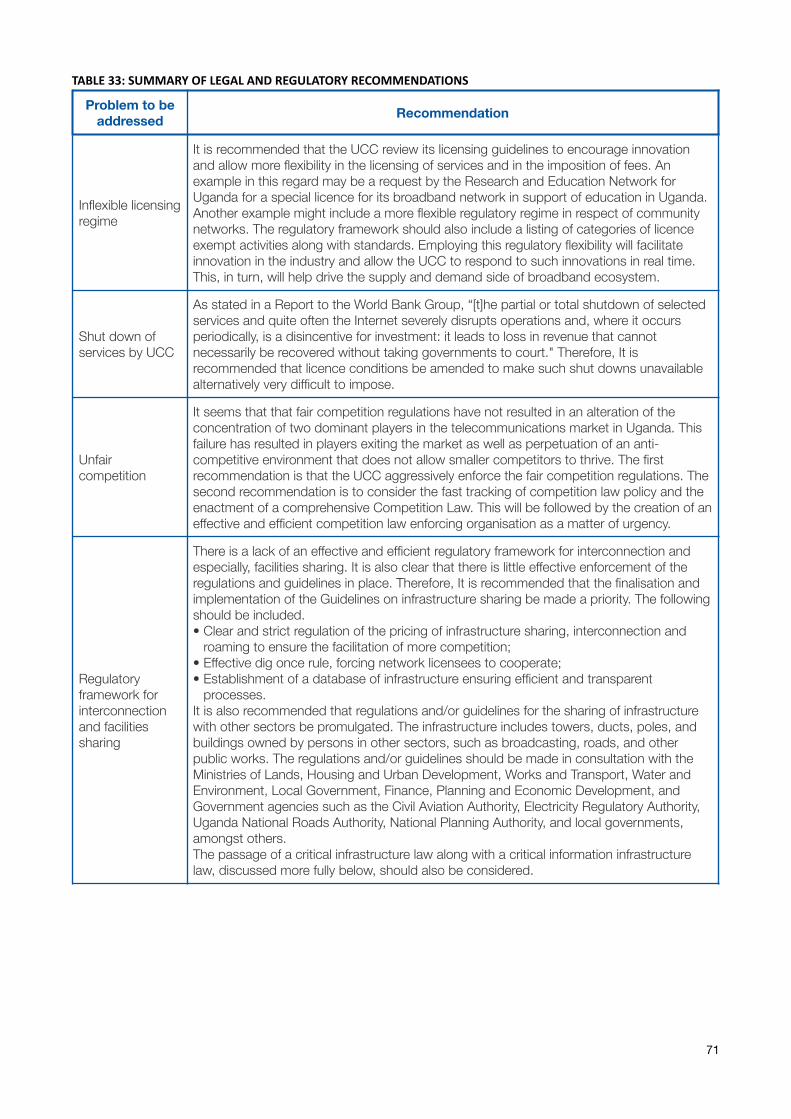
TABLE33:SUMMARYOFLEGALANDREGULATORYRECOMMENDATIONS
Problem to be addressed Recommendation
Inflexible licensing regime
It is recommended that the UCC review its licensing guidelines to encourage innovation and allow more flexibility in the licensing of services and in the imposition of fees. An example in this regard may be a request by the Research and Education Network for Uganda for a special licence for its broadband network in support of education in Uganda. Another example might include a more flexible regulatory regime in respect of community networks. The regulatory framework should also include a listing of categories of licence exempt activities along with standards. Employing this regulatory flexibility will facilitate innovation in the industry and allow the UCC to respond to such innovations in real time. This, in turn, will help drive the supply and demand side of broadband ecosystem.
Shut down of services by UCC
As stated in a Report to the World Bank Group, “[t]he partial or total shutdown of selected services and quite often the Internet severely disrupts operations and, where it occurs periodically, is a disincentive for investment: it leads to loss in revenue that cannot necessarily be recovered without taking governments to court." Therefore, It is recommended that licence conditions be amended to make such shut downs unavailable alternatively very difficult to impose.
Unfair competition
It seems that that fair competition regulations have not resulted in an alteration of the concentration of two dominant players in the telecommunications market in Uganda. This failure has resulted in players exiting the market as well as perpetuation of an anti-competitive environment that does not allow smaller competitors to thrive. The first recommendation is that the UCC aggressively enforce the fair competition regulations. The second recommendation is to consider the fast tracking of competition law policy and the enactment of a comprehensive Competition Law. This will be followed by the creation of an effective and efficient competition law enforcing organisation as a matter of urgency.
Regulatory framework for interconnection and facilities sharing
There is a lack of an effective and efficient regulatory framework for interconnection and especially, facilities sharing. It is also clear that there is little effective enforcement of the regulations and guidelines in place. Therefore, It is recommended that the finalisation and implementation of the Guidelines on infrastructure sharing be made a priority. The following should be included. • Clear and strict regulation of the pricing of infrastructure sharing, interconnection and
roaming to ensure the facilitation of more competition; • Effective dig once rule, forcing network licensees to cooperate; • Establishment of a database of infrastructure ensuring efficient and transparent
processes. It is also recommended that regulations and/or guidelines for the sharing of infrastructure with other sectors be promulgated. The infrastructure includes towers, ducts, poles, and buildings owned by persons in other sectors, such as broadcasting, roads, and other public works. The regulations and/or guidelines should be made in consultation with the Ministries of Lands, Housing and Urban Development, Works and Transport, Water and Environment, Local Government, Finance, Planning and Economic Development, and Government agencies such as the Civil Aviation Authority, Electricity Regulatory Authority, Uganda National Roads Authority, National Planning Authority, and local governments, amongst others. The passage of a critical infrastructure law along with a critical information infrastructure law, discussed more fully below, should also be considered.
71
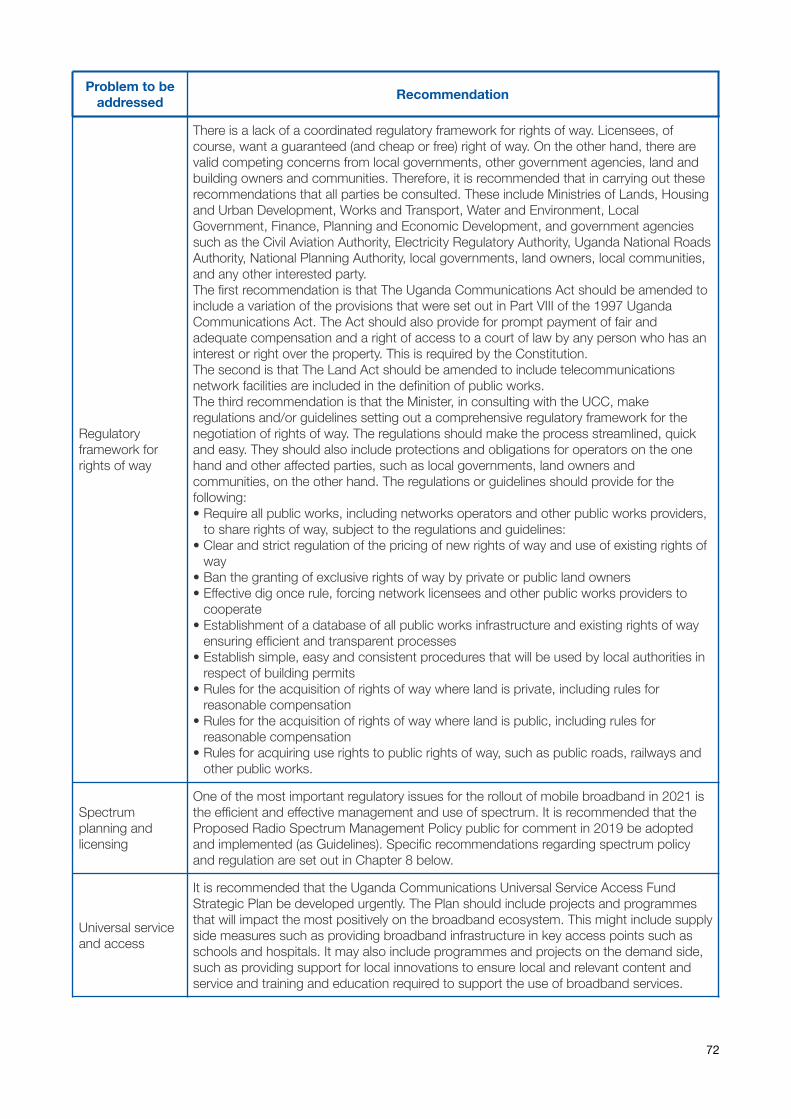
Regulatory framework for rights of way
There is a lack of a coordinated regulatory framework for rights of way. Licensees, of course, want a guaranteed (and cheap or free) right of way. On the other hand, there are valid competing concerns from local governments, other government agencies, land and building owners and communities. Therefore, it is recommended that in carrying out these recommendations that all parties be consulted. These include Ministries of Lands, Housing and Urban Development, Works and Transport, Water and Environment, Local Government, Finance, Planning and Economic Development, and government agencies such as the Civil Aviation Authority, Electricity Regulatory Authority, Uganda National Roads Authority, National Planning Authority, local governments, land owners, local communities, and any other interested party. The first recommendation is that The Uganda Communications Act should be amended to include a variation of the provisions that were set out in Part VIII of the 1997 Uganda Communications Act. The Act should also provide for prompt payment of fair and adequate compensation and a right of access to a court of law by any person who has an interest or right over the property. This is required by the Constitution. The second is that The Land Act should be amended to include telecommunications network facilities are included in the definition of public works. The third recommendation is that the Minister, in consulting with the UCC, make regulations and/or guidelines setting out a comprehensive regulatory framework for the negotiation of rights of way. The regulations should make the process streamlined, quick and easy. They should also include protections and obligations for operators on the one hand and other affected parties, such as local governments, land owners and communities, on the other hand. The regulations or guidelines should provide for the following: • Require all public works, including networks operators and other public works providers,
to share rights of way, subject to the regulations and guidelines: • Clear and strict regulation of the pricing of new rights of way and use of existing rights of
way • Ban the granting of exclusive rights of way by private or public land owners • Effective dig once rule, forcing network licensees and other public works providers to
cooperate • Establishment of a database of all public works infrastructure and existing rights of way
ensuring efficient and transparent processes • Establish simple, easy and consistent procedures that will be used by local authorities in
respect of building permits • Rules for the acquisition of rights of way where land is private, including rules for
reasonable compensation • Rules for the acquisition of rights of way where land is public, including rules for
reasonable compensation • Rules for acquiring use rights to public rights of way, such as public roads, railways and
other public works.
Spectrum planning and licensing
One of the most important regulatory issues for the rollout of mobile broadband in 2021 is the efficient and effective management and use of spectrum. It is recommended that the Proposed Radio Spectrum Management Policy public for comment in 2019 be adopted and implemented (as Guidelines). Specific recommendations regarding spectrum policy and regulation are set out in Chapter 8 below.
Universal service and access
It is recommended that the Uganda Communications Universal Service Access Fund Strategic Plan be developed urgently. The Plan should include projects and programmes that will impact the most positively on the broadband ecosystem. This might include supply side measures such as providing broadband infrastructure in key access points such as schools and hospitals. It may also include programmes and projects on the demand side, such as providing support for local innovations to ensure local and relevant content and service and training and education required to support the use of broadband services.
Problem to be addressed Recommendation
72
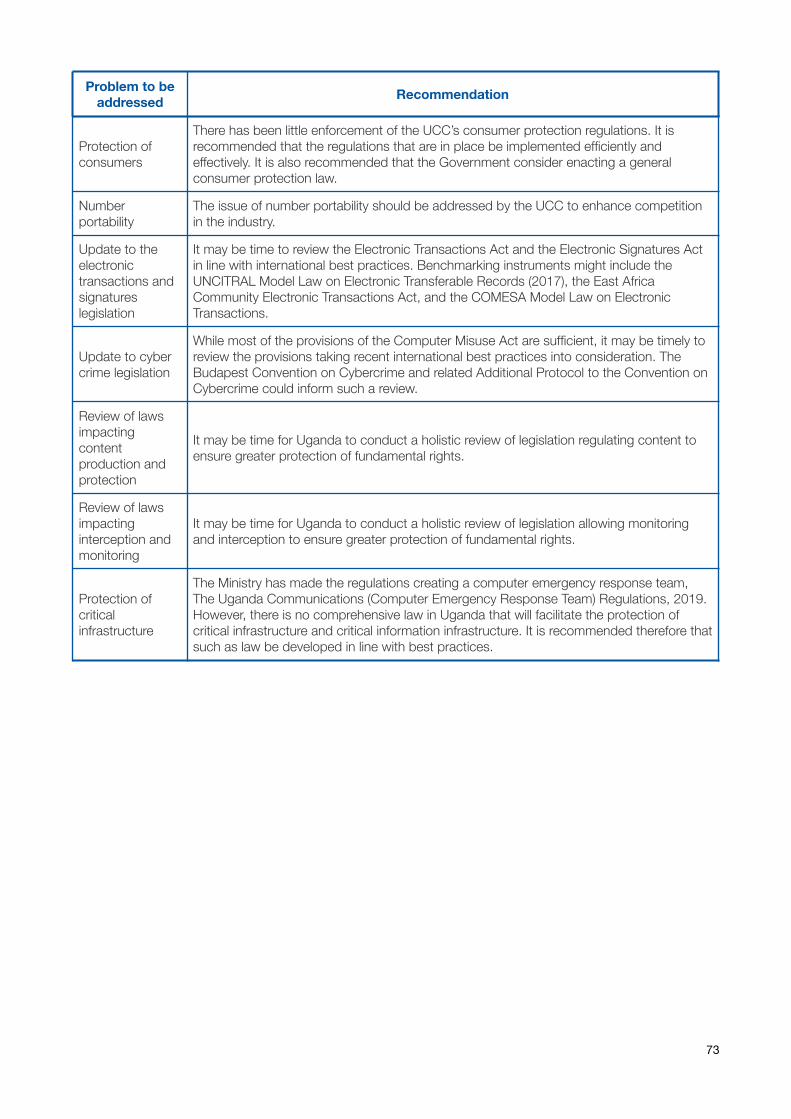
Protection of consumers
There has been little enforcement of the UCC’s consumer protection regulations. It is recommended that the regulations that are in place be implemented efficiently and effectively. It is also recommended that the Government consider enacting a general consumer protection law.
Number portability
The issue of number portability should be addressed by the UCC to enhance competition in the industry.
Update to the electronic transactions and signatures legislation
It may be time to review the Electronic Transactions Act and the Electronic Signatures Act in line with international best practices. Benchmarking instruments might include the UNCITRAL Model Law on Electronic Transferable Records (2017), the East Africa Community Electronic Transactions Act, and the COMESA Model Law on Electronic Transactions.
Update to cyber crime legislation
While most of the provisions of the Computer Misuse Act are sufficient, it may be timely to review the provisions taking recent international best practices into consideration. The Budapest Convention on Cybercrime and related Additional Protocol to the Convention on Cybercrime could inform such a review.
Review of laws impacting content production and protection
It may be time for Uganda to conduct a holistic review of legislation regulating content to ensure greater protection of fundamental rights.
Review of laws impacting interception and monitoring
It may be time for Uganda to conduct a holistic review of legislation allowing monitoring and interception to ensure greater protection of fundamental rights.
Protection of critical infrastructure
The Ministry has made the regulations creating a computer emergency response team, The Uganda Communications (Computer Emergency Response Team) Regulations, 2019. However, there is no comprehensive law in Uganda that will facilitate the protection of critical infrastructure and critical information infrastructure. It is recommended therefore that such as law be developed in line with best practices.
Problem to be addressed Recommendation
73
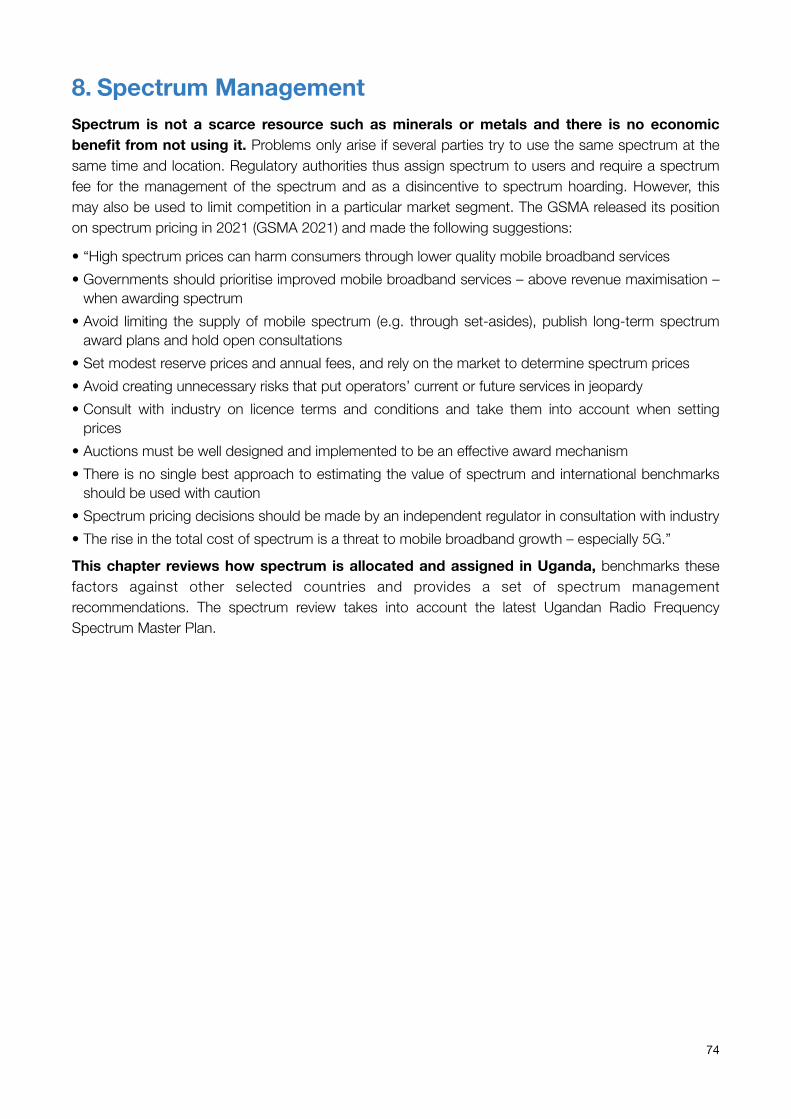
8. Spectrum Management Spectrum is not a scarce resource such as minerals or metals and there is no economic benefit from not using it. Problems only arise if several parties try to use the same spectrum at the same time and location. Regulatory authorities thus assign spectrum to users and require a spectrum fee for the management of the spectrum and as a disincentive to spectrum hoarding. However, this may also be used to limit competition in a particular market segment. The GSMA released its position on spectrum pricing in 2021 (GSMA 2021) and made the following suggestions:
• “High spectrum prices can harm consumers through lower quality mobile broadband services • Governments should prioritise improved mobile broadband services – above revenue maximisation –
when awarding spectrum • Avoid limiting the supply of mobile spectrum (e.g. through set-asides), publish long-term spectrum
award plans and hold open consultations • Set modest reserve prices and annual fees, and rely on the market to determine spectrum prices • Avoid creating unnecessary risks that put operators’ current or future services in jeopardy • Consult with industry on licence terms and conditions and take them into account when setting
prices • Auctions must be well designed and implemented to be an effective award mechanism • There is no single best approach to estimating the value of spectrum and international benchmarks
should be used with caution • Spectrum pricing decisions should be made by an independent regulator in consultation with industry • The rise in the total cost of spectrum is a threat to mobile broadband growth – especially 5G.”
This chapter reviews how spectrum is allocated and assigned in Uganda, benchmarks these factors against other selected countries and provides a set of spectrum management recommendations. The spectrum review takes into account the latest Ugandan Radio Frequency Spectrum Master Plan.
74
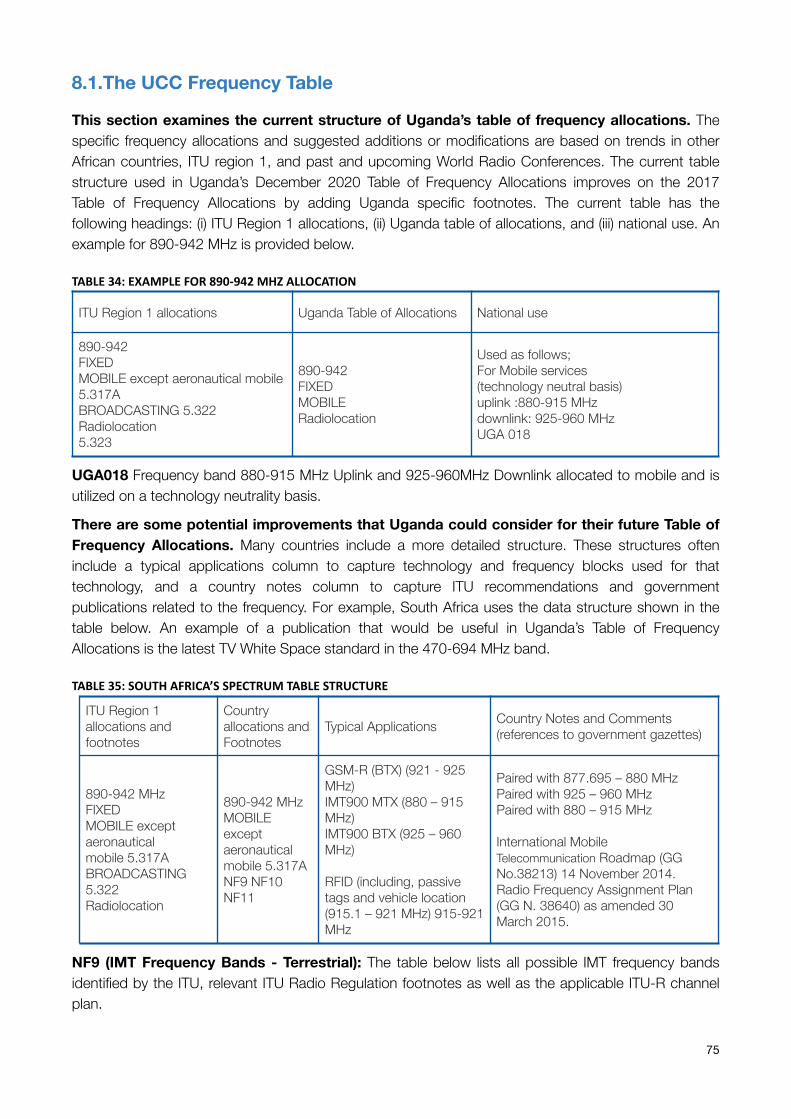
8.1.The UCC Frequency Table
This section examines the current structure of Uganda’s table of frequency allocations. The specific frequency allocations and suggested additions or modifications are based on trends in other African countries, ITU region 1, and past and upcoming World Radio Conferences. The current table structure used in Uganda’s December 2020 Table of Frequency Allocations improves on the 2017 Table of Frequency Allocations by adding Uganda specific footnotes. The current table has the following headings: (i) ITU Region 1 allocations, (ii) Uganda table of allocations, and (iii) national use. An example for 890-942 MHz is provided below.
TABLE34:EXAMPLEFOR890-942MHZALLOCATION
UGA018 Frequency band 880-915 MHz Uplink and 925-960MHz Downlink allocated to mobile and is utilized on a technology neutrality basis.
There are some potential improvements that Uganda could consider for their future Table of Frequency Allocations. Many countries include a more detailed structure. These structures often include a typical applications column to capture technology and frequency blocks used for that technology, and a country notes column to capture ITU recommendations and government publications related to the frequency. For example, South Africa uses the data structure shown in the table below. An example of a publication that would be useful in Uganda’s Table of Frequency Allocations is the latest TV White Space standard in the 470-694 MHz band.
TABLE35:SOUTHAFRICA’SSPECTRUMTABLESTRUCTURE
NF9 (IMT Frequency Bands - Terrestrial): The table below lists all possible IMT frequency bands identified by the ITU, relevant ITU Radio Regulation footnotes as well as the applicable ITU-R channel plan.
ITU Region 1 allocations Uganda Table of Allocations National use
890-942 FIXED MOBILE except aeronautical mobile 5.317A BROADCASTING 5.322 Radiolocation 5.323
890-942 FIXED MOBILE Radiolocation
Used as follows; For Mobile services (technology neutral basis) uplink :880-915 MHz downlink: 925-960 MHz UGA 018
ITU Region 1 allocations and footnotes
Country allocations and Footnotes
Typical Applications Country Notes and Comments (references to government gazettes)
890-942 MHz FIXED MOBILE except aeronautical mobile 5.317A BROADCASTING 5.322 Radiolocation
890-942 MHz MOBILE except aeronautical mobile 5.317A NF9 NF10 NF11
GSM-R (BTX) (921 - 925 MHz) IMT900 MTX (880 – 915 MHz) IMT900 BTX (925 – 960 MHz)
RFID (including, passive tags and vehicle location (915.1 – 921 MHz) 915-921 MHz
Paired with 877.695 – 880 MHz Paired with 925 – 960 MHz Paired with 880 – 915 MHz
International Mobile Telecommunication Roadmap (GG No.38213) 14 November 2014. Radio Frequency Assignment Plan (GG N. 38640) as amended 30 March 2015.
75
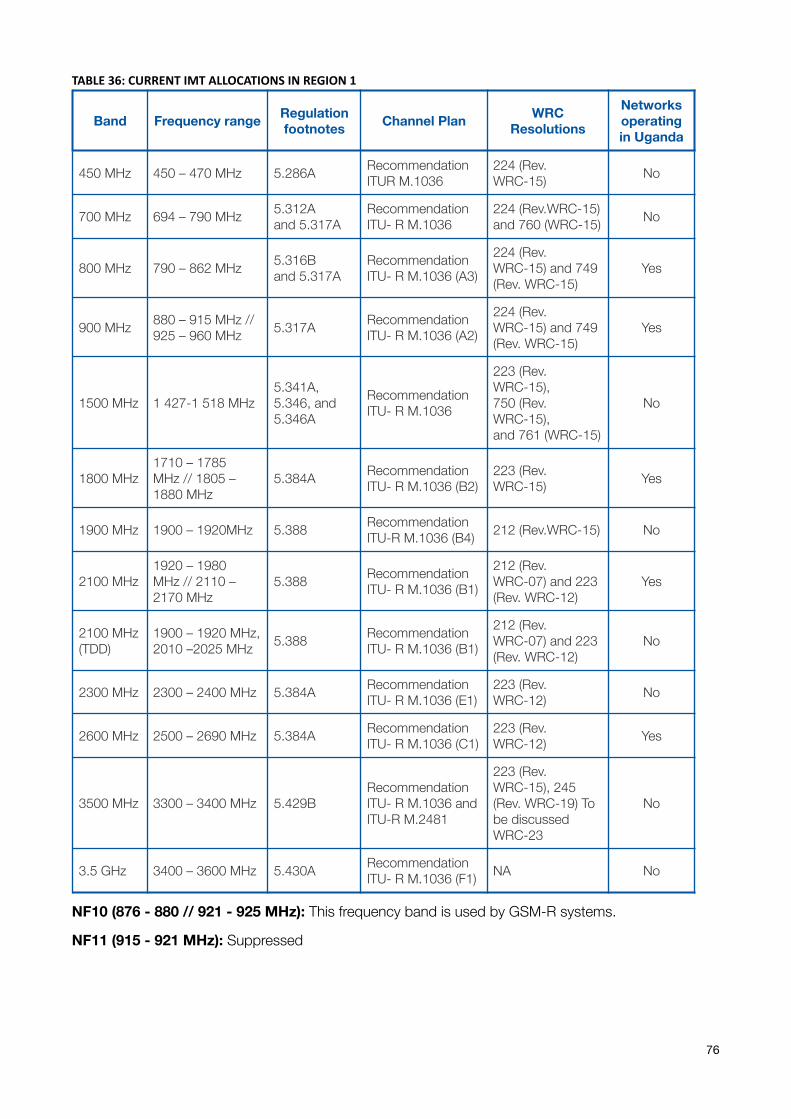
TABLE36:CURRENTIMTALLOCATIONSINREGION1
NF10 (876 - 880 // 921 - 925 MHz): This frequency band is used by GSM-R systems.
NF11 (915 - 921 MHz): Suppressed
Band Frequency range Regulation footnotes Channel Plan WRC
Resolutions
Networks operating in Uganda
450 MHz 450 – 470 MHz 5.286A Recommendation ITUR M.1036
224 (Rev. WRC-15) No
700 MHz 694 – 790 MHz 5.312A and 5.317A
Recommendation ITU- R M.1036
224 (Rev.WRC-15) and 760 (WRC-15) No
800 MHz 790 – 862 MHz 5.316B and 5.317A
Recommendation ITU- R M.1036 (A3)
224 (Rev. WRC-15) and 749 (Rev. WRC-15)
Yes
900 MHz 880 – 915 MHz // 925 – 960 MHz 5.317A Recommendation
ITU- R M.1036 (A2)224 (Rev. WRC-15) and 749 (Rev. WRC-15)
Yes
1500 MHz 1 427-1 518 MHz5.341A, 5.346, and 5.346A
Recommendation ITU- R M.1036
223 (Rev. WRC-15), 750 (Rev. WRC-15), and 761 (WRC-15)
No
1800 MHz1710 – 1785 MHz // 1805 – 1880 MHz
5.384A Recommendation ITU- R M.1036 (B2)
223 (Rev. WRC-15) Yes
1900 MHz 1900 – 1920MHz 5.388 Recommendation ITU-R M.1036 (B4) 212 (Rev.WRC-15) No
2100 MHz1920 – 1980 MHz // 2110 – 2170 MHz
5.388 Recommendation ITU- R M.1036 (B1)
212 (Rev. WRC-07) and 223 (Rev. WRC-12)
Yes
2100 MHz (TDD)
1900 – 1920 MHz, 2010 –2025 MHz 5.388 Recommendation
ITU- R M.1036 (B1)212 (Rev. WRC-07) and 223 (Rev. WRC-12)
No
2300 MHz 2300 – 2400 MHz 5.384A Recommendation ITU- R M.1036 (E1)
223 (Rev. WRC-12) No
2600 MHz 2500 – 2690 MHz 5.384A Recommendation ITU- R M.1036 (C1)
223 (Rev. WRC-12) Yes
3500 MHz 3300 – 3400 MHz 5.429BRecommendation ITU- R M.1036 and ITU-R M.2481
223 (Rev. WRC-15), 245 (Rev. WRC-19) To be discussed WRC-23
No
3.5 GHz 3400 – 3600 MHz 5.430A Recommendation ITU- R M.1036 (F1) NA No
76
Nigeria has a similar data structure and publishes its frequency allocation table online. 84
Ofcom in the UK also publishes its frequency table online. While Uganda does provide a 85
downloadable document of its table, this is static until updated and uploaded (the current version is 86
2017). Publishing a frequency table online makes it possible to have a continuous up-to-date frequency allocation table that can easily be checked by potential local users of spectrum or international companies interested in wireless deployments. These are some of the features typically captured in the column sections:
• In the country allocation section: footnote links with aspects shared between multiple frequency blocks (the latest 2020 Uganda Table of Frequency Allocations does now include this);
• In the typical applications section: a list of the technology and frequency ranges of typical applications being used nationally; and
• In the notes section: paired frequencies, ITU recommendations and country government gazettes or publicly available publications on topics related to the frequency block.
These topics can be captured with less column sections. For example, “Typical Applications” and “Country Notes” as well as publications could be captured in the “National Use” column. But at a high level these three topics are valuable for ensuring that a complete succinct level of detail is captured for each spectrum band.
8.2.Detailed comments on frequency allocation table
This section focuses on the ITU frequency categories with the most activity. . Categories such as Maritime Mobile, Maritime Radio navigation, Meteorological Aids, and Meteorological-Satellite have not changed much in the past few decades and are relatively static. The categories with the most activity are Broadcasting, Fixed, Fixed-Satellite, and Mobile. The full set of frequencies used for IMT spectrum in region 1 is provided in Appendix 14.6 for easy reference purposes. Full detailed comments are provided in Section 14.5, and some key aspects are highlighted here.
8.2.1.Low band (0 to 1 GHz) The 432-438 MHz band had no national use listed. However, the 433.05 - 434.79 MHz band is used for IoT applications such as Lora and 433 MHz is also used for low power applications such as garage door openers, headphones, baby monitors and remote-control applications. We note that such information has to be sought through contact with the UCC.
The 450-470 MHz band is used for narrow band-IMT2000 technologies (CDMA). However, the current band has no cellular phone support and is still used for PMR radio systems such as MPT-1327, TETRA, APCO 25, and DMR. The planned action in the Radio Frequency Spectrum Master Plan is to re-farm the band for introduction of IMT and Fixed Wireless Access (target date for ITA is Q2 2022).
For the 470-694 MHz band, Uganda should pursue harmonizing TVWS regulation with CRASA across the African continent to avoid the complexity of customizing equipment for each countries’ unique set of TVWS rules for spectrum access. A standard for use of “TV White Spaces” (470-694 MHz) have been published and will be subject to non-interference and on a non-
https://www.ncc.gov.ng/technical-regulation/spectrum/frequency-allocations#segment-2-30-300mhz84
http://static.ofcom.org.uk/static/spectrum/fat.html85
https://www.ucc.co.ug/wp-content/uploads/2017/09/Uganda-Table-of-Frequency-Allocation_SEPTEMBER-2017.pdf86
77
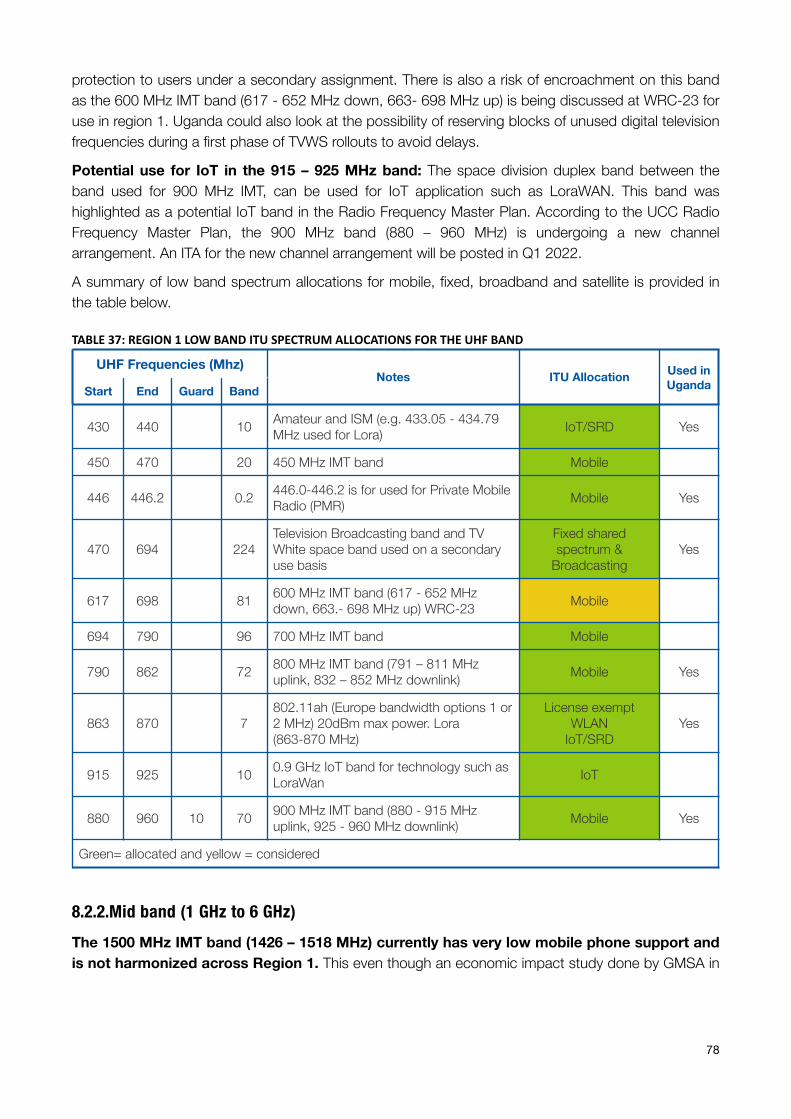
protection to users under a secondary assignment. There is also a risk of encroachment on this band as the 600 MHz IMT band (617 - 652 MHz down, 663- 698 MHz up) is being discussed at WRC-23 for use in region 1. Uganda could also look at the possibility of reserving blocks of unused digital television frequencies during a first phase of TVWS rollouts to avoid delays.
Potential use for IoT in the 915 – 925 MHz band: The space division duplex band between the band used for 900 MHz IMT, can be used for IoT application such as LoraWAN. This band was highlighted as a potential IoT band in the Radio Frequency Master Plan. According to the UCC Radio Frequency Master Plan, the 900 MHz band (880 – 960 MHz) is undergoing a new channel arrangement. An ITA for the new channel arrangement will be posted in Q1 2022.
A summary of low band spectrum allocations for mobile, fixed, broadband and satellite is provided in the table below.
TABLE37:REGION1LOWBANDITUSPECTRUMALLOCATIONSFORTHEUHFBAND
8.2.2.Mid band (1 GHz to 6 GHz) The 1500 MHz IMT band (1426 – 1518 MHz) currently has very low mobile phone support and is not harmonized across Region 1. This even though an economic impact study done by GMSA in
UHF Frequencies (Mhz)Notes ITU Allocation Used in
UgandaStart End Guard Band
430 440 10 Amateur and ISM (e.g. 433.05 - 434.79 MHz used for Lora) IoT/SRD Yes
450 470 20 450 MHz IMT band Mobile
446 446.2 0.2 446.0-446.2 is for used for Private Mobile Radio (PMR) Mobile Yes
470 694 224Television Broadcasting band and TV White space band used on a secondary use basis
Fixed shared spectrum &
BroadcastingYes
617 698 81 600 MHz IMT band (617 - 652 MHz down, 663.- 698 MHz up) WRC-23 Mobile
694 790 96 700 MHz IMT band Mobile
790 862 72 800 MHz IMT band (791 – 811 MHz uplink, 832 – 852 MHz downlink) Mobile Yes
863 870 7802.11ah (Europe bandwidth options 1 or 2 MHz) 20dBm max power. Lora (863-870 MHz)
License exempt WLAN
IoT/SRDYes
915 925 10 0.9 GHz IoT band for technology such as LoraWan IoT
880 960 10 70 900 MHz IMT band (880 - 915 MHz uplink, 925 - 960 MHz downlink) Mobile Yes
Green= allocated and yellow = considered
78
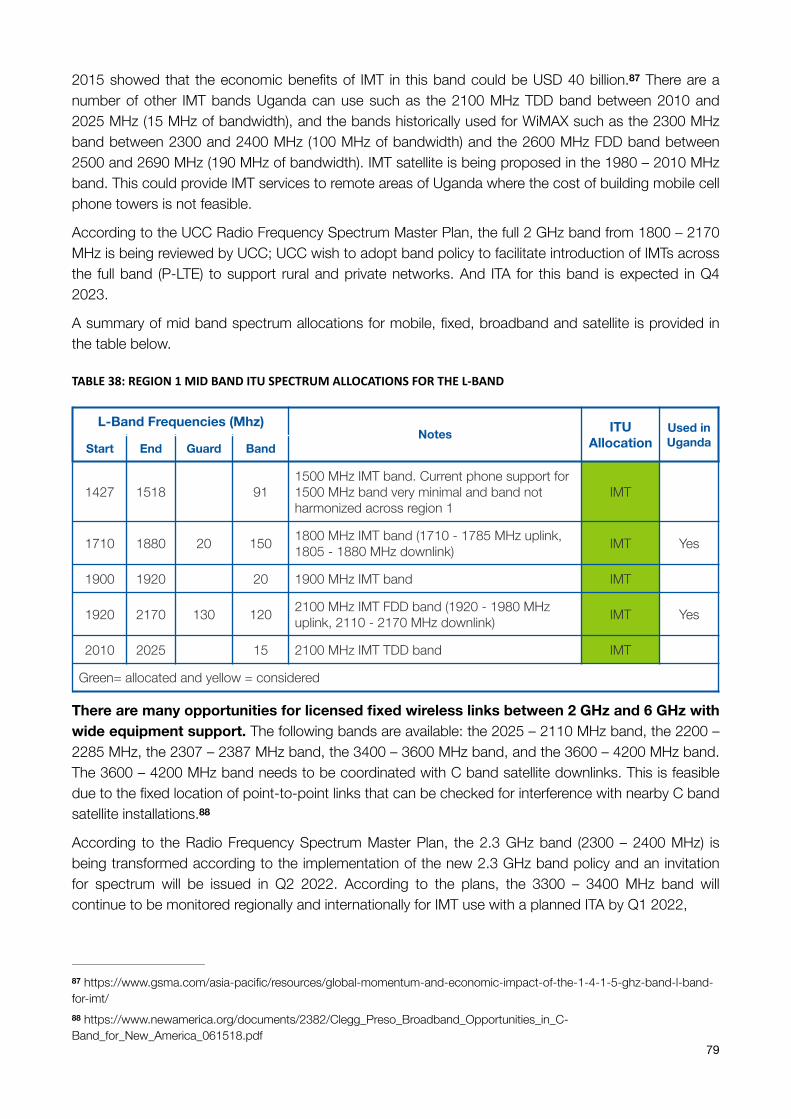
2015 showed that the economic benefits of IMT in this band could be USD 40 billion. There are a 87
number of other IMT bands Uganda can use such as the 2100 MHz TDD band between 2010 and 2025 MHz (15 MHz of bandwidth), and the bands historically used for WiMAX such as the 2300 MHz band between 2300 and 2400 MHz (100 MHz of bandwidth) and the 2600 MHz FDD band between 2500 and 2690 MHz (190 MHz of bandwidth). IMT satellite is being proposed in the 1980 – 2010 MHz band. This could provide IMT services to remote areas of Uganda where the cost of building mobile cell phone towers is not feasible.
According to the UCC Radio Frequency Spectrum Master Plan, the full 2 GHz band from 1800 – 2170 MHz is being reviewed by UCC; UCC wish to adopt band policy to facilitate introduction of IMTs across the full band (P-LTE) to support rural and private networks. And ITA for this band is expected in Q4 2023.
A summary of mid band spectrum allocations for mobile, fixed, broadband and satellite is provided in the table below.
TABLE38:REGION1MIDBANDITUSPECTRUMALLOCATIONSFORTHEL-BAND
There are many opportunities for licensed fixed wireless links between 2 GHz and 6 GHz with wide equipment support. The following bands are available: the 2025 – 2110 MHz band, the 2200 – 2285 MHz, the 2307 – 2387 MHz band, the 3400 – 3600 MHz band, and the 3600 – 4200 MHz band. The 3600 – 4200 MHz band needs to be coordinated with C band satellite downlinks. This is feasible due to the fixed location of point-to-point links that can be checked for interference with nearby C band satellite installations. 88
According to the Radio Frequency Spectrum Master Plan, the 2.3 GHz band (2300 – 2400 MHz) is being transformed according to the implementation of the new 2.3 GHz band policy and an invitation for spectrum will be issued in Q2 2022. According to the plans, the 3300 – 3400 MHz band will continue to be monitored regionally and internationally for IMT use with a planned ITA by Q1 2022,
L-Band Frequencies (Mhz)Notes ITU
AllocationUsed in UgandaStart End Guard Band
1427 1518 911500 MHz IMT band. Current phone support for 1500 MHz band very minimal and band not harmonized across region 1
IMT
1710 1880 20 150 1800 MHz IMT band (1710 - 1785 MHz uplink, 1805 - 1880 MHz downlink) IMT Yes
1900 1920 20 1900 MHz IMT band IMT
1920 2170 130 120 2100 MHz IMT FDD band (1920 - 1980 MHz uplink, 2110 - 2170 MHz downlink) IMT Yes
2010 2025 15 2100 MHz IMT TDD band IMT
Green= allocated and yellow = considered
https://www.gsma.com/asia-pacific/resources/global-momentum-and-economic-impact-of-the-1-4-1-5-ghz-band-l-band-87
for-imt/ https://www.newamerica.org/documents/2382/Clegg_Preso_Broadband_Opportunities_in_C-88
Band_for_New_America_061518.pdf79
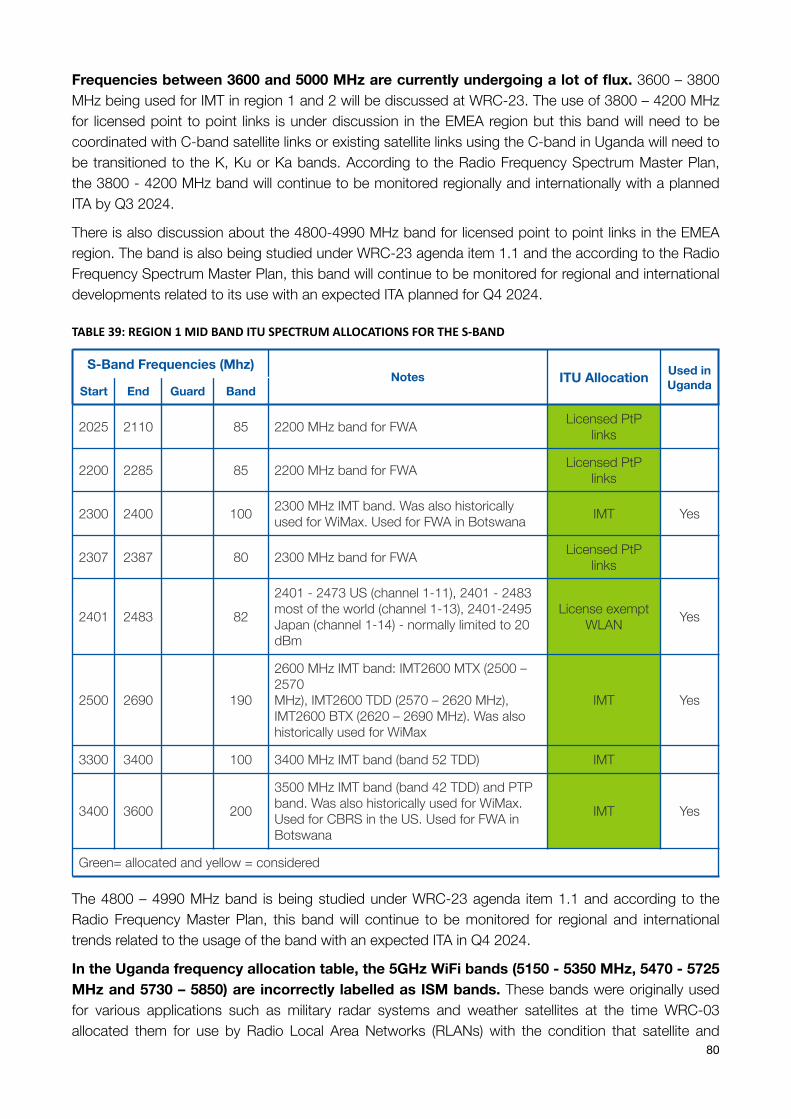
Frequencies between 3600 and 5000 MHz are currently undergoing a lot of flux. 3600 – 3800 MHz being used for IMT in region 1 and 2 will be discussed at WRC-23. The use of 3800 – 4200 MHz for licensed point to point links is under discussion in the EMEA region but this band will need to be coordinated with C-band satellite links or existing satellite links using the C-band in Uganda will need to be transitioned to the K, Ku or Ka bands. According to the Radio Frequency Spectrum Master Plan, the 3800 - 4200 MHz band will continue to be monitored regionally and internationally with a planned ITA by Q3 2024.
There is also discussion about the 4800-4990 MHz band for licensed point to point links in the EMEA region. The band is also being studied under WRC-23 agenda item 1.1 and the according to the Radio Frequency Spectrum Master Plan, this band will continue to be monitored for regional and international developments related to its use with an expected ITA planned for Q4 2024.
TABLE39:REGION1MIDBANDITUSPECTRUMALLOCATIONSFORTHES-BAND
The 4800 – 4990 MHz band is being studied under WRC-23 agenda item 1.1 and according to the Radio Frequency Master Plan, this band will continue to be monitored for regional and international trends related to the usage of the band with an expected ITA in Q4 2024.
In the Uganda frequency allocation table, the 5GHz WiFi bands (5150 - 5350 MHz, 5470 - 5725 MHz and 5730 – 5850) are incorrectly labelled as ISM bands. These bands were originally used for various applications such as military radar systems and weather satellites at the time WRC-03 allocated them for use by Radio Local Area Networks (RLANs) with the condition that satellite and
S-Band Frequencies (Mhz)Notes ITU Allocation Used in
UgandaStart End Guard Band
2025 2110 85 2200 MHz band for FWA Licensed PtP links
2200 2285 85 2200 MHz band for FWA Licensed PtP links
2300 2400 100 2300 MHz IMT band. Was also historically used for WiMax. Used for FWA in Botswana IMT Yes
2307 2387 80 2300 MHz band for FWA Licensed PtP links
2401 2483 822401 - 2473 US (channel 1-11), 2401 - 2483 most of the world (channel 1-13), 2401-2495 Japan (channel 1-14) - normally limited to 20 dBm
License exempt WLAN Yes
2500 2690 190
2600 MHz IMT band: IMT2600 MTX (2500 – 2570 MHz), IMT2600 TDD (2570 – 2620 MHz), IMT2600 BTX (2620 – 2690 MHz). Was also historically used for WiMax
IMT Yes
3300 3400 100 3400 MHz IMT band (band 52 TDD) IMT
3400 3600 2003500 MHz IMT band (band 42 TDD) and PTP band. Was also historically used for WiMax. Used for CBRS in the US. Used for FWA in Botswana
IMT Yes
Green= allocated and yellow = considered
80
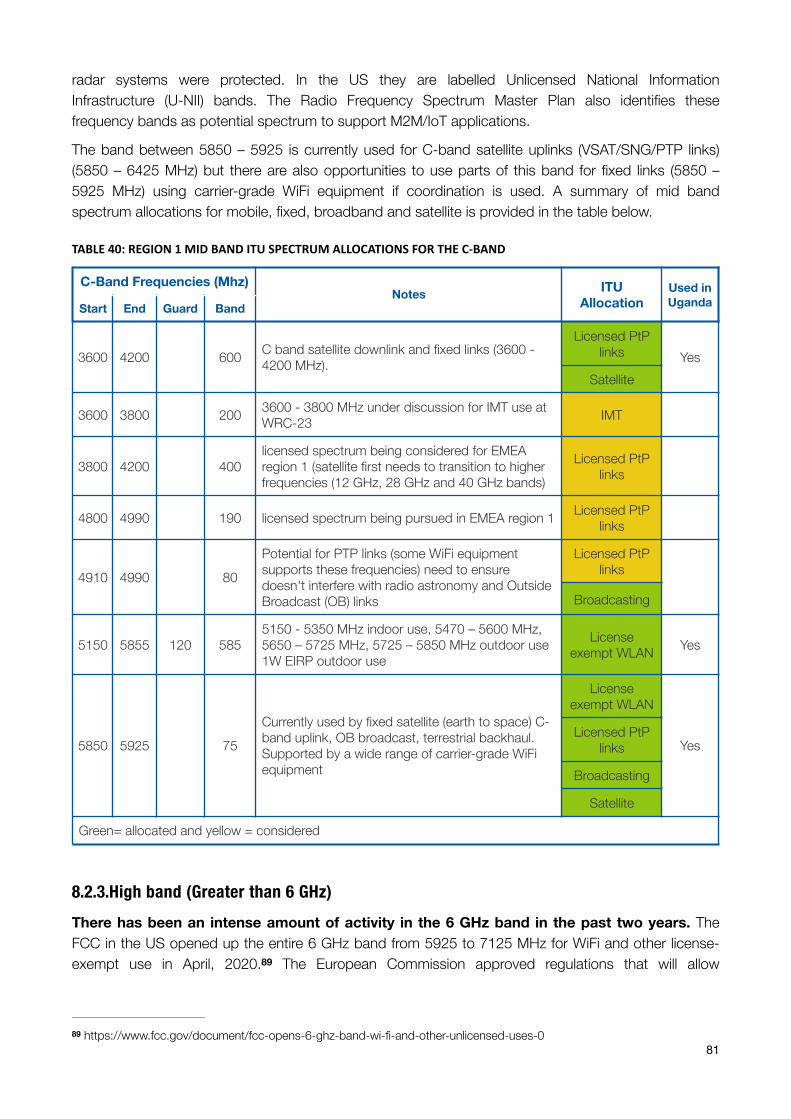
radar systems were protected. In the US they are labelled Unlicensed National Information Infrastructure (U-NII) bands. The Radio Frequency Spectrum Master Plan also identifies these frequency bands as potential spectrum to support M2M/IoT applications.
The band between 5850 – 5925 is currently used for C-band satellite uplinks (VSAT/SNG/PTP links) (5850 – 6425 MHz) but there are also opportunities to use parts of this band for fixed links (5850 – 5925 MHz) using carrier-grade WiFi equipment if coordination is used. A summary of mid band spectrum allocations for mobile, fixed, broadband and satellite is provided in the table below.
TABLE40:REGION1MIDBANDITUSPECTRUMALLOCATIONSFORTHEC-BAND
8.2.3.High band (Greater than 6 GHz) There has been an intense amount of activity in the 6 GHz band in the past two years. The FCC in the US opened up the entire 6 GHz band from 5925 to 7125 MHz for WiFi and other license-exempt use in April, 2020. The European Commission approved regulations that will allow 89
C-Band Frequencies (Mhz)Notes ITU
AllocationUsed in UgandaStart End Guard Band
3600 4200 600 C band satellite downlink and fixed links (3600 - 4200 MHz).
Licensed PtP links Yes
Satellite
3600 3800 200 3600 - 3800 MHz under discussion for IMT use at WRC-23 IMT
3800 4200 400licensed spectrum being considered for EMEA region 1 (satellite first needs to transition to higher frequencies (12 GHz, 28 GHz and 40 GHz bands)
Licensed PtP links
4800 4990 190 licensed spectrum being pursued in EMEA region 1 Licensed PtP links
4910 4990 80Potential for PTP links (some WiFi equipment supports these frequencies) need to ensure doesn't interfere with radio astronomy and Outside Broadcast (OB) links
Licensed PtP links
Broadcasting
5150 5855 120 5855150 - 5350 MHz indoor use, 5470 – 5600 MHz, 5650 – 5725 MHz, 5725 – 5850 MHz outdoor use 1W EIRP outdoor use
License exempt WLAN Yes
5850 5925 75Currently used by fixed satellite (earth to space) C-band uplink, OB broadcast, terrestrial backhaul. Supported by a wide range of carrier-grade WiFi equipment
License exempt WLAN
YesLicensed PtP
links
Broadcasting
Satellite
Green= allocated and yellow = considered
https://www.fcc.gov/document/fcc-opens-6-ghz-band-wi-fi-and-other-unlicensed-uses-089
81
deployment of WiFi in the lower 6 GHz band from 5925 to 6425 MHz in June 2021. The African 90
Telecommunications Union’s emerging technologies task group suggested in July 2021 that the lower 6 GHz band from 5925 to 6425 MHz be made available for unlicensed use on a non-exclusive, non-interference and non-protected basis. The UCC Radio Spectrum Master Plan is considering the 91
adoption of the lower 6 GHz band to support WiFi-6. In Region 1, the upper 6 GHz band from 6425 to 7025 MHz is being considered for IMT at WRC-23. However, there are notable exceptions to the upper block of the 6 GHz band being used for IMT in region 1. In March 2021, Saudi Arabia, released the full lower and upper block of 6 GHz for WiFi and Kenya is also exploring using the entire 6 GHz block for 92
WiFi and other license-exempt uses. 93
There are some good spectrum opportunities for both IMT and license-exempt use in the high band region for Uganda. The 17 GHz band (17.1 – 17.3 GHz) and 24 GHz band (24.0 – 24.25 GHz) can be used to build fixed wireless links although generally these will be for short range links as they have 100 mW EIRP power limits. The 60 GHz band (57 – 66 GHz) known as WiGig is currently used by the 802.11ad standard for building outdoor point to point links and the 802.11ay standard for high-speed indoor cable replacement with speeds up to 7 Gbps.
According to the UCC Radio Spectrum Master Plan, the 60 GHz band is envisaged to support Fixed Wireless Access to support 5G (NR-U) private and dedicated networks with an ITA expected in Q4 2022.
The 24500 – 27500 MHz band (250 MHz of bandwidth) has recently been licensed for 5G in Europe and is a potential band for high-capacity 5G cellular in urban areas.
There are several spectrum developments for satellite. Many of the new LEO satellite providers will be offering services in the Ka band (27500 – 31000 MHz). In the UCC Radio Spectrum Master Plan, 17.7 – 19.7 GHz in the Ku band (space-to-Earth) and 27.5 – 29.5 GHz in the K band (earth-to-space) is being explored for operation of Earth stations in motion (ESIMs). An ITA for these bands is expected in Q4 2022.
The E-band (71 – 76 GHz paired with 81 – 86 GHz) is typically used for fixed links and according to the UCC Radio Frequency Spectrum Master plan, an invitation for application for spectrum will be posted via a public notice in Q1 2022.
A summary of high band spectrum allocations for mobile, fixed, broadband and satellite is provided in Table 37.
https://www.eetimes.eu/eu-boosts-6ghz-spectrum-for-wi-fi-use/90
https://www.icasa.org.za/uploads/files/GH_Communnication-ATU-R-Recom.pdf91
https://wifinowglobal.com/newsletter/saudi-arabia-releases-full-6-ghz-band-to-wi-fi-and-takes-global-lead-in-mid-band-92
unlicensed-spectrum/ https://www.wi-fi.org/countries-enabling-wi-fi-6e93
82
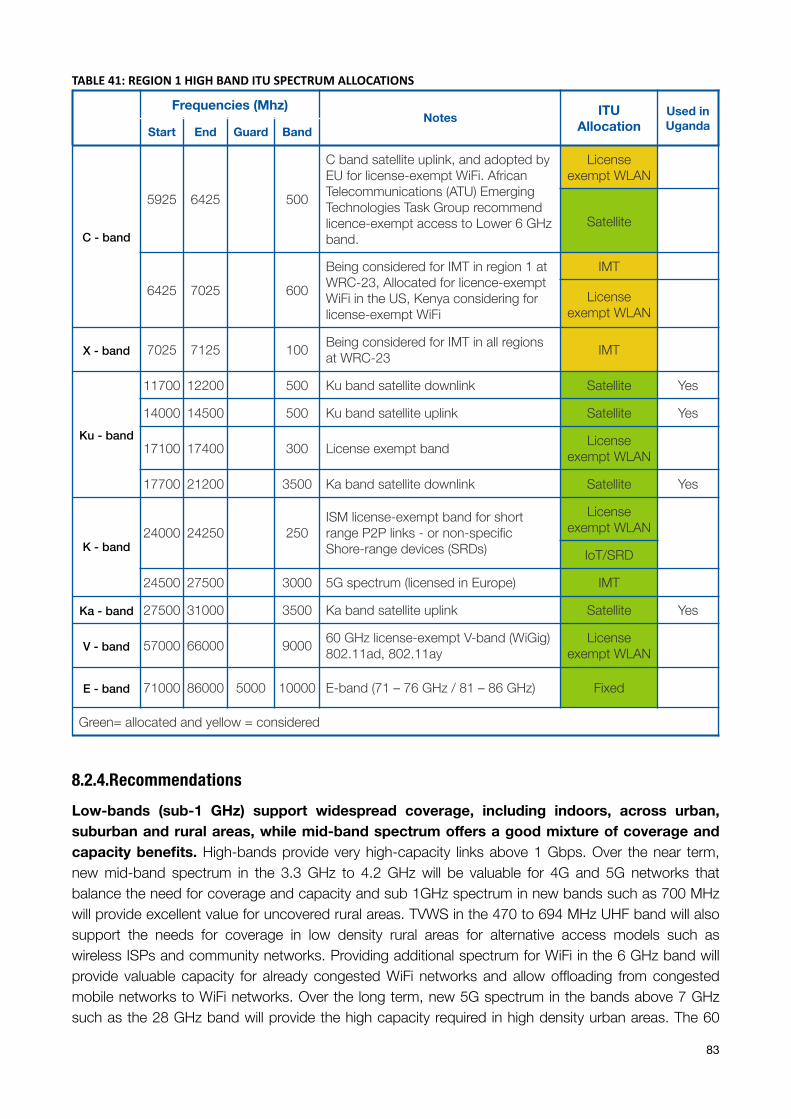
TABLE41:REGION1HIGHBANDITUSPECTRUMALLOCATIONS
8.2.4.Recommendations Low-bands (sub-1 GHz) support widespread coverage, including indoors, across urban, suburban and rural areas, while mid-band spectrum offers a good mixture of coverage and capacity benefits. High-bands provide very high-capacity links above 1 Gbps. Over the near term, new mid-band spectrum in the 3.3 GHz to 4.2 GHz will be valuable for 4G and 5G networks that balance the need for coverage and capacity and sub 1GHz spectrum in new bands such as 700 MHz will provide excellent value for uncovered rural areas. TVWS in the 470 to 694 MHz UHF band will also support the needs for coverage in low density rural areas for alternative access models such as wireless ISPs and community networks. Providing additional spectrum for WiFi in the 6 GHz band will provide valuable capacity for already congested WiFi networks and allow offloading from congested mobile networks to WiFi networks. Over the long term, new 5G spectrum in the bands above 7 GHz such as the 28 GHz band will provide the high capacity required in high density urban areas. The 60
Frequencies (Mhz)Notes ITU
AllocationUsed in UgandaStart End Guard Band
C - band
5925 6425 500
C band satellite uplink, and adopted by EU for license-exempt WiFi. African Telecommunications (ATU) Emerging Technologies Task Group recommend licence-exempt access to Lower 6 GHz band.
License exempt WLAN
Satellite
6425 7025 600Being considered for IMT in region 1 at WRC-23, Allocated for licence-exempt WiFi in the US, Kenya considering for license-exempt WiFi
IMT
License exempt WLAN
X - band 7025 7125 100 Being considered for IMT in all regions at WRC-23 IMT
Ku - band
11700 12200 500 Ku band satellite downlink Satellite Yes
14000 14500 500 Ku band satellite uplink Satellite Yes
17100 17400 300 License exempt band License exempt WLAN
17700 21200 3500 Ka band satellite downlink Satellite Yes
K - band24000 24250 250
ISM license-exempt band for short range P2P links - or non-specific Shore-range devices (SRDs)
License exempt WLAN
IoT/SRD
24500 27500 3000 5G spectrum (licensed in Europe) IMT
Ka - band 27500 31000 3500 Ka band satellite uplink Satellite Yes
V - band 57000 66000 9000 60 GHz license-exempt V-band (WiGig) 802.11ad, 802.11ay
License exempt WLAN
E - band 71000 86000 5000 10000 E-band (71 – 76 GHz / 81 – 86 GHz) Fixed
Green= allocated and yellow = considered
83
GHz license-exempt bands can also serve as fibre replacement to create high-capacity links in areas with high population density. For very remote areas, Low Earth Orbit (LEO) services in the Ka-band will provide high-capacity, low latency links and Earth Station in Motion (ESIM) services in the Ku and K band will provide remote services for land vehicles in motion.
8.3.Best practices in emerging spectrum management
8.3.1.United States (Americas) The US has been a first mover in many areas of spectrum access innovation. As far back as the 1930s, the US acknowledged that it was impossible to license every radio resource, and this was unnecessary anyway when there was little risk of harmful interference. In 1938, the Federal Communications Commission (FCC) created a new license exempt rule allowing some specific types of short-range communication devices like baby monitors and wireless loudspeakers to operate without a license. Until the 1980s, each individual device had to apply for license exemption which was creating an enormous administrative backlog. In order to streamline this process, in 1989, the FCC decided to “future proof” its rules and created broad categories of rules that were application and device-neutral. As long as the devices met the technical constraints of these rules, they were license exempt. This led to a burst of innovations like RFID, WiFi and Bluetooth in the 1990s that has spurred a multi-trillion-dollar industry; the Internet of Things industry alone is worth $14 trillion dollars. 94
The US has continued to innovate in spectrum management in the new millennium. In 2008, the FCC voted to approve the unlicensed use of TV white spaces — radio frequencies allocated to a broadcasting service but not used locally. TVWS rules allowed secondary users to make use of channels that are unused by the primary broadcasting users. This is a so-called two-tier licensing model. In 2017, the FCC created new commercial rules for the 3.5 GHz Citizens Broadband Radio Service (CBRS) — a 150 MHz band from 3550 to 3700 MHz. Parts of the band were still reserved for the Federal Government to limit interference with Navy radar systems and aircraft communications. CBRS makes use of a three-tier licensing model to accommodate a variety of commercial uses on a shared basis with incumbent federal and non-federal users of the band in the US. The three tiers are:
• Incumbent Access tier users that include authorized federal and grandfathered fixed satellite service users currently operating in the 3.5 GHz band protected from harmful interference from Priority Access and General Authorized Access users.
• The Priority Access tier consists of Priority Access Licenses (PALs) that will be assigned using competitive bidding within the 3550-3650 MHz portion of the band. Each PAL is defined as a non-renewable authorization to use a 10 megahertz channel in a single census tract for three years.
• The General Authorized Access tier is licensed-by-rule to permit open, flexible access to the band for the widest possible group of potential users. General Authorized Access users are permitted to use any portion of the 3550-3700 MHz band not assigned to a higher tier user and may also operate opportunistically on unused Priority Access channels.
Use of the CBRS band does not require spectrum licenses, which, in turn, is expected to reduce the cost of data transmissions. This will enable carriers to deploy 5G faster and with less administrative burden using the shared airwaves instead of trying to acquire spectrum licenses at an auction or through deals.
https://www.inc.com/andrew-thomas/this-industry-is-projected-to-be-14-trillion-by-2020-here-are-the-top-influence.html94
84
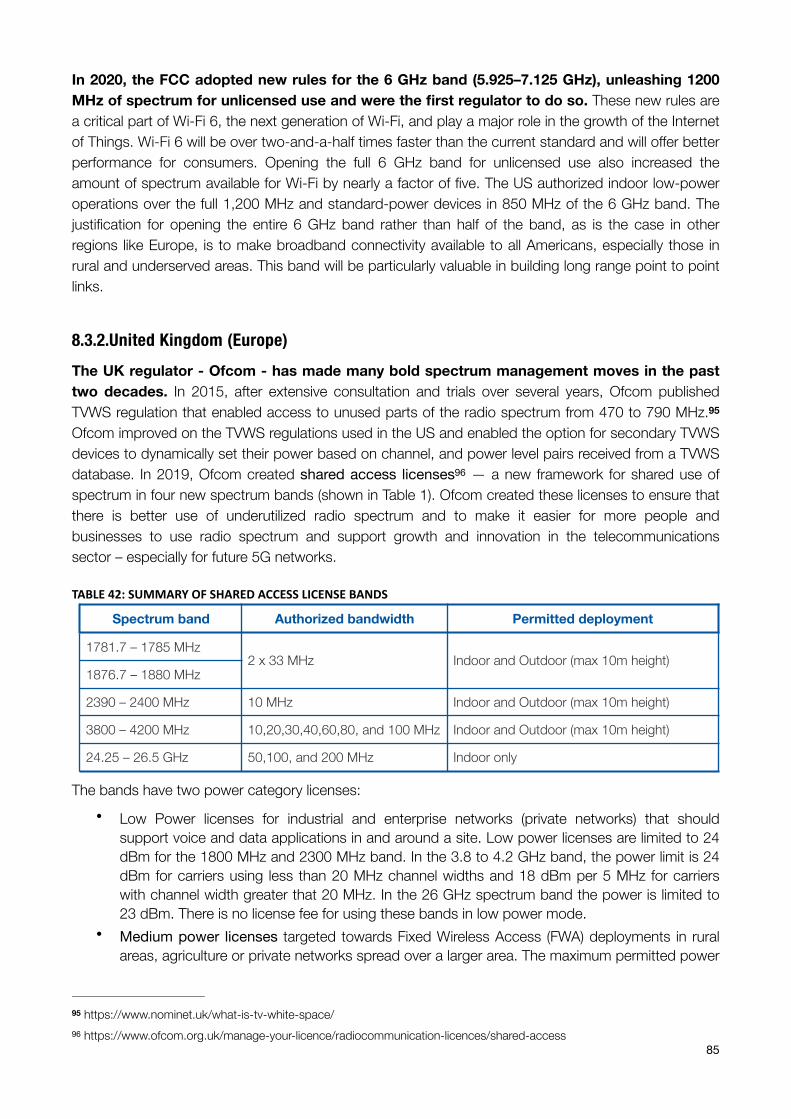
In 2020, the FCC adopted new rules for the 6 GHz band (5.925–7.125 GHz), unleashing 1200 MHz of spectrum for unlicensed use and were the first regulator to do so. These new rules are a critical part of Wi-Fi 6, the next generation of Wi-Fi, and play a major role in the growth of the Internet of Things. Wi-Fi 6 will be over two-and-a-half times faster than the current standard and will offer better performance for consumers. Opening the full 6 GHz band for unlicensed use also increased the amount of spectrum available for Wi-Fi by nearly a factor of five. The US authorized indoor low-power operations over the full 1,200 MHz and standard-power devices in 850 MHz of the 6 GHz band. The justification for opening the entire 6 GHz band rather than half of the band, as is the case in other regions like Europe, is to make broadband connectivity available to all Americans, especially those in rural and underserved areas. This band will be particularly valuable in building long range point to point links.
8.3.2.United Kingdom (Europe) The UK regulator - Ofcom - has made many bold spectrum management moves in the past two decades. In 2015, after extensive consultation and trials over several years, Ofcom published TVWS regulation that enabled access to unused parts of the radio spectrum from 470 to 790 MHz. 95
Ofcom improved on the TVWS regulations used in the US and enabled the option for secondary TVWS devices to dynamically set their power based on channel, and power level pairs received from a TVWS database. In 2019, Ofcom created shared access licenses — a new framework for shared use of 96
spectrum in four new spectrum bands (shown in Table 1). Ofcom created these licenses to ensure that there is better use of underutilized radio spectrum and to make it easier for more people and businesses to use radio spectrum and support growth and innovation in the telecommunications sector – especially for future 5G networks.
TABLE42:SUMMARYOFSHAREDACCESSLICENSEBANDS
The bands have two power category licenses: • Low Power licenses for industrial and enterprise networks (private networks) that should
support voice and data applications in and around a site. Low power licenses are limited to 24 dBm for the 1800 MHz and 2300 MHz band. In the 3.8 to 4.2 GHz band, the power limit is 24 dBm for carriers using less than 20 MHz channel widths and 18 dBm per 5 MHz for carriers with channel width greater that 20 MHz. In the 26 GHz spectrum band the power is limited to 23 dBm. There is no license fee for using these bands in low power mode.
• Medium power licenses targeted towards Fixed Wireless Access (FWA) deployments in rural areas, agriculture or private networks spread over a larger area. The maximum permitted power
Spectrum band Authorized bandwidth Permitted deployment
1781.7 – 1785 MHz2 x 33 MHz Indoor and Outdoor (max 10m height)
1876.7 – 1880 MHz
2390 – 2400 MHz 10 MHz Indoor and Outdoor (max 10m height)
3800 – 4200 MHz 10,20,30,40,60,80, and 100 MHz Indoor and Outdoor (max 10m height)
24.25 – 26.5 GHz 50,100, and 200 MHz Indoor only
https://www.nominet.uk/what-is-tv-white-space/95
https://www.ofcom.org.uk/manage-your-licence/radiocommunication-licences/shared-access96
85
for all bands in this power category is 42 dBm. The licensing fee is 80 GBP for a 2 x 3.3 MHz / 10 MHz channel and 800 GBP for a 100 MHz channel.
In addition to shared spectrum licenses, in 2019, Ofcom created local access licenses that 97
enable organizations and enterprises to gain access to radio spectrum previously allocated / licensed to mobile service providers but not being utilized throughout the entire country. If the spectrum is not being used in a specific geographical location, an organization can approach Ofcom and request a local access license to make use of it. A local access license is available in any band covered by the 2011 mobile trading regulations and include the 800, 900, 1400, 1800, 1900, 2100, 2300, and 2600 MHz bands that are widely used for mobile 2G, 3G, 4G and 5G technologies. The licenses will apply for a period of three years and cost 950 GBP.
8.3.3.New Zealand (Australasia) New Zealand encourages innovative ideas to use spectrum more efficiently as well as creating new methods or opportunities for connecting the unconnected. To this end, New Zealand has created Managed Spectrum Park licenses, allocated spectrum to the Māori Spectrum Working Group, and has an open data spectrum policy.
New Zealand created Managed Spectrum Park (MSP) licenses in 2008. The licensed band consists of 40 MHz of spectrum from 2575 MHz - 2620 MHz. In this regime, the licensee agrees to share the block of spectrum by means of licensing or employing compatible equipment capable of sharing the same spectrum (this could be using techniques such as antenna polarization, careful site selection, power control, and databases). MSP licenses are allocated following an expression of interest process, which may involve a ballot if applicants can't agree to share spectrum. To ensure the spectrum is efficiently utilized, services must be implemented within two years of allocation.
Established in 2019, the Māori Spectrum Working Group advocates for Māori interests in radio spectrum and spectrum auctions in the future. A recent deal was signed that allocated a significant slice of 5G spectrum to the Māori. 50 MHz of unused spectrum in the 3.5 GHz band, 98
currently supported by smartphones, was made available to the Māori in 2020. Māori interests in radio spectrum date back to 2004, when the Māori Television Broadcasting service was established (currently they own two DTV channels). This is similar to social purposes spectrum licenses created in Mexico for communities to deploy mobile service in the 850 MHz band.
The New Zealand regulator opted for a simple approach for licensed microwave links. They charge a flat fee of $150 per link regardless of frequency. New Zealand also have a fully open data 99
policy regarding spectrum use. All licensed spectrum users can be looked up on the regulator website. The website provides the name of the license holder, location of sites with a grid reference, 100
the spectrum they are using and the license type.
https://www.mpirical.com/blog/shared-access-driving-innovation-in-the-uk-with-local-spectrum-licencing97
See 5G deal signed with Maori (https://www.stuff.co.nz/business/118193085/sparks-5g-roadblock-cleared-after-government-strikes-98
deal-with-mori).
https://www.rsm.govt.nz/licensing/licences-you-must-pay-for/fixed-location-licences/fixed-link-licence/99
https://rrf.rsm.govt.nz/smart-web/smart/page/-smart/domain/licence/SelectLicencePage.wdk100
86
8.3.4.South Africa (Africa) South Africa’s current broadband policy, SA Connect – ratified in 2013 - grew out of the National Development Plan NDP (focused on addressing poverty and inequality) to 101
address the lack of affordable high speed and high quality bandwidth for businesses, public institutions and citizens. The plan has a vision of 80% of the population connected at 100 Mbps by 2030 and 100% of the population connected at 10 Mbps by 2030. Spectrum access is a critical component of achieving targets in the NDP plan and the SA Connect policy. Without sufficient spectrum in the lower bands, coverage targets won’t be achieved and in the mid and high-bands, capacity targets won’t be achieved. The national commitments to ICTs that followed SA Connect in 2013, have not been met and no significant progress has been made to reach the specific objectives. However, in spite of this, the private sector has made impressive gains. By 2012, the mobile operators had already achieved 99% mobile population coverage (although this was never independently verified). Mobile operators last received competitive spectrum 15 years ago and have have re-farmed their existing spectrum in the allocated 900,1800 and 2100 MHz bands for 3G and 4G networks.
At the end of 2020, ICASA announced the auction of 406 MHz of high-demand spectrum in an ITA (Invitation to Apply). 80 MHz of this spectrum was reserved for a new Wholesale Open Access Network (WOAN). The aim of the WOAN is to create a wholesale open access wireless network that smaller operators can use to open up more competition in the services market. The idea of the WOAN has received mixed opinions from industry. Smaller players in the market support the creation of a WOAN to increase competition and larger players are against it. The WOAN will be awarded in a separate bid process that was expected in 2021. Both processes were delayed by court proceedings. Larger operators who bid for and are awarded spectrum in the expected auction are required to collectively purchase 30% of the WOAN capacity as a condition for being awarded new high-demand spectrum. Open-access models have been very successful when used by fibre network operators and empower many ISPs to compete as service providers, which works well to drive down prices. It is yet to be seen if the model will work with a mobile wholesale access network.
South Africa published final TV White Space regulations in 2018, becoming the first African 102
country to publish a TV White Space regulatory framework. In early 2021, the first commercial TV White space networks began rolling out. 103
South Africa also has a very robust growing Wireless ISP (WISP) market. WISPs in South Africa have developed experience in rolling out low-cost connectivity via fixed wireless broadband access (typically under R500 per month for uncapped 5 Mbps Internet access) to over half a million customers across South Africa mostly using license-exempt WiFi spectrum and some licensed wireless point-to-point spectrum. WISPs will also start using TV white space to cover areas where WiFi connectivity was challenging due to terrain or vegetation.
The Wireless Access Providers Association (WAPA) currently represents more than 220 organisations, including large and small players, as well as support industries such as equipment vendors and software providers. WAPA’s members predominantly operate in peri-urban and rural areas which often lack affordable or reliable access to broadband Internet. As a class, WISPs serve to drive down the cost to communicate and increase broadband penetration. A wireless access providers association model like WAPA may work well to help support small operators who need
https://www.gov.za/issues/national-development-plan-2030101
https://www.icasa.org.za/legislation-and-regulations/regulations-on-the-use-of-television-white-spaces-2018102
https://techcentral.co.za/tv-white-spaces-in-south-africa-is-now-ready-for-lift-off/105428/103
87
assistance with spectrum licensing, as an interface to the regulator for arbitration, and to represent the needs of smaller operators when policies and regulations are being formed.
South Africa also has an active community networks movement and a number of community networks around the country provide affordable access to local free content to users. The most well-known and established is the Zenzeleni community network, established in 2012. They offer quality, high-speed Internet comparable to the country’s most developed urban centres. The Internet service is truly affordable. The model aims to significantly cut costs of telecommunications, retain expenditure within communities as a form of social entrepreneurship, and support the development of a rural digital ecosystem to bridge the digital divide. Zenzeleni has also created strategic partnerships with international organizations such as the Internet Society and the Association for Progress Communication, amongst others, as well as Government to forge a path for getting community networks recognized as a mechanism for positive change and connectivity in South Africa, throughout Africa and internationally.
8.3.5.South Korea (East Asia) In 2013, South Korea launched the Ultra Broadband convergence Network (UBcN) project with targets of 1 Gbs speeds on fixed lines and 10 Mbs on wireless. The policies and programs under UBcN facilitated the rapid expansion and use of broadband. To date, about 50 million people in South Korea (or 97% of the population) use the Internet and the country has the world’s fastest 104
average Internet connection speed (169 Mbps for mobile connections and 171 Mbps for fixed connections). South Korea has also consistently ranked first in the UN ICT Development Index since 105
its launch. To support these targets, South Korea have developed advanced spectrum management and planning systems. They have a Central Radio Management Service (CRMS) that covers broadcasting and communication with regional branches to offer radio administration services and monitor radio spectrum compliance. The South Korean Ministry of Science and ICT (MSIT) 106
announced the establishment of a new fund specifically targeting technologies and projects that can provide data rates of 10 Gbps, with plans to reach 50% adoption rate of the super-fast speeds by 2022. 107
South Korea have consistently been trend setters in 5G development. In April 2019, The Republic of Korea launched the world’s first business-to-consumer (B2C) smartphone-based 5G commercial services. In two years, the number of 5G subscribers surpassed 13 million, accounting for 20 percent of total mobile subscriptions in the country. The government has also introduced various 108
support measures, including tax credits for 5G investments and is encouraging network sharing in suburban and rural areas, to facilitate the fast rollout of the 5G network with nationwide network deployment by 2022.
South Korea has chosen 3.5 GHz spectrum as the main network for 5G, and MSIT is planning to deploy 28 GHz primarily for hotspot and B2B services. This strategy balances the coverage
https://datareportal.com/reports/digital-2021-south-korea?rq=korea (slide 17)104
https://datareportal.com/reports/digital-2021-south-korea?rq=korea (slide 27)105
https://www.itu.int/en/ITU-D/Regional-Presence/AsiaPacific/Documents/Events/2018/SMWE-China/Presentations/106
case%20study%20in%20Korea.pdf https://www.researchandmarkets.com/reports/3763620/south-korea-fixed-broadband-market-statistics107
http://documents1.worldbank.org/curated/en/389891611234263109/pdf/World-Bank-Group-Korea-Office-FY20-Annual-108
Report.pdf88
and capacity trade-offs of these two bands: with 3.5 GHz providing good coverage and 28 GHz providing high capacity.
Public 5G spectrum auctions took place on 18 June 2018. The government made available a total of 2680 MHz, including 280 MHz (3420 ~ 3700 MHz) in the 3.5 GHz spectrum band and 2400 MHz (26.5 ~ 28.9 GHz) in the 28 GHz band. In the case of the 3.5 GHz spectrum, the operator must install 15% of LTE base stations in three years and increase the percentage up to 30% in five years. Under these conditions, mobile carriers must install 22,500 5G base stations by the end of 2021, for a total of 45,000 by the end of 2023. These targets ensure operators don’t park unused spectrum for long periods of time.
On 5 December 2019, the MSIT launched a mid- and long-term 5G spectrum strategy called the 5G+ Spectrum Plan. Some of the key ideas of the plan include:
• Use unlicensed spectrum for 5G using 5G NR-U (New Radio Unlicensed Band); • Secure the world's largest 5G spectrum; and • Accelerate innovation in spectrum management, regulations, and systems.
By reallocating unlicensed frequencies, the government aims to boost 5G+ strategic industries such as smart cities, autonomous cars and drones. Standalone 5G NR-U is basically a version of 5G that can be deployed into unlicensed spectrum.
South Korea has good policies to encourage competition. Mobile operators must provide mandatory wholesale services to MVNOs under the Telecommunications Business Act Enforcement Decree from 2020. In addition, the government is planning to reduce 5G wholesale prices. The government is making efforts to encourage MVNOs to provide 5G services. In addition, some frequencies have been set aside by MSIT for new operators entering the market; blocks have been reserved in the 700 MHz, 28 GHz, 2.5 GHz, and 2.3 GHz bands in case a fourth mobile carrier enters the market. In the future, MSIT plans to supply 6 GHz band as unlicensed frequency, aiming to commercialise this in 2022.
8.4.Notable achievements related to spectrum access in Africa
The pandemic presented a particular challenge to the release of spectrum to operators. While most spectrum auctions around the world were delayed in 2020, a number of African regulators, including Ghana, Kenya, South Africa, Zambia, and Zimbabwe acted quickly to release spectrum to operators to help them cope with increased demand for capacity on their networks. Where operators had existing spectrum, this helped to expand capacity on existing networks but typically did not result in new infrastructure being built, partly due to the uncertainty related to the permanence of the spectrum making infrastructure investment risky but also due to the physical challenges of construction logistics during the pandemic. Recent initiatives include: 109
• In 2020 Kenya and Nigeria announced draft regulations for TVWS use and South Africa granted access to TVWS spectrum as part of their COVID-19 response. 110
• WiFi-Enabled ‘Hello Hubs’ brought Internet to Underserved Communities in Uganda in 2020. 111
https://manypossibilities.net/2021/02/africa-telecoms-infrastructure-in-2020/109
https://manypossibilities.net/2021/02/africa-telecoms-infrastructure-in-2020/110
https://www.forbes.com/sites/chrisstrub/2020/01/15/wifi-enabled-hello-hubs-bring-Internet-to-underserved-communities-111
in-uganda/#67df5892306389
• TVWS regulation was finalized in Mozambique in early 2019. In a market of largely lower income population with tough economic viability, schools were connected in three main cities with TVWS and Raspberry Pi devices used to provide access for school pupils in school IT labs.
• In 2019, Kenya’s BRCK acquired Surf to become the largest public WiFi network in sub-Saharan Africa. 112
• In 2018, a number of African countries began licensing digital dividend spectrum (700 and 800 MHz) for mobile broadband: 800 MHz is now licensed in Uganda, Nigeria, Kenya and Ghana and 700 MHz is licensed in Kenya. 113
• In 2014, Rwanda built a Single Wholesale Network (SWN) - a government-initiated network that compels mobile operators and others to rely on wholesale services provided by the SWN as they serve and compete for retai l customers. The SWN was implemented by Korea Telecommunication Rwanda Networks (KTRN) for 4G only in the 800 and 1800 MHz bands. The target for the network was 4G coverage for 98% of the population after 5 years. By 2018, 95% of the population had been covered by 4G LTE from the KTRN wholesale network. 114
Community networks in Africa provide an example of how to increase ownership in telecommunication infrastructure, reduce cost of connectivity and make use of low-cost, license-exempt technology such as WiFi and new emerging techniques such as TVWS to provide access. These have been deployed since the early 2000s and are growing steadily. Below is a list of some active community networks in Africa (a full description can be found in “Community Connectivity: Building the Internet from Scratch” ) 115
• Uganda: Bosco • DRC: Mesh Bukavu, Mesh Boma, Pamoja Net • Ghana: Akwapim Community Wireless Network • Kenya: Tunapandanet • Namibia: Connecting Eehana • Nigeria: Fantsuam Foundation, Ibadan WUG • Somalia: Abaarso • South Africa: Zenzeleni, iNethi, SoWUG, Cape Town WUG, Johannesburg WUG, Durban.
WUG, Home of compassion • Tanzania: ICT4RD, Sengerema Wireless Community Network • Tunisia: Mesh SAYADA • Zambia: Macha Works • Zimbabwe: Murambinda Works
8.5.Spectrum auctions in Africa
In the 1990s and early 2000s, mobile spectrum in Africa was allocated via administered assignment or via a beauty contest. In administered assignment of spectrum, a regulator directly assigns a licensed operator spectrum, often with some conditions such as target population coverage
https://techcrunch.com/2019/02/15/brck-acquires-isps-everylayer-and-surf-to-boost-africas-public-wi-fi/112
https://opentelecomdata.org/spectrum-chart/113
https://www.newtimes.co.rw/news/four-years-later-95-rwanda-covered-4g-Internet114
https://Internet-governance.fgv.br/sites/Internet-governance.fgv.br/files/publicacoes/community_connectivity_-115
_building_the_internet_from_scratch_0.pdf90
in specific areas with poor connectivity. In a beauty contest, a set of criteria are created, such as spectrum efficiency and areas that need to be covered, with a fixed set of prices and existing or new operators apply and are evaluated against these criteria. Over the past decade, as demand for radio frequency spectrum has increased and demand for spectrum from mobile operators is outstripping supply, ‘Market-based’ mechanisms for spectrum management, such as spectrum auctioning are becoming more popular. Auctions tend to be more transparent and less vulnerable to lobbying than the beauty contest approach.
Spectrum auctions need to balance a wide range of objectives, some of which can be conflicting. Revenue generation, spectrum efficiency, and promoting competition are some of the objectives and in theory the operator who is prepared to pay the most for the spectrum should have the highest valuation for it. However, high reserve prices could deter participation by smaller players or even cause an auction to fail completely. Some typical measures to ensure wider competition include auctioning spectrum in small lots, spectrum set-asides for new entrants and spectrum caps to ensure that no operator is able to monopolise access to spectrum in a particular band or across bands.
Surprisingly, as of 2013 among African countries, only Nigeria had successfully conducted and concluded a spectrum auction. However, in the past six years, a number of African countries have been embracing spectrum auctions even though some have failed and ended in a negotiated settlement or ended in continued court battles. The digital dividend (releasing of the 700 MHz and 800 MHz bands as broadcasting transitioned to digital television) appeared to be the catalyst to a slew of spectrum auctions across the continent. A summary of spectrum auctions is provided below:
8.5.1.Kenya Kenya has not had a spectrum auction in the true sense of the word, but their story is still interesting and an example of innovation in spectrum assignment. Assignment of spectrum in the 800 MHz band in Kenya began in 2014 with a request from the Kenyan government to the largest operator, Safaricom, to build a national police communications network. Safaricom initially agreed to pay $56.2 million and build the requested network in exchange for access to 2x15 MHz of 800 MHz spectrum. After complaints from Airtel and Telkom Kenya, the regulator compelled Safaricom to relinquish 2x5 Mhz of spectrum so that each of the three incumbent mobile network operators would be assigned 2x10 MHz of 800 MHz spectrum each for a total of 60 Mhz of spectrum. The three operators then agreed to each pay 25 million USD for the spectrum licenses. The cost of the national police network has now been disaggregated from the spectrum sale. The licensing process for the 700 MHz band was completed in 2017. This was not strictly an auction but rather a process that allowed two consortiums of five companies each to apply for a license. An operator was required to pay an up-front fee of $25M for a spectrum license for a 10-year period. To promote more competition, the licenses were closed to the three top operators who already had spectrum in the 800 MHz band. 116
8.5.2.Nigeria In late 2013 the Nigerian communication regulator (NCC) announced a spectrum auction for 30 MHz of 2.3 GHz spectrum. The auction attracted only two bidders and was won by a new entrant consortium called Bitflux. Bitflux paid just over the reserve price of $23 million for the spectrum license. Later in 2014, the regulator launched an auction in the 2.6 GHz band. This was withdrawn and re-
https://manypossibilities.net/2017/04/the-failure-of-spectrum-auctions-in-africa/116
91
attempted in 2015 but again withdrawn. Finally in March of 2016, the regulator announced an auction of spectrum in the 2.6 GHz band. In total, 14 lots of 2x5 MHz spectrum (140 MHz of spectrum in total) were put up for bid. By the end of the bidding process only one operator, MTN Nigeria, was willing to meet the reserve prices of $16 million per lot. MTN bid for 6 lots, paying a total of $96 million for 60 MHz of spectrum. The remaining spectrum remains unsold. The spectrum license period for this auction was ten years.
Nigeria has recently announced an auction of two lots of 100 MHz spectrum in the 3.5 GHz band from 3500 – 3600 MHz and 3700 – 3800 MHz. Each 100 MHz lot has a reserve price of 117
$197.4 million. The auction will take place 13 December, 2021. This auction places a reserve price of $1.974 million per MHz on the spectrum. The license will be valid for a period of ten years. With the 3700 – 3800 MHz band yet to be cleared by WRC-23 and the band being 23% more costly than the previous auction in the 2.6 GHz band, at $1.6 million per MHz, and the previous auction only attracting a single bidder, this appears to be a high risk auction.
8.5.3.Mozambique In April of 2013, the Mozambique regulator announced the auction of five lots of 2x5 MHz (a total of 50 MHz) of 800 MHz spectrum with a reserve price of 30 million USD per lot. The auction did not attract any bids and was widely perceived to have an excessively high reserve price. The auction was quietly withdrawn. Another auction was held in 2018 for the 800 MHz, 1800 MHz and 2600 MHz bands, but only the 800 MHz band attracted bids, likely due to excessively high reserve prices. Vodacom, Movitel, and mCell all secured portions of the 800 MHz band bringing in a total of $83.4 million from the spectrum sale.
8.5.4.South Africa Since 2010, the South African regulator has attempted to convene a spectrum auction many times. The first two were in the 2.6 GHz and 3.5 GHz bands, the third attempt in 2016 was in the 800 MHz, 2.6 GHz, and 3.5 GHz bands. Each time the auction has been withdrawn with another one being cancelled in February of 2017. This is mostly attributed to a lack of coherent vision from the Ministry of Communications and Digital Technologies, which has seen eight different ministers since 2009, which has, in turn, led to disputes between the regulator and the ministry. The third attempt at auctioning this spectrum was cancelled due to the Ministry’s new policy at the time of removing all exclusive-use spectrum in favour of a national wholesale network.
In 2020, a new Invitation to Apply for a spectrum auction was issued for 700 MHz, 800 MHz, 2.6 GHz and 3.5 GHz bands (a total of 406 MHz of spectrum). The ITA included spectrum caps of a maximum of 2×21 MHz in sub 1 GHz holdings (including existing spectrum holdings) and overall maximum of 184 MHz (including existing spectrum holdings). The prices are high relative to the rest of Africa. For example, a 2x10 MHz 800 MHz block will cost $78 million. Six operators responded to the ITA (Vodacom, MTN, Telkom, Liquid Telecoms, Rain Networks, and Cell C). 80 MHz of spectrum in these four high-demand spectrum bands was reserved for the Wireless Open Access Network (2x10 MHz of 700 MHz, 1x30 MHz of 2.6 GHz and 1x30 MHz of 3.5 GHz). In March 2021, the High Court
See 3.5 GHz for IMT Services (available at https://www.ncc.gov.ng/technical-regulation/spectrum/spectrum-auctions/117
upcoming-auctions/1064-3-5ghz)92
issued a judgement interdicting regulator from continuing with the ITA processes for high demand spectrum and the licensing of the WOAN respectively, due to a court application filed by Telkom.
Since then, the parties reached an out of court settlement which resulted in an Information Memorandum for the purpose of consulting on the proposed ITA. Following consultation with operators, a 2nd Information Memorandum was published on 16 November 2021. Following 118
consideration of written representations on this Information Memorandum, a final ITA is expected to be published on 10 December 2021. It is expected that the auction process will begin in March 2022 and the licensing of the WOAN will be in May 2022. The license is issued with a condition that it needs to be fully utilized within five years. Should the spectrum not be fully utilized, the regulation authority will initiate a process to either (i) share unused spectrum operators in areas where it is needed, or (ii) force an operator to surrender a portion of the spectrum or cancel the issued radio frequency spectrum license.
8.5.5.Ghana In 2015, the Ghanaian regulator announced an auction of 800 MHz spectrum, offering 2 lots of 2x10 MHz spectrum ( a total of 40 MHz) with a reserve price of 67.5 million USD per lot. While local companies were encouraged to participate, none of the three Ghanaian companies that registered for the auction were able to meet the reserve price. The only company to meet the reserve price for a single lot was Scancom (MTN) resulting in an effective monopoly for MTN in the 800 MHz band. The regulator has announced plans to attempt to auction the remaining spectrum with the intention of using auction proceeds to fund the roll-out of digital terrestrial broadcasting infrastructure. The license is valid for a period of 15 years.
8.5.6.Senegal In 2015, the Senegalese regulator announced an invitation to apply for LTE spectrum in the 700 MHz, 800 MHz, and 1800 MHz bands: specifically, 3 blocks of 2x30 MHz in 800 MHz, 4 blocks of 2x20 MHz in 700 MHz and 3 blocks of 2x30 MHz spectrum in 1800 MHz. The reserve price for a 20-year license was set at approximately $50 million. The auction was effectively boycotted due to the high reserve price and resulted in a stand-off between the regulator and operators. This was resolved in June of 2015 when the regulator restarted the licensing process having negotiated a deal with the former fixed-line incumbent operator, Sonatel, to pay $53 million for 2x10 MHz of spectrum in the 800 MHz band and 2x10 MHz in the 1800 MHz band. The 20-year license commits Sonatel to provide 70% population coverage within five years and 90% coverage within ten years.
8.5.7.Tanzania In 2018, market leader Vodacom Tanzania and a newcomer in Tanzania’s fast-growing communications sector, Azam Telecom (T) Limited, were picked as winners of the spectrum auction in the 700 MHz band. Vodacom Tanzania Plc acquired 2 x 10 MHz for a total price of $10.005 million and Azam Telecom (T) Ltd acquired 2 x 10 MHz for a total price of $10 million. Azam
See ICASA publishes updated Information Memorandum for another round of consultation (available at: https://118
www.icasa.org.za/news/2021/icasa-publishes-the-updated-information-memorandum-for-another-round-of-consultation)93
struggled to deploy their network and returned the spectrum. The spectrum license is valid for a period of 20 years. 119
8.5.8.Angola The Angolan Institute of Communications (INACOM) held its first open spectrum auction in August 2017 for the 800 MHz spectrum. Until this point, mobile spectrum licenses had been allocated behind closed doors to the two existing telcos, Unitel and Movicel. The spectrum was awarded to Angola Telecom, which launched 4G LTE services on 800MHz later in 2018.
8.5.9.Botswana Botswana has not had spectrum auctions, and this is arguably one of the countries where spectrum demand is too low to warrant an auction. In January 2021, population size was 2.37 million. A recent ITA has been released by the Botswana Communications Regulatory Authority (BOCRA) in July 2021 for IMT licenses in the 450 MHz, 800 MHz, 2.1 GHz, 2.6 GHz, and 3.5 GHz spectrum bands. This is effectively a beauty contest and will be evaluated on spectrum, functional and economic efficiency and comes with coverage and capacity obligations of 30 Mbps in the 800 MHz and 3.5 GHz MHz bands and 20 Mbps in the 2.1 GHz and 2.6 GHz bands. The license period for these IMT bands is 15 years. The price for these bands is very low compared to other African countries. For example, a national use 2x10 MHz 800 MHz package is approximately $77k and a national use 50 MHz TDD 3.5 GHz package is approximately $51k. To put this in perspective, a 2x10 MHz 800 MHz block in the current South Africa ITA will cost $78 million.
8.5.10.Lessons learned and recommendations There are many lessons to be learned from the failed spectrum auctions in Africa and one could argue that only Mozambique has had some level of success auctioning the 800 MHz spectrum. Highlighting a country that has had a successful auction also provides some valuable insights. One such country is Costa Rica. Costa Rica Costa Rican mobile operators have historically benefited from timely and fair 120
access to sufficient spectrum at affordable prices compared to other developing countries in the region. In 2017, the national regulator Superintendencia de Telecomunicaciones (SUTEL) auctioned 70 MHz of spectrum in the 1800 and 2100 MHz bands (ICE, the State-owned operator, has 550 MHz of total spectrum due to historic reasons, so was excluded from the auction). Following unsold spectrum in 2011, the regulator decided to re-auction the unsold concession in 2017 at a much lower reserve price ($70 million in 2011 versus $43 million in 2017). Movistar and Claro were able to secure the spectrum in 2017 (40 and 30 MHz respectively) for $43 million, which, in $/MHz/population terms, was over 55% cheaper than the average for developing countries in Latin America.
While spectrum auctions are theoretically the most efficient way to assign spectrum, their success or failure is highly dependent on the detail of their design and the context of the relevant market. The experiences of African countries suggests that reserve prices are often set too
See GSMA advocacy for Tanzania spectrum auction (available at: https://www.gsma.com/subsaharanafrica/gsma-119
advocacy-for-tanzania-spectrum-auction) See Spectrum pricing in developing countries Evidence to support better and more affordable mobile services (available at: 120
https://data.gsmaintelligence.com/api-web/v2/research-file-download-old?file=5a8f746015d3c1f72e5c8257e4a9829a&download)
94
high with the objective of maximising revenue rather than ensuring participation and competition. By contrast, non-competitive assignments may be more effective at ensuring all available spectrum is assigned and shared among operators. However, beauty contests lack transparency and where spectrum has been assigned by non-competitive means, it is also possible that an important national resource has been undervalued. The GSMA released a report with key elements for successful 121
spectrum auctions, these are the key positions:
• The top priority for spectrum auctions should be to support affordable, high-quality mobile services; • Auctions are a tried and tested award mechanism but can and do fail when poorly designed; • Auctions should not be the only award process as they are not always suitable; • Auctions designed to maximise state revenues risk serious harm to consumers; • Assign a sufficiently large amount of spectrum and publish roadmaps to support high-quality mobile
services; • Spectrum caps and set-asides distort the level playing field; • Licence obligations and conditions should be designed to minimise the cost of covering non-
profitable areas, and avoid distorting the award of spectrum; • The chosen auction design should not create additional risk and uncertainty for bidders; • Poorly chosen lot sizes or inflexible packages of spectrum lots risk inefficient outcomes; • Policymakers should work in partnership with stakeholders to enable timely, fair and effective awards.
In addition to these guidelines, the approach used for assigning spectrum should factor in Uganda’s “Framework for spectrum assignment to telecommunications services in Uganda” with the following 122
considerations:
• The allocation, allotment and/or industry purpose/use of the respective spectrum. • Does the use of the respective spectrum necessitate exclusive use, or can it be shared? • Status of the use of the respective band. • The amount of spectrum available versus the demand. • The market structure.
These guidelines provide valuable insights for allocating spectrum. Shared spectrum access is explored in the following section and this together with the intended use, intended market structure and the potential spectrum demand will dictate the approach required for licensing spectrum. If a spectrum auction approach is followed, there are situations where spectrum caps could be used judiciously to ensure more competition in the market. In addition, license obligations are critical to ensure universal access but need to be balanced carefully with the profitability of the spectrum for the bidder.
8.6.Assessing impact of alternative broadband access models
Most of the world’s population is accessing the Internet on a mobile or fixed wireless connection that makes use of radio spectrum. Smarter spectrum policy and regulation can radically change the cost economics of deploying wireless networks —expanding access to underserved and previously unserved communities, increasing competition, and reducing costs for
See https://www.gsma.com/spectrum/resources/spectrum-auctions/121
Framework for spectrum assignment to Telecommunications Services in Uganda, 2019 (available at: https://122
www.ucc.co.ug/wp-content/uploads/2017/09/Framework-for-spectru-assignment-in-Uganda-20191.pdf95
consumers. To support deployments, regulators need to make new spectrum available on an exclusive-use basis for new 4G and 5G mobile networks and satellite networks or on a license-exempt basis for WISPs, community networks or governments deploying next generation WiFi and last-mile fixed wireless access. Spectrum needs to be made available across a range of low-band, mid-band, and high-band frequencies to support fixed and mobile terrestrial- and satellite-based communications. This diversity is key to addressing connectivity gaps and improving affordability.
While it is clear that more licensed and unlicensed spectrum is needed to support next-generation wireless applications, it is becoming increasingly difficult for regulators to move incumbent users from their existing assignments and clear that spectrum for new uses and users. Fortunately, the emergence of various types of spectrum-sharing technologies enables regulators to allow wireless network operators access to new spectrum bands without displacing incumbent government users and commercial licensees. These spectrum-sharing regimes are made possible by the emergence of spectrum-sensing capabilities and cloud-based spectrum-sharing databases that can dynamically assign unused frequencies while protecting incumbent users from harmful interference. The best examples of spectrum-sharing technology are TVWS in the UHF band, 3.5–3.65 GHz Citizens Broadband Radio Service (CBRS) in the US, and 6 GHz WiFi.
In addition, regulators should consider licensing for space-based satellite communications, as well as experimental High Altitude Platform Station (HAPS). These technologies promise higher throughput and lower latency connectivity than is available from traditional geostationary satellite constellations. They are suitable in remote locations where terrestrial connectivity cannot be cost effectively deployed, providing direct connectivity to consumers and IoT devices as well as backhaul connectivity to last-mile mobile and fixed wireless networks. There are now numerous non-geostationary orbit satellite constellations, including OneWeb, SpaceX, Kuiper, Telesat, and others. HAPS providers, like HAPSMobile, have conducted their first test flights. These providers’ connectivity solutions are in varying stages of development, but each of the companies is committed to deploying global offerings, with a focus on helping to close the global broadband gap.
Spectrum access can now be placed into four categories that move from a rigid to a more flexible regulatory approach as shown in Figure 17. The categories are:
• A static licensing regime: Spectrum is licensed to national or regional users such as cellular operators or broadcasters on an exclusive basis.
• License Shared Access: A primary license holder, such as a satellite operator, shares spectrum with a secondary licensed holder, such as an operator building point-to-point links.
• License Exempt Shared Access: A primary license holder, such as a broadcaster, shares unused spectrum with a secondary user, such as a wireless access provider, on a license exempt basis. This may be a model used for TV White Spaces.
• A Spectrum Commons: where all users of the spectrum obey rules such as maximum power levels and “listen before talk” to avoid interfering with each other. Bluetooth and Wi-Fi are common examples.
96
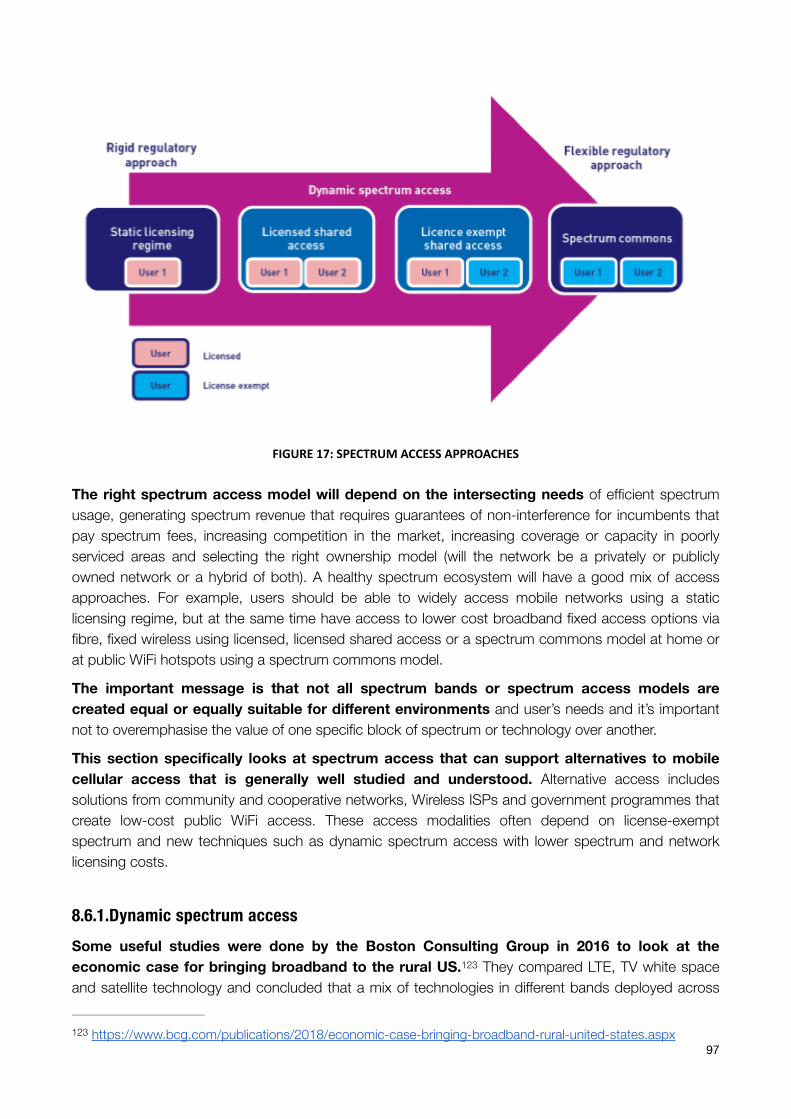
FIGURE17:SPECTRUMACCESSAPPROACHES
The right spectrum access model will depend on the intersecting needs of efficient spectrum usage, generating spectrum revenue that requires guarantees of non-interference for incumbents that pay spectrum fees, increasing competition in the market, increasing coverage or capacity in poorly serviced areas and selecting the right ownership model (will the network be a privately or publicly owned network or a hybrid of both). A healthy spectrum ecosystem will have a good mix of access approaches. For example, users should be able to widely access mobile networks using a static licensing regime, but at the same time have access to lower cost broadband fixed access options via fibre, fixed wireless using licensed, licensed shared access or a spectrum commons model at home or at public WiFi hotspots using a spectrum commons model.
The important message is that not all spectrum bands or spectrum access models are created equal or equally suitable for different environments and user’s needs and it’s important not to overemphasise the value of one specific block of spectrum or technology over another.
This section specifically looks at spectrum access that can support alternatives to mobile cellular access that is generally well studied and understood. Alternative access includes solutions from community and cooperative networks, Wireless ISPs and government programmes that create low-cost public WiFi access. These access modalities often depend on license-exempt spectrum and new techniques such as dynamic spectrum access with lower spectrum and network licensing costs.
8.6.1.Dynamic spectrum access Some useful studies were done by the Boston Consulting Group in 2016 to look at the economic case for bringing broadband to the rural US. They compared LTE, TV white space 123
and satellite technology and concluded that a mix of technologies in different bands deployed across
https://www.bcg.com/publications/2018/economic-case-bringing-broadband-rural-united-states.aspx123
97
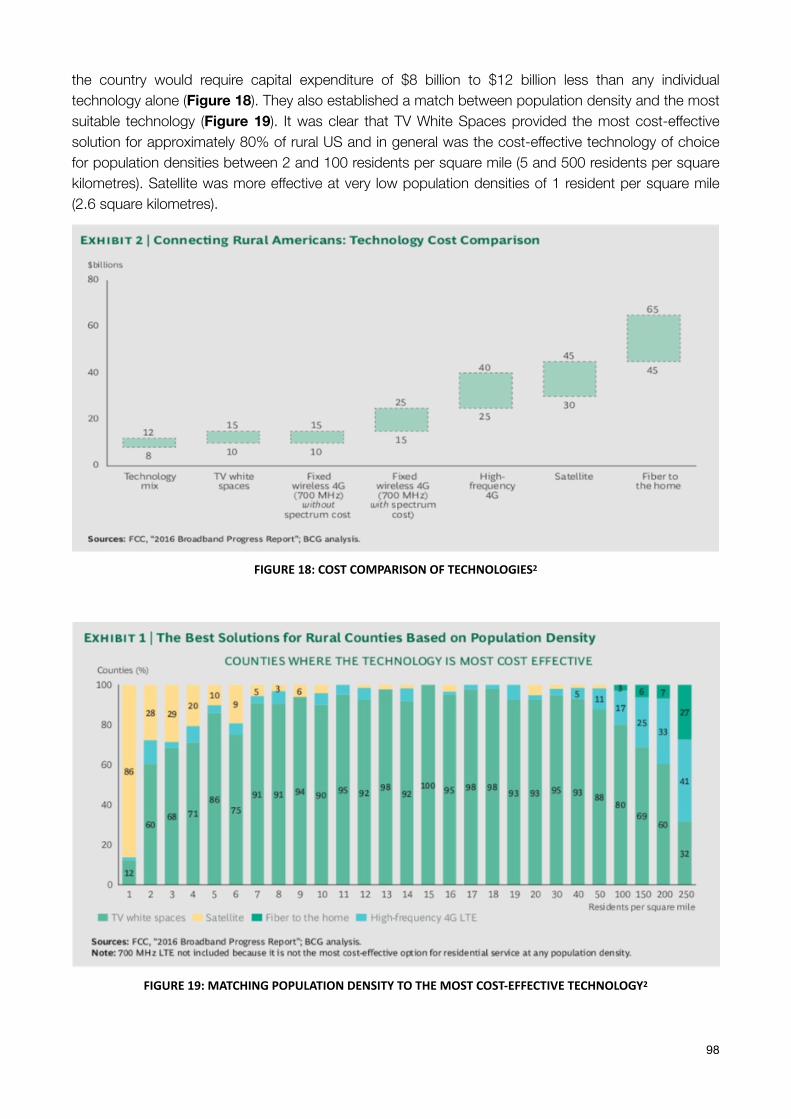
the country would require capital expenditure of $8 billion to $12 billion less than any individual technology alone (Figure 18). They also established a match between population density and the most suitable technology (Figure 19). It was clear that TV White Spaces provided the most cost-effective solution for approximately 80% of rural US and in general was the cost-effective technology of choice for population densities between 2 and 100 residents per square mile (5 and 500 residents per square kilometres). Satellite was more effective at very low population densities of 1 resident per square mile (2.6 square kilometres).
FIGURE18:COSTCOMPARISONOFTECHNOLOGIES2
FIGURE19:MATCHINGPOPULATIONDENSITYTOTHEMOSTCOST-EFFECTIVETECHNOLOGY2
98
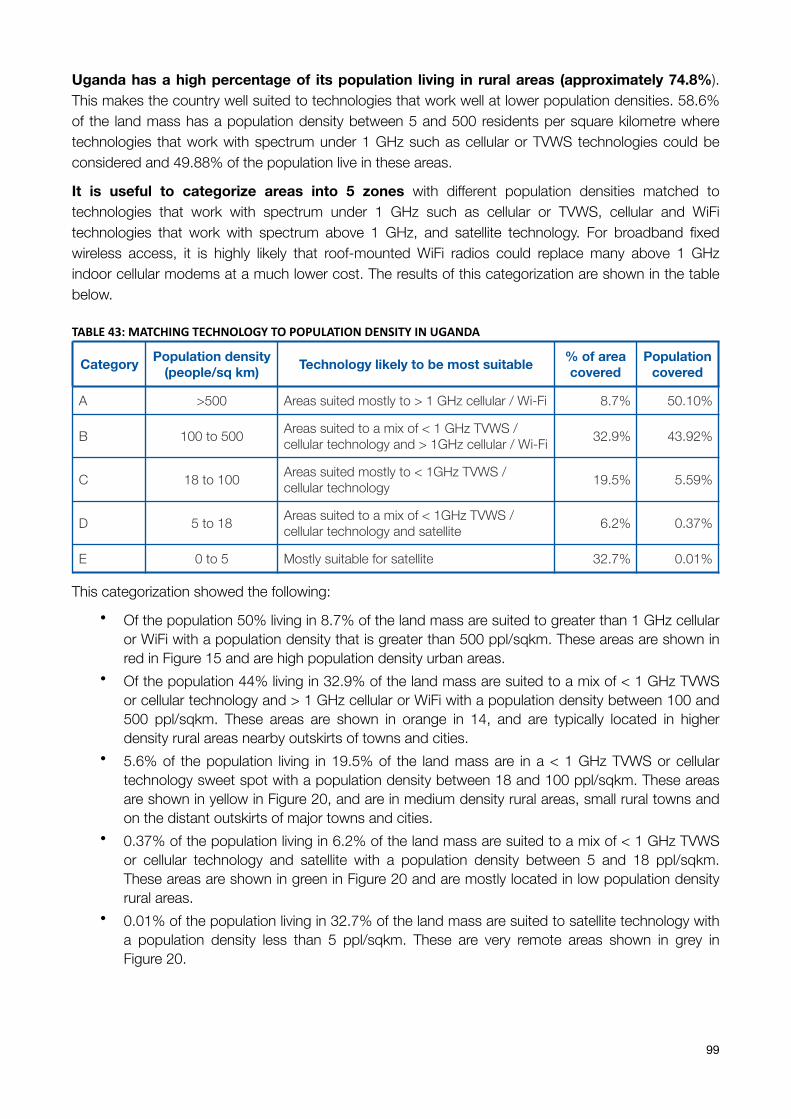
Uganda has a high percentage of its population living in rural areas (approximately 74.8%). This makes the country well suited to technologies that work well at lower population densities. 58.6% of the land mass has a population density between 5 and 500 residents per square kilometre where technologies that work with spectrum under 1 GHz such as cellular or TVWS technologies could be considered and 49.88% of the population live in these areas.
It is useful to categorize areas into 5 zones with different population densities matched to technologies that work with spectrum under 1 GHz such as cellular or TVWS, cellular and WiFi technologies that work with spectrum above 1 GHz, and satellite technology. For broadband fixed wireless access, it is highly likely that roof-mounted WiFi radios could replace many above 1 GHz indoor cellular modems at a much lower cost. The results of this categorization are shown in the table below.
TABLE43:MATCHINGTECHNOLOGYTOPOPULATIONDENSITYINUGANDA
This categorization showed the following: • Of the population 50% living in 8.7% of the land mass are suited to greater than 1 GHz cellular
or WiFi with a population density that is greater than 500 ppl/sqkm. These areas are shown in red in Figure 15 and are high population density urban areas.
• Of the population 44% living in 32.9% of the land mass are suited to a mix of < 1 GHz TVWS or cellular technology and > 1 GHz cellular or WiFi with a population density between 100 and 500 ppl/sqkm. These areas are shown in orange in 14, and are typically located in higher density rural areas nearby outskirts of towns and cities.
• 5.6% of the population living in 19.5% of the land mass are in a < 1 GHz TVWS or cellular technology sweet spot with a population density between 18 and 100 ppl/sqkm. These areas are shown in yellow in Figure 20, and are in medium density rural areas, small rural towns and on the distant outskirts of major towns and cities.
• 0.37% of the population living in 6.2% of the land mass are suited to a mix of < 1 GHz TVWS or cellular technology and satellite with a population density between 5 and 18 ppl/sqkm. These areas are shown in green in Figure 20 and are mostly located in low population density rural areas.
• 0.01% of the population living in 32.7% of the land mass are suited to satellite technology with a population density less than 5 ppl/sqkm. These are very remote areas shown in grey in Figure 20.
Category Population density (people/sq km) Technology likely to be most suitable % of area
coveredPopulation
covered
A >500 Areas suited mostly to > 1 GHz cellular / Wi-Fi 8.7% 50.10%
B 100 to 500 Areas suited to a mix of < 1 GHz TVWS / cellular technology and > 1GHz cellular / Wi-Fi 32.9% 43.92%
C 18 to 100 Areas suited mostly to < 1GHz TVWS / cellular technology 19.5% 5.59%
D 5 to 18 Areas suited to a mix of < 1GHz TVWS / cellular technology and satellite 6.2% 0.37%
E 0 to 5 Mostly suitable for satellite 32.7% 0.01%
99
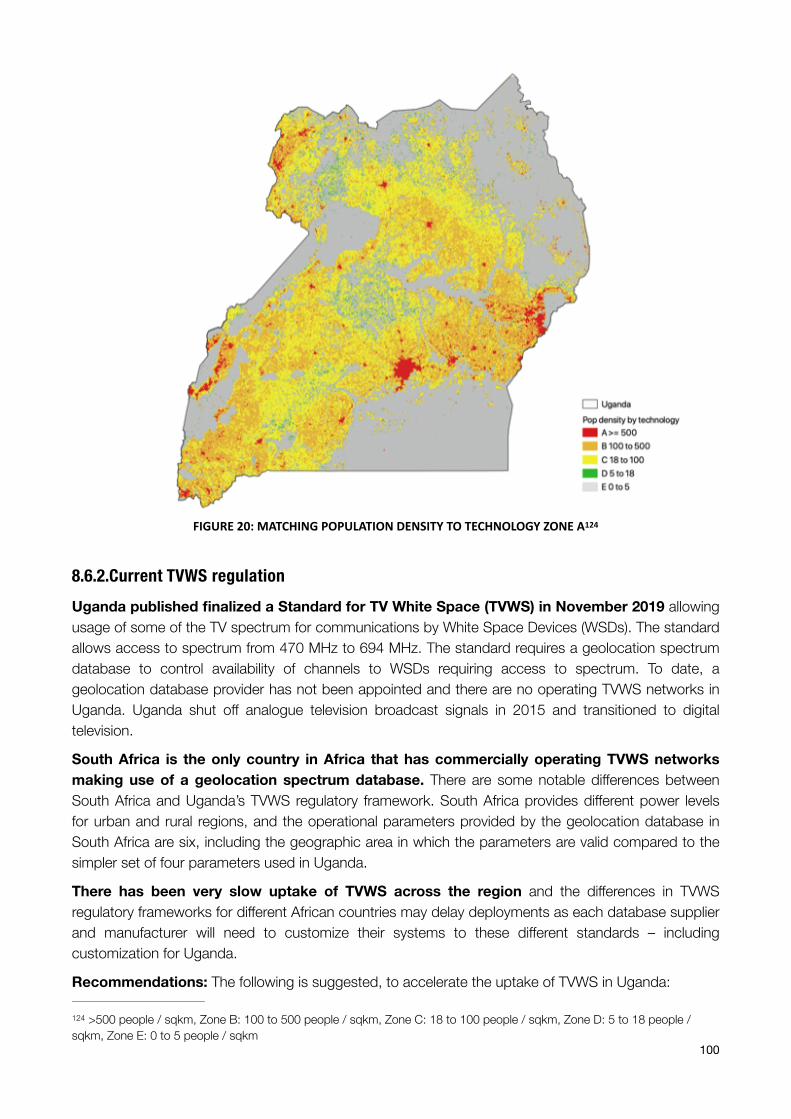
FIGURE20:MATCHINGPOPULATIONDENSITYTOTECHNOLOGYZONEA 124
8.6.2.Current TVWS regulation Uganda published finalized a Standard for TV White Space (TVWS) in November 2019 allowing usage of some of the TV spectrum for communications by White Space Devices (WSDs). The standard allows access to spectrum from 470 MHz to 694 MHz. The standard requires a geolocation spectrum database to control availability of channels to WSDs requiring access to spectrum. To date, a geolocation database provider has not been appointed and there are no operating TVWS networks in Uganda. Uganda shut off analogue television broadcast signals in 2015 and transitioned to digital television.
South Africa is the only country in Africa that has commercially operating TVWS networks making use of a geolocation spectrum database. There are some notable differences between South Africa and Uganda’s TVWS regulatory framework. South Africa provides different power levels for urban and rural regions, and the operational parameters provided by the geolocation database in South Africa are six, including the geographic area in which the parameters are valid compared to the simpler set of four parameters used in Uganda.
There has been very slow uptake of TVWS across the region and the differences in TVWS regulatory frameworks for different African countries may delay deployments as each database supplier and manufacturer will need to customize their systems to these different standards – including customization for Uganda.
Recommendations: The following is suggested, to accelerate the uptake of TVWS in Uganda:
>500 people / sqkm, Zone B: 100 to 500 people / sqkm, Zone C: 18 to 100 people / sqkm, Zone D: 5 to 18 people / 124
sqkm, Zone E: 0 to 5 people / sqkm100
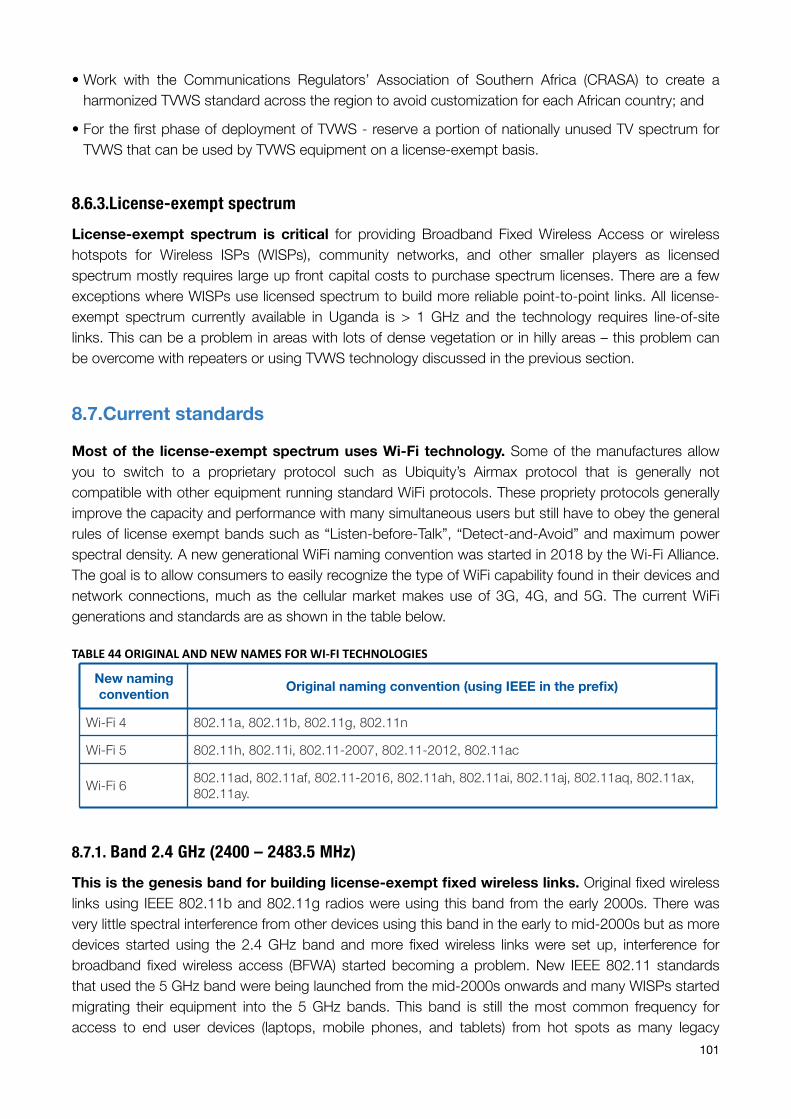
• Work with the Communications Regulators’ Association of Southern Africa (CRASA) to create a harmonized TVWS standard across the region to avoid customization for each African country; and
• For the first phase of deployment of TVWS - reserve a portion of nationally unused TV spectrum for TVWS that can be used by TVWS equipment on a license-exempt basis.
8.6.3.License-exempt spectrum License-exempt spectrum is critical for providing Broadband Fixed Wireless Access or wireless hotspots for Wireless ISPs (WISPs), community networks, and other smaller players as licensed spectrum mostly requires large up front capital costs to purchase spectrum licenses. There are a few exceptions where WISPs use licensed spectrum to build more reliable point-to-point links. All license-exempt spectrum currently available in Uganda is > 1 GHz and the technology requires line-of-site links. This can be a problem in areas with lots of dense vegetation or in hilly areas – this problem can be overcome with repeaters or using TVWS technology discussed in the previous section.
8.7.Current standards
Most of the license-exempt spectrum uses Wi-Fi technology. Some of the manufactures allow you to switch to a proprietary protocol such as Ubiquity’s Airmax protocol that is generally not compatible with other equipment running standard WiFi protocols. These propriety protocols generally improve the capacity and performance with many simultaneous users but still have to obey the general rules of license exempt bands such as “Listen-before-Talk”, “Detect-and-Avoid” and maximum power spectral density. A new generational WiFi naming convention was started in 2018 by the Wi-Fi Alliance. The goal is to allow consumers to easily recognize the type of WiFi capability found in their devices and network connections, much as the cellular market makes use of 3G, 4G, and 5G. The current WiFi generations and standards are as shown in the table below.
TABLE44ORIGINALANDNEWNAMESFORWI-FITECHNOLOGIES
8.7.1. Band 2.4 GHz (2400 – 2483.5 MHz) This is the genesis band for building license-exempt fixed wireless links. Original fixed wireless links using IEEE 802.11b and 802.11g radios were using this band from the early 2000s. There was very little spectral interference from other devices using this band in the early to mid-2000s but as more devices started using the 2.4 GHz band and more fixed wireless links were set up, interference for broadband fixed wireless access (BFWA) started becoming a problem. New IEEE 802.11 standards that used the 5 GHz band were being launched from the mid-2000s onwards and many WISPs started migrating their equipment into the 5 GHz bands. This band is still the most common frequency for access to end user devices (laptops, mobile phones, and tablets) from hot spots as many legacy
New naming convention Original naming convention (using IEEE in the prefix)
Wi-Fi 4 802.11a, 802.11b, 802.11g, 802.11n
Wi-Fi 5 802.11h, 802.11i, 802.11-2007, 802.11-2012, 802.11ac
Wi-Fi 6 802.11ad, 802.11af, 802.11-2016, 802.11ah, 802.11ai, 802.11aj, 802.11aq, 802.11ax, 802.11ay.
101
devices are still in circulation and some new devices still only support single band 2.4 GHz WiFi access. For BFWA there are still a few links using 2.4 GHz in small towns or rural areas where there is little interference, In urban areas, 2.4 GHz is mostly unusable for outdoor links due to interference.
8.7.2. Band 5 GHz (5150 – 5855 MHz) Although 802.11a equipment was available in the 5 GHz band from the early-2000s, it was only with the launch of 802.11n, that 5 GHz band started being for BFWA applications from the late 2000s. The 5 GHz band provides 380 MHz of outdoor spectrum and 200 MHz of indoor spectrum compared to only 83 MHz of spectrum in the 2.4 GHz band. The band also allows much wider channels widths (up to 160 MHz) and hence much higher capacity links compared to the 2.4 GHz band with maximum allowed channel widths of 20 MHz. In the 5.250–5.350 GHz band, devices must employ dynamic frequency selection (DFS) and transmit power control (TPC) capabilities. This is to avoid interference with weather-radar and military applications and may result in this portion of the band not always being available. This 5 GHz band is now the de-facto band of choice for BFWA as well as other outdoor application like IP cameras. For point-to-point links, very high-gain antennas up to 30 dBi with narrow 5-degree beams and line-of-sight ranges up to 50 km are possible in this band.
8.7.3. Band 6 GHz (5925 – 7125 MHz) The FCC in the US opened up the entire 6 GHz band from 5925 to 7125 MHz for WiFi and other license-exempt use in April, 2020. The European Commission approved regulations that 125
will allow deployment of WiFi in the lower 6 GHz band from 5925 to 6425 MHz in June 2021. The 126
African Telecommunications Union’s emerging technologies task group suggested in July 2021 that the lower 6 GHz band from 5925 to 6425 MHz be made available for unlicensed use on a non-exclusive, non-interference and non-protected basis. In region 1, the upper 6 GHz band from 6425 to 7025 127
MHz is being considered for IMT at WRC-23. However, there are notable exceptions to the upper block of the 6 GHz band being used for IMT in region 1. In March 2021, Saudi Arabia, released the full lower and upper block of 6 GHz for WiFi. 128
Unlicensed devices will share this band with licensed services that mostly use this band for terrestrial point-to-point microwave links. The devices will make use of an Automated Frequency Coordination (AFS) system to avoid interference with primary users but this will only be required for outdoor devices. AFS is in its essence a database lookup scheme that will allow 6 GHz WiFi devices to use AFC-protected bands in the event that a primary user is not found in the particular area. Fortunately, 6 GHz primary users are fixed and change rarely. This more than doubles the amount of spectrum available for WiFi. and the IEEE has decided that the band will exclusively be used by WiFi 6 generation protocols such as IEEE 802.11ax and IEEE 802.11ad. WiFi performance will increase by an order of magnitude in the 6 GHz band due to availability of much wider channel widths, improved interference management and legacy WiFi not being allowed in the new 6 GHz band. IEEE 802.11ax-based devices are already available commercially.
https://www.fcc.gov/document/fcc-opens-6-ghz-band-wi-fi-and-other-unlicensed-uses-0125
https://www.eetimes.eu/eu-boosts-6ghz-spectrum-for-wi-fi-use/126
https://www.icasa.org.za/uploads/files/GH_Communnication-ATU-R-Recom.pdf127
https://wifinowglobal.com/newsletter/saudi-arabia-releases-full-6-ghz-band-to-wi-fi-and-takes-global-lead-in-mid-band-128
unlicensed-spectrum/102
Current use of the band is for fixed point to point links (5925-7110 MHz) and fixed satellite links Earth to space (5925-7075 MHz) and Space to Earth (6700-7075 MHz). The band will provide a massive increase in capacity for BFWA due to an additional 500 MHz to 1.2 GHz of spectrum. The AFS database can be used to protect primary satellite users and PTP licensed users and license-exempt users could access any remaining spectrum in a specific area.
8.7.4. Band 17 GHz (17.1 – 17.3 GHz) This spectrum is often used for Wireless Access Systems (WAS) and Radio Local Access Networks (RLAN). The maximum power allowed is 100 mW (20 dBm) EIRP. The band is shared with spectrum used for satellite communication for earth exploration and space research. The band is not mentioned as having any specific allocation in Uganda but could made available for license-exempt point to point links for BFWA. There is some equipment available in this band such as SIAE ALFO plus 17 GHz Link, 100 Mbps (upgradeable to 500 Mbps). 129
8.7.5. Band 24 GHz (24.0 – 24.25 GHz) This is classified as an ISM (industrial, scientific, medical) license-exempt band. The band is shared with spectrum used for amateur satellite communication and amateur radio and the maximum allowed power is 100 mW EIRP. The band is not mentioned as having any specific allocation in Uganda but could be used for license-exempt point to point links for BFWA. There is equipment available that can create high-capacity point-to-point links, such as Ubiquiti AirFiber 24 AF-24/AF-24HD (1.5 Gbps to 2 Gbps). 130
8.7.6. V-Band 60 GHz (57 – 66 GHz) 60 GHz WiFi also known as WiGig refers to a collective set of wireless network protocols in the 60 GHz band. The band covers the frequencies from 57 to 71 GHz. This includes the current IEEE 802.11ad standard and upcoming IEEE 802.11ay standard. The standard is typically designed for indoor wireless LAN cable replacement applications to deliver multi-Gigabit speeds up to 7 Gbps (802.11ad). Indoor devices will typically be tri-band and operate in the 2.4 GHz, 5 GHz and 60 GHz bands. The IEEE 802.11ay will allow transmission rates of 20-40 Gbps with ranges of up to 300-500 meters. Region 1 allow frequencies from 57.24 GHz to 65.88 GHz. The 802.11ad standard can be used for outdoor point-to-point links up to 2 km, but this band can be affected by rain. There is some high-capacity equipment available that can offer up to 1 Gbps links such as Siklu EtherHaul 600TL 131
and IgniteNet. The band is not mentioned as having any specific allocation in Uganda but could be 132
very beneficial for short-range license-exempt high-capacity links.
https://www.miro.co.za/product/siae-17ghz-100mb-fd-link-2-x-terminal-equipment-including-poe-connector-grounding-129
kit-no-antenna/ https://www.miro.co.za/product/ubiquiti-airfiber-24ghz-1-4gbps-gps-sync-point-to-point-radio-poe-incl/130
https://www.miro.co.za/product-category/pc_ma-carrier-wireless/pc_mtg5na-60-ghz-v-band/pc_ndyzna-siklu-v-band/131
https://www.miro.co.za/product/ignitenet-metrolinq-60ghz-radio-1gbps/132
103
8.8.Economic arguments
Building an economic argument for license-exempt spectrum for the future of the Internet has been well studied by Thanki . Although this was done for WiFi, it is equally true for new license-exempt 133
shared access technologies like CBRS, TVWS, and 6 GHz WiFi. In 2012, Thanki estimated the global economic value of WiFi to be between $52 and $99 billion per annum based on the yearly benefit gained from using WiFi. With the release of 6 GHz WiFi in 2020, this global economic value will increase significantly. Thanki also pointed out at the time in 2012 that 69% of the total Internet traffic was being carried on WiFi on smartphones and tablets and in the absence of WiFi, 150,000 to 450,000 new cellular base stations would need to be built to cope with smartphone traffic. This saved mobile operators an investment of between $30 and $93 billion per year. In South Africa, the amount of traffic offloaded to WiFi was 49% in 2020. Worldwide, the amount of Internet traffic carried by Wi-Fi was 79% in 2020.
License-exempt spectrum being used for WiFi and licence-exempt shared access schemes like TV White Space and 6 GHz WiFi will help WISPs continue to grow their market share and will play an important part in the mix of access solutions in Uganda. WiFi operators in Uganda such as CSquared that have city-wide wholesale last-mile WiFi fixed wireless access solutions; and Zoom Wireless that launched WiFi Internet services for business and residential customers in 2014 in parts of northern Uganda at approximately 50% of the rates of its competitors with no usage caps, are examples of operators that could use additional license-exempt spectrum.
A more recent study of 6 GHz in Brazil, showed that unlicensed access in the 6GHz band 134
could add $165.5 billion to Brazil’s economy. The study, titled “Assessing the economic value of unlicensed use in the 6 GHz band in Brazil”, was published by the Dynamic Spectrum Alliance and 135
Telecom Advisory Services LLC and conducted by leading scholars of economics and telecommunications policy. The study looked at the impact on service quality, coverage, affordability, and the impact on different applications and use cases. The methodology relied upon in this study identified the different sources of economic value, estimated them independently and then aggregated within a single value. Its findings revealed a significant early economic impact following the allocation of 1,200 MHz in the 6 GHz band for unlicensed use. The cumulative economic value between 2020 and 2030 associated with enabling license-exempt access to the 1200 MHz in the 6 GHz band amounts to US$ 112.14 billion in GDP contribution, US$ 30.03 billion in producer surplus to Brazilian enterprises, and US$ 21.19 billion in consumer surplus to the Brazilian population. The total contribution amounts to US$ 163.5 billion to the Brazilian economy over the next 10 years.
https://www.microsoft.com/en-us/research/uploads/prod/2016/02/spectrum-economic-significance-of-license-exempt-133
spectrum-report_thanki.pdf http://dynamicspectrumalliance.org/wp-content/uploads/2020/11/1-DSA-Valor-Economico-Uso-Nao-Licenciado-6-GHz-134
Brasil-1.pdf http://dynamicspectrumalliance.org/135
104
8.9.Community networks
While they remain small in size and geography, there are now a growing number of community networks or social-purpose operators that show promise for connecting communities where traditional operators do not cost-effectively provide coverage or affordable access. Community networks operate on the following core principles: • Collective ownership: network infrastructure managed as a common resource; • Social management: network infrastructure is operated by community members; • Open design: the network implementation and management details are public; • Open participation: anyone can extend the network if they follow the network principles; and • Promotion and development of local content in local languages.
Community networks can be operationalized, wholly or partly, through individuals and 136
local stakeholders, NGOs, private sector entities, or public administrations. They are mostly structured as a cooperative where any surplus is reinvested in the network or pays dividends to cooperative members. Some markets, such as the United States, have a deep history of community networks going back to the early days of electrification and telephony. In the United States, these network operators—still numbering close to 1,000—grew up in rural agricultural communities and adopted a cooperative business model leveraging existing farmers’ cooperatives. The U.S. National Telecommunications Cooperative Association still has 850 independent, community-based telecommunications company members leading innovation in rural and small-town America.
While community networks are well known in some markets like the United States, one of the main barriers to the adoption of an enabling regulatory framework for community networks or social-purpose operators is that few people know they exist. This applies not only to the rural communities that are most likely to benefit, but also to policymakers, regulators, and development organizations. Lack of awareness is compounded by the view that access markets can be sufficiently well served only by a handful of large-scale national mobile and fixed network operators competing to provide services of sufficient coverage and quality and at an affordable price. The experience of the United States has shown the opposite to be the case—some of these rural markets can only be served by non-profit community-based network operators.
There is an increasing body of evidence, as shown in the 43-country Community Networks report by GisWatch (APC and IDRC, 2018), that support for expanding the telecommunications operator ecosystem to include community networks and embedding this in national broadband plans could help provide affordable access to more vulnerable communities. Two successful recent cases of community networks—one providing fixed connectivity and the other providing mobile connectivity—are highlighted below.
Spain’s Guifi.net, which received the European Broadband Award for the best innovative model of financing, business, and investment in 2015, supports thousands of individual participants and 26 local for-profit and non-profit operators sharing infrastructure in common, with a fibre and wireless backbone and multihoming Internet links with Wi-Fi and Fibre to the Home (FTTH) fixed broadband connectivity. The nodes of the network are contributed by individuals, companies, and administrations that freely connect to an open network of telecommunications and extend the network wherever the infrastructure and content might not otherwise be accessible. Guifi.net allows for a wide set of different business models to exist around an infrastructure commons and this flexibility has been
See APC and IDRC (2018). 136
105
the secret of its success. As of June 2021, Guifi.net had 36,881 active nodes and 70,135 kilometres of wireless links. 137
Community Cellular Networks in Oaxaca, Mexico, nominated for a World Summit on the Information Society (WSIS) award in 2019, is an example of a community-based mobile network. In 2013, because of the joint efforts between Rhizomatica, REDES A.C., and those in charge of a community radio station in a small village called Talea de Castro in the state of Oaxaca, it was possible to create an indigenous mobile telecommunications network completely operated, owned, and managed by the community itself. The community decides who is responsible for managing the network, how it will operate, and even how much service costs. Currently, the service is licensed through a cooperative called Telecomunicaciones Indígenas Comunitarias A.C. (TIC A.C.), comprised of 14 operating communities, which cover 63 localities. TIC A.C. also has an operational team that accompanies individuals and communities seeking to build, manage, and operate their own communication networks.
As of July 2020, Community Cellular Networks has provided daily service to more than 3,500 people despite some of the harshest conditions for building communications networks in Mexico. In 2021, Community Cellular Networks, which has been allocated 10 MHz in the 850 MHz band, won a court case that exempts it from paying spectrum fees. In addition, the government regulations provide low-cost satellite capacity to local operators like those that are part of TIC A.C. Rhizomatica now functions as a local and international organization to support communities who want to build and maintain self-governed and -owned telecommunication infrastructure. They are involved in policy and regulatory advocacy, open-source technology development for GSM networks, and capacity building.
In Kenya, the Communications Authority of Kenya (CA) formulated a Licensing and Shared Spectrum Framework for Community Networks in November 2021. The license application fee is Ksh1000 ($8.90), with an annual renewal fee of KSh5000 ($44.4). The license is valid for 10 years. The community network will be limited to a subcounty. This is considered affordable compared to the lowest fee in the Network Facilities Provider license where an initial license fee is Sh200,000 ($1777.8).
There are opportunities for UCC to support new or existing community-based operators 138
with funding from universal service funds and by creating additional licensed and license-exempt spectrum. Local government can also leverage funding used to connect local government anchor facilitates to also provide affordable backhaul for community-based operators. Additional license-exempt spectrum opportunities have been discussed in this section and social-purpose IMT spectrum licenses could also be created – following the Mexican model. An example of a community-based non-profit organization in Uganda is Battery Operated System for Community Outreach (BOSCO) that supports 48 ICT and Development Centres with over 60,000 beneficiaries in the Northern and West Nile regions in Uganda. This organization could make use of additional spectrum 139
and funding to provide connectivity to surrounding communities.
Community-based operators currently need to apply for a Communal Access Provider license to operate. This license involves a $2500 application fee, a $3000 annual fee and 2% of annual revenue with many coverage and quality of service requirements. This would preclude most community-based
https://guifi.net/en137
Uganda has a category for communal networks in its licensing scheme, available to non-profits. https://www.ucc.co.ug/138
wp-content/uploads/2020/05/COMMUNAL-ACCESS-PROVIDER-LICENSE-25-05-2020.pdf https://www.apc.org/en/users/bosco-uganda139
106
operators from starting a small-scale community network in an under-serviced area of Uganda. Kenya have solved this problem and recently adopted a community network licensing framework with affordable license fees. A subcounty community license application fee is Ksh1000 ($8.85) and the 140
annual renewal fee is Ksh5000 ($44.20). The license is valid for 10 years. Subsidies from Universal Service Funds can also be used to support community network operators to provide required infrastructure such as backhaul or towers.
Should Uganda follow a Kenyan community network licensing model or license waivers, subsidies from Universal Service Funds, and provide sufficient license-exempt or shared spectrum for community network operators, their probability of success will be greatly improved.
8.10.Low-earth orbit platforms and high-altitude platform systems
Connecting very remote areas with population densities less than 100 people per square kilometre is often best suited to satellite technology as terrestrial connectivity is not cost effective. These areas make up 25.7% of the land mass of Uganda and 5.96% of the population. Traditionally geo-stationary satellite technology such as VSAT was used in very remote areas, but there are many new emerging higher capacity and lower latency space-based technologies that the Ugandan regulator can look at for these regions for direct connectivity to consumers and Internet of things (IoT) devices as well as backhaul connectivity to last-mile mobile and fixed wireless networks.
Low Earth Orbit (LEO) satellite systems that have launched or are in the process of being launched include OneWeb, SpaceX, Kuiper, and Telesat. High-altitude Platform Systems (HAPS) providers, like HAPSMobile, have conducted their first test flights. There are already allocated ITU frequency assignments in the Ku and Ka bands for these space-based platforms that will need to be ratified, should UCC license one of these platforms for operation in Uganda.
The ITU is also discussing co-use of IMT bands used for both terrestrial cellular technology and space-based cellular (see Resolution 212 from WRC-19). In this resolution it is agreed that 141
co-coverage, and co-frequency deployment of terrestrial and satellite components of IMT could be feasible if deployed as an integrated network supported by a system providing the management of frequency utilization by both components. Hence it would be possible for a cellular operator in Uganda to make use of a space-based platform offering IMT services to reach more remote regions if they coordinate their frequency use and coverage with the space-based platform.
Low-income users in remote regions will likely not be able to afford purchasing LEO or HAPS units for home or business connectivity. It is more likely that these systems will be used for backhaul to a fixed wireless network such as a community network or small WISP operating in a rural region which can aggregate demand from users.
https://www.apc.org/en/news/kenya-adopts-community-networks-licensing-framework140
https://www.itu.int/dms_pub/itu-r/oth/0C/0A/R0C0A00000F0068PDFE.pdf141
107
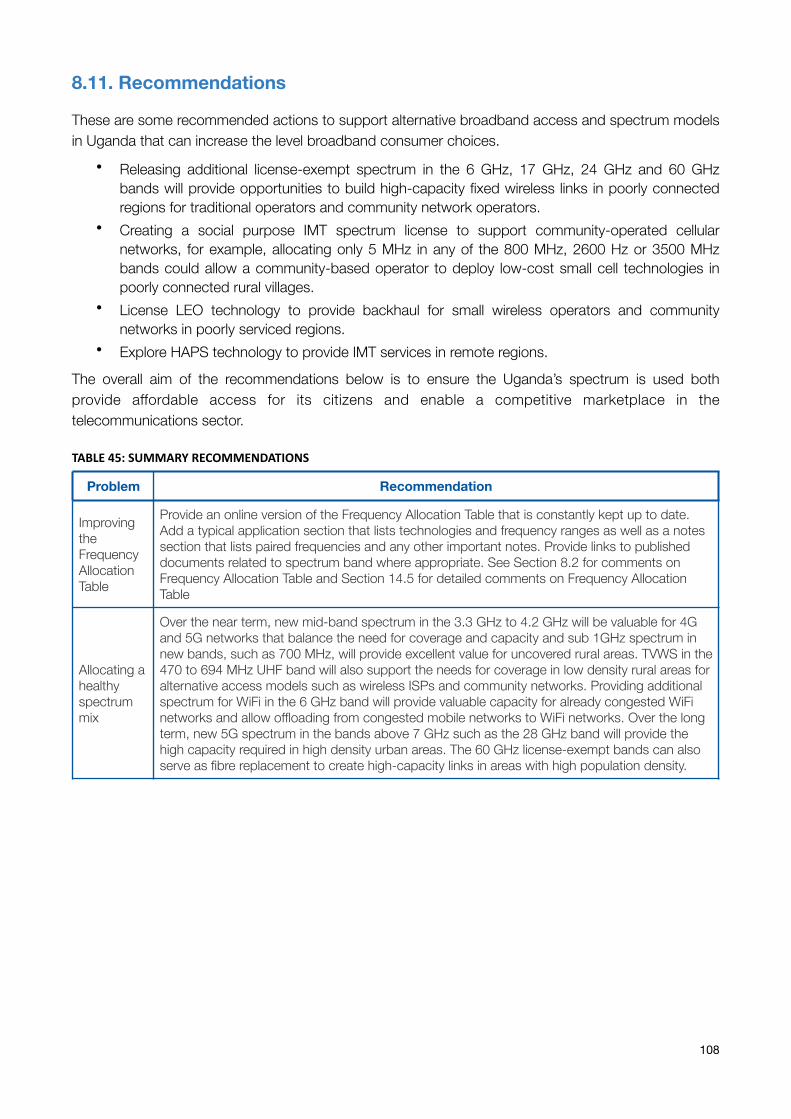
8.11. Recommendations
These are some recommended actions to support alternative broadband access and spectrum models in Uganda that can increase the level broadband consumer choices.
• Releasing additional license-exempt spectrum in the 6 GHz, 17 GHz, 24 GHz and 60 GHz bands will provide opportunities to build high-capacity fixed wireless links in poorly connected regions for traditional operators and community network operators.
• Creating a social purpose IMT spectrum license to support community-operated cellular networks, for example, allocating only 5 MHz in any of the 800 MHz, 2600 Hz or 3500 MHz bands could allow a community-based operator to deploy low-cost small cell technologies in poorly connected rural villages.
• License LEO technology to provide backhaul for small wireless operators and community networks in poorly serviced regions.
• Explore HAPS technology to provide IMT services in remote regions.
The overall aim of the recommendations below is to ensure the Uganda’s spectrum is used both provide affordable access for its citizens and enable a competitive marketplace in the telecommunications sector.
TABLE45:SUMMARYRECOMMENDATIONS
Problem Recommendation
Improving the Frequency Allocation Table
Provide an online version of the Frequency Allocation Table that is constantly kept up to date. Add a typical application section that lists technologies and frequency ranges as well as a notes section that lists paired frequencies and any other important notes. Provide links to published documents related to spectrum band where appropriate. See Section 8.2 for comments on Frequency Allocation Table and Section 14.5 for detailed comments on Frequency Allocation Table
Allocating a healthy spectrum mix
Over the near term, new mid-band spectrum in the 3.3 GHz to 4.2 GHz will be valuable for 4G and 5G networks that balance the need for coverage and capacity and sub 1GHz spectrum in new bands, such as 700 MHz, will provide excellent value for uncovered rural areas. TVWS in the 470 to 694 MHz UHF band will also support the needs for coverage in low density rural areas for alternative access models such as wireless ISPs and community networks. Providing additional spectrum for WiFi in the 6 GHz band will provide valuable capacity for already congested WiFi networks and allow offloading from congested mobile networks to WiFi networks. Over the long term, new 5G spectrum in the bands above 7 GHz such as the 28 GHz band will provide the high capacity required in high density urban areas. The 60 GHz license-exempt bands can also serve as fibre replacement to create high-capacity links in areas with high population density.
108
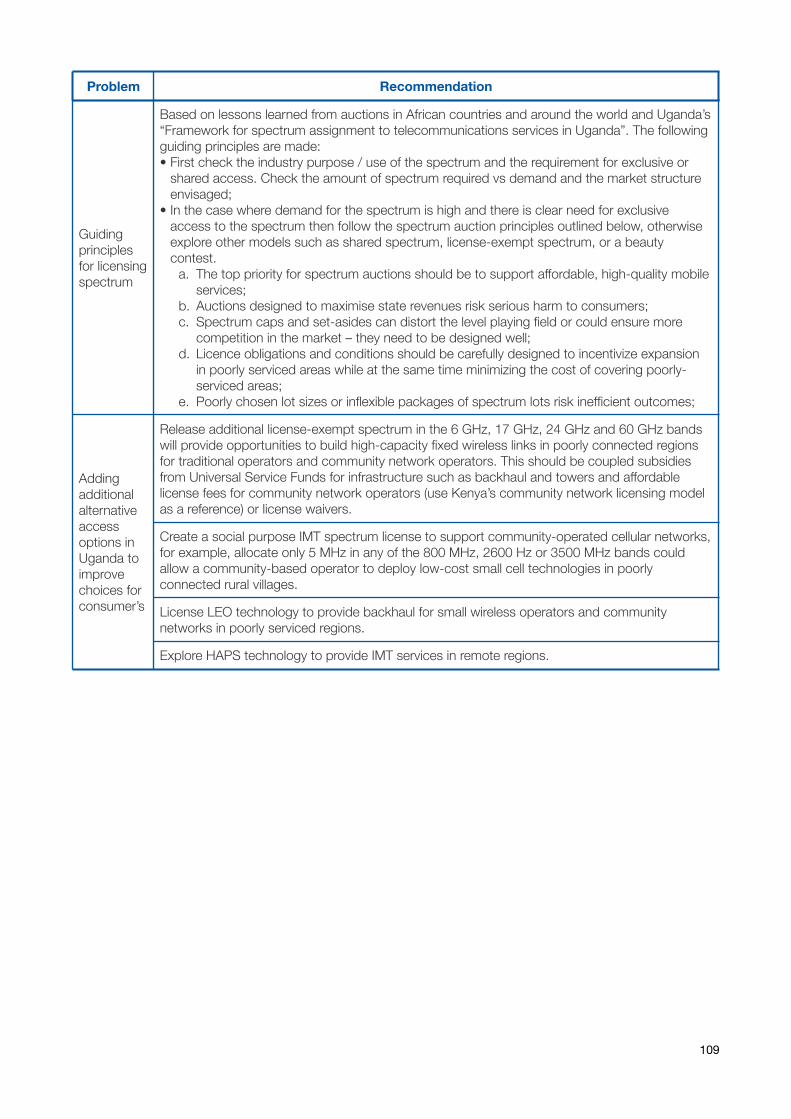
Guiding principles for licensing spectrum
Based on lessons learned from auctions in African countries and around the world and Uganda’s “Framework for spectrum assignment to telecommunications services in Uganda”. The following guiding principles are made: • First check the industry purpose / use of the spectrum and the requirement for exclusive or
shared access. Check the amount of spectrum required vs demand and the market structure envisaged;
• In the case where demand for the spectrum is high and there is clear need for exclusive access to the spectrum then follow the spectrum auction principles outlined below, otherwise explore other models such as shared spectrum, license-exempt spectrum, or a beauty contest.
a. The top priority for spectrum auctions should be to support affordable, high-quality mobile services;
b. Auctions designed to maximise state revenues risk serious harm to consumers; c. Spectrum caps and set-asides can distort the level playing field or could ensure more
competition in the market – they need to be designed well; d. Licence obligations and conditions should be carefully designed to incentivize expansion
in poorly serviced areas while at the same time minimizing the cost of covering poorly-serviced areas;
e. Poorly chosen lot sizes or inflexible packages of spectrum lots risk inefficient outcomes;
Adding additional alternative access options in Uganda to improve choices for consumer’s
Release additional license-exempt spectrum in the 6 GHz, 17 GHz, 24 GHz and 60 GHz bands will provide opportunities to build high-capacity fixed wireless links in poorly connected regions for traditional operators and community network operators. This should be coupled subsidies from Universal Service Funds for infrastructure such as backhaul and towers and affordable license fees for community network operators (use Kenya’s community network licensing model as a reference) or license waivers.
Create a social purpose IMT spectrum license to support community-operated cellular networks, for example, allocate only 5 MHz in any of the 800 MHz, 2600 Hz or 3500 MHz bands could allow a community-based operator to deploy low-cost small cell technologies in poorly connected rural villages.
License LEO technology to provide backhaul for small wireless operators and community networks in poorly serviced regions.
Explore HAPS technology to provide IMT services in remote regions.
Problem Recommendation
109
9. Broadband Blueprint The Broadband Blueprint is a set of action points that need to be implemented to extend broadband access and use to all Ugandans. It briefly outlines the methodology, the tools for the project and the recommendations of the study. Each chapter gives substantial detail on each component of the Blueprint and should be referred to for more information. The broadband value chain is the conceptual model that links the components together. The main outputs of the Blueprint are in the Connectivity and Ecosystem segments (Figure 7).
The purpose of the Broadband Blueprint is to lay out a plan to extend broadband connectivity to all Ugandans. The first step is to identify the scope of the problem. There are three parts to this step:
I. Collecting data in order to analyze the current status of broadband access; II. To methodically investigate what obstacles exist - in this instance, the PESTLE model
was used; and III. To benchmark the current status against peer and best practice countries.
The MoICT&NG GIS portal provides users with a single window to assess the current status of broadband access. A range of data was collected from different stakeholders, most particularly UCC and NITA. Even though collecting accurate and timely data was very difficult, the benefit of the portal is that it can relatively easily be updated. As a result, a new and updated assessment of the current status of broadband access can quickly be produced. This is a much needed step forward for Uganda, because updated data analytics has been a perpetual challenge.
The PESTLE model highlights the challenges facing the sector. Taxation is one issue highlighted by the PESTLE analysis. The policy focus on the ICT sector is not reflected in Uganda’s tax regime, which discriminates against the ICT sector through a wide range of excise duties. The result is that the current tax regime directly sabotages any broadband policy. There are other challenges, notably, no right of way regulatory regime, enforcement of facilities sharing regime among all sectors, changes to the spectrum planning and licensing regimes, all covered in Chapter 7.
110
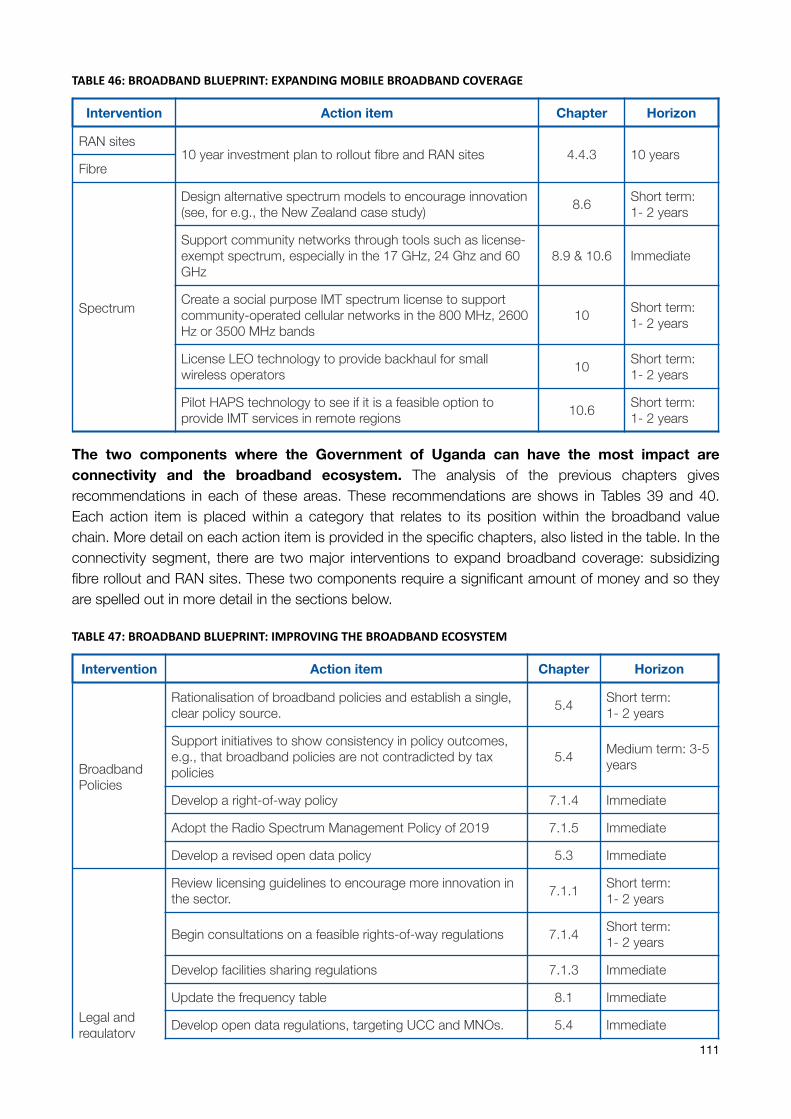
TABLE46:BROADBANDBLUEPRINT:EXPANDINGMOBILEBROADBANDCOVERAGE
The two components where the Government of Uganda can have the most impact are connectivity and the broadband ecosystem. The analysis of the previous chapters gives recommendations in each of these areas. These recommendations are shows in Tables 39 and 40. Each action item is placed within a category that relates to its position within the broadband value chain. More detail on each action item is provided in the specific chapters, also listed in the table. In the connectivity segment, there are two major interventions to expand broadband coverage: subsidizing fibre rollout and RAN sites. These two components require a significant amount of money and so they are spelled out in more detail in the sections below.
TABLE47:BROADBANDBLUEPRINT:IMPROVINGTHEBROADBANDECOSYSTEM
Intervention Action item Chapter Horizon
RAN sites 10 year investment plan to rollout fibre and RAN sites 4.4.3 10 years
Fibre
Spectrum
Design alternative spectrum models to encourage innovation (see, for e.g., the New Zealand case study) 8.6 Short term:
1- 2 years
Support community networks through tools such as license-exempt spectrum, especially in the 17 GHz, 24 Ghz and 60 GHz
8.9 & 10.6 Immediate
Create a social purpose IMT spectrum license to support community-operated cellular networks in the 800 MHz, 2600 Hz or 3500 MHz bands
10 Short term: 1- 2 years
License LEO technology to provide backhaul for small wireless operators 10 Short term:
1- 2 years
Pilot HAPS technology to see if it is a feasible option to provide IMT services in remote regions 10.6 Short term:
1- 2 years
Intervention Action item Chapter Horizon
Broadband Policies
Rationalisation of broadband policies and establish a single, clear policy source. 5.4 Short term:
1- 2 years
Support initiatives to show consistency in policy outcomes, e.g., that broadband policies are not contradicted by tax policies
5.4 Medium term: 3-5 years
Develop a right-of-way policy 7.1.4 Immediate
Adopt the Radio Spectrum Management Policy of 2019 7.1.5 Immediate
Develop a revised open data policy 5.3 Immediate
Legal and regulatory
Review licensing guidelines to encourage more innovation in the sector. 7.1.1 Short term:
1- 2 years
Begin consultations on a feasible rights-of-way regulations 7.1.4 Short term: 1- 2 years
Develop facilities sharing regulations 7.1.3 Immediate
Update the frequency table 8.1 Immediate
Develop open data regulations, targeting UCC and MNOs. 5.4 Immediate
111
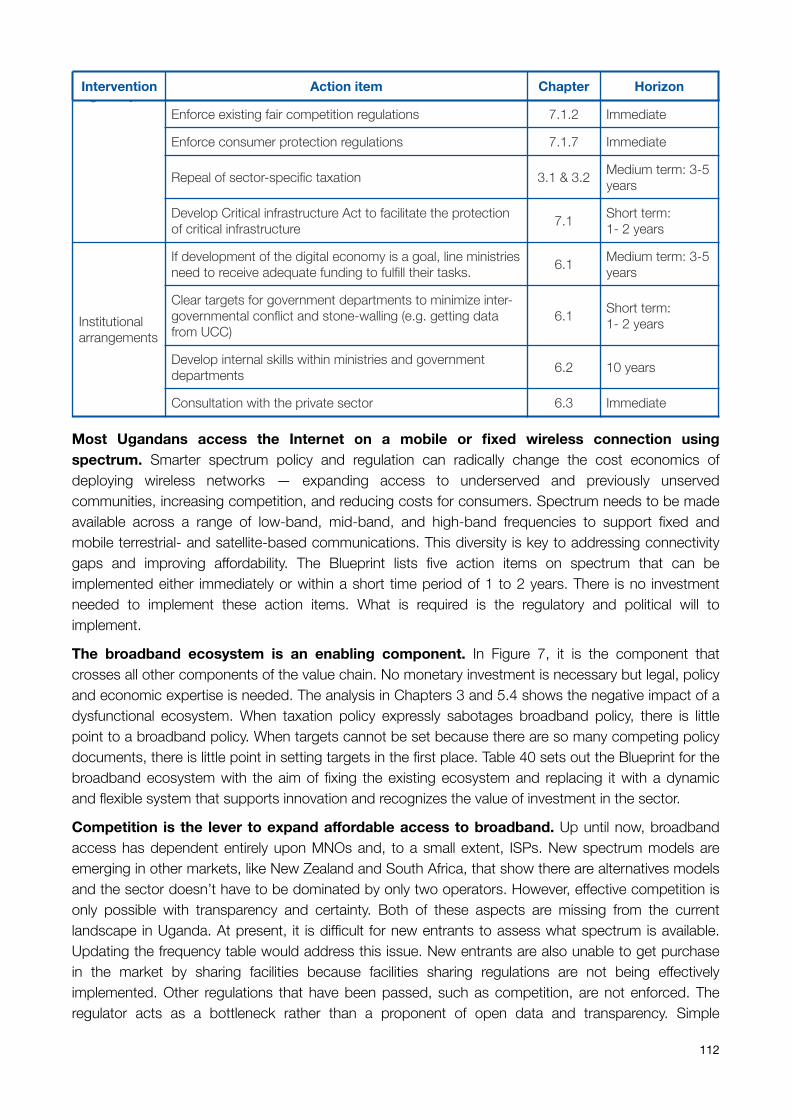
Most Ugandans access the Internet on a mobile or fixed wireless connection using spectrum. Smarter spectrum policy and regulation can radically change the cost economics of deploying wireless networks — expanding access to underserved and previously unserved communities, increasing competition, and reducing costs for consumers. Spectrum needs to be made available across a range of low-band, mid-band, and high-band frequencies to support fixed and mobile terrestrial- and satellite-based communications. This diversity is key to addressing connectivity gaps and improving affordability. The Blueprint lists five action items on spectrum that can be implemented either immediately or within a short time period of 1 to 2 years. There is no investment needed to implement these action items. What is required is the regulatory and political will to implement.
The broadband ecosystem is an enabling component. In Figure 7, it is the component that crosses all other components of the value chain. No monetary investment is necessary but legal, policy and economic expertise is needed. The analysis in Chapters 3 and 5.4 shows the negative impact of a dysfunctional ecosystem. When taxation policy expressly sabotages broadband policy, there is little point to a broadband policy. When targets cannot be set because there are so many competing policy documents, there is little point in setting targets in the first place. Table 40 sets out the Blueprint for the broadband ecosystem with the aim of fixing the existing ecosystem and replacing it with a dynamic and flexible system that supports innovation and recognizes the value of investment in the sector.
Competition is the lever to expand affordable access to broadband. Up until now, broadband access has dependent entirely upon MNOs and, to a small extent, ISPs. New spectrum models are emerging in other markets, like New Zealand and South Africa, that show there are alternatives models and the sector doesn’t have to be dominated by only two operators. However, effective competition is only possible with transparency and certainty. Both of these aspects are missing from the current landscape in Uganda. At present, it is difficult for new entrants to assess what spectrum is available. Updating the frequency table would address this issue. New entrants are also unable to get purchase in the market by sharing facilities because facilities sharing regulations are not being effectively implemented. Other regulations that have been passed, such as competition, are not enforced. The regulator acts as a bottleneck rather than a proponent of open data and transparency. Simple
regulatoryEnforce existing fair competition regulations 7.1.2 Immediate
Enforce consumer protection regulations 7.1.7 Immediate
Repeal of sector-specific taxation 3.1 & 3.2 Medium term: 3-5 years
Develop Critical infrastructure Act to facilitate the protection of critical infrastructure 7.1 Short term:
1- 2 years
Institutional arrangements
If development of the digital economy is a goal, line ministries need to receive adequate funding to fulfill their tasks. 6.1 Medium term: 3-5
years
Clear targets for government departments to minimize inter-governmental conflict and stone-walling (e.g. getting data from UCC)
6.1 Short term: 1- 2 years
Develop internal skills within ministries and government departments 6.2 10 years
Consultation with the private sector 6.3 Immediate
Intervention Action item Chapter Horizon
112

initiatives, such as open data regulations, could have an outsize impact by establishing the current status of broadband in Uganda, the resources available to new entrants and also kickstart consultations with the private sector by ensuring that all stakeholders have access to up-to-date and accurate information.
The tools to fix the broadband ecosystem in Uganda are currently available. For the ecosystem, Chapters 3, 6 and 7 describe the steps that need to be taken. The most important steps are highlighted in Table 40. However, expanding mobile broadband coverage is new to the MoICT&NG. The primary tool to expand coverage is the GIS portal. The following section explains how the GIS portal can be used to identify areas that need broadband infrastructure. It is worth noting again that the primary advantage of the GIS portal is that it can be updated frequently as the quality of input data improves.
113
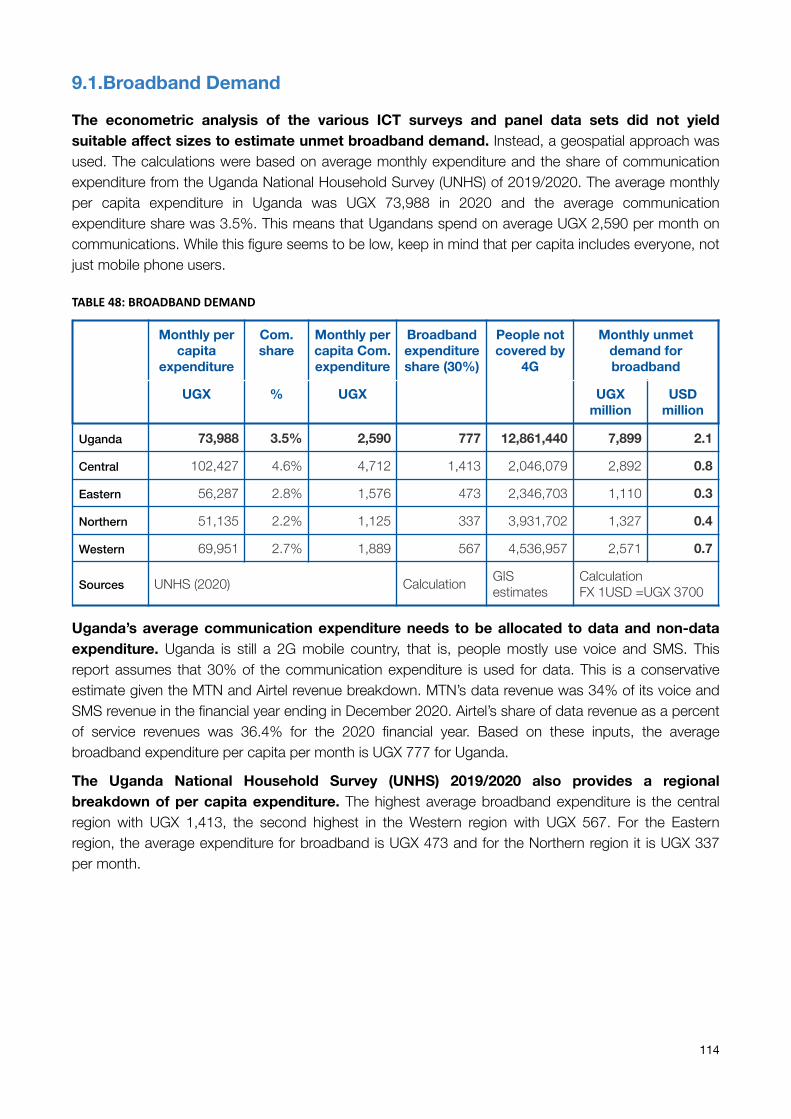
9.1.Broadband Demand
The econometric analysis of the various ICT surveys and panel data sets did not yield suitable affect sizes to estimate unmet broadband demand. Instead, a geospatial approach was used. The calculations were based on average monthly expenditure and the share of communication expenditure from the Uganda National Household Survey (UNHS) of 2019/2020. The average monthly per capita expenditure in Uganda was UGX 73,988 in 2020 and the average communication expenditure share was 3.5%. This means that Ugandans spend on average UGX 2,590 per month on communications. While this figure seems to be low, keep in mind that per capita includes everyone, not just mobile phone users.
TABLE48:BROADBANDDEMAND
Uganda’s average communication expenditure needs to be allocated to data and non-data expenditure. Uganda is still a 2G mobile country, that is, people mostly use voice and SMS. This report assumes that 30% of the communication expenditure is used for data. This is a conservative estimate given the MTN and Airtel revenue breakdown. MTN’s data revenue was 34% of its voice and SMS revenue in the financial year ending in December 2020. Airtel’s share of data revenue as a percent of service revenues was 36.4% for the 2020 financial year. Based on these inputs, the average broadband expenditure per capita per month is UGX 777 for Uganda.
The Uganda National Household Survey (UNHS) 2019/2020 also provides a regional breakdown of per capita expenditure. The highest average broadband expenditure is the central region with UGX 1,413, the second highest in the Western region with UGX 567. For the Eastern region, the average expenditure for broadband is UGX 473 and for the Northern region it is UGX 337 per month.
Monthly per capita
expenditure
Com. share
Monthly per capita Com. expenditure
Broadband expenditure share (30%)
People not covered by
4G
Monthly unmet demand for broadband
UGX % UGX UGX million
USD million
Uganda 73,988 3.5% 2,590 777 12,861,440 7,899 2.1
Central 102,427 4.6% 4,712 1,413 2,046,079 2,892 0.8
Eastern 56,287 2.8% 1,576 473 2,346,703 1,110 0.3
Northern 51,135 2.2% 1,125 337 3,931,702 1,327 0.4
Western 69,951 2.7% 1,889 567 4,536,957 2,571 0.7
Sources UNHS (2020) Calculation GIS estimates
Calculation FX 1USD =UGX 3700
114
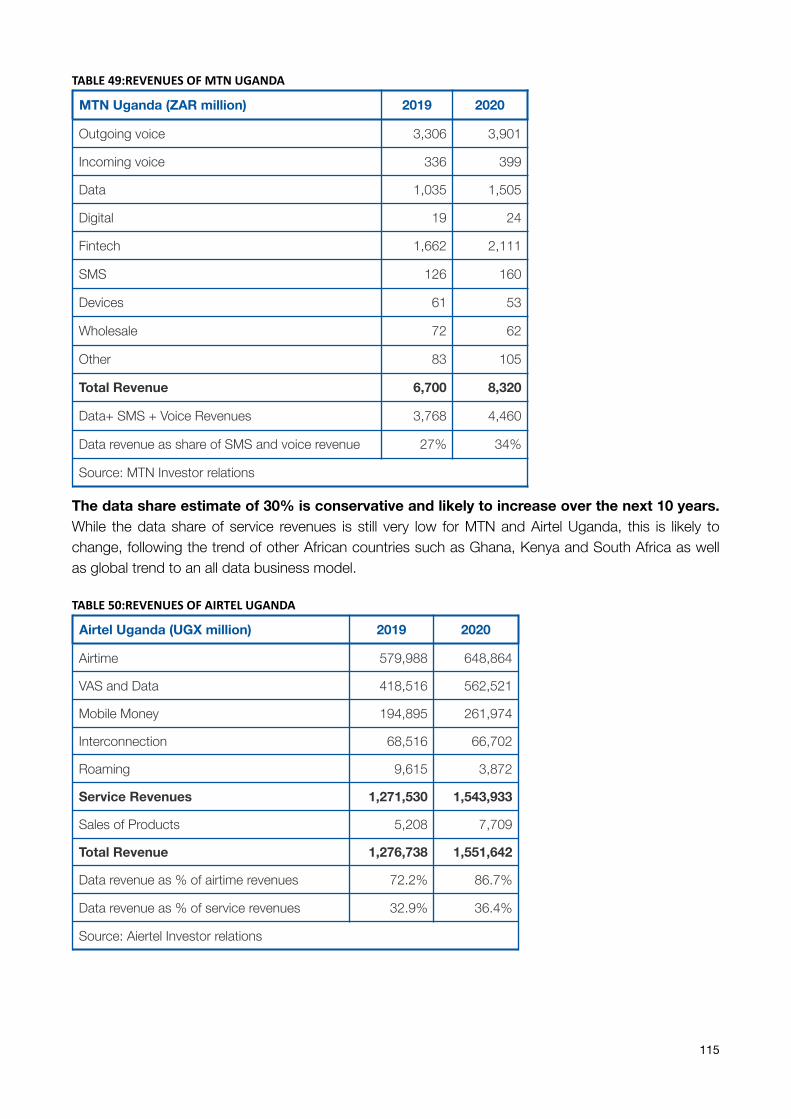
TABLE49:REVENUESOFMTNUGANDA
The data share estimate of 30% is conservative and likely to increase over the next 10 years. While the data share of service revenues is still very low for MTN and Airtel Uganda, this is likely to change, following the trend of other African countries such as Ghana, Kenya and South Africa as well as global trend to an all data business model.
TABLE50:REVENUESOFAIRTELUGANDA
MTN Uganda (ZAR million) 2019 2020
Outgoing voice 3,306 3,901
Incoming voice 336 399
Data 1,035 1,505
Digital 19 24
Fintech 1,662 2,111
SMS 126 160
Devices 61 53
Wholesale 72 62
Other 83 105
Total Revenue 6,700 8,320
Data+ SMS + Voice Revenues 3,768 4,460
Data revenue as share of SMS and voice revenue 27% 34%
Source: MTN Investor relations
Airtel Uganda (UGX million) 2019 2020
Airtime 579,988 648,864
VAS and Data 418,516 562,521
Mobile Money 194,895 261,974
Interconnection 68,516 66,702
Roaming 9,615 3,872
Service Revenues 1,271,530 1,543,933
Sales of Products 5,208 7,709
Total Revenue 1,276,738 1,551,642
Data revenue as % of airtime revenues 72.2% 86.7%
Data revenue as % of service revenues 32.9% 36.4%
Source: Aiertel Investor relations
115
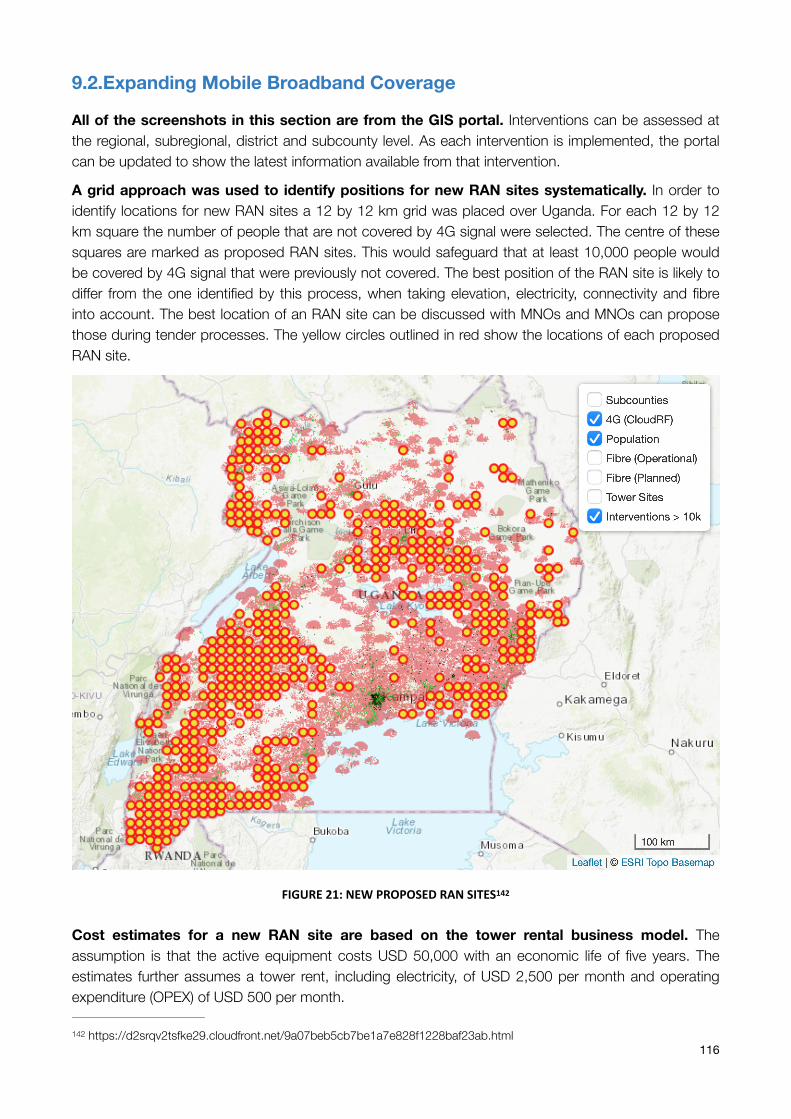
9.2.Expanding Mobile Broadband Coverage
All of the screenshots in this section are from the GIS portal. Interventions can be assessed at the regional, subregional, district and subcounty level. As each intervention is implemented, the portal can be updated to show the latest information available from that intervention.
A grid approach was used to identify positions for new RAN sites systematically. In order to identify locations for new RAN sites a 12 by 12 km grid was placed over Uganda. For each 12 by 12 km square the number of people that are not covered by 4G signal were selected. The centre of these squares are marked as proposed RAN sites. This would safeguard that at least 10,000 people would be covered by 4G signal that were previously not covered. The best position of the RAN site is likely to differ from the one identified by this process, when taking elevation, electricity, connectivity and fibre into account. The best location of an RAN site can be discussed with MNOs and MNOs can propose those during tender processes. The yellow circles outlined in red show the locations of each proposed RAN site.
FIGURE21:NEWPROPOSEDRANSITES 142
Cost estimates for a new RAN site are based on the tower rental business model. The assumption is that the active equipment costs USD 50,000 with an economic life of five years. The estimates further assumes a tower rent, including electricity, of USD 2,500 per month and operating expenditure (OPEX) of USD 500 per month.
https://d2srqv2tsfke29.cloudfront.net/9a07beb5cb7be1a7e828f1228baf23ab.html142
116
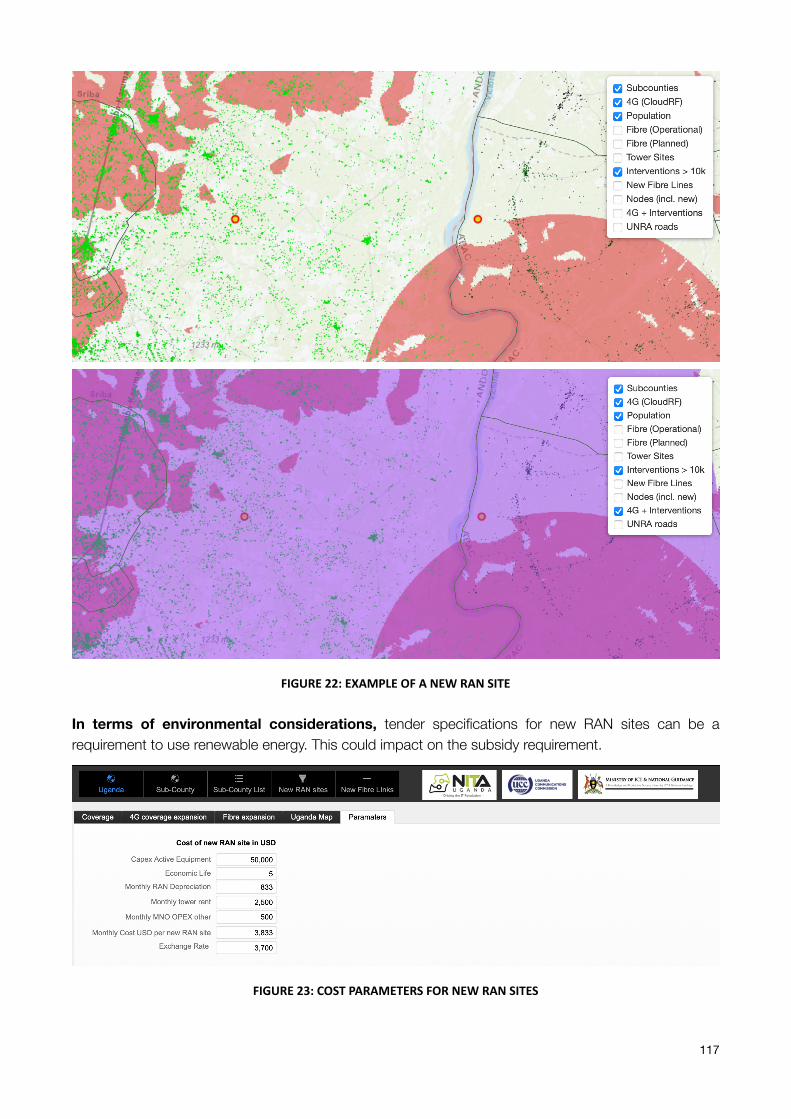
FIGURE22:EXAMPLEOFANEWRANSITE
In terms of environmental considerations, tender specifications for new RAN sites can be a requirement to use renewable energy. This could impact on the subsidy requirement.
FIGURE23:COSTPARAMETERSFORNEWRANSITES
117
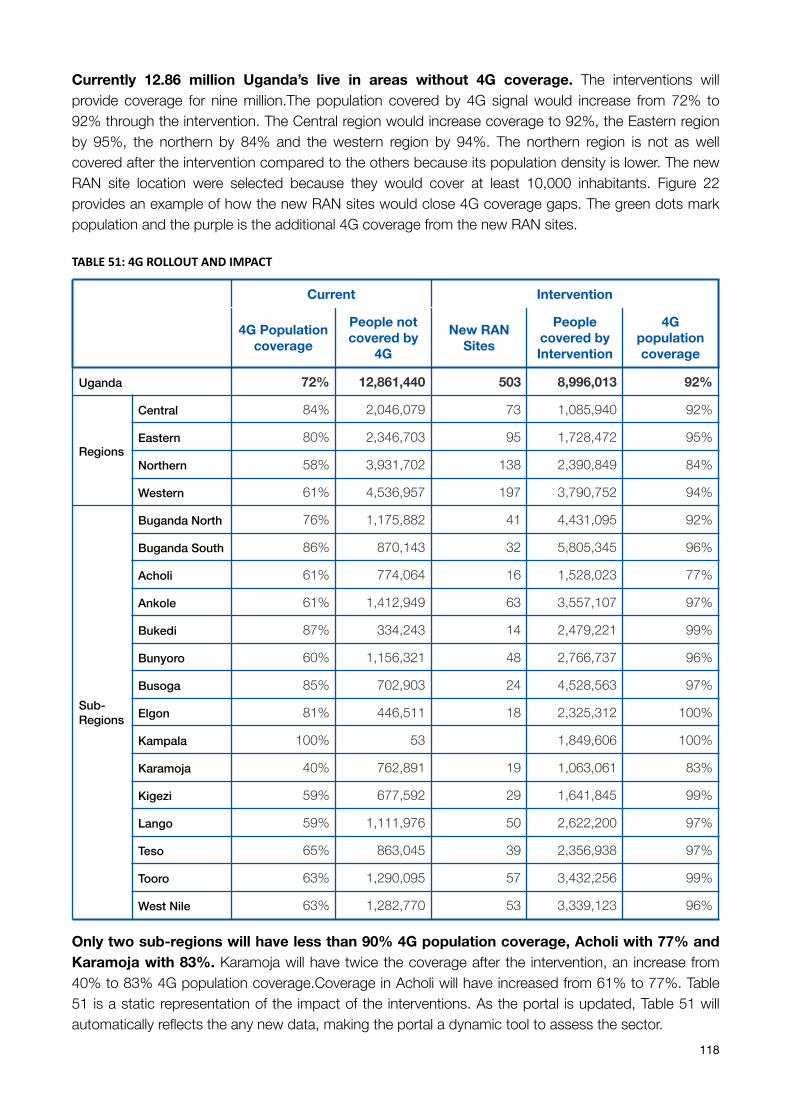
Currently 12.86 million Uganda’s live in areas without 4G coverage. The interventions will provide coverage for nine million.The population covered by 4G signal would increase from 72% to 92% through the intervention. The Central region would increase coverage to 92%, the Eastern region by 95%, the northern by 84% and the western region by 94%. The northern region is not as well covered after the intervention compared to the others because its population density is lower. The new RAN site location were selected because they would cover at least 10,000 inhabitants. Figure 22 provides an example of how the new RAN sites would close 4G coverage gaps. The green dots mark population and the purple is the additional 4G coverage from the new RAN sites.
TABLE51:4GROLLOUTANDIMPACT
Only two sub-regions will have less than 90% 4G population coverage, Acholi with 77% and Karamoja with 83%. Karamoja will have twice the coverage after the intervention, an increase from 40% to 83% 4G population coverage.Coverage in Acholi will have increased from 61% to 77%. Table 51 is a static representation of the impact of the interventions. As the portal is updated, Table 51 will automatically reflects the any new data, making the portal a dynamic tool to assess the sector.
Current Intervention
4G Population coverage
People not covered by
4G
New RAN Sites
People covered by Intervention
4G population coverage
Uganda 72% 12,861,440 503 8,996,013 92%
Regions
Central 84% 2,046,079 73 1,085,940 92%
Eastern 80% 2,346,703 95 1,728,472 95%
Northern 58% 3,931,702 138 2,390,849 84%
Western 61% 4,536,957 197 3,790,752 94%
Sub-Regions
Buganda North 76% 1,175,882 41 4,431,095 92%
Buganda South 86% 870,143 32 5,805,345 96%
Acholi 61% 774,064 16 1,528,023 77%
Ankole 61% 1,412,949 63 3,557,107 97%
Bukedi 87% 334,243 14 2,479,221 99%
Bunyoro 60% 1,156,321 48 2,766,737 96%
Busoga 85% 702,903 24 4,528,563 97%
Elgon 81% 446,511 18 2,325,312 100%
Kampala 100% 53 1,849,606 100%
Karamoja 40% 762,891 19 1,063,061 83%
Kigezi 59% 677,592 29 1,641,845 99%
Lango 59% 1,111,976 50 2,622,200 97%
Teso 65% 863,045 39 2,356,938 97%
Tooro 63% 1,290,095 57 3,432,256 99%
West Nile 63% 1,282,770 53 3,339,123 96%
118
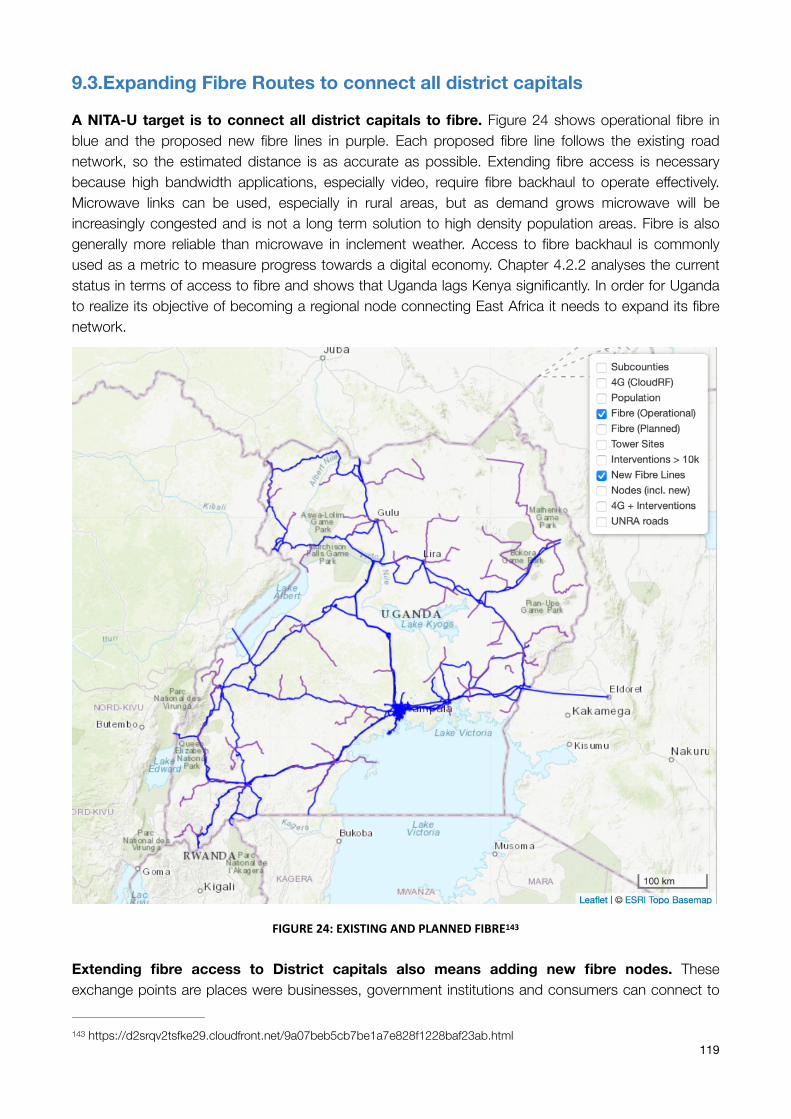
9.3.Expanding Fibre Routes to connect all district capitals
A NITA-U target is to connect all district capitals to fibre. Figure 24 shows operational fibre in blue and the proposed new fibre lines in purple. Each proposed fibre line follows the existing road network, so the estimated distance is as accurate as possible. Extending fibre access is necessary because high bandwidth applications, especially video, require fibre backhaul to operate effectively. Microwave links can be used, especially in rural areas, but as demand grows microwave will be increasingly congested and is not a long term solution to high density population areas. Fibre is also generally more reliable than microwave in inclement weather. Access to fibre backhaul is commonly used as a metric to measure progress towards a digital economy. Chapter 4.2.2 analyses the current status in terms of access to fibre and shows that Uganda lags Kenya significantly. In order for Uganda to realize its objective of becoming a regional node connecting East Africa it needs to expand its fibre network.
FIGURE24:EXISTINGANDPLANNEDFIBRE 143
Extending fibre access to District capitals also means adding new fibre nodes. These exchange points are places were businesses, government institutions and consumers can connect to
https://d2srqv2tsfke29.cloudfront.net/9a07beb5cb7be1a7e828f1228baf23ab.html143
119
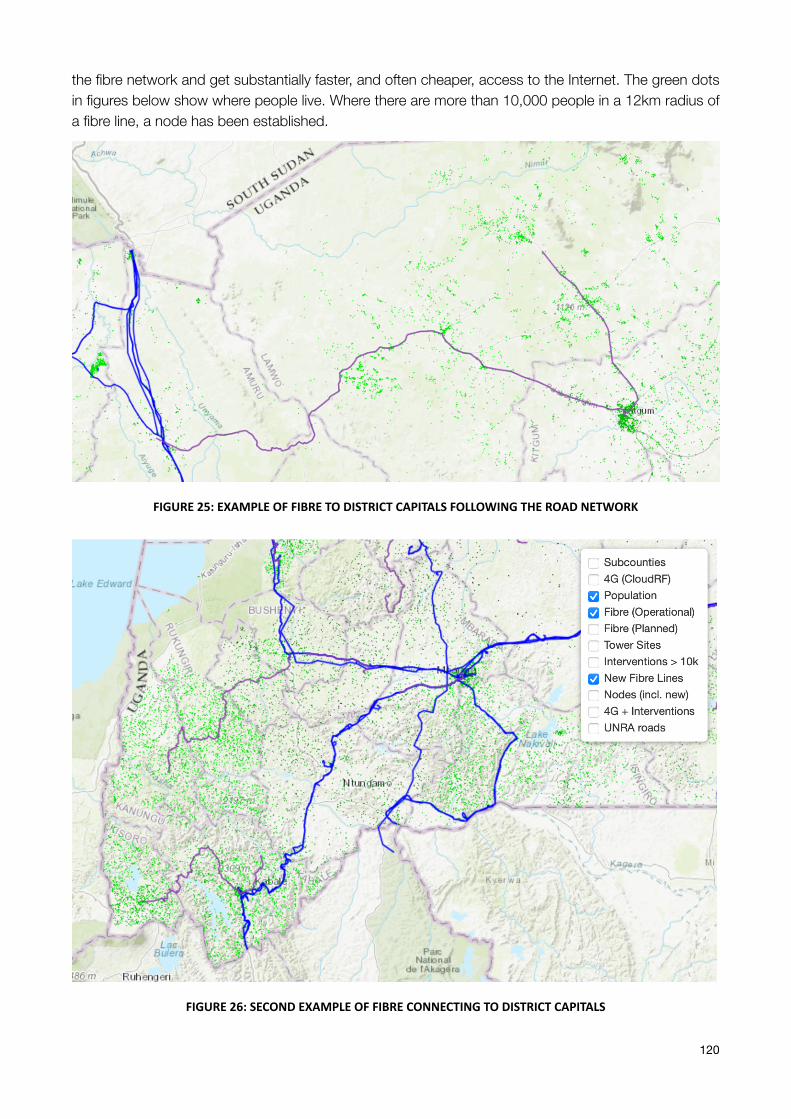
the fibre network and get substantially faster, and often cheaper, access to the Internet. The green dots in figures below show where people live. Where there are more than 10,000 people in a 12km radius of a fibre line, a node has been established.
FIGURE25:EXAMPLEOFFIBRETODISTRICTCAPITALSFOLLOWINGTHEROADNETWORK
FIGURE26:SECONDEXAMPLEOFFIBRECONNECTINGTODISTRICTCAPITALS
120
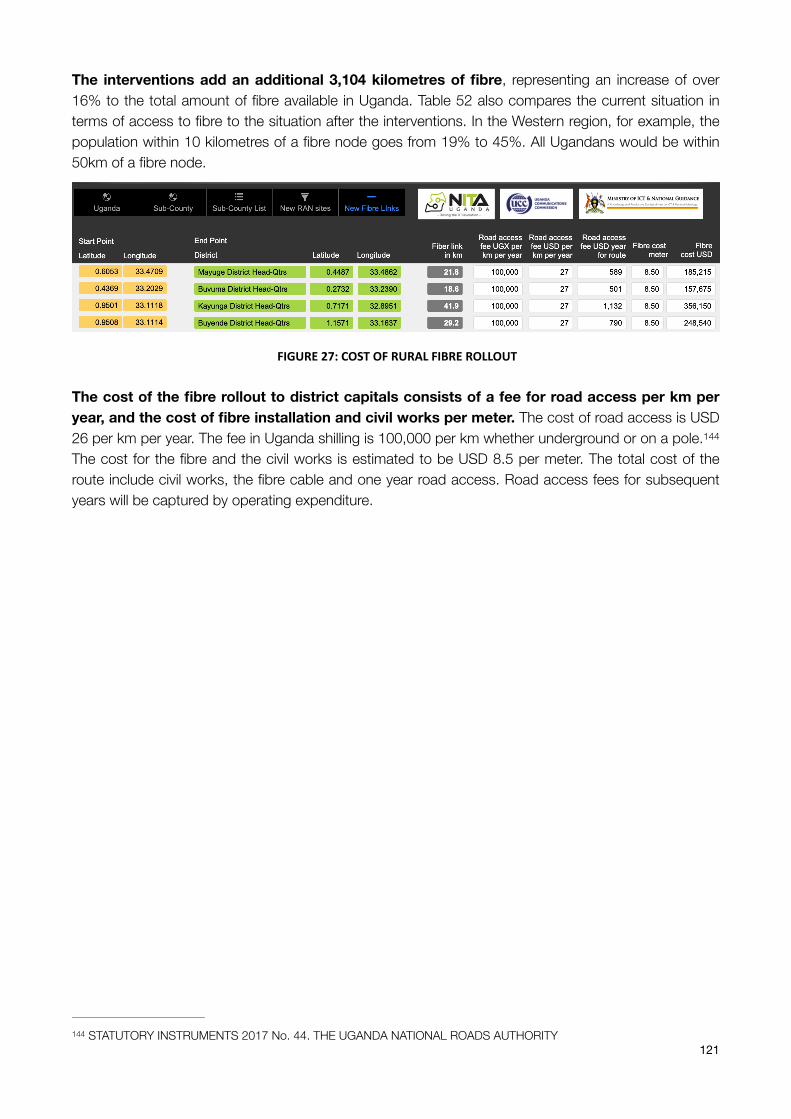
The interventions add an additional 3,104 kilometres of fibre, representing an increase of over 16% to the total amount of fibre available in Uganda. Table 52 also compares the current situation in terms of access to fibre to the situation after the interventions. In the Western region, for example, the population within 10 kilometres of a fibre node goes from 19% to 45%. All Ugandans would be within 50km of a fibre node.
FIGURE27:COSTOFRURALFIBREROLLOUT
The cost of the fibre rollout to district capitals consists of a fee for road access per km per year, and the cost of fibre installation and civil works per meter. The cost of road access is USD 26 per km per year. The fee in Uganda shilling is 100,000 per km whether underground or on a pole. 144
The cost for the fibre and the civil works is estimated to be USD 8.5 per meter. The total cost of the route include civil works, the fibre cable and one year road access. Road access fees for subsequent years will be captured by operating expenditure.
STATUTORY INSTRUMENTS 2017 No. 44. THE UGANDA NATIONAL ROADS AUTHORITY144
121
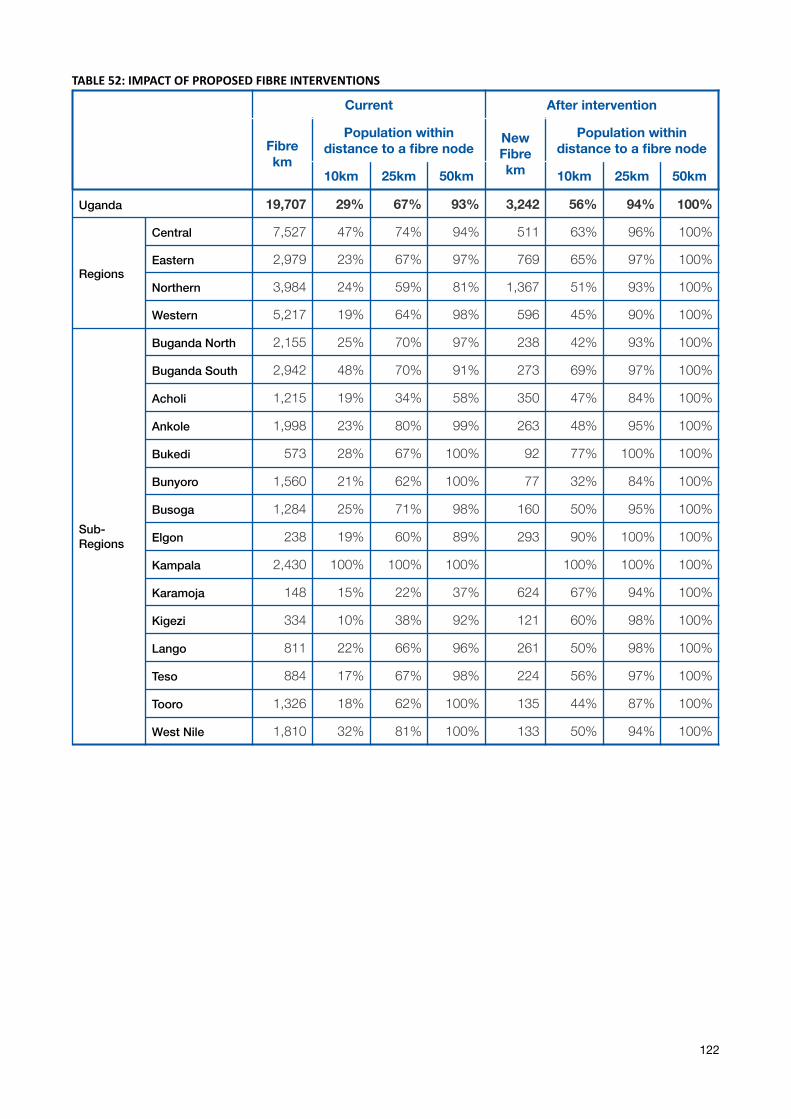
TABLE52:IMPACTOFPROPOSEDFIBREINTERVENTIONS
Current After intervention
Fibre km
Population within distance to a fibre node
New Fibre km
Population within distance to a fibre node
10km 25km 50km 10km 25km 50km
Uganda 19,707 29% 67% 93% 3,242 56% 94% 100%
Regions
Central 7,527 47% 74% 94% 511 63% 96% 100%
Eastern 2,979 23% 67% 97% 769 65% 97% 100%
Northern 3,984 24% 59% 81% 1,367 51% 93% 100%
Western 5,217 19% 64% 98% 596 45% 90% 100%
Sub-Regions
Buganda North 2,155 25% 70% 97% 238 42% 93% 100%
Buganda South 2,942 48% 70% 91% 273 69% 97% 100%
Acholi 1,215 19% 34% 58% 350 47% 84% 100%
Ankole 1,998 23% 80% 99% 263 48% 95% 100%
Bukedi 573 28% 67% 100% 92 77% 100% 100%
Bunyoro 1,560 21% 62% 100% 77 32% 84% 100%
Busoga 1,284 25% 71% 98% 160 50% 95% 100%
Elgon 238 19% 60% 89% 293 90% 100% 100%
Kampala 2,430 100% 100% 100% 100% 100% 100%
Karamoja 148 15% 22% 37% 624 67% 94% 100%
Kigezi 334 10% 38% 92% 121 60% 98% 100%
Lango 811 22% 66% 96% 261 50% 98% 100%
Teso 884 17% 67% 98% 224 56% 97% 100%
Tooro 1,326 18% 62% 100% 135 44% 87% 100%
West Nile 1,810 32% 81% 100% 133 50% 94% 100%
122
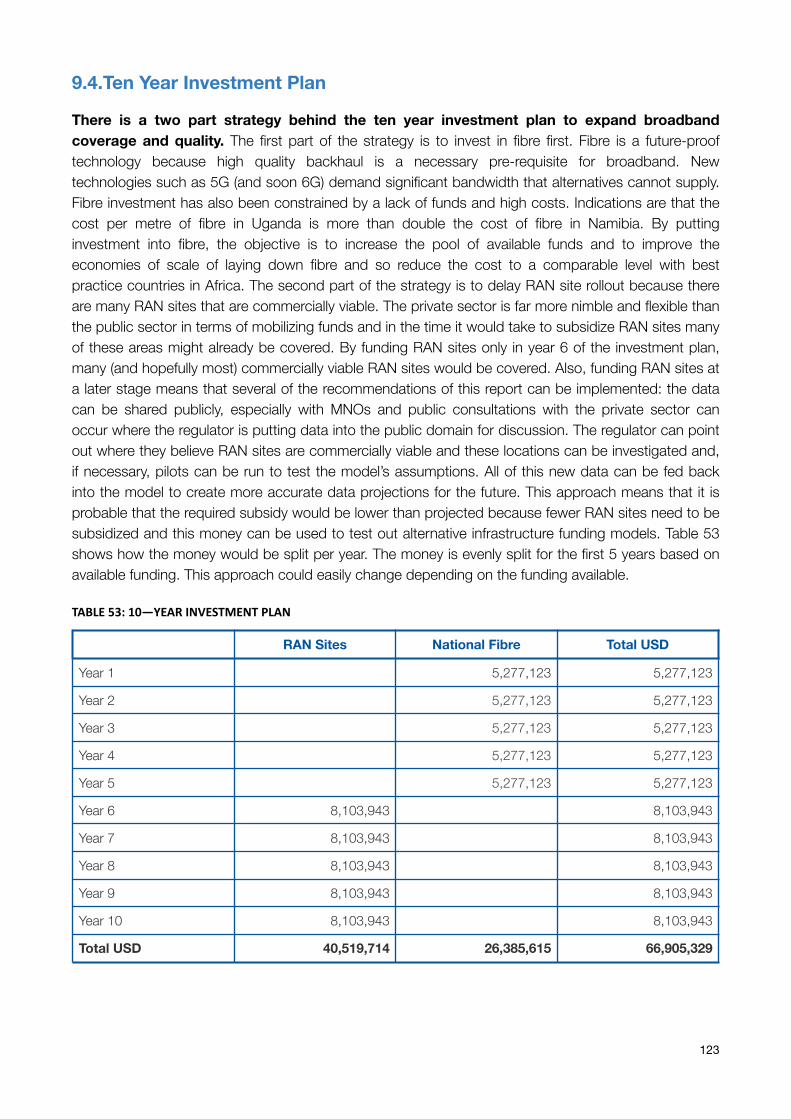
9.4.Ten Year Investment Plan
There is a two part strategy behind the ten year investment plan to expand broadband coverage and quality. The first part of the strategy is to invest in fibre first. Fibre is a future-proof technology because high quality backhaul is a necessary pre-requisite for broadband. New technologies such as 5G (and soon 6G) demand significant bandwidth that alternatives cannot supply. Fibre investment has also been constrained by a lack of funds and high costs. Indications are that the cost per metre of fibre in Uganda is more than double the cost of fibre in Namibia. By putting investment into fibre, the objective is to increase the pool of available funds and to improve the economies of scale of laying down fibre and so reduce the cost to a comparable level with best practice countries in Africa. The second part of the strategy is to delay RAN site rollout because there are many RAN sites that are commercially viable. The private sector is far more nimble and flexible than the public sector in terms of mobilizing funds and in the time it would take to subsidize RAN sites many of these areas might already be covered. By funding RAN sites only in year 6 of the investment plan, many (and hopefully most) commercially viable RAN sites would be covered. Also, funding RAN sites at a later stage means that several of the recommendations of this report can be implemented: the data can be shared publicly, especially with MNOs and public consultations with the private sector can occur where the regulator is putting data into the public domain for discussion. The regulator can point out where they believe RAN sites are commercially viable and these locations can be investigated and, if necessary, pilots can be run to test the model’s assumptions. All of this new data can be fed back into the model to create more accurate data projections for the future. This approach means that it is probable that the required subsidy would be lower than projected because fewer RAN sites need to be subsidized and this money can be used to test out alternative infrastructure funding models. Table 53 shows how the money would be split per year. The money is evenly split for the first 5 years based on available funding. This approach could easily change depending on the funding available.
TABLE53:10—YEARINVESTMENTPLAN
RAN Sites National Fibre Total USD
Year 1 5,277,123 5,277,123
Year 2 5,277,123 5,277,123
Year 3 5,277,123 5,277,123
Year 4 5,277,123 5,277,123
Year 5 5,277,123 5,277,123
Year 6 8,103,943 8,103,943
Year 7 8,103,943 8,103,943
Year 8 8,103,943 8,103,943
Year 9 8,103,943 8,103,943
Year 10 8,103,943 8,103,943
Total USD 40,519,714 26,385,615 66,905,329
123
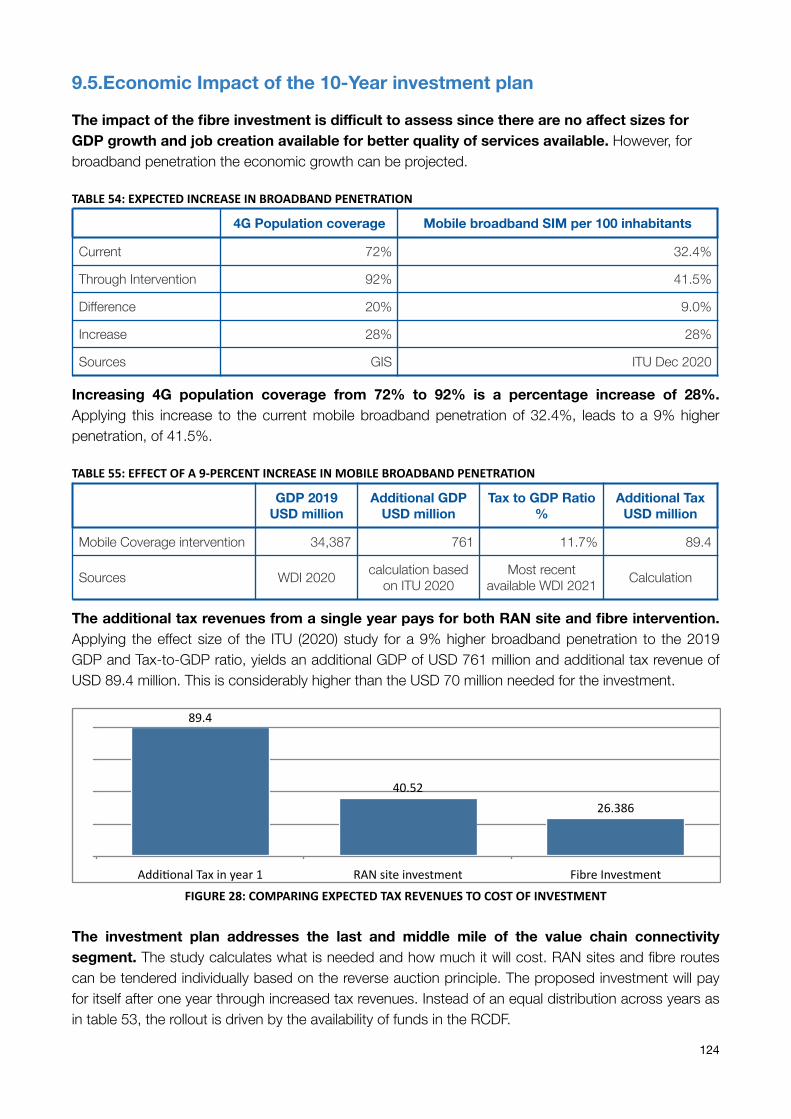
9.5.Economic Impact of the 10-Year investment plan
The impact of the fibre investment is difficult to assess since there are no affect sizes for GDP growth and job creation available for better quality of services available. However, for broadband penetration the economic growth can be projected.
TABLE54:EXPECTEDINCREASEINBROADBANDPENETRATION
Increasing 4G population coverage from 72% to 92% is a percentage increase of 28%. Applying this increase to the current mobile broadband penetration of 32.4%, leads to a 9% higher penetration, of 41.5%.
TABLE55:EFFECTOFA9-PERCENTINCREASEINMOBILEBROADBANDPENETRATION
The additional tax revenues from a single year pays for both RAN site and fibre intervention. Applying the effect size of the ITU (2020) study for a 9% higher broadband penetration to the 2019 GDP and Tax-to-GDP ratio, yields an additional GDP of USD 761 million and additional tax revenue of USD 89.4 million. This is considerably higher than the USD 70 million needed for the investment.
FIGURE28:COMPARINGEXPECTEDTAXREVENUESTOCOSTOFINVESTMENT
The investment plan addresses the last and middle mile of the value chain connectivity segment. The study calculates what is needed and how much it will cost. RAN sites and fibre routes can be tendered individually based on the reverse auction principle. The proposed investment will pay for itself after one year through increased tax revenues. Instead of an equal distribution across years as in table 53, the rollout is driven by the availability of funds in the RCDF.
4G Population coverage Mobile broadband SIM per 100 inhabitants
Current 72% 32.4%
Through Intervention 92% 41.5%
Difference 20% 9.0%
Increase 28% 28%
Sources GIS ITU Dec 2020
GDP 2019 USD million
Additional GDP USD million
Tax to GDP Ratio %
Additional Tax USD million
Mobile Coverage intervention 34,387 761 11.7% 89.4
Sources WDI 2020 calculation based on ITU 2020
Most recent available WDI 2021 Calculation
AddiKonalTaxinyear1 RANsiteinvestment FibreInvestment
26.38640.52
89.4
124
10.Conclusions Based on the analysis and recommendations provided in the different chapters in this Report, it is evident that transitioning from the current state of broadband access in Uganda to what is desirable to achieve the DUV aspirations will require coordinated and collaborative action across government. This includes the policy environment where focus and consistency is needed especially in reducing cost of rollout and access; the institutional arrangements to ensure clear roles in a collaborative rather than combative setting; the legal and regulatory environment to ensure a regionally competitive investment climate, ease of infrastructure rollout, collaboration, fair competition as well as consumer protection; and approaches to spectrum management that create opportunities for large, small, and community players to enable access. With direct international connections to five countries, Uganda is positioned to become an Internet hub for its landlocked neighbours, providing connectivity and data centre services. This opportunity is however time sensitive as Kenya and Rwanda, are rapidly improving their ICT infrastructure and investment climate.
The Uganda Broadband Portal was developed as an analytical tool that has the major benefits of both visualization, and permitting the continuous update of data to provide “present time” snaps of coverage, gaps, and options as well as identifying and estimating costs for locations where subsidy is required. For the first time, users across Government can visually assess the location of ICT infrastructure. As different government departments work through the portal, there will be an incentive to update data. The structure of the Portal means that the analytical framework can be easily updated and new inputs can be quickly uploaded. Dissolving departmental silos is an important step towards a coordinated all-of-government approach to the ICT sector.
The Broadband Value Chain shows that the main challenge facing Uganda is in the Connectivity segment. Used international bandwidth is low. Only 29% of the population are within 10 km of a fibre node compared to 41% in Kenya. Uganda suffers from high data prices: As a % of GNI per capita per month, Uganda is ranked 27th in Africa for a 300MB basket. At a high level, the solutions to these connectivity challenges are to reduce obstacles to data usage, such as high prices; remove obstacles to fibre roll-out such as rights-of-way access; lower the cost of operating a network in Uganda by creating an innovative and flexible spectrum management system and transforming the ICT taxation regime by lowering excise duties and removing sector-specific taxation.
The Broadband Infrastructure Blueprint is a set of actions, along with timelines, that Uganda needs to take to realise the DUV aspirations, with the greatest focus being on getting the ecosystem right. Table 56 summarises what needs to be done in order to address gaps and remove barriers in the ecosystem to promote fast rollout of, and access to broadband.
The nature of the spatial distribution of population combining with the economic state is such that, for the ten-year projections of the Blueprint, many communities and areas will be commercially unviable. This means that as part of the Blueprint, Uganda needs to provide for subsidies to achieve targeted coverage if the SDGs by-line of “Leaving no one behind” is to be achieved.
125
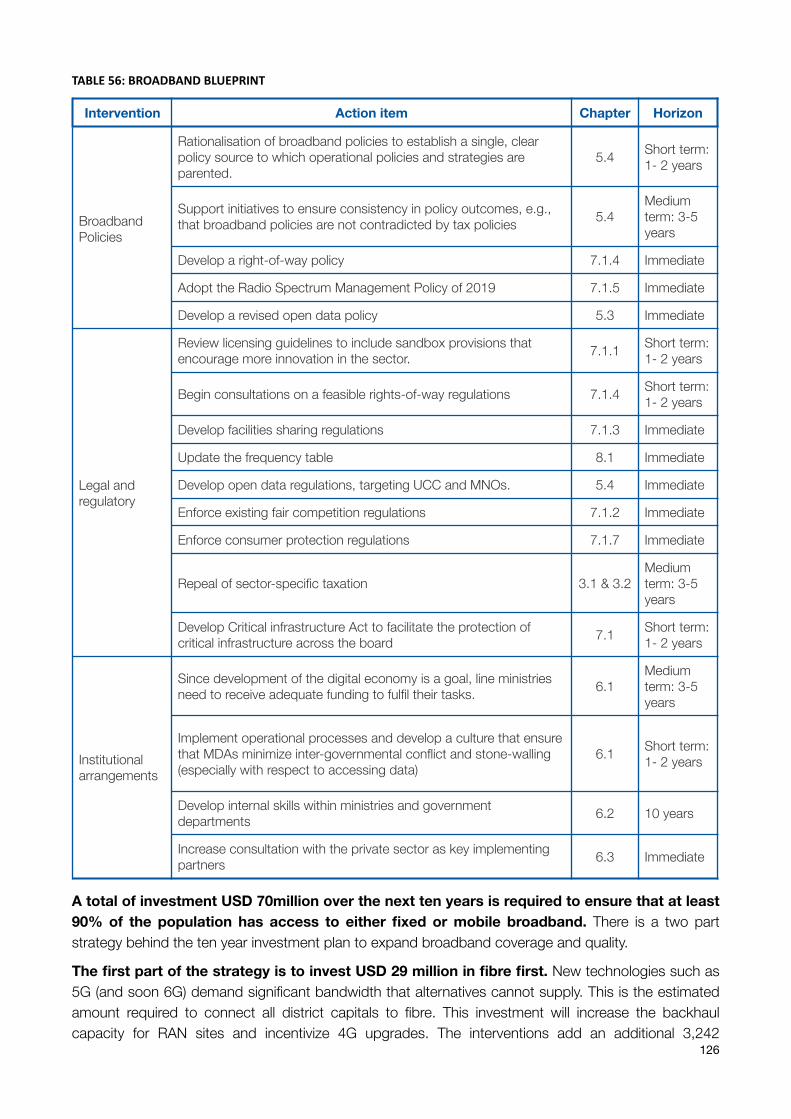
TABLE56:BROADBANDBLUEPRINT
A total of investment USD 70million over the next ten years is required to ensure that at least 90% of the population has access to either fixed or mobile broadband. There is a two part strategy behind the ten year investment plan to expand broadband coverage and quality.
The first part of the strategy is to invest USD 29 million in fibre first. New technologies such as 5G (and soon 6G) demand significant bandwidth that alternatives cannot supply. This is the estimated amount required to connect all district capitals to fibre. This investment will increase the backhaul capacity for RAN sites and incentivize 4G upgrades. The interventions add an additional 3,242
Intervention Action item Chapter Horizon
Broadband Policies
Rationalisation of broadband policies to establish a single, clear policy source to which operational policies and strategies are parented.
5.4 Short term: 1- 2 years
Support initiatives to ensure consistency in policy outcomes, e.g., that broadband policies are not contradicted by tax policies 5.4
Medium term: 3-5 years
Develop a right-of-way policy 7.1.4 Immediate
Adopt the Radio Spectrum Management Policy of 2019 7.1.5 Immediate
Develop a revised open data policy 5.3 Immediate
Legal and regulatory
Review licensing guidelines to include sandbox provisions that encourage more innovation in the sector. 7.1.1 Short term:
1- 2 years
Begin consultations on a feasible rights-of-way regulations 7.1.4 Short term: 1- 2 years
Develop facilities sharing regulations 7.1.3 Immediate
Update the frequency table 8.1 Immediate
Develop open data regulations, targeting UCC and MNOs. 5.4 Immediate
Enforce existing fair competition regulations 7.1.2 Immediate
Enforce consumer protection regulations 7.1.7 Immediate
Repeal of sector-specific taxation 3.1 & 3.2Medium term: 3-5 years
Develop Critical infrastructure Act to facilitate the protection of critical infrastructure across the board 7.1 Short term:
1- 2 years
Institutional arrangements
Since development of the digital economy is a goal, line ministries need to receive adequate funding to fulfil their tasks. 6.1
Medium term: 3-5 years
Implement operational processes and develop a culture that ensure that MDAs minimize inter-governmental conflict and stone-walling (especially with respect to accessing data)
6.1 Short term: 1- 2 years
Develop internal skills within ministries and government departments 6.2 10 years
Increase consultation with the private sector as key implementing partners 6.3 Immediate
126
kilometres of fibre, representing an increase of over 16% to the total amount of fibre available in Uganda. People living within a 10 km radius to a fibre node would be increased from 29% to 56%, and those living within 25km from 67% to 94%. Starting with fibre rollout creates a springboard for service providers to reach all areas that are commercially viable using either FTTX or RAN sites. Many potential locations for new RAN sites are commercially viable. By funding RAN sites only in year 6 of the investment plan, many (and hopefully most) commercially viable RAN sites would already be covered.
The second part of the strategy is to subsidize the expansion of the Radio Access Network (RAN) site rollout after the connection of all district capitals to fibre. The estimated subsidy required to increase the 4G population coverage from the current 72% to 92% is about USD 41 million. Uganda’s universal access and service fund, administered by the RCDF will be responsible for this intervention. In total 503 new RAN sites would be subsidised, bringing 4G coverage to 9 million more Ugandans.
It is evident that Uganda has all the underpinning requirements for an inclusive fully digitalised economy, provided there is consistent and coordinated political will and leadership to deal with the remaining barriers and gaps highlighted in this Report. None of the gaps or challenges identified is insurmountable.
127
11.References BoU 2020a. Bank of Uganda, FINANCIAL STABILITY REPORT June 2020 | Issue No. 12. https://www.bou.or.ug/bou/bouwebsite/bouwebsitecontent/FinancialStability/financial_stability/Rpts/All/Financial-Stability-Report-June-2020.pdf.
BoU 2020b. ANNUAL SUPERVISION REPORT, December 2020 | Issue No. 1, https://bou.or.ug/bou/bouwebsite/bouwebsitecontent/Supervision/Annual_Supervision_Report/asr/Annual-Supervision-Report-2020.pdf.
BoU (2020c) STATISTICAL ABSTRACT, https://www.bou.or.ug/bou/bouwebsite/bouwebsitecontent/publications/Statistical_Abstract/2020/2020-Bank-of-Uganda-Statistical-Abstract.pdf
BoU 2019. Bank of Uganda, FINANCIAL STABILITY REPORT June 2020 | Issue No. 11, https://www.bou.or.ug/bou/bouwebsite/bouwebsitecontent/FinancialStability/financial_stability/Rpts/All/Financial-Stability-Report-June-2019-final-2.pdf.
BoU 2018. Bank of Uganda, FINANCIAL STABILITY REPORT June 2020 | Issue No. 10, https://www.bou.or.ug/bou/bouwebsite/bouwebsitecontent/FinancialStability/financial_stability/Rpts/All/Financial_Stability_Report_June-2018_final.pdf.
Czernich N., Falck, O, Kretschmer, T. and & Woessmann L., (2009). "Broadband Infrastructure and Economic Growth,” CESifo Working Paper Series 2861, CESifo, https://ideas.repec.org/p/ces/ceswps/_2861.html.
Edquist, H., Goodridge, P., Haskel, Li, X., and Lindquist, E. (2018). “How Important Are Mobile Broadband Networks for the Global Economic Development.” Information Economics and Policy, Volume 45, December 2018, Pages 16-29, https://www.sciencedirect.com/science/article/pii/S0167624517301695.
GSMA. (2016a). Digitalisation and mobile sector taxation in Europe: The experience in Hungary, https://w w w . g s m a . c o m / m o b i l e f o r d e v e l o p m e n t / w p - c o n t e n t / u p l o a d s / 2 0 1 6 / 0 3 /GSMA_Digitalisation_and_mobile_sector_taxation_experience_in_Hungary.pdf.
GSMA. (2016b).The Internet Value Chain, May 2016, https://www.gsma.com/publicpolicy/wp-content/uploads/2016/09/GSMA2016_Report_TheInternetValueChain.pdf.
GSMA. (2018).The Data Value Chain, June 2018, https://www.gsma.com/publicpolicy/wp-content/uploads/2018/06/GSMA_Data_Value_Chain_June_2018.pdf.
GSMA (2021). Spectrum Pricing, GSMA Public Policy Position, May 2021, https://www.gsma.com/spectrum/wp-content/uploads/2021/05/Spectrum-Pricing-Positions.pdf.
ITU (2013). Taxing telecommunication/ ICT services: an overvIew, https://www.itu.int/en/ITU-D/Regulatory-Market/Documents/Publications/Taxation2%20E-BAT3.pdf.
ITU (2020). How broadband, digitisation and ICT Regulation impact the global economy, https://www.itu.int/en/ITU-D/Conferences/GSR/2020/Documents/ITU_Global_Econometric_Modeling_GSR-DiscussionPaper.pdf.
ITU (2016). Guidelines for the review of spectrum pricing methodologies and the preparation of spectrum fee schedules, ISBN 978-92-61-19661-5, https://www.itu.int/en/ITU-D/Spectrum-Broadcasting/Documents/Publications/Guidelines_SpectrumFees_Final_E.pdf.
128
Koutroumpis, P, (2018). The economic impact of broadband: evidence from OECD countries, April 2018, https://www.ofcom.org.uk/__data/assets/pdf_file/0025/113299/economic-broadband-oecd-countries.pdf.
Qiang, Christine Zhen-Wei, Carlo Rossotto, and Kaoru Kimura. (2009). “Economic Impacts of Broadband.” In Information and Communications for Development. Washington D.C.: World Bank.
OECD (2011). Economic Impact of Internet/Broadband Technologies, 2011, DSTI/ICCP/IE(2011)i/Rev1.
Scott, Colin (2012). “Does Broadband Internet Access Actually Spur Economic Growth?” http://www.eecs.berkeley.edu/~rcs/classes/ictd.pdf.
Stork, C. (2020). Chapter 7. Regulatory responses to evolving technologies, Digital Regulation Handbook, International Telecommunication Union and The World Bank, 2020, ISBN: 978-92-61-31651-8, https://www.itu.int/en/myitu/Publications/2020/08/31/09/09/Digital-Regulation-Handbook.
ALA (2000): Information Literacy Competency Standards for Higher Education, ALA, 2000, : http://www.ala.org/acrl/ilcomstan. html.
Baro, E. E. (2011). “A survey of information literacy education in library schools in Africa”. Library Review, March.
Bawden, D. (2001), “Information and digital literacies: a review of concepts”, Journal of Documentation, Vol. 57 No. 2, pp. 218-59.
Benchmarking baskets, ACORN-REDECOM Conference 2010 Brasilia, D.F.
Bertot, J. C. (2003). The multiple dimensions of the digital divide: more than the technology 'haves' and 'have nots. Government Information Quarterly, 20(2), 185–191.
Breivik. P. S., & Senn, J. A. (1998). Information literacy: Educating children for the 21st century. (2nd ed.). Washington, DC: National Education Association.
Britz, J. J. (2004). To know or not to know: a moral reflection on information poverty. Journal of information science, 30(3), 192-204.
Britz, J. J. (2008). Making the global information society good: A social justice perspective on the ethical dimensions of the global information society. Journal of the Association for Information Science and Technology, 59(7), 1171-1183.
Carlson, U. (2010): Children and Youth in the Digital Media Culture, Nordic Horizon, Edited by Ulla Carlson, published by the International Clearinghouse on Children, Youth and Media, 2010.
Eisenberg, M., Lowe, C., & Spitzer, K. (2004). Information Literacy: Essential Skills for the Information Age. 2nd. edition. Libraries Unlimited.
Esselaar, S., Song, S. and Stork, C. (2017). Universal Basic Internet as a Freemium Business Model to Connect the Next Billion, in DigiWorld Economic Journal, No. 108, 4th quarter 2017.
Gebremichael, M. D. and Jackson, J. W. (2006). “Briding the gap in Sub-Saharan Africa: A holistic look at information poverty and the region’s digital divide”. Government Information Quarterly 23: 268.
Fuchs, C. and Horak, E. (2008). "Africa and the Digital Divide”. Telematics and Informatics 25: 105.
Hargittai, E (1999). Weaving the western web: explaining differences in Internet connectivity among OECD countries. Telecommunications Policy, 23(10-11):701–718, 1999.
129
Hargittai, E (2002). Second-level digital divide: Differences in people’s online skills. First Monday, 7(4), April 2002.
Hargittai, E (2005). Survey Measures of Web-Oriented Digital Literacy. Social Science Computer Review, 23(3):371–379, 2005.
Horton, F. W. (2008): Understanding Information Literacy: A Primer, UNESCO, https://unesdoc.unesco.org/ark:/48223/pf0000157020.
ITU (2011). Measuring the information society. Retrieved March 25, 2014, from http://www.itu.int/en/ITU-D/Statistics/Documents/publications/mis2012/MIS2012_without_Annex_4.pdf
JISC (2020), Building digital capabilities: The six elements defined, https://repository.jisc.ac.uk/6611/1/JFL0066F_DIGIGAP_MOD_IND_FRAME.PDF.
Khan. S, Chair. C, & Deen-Swarray, S. (2015). Taking the Microscope to ICT Gender Gaps in Sub-Saharan Africa. Communications Policy Research South Conference, Zanzibar, August 2016, https://re s e a rc h i c t a f r i c a . n e t / p u b l i c a t i o n s / C o n f e re n c e _ P u b l i c a t i o n s / 2 0 1 6 _ C h a i r _ D e e n -Swarray_Khand_Taking_a_microscope_to_ICT_gender_gaps_in_Africa_CPRsouth_Best_Paper.pdf.
Lwanga, S.and Lemeshow, S. (1991): Sample Size Determination in Health Studies – A Practical Manual, World Health Organisation, Geneva.
Milek, A., Stork, C. and Gillwald, A. (2011). Engendering communication: a perspective on ICT access and usage in Africa, Emerald Group Publishing Limited, Vol. 13 Issue: 3, pp.125 - 141, ISSN: 1463-6697.
de Lanerolle, I., Gillwald, A., Stork, C., and Calandro, E. (2014). Let Them Eat Movies: (How) Will Next-Generation Broadband DiffuseThroughAfrica?, in Broadband as a Video Platform, edited O'Neill, J., Noam, E. , Gerbarg, D., Springer, ISBN 978-3-319-03617-5.
Polo, L. and Martin, P. (2013). “Children’s digital literacy practices in unequal South African settings”. Tilburg University: Tilburg Papers in Culture Studies #60.
Rea, L. and Parker, R. (1997): Designing and Conducting Survey Research – A Comprehensive Guide, Jossey-Bass Publishers, San Francisco.
Rong Wang (undated)., Internet Use and the Building of Social Capital for Development: A Network Perspective, University of Southern California
Schmidt P. and Stork, C. (2008). Towards evidence-based ICT policy and regulation: e-Skills, Volume 1, Policy Paper 3, ISSN 2073-0845.
Sen (1992). Inequality Re-examined, Oxford: Clarendon Press
Stork, C. & Calandro, E. (2014). Internet gone mobile in Namibia, in ICT Pathways to Poverty Reduction, ISBN-13: 978-1853398155, http://www.amazon.com/Pathways-Poverty-Reduction-Edith-Ofwona/dp/1853398152.
Stork, C., Calandro, E. & Gamage, R. (2014). "The future of broadband in Africa", info, Vol. 16 Iss: 1, pp.76 - 93, https://www.emeraldinsight.com/doi/pdfplus/10.1108/info-10-2013-0055.
Stork, C., Esselaar, S. and Chair, C. (2016). OTT - threat or opportunity for African Telcos?, printed at first African ITS conference 10-11 March 2016, http://www.africa-its.org.
130
Stork, C., Esselaar, S. and Chair, C. (2017). OTT - threat or opportunity for African Telcos?, Telecommunications Policy, Volume 41 (2017), http://www.sciencedirect.com/science/article/pii/S0308596117302069.
Stork, C., Kapugama, N., & Samarajiva, R. (2018). Economic impacts of mobile telecom in rural areas in low- and lower-middle-income countries: Findings of a systematic review. Information Technologies & International Development (Special Section), 14, 191–208, http://itidjournal.org/index.php/itid/article/view/1485/596.
Thanki, R. (2012). The Economic Significance of Licence- Exempt Spectrum to the Future of the Internet, https://www.microsoft.com/en-us/research/uploads/prod/2016/02/spectrum-economic-significance-of-license-exempt-spectrum-report_thanki.pdf
Tuominen et al. (2005). Information Literacy as a Sociotechnical Practice. The University of Chicago Press.
UBOS (2020). The Uganda National Household Survey - UNHS 2019/2020, https://www.ubos.org/wp-content/uploads/publications/09_2021Uganda-National-Survey-Report-2019-2020.pdf.
UCC (2021). Market performance report 2021, https://www.ucc.co.ug/wp-content/uploads/2021/09/2Q21-MARKET-PERFOMANCE-REPORT-compressed.pdf.
UNESCO (2008): Towards Information Literacy Indicators, UNESCO Paris, Conceptual framework paper prepared by Ralph Catts and Jesus Lau.
UNHS (2020). Uganda National Household Survey 2019/2020. https://www.ubos.org/wp-content/uploads/publications/09_2021Uganda-National-Survey-Report-2019-2020.pdf.
UNSD (2005): Designing Household Surveys Samples: Practical Guidelines, United Nations, New York.
131
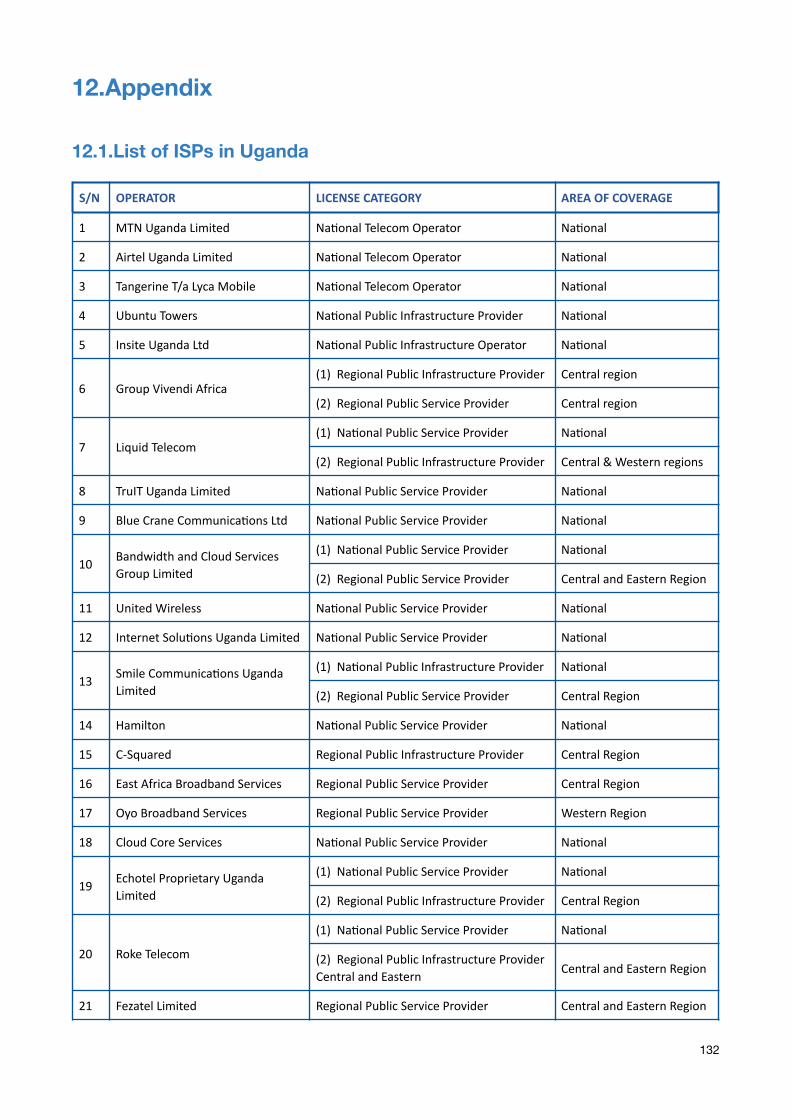
12.Appendix
12.1.List of ISPs in Uganda
S/N OPERATOR LICENSECATEGORY AREAOFCOVERAGE
1 MTNUgandaLimited NaKonalTelecomOperator NaKonal
2 AirtelUgandaLimited NaKonalTelecomOperator NaKonal
3 TangerineT/aLycaMobile NaKonalTelecomOperator NaKonal
4 UbuntuTowers NaKonalPublicInfrastructureProvider NaKonal
5 InsiteUgandaLtd NaKonalPublicInfrastructureOperator NaKonal
6 GroupVivendiAfrica(1)RegionalPublicInfrastructureProvider Centralregion
(2)RegionalPublicServiceProvider Centralregion
7 LiquidTelecom(1)NaKonalPublicServiceProvider NaKonal
(2)RegionalPublicInfrastructureProvider Central&Westernregions
8 TruITUgandaLimited NaKonalPublicServiceProvider NaKonal
9 BlueCraneCommunicaKonsLtd NaKonalPublicServiceProvider NaKonal
10 BandwidthandCloudServicesGroupLimited
(1)NaKonalPublicServiceProvider NaKonal
(2)RegionalPublicServiceProvider CentralandEasternRegion
11 UnitedWireless NaKonalPublicServiceProvider NaKonal
12 InternetSoluKonsUgandaLimited NaKonalPublicServiceProvider NaKonal
13 SmileCommunicaKonsUgandaLimited
(1)NaKonalPublicInfrastructureProvider NaKonal
(2)RegionalPublicServiceProvider CentralRegion
14 Hamilton NaKonalPublicServiceProvider NaKonal
15 C-Squared RegionalPublicInfrastructureProvider CentralRegion
16 EastAfricaBroadbandServices RegionalPublicServiceProvider CentralRegion
17 OyoBroadbandServices RegionalPublicServiceProvider WesternRegion
18 CloudCoreServices NaKonalPublicServiceProvider NaKonal
19 EchotelProprietaryUgandaLimited
(1)NaKonalPublicServiceProvider NaKonal
(2)RegionalPublicInfrastructureProvider CentralRegion
20 RokeTelecom
(1)NaKonalPublicServiceProvider NaKonal
(2)RegionalPublicInfrastructureProviderCentralandEastern CentralandEasternRegion
21 FezatelLimited RegionalPublicServiceProvider CentralandEasternRegion
132
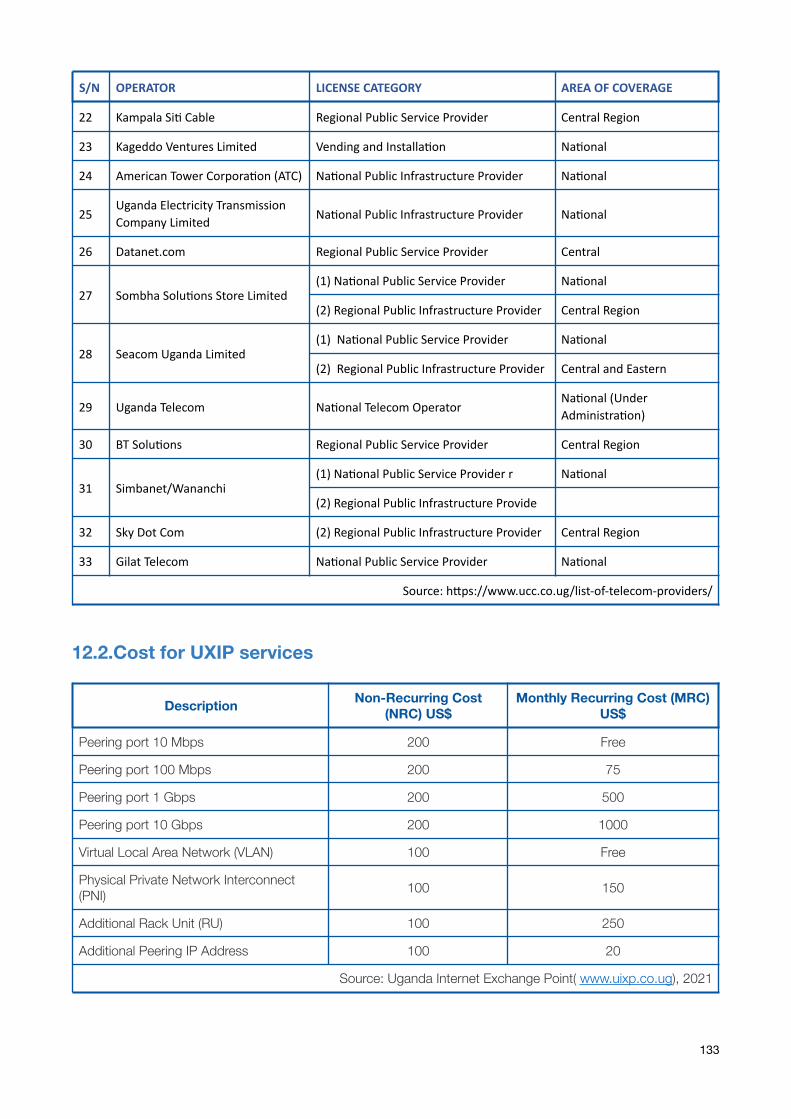
12.2.Cost for UXIP services
22 KampalaSiKCable RegionalPublicServiceProvider CentralRegion
23 KageddoVenturesLimited VendingandInstallaKon NaKonal
24 AmericanTowerCorporaKon(ATC) NaKonalPublicInfrastructureProvider NaKonal
25UgandaElectricityTransmissionCompanyLimited NaKonalPublicInfrastructureProvider NaKonal
26 Datanet.com RegionalPublicServiceProvider Central
27 SombhaSoluKonsStoreLimited(1)NaKonalPublicServiceProvider NaKonal
(2)RegionalPublicInfrastructureProvider CentralRegion
28 SeacomUgandaLimited(1)NaKonalPublicServiceProvider NaKonal
(2)RegionalPublicInfrastructureProvider CentralandEastern
29 UgandaTelecom NaKonalTelecomOperatorNaKonal(UnderAdministraKon)
30 BTSoluKons RegionalPublicServiceProvider CentralRegion
31 Simbanet/Wananchi(1)NaKonalPublicServiceProviderr NaKonal
(2)RegionalPublicInfrastructureProvide
32 SkyDotCom (2)RegionalPublicInfrastructureProvider CentralRegion
33 GilatTelecom NaKonalPublicServiceProvider NaKonal
Source:hhps://www.ucc.co.ug/list-of-telecom-providers/
S/N OPERATOR LICENSECATEGORY AREAOFCOVERAGE
Description Non-Recurring Cost (NRC) US$
Monthly Recurring Cost (MRC) US$
Peering port 10 Mbps 200 Free
Peering port 100 Mbps 200 75
Peering port 1 Gbps 200 500
Peering port 10 Gbps 200 1000
Virtual Local Area Network (VLAN) 100 Free
Physical Private Network Interconnect (PNI) 100 150
Additional Rack Unit (RU) 100 250
Additional Peering IP Address 100 20
Source: Uganda Internet Exchange Point( www.uixp.co.ug), 2021
133
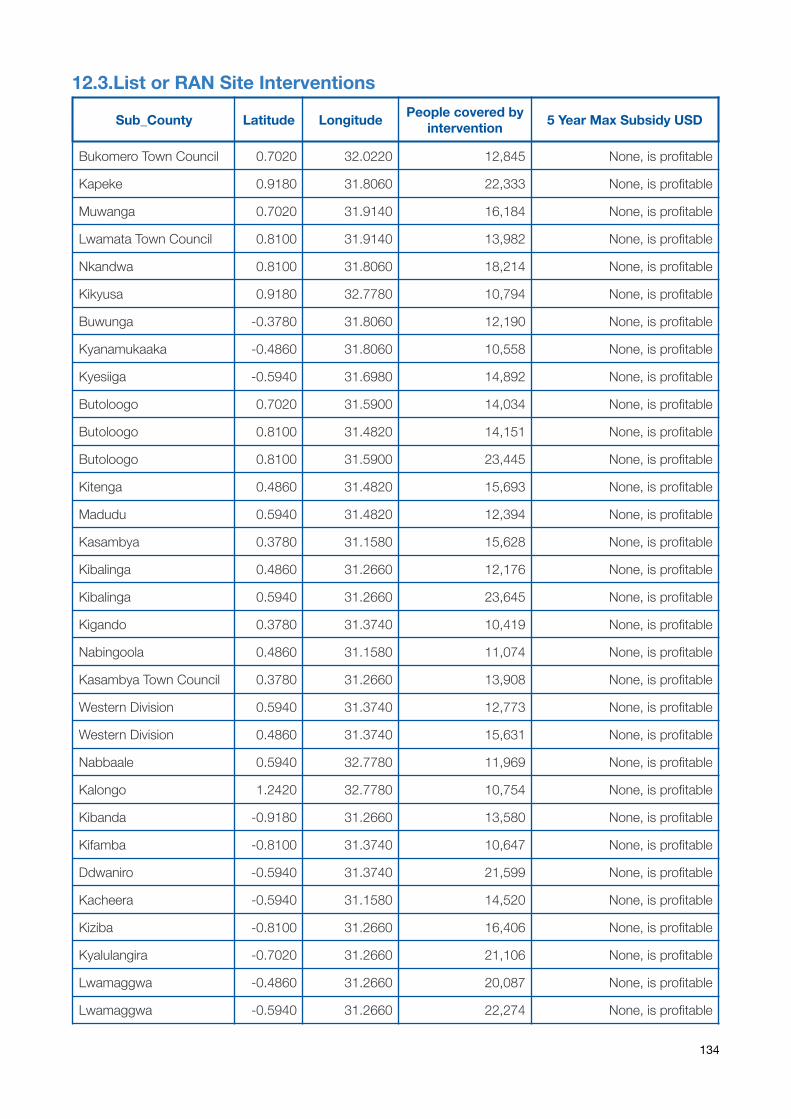
12.3.List or RAN Site Interventions
Sub_County Latitude Longitude People covered by intervention 5 Year Max Subsidy USD
Bukomero Town Council 0.7020 32.0220 12,845 None, is profitable
Kapeke 0.9180 31.8060 22,333 None, is profitable
Muwanga 0.7020 31.9140 16,184 None, is profitable
Lwamata Town Council 0.8100 31.9140 13,982 None, is profitable
Nkandwa 0.8100 31.8060 18,214 None, is profitable
Kikyusa 0.9180 32.7780 10,794 None, is profitable
Buwunga -0.3780 31.8060 12,190 None, is profitable
Kyanamukaaka -0.4860 31.8060 10,558 None, is profitable
Kyesiiga -0.5940 31.6980 14,892 None, is profitable
Butoloogo 0.7020 31.5900 14,034 None, is profitable
Butoloogo 0.8100 31.4820 14,151 None, is profitable
Butoloogo 0.8100 31.5900 23,445 None, is profitable
Kitenga 0.4860 31.4820 15,693 None, is profitable
Madudu 0.5940 31.4820 12,394 None, is profitable
Kasambya 0.3780 31.1580 15,628 None, is profitable
Kibalinga 0.4860 31.2660 12,176 None, is profitable
Kibalinga 0.5940 31.2660 23,645 None, is profitable
Kigando 0.3780 31.3740 10,419 None, is profitable
Nabingoola 0.4860 31.1580 11,074 None, is profitable
Kasambya Town Council 0.3780 31.2660 13,908 None, is profitable
Western Division 0.5940 31.3740 12,773 None, is profitable
Western Division 0.4860 31.3740 15,631 None, is profitable
Nabbaale 0.5940 32.7780 11,969 None, is profitable
Kalongo 1.2420 32.7780 10,754 None, is profitable
Kibanda -0.9180 31.2660 13,580 None, is profitable
Kifamba -0.8100 31.3740 10,647 None, is profitable
Ddwaniro -0.5940 31.3740 21,599 None, is profitable
Kacheera -0.5940 31.1580 14,520 None, is profitable
Kiziba -0.8100 31.2660 16,406 None, is profitable
Kyalulangira -0.7020 31.2660 21,106 None, is profitable
Lwamaggwa -0.4860 31.2660 20,087 None, is profitable
Lwamaggwa -0.5940 31.2660 22,274 None, is profitable
134
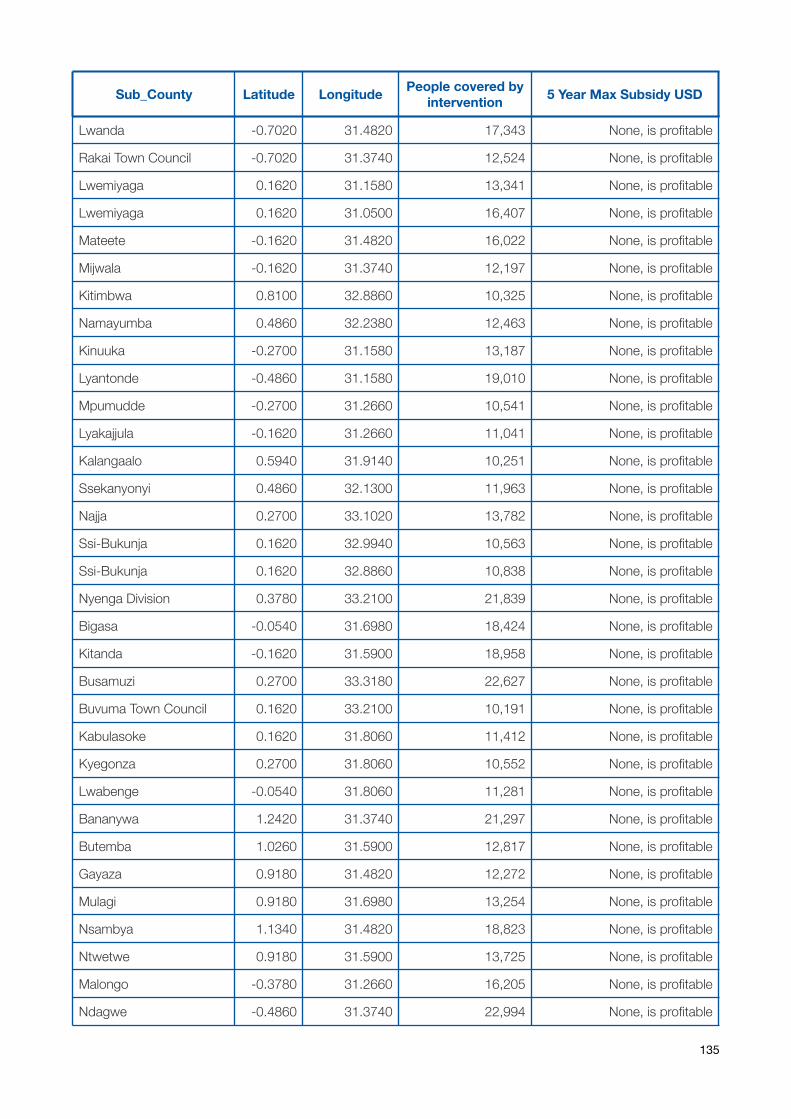
Lwanda -0.7020 31.4820 17,343 None, is profitable
Rakai Town Council -0.7020 31.3740 12,524 None, is profitable
Lwemiyaga 0.1620 31.1580 13,341 None, is profitable
Lwemiyaga 0.1620 31.0500 16,407 None, is profitable
Mateete -0.1620 31.4820 16,022 None, is profitable
Mijwala -0.1620 31.3740 12,197 None, is profitable
Kitimbwa 0.8100 32.8860 10,325 None, is profitable
Namayumba 0.4860 32.2380 12,463 None, is profitable
Kinuuka -0.2700 31.1580 13,187 None, is profitable
Lyantonde -0.4860 31.1580 19,010 None, is profitable
Mpumudde -0.2700 31.2660 10,541 None, is profitable
Lyakajjula -0.1620 31.2660 11,041 None, is profitable
Kalangaalo 0.5940 31.9140 10,251 None, is profitable
Ssekanyonyi 0.4860 32.1300 11,963 None, is profitable
Najja 0.2700 33.1020 13,782 None, is profitable
Ssi-Bukunja 0.1620 32.9940 10,563 None, is profitable
Ssi-Bukunja 0.1620 32.8860 10,838 None, is profitable
Nyenga Division 0.3780 33.2100 21,839 None, is profitable
Bigasa -0.0540 31.6980 18,424 None, is profitable
Kitanda -0.1620 31.5900 18,958 None, is profitable
Busamuzi 0.2700 33.3180 22,627 None, is profitable
Buvuma Town Council 0.1620 33.2100 10,191 None, is profitable
Kabulasoke 0.1620 31.8060 11,412 None, is profitable
Kyegonza 0.2700 31.8060 10,552 None, is profitable
Lwabenge -0.0540 31.8060 11,281 None, is profitable
Bananywa 1.2420 31.3740 21,297 None, is profitable
Butemba 1.0260 31.5900 12,817 None, is profitable
Gayaza 0.9180 31.4820 12,272 None, is profitable
Mulagi 0.9180 31.6980 13,254 None, is profitable
Nsambya 1.1340 31.4820 18,823 None, is profitable
Ntwetwe 0.9180 31.5900 13,725 None, is profitable
Malongo -0.3780 31.2660 16,205 None, is profitable
Ndagwe -0.4860 31.3740 22,994 None, is profitable
Sub_County Latitude Longitude People covered by intervention 5 Year Max Subsidy USD
135
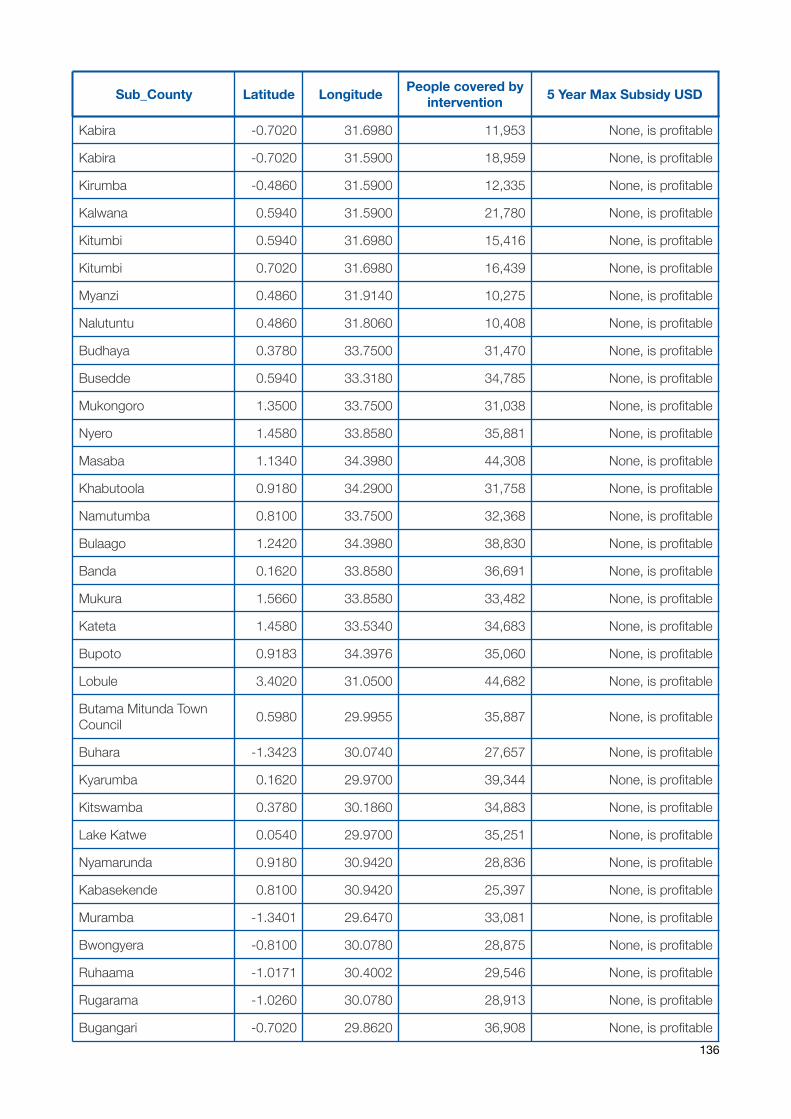
Kabira -0.7020 31.6980 11,953 None, is profitable
Kabira -0.7020 31.5900 18,959 None, is profitable
Kirumba -0.4860 31.5900 12,335 None, is profitable
Kalwana 0.5940 31.5900 21,780 None, is profitable
Kitumbi 0.5940 31.6980 15,416 None, is profitable
Kitumbi 0.7020 31.6980 16,439 None, is profitable
Myanzi 0.4860 31.9140 10,275 None, is profitable
Nalutuntu 0.4860 31.8060 10,408 None, is profitable
Budhaya 0.3780 33.7500 31,470 None, is profitable
Busedde 0.5940 33.3180 34,785 None, is profitable
Mukongoro 1.3500 33.7500 31,038 None, is profitable
Nyero 1.4580 33.8580 35,881 None, is profitable
Masaba 1.1340 34.3980 44,308 None, is profitable
Khabutoola 0.9180 34.2900 31,758 None, is profitable
Namutumba 0.8100 33.7500 32,368 None, is profitable
Bulaago 1.2420 34.3980 38,830 None, is profitable
Banda 0.1620 33.8580 36,691 None, is profitable
Mukura 1.5660 33.8580 33,482 None, is profitable
Kateta 1.4580 33.5340 34,683 None, is profitable
Bupoto 0.9183 34.3976 35,060 None, is profitable
Lobule 3.4020 31.0500 44,682 None, is profitable
Butama Mitunda Town Council 0.5980 29.9955 35,887 None, is profitable
Buhara -1.3423 30.0740 27,657 None, is profitable
Kyarumba 0.1620 29.9700 39,344 None, is profitable
Kitswamba 0.3780 30.1860 34,883 None, is profitable
Lake Katwe 0.0540 29.9700 35,251 None, is profitable
Nyamarunda 0.9180 30.9420 28,836 None, is profitable
Kabasekende 0.8100 30.9420 25,397 None, is profitable
Muramba -1.3401 29.6470 33,081 None, is profitable
Bwongyera -0.8100 30.0780 28,875 None, is profitable
Ruhaama -1.0171 30.4002 29,546 None, is profitable
Rugarama -1.0260 30.0780 28,913 None, is profitable
Bugangari -0.7020 29.8620 36,908 None, is profitable
Sub_County Latitude Longitude People covered by intervention 5 Year Max Subsidy USD
136
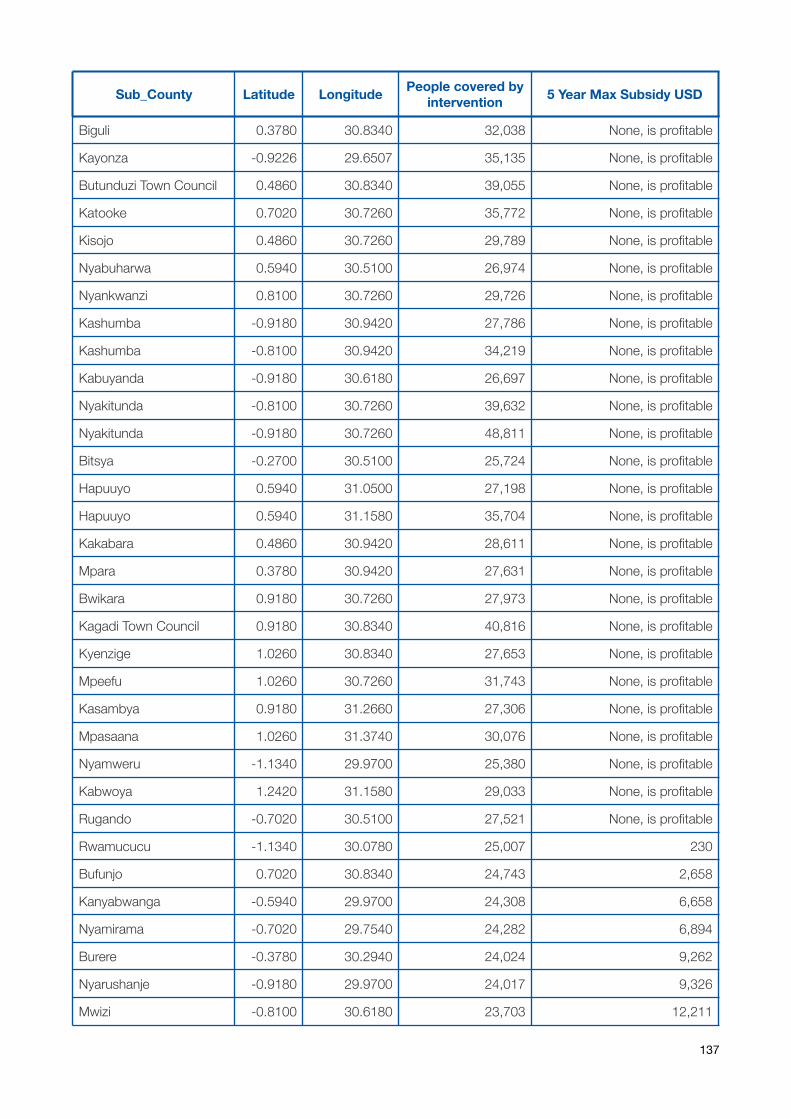
Biguli 0.3780 30.8340 32,038 None, is profitable
Kayonza -0.9226 29.6507 35,135 None, is profitable
Butunduzi Town Council 0.4860 30.8340 39,055 None, is profitable
Katooke 0.7020 30.7260 35,772 None, is profitable
Kisojo 0.4860 30.7260 29,789 None, is profitable
Nyabuharwa 0.5940 30.5100 26,974 None, is profitable
Nyankwanzi 0.8100 30.7260 29,726 None, is profitable
Kashumba -0.9180 30.9420 27,786 None, is profitable
Kashumba -0.8100 30.9420 34,219 None, is profitable
Kabuyanda -0.9180 30.6180 26,697 None, is profitable
Nyakitunda -0.8100 30.7260 39,632 None, is profitable
Nyakitunda -0.9180 30.7260 48,811 None, is profitable
Bitsya -0.2700 30.5100 25,724 None, is profitable
Hapuuyo 0.5940 31.0500 27,198 None, is profitable
Hapuuyo 0.5940 31.1580 35,704 None, is profitable
Kakabara 0.4860 30.9420 28,611 None, is profitable
Mpara 0.3780 30.9420 27,631 None, is profitable
Bwikara 0.9180 30.7260 27,973 None, is profitable
Kagadi Town Council 0.9180 30.8340 40,816 None, is profitable
Kyenzige 1.0260 30.8340 27,653 None, is profitable
Mpeefu 1.0260 30.7260 31,743 None, is profitable
Kasambya 0.9180 31.2660 27,306 None, is profitable
Mpasaana 1.0260 31.3740 30,076 None, is profitable
Nyamweru -1.1340 29.9700 25,380 None, is profitable
Kabwoya 1.2420 31.1580 29,033 None, is profitable
Rugando -0.7020 30.5100 27,521 None, is profitable
Rwamucucu -1.1340 30.0780 25,007 230
Bufunjo 0.7020 30.8340 24,743 2,658
Kanyabwanga -0.5940 29.9700 24,308 6,658
Nyamirama -0.7020 29.7540 24,282 6,894
Burere -0.3780 30.2940 24,024 9,262
Nyarushanje -0.9180 29.9700 24,017 9,326
Mwizi -0.8100 30.6180 23,703 12,211
Sub_County Latitude Longitude People covered by intervention 5 Year Max Subsidy USD
137
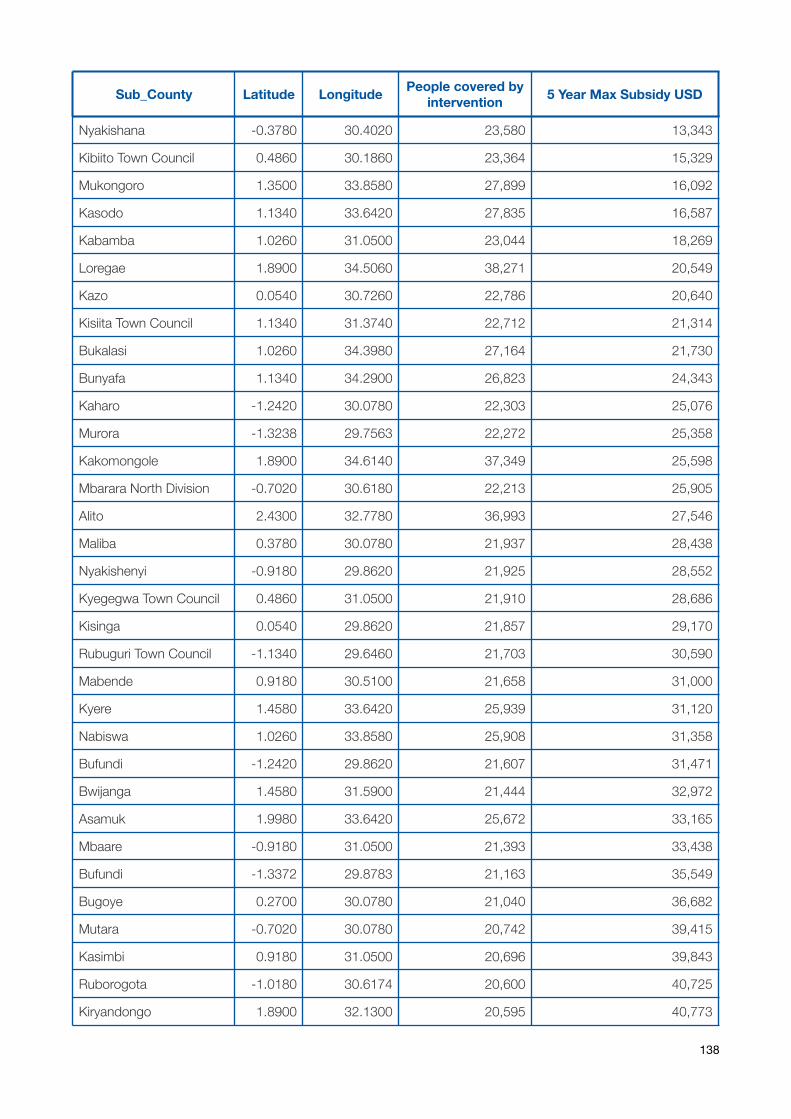
Nyakishana -0.3780 30.4020 23,580 13,343
Kibiito Town Council 0.4860 30.1860 23,364 15,329
Mukongoro 1.3500 33.8580 27,899 16,092
Kasodo 1.1340 33.6420 27,835 16,587
Kabamba 1.0260 31.0500 23,044 18,269
Loregae 1.8900 34.5060 38,271 20,549
Kazo 0.0540 30.7260 22,786 20,640
Kisiita Town Council 1.1340 31.3740 22,712 21,314
Bukalasi 1.0260 34.3980 27,164 21,730
Bunyafa 1.1340 34.2900 26,823 24,343
Kaharo -1.2420 30.0780 22,303 25,076
Murora -1.3238 29.7563 22,272 25,358
Kakomongole 1.8900 34.6140 37,349 25,598
Mbarara North Division -0.7020 30.6180 22,213 25,905
Alito 2.4300 32.7780 36,993 27,546
Maliba 0.3780 30.0780 21,937 28,438
Nyakishenyi -0.9180 29.8620 21,925 28,552
Kyegegwa Town Council 0.4860 31.0500 21,910 28,686
Kisinga 0.0540 29.8620 21,857 29,170
Rubuguri Town Council -1.1340 29.6460 21,703 30,590
Mabende 0.9180 30.5100 21,658 31,000
Kyere 1.4580 33.6420 25,939 31,120
Nabiswa 1.0260 33.8580 25,908 31,358
Bufundi -1.2420 29.8620 21,607 31,471
Bwijanga 1.4580 31.5900 21,444 32,972
Asamuk 1.9980 33.6420 25,672 33,165
Mbaare -0.9180 31.0500 21,393 33,438
Bufundi -1.3372 29.8783 21,163 35,549
Bugoye 0.2700 30.0780 21,040 36,682
Mutara -0.7020 30.0780 20,742 39,415
Kasimbi 0.9180 31.0500 20,696 39,843
Ruborogota -1.0180 30.6174 20,600 40,725
Kiryandongo 1.8900 32.1300 20,595 40,773
Sub_County Latitude Longitude People covered by intervention 5 Year Max Subsidy USD
138
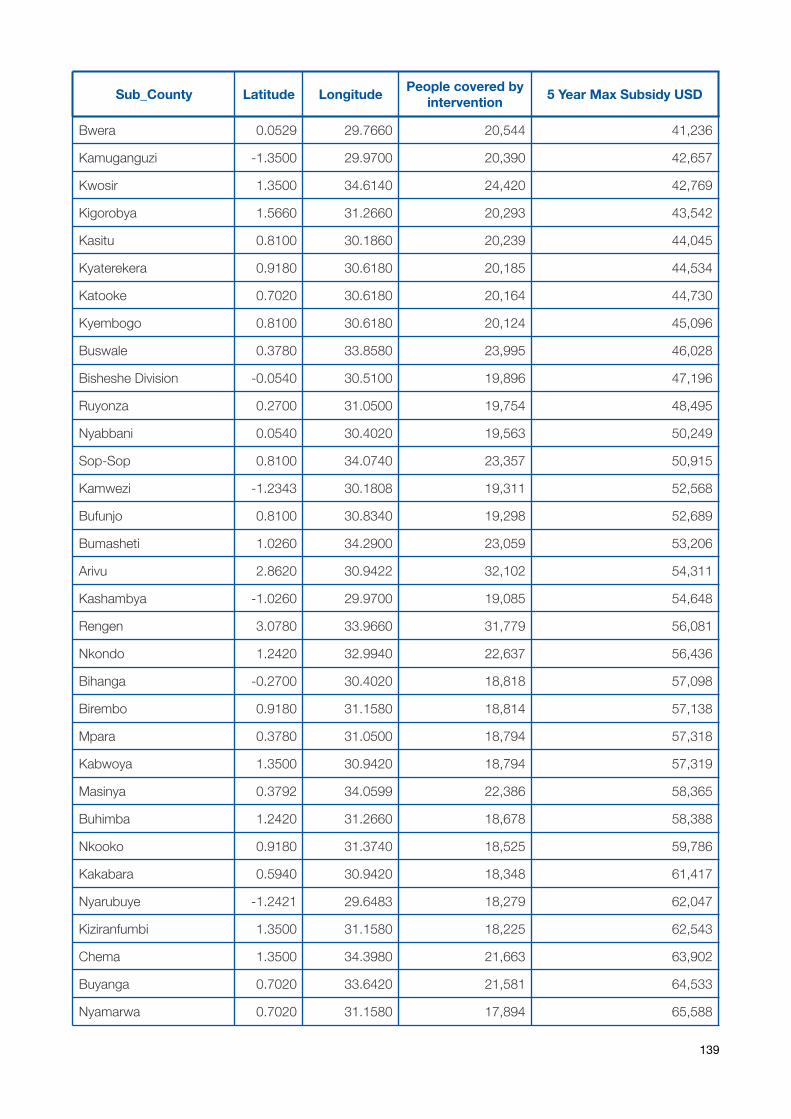
Bwera 0.0529 29.7660 20,544 41,236
Kamuganguzi -1.3500 29.9700 20,390 42,657
Kwosir 1.3500 34.6140 24,420 42,769
Kigorobya 1.5660 31.2660 20,293 43,542
Kasitu 0.8100 30.1860 20,239 44,045
Kyaterekera 0.9180 30.6180 20,185 44,534
Katooke 0.7020 30.6180 20,164 44,730
Kyembogo 0.8100 30.6180 20,124 45,096
Buswale 0.3780 33.8580 23,995 46,028
Bisheshe Division -0.0540 30.5100 19,896 47,196
Ruyonza 0.2700 31.0500 19,754 48,495
Nyabbani 0.0540 30.4020 19,563 50,249
Sop-Sop 0.8100 34.0740 23,357 50,915
Kamwezi -1.2343 30.1808 19,311 52,568
Bufunjo 0.8100 30.8340 19,298 52,689
Bumasheti 1.0260 34.2900 23,059 53,206
Arivu 2.8620 30.9422 32,102 54,311
Kashambya -1.0260 29.9700 19,085 54,648
Rengen 3.0780 33.9660 31,779 56,081
Nkondo 1.2420 32.9940 22,637 56,436
Bihanga -0.2700 30.4020 18,818 57,098
Birembo 0.9180 31.1580 18,814 57,138
Mpara 0.3780 31.0500 18,794 57,318
Kabwoya 1.3500 30.9420 18,794 57,319
Masinya 0.3792 34.0599 22,386 58,365
Buhimba 1.2420 31.2660 18,678 58,388
Nkooko 0.9180 31.3740 18,525 59,786
Kakabara 0.5940 30.9420 18,348 61,417
Nyarubuye -1.2421 29.6483 18,279 62,047
Kiziranfumbi 1.3500 31.1580 18,225 62,543
Chema 1.3500 34.3980 21,663 63,902
Buyanga 0.7020 33.6420 21,581 64,533
Nyamarwa 0.7020 31.1580 17,894 65,588
Sub_County Latitude Longitude People covered by intervention 5 Year Max Subsidy USD
139
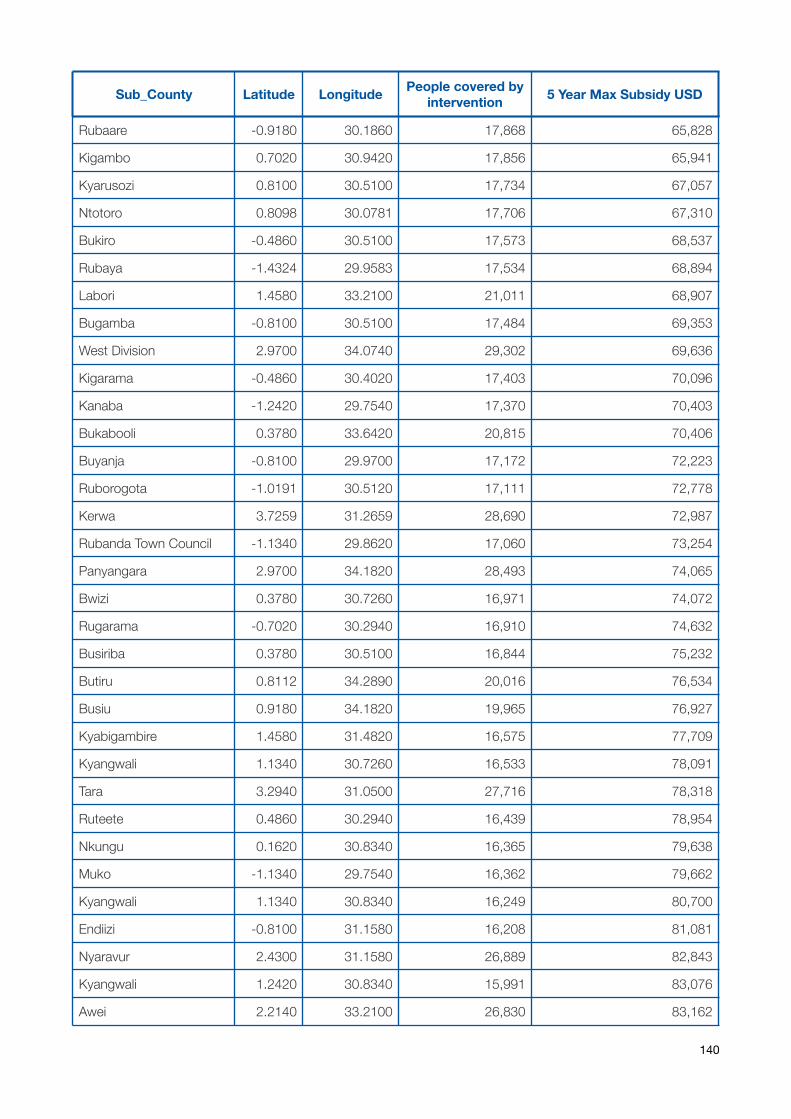
Rubaare -0.9180 30.1860 17,868 65,828
Kigambo 0.7020 30.9420 17,856 65,941
Kyarusozi 0.8100 30.5100 17,734 67,057
Ntotoro 0.8098 30.0781 17,706 67,310
Bukiro -0.4860 30.5100 17,573 68,537
Rubaya -1.4324 29.9583 17,534 68,894
Labori 1.4580 33.2100 21,011 68,907
Bugamba -0.8100 30.5100 17,484 69,353
West Division 2.9700 34.0740 29,302 69,636
Kigarama -0.4860 30.4020 17,403 70,096
Kanaba -1.2420 29.7540 17,370 70,403
Bukabooli 0.3780 33.6420 20,815 70,406
Buyanja -0.8100 29.9700 17,172 72,223
Ruborogota -1.0191 30.5120 17,111 72,778
Kerwa 3.7259 31.2659 28,690 72,987
Rubanda Town Council -1.1340 29.8620 17,060 73,254
Panyangara 2.9700 34.1820 28,493 74,065
Bwizi 0.3780 30.7260 16,971 74,072
Rugarama -0.7020 30.2940 16,910 74,632
Busiriba 0.3780 30.5100 16,844 75,232
Butiru 0.8112 34.2890 20,016 76,534
Busiu 0.9180 34.1820 19,965 76,927
Kyabigambire 1.4580 31.4820 16,575 77,709
Kyangwali 1.1340 30.7260 16,533 78,091
Tara 3.2940 31.0500 27,716 78,318
Ruteete 0.4860 30.2940 16,439 78,954
Nkungu 0.1620 30.8340 16,365 79,638
Muko -1.1340 29.7540 16,362 79,662
Kyangwali 1.1340 30.8340 16,249 80,700
Endiizi -0.8100 31.1580 16,208 81,081
Nyaravur 2.4300 31.1580 26,889 82,843
Kyangwali 1.2420 30.8340 15,991 83,076
Awei 2.2140 33.2100 26,830 83,162
Sub_County Latitude Longitude People covered by intervention 5 Year Max Subsidy USD
140
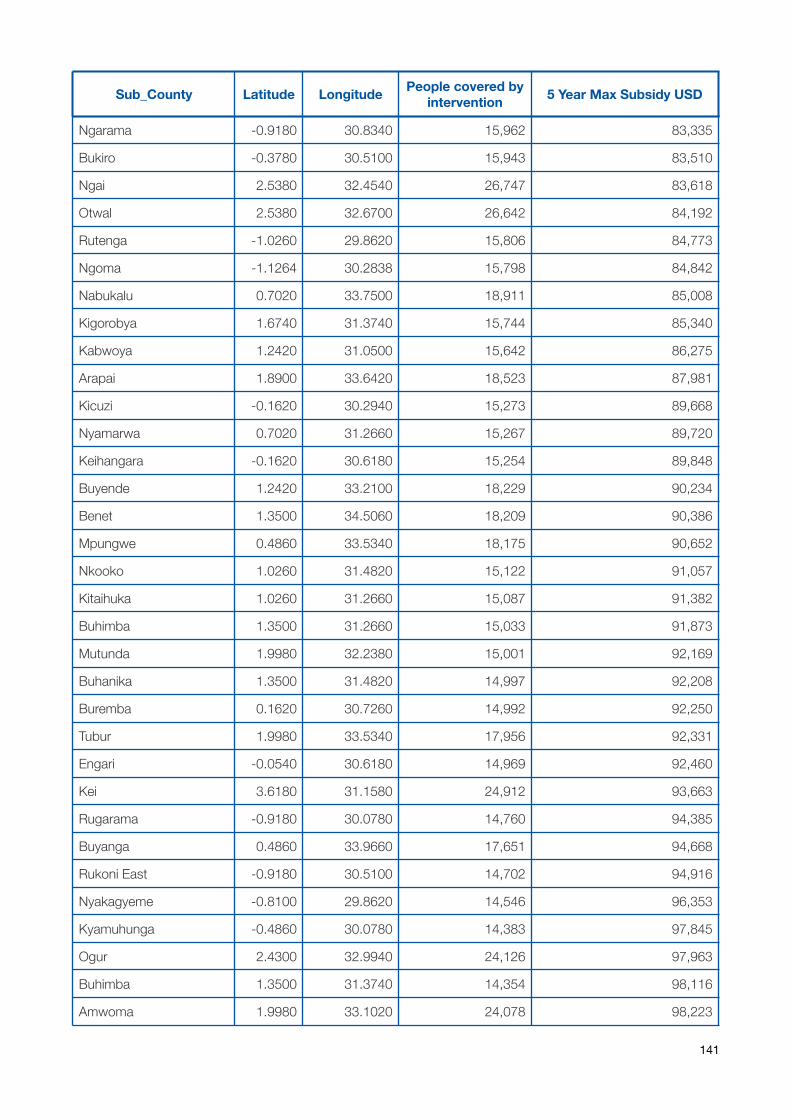
Ngarama -0.9180 30.8340 15,962 83,335
Bukiro -0.3780 30.5100 15,943 83,510
Ngai 2.5380 32.4540 26,747 83,618
Otwal 2.5380 32.6700 26,642 84,192
Rutenga -1.0260 29.8620 15,806 84,773
Ngoma -1.1264 30.2838 15,798 84,842
Nabukalu 0.7020 33.7500 18,911 85,008
Kigorobya 1.6740 31.3740 15,744 85,340
Kabwoya 1.2420 31.0500 15,642 86,275
Arapai 1.8900 33.6420 18,523 87,981
Kicuzi -0.1620 30.2940 15,273 89,668
Nyamarwa 0.7020 31.2660 15,267 89,720
Keihangara -0.1620 30.6180 15,254 89,848
Buyende 1.2420 33.2100 18,229 90,234
Benet 1.3500 34.5060 18,209 90,386
Mpungwe 0.4860 33.5340 18,175 90,652
Nkooko 1.0260 31.4820 15,122 91,057
Kitaihuka 1.0260 31.2660 15,087 91,382
Buhimba 1.3500 31.2660 15,033 91,873
Mutunda 1.9980 32.2380 15,001 92,169
Buhanika 1.3500 31.4820 14,997 92,208
Buremba 0.1620 30.7260 14,992 92,250
Tubur 1.9980 33.5340 17,956 92,331
Engari -0.0540 30.6180 14,969 92,460
Kei 3.6180 31.1580 24,912 93,663
Rugarama -0.9180 30.0780 14,760 94,385
Buyanga 0.4860 33.9660 17,651 94,668
Rukoni East -0.9180 30.5100 14,702 94,916
Nyakagyeme -0.8100 29.8620 14,546 96,353
Kyamuhunga -0.4860 30.0780 14,383 97,845
Ogur 2.4300 32.9940 24,126 97,963
Buhimba 1.3500 31.3740 14,354 98,116
Amwoma 1.9980 33.1020 24,078 98,223
Sub_County Latitude Longitude People covered by intervention 5 Year Max Subsidy USD
141
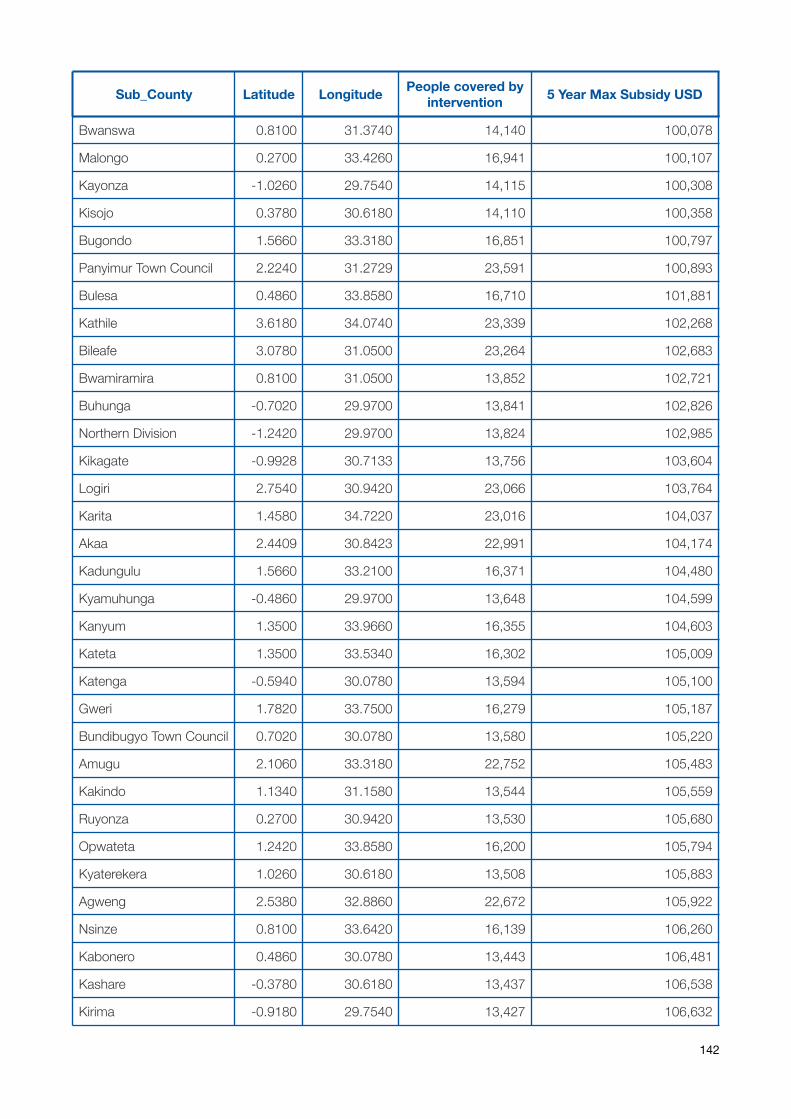
Bwanswa 0.8100 31.3740 14,140 100,078
Malongo 0.2700 33.4260 16,941 100,107
Kayonza -1.0260 29.7540 14,115 100,308
Kisojo 0.3780 30.6180 14,110 100,358
Bugondo 1.5660 33.3180 16,851 100,797
Panyimur Town Council 2.2240 31.2729 23,591 100,893
Bulesa 0.4860 33.8580 16,710 101,881
Kathile 3.6180 34.0740 23,339 102,268
Bileafe 3.0780 31.0500 23,264 102,683
Bwamiramira 0.8100 31.0500 13,852 102,721
Buhunga -0.7020 29.9700 13,841 102,826
Northern Division -1.2420 29.9700 13,824 102,985
Kikagate -0.9928 30.7133 13,756 103,604
Logiri 2.7540 30.9420 23,066 103,764
Karita 1.4580 34.7220 23,016 104,037
Akaa 2.4409 30.8423 22,991 104,174
Kadungulu 1.5660 33.2100 16,371 104,480
Kyamuhunga -0.4860 29.9700 13,648 104,599
Kanyum 1.3500 33.9660 16,355 104,603
Kateta 1.3500 33.5340 16,302 105,009
Katenga -0.5940 30.0780 13,594 105,100
Gweri 1.7820 33.7500 16,279 105,187
Bundibugyo Town Council 0.7020 30.0780 13,580 105,220
Amugu 2.1060 33.3180 22,752 105,483
Kakindo 1.1340 31.1580 13,544 105,559
Ruyonza 0.2700 30.9420 13,530 105,680
Opwateta 1.2420 33.8580 16,200 105,794
Kyaterekera 1.0260 30.6180 13,508 105,883
Agweng 2.5380 32.8860 22,672 105,922
Nsinze 0.8100 33.6420 16,139 106,260
Kabonero 0.4860 30.0780 13,443 106,481
Kashare -0.3780 30.6180 13,437 106,538
Kirima -0.9180 29.7540 13,427 106,632
Sub_County Latitude Longitude People covered by intervention 5 Year Max Subsidy USD
142
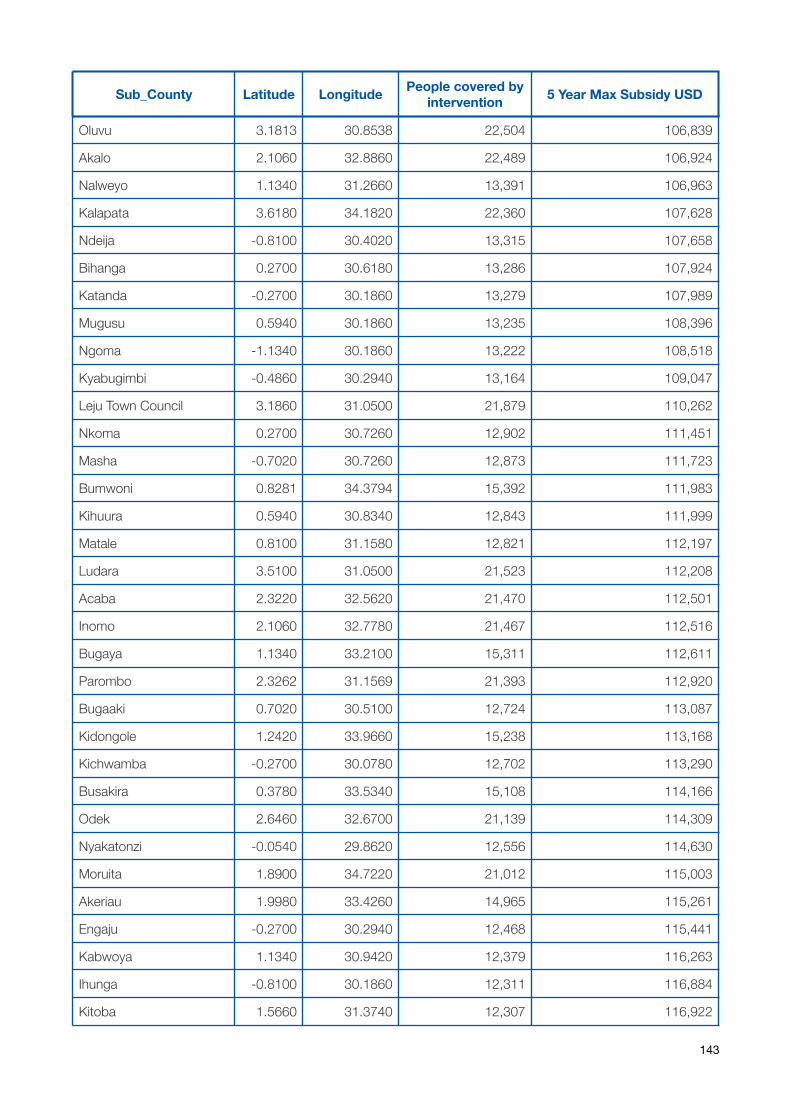
Oluvu 3.1813 30.8538 22,504 106,839
Akalo 2.1060 32.8860 22,489 106,924
Nalweyo 1.1340 31.2660 13,391 106,963
Kalapata 3.6180 34.1820 22,360 107,628
Ndeija -0.8100 30.4020 13,315 107,658
Bihanga 0.2700 30.6180 13,286 107,924
Katanda -0.2700 30.1860 13,279 107,989
Mugusu 0.5940 30.1860 13,235 108,396
Ngoma -1.1340 30.1860 13,222 108,518
Kyabugimbi -0.4860 30.2940 13,164 109,047
Leju Town Council 3.1860 31.0500 21,879 110,262
Nkoma 0.2700 30.7260 12,902 111,451
Masha -0.7020 30.7260 12,873 111,723
Bumwoni 0.8281 34.3794 15,392 111,983
Kihuura 0.5940 30.8340 12,843 111,999
Matale 0.8100 31.1580 12,821 112,197
Ludara 3.5100 31.0500 21,523 112,208
Acaba 2.3220 32.5620 21,470 112,501
Inomo 2.1060 32.7780 21,467 112,516
Bugaya 1.1340 33.2100 15,311 112,611
Parombo 2.3262 31.1569 21,393 112,920
Bugaaki 0.7020 30.5100 12,724 113,087
Kidongole 1.2420 33.9660 15,238 113,168
Kichwamba -0.2700 30.0780 12,702 113,290
Busakira 0.3780 33.5340 15,108 114,166
Odek 2.6460 32.6700 21,139 114,309
Nyakatonzi -0.0540 29.8620 12,556 114,630
Moruita 1.8900 34.7220 21,012 115,003
Akeriau 1.9980 33.4260 14,965 115,261
Engaju -0.2700 30.2940 12,468 115,441
Kabwoya 1.1340 30.9420 12,379 116,263
Ihunga -0.8100 30.1860 12,311 116,884
Kitoba 1.5660 31.3740 12,307 116,922
Sub_County Latitude Longitude People covered by intervention 5 Year Max Subsidy USD
143
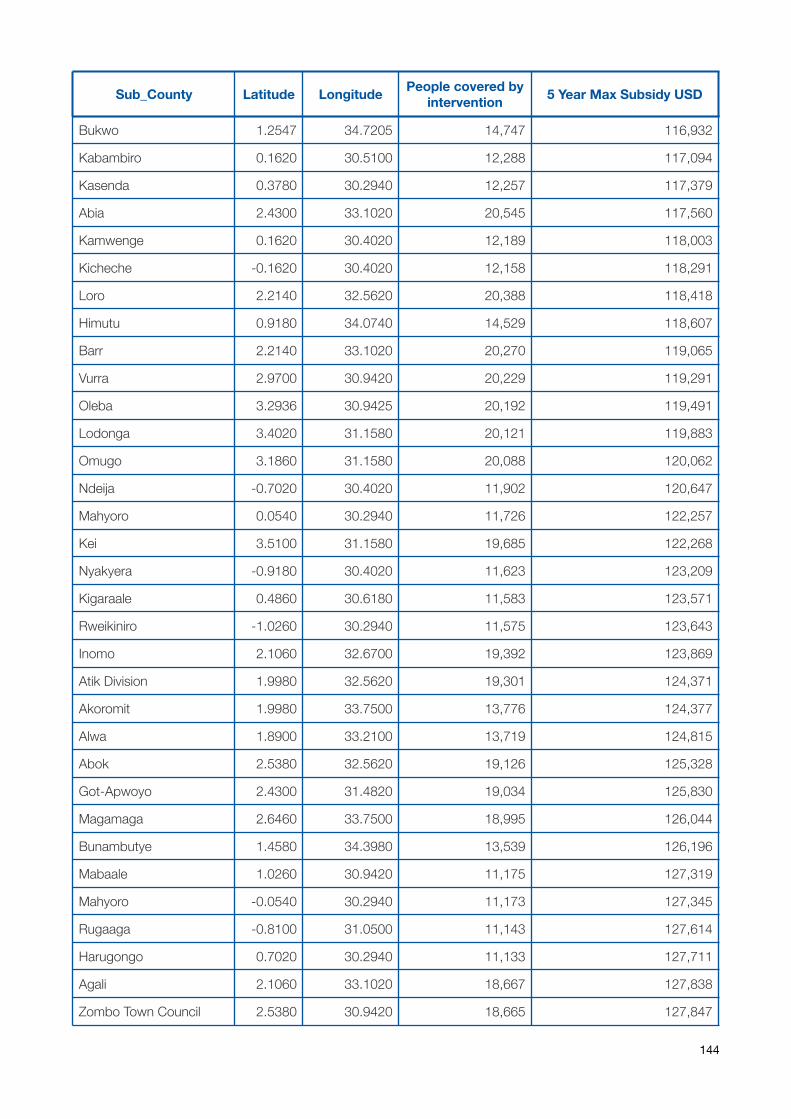
Bukwo 1.2547 34.7205 14,747 116,932
Kabambiro 0.1620 30.5100 12,288 117,094
Kasenda 0.3780 30.2940 12,257 117,379
Abia 2.4300 33.1020 20,545 117,560
Kamwenge 0.1620 30.4020 12,189 118,003
Kicheche -0.1620 30.4020 12,158 118,291
Loro 2.2140 32.5620 20,388 118,418
Himutu 0.9180 34.0740 14,529 118,607
Barr 2.2140 33.1020 20,270 119,065
Vurra 2.9700 30.9420 20,229 119,291
Oleba 3.2936 30.9425 20,192 119,491
Lodonga 3.4020 31.1580 20,121 119,883
Omugo 3.1860 31.1580 20,088 120,062
Ndeija -0.7020 30.4020 11,902 120,647
Mahyoro 0.0540 30.2940 11,726 122,257
Kei 3.5100 31.1580 19,685 122,268
Nyakyera -0.9180 30.4020 11,623 123,209
Kigaraale 0.4860 30.6180 11,583 123,571
Rweikiniro -1.0260 30.2940 11,575 123,643
Inomo 2.1060 32.6700 19,392 123,869
Atik Division 1.9980 32.5620 19,301 124,371
Akoromit 1.9980 33.7500 13,776 124,377
Alwa 1.8900 33.2100 13,719 124,815
Abok 2.5380 32.5620 19,126 125,328
Got-Apwoyo 2.4300 31.4820 19,034 125,830
Magamaga 2.6460 33.7500 18,995 126,044
Bunambutye 1.4580 34.3980 13,539 126,196
Mabaale 1.0260 30.9420 11,175 127,319
Mahyoro -0.0540 30.2940 11,173 127,345
Rugaaga -0.8100 31.0500 11,143 127,614
Harugongo 0.7020 30.2940 11,133 127,711
Agali 2.1060 33.1020 18,667 127,838
Zombo Town Council 2.5380 30.9420 18,665 127,847
Sub_County Latitude Longitude People covered by intervention 5 Year Max Subsidy USD
144
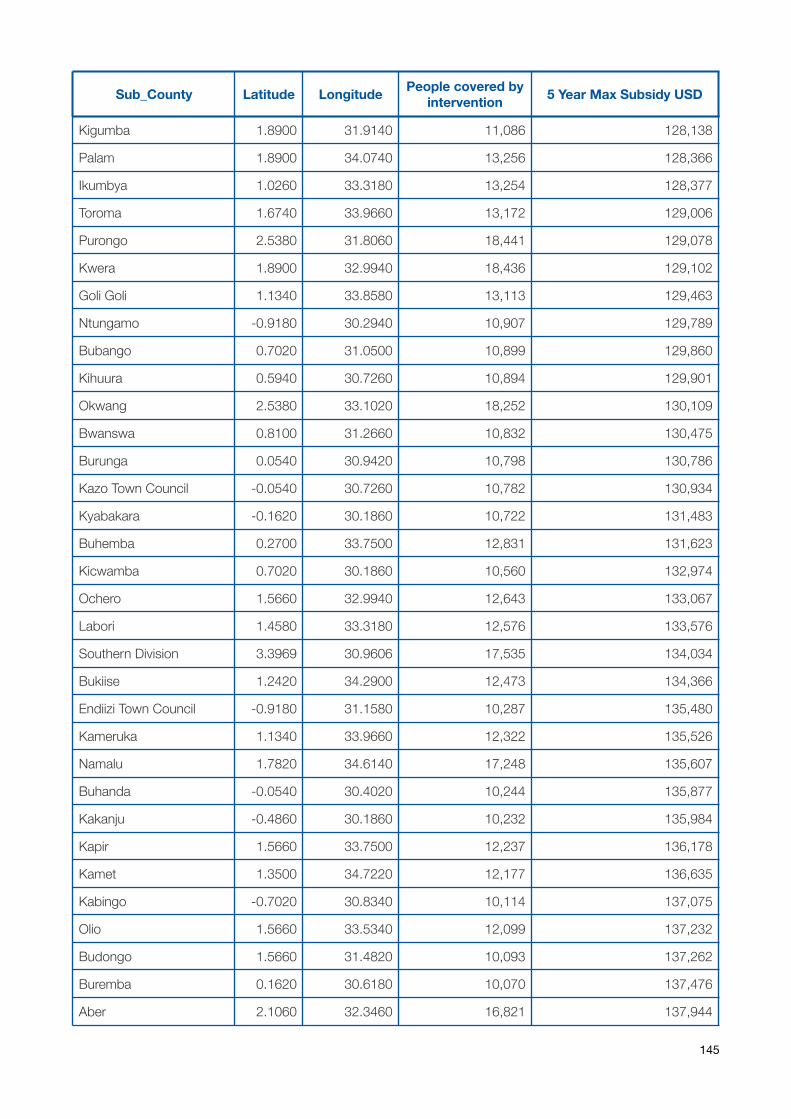
Kigumba 1.8900 31.9140 11,086 128,138
Palam 1.8900 34.0740 13,256 128,366
Ikumbya 1.0260 33.3180 13,254 128,377
Toroma 1.6740 33.9660 13,172 129,006
Purongo 2.5380 31.8060 18,441 129,078
Kwera 1.8900 32.9940 18,436 129,102
Goli Goli 1.1340 33.8580 13,113 129,463
Ntungamo -0.9180 30.2940 10,907 129,789
Bubango 0.7020 31.0500 10,899 129,860
Kihuura 0.5940 30.7260 10,894 129,901
Okwang 2.5380 33.1020 18,252 130,109
Bwanswa 0.8100 31.2660 10,832 130,475
Burunga 0.0540 30.9420 10,798 130,786
Kazo Town Council -0.0540 30.7260 10,782 130,934
Kyabakara -0.1620 30.1860 10,722 131,483
Buhemba 0.2700 33.7500 12,831 131,623
Kicwamba 0.7020 30.1860 10,560 132,974
Ochero 1.5660 32.9940 12,643 133,067
Labori 1.4580 33.3180 12,576 133,576
Southern Division 3.3969 30.9606 17,535 134,034
Bukiise 1.2420 34.2900 12,473 134,366
Endiizi Town Council -0.9180 31.1580 10,287 135,480
Kameruka 1.1340 33.9660 12,322 135,526
Namalu 1.7820 34.6140 17,248 135,607
Buhanda -0.0540 30.4020 10,244 135,877
Kakanju -0.4860 30.1860 10,232 135,984
Kapir 1.5660 33.7500 12,237 136,178
Kamet 1.3500 34.7220 12,177 136,635
Kabingo -0.7020 30.8340 10,114 137,075
Olio 1.5660 33.5340 12,099 137,232
Budongo 1.5660 31.4820 10,093 137,262
Buremba 0.1620 30.6180 10,070 137,476
Aber 2.1060 32.3460 16,821 137,944
Sub_County Latitude Longitude People covered by intervention 5 Year Max Subsidy USD
145

Kuluba 3.6087 30.9600 16,789 138,118
Buwunga 0.4860 33.6420 11,963 138,276
Aliba 3.1860 31.4820 16,694 138,639
Ayivu Division 3.0753 30.8394 16,643 138,914
Sigulu Island 0.1620 33.7500 11,875 138,956
Awei 2.1060 33.2100 16,623 139,027
Imanyiro 0.4860 33.4260 11,660 140,597
Alango 2.4300 33.2100 16,269 140,964
Chawente 1.8900 32.6700 16,155 141,585
Uleppi 2.7540 31.0500 16,129 141,727
Koch-Goma 2.6460 32.0220 16,019 142,331
Magoro 1.6740 34.0740 11,434 142,334
Kaptererwo 1.2628 34.7991 11,383 142,721
Bukedea 1.3500 34.0740 11,336 143,085
Omodoi 1.7820 33.9660 11,325 143,168
Kachumbala 1.2420 34.0740 11,291 143,432
Kijomoro 3.1860 30.9420 15,709 144,027
Willa 2.1060 33.6420 11,144 144,560
Lorengedwat 2.4300 34.6140 15,532 144,996
Magamaga 2.7540 33.7500 15,421 145,606
Odek 2.6460 32.7780 15,343 146,029
Aleka 2.5380 32.7780 15,335 146,075
Lapono 2.9700 33.4260 15,249 146,547
Apapai 1.8900 33.4260 10,809 147,126
Akisim 1.2420 33.7500 10,803 147,168
Ongino 1.5660 34.0740 10,787 147,292
Zeu 2.5380 30.8340 15,098 147,373
Lungulu 2.7540 31.9140 15,063 147,561
Kapelebyong 2.3220 33.8580 10,734 147,703
Masaba 0.3780 33.9660 10,725 147,771
Minakulu 2.4300 32.3460 15,004 147,888
Koch-Goma 2.5380 32.0220 14,898 148,465
Bukatube 0.3780 33.3180 10,631 148,494
Sub_County Latitude Longitude People covered by intervention 5 Year Max Subsidy USD
146
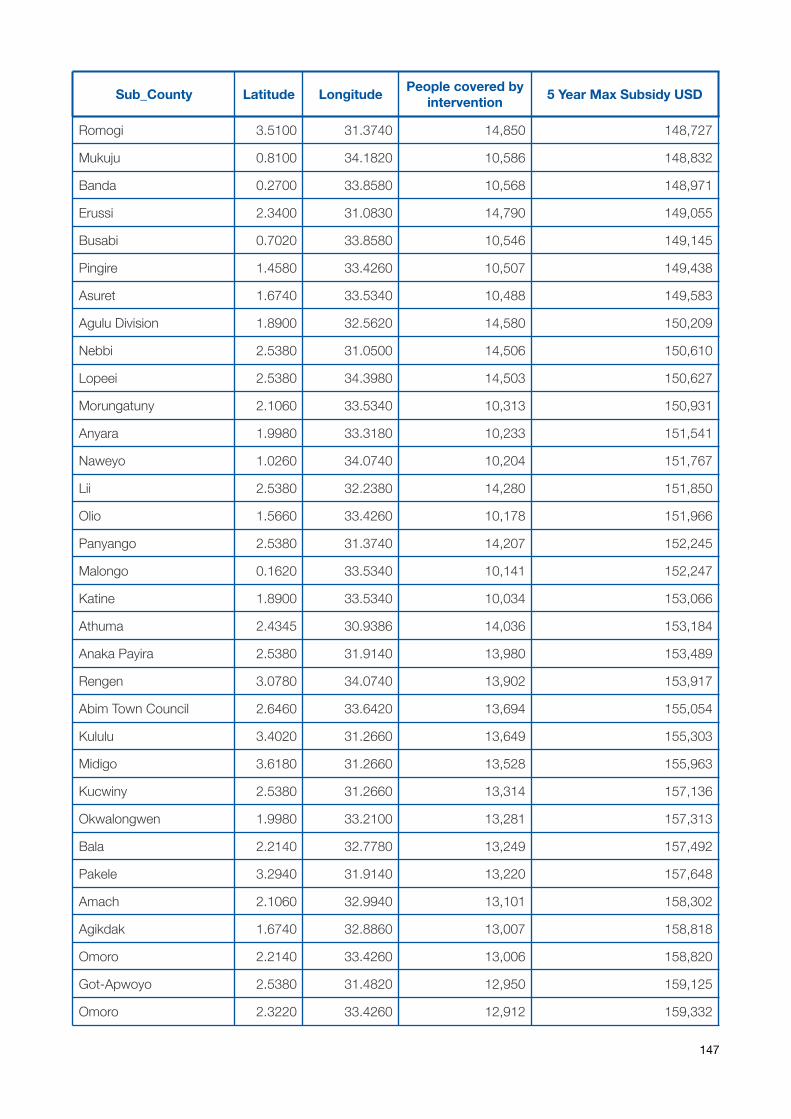
Romogi 3.5100 31.3740 14,850 148,727
Mukuju 0.8100 34.1820 10,586 148,832
Banda 0.2700 33.8580 10,568 148,971
Erussi 2.3400 31.0830 14,790 149,055
Busabi 0.7020 33.8580 10,546 149,145
Pingire 1.4580 33.4260 10,507 149,438
Asuret 1.6740 33.5340 10,488 149,583
Agulu Division 1.8900 32.5620 14,580 150,209
Nebbi 2.5380 31.0500 14,506 150,610
Lopeei 2.5380 34.3980 14,503 150,627
Morungatuny 2.1060 33.5340 10,313 150,931
Anyara 1.9980 33.3180 10,233 151,541
Naweyo 1.0260 34.0740 10,204 151,767
Lii 2.5380 32.2380 14,280 151,850
Olio 1.5660 33.4260 10,178 151,966
Panyango 2.5380 31.3740 14,207 152,245
Malongo 0.1620 33.5340 10,141 152,247
Katine 1.8900 33.5340 10,034 153,066
Athuma 2.4345 30.9386 14,036 153,184
Anaka Payira 2.5380 31.9140 13,980 153,489
Rengen 3.0780 34.0740 13,902 153,917
Abim Town Council 2.6460 33.6420 13,694 155,054
Kululu 3.4020 31.2660 13,649 155,303
Midigo 3.6180 31.2660 13,528 155,963
Kucwiny 2.5380 31.2660 13,314 157,136
Okwalongwen 1.9980 33.2100 13,281 157,313
Bala 2.2140 32.7780 13,249 157,492
Pakele 3.2940 31.9140 13,220 157,648
Amach 2.1060 32.9940 13,101 158,302
Agikdak 1.6740 32.8860 13,007 158,818
Omoro 2.2140 33.4260 13,006 158,820
Got-Apwoyo 2.5380 31.4820 12,950 159,125
Omoro 2.3220 33.4260 12,912 159,332
Sub_County Latitude Longitude People covered by intervention 5 Year Max Subsidy USD
147
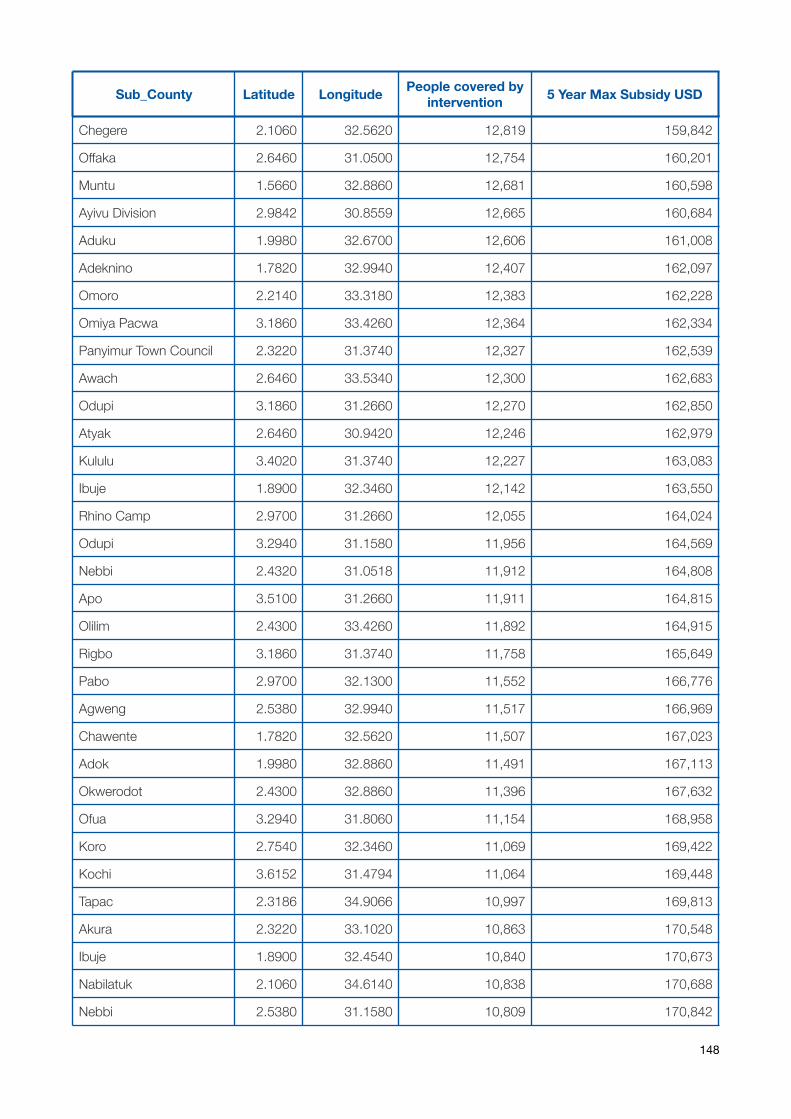
Chegere 2.1060 32.5620 12,819 159,842
Offaka 2.6460 31.0500 12,754 160,201
Muntu 1.5660 32.8860 12,681 160,598
Ayivu Division 2.9842 30.8559 12,665 160,684
Aduku 1.9980 32.6700 12,606 161,008
Adeknino 1.7820 32.9940 12,407 162,097
Omoro 2.2140 33.3180 12,383 162,228
Omiya Pacwa 3.1860 33.4260 12,364 162,334
Panyimur Town Council 2.3220 31.3740 12,327 162,539
Awach 2.6460 33.5340 12,300 162,683
Odupi 3.1860 31.2660 12,270 162,850
Atyak 2.6460 30.9420 12,246 162,979
Kululu 3.4020 31.3740 12,227 163,083
Ibuje 1.8900 32.3460 12,142 163,550
Rhino Camp 2.9700 31.2660 12,055 164,024
Odupi 3.2940 31.1580 11,956 164,569
Nebbi 2.4320 31.0518 11,912 164,808
Apo 3.5100 31.2660 11,911 164,815
Olilim 2.4300 33.4260 11,892 164,915
Rigbo 3.1860 31.3740 11,758 165,649
Pabo 2.9700 32.1300 11,552 166,776
Agweng 2.5380 32.9940 11,517 166,969
Chawente 1.7820 32.5620 11,507 167,023
Adok 1.9980 32.8860 11,491 167,113
Okwerodot 2.4300 32.8860 11,396 167,632
Ofua 3.2940 31.8060 11,154 168,958
Koro 2.7540 32.3460 11,069 169,422
Kochi 3.6152 31.4794 11,064 169,448
Tapac 2.3186 34.9066 10,997 169,813
Akura 2.3220 33.1020 10,863 170,548
Ibuje 1.8900 32.4540 10,840 170,673
Nabilatuk 2.1060 34.6140 10,838 170,688
Nebbi 2.5380 31.1580 10,809 170,842
Sub_County Latitude Longitude People covered by intervention 5 Year Max Subsidy USD
148
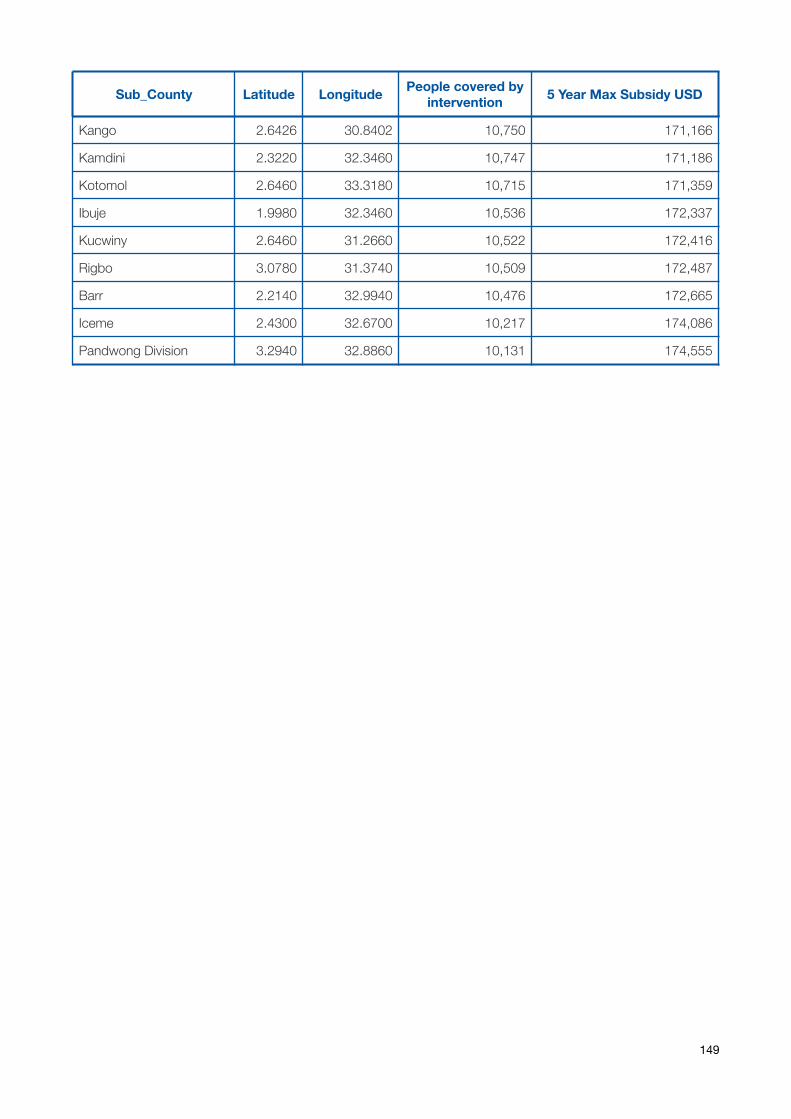
Kango 2.6426 30.8402 10,750 171,166
Kamdini 2.3220 32.3460 10,747 171,186
Kotomol 2.6460 33.3180 10,715 171,359
Ibuje 1.9980 32.3460 10,536 172,337
Kucwiny 2.6460 31.2660 10,522 172,416
Rigbo 3.0780 31.3740 10,509 172,487
Barr 2.2140 32.9940 10,476 172,665
Iceme 2.4300 32.6700 10,217 174,086
Pandwong Division 3.2940 32.8860 10,131 174,555
Sub_County Latitude Longitude People covered by intervention 5 Year Max Subsidy USD
149
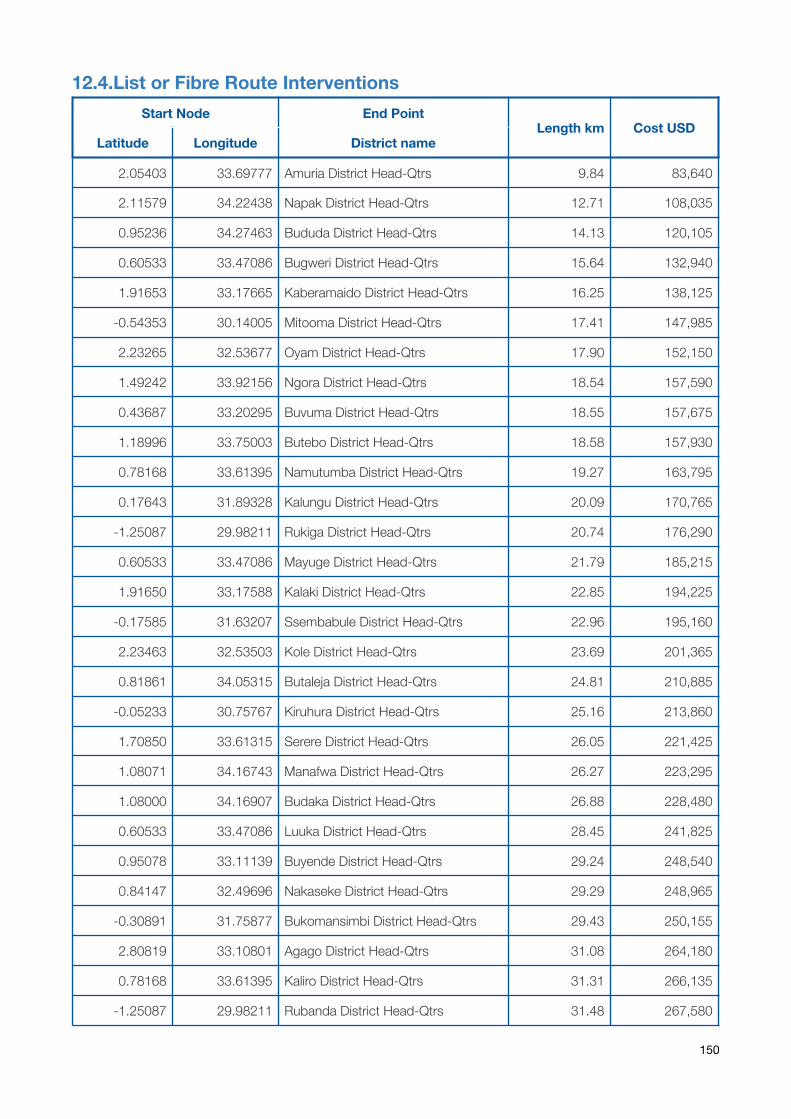
12.4.List or Fibre Route InterventionsStart Node End Point
Length km Cost USDLatitude Longitude District name
2.05403 33.69777 Amuria District Head-Qtrs 9.84 83,640
2.11579 34.22438 Napak District Head-Qtrs 12.71 108,035
0.95236 34.27463 Bududa District Head-Qtrs 14.13 120,105
0.60533 33.47086 Bugweri District Head-Qtrs 15.64 132,940
1.91653 33.17665 Kaberamaido District Head-Qtrs 16.25 138,125
-0.54353 30.14005 Mitooma District Head-Qtrs 17.41 147,985
2.23265 32.53677 Oyam District Head-Qtrs 17.90 152,150
1.49242 33.92156 Ngora District Head-Qtrs 18.54 157,590
0.43687 33.20295 Buvuma District Head-Qtrs 18.55 157,675
1.18996 33.75003 Butebo District Head-Qtrs 18.58 157,930
0.78168 33.61395 Namutumba District Head-Qtrs 19.27 163,795
0.17643 31.89328 Kalungu District Head-Qtrs 20.09 170,765
-1.25087 29.98211 Rukiga District Head-Qtrs 20.74 176,290
0.60533 33.47086 Mayuge District Head-Qtrs 21.79 185,215
1.91650 33.17588 Kalaki District Head-Qtrs 22.85 194,225
-0.17585 31.63207 Ssembabule District Head-Qtrs 22.96 195,160
2.23463 32.53503 Kole District Head-Qtrs 23.69 201,365
0.81861 34.05315 Butaleja District Head-Qtrs 24.81 210,885
-0.05233 30.75767 Kiruhura District Head-Qtrs 25.16 213,860
1.70850 33.61315 Serere District Head-Qtrs 26.05 221,425
1.08071 34.16743 Manafwa District Head-Qtrs 26.27 223,295
1.08000 34.16907 Budaka District Head-Qtrs 26.88 228,480
0.60533 33.47086 Luuka District Head-Qtrs 28.45 241,825
0.95078 33.11139 Buyende District Head-Qtrs 29.24 248,540
0.84147 32.49696 Nakaseke District Head-Qtrs 29.29 248,965
-0.30891 31.75877 Bukomansimbi District Head-Qtrs 29.43 250,155
2.80819 33.10801 Agago District Head-Qtrs 31.08 264,180
0.78168 33.61395 Kaliro District Head-Qtrs 31.31 266,135
-1.25087 29.98211 Rubanda District Head-Qtrs 31.48 267,580
150
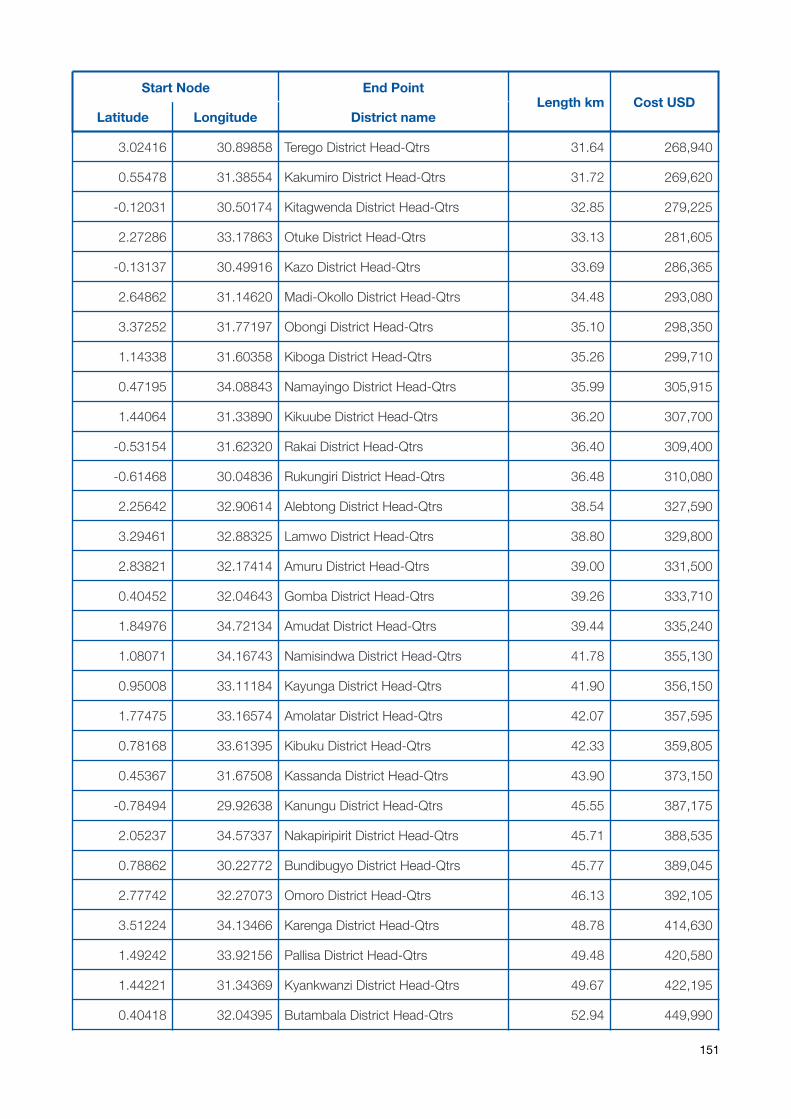
3.02416 30.89858 Terego District Head-Qtrs 31.64 268,940
0.55478 31.38554 Kakumiro District Head-Qtrs 31.72 269,620
-0.12031 30.50174 Kitagwenda District Head-Qtrs 32.85 279,225
2.27286 33.17863 Otuke District Head-Qtrs 33.13 281,605
-0.13137 30.49916 Kazo District Head-Qtrs 33.69 286,365
2.64862 31.14620 Madi-Okollo District Head-Qtrs 34.48 293,080
3.37252 31.77197 Obongi District Head-Qtrs 35.10 298,350
1.14338 31.60358 Kiboga District Head-Qtrs 35.26 299,710
0.47195 34.08843 Namayingo District Head-Qtrs 35.99 305,915
1.44064 31.33890 Kikuube District Head-Qtrs 36.20 307,700
-0.53154 31.62320 Rakai District Head-Qtrs 36.40 309,400
-0.61468 30.04836 Rukungiri District Head-Qtrs 36.48 310,080
2.25642 32.90614 Alebtong District Head-Qtrs 38.54 327,590
3.29461 32.88325 Lamwo District Head-Qtrs 38.80 329,800
2.83821 32.17414 Amuru District Head-Qtrs 39.00 331,500
0.40452 32.04643 Gomba District Head-Qtrs 39.26 333,710
1.84976 34.72134 Amudat District Head-Qtrs 39.44 335,240
1.08071 34.16743 Namisindwa District Head-Qtrs 41.78 355,130
0.95008 33.11184 Kayunga District Head-Qtrs 41.90 356,150
1.77475 33.16574 Amolatar District Head-Qtrs 42.07 357,595
0.78168 33.61395 Kibuku District Head-Qtrs 42.33 359,805
0.45367 31.67508 Kassanda District Head-Qtrs 43.90 373,150
-0.78494 29.92638 Kanungu District Head-Qtrs 45.55 387,175
2.05237 34.57337 Nakapiripirit District Head-Qtrs 45.71 388,535
0.78862 30.22772 Bundibugyo District Head-Qtrs 45.77 389,045
2.77742 32.27073 Omoro District Head-Qtrs 46.13 392,105
3.51224 34.13466 Karenga District Head-Qtrs 48.78 414,630
1.49242 33.92156 Pallisa District Head-Qtrs 49.48 420,580
1.44221 31.34369 Kyankwanzi District Head-Qtrs 49.67 422,195
0.40418 32.04395 Butambala District Head-Qtrs 52.94 449,990
Start Node End PointLength km Cost USD
Latitude Longitude District name
151
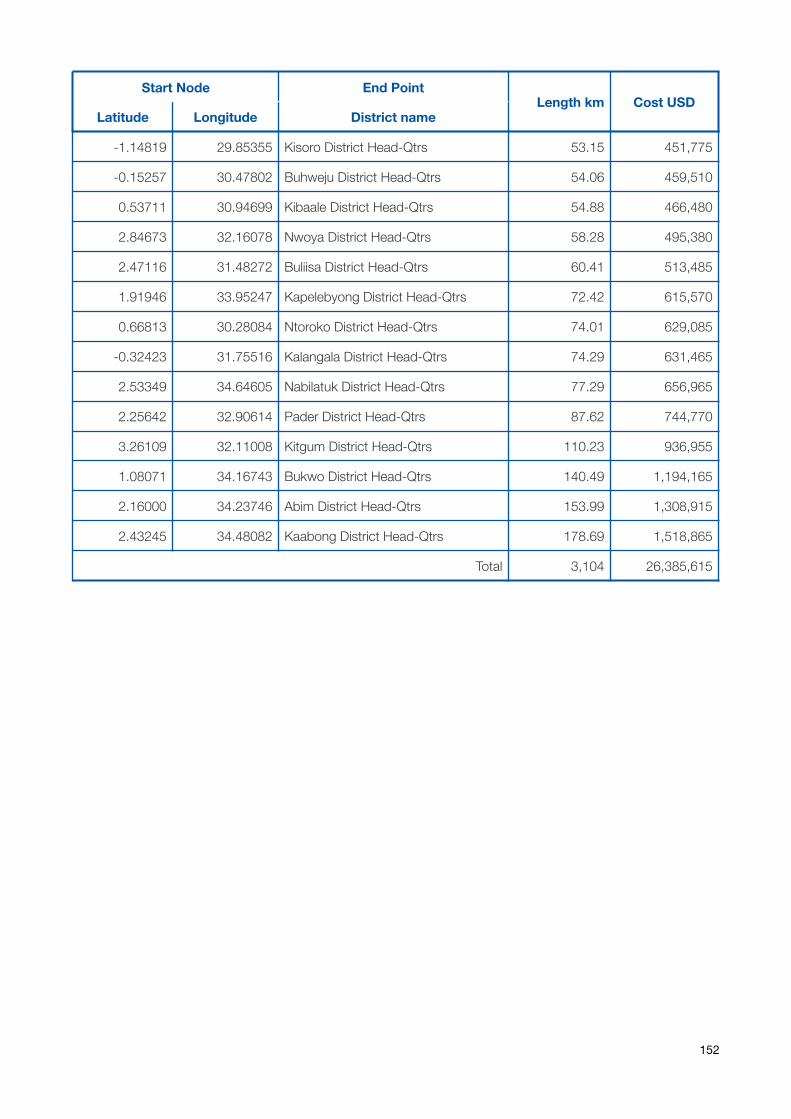
-1.14819 29.85355 Kisoro District Head-Qtrs 53.15 451,775
-0.15257 30.47802 Buhweju District Head-Qtrs 54.06 459,510
0.53711 30.94699 Kibaale District Head-Qtrs 54.88 466,480
2.84673 32.16078 Nwoya District Head-Qtrs 58.28 495,380
2.47116 31.48272 Buliisa District Head-Qtrs 60.41 513,485
1.91946 33.95247 Kapelebyong District Head-Qtrs 72.42 615,570
0.66813 30.28084 Ntoroko District Head-Qtrs 74.01 629,085
-0.32423 31.75516 Kalangala District Head-Qtrs 74.29 631,465
2.53349 34.64605 Nabilatuk District Head-Qtrs 77.29 656,965
2.25642 32.90614 Pader District Head-Qtrs 87.62 744,770
3.26109 32.11008 Kitgum District Head-Qtrs 110.23 936,955
1.08071 34.16743 Bukwo District Head-Qtrs 140.49 1,194,165
2.16000 34.23746 Abim District Head-Qtrs 153.99 1,308,915
2.43245 34.48082 Kaabong District Head-Qtrs 178.69 1,518,865
Total 3,104 26,385,615
Start Node End PointLength km Cost USD
Latitude Longitude District name
152
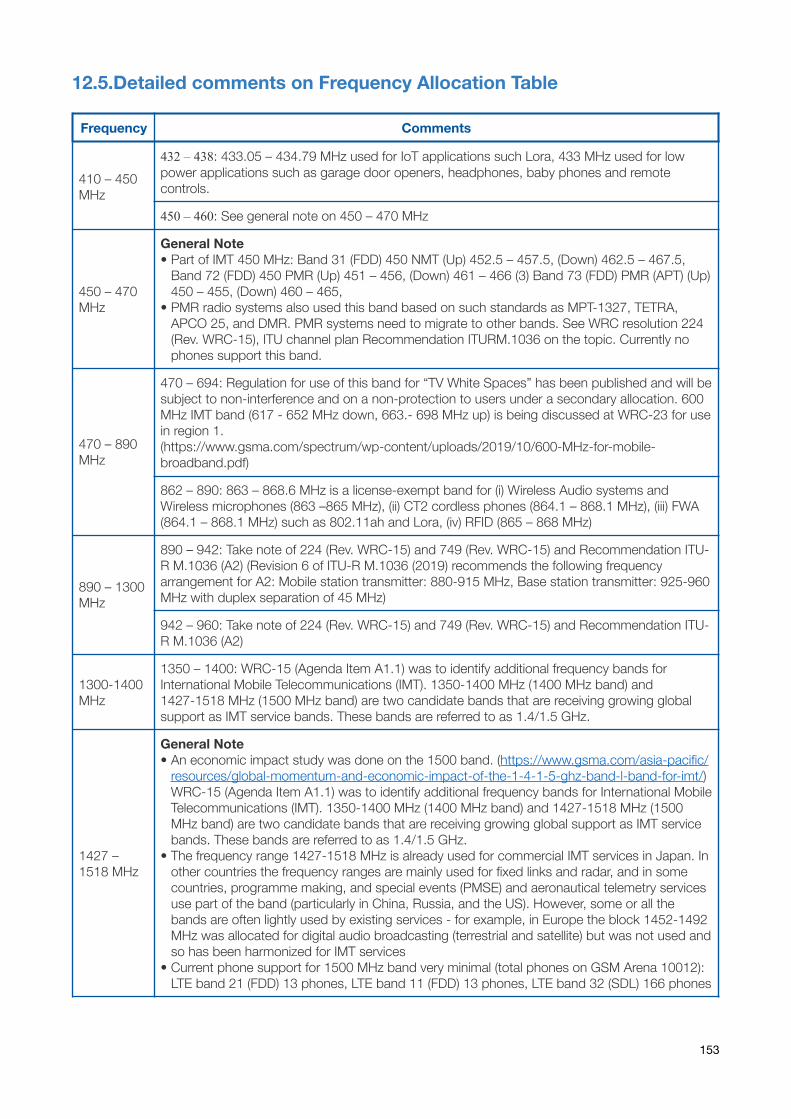
12.5.Detailed comments on Frequency Allocation Table
Frequency Comments
410 – 450 MHz
432 – 438: 433.05 – 434.79 MHz used for IoT applications such Lora, 433 MHz used for low power applications such as garage door openers, headphones, baby phones and remote controls.
450 – 460: See general note on 450 – 470 MHz
450 – 470 MHz
General Note • Part of IMT 450 MHz: Band 31 (FDD) 450 NMT (Up) 452.5 – 457.5, (Down) 462.5 – 467.5,
Band 72 (FDD) 450 PMR (Up) 451 – 456, (Down) 461 – 466 (3) Band 73 (FDD) PMR (APT) (Up) 450 – 455, (Down) 460 – 465,
• PMR radio systems also used this band based on such standards as MPT-1327, TETRA, APCO 25, and DMR. PMR systems need to migrate to other bands. See WRC resolution 224 (Rev. WRC-15), ITU channel plan Recommendation ITURM.1036 on the topic. Currently no phones support this band.
470 – 890 MHz
470 – 694: Regulation for use of this band for “TV White Spaces” has been published and will be subject to non-interference and on a non-protection to users under a secondary allocation. 600 MHz IMT band (617 - 652 MHz down, 663.- 698 MHz up) is being discussed at WRC-23 for use in region 1. (https://www.gsma.com/spectrum/wp-content/uploads/2019/10/600-MHz-for-mobile-broadband.pdf)
862 – 890: 863 – 868.6 MHz is a license-exempt band for (i) Wireless Audio systems and Wireless microphones (863 –865 MHz), (ii) CT2 cordless phones (864.1 – 868.1 MHz), (iii) FWA (864.1 – 868.1 MHz) such as 802.11ah and Lora, (iv) RFID (865 – 868 MHz)
890 – 1300 MHz
890 – 942: Take note of 224 (Rev. WRC-15) and 749 (Rev. WRC-15) and Recommendation ITU- R M.1036 (A2) (Revision 6 of ITU-R M.1036 (2019) recommends the following frequency arrangement for A2: Mobile station transmitter: 880-915 MHz, Base station transmitter: 925-960 MHz with duplex separation of 45 MHz)
942 – 960: Take note of 224 (Rev. WRC-15) and 749 (Rev. WRC-15) and Recommendation ITU- R M.1036 (A2)
1300-1400 MHz
1350 – 1400: WRC-15 (Agenda Item A1.1) was to identify additional frequency bands for International Mobile Telecommunications (IMT). 1350-1400 MHz (1400 MHz band) and 1427-1518 MHz (1500 MHz band) are two candidate bands that are receiving growing global support as IMT service bands. These bands are referred to as 1.4/1.5 GHz.
1427 – 1518 MHz
General Note • An economic impact study was done on the 1500 band. (https://www.gsma.com/asia-pacific/
resources/global-momentum-and-economic-impact-of-the-1-4-1-5-ghz-band-l-band-for-imt/) WRC-15 (Agenda Item A1.1) was to identify additional frequency bands for International Mobile Telecommunications (IMT). 1350-1400 MHz (1400 MHz band) and 1427-1518 MHz (1500 MHz band) are two candidate bands that are receiving growing global support as IMT service bands. These bands are referred to as 1.4/1.5 GHz.
• The frequency range 1427-1518 MHz is already used for commercial IMT services in Japan. In other countries the frequency ranges are mainly used for fixed links and radar, and in some countries, programme making, and special events (PMSE) and aeronautical telemetry services use part of the band (particularly in China, Russia, and the US). However, some or all the bands are often lightly used by existing services - for example, in Europe the block 1452-1492 MHz was allocated for digital audio broadcasting (terrestrial and satellite) but was not used and so has been harmonized for IMT services
• Current phone support for 1500 MHz band very minimal (total phones on GSM Arena 10012): LTE band 21 (FDD) 13 phones, LTE band 11 (FDD) 13 phones, LTE band 32 (SDL) 166 phones
153
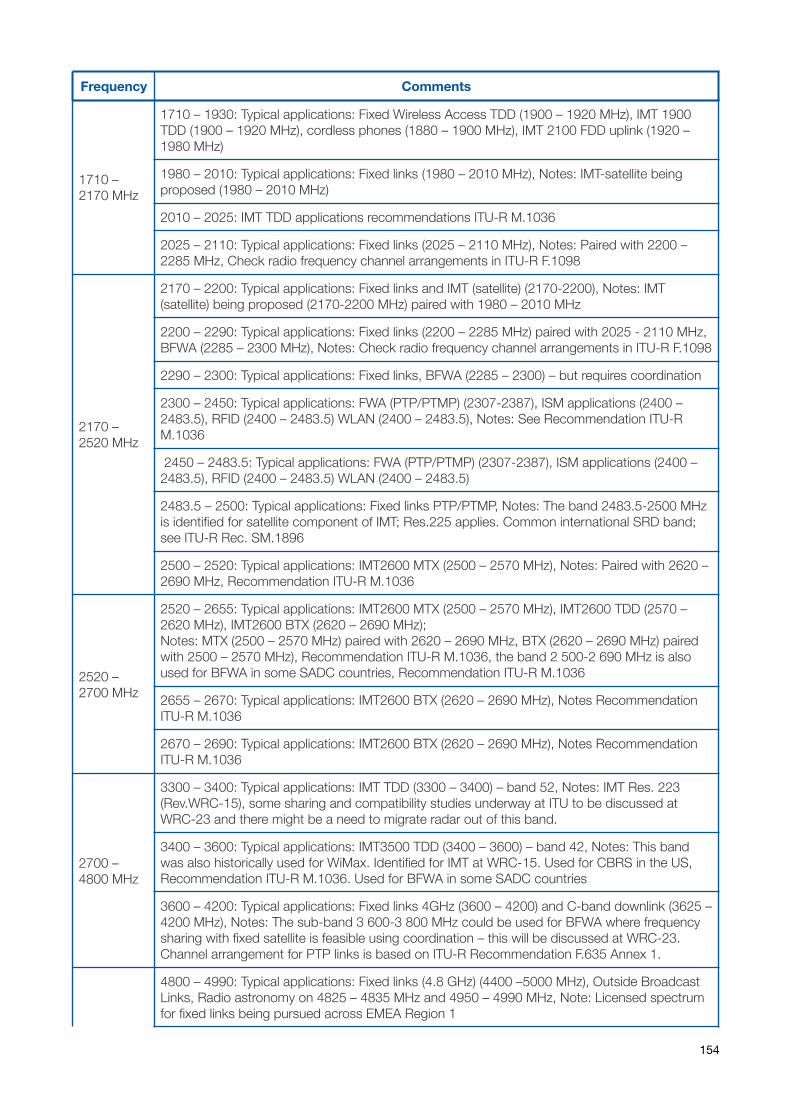
1710 – 2170 MHz
1710 – 1930: Typical applications: Fixed Wireless Access TDD (1900 – 1920 MHz), IMT 1900 TDD (1900 – 1920 MHz), cordless phones (1880 – 1900 MHz), IMT 2100 FDD uplink (1920 – 1980 MHz)
1980 – 2010: Typical applications: Fixed links (1980 – 2010 MHz), Notes: IMT-satellite being proposed (1980 – 2010 MHz)
2010 – 2025: IMT TDD applications recommendations ITU-R M.1036
2025 – 2110: Typical applications: Fixed links (2025 – 2110 MHz), Notes: Paired with 2200 – 2285 MHz, Check radio frequency channel arrangements in ITU-R F.1098
2170 – 2520 MHz
2170 – 2200: Typical applications: Fixed links and IMT (satellite) (2170-2200), Notes: IMT (satellite) being proposed (2170-2200 MHz) paired with 1980 – 2010 MHz
2200 – 2290: Typical applications: Fixed links (2200 – 2285 MHz) paired with 2025 - 2110 MHz, BFWA (2285 – 2300 MHz), Notes: Check radio frequency channel arrangements in ITU-R F.1098
2290 – 2300: Typical applications: Fixed links, BFWA (2285 – 2300) – but requires coordination
2300 – 2450: Typical applications: FWA (PTP/PTMP) (2307-2387), ISM applications (2400 – 2483.5), RFID (2400 – 2483.5) WLAN (2400 – 2483.5), Notes: See Recommendation ITU-R M.1036
2450 – 2483.5: Typical applications: FWA (PTP/PTMP) (2307-2387), ISM applications (2400 – 2483.5), RFID (2400 – 2483.5) WLAN (2400 – 2483.5)
2483.5 – 2500: Typical applications: Fixed links PTP/PTMP, Notes: The band 2483.5-2500 MHz is identified for satellite component of IMT; Res.225 applies. Common international SRD band; see ITU-R Rec. SM.1896
2500 – 2520: Typical applications: IMT2600 MTX (2500 – 2570 MHz), Notes: Paired with 2620 – 2690 MHz, Recommendation ITU-R M.1036
2520 – 2700 MHz
2520 – 2655: Typical applications: IMT2600 MTX (2500 – 2570 MHz), IMT2600 TDD (2570 – 2620 MHz), IMT2600 BTX (2620 – 2690 MHz); Notes: MTX (2500 – 2570 MHz) paired with 2620 – 2690 MHz, BTX (2620 – 2690 MHz) paired with 2500 – 2570 MHz), Recommendation ITU-R M.1036, the band 2 500-2 690 MHz is also used for BFWA in some SADC countries, Recommendation ITU-R M.1036
2655 – 2670: Typical applications: IMT2600 BTX (2620 – 2690 MHz), Notes Recommendation ITU-R M.1036
2670 – 2690: Typical applications: IMT2600 BTX (2620 – 2690 MHz), Notes Recommendation ITU-R M.1036
2700 – 4800 MHz
3300 – 3400: Typical applications: IMT TDD (3300 – 3400) – band 52, Notes: IMT Res. 223 (Rev.WRC-15), some sharing and compatibility studies underway at ITU to be discussed at WRC-23 and there might be a need to migrate radar out of this band.
3400 – 3600: Typical applications: IMT3500 TDD (3400 – 3600) – band 42, Notes: This band was also historically used for WiMax. Identified for IMT at WRC-15. Used for CBRS in the US, Recommendation ITU-R M.1036. Used for BFWA in some SADC countries
3600 – 4200: Typical applications: Fixed links 4GHz (3600 – 4200) and C-band downlink (3625 – 4200 MHz), Notes: The sub-band 3 600-3 800 MHz could be used for BFWA where frequency sharing with fixed satellite is feasible using coordination – this will be discussed at WRC-23. Channel arrangement for PTP links is based on ITU-R Recommendation F.635 Annex 1.
4800 – 4990: Typical applications: Fixed links (4.8 GHz) (4400 –5000 MHz), Outside Broadcast Links, Radio astronomy on 4825 – 4835 MHz and 4950 – 4990 MHz, Note: Licensed spectrum for fixed links being pursued across EMEA Region 1
Frequency Comments
154
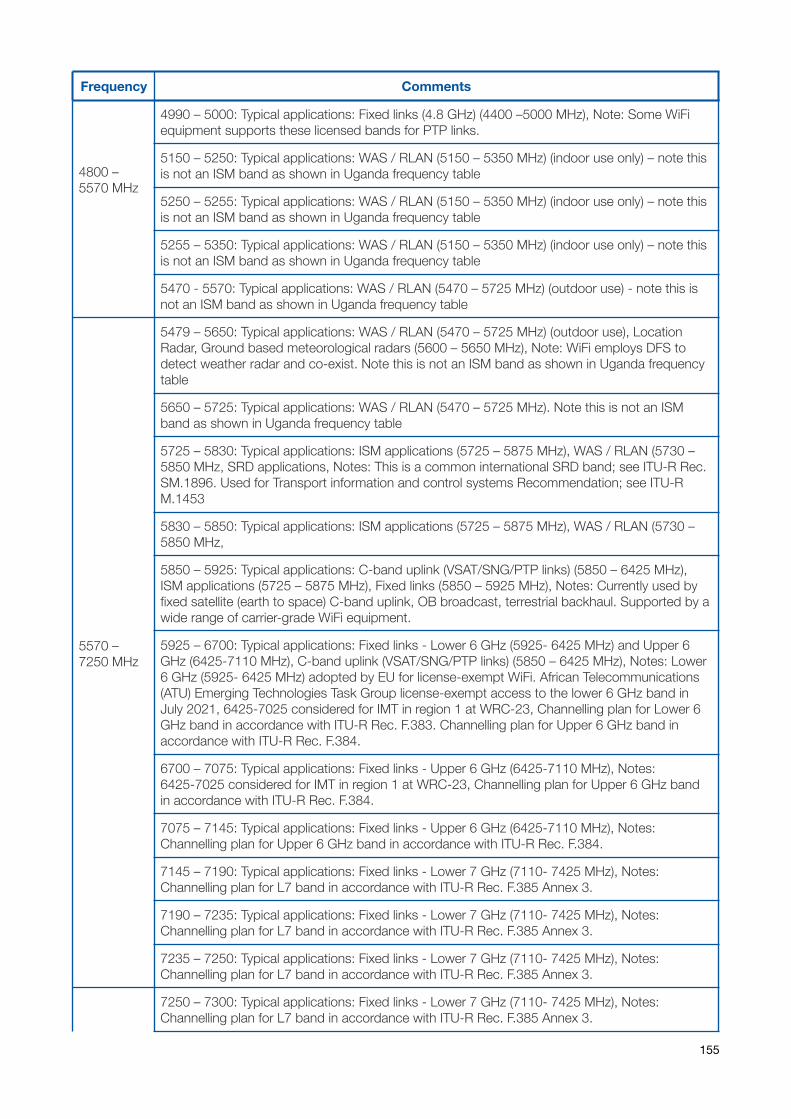
4800 – 5570 MHz
4990 – 5000: Typical applications: Fixed links (4.8 GHz) (4400 –5000 MHz), Note: Some WiFi equipment supports these licensed bands for PTP links.
5150 – 5250: Typical applications: WAS / RLAN (5150 – 5350 MHz) (indoor use only) – note this is not an ISM band as shown in Uganda frequency table
5250 – 5255: Typical applications: WAS / RLAN (5150 – 5350 MHz) (indoor use only) – note this is not an ISM band as shown in Uganda frequency table
5255 – 5350: Typical applications: WAS / RLAN (5150 – 5350 MHz) (indoor use only) – note this is not an ISM band as shown in Uganda frequency table
5470 - 5570: Typical applications: WAS / RLAN (5470 – 5725 MHz) (outdoor use) - note this is not an ISM band as shown in Uganda frequency table
5570 – 7250 MHz
5479 – 5650: Typical applications: WAS / RLAN (5470 – 5725 MHz) (outdoor use), Location Radar, Ground based meteorological radars (5600 – 5650 MHz), Note: WiFi employs DFS to detect weather radar and co-exist. Note this is not an ISM band as shown in Uganda frequency table
5650 – 5725: Typical applications: WAS / RLAN (5470 – 5725 MHz). Note this is not an ISM band as shown in Uganda frequency table
5725 – 5830: Typical applications: ISM applications (5725 – 5875 MHz), WAS / RLAN (5730 – 5850 MHz, SRD applications, Notes: This is a common international SRD band; see ITU-R Rec. SM.1896. Used for Transport information and control systems Recommendation; see ITU-R M.1453
5830 – 5850: Typical applications: ISM applications (5725 – 5875 MHz), WAS / RLAN (5730 – 5850 MHz,
5850 – 5925: Typical applications: C-band uplink (VSAT/SNG/PTP links) (5850 – 6425 MHz), ISM applications (5725 – 5875 MHz), Fixed links (5850 – 5925 MHz), Notes: Currently used by fixed satellite (earth to space) C-band uplink, OB broadcast, terrestrial backhaul. Supported by a wide range of carrier-grade WiFi equipment.
5925 – 6700: Typical applications: Fixed links - Lower 6 GHz (5925- 6425 MHz) and Upper 6 GHz (6425-7110 MHz), C-band uplink (VSAT/SNG/PTP links) (5850 – 6425 MHz), Notes: Lower 6 GHz (5925- 6425 MHz) adopted by EU for license-exempt WiFi. African Telecommunications (ATU) Emerging Technologies Task Group license-exempt access to the lower 6 GHz band in July 2021, 6425-7025 considered for IMT in region 1 at WRC-23, Channelling plan for Lower 6 GHz band in accordance with ITU-R Rec. F.383. Channelling plan for Upper 6 GHz band in accordance with ITU-R Rec. F.384.
6700 – 7075: Typical applications: Fixed links - Upper 6 GHz (6425-7110 MHz), Notes: 6425-7025 considered for IMT in region 1 at WRC-23, Channelling plan for Upper 6 GHz band in accordance with ITU-R Rec. F.384.
7075 – 7145: Typical applications: Fixed links - Upper 6 GHz (6425-7110 MHz), Notes: Channelling plan for Upper 6 GHz band in accordance with ITU-R Rec. F.384.
7145 – 7190: Typical applications: Fixed links - Lower 7 GHz (7110- 7425 MHz), Notes: Channelling plan for L7 band in accordance with ITU-R Rec. F.385 Annex 3.
7190 – 7235: Typical applications: Fixed links - Lower 7 GHz (7110- 7425 MHz), Notes: Channelling plan for L7 band in accordance with ITU-R Rec. F.385 Annex 3.
7235 – 7250: Typical applications: Fixed links - Lower 7 GHz (7110- 7425 MHz), Notes: Channelling plan for L7 band in accordance with ITU-R Rec. F.385 Annex 3.
7250 – 7300: Typical applications: Fixed links - Lower 7 GHz (7110- 7425 MHz), Notes: Channelling plan for L7 band in accordance with ITU-R Rec. F.385 Annex 3.
Frequency Comments
155
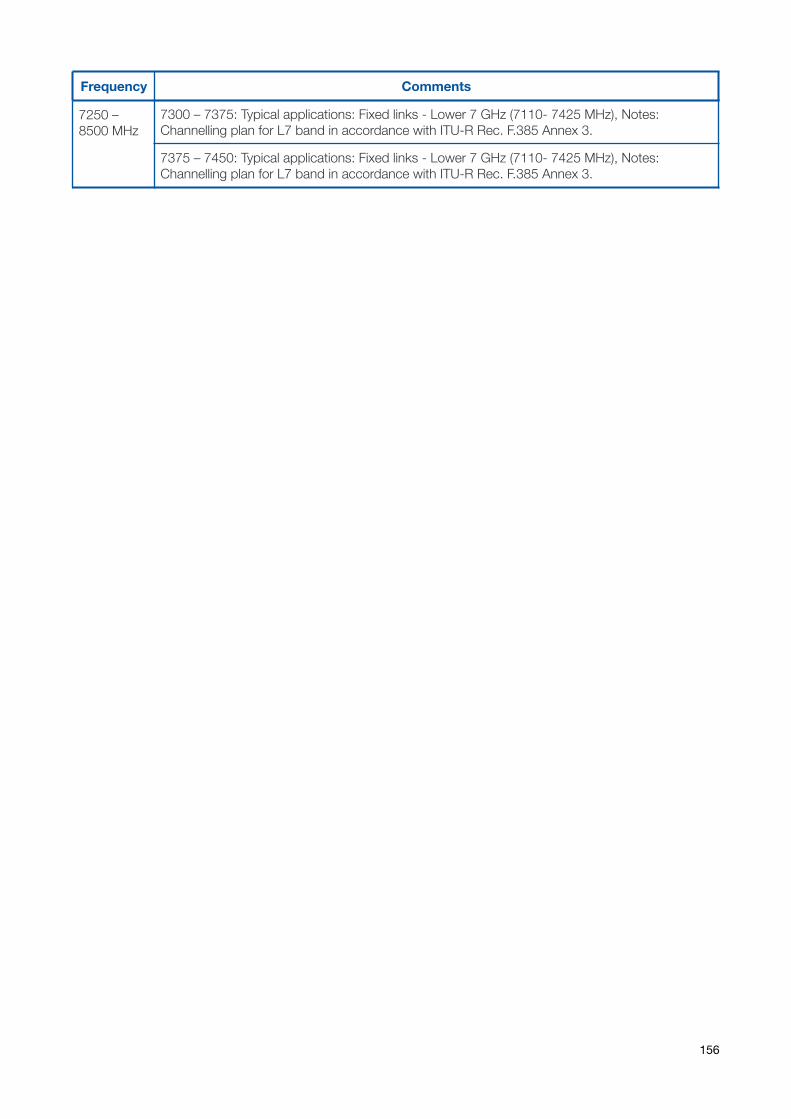
7250 – 8500 MHz
7300 – 7375: Typical applications: Fixed links - Lower 7 GHz (7110- 7425 MHz), Notes: Channelling plan for L7 band in accordance with ITU-R Rec. F.385 Annex 3.
7375 – 7450: Typical applications: Fixed links - Lower 7 GHz (7110- 7425 MHz), Notes: Channelling plan for L7 band in accordance with ITU-R Rec. F.385 Annex 3.
Frequency Comments
156
12.6.Community Networks: Global, Regional, and National Recognition
This appendix provides global, regional and national-level references that support the use of community networks in broadband policy and regulation.
12.6.1.Global Recognition ITU-D: Telecommunications for rural and remote areas - The World Telecommunication Development Conference (Dubai, 2014) Recommendation 19 includes the following (ITU, 2018, 648):
• “10. that it is important to consider small and non-profit community operators, through appropriate regulatory measures that allow them to access basic infrastructure on fair terms, in order to provide broadband connectivity to users in rural and remote areas, taking advantage of technological advances;
• 11. that it is also important that administrations, in their radio-spectrum planning and licensing activities, consider mechanisms to facilitate the deployment of broadband services in rural and remote areas by small and non-profit community operators;”
UN ECOSOC Resolution 2019/24 Numeral 54 includes “Community Networks” as an emerging topic (ECOSOC, 2019). The Report of the United Nations Secretary General’s High Level Panel on Digital 145Co-operation states that: “Governments have an important role to play in creating a policy framework to enable private sector enterprise, innovation, and cooperative, bottom-up networks” (page 12). And concludes in its recommendation that: “Second, investments should be made in both human capacity and physical infrastructure. Creating the foundation of universal, affordable access to electricity and the Internet will often require innovative approaches, such as community groups operating rural networks, or incentives such as public sector support.” (page 29)
The Annual Deliverable 2019–2020 from ITU-D Study Groups Question 5/1: Telecommunications/ICTs for Rural and Remote Areas states (ITU, 2020e): “the following recommendations can be made for now:Ease regulatory requirements for community network operators.”
The ITU Smart Villages Blueprint document produced in 2020 mentions community networks on 146
several occasions.
12.6.2.Regional Recognition In Africa, the Specialized Technical Committee on Communications and Information Technologies (STC-CICT) of the African Union included in its 2019 Sharm El Sheikh Declaration (STC-CICT, 2019) the following text directing the African Union Commission to:
“PROMOTE the formulation of strategy and pilot projects for Unlocking Access to Basic Infrastructure and Services for Rural and Remote Areas including Indigenous Community Networks, and develop guidelines on legislation on deployment of technologies and ICT applications, to accelerate infrastructure role [sic] out in collaboration with [African Telecommunications Union] and other regional institutions;”
The Broadband Commission’s “Connecting Africa through Broadband: A strategy for doubling connectivity by 2021 and reaching universal access by 2030” (Broadband Commission for Sustainable Development, 2019) recognizes the role of community networks in three of the seven objectives of its action plan. Of particular interest is Objective 5:
https://www.un.org/en/pdfs/DigitalCooperation-report-for%20web.pdf145
https://www.itu.int/dms_pub/itu-d/opb/str/D-STR-SMART_VILLAGE.NIGER-2020-PDF-E.pdf146
157
“Provide direct funding support for extending affordable broadband access to commercially challenging rural and remote areas, to women, and low-income users and the recommendations under Objective 1, “Ensure that the commercial broadband ICT market is open and structurally prepared for competitive private investment”:
Adopt open wholesale and retail telecommunications market entry policies, especially competitive and unified licensing regimes, and liberal, dynamic spectrum policies. Such policies should also accommodate community and non-profit focused network operators who offer services in underserved areas."
In the Americas, the Inter-American Telecommunication Commission tracks the implementation of resolution ITU D-19 regarding small not-for-profit and community operators through resolution 268-PCC1. The report, presented in 2018, shows the development of inclusive regulation for small and 147
community operators in each of the countries (see page 29).
In the Asia Pacific region, community networks are a relatively new topic. Still, they were discussed in 2019 at the Third Session of the Asia-Pacific Information Superhighway Steering Committee and WSIS Regional Review and included in its deliberations. 148
12.6.3.National Recognition Some countries such as Kenya and South Africa include in their policy documents references to community networks, small operators, and co-operatives as a vehicle for digital inclusion. Kenya 149highlights the need to provide for an enabling policy and regulatory framework for community-based operators in their National Broadband Strategy. South Africa not only mentions them in their National Broadband Plan and includes them as part of the Telecommunications Value Chain in their SMME Strategy, but the development and promotion of “SMMEs and cooperatives” is part of the objectives of the Electronic Communications Act, the main act of the telecommunications sector in the country. In the particular case of community networks, specific support for their development was articulated in the Budget Speech 2018 from the Department of Telecommunications and Postal Services. Unsurprisingly, South Africa is the country with the most local operators in Africa.
In the Americas during the last few years, Brazil has implemented a strong policy and regulatory strategy for facilitating the participation of small operators in serving rural and remote areas, including a recent note on how to regulate community networks. In Mexico, community and indigenous 150
operators are specifically recognized in the Telecommunications Act, and it specifies that spectrum planning activities should always take into consideration the specific needs of these operators. Mexico’s new Social Coverage Program specifically refers to them as important allies in addressing unconnected areas.151
See https://www.citel.oas.org/en/SiteAssets/PCCI/Final-Reports/CCPI-2018-33-4714_i.pdf147
See https://www.unescap.org/sites/default/files/Summary percent20Report percent20- percent20Third percent20AP-IS 148
percent20SC_0.pdf. See Kenya’s National Broadband Strategy 2018 (https://ca.go.ke/wp-content/uploads/2018/02/National-Broadband-149
Strategy.pdf); South Africa Connect: South Africa’s Broadband Policy (https://www.ellipsis.co.za/wp-content/uploads/2013/10/NBP-2013.pdf); Draft Information and Communication Technology Small, Medium, and Micro-Enterprise Support Strategy (https://www.dtps.gov.za/images/phocagallery/Popular_Topic_Pictures/40756_31-3_TeleComPostServ.pdf); Electronic Communications Act 36//2005 (https://www.dtps.gov.za/index.php?option=com_phocadownload&view=category&download=34:electronic-communications-act-2005&id=2:legislation&Itemid=142&start=20); Deputy Minister Stella Ndabeni-Abrahams: Telecommunications and Postal Services Dept Budget Vote 2018/19 (https://africanewswire.za.com/deputy-minister-stella-ndabeni-abrahams-telecommunications-and-postal-services-dept-budget-vote-2018-19/).
See https://inseit.net/news/86/150
See https://www.gob.mx/sct/acciones-y-programas/programa-de-cobertura-social. 151
158