multivariate analysis of sedimentary environments using grain-size frequency distributions
TRANSCRIPT
Mathematical Geology, Vol. 1l, No. 1, 1979
Multivariate Analysis of Sedimentary Environments Using Grain-Size Frequency Distributions
Richard L. Chambers 2 and S a m B. Upchurch 3
Multivariate statistics were used to characterize and test the ej]ectiveness o f grain-size fi'equencies as environmental discriminators. Sediment f rom the following two depositional systems along eastern Lake Michigan were studied: (1) a closed system with respect to available grain sizes (Little Sable Point), and (2) an open system (Sleeping Bear Point-Manitou ,Passage). Principal components analysis shows that grain-size distributions are composed o f two or more subgroups that reflect surface creep bedload, mixed suspension bedload, and un(/brm suspension. Discriminant function and principal latent vector analyses o f the Little Sable Point environments show that, when availabh, sediment is limited with respect to grain size (0.5 • to 3.0 ~ ) , similar size distributions can occur in environments supposedly characterized by different energy conditions. Sediment in the Sleeping Bear Point-Manitou Passage system is not restricted to available grain sizes and the environments discriminated very well (c~ < 0.001). The grain-size distributions are such that they reflect differences in energy conditions within the environments. It is apparent that the grain sizes available to a depositional system control to a great extent the effectiveness o f environmental discrimination. KEY WORDS: multivariate analysis, lacustrine environment, grain-size distributions.
INTRODUCTION
Sedimentological models often use concepts based on fundamental relation- ships between grain-size textural parameters and depositional environments. It is often assumed that each depositional environment has its own character- istic energy condition (e.g., Sahu, 1964) and that specific textural attributes should be produced in a given sand body in different environments (Folk and Ward, 1957; Visher, 1965, 1969; Klovan, 1966; Friedman, 1967; Upchurch, 1970a, b; Allen, Castaign, and Klingebiel, 1971; Davis and Ethridge, 1975). Considerable controversy has developed over the usefulness of summary statistics from grain-size analyses for the identification of depositional
I Manuscript received 14 May 1978. GLERL Contribution No. 127. 2 U.S. Department of Commerce, National Oceanic and Atmospheric Administration, Environ-
mental Research Laboratories, Great Lakes Environmental Research Laboratory, 2300 Wash- tenaw Avenue, Ann Arbor, Michigan 48104.
3 Department of Geology, University of South Florida, Tampa, Florida 33620.
27
0020-5958/79/02004)027503.00/0 © 1979 Plenum Publishing Corporation
28 Richard L. Chambers and Sam B. Upchurch
environments. This dispute arises in part from the numerous textural compu- tational methods developed over the years.
This study illustrates the relationship between grain-size frequency distri- butions and depositional environments from two different depositional sys- tems and suggests why discrimination between environments on the basis of texture is not always effective. A multivariate statistical approach was chosen to relate texture to depositional environment without any a priori knowledge of the causal factors producing the sediment textures.
THE STUDY AREAS
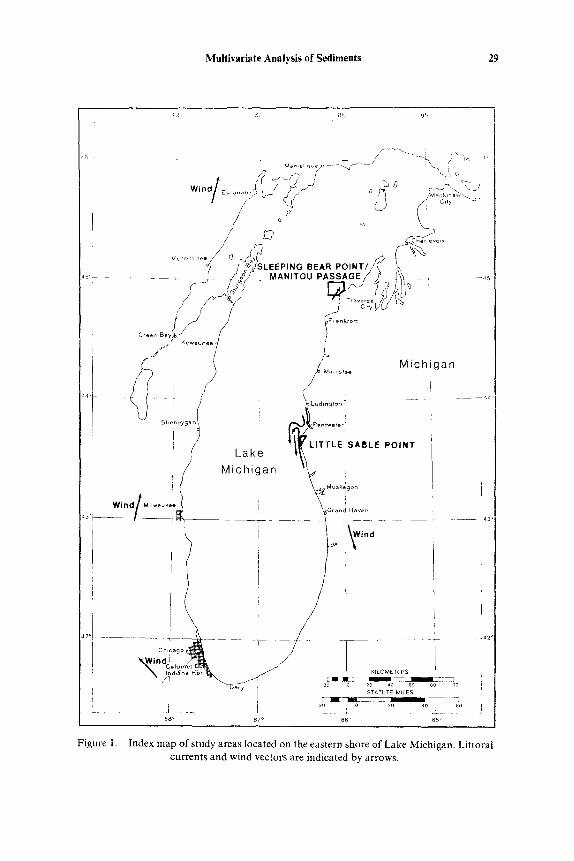
Two independent recent depositional systems (Fig. 1) on the eastern coast of Lake Michigan were chosen for this study: the Little Sable Point area, and the Sleeping Bear Point-Manitou Passage area.
Li t t l e S a b l e P o i n t
The surficial deposits in this area are predominantly of glacial origin (Saylor and Hands, 1970). Beach, aeolian, and fluvial sediments accumulate at the lakeshore. The source material for sediments in the Silver Lake sand dunes and adjacent Lake Michigan beach system to the west is Pleistocene morainic sediment approximately 2.5 km south of the study area (Upchurch, 1970b). Upchurch (1970b) found the following sorting conditions at the source area: (1) the pebble-cobble fraction forms a lag beach deposit; (2) the silt-clay population is winnowed and carried lakeward; and (3) the sand population is transported by littoral currents. The dominant littoral current for this area is northward (Ayers, Chandler, Lauff, Power, and Henson, 1958). Thus, beach sediment transported northward from the source area has a grain-size distri- bution limited by the sand-size population at the source and by the com- petence of the transporting mechanism, namely, littoral drift. There is much feedback between the beach and adjacent dunes (Upchurch, 1970b) and presumably between the beach, offshore bars and troughs, aeolian dunes, and Silver Creek. This area provides an excellent opportunity to study a system that is closed in the sense that it is a self-feeding system with a grain-size range limited to the sand fraction subjected to supposedly different hydrodynamic conditions.
Samples were collected from the following environments: (1) beach sediment at the morainic source area (n=9), (2) beach sediment (collected only on the foreshore) on Lake Michigan west of Silver Lake (n = 20), (3) offshore bars and troughs in the area of the beach just described (n = 18), (4) bed sediment from Silver Creek (n = 22), and (5) aeolian sediment collected near the northwest corner of Silver Lake (n= 25). As suggested by Visher
Multivariate Analysis of Sediments 29
7 J. , Michigan i / ..... ~° i
- L i / _ , : _ . . . . . .
X) ' ~ ,i ~'° .... ' J Sheb°yganl ,ga~/ ~'entwater i L a k e ITTLE SABLE POINT )
j : / Michigan '~¢ i ~ ~ .° .+°° r f ,,,,..,/M ....... . ~ r ~ , o ; .
.~0~- - - # ~ _ _ _ _ .... ~ .............. ~ .......
I L, i Wind
i , ~ i o , , , o . ~ & j i ~,<o . . . . . ~ I ' \ ~=,~o= H~.&X . I " ,
L i .. . . . . l .o ,, o ,o to L .~,> 88° 87 + 86" 85 ~
Figure 1. Index map of study areas located on the eastern shore of Lake Michigan. }Littoral currents and wind vectors are indicated by arrows.
30 Richard L. Chambers and Sam B. Upchurch
(1969), only the upper centimeter was collected, so physical conditions just prior to sampling should be reflected.
Sleeping Bear Point-Manitou Passage
This area (Fig. 1) is a region of both nearshore and open water environments, with different sedimentary processes operating in an area of mixed sediment provenances. The surficial sediments of Sleeping Bear Point and North and South Manitou Islands are morainic and glacial outwash, with large active sand dunes on Sleeping Bear Point (French, 1964).
The lake bottom physiography is complex and has been called the ridge-and-valley province of Lake Michigan (Hough, 1958). The major mor- phological zones in the study area are: (1) the shallow water, Sleeping Bear Shoal, extending approximately 8 km northwest of Sleeping Bear Point, with water depths of 10-20 m, (2) deep, quiet water basins north and south of the shoal, with water depths of 75-100 m, and (3) an intermediate depth area north to northeast of Sleeping Bear Point, with depths of 20 75 m (French, 1964).
The most prominent feature of Sleeping Bear Point, the west face, has undergone extensive erosion in the past 50 years and has retreated more than 15 m during that time (Gillis and Bakeman, 1963). According to French (1964), shoal areas with depths of less than 20 m are floored with clean sands or with a pebble-cobble-boulder pavement overlaying clay till. The rocky bottomed central portions of the shoal appear to be covered with lag concen- trates eroded from the underlying till.
The northeast tip of Sleeping Bear Point has undergone at least two major episodes of mass wastage since the turn of the century. In 1906, approximately 8 x 10⁵ m 2 (200 acres 2) of unconsolidated glacial outwash and sand dune material slumped into the adjacent lake water (Upchurch, 1973). In March 1970, another 8 x 10⁴ m 2 (20 acres 2) slumped into the lake (U.S. Department of Commerce News, 1971) as a result of heavy rains and high water.
Unlike the Little Sable Point area, this system could be considered an open system in that there are multiple source areas with grain sizes ranging from lag gravels and coarse sand on the Sleeping Bear Shoal to fine silt and clay in the profundal basin north of the shoal.
Forty-two surface samples were collected from a 284-km z area encom- passing the above environments during a 1-week cruise in July 1973. Bottom samples were collected at each station with a 400 cm 3 Shipek sediment sampler. The sampler recovers the upper 10 cm in an essentially undisturbed condition, although some surface floc may be lost. Only the upper centimeter was retained for size analysis.
Multivariate Analysis of Sediments 31
ANALYTIC M E T H O D S
Samples from the Sleeping Bear Point-Manitou Passage area were first treated with 10~o HC1 acid to remove shell material, and with 30~,; H202 to remove organic detritus. The samples were dried and weighed, then split at 4.0 • by wet-sieving methods. The coarse fraction was redried and weighed and the percent weight calculated. This portion was then ready for settling-tube analysis. The above procedures were not necessary for the Little Sable samples as they contained no shell fragments or organic detritus and were truncated at approximately 3 0 .
A 12.5-cm inside diameter settling tube with a differential pressure transducer, carrier demodulator, and strip chart recorder was used to deter- mine fall-velocity frequency distributions. The tube has a 140-cm effective fall length with a grain-size measuring range of - 1 to 4 0 . Material finer than 4 • was measured with a photo extinction particle analyzer.
These analyses permit each sample to be defined by a very large n-dimen- sional sample space. However, for this study, the frequency percents in half-phi-size intervals were used as unique variables of the whole sample. The half-phi-size class was chosen as this is the most commonly used size interval. Theoretically, any number of size classes could be chosen from this type of grain-size analysis.
STATISTICAL M E T H O D S
The application of robust multivariate statistical techniques allows for an objective means of identifying or classifying and comparing sedimentary environments. Two multivariate techniques were applied systematically to extract the most variance between and within sediment types.
Discriminant-function analysis (Krumbein and Graybill, 1965; Upchurch, 1970a, 1972; Davis, 1973; Feldhausen and Ali, 1975; Davis and Ethridge, 1975) is a technique used to test for significant differences of a classification based on a pr ior i grain-size population criteria, for the present study, or on the basis of a classification obtained by some other statistical test (e.g., cluster or factor analysis). Linear equations are derived from this analysis based on weighted variables that produce maximum separation among the samples from the previously defined (sampled environments) groups. These equations can be used to extend the classification to unknown samples. We used a program from the BMD series (05 M) (Dixon, 1970) to estimate the equations.
Principal components analysis was used based on the prior assumption that grain-size distributions are composed of several subpopulations that can be assigned to different transport mechanisms (Moss, 1962, 1963; Visher, 1965, 1969; McKinney and Friedman, 1970). If this is the case, principal
32 Richard L. Chambers and Sam B. Upchurch
components analysis can be used to find the best linear combinations of the original interdependent grain-size classes. Each linear combination or princi- pal component should be a combination of grain sizes influenced by the same environmental stresses, namely, specific transport mechanisms dependent on energy levels within the environment. This technique has been used by Allen, Castaing, and Klingebiel (1971) to seek the best average textural descriptors of the processes operating in the Gironde estuary, France. With the exception of a matrix problem, which they apparently did not account for, this technique appears to be a very promising approach to the analysis of grain-size fre- quency distributions.
For the present study we modified the principal components and factor analysis programs in Davis (1973). It was modified so that by combining the two programs we could rotate only those factors whose eigenvalues were >~ 1, that is, only those factors having variance greater than or equal to the variance of the original standardized variables. A second modification allows for one of several transformations of the original data (i.e., log X, arc sin); these trans- formed data are then used as the input data matrix. A third modification in this program is a subroutine that plots a scatter diagram of the factor scores for the first two principal components by transforming the original variables as the product of the matrix of eigenvectors and the input data matrix. These new transformed variables characterize each sample and may be used to delineate sedimentary environments. These plots are known as "principal latent vector variation diagrams" (Le Maitre, 1968). The transformed vari- able option gives almost the same information as a Q-mode factor analysis without the usual statistical assumption problems associated with a factor analysis.
The nature of the data used in the multivariate tests requires some explanation that will help put the results into perspective. The data are expressed as frequency percentages and, as percentage values, the data form a closed data matrix (Chayes, 1960, 1962; Davis, 1973; Butler, 1976). This constant sum raises troublesome theoretical questions concerned with in- duced negative correlations in the principal components analysis. The calcu- lated correlation matrix forms a closed data matrix that is overdetermined. If A, B, and C are known and the total A + B + C is also known, then there is more information than is needed; thus one of the eigenvalues of the matrix will be zero (Davis, 1973).
To avoid closure, A, B, or C should be eliminated from the original data matrix. For this study, one variable (percentage data of a size class interval) was eliminated to open the data matrix. For the Little Sable Point aeolian, bar and trough, and fluvial samples, the 0 • variable was eliminated. This variable never accounted for more than 1.8~o of the total sample, and material in this size class was present in only 12 of the 65 samples. The 3 • variable was
Multivariate Analysis of Sediments 33
eliminated from the beach samples because more sediment was present in the 0 size interval. Only 7 of the 29 beach samples contained sediment in the 3 ¢~
size class; sediment in this class represented less than 2.5% of the total sample. Sediment finer than 4 ¢) was eliminated from the Sleeping Bear Point-
Manitou Passage samples as this fraction probably represents pure suspen- sion (Visher, 1969) and should be represented as an independent factor in principal components analysis (Allen, Castaing, and Klingebiel, 1971).
D I S C R I M I N A N T F U N C T I O N ANALYSIS
The a pr ior i criteria used to test for significant differences in the Little Sable Point sediments are based on the mode of sample collection, each subset having been collected from a different physiographic environment. The cri- teria used to test for differences in the Sleeping Bear Point-Manitou Passage sediments are based on modified morphological regions defined by French (1964).
Little Sable Point
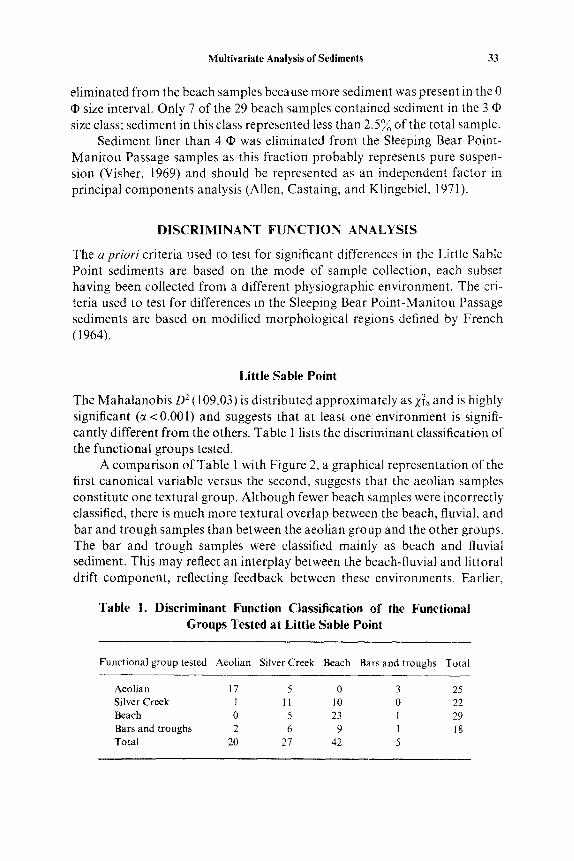
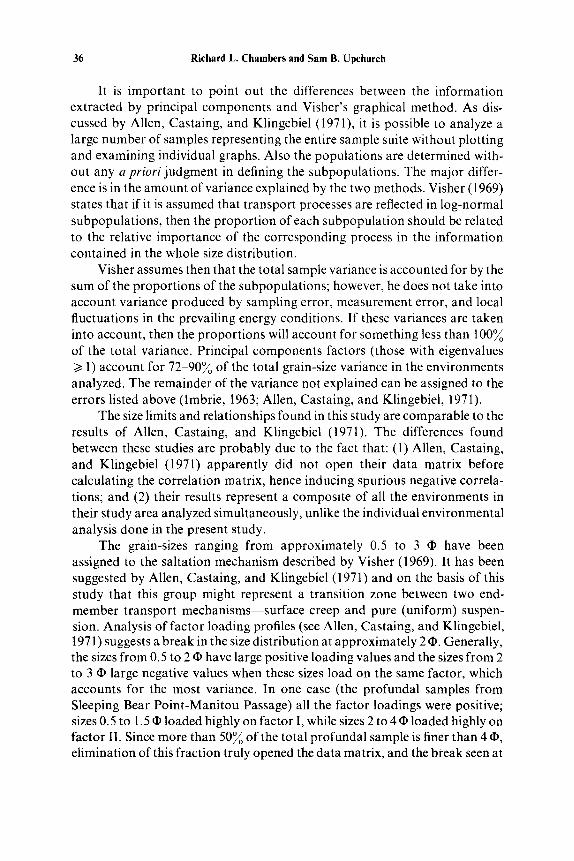
The Mahalanobis D 2 (109.03) is distributed approximately as Z~8 and is highly significant (~ <0.001) and suggests that at least one environment is signifi- cantly different from the others. Table 1 lists the discriminant classification of the functional groups tested.
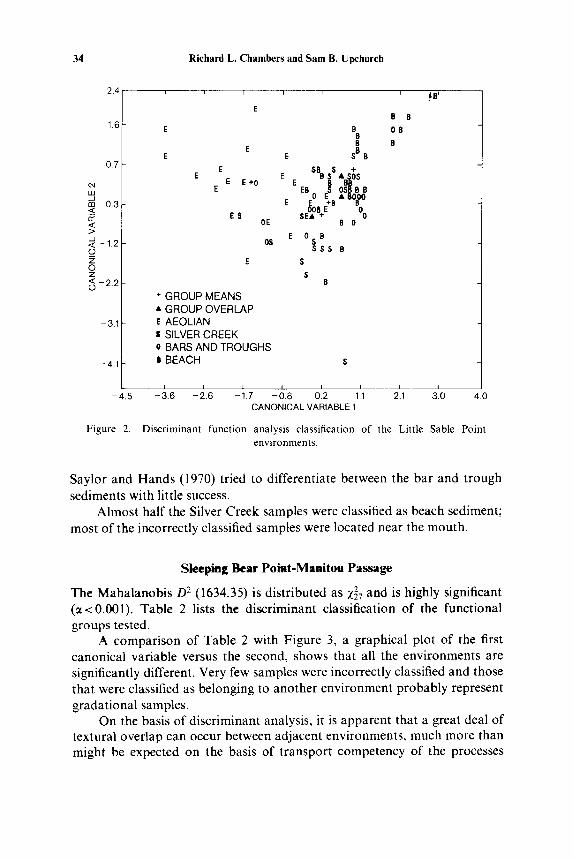
A comparison of Table 1 with Figure 2, a graphical representation of the first canonical variable versus the second, suggests that the aeolian samples constitute one textural group. Although fewer beach samples were incorrectly classified, there is much more textural overlap between the beach, fluvial, and bar and trough samples than between the aeolian group and the other groups. The bar and trough samples were classified mainly as beach and fluvial sediment. This may reflect an interplay between the beach-fluvial and littoral drift component, reflecting feedback between these environments. Earlier,
Table 1. Discriminant Function Classification of the Functional Groups Tested at Little Sable Point
Functional group tested Aeolian Silver Creek Beach Bars and troughs Total
Aeolian 17 5 0 3 25 Silver Creek t l 1 10 0 22 Beach 0 5 23 1 29 Bars and troughs 2 6 9 1 18 Total 20 27 42 5
34
2.4
1.6
0,7
cq
m 0.3 <
,< >
• ~ -1.2 _(2 z 0 z (~ - 2 . 2
-3 .1
-4 .1
Richard L. Chambers and Sam B. Upchurch
i i i
E
E
E E
E E
E E +0 E
ES OE
0S
* GROUP MEANS • GROUP OVERLAP E AEOLIAN s SILVER CREEK o BARS AND TROUGHS at BEACH
E
E E
E
B B B
S B B
$8 S + B $ ASO$
SE AB+ 0 B 0
0 8 S S S S B
S
S B
B B
OB
B
I l t I
- 4 . 5 - 3 . 6 - 2 . 6 -1 .7 - 0 . 8 012 11t 2'.1 310 CANONICAL VARIABLE 1
Figure 2. D i s c r i m i n a n t f u n c t i o n ana lys i s c lass i f ica t ion o f the Litt le Sable
e n v i r o n m e n t s .
4.0
Po in t
Saylor and Hands (1970) tried to differentiate between the bar and trough sediments with little success.
Almost half the Silver Creek samples were classified as beach sediment; most of the incorrectly classified samples were located near the mouth.
Sk~l~ng Bear Poiat-Manitou Passage
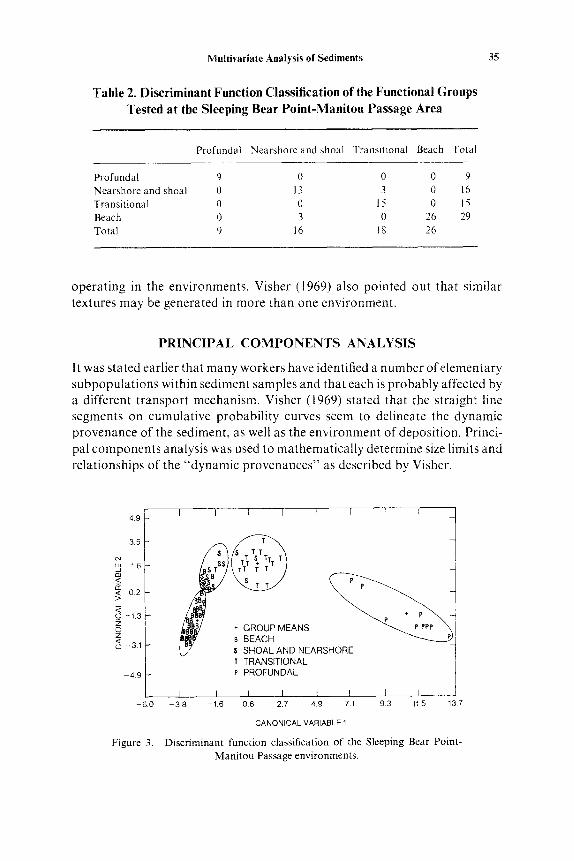
The Mahalanobis D 2 (1634.35) is distributed as ~2 7 and is highly significant (a<0.001). Table 2 lists the discriminant classification of the functional groups tested.
A comparison of Table 2 with Figure 3, a graphical plot of the first canonical variable versus the second, shows that all the environments are significantly different. Very few samples were incorrectly classified and those that were classified as belonging to another environment probably represent gradational samples.
On the basis of discriminant analysis, it is apparent that a great deal of textural overlap can occur between adjacent environments, much more than might be expected on the basis of transport competency of the processes
Multivariate Analysis of Sediments
Table 2. Discriminant Function Classification of the Functional Groups Tested at the Sleeping Bear Point-Manitou Passage Area
35
Profundal Nearshore and shoal Transitional Beach Total
Profundal 9 0 0 0 9
Nearshore and shoal 0 13 3 0 16
Transitional 0 0 15 0 15
Beach 0 3 0 26 29
Total 9 16 18 26
operating in the environments. Visher (1969) also pointed out that similar textures may be generated in more than one environment.
PRINCIPAL C O M P O N E N T S ANALYSIS
It was stated earlier that many workers have identified a number of elementary subpopulations within sediment samples and that each is probably affected by a different transport mechanism. Visher (1969) stated that the straight line segments on cumulative probability curves seem to delineate the dynamic provenance of the sediment, as well as the environment of deposition. Princi- pal components analysis was used to mathematically determine size limits and relationships of the "dynamic provenances" as described by Visher.
4.9
3.5
c~ ~.6
<
X 02
-1.3 z
-3.1
-4 .9
-6 .0
Figure 3.
1
I I [ I I I L I I - 3 . 8 -1 .6 0.6 2.7 4.9 7.1 9.3 11,5 13.7
CANONICAL VARIABLE 1
Discriminant function classification of the Sleeping Bear Poin t -
M a n i t o u Passage environments.
36 Richard L. Chambers and Sam B. Upchurch
It is important to point out the differences between the information extracted by principal components and Visher's graphical method. As dis- cussed by Allen, Castaing, and Klingebiel (1971), it is possible to analyze a large number of samples representing the entire sample suite without plotting and examining individual graphs. Also the populations are determined with- out any a priori judgment in defining the subpopulations. The major differ- ence is in the amount of variance explained by the two methods. Visher (1969) states that if it is assumed that transport processes are reflected in log-normal subpopulations, then the proportion of each subpopulation should be related to the relative importance of the corresponding process in the information contained in the whole size distribution.
Visher assumes then that the total sample variance is accounted for by the sum of the proportions of the subpopulations; however, he does not take into account variance produced by sampling error, measurement error, and local fluctuations in the prevailing energy conditions. If these variances are taken into account, then the proportions will account for something less than t 00% of the total variance. Principal components factors (those with eigenvalues >/1) account for 72-90% of the total grain-size variance in the environments analyzed. The remainder of the variance not explained can be assigned to the errors listed above (Imbrie, 1963; Allen, Castaing, and Klingebiel, 1971).
The size limits and relationships found in this study are comparable to the results of Allen, Castaing, and Klingebiel (1971). The differences found between these studies are probably due to the fact that: (1) Allen, Castaing, and Klingebiel (1971) apparently did not open their data matrix before calculating the correlation matrix, hence inducing spurious negative correla- tions; and (2) their results represent a composite of all the environments in their study area analyzed simultaneously, unlike the individual environmental analysis done in the present study.
The grain-sizes ranging from approximately 0.5 to 3 • have been assigned to the saltation mechanism described by Visher (1969). It has been suggested by Allen, Castaing, and Klingebiel (1971) and on the basis of this study that this group might represent a transition zone between two end- member transport mechanisms--surface creep and pure (uniform) suspen- sion. Analysis of factor loading profiles (see Allen, Castaing, and Klingebiel, 1971) suggests a break in the size distribution at approximately 2 ~. Generally, the sizes from 0.5 to 2 • have large positive loading values and the sizes from 2 to 3 • large negative values when these sizes load on the same factor, which accounts for the most variance. In one case (the profundal samples from Sleeping Bear Point-Manitou Passage) all the factor loadings were positive; sizes 0.5 to 1.5 • loaded highly on factor I, while sizes 2 to 4q) loaded highly on factor II. Since more than 50~ of the total profundal sample is finer than 4 ~, elimination of this fraction truly opened the data matrix, and the break seen at
Multivariate Analysis of Sediments 37
2 (I) is probably real and not an artifact of mathematics. Bagnold (1966) noted a definite change in sediment transportation at 2 q). He suggested that sediment coarser than 2 q5 would be transported as bedload and those sizes finer than 2 q~ to approximately 3.3 ~ would be transported as a nonuniform suspension mechanism. This nonuniform suspension mechanism, termed "graded suspension" by Passega (1957), denotes an increased density of particles nearer the bottom. Bagnold also stated that true suspension would affect sizes finer than 3.3 (I). Allen, Castaing, and Klingebiel (1971) placed the pure suspension-graded suspension break at approximately 3 ~.
A break in the sediment distribution at approximately 3 q~ was also found in this study. Almost all the samples collected at Little Sable Point were truncated at 3 ~. The amount of material finer than 3 ~ but coarser than 4 q~ was insignificant, generally less than l ~ o and, when present, was included in the 3 q~ size interval. A definite break at 3 • was found in the transitional samples at the Sleeping Bear Point-Manitou Passage study area. The sizes finer than 3 to 4 q~ have a high negative loading value on factor II, while sizes 2 and 2.5 @ have high positive values on this same factor. The 3 q~ size also has a high negative value, but is more closely associated with factor I.
It seems possible to delineate size populations from grain-size frequencies with principal components analysis. This is a more rapid method than that of plotting grain-size probability curves after Visher (1969), although the results of these two methods agree quite well. We agree with Stapor and Tanner (1975) that it is not warranted at this time to place rigid size limits on so-called "primary size populations." However, we disagree with their statement that the 50th percentile "break," which occurs roughly at 2 q~ in beach sediments, cannot be an end-to-end juncture between two component populations that are probably a result of a dynamic process constantly modifying the grain-size distribution. We found this break (actually the average for the samples analyzed) to occur in all the environments analyzed. As the energy increases, the juncture points should be shifted toward the coarser sizes, and as the energy decreases, they should be shifted toward the finer sizes. The hydro- dynamic behavior of the different sizes are dependent largely on their fall velocities. Therefore, the size limits should be expected to change as the intensity of the process acting on the sediment changes.
PRINCIPAL LATENT VECTOR ANALYSIS RESULTS
The multidimensional space defined by the grain-size variables was projected into two-dimensional space by using the first two principal components axes. The resulting plot contains 81 ~o of the total sample variance for the Sleeping Bear Point-Manitou Passage suite and 96% of the variance for the Little Sable
38 Richard L. Chambers and Sam B. U p c h u r c h
Point suite. The "transformed variables" for each analysis were calculated as follows:
First transformed variable = e ~ Z ~ + ~ 2 Z 2 + . . . +c<,,Z,,
Second transformed variable =/~lZl + ~ 2 Z z + . . . + ~, ,Z , ,
where the 7's and/3's represent the eigenvectors of the various size classes and the Z's are the standardized percent frequencies in a specific size class interval. Graphs of the transformed variables were used to study the textural variations within the samples and to compare the various "'environments" to one another.
Little Sable Point
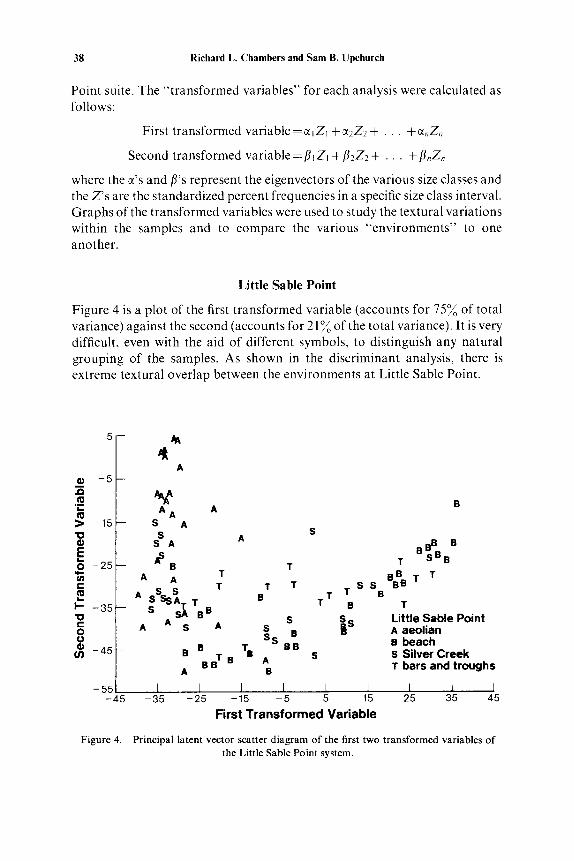
Figure 4 is a plot of the first transformed variable (accounts for 75~o of total variance) against the second (accounts for 21% of the total variance). It is very difficult, even with the aid of different symbols, to distinguish any natural grouping of the samples. As shown in the discriminant analysis, there is extreme textural overlap between the environments at Little Sable Point.
- 5 m
(o ..-
- 1 5 - - "0
E ~ - 2 5 - -
c
I-- - 3 5 - - '10 ¢,,,= 0 o
t,/) - 4 5 - -
- 5 5 - 4 5
~A 4
A
%, A A A
S A S
S A
P B
T A A T
S S A S SSA.r T
S S~ B B A A S A
. . T. T B
BB A
I I I - 3 5 - 2 5 - 1 5
S A
T T
T T S S UB-B T T T T B B
B T s s_ s L i t t le S a b l e Po in t
S I~ A aeo l ian Ss B B B B b e a c h A S S S i lver C r e e k
T bars a n d t r o u g h s B
I [ I I J ] - 5 5 15 25 35 45
F i r s t T r a n s f o r m e d V a r i a b l e
Figure 4. Principal latent vector scatter diagram of the first two transformed variables of the Little Sable Point system.
Multivariate Analysis of Sediments 39
50
o 40 .~1 30
20 ~ ~s
O
e- 10
e- 0 O
-10
- 2 0 - 6 0
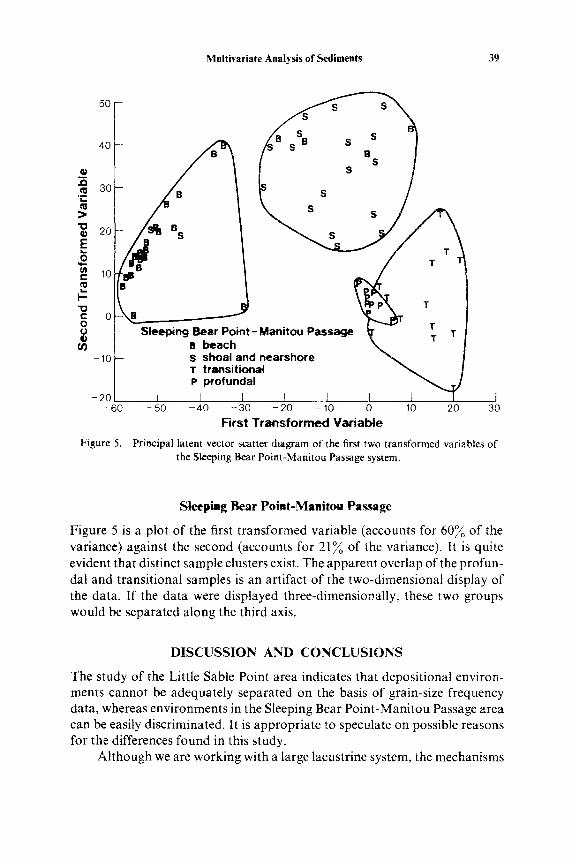
Figure 5.
S S
S S B S S
B S
S
S
S
T T
SieepingBBearbeachPOint-Manitou Passage ~ ~ T T
S s h o a l and nearshore T transitional P profundal
I I I I I 1 [ I - 5 0 - 4 0 - 3 0 - 2 0 -10 0 10 20 30
First Transformed Variable Principal latent vector scatter diagram of the first two transformed variables of
the Sleeping Bear Point-Manitou Passage system.
Sleeping Bear Point-Manitou Passage
Figure 5 is a plot of the first transformed variable (accounts for 60% of the variance) against the second (accounts for 21% of the variance). It is quite evident that distinct sample clusters exist. The apparent overlap of the profun- dal and transitional samples is an artifact of the two-dimensional display of the data. If the data were displayed three-dimensiop.ally, these two groups would be separated along the third axis.
DISCUSSION AND CONCLUSIONS
The study of the Little Sable Point area indicates that depositional environ- ments cannot be adequately separated on the basis of grain-size frequency data, whereas environments in the Sleeping Bear Point-Manitou Passage area can be easily discriminated. It is appropriate to speculate on possible reasons for the differences found in this study.
Although we are working with a large lacustrine system, the mechanisms
40 Richard L. Chambers and Sam B. Upchurch
in these environments are like the ones in a marine system, with the exception of tides. Solohub and Klovan (1970) state that scale is relevant only with respect to the detail in which the study is conducted. If proposed methods work in a large area, they should be equally effective in a small area, given an adequate sampling program.
The environmental boundaries in the two study areas were chosen differ- ently. In the Little Sable Point area, samples were collected from environ- ments of precisely known physiography, while the boundaries placed between the environments in the Sleeping Bear Point-Manitou Passage area were chosen, with the exception of the beach samples, on the basis of bathymetry. It is interesting that the environments chosen with less rigid boundaries discri- minated best.
The transport-depositional mechanisms operating in the Little Sable Point system have been shown to produce very similar grain-size frequencies in their respective sediments. These distributions reflect the energy in the transporting mechanism but give little indication of the "real" environment from which they were collected.
The results of this study can be expressed in terms of a very simple causal relationship: The grain-size distribution of the parent material (i.e., those grains available to the system) seems to control the efficiency of environmen- tal discrimination. If it is assumed that textural modifications are energy- dependent, then systems with a limited grain-size range (i.e., truncated), such as the Little Sable Point system, may not reflect the entire energy spectrum of the system, whereas systems with unlimited grain-size ranges, such as the Sleeping Bear Point-Manitou Passage system, can reflect different energy levels in their sediment distributions. Even though different transport mechanisms are at work in a system, sediment with narrow size ranges may only be affected by one mechanism and hence have only one degree of freedom for modification. In the tails of the distributions, those sediments with broader size ranges have more degrees of freedom in which to reflect the energy spectrum, and should be affected most.
The presence of a fine tail (silt/clay fraction) has been suggested as a sensitive environmental indicator (Passega, 1957, 1972; Bagnold, 1966; Klovan, 1966; Koldijk, 1968). This fraction was shown indirectly to be a significant factor for environmental discrimination of the Sleeping Bear Point-Manitou Passage sediment suite. Indirectly, in the sense that the matrix was converted to standardized scores prior to analysis, which in effect took into account the presence of this fraction even though it was deleted from the analysis to avoid closure problems. Stapor and Tanner (1975) found that the coarse tail was the most sensitive parameter in their study of beach, beach ridges, and aeolian dunes.
The results in this study also tend to confirm, on the basis of principal
Multivariate Analysis of Sediments 41
components analysis, the presence of two or more subpopulations in size distributions. The subpopulations may be related to different energy-depen- dent transport mechanisms. Although this technique does not determine which mechanisms control the size populations, it does show that at least two or three factors are needed to explain a major portion of the variance in a set of grain-size data. Also, the subpopulations described by principal components analysis support the earlier work of Moss (1962, 1963) and Visher (1969).
As shown in this study, it is difficult to generalize with certainty as to whether depositional environments can be uniquely identified in recent depo- sits from only grain-size analysis. The problem of environmental discrimina- tion on the basis of texture is further complicated in ancient deposits because of lithification and diagenesis of the sediment. Because it is often impossible to make a unique environmental discrimination, grain-size should not be the only parameter used for environmental analysis. Other useful parameters include: fossils, sedimentary structures, grain-shape, mineralology, and/or geometry of the units in question.
There is a great need at this time for more experimental flume and wave tank studies with much more sophisticated in situ measurements and collec- tion techniques in order to establish the hydrodynamic aspects of sediment transport mechanisms, which up to now have been studied mainly by some type of grain-size analysis. Once these techniques have been established and a reasonable data base established, the multivariate techniques applied in this study could be used to establish a more objective classification of sediment types and processes. Even if environments cannot be uniquely identified in the fossil deposits, knowledge of energy-transport relationships of recent or experimental deposits will help to better interpret paleo-flow regimes.
ACKNOWLEDGMENTS
We would like to thank Dr. Richard Davis of the University of South Florida, Tampa; Dr. L. James Charlesworth of the University of Toledo, Ohio; and Gerald L. Bell of the Great Lakes Environmental Research Laboratory for providing valuable suggestions for the improvement of this paper.
R E F E R E N C E S
Allen, G. P., Castaing, P., and Klingebiel, A., 1971, Distinction of elementary sand populations in the Gironde estuary (France) by R-mode factor analysis of grain-size data: Sedimento- logy, v. 19, p. 21-35.
Ayers, J. C., Chandler, D. C.~ Lauff, G. H., Power, C. F., and Henson, E. B., 1958, Currents and water masses of Lake Michigan: Pub. 3, Great Lakes Res. Div., University of Michigan, Ann Arbor, Michigan, 169 p.
42 Richard L. Chambers and Sam B. Upchurch
Bagnold, R. A., 1966, An approach to the sediment transport problem for general physics: U.S. Geol. Surv. Prof. Pap., 422 (1), p. 11-137.
Butler, J. C., 1976, Principal components analysis using the hypothetical closed array: Jour. Math. Geology, v. 8, no. 1, p. 25-36.
Chayes, F., 1960, On correlation between variables of constant sums: Jour. Geophys. Research, v. 65, no. I2, p. 4185-4193.
Chayes, F., 1962, Numerical correlation and petrographic variation: Jour. Geology, v. 70, p. 440-452.
Davis, J. C., 1973, Statistics and Data Analysis in Geology: John Wiley and Sons, Inc., New York, p. 442 533.
Davis, D. K., and Ethridge, F. G., 1975, Sandstone composition and depositional environment: Am Assoc. Petrol. Geology, v. 59, no. 2, p. 239 264.
Dixon, W. J., (ed.), 1970, Biomedical Computer Programs: The University of California Press, Los Angeles, California, p. 233 254.
Feldhausen, P. H., and Ali, S. A., 1975, Sedimentary facies determined by multivariate statistical techniques: Sed. Geology, v. 14, p. 259-274.
French, W. E., 1964, A correlation of currents and sedimentary activity in the Manitou Passage area of Lake Michigan: Pub. 11, Great Lakes Research Div., University of Michigan, Ann Arbor, Michigan, p. 142 146.
Friedman, G. M., 1967, Dynamic processes and statistical parameters compared for size fre- quency distribution of beach and river sands: Jour. Sed. Petrol., v. 37, no. 2, p. 327-354.
Folk, R. F., and Ward, W. C., 1957, Brazos River bar, a study in the significance of grain-size parameters: Jour. Sed. Petrol., v. 27, p. 3-26.
Gillis, W. T., and Bakeman, K. I., 1963, The disappearing Sleeping Bear Sand Dune: Mich. Botanist, v. 2, p. 45-54.
Hough, J. L., 1958, Geology of the Great Lakes: University of Illinois Press, Urbana, Illinois, p. 20-24.
Imbrie, J., 1963, Factor and vector analysis programs for analyzing geologic data: Northwestern University, Evanston, Illinois, Tech. Rept. 6, D.N.R. Task No: 389-135, Contr. No. 1228(26), 83 p.
Klovan, J. E., 1966, The use of factor analysis in determining depositional environments from grain-size distributions: Jour. Sed. Petrol., v. 36, p. 5749.
Koldijk, W. S., 1968, On environment-sensitive grain-size parameters: Sedimentology, v. 10, p. 57-69.
Krumbein, W. C., and Graybill, F. A., 1965, An Introduction to Statistical Models in Geology: McGraw-Hill Book Co., New York, p. 248-275, 357 379.
Le Maitre, R. W., 1968, Chemical variation within and between volcanic rock series--a statistical approach: Jour. Petrol., v. 9, p. 220-252.
McKinney, T. F., and Friedman, G. M., 1970, Continental shelf sediments of Long Island, New York: Jour. Sediment. Petrol., v. 40, p. 213-248.
Moss, A. J., 1962, The physical nature of common sandy and pebbly deposits, II: Am. Jour. Sci., v. 260, p. 337-373.
Moss, A. J., 1963, The physical nature of common sandy and pebbly deposits II: Am. Jour. Sci., v. 261, p. 297-343.
Passega, R., 1957, Texture as characteristic of clastic deposition: Am. Assoc. Petroleum Geol. Bull., v. 41, p. 1304-1319.
Passega, R., 1972, Sediment sorting related to basin mobility and environment: Am. Assoc. Petrolum Geol. Bull., v. 56, p. 2440-2450.
Sahu, B. K., 1964, Depositional mechanisms from size analysis of clastic sediments: Jour. Sed. Petrol. v. 34, p. 73-83.
Multivariate Analysis of Sediments 43
Saylor, J. H., and Hands, E. B., 1970, Properties of longshore bars in the Great Lakes: Proc. of 12th Coastal Engineering Conf., Washington, D.C., p. 839 853.
Solohub, J. T., and Klovan, J. E., 1970, Evaluation of grain-size parameters in lacustrine environments. Jour. Sed. Petrol., v. 40, p. 81 101.
Stapor, F. W., and Tanner, W. F., 1975, Hydrodynamic implications of beach, beach ridge, and dune grain-size studies: Jour. Sed. Petrol., v. 45, no. 4, p. 926 931.
Upchurch, S. B., 1970a, Sedimentation on the Bermuda platform: U.S. Lake Survey Research Report 2-2, Department of the Army, U.S. Lake Survey District, Corps of Engineers, 172 p.
Upchurch, S. B., 1970b, Mixed-population sediment in nearshore environments: Proc. 13th Conf. Great Lakes Res., p~ 768-778.
Upchurch, 1972, Discriminant analysis of Bermuda carbonate strand-line sediment: Bull. Geol. Soc. America, v. 83, p. 87 94.
Upchurch, 1973, Lake Michigan coastal processes: Leland to Manistee, Michigan, in Geology and the Environment, Chambers, R. L., and Straw, W. T., (eds.): Michigan Basin Geological Society, p. 54-66.
U.S. Department of Commerce News, 1971, No hazards found at Sleeping Bear dunes slide site. Circular N/R 71-40 (Oct. t971) OB-0-5-7-75-9-55B-SNB-75B-55-5N-7N, Lake Survey Center, NOAA, Detroit, Michigan.
Visher, G. S., 1965, Fluvial processes as interpreted from ancient and recent fluvial sediments; in
Primary sedimentary structures and their hydrodynamic interpretations: G. V. Middleton, (ed.), Soc. Econ. Paleon. Mineral. Sp. Pap. 12, p. 116 133.
Visher, G. S., 1969, Grain-size distributions and depositional processes: Jour. Sed. Petrol., v. 39, no. 3, p. 1074-1106.