multivariable network associated with cognitive decline and dementia
TRANSCRIPT
N
A
iudi(swpa
p©
K
1
aoTsc(p
Sf
0d
ARTICLE IN PRESSBA-7071; No. of Pages 13
Neurobiology of Aging xxx (2008) xxx–xxx
Multivariable network associated with cognitive decline and dementia
Federico Licastro a,∗, Elisa Porcellini a, Martina Chiappelli a, Paola Forti b,Massimo Buscema c, Giovanni Ravaglia b, Enzo Grossi d
a Department of Experimental Pathology, Via San Giacomo 14, 40126 Bologna, Italyb Department of Internal Medicine, Cardiology and Hepatology, School of Medicine, Via Albertoni 15, 40138 Bologna, Italy
c Semeion Research Center of Communication Science, Via Sersale 117, 00128 Roma, Italyd Bracco SpA, via Folli 50, 20134 Milan, Italy
Received 25 September 2007; received in revised form 25 March 2008; accepted 26 March 2008
bstract
Data mining of a large data base from the population longitudinal study named “The Conselice Study” has been the focus of the presentnvestigation. Initially, 65 years old or older participants were interviewed, underwent medical and cognitive examination, and were followedp for 5 years: 937 subjects completed the follow-up. Relationships of 35 genetic and/or phenotypic factors with incident cognitive decline andementia were investigated. The new mathematical approach, called the Auto Contractive Map (AutoCM), was able to show the differentialmportance of each variables. This new variable processing created a semantic connectivity map that: (a) preserved non-linear associations;b) showed connection schemes; (c) captured the complex dynamics of adaptive interactions. This method, based on an artificial adaptiveystem, was able to define the association strength of each variable with all the others. Few variables resulted to be aggregation points andere considered as major biological hubs. Three hubs were identified in the hydroxyl-methyl-gutaryl-CoA reductase (HMGCR) enzyme,lasma cholesterol levels and age. Gene variants and cognate phenotypic variables showed differential degrees of relevance to brain agingnd dementia.
This data analysis method was compared with another mathematical model called mutual information relevance network and results areresented and discussed.
2008 Elsevier Inc. All rights reserved.
eywords: Brain aging; Dementia; Data base analysis; Connectivity map; Predictive factors
aMvaapi
. Introduction
Alzheimer’ disease (AD) is a chronic progressive diseasend the most frequent cause of mental disability and lossf independence among the elderly (Aronson et al., 1991).he disease is characterized by neuro-pathological hallmarksuch as, synapsis loss, extracellular amyloid deposition, intra-
Please cite this article in press as: Licastro, F., et al., Multivariable netwAging (2008), doi:10.1016/j.neurobiolaging.2008.03.019
ellular fibrillary tangle deposits and neuronal degenerationTerry, 1994; Trojanowski et al., 1997). A prominent neuro-athological feature of the AD brain is also represented by
∗ Corresponding author at: Dipartimento di Patologia Sperimentale, Viaan Giacomo 14, 40126 Bologna, Italy. Tel.: +39 0512094730;ax: +39 0512094746.
E-mail address: [email protected] (F. Licastro).
hiL
cvcd
197-4580/$ – see front matter © 2008 Elsevier Inc. All rights reserved.oi:10.1016/j.neurobiolaging.2008.03.019
strogliosis and microglia activation (Griffin et al., 1989;cGeer et al., 1993; Rogers et al., 1988). Abnormal acti-
ation of glia cells is now considered an early phenomenonssociated with the development of the disease (Griffin etl., 1998) and has been suggested to be implicated in theathogenesis of AD (Mrak et al., 1995). Genetic studies onnflammatory gene polymorphism associated with the diseaseave reinforced the notion that abnormal immune responsesn the brain play a pivotal role in the disease (Licastro, 2002;icastro and Chiappelli, 2003).
Some inflammatory genetic markers and the levels of their
ork associated with cognitive decline and dementia, Neurobiol
ognate proteins in the blood have been related to the con-ersion of pre-dementia states, such as subjects with mildognitive impairment (MCI) or cognitive impairment and noementia (CIND) to AD (Chiappelli et al., 2006a,b). A gene
INNBA-7071; No. of Pages 13
2 logy of
ptheiTpsbttd
tsTpp
evt
fisdan
pl2ed
dlnA2ebaa
cvtdi
dstma
aiGahatAaolpvgItcc
vdtgwfobos2
anci
sddwhp
Rtc
toTi
ARTICLEF. Licastro et al. / Neurobio
olymorphism in the promoter region of an acute phase pro-ein called alpha-1 antichymotrypsin (ACT) or SERPINA 3,as been found to be associated with an increased risk ofarly onset AD and levels of the ACT protein were elevatedn sera from AD and CIND patients (Licastro et al., in press).hese findings have raised the question whether genetic orhenotypic markers might be used for the screening of per-ons at high risk of developing cognitive decline and dementiaefore clinical manifestation of the diseases. The answer tohis question might open the possibility of starting preven-ive protocols for high-risk healthy subjects with the goal ofecreasing AD incidence.
AD is a complex multi-factorial disease and it is unlikelyhat a single biomarker may carry enough information forcreening the potential risk of cognitive decline and dementia.herefore, the use of several biomarkers, either genetic orhenotypic, may be necessary for a comprehensive screeningrotocol.
To approach this complex situation, informative biomark-rs should be generated during longitudinal studies that canalidate the clinical endpoints, e.g. cognitive decline, demen-ia or healthy cognitive performance.
The statistical evaluation of multiple variables in a suf-ciently large population is another complex issue and newtatistical models able to connect several factors with theisease, to evaluate the degree of linkage among variablesnd their association with the disease or its absence areeeded.
The Conselice Study of brain aging is a population-basedrospective study focused on an homogeneous elderly popu-ation from Northern Italy (Forti et al., 2001; Ravaglia et al.,001). The principal aim of this investigation was to explorenvironmental, epidemiological and intrinsic risk factors forementia in the elderly (Ravaglia et al., 2001).
From this study a biological and clinical data baseuring the 5-year follow-up has been generated and bio-ogical markers have been found individually associated orot with AD risk, incident cognitive decline and incidentD (Ravaglia et al., 2005; Ravaglia et al., 2006a, Sep.8; Ravaglia et al., 2006b; Ravaglia et al., 2007). How-ver, results were not conclusive or completely satisfactory,ecause of the limited power of classical statistical analysisnd the difficulty in solving multiple concomitant variablenalysis.
Here, we applied a novel data mining process to con-omitantly explore the possible association of 35 differentariables with CIND and AD and the possible presence of pat-erns or systematic relationship among variables, as recentlyescribed in other topics of medicine (Buscema and Grossi,n press).
This method of data mining is an analytical processesigned to search a data base for consistent patterns and/or
Please cite this article in press as: Licastro, F., et al., Multivariable netAging (2008), doi:10.1016/j.neurobiolaging.2008.03.019
ystematic relationships between variables. The method hashe aim to detect patterns from new subsets of data. The ulti-
ate goal of data mining is to discover hidden trends andssociations among variables.
oipp
PRESSAging xxx (2008) xxx–xxx
The more common algorithms of linear projections of vari-bles are the principal component analysis (PCA) and thendependent component analysis (ICA); the former requires aaussian distribution of data, while the latter does not require
ny specific distribution. These classical statistical techniquesave limited power when the relationships between vari-bles are non-linear. Moreover, PCA and ICA are not ableo preserve the geometrical structure of the original space.pplication of these methods may lose important information
nd establishing precise association among variables havingnly the contiguity as a known element is difficult. Anotherimitation of currently used statistical methods is that map-ing is generally based on a specific kind of “distance” amongariables (e.g. Euclidean, City block, correlation, etc.) andives origin to a “static” projection of possible associations.n other words, the intrinsic dynamics due to active interac-ions of variables in living systems of the real world (whichould be captured by means of artificial adaptive systems) isompletely lost.
A connection scheme able to hypothesize links amongariables, i.e. minimum spanning tree (MST) algorithm, asescribed by Kruskal (1956), could increase the informa-ion obtained by the map. The Kruskal MST algorithm ofraph theory finds a minimum spanning tree for a connectedeighted graph. MST method finds a subset of the edges that
orm a tree that includes every vertex, where the total weightf all the edges in the tree is minimized. This function haseen recently applied in the medical field, especially in biol-gy and medical imaging. However, the MST algorithm istill rare in medical clinics (Frimmel et al., 2004; Lee et al.,006).
Here, we describe a new paradigm of variables mappingble to create a semantic connectivity map in which: (a)on-linear associations are preserved; (b) there are explicitonnections schemes; (c) the complex dynamics of adaptiventeractions is captured.
Data recorded during the 5-year follow-up from The Con-elice Study participants were elaborated in relation to threeifferent clinical endpoints: no cognitive decline, CIND andementia. Three major biological hubs connecting variablesith the three different cognitive conditions were identified inydroxyl-methyl-gutaryl-CoA reductase enzyme (HMGCR),lasma cholesterol levels and age.
Biological hubs of variables are detected by the analysis.elated dependent variables converge to these hubs, that in
urn may be considered as relevant biological variables in theonnectivity map.
Several gene variants of different inflammatory genes andheir cognate phenotypic factors showed a variable degreef relevance to brain aging and development of dementia.his is the first attempt to describe an integrated approach
llustrating 35 variables in association with the risk of devel-
work associated with cognitive decline and dementia, Neurobiol
ping cognitive impairment and dementia in the elderly. Thedentification of biological hubs suggests possible patterns ofharmacological and non-pharmacological intervention withreventive potential against cognitive impairment.
INNBA-7071; No. of Pages 13
logy of
2
2
oaisgyatbR
IA(e
a
2
untrbalaaavCilp
s
rpcdAsfiobsml
“t
wneddibeFmca
asK
3
n
t
taoilAhbCtTta
cwvsmvpecd
ARTICLEF. Licastro et al. / Neurobio
. Materials and methods
.1. Data base generation
Data were collected from 1200 elderly, 65 years old orlder, living in Conselice county in northern Italy. Femalend male participants were interviewed and underwent med-cal examination and cognitive evaluation in 1999. A bloodample from each subject was taken and each participant wasiven a computerized radiogram scan of the brain. After 5ears subjects underwent medical and cognitive re-evaluationnd 937 elderly completed the follow-up. A detailed descrip-ion of the clinical protocol and the assessed variables haseen already described elsewhere (Ravaglia et al., 2001;avaglia et al., 2007).
Diagnosis of dementia was performed according to DSM-V criteria and clinical AD was defined using the NINCDS-DRDA criteria (McKhann et al., 1984). Vascular dementia
VD) was diagnosed using NINDS-AIREN criteria (Romant al., 1993).
Diagnosis of CIND was performed according methodslready described (Ravaglia et al., 2004).
.2. Statistical analysis
The Conselice data base has the aim of increasing ournderstanding of the pathogenetic pathway leading to cog-itive decline and dementia. This goal has been achievedhrough a new mathematical approach able to point out theelative relevance of each variable in representing a majoriological hub. This new paradigm of variable processingims to create a semantic connectivity map in which: (a) non-inear associations are preserved; (b) connections schemesre explicit; (c) the complex dynamics of adaptive inter-ctions is captured. This method is based on an artificialdaptive system able to define the association strength of eachariable with all the others in any dataset, named the Autoontractive Map (AutoCM). The architecture and mathemat-
cs of AutoCM were invented, tested and implemented in Canguage, as described elsewhere (Buscema and Grossi, inress).
An appendix describing the mathematics and equationsupporting the methodology is provided (see Appendix A).
This approach highlights affinities among variables aselated to their dynamical interaction rather than to their sim-le contingent spatial position. This approach describes aontext typical of living systems where a continuous timeependent complex change in the variable value is present.fter the training phase, the matrix of the AutoCM repre-
ents the warped landscape of the dataset. We apply a simplelter (minimum spanning tree by Kruskal) to the matrixf AutoCM system to show the map of main connections
Please cite this article in press as: Licastro, F., et al., Multivariable netwAging (2008), doi:10.1016/j.neurobiolaging.2008.03.019
etween and among variables and the principal hubs of theystem. These hubs can also be defined as variables with theaximum amount of connections in the map. The AutoCM
earning equations, the specific mathematics linked to the
Awcw
PRESSAging xxx (2008) xxx–xxx 3
contractive factor” and the association to minimum spanningree (MST) algorithm, are described in detail in Appendix A.
The stability of the MST statistical method was verifiedith a validation protocol here described. From the origi-al dataset, 10 different and independent random samples,ach one including the 90% of data points of the originalataset were generated. Thereafter, 10 different and indepen-ent AutoCM on the 10 new datasets were trained and anndependent MST for each AutoCM matrix was built. A celly cell comparison regarding the zero–one squared matrix ofach MST was performed (end point: 0 = no link; 1 = link).or each possible connection the summation of the agree-ent coefficient among the 10 MST was made: in each ai,j
ell the 10 MST may agree from 0.5 (no agreement) to 1 (fullgreement).
Finally, data analysis was also performed according tonother mathematical model, i.e. the mutual informationcore, following the method elsewhere described (Butte andohane, 2000).
. Results
A summary of data from The Conselice Study at the begin-ing and after the 5-year follow up is reported in Table 1.
A list of variables investigated and their functional defini-ion used in this study is reported in Tables 2 and 3.
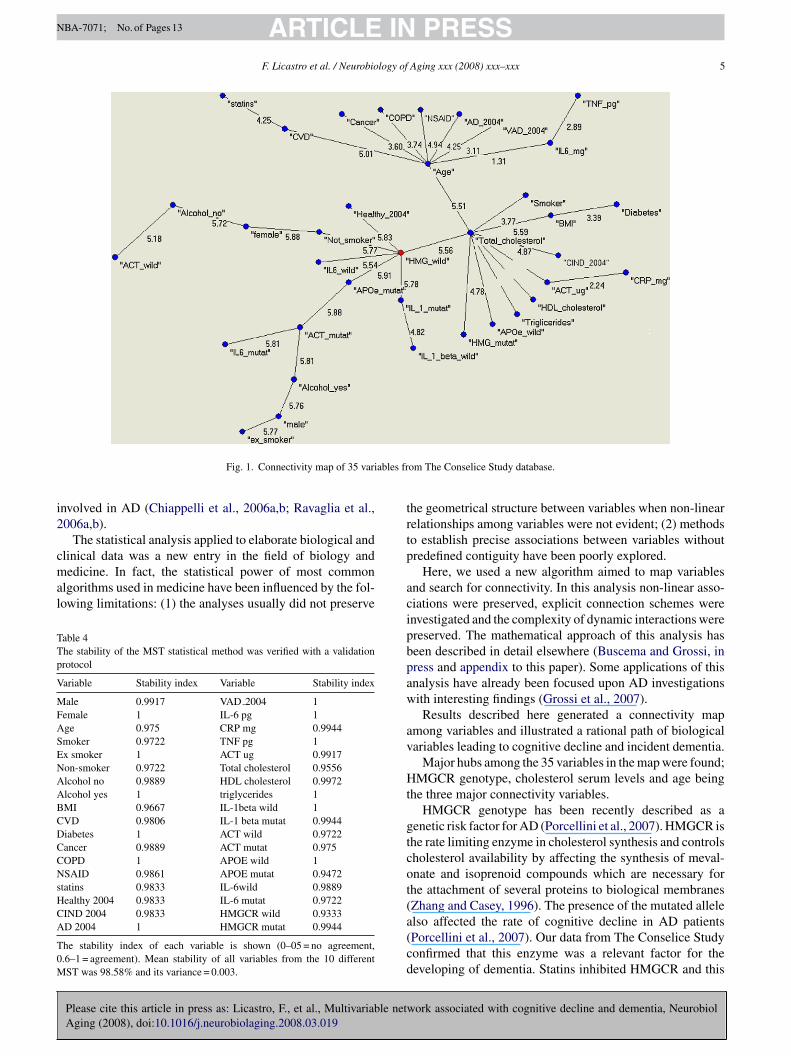
Two time points are considered; the first one representshe baseline time point (time 0) where clinical, biologicalnd genetic data have been collected in 1999. The secondne represents the follow-up time point (time 1) where clin-cal data from participants have been collected in 2004; thisatter point also represents the cognitive function outcome.fter the training phase of the statistical process, AutoCMas been applied using all records from all subjects in the dataase. The connectivity map related to 35 variables from Theonselice Study data base is shown in Fig. 1. The map illus-
rates the most relevant associations present in the data base.hree major biological hubs or points of variable aggrega-
ion were identified: (1) a SNP in the HMGCR (non-mutatedllele); (2) plasma cholesterol levels; (3) age.
Different genotypic, phenotypic, clinical, pharmacologi-al or habit variables converged to the three hubs. Femalesith no history of smoking or alcohol consumption con-erged to the first HMGCR hub. Males with past history ofmoking, present alcohol consumption and carriers of theutated alleles in the ACT, APOE and IL-6 genes also con-
erged to this first MHGCR hub. These two gender relatedathways led to the second major hub; blood cholesterol lev-ls. Other different genotypic, phenotypic and clinical statesonverged to the cholesterol hub, each variable showing aifferential degree of relation with cholesterol. For instance,
ork associated with cognitive decline and dementia, Neurobiol
CT, HDL and triglycerides serum levels, as well as BMI,ere highly connected with blood cholesterol. Incident CIND
ases (CIND 2004) also showed a significant correlationith cholesterol levels. The degree of correlation between
ARTICLE IN PRESSNBA-7071; No. of Pages 13
4 F. Licastro et al. / Neurobiology of Aging xxx (2008) xxx–xxx
Table 1Description of the population investigated at the beginning (1999/2000) and at the end of the follow up (2003/2004)
Eligible individuals Non-participantsa at the beginning Final participants Prevalent dementia Cognitively non-classificable Dementia free cohort
1999/2000N = 1353 n = 337 n = 1016 n = 60 n = 19 n = 937
Reassessed population Non-reassessedb population Final population Incident dementia Cognitively non-classificable Dementia free cohort
Follow up 2003/2004n = 109 n = 4 n = 695
vsh
wc(ta
stbvc
bmaa
TG
G
P
O
Table 3Definitions of functional and non-parametric variables used in the statisticalanalysis
Clinical statesAD 2004 = patients with Alzheimer’s disease at the end of the follow upAge = chronological ageAlcohol yes, alcohol no = alcohol consumption habitCOPD = patients with chronic obstructive lung diseaseCIND 2004 = patient with clinical diagnosis of cognitive impairment but
no dementiaCVD = cardiovascular diseasesDiabetes = clinical diagnosis of non-autoimmune diabetesFemale, male = gender definitionHealthy 2004 = cognitively non-impaired at the end of the follow upSmokers, non-smokers, ex-smokers = cigarette smoking habitTumor = patients with diagnosis of cancerVAD 2004 = patients with vascular dementia at the end of the follow up
T
N = 937 n = 133 n = 804a Refusals n = 271; deceased n = 59; not found n = 7.b Refusals n = 74; deceased n = 28; not found n = 31.
ariables is described by the number between each variablehowed in the connectivity map: the higher the score, theigher the link between the two variables.
Age represented the third hub and cholesterol blood levelsere highly correlated with this chronological variable. Most
linical states such as, incident AD (AD 2004), incident VDVD 2004), patients with cancer or BPCO converged in tohis third hub; incident AD showing the highest degree ofssociation (4.25).
Pharmacological variables, e.g. the use of statins and non-teroid anti-inflammatory drugs (NSAID), also converged tohis third hub. Statins, a major prescription for decreasinglood cholesterol, converged to the age hub through cardio-ascular diseases (CVD). On the other hand, NSAID directlyonverged on age.
The stability of the MST statistical method was verified
Please cite this article in press as: Licastro, F., et al., Multivariable netAging (2008), doi:10.1016/j.neurobiolaging.2008.03.019
y a validation protocol, as described in the material andethods. For each possible connection the summation of the
greement coefficient among the 10 MST was made: in eachi,j cell the 10 MST may agree from 0.5 (no agreement) to
able 2enetic and phenotypic variables used in the statistical analysis
enetic variable (gene polymorphism)ACT = alpha-1 antichymotrypsin SNP* at −51 in the promoter region,
allele mutation = TAPOE = apolipoprotein E gene variation 2, 3 and 4 alleles, allele
mutation = 4HMG = hydroxy-methyl-glutayl CoA reductase, SNP at −694, allele
mutation = AIL-1 beta = interleukin-1 beta, SNP at −511 in the promoter region,
allele mutation = TIL-6 = interleukin-6, SNP at −674 in the promoter region, allele
mutation = Chenotypic blood variableACT = serum level (�g/ml) assessed by competitive non-commercial
ELISACholesterol = serum levels (mg/dl) assessed by commercial clinical lab
assayCRP = serum levels (mg/l) assessed by commercial nephelometric assayHDL = serum levels (mg/dl) assessed by commercial clinical lab
methodologyIL-6 = serum level (pg/ml) assessed by commercial ELISATNF = tumor necrosis factor-alpha (pg/ml) assessed by commercial
ELISATriglycerides = serum levels assessed by commercial clinical lab assay
ther clinical variableBMI = body max index
1rvsr
taivtAmc2
4
ud
eai
herapyNSAID = non-steroid anti-inflammatory drugsStatins = drugs with anti cholesterol action
(full agreement). Results from this validation analysis areeported in Table 4. All variables showed a stability indexery close to full agreement (full agreement = 1) and the meantability index of the variables from the validation protocolesulted 98.58% with a variance of 0.003.
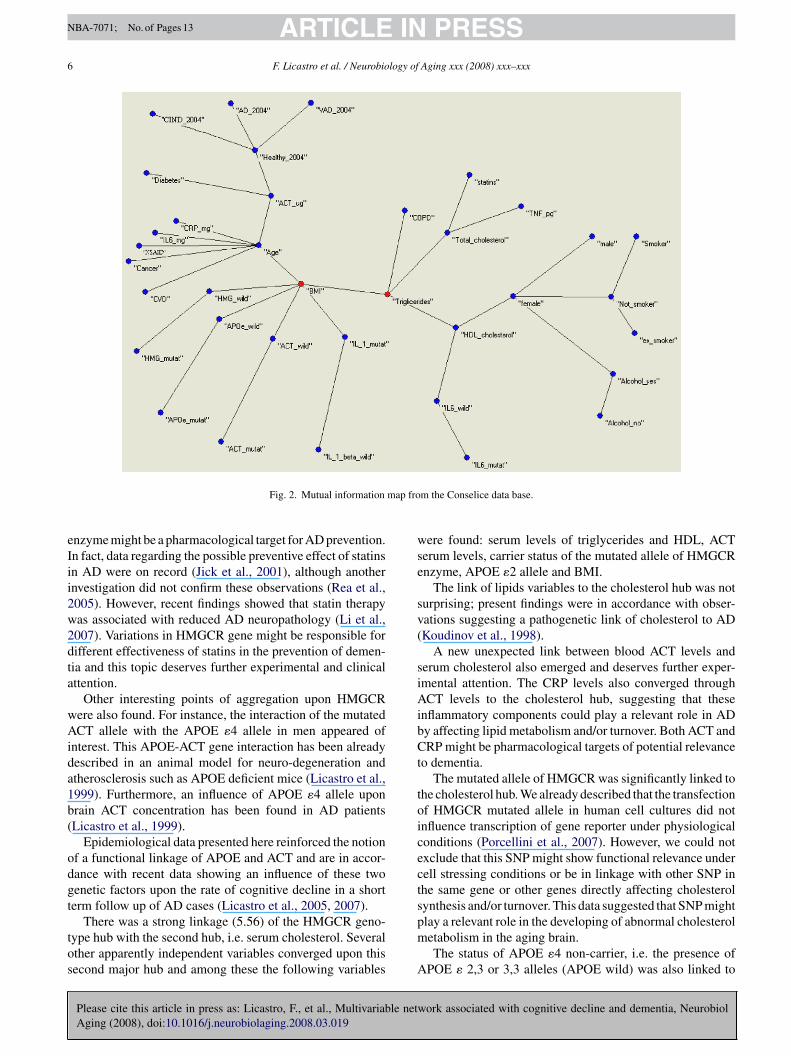
Data were also analyzed by a different algorithm, i.e.he mutual information score, and the map of relationshipmong variables is shown in Fig. 2. This second mathemat-cal approach used mutual information distance to map theariables after a MST filtering. This second map was par-ially but significantly different; triglycerides, BMI, age andCT blood levels were major aggregation points. Further-ore, the clinical status of incident AD, VAD and CIND
onverged to the point representing the controls (healthy004).
. Discussion
AD is a complex and multi-factor disease. Therefore, it isnlikely that a single biomarker may be determinant in theiagnosis or monitoring the progression of the disease.
work associated with cognitive decline and dementia, Neurobiol
This is the main reason why we chose to concomitantlyvaluate several biological and clinical variables. These vari-bles were selected according our previous experience show-ng them associated or linked to pathogenetic mechanisms
ARTICLE IN PRESSNBA-7071; No. of Pages 13
F. Licastro et al. / Neurobiology of Aging xxx (2008) xxx–xxx 5
ables fr
i2
cmal
TTp
V
MFASENAABCDCCNsHCA
T0M
trt
Fig. 1. Connectivity map of 35 vari
nvolved in AD (Chiappelli et al., 2006a,b; Ravaglia et al.,006a,b).
The statistical analysis applied to elaborate biological and
Please cite this article in press as: Licastro, F., et al., Multivariable netwAging (2008), doi:10.1016/j.neurobiolaging.2008.03.019
linical data was a new entry in the field of biology andedicine. In fact, the statistical power of most common
lgorithms used in medicine have been influenced by the fol-owing limitations: (1) the analyses usually did not preserve
able 4he stability of the MST statistical method was verified with a validationrotocol
ariable Stability index Variable Stability index
ale 0.9917 VAD 2004 1emale 1 IL-6 pg 1ge 0.975 CRP mg 0.9944moker 0.9722 TNF pg 1x smoker 1 ACT ug 0.9917on-smoker 0.9722 Total cholesterol 0.9556lcohol no 0.9889 HDL cholesterol 0.9972lcohol yes 1 triglycerides 1MI 0.9667 IL-1beta wild 1VD 0.9806 IL-1 beta mutat 0.9944iabetes 1 ACT wild 0.9722ancer 0.9889 ACT mutat 0.975OPD 1 APOE wild 1SAID 0.9861 APOE mutat 0.9472
tatins 0.9833 IL-6wild 0.9889ealthy 2004 0.9833 IL-6 mutat 0.9722IND 2004 0.9833 HMGCR wild 0.9333D 2004 1 HMGCR mutat 0.9944
he stability index of each variable is shown (0–05 = no agreement,.6–1 = agreement). Mean stability of all variables from the 10 differentST was 98.58% and its variance = 0.003.
p
acipbpaw
av
Ht
gtcot(a(cd
om The Conselice Study database.
he geometrical structure between variables when non-linearelationships among variables were not evident; (2) methodso establish precise associations between variables withoutredefined contiguity have been poorly explored.
Here, we used a new algorithm aimed to map variablesnd search for connectivity. In this analysis non-linear asso-iations were preserved, explicit connection schemes werenvestigated and the complexity of dynamic interactions werereserved. The mathematical approach of this analysis haseen described in detail elsewhere (Buscema and Grossi, inress and appendix to this paper). Some applications of thisnalysis have already been focused upon AD investigationsith interesting findings (Grossi et al., 2007).Results described here generated a connectivity map
mong variables and illustrated a rational path of biologicalariables leading to cognitive decline and incident dementia.
Major hubs among the 35 variables in the map were found;MGCR genotype, cholesterol serum levels and age being
he three major connectivity variables.HMGCR genotype has been recently described as a
enetic risk factor for AD (Porcellini et al., 2007). HMGCR ishe rate limiting enzyme in cholesterol synthesis and controlsholesterol availability by affecting the synthesis of meval-nate and isoprenoid compounds which are necessary forhe attachment of several proteins to biological membranesZhang and Casey, 1996). The presence of the mutated allele
ork associated with cognitive decline and dementia, Neurobiol
lso affected the rate of cognitive decline in AD patientsPorcellini et al., 2007). Our data from The Conselice Studyonfirmed that this enzyme was a relevant factor for theeveloping of dementia. Statins inhibited HMGCR and this
ARTICLE IN PRESSNBA-7071; No. of Pages 13
6 F. Licastro et al. / Neurobiology of Aging xxx (2008) xxx–xxx
map fro
eIii2w2dta
wAida1b(
odgt
tos
wse
sv(
siAibCt
toicects
Fig. 2. Mutual information
nzyme might be a pharmacological target for AD prevention.n fact, data regarding the possible preventive effect of statinsn AD were on record (Jick et al., 2001), although anothernvestigation did not confirm these observations (Rea et al.,005). However, recent findings showed that statin therapyas associated with reduced AD neuropathology (Li et al.,007). Variations in HMGCR gene might be responsible forifferent effectiveness of statins in the prevention of demen-ia and this topic deserves further experimental and clinicalttention.
Other interesting points of aggregation upon HMGCRere also found. For instance, the interaction of the mutatedCT allele with the APOE �4 allele in men appeared of
nterest. This APOE-ACT gene interaction has been alreadyescribed in an animal model for neuro-degeneration andtherosclerosis such as APOE deficient mice (Licastro et al.,999). Furthermore, an influence of APOE �4 allele uponrain ACT concentration has been found in AD patientsLicastro et al., 1999).
Epidemiological data presented here reinforced the notionf a functional linkage of APOE and ACT and are in accor-ance with recent data showing an influence of these twoenetic factors upon the rate of cognitive decline in a shorterm follow up of AD cases (Licastro et al., 2005, 2007).
Please cite this article in press as: Licastro, F., et al., Multivariable netAging (2008), doi:10.1016/j.neurobiolaging.2008.03.019
There was a strong linkage (5.56) of the HMGCR geno-ype hub with the second hub, i.e. serum cholesterol. Severalther apparently independent variables converged upon thisecond major hub and among these the following variables
pm
A
m the Conselice data base.
ere found: serum levels of triglycerides and HDL, ACTerum levels, carrier status of the mutated allele of HMGCRnzyme, APOE �2 allele and BMI.
The link of lipids variables to the cholesterol hub was noturprising; present findings were in accordance with obser-ations suggesting a pathogenetic link of cholesterol to ADKoudinov et al., 1998).
A new unexpected link between blood ACT levels anderum cholesterol also emerged and deserves further exper-mental attention. The CRP levels also converged throughCT levels to the cholesterol hub, suggesting that these
nflammatory components could play a relevant role in ADy affecting lipid metabolism and/or turnover. Both ACT andRP might be pharmacological targets of potential relevance
o dementia.The mutated allele of HMGCR was significantly linked to
he cholesterol hub. We already described that the transfectionf HMGCR mutated allele in human cell cultures did notnfluence transcription of gene reporter under physiologicalonditions (Porcellini et al., 2007). However, we could notxclude that this SNP might show functional relevance underell stressing conditions or be in linkage with other SNP inhe same gene or other genes directly affecting cholesterolynthesis and/or turnover. This data suggested that SNP might
work associated with cognitive decline and dementia, Neurobiol
lay a relevant role in the developing of abnormal cholesteroletabolism in the aging brain.The status of APOE �4 non-carrier, i.e. the presence of
POE � 2,3 or 3,3 alleles (APOE wild) was also linked to
INNBA-7071; No. of Pages 13
logy of
ccbtA
lseo
cfoecl
aicrapcons
rls
sKthvftscaFbf“mjvsiOcvF
bsadsctva(scptuloiahi
icfabt
A
RmE
n
A
A
atuio
i
ARTICLEF. Licastro et al. / Neurobio
holesterol hub. APOE �2 allele has been shown to affectholesterol and lipid serum levels (Eto et al., 1986) and toe linked to cardiovascular diseases (Lahoz et al., 2001). Onhe other hand it is well known that many subjects with thePOE � 3,3 have developed AD (Bickeboller et al., 1997).The incident clinical CIND status, after the five year fol-
ow up (CIND 2004), also converged to the cholesterol hub,uggesting that alterations of cognitive performances in theselderly were partially dependent upon an abnormal regulationf cholesterol synthesis or turnover.
Cholesterol hub was linked with the third major one, i.e.hronological age. Age has been considered the major riskactor for dementia and AD (Blennow et al., 2006). However,ld age has also been associated with a variety of other dis-ases, named age-related diseases. Therefore, convergence ofancer, obstructive lung alterations (BPCO) and cardiovascu-ar diseases (CVD) to this last major hub was not surprising.
The weak (1.31) association of phenotypic immune vari-bles such as TNF and IL-6 serum levels with the age hubndicated an age-related serum level alterations of theseytokines. These findings confirmed previous observationseporting increased IL-6 blood levels in the elderly (Cohen etl., 2003). These age-related immune alterations may inde-endently contribute to neurodegenerative processes in theentral nervous system and influence the clinical appearancef cognitive alterations and dementia. In fact, a special role ineuro-protection and neuro-degeneration for IL-6 has beenuggested (Gruol and Nelson, 1997).
Finally, incident AD and VD (AD 2004 and VAD 2004,espectively) strongly converged to the age hub. In particu-ar, AD was highly associated (4.25) with age, showing theecond highest correlation coefficient after CVD (5.01).
A different map was generated by applying a differenttatistical model, i.e. mutual information analysis (Butte andohane, 2000). Results from this algorithm were substan-
ially different, since triglycerides, BMI and age were majorubs of the map. Moreover, incident AD, VD and CIND con-erged to incident healthy status (healthy 2004) or divergedrom this point and all four conditions were connected withhe ACT blood levels. In our opinion the connectivity maphown in Fig. 1 displayed a higher resolution power inonnecting different variables and increased focus in system-tically showing pattern aggregation than that represented inig. 2. The reduced power of the connectivity map generatedy the mutual information analysis could be ascribed to theact that this mapping method was based on specific kind ofdistance” among variables. In fact, the mutual informationethod evaluated a couple of variables at each time and
oint information was not calculated when the number ofariables increased. This model appeared to generate atatic projection of the possible associations and the activenteractions among variables might be underestimated.
Please cite this article in press as: Licastro, F., et al., Multivariable netwAging (2008), doi:10.1016/j.neurobiolaging.2008.03.019
n the other hand, AutoCM was able to simultaneouslyompute multiple or “many to many” associations amongariables, since it was a non-linear auto-associative method.inally, a validation analysis of the AutoCM methods has
lomn
PRESSAging xxx (2008) xxx–xxx 7
een performed (see Table 4) and it showed a high statisticaltability of the method. The AutoCM statistical analysis wasble to point out affinities among variables, as related to theirynamical interaction rather than to their simple contingentpatial position. This was obtained through a dynamic pro-essing with a particular neural network which reproducedhe value of a given variable using the information of all otherariables. In the AutoCM analysis each variable influencedll other variables and was influenced by all other onesn-order of effects). AutoCM could be considered a dynamicystem, since the system adjusted its weight gradually,omputing all records several times. During the learninghase variables could dynamically negotiate the value ofheir connections. The implications of this method for betternderstanding AD are substantial, since the method avoidsimitation of data analysis linked to the reductionist approachf probability based statistics which might lead to missednformation regarding the associations among variables. Inddition the explicit connection schemes allow clear cutypotheses generation at variance with clustering methodsn which associations are often vague.
In conclusion, the connectivity map presented here onncident dementia extended previous observations fromase/control investigations and confirmed that some immuneactors could indeed play a role in the pathogenesis of age-ssociated dementia. Our findings also showed a new linketween immunity, cholesterol metabolism and age in rela-ion with cognitive deterioration.
cknowledgments
Research supported by Italian Ministry for Scientificesearch and University, Italian CURA and Bologna Cari-onte Foundation. We are grateful to Dr. Jane Davis for thenglish supervision of the manuscript.
Competing interest: The author(s) declare that they haveo competing interests.
ppendix A. Auto Contractive Map analysis
.1. Learning equations
The Auto Contractive Map (CM) presents a three layersrchitecture: an Input layer, where the signal is captured fromhe environment, an Hidden layer, where the signal is mod-lated inside the CM, and an Output layer by which the CMnfluences the environment according to the stimuli previ-usly received (Fig. 1A).
Each layer is composed by N units. Then the whole CMs composed by 3N units. The connections between the Input
ork associated with cognitive decline and dementia, Neurobiol
ayer and the Hidden layer are Mono-dedicated, whereas thenes between the Hidden layer and the Output layer are ataximum gradient. Therefore, in relation to the units the
umber of the connections Nc, is given by: Nc = N (N + 1).

ARTICLE INNBA-7071; No. of Pages 13
8 F. Licastro et al. / Neurobiology of
etc
o
12
3
4
sadml
o
d
tco
s
n
IE
nl
1
2
3. ϕ is the contractive factor between the Hidden nodes andthe Input nodes:
ϕ = m[s]i(n)
− m[h]i(n)
;
4. λ is the contractive factor between the Output nodes andthe Hidden nodes:
λ = m[h]i(n)
− m[t]i(n)
.
Fig. 1A. The figure gives an example of a Auto CM with N = 4.
All the connections of CM may be initialized both byqual values and by values at random. The best practice iso initialize all the connections with the same positive value,lose to zero.
The learning algorithm of CM may be summarized in fourrderly steps:
. Signal Transfer from the Input into the Hidden layer;
. Adaptation of the connections value between the Inputlayer and the Hidden layer;*
. Signal Transfer from the Hidden layer into the Outputlayer;*
. Adaptation of the connections value between the Hiddenlayer and the Output layer.
(*) Steps 2 and 3 may take place in parallel.We define as m[s] the units of the Input layer (sensors),
caled between 0 and 1, as m[h] the ones of the Hidden layernd as m[t] the ones of the Output layer (system target). Weefine v the vector of monodedicated connections, w theatrix of the connections between Hidden layer and Output
ayer, and n the discrete time of the weights evolution.The signal forward transfer equations and the learning
nes are four:
a. Signal transfer from the Input to the Hidden:
m[h]i(n)
= m[s]i(n)
(1 − vi(n)
C
)(1)
where C = positive real number, named contractive factor.b. Adaptation of the connections vi(n) through the �vi(n) trap-
ping the energy difference generated by the Eq. (1):
�vi(n) = (m[s]i(n)
− m[h]i(n)
)(
1 − vi(n)
C
); (2)
vi(n+1) = vi(n) + �vi(n) ; (3)
c. Signal transfer from the Hidden to the Output:
Neti(n) =N∑j
m[h]j(n)
(1 − wi,j(n)
C
); (4)
Please cite this article in press as: Licastro, F., et al., Multivariable netAging (2008), doi:10.1016/j.neurobiolaging.2008.03.019
m[t]i(n)
= m[h]i(n)
(1 − Neti(n)
C
). (5) T
d
PRESSAging xxx (2008) xxx–xxx
. Adaptation of the connections wi,j(n) through the �wi,j(n)
trapping the energy differences generated by the Eq. (5):
�wi,j(n) = (m[h]i(n)
− m[t]i(n)
)(
1 − wi,j(n)
C
)m
[h]j(n)
; (6)
wi,j(n+1) = wi,j(n) + �wi,j(n) (7)
The value m[h]j(n)
of (6) is used for proportioning the changeof the connection wi,j(n) to the quantity of energy liberated
by the node m[h]j(n)
in favor of node m[t]i(n)
.
In CM the learning process, conceived as adjustment ofhe connections in relation to the minimization of Energy,orresponds to the continuous acceleration and decelerationf velocities of the signals inside the ANN connection matrix.
The first step to make the precedent sentence evident is tohow the CM convergence equation:
lim→∞vi(n) = C. (8)
n fact, when vi(n) = C, then �vi(n) = 0 Eq. (2), and m[h]i(n)
= 0q. (1) and, consequently, �wi,j(n) = 0 Eq. (6)
During this mathematic analysis, we will introduce fourew variables, that we consider the key points of the AutoCMearning process:
. ε is the contractive factor of the first layer of AutoCMweights:
ε = 1 − vi(n)
C.
. η is the contractive factor of the second layer of AutoCMweights:
η = 1 − wi,j(n)
C
work associated with cognitive decline and dementia, Neurobiol
he second step is to demonstrate how �vi(n) increases andecreases during the CM learning phase.
INNBA-7071; No. of Pages 13
logy of
A
�
B
�
T
�
Ts
v
C
ε
Fe
m
I
m
a
m
N�
m
A
m
m
A
�
I
�
Na
�
a
�
S
IH
λ
F
λ
a
l
N
�
B
�
a
l
N
w
ARTICLEF. Licastro et al. / Neurobio
Let us suppose that:
vi(n)
C= 1 − ε, where ε is a small positive real
number close to zero.
t this point, we can re-write the Eq. (2) in this way:
vi(n) =(m
[s]i(n)
− m[s]i(n)
(1 − vi(n)
C
)) (1 − vi(n)
C
)
= m[s]i(n)
vi(n)
C
(1 − vi(n)
C
); (2a)
ut, because (vi(n)/C) = 1 − ε, then:
vi(n) = m[s]i(n)
(1 − ε)(1 − (1 − ε)) = m[s]i(n)
(1 − ε)ε. (2b)
he Eq. (2b) shows the parabolic dynamics of �vi.Considering (2b) we can write:
vi(n) < ε. (2c)
he Eq. (2c) means that the increment of �vi(n) will be alwaysmaller than the quantity that vi(n) needs to reach up C.
At this point we can re-write the Eq. (3) in this form:
i(n+1) = C(1 − ε)i(n)+ m
[s]i(n)
(1 − ε)ε. (3a)
onsequently:
lim→0
vi(n) = C (3b)
urther, the contractive factor of the Eqs. (1) and (5) makesvident this relation:
[t]i(n)
< m[h]i(n)
< m[s]i(n)
; (1-5)
n fact:
[h]i(n)
= m[s]i(n)
ε; (1a)
nd:
[t]i(n)
= m[h]i(n)
ε(1 − Neti(n) ). (5a)
ow it is possible maker clear the relationship betweenvi(n) and �wi,j(n) .From the Eq. (1-5) we can suppose:
[h]i(n)
= m[s]i(n)
− ϕ; where ϕ is a small positive real number
close to 0; (1b)
nd
[t]i(n)
= m[h]i(n)
− λ; where λ is a small positive real number
close to 0; (5b)
Please cite this article in press as: Licastro, F., et al., Multivariable netwAging (2008), doi:10.1016/j.neurobiolaging.2008.03.019
[t]i(n)
= m[t]i(n)
− (ϕ + λ). (5c)
F
l
PRESSAging xxx (2008) xxx–xxx 9
t this point we write again the Eq. (2) in this way:
vi(n) = (m[s]i(n)
− (m[s]i(n)
− ϕ))(
1 − vi(n)
C
)= ϕ
(1 − vi(n)
C
)= ϕε. (2d)
n a similar way we can re-write the Eq. (6):
wi,j(n)= ((m[s]i(n)
−ϕ)−(m[s]i(n)
− (ϕ + λ))(m[s]i(n)
− ϕ)
× (1 − wi,j(n) ) = λ(m[s]i(n)
− ϕ)(1 − wi,j(n) ). (6a)
ow we can re-write (wi,j(n)/C) = 1 − η (where η has to bepositive real number smaller than 1).So:
vi(n) = ϕε; (2e)
nd
wi,j(n) = λ(m[s]i(n)
− ϕ)η; (6b)
o, considering the Eq. (5a) in this form:
m[s]i(n)
εNeti(n) = m[s]i(n)
ε − m[t]i(n)
;
Neti(n) =m
[s]i(n)
ε − m[t]i(n)
m[s]i(n)
ε=
m[s]i(n)
ε − (m[s]i(n)
ε − λ)
m[s]i(n)
ε
= λ
m[s]i(n)
ε.
(5b)
t is now possible to size the λ contractive factor betweenidden and Output units:
= m[s]i(n)
εNeti(n) . (5c)
rom (5c) we can write:
= m[s]i(n)
(1 − vi(n)
C
)Neti(n) (5d)
nd so:
im λ = 0vi(n)→C
(5e)
ow we can substitute (5c) in (6b):
wi,j(n) = m[s]i(n)
εNeti(n) (m[s]i(n)
− ϕ)η; (6c)
ut because m[s]i(n)
− ϕ = m[s]i(n)
ε, then
wi,j(n) = (m[s]i(n)
ε)2Neti(n)η; (6d)
nd
im �wi,j(n) = 0ε→0
(6e)
ow we have to consider the Eq. (7):
i,j(n+1) = C(1 − η)i,j(n)+ (m[s]
i(n)ε)
2Neti(n)η; (7a)
ork associated with cognitive decline and dementia, Neurobiol
rom (7a) we can conclude:
im wi,j(n) = C − Cηi,j(n)ε→0
(7b)
INNBA-7071; No. of Pages 13
1 logy of
SH�
λ
b
i�
a
W
aosd
d
g
A
matvtvvtcst
s
T
1
2
3
ARTICLE0 F. Licastro et al. / Neurobio
o this means that at the beginning of the training Input andidden units will be very similar (Eq. (1)), and, consequently,vi(n) will be very small (Eq. (2e)), while for the same reason
, at the beginning will be very big (Eq. (5c)) and �wi,j(n)
igger than �vi(n) (Eq. (5c)).During the training, all the same, while vi(n) slowly
ncreases, m[h]i(n)
decreases, so ϕ increases and, consequently,wi,j(n) monotonically continues to decreases (λ becomes
lways smaller, see equation (5c)) and Δvi(n) increases faster.
hen λ becomes close to zero this means that m[h]i(n)
is only
bit bigger that m[t]i(n)
(see Eq. (5b)). At this point, �vi(n) isn the global maximum of the equation (1 − ε)·ε (see (2b)),o after this critical point �vi(n) will becomes a symmetricalecreasing toward zero.
Auto Contractive Maps do not behave as a regular ANN:
a. They learn also starting from all connections set up withthe same values. So they do not suffer the problem of thesymmetric connections.
b. During training, they develop for each connection onlypositive values. Therefore, Auto CM do not presentinhibitory relations among nodes, but only differentstrengths of excitatory connections.
c. Auto CM can learn also in hard conditions, that is, whenthe connections of the main diagonal of the second con-nections matrix are removed. When the learning processis organized in this way, Auto CM seems to find a specificrelationships between each variable and any other. Con-sequently, from an experimental point of view, it seemsthat the ranking of its connections matrix is equal to theranking of the joint probability between each variable andthe others.
. After learning process, any input vector, belonging to thetraining set, will generate a null output vector. So, theenergy minimization of the training vectors is representedby a function trough which the trained connections absorbcompletely the input training vectors. Auto CM seems tolearn to transform itself in a dark body.
e. At the end of the training phase (�wi,j = 0), all the com-ponents of the weights vector v reach up the same value:
limn→∞vi(n) = C. (8)
f. The matrix w, then, represents the CM knowledge aboutall the dataset.
It is possible to transform the w matrix also in proba-bilistic joint association among the variables m:
pi,j = wi,j∑Nj=1wi,j
; (9)
Please cite this article in press as: Licastro, F., et al., Multivariable netAging (2008), doi:10.1016/j.neurobiolaging.2008.03.019
P(m[s]j ) =
N∑i
pi,j = 1 (10)
PRESSAging xxx (2008) xxx–xxx
The new matrix p can be read as the probability of transi-tion from any state-variable to anyone else:
P(m[t]i |m[s]
j ) = pi,j. (11)
. At the same time the matrix w may be transformed intoa non-Euclidean distance metric (semi-metric), when wetrain the CM with the main diagonal of the w matrix fixedat value N.
Now, if we consider N as a limit value for all the weightsof the w matrix, we can write:
di,j = N − wi,j (12)
The new matrix d is also a squared symmetric matrixwhere the main diagonal represents the zero distancebetween each variable from itself.
.2. The contractive factor
There is another way to interpret the squared weightsatrix of the AutoCM system. We have to assume each vari-
ble of the dataset as a vector composed of the all its values. Athis point, the dynamic value of each connection between twoariables represents the local velocity of their mutual attrac-ion caused by their mutual vectors similarity: more is theectors similarity, more is their attraction speed. When twoariables are attracted by each other, they contract propor-ionally the original Euclidean space between them. The limitase is when two variables are identical: the space contractionhould be infinitive and the two variables should collapse inhe same point.
We can extract from each weight of a trained AutoCM thispecific contractive factor:
Fi,j =(
1 − wi,j
C
)−1;
1 ≤ Fi,j ≤ ∞.
(9a)
his equation is interesting for three reason:
. it is the inverse of the equation used as contractive factorduring the AutoCm training;
. considering the Eq. (3b), each mono-connection vi at theend of the training will reach the value C. In this casethe contractive factor will be infinitive because the twovariables connected by the weight are really the samevariable.
. considering, instead, the Eq. (7b), each weight wi,j , at theend the training will be always smaller than C. This meansthat the contractive factor for each weight of the matrixthat we are considering will be always non-infinitive. Thatis correct. In fact in the case of the weight wi,i, the variableis connected with itself, but the same variable has also
work associated with cognitive decline and dementia, Neurobiol
received the influences of the other variables (remind thatthe matrix w is a squared matrix where each variable islinked to the other). Consequently, this variable has notbe exactly the same.
IN PRESSNBA-7071; No. of Pages 13
logy of Aging xxx (2008) xxx–xxx 11
to
i
d
wxi
t
d
A
Cdw
g
ssipEa
Ewcgi(
chgo
dvts
rb
s
Table A1Adjacency matrix of a distance matrix
A B C D . . . E
A 0 1 1 1 1 1B 1 0 1 1 1 1C 1 1 0 1 1 1D.E
fiit
d
Ts
M
Gtn
E
A
T
Knogm
ettans
tr
twa
t
ARTICLEF. Licastro et al. / Neurobio
At this point, we are able to calculate the contractive dis-ance between each variable and the other, modifying theriginal Euclidean distance with a specific contractive factor.
The Euclidean distance among the variables in the datasets given by the following equation:
[Eucliden]i,j =
√√√√ R∑k
(xi,k − xj,k)2; (10a)
here R = the number of the records of the assigned dataset;i,k and xj,k = the i-th value and the j-th value of two variablesn the k-th record.
And, consequently, the AutoCM distance matrix amonghe same variables is:
[AutoCM]i,j = d
[Euclidean]i,j
Fi,j
. (11a)
.3. Auto CM and minimum spanning tree
Eq. (12) transforms the squared weights matrix of AutoM into a squared matrix of distances among nodes. Eachistance between a pair of node becomes, consequently, theeighted edge between these pair of nodes.At this point, the matrix d may be analyzed trough the
raph theory.A graph is a mathematical abstraction that is useful for
olving many kinds of problems. Fundamentally, a graph con-ists of a set of vertices, and a set of edges, where an edges something that connects two vertices in the graph. Morerecisely, a graph is a pair (V,E), where V is a finite set andis a binary relation on V, to whom it is possible to attributescalar value (in this case the weights is the distance di,j).
V is called a vertex set whose elements are called vertices.is a collection of edges, where an edge is a pair (u, v)
ith u, v in V. In a directed graph, edges are ordered pairs,onnecting a source vertex to a target vertex. In an undirectedraph edges are unordered pairs and connect the two verticesn both directions, hence in an undirected graph (u, v) andv, u) are two ways of writing the same edge.
It does not say what a vertex or edge represents. Theyould be cities with connecting roads, or web-pages withyperlinks. These details are left out of the definition of araph for an important reason; they are not a necessary partf the graph abstraction.
An adjacency-matrix representation of a graph is a two-imensional V × V array, where rows represent the list ofertices and the columns represent the edges among the ver-ices. Each element in the array is stored with a Boolean valueaying whether the edge (u, v) is in the graph.
A distance matrix among V vertices represents an undi-
Please cite this article in press as: Licastro, F., et al., Multivariable netwAging (2008), doi:10.1016/j.neurobiolaging.2008.03.019
ected graph, where each vertex is linked with all the other,ut itself (Table A1).
At this point is useful to introduce the concept of minimumpanning tree (MST).
wita
1 1 1 0 1 1. 1 1 1 1 0 1
1 1 1 1 1 0
The minimum spanning tree problem is defined as follows:nd an acyclic subset T of E that connects all of the vertices
n the graph and whose total weight is minimized, where theotal weight is given by
(T ) =N−1∑i=0
N∑j=i+1
di,j, ∀di,j. (13)
is called spanning tree, and MST is the T with the minimumum of its edges weighted.
st = Min{d(Tk)} (14)
iven a undirected Graph G, representing a d matrix of dis-ances, with V vertices, completely linked each other, the totalumber of their edges (E) is:
= V (V − 1)
2; (15)
nd the number of its possible tree is:
= VV−2. (16)
ruskal in the 1956 found out an algorithm able to determi-ate the MST of any undirected graph in a quadratic numberf steps, in the worse case. Obviously, the Kruskal algorithmenerates one of the possible MST. In fact in a weighted graphore than one MST are possible.From conceptual point of view the MST represents the
nergy minimization state of a structure. In fact, if we considerhe atomic elements of a structure as vertices of a graph andhe strength among them as the weight of each edge, linkingpair of vertex, the MST represents the minimum of energyeeded because all the elements of the structure continue totay together.
In a closed system, all the components tend to minimizehe overall energy. So the MST, in specific situations, canepresent the most probable state where a system tends to.
To define the MST of a undirected graph, each edge ofhe graph has to be weighted. The Eq. (12) shows a way toeight each edge whose nodes are the variables of a dataset
nd whose weights of a trained AutoCM provides the metrics.Obviously, it is possible to use any kind of AutoAssocia-
ive ANN or any kind of Linear Auto-Associator to generate a
ork associated with cognitive decline and dementia, Neurobiol
eight matrix among the variables of a assigned dataset. Butt is hard to train a two layer AutoAssociative Back Propaga-ion with the weights main diagonal fixed (to avoid variablesuto-correlation). In the most of the cases, the Root Mean
INNBA-7071; No. of Pages 13
1 logy of
Swutid
n
pv
R
A
B
B
B
B
C
C
C
E
F
F
G
G
G
G
J
K
K
L
L
L
L
L
L
L
L
L
M
M
M
P
ARTICLE2 F. Licastro et al. / Neurobio
quare Error stops to decrease after few epochs. Especiallyhen the orthogonally of the records increase. And that issual when it is necessary to weight the distance amonghe records of the assigned dataset. In this case, in fact, its necessary to train the transposed matrix of the assignedataset.
By the way, if a Linear Auto-Associator is used, all theon-linear association among variables will be lost.
So, actually, AutoCM seems to be the best choice to com-ute a complete and a non-linear matrix of weights amongariables or among records of any assigned dataset.
eferences
ronson, M.K., Ooi, W.L., Geva, D.L., Masur, D., Blau, A., Frishman, W.,1991. Dementia. Age-dependent incidence, prevalence, and mortality inthe old. Arch. Intern. Med. 151 (5), 989–992.
ickeboller, H., Campion, D., Brice, A., Amouyel, P., Hannequin, D., Didier-jean, O., Penet, C., Martin, C., Perez-Tur, J., Michon, A., Dubois, B.,Ledoze, F., Thomas-Anterion, C., Pasquier, F., Puel, M., Demonet, J.F.,Moreaud, O., Babron, M.C., Meulien, D., Guez, D., Chartier-Harlin,M.C., Frebourg, T., Agid, Y., Martinez, M., Clerget-Darpoux, F., 1997.Apolipoprotein E and Alzheimer disease: genotype-specific risks by ageand sex. Am. J. Hum. Genet. 60 (2), 439–446.
lennow, K., de Leon, M.J., Zetterberg, H., 2006. Alzheimer’s disease.Lancet 368, 387–403.
uscema, M., Grossi, E. The Semantic Connectivity Map: an adapting self-organizing knowledge discovery method in data bases. Experience inGastro-oesophageal reflux disease. Int. J. Data Mining Bioinform., inpress.
utte, A.J., Kohane, I.S., 2000. Mutual information relevance networks:functional genomic clustering using pair-wise entropy measurements.Pac. Symp. Biocomput., 418–429.
hiappelli, M., Borroni, B., Archetti, S., Calabrese, E., Corsi, M.M.,Franceschi, M., Padovani, A., Licastro, F., 2006a. VEGF gene and phe-notype relation with Alzheimer’s disease and mild cognitive impairment.Renjuvenation. Res. 9 (4), 485–493.
hiappelli, M., Tumini, E., Porcellini, E., Licastro, F., 2006b. Impairedregulation of immune responses in cognitive decline and Alzheimer’sdiseases: lessons from genetic association study. Exp. Rev. Neurother.6, 1327–1336.
ohen, H.J., Harris, T., Pieper, C.F., 2003. Coagulation and activation ofinflammatory pathways in the development of functional decline andmortality in the elderly. Am. J. Med. 114 (3), 180–187.
to, M., Watanabe, K., Ishii, K., 1986. Reciprocal effects of apolipoprotein Ealleles (epsilon 2 and epsilon 4) on plasma lipid levels in normolipidemicsubjects. Clin. Genet. 29 (6), 477–484.
orti, P., Maioli, F., Nesi, B., Vettori, C., Flisi, E., Dalmonte, E., Zanardi, V.,Lodi, L., Macini, P., Caldarera, M., Ravaglia, G., 2001. Conselice study:a population based survey of brain aging in a municipality of the EmiliaRomagna region: (A.U. S. L. Ravenna). Neuropsychological tests andnutritional status. Arch. Gerontol. Geriatr. Suppl. 7, 137–144.
rimmel, H., Nappi, J., Yoshida, H., 2004. Fast and robust computation ofcolon centerline in CT colonography. Med. Phys. 31 (11), 3046–3056.
riffin, W.S., Stanley, L.C., Ling, C., White, L., MacLeod, V., Perrot,L.J., White III, C.L., Araoz, C., 1989. Brain interleukin 1 and S-100immunoreactivity are elevated in Down syndrome and Alzheimer dis-
Please cite this article in press as: Licastro, F., et al., Multivariable netAging (2008), doi:10.1016/j.neurobiolaging.2008.03.019
ease. Proc. Natl. Acad. Sci. USA 86 (19), 7611–7615.riffin, W.S., Sheng, J.G., Royston, M.C., Gentleman, S.M., McKenzie,
J.E., Graham, D.I., Roberts, G.W., Mrak, R.E., 1998. Glial-neuronalinteractions in Alzheimer’s disease: the potential role of a ’cytokinecycle’ in disease progression. Brain Pathol. 8 (1), 65–72.
R
PRESSAging xxx (2008) xxx–xxx
rossi, E., Buscema, M.P., Snowdon, D., Antuono, P., 2007. Neuropatho-logical findings processed by artificial neural networks (ANNs) canperfectly distinguish Alzheimer’s patients from controls in the NunStudy. BMC Neurol. 21, 7–15.
ruol, D.L., Nelson, T.E., 1997. Physiological and pathological rolesof interleukin-6 in the central nervous system. Mol. Neurobiol. 15,307–339.
ick, H., Zornberg, G.L., Jick, S.S., Seshadri, S., Drachmen, D.A., 2001.Statins and the risk of dementia. Lancet 357, 562–565.
oudinov, A.R., Berezov, T.T., Koudinova, N., 1998. Alzheimer’s amyloidbeta and lipid metabolism: a missing link? FASEB 12, 1097–1099.
ruskal, J.B., 1956. On the shortest spanning subtree of a graph and thetraveling-salesman problem. In: Proceedings of the American Mathe-matical Society 7, pp. 48–50.
ahoz, C., Schaefer, E.J., Cupples, L.A., Wilson, P.W., Levy, D., Osgood, D.,Parpos, S., Pedro-Botet, J., Daly, J.A., Ordovas, J.M., 2001. Apolipopro-tein E genotype and cardiovascular disease in the Framingham HeartStudy. Atherosclerosis 154 (3), 529–537.
ee, U., Kim, S., Jung, K.Y., 2006. Classification of epilepsy types throughglobal network analysis of scalp electroencephalograms. Phys. Rev. EStat. Nonlin. Soft. Matter Phys. 73 (4 Pt 1), 041920.
i, G., Larson, E.B., Sonnen, J.A., Shofer, J.B., Petrie, E.C., Schantz, A.,Peskind, E.R., Raskind, M.A., Breitner, J.C.S., Montine, T.J., 2007.Statin therapy is associated with reduced neuropathologic changes ofAlzheimer’s disease. Neurology 69, 878–885.
icastro, F., Campbell, I.L., Kincaid, C., Veinbergs, I., Van Uden, E.,Rockenstein, E., Mallory, M., Gilbert, J.R., Masliah, E., 1999. A rolefor apoE in regulating the levels of alpha-1-antichymotrypsin in theaging mouse brain and in Alzheimer’s disease. Am. J. Pathol. 155 (3),869–875.
icastro, F., 2002. Genomics of immune molecules: early detection ofcognitive decline and new therapeuthic interventions. Expert Rev. Neu-rotherapeutics 2 (5), 89–95.
icastro, F., Chiappelli, M., 2003. Brain immune responses, cognitivedecline and dementia relationship with phenotype expression and geneticbackground. Mech. Aging Develop. 124, 539–548.
icastro, F., Chiappelli, M., Grimaldi, L.M.E., Morgan, K., Kalsheker,N., Calabrese, E., Ritchie, A., Porcellini, E., Salani, G., Franceschi,M., Canal, N., 2005. A new promoter polymorphism in the alpha-1-antichymotrypsin gene is a disease modifier of Alzheimer’s disease.Neurobiol. Aging 26, 449–453.
icastro, F., Porcellini, E., Caruso, C., Lio, D., Corder, E.H., 2007. Geneticrisk profiles for Alzheimer’s disease: integration of APOE genotypeand variants that up-regulate inflammation. Neurobiol. Aging. 28,1637–1643.
icastro, F., Porcellini, E., Davis, L.J., Chiappelli, M., Tumini, E., Forti, P.,Ravaglia, G. Plasma �-1-antichymotrypsin age-related cognitive declineand Alzheimer’s disease. JNNP, in press.
cGeer, P.L., Kawamata, T., Walzer, D.G., Akiyama, H., Tooyama, I.,McGeer, E.G., 1993. Microglia in degenerative neurological disease.Glia 7, 84–92.
cKhann, G., Drachman, D., Folstein, M., Katzman, R., Price, D., Stad-lan, E.M., 1984. Clinical diagnosis of Alzheimer’s disease: report ofthe NINCDS-ADRDA Work Group under the auspices of Departmentof Health and Human Services Task Force on Alzheimer’s Disease.Neurology 34 (7), 939–944.
rak, R.E., Sheng, J.G., Griffin, W.S., 1995. Glial cytokines in Alzheimer’sdisease: review and pathogenic implications. Hum. Pathol. 26 (8),816–823.
orcellini, E., Calabrese, E., Guerini, F., Govoni, M., Chiappelli, M., Tumini,E., Morgan, K., Chappell, S., Kalsheker, N., Franceschi, M., Licastro, F.,2007. The hydroxy-methyl-glutaryl CoA reductase promoter polymor-
work associated with cognitive decline and dementia, Neurobiol
phism is associated with Alzheimer’s risk and cognitive deterioration.Neurosci. Lett. 416 (1), 66–70.
avaglia, G., Forti, P., Maioli, F., Orlanducci, P., Sacchetti, L., Flisi, E.,Dalmonte, E., Martignani, A., Cucinotta, D., Cavalli, G., 2001. Conselicestudy: a population based survey of brain aging in a muncipality of the
INNBA-7071; No. of Pages 13
logy of
R
R
R
R
R
R
R
R
T
T1997. Strategies for improving the postmortem neuropathological
ARTICLEF. Licastro et al. / Neurobio
Emilia Romagna region: (A.U. S. L. Ravenna). Design and methods.Arch. Gerontol. Geriatr. Suppl. 7, 313–324.
avaglia, G., Forti, P., Maioli, F., Scali, R.C., Arnone, G., Talerico, T.,Pantieri, T., Nativio, V., Mantovani, V., Bianchin, M., 2004. Commonpolymorphisms in methylentetrahydropholate reductase (MTHFR): rela-tionship with plasma homocysteine concentrations and cognitive statusin elderly northern Italian subjects. Arch. Gerontol. Geriat. Suppl. 9,339–348.
avaglia, G., Forti, P., Maioli, F., Martelli, M., Servadei, L., Brunetti, N.,Porcellini, E., Licastro, F., 2005. Homocysteine and folate as risk factorsfor dementia and Alzheimer disease. Am. J. Clin. Nutr. 82, 636–643.
avaglia, G., Forti, P., Maioli, F., Chiappelli, M., Montesi, F., Tumini, E.,Mariani, E., Licastro, F., Patterson, C., 2006, Sep. 28. Blood inflamma-tory markers and risk of dementia: The Conselice Study of Brain Aging.Neurobiol. Aging., p28.
avaglia, G., Forti, P., Maioli, F., Martelli, M., Montesi, F., Bastagli, L.,Bianchin, M., Chiappelli, M., Tumini, E., Bolondi, L., Licastro, F.,2006b. Interleukin-1beta and interleukin-6 gene polymorphisms as risk
Please cite this article in press as: Licastro, F., et al., Multivariable netwAging (2008), doi:10.1016/j.neurobiolaging.2008.03.019
factors for AD: a prospective study. Exper. Gerontol. 41, 85–92.avaglia, G., Forti, P., Maioli, F., Montesi, F., Rietti, E., Pisacane, N., Rolfo,
E., Scali, C.R., Dal monte, E., 2007. Risk factors for dementia: data fromThe Conselice Study of brain aging. Arch. Gerontol. Geriatr. Suppl. 1,311–320.
Z
PRESSAging xxx (2008) xxx–xxx 13
ea, T.D., Breitner, J.C., Psaty, B.M., Fitzpatrick, A.L., Lopez, O.L.,Newman, A.B., Hazzard, W.R., Zandi, P.P., Burke, G.L., Lyketsos,C.G., Bernick, C., Kuller, L.H., 2005. Statin use and the risk ofincident dementia: the cardiovascular health study. Arch. Neurol. 62,1047–1051.
ogers, J., Luber-Narod, J., Styren, S.D., Civin, W.H., 1988. Expressionof immune system-associated antigens by cells of the human centralnervous system: relationship to the pathology of Alzheimer’s disease.Neurobiol. Aging 9, 339–349.
oman, G.C., Tatemichi, T.K., Erkinjuntti, T., Cummings, J.L., Masdeu,J.C., Garcia, J.H., Amaducci FL., Orgogozo, J.M., Brun, A., Hofman, A.,et al., 1993. Vascular dementia: diagnostic criteria for research studies.Report of the NINDS-AIREN International Workshop. Neurology 43(2), 250–260.
erry, R.D., 1994. Neuropathological changes in Alzheimer’s disease. Prog.Brain Res. 101, 383–390.
rojanowski, J.Q., Clark, C.M., Schmidt, M.L., Arnold, S.E., Lee, V.M.,
ork associated with cognitive decline and dementia, Neurobiol
diagnosis of Alzheimer’s disease. Neurobiol. Aging 18 (4 Suppl.),S75–S79.
hang, F.L., Casey, P.J., 1996. Protein prenylation: molecular mechanismsand functional consequences. Annu. Rev. Biochem. 65, 241–269.