multiplex serology demonstrate cumulative prevalence and
TRANSCRIPT
Assefa et al. Malar J (2019) 18:246 https://doi.org/10.1186/s12936-019-2874-z
RESEARCH
Multiplex serology demonstrate cumulative prevalence and spatial distribution of malaria in EthiopiaAshenafi Assefa1,2* , Ahmed Ali Ahmed2, Wakgari Deressa2, Heven Sime1, Hussein Mohammed1, Amha Kebede3, Hiwot Solomon4, Hiwot Teka5, Kevin Gurrala6, Brian Matei6, Brian Wakeman6, G. Glenn Wilson7, Ipsita Sinha8,9, Richard J. Maude8,9,10, Ruth Ashton11, Jackie Cook12, Ya Ping Shi6, Chris Drakeley12, Lorenz von Seidlein8,9, Eric Rogier6 and Jimee Hwang13
Abstract
Background: Measures of malaria burden using microscopy and rapid diagnostic tests (RDTs) in cross-sectional household surveys may incompletely describe the burden of malaria in low-transmission settings. This study describes the pattern of malaria transmission in Ethiopia using serological antibody estimates derived from a nation-wide household survey completed in 2015.
Methods: Dried blood spot (DBS) samples were collected during the Ethiopian Malaria Indicator Survey in 2015 from malarious areas across Ethiopia. Samples were analysed using bead-based multiplex assays for IgG antibodies for six Plasmodium antigens: four human malaria species-specific merozoite surface protein-1 19kD antigens (MSP-1) and Apical Membrane Antigen-1 (AMA-1) for Plasmodium falciparum and Plasmodium vivax. Seroprevalence was estimated by age, elevation and region. The seroconversion rate was estimated using a reversible catalytic model fitted with maximum likelihood methods.
Results: Of the 10,278 DBS samples available, 93.6% (9622/10,278) had valid serological results. The mean age of participants was 15.8 years and 53.3% were female. National seroprevalence for antibodies to P. falciparum was 32.1% (95% confidence interval (CI) 29.8–34.4) and 25.0% (95% CI 22.7–27.3) to P. vivax. Estimated seroprevalences for Plasmodium malariae and Plasmodium ovale were 8.6% (95% CI 7.6–9.7) and 3.1% (95% CI 2.5–3.8), respectively. For P. falciparum seroprevalence estimates were significantly higher at lower elevations (< 2000 m) compared to higher (2000–2500 m) (aOR 4.4; p < 0.01). Among regions, P. falciparum seroprevalence ranged from 11.0% (95% CI 8.8–13.7) in Somali to 65.0% (95% CI 58.0–71.4) in Gambela Region and for P. vivax from 4.0% (95% CI 2.6–6.2) in Somali to 36.7% (95% CI 30.0–44.1) in Amhara Region. Models fitted to measure seroconversion rates showed variation nationally and by elevation, region, antigen type, and within species.
Conclusion: Using multiplex serology assays, this study explored the cumulative malaria burden and regional dynamics of the four human malarias in Ethiopia. High malaria burden was observed in the northwest compared to the east. High transmission in the Gambela and Benishangul-Gumuz Regions and the neglected presence of P. malariae and P. ovale may require programmatic attention. The use of a multiplex assay for antibody detection in low transmission settings has the potential to act as a more sensitive biomarker.
Keywords: Multiplex serology, Seroprevalence, Malaria, Ethiopia
© The Author(s) 2019. This article is distributed under the terms of the Creative Commons Attribution 4.0 International License (http://creat iveco mmons .org/licen ses/by/4.0/), which permits unrestricted use, distribution, and reproduction in any medium, provided you give appropriate credit to the original author(s) and the source, provide a link to the Creative Commons license, and indicate if changes were made. The Creative Commons Public Domain Dedication waiver (http://creat iveco mmons .org/publi cdoma in/zero/1.0/) applies to the data made available in this article, unless otherwise stated.
Open Access
Malaria Journal
*Correspondence: [email protected] 1 Ethiopian Public Health Institute, Addis Ababa, EthiopiaFull list of author information is available at the end of the article

Page 2 of 14Assefa et al. Malar J (2019) 18:246
BackgroundMalaria transmission in Ethiopia is non-stable, het-erogeneous and seasonal, with peak periods following the main rains from June to September and short rains from March to April [1]. Historically, malaria epidemics occurred at 5 to 8-year intervals. The last malaria epi-demic in 2004/2005 caused two million clinical cases and claimed approximately 3000 lives [2, 3]. Although malaria transmission has been declining over the past 15 years [4, 5], 60% of the Ethiopian landmass is suitable for malaria transmission and communities remain vulnerable for malaria transmission. The National Malaria Control Pro-gramme of Ethiopia considers areas below 2000 m eleva-tion as malaria endemic and eligible for malaria control activities [6]. Plasmodium falciparum and Plasmodium vivax are the major documented malaria parasite spe-cies, with approximately 1.2 million P. falciparum cases and 678,000 P. vivax cases reported in 2015 [7]. The pro-portion of P. vivax cases has been increasing whereas a decline in P. falciparum incidence was observed [8].
With the decline in malaria cases, measuring malaria transmission intensity and dynamics is becoming increasingly challenging. Transmission estimates using standard malaria diagnostic tests, such as microscopy or rapid diagnostic tests (RDT), entomological inoculation rate, and splenomegaly prevalence fail to detect changes in the malaria burden in very low transmission settings [9]. The last three Ethiopian Malaria Indicator Surveys (EMIS) reported very low prevalence, using microscopy and RDTs: 0.9% by microscopy in 2007, 1.3% by micros-copy and 4.5% by RDTs in 2011, and 0.5% by microscopy and 1.2% by RDT in 2015 [10–12]. With decreasing para-site prevalence as well as density of individual infections, the sensitivity of conventional diagnostic tools has been declining [13, 14]. Serological and molecular epidemio-logical studies may be more useful in such scenarios, and are being increasingly used for measuring malaria bur-den in low transmission settings [15–17]. Robust sero-prevalence estimates of Plasmodium infections could be critical for monitoring and evaluation of ongoing malaria control and elimination activities in Ethiopia.
In this study, multiplex serological methods were used to estimate malaria exposure, transmission patterns, and spatial and regional distribution of malaria in Ethiopia, using samples collected during the 2015 EMIS.
MethodsStudy areaThe study was conducted as part of the National Ethio-pian Malaria Indicator Survey in 2015 (EMIS-2015). Ethiopia has successfully implemented three national EMISs in 2007, 2011 and 2015 [10–12]. EMIS-2015 was embarked during the peak of malaria transmission
season, between September and December 2015. The sampling design provided national and sub-national esti-mates of major malaria intervention indicators, including malaria prevalence for malarious areas of the country, as well as estimates for areas below 2000 m elevation, areas between 2000 and 2500 m, and for 10 administrative regions.
Study design and sample collectionEMIS-2015 was a cross-sectional survey that used a two-stage cluster sampling approach. A total of 555 enu-meration areas (EAs) were selected proportional to the population size of the regions, as estimated by the Ethio-pian Central Statistics Agency. In each EA, 25 households were randomly selected following onsite EA household mapping. A total of 53,335 individuals were surveyed in 13,875 selected households. Demographic, socio-eco-nomic, use of malaria prevention, and malariometric data were collected in the selected households from each EA. Children under 5 years of age in each selected house-hold and persons of all ages in every fourth household were eligible for biological sample testing. Whole blood from a finger prick from consenting individuals was col-lected for a malaria RDT (histidine‐rich protein 2 (HRP2) and Plasmodium lactate dehydrogenase (pLDH) antigen CareStart®, AccessBio, US), a malaria blood slide (thick and thin blood film), haemoglobin (Hemocue Hb 201+ , Hemocue AB, Ängelholm, Sweden) measurement, and dried blood spot (DBS) samples. Whatman 903 Protein Saver (GE Healthcare, Pittsburgh, PA, USA) filter paper was used for DBS collection. Filter papers were air dried, individually packed in a plastic bag together with a desic-cant and stored at − 20 °C at the Ethiopian Public Health Institute (EPHI) before they were shipped for further lab-oratory-based testing at the US Centers for Disease Con-trol and Prevention (CDC), Atlanta, GA, USA.
Ethical considerationThe EMIS-2015 protocol received ethical clearance from the National Research Ethics Review Committee of Ethi-opia and PATH. The survey protocol underwent human subjects review at CDC and was considered to be a non-research programme evaluation activity. Additional ethi-cal clearance for the present serology study was obtained from the Institutional Review Board of the College of Health Sciences of the Addis Ababa, University (AAUMF 03-008).
Blood spot elution, bead coupling and antigens used in the studyLaboratory analysis was conducted as previously described [15]. Briefly, a 6-mm punch was used from each DBS sample and blood eluted to a 1:20 concentration

Page 3 of 14Assefa et al. Malar J (2019) 18:246
in blocking buffer (Buffer B: Phosphate Buffered Saline (PBS) containing 0.5% Bovine Serum Albumin (BSA), 0.05% Tween 20, 0.02% sodium azide, 0.5% polyvinyl alcohol, 0.8% polyvinylpyrrolidone and 0.5% w/v Escheri-chia coli extract) overnight.
Six Plasmodium antigens were used for this study: two P. falciparum antigens (Merozoite Surface Protein-1 19kD (MSP-1) and Apical Merozoite Antigen-1 (AMA-1), two P. vivax antigens (PvMSP-1 and PvAMA-1), one P. malariae (PmMSP-1) and one P. ovale (PoMSP-1). The four Plasmodium MSP-1 19kD antigens were produced as recombinant proteins and purified as described previ-ously [18]. The external domain of P. falciparum AMA-1 antigen was produced at the Walter Reed Army Institute of Research (WRAIR) under previously published con-ditions [19]. The P. vivax AMA-1 antigen was produced at the London School of Hygiene and Tropical Medicine (LSHTM) under previously published conditions [20]. The Schistosoma japonicum glutathione-S-transferase antigen (GST) was produced recombinantly and served as a generic protein to assess immunoglobulin G (IgG) non-specific binding.
All antigens were coupled to magnetic beads (Luminex Corp, Austin, TX, USA) as per prior studies [18, 21]. Briefly, beads were pulse vortexed, transferred to a microcentrifuge tube and centrifuged for 1.5 min at 13,000g. Supernatant was removed, and the beads were washed with a 0.1 M and pH 6.2 sodium phosphate (NaP) solution. Beads were activated by suspending in NaP with 5 mg/mL of EDC (1-ethyl-3-[3-dimethylaminutesopro-pyl] carbodiimide hydrochloride) and 5 mg/mL sulfo-NHS (sulfo N-hydroxylsulfosuccinimide) and incubating with rotation for 20 min at room temperature (RT), while protected from light. After a wash with coupling buffer (50 mM 2-(4-morpholino)-ethane sulfonic acid, 0.85% NaCl at pH 5.0), antigens were coupled to beads in the presence of a coupling buffer for 2 h at a concentration of 20 ug/mL for all antigens, except for PvAMA1 and GST at 15 ug/mL. Beads were washed once with PBS and suspended in PBS with 1% bovine serum albumin (BSA) with incubation for 30 min at RT by rotation. Beads were then resuspended in a storage buffer (PBS, 1% BSA, 0.02% sodium azide and 0.05% Tween-20) and stored at 4 °C. Coupled beads were run with a panel of known malaria seronegatives to assure minimal non-specific MFI signal would be given by beads used in this study.
The DBS elution was assayed for IgG antibodies using bead-based multiplex technology, and all wash steps were performed with a handheld magnet. In 5 mL of reagent buffer (Buffer A: PBS, 0.5% BSA, 0.05% Tween-20, 0.02% NaN3), a bead mix was prepared with all coupled bead regions included (approximately 625 beads/antigen per well), and 50 uL bead mix was pipetted into each well of
a BioPlex Pro plate (BioRad, Hercules, CA, USA). Beads were washed twice with 100 µL PBS with Tween (PBST), and 50 µL of the reagent mix [in 5 mL Buffer A: 1:500 anti-human IgG (Southen Biotech), 1:625 anti-human IgG4 (Southern Biotech), 1:200 streptavidin-PE (Invitro-gen)] was added to each well. Negative control samples and a dilution curve of hyperimmune serum were added to each assay plate to monitor any change in control val-ues over the course of the study. Samples of blood eluted from DBS were added to predefined wells (already con-taining beads and reagent mix) at 1:50 dilution. Plates were incubated overnight with gentle shaking at RT and protected from light. The next morning (approximately 16 h total incubation time), plates were washed three times, and beads were re-suspended with 100 µL PBS and read on a MAGPIX machine (Luminex Corp, Austin, TX, USA). Mean fluorescence intensity (MFI) signal was gen-erated for a minimum of 50 beads/region, and the back-ground (bg) MFI from wells incubated with Buffer B was subtracted from each sample to give a final value of MFI-bg. Minimal variation was seen in the assay signal for the background or positive hyperimmune serum curve val-ues, so no plates were re-run for the study.
Statistical analysisData analysis was done using Stata 13 software (College Station, USA). Samples with GST MFI-bg reads above 1000 MFI value (non-specific binding) were excluded from the analysis (n = 678). To dichotomize seropositiv-ity, log10-transformed MFI-bg values were fitted to a two-component Finite Mixture Model (FMM) by the FMM procedure with normal distribution and maximum like-lihood estimation outputs. A seropositivity cutoff value was determined by the mean MFI-bg value of the first (assumed seronegative) component plus three standard deviations [18]. Overall, P. falciparum and P. vivax sero-positivity were defined as an individual being positive for either or both of the MSP-1 and AMA-1 antigens for each species. Seropositivity estimates for P. malariae and P. ovale are presented using the seropositivity cut-off method outlined above. However, to minimize cross-reactivity between the species-specific MSP-1 antigens, the current study report an additional conservative two-stage approach that increase specificity, but decrease sensitivity of the specific antibodies to the targeted anti-gens. For this conservative approach for P. malariae and P. ovale, individual readings for PmMSP-1 or PoMSP-1 response first had to be above the MFI-bg cutoff as described above. Additionally, the PmMSP-1 and/or PoMSP-1 MFI-bg signal for that sample also needed to be above the PfMSP-1 MFI-bg signal for the same sam-ple (ratio to PfMSP-1 greater than 1.0) to be considered PmMSP-1 and/or PoMSP-1 positive.

Page 4 of 14Assefa et al. Malar J (2019) 18:246
A reversible catalytic model was fitted to the dichot-omized data using maximum likelihood methods to generate a seroconversion rate (SCR or λ) and a seror-eversion rate (ρ). The model was used to generate age seroprevalence curves, from which a seroconversion rate (SCR) representing the force of infection for the community was calculated. Evidence for two forces of infection was investigated, if visual inspection of SCR curves indicated such a comparison and was guided by a profile likelihood plots to determine the most likely time (year) of change in transmission [16, 22]. Multiple logistic regression models were employed to determine odds ratios (OR); 95% confidence intervals (CI) for gen-der, age and elevations. Similar regression models were employed for P. falciparum and P. vivax seropositivity. Adjustments were made by region, elevation and age group.
Empirical bayesian kriging in ArcGIS version 10.5 (ESRI, CA, USA) was used to predict the spatial dis-tribution of seroprevalence as a continuous surface of probability of being above a cut-off. This is an estab-lished method that uses a statistical model to predict and interpolate the spatial distribution of a variable from available data [23]. Maps were developed sepa-rately for MSP-1 and AMA-1 antigens for both P. falci-parum and P. vivax for all individuals and for children under 5 years of age. Seroprevalence by woreda/district was compared with the 2015 annual parasite incidence (API) data. QGIS version 2.1.8 and ArcGIS version 10.5 (ESRI, Redlands, CA) were used to produce maps.
Sampling weights calculated during MIS 2015 were used to ensure the representativeness of the samples tested to the study population.
ResultsStudy populationOf the expected 15,829 DBS samples, 10,278 individual DBSs were available for the current study, serological results were generated for 93.6% (9622/10,278) of these (Fig. 1). A total of 8944 results were merged with the EMIS-2015 data base, of which 52.3% (95% CI (50.8–53.7)) of the survey participants were female (Table 1). Figure 2 shows the spatial distribution of EAs providing serology data. The overall proportion of samples col-lected from children under 5 years was 44.8% (95% CI 43.0–46.5); although this proportion was above 60% in the Afar and Somali Regions (Table 1). The number of individuals with serology data within an EA ranged from 1 to 55, with a mean of 24 individuals per EA. Over-all mean age was 15.8 years (95% CI 15.2–16.4) (range 1–107). Of the samples collected, 75.0% (95% CI 67.5–81.2) were from areas with elevation less than 2000 m.
A total of 0.8% (95% CI 0.6–1.2) of the participants were positive by RDT; comprising 0.5% (95% CI 0.3–0.7) for P. falciparum (HRP2 antigen positive), 0.2% (95% CI 0.1–0.4) for either P. vivax, P. malariae or P. ovale (Pv/Pm/Po) (pan-LDH antigen positive), and 0.1% (95% CI 0.1–0.3) considered as a mixed infection (HRP2 and pan-LDH positive). More than 90% of the positive P. falciparum RDT results were from the Gambela and
Fig. 1 Flow chart showing sample selection and analysis procedure
Page 5 of 14Assefa et al. Malar J (2019) 18:246
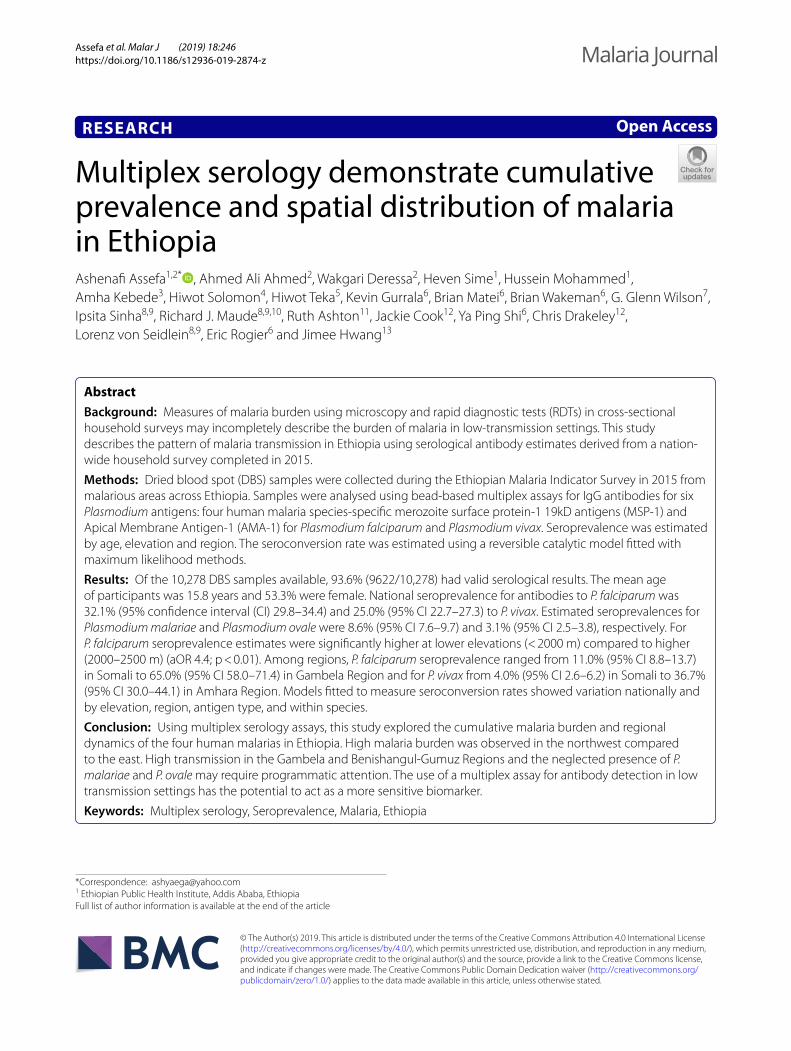
Tabl
e 1
Char
acte
rist
ics
of s
tudy
par
tici
pant
s by
adm
inis
trat
ive
regi
on, E
thio
pian
Mal
aria
Indi
cato
r Sur
vey-
2015
(EM
IS-2
015)
n, n
umbe
r of o
bser
vatio
ns; R
DT,
rapi
d di
agno
stic
test
; *3
peop
le d
id n
ot h
ave
GPS
coo
rdin
ates
; **3
613
indi
vidu
als
wer
e w
ithou
t bed
net
use
dat
a; *
**RD
T te
st w
as n
ot d
one
for 4
indi
vidu
als;
4 R
DT
test
s w
ere
inva
lid a
nd 3
in
divi
dual
s re
fuse
d RD
T te
stin
g
Tigr
ayA
far
Am
hara
Oro
mia
Som
ali
Beni
shan
gul-
Gum
uzSo
uthe
rn N
atio
ns
and
Nat
iona
litie
s Pe
ople
s’
Gam
bela
Har
ari
Dire
daw
aN
atio
nal
Gen
der %
(95%
CI)
n =
874
3
Mal
e46
.5 (4
4.1–
48.9
)47
.6 (4
2.9–
52.3
)50
.9 (4
7.4–
54.3
)48
.2 (4
5.6–
50.9
)45
.1 (4
0.8–
49.4
)45
.3 (4
0.8–
49.9
)46
.4 (4
4.3–
48.5
)41
.4 (3
7.4–
45.5
)47
.4 (3
.0–6
5.4)
40.5
(33.
1–48
.4)
47.7
(46.
3–49
.2)
Fem
ale
53.3
(51.
1–55
.9)
52.4
(47.
7–57
.1)
49.1
(45.
7–52
.6)
51.8
(49.
1–54
.4)
54.9
(50.
6–59
.2)
54.7
(50.
1–59
.2)
53.6
(51.
5–55
.7)
58.6
(54.
5–62
.6)
52.6
(34.
6–70
.0)
59.5
(51.
6–66
.9)
52.3
(50.
8–53
.7)
Age
gro
up (y
ears
)% (9
5% C
I)
0–5
43.8
(39.
6–48
.0)
66.6
(63.
7–69
.3)
40.8
(37.
1–44
.7)
44.6
(41.
5–47
.9)
61.7
(58.
8–64
.6)
49.5
(41.
5–57
.5)
45.4
(43.
2–47
.7)
54.8
(50.
8–58
.8)
25.5
(12.
9–44
.2)
46.0
(35.
3–57
.1)
44.8
(43.
0–46
.5)
5–1
517
.7 (1
5.2–
20.4
)12
.8 (9
.2–1
7.5)
20.5
(18.
0–23
.3)
18.8
(15.
8–22
.3)
14.6
(11.
7–18
.1)
16.0
(12.
9–19
.6)
20.8
(18.
9–22
.9)
18.9
(16.
6–21
.5)
3.5
(1.0
–11.
6)10
.2 (6
.6–1
5.4)
19.4
(17.
8–21
.1)
15–
2513
.3 (1
1.3–
15.6
)6.
1 (3
.9–9
.4)
12.6
(9.5
–16.
6)11
.6 (1
0.0–
13.4
)5.
2 (3
.6–7
.5)
11.5
(7.8
–16.
6)11
.4 (9
.7–1
3.4)
10.7
(8.3
–13.
8)22
.1 (1
7.4–
27.5
)14
.0 (1
0.9–
17.9
)11
.7 (1
0.7–
12.8
)
25–
5017
.1 (1
4.9–
19.4
)14
.1 (1
2.1–
16.4
)19
.2 (1
6.2–
22.6
)19
.7 (1
7.5–
22.1
)14
.6 (1
3.0–
16.4
)14
.5 (1
0.7–
19.3
)17
.1 (1
5.6–
18.6
)12
.3 (1
.1–1
5.0)
36.8
(29.
3–45
.0)
21.7
(15.
9–28
.9)
18.5
(17.
3–19
.8)
50+
8.2
(6.6
–10.
1)0.
5 (0
.1–1
.5)
6.9
(5.1
–9.1
)5.
2 (3
.9–7
.0)
3.8
(2.7
–5.3
)8.
6 (5
.3–1
3.5)
5.2
(4.1
–6.6
)3.
2 (2
.3–4
.5)
12.1
(7.4
–19.
2)8.
1 (4
.5–1
4.2)
5.7
(4.9
–6.6
)
Elev
atio
n (m
) % (9
5% C
I)n =
874
0*
< 1
000
5.6
(1.6
–17.
4)38
.0 (1
3.7–
70.4
)0
(0.0
–0.0
)0
(0.0
–0.0
)28
.6 (1
2.6–
52.7
)8.
2 (1
.1–5
2.7)
0 (0
.0–0
.0)
88.4
(7
2.1–
95.8
0 (0
.0–0
.0)
0.9
(0.1
–6.7
)1.
9 (1
.2–2
.8)
100
0–20
0064
.3 (4
6.8–
78.6
)62
.0 (2
9.6–
86.3
)53
.4 (3
3.2–
72.5
)77
.4 (4
7.3–
87.4
)71
.4 (4
7.3–
87.4
)91
.8 (5
7.4–
98.9
)79
.0 (6
7.3–
87.3
)11
.6 (4
.2–2
7.9)
100
(100
.0–
100.
0)99
.1 (9
3.9–
99.9
)73
.1 (6
5.6–
79.4
)
> 2
000
30.2
(16.
5–48
.5)
0 (0
.0–0
.0)
46.6
(27.
5–66
.8)
22.6
(13.
1–36
.1)
0 (0
.0–0
.0)
0 (0
.0–0
.0)
21 (1
2.7–
32.7
)0
(0.0
–0.0
)0
(0.0
–0.0
)0
(0.0
–0.0
)25
.0 (1
8.8–
32.5
)
Bed
net u
se (l
ast n
ight
) % (9
5% C
I)n =
516
8**
Yes
57.6
(50.
3–64
.5)
80.5
(65.
7–89
.9)
59.1
(48.
1–69
.4)
69.6
(59.
6–78
.1)
75.2
(61.
2–85
.4)
66.1
(54.
3–76
.2)
55.7
(49.
4–61
.8)
84.7
(76.
0–90
.6)
33.5
(12.
8–63
.3)
25 (1
4.3–
41.6
)62
.1 (5
7.5–
66.6
)
No
42.4
(35.
5–49
.7)
19.5
(10.
1–34
.3)
40.9
(30.
6–51
.9)
30.4
(21.
9–40
.4)
24.8
(14.
6–38
.8)
33.9
(23.
8–45
.7)
44.3
(38.
2–50
.6)
15.3
(9.4
–24.
0)66
.5 (3
6.7–
87.2
)74
.4 (5
8.4–
85.7
)37
.9 (3
3.4–
42.5
)
RDT
resu
lts %
(95%
CI)
Pf
0.8
(0.4
–1.6
)0
(0.0
–0.0
)0.
7 (0
.2–1
.8)
0.2
(0.1
–0.6
)0
(0.0
–0.0
)6.
2 (2
.2–1
6.3)
0.2
(0.1
–0.5
)16
.8 (1
1.8–
23.2
)0
(0.0
–0.0
)0
(0.0
–0.0
)0.
5 (0
.3–0
.7)
Pan
0.7
(0.3
–1.3
)0.
2 (0
.0–1
.3)
0 (0
.0–0
.0)
0.1
(0.0
–0.4
)0.
1 (0
.0–0
.8)
0 (0
.0–0
.0)
0.4
(0.1
–1.2
)0.
1 (0
.0–0
.6)
0 (0
.0–0
.0)
0 (0
.0–0
.0)
0.2
(0.1
–0.4
)
Pf/
Pan
0.1
(0.0
–0.6
)0
(0.0
–0.0
)0.
5 (0
.1–1
.8)
0 (0
.0–0
.0)
0 (0
.0–0
.0)
0.4
(0.0
–2.6
)0.
2 (0
.0–0
.6)
1.7
(0.9
–3.0
)0
(0.0
–0.0
)0
(0.0
–0.0
)0.
1 (0
.1–0
.3)
Neg
ativ
e98
.4 (9
7.4–
99.0
)99
.8 (9
8.7–
100.
0)98
.9 (9
6.7–
99.6
)99
.7 (9
9.3–
99.8
)99
.9 (9
9.2–
100.
0)93
.5 (8
2.3–
97.8
)99
.3 (9
8.3–
99.7
)81
.5 (7
4.5–
86.9
)10
0 (1
00.0
–10
0.0)
100
100.
0–10
0.0)
99.2
(98.
8–99
.4)

Page 6 of 14Assefa et al. Malar J (2019) 18:246
Benishangual-Gumuz Regions. 62.1% (95% CI 57.5–66.6) of respondents said they used a bed net during the previ-ous night (Table 1).
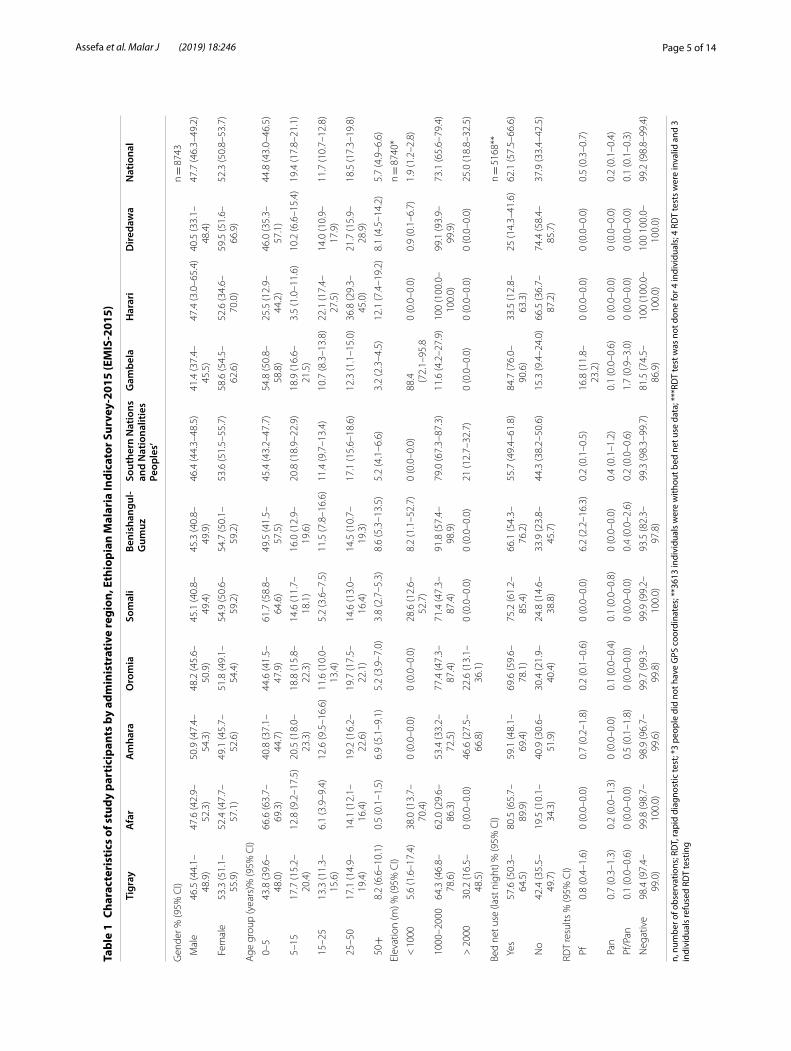
SeroprevalenceNationally, 32.1% (95% CI 29.8–34.4) of the participants were seropositive for any IgG against the two P. falci-parum antigens, and 25.0% (95% CI 22.7–27.34) for P. vivax. Only 6.6% (95% CI 5.5–8.0) of participants were seropositive for both P. falciparum and P. vivax, while 41.1% (95% CI 38.5–43.7) of individuals were positive either for P. falciparum or P. vivax. Eight point six per-cent (95% CI 7.6–9.7) and 3.1% (95% CI 2.5–3.8) were seropositive for P. malariae and P. ovale, respectively (Table 2). By antigen, 23.8% (95% CI 21.4–26.3) were positive against P. falciparum MSP-1 and 24.5% (95% CI 22.4–26.7) AMA-1, while for P. vivax, 21.2% (95% CI 19.2–23.4) were positive against MSP-1 and 14.4% (95% CI 12.7–16.2) AMA-1.
For children under 5 years of age, 18.0% (95% CI 16.1–20.1) and 14.8% (95% CI 12.7–17.2) were seropositive for P. falciparum and P. vivax, respectively. Similarly, 33.3% (95% CI 30.4–36.2) of male children were seropositive for
P. falciparum compared to 30.9% (95% CI 28.3–33.6) of the females [aOR: 1.3 (95% CI 1.1–1.4), p < 0.05] (Addi-tional file 1). A similar trend was observed for P. vivax, where 26.4% (95% CI 23.4–29.7) of males compared to 23.6% (95% CI 21.1–26.3) of females were seropositive [aOR: 1.3 (95% CI 1.1–1.5), p > 0.05].
Seroprevalence by ageThe DBS sample collection was purposely biased towards children under 5 years of age, with 44.8% (95% CI 43.0–46.5) of the DBS samples having been collected from this age group. Seropositivity increased with age group. This pattern was more pronounced for P. falciparum than P. vivax, although the difference was significant in both Plasmodium species (p < 0.05).
Conservative estimate for Plasmodium malariae and Plasmodium ovaleTable 3 shows of all samples tested, 5.1% (95% CI 4.4–6.0) were seropositive for P. malariae and 1.5% (95% CI 1.1–2.0) for P. ovale using the conservative approach to define seropositivity. Both species were observed in all the regions, albeit with a variable distribution. The
Fig. 2 Distribution of dried blood spot (DBS) samples collected from selected malaria endemic areas of Ethiopia as part of the national, cross-sectional, household Malaria Indicator Survey conducted in 2015 (EMIS-2015). Each point depicts a cluster of sampled households in an EA. Shading indicates elevation which ranges from − 131 m below sea level (lightest) to 4092 m (darkest)
Page 7 of 14Assefa et al. Malar J (2019) 18:246
proportion of seropositives was slightly lower for both species, accordingly to the conservative estimation method. A similar trend of seropositivity was observed for children under 5 years of age (Table 3).
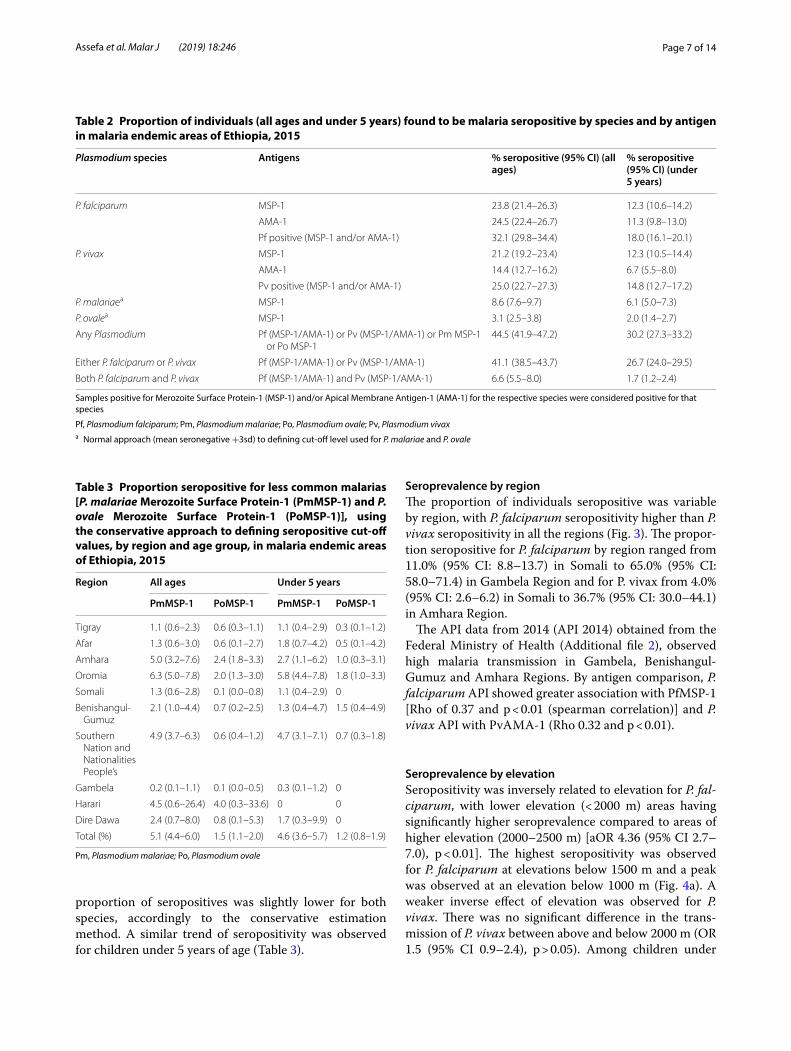
Seroprevalence by regionThe proportion of individuals seropositive was variable by region, with P. falciparum seropositivity higher than P. vivax seropositivity in all the regions (Fig. 3). The propor-tion seropositive for P. falciparum by region ranged from 11.0% (95% CI: 8.8–13.7) in Somali to 65.0% (95% CI: 58.0–71.4) in Gambela Region and for P. vivax from 4.0% (95% CI: 2.6–6.2) in Somali to 36.7% (95% CI: 30.0–44.1) in Amhara Region.
The API data from 2014 (API 2014) obtained from the Federal Ministry of Health (Additional file 2), observed high malaria transmission in Gambela, Benishangul-Gumuz and Amhara Regions. By antigen comparison, P. falciparum API showed greater association with PfMSP-1 [Rho of 0.37 and p < 0.01 (spearman correlation)] and P. vivax API with PvAMA-1 (Rho 0.32 and p < 0.01).
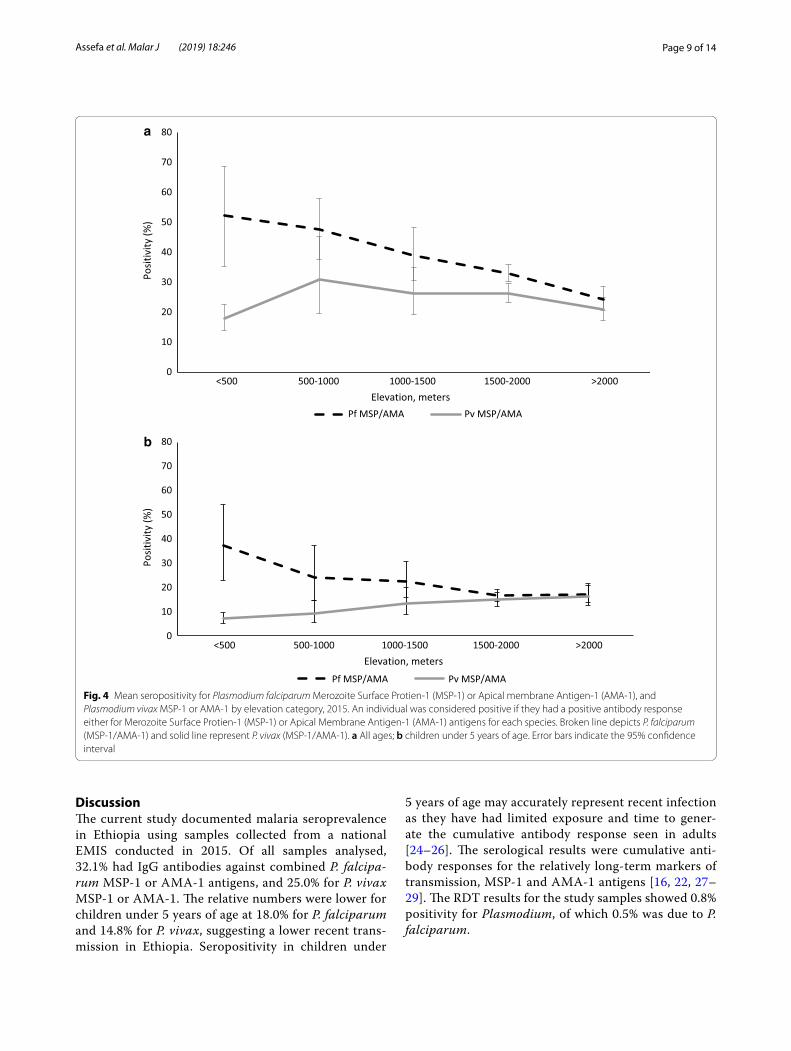
Seroprevalence by elevationSeropositivity was inversely related to elevation for P. fal-ciparum, with lower elevation (< 2000 m) areas having significantly higher seroprevalence compared to areas of higher elevation (2000–2500 m) [aOR 4.36 (95% CI 2.7–7.0), p < 0.01]. The highest seropositivity was observed for P. falciparum at elevations below 1500 m and a peak was observed at an elevation below 1000 m (Fig. 4a). A weaker inverse effect of elevation was observed for P. vivax. There was no significant difference in the trans-mission of P. vivax between above and below 2000 m (OR 1.5 (95% CI 0.9–2.4), p > 0.05). Among children under
Table 2 Proportion of individuals (all ages and under 5 years) found to be malaria seropositive by species and by antigen in malaria endemic areas of Ethiopia, 2015
Samples positive for Merozoite Surface Protein-1 (MSP-1) and/or Apical Membrane Antigen-1 (AMA-1) for the respective species were considered positive for that species
Pf, Plasmodium falciparum; Pm, Plasmodium malariae; Po, Plasmodium ovale; Pv, Plasmodium vivaxa Normal approach (mean seronegative +3sd) to defining cut-off level used for P. malariae and P. ovale
Plasmodium species Antigens % seropositive (95% CI) (all ages)
% seropositive (95% CI) (under 5 years)
P. falciparum MSP-1 23.8 (21.4–26.3) 12.3 (10.6–14.2)
AMA-1 24.5 (22.4–26.7) 11.3 (9.8–13.0)
Pf positive (MSP-1 and/or AMA-1) 32.1 (29.8–34.4) 18.0 (16.1–20.1)
P. vivax MSP-1 21.2 (19.2–23.4) 12.3 (10.5–14.4)
AMA-1 14.4 (12.7–16.2) 6.7 (5.5–8.0)
Pv positive (MSP-1 and/or AMA-1) 25.0 (22.7–27.3) 14.8 (12.7–17.2)
P. malariaea MSP-1 8.6 (7.6–9.7) 6.1 (5.0–7.3)
P. ovalea MSP-1 3.1 (2.5–3.8) 2.0 (1.4–2.7)
Any Plasmodium Pf (MSP-1/AMA-1) or Pv (MSP-1/AMA-1) or Pm MSP-1 or Po MSP-1
44.5 (41.9–47.2) 30.2 (27.3–33.2)
Either P. falciparum or P. vivax Pf (MSP-1/AMA-1) or Pv (MSP-1/AMA-1) 41.1 (38.5–43.7) 26.7 (24.0–29.5)
Both P. falciparum and P. vivax Pf (MSP-1/AMA-1) and Pv (MSP-1/AMA-1) 6.6 (5.5–8.0) 1.7 (1.2–2.4)
Table 3 Proportion seropositive for less common malarias [P. malariae Merozoite Surface Protein-1 (PmMSP-1) and P. ovale Merozoite Surface Protein-1 (PoMSP-1)], using the conservative approach to defining seropositive cut-off values, by region and age group, in malaria endemic areas of Ethiopia, 2015
Pm, Plasmodium malariae; Po, Plasmodium ovale
Region All ages Under 5 years
PmMSP-1 PoMSP-1 PmMSP-1 PoMSP-1
Tigray 1.1 (0.6–2.3) 0.6 (0.3–1.1) 1.1 (0.4–2.9) 0.3 (0.1–1.2)
Afar 1.3 (0.6–3.0) 0.6 (0.1–2.7) 1.8 (0.7–4.2) 0.5 (0.1–4.2)
Amhara 5.0 (3.2–7.6) 2.4 (1.8–3.3) 2.7 (1.1–6.2) 1.0 (0.3–3.1)
Oromia 6.3 (5.0–7.8) 2.0 (1.3–3.0) 5.8 (4.4–7.8) 1.8 (1.0–3.3)
Somali 1.3 (0.6–2.8) 0.1 (0.0–0.8) 1.1 (0.4–2.9) 0
Benishangul-Gumuz
2.1 (1.0–4.4) 0.7 (0.2–2.5) 1.3 (0.4–4.7) 1.5 (0.4–4.9)
Southern Nation and Nationalities People’s
4.9 (3.7–6.3) 0.6 (0.4–1.2) 4.7 (3.1–7.1) 0.7 (0.3–1.8)
Gambela 0.2 (0.1–1.1) 0.1 (0.0–0.5) 0.3 (0.1–1.2) 0
Harari 4.5 (0.6–26.4) 4.0 (0.3–33.6) 0 0
Dire Dawa 2.4 (0.7–8.0) 0.8 (0.1–5.3) 1.7 (0.3–9.9) 0
Total (%) 5.1 (4.4–6.0) 1.5 (1.1–2.0) 4.6 (3.6–5.7) 1.2 (0.8–1.9)
Page 8 of 14Assefa et al. Malar J (2019) 18:246
5 years of age, P. falciparum and P. vivax both showed a significant although varying relationship with elevation. Plasmodium vivax showed direct relation with increasing elevation. High P. vivax seropositivity was observed at higher elevations above 1500 m (Fig. 4b). No significant effect of elevation on seropositivity was detected for the rare species, P. malariae and P. ovale (p > 0.05).
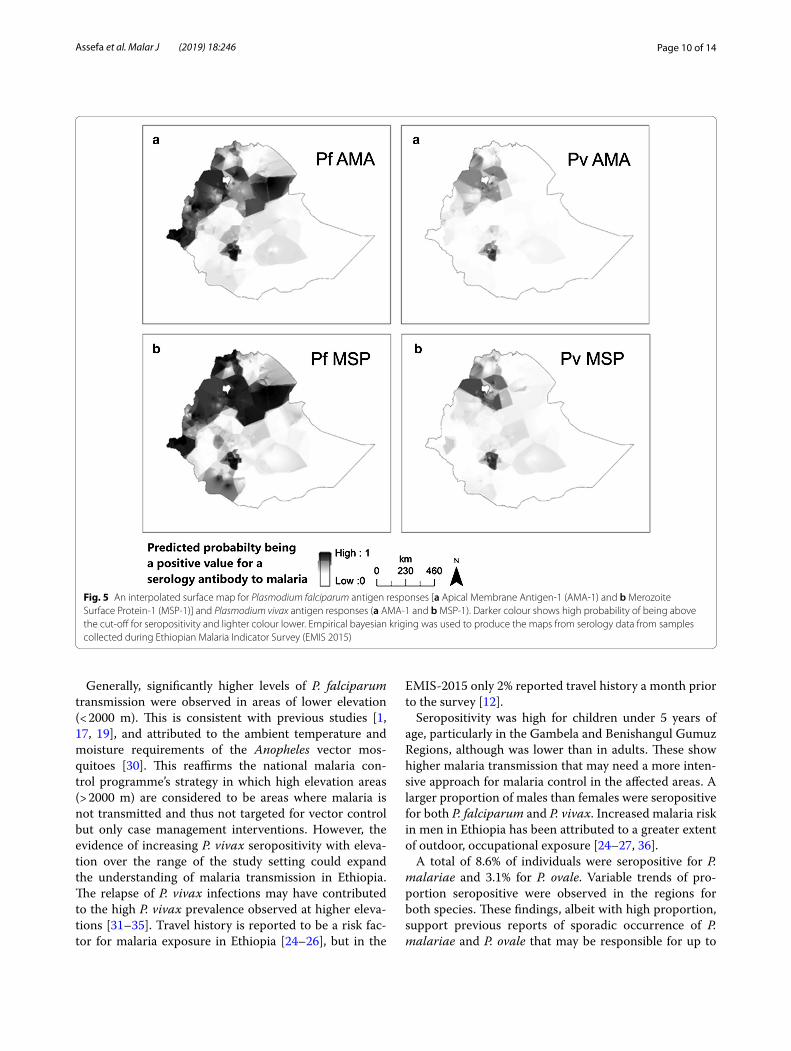
Generally, seropositivity was found to vary in space, with elevation and among administrative regions, as depicted in Fig. 5. An interpolated surface map predicted differing transmission patterns for P. falciparum and P. vivax. Higher seropositivity is predicted in the northwest compared to the southeast.
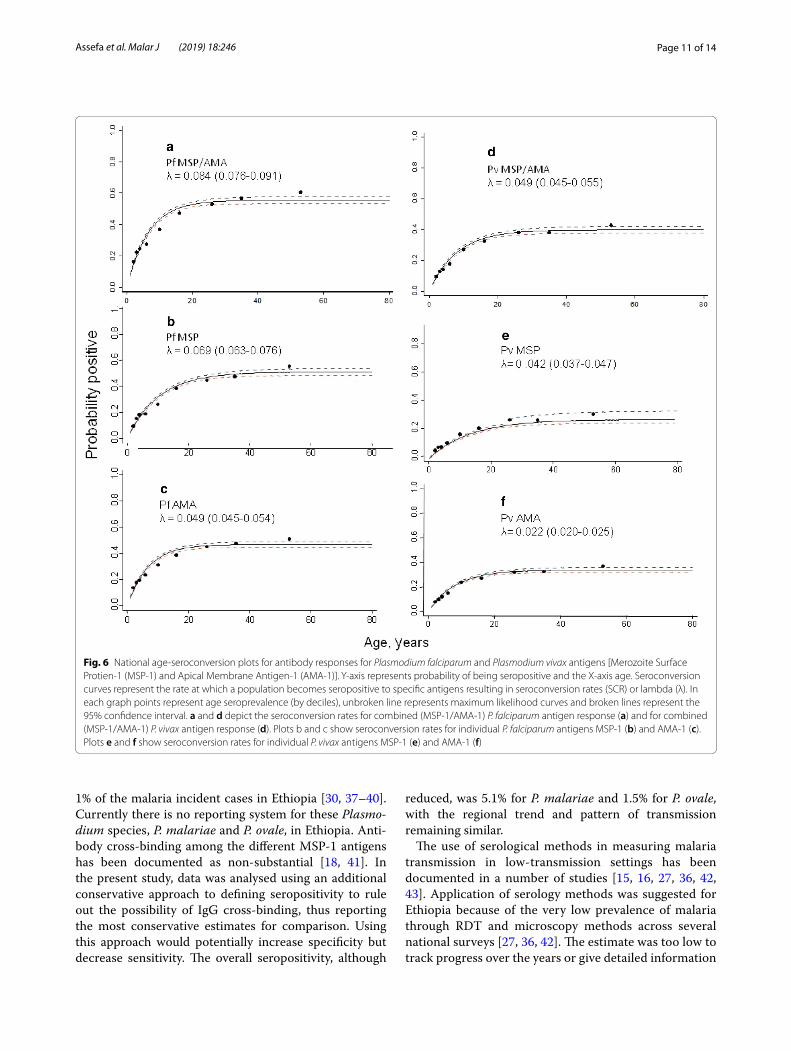
Seroconversion curvesThe overall age seroconversion plot for antibody responses for both P. falciparum and P. vivax are shown in Fig. 6. In general, higher seroconversion rates were observed for P. falciparum compared to P. vivax both for
the combined MSP-1/AMA-1 outcome and individual MSP-1 and AMA-1 antigens; and MSP-1 antigen show higher seroconversion rates compared to AMA-1 anti-gens for both species. Heterogeneity was observed across the different antigen responses. A similar trend was observed when the model was fitted to data with eleva-tion below 2000 m and combined MSP-1 and AMA-1 antigens. Regionally, the seroconversion model was fitted to the four major administrative regions (Amhara, Oro-mia, SNNP, Tigray) both for P. falciparum and P. vivax MSP-1 and AMA-1 antigen responses. Heterogeneous seroconversion rates were observed over the regions (Additional files 3 and 4). For seroconversion plots, where visual inspection indicated better fit between the observed and predicted pattern of transmission, two forces of infection were compared with a single force of infection. This showed a non-significant change over around two decades for both P. falciparum and P. vivax antigen responses (p > 0.05).
Fig. 3 Mean seropositivity by region for Plasmodium falciparum and Plasmodium vivax, 2015. An individual was considered positive if they had a positive antibody response either for Merozoite Surface Protein-1 (MSP-1) or Apical Membrane Antigen-1 (AMA-1) antigens for each species. a All ages; b children under 5 years of age. Error bars indicate the 95% confidence interval (BG: Benishangul-Gumuz and SNNPR: Southern Nations and Nationalities People’s Region)
Page 9 of 14Assefa et al. Malar J (2019) 18:246
DiscussionThe current study documented malaria seroprevalence in Ethiopia using samples collected from a national EMIS conducted in 2015. Of all samples analysed, 32.1% had IgG antibodies against combined P. falcipa-rum MSP-1 or AMA-1 antigens, and 25.0% for P. vivax MSP-1 or AMA-1. The relative numbers were lower for children under 5 years of age at 18.0% for P. falciparum and 14.8% for P. vivax, suggesting a lower recent trans-mission in Ethiopia. Seropositivity in children under
5 years of age may accurately represent recent infection as they have had limited exposure and time to gener-ate the cumulative antibody response seen in adults [24–26]. The serological results were cumulative anti-body responses for the relatively long-term markers of transmission, MSP-1 and AMA-1 antigens [16, 22, 27–29]. The RDT results for the study samples showed 0.8% positivity for Plasmodium, of which 0.5% was due to P. falciparum.
0
10
20
30
40
50
60
70
80
<500 500-1000 1000-1500 1500-2000 >2000
Posit
ivity
(%)
Elevation, metersPf MSP/AMA Pv MSP/AMA
0
10
20
30
40
50
60
70
80
<500 500-1000 1000-1500 1500-2000 >2000
Posit
ivity
(%)
Elevation, metersPf MSP/AMA Pv MSP/AMA
a
b
Fig. 4 Mean seropositivity for Plasmodium falciparum Merozoite Surface Protien-1 (MSP-1) or Apical membrane Antigen-1 (AMA-1), and Plasmodium vivax MSP-1 or AMA-1 by elevation category, 2015. An individual was considered positive if they had a positive antibody response either for Merozoite Surface Protien-1 (MSP-1) or Apical Membrane Antigen-1 (AMA-1) antigens for each species. Broken line depicts P. falciparum (MSP-1/AMA-1) and solid line represent P. vivax (MSP-1/AMA-1). a All ages; b children under 5 years of age. Error bars indicate the 95% confidence interval
Page 10 of 14Assefa et al. Malar J (2019) 18:246
Generally, significantly higher levels of P. falciparum transmission were observed in areas of lower elevation (< 2000 m). This is consistent with previous studies [1, 17, 19], and attributed to the ambient temperature and moisture requirements of the Anopheles vector mos-quitoes [30]. This reaffirms the national malaria con-trol programme’s strategy in which high elevation areas (> 2000 m) are considered to be areas where malaria is not transmitted and thus not targeted for vector control but only case management interventions. However, the evidence of increasing P. vivax seropositivity with eleva-tion over the range of the study setting could expand the understanding of malaria transmission in Ethiopia. The relapse of P. vivax infections may have contributed to the high P. vivax prevalence observed at higher eleva-tions [31–35]. Travel history is reported to be a risk fac-tor for malaria exposure in Ethiopia [24–26], but in the
EMIS-2015 only 2% reported travel history a month prior to the survey [12].
Seropositivity was high for children under 5 years of age, particularly in the Gambela and Benishangul Gumuz Regions, although was lower than in adults. These show higher malaria transmission that may need a more inten-sive approach for malaria control in the affected areas. A larger proportion of males than females were seropositive for both P. falciparum and P. vivax. Increased malaria risk in men in Ethiopia has been attributed to a greater extent of outdoor, occupational exposure [24–27, 36].
A total of 8.6% of individuals were seropositive for P. malariae and 3.1% for P. ovale. Variable trends of pro-portion seropositive were observed in the regions for both species. These findings, albeit with high proportion, support previous reports of sporadic occurrence of P. malariae and P. ovale that may be responsible for up to
Fig. 5 An interpolated surface map for Plasmodium falciparum antigen responses [a Apical Membrane Antigen-1 (AMA-1) and b Merozoite Surface Protein-1 (MSP-1)] and Plasmodium vivax antigen responses (a AMA-1 and b MSP-1). Darker colour shows high probability of being above the cut-off for seropositivity and lighter colour lower. Empirical bayesian kriging was used to produce the maps from serology data from samples collected during Ethiopian Malaria Indicator Survey (EMIS 2015)
Page 11 of 14Assefa et al. Malar J (2019) 18:246
1% of the malaria incident cases in Ethiopia [30, 37–40]. Currently there is no reporting system for these Plasmo-dium species, P. malariae and P. ovale, in Ethiopia. Anti-body cross-binding among the different MSP-1 antigens has been documented as non-substantial [18, 41]. In the present study, data was analysed using an additional conservative approach to defining seropositivity to rule out the possibility of IgG cross-binding, thus reporting the most conservative estimates for comparison. Using this approach would potentially increase specificity but decrease sensitivity. The overall seropositivity, although
reduced, was 5.1% for P. malariae and 1.5% for P. ovale, with the regional trend and pattern of transmission remaining similar.
The use of serological methods in measuring malaria transmission in low-transmission settings has been documented in a number of studies [15, 16, 27, 36, 42, 43]. Application of serology methods was suggested for Ethiopia because of the very low prevalence of malaria through RDT and microscopy methods across several national surveys [27, 36, 42]. The estimate was too low to track progress over the years or give detailed information
Fig. 6 National age-seroconversion plots for antibody responses for Plasmodium falciparum and Plasmodium vivax antigens [Merozoite Surface Protien-1 (MSP-1) and Apical Membrane Antigen-1 (AMA-1)]. Y-axis represents probability of being seropositive and the X-axis age. Seroconversion curves represent the rate at which a population becomes seropositive to specific antigens resulting in seroconversion rates (SCR) or lambda (λ). In each graph points represent age seroprevalence (by deciles), unbroken line represents maximum likelihood curves and broken lines represent the 95% confidence interval. a and d depict the seroconversion rates for combined (MSP-1/AMA-1) P. falciparum antigen response (a) and for combined (MSP-1/AMA-1) P. vivax antigen response (d). Plots b and c show seroconversion rates for individual P. falciparum antigens MSP-1 (b) and AMA-1 (c). Plots e and f show seroconversion rates for individual P. vivax antigens MSP-1 (e) and AMA-1 (f)
Page 12 of 14Assefa et al. Malar J (2019) 18:246
about differences in malaria burden by region or risks of infection due to demographic or behavioural fac-tors. By describing exposure to malaria over a longer period, serology data were able to better document dif-ferences in exposure between age groups, regions and by elevation.
The findings show the magnitude of transmission intensity was highly variable among different regions and elevations in Ethiopia. Yalew et al. reported similar trends with 30.0 and 21.8% seroprevalence for P. falcipa-rum and P. vivax, respectively, for the Amhara region in 2013 [36]. The current study reported 32.1% for P. falci-parum and 25.0% for P. vivax for the same region. The slight variation in seropositivity may be attributed to the different type of laboratory assay used. The challenge of comparing data from ELISA and bead-based multiplex serology has been investigated previously [15]. Results from multiplex serology were more robust, sensitive and ideal for large-scale surveys compared to ELISA [15]. Heterogeneity of response for the different anti-gens was demonstrated in several studies. Ashton et al. [27] described MSP-1 antigens to be better biomark-ers for P. falciparum, although Cook et al. [16] reported AMA-1 to be better for measuring P. falciparum in low-transmission settings. Characterization of antigen markers may be required to further qualify the serol-ogy methods [44]. The current finding was in agreement with the API data from 2014 obtained through routine surveillance. Although routine surveillance can provide crucially important data for decision making for coun-tries at lower transmission, additional biomarkers to track malaria burden can serve as ancillary data as sur-veillance systems continue to improve and dynamically evolve in completeness and quality.
The study had several limitations. Only 65% of DBS samples from the EMIS-2015 survey were available for serological analysis. Although no systematic bias was introduced and frequencies were weighted, the repre-sentativeness of this sample at the national and regional levels should be interpreted cautiously. The data were insufficient to produce refined spatial heat maps and the maps produced show only general trends. Samples col-lected are assumed to reflect the malaria exposure of their respective locations and did not account for poten-tial population movement. Although the survey reported very low recent travel history, past travel encompassing the previous harvest season as well as previous years were not captured and could reflect past malaria expo-sure risk from a different locale. This study assessed long-term markers of transmission, but further char-acterizing antigens based on local eco-epidemiology is recommended to identify and select specific short- and long-term markers.
ConclusionThe current study explored the malaria burden and transmission intensity using serological markers of exposure to four malaria species. It documented the magnitude, spatial distribution and dynamics of trans-mission over differing elevation, administrative regions, and age groups using samples collected during a national programme evaluation survey with minimal sample preparation time and cost. These findings confirmed the National Malaria Control Programme data of the rela-tive high transmission in the Gambela and Benishangul-Gumuz Regions and highlighted gaps in the current understanding of malaria epidemiology. The increase of P. vivax seropositivity with elevation and the presence of P. malariae and P. ovale in all administrative regions (given P. ovale requires hypnozoiticidal treatment) may require programmatic consideration in selecting diag-nostic tools and appropriate treatment guidelines. These results can be used as baseline data to evaluate the recent malaria elimination efforts in Ethiopia especially as routine surveillance systems are progressively being strengthened.
Additional files
Additional file 1. Percent malaria seropositivity and Odds Ratio (OR) by sex, age and elevation for each species in malaria endemic areas of Ethiopia, 2014.
Additional file 2. An Interpolated surface map for P. falciparum (left) and P. vivax (right). Empirical bayesian kriging was used to produce the maps from the Annual Parasite Incidence data in Ethiopia (API 2014).
Additional file 3. Regional age-seroconversion plots for antibody responses for Plasmodium falciparum antigens. Y-axis represents prob-ability of being seropositive and the X-axis age. Seroconversion curves represent the rate at which a population become seropositive to specific antigens resulting in seroconversion rates (SCR) or lambda (λ). In each graph points represent age seroprevalence (by deciles), unbroken line rep-resents maximum likelihood curves and broken lines represent the 95% confidence interval. Plots A and B depict the seroconversion curves for P. falciparum antigens response to MSP-1 (A) and AMA-1(B) for the major four regions Tigray, Amhara, Oromia and Southern Nations and Nationali-ties People’s Regions.
Additional file 4. Regional age-seroconversion plots for antibody responses for P. falciparum antigens. Y-axis represents probability of being seropositive and the X-axis age. Seroconversion curves represent the rate at which a population become seropositive to specific antigens resulting in seroconversion rates (SCR) or lambda (λ). In each graph points represent age seroprevalence (by deciles), unbroken line represents maximum likeli-hood curves and broken lines represent the 95% confidence interval. Plots A and B depict the seroconversion curves for P. vivax antigens response to MSP-1 (A) and AMA-1 (B) for the major four regions, Tigray, Amhara, Oromia and Southern Nations and Nationalities People’s Region (SNNPR).
AbbreviationsAMA-1: Apical Membrane Antigen-1; API: annual parasite incidence; aOR: adjusted odds ratio; BG: Benishangul-Gumuz; BSA: bovine serum albumin; CDC: Center for Disease Control; CI: confidence interval; DBS: dried blood

Page 13 of 14Assefa et al. Malar J (2019) 18:246
spot; EA: enumeration area; ELISA: Enzyme Linked Immunosorbent Assay; EMIS: Ethiopia Malaria Indicator Survey; FMM: Finite Mixture Model; GST: Gluthathione-S-Transferase; HRP2: Histidin Rich Protein 2; IgG: Immune globu-lin G; LSHTM: London School of Hygiene and Tropical Medicine; MFI: mean fluorescence intensity; MSP-1: Merozoite Surface Protein-1; RERRC : National Ethics and Research Review Committee; OR: odds ratio; PBS: phosphate buffered saline; PCR: polymerase chain reaction; pLDH: plasmodium lactate dehydrogenase; RDT: rapid diagnostic test; RFLP: restriction fragment length polymorphism; RT: room temperature; SCR: seroconversion rate; SNNPR: Southern Nations and Nationalities People’s Region; WRAIR: Walter Reed Army Institute of Research.
AcknowledgementsWe acknowledge the MIS 2015 steering committee, data collectors and study participants for the samples collected. We thank Zewditu Bekele, Fitsum Tes-faye, Hilina Legesse and Hailemariam Difabachew from the Ethiopian Public Health Institute for sample organization and management.
Authors’ contributionsConceived the study: AA, JH, AAA, WD designed the experiments: AA, ER, YPS, BW. Performed the experiments: AA, ER, KG, BM. Analysed the data: AA, ER, JK, CD, RA, RM, IS, JH. Assisted study implementation: AAA, WD, AK, HS, JM, HM, JH. Critically reviewed and contributed to writing: JH, LS, ER, AAA GW, RM, WD. Drafted the manuscript: AA. All authors read and approved the final manuscript.
FundingThis research was made possible through support provided by the Global Fund to fight AIDS, Tuberculosis and Malaria via the Federal Ministry of Health in Ethiopia and the US President’s Malaria Initiative via the Office of Health, Infectious Diseases, and Nutrition, Bureau for Global Health, US Agency for International Development. The opinions expressed herein are those of the author(s) and do not necessarily reflect the views of any collaborating institute including the Centers for Disease Control and Prevention or the US Agency for International Development. HT and JH receive salary support from the US President’s Malaria Initiative.
Availability of data and materialsThe datasets used and/or analysed during the current study are available from the corresponding author on reasonable request.
Ethics approval and consent to participateThe MIS 2015 protocol received ethical clearance from the National Ethics and Research Review Committee (RERRC) of Ethiopia and from the College of Health Science Addis Ababa, University. The survey protocol which included serology testing underwent human subjects review at CDC and received non-research determination.
Consent for publicationNot applicable.
Competing interestsThe authors declare that they have no competing interests.
Author details1 Ethiopian Public Health Institute, Addis Ababa, Ethiopia. 2 School of Public Health, Addis Ababa University, Addis Ababa, Ethiopia. 3 African Society for Laboratory Medicine, Addis Ababa, Ethiopia. 4 Ethiopian Federal Ministry of Health, Addis Ababa, Ethiopia. 5 U.S. President’s Malaria Initiative, United States Agency for International Development, Addis Ababa, Ethiopia. 6 Malaria Branch, Division of Parasitic Diseases and Malaria, Centers for Disease Control and Prevention, Atlanta, GA, USA. 7 Department of Biology, University of Southern Denmark, 5230 Odense M, Denmark. 8 Mahidol Oxford Research Unit, Mahidol University, Bangkok, Thailand. 9 Centre for Tropical Medicine and Global Health, Nuffield Department of Medicine, University of Oxford, Oxford, UK. 10 Harvard TH Chan School of Public Health, Harvard University, Boston, USA. 11 Center for Applied Malaria Research and Evaluation, Tulane School of Public Health and Tropical Medicine, New Orleans, LA, USA. 12 Lon-don School of Hygiene and Tropical Medicine, London, UK. 13 Malaria Branch, Division of Parasitic Diseases and Malaria, U.S. President’s Malaria Initiative, Centers for Disease Control and Prevention, Atlanta, GA, USA.
Received: 13 March 2019 Accepted: 7 July 2019
References 1. Zein A, Koos H. The ecology of health and disease in Ethiopia. Ministry of
Health: Addis Ababa; 1993. 2. Ethiopian Public Health Association (EPHA). Proceeding on the 2003
malaria epidemics in Ethiopia. EPHA Addis Ababa 2004. 3. Checchi F, Cox J, Balkan S, Tamrat A, Priotto G, Alberti KP, Guthmann JP.
Malaria epidemics and interventions, Kenya, Burundi, Southern Sudan, and Ethiopia, 1999–2004. Emerg Infect Dis. 2006;10:1477–85.
4. Aregawi M, Lynch M, Bekele W, Kebede H, Jima D, Taffese HS, et al. Time series analysis of trends in malaria cases and deaths at hospitals and the effect of antimalarial interventions, 2001–2011, Ethiopia. PLoS One. 2014;9:e106359.
5. Deribew A, Dejene T, Kebede B, Tessema GA, Melaku YA, Misganaw A, et al. Incidence, prevalence and mortality rates of malaria in Ethiopia from 1990 to 2015: analysis of the global burden of diseases 2015. Malar J. 2017;16:271.
6. Federal Ministry of Health Ethiopia (FMOH). Ethiopia National Malaria strategic plan: 2017–2020. Addis Ababa; 2017.
7. WHO. World malaria report 2015. Geneva: World Health Organization; 2015. http://apps.who.int/iris/bitst ream/10665 /20001 8/1/97892 41565 158_eng.pdf?ua=1.
8. WHO. World malaria report 2017. Geneva: World Health Organization; 2017. http://www.who.int/malar ia/publi catio ns/world -malar ia-repor t-2017/en/.
9. Ochola LB, Vounatsou P, Smith T, Mabaso ML, Newton CR. The reliability of diagnostic techniques in the diagnosis and management of malaria in the absence of a gold standard. Lancet Infect Dis. 2006;6:582–8.
10. Ethiopia National Malaria Indicator Survey Report-EMIS 2011. Ethiopian Public Health Institute; 2012. http://www.ephi.gov.et/image s/downl oads/ethio pia-mis20 11-repor t.pdf.
11. Jima D, Getachew A, Bilak H, Steketee RW, Emerson PM, Graves PM, et al. Malaria indicator survey 2007, Ethiopia: coverage and use of major malaria prevention and control interventions. Malar J. 2010;9:58.
12. Ethiopian National Malaria indicator Survey 2015. Ethiopian Public Health Institute; 2016. https ://www.ephi.gov.et/image s/pictu res/downl oad20 09/MIS-2015-Final -Repor t-Decem ber-2016.pdf.
13. Zaw MT, Thant M, Hlaing TM, Aung NZ, Thu M, Phumchuea K, et al. Asymptomatic and sub-microscopic malaria infection in Kayah State, eastern Myanmar. Malar J. 2017;16:138.
14. Bousema T, Okell L, Felger I, Drakeley C. Asymptomatic malaria infections: detectability, transmissibility and public health relevance. Nat Rev Micro-biol. 2014;12:833–40.
15. Rogier E, Wiegand R, Moss D, Priest J, Angov E, Dutta S, et al. Multiple comparisons analysis of serological data from an area of low Plasmodium falciparum transmission. Malar J. 2015;14:436.
16. Cook J, Reid H, Iavro J, Kuwahata M, Taleo G, Clements A, et al. Using sero-logical measures to monitor changes in malaria transmission in Vanuatu. Malar J. 2010;9:169.
17. Corran P, Coleman P, Riley E, Drakeley C. Serology: a robust indicator of malaria transmission intensity? Trends Parasitol. 2007;23:575–82.
18. Priest JW, Plucinski MM, Huber CS, Rogier E, Mao B, Gregory CJ, et al. Specificity of the IgG antibody response to Plasmodium falciparum, Plasmodium vivax, Plasmodium malariae, and Plasmodium ovale MSP119 subunit proteins in multiplexed serologic assays. Malar J. 2018;17:417.
19. Heppner DG, Kester KE, Ockenhouse CF, Tornieporth N, Ofori O, Lyon JA, et al. Towards an RTS, S-based, multi-stage, multi-antigen vaccine against falciparum malaria: progress at the Walter Reed Army Institute of Research. Vaccine. 2005;23:2243–50.
20. Tongren JE, Drakeley CJ, McDonald SLR, Reyburn HG, Manjurano A, Nkya WMM, et al. Target antigen, age, and duration of antigen exposure independently regulate immunoglobulin G subclass switching in malaria. Infect Immun. 2006;74:257–64.
21. Rogier E, Moss DM, Chard AN, Trinies V, Doumbia S, Freeman MC, et al. Evaluation of immunoglobulin G responses to Plasmodium falciparum and Plasmodium vivax in Malian school children using multiplex bead assay. Am J Trop Med Hyg. 2017;96:312–8.
Page 14 of 14Assefa et al. Malar J (2019) 18:246
• fast, convenient online submission
•
thorough peer review by experienced researchers in your field
• rapid publication on acceptance
• support for research data, including large and complex data types
•
gold Open Access which fosters wider collaboration and increased citations
maximum visibility for your research: over 100M website views per year •
At BMC, research is always in progress.
Learn more biomedcentral.com/submissions
Ready to submit your research ? Choose BMC and benefit from:
22. Drakeley CJ, Corran PH, Coleman PG, Tongren JE, McDonald SLR, Carneiro I, et al. Estimating medium- and long-term trends in malaria transmission by using serological markers of malaria exposure. Proc Natl Acad Sci USA. 2005;102:5108–13.
23. Krivoruchko K. Empirical Bayesian Kriging 2012. https ://www.esri.com/news/arcus er/1012/empir ical-byesi an-krigi ng.html. Accessed 27 Dec 2018.
24. Alemu K, Worku A, Berhane Y, Kumie A. Men traveling away from home are more likely to bring malaria into high altitude villages, northwest Ethiopia. PLoS One. 2014;9:e0095341.
25. Yukich JO, Taylor C, Eisele TP, Reithinger R, Nauhassenay H, Berhane Y. Travel history and malaria infection risk in a low-transmission setting in Ethiopia: a case control study. Malar J. 2013;12:33.
26. Asnakew Y, Belendia S, Caterina G, Berhane T, Steffanie C, Teklehaimanot GK, et al. Movement patterns of seasonal migrant workers associated with malaria risk derived from outpatient register books in Amhara Region, Ethiopia. 2017. https ://path.org/resou rces/movem ent-patte rns-of-seaso nal-migra nt-worke rs-assoc iated -with-malar ia-risk-deriv ed-from-outpa tient -regis ter-books -in-amhar a-regio n-ethio pia/.
27. Ashton RA, Kefyalew T, Tesfaye G, Pullan RL, Yadeta D, Reithinger R, et al. School-based surveys of malaria in Oromia Regional State, Ethiopia: a rapid survey method for malaria in low transmission settings. Malar J. 2011;10:25.
28. Donahue CG, Carruthers VB, Gilk SD, Ward GE. The Toxoplasma homolog of Plasmodium Apical Membrane Antigen-1 (AMA-1) is a microneme protein secreted in response to elevated intracellular calcium levels. Mol Biochem Parasitol. 2000;111:15–30.
29. Scott CA, Yeshiwondim AK, Serda B, Guinovart C, Tesfay BH, Agmas A, et al. Mass testing and treatment for malaria in low transmission areas in Amhara Region, Ethiopia. Malar J. 2016;15:305.
30. National Malaria Control Team, World Health Organization, Ethiopian Addis Ababa University and the INFORM project, Ethiopian Public Health Institute, Department of Public Health Kenya Medical Research Institute. An epidemiological profile of malaria in Ethiopia. 2014.
31. White NJ. Determinants of relapse periodicity in Plasmodium vivax malaria. Malar J. 2011;10:297.
32. Assefa A, Ali A, Deressa W, Tsegaye W, Abebe G, Sime H, et al. Glucose-6-phosphate dehydrogenase (G6PD) deficiency in Ethiopia: absence of common African and Mediterranean allelic variants in a nationwide study. Malar J. 2018;17:388.
33. Kondrashin A, Baranova AM, Ashley EA, Recht J, White NJ, Sergiev VP. Mass primaquine treatment to eliminate vivax malaria: lessons from the past. Malar J. 2014;13:51.
34. Koepfli C, Colborn KL, Kiniboro B, Lin E, Speed TP, Siba PM, et al. A high force of Plasmodium vivax blood-stage infection drives the rapid acquisi-tion of immunity in Papua New Guinean children. PLoS Negl Trop Dis. 2013;7:e2403.
35. Woyessa A, Deressa W, Ali A, Lindtjørn B. Prevalence of malaria infection in Butajira area, south-central Ethiopia. Malar J. 2012;11:84.
36. Yalew WG, Pal S, Bansil P, Dabbs R, Tetteh K, Guinovart C, et al. Current and cumulative malaria infections in a setting embarking on elimination: Amhara, Ethiopia. Malar J. 2017;16:242.
37. Alemu A, Fuehrer H-P, Getnet G, Tessema B, Noedl H. Plasmodium ovale curtisi and Plasmodium ovale wallikeri in North-West Ethiopia. Malar J. 2013;12:346.
38. Armstrong JC. Plasmodium ovale endemic in Ethiopia. Trans R Soc Trop Med Hyg. 1969;63:287–8.
39. Krafsur ES, Armstrong JC. Epidemiology of Plasmodium malariae infection in Gambela, Ethiopia. Parassitologia. 1982;24:105–20.
40. WHO. World Malaria Report. Geneva: World Health Organization; 2011. http://www.who.int/malar ia/world _malar ia_repor t_2011/en/.
41. Woodberry T, Minigo G, Piera KA, Hanley JC, de Silva HD, Salwati E, et al. Antibodies to Plasmodium falciparum and Plasmodium vivax Merozo-ite Surface Protein 5 in Indonesia: species-specific and cross-reactive responses. J Infect Dis. 2008;198:134–42.
42. Birhanu Z, Yihdego YY, Yewhalaw D. Quantifying malaria endemicity in Ethiopia through combined application of classical methods and enzyme-linked immunosorbent assay: an initial step for countries with low transmission initiating elimination programme. Malar J. 2018;17:152.
43. Cook J, Xu W, Msellem M, Vonk M, Bergstrom B, Gosling R. Mass screening and treatment on the basis of results of a Plasmodium falciparum-specific rapid diagnostic test did not reduce malaria incidence in Zanzibar. J Infect Dis. 2015;211:1476–83.
44. Helb DA, Tetteh KKA, Felgner PL, Skinner J, Hubbard A, Arinaitwe E, et al. Novel serologic biomarkers provide accurate estimates of recent Plas-modium falciparum exposure for individuals and communities. Proc Natl Acad Sci USA. 2015;112:E4438–47.
Publisher’s NoteSpringer Nature remains neutral with regard to jurisdictional claims in pub-lished maps and institutional affiliations.