monopolar corona on bundle conductors
TRANSCRIPT
IEEE Transactions on Power Apparatus and Systems, Vol. PAS-101, No. 10 October 1982 4079
MONOPOLAR CORONA ON BUNDLE CONDUCTORS
M. Abdel-Salam,i Senior Member, IEEE M. Farghaly, Nonmember S. Abdel-Sattar, Nonmember
Electrical Department, Assiut UniversityAssiut , Egypt
Abstract - In this paper, the monopolar equation is the electric field given in ter-corond etilSIon is solved for bundle condue- mu of the potential.tor using a modified iterative procedure togive the corona current contributed by each Equation (1) can be replaced by a single
subonducorf th bunle.Someof te ~ third-order nonlinear partial differentialsubconductor of the bundle. Some of the main eqainunderlying assumptions are-waived in the pr- equation:sent calculations. The variation of ion mo- div (V 0 2 0 _ (2bility with its life time as well as thechange of corona onset voltage from point to Equation (2) is the general form for mo-point on each subgonductor ore taken into ac- nopolar corona equation and there is nocount for the first time. The calculated method known for solving it in the generalcorona currents from each subconduotor are case without simplifying assumptions.compared with those measured experimentally Deutsch (4] was the first to make an approx-for a laboratory model. imate analysis for the line-to-plane geome-
try. Following Deutsch were PopkovTsyrlin and Usynin [5] who made a solution
INTRODUCTION more accurate than Deutsch. In a recent ana-lysis by Sarma and Janischewskyj 121 the fol-
-HV dc has many advantages over the con- lowing assumptions were used:ventional ac for long transmission (11 . Re- (1) The electric field at the surface of thecent advances in the development of the NV hv conductor in corona remains cotantterminal equipment have increased the feasi- at its onset value.bility of dc transmission. Consequently ' (2) The mobility of ions is constant inde-various problems associated with it have pendent of their life time.b*en studied extensively. One of these prob- ()Tesaecag fet nytemgileas is the corona occuring on the tra s tude but not thetdirectsion o the elec-ssion lines and the power loss, radio inter- tric field.ference, television interference and audi -ble noise associated with it. Theoretical Sarma and Janischewskyj computed theanalysis of corona losses on do transmission point to point variation of the charge dens-lines is very useful for line design. ity in the field space between the hv con-
In this pp,ductor ( single or bundle ) and the groundforcalculating corona:lossinmppronopol2 plane with the aid of an iterative technique.for calculating corona loss 'in monopolar moon i trtvetcnqew11b icse
figurations are critically reviewed and the This iterative technique will be discussedunderlying assumptions are discussed. Then, late in thelho our teoretcl an-
an aprochs sugesed hichwaies ome lysis. Although the calculated results ag-a approach is suggested which waives some reed rea30onably with those measured experi-unreal assumptions and improves the accu- redeaoblwihtsem sudepr-ofeleumtosadipoethe alcccations- mentally for single - conductor lines , theracy o e e c a lon. method has never been checked for lines with
bundle conductors L 63MONOPOILAR COROUA EgUATION Very recently, Sunaga et al. [3) repor-
ted a new approach for calculating the ioni-The main system of equations describing zed field of hv dc transmission lines with
the monopolar corona discharge is: bundle conductors. They replaced the bun-V.E-?/E, V.J 0, \ edled conductor with an equivalent single3 o EE= 0V0J = E (EEs l) conductor having the same electrostatic ca-
The first is the Poisson's equation for the pacitance. Therefore , assumption (1) waselectric field; the second is the equation replaced with the following two supplemen.tfor current continuity ; the third is the tary assumptions:equation for current density; and the fourth (la) The amount of corona current emitted
from a bundled conductor is correlatedto the resultant conductor surfacefield by using simplifying relation-ships having empirical con3stants.
(lb) The ratio of the corona current denLsity82 WM 212-9 A paper recommended and approved by the bundled conliducoslnotri difierenforomhIEEE Transmission and Distribution Comsmittee of the b3de odco sntdfeetfoIEEE Power Engineering Society for presentation at the the equivalent singe conductor.IEEE PES 1982 Winter Meeting, New York, New York, The empirical conlstants in (la) are de-January 31-February 5, 1982. Manuscript submitted termined [3] from corona current measuremen-Janiuary 26, 1981; made available for printing December ts on the available test line. As is well16, 1981.
0018-9510/82/l000-4079$00.75 ©C 1982 IEEE
4080
known, the corona current measurements cha- 41nge from place to place and may vary from XtOtime to time [7 1 . This restricts the app-lication of the analysis by Sunaga -et al. to 2.4any general monopolar configuration.
In the following , the assumptions (1-3)pertaining to the monopolar corona equation 2.0(2) are briefly discussed to determiine whichone is realistic. Subsequently, some unrealassumptions are waived and an approach forsolving the corona equation- for lines with t-6bundle conductors is presented. The pre-sent calculations are compared with prev-ious calculations and are checked againstlaboratory experimental results.
UNDERLYING ASSUMPTIOIS0NS
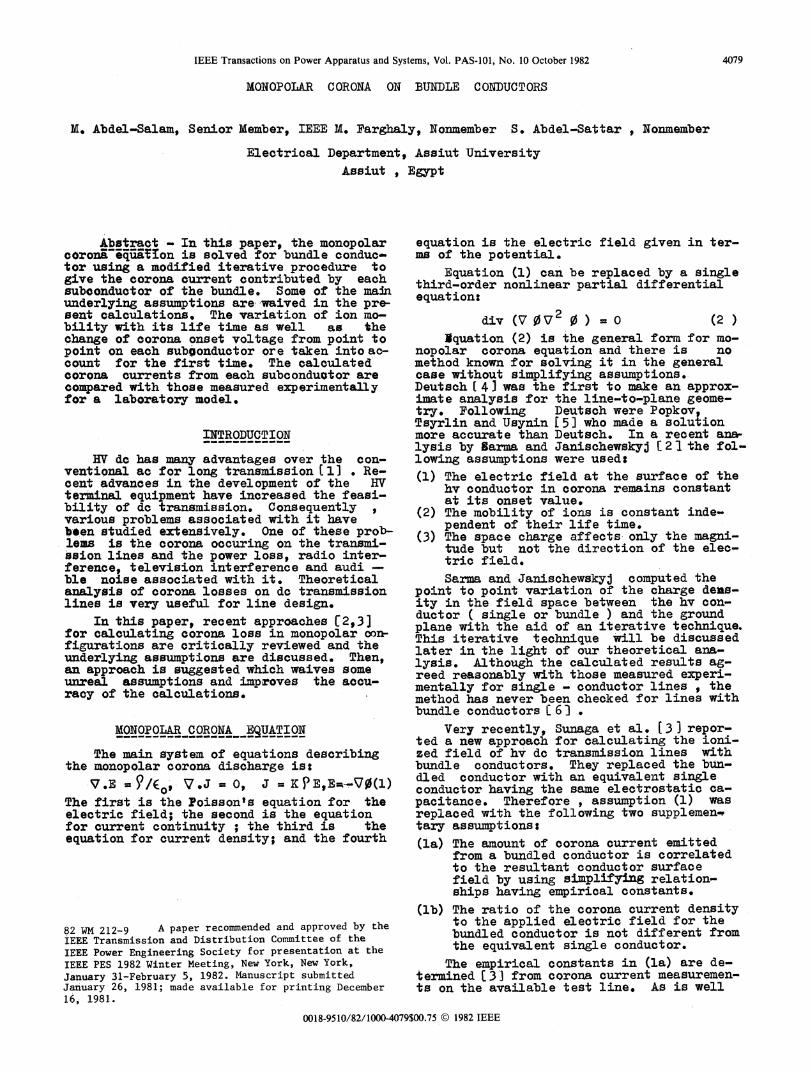
Assumption ( t2s When corona occurs on a hvconauc 7r, He electric field at its surfaceis decreased slightly ( 5-10%1 ) from theonset value by the ion space charge built uparround it. The decrease in field was mea-sured experimentllyl8l and also calculated( 9 3 * Therefore assumption (1) is notquite justified. This decrease in field 0.001 0.00.1Q 1.0 10affects the corona current value contributed Time t,tS)by this conductor. In some preliminary cal-culations , such effect was folnd to be no- Pig.l. Variation of ion m6bility withticeable only in the region of the onset and its life time.becomes negligible at high voltages. region is not very large [ 2]
On the other hand when corona occurs on In reality, the field due to space cha±-gea hv bundle conductor, the onset field is no at any point in the discharge space can belonger assigned a unique value as assumed decomposed into two components; one along.thepreviously by Sarma and Janischewskyj [ 6 1 flux line passing it and other in the normaland by Sunaga et al. 3 . The corona on- direction. The first component affects onlyset field is calculated based on the physi- the magnitude but not the direction of thecal processes involved in the corona dis- applied electric field as introduced well-incharge phenomena (10 3 . In the present worlk corona loss computation by, others [ 2, 31,9Whilethe corona onset field is considered to cha- the other component is neglected by them.nge from point to point over the subcon- This latter component has a lateral effect onductor surface. This means that the sub- the applied electric field making them angu-coniductor does not go as whole in corona at larly displaced from their trajectories "inone voltage value as considered previously the absence of space charge as stuidied pre-3,63 , in conformity with experimental viously C 15,16 J.studies by Simpson t 111- studies by Simpson II Ill Very recently , Janischewskyj.and Gela
Therefore6, all the present calculations (17 ) have succeeded in extending the finitetake into account that the surface field at elemenits technique to waive the analysi'seach point on the subconductors periphery is from this assumption in coaxial cylindricalconstant at its respective onset value. geometry.Assum2tion j21s Detailed investigations The object of the present paper is toFIZ - aI4zve been made to establish defi- report an iterative algorithm for calculatinnitely that the mobility of ions in not corona loss from bundled conductors with thisconstant in the corona field. Different em- assumption being retained in the calculation'spirical relations have been developedC12-14) The same authors are working now to use thein literature which correlates the mobility finite elements technique to waive these cal-value (K) to the life time of ions (t),Figl. culations from this assumption. They hope to
It is clear that the value of ion mobi- make the obtained results public in the verylity obtained by Popkov(12] fits on average near futurethe values obtained by Arai and Tsunoda( 131 PRESENT APPROACHand Ereshchagin and Litvinov [14] over allthe life time. Therefore , the values of According to assumption (2), the space-Popkov for the change of mobility with life charge-free field E1 at any point in the in-time has been considered in the present terelectrode regionl is related to the fieldcalculations. in presence of space charge iE by;Assumtion (3)_: This assumption was aimed E =A E1 (3 )
tfions fEe calculations possible. It iswee sasaa on ucino hperfectly valid in symmetrical configura' wee
tos(such as the concentric cylindricalspc Ordnais U to fthgeometry) . It will be sufficiently close saecodntsto reality in other confiEgurations where the E and E, may be defined in term of the cor-space charge density in the interelectrode responding space potential 0 and 01 in the
4081
form; But d_ = _ 1_ and dt ,R L = _E=. _V0 = - d0l/ds ( 4 ) d01 ds K E KBElE,= -V0 = - d01/ do . dP2P (7bElas V 01 = - do,/ d___ 3 2 -+ - --- ( 7b)
where; d1 E A E1 AK2 dts is the distance measured along the
flux line of the space-charge-free daerevfield. dt d) , an incremental value ofCombining equations (3) and (4) and simpli- th ion life ti
dsz K A B1 the ion velocity.
'do is an incremental distance alongd0/d01 (5) the flu line.
Substituting equation (3) into equation (1), Equations (5-7) describe the distribution of¶7 (~N AF ) l P/the electric field and the charge density inV *LIE o the interlectrode spacing providing that the
applied electric field is precalulated overAV. El + El-V A =fall the interelectrode spacing. The bounda-
ry conditions required to solve these equa-But V. B1 - 0 and :E1l.VA.. d,\/ ds tions are given in terms of the voltage app-
lied to the hv bundle conductor and the mag-d )\/ ds " P/( oEL nitude of the electric field at its surface.
If , representsthe value of the scalar pointChanging the independent variable to 01 ,one function (N) at the subconducter surface,itcan write; follows from assumptions 1) and (2) that
V /=V where VO() is the coronadA dAdO1 d?\ e ~~~0 (I,V)/ V where.dA, dA d01 3 e dA_onset at a point described by the angle /
ds dORZ dE dl over the periphery-of the subconductors. For-1 1 actual subconductor a reduction surface fac-Then; tor m is assumed for the corona onset vol-
dX ~ tage when compared with a hypotically smooth- -E - y/ OE subconductor. This factor depends on the
dML surface condition of the subconductor and0 2 isometimes reaches 0.4 on full-scale tranz-
dX/d01 -J/E0E1 ( 6) mission lines.From equation (l) and (3), The complete specification of the problem
for any particular flux line is , therefore,3 = K? > B1 given in texms of the differential equations
V.V.J = 0 (5-7) with the following boundary conditions;7.( K?AE =0 (i)0 =V at 0 =V Jat subcorK9A V,El + E1.V(KPY) =(ii ) ' =Ae v0(9/)/V at 01 V surface.
Substituting by V .El = , (iii) 0 = 0 at 01 = 0 at ground surface
El .7( K9X) = ... (8)
Accodin tohe ast quaion KSXis on- The boundary value problem defined by thestantralnontgany flux lienuetof tnhe Kspaie - c oset of differential equations (5-7), and thecharge - free field. The last equation can corresponding boundary conditions (8) is so-be rewritten in the form, lved numerically as described in the follo-
wing steps:d 1.. At a given point F on the subconductor per-
B1 -d-- ( K?/X) 0° ~ iphery*$ the electric field E, is calcu-lated using the charge simulation tech.-
d° ,pKdA \d.K nique [19) . The field line emanatingKA -f +,PK d-- 0 from this point is also traced to deter-
ds ds ds mine the distribution of the applied elec-tric field along it.
T2.he corona onset voltage V ( / ) is cal-K EB1 + P KE --- +9AEl---- 0 culated at the point P 10"). This defines
1dO1 dO1 dO1 the boundary conditions (i) and (ii) ofequation (8) at the applied voltage V.
Substituting by equation (6) , 3. Assume an arbitrary guessed initial valueof space charge Pe at the point P , Appen-
d? Xp d;K r w2 dx
d0 2 K :d01'7 4. Integrate the systeni of equations (5-8)01i. E0XB 1 along the already traced field line emana-ting from the point F, taking into accourt
Equation (7a) ca:n be rewritten in the folio- the variation of ion mobility with itswing form by substituting; - ___
dK dK dt ds i~~~~The choice of the ground as the starting_dK_=O1d dO point is improper as it may l ead to mathe-d dt da 1p matical difficulties £18)z.
4082
life time , Fig.l, (see Appendix II). tions of the measuring circuit to be free5. The resulting value of the potential 0 from corona.
at the end of the field line (i. e at theground surface )is compared with thezero value defined by the boundary con- corona current at the ground plate, the ear-dition (iii) of equation (8) . thed aluminium plate has been divided into
6a. When the boundary con.dition (iii) is not 30 segments each ( 5 cm x 4.5 m ) spaced lmmsatisfied in the above step, the assumed apart. To each segment, a sensitive micro-value of 9 is then adjusted and the pro- ammeter was connected to measure the currentcedure ( seeps 3 through 5 ) is repeated, received by it. Division of received currentAppendix I gives how 9 can be changed by the segment area defines the current den-with the aim to maintain the convergence sity at the segment position.of the solution. The avaliable hv source was up to 125 kv,
6b. When the boundary condition (iii) is sat- the ripple and harmonic contents of its out-isfied, the charge densityy and hence put were less than 1%. The output voltagethe current density J at the point P on was measured accurately using a resistive vl-the subconductor surface are calculated tage divider.providing that the electric field atthis point is predefined by condition £2marison with previous methods(213] :(ii) of equation(8). Saarm and Janischewskyj C 2 3 derived an
7. Repeat steps 1 through 6 for all the po- expression for the mean charge density alongints on the subconductor surface. This the flux line emanating from the corona wire.determines the current density distrib- For solving the corona equation(l), they sug-ution over the subconductor periphery at gested an iterative procedure to determinethe voltage value V. the charge density pe at the coronating
8. Integrate the resulting current density edistributions over the subconductors wire which keeps the mean charge densitysurface to determine the contributions along the fluic line the same as that deter-of each to the total corona current from mined by the prescribed expression. In thisthe bundle, iterative technique , no interst was devoted
9. Increment the value of the applied vol]- to satsfy the boundary condition of thetage V and repeat steps 2 through 8 to problem ; namely; boundary condition (iii )determine the subconductor corona curr- of equation (8) . Adjustment of the meanent for different applied voltages, charge density along the flux line does notentail a satisfaction of the boundary con-
dition (iii) of equation (8) i*e. is notRESULTS AND DISCUSSION enough to Ikeep the potential at the ground
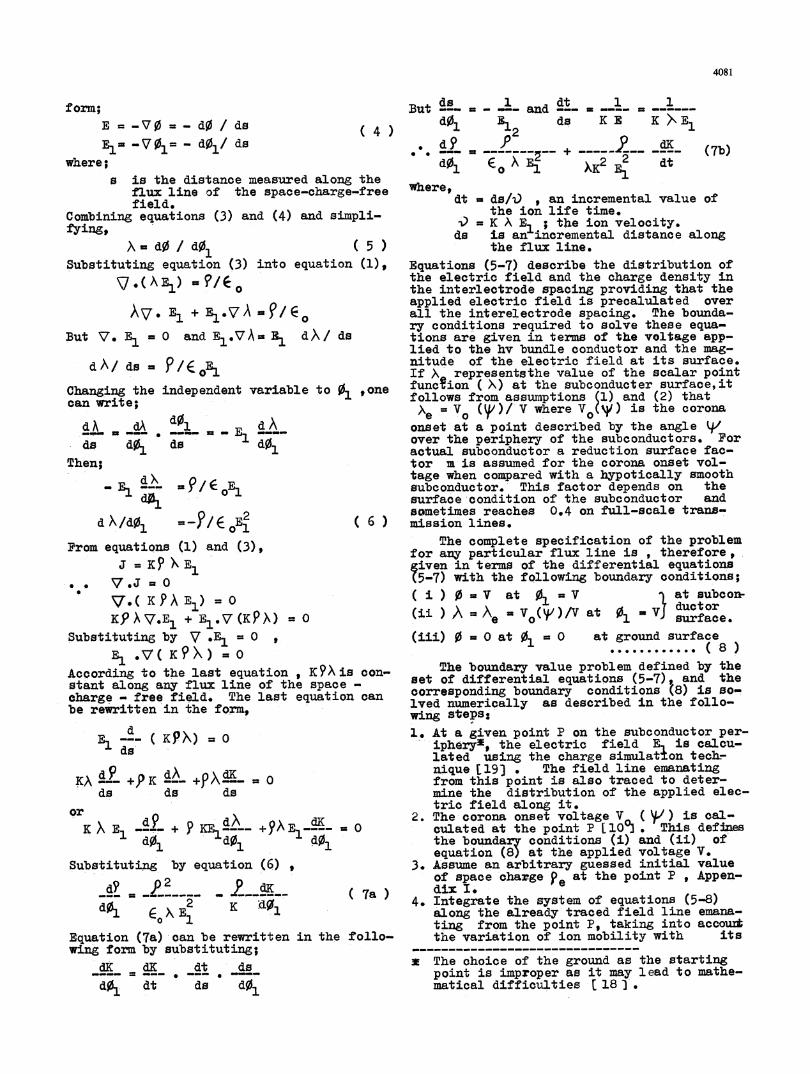
Test arrangements: plane at the zero vdlue.In this paper the present method of ana- the pigure 3 gives the percentage error of
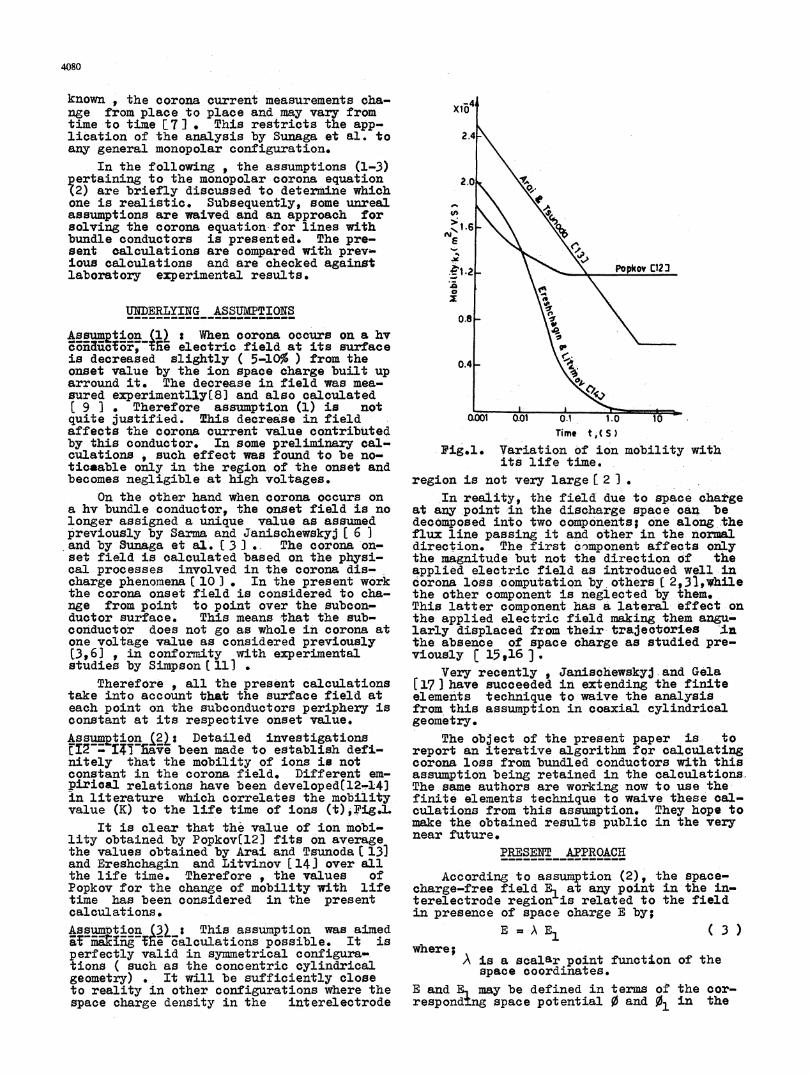
lysis is used to calculate the corona current renpotential at the ground plane for diffe-from each subconductor of a full-scale line rent flux lines emanating from thesubcondug-as well as of a laboratorxy model. The EPRI- tors of the EPRI-DOI test line, Fig. 2.DOE project UHV test line of bundle-4 diamond where the mean charge density is adjusted towhose dimensions are shown in Fig.2, is cho- wi n ± . %sen as an example for the full-scale line.
Using Romberg zintogrationlY.. Using trop@ziodat method
.- 0I 2rs 0.642m
Radius rc =00151m o /iH.13.5m I4 \ 1t t 0.64m+ive' I ~~~~~~0.64m
c 3 H 13.5m Rod iu s rc Qo. 5) mT X3i \sS/|' I
2Fig. 2. EPRI-DOE Project llXV test line.The laboratory model consisted of smooth
wires( 0.175 cm in radius and 4.*5 m in length)0
to simulate the subconductors of the bundle-4 I 5 75 ) 5 105 255 315diamond. The ground was simulated by an ear-
-
thed aluminium plate. The bundle height above Angle e,(the ground was changed by changing the rela- Fig.3. Percentage error of potential attivre position of the aluminiu plate with the ground plawne for differentrespect to the hv wires. Microainmeters were flu lines.used at the hv circuit to measure the coronacurrent from each subconductor. The hvr cir- Sarma and JanischewskyJ (2]considered incuit was so dimensioned that the corona is their analysis the onset voltage around theonly generated at the wires under test. To periphery of the subconductors constant atachieve this condition , both ends of each its lowest value , Fig.4. The calculatedwire were enclosed in a metallic spherical corona currents from bundle conductors havecaps to avoid corona discharge at these ends.*nev[e6rbeen compared with experimental resul-Precautions were also made for all connec- ts(6
4083
+Ive Ywhere; V and V are the maximum andomax omin
m , O 8{p.64m aminimum values of the onset vol-tage where the applied electrictH= 135m rs-c=ROISlm field reaches minimum and maxi-
mum values respectively.EM ---^ tisthe angle measured around the
pesent cmculatio periphery of each subconductor---cosine ting curm starting from the point having
the maxi'mum onset voltage.A_plication to Full-Scale line (EPRI-DOE
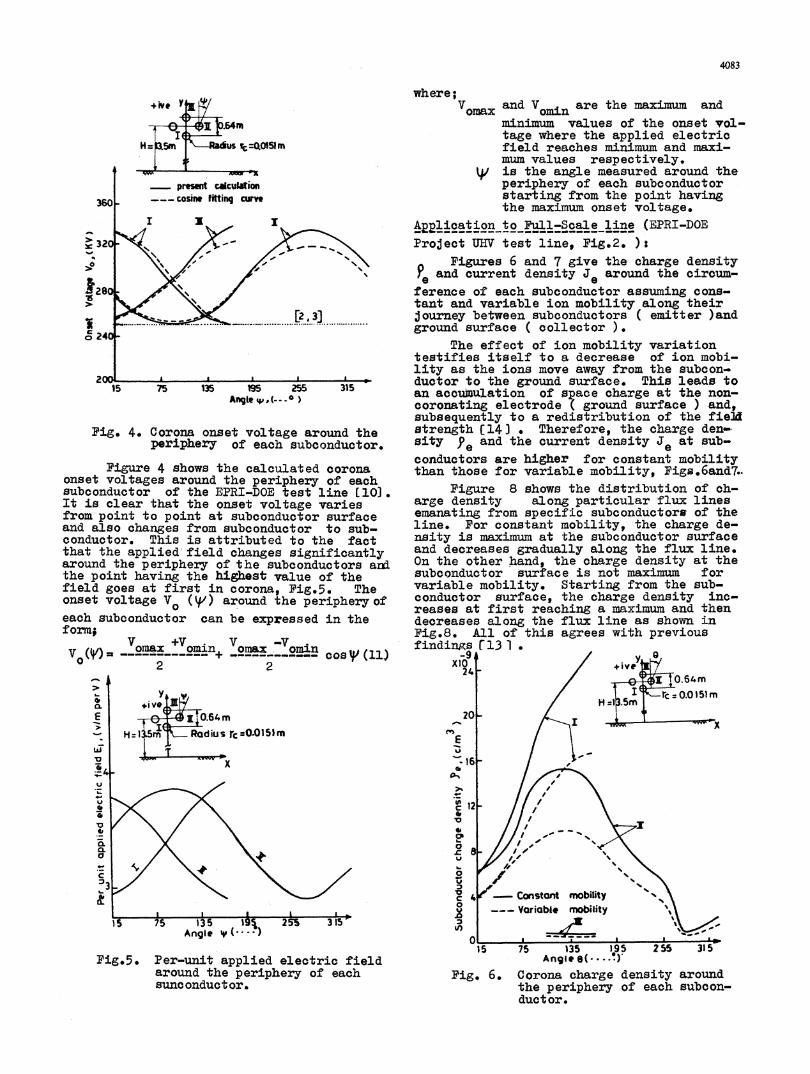
'320FS ,-- < Project UHV test line, Fig.2. ):Figures 6 and 7 give the charge densityP and current density J0 around the circum-
ference of each subconductor assuming cons-> \v4 \^ w tant and variable ion mobility along their
journey between subconductors ( emitter )andc ground surface ( collector ).
The effect of ion mobility variationtestifies itself to a decrease of ion mobi-lity as the ions move away from the subcon-ductor to the ground surface. This leads to
Ae5 75 135m 255 315an accunulation of space charge at the non-'n~te~ coronating electrode ( ground surface ) and,
subsequently to a redistribution of the fieldFig. 4. Corona onset voltage around the strength (143 . Therefore, the charge den-
periphery of each subconductor. sity Pe and the current density e at sub-conductors are higher for constant mobilityFigure 4 shows the calculated corona than those for variable mobility, Figs.6and7..
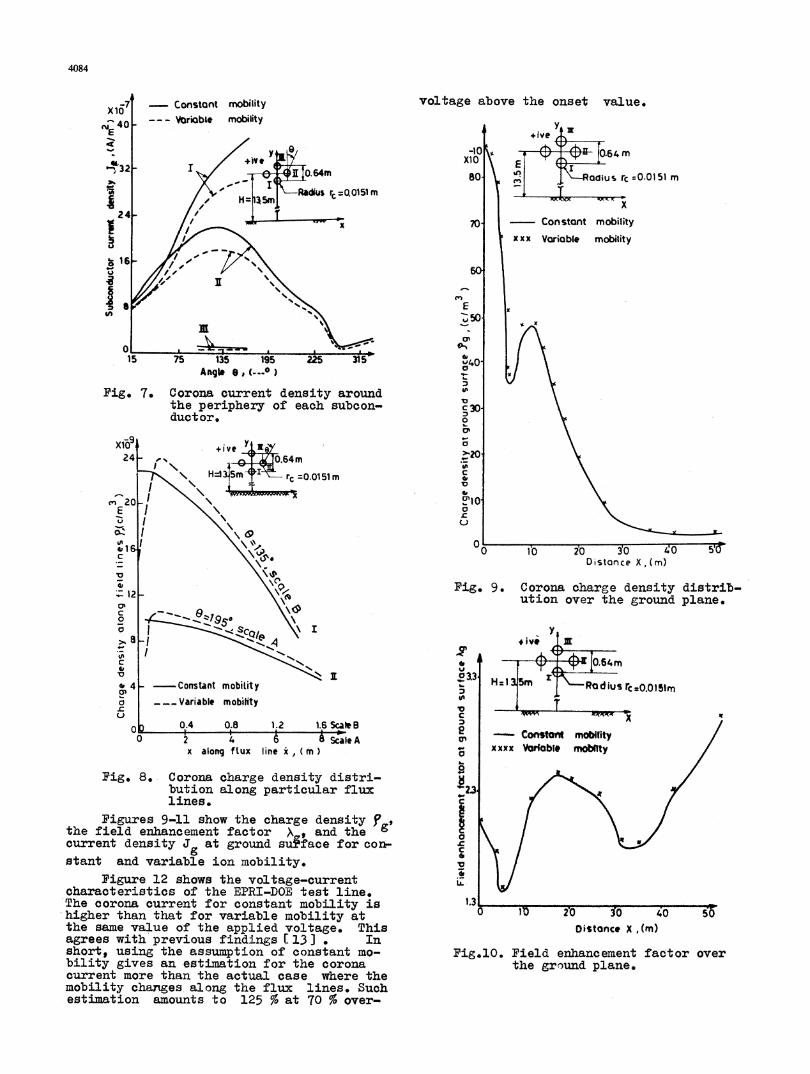
onset voltages around the periphery of eachsubconductor of the EPRI-DOE test line [10. Figure 8 shows the distribution of ch-It is clear that the onset voltage varies arge density along particular flux linesfrom point to point at subconductor surface emanating from specific subconductore of theand also changes from subconductor to sub- line. For constant mobility, the charge de-conductor. This is attributed to the fact nsity is maximum at the subconductor surfacethat the applied field changes significantly and decreases gradually along the flux line.around the periphery of the subconductors aui On the other hand, the charge density at thethe point having the highest value of the subconductor surface is not maximum forfield goes at first in corona, Fig.5. the variable mobility. Starting from the sub-onset voltage V (') around the periphery of conductor surface the charge density inc-
° reases at first reaching a maximum and theneach subconductor can be expressed in the decreases along the flux line as shown inform; Fig.8. All of this agrees with previous
Vomax.: omin Vomax Vomin findings r13 1 .
2 2 24x / ive
Y~~~~~~~~~~~~~~~Irc O.0 51mC* y H=1 .5m
E 7 64m xo I usTc IOW.Ol5lm=.os1>
H Radus Er00 4-I;t x
x a 6 -
.U~~~~~~~~~~~~~~~~~~~~~~~~~~~~~~~~~a
414
a~~~~~~~~~~~~~~~~~~~0
*z tConstont mnobility \
c ~~~~~~~~~~~~~~~0
__1 __ V-riobi mobility
Angle I('**) Ii _
Fig.5. Per-unit applied electric field Angleet( ..)aroud the periphery of each Fig. 6. Corona charge density aroundsuconduct or. -the periphery of each subcon-
ductor.
4084
X1-7 Constant mobility voltage above the onset value.4£ 40 - -- orsiabIe mobility40
y -~~~~~~~10 O.64Fm
80- fa~dius rc =0.0151M
z tRadius r QQ0151 m
// 70 - Constant mobilityxxx Variable mobility
Ez50
Jr~~~~~~~~~~~~~~~~~c0 O-N~~~~~~~~~~~~~~~~~~~~~0
15 75 135 195 225 315k Go |
15 ~~~~~~~~~~~~~~~~40 }Ang. *,(.O) og0 \
Fig. 7. Corona current density aroundthe periphery of each subcon- c30\ductor. o
xfo9 +ive Y N ay24 01%_J.64m
\k H±135m 1rc=.0151m to
-x~~~~~~~~~~~~~~~~GC'120 - I0ElU 1I\ \sU I
c1bs J \\ 's °1 10 20 3s0 40 5'0Distance X, (m)
_2- \<\oFig. 9. Corona charge density distrib-ution over the ground plane.
c 4'Ic,a3
Go 4 --Cornstant mobility H:l 5m adius rc O.0151mCDai ../---Variable mobiety
0.4 0.8 1.2 1.6 ScaleB /0 4 Scale A -Const tnobility
x along flux line x, (in) xxxx Variable mobftty0
Fig. 8. Corona charge density distri-bution along particular flux _23.lines.
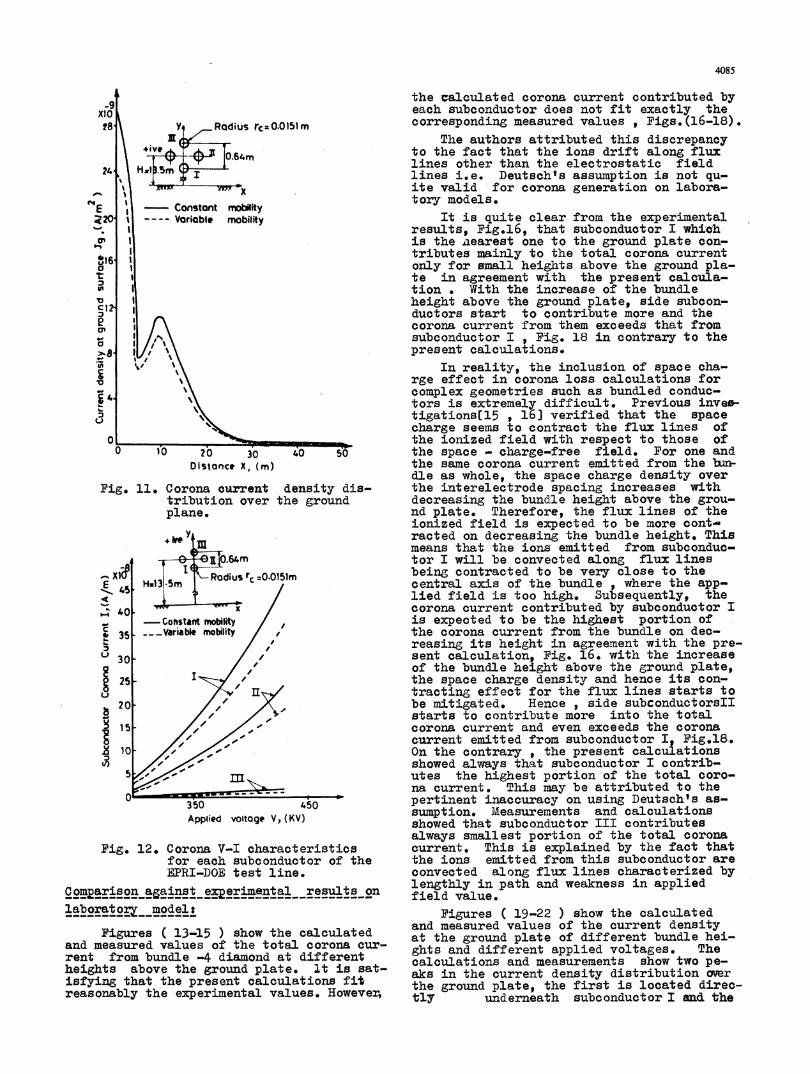
Figures 9-11 show the charge density p5 Ithe field enhancement factor X , and the \current density Jg at ground sugface for con- cstant and variable ion mobility.
Figure 12 shows the voltage-currentcharacteristics of the EPRI-DOE test line.The corona current for constant mobility is t.3 U ~.-________________higher than that for vrariable mobility at 0 O ~2~0 §0 40 5Othe same value of the applied v.oltage. This DiStonce x ,(m)agrees with prevrious findings 13 ] . Inshort, using the assumption of conastant mo- Fig.l0. Field enhancement factor overbility gives an estimation for the coronla the grrund plane.current more than the actual case where themobility changes along the flux lines. Suchest:imation amounts to 125 % at 70 % over-
4085
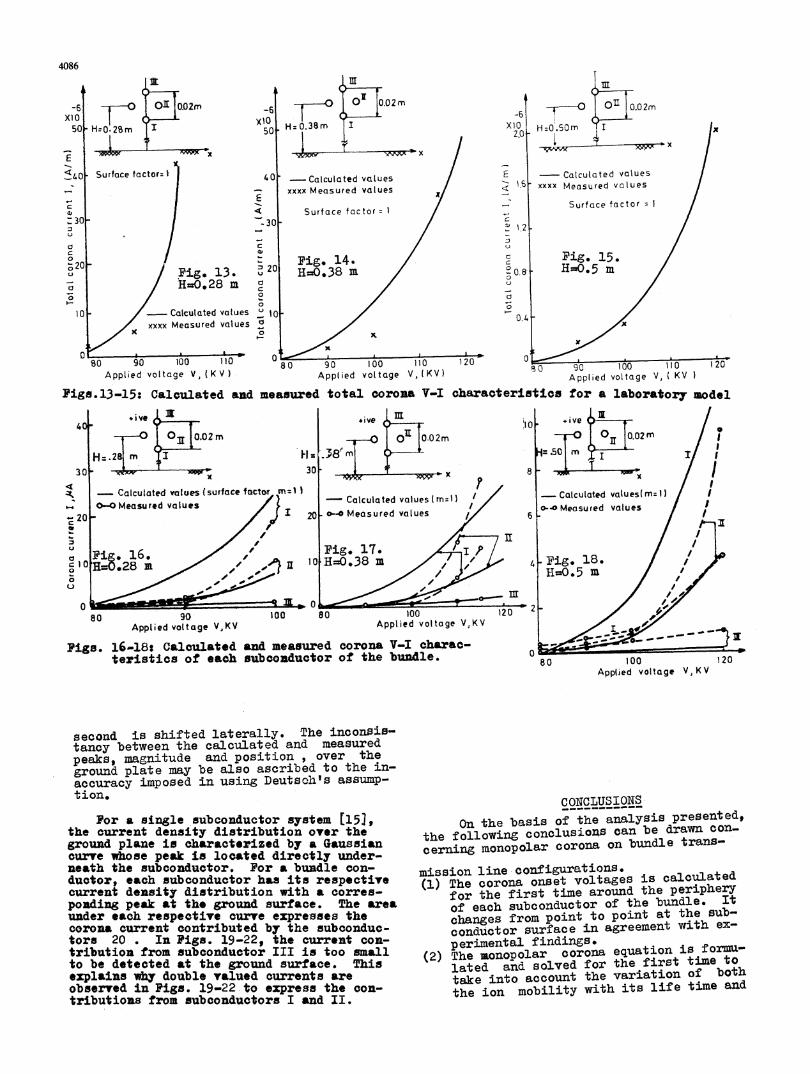
the calculated corona current contributed byx19 each subconductor does not fit exactly the8 Yt Radius rc=O.0151m corresponding measured values , Figs.(16-18).\. The authors attributed this discrepancy
\ m + +0.64M tto the fact that the ions drift along flux24 HZI Sm lines other than the electrostatic field' \ < . $ I lines i.e. Deutschts assumption is not qu-
x \1 - x ite valid for corona generation on labora-NE Constantm
tory models.
c2O -- -- Variable mobility It is quite clear from the experimental11 results, Fig.16, that subconductor I which
is the aearest one to the ground plate con--6 ltributes mainly to the total corona current
gx6 | only for small heights above the ground pla-t | te in agreement with the present calcula-
tion . With the increase of the bundleheight above the ground plate, side subcon-ductors start to contribute more and the
e' ; /\corona current from them exceeds that fromsubconductor I, Fig. 18 in contrary to the
'ItJ 8\ present calcuations,'t ' 8 ,,\In reality, the inclusion of space cha-
%\\ rge effect in corona loss calculations forcomplex geometries such as bundled conduc-tors is extremely difficult. Previous inves-tigationsrl5 , 163 verified that the spacecharge seems to contract the flux lines of
01 the ionized field with respect to those of0 10 20 3 40 50 the space - charge-free field. For one and
Distance X, (in) the same corona current emitted from the bun-dle as whole, the space charge density over
Fig. 11. Corona current density dis- the interelectrode spacing increases withtribution over the ground decreasing the bundle height above the grou-plane. nd plate. Therefore, the flux lines of the
ionized field is expected to be more cont-+k#Y m racted on decreasing the bundle height. This
sm means that the ions emitted from subconduc-[0.64m tor I will be convected along flux lines
X sRadius rc -0.0151m being contracted to be very close to theE H.13 5m d central axis of the bundlle , where the app-
415 Z >/lied field is too high. Subsequently, thet40 corona current contributed by suboonductor I
-Cohstant mobility is expected to be the highest portion of* 35 --Variable mobility / the corona current from the bundle on dec-
//' reasing its height in agreement with the pre-- 30 / o sent calculation, Fig. 16. with the increase
Q /,' of the bundle height above the ground plate,b25 I / the space charge densitv and hence its con-
u, Il>/ tracting effect for the flux lines starts to
20 /, be mitigated. Hence , side subconductorsII§ / -/ ,> starts to contribute more into the total
Xt5- ~// - corona current and even exceeds the corona--o /o- -current emitted from subconductor I Fig.18.
110 OOn the contrary ,the present calculations113 / -, showed always that subconductor I contrib-
5 - - m utes the highest portion of the total coro-na current. This may be attributed to the
3150 450 pertinent inaccuracy on using Deutsch's as-350(4V) sumption. Measurements and calculationsApplied voltage Vs(KV) showed that subconduotor III contributes
always smallest portion of the total coronaFig. 12. Corona V-I characteristics current. This is explained by the fact that
for each subconductor of the the ions emitted from this subconductor areEPRI-DOE test line. convected along flux lines characterized by
lengthly in path and weakness in applied--- -~ ~ ~ ~ ~ ~ ~~~~ild value.
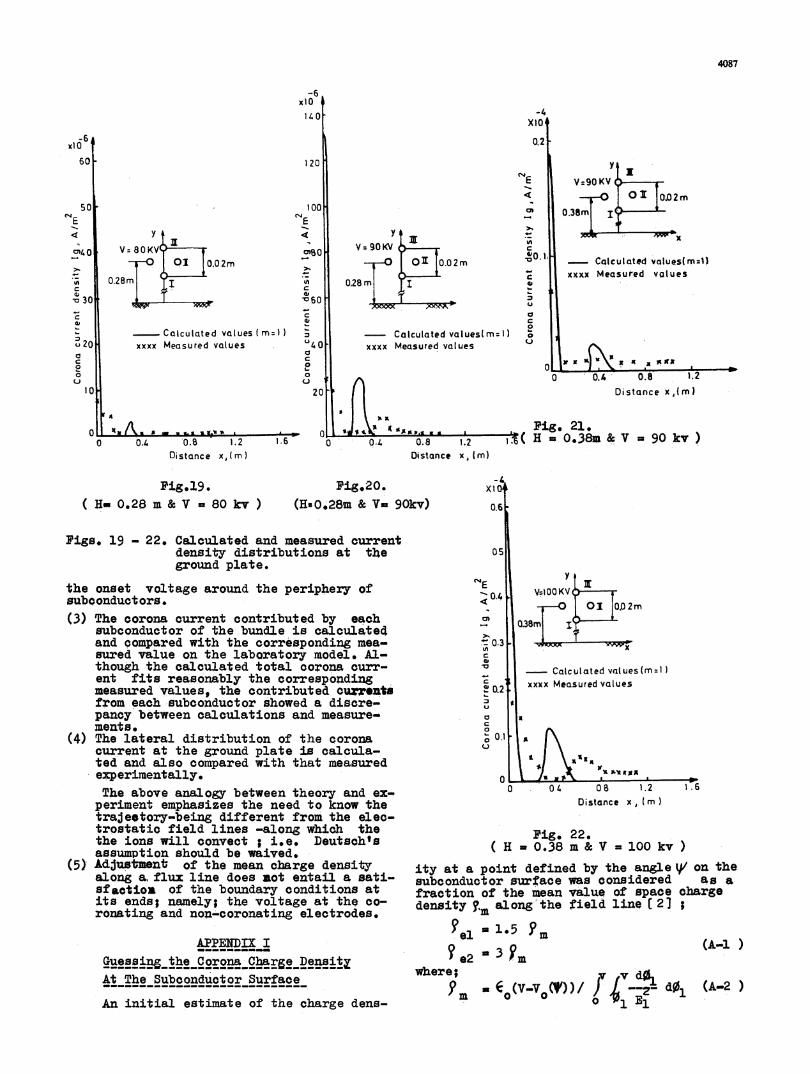
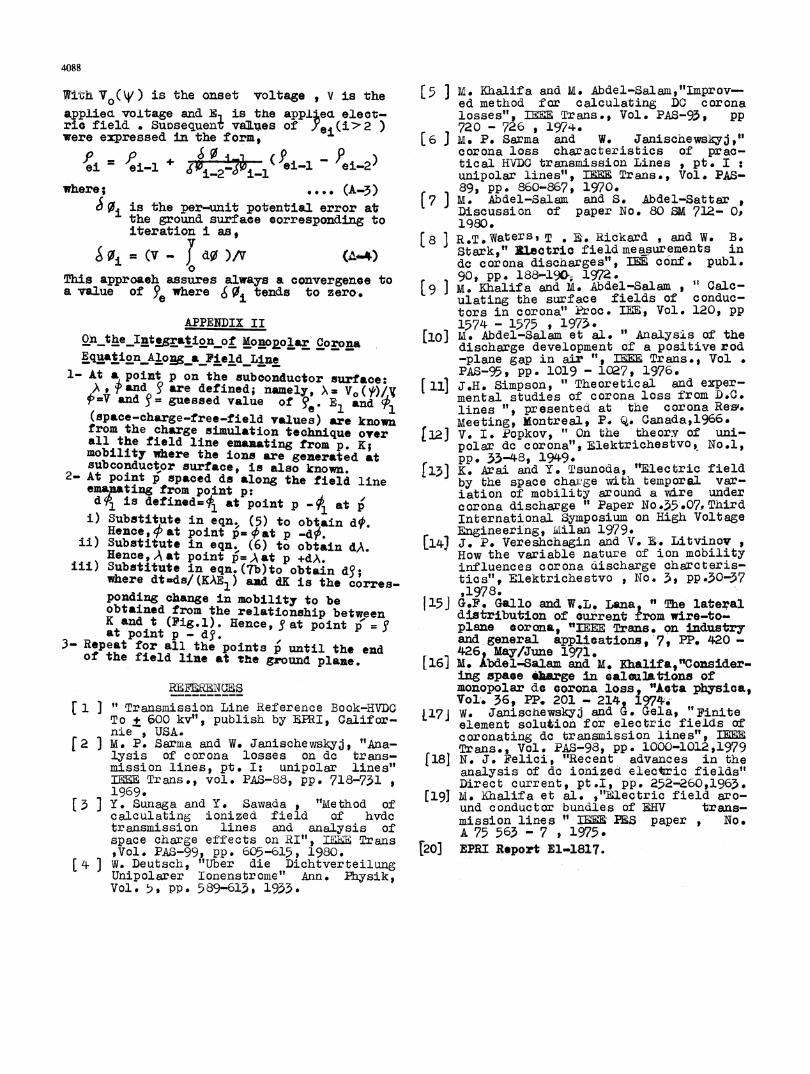
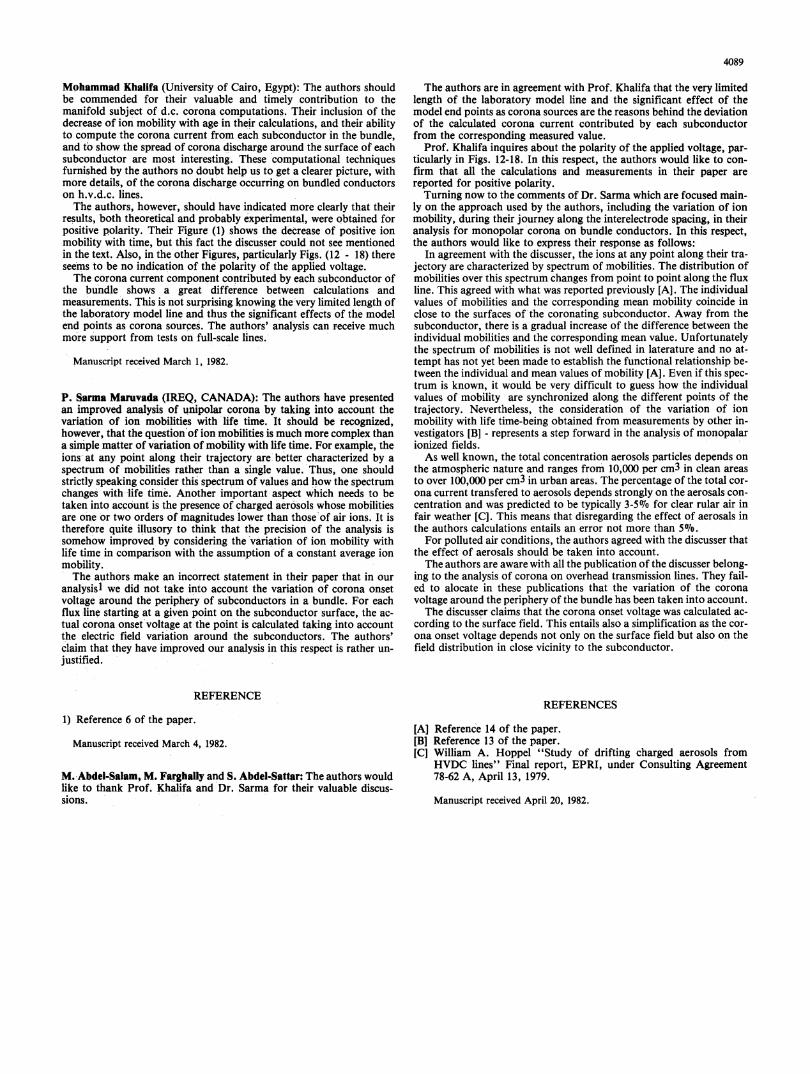
laboratory model: Figures C 19-22 ) show the calculatedC 1315)showthe alcuated and measured values of the culrrent density
Figures (1-5)soth acled at the ground plate of different bundle hei-and measured values of the tota:L coronaw cur- ghts and diffEerent applied voltages. Therent from bundle -4 diamond at different calculations and measurements show two pe-heights above the ground plate. 3"t is sat- aks in the current density distributionl overisfying that the present calculations fit the grouznd plate, the first is located direc-reasonably the experimental values. However, tly underneath subconductor I and the
4086
-6 r OD2m)6 0 0.0m 002mT 0 XIO H=0.38m I Xi0 H=O.SOm50 H=0.2'8m I0
x| o r -x / I I x
0t Surfacetactor=\~ 140 -Calculated values -xxxx
Calculated values
I|E xxMaudvleX<6xxxxMeasured values e
I |- | rX Surface factor Surface factorO ' / - 1,2 /
a ~~~~~~~~~~~~~~~~~~~~C:c / -/'°20 Fig. 13. '20 Fig. 14. Fig. 15.
o 20 21=.3 It-.. H1=0.5 ma 110.28niFi*1 H=.3_ / E~~~=028 m /0a
10 - Calcutated vatues U 1Oxxxx Measured vatues 0/. -
. v x o . XK , v
0o 10 0 -0
80Bl 90 100 110 80 90 100 110 120 0 100 120Applied voltage V, (KV) Applied voltage V,(KV) Applied voltage V,
oKV 1
Pigs.13-15: Calculated and measured total corona V-I characteristics for a laboratory modelvIt I mD*cye *ive 1 +ive
°7_0 0L40.02m 0.02m 7 z'002rH=.28 m ; 1 J8 m p=50 m I
30 30d y 8
Calculated v-atues (surface factor T-1)Itacltdvle(=1_0-0 Measured values JZ | -Calculated values lm-l1 / -Calculated valueslm:1/
20 0 4 Measured values / 6 --oMeasured values
Fig. 17. /FI /16, I HT / E I 1 /10 H=038 m 4F// 1=O5 in
0 0 2 -
80 90 100 80 100 120 2Applied voltage V,KV Applied voltage V,KV - 1
Pigs. 16-18s Calculated and measured corona V-I charac- = Zteristics of each subcomductor of the bundle. 0
80 100 120Applied voltage V, KV
second is shifted laterally. The inconOiS-tancy between the calculated and measuredpeaks, magnitude and position , over theground plate may be also ascribed to the in-accuracy imposed in using Deutsoh's assump-tion. CONCLUSIONS
For a single subconductor system [153, On the basis of the analySis presented,the current density distribution over the the following conclusio0s can be drawn cOn-ground plane in characterized by a Gaussian cerning monopolar corona on bundle trans-curve whose peak is located directly under-neath the subconductor. For a bundle con- mission line conigurations.ductor, each subconductor has its respective (1) The corona onset voltages is calculatedcurrent density distribution with a corres- for the first time around the peripherypoading peak at the ground surface. The area of each subconductOr of the bundle. Itunader each respective cure expresses the changes from point to point at the sub-corona current contributed by the subconduc- conductor surface in agreement with ex-tors 20 . In Pigs. 19-22, the current con- per*mental findings.tribution from subconductor III is too small (2) The xaonopolar corona equation is foru-to be detected at the ground surface. This lated and solved for the first time toexplains wh double valued currents are takle inlto a"ccount the variation of botobserved in Pigs. 19-22 to express the con- the ion mobility wit:h its life timne andtributioms from subconductors I and II.
4087
-6x1o140 -4
-id6 0.2-60 1 20 y
E V:9O KV
50 100 xx 0.38m v
o Q ^ {).40.8).2~~14.38
E ~~~~~~~~~~~~~~~~~~~E
o y xlE ,s, .., otsli t*,,, , ,Fg 1
04 0.8 V:OKV "O V z 90 KV
Figul9. }?ig*20. xlO i~~~~~~~~60.
( 01 0.02m 0!O& 0.02m 0*8 Calculated values(m 90)xFxx Measured vQ1uessuooduto0.28m 0,02m
subconductor~~~~~~~~~,2mfth udei ¢luaeP08m
a30 .,60
40~~~~~~~~~~~- cClculated values(m=l C- Calculated values(m I) a
20 xxxx Measured values 40 xxxx Measured values
o 0 0 2a ~~ ~~~~ ~~~~ ~~~~~~~~~~~~~~~~~~0o0..812
1(0 20 Distance xtm)
0 0 6 igs 21.0 0.4 0O.8 1.2 1.6 0 .4 08 12H 0.38m & V =90 kV
Xhe aboureanalogg between hoU and 0.8 04 08.2 .
Distance xthm) Distance xt (mx)
Fig.19. Pig.20. XIOttHm0o28mm&V 80kv) (Hs..028m & V=99kv) 0.6
Figs. 19 - 22. Caloulated and measured currentdensity distributions at the 05ground plate.
C4 ~~~~ythe onset voltage around the periphery of E V:100KV ¢suboonduotors. 040,.2(3) The oorona current contributed by each 0ssubconductor of the bundle is calculatecl38
and compared with the corresponding mea- 0O.3iUAsured value on the laboratory model. Al- C
though the Calculated total co:rona curr- - C a v usJment fits reaso'nably the correspoziding C xx esrdvlemeasured values, the contributed ci uts ~ 0.2-from each subconductor showed a discre-pancy between calculations and measure- °mentas 0
(4) Th'e lateral distribution of the corozna 0. St
current at the ground plate is calcula- Ated and also compared with that measuredexperimentally.The above analogy between theor-y and ex- 0 0 4 0a 1.2 1.6
periment emphasizes the need to know theDitne Imtrajeotory-being different from' the elec-trostatic field lines -along which the Fig., 22.the ions will convect ; i.e. Deutsoh'as .8m&V=10kassumption should be waived.
(5), AdJust-mnt of the mean charge density ity at a point defined by the angle Y/ on thealong a, flux line does not entail a sati- subconductor surfac'e was considered as a
4088
with V ( /) is the onset voltage , V is the [5 ] Me KtLalifa and M. Abdel-Salami,"Improv-° ed method for calculating DC coronaappliea, voltage and E is the appl4eo. elect- losses",, I1 Trans., Vol. PAS-93, ppric field, . SuosequenxT values of Yei(i>2 ) 720 -726 1974.were expressed in the form, 16 j M. P. Sarma and W. Janischewskyj,"p O 0 ,p p acorona loss characteristics of prac-
ei ei-l1 zW -Ji ( ei-1 ei-2) tical HVDC transmission Lines pt. Iunipolar lines", IK Trans., Vol. PAS-where; ...* (A-3) 89, pp. 860-867, 1970.
[7 3 M. Abdel-Salam and S. Abdel-Sattari is the per-unit potential error at Discussion of paper No. 80 SM 712- O,the ground surface corresponding to 1980iterationi i as [8 1 R.T.Waterss T
O E. Rickard , and W. B.=P- (V _- [ d0 )fV (^4)Stark,' 3lectric fieldmeasurements in
o20 dc corona discharges",t I conf. publ.
This approash assures always a convergence to [ 9pp. lfa 1972.a value of 5) where c~0j tends to zeroo* 9 I M bai n .AdlSJa ac
e ulating the surface fields of conduc-tors in corona" Proc. Tl, Vol. 120, ppAPPENDIX II 1574 - 1575 , 1973.5
On_the lntsgration_of MtonoELoar £1'oro [io M. Abdel-Salam et al.II
Analysis of the_ - - -- -- - 0. PLdischarge development of a positive rod
Equation AloWga Field Line -plane gap in air ", lEE Trans., Vol1- At poinlt p
sub¢onductor suMace PAS-95, pp. 1019 - 1027, 1976.on, tefinedsubnductor surfac [i11 J.H. Simpson, " Theoretical and exper-
)=V vand g a mental studies of corona loss from D.C.~= and guessed value of Fe. 1 and lines ", presented at the corona Reso.(space-charge-free-field values) are known Meeting, Mlontreal, P. Q. Canada,1966.from the charge simulation technique over v. 1. Fopkov, ' On the theory of uni-all the field line emanting from p. K; polardI corona"vOlektrichestvor Nof1imobility where the ions are generated at pPo d5o48,o1949Nsubconductoor surface, is also known. 13] K. Arai and Y. Tsunoda, "Electric field2- At point p spaced ds along the field line by 'the space charge with temporal Var-emanating from point p:, iation of mobility around a wire underd0l is defined=l, at point p -01 at p corona discharge " Paper No.55.07, Thirdi) Substitute in eqn. (5) to obtain d4'. International Symposium on High Voltageii) e,Substitu pointa ps Qat p 4Engineering, Milan 1979.ii) Substitute in eqn. (6) to obtain dA. [14) J P. Vereshc;hagin ad V. K. Litvinov ,Hence,A at point $=A at p +dA. How the variable nature of ion mobility
iii) Substitute in eqn.(7b)to obtain d3; influences corona discharge charcteris-where dtmds/ (KAE1) and dK is the corres- tics", Elektrichestvo , No. 5, pp.30-57,1978#ponding change in mobility to be 115J G.F. Gallo and W.L. Lana " The lateralobtained from the relationship between distribution of ourrent from wire-to-Kand t (Fig.l). Hence, Sat point p = y plane corona, "IEEE rans. on industryat point p - dy. and gnral applications, 7, PP. 420-
3- Repeat for all the points p until the end 426 May/June 1971.of the field line at the ground plane. [161 M. Ibdel-Salam and M. Khalifa,"Consider-ing spaee 4Mrge in oalcalatitons of
RSLFLRE iNGM,S monopolar do corona loss, "Aita physica,[1~ ~ 3" ransissin ne Rferece ook-YD 17Vol. 36, PP. 201 - 214 1974.1 T ±Transmkissi,on Line Reference Book-HorDC w Janischewskyj_ and (. Gela, "FiniteTo + U00 kvA, publish by SAI. Califor- element solution for electric fields ofM:Pe USA coronating dc transmission lines"', IEE[2 M Ta P. SarmaandW Janischewsk,j Vol. PAS-98, pp. 1000-1012,1979lysis of corona losses on dc trans- f181 N.- J. Felici, "Recent advances in themission lines, pt. I: unipolar lines" analysis of dc ionized electric fields"tIEE Trans., vol. PAS-88, pp. 718-731, Direct current, pt.I, pp. 252-260,1963.1969. [19] M. Khalifa et al#. ,"lectric field aro-[53 Y. Sunaga and Y. Sawada, "Method of und conductor bundles of KHV trans-calculating ionized field of hvdc mission lines " PES paper, No.transmission lines and analysis of A 75 65 - 7
space charge effects on RI", LET Trans ' ',Vol. PAS-99, pp. 605-615,t 1980. [203 EPRI Repor E1-1817.[4 3 W. Deutsch, "Uber die DichtverteilungUnipolarer lonenstrome" Ann. Physik,Vol. 5. pp. 589-615, 1955.
4089
Mohammad Khalifa (University of Cairo, Egypt): The authors should The authors are in agreement with Prof. Khalifa that the very limitedbe commended for their valuable and timely contribution to the length of the laboratory model line and the significant effect of themanifold subject of d.c. corona computations. Their inclusion of the model end points as corona sources are the reasons behind the deviationdecrease of ion mobility with age in their calculations, and their ability of the calculated corona current contributed by each subconductorto compute the corona current from each subconductor in the bundle, from the corresponding measured value.and to show the spread of corona discharge around the surface of each Prof. Khalifa inquires about the polarity of the applied voltage, par-subconductor are most interesting. These computational techniques ticularly in Figs. 12-18. In this respect, the authors would like to con-furnished by the authors no doubt help us to get a clearer picture, with firm that all the calculations and measurements in their paper aremore details, of the corona discharge occurring on bundled conductors reported for positive polarity.on h.v.d.c. lines. Turning now to the comments of Dr. Sarma which are focused main-The authors, however, should have indicated more clearly that their ly on the approach used by the authors, including the variation of ion
results, both theoretical and probably experimental, were obtained for mobility, during their journey along the interelectrode spacing, in theirpositive polarity. Their Figure (1) shows the d'ecrease of positive ion analysis for monopolar corona on bundle conductors. In this respect,mobility with time, but this fact the discusser could not see mentioned the authors would like to express their response as follows:in the text. Also, in the other Figures, particularly Figs. (12 - 18) there In agreement with the discusser, the ions at any point along their tra-seems to be no indication of the polarity of the applied voltage. jectory are characterized by spectrum of mobilities. The distribution ofThe corona current component contributed by each subconductor of mobilities over this spectrum changes from point to point along the flux
the bu-ndle shows a great difference between calculations and line. This agreed with what was reported previously [A]. The individualmeasurements. This is not surprising knowing the'very limited length of values of mobilities and the corresponding mean mobility coincide inthe laboratory model line and thus the significant effects of the model close to the surfaces of the coronating subconductor. Away from theend points as corona sources. The authors' analysis can receive much subconductor, there is a gradual increase of the difference between themore support from tests on full-scale lines. individual mobilities and the corresponding mean value. Unfortunately
the spectrum of mobilities is not well defined in laterature and no at-Manuscript received March 1, 1982. tempt has not yet been made to establish the functional relationship be-
tween the individual and mean values of mobility [A]. Even if this spec-trum is known, it would be very difficult to guess how the individual
P. Sarma Maruvada (IREQ, CANADA): The authors have presented values of mobility are synchronized along the different points of thean improved analysis of unipolar corona by taking into account the trajectory. Nevertheless, the consideration of the variation of ionvariation of ion mobilities with life time. It should be recognized, mobility with life time-being obtained from measurements by other in-however, that the questionof ion mobilities is much more complex than vestigators [B] - represents a step forward in the analysis of monopalara simple matter of variation of mobility with life time. For example, the ionized fields.ions at any point along their trajectory are better characterized by a As well known, the total concentration aerosols particles depends onspectrum of mobilities rather than a single value.'Thus, one should the atmospheric nature and ranges from 10,000 per cm3 in clean areasstrictly speaking consider this spectrum of values and how the spectrum to over 100,000 per cm3 in urban areas. The percentage of the total cor-changes with life time. Another important aspect which needs to be ona current transfered to aerosols depends strongly on the aerosals con-taken into account is the presence of charged aerosols whose mobilities centration and was predicted to be typically 3-50o for clear rular air inare one or two orders of magnitudes lower than those of air ions. It is fair weather [C]. This means that disregarding the effect of aerosals intherefore quite illusory to think that the precision of the analysis is the authors calculations entails an error not more than 5%.somehow improved by considering the 'variation of ion mobility with For polluted air conditions, the authors agreed with the discusser thatlife time in comparison with the assumption of a constant average ion the effect of aerosals should be taken into account.mobility. The authors are aware with all the publication of the discusser belong-The authors make an incorrect statement in their paper that in our ing to the analysis of corona on overhead transmission lines. They fail-
analysisl we did not take into account the variation of corona onset ed to alocate in these publications that the variation of the coronavoltage around the periphery of subconductors in a bundle. For each voltage around the periphery of the bundle has been taken into account.flux -line starting at a given point on the subconductor surface, the ac- The discusser claims that the corona onset voltage was calculated ac-tual corona onset voltage at the point is calculated taking into account cording to the surface field. This entails also a simplification as the cor-the electric field variation around the subconductors. The authors' ona onset voltage depends not only on the surface field but also on theclaim that they have improved our analysis in this respect is rather un- field distribution in close vicinity to the subconductor.justified.
REFERENCEREFERENCES
1) Reference 6 of the paper.[A] Reference 14 of the paper.
Manuscript received March 4, 1982. [B] Reference 13 of the paper.[C] William A. Hoppel "Study of drifting charged aerosols from
HVDC lines" Final report, EPRI, under Consulting AgreementM. Abdel-Salam, M. Farghally and S. Abdel-Sattar: The authors would 78-62 A, April 13, 1979.like to thank Prof. Khalifa and Dr. Sarma for their valuable discus-sions. Manuscript received April 20, 1982.