monograph 39/2018 - madras school of economics
TRANSCRIPT

MSE Monographs
* Monograph 28/2014 Fiscal Instruments for Climate Friendly Industrial Development in Tamil Nadu D.K. Srivastava, K.R. Shanmugam, K.S. Kavi Kumar and Madhuri Saripalle
* Monograph 29/2014 Prevalence of Undernutrition and Evidence on Interventions: Challenges for India Brinda Viswanathan
* Monograph 30/2014 Counting The Poor: Measurement And Other Issues C. Rangarajan and S. Mahendra Dev
* Monograph 31/2015 Technology and Economy for National Development: Technology Leads to Nonlinear Growth Dr. A. P. J. Abdul Kalam, Former President of India
* Monograph 32/2015 India and the International Financial System Raghuram Rajan
* Monograph 33/2015 Fourteenth Finance Commission: Continuity, Change and Way Forward Y.V. Reddy
* Monograph 34/2015 Farm Production Diversity, Household Dietary Diversity and Women’s BMI: A Study of Rural Indian Farm Households Brinda Viswanathan
* Monograph 35/2016 Valuation of Coastal and Marine Ecosystem Services in India: Macro Assessment K. S. Kavi Kumar, Lavanya Ravikanth Anneboina, Ramachandra Bhatta, P. Naren, Megha Nath, Abhijit Sharan, Pranab Mukhopadhyay, Santadas Ghosh, Vanessa da Costa, Sulochana Pednekar
* Monograph 36/2017 Underlying Drivers of India’s Potential Growth C.Rangarajan and D.K. Srivastava
* Monograph 37/2018 India: The Need for Good Macro Policies Ashok K. Lahiri
* Monograph 38/2018 Finances of Tamil Nadu Government K R Shanmugam
MONOGRAPH 39/2018
GROWTH DYNAMICS OF TAMIL NADU ECONOMY
K R Shanmugam
MADRAS SCHOOL OF ECONOMICS Gandhi Mandapam Road
Chennai 600 025
India
March 2018

i
Growth Dynamics of Tamil Nadu Economy
K R Shanmugam
MADRAS SCHOOL OF ECONOMICS Gandhi Mandapam Road
Chennai 600 025
India
March 2018

ii
MONOGRAPH 39/2018
March 2018
Rs.200/-
MADRAS SCHOOL OF ECONOMICS Gandhi Mandapam Road
Chennai 600 025 India
Phone: 2230 0304/ 2230 0307/2235 2157
Fax : 2235 4847 /2235 2155
Email : [email protected]
Website: www.mse.ac.in
iii
Acknowledgement
I am thankful to the Tamil Nadu State Planning Commission for entrusting this study to the Madras School of Economics. I am also thankful to Dr. C. Rangarajan, Chairman of Madras School of Economics for allowing me to conduct this study at MSE.
I thank Tmt. Santa Sheela Nair IAS (Retd.), Vice Chairperson and Thiru M. Balaji, the former Member Secretary Tamil Nadu State Planning Commission for their valuable supports and suggestions. I also thank other officials of Tamil Nadu State Planning Commission, for their help in procuring the necessary data for this study,
I thank Dr. Sunil, Assistant Professor, Madras School of Economics for his research assistance. I also thank Ms. Jothi for her assistance in preparing the manuscript.
K R Shanmugam


1
INTRODUCTION Tamil Nadu is one of the most progressive states in the country. It ranks first in credit
deposit ratio, second in (largest) size of economy, third in industrial development and
competitiveness index (and manufacturing competitiveness index), and fourth in terms of
per capita income1 among the major Indian states. Tamil Nadu has also done well in
terms of human development indicators.2
Tamil Nadu is one of the industrialized states in the county. It ranks first in
number of factories and third in industrial output.3 While Tamil Nadu’s growth is driven
by services, industry is the second dominant sector, accounting for about 30 percent of
total GSDP of the state. It is a leading manufacturer in automobiles, textiles, hosiery,
pharma, leather, IT and ITES.
Tamil Nadu economy has been one of the fastest growing states in the country.
During 2005-06 to 2014-15, the real growth of Tamil Nadu economy was 9.2 percent per
annum as against the All-India average rate of growth of 7.7 percent. Its GSDP has come
mainly from services, which grow at about 10 percent per annum. Tamil Nadu has the
potential to record a double-digit growth. The Vision Tamil Nadu 2023 document sets 11
percent growth target for the Tamil Nadu economy. The Twelfth Plan also sets 11
percent growth target.
Tamil Nadu Government has also managed its finances in a fiscally prudent
manner. Its revenue deficit, fiscal deficit and debt are kept within the norms prescribed in
its FRBM act. Despite all these developments and achievements, the GSDP growth in
Tamil Nadu came down to 3.4 percent in 2012-13 (while the All India growth was 4.5
percent). At the same time, poor states like Madhya Pradesh, Bihar, and Jharkhand
registered almost double-digit growth.
There could be various reasons for slow pace of growth of Tamil Nadu economy
in recent years. Some of them include:
Increased share of the non agriculture sectors which are vulnerable to global
shock;
1 Next only to Maharashtra, Haryana and Gujarat. 2 It ranks second in low birth rate, third in terms of literacy rate and female literacy in 2011 and third in infant mortality
rate. It also ranks fourth in life expectancy at birth. 3 Industry comprises (i) mining and quarrying, (ii) manufacturing, (iii) construction and (iv) electricity, gas and water
supply.

2
Rapid urbanization and increasing proportion of urban poor that create pressure
on urban amenities like housing, water supply, sanitation, solid waste
management etc.;
Tamil Nadu is a power deficit state; and
Its agriculture growth depends on monsoon.
While evidences indicate a very low level of growth of Tamil Nadu during the
recession years in the past, the state had successfully emerged out of the recession years
and potential to register a double-digit growth in the medium term. However, the slow
pace of growth in the recession years led to uncertainty and raised doubt in meeting the
Twelfth Plan objective of “Accelerating, Innovative and Inclusive Growth”. Therefore,
there is a need to understand the growth dynamics of the state and identify the sectors
and regions causing the sudden fall in the overall growth rate during the recession years.
Specifically, it is essential to understand:
(i) Structure and composition of GSDP,
(ii) Spatial and economic concentrations,
(iii) The driving forces of per capita GSDP growth,
(iv) The short term constraints of growth and challenges facing the economy, and
(v) Opportunities available for the state to grow faster.
This information will be useful to the policy maker and other analyst to make
appropriate strategies to overcome the bottlenecks and make the state to register its
potential level of growth, and achieve its Twelfth Plan VISION of “Accelerated,
Innovative and Inclusive Growth”.
Objectives of the Study
The main aim of this study is to anlyze the growth dymanics of Tamil Nadu economy The
specif objectives of this study are follows:
To analyze the Tamil Nadu’s growth experience in terms of (a) sectoral growth,
(b) relative contribution of sectoral growth to overall growth, and (c) changes
in sectoral composition of GSDP;
To analyze the spatial aspects of growth in terms of (a) inter district growth;
(b) relative contribution of regional (districts) growth to overall growth; and (c)
regional share in total GSDP of the state;
To rank districts based on their economic performance;
To identify the factors determining the per capita income growth in Tamil
Nadu;

3
To analyze the convergence of per capita income growth among the Tamil
Nadu districts;
To study the challenges facing Tamil Nadu economy and find out possible
remedies; and
To analyze the opportunities available for Tamil Nadu to make high growth.
It is noted that this study mainly focuses on the sectoral and regional dimension of
growth of Tamil Nadu economy and not on all other aspects of growth. It therefore
excludes the in-depth the discussion on the role of fiscal policy, resource availability,
proper utilization of existing resources, role of human resources etc. in the growth
process or dynamics of the state.
Plan of the Report
Chapter 2 assesses the growth performance of Tamil Nadu economy in the long-term,
medium term and short term and compares the growth performance of Tamil Nadu state
with that of other major states in the country. Chapter 3 reviews the sectoral growth
pattern and contributions of various sectors to the overall GSDP growth and identifies the
sub sectors responsible for slow pace of growth of Tamil Nadu economy during the
recession years. Chapter 4 analyses the regional growth pattern and identifies the
regions with slow pace of growth, hindering the overall growth of the state. Chapter 5
deals with determinants of economic growth and convergence analysis and the final
Chapter 6 discusses about the challenges facing Tamil Nadu economy and the possible
remedies for achieving high growth.

4
Chapter 2
PERFORMANCE OF TAMIL NADU ECONOMY
Long-term Growth Performance
The long-term average (actual) growth of Tamil Nadu economy at constant prices was
6.69 percent during 1981-82 to 2014-15 as against the all India average growth of 6.28
percent (Charts 2.1 and 2.2).4While both Tamil Nadu economy (5.49 percent) and Indian
economy (5.58 percent) recorded almost the equivalent (average) rate from 1981-82 to
2003-04, Tamil Nadu economy started growing faster since 2004-05 and as a result, its
long-term average growth improved to 6.69 percent level. Its average annual rate of
growth during 2004-05 to 2014-15 (9.2 percent) was about 1.5 percentage points higher
that the all India growth of 7.72 percent.
While Tamil Nadu’s trend (potential) growth rate was higher than that of all
India up to 1995-96, both India’s and Tamil Nadu’s long term trend growths reached
6.05 percent level in 1996-97. Until 2002-03, India’s trend growth was higher than Tamil
Nadu’s trend growth, after that year Tamil Nadu’s trend rate was kept higher than all
India’s rate. Between 2005-06 and 2011-12, Tamil Nadu’s long-term average trend rate
ranged between 8.24 percent and 8.79 percent, which is about 1 percentage, point
higher than all India rate.
Chart 1: Trend and Actual Growth Rates of GSDP (real) in Tamil Nadu
4 Chart 1 shows the estimated (using HP Filter) trend and actual growth rates of GSDP of Tamil Nadu at constant prices
since eighties. Up to 2004-05, the 1999-00 (base series) prices and after that 2004-05 prices series are used. In Chart 2,
2004-05 prices series for all India GDP at factor cost is used until 2012-13 and then 2011-12 prices (new) series are
used.
10.5
-4.2
6.0
12.2
4.7
-0.6
6.4
8.06.9 7.3
3.0
5.3
8.6
12.6
3.5
4.9
8.2
4.7
6.1 5.8
-1.5
1.8
6.0
11.2
14.0
15.2
6.15.5
10.8
13.1
7.4
3.4
7.3
7.2
-10
-5
0
5
10
15
20
19
81
-82
19
82-8
3
19
83-8
4
19
84-8
5
19
85
-86
19
86
-87
19
87-8
8
19
88-8
9
19
89
-90
19
90
-91
19
91-9
2
19
92-9
3
19
93
-94
19
94
-95
19
95-9
6
19
96-9
7
19
97
-98
19
98
-99
19
99-0
0
20
00-0
1
20
01
-02
20
02
-03
20
03-0
4
20
04-0
5
20
05
-06
20
06
-07
20
07-0
8
20
08-0
9
20
09
-10
20
10
-11
20
11-1
2
20
12-1
3
20
13
-14
20
14
-15
5
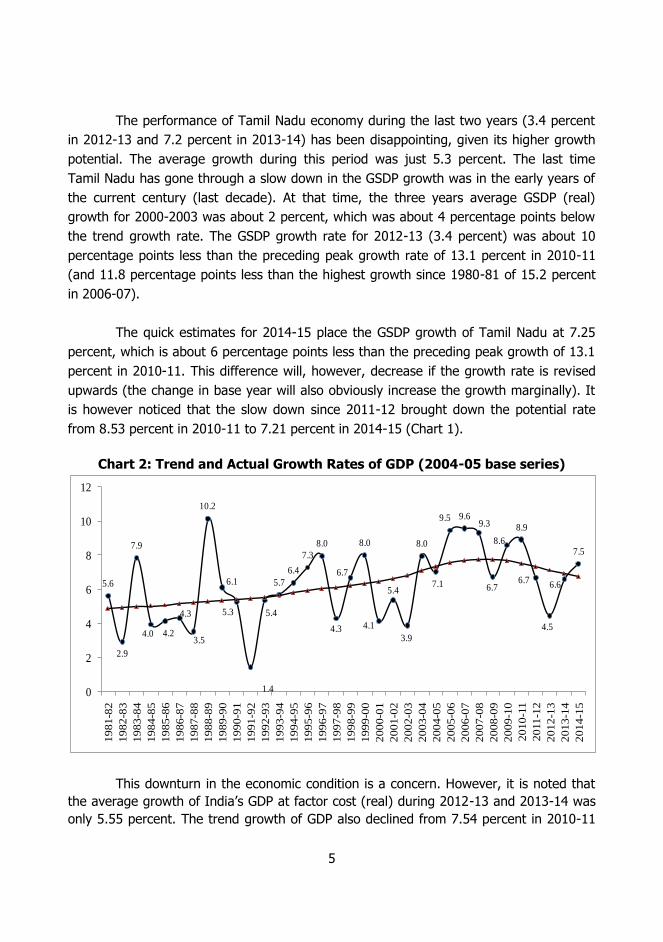
The performance of Tamil Nadu economy during the last two years (3.4 percent
in 2012-13 and 7.2 percent in 2013-14) has been disappointing, given its higher growth
potential. The average growth during this period was just 5.3 percent. The last time
Tamil Nadu has gone through a slow down in the GSDP growth was in the early years of
the current century (last decade). At that time, the three years average GSDP (real)
growth for 2000-2003 was about 2 percent, which was about 4 percentage points below
the trend growth rate. The GSDP growth rate for 2012-13 (3.4 percent) was about 10
percentage points less than the preceding peak growth rate of 13.1 percent in 2010-11
(and 11.8 percentage points less than the highest growth since 1980-81 of 15.2 percent
in 2006-07).
The quick estimates for 2014-15 place the GSDP growth of Tamil Nadu at 7.25
percent, which is about 6 percentage points less than the preceding peak growth of 13.1
percent in 2010-11. This difference will, however, decrease if the growth rate is revised
upwards (the change in base year will also obviously increase the growth marginally). It
is however noticed that the slow down since 2011-12 brought down the potential rate
from 8.53 percent in 2010-11 to 7.21 percent in 2014-15 (Chart 1).
Chart 2: Trend and Actual Growth Rates of GDP (2004-05 base series)
This downturn in the economic condition is a concern. However, it is noted that
the average growth of India’s GDP at factor cost (real) during 2012-13 and 2013-14 was
only 5.55 percent. The trend growth of GDP also declined from 7.54 percent in 2010-11
5.6
2.9
7.9
4.0 4.2
4.3
3.5
10.2
6.1
5.3
1.4
5.4
5.7
6.4
7.3
8.0
4.3
6.7
8.0
4.1
5.4
3.9
8.0
7.1
9.5 9.69.3
6.7
8.6
8.9
6.7
4.5
6.6
7.5
0
2
4
6
8
10
12
19
81-8
2
19
82-8
3
19
83-8
4
19
84-8
5
19
85-8
6
19
86-8
7
19
87-8
8
19
88-8
9
19
89-9
0
19
90-9
1
19
91-9
2
19
92-9
3
19
93-9
4
19
94-9
5
19
95-9
6
19
96-9
7
19
97-9
8
19
98-9
9
19
99-0
0
20
00-0
1
20
01-0
2
20
02-0
3
20
03-0
4
20
04-0
5
20
05-0
6
20
06-0
7
20
07-0
8
20
08-0
9
20
09-1
0
2010
-11
20
11
-12
20
12-1
3
20
13-1
4
20
14-1
5
6
to 6.78 percent in 2014-15 (Chart 2). Thus, the growth pattern of Tamil Nadu is more or
less, in general, consistent with all India growth pattern.
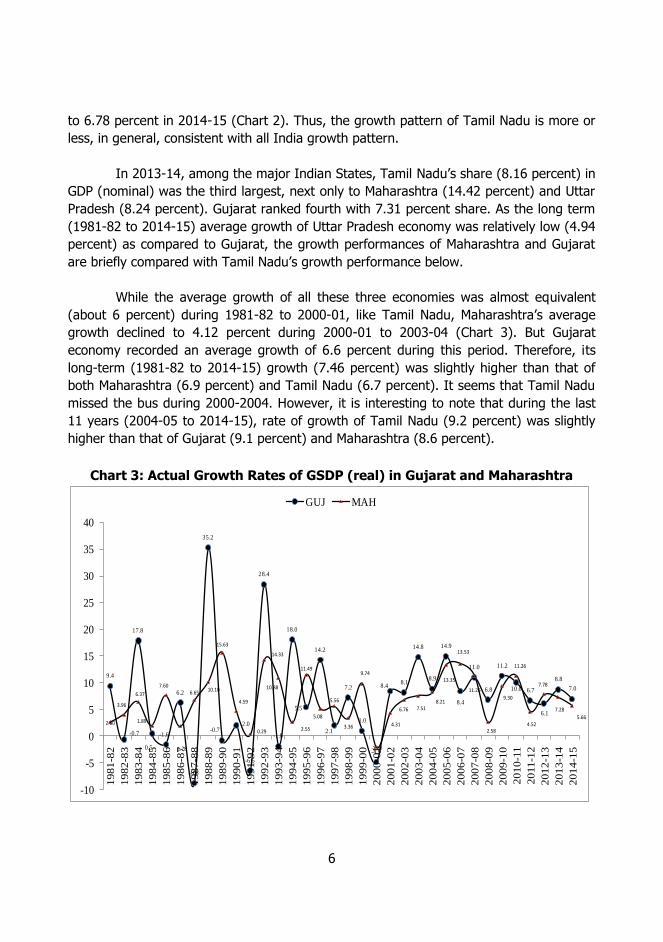
In 2013-14, among the major Indian States, Tamil Nadu’s share (8.16 percent) in
GDP (nominal) was the third largest, next only to Maharashtra (14.42 percent) and Uttar
Pradesh (8.24 percent). Gujarat ranked fourth with 7.31 percent share. As the long term
(1981-82 to 2014-15) average growth of Uttar Pradesh economy was relatively low (4.94
percent) as compared to Gujarat, the growth performances of Maharashtra and Gujarat
are briefly compared with Tamil Nadu’s growth performance below.
While the average growth of all these three economies was almost equivalent
(about 6 percent) during 1981-82 to 2000-01, like Tamil Nadu, Maharashtra’s average
growth declined to 4.12 percent during 2000-01 to 2003-04 (Chart 3). But Gujarat
economy recorded an average growth of 6.6 percent during this period. Therefore, its
long-term (1981-82 to 2014-15) growth (7.46 percent) was slightly higher than that of
both Maharashtra (6.9 percent) and Tamil Nadu (6.7 percent). It seems that Tamil Nadu
missed the bus during 2000-2004. However, it is interesting to note that during the last
11 years (2004-05 to 2014-15), rate of growth of Tamil Nadu (9.2 percent) was slightly
higher than that of Gujarat (9.1 percent) and Maharashtra (8.6 percent).
Chart 3: Actual Growth Rates of GSDP (real) in Gujarat and Maharashtra
9.4
-0.7
17.8
0.5
-1.6
6.2
-8.8
35.2
-0.72.0
-6.5
28.4
-1.8
18.0
5.5
14.2
2.1
7.2
1.0
-4.9
8.48.1
14.8
8.9
14.9
8.4
11.0
6.8
11.2
10.0 6.7
6.1
8.8
7.0
2.60
3.96
6.37
1.89
7.60
1.78
6.6510.10
15.63
4.59
0.29
14.33
10.88
2.55
11.49
5.08
5.56
3.36
9.74
-2.10
4.31
6.76 7.518.21
13.35
13.53
11.26
2.58
9.30
11.26
4.52
7.78
7.28
5.66
-10
-5
0
5
10
15
20
25
30
35
40
1981
-82
1982
-83
1983
-84
1984
-85
1985
-86
1986
-87
1987
-88
1988
-89
1989
-90
1990
-91
1991
-92
1992
-93
1993
-94
1994
-95
1995
-96
1996
-97
1997
-98
1998
-99
1999
-00
2000
-01
2001
-02
2002
-03
2003
-04
2004
-05
2005
-06
2006
-07
2007
-08
2008
-09
2009
-10
20
10-1
1
20
11-1
2
2012
-13
2013
-14
2014
-15
GUJ MAH

7
The trend growth pattern shown in Chart 4 reveals that Tamil Nadu’s rate was lower than
Gujarat’s rate, but higher than Maharashtra’ rate and all India rate till 1984-85. From
1985-86 onwards, Maharashtra’s trend growth went ahead of both Tamil Nadu and
Gujarat. But Gujarat had overcome Maharashtra from 1993-94 and since then it stayed
top among these three states. After 2006-07, Tamil Nadu’s trend growth went ahead of
Maharashtra’ s rate. However, it is noted that the trend growths of all these three
economies continuously have come down after reaching their respective peak rate in
2007-08. This down turn in the economy is the major concern.
Chart 4: Trend Growth of Tamil Nadu, Gujarat, and Maharashtra (based on HP
Filter)
Medium-term Growth Performance
Comparing the growth performance of Tamil Nadu (at 2004-05 prices) with all India
growth performance in the medium term, i.e., from 2005-06 to 2014-15, the following
features stand out: (i) in the initial two years, Tamil Nadu compared well with the all
India growth, (ii) during the recession (2007-08 and 2008-09), the state compared poorly
with all India performance, (iii) in 2009-10 and 2010-11, the revival in Tamil Nadu was
faster than that in all India, and (iv) when GDP growth declined to 4.5 percent in 2012-
13, Tamil Nadu’s growth rate also dipped to 3.4 percent (Chart 5). This cyclical trend
clearly shows that Tamil Nadu’s growth is highly volatile and more vulnerable to external
shocks as compared to the all India growth pattern due to increased globalization and
structural changes in the economy.
2
3
4
5
6
7
8
9
10
1981
-82
1982
-83
1983
-84
1984
-85
1985
-86
1986
-87
1987
-88
1988
-89
1989
-90
1990
-91
1991
-92
1992
-93
1993
-94
1994
-95
1995
-96
1996
-97
1997
-98
1998
-99
1999
-00
2000
-01
2001
-02
2002
-03
2003
-04
2004
-05
2005
-06
2006
-07
2007
-08
2008
-09
2009
-10
2010
-11
2011
-12
2012
-13
2013
-14
2014
-15
India
TN
GUJ
MAH
8
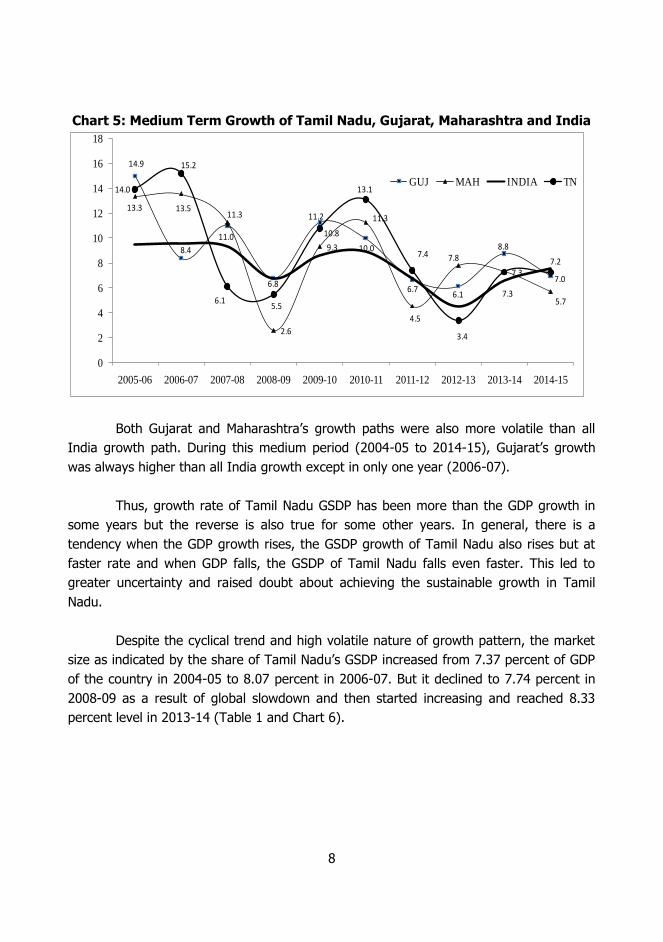
Chart 5: Medium Term Growth of Tamil Nadu, Gujarat, Maharashtra and India
Both Gujarat and Maharashtra’s growth paths were also more volatile than all
India growth path. During this medium period (2004-05 to 2014-15), Gujarat’s growth
was always higher than all India growth except in only one year (2006-07).
Thus, growth rate of Tamil Nadu GSDP has been more than the GDP growth in
some years but the reverse is also true for some other years. In general, there is a
tendency when the GDP growth rises, the GSDP growth of Tamil Nadu also rises but at
faster rate and when GDP falls, the GSDP of Tamil Nadu falls even faster. This led to
greater uncertainty and raised doubt about achieving the sustainable growth in Tamil
Nadu.
Despite the cyclical trend and high volatile nature of growth pattern, the market
size as indicated by the share of Tamil Nadu’s GSDP increased from 7.37 percent of GDP
of the country in 2004-05 to 8.07 percent in 2006-07. But it declined to 7.74 percent in
2008-09 as a result of global slowdown and then started increasing and reached 8.33
percent level in 2013-14 (Table 1 and Chart 6).
14.9
8.4
11.0
6.8
11.2
10.0
6.76.1
8.8
7.0
13.3 13.511.3
2.6
9.3
11.3
4.5
7.8
7.3
5.7
14.0
15.2
6.15.5
10.8
13.1
7.4
3.4
7.3
7.2
0
2
4
6
8
10
12
14
16
18
2005-06 2006-07 2007-08 2008-09 2009-10 2010-11 2011-12 2012-13 2013-14 2014-15
GUJ MAH INDIA TN

9
Table 1: Tamil Nadu’s Share of GSDP (at 2004-05 prices)
Years GSDP (Rs. Crore) GDPfc (Rs. Crore) TN Share (percent)
2004-05 219003 2971464 7.37
2005-06 249567 3253073 7.67
2006-07 287530 3564364 8.07
2007-08 305157 3896636 7.83
2008-09 321793 4158676 7.74
2009-10 356632 4516071 7.9
2010-11 403416 4918533 8.2
2011-12 433353 5247530 8.26
2012-13 451313 5482111 8.23
2013-14 478975 5748564 8.33
Source (Basic Data): CSO (website).
Chart 6: Tamil Nadu’s Share of GDPfc (2004-05 Prices) in Percent
This also clearly demonstrates higher volatility in the growth trend of the state
due to its larger linkage with the global economy. It also indicates the need for
significantly higher fiscal buffers for the Government of Tamil Nadu to undertake counter
cyclical policy measures necessary for stabilizing the economy during the years with
growth downturn.
During 2004-05 to 2013-14, the average growth of per capita income of Tamil
Nadu in 2004-05 prices was 8.41 percent and that of all India was 6.15 percent (Table
2). During this period, the per capita income of the state was always higher than that of

10
the nation. In 2013-14, the per capita income (in 2004-05 prices) of Tamil Nadu was Rs.
70162 while the per capita income of the country was Rs. 46623 (Chart 7).
Table 2: Growth of Per Capita Income (in 2004-05 Prices)
2004-05
2005-06
2006-07
2007-08
2008-09
2009-10
2010-11
2011-12
2012-13
2013-14
2014-15
Tamil Nadu 33998 38435 (13.05)
43941 (14.33)
46293 (5.35)
48473 (4.71)
53359 (10.1)
59967 (12.38)
63996 (6.72)
65771 (2.77)
70162 (6.67)
74833 (6.66)
India 27286 29413 (7.79)
31768 (8.01)
34241 (7.79)
36037 (5.25)
38599 (7.11)
41472 (7.44)
43657 (5.27)
45046 (3.18)
46623 (3.50)
Source (Basic Data): Government of India, Central Statistical Organization. Figures in parentheses are annual
growth rates.
Chart 7: Per Capita Income: Tamil Nadu and All India (2005-05 Prices)
Short-term Growth Performance
Tamil Nadu economy grew at an average rate of 5.34 percent in the short term, i.e.,
from 2012-13 to 2013-14 and it ranked 18th in terms of growth (Table 3). Tamil Nadu
faced a similar situation when its average growth declined to 5.79 percent during 2007-
08 to 2008-09 and its rank declined to 21st position. But Tamil Nadu economy has
successfully emerged out of these recession years and it has the potential to register a
double-digit average growth. It is noted from Chart 5 that the growth curve has already
turned up in 2013-14 and it is expected to move up further, unless there is a severe
negative global (and/or other) shock. As Tamil Nadu economy has frequently performed
poorly in short terms particularly when there has been global slow down, it is imperative
to find out the sectors and regions, which are the causes of concerns.

11
Table 3: Average Annual Growth of GSDP in Constant prices and Per Capita Income of Major Indian States
States
GSDP Growth ( percent)
Per Capita
Income
1981-82 to
2012-
13
R A
N
K
2005-06 to
2013-
14
R A
N
K
2007-08 to
2008-
09
R A
N
K
2012-13 to
2013-
14
R A
N
K
(2013-
14)
Rs.
R A
N
K
Andhra Pradesh 6.28 8 7.00 15 7.63 13 5.60 14 48817 11
Arunachal Pradesh 7.25 2 6.10 20 10.39 3 3.65 21 40193 13
Assam 4.18 18 5.57 22 5.27 22 6.33 10 27540 20
Bihar 5.66 12 9.45 3 10.05 4 9.91 1 17163 22
Chhattisgarh - 8.04 10 8.50 10 6.89 8 35948 16
Gujarat 7.48 1 9.33 4 8.89 8 7.45 6 74173 3
Haryana 6.87 5 8.52 7 8.31 11 6.24 11 75314 2
Himachal Pradesh 6.26 9 7.79 11 7.99 12 6.19 12 67105 6
Jammu and Kashmir 4.62 17 5.93 21 6.43 19 5.49 16 37903 14
Jharkhand - 7.20 14 9.38 6 8.17 3 33573 17
Karnataka 6.49 7 7.62 12 9.86 5 6.62 9 52719 10
Kerala 5.64 13 7.38 13 7.17 15 6.10 13 66862 7
Madhya Pradesh 5.67 11 8.25 8 8.58 9 9.09 2 30617 19
Maharashtra 6.97 4 8.98 6 6.92 18 7.53 5 76917 1
Odisha 5.12 15 6.59 19 9.34 7 2.79 22 31707 18
Punjab 5.34 14 6.74 16 7.45 14 5.19 19 57349 8
Rajasthan 7.00 3 8.14 9 7.11 17 5.60 15 36485 15
Tamil Nadu 6.67 6 9.20 5 5.79 21 5.34 18 70162 4 Telangana - 9.80 2 11.99 2 4.44 20 56891 9
Uttar Pradesh 4.91 16 6.63 18 7.16 16 5.37 17 22140 21
Uttarakhand - 12.45 1 15.39 1 7.94 4 68820 5
West Bengal 5.82 10 6.64 17 6.33 20 7.22 7 40592 12 Source (Basic Data): CSO website.
Inter State Comparison
An interstate comparison reveals that Tamil Nadu ranks fourth in per capita income (in
2004-05 prices) in 2013-14 among the major Indian states, next only to Maharashtra,
Haryana and Gujarat (Table 3). During 2004-05 to 2014-15, its average annual GSDP
growth was about 9 percent, which was higher than all India GDP growth of 7.72 percent
and GSDP growth of any other southern state (Table 4). During the same period,
Uttarkhand ranked first among the major states with its GSDP growth of 12.14 percent.
Interestingly, the poorer state-Bihar recorded 9.45 percent growth during this period.

12
Maharashtra, Uttar Pradesh and Tamil Nadu were the top three states in terms of GSDP
share in GDP in 2013-14. Table 4 also reveals that Tamil Nadu was one among the top
four states in the country in GDP share in 1980-81 and also in average share during
1980-81 to 2013-14.
Other Economic and Social Indicators
Table 5 provides the details of selective economic indicators in major Indian states. Tamil
Nadu ranks first in bank credit-deposit ratio (followed by Andhra Pradesh and
Maharashtra), sixth in poverty ratio, 6th in average per capita monthly consumption
expenditure in rural areas, and 7th in average monthly per capita consumption
expenditure in urban areas. In terms of manufacturing competitiveness index (in 2014),
Tamil Nadu ranks third.5 This index was prepared first time by the Institute of
Competitiveness, using the conceptual antecedents from “The Determinants of National
Competition” by Porter et al. This aggregate index made up of four interrelated factors,
viz., state business environment, social infrastructure, political stability and
macroeconomic conditions.
5 It considers five stages of manufacturing development, namely weak, weak to medium, medium, medium to strong and
strong. Tamil Nadu was kept under strong stage, but next to Maharashtra and Gujarat.

13
Table 4: Average Annual Growth of GSDP in Constant Prices and GDP Share of Major Indian States
States
GSDP (real) Growth in percent Share in GDP (nominal) in percent 1981-82 to 1989-
90
1990-91 to 1999-
00
2000-01 to 2004-
05
2005-06 to 2014-15 (13-
14)
1981-82 to 2014-
2015
1980-81 2013-14 Average
Andhra Pradesh 6.66 5.27 6.32 7.02 6.31 6.78 4.43 6.35
Arunachal Pradesh 8.14 6.53 9.17 6.19 7.24 0.08 0.13 0.10
Assam 4.18 2.68 4.67 5.65 4.24 2.33 1.52 2.09
Bihar 4.41 3.26 5.87 9.45 5.77 4.07 3.28 3.27
Chhattisgarh - 2.87 6.23 7.82 - 1.77 -
Delhi 7.84 6.79 6.03 9.05 7.62 2.22 3.73 2.90
Goa 4.81 8.65 5.10 10.26* 7.50* 0.30 0.47 0.34
Gujarat 6.37 7.01 7.06 9.33* 7.48* 6.16 7.31 6.55
Haryana 6.34 5.28 8.10 8.44 6.90 2.89 3.71 3.08
Himachal Pradesh 5.24 5.71 6.45 7.79* 6.26* 0.78 0.79 0.75
Jammu and Kashmir 3.18 4.93 4.21 5.18 4.44 1.15 0.84 0.92
Jharkhand - 5.35 4.54 7.33 - 1.65 -
Karnataka 5.64 6.92 5.07 7.56 6.50 5.10 5.87 5.34
Kerala 3.33 5.93 6.07 7.38* 5.64* 4.15 3.78 3.81
Madhya Pradesh 4.29 6.28 2.26 8.45 5.80 5.14 4.15 4.37
Maharashtra 6.29 6.80 4.94 8.63 6.93 13.18 14.42 13.52
Manipur 4.99 5.50 4.11 5.57* 5.17* 0.19 0.14 0.17
Meghalaya 5.43 6.04 6.01 8.34 6.55 0.19 0.21 0.20
Mizoram - 5.84 8.68* 0.06 0.10 0.09
Nagaland - 4.35 10.69 7.60 0.12 0.17 0.17
Orissa 5.36 2.90 6.48 6.74 5.21 3.30 2.61 2.71
Punjab 5.73 4.45 3.88 6.60 5.34 4.06 3.03 3.72
Rajasthan 7.21 6.70 5.16 7.90 6.96 4.26 4.94 4.50
Sikkim - 5.83 7.68 16.49* 0.05 0.12 0.06
Tamil Nadu 5.54 6.42 4.66 9.00 6.69 7.19 8.16 7.48
Telangana - 9.35 - 3.74 1.01
Tripura 5.51 7.16 8.08 8.63* 7.26* 0.29 0.26 0.27
Uttar Pradesh 4.97 4.02 3.49 6.56 4.94 12.59 8.24 10.15
Uttarakhand 3.22 9.62 12.14 - 1.17 -
West Bengal 4.29 6.65 5.49 6.69 5.86 8.97 6.75 7.52
Puducherry 4.21 8.82 4.92 10.71 7.58 0.17 0.20 0.17
A and N Islands 5.66 5.66 5.11 9.92* 6.73* 0.06 0.06 0.06
Chandigarh - 9.33 11.62 7.11* - 0.28 -
Source (Basic Data): Up to 2004-05, EPW Research Foundation; From 2004-05, the CSO. * up to 2013-14.

14
Table 5: Economic Indicators in Major Indian States
States
Monthly PC Expenditure
(2011-12)-Rural
Monthly PC Expenditure
(2011-12)-Urban
Manufacturing Competitiveness
Index
Credit-Deposit
Ratio
Poverty Ratio
Rs. Rank Rs. Rank 2014 Rank Mar
2014
Rank 2011-
12
Rank
Andhra
Pradesh
1754 4 2685 6 60.94 4 111.3 2 9.2 3
Bihar 1127 14 1507 17 52.35 17 32.8 16 33.7 15
Chhattisgarh 1027 15 1868 16 53.84 15 59.5 12 39.9 17
Gujarat 1536 10 2581 9 64.75 2 74.7 7 16.6 8
Haryana 2176 3 3819 1 60.48 5 78.1 6 11.2 4
Jharkhand 1006 16 2018 14 53.39 16 31.8 17 37 16
Karnataka 1561 9 3026 4 60.1 6 71.0 8 20.9 11
Kerala 2669 1 3408 2 58.3 9 67.7 9 7.1 1
Madhya
Pradesh
1152 13 2058 12 56.73 12 60.4 11 31.7 13
Maharashtra 1619 7 3189 3 67.07 1 89.8 3 17.4 9
Orissa 1003 17 1941 15 56.05 14 44.6 14 32.6 14
Punjab 2345 2 2794 5 57.17 10 79.1 5 8.3 2
Rajasthan 1598 8 2442 10 57.06 11 87.1 4 14.7 7
Tamil Nadu
1693 6 2622 7 64.63 3 121.8 1 11.3 6
Uttar Pradesh
1156 12 2051 13 59.74 7 44.6 13 29.4 12
Uttarakhand 1726 5 2339 11 56.63 13 35.6 15 11.3 5
West Bengal 1291 11 2591 8 58.34 8 61.6 10 20 10
All India 1430 2630 79.0 21.9
Chart 8 shows the performance of Indian states based on their competitiveness
score (2014), given in “The State Competitiveness Report” by Mint Asia and Institute of
Competitiveness, India. It basically compares the states with similar per capita GSDP6 to
assess their competitiveness by looking at factors like factor availability (of land, labor
and capital), role played by Government in facilitating business and the profile of
consumers in each state. Tamil Nadu is one among the top income (innovation driven)
6As states varied with demographic size, natural resources, and income levels, states are categorized into: (i) factor driven
with per capital income of less than $400 (UP and Bihar), (ii) changeover with per capita income ranged $400-$525
(MP, Odhisa, JandK, Chhattisgarh and Jharkhand), (iii) Investment driven with per capita income ranged $525-$800 (AP, Karnataka, Rajasthan, West Bengal), (iv) Transition economies with income ranged $800-$925 (Punjab, HP and
Kerala) and (v) Innovation driven with per capita income above $925 (Maharashtra, Gujarat, TN, Haryana and
Uttaranchal).

15
categories and ranked third among the major nations, next only to Maharashtra and
Gujarat.
Chart 8: Ranking of Indian States based on Competitiveness Score 2014
Source: The State Competitiveness Report, 2014.
Chart 9 plots the monthly CPI inflation (Industrial workers) for Tamil Nadu,
Maharashtra, Gujarat and All India from April 2004 to December 2013. Up to April 2007,
Tamil Nadu’s inflation was in general less than all India inflation. But in the recession
period till April 2009 it was higher than all India inflation. Then up to Jan 2012, it was
kept below all India inflation, but after that it was again kept above the all India inflation.
This pattern clearly shows that during recession period, the prices in Tamil Nadu (at least
in urban areas) have gone above the all India price level. This needs special attention. It
is interesting to note that in the recession period till April 2009, inflation levels in both
Maharashtra and Gujarat were well below all India level. While inflation levels at Gujarat
and Maharashtra went up in 2012, Gujarat’s inflation came down in the beginning of the
next year.

16
Chart 9: CPI_IW Inflation (April 2004-December 2013): Tamil Nadu and India
Table 6: Social Indicators in Major (and Selective) Indian States
States 2013 2011
IMR RA NK
Birth Rate
RA NK
Death Rate
RA NK
Literacy RA NK
Female Literacy
RA NK
Urban Ratio
RA NK
Andhra Pradesh 29 10 17.4 6 7.3 13 67.7 14 59.7 13 33.5 8
Bihar 33 13 27.6 17 6.6 7 63.8 17 53.3 16 11.3 17
Chhattisgarh 38 15 24.4 12 7.9 15 71.0 11 60.6 11 23.2 14
Gujarat 22 4 20.8 10 6.5 5 79.3 5 70.7 7 42.6 4
Haryana 32 12 21.3 11 6.3 3 76.6 8 66.8 9 34.8 7
Jharkhand 27 9 24.6 13 6.8 9 67.6 15 56.2 15 24.1 13
Karnataka 24 7 18.3 8 7 11 75.6 9 68.1 8 38.6 5
Kerala 9 1 14.7 1 6.9 10 93.9 1 92.0 1 47.7 2
Madhya Pradesh 37 14 26.3 15 8 16 70.6 12 60.0 12 27.6 11
Maharashtra 16 2 16.5 5 2.2 1 82.9 2 75.5 2 45.2 3
Odisha 38 16 19.6 9 8.4 17 73.5 10 64.4 10 16.7 16
Punjab 23 6 15.7 3 6.7 8 76.7 7 71.3 4 37.5 6
Rajasthan 30 11 25.6 14 6.5 6 67.1 16 52.7 17 24.9 12
Tamil Nadu 17 3 15.6 2 7.3 12 80.3 3 73.9 3 48.5 1 Uttar Pradesh 38 17 27.2 16 7.7 14 69.7 13 59.3 14 22.3 15
Uttarakhand 22 5 18.2 7 6.1 2 79.6 4 70.7 6 30.6 10
West Bengal 26 8 16 4 6.4 4 77.1 6 71.2 5 31.9 9
ALL-INDIA 40 21.4 7 74.0 65.5 31.2
Table 6 provides the details of selective social and demographic indicators in
major Indian states. Tamil Nadu ranked first in urbanization with about 49 percent of
urban ration in 2011. Tamil Nadu ranks second in (low) birth rate, next only to Kerala. It
ranks third in infant mortality rate, literacy and female literacy. But it ranks twelfth in

17
death rates. Even poor income states like Bihar and Madhya Pradesh compare well in
death rate. This needs special attention.
Concluding Remarks7
This Chapter has briefly reviewed the overall growth performance of Tamil Nadu
economy since 1980s. Tamil Nadu is a better performing state as its long-term growth
rate of 6.69 percent is slightly higher than all India growth of 6.28 percent. Its long-term
average growth is also closer to other big economies- Maharashtra (6.9 percent) and
Gujarat (7.46 percent). The long-term trend (potential) growth rate was also higher than
Maharashtra and all India, but slightly slower than Gujarat.
In the medium-term (since 2005), Tamil Nadu is performing better than all India
and other two top economies. During 2005-2015, Tamil Nadu’s average growth rate was
9.2 percent, which is about 1.5 percentage points above the all India growth of 7.7
percent. Other top two economies’ average growth rates (Gujarat- 9.1 percent and
Maharashtra - 8.6 percent) were slightly lower than that of Tamil Nadu.
Tamil Nadu ranks fourth in terms of average growth as well as per capita
income. It also compares well with many other Indian states in many demographic and
social indicators. However, the great concern is its short run growth dynamics. During the
recession period, its growth has dipped into a very low level as compared to all India as
well as other two top economies. Further its growth is highly volatile and vulnerable to
external shocks due to increased globalization (i.e., high dependency on all India and
foreign nations). Its inflation was also high during the recession periods as compared to
other major economies.
While other top economies also responded more or less the same way as reacted
by Tamil Nadu during the recession periods, its persistent inflation and high volatile
nature of growth are major concerns. While evidences indicate that Tamil Nadu economy
has successfully emerged out of the recession years in the recent past (two occasions)
and potential to register a double-digit growth in the medium term, there is a need to
identify the sectors and regions causing the sudden fall in the overall growth rate during
the recession years. The next two chapters deal with these issues.
7 A brief review on state government finances is given in Appendix A.

18
Chapter 3
SECTORAL PERFORMANCE IN TAMIL NADU
In this Chapter, we look at Tamil Nadu’s growth experience in terms of (a) sectoral
growth, (b) relative contribution of sectoral growth to overall growth, and (c) changes in
sectoral composition of GSDP.
Sectoral Growth Pattern
Table 7(and Chart 10) provides a profile of sectoral growth rates and the overall GSDP
growth rate for Tamil Nadu during 2005-06 to 2013-14. All figures relate to the GSDP at
2004-05 prices. For the purpose of this analysis, we have divided GSDP into three major
sectors:
1. Agriculture and Allied Services (primary sector);
2. Industry (includes mining and quarrying, manufacturing, electricity, gas and
water supply and construction); and
3. Services (includes (i) transport, storage and communication, (ii) trade, hotels and
restaurants, (iii) banking and insurance, (iv) real estate, ownership of dwellings
etc, and (v) other services).
Chart 10: Sectoral Growth in Tamil Nadu
13.3 13.2
-4.4
-2.3
6.47.5
10.0
-11.1
7.3
4.9
14.1 13.4
3.9
-2.1
20.9
15.3
4.12.1 3.1
3.6
14.0
16.6
9.3 10.6
6.9
12.8
8.8 6.0
9.3 9.2
-15
-10
-5
0
5
10
15
20
25
2005-06 2006-07 2007-08 2008-09 2009-10 2010-11 2011-12 2012-13 2013-14 2014-15
Agriculture and Allied Industry Services

19
Table 7: Annual Growth Rates: Sector-wise Performances at 2004-05 Prices
Sectors/Sub-sectors
2005-06
2006-07
2007-08
2008-09
2009-10
2010-11
2011-12
2012-13
2013-14
2014-15
Avg. XI Plan
Last 3 yrs.
Last 2 yrs
First 3 yrs of XI Plan
GSDP (Tamil Nadu)
Agriculture and Allied
13.26 13.24 -4.41 -2.29 6.35 7.47 9.95 -11.11 7.33 4.94 4.47 3.41 0.39 6.13 -0.12
Agriculture 11.49 15.42 -4.69 -2.70 6.56 7.69 11.05 -13.04 8.22 4.71 4.47 3.58 -0.03 6.47 -0.28
Forestry, Logging
5.74 -0.54 2.82 -0.88 3.16 3.30 2.49 3.44 4.08 4.40 2.80 2.18 3.97 4.24 1.70
Fishing 43.04 1.95 -6.47 1.17 6.58 8.16 3.40 1.03 0.70 7.84 6.74 2.57 3.19 4.27 0.43
Industry 14.08 13.44 3.86 -2.06 20.93 15.32 4.09 2.12 3.11 3.64 7.85 8.43 2.96 3.38 7.58
Manufacture 15.11 18.75 0.59 -1.31 29.18 12.31 1.42 1.12 4.58 2.58 8.43 8.44 2.76 3.58 9.49
Mining and Quarrying
-4.86 4.36 1.17 -1.78 9.30 3.13 13.15 5.96 6.01 7.49 4.39 4.99 6.49 6.75 2.90
Construction 16.19 4.45 18.61 5.31 5.18 22.49 9.24 -2.18 1.22 5.76 8.63 12.17 1.60 3.49 9.70
Services 14.02 16.57 9.33 10.56 6.90 12.80 8.77 6.05 9.31 9.16 10.35 9.67 8.17 9.23 8.93
Trade Hotels Restaurants
16.28 20.58 4.30 3.66 4.50 13.22 7.68 2.76 7.33 7.62 8.79 6.67 5.91 7.48 4.15
Transport, Storage,Communication
12.40 13.56 9.35 15.49 13.87 14.13 7.53 4.41 6.73 5.70 10.32 12.07 5.61 6.22 12.90
Real Estate, Ownership of Dwellings
15.17 16.50 16.75 13.40 6.82 10.03 14.16 12.79 14.99 16.45 13.71 12.23 14.74 15.72 12.32
Banking and Insurance
17.55 19.09 17.11 10.18 2.97 14.65 9.73 12.65 12.65 7.85 12.44 10.93 11.05 10.25 10.09
Other Services 12.18 11.48 7.34 10.31 10.69 14.26 7.46 2.35 5.08 7.29 8.85 10.01 4.91 6.19 9.45
GSDP 13.96 15.21 6.13 5.45 10.83 13.12 7.39 3.39 7.29 7.25 9.20 8.58 5.98 7.27 7.47
(Contd Table …)

20
Sectors/Sub-sectors
2005-06
2006-07
2007-08
2008-09
2009-10
2010-11
2011-12
2012-13
2013-14
2014-15
Avg. XI Plan
Last 3 yrs.
Last 2 yrs.
First 3 yrs.
of 11th Plan
GDP fc (India)
Agriculture and Allied
5.14 4.16 5.80 0.09 0.81 8.60 5.02 1.42 3.66 0.23 3.49 4.06 1.77 1.94 2.23
Agriculture 5.53 4.13 6.34 -0.27 0.41 9.54 5.34 0.91 n.a n.a 4.27 2.16
Forestry, Logging
1.79 3.27 1.39 1.88 2.91 2.37 1.85 2.85 n.a n.a 2.08 2.06
Fishing 5.88 6.61 5.80 2.74 3.24 5.83 5.70 7.15 n.a n.a 4.66 3.93
Industry 9.72 12.17 9.67 4.44 9.16 7.55 7.81 0.96 4.53 6.12 7.21 7.73 3.87 5.32 7.76
Manufacture 10.10 14.32 10.28 4.33 11.30 8.86 7.41 1.14 5.32 7.13 8.02 8.43 4.53 6.23 8.63
Mining and Quarrying
1.31 7.47 3.69 2.14 5.89 6.54 0.10 -2.16 5.39 2.42 3.28 3.67 1.88 3.90 3.91
Elect. Gas and Water sup
7.10 9.29 8.27 4.56 6.22 5.26 8.38 2.26 4.76 7.90 6.40 6.54 4.97 6.33 6.35
Construction 12.79 10.33 10.78 5.34 6.65 5.72 10.80 1.11 2.48 4.77 7.08 7.86 2.79 3.62 7.59
Services 10.56 9.58 10.07 10.76 10.53 8.90 7.26 7.53 9.05 10.16 9.44 9.50 8.91 9.60 10.45
Trade, Hotel, Restaurant Transport, storage, Com.
12.05 11.61 10.93 7.49 10.39 12.20 4.33 5.07 11.09 10.68 9.58 9.07 8.95 10.88 9.60
Trade Hotels Restaurants
12.17 11.12 10.10 5.68 7.92 11.96 1.23 4.45 n.a n.a 7.38 7.90
Transport,
Storage, Communication
11.82 12.56 12.48 10.83 14.75 12.60 9.45 6.01 n.a n.a 12.02 12.69
Finance, Real Estate etc
12.62 13.96 11.95 12.02 9.70 10.01 11.35 10.92 7.87 11.54 11.19 11.01 10.11 9.71 11.23
Real Estate, Ownership of Dwellings
10.56 9.51 8.44 10.44 8.33 5.90 9.90 10.04 n.a n.a 8.60 9.07
(Contd Table …)
(Contd Table …)

21
Sectors/Sub-sectors
2005-06
2006-07
2007-08
2008-09
2009-10
2010-11
2011-12
2012-13
2013-14
2014-15
Avg. XI Plan
Last 3 yrs.
Last 2 yrs.
First 3 yrs.
of 11th Plan
GDP fc (India)
Banking and Insurance
15.82 20.56 16.69 14.01 11.38 14.87 12.92 11.84 n.a n.a 13.97 14.03
Public Admin, and Others
7.07 2.81 6.87 12.52 11.73 4.24 4.90 5.31 7.95 7.22 7.06 8.05 6.83 7.59 10.37
Other Services 9.08 3.47 6.35 7.39 7.16 8.22 5.43 6.79 n.a n.a 6.91 6.97
Public Administ, Defence
4.34 1.88 7.61 19.81 17.55 -0.39 4.24 3.43 n.a n.a 9.76 14.99
GDP fc (India) 9.48 9.57 9.32 6.72 8.59 8.91 6.69 4.47 6.64 7.17 7.76 8.05 6.09 6.90 8.21 Source (Basic Data): Central Statistical Organization, Government of India.
(Contd Table …)
22
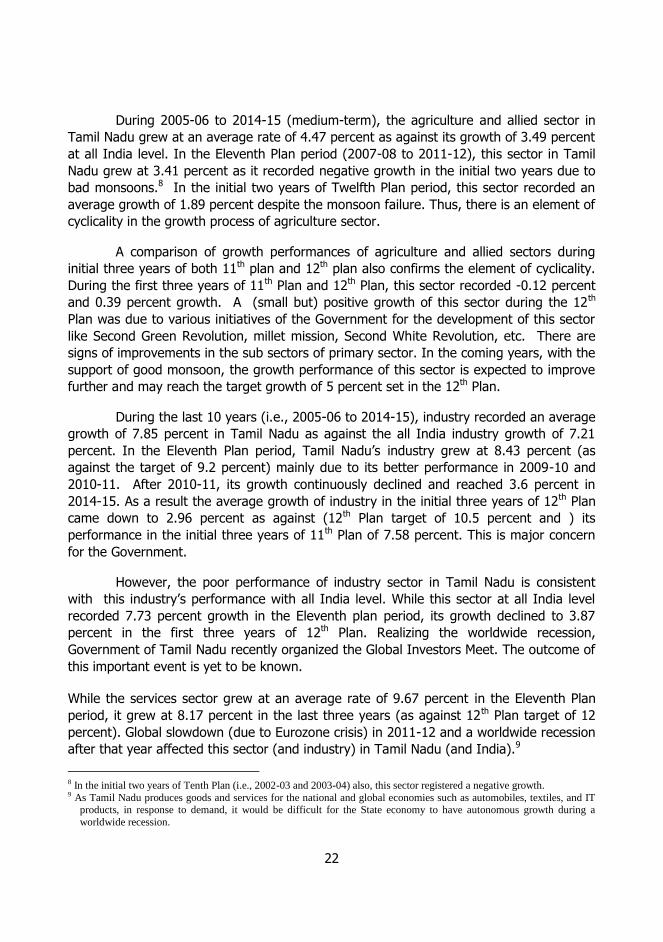
During 2005-06 to 2014-15 (medium-term), the agriculture and allied sector in
Tamil Nadu grew at an average rate of 4.47 percent as against its growth of 3.49 percent
at all India level. In the Eleventh Plan period (2007-08 to 2011-12), this sector in Tamil
Nadu grew at 3.41 percent as it recorded negative growth in the initial two years due to
bad monsoons.8 In the initial two years of Twelfth Plan period, this sector recorded an
average growth of 1.89 percent despite the monsoon failure. Thus, there is an element of
cyclicality in the growth process of agriculture sector.
A comparison of growth performances of agriculture and allied sectors during
initial three years of both 11th plan and 12th plan also confirms the element of cyclicality.
During the first three years of 11th Plan and 12th Plan, this sector recorded -0.12 percent
and 0.39 percent growth. A (small but) positive growth of this sector during the 12th
Plan was due to various initiatives of the Government for the development of this sector
like Second Green Revolution, millet mission, Second White Revolution, etc. There are
signs of improvements in the sub sectors of primary sector. In the coming years, with the
support of good monsoon, the growth performance of this sector is expected to improve
further and may reach the target growth of 5 percent set in the 12th Plan.
During the last 10 years (i.e., 2005-06 to 2014-15), industry recorded an average
growth of 7.85 percent in Tamil Nadu as against the all India industry growth of 7.21
percent. In the Eleventh Plan period, Tamil Nadu’s industry grew at 8.43 percent (as
against the target of 9.2 percent) mainly due to its better performance in 2009-10 and
2010-11. After 2010-11, its growth continuously declined and reached 3.6 percent in
2014-15. As a result the average growth of industry in the initial three years of 12th Plan
came down to 2.96 percent as against (12th Plan target of 10.5 percent and ) its
performance in the initial three years of 11th Plan of 7.58 percent. This is major concern
for the Government.
However, the poor performance of industry sector in Tamil Nadu is consistent
with this industry’s performance with all India level. While this sector at all India level
recorded 7.73 percent growth in the Eleventh plan period, its growth declined to 3.87
percent in the first three years of 12th Plan. Realizing the worldwide recession,
Government of Tamil Nadu recently organized the Global Investors Meet. The outcome of
this important event is yet to be known.
While the services sector grew at an average rate of 9.67 percent in the Eleventh Plan
period, it grew at 8.17 percent in the last three years (as against 12th Plan target of 12
percent). Global slowdown (due to Eurozone crisis) in 2011-12 and a worldwide recession
after that year affected this sector (and industry) in Tamil Nadu (and India).9
8 In the initial two years of Tenth Plan (i.e., 2002-03 and 2003-04) also, this sector registered a negative growth. 9 As Tamil Nadu produces goods and services for the national and global economies such as automobiles, textiles, and IT
products, in response to demand, it would be difficult for the State economy to have autonomous growth during a
worldwide recession.

23
Chart 10 clearly indicates that all these three major sectors went through a
recession after 2010-11, particularly industry. It also shows that the agriculture and allied
sector and industry growth curves are more volatile than services growth curve. These
high volatility in industry and agriculture sector implies that the risk-adjusted returns
from them are low and so these sector may find it difficult to attract private investments.
An interstate comparison reveals that Tamil Nadu obtained 10th rank in average rate of
growth of agriculture and allied sector during 2005-06 to 2014-15 (Table 8). It ranked 6th
in terms of industrial growth, next only to Uttarkhand, Bihar, Gujarat, Maharashtra, and
Rajasthan. It also ranked 7th in services sector growth, next only to Uttarkhand, Haryana,
Jharkhand, Telungana, Bihar, and Gujarat. It ranked 5th in GSDP growth.
Table 8: 10 Year Average Annual Growth of GSDP and its Sub Sectors of Major
States (2005-06 to 2014-15) in 2004-05 prices States 2005-06 to 2014-15 (10 Years) Last 3 Years (2012-13 to 20014-15)
AG. and Alli
R A N K
IN DU ST RY
R A N K
SE RV IC ES
R A N K
G S D P
R A N K
AG. and Alli
R A N K
IN DU ST RY
R A N K
SE RV IC ES
R A N K
G S D P
R A N K
Andhra Pradesh 4.8 8.0 6.1 15.0 8.6 19.0 7.0 15.0 7.1 5.0 0.6 21.0 8.0 13.0 6.1 13.0
Arunachal Pradesh 4.4 12.0 6.3 14.0 8.7 18.0 6.2 20.0 3.0 13.0 6.4 5.0 5.3 21.0 4.8 19.0
Assam 3.2 16.0 3.8 21.0 7.7 22.0 5.7 21.0 3.7 9.0 6.7 4.0 7.2 17.0 6.4 11.0
Bihar 4.7 9.0 12.9 2.0 10.9 5.0 9.5 2.0 2.2 15.0 7.3 2.0 13.5 1.0 9.8 1.0
Chhattisgarh 6.6 4.0 7.6 10.0 9.3 12.0 7.8 10.0 5.5 6.0 5.2 8.0 8.7 8.0 6.5 10.0
Gujarat 7.7 3.0 8.9 3.0 10.5 6.0 9.3 4.0 9.7 3.0 4.8 9.0 9.5 4.0 7.5 5.0
Haryana 3.4 14.0 6.3 13.0 11.7 2.0 8.4 8.0 0.8 18.0 4.5 11.0 9.6 3.0 6.7 9.0
Himachal Pradesh 4.5 11.0 7.8 8.0 10.0 8.0 7.8 11.0 11.4 2.0 2.9 16.0 7.1 19.0 6.2 12.0
Jammuand Kashmir 0.5 21.0 4.3 19.0 8.0 21.0 5.2 22.0 -3.7 22.0 5.5 7.0 4.7 22.0 3.1 22.0
Jharkhand 8.6 2.0 4.2 20.0 11.1 3.0 7.3 14.0 7.7 4.0 4.7 10.0 11.7 2.0 8.3 4.0
Karnataka 5.2 7.0 6.1 16.0 9.2 13.0 7.6 12.0 5.5 7.0 2.8 17.0 9.1 5.0 6.8 8.0
Kerala -0.4 22.0 2.2 22.0 9.5 10.0 7.4 13.0 0.0 20.0 2.2 18.0 8.4 9.0 6.1 14.0
Madhya Pradesh 9.7 1.0 7.5 11.0 8.4 20.0 8.5 7.0 19.1 1.0 3.1 14.0 7.9 15.0 9.5 2.0
Maharashtra 4.1 13.0 8.4 4.0 9.5 9.0 8.7 6.0 -0.1 21.0 5.9 6.0 8.3 10.0 6.9 7.0
Orissa 2.4 18.0 6.7 12.0 8.8 16.0 6.7 16.0 1.1 16.0 3.8 12.0 6.4 20.0 4.6 21.0
Punjab 1.6 20.0 7.7 9.0 8.9 14.0 6.6 18.0 1.1 17.0 2.1 19.0 8.9 6.0 5.2 18.0
Rajasthan 5.4 6.0 8.0 5.0 9.3 11.0 7.9 9.0 2.5 14.0 3.2 13.0 8.7 7.0 5.7 16.0
Tamil Nadu 4.5 10.0 7.9 6.0 10.4 7.0 9.0 5.0 0.4 19.0 3.0 15.0 8.2 12.0 6.0 15.0
Telungana 6.3 5.0 7.8 7.0 11.0 4.0 9.4 3.0 3.2 12.0 0.0 22.0 7.3 16.0 4.7 20.0
Uttar Pradesh 3.2 15.0 5.5 17.0 8.8 15.0 6.6 19.0 3.3 10.0 2.0 20.0 7.9 14.0 5.6 17.0
Uttarkhand 2.9 17.0 16.3 1.0 12.4 1.0 12.1 1.0 3.8 8.0 11.4 1.0 7.1 18.0 8.4 3.0
West Bengal 2.4 19.0 5.2 18.0 8.7 17.0 6.7 17.0 3.2 11.0 7.2 3.0 8.2 11.0 7.2 6.0
India 3.5 7.2 9.4 7.8 1.8 3.9 8.9 6.1
Source (Basic Data): Central Statistical Organization, Government of India.
But in the last three years, Tamil Nadu slipped to 19th rank in agriculture and
allied sector growth, 15th rank in industry growth, 12th rank in services growth and 15th

24
rank in GSDP growth. Thus, the short run poor performance of Tamil Nadu is of serious
concern. As there is an element of cyclicality in its growth performance, Government
needs to plan properly to overcome this issue and make all sectors growth pattern as
consistent (or less volatile).
Growth of Sub Sectors
Among the industries, manufacturing grew at an average annual rate of 8.44 percent in
the Eleventh Plan period (2007-08 to 2011-12). But in the last three years its growth
dipped into 2.76 percent level (Table 7). Rising oil prices and power shortage aggravated
the problem along with over all economic downturn of the economy. While the
construction industry’s growth was 12.2 percent in the Eleventh Plan period it declined to
just 1.6 percent in the last three years despite the fact that the real estate growth
increased from 12.23 percent in the Eleventh Plan period to 14.74 percent in the last
three years. Rising costs of construction materials like cement, sand etc. could be the
reasons for slow growth in this sector. However, the poor performance of these two
sectors is consistent with their poor performance at all India. At all India level,
manufacture grew at only 4.53 percent while construction at 2.79 percent. As high
growth of both manufacturing and construction sectors are more important from the
employment point of view, the slow down in the growth of these two major sub-sectors
is the major concern.
As indicated above, growth of real estate and ownership dwellings increased in
the last three years as compared to Eleventh Plan. The Banking and Insurance sectors
registered more or less the same growth (11 percent) in the 11th Plan and in the last
three years. However, the growth rate of Trade, Hotels and Restaurants declined
marginally from about 6.67 percent to 5.91 percent, Transports, Storage and
Communication from about 12 percent to 5.6 percent and Other Services from about 10
percent to 5 percent (Table 7). This trend clearly indicates that being a producing state,
Tamil Nadu’s manufacturing activities and related services activities were severely
affected by the global economic downturn.
Relative Contributions of Sectoral Growths to Aggregate Growth
In this Section, we look at the relative contributions of the sectoral growth rates to
overall growth rate by decomposing growth as a weighted sum of sectoral growth rates
with weights being equal to the respective shares of the sector in the overall GSDP. The
weights change every year as explained below. For the purpose of this analysis, we have
divided GSDP in to the following 13 sectors:
25
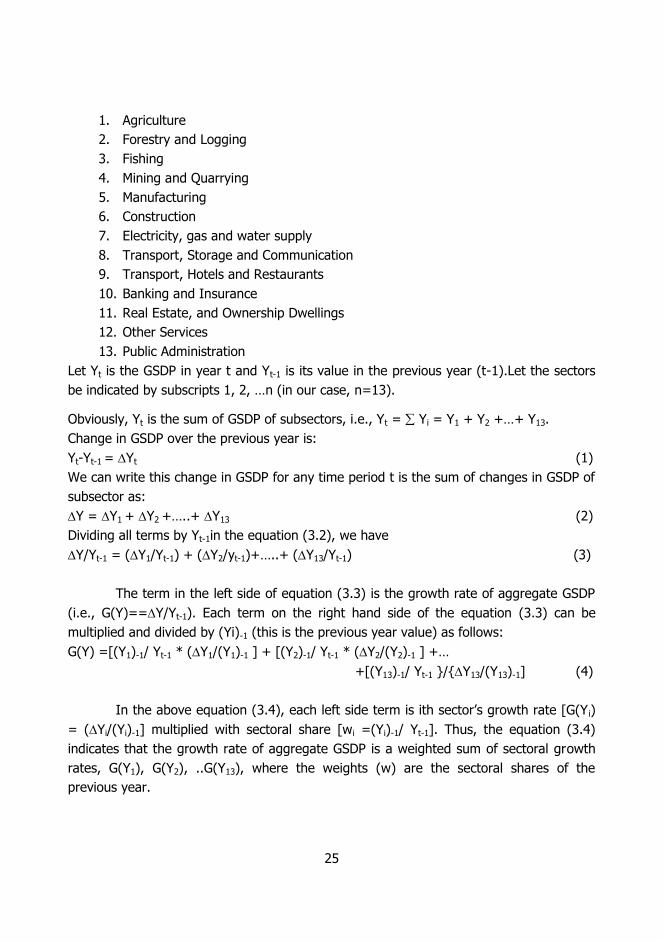
1. Agriculture
2. Forestry and Logging
3. Fishing
4. Mining and Quarrying
5. Manufacturing
6. Construction
7. Electricity, gas and water supply
8. Transport, Storage and Communication
9. Transport, Hotels and Restaurants
10. Banking and Insurance
11. Real Estate, and Ownership Dwellings
12. Other Services
13. Public Administration
Let Yt is the GSDP in year t and Yt-1 is its value in the previous year (t-1).Let the sectors
be indicated by subscripts 1, 2, …n (in our case, n=13).
Obviously, Yt is the sum of GSDP of subsectors, i.e., Yt = Yi = Y1 + Y2 +…+ Y13.
Change in GSDP over the previous year is:
Yt-Yt-1 = Yt (1)
We can write this change in GSDP for any time period t is the sum of changes in GSDP of
subsector as:
Y = Y1 + Y2 +…..+ Y13 (2)
Dividing all terms by Yt-1in the equation (3.2), we have
Y/Yt-1 = (Y1/Yt-1) + (Y2/yt-1)+…..+ (Y13/Yt-1) (3)
The term in the left side of equation (3.3) is the growth rate of aggregate GSDP
(i.e., G(Y)==Y/Yt-1). Each term on the right hand side of the equation (3.3) can be
multiplied and divided by (Yi)-1 (this is the previous year value) as follows:
G(Y) =[(Y1)-1/ Yt-1 * (Y1/(Y1)-1 ] + [(Y2)-1/ Yt-1 * (Y2/(Y2)-1 ] +…
+[(Y13)-1/ Yt-1 }/{Y13/(Y13)-1] (4)
In the above equation (3.4), each left side term is ith sector’s growth rate [G(Y i)
= (Yi/(Yi)-1] multiplied with sectoral share [wi =(Yi)-1/ Yt-1]. Thus, the equation (3.4)
indicates that the growth rate of aggregate GSDP is a weighted sum of sectoral growth
rates, G(Y1), G(Y2), ..G(Y13), where the weights (w) are the sectoral shares of the
previous year.

26
The growth decomposition results shows that manufacturing was the single most
important component of the growth rate, followed by real estate and trade, hotels and
restaurants in the normal years. Construction, transport, storage and communication and
banking sectors also contributed significantly in many years. Agriculture also contributed
in some years and was even strong enough to pull in the negative direction in 2007-08
and 2012-13 (Table 9).
Table 9: Contributions of Sectoral Growth Rates to GSDP Growth
(Percent)
Sectors/Sub-
sectors
2005
-06
2006
-07
2007
-08
2008
-09
2009
-10
2010
-11
2011
-12
2012
-13
2013
-14
2014
-15
1.Agriculture 1.10 1.45 -0.44 -0.23 0.51 0.58 0.79 -0.96 0.51 0.29
2.Forestry, Logging 0.04 0.00 0.02 -0.01 0.02 0.02 0.01 0.02 0.02 0.02
3.Fishing 0.33 0.02 -0.05 0.01 0.05 0.06 0.02 0.01 0.00 0.05
4.Manufacture 3.00 3.76 0.12 -0.26 5.34 2.63 0.30 0.22 0.90 0.49
5.Mining and
Quarrying -0.04 0.03 0.01 -0.01 0.05 0.02 0.06 0.03 0.03 0.04
6.Construction 1.45 0.41 1.54 0.49 0.48 1.98 0.88 -0.21 0.11 0.50
7.Electricity, gas WS 0.04 0.07 -0.47 -0.85 0.06 0.12 0.05 0.61 -0.10 0.03
8.Trade Hotels
Restaurants 2.78 3.58 0.78 0.66 0.79 2.19 1.28 0.46 1.21 1.26
9.Transport, Storage,Communicati
on 1.15 1.24 0.84 1.44 1.41 1.48 0.79 0.47 0.72 0.60
10.Real Estate,
Ownership Dwellings 1.59 1.75 1.80 1.58 0.87 1.23 1.68 1.62 2.07 2.43
11.Banking and
Insurance 1.27 1.43 1.32 0.87 0.26 1.21 0.82 1.08 1.18 0.77
12.Other Services 1.09 1.01 0.62 0.89 0.96 1.28 0.68 0.21 0.46 0.64
13,Public
Adminstraion 0.15 0.48 0.04 0.88 0.02 0.34 0.03 -0.15 0.18 0.12
GSDP 13.96 15.21 6.13 5.45 10.83 13.12 7.39 3.39 7.29 7.25
Major Problem Sectors
(1+4+6+8+9) 9.48 10.43 2.85 2.10 8.54 8.85 4.04 -0.02 3.45 3.15 Source: Computed using basic data from CSO. * - GSDP growth is sum of contributions of all 10 sectors.
Chart 11 also highlights the growing importance of manufacturing, agriculture
and allied sector, construction, trade, hotels and restaurants, and transport, storage, and
communication services in the overall growth performance of Tamil Nadu.

27
Chart 11: Sectoral Contributions to Growth
What is apparent is that the growth rate itself was very volatile, due to the fact
that agriculture itself is very dependent on rainfall making it very volatile, and
manufacture is also very dependent on global demand and volatile in the recession
periods. Table 10 shows that the percentage contributions of different sectors to overall
GDSP growth. Looking at the growth performance from 2004-05 onwards, it is clear that
manufacturing contributed significantly in normal years: 2005-06, 2006-07, 2009-10 to
2010-11. Sectors contributing more or less consistently well have been banking and
insurance and real estate.
It is also observed from Chart 11 that the following 5 sub sectors: agriculture and
allied, manufacture, transport, storage and communication, trade, hotels, and restaurants
and construction contributed about 70 percent of over all GSDP growth in 2005-06, 2006-
07 and 2010-11 (Table 10). They also jointly contributed more than 80 percent in 2009-
10 and about 55 percent in 2011-12. But their joint contribution declined severely in the
problem years: 2007-08, 2008-09, and initial three years of 12th Plan. As a result, the
over all growth declined in those years. These major but problematic sectors need special
attention.

28
Table 10: Percentage Contribution of Sectors to GSDP Growth
Sectors/Sub-sectors
2005-06
2006-07
2007-08
2008-09
2009-10
2010-11
2011-12
2012-13
2013-14
2014-15
1.Agriculture 7.90 9.52 -7.20 -4.18 4.72 4.40 10.67 -
28.35
7.00 4.07
2.Forestry, Logging 0.31 -0.03 0.28 -0.09 0.16 0.13 0.16 0.46 0.25 0.27
3.Fishing 2.35 0.12 -0.89 0.16 0.44 0.43 0.30 0.19 0.06 0.63
4.Manufacture 21.47 24.70 1.98 -4.72 49.37 20.04 4.06 6.61 12.29 6.79
5.Mining and Quarrying
-0.26 0.18 0.11 -0.18 0.43 0.12 0.80 0.83 0.40 0.50
6.Construction 10.41 2.67 25.19 9.03 4.43 15.06 11.90 -6.21 1.53 6.87
7.Electricity, gas, water supply
0.31 0.45 -7.66 -15.66
0.58 0.91 0.71 17.86 -1.33 0.41
8.Trade Hotels
Restaurants
19.91 23.55 12.79 12.02 7.32 16.72 17.27 13.57 16.65 17.40
9.Transport,
Storage,Communication
8.24 8.15 13.74 26.39 13.03 11.26 10.74 13.72 9.84 8.34
10.Real Estate,
Ownership Dwellings
11.41 11.51 29.30 29.00 7.99 9.35 22.79 47.64 28.35 33.56
11.Banking and Insurance
9.11 9.37 21.55 15.91 2.44 9.24 11.04 31.91 16.18 10.61
12.Other Services 7.79 6.63 10.18 16.26 8.88 9.77 9.16 6.30 6.26 8.86
13,Public Adminstraion
1.05 3.17 0.62 16.06 0.21 2.58 0.41 -4.54 2.52 1.71
GSDP 100 100 100 100 100 100 100 100 100 100
Major Problem Sectors
(1+4+6+8+9)
67.93 68.60 46.51 38.54 78.87 67.47 54.63 -0.66 47.31 43.47
Source: Computed using basic data from CSO.
Chart 12 shows the growth contributions of these five major sub sectors since
2005-06. Among them, the industrial growth contribution is highly volatile, and trades,
hotels and restaurants growth contribution is also volatile. As indicated earlier, these
sectors are highly sensitive to global economies. They need special attention. The growth
contribution of transport, storage and communication is more or less consistent. Given
that agriculture is critical for food security in the state and around 50 percent of
population is still rural, sufficient investments are necessary in agriculture sector to
ensure growth in the sector overcoming climatic aberrations.

29
Chart 12: Growth Contributions of Five Major Sub Sectors
Manufacturing along with services is the engine of growth in the State. The
growth of this sector is vital for generating jobs to absorb the working age population in
the state. Uninterrupted power to industries, credit facilities to SMEs and incentives for
new industries are essential to ensure a sustained industrial growth in Tamil Nadu.
Structure of GSDP
Like in many other Indian States, the structure of gross state domestic product (GSDP) in
Tamil Nadu has been shifting away from agriculture towards non-agriculture, particularly
services. The share of agriculture and allied sector in total GSDP (in 1999-00 prices) of
Tamil Nadu in 1999-00 was about 17 percent and the shares of industry and services
sectors were 30 percent and 53 percent respectively (not shown). As indicated in Table
11, the share of agriculture and allied sector declined to about 11 percent in 2004-05 (at
2004-05 prices) and further to 7.12 percent in 2014-15.
Table 11: Share of GSDP (GDP) in Tamil Nadu (India) at 2004-05 Prices
(Percent)
Sectors/Sub-Sectors
2004-05
2005-06
2006-07
2007-08
2008-09
2009-10
2010-11
2011-12
2012-13
2013-14
2014-15
Tamil Nadu
Agriculture and Allied of which
11.12 11.06 10.87 9.79 9.07 8.70 8.27 8.46 7.28 7.28 7.12
Agriculture 9.60 9.39 9.41 8.45 7.80 7.50 7.14 7.38 6.21 6.26 6.11
Forestry, Logging
0.76 0.71 0.61 0.59 0.55 0.52 0.47 0.45 0.45 0.44 0.42
Fishing 0.76 0.96 0.85 0.75 0.72 0.69 0.66 0.63 0.62 0.58 0.58
-1
0
1
2
3
4
5
6
2005-06 2006-07 2007-08 2008-09 2009-10 2010-11 2011-12 2012-13 2013-14 2014-15
Agriculture ManufactureConstruction Trade Hotels RestaurantsTransport, Storage,Communication
(Contd Table …)

30
Sectors/Sub-Sectors
2004-05
2005-06
2006-07
2007-08
2008-09
2009-10
2010-11
2011-12
2012-13
2013-14
2014-15
Industry of which
31.65 31.68 31.20 30.53 28.35 30.94 31.54 30.57 30.19 29.02 28.04
Manufacture 19.83 20.03 20.65 19.57 18.31 21.35 21.20 20.02 19.58 19.08 18.25
Mining and Quarry
0.75 0.62 0.56 0.54 0.50 0.49 0.45 0.47 0.49 0.48 0.48
Construction 8.97 9.15 8.30 9.27 9.26 8.79 9.52 9.68 9.16 8.64 8.52
Elec., Gas, Water supply
2.10 1.88 1.69 1.15 0.28 0.31 0.38 0.40 0.97 0.82 0.79
Services of which
57.23 57.26 57.94 59.68 62.58 60.36 60.19 60.96 62.53 63.70 64.84
Trade, Hotels and Restaurants
17.06 17.41 18.22 17.91 17.60 16.60 16.61 16.66 16.56 16.56 16.62
Transport, Storage, Communication
9.27 9.14 9.01 9.29 10.17 10.45 10.54 10.56 10.66 10.60 10.45
Real Estate, Ownership Dwellings
10.50 10.61 10.73 11.80 12.69 12.23 11.90 12.65 13.79 14.78 16.05
Banking and Insurance
7.24 7.47 7.72 8.52 8.90 8.27 8.38 8.57 9.33 9.80 9.85
Public administration
4.23 3.84 3.75 3.57 4.22 3.83 3.68 3.46 3.20 3.15 3.05
Tamil Nadu
Other Services 8.93 8.79 8.50 8.60 9.00 8.98 9.07 9.08 8.99 8.80 8.81
GSDP 100 100 100 100 100 100 100 100 100 100 100
India
Agriculture and Allied of which
19.03 18.27 17.37 16.81 15.77 14.64 14.59 14.37 17.72 17.22 16.11
Agriculture 16.04 15.46 14.69 14.29 13.36 12.35 12.42 12.26 0.00 0.00 0.00
Industry of which
27.93 27.99 28.65 28.74 28.13 28.27 27.92 28.22 32.32 31.68 31.37
Manufacture 15.25 15.34 16.00 16.14 15.78 16.17 16.17 16.28 18.31 18.08 18.08
Mining and Quarrying
2.86 2.65 2.60 2.46 2.36 2.30 2.25 2.11 3.05 3.01 2.88
Construction 7.70 7.93 7.99 8.10 7.99 7.85 7.62 7.91 8.61 8.28 8.09
Services of which
53.05 53.74 53.98 54.45 56.11 57.09 57.48 57.42 49.96 51.09 52.52
Trade, Hotel, Restaurants, Transp. Storage, Comm.
24.49 25.07 25.53 25.91 26.09 26.53 27.33 26.72 18.01 18.76 19.38
Finance, Real Estate Etc.
14.71 15.13 15.74 16.12 16.92 17.09 17.27 18.02 19.48 19.71 20.51
Public Adm, Def. and Others
13.84 13.54 12.70 12.42 13.09 13.47 12.89 12.68 12.47 12.62 12.63
GDPfc 100 100 100 100 100 100 100 100 100 100 100 Source (Basic Data): Central Statistical Organization, Government of India.
(Contd Table …)
31
During 2004-05 to 2014-15, the share of industry declined marginally from 31.6
percent to 28 percent and the contribution of services sector increased from 57.2 percent
to 64.84 percent. At all India level too, the share agriculture and allied sector in GDP
factor cost declined from 19 percent in 2004-05 to 16.11 percent in 2014-15. The share
of industrial sector increased slightly from 27.9 percent to 31.37 percent while the share
of services remained the same (i.e., about 53 percent).
The continuous fall of agriculture share is a concern given the fact that growth of
this sector is vital for food security in the state. Given limited availability of critical inputs
of this sector, land and irrigation it is essential to concentrate on productivity, efficiency
and technological progress for ensuring high growth of output of this sector.
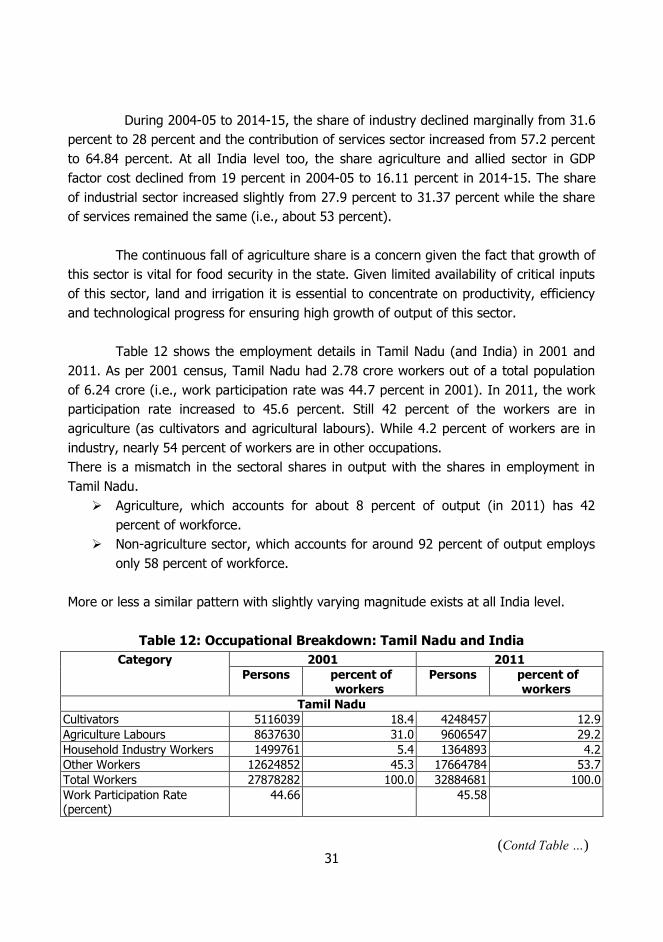
Table 12 shows the employment details in Tamil Nadu (and India) in 2001 and
2011. As per 2001 census, Tamil Nadu had 2.78 crore workers out of a total population
of 6.24 crore (i.e., work participation rate was 44.7 percent in 2001). In 2011, the work
participation rate increased to 45.6 percent. Still 42 percent of the workers are in
agriculture (as cultivators and agricultural labours). While 4.2 percent of workers are in
industry, nearly 54 percent of workers are in other occupations.
There is a mismatch in the sectoral shares in output with the shares in employment in
Tamil Nadu.
Agriculture, which accounts for about 8 percent of output (in 2011) has 42
percent of workforce.
Non-agriculture sector, which accounts for around 92 percent of output employs
only 58 percent of workforce.
More or less a similar pattern with slightly varying magnitude exists at all India level.
Table 12: Occupational Breakdown: Tamil Nadu and India
Category 2001 2011
Persons percent of workers
Persons percent of workers
Tamil Nadu
Cultivators 5116039 18.4 4248457 12.9
Agriculture Labours 8637630 31.0 9606547 29.2
Household Industry Workers 1499761 5.4 1364893 4.2
Other Workers 12624852 45.3 17664784 53.7
Total Workers 27878282 100.0 32884681 100.0
Work Participation Rate (percent)
44.66 45.58
(Contd Table …)

32
Category 2001 2011
Persons percent of workers
Persons percent of workers
Population 62425679 72147030
Non Workers 34547397 55.34164394 39262349
percent of Non Workers 55.34 percent
54.42 percent
India
Cultivators 127312851 31.7 118692640 24.6
Agriculture Labours 106775330 26.5 144329833 30.0
Household Industry Workers 16956942 4.2 18336307 3.8
Other Workers 151189601 37.6 200384531 41.6
Total Workers 402234724 100.0 481743311 100.0
Work Participation Rate (percent)
39.10 percent
39.80 percent
Population 1028610115 1210569573
Non Workers 626375391 728826262
percent of Non Workers 60.90 percent
60.20 percent
Source: Census of India, 2001 and 2011.
Concluding Remarks
This Chapter has reviewed the sectoral growth patterns and their contributions to the
overall GSDP growth. The overall GSDP growth in Tamil Nadu declined to about 6 percent
during the last three years (2012-13 to 2014-15) as compared its growth of about 9
percent in the 11th Plan period. However, this fall in GSDP growth of Tamil Nadu is
consistent with the GDP growth of India, which also came down from about 8 percent to
6 percent. The fall in GSDP growth of Tamil Nadu in recent years was mainly due to fall
in the contributions of 5 sub sectors-manufacturing, agriculture and allied, transport,
storage and communications, trade, hotels and restaurants and construction sector. They
jointly contributed more than 75 percent of the overall GSDP growth in Tamil Nadu in
2009-10. But their joint contribution was -0.66 percent of overall GSDP growth in 2012-
13.
While the general economic slowdown in the country and across the world
affected the growth of major sectors which in turn affected the over all growth in 2012-
13, the following sector specific factors which aggravated the problem may also be
noticed as: (i) bad monsoon affected agriculture; (ii) rising oil prices and power shortage
affected the manufacturing; (iii) fall in manufacturing output and economic slow down
affected the transport, storage and communication sector, trade, hotels and restaurants,
and other services sectors in Tamil Nadu (due to inter sectoral linkages).
(Contd Table …)
33
Chapter 4
REGIONAL GROWTH PERFORMANCE IN TAMIL NADU
In Chapter 2, we have seen substantial differences in economic performances of various
Indian states. This suggests that there could be substantial differences in economic
performances across regions within a state like Tamil Nadu. Therefore, in this Chapter,
we look at spatial aspects of growth in terms of inter-district growth, and relative
contribution of districts growth to over all growth of the state of Tamil Nadu. For this
purpose, the overall GSDP is divided into agriculture and allied activities, industry and
services and all 32 districts in Tamil Nadu are considered. Due to the non- availability of
district level data for recent years, the analysis is restricted to cover the period: 2004-05
to 2011-12.
Special Economic Concentration
Table 13 shows 8-year average (2004-05 to 2011-12) share of districts in total GSDP of
Tamil Nadu. Top three districts in terms of share in GSDP are: Chennai (7.9 percent),
Thiruvallur (6.2 percent) and Kancheepuram (6.2 percent). These top 3 districts along
with the following 7 districts contribute nearly 53 percent of total GSDP produced in the
state: Coimbatore, Vellore, Salem, Trichy, Thiruppur, Madurai and Erode. The poor three
districts in terms of their share in GSDP are: Perambalur, Ariyalur and The Nilgiris. They
jointly contribute only 1.68 percent of total GSDP generated in Tamil Nadu.

34
Table 13: District-wise Shares in GSDP: 2004-05 to 2011-12
Districts
8-Year Average Contribution in Overall GSDP of Tamil Nadu
(percent)
Share of Sectors in Total GDDP (8-year average) in
percent
Agriculture and
Allied
Indu-stry
Services GDDP Agriculture and
Allied
Indu-stry
Services
Chennai 0.94 4.03 11.02 7.92 1.12 15.67 83.21
Kancheepuram 2.39 7.18 6.24 6.17 3.66 35.83 60.52
Thiruvallur 2.54 7.33 6.15 6.17 3.88 36.53 59.59
Vellore 4.19 6.50 5.27 5.55 7.13 36.04 56.82
Thiruvannamalai 3.91 1.93 2.01 2.16 17.08 27.44 55.49
Cuddalore 4.20 2.68 3.17 3.11 12.73 26.48 60.79
Villupuram 5.20 1.87 2.55 2.59 18.95 22.26 58.79
Thanjavur 3.85 1.44 3.04 2.63 13.82 16.88 69.30
Nagapattinam 2.86 1.37 1.50 1.59 17.05 26.59 56.36
Thiruvarur 2.23 0.44 1.10 1.01 20.96 13.32 65.72
Salem 4.43 5.25 4.32 4.62 9.07 35.00 55.93
Namakkal 5.90 2.88 2.37 2.86 19.46 30.98 49.56
Dharmapuri 3.53 1.28 1.84 1.82 18.28 21.53 60.19
Krishnagiri 2.86 2.65 2.46 2.56 10.56 31.85 57.59
The Nilgris 2.07 0.53 1.08 1.00 19.53 16.16 64.31
Thiruchirappalli 3.21 3.06 5.19 4.34 6.97 21.65 71.38
Karur 1.65 1.64 1.61 1.62 9.58 31.10 59.32
Perambalur 0.95 0.15 0.26 0.29 31.00 16.16 52.83
Ariyalur 1.13 0.25 0.34 0.39 27.56 19.59 52.85
Pudukkotai 2.78 1.31 1.59 1.62 16.26 24.98 58.77
Coimbatore 3.56 7.79 5.46 6.00 5.60 39.95 54.45
Thiruppur 3.26 5.55 3.78 4.27 7.21 39.96 52.83
Erode 6.33 4.54 3.62 4.16 14.38 33.60 52.02
Madurai 2.47 3.46 4.87 4.21 5.53 25.28 69.18
Theni 3.01 0.56 1.14 1.14 24.93 15.23 59.84
Dindigul 4.55 2.52 2.51 2.70 15.88 28.63 55.49
Ramanathapuram 2.52 0.97 1.34 1.34 17.78 22.41 59.81
Sivagangai 1.51 1.06 1.53 1.38 10.31 23.62 66.07
Virudhunagar 2.03 6.50 2.79 3.86 4.97 51.78 43.25
Thirunelveli 3.94 5.10 3.97 4.32 8.61 36.34 55.05
Thoothukudi 3.30 2.67 3.18 3.03 10.27 27.09 62.64
Kanniyakumari 2.73 5.50 2.72 3.58 7.20 47.28 45.52
Tamil Nadu 100 100 100 100 9.44 30.76 59.79

35
Top 3 districts in terms of their share in GSDP agriculture are: Erode (6.33
percent), Namakkal (5.9 percent) and Villupuram (5.2 percent) and bottom 3 in their
contribution to GSDP agriculture of Tamil Nadu are: Perambalur, Chennai and Ariyalur. It
is noted that in both Perambalur and Ariyalur, nearly 30 percent of their GSDP comes
from agriculture. Still they contribute less to state agriculture GSDP.
Coimbatore ranks first in terms of share in Industrial GSDP (7.79 percent),
followed by Thiruvallur (7.33 percent) and Kancheepuram (7.18 percent). Poorer districts
with lowest industrial contributions are: Perambalur (0.15 percent), Ariyalur (0.25
percent) and Thiruvarur (0.44 percent).
About 11 percent of Services GSDP comes from Chennai, followed by Kancheepuram
(6.24 percent) and Thiruvallur (6.15 percent). Perambalur, Ariyalur and The Nilgiris are
the bottom 3 districts in terms of their contribution to Services GSDP.
Table 13 also shows that Perambalur (31 percent), Ariyalur (27.6 percent) and
Theni (25 percent) are the top 3 districts in having the largest share of agriculture and
allied activities in their GDDP. In Virudhunagar nearly 52 percent of GDDP comes from
industry, followed by Kanniyakumari (47.3 percent) and Thiruppur (40 percent). Nearly
83 percent of GDDP comes from service sector in Chennai district. Other top two districts
with larger services share are Thiruchirappalli (71.4 percent) and Thanjavur (69.3
percent).
Index of Concentration
The Herfindahl index is a measure of how concentrated an industry is. An industry with
few competitors will have a high level of concentration, while many competitors will
result in low concentration. This is also known as Herfindahl-Hirschman Index or HHI. As
there are 32 districts in Tamil Nadu, let the sectoral share for each district be given as a1,
a2, . . . a32 and ai is the sectoral share of each district. We also know that the ∑a i=1,
where i=1,2,..,32. The formula for calculating the Herfindahl index is: HHI = ∑ai2. As in
previous Chapter, we calculate the Herfindahl index for various sub sectors for the years
from 2004-05 to 2011-12:
1. Agriculture and Allied
2. Mining and Quarrying
3. Manufacturing
4. Construction
5. Electricity, Gas and Water Supply
6. Storage

36
7. Communication
8. Transport, Hotels and Restaurants
9. Banking and Insurance
10. Real Estate, and Ownership Dwellings
11. Public Administration
12. Other Services
As we calculate the Herfindahl index for each sector in Tamil Nadu, these indices
are useful to find out which sector is concentrated more in the state.
A HHI index below 0.01 indicates a highly competitive index.
A HHI index below 0.1 indicates an unconcentrated index.
A HHI index between 0.1 to 0.18 indicates moderate concentration.
A HHI index above 0.18 indicates high concentration.
Table 14 provides the HHIs for various sectors for the years 2004-05 to 2011-12.
Mining and Quarrying sector is highly concentrated in Tamil Nadu and there is not much
competition in that sector. All other sectors such as the Manufacturing, Electricity and
Water supply and the service sector are not much concentrated. The Agriculture sector is
also less concentrated and there is much competition in this sector. From this we can see
that majority of the people in the state depend on agriculture, other services and trade,
hotels and restaurants for their livelihood. Thus, mining and quarrying is the only one
high spatial concentrated economic sector in the state and all other sectors are relatively
better spatially spread out.
Table 14: Concentration of Economic Activity Measured by Herfindahl Index:
District-wise Sector Wise Analysis
Sectors 2004-05
2005-06
2006-07
2007-08
2008—09
2009-10
2010-11
2011-12
Agriculture and Allied 0.038 0.038 0.038 0.040 0.039 0.040 0.040 0.039
Industry 0.046 0.047 0.047 0.047 0.048 0.050 0.050 0.050
Mining and Quarrying 0.382 0.360 0.351 0.354 0.355 0.330 0.342 0.344
Manufacture 0.053 0.055 0.054 0.056 0.057 0.059 0.060 0.061
Electricity, Gas and
Water Supply
0.048 0.048 0.049 0.049 0.049 0.049 0.050 0.050
Construction 0.045 0.046 0.047 0.048 0.049 0.050 0.052 0.053
Services 0.047 0.047 0.046 0.046 0.046 0.046 0.046 0.046
Trade, Hotel, Restaurants
0.044 0.044 0.044 0.044 0.044 0.044 0.044 0.044
Storage 0.052 0.053 0.052 0.056 0.058 0.058 0.061 0.065
(Contd Table …)

37
Sectors 2004-
05
2005-
06
2006-
07
2007-
08
2008—
09
2009-
10
2010-
11
2011-
12
Communication 0.050 0.049 0.049 0.049 0.049 0.049 0.049 0.049
Banking and Insurance 0.051 0.051 0.050 0.049 0.049 0.048 0.048 0.047
Real Estate, Ownership etc
0.051 0.053 0.054 0.054 0.055 0.057 0.058 0.061
Public Administration 0.044 0.045 0.045 0.045 0.045 0.046 0.046 0.046
Other Services 0.043 0.043 0.043 0.043 0.042 0.042 0.042 0.042
Inter District Growth Profile
Table 15 provides a profile of sectoral growth rates and the overall GDDP growth for all
districts during 2005-06 to 2011-12. All figures relate to the GDDP at 2004-05 prices. For
the purpose of this analysis, we have divided GDDP in each district into three major
sectors: (i) Agriculture and Allied Services, (ii) Industry and (iii) Services.
The overall GSDP of Tamil Nadu grew at an average rate of 10.3 percent during
2-005-06 to 2011-12. Kancheepuram (14.7 percent) registered the highest average GDDP
growth, followed by Krishanagiri (14.38 percent) and Thiruvallur (12.75 percent).
Namakkal, Dharmapuri, Thiruchirappalli, Karur, Coimbatore, Sivagangai, Virudhunagar
and Kanniyakumari also recorded a double-digit growth rate. The districts that registered
the low average GDDP growth were: Ariyalur (5.61 percent), Theni (5.87 percent), and
Perambalur (6.95 percent).
Agriculture and allied sector recorded an average growth rate of 6.22 in Tamil
Nadu during 2005-06 to 2011-12. The top 3 districts in terms of high growth of
agriculture and allied sector were: Coimbatore (20.42 percent), Nagapattinam (18.02
percent), and Thiruvarur (17.33 percent). Thiruppur also registered a double-digit growth
(16.71 percent). The bottom 3 districts with relatively low growth of agriculture sector
were: Cuddalore (-1.16 percent), The Nilgiris (1.87 percent) and Kanniyakumari (2.79
percent).
The industrial growth was 9.95 percent in the state. Top 3 districts with the
highest growth of this sector were: Kancheepuram (18.02 percent), Kanniyakumari
(13.95 percent) and Krishnagiri (12.99 percent). Other districts recorded a double-digit
growth were: Karur, Vellore, Thiruvallur, Thiruvannamalai, Dindigul, Madurai, Coimbatore
and Thiruppur. The bottom 3 districts with low industrial growth were: The Nilgiris (1.72
percent), Chennai (2.56 percent) and Theni (2.68 percent).
(Contd Table …)

38
Table 15: 7 Year Average Annual Growth of GDDP and Major Sectors of Districts in Tamil Nadu (2005-06 to 2011-12) in 2004-05 prices
The services sector of Tamil Nadu grew at 11.28 percent. The highest growth of
services was recorded in Krishnagiri (16.51 percent), Dharmapuri (14.74 percent) and
Thiruvallur (14.38 percent). The bottom 3 districts having low services sector growth
were: Ariyalur (5.96 percent), Perambalur (7.02 percent) and Theni (7.18).
Districts Agri. and Allied
RA NK
Indu- stry
RA NK
Ser- vices
RA NK
GDDP RA NK
Chennai 2.88 28 2.56 31 8.66 28 7.52 27
Kancheepuram 4.30 23 18.02 1 13.68 4 14.70 1
Thiruvallur 2.89 27 11.93 6 14.38 3 12.75 3
Vellore 6.24 18 10.74 9 11.87 9 10.92 8
Thiruvannamalai 7.10 15 10.74 8 10.62 19 9.93 15
Cuddalore -1.16 32 7.19 24 13.05 5 9.25 18
Villupuram 3.82 25 10.50 12 10.10 23 8.87 23
Thanjavur 6.71 16 7.70 22 10.54 20 9.34 17
Nagapattinam 18.02 2 4.62 27 8.78 27 8.33 25
Thiruvarur 17.33 3 4.12 29 8.16 29 8.52 24
Salem 7.99 12 7.44 23 11.16 13 9.44 16
Namakkal 9.01 7 8.46 21 11.75 11 10.07 13
Dharmapuri 8.17 11 9.79 17 14.74 2 12.32 6
Krishnagiri 8.91 8 12.99 3 16.51 1 14.38 2
The Nilgris 1.87 31 1.72 32 11.13 14 7.44 29
Thiruchirappalli 4.51 22 11.00 7 12.98 6 11.84 7
Karur 8.52 10 10.29 13 11.94 8 10.86 10
Perambalur 8.66 9 6.78 26 7.02 31 6.95 30
Ariyalur 7.40 14 4.18 28 5.96 32 5.61 32
Pudukkotai 6.44 17 8.78 19 10.43 21 9.02 22
Coimbatore 20.42 1 10.71 10 11.39 12 10.88 9
Thiruppur 16.71 4 12.47 4 11.85 10 12.32 5
Erode 9.25 5 8.48 20 10.19 22 9.16 20
Madurai 3.66 26 12.26 5 10.94 16 10.42 11
Theni 6.00 19 2.68 30 7.18 30 5.87 31
Dindigul 4.83 21 10.71 11 9.61 24 9.06 21
Ramanathapuram 2.88 29 9.86 15 9.13 26 7.50 28
Sivagangai 7.77 13 9.82 16 11.07 15 10.13 12
Virudhunagar 9.07 6 9.88 14 10.85 17 10.06 14
Thirunelveli 4.11 24 9.14 18 10.62 18 9.19 19
Thoothukudi 5.50 20 6.85 25 9.39 25 8.07 26
Kanniyakumari 2.79 30 13.95 2 12.39 7 12.35 4
Tamil Nadu 6.22 9.95 11.28 10.30

39
Relative Contribution of Regional Growth to Aggregate Growth
In this Section, we look at the relative contribution of the regional (district) growth rates
to overall growth rate by decomposing growth as a weighted sum of regional growth
rates with weights being equal to the respective shares of the district in the overall GSDP.
The weights change every year as explained in previous Chapter. There are 32
regions/districts in Tamil Nadu.
The growth decomposition results in Table 16 shows that Thiruvallur district contributed
1.07 percent in the total GSDP growth of 13.96 percent in 2005-06, followed by
Thirunelveli (0.95 percent), and Chennai and Coimbatore each contributing 0.85 percent.
Thus these 4 districts contributed 3.72 percent in the 13.96 percent growth of GSDP (i.e.,
they jointly contributed 25.84 percent of total GSDP growth). But in the initial 2 years of
11th Plan (2007-08 and 2008-09), they jointly contributed only 2.15 percent and 0.94
percent growth in the over all growth of 6.13 percent and 5.45 percent in those years.
These four districts along with the following nine districts contributed more than 60
percent of GSDP growth in all years: (i) Kancheepuram, (ii) Vellore, (iii) Salem, (iv)
Kanniyakumari, (v) Thiruchirappalli, (vi) Erode, (vii) Virudhunagar, (viii) Madurai, and (ix)
Thiruppur (Table 17).
Table 16: Contributions of Regional Growths to GSDP Growth of Tamil Nadu
(Percent)
Districts 2005-06 2006-07 2007-08 2008-09 2009-10 2010-11 2011-12
Chennai 0.85 1.10 0.47 0.39 0.36 0.79 0.33
Kancheepuram 0.76 1.05 0.39 0.91 0.85 1.28 0.83
Thiruvallur 1.07 0.89 0.55 0.43 1.19 0.72 0.50
Vellore 0.70 0.90 0.39 0.26 0.74 0.77 0.43
Thiruvannamalai 0.29 0.25 0.23 0.08 0.14 0.30 0.20
Cuddalore 0.23 0.53 0.18 0.13 0.33 0.40 0.22
Villupuram 0.28 0.33 0.19 0.13 0.23 0.28 0.18
Thanjavur 0.36 0.39 0.14 0.15 0.13 0.33 0.24
Nagapattinam 0.22 0.38 -0.11 0.06 0.17 0.10 0.12
Thiruvarur 0.11 0.23 -0.01 0.01 0.08 0.02 0.15
Salem 0.65 0.68 0.30 0.24 0.31 0.59 0.30
Namakkal 0.38 0.56 0.19 0.12 0.31 0.31 0.15
Dharmapuri 0.28 0.30 0.19 0.10 0.16 0.31 0.20
Krishnagiri 0.45 0.37 0.20 0.22 0.44 0.49 0.29
The Nilgris 0.05 0.12 0.06 0.07 0.08 0.10 0.05
Thiruchirappalli 0.63 0.65 0.36 0.44 0.59 0.52 0.34
Karur 0.20 0.32 0.02 0.16 0.22 0.16 0.14
(Contd Table …)

40
Districts 2005-06 2006-07 2007-08 2008-09 2009-10 2010-11 2011-12
Perambalur 0.01 0.03 0.00 0.01 0.01 0.03 0.05
Ariyalur 0.05 0.04 -0.01 0.04 0.01 0.01 0.02
Pudukkotai 0.26 0.17 0.09 0.06 0.17 0.16 0.14
Coimbatore 0.85 0.91 0.62 0.22 0.72 0.96 0.26
Thiruppur 0.59 0.65 0.44 0.23 0.70 0.70 0.29
Erode 0.62 0.57 0.41 -0.21 0.30 0.71 0.27
Madurai 0.60 1.09 -0.20 0.28 0.41 0.55 0.30
Theni 0.13 0.09 0.02 0.05 0.09 0.06 0.05
Dindigul 0.28 0.40 0.11 0.18 0.25 0.35 0.16
Ramanathapuram 0.16 0.30 -0.07 0.06 0.04 0.14 0.09
Sivagangai 0.26 0.08 0.09 0.11 0.11 0.19 0.13
Virudhunagar 0.61 0.68 -0.05 0.13 0.61 0.51 0.23
Thirunelveli 0.95 0.25 0.51 0.00 0.38 0.47 0.24
Thoothukudi 0.44 0.47 0.01 0.13 0.27 0.24 0.20
Kanniyakumari 0.64 0.43 0.41 0.26 0.40 0.59 0.30
Tamil Nadu 13.96 15.21 6.13 5.45 10.83 13.12 7.39
It is noticed that relative contributions of Chennai, Thiruchirappalli and Thanjavur
districts with higher share of services sector declined significantly in the recession years
2007-08 and 2008-09. Similarly, the relative contributions of districts with higher share of
industries like Virudhunagar, Coimbatore and Kanniyakumari also declined dramatically in
those recession years.
Table 17: Percentage Contribution of Districts to GSDP Growth
Districts 2005-06 2006-07 2007-08 2008-09 2009-10 2010-11 2011-12
Thiruvallur 7.64 5.84 8.95 7.93 11.01 5.49 6.71
Thirunelveli 6.80 1.64 8.35 0.05 3.51 3.58 3.26
Chennai 6.06 7.26 7.69 7.18 3.37 6.05 4.45
Coimbatore 6.06 5.95 10.06 4.00 6.63 7.29 3.50
Kancheepuram 5.47 6.91 6.33 16.63 7.82 9.77 11.23
Vellore 5.05 5.94 6.31 4.81 6.85 5.88 5.86
Salem 4.69 4.47 4.92 4.44 2.84 4.52 4.07
Kanniyakumari 4.56 2.81 6.75 4.70 3.66 4.49 4.07
Thiruchirappalli 4.52 4.26 5.92 7.98 5.49 3.98 4.63
Erode 4.42 3.73 6.71 -3.91 2.77 5.41 3.64
Virudhunagar 4.34 4.46 -0.75 2.44 5.62 3.85 3.17
Madurai 4.27 7.16 -3.29 5.09 3.82 4.21 4.08
Thiruppur 4.23 4.24 7.17 4.24 6.45 5.31 3.95
Contribution of Top 13 Dts.
68.09 64.68 75.12 65.57 69.85 69.83 62.61
Krishnagiri 3.20 2.46 3.28 4.09 4.10 3.74 3.93
(Contd Table …)
(Contd Table …)

41
Districts 2005-06 2006-07 2007-08 2008-09 2009-10 2010-11 2011-12
Thoothukudi 3.14 3.10 0.17 2.35 2.51 1.86 2.68
Namakkal 2.73 3.70 3.04 2.12 2.91 2.35 2.00
Thanjavur 2.59 2.57 2.30 2.72 1.18 2.49 3.22
Thiruvannamalai 2.11 1.65 3.74 1.50 1.32 2.30 2.73
Villupuram 2.04 2.19 3.15 2.47 2.11 2.11 2.42
Dharmapuri 2.02 1.97 3.04 1.83 1.51 2.33 2.69
Dindigul 1.97 2.62 1.73 3.39 2.35 2.66 2.21
Contribution of 8 Middle Dt.
19.79 20.26 20.45 20.46 17.99 19.84 21.89
Sivagangai 1.89 0.51 1.52 2.03 1.04 1.48 1.72
Pudukkotai 1.86 1.09 1.42 1.10 1.53 1.18 1.94
Cuddalore 1.63 3.51 2.95 2.43 3.05 3.02 2.96
Nagapattinam 1.57 2.49 -1.77 1.05 1.60 0.73 1.62
Karur 1.43 2.11 0.34 2.90 2.03 1.21 1.92
Ramanathapuram 1.15 1.97 -1.12 1.18 0.32 1.04 1.18
Theni 0.92 0.61 0.37 0.93 0.86 0.45 0.63
Thiruvarur 0.82 1.50 -0.14 0.26 0.76 0.16 1.98
The Nilgris 0.39 0.77 1.04 1.24 0.79 0.75 0.62
Ariyalur 0.34 0.27 -0.20 0.67 0.10 0.10 0.32
Perambalur 0.11 0.22 0.02 0.18 0.07 0.20 0.63
Contribution of Poor 11 Dts
12.12 15.06 4.43 13.96 12.16 10.33 15.50
Tamil Nadu 100.0 100.0 100.0 100.0 100.0 100.0 100.0
The joint contributions of the following 11 districts: Sivagangai, Pudukkottai,
Cuddalore, Nagapatiinam, Karur, Ramanathapuram, Theni, Thiruvarur, The Nilgiris,
Ariyalur, and Perambalur ranged between 4.43-15.5 percent of the growth of GSDP of
Tamil Nadu during 2005-06 to 2011-12. These districts need special attention.
Concluding Remarks
This Chapter has reviewed the regional growth pattern and the contributions of various
regions to the overall GSDP growth. The analysis is restricted to cover the period 2004-05
to 2011-12 due to unavailability of the regional level data for recent years. While
Chennai, Thiruvallur, and Kancheepuram are top 3 districts, jointly contributing about 20
percent of total GSDP produced in the state, the poorer districts-Perambalur, Ariyalur
and The Nilgiris jointly contributed only 1.68 percent. Erode, Namakkal and Villupuram
were the top 3 in terms of higher contribution to GSDP agriculture of Tamil Nadu.
Coimbatore, Thiruvallur and Kancheepuram jointly accounted for about 22 percent of
Industry GSDP of the state while Chennai, Kancheepuram and Thiruvallur jointly
accounted for about 23.4 percent of total services GSDP of the Tamil Nadu.
(Contd Table …)

42
Bottom 3 districts in terms of low contribution to (i) GSDP agriculture of the State
are: Perambalur, Chennai and Ariyalur; (ii) GSDP industry are Perambalur, Ariyalur and
Thiruvarur; and (iii) GSDP services are: Perambalur, Ariyalur and The Nilgiris. It was
observed that in the poorer districts like Perambalur (31.1 percent), Ariyalur (27.6
percent) and Theni (24.9 percent), the share of agriculture and allied activities was the
highest in their respective GDDP.
Kancheepuram (14.7 percent), Krishnagiri (13.4 percent), and Thiruvallur (12.7
percent) are top 3 districts in high average GDDP growth. Top 3 in terms of high
average industrial growth were: Kancheepuram (18 percent), Kanniyakumari (14 percent)
and Thiruvallur. Top 3 in high services sector growth were: Krishanagiri (16.5 percent),
Dharmapuri (14.7 percent) and Thruvallur (14.4 percent). Coimbatore (20 percent),
Namakkal (18 percent), and Thiruvarur (12 percent) were the top 3 in high agriculture
growth.
The growth decomposition analysis indicate that the following 11 districts:
Sivagangai, t, Cuddalore, Nagapatiinam, Karur, Ramanathapuram, Theni, Thiruvarur, The
Nilgiris, Ariyalur, and Perambalur jointed contributed only about 12 percent (4.43
percent) of the growth of GSDP of Tamil Nadu in 2009-10 (in 2007-08). These districts
need special attention.

43
Chapter 5
DETERMINANTS OF ECONOMIC GROWTH
In the previous Chapter, we have seen that there are substantial differences in economic
performance across districts in Tamil Nadu. This suggests that many of the essential
determinants of economic performance are to be found at the regional level. Therefore,
in this Chapter, an attempt is made to identify the determinants of economic growth in
Tamil Nadu. Specifically we relate the per capita income growth of the districts of Tamil
Nadu with various factors like share of agriculture, share of industry, share of services,
initial per capita income, etc.
Per Capita Income Growth: Inter-District Profile
There are 32 districts in Tamil Nadu (see Chart 13). Kanniyakumari (Rs. 96070) and
Kancheepuram (Rs. 92713) ranked first and second in per capita (Gross District Domestic
Product) income (real) in 2011-12 (this is the latest year for which the district wise
income data are available). Thiruvallur (Rs. 88549) obtained third rank. Ariyalur (Rs.
19467), Perambalur (Rs. 24256), and Villupuram (Rs. 34727) districts were the poorest,
occupying the last three ranks.
Chart 13: Per Capita Income (2004-05 prices) of Districts in Tamil Nadu in
2011-12
It is noted that the per capita income of the top ranked (Kanniyakumari) district
is about 4.94 times larger than that of the poorest (Ariyalur) district (i.e., the latter is
only 20.26 per cent of the former). The per capita income of the state was about Rs.
63996 in 2011-12. In 18 districts (out of 32), the per capita income was below the per
capita income of the state (Chart 13).
9607
0
9271
3
8854
9
8736
1
8359
4
7797
5
7567
0
7539
3
7493
3
7179
5
6931
8
6821
3
6725
8
6624
0
6399
6
6318
5
6189
9
5862
3
5637
6
5631
5
5626
2
5173
8
5046
6
4828
4
4470
7
4389
0
4156
9
4120
8
3985
6
3529
5
3472
7
2425
6
1946
7
0
20000
40000
60000
80000
100000
120000
Kann
iyaku
mari
Kanc
heep
uram
Thiru
ppur
Virud
huna
gar
Thiru
vallur
Coim
bator
e
Erode
Thiru
chira
ppall
i
Thoo
thuku
di
Karur
Krishn
agiri
Nama
kkal
Madu
rai
Chen
nai
Tami
l Nad
u
Vello
re
Thiru
nelve
li
Salem
Dindig
ul
Cudd
alore
Dharm
apuri
The N
ilgris
Sivag
anga
i
Than
javur
Rama
natha
puram
Pudu
kkota
i
Thiru
vann
amala
i
Naga
pattin
am Then
i
Villup
uram
Thiru
varu
r
Peram
balur
Ariya
lur
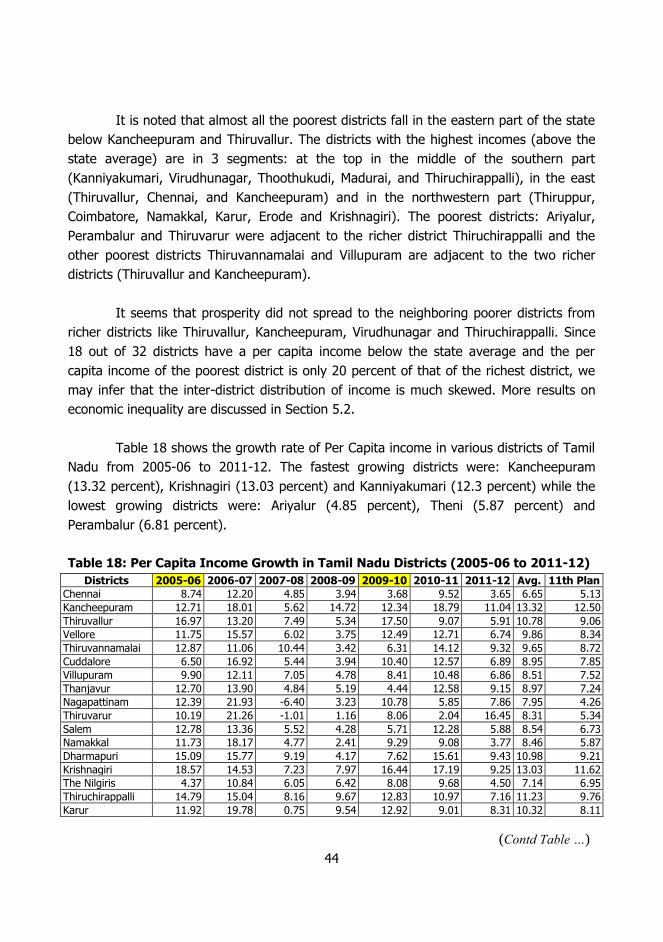
44
It is noted that almost all the poorest districts fall in the eastern part of the state
below Kancheepuram and Thiruvallur. The districts with the highest incomes (above the
state average) are in 3 segments: at the top in the middle of the southern part
(Kanniyakumari, Virudhunagar, Thoothukudi, Madurai, and Thiruchirappalli), in the east
(Thiruvallur, Chennai, and Kancheepuram) and in the northwestern part (Thiruppur,
Coimbatore, Namakkal, Karur, Erode and Krishnagiri). The poorest districts: Ariyalur,
Perambalur and Thiruvarur were adjacent to the richer district Thiruchirappalli and the
other poorest districts Thiruvannamalai and Villupuram are adjacent to the two richer
districts (Thiruvallur and Kancheepuram).
It seems that prosperity did not spread to the neighboring poorer districts from
richer districts like Thiruvallur, Kancheepuram, Virudhunagar and Thiruchirappalli. Since
18 out of 32 districts have a per capita income below the state average and the per
capita income of the poorest district is only 20 percent of that of the richest district, we
may infer that the inter-district distribution of income is much skewed. More results on
economic inequality are discussed in Section 5.2.
Table 18 shows the growth rate of Per Capita income in various districts of Tamil
Nadu from 2005-06 to 2011-12. The fastest growing districts were: Kancheepuram
(13.32 percent), Krishnagiri (13.03 percent) and Kanniyakumari (12.3 percent) while the
lowest growing districts were: Ariyalur (4.85 percent), Theni (5.87 percent) and
Perambalur (6.81 percent).
Table 18: Per Capita Income Growth in Tamil Nadu Districts (2005-06 to 2011-12)
Districts 2005-06 2006-07 2007-08 2008-09 2009-10 2010-11 2011-12 Avg. 11th Plan
Chennai 8.74 12.20 4.85 3.94 3.68 9.52 3.65 6.65 5.13
Kancheepuram 12.71 18.01 5.62 14.72 12.34 18.79 11.04 13.32 12.50
Thiruvallur 16.97 13.20 7.49 5.34 17.50 9.07 5.91 10.78 9.06
Vellore 11.75 15.57 6.02 3.75 12.49 12.71 6.74 9.86 8.34
Thiruvannamalai 12.87 11.06 10.44 3.42 6.31 14.12 9.32 9.65 8.72
Cuddalore 6.50 16.92 5.44 3.94 10.40 12.57 6.89 8.95 7.85
Villupuram 9.90 12.11 7.05 4.78 8.41 10.48 6.86 8.51 7.52
Thanjavur 12.70 13.90 4.84 5.19 4.44 12.58 9.15 8.97 7.24
Nagapattinam 12.39 21.93 -6.40 3.23 10.78 5.85 7.86 7.95 4.26
Thiruvarur 10.19 21.26 -1.01 1.16 8.06 2.04 16.45 8.31 5.34
Salem 12.78 13.36 5.52 4.28 5.71 12.28 5.88 8.54 6.73
Namakkal 11.73 18.17 4.77 2.41 9.29 9.08 3.77 8.46 5.87
Dharmapuri 15.09 15.77 9.19 4.17 7.62 15.61 9.43 10.98 9.21
Krishnagiri 18.57 14.53 7.23 7.97 16.44 17.19 9.25 13.03 11.62
The Nilgiris 4.37 10.84 6.05 6.42 8.08 9.68 4.50 7.14 6.95
Thiruchirappalli 14.79 15.04 8.16 9.67 12.83 10.97 7.16 11.23 9.76
Karur 11.92 19.78 0.75 9.54 12.92 9.01 8.31 10.32 8.11
(Contd Table …)
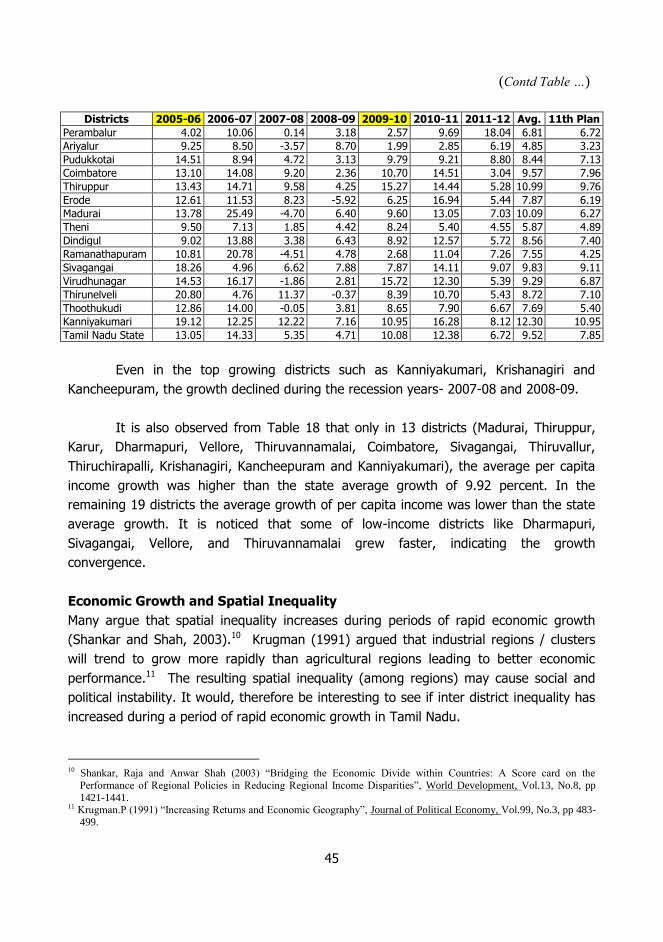
45
Districts 2005-06 2006-07 2007-08 2008-09 2009-10 2010-11 2011-12 Avg. 11th Plan
Perambalur 4.02 10.06 0.14 3.18 2.57 9.69 18.04 6.81 6.72
Ariyalur 9.25 8.50 -3.57 8.70 1.99 2.85 6.19 4.85 3.23
Pudukkotai 14.51 8.94 4.72 3.13 9.79 9.21 8.80 8.44 7.13
Coimbatore 13.10 14.08 9.20 2.36 10.70 14.51 3.04 9.57 7.96
Thiruppur 13.43 14.71 9.58 4.25 15.27 14.44 5.28 10.99 9.76
Erode 12.61 11.53 8.23 -5.92 6.25 16.94 5.44 7.87 6.19
Madurai 13.78 25.49 -4.70 6.40 9.60 13.05 7.03 10.09 6.27
Theni 9.50 7.13 1.85 4.42 8.24 5.40 4.55 5.87 4.89
Dindigul 9.02 13.88 3.38 6.43 8.92 12.57 5.72 8.56 7.40
Ramanathapuram 10.81 20.78 -4.51 4.78 2.68 11.04 7.26 7.55 4.25
Sivagangai 18.26 4.96 6.62 7.88 7.87 14.11 9.07 9.83 9.11
Virudhunagar 14.53 16.17 -1.86 2.81 15.72 12.30 5.39 9.29 6.87
Thirunelveli 20.80 4.76 11.37 -0.37 8.39 10.70 5.43 8.72 7.10
Thoothukudi 12.86 14.00 -0.05 3.81 8.65 7.90 6.67 7.69 5.40
Kanniyakumari 19.12 12.25 12.22 7.16 10.95 16.28 8.12 12.30 10.95
Tamil Nadu State 13.05 14.33 5.35 4.71 10.08 12.38 6.72 9.52 7.85
Even in the top growing districts such as Kanniyakumari, Krishanagiri and
Kancheepuram, the growth declined during the recession years- 2007-08 and 2008-09.
It is also observed from Table 18 that only in 13 districts (Madurai, Thiruppur,
Karur, Dharmapuri, Vellore, Thiruvannamalai, Coimbatore, Sivagangai, Thiruvallur,
Thiruchirapalli, Krishanagiri, Kancheepuram and Kanniyakumari), the average per capita
income growth was higher than the state average growth of 9.92 percent. In the
remaining 19 districts the average growth of per capita income was lower than the state
average growth. It is noticed that some of low-income districts like Dharmapuri,
Sivagangai, Vellore, and Thiruvannamalai grew faster, indicating the growth
convergence.
Economic Growth and Spatial Inequality
Many argue that spatial inequality increases during periods of rapid economic growth
(Shankar and Shah, 2003).10 Krugman (1991) argued that industrial regions / clusters
will trend to grow more rapidly than agricultural regions leading to better economic
performance.11 The resulting spatial inequality (among regions) may cause social and
political instability. It would, therefore be interesting to see if inter district inequality has
increased during a period of rapid economic growth in Tamil Nadu.
10 Shankar, Raja and Anwar Shah (2003) “Bridging the Economic Divide within Countries: A Score card on the
Performance of Regional Policies in Reducing Regional Income Disparities”, World Development, Vol.13, No.8, pp
1421-1441. 11 Krugman.P (1991) “Increasing Returns and Economic Geography”, Journal of Political Economy, Vol.99, No.3, pp 483-
499.
(Contd Table …)

46
Table 19 provides the computed values of various (selective) inequality
coefficients using district level per capita income data from 2004-05 to 2011-12. These
parameters indicate the following: (i) The maximum-minimum ratio of Per Capita GDDP
increased continuously from 3.378 in 2004-05 to 4.935 in 2011-12; (ii) The coefficient of
variation (ratio of standard deviation to the mean) increased from 0.276 in 2004-05 to
0.328 in 2011-12; and (iii) Other measures of inequality such as the Gini Index12 and the
Theil Index13 also increased from 2004-05 to 2011-12.
Table 19: Measures of Per Capita GDDP Inequality
Year Max/Min (MMR)
Coefficient of Variation (CV)
Weighted CV (WCV)
Gini Index
Weighted Gini Index
Theil Index
2004-
05
3.378 0.276 0.253 0.160 0.141 0.085
2005-
06
3.542 0.286 0.260 0.166 0.145 0.085
2006-
07
3.792 0.291 0.263 0.169 0.146 0.086
2007-08
3.998 0.301 0.272 0.175 0.150 0.082
2008-
09
3.941 0.301 0.271 0.174 0.150 0.083
2009-
10
4.287 0.320 0.284 0.186 0.161 0.087
2010-
11
4.847 0.334 0.303 0.194 0.168 0.087
2011-12
4.935 0.328 0.298 0.190 0.165 0.088
Chart 14 plots the coefficient of variation against the average per capita GSDP (in
constant prices) during 2004-05 to 2011-12. The correlation coefficient is 0.97 clearly
demonstrating that inter district inequality is widening with economic growth.
12 Gini Index: Ratio of the area that lies between the line of equality and the Lorenz curve over the total area under the line
of equality.
13 Theil Index, )log(i
ii
i q
xxT where xi and qi are the GDP share and population share of region i.

47
Chart 14: Weighted Coefficient of Variation Vs Per Capita GSDP
Determinants of Per Capita Income
In this section, we attempt to identify the factors determining per capita income growth
of districts in Tamil Nadu using simple plotting procedure. Chart 15 plots the average
rate of growth of per capita income of districts in Tamil Nadu during 2005-06 to 2011-12
against the initial per capita income in districts in 2004-05 (as suggested in Porter, 2003).
It is expected that the initial economic conditions will boost economic growth and so a
positive relationship with per capital income growth.
Chart 15: Per Capita GDDP Growth (2005-12) Vs. Initial Per Capita GDDP (2004-05) by Districts
It seems that those districts with comparatively higher initial per capita income in
2004-05 experienced more rapid growth; the regression coefficient was 0.0001,
indicating that on an average ten thousand rupees increase in initial per capita income
leads to 1 percent increase in per capita income growth rate in Tamil Nadu districts.
0.24
0.26
0.28
0.3
0.32
30000 35000 40000 45000 50000 55000 60000 65000 70000
y = 0.0001x + 6.490
0
2
4
6
8
10
12
14
10000 15000 20000 25000 30000 35000 40000 45000 50000

48
Chart 16 plots the average rate of growth of per capita income of districts in
Tamil Nadu during 2005-06 to 2011-12 against their (average) share of agriculture in
GDDP over the years. We note from the negative regression line that per capita income
growth is higher in districts with less agriculture share. The regression coefficient
indicates that on an average a 1 percent increase in agriculture share leads to 0.16
percent fall in the rate of growth of per capita income in Tamil Nadu districts.
Chart 16: Per Capita GDDP Growth Vs. Agriculture Share by Districts
On the other hand, Per capita GDDP growth has a positive relationship with the
share of industry in GDDP in Chart 17 as the regression line is positively sloped. The
regression coefficient indicates that on an average a 1 percent increase in industry share
leads to 0.11 percent increase in the rate of growth of per capita income in Tamil Nadu
districts.
Chart 17: Per Capita GDDP Growth Vs. Industry Share by Districts
Chart 18 plots the average rate of growth of per capita income of districts in
Tamil Nadu against their (average) share of services in GDDP over the years. We note
y = -0.160x + 11.19
0
5
10
15
0.00 5.00 10.00 15.00 20.00 25.00 30.00 35.00
y = 0.109x + 6.025
0
2
4
6
8
10
12
14
10.00 20.00 30.00 40.00 50.00 60.00
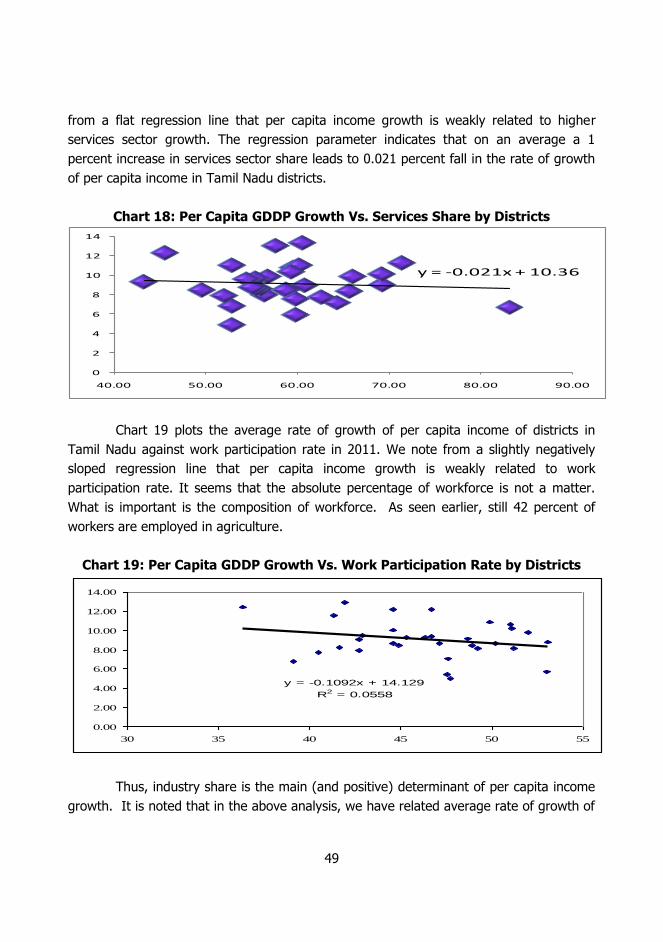
49
from a flat regression line that per capita income growth is weakly related to higher
services sector growth. The regression parameter indicates that on an average a 1
percent increase in services sector share leads to 0.021 percent fall in the rate of growth
of per capita income in Tamil Nadu districts.
Chart 18: Per Capita GDDP Growth Vs. Services Share by Districts
Chart 19 plots the average rate of growth of per capita income of districts in
Tamil Nadu against work participation rate in 2011. We note from a slightly negatively
sloped regression line that per capita income growth is weakly related to work
participation rate. It seems that the absolute percentage of workforce is not a matter.
What is important is the composition of workforce. As seen earlier, still 42 percent of
workers are employed in agriculture.
Chart 19: Per Capita GDDP Growth Vs. Work Participation Rate by Districts
Thus, industry share is the main (and positive) determinant of per capita income
growth. It is noted that in the above analysis, we have related average rate of growth of
y = -0.021x + 10.36
0
2
4
6
8
10
12
14
40.00 50.00 60.00 70.00 80.00 90.00
y = -0.1092x + 14.129
R2 = 0.0558
0.00
2.00
4.00
6.00
8.00
10.00
12.00
14.00
30 35 40 45 50 55

50
per capita income of districts with average share of agriculture or industry separately. As
each year growth depends on each year share and also depens on all factors, we do the
convergence model analysis in the next section where we relate percapita income growth
with initial income, agriculture share, industrial share etc for every year and together.
Convergence Analysis
The theoretical foundations of the convergence approach can be traced back to the neo-
classical Solow-Swan-Ramsey model of growth. The literature on regional catch-up or
convergence has also been enriched by the seminal contributions of Barro and Sala-i-
Martin (1991). In this model, the notion of (beta-) convergence requires poorer
economies to grow faster than richer ones.14
The key assumption of this convergence hypothesis is that poor economies in general
endowed with less stock of physical capital and hence higher marginal rates of return on
capital. Therefore, for any given rate of investment, the relatively backward regions will
have faster growth in the transition phase. It has substantive implications that current
per capita income differences among regions will narrow. It is noted that the beta
convergence is conditional and perceptible only after other factors that may cause
variation in steady states have been accounted for including the initial level of income.
With panel (time series wise cross sectional) data, the conditional convergence
model is specified as:
1/T ln (Yi,t/Yi,t-1) = 1 + 2 ln Yi,t-1 + 3 Xit + i + t + i,t (5.1)
where, the term in the left hand side is the annual rate of growth of per capita income of
ith region in the t th time period; Y i,t-1is initial per capita income (i.e., last year per capita
income); iis region specific effect which captures impact of unobserved heterogeneity in
the model and t will capture the time specific impacts. These two terms (i and t) can
be treated either as fixed or random. If the former, the model gets individual specific
intercept terms.15 The stead state income of each region in the sample can be computed
14 By convergence, the literature refers to the hypothesis that is less than zero (i.e., negative). The negative beta in the
cross country (or state or district) growth regression model implies after controlling for variety of region specific factors,
that countries or regions with low initial incomes grow, on an average, faster than those with higher initial incomes. It is noted that Solow model predicts a negative beta while some endogenous growth models (which assume increasing
returns to scale) imply a positive beta. 15 In the fixed effects model, these two terms are treated as fixed exogenous variables. The individual (region) specific and
time specific dummies are included in the model and the Ordinary Least Square method can be used to estimate the
fixed effects model. This model is called as Least Square Dummy Variable (LSDV) Model.

51
by: ln Y* = i/2. In the latter, the unobserved factors are added with regular residual.16
The choice of the model depends on the Hausman statistics.
Regarding X (other determinants of per capita income growth), over 90 different
conditioning variables have been appeared in existing studies, which analyze country
level data. At the state or district level, most variables are not relevant and many district
specific variables are not available or unobservable. Therefore, all conditioning variables
can be subsumed under the region (district) specific fixed effects instead of explicitly
modeling a few variables. However, in an alternative specification a few region specific
available factors like sectoral share, and growth rates of sub sectors of the economy can
be added.
The above equation (5.1) is estimated using the data on per capita income (real)
and per capita income growth of 32 districts in Tamil Nadu during 2004-05 to 2011-12.
Due to growth rate calculation, we are losing one observation for each district. Therefore,
the total observations included in the analysis are: 32 x 7 =224.
Empirical Results
In Table 20, we provide the conditional convergence analyses results. In model 1, we
have included only the last year per capita income as the explanatory variable along with
individual (district) specific and time specific dummies, because the Hausman statistics
supports a two way fixed effects model. In this model, we have not included any specific
X variables explicitly, but implicitly we are incorporating the effects of those factors by
using state specific heterogeneity variable () which subsumes effects of all such
variables.
It is noted that when control variables are accounted for in the regression
specification, different districts do not converge to a single steady state income rather
each of them converges to its own steady state income. As expected, there is a
statistically significant (at 1 percent level) negative association between growth and initial
income per capita, providing a strong evidence for conditional convergence in per capita
income among the districts in Tamil Nadu.
16 That is, and t terms are treated as residuals (random). Since the error is a composite term, consisiting of regular
residual, i and t and as a result, it is heteroscedastic, the weighted least square procedure can be used to estiamte the
random effects model.

52
Table 20: Panel Conditional Convergence: Two-way Fixed Effects Model
Results
Variables Model 1 Model2 Model 3
Coefficient t-ratio Coefficient t-ratio Coefficient t-ratio
Constant (1) 3.3907 5.990 3.7941 8.430 1.7522 4.240
Ln Per Capita Income t-1 (2)
-0.3108 -5.830 -0.3965 -9.250 -0.1622 -4.180
Agriculture Share 0.0098 6.620
Industrial Share 0.0136 10.630
Industrial Sector Growth 0.0023 13.540
Services Sector Growth 0.0037 3.330
R Square [F] 0.6292 [8.006] 0.7789 [15.64] 0.8205 [20.28]
Hausman Statistics 17.13 28.63 12.52
District Specific Fixed Effects
Chennai 0.0551 2.898 0.3620 11.275 0.0401 2.968
Kancheepuram 0.1408 6.558 0.1589 7.851 0.0622 3.827
Thiruvallur 0.1256 5.492 0.1259 5.985 0.0538 3.126
Vellore 0.0326 2.343 -0.0114 -0.775 0.0129 1.299
Thiruvannamalai -0.0996 -4.455 -0.1604 -8.740 -0.0526 -3.283
Cuddalore -0.0067 -0.505 0.0193 1.829 -0.0081 -0.841
Villupuram -0.1483 -5.337 -0.1650 -7.414 -0.0809 -4.036
Thanjavur -0.0501 -3.198 0.0805 4.639 -0.0226 -2.027
Nagapattinam -0.0900 -4.767 -0.1316 -8.478 -0.0347 -2.486
Thiruvarur -0.1506 -5.414 -0.0676 -2.647 -0.0611 -2.957
Salem 0.0145 1.060 -0.0366 -2.742 0.0074 0.771
Namakkal 0.0682 3.705 -0.0158 -0.862 0.0305 2.311
Dharmapuri -0.0030 -0.221 0.0244 1.768 -0.0087 -0.834
Krishnagiri 0.0573 4.218 0.0322 2.817 0.0186 1.610
The Nilgris -0.0319 -2.378 0.0680 3.734 -0.0101 -1.062
Thiruchirappalli 0.0901 5.084 0.2534 12.470 0.0447 3.438
Karur 0.0743 4.373 0.0834 6.109 0.0376 3.076
Perambalur -0.2829 -6.082 -0.3640 -8.814 -0.1393 -4.053
Ariyalur -0.3248 -6.473 -0.4293 -10.198 -0.1606 -4.298
Pudukkotai -0.0801 -4.381 -0.0908 -6.267 -0.0429 -3.279
Coimbatore 0.1044 4.830 0.0419 2.029 0.0508 3.251
Thiruppur 0.1384 5.675 0.0675 3.118 0.0695 3.908
Erode 0.0928 4.151 0.0333 1.818 0.0462 2.886
Madurai 0.0601 3.805 0.1831 10.302 0.0282 2.497
Theni -0.1058 -5.788 -0.0651 -2.873 -0.0425 -3.017
Dindigul -0.0042 -0.313 -0.0378 -3.393 -0.0042 -0.446
Ramanathapuram -0.0667 -4.198 -0.0518 -3.802 -0.0379 -3.308
Sivagangai -0.0400 -2.575 0.0331 2.349 -0.0201 -1.834
Virudhunagar 0.1366 5.133 -0.0704 -2.232 0.0702 3.651
Thirunelveli 0.0376 2.505 -0.0238 -1.601 0.0183 1.730
Thoothukudi 0.0919 4.089 0.1601 8.657 0.0516 3.214
Kanniyakumari 0.1644 6.257 -0.0055 -0.198 0.0839 4.344
Time Effects
2005-06 -0.0523 -3.293 -0.1106 -8.237 -0.0286 -2.466
2006-07 0.0001 0.007 -0.0397 -4.514 -0.0033 -0.366
(Contd Table …)
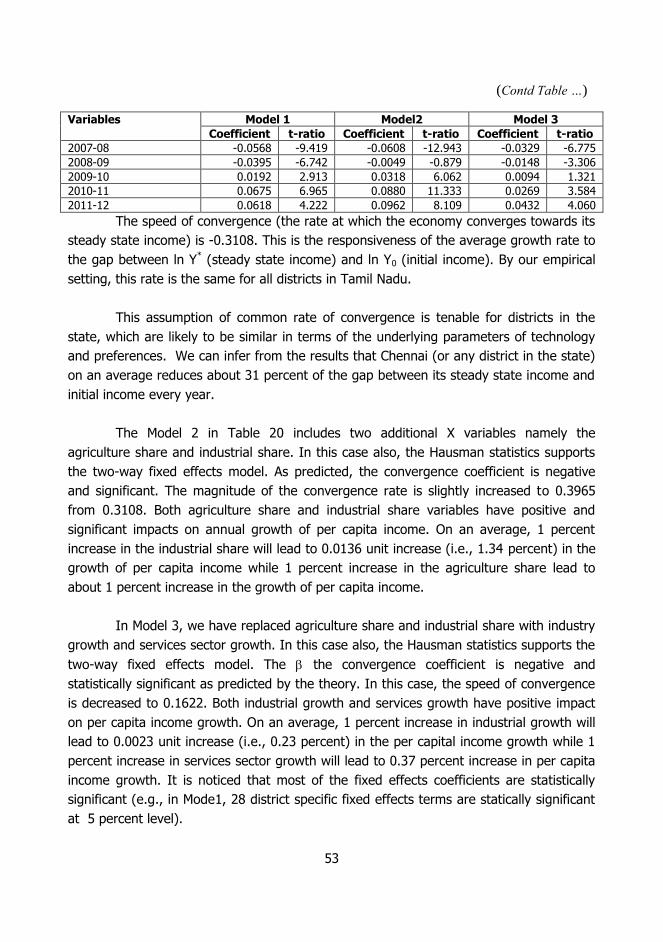
53
Variables Model 1 Model2 Model 3
Coefficient t-ratio Coefficient t-ratio Coefficient t-ratio
2007-08 -0.0568 -9.419 -0.0608 -12.943 -0.0329 -6.775
2008-09 -0.0395 -6.742 -0.0049 -0.879 -0.0148 -3.306
2009-10 0.0192 2.913 0.0318 6.062 0.0094 1.321
2010-11 0.0675 6.965 0.0880 11.333 0.0269 3.584
2011-12 0.0618 4.222 0.0962 8.109 0.0432 4.060
The speed of convergence (the rate at which the economy converges towards its
steady state income) is -0.3108. This is the responsiveness of the average growth rate to
the gap between ln Y* (steady state income) and ln Y0 (initial income). By our empirical
setting, this rate is the same for all districts in Tamil Nadu.
This assumption of common rate of convergence is tenable for districts in the
state, which are likely to be similar in terms of the underlying parameters of technology
and preferences. We can infer from the results that Chennai (or any district in the state)
on an average reduces about 31 percent of the gap between its steady state income and
initial income every year.
The Model 2 in Table 20 includes two additional X variables namely the
agriculture share and industrial share. In this case also, the Hausman statistics supports
the two-way fixed effects model. As predicted, the convergence coefficient is negative
and significant. The magnitude of the convergence rate is slightly increased to 0.3965
from 0.3108. Both agriculture share and industrial share variables have positive and
significant impacts on annual growth of per capita income. On an average, 1 percent
increase in the industrial share will lead to 0.0136 unit increase (i.e., 1.34 percent) in the
growth of per capita income while 1 percent increase in the agriculture share lead to
about 1 percent increase in the growth of per capita income.
In Model 3, we have replaced agriculture share and industrial share with industry
growth and services sector growth. In this case also, the Hausman statistics supports the
two-way fixed effects model. The the convergence coefficient is negative and
statistically significant as predicted by the theory. In this case, the speed of convergence
is decreased to 0.1622. Both industrial growth and services growth have positive impact
on per capita income growth. On an average, 1 percent increase in industrial growth will
lead to 0.0023 unit increase (i.e., 0.23 percent) in the per capital income growth while 1
percent increase in services sector growth will lead to 0.37 percent increase in per capita
income growth. It is noticed that most of the fixed effects coefficients are statistically
significant (e.g., in Mode1, 28 district specific fixed effects terms are statically significant
at 5 percent level).
(Contd Table …)

54
Steady State Income
The advantage of the above model is that the fixed effects estimated from the
convergence regressions will help us to find out the individual specific steady state
income.17 In Table 21, we provide the initial per capital income and steady state income
of districts using the results from Models 1-3 in Table 20. Virudhunagar (and
Kanniyakumari) has the highest initial per capita income, Rs.47514 (in 2004-05). The
Model 1 shows that its steady state income is Rs. 84883. It is note that Kanniyakumari
has the highest steady state income (of Rs. 92829) in Model 1, followed by
Kancheepuram (Rs. 86038) Thiruppur (Rs. 85368). Chennai has the highest steady state
income in Model 2 while Kanniyakumari has the highest in Model 3. Ariyalur has the
lowest initial income (Rs. 14064) and its steady state income in Model 1 is Rs.19239 and
Rs. 18259 in Model 3. Perambalur’s initial per capita income is Rs. 15442. In Model 1, its
steady state income is Rs. 22016. The gap between its steady state and initial is only
Rs.6574. For the poorest district Ariyalur, the gap is Rs. 5175.
Table 21: Initial Income and Steady State Income of Districts in Tamil Nadu
Districts Initial
Income
Model 1 Model 2 Model 3
Chennai 42328 65302 143581 62936
Kancheepuram 38823 86038 80361 72132
Thiruvallur 41081 81927 73133 68466
Vellore 32864 60745 49396 53207
Thiruvannamalai 21893 39697 32277 35547
Cuddalore 31064 53532 53932 46768
Villupuram 19954 33944 31848 29846
Thanjavur 26578 46557 64234 42766
Nagapattinam 24609 40945 35037 39694
Thiruvarur 20214 33690 42071 33717
Salem 33158 57309 45963 51445
Namakkal 38921 68118 48782 59316
Dharmapuri 27265 54166 54721 46578
Krishnagiri 29575 65781 55951 55113
The Nilgris 31988 49367 61973 46181
Thiruchirappalli 35868 73100 105261 64759
Karur 36397 69463 64776 61970
Perambalur 15442 22016 18038 20825
17 We have used LIMDEP econometric software to estimate the panel data convergence models. It adds the overall
intercept and state and time specific dummies. To avoid perfect multicollinearity, it uses the restriction that i = t =
0. In this case, i is the mean deviation from the overall intercept. Therefore, adding the i with overall intercept would
provide the individual specific effect. It is noted that the steady state income in this case is computed by: ln Y* =
(1+i)/2.
(Contd Table …)

55
Districts Initial
Income
Model 1 Model 2 Model 3
Ariyalur 14064 19239 14967 18259
Pudukkotai 24973 42270 39378 37733
Coimbatore 41394 76542 57530 67220
Thiruppur 42898 85368 61892 75438
Erode 45160 73733 56125 65356
Madurai 35034 66359 86107 58473
Theni 26785 38913 42371 37833
Dindigul 31842 53973 45811 47903
Ramanathapuram 27301 44135 44021 38907
Sivagangai 26325 48096 56100 43425
Virudhunagar 47514 84883 41735 75751
Thirunelveli 34851 61737 47677 55038
Thoothukudi 44884 73527 80646 67577
Kanniyakumari 47514 92829 50247 82457
Concluding Remarks
In this Chapter, an attempt has been made to identify the factors determining the per
capita income growth and test whether the convergence of growth happens at district
level in Tamil Nadu. Results indicate that inter-district distribution of income is much
skewed because in 18 out of 32 districts, the per capita income is below the state
average; and the per capita income of the poorest (Ariyalur) district is only about 20
percent of that of the richest district (Kanniyakumari). Inter district inequality is also
widening with economic growth.
In terms of high per capita income growth, Kancheepuram, Krishnagiri and
Kanniyakumari are the top three districts while Ariyalur, Theni and Perambalur are the
bottom 3 districts. In 19 districts, the average growth of per capita income was lower
than the state average growth. Even in the top growing districts like Kanniyakumari,
Krishanagiri and Kancheepuram, the growth declined during the recession years- 2007-08
and 2008-09. Districts with comparatively higher initial per capita income in 2004-05
experienced more rapid growth. Per capita income growth is higher in districts with less
agriculture share and with larger industry share.
The convergence analysis results provide a strong evidence for conditional
convergence in per capita income. Different districts do not converge to a single steady
state income rather each of them converges to its own steady state income. The speed
of convergence (the rate at which the economy converges towards its steady state
income) is -0.311. Kanniyakumari has the highest steady state income while Ariyalur has
the lowest initial income as well as steady state income.
(Contd Table …)

56
Chapter 6
TAMIL NADU ECONOMY: PROGRESS, CHALLENGES AND PROSPECTS
In the previous Chapters, we have analyzed the growth dynamics of Tamil Nadu
economy in the long run, medium run and short-run, its sectoral growth pattern and
spatial aspects and compared Tamil Nadu’s performance with other major Indian states.
We have also identified the determinants of its economic growth, measured in terms of
its real percapita income growth. In this Chapter, we list out our major findings, look at
various dimensions or issues of recent slow pace of growth each with its own challenges
and finally identify the sectoral and regional strategies to boost over all growth of Tamil
Nadu economy.
Progress
Tamil Nadu is the most progressive state in terms of various economic and development
parameters in the country. Currently, it is the second largest economy with about 8.3
percent share of GDP (2014-15), next only to Maharashtra. Its long-term (1981-2015)
growth rate was 6.7 percent as against the India’s growth of 6.3 percent. In the medium
term (2005-14), it is the fourth fastest growing economy and its annual growth rate was
9.2 percent which was 1.5 percentage points above all India growth rate (of 7.7 percent).
Interestingly, its growth rate was slightly higher than that of Gujarat (9.1 percent) and
Maharashtra (8.6 percent) in the medium-term.
Tamil Nadu ranks fourth in terms of per capita income. Currently, its per capita
income (2004-05) was Rs. 74823 and interestingly Tamil Nadu’s per capita income has
been always above the India’s per capita income. It also ranks first in terms of credit
deposit ratio and high degree of urbanization, second in low birth rate, and third in
competitiveness index, manufacturing competitiveness index, low infant mortality rate,
literacy and female literacy.
Between 2005-065 and 2014-15, its growth exceeded 10 percent in 4 out of 8
years. In two years (2005-06 and 2006-07), its growth exceeded 14 percent when India
registered 9.5 percent and 9.6 percent in those years. It has the potential to record a
double-digit growth. More than 60 percent of its GSDP comes from services and this
sector recorded about 10 percent growth. Industry accounted for about 30 percent of
GSDP and this sector grew at about 7.9 percent. Keeping this fact that Tamil Nadu’s
GSDP is driven mainly by non-agriculture sector, which grew about 9-10 percent, the
Twelfth Plan sets 11 percent growth target.

57
Sectoral analysis of growth has identified 5 major subsectors-agriculture and
allied activities, manufacturing, transport, storage and communication, trade, hotels and
restaurants and construction and they jointly contribute more than 70 percent of the
overall GSDP growth in Tamil Nadu. Tamil Nadu ranks 6th in terms of industrial growth
and 7th in services growth, while its rank is 10 in agriculture growth among major Indian
states.
Spatial analysis of growth indicates that 13 districts (Chennai, Thiruvallur,
Coimbatore, Thirunelveli, Kancheepuram, Vellore, Salem, Erode, Thiruchirapalli,
Kanniyakumari, Virudhunagar, Thiruppur and Madurai) out of 32 districts contribute more
than 60 percent of GSDP of Tamil Nadu.
Erode, Namakkal and Villupuram are the top 3 in terms of higher contributions
to GSDP agriculture of Tamil Nadu. Coimbatore, Thiruvallur and Kancheepuram jointly
accounted for about 22 percent of Industry GSDP of the state while Chennai,
Kancheepuram and Thiruvallur jointly accounted for about 23.4 percent to total services
GSDP of the Tamil Nadu.
Kancheepuram (14.7 percent), Krishnagiri (13.4 percent), and Thiruvallur (12.7
percent) recorded the fastest GDDP annual growth rates. Top 3 in terms of high average
industrial growth were: Kancheepuram, Kanniyakumari and Krishnagiri. Krishanagiri,
Dharmapuri and Thiruvallur were the top 3 in high services growth. Coimbatore,
Namakkal, and Thiruvarur are the top 3 in high agriculture growth.
Kanniyakumari, Kancheepuram and Thiruppur are the top 3 districts in terms of
higher per capita income. Kancheepuram, Kanniyakumari and Krishnagiri are the top 3
districts in terms of higher annual rate of growth of per capita income. At district level,
the per capita income growth is positively associated with (i) high industrial share, (ii)
high industrial growth and (iii) high services growth. It is however, negatively related to
(i) work participation rate and (ii) agriculture share.
In Tamil Nadu, the regional level convergence analysis indicates that
convergence hypothesis is valid, i.e., poorer districts grow faster than richer ones. The
rate at which the economies converge towards their steady state income is 0.311. That
is, Chennai or any other district in Tamil Nadu on an average reduces about 31 percent
of the gap between its steady state (i.e., target) income and initial income every year.

58
Virudhunagar has the highest initial income in the state. Kanniyakumari has the
highest steady state income, followed by Kancheepuram and Thiruppur. Ariyalur and
Perambalur have the lowest initial income and lowest stead state income too.
Challenges facing Tamil Nadu Economy
(i) High Volatile Growth: Tamil Nadu’s growth is highly volatile and more vulnerable to
external shocks as compared to all India growth pattern. As Tamil Nadu produces goods
and services for the nation as well as global economies such as automobiles, textiles, and
IT products, in response to demand it would be difficult for the state to have autonomous
growth during a worldwide recession.
(ii) Falling Trend Growth Rate: Tamil Nadu’s trend growth rate decreased from about
8.8 percent in 2008-09 to 7.2 percent in 2014-15. That is, 1.6 percentage points less
than the peak rate of 8.8 percent. This down turn in the economic condition is a concern.
However, it is noted that trend growth of India also declined from 7.66 percent to 6.78
percent.
(iii) Slow Pace of Growth in the Short-run: After 2002, its growth dipped into a very
low level thrice, when there was worldwide recession: (i) 2002-03 and 2003-04; (ii)
2007-08 and 2008-09; and (iii) 2012-13 and 2013-14. It is noticed that these are initial
years of Tenth, Eleventh and Twelfth Plan periods. This indicates the presence of cyclical
trend. Another similarity is that in all this short span of time, agriculture registered a
negative growth due to bad monsoons. Thus, worldwide recession affected industrial and
services sector growths while the drought affected agriculture. This led to the sudden fall
of GSDP of the state in the short-run. This also led to greater uncertainty and raised
doubt in sustaining its high growth rate target.
(iv) High Inflation: Evidences clearly indicate that during recession years, the prices in
Tamil Nadu have gone above all India prices. This needs special attention.
(v) Falling Agriculture Share of GSDP: Continuous fall of agriculture share (from 17
percent in 1999-00 to 7 percent in 2014-15) is a concern given the fact that growth of
this sector is vital for food security in the state. As per Census 2011, still 42 percent of
the workers are in agriculture (as cultivators and agriculture labours). Evidences indicate
that districts with high share of agriculture are basically the poorest districts. As
mentioned above, there is an element of cyclicality in the growth process of this
important sector. Particularly in the initial two years of every plan period, this sector

59
witnessed negative or low growth due to drought. As Tamil Nadu does not have any
perennial river, maintaining a sustained growth of this sector is a major challenge.
(vi) Volatile Growth of Industry: Like agriculture, industry growth too is volatile.
Between 2005-06 and 2013-14, in some years it was 20.9 percent and in some other it
was -2.3 percent. The major concern is that after 2009-10, its growth has been
continuously declining from 20.9 percent to 3.6 percent. In addition, the global slow
down, power shortage and rising input prices including oil prices might have caused this.
High growth of this sector is essential for generating employment.
(vii) Volatile Growth of Construction: While construction registered the highest
growth of 12.2 percent in the Eleventh Plan among the sub sectors, its growth declined
to just 1.6 percent in the initial three years of 12th Plan. Its contribution to over all
growth of GSDP was not consistent. Its contribution was about 25 percent in 2007-08
and 15 percent in 2011-12. But it accounted for -6.21 percent in 2012-13 and 1.5 percent
in 2013-14. Rising inputs prices (cement, sand, iron etc.) and shortage of inputs are
major concern. From the employment generation point of view, maintaining high growth
of this sector is important.
(viii) High Dependency on 5 Sub Sectors: Over all growth of GSDP of Tamil Nadu
depend on 5 sub sectors-(i) agriculture and its allied, (ii) manufacture, (iii) transport,
storage and communication, (iv) trade, hotels and restaurants and (v) construction. They
jointly contributed about 70 percent of overall GSDP growth in 2005-06, 2006-07 and
2010-11. They also contributed about 80 percent of growth in 2009-10. But in recession
years, they contributed poorly. For instances, they accounted for about 38.5 percent of
growth in 2008-09 and in 2012-13, they contributed -0.66 percent. These major but
problematic sectors need special attention.
(xi) High Dependency of 13 Districts: More than 60 percent of over all GSDP comes
from 13 major districts: Thiruvallur, Thirunelveli, Chennai, Coimbatore, Kancheepuram,
Vellore, Salem, Kanniyakumari, Thiruchirappalli, Erode, Virudhunagar, Madurai and
Thiruppur. 11 bottom districts: Sivagangai, Pudukkotai, Cuddalore, Nagapattinam, Karur,
Ramanathapuram, Theni, Thiruvarur, The Nilgiris, Ariyalur and Perambalur contributed
only 4.4 (12 percent) percent of overall growth of GSDP of Tamil Nadu in 2007-08 (2009-
10). These districts need special attention.
(x) Regional Inequality: In 18 out of 32 districts the per capita income is below the per
capita income of the state. In 19 districts, the per capita income growth is less than the

60
state (average) per capita growth. The per capita income of the top ranked district is
4.94 times larger than that of the poorest district. Almost all the poorest districts fall in
the eastern part of the state and many of them are coastal districts. Inter district income
inequality is also widening with economic growth. The rising spatial inequality may cause
social and political instability in the state. The convergence analysis indicates that the
poorer districts are not only having relatively low per capita income but also relatively low
steady state (target) income. That is, they set low target to achieve. They deserve
special attention.
Prospects of Tamil Nadu Economy
(i) Government policy should focus on a limited number of sectors to lead to positive
feedback cycles by creating sectoral income spurts, which generates demand for
other goods and services both from output and input sides thereby generating
growth through demand and supply inter-linkages. The linages between agriculture
and industry and between industry and services are well known. Obviously the focus
should be on agriculture and industry.
(ii) Growth of agriculture is vital for food security and safeguarding livelihood of poor.
Given limited availability of inputs like land and irrigation, the focus should be on
productivity, efficiency and technological progress for ensuring high output growth
of this sector.
(iii) For any state in India, given the mobility of savings and resources, overall savings of
the country are available for investment. Given the all-India common market, the
cost of accessing such savings in Tamil Nadu cannot be higher that that for other
states. Data on credit-deposit (C-D) ratio indicates that the C-D ratio has been
considerably higher than 1 for Tamil Nadu. It was close to 0.75 for all India. This
indicates that that not only savings are available from the rest of the country, but
Tamil Nadu is also able to fully avail of its own savings. It is essential to ensure that
these investments are properly used for agriculture and industrial development in
the state.
(iv) As agriculture growth is highly volatile (industry too), its risk-adjusted return may be
low and so this sector may fail to attract private investments. Government
investments should be the substitute for this.
(v) Based on macro forecast of future recession years and forecast of bad monsoon
years, appropriate strategies need to be taken in the cases of both agriculture and
industry. Proper water management (water saving during excess rainfall) will help to

61
provide irrigation during bad monsoon years. Industries should be advised to take
long-term orders such that production will not halt during the recession. To ensure
continuous production, Government policy should ensure uninterrupted power at
cheaper price, stable input prices, availability of raw materials and credit facility to
SMES etc.
(vi) Slow pace of growth in the short run is an issue. However, evidences indicate that
Tamil Nadu had the potential to overcome this issue and maintain a higher average
growth in the medium term. Government needs to have sufficient higher fiscal
buffers to undertake counter cyclical policy measures to sustain the growth even in
the recession period.
(vii) Industry is the main driver of growth in the state. With increased competition,
protecting exiting industries and attracting new industries are difficult. Appropriate
strategies need to be taken to ensure high industrial development in the state.
(viii) As Tamil Nadu produces goods and services for the nation as well as global
economies such as automobiles, textiles, and IT products, in response to demand it
would be difficult for the state to have autonomous growth during a worldwide
recession. Industrial diversification may be useful.
(viii) During recession, Government policy should focus on containing inflation in the
state. Price stability is an important factor for sustainable growth.
(xi) Contributions from poor districts are very low. There is a need to find out whether
they have proper resources, and they properly use their available resources, and
also to find out their efficiency in generating GDDP. It is also necessary to find out
why they are less efficient. Then appropriate strategies need to be taken to improve
their efficiency level.
(x) Most of the Poor districts are geographically concentrated on the eastern part of the
state below two prosperous districts: Kancheepuram and Thiruvallur. Special
packages for these poorer districts will improve their performances. As most of
these districts are coastal districts, new industrial corridor, infrastructure
development in those areas will also help.

62
Appendix A
STATE FINANCES: A BRIEF REVIEW
Tamil Nadu has managed its finances in a fiscally prudent manner. Like all other state
governments, Tamil Nadu had also witnessed a serious deterioration in various indicators
of fiscal balance towards the end of the nineties and the early years of the current
decade including large revenue deficits, and large fiscal deficit relative to GSDP. But
these imbalances were brought under prudent limits in the framework of Fiscal
Responsibility and Budget Management Act (FRBMA), which was enacted in 2003, making
Tamil Nadu one of the first states to enact such legislation even prior to the
recommendation of the Twelfth Finance Commission.
Fiscal Trend
During 2005-06 to 2012-13, the revenue account in Tamil Nadu showed surplus except in
two years 2009-10 and 2010-11 with the erosion of central tax buoyancy and slow down
of the economy. However, in those years also it was less than 1 percent of GSDP. In the
last three years, the revenue account showed deficit, it was less than 1 percent of GSDP
(Tables A.1 and A.2).
The fiscal deficit relative to GSDP was kept below 3 percent in all years since
2004-05. In Tamil Nadu, the outstanding liabilities relative GSDP was 25.56 percent in
2004-05. After this year, it started decreasing and reached 19.23 percent level in 2015-
16 (BE). This level of debt-GSDP ratio may be an acceptable (or sustainable) level due to
the levels as suggested in various Finance Commissions including the Fourteenth Finance
Commission.
Own non-tax revenues relative to GSDP is just 1 percent. Tamil Nadu ranks low
in non-tax revenues among major Indian States. Part of the reason is that some user
charges (such as bus fares) do not go directly to the state’s treasury but are collected by
state-owned enterprises. There is some potential for the state to increase the non-tax
revenues.

63
Table A.1: Tamil Nadu State Finances: Selected Fiscal Aggregates
(Rs. Crore)
Fiscal Indicators 2004-
05
2005-
06
2006-
07
2007-
08
2008-
09
2009-
10
2010-
11
2011-
12
2012-13
2013-14
2014-15RE
2015-16BE
Own Tax Revenues 19357 23326 27771 29619 33684 36547 47782 59517 71254 73718 85773 96083
Own Non Tax Revenues 2208 2601 3423 3304 5712 5027 4651 5684 6554 9343 8868 9072
State's Own Revenue 21565 25927 31194 32923 39397 41574 52434 65201 77809 83061 94640 105155
Total Central Transfers 6886 8033 9720 14597 15646 14270 17754 20001 21019 24975 38548 37527
Share in Central Taxes 4236 5013 6394 8065 8511 8756 10914 12715 14520 15853 16824 21150
Grants 2650 3020 3326 6532 7135 5514 6840 7286 6499 9122 21724 16377
Total Revenue Receipts 28452 33960 40913 47520 55042 55844 70188 85202 98828 108036 133189 142681
Total Revenue Expenditure 29155 32009 38265 42975 53590 59375 72916 83838 97067 109825 136725 147297
Capital Expenditure of which 5650 5094 8207 9244 11934 10863 14688 21819 19337 19415 24147 27514
Capital Outlay 4564 4055 5952 7462 9104 8573 12436 16336 14568 17173 20341 24313
Loans and Advances (Gross) 1086 1040 2254 1782 2830 2291 2252 5483 4769 2242 3806 3201
Recoveries of Loans ,Advances 783 892 1602 1013 1934 2587 770 3181 1058 620 338 301
Revenue Deficit@ 703 -1951 -2648 -4545 -1452 3531 2729 -1364 -1760 1788 3537 4616
Fiscal Deficit 5570 2251 3956 3686 8548 11807 16647 17274 16519 20584 27346 31829
Outstanding liabilities 55970 63850 68560 73890 86150 101710 114470 130630 147416 154051 181036 211483
GSDP at Current Prices# 219003 257833 310526 350819 401336 479733 584896 667202 744859 854238 976703 1099675
* At the end of March; # 2004-05 base series. @ minus sign means surplus Source (Basic Data): State Budget Documents of Tamil Nadu (Various Years); RE-Revised Estimates; BE-Budget Estimates. For GSDP, CSO
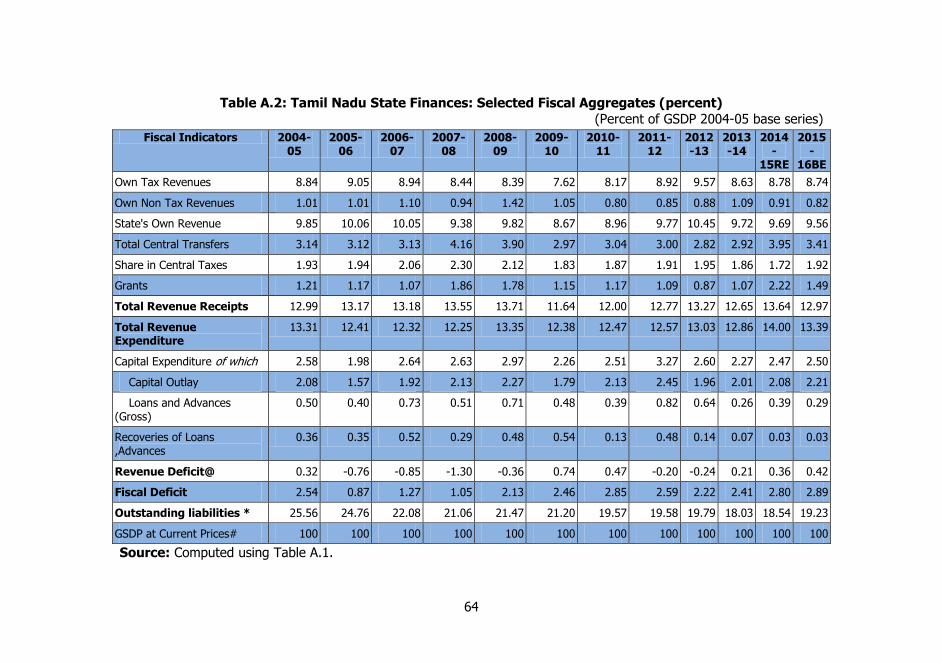
64
Table A.2: Tamil Nadu State Finances: Selected Fiscal Aggregates (percent)
(Percent of GSDP 2004-05 base series)
Fiscal Indicators 2004-05
2005-06
2006-07
2007-08
2008-09
2009-10
2010-11
2011-12
2012-13
2013-14
2014-
15RE
2015-
16BE
Own Tax Revenues 8.84 9.05 8.94 8.44 8.39 7.62 8.17 8.92 9.57 8.63 8.78 8.74
Own Non Tax Revenues 1.01 1.01 1.10 0.94 1.42 1.05 0.80 0.85 0.88 1.09 0.91 0.82
State's Own Revenue 9.85 10.06 10.05 9.38 9.82 8.67 8.96 9.77 10.45 9.72 9.69 9.56
Total Central Transfers 3.14 3.12 3.13 4.16 3.90 2.97 3.04 3.00 2.82 2.92 3.95 3.41
Share in Central Taxes 1.93 1.94 2.06 2.30 2.12 1.83 1.87 1.91 1.95 1.86 1.72 1.92
Grants 1.21 1.17 1.07 1.86 1.78 1.15 1.17 1.09 0.87 1.07 2.22 1.49
Total Revenue Receipts 12.99 13.17 13.18 13.55 13.71 11.64 12.00 12.77 13.27 12.65 13.64 12.97
Total Revenue Expenditure
13.31 12.41 12.32 12.25 13.35 12.38 12.47 12.57 13.03 12.86 14.00 13.39
Capital Expenditure of which 2.58 1.98 2.64 2.63 2.97 2.26 2.51 3.27 2.60 2.27 2.47 2.50
Capital Outlay 2.08 1.57 1.92 2.13 2.27 1.79 2.13 2.45 1.96 2.01 2.08 2.21
Loans and Advances (Gross)
0.50 0.40 0.73 0.51 0.71 0.48 0.39 0.82 0.64 0.26 0.39 0.29
Recoveries of Loans ,Advances
0.36 0.35 0.52 0.29 0.48 0.54 0.13 0.48 0.14 0.07 0.03 0.03
Revenue Deficit@ 0.32 -0.76 -0.85 -1.30 -0.36 0.74 0.47 -0.20 -0.24 0.21 0.36 0.42
Fiscal Deficit 2.54 0.87 1.27 1.05 2.13 2.46 2.85 2.59 2.22 2.41 2.80 2.89
Outstanding liabilities * 25.56 24.76 22.08 21.06 21.47 21.20 19.57 19.58 19.79 18.03 18.54 19.23
GSDP at Current Prices# 100 100 100 100 100 100 100 100 100 100 100 100
Source: Computed using Table A.1.

65
Relative to GSDP, own tax revenues in Tamil Nadu have historically been one of
the highest among states for many years. It is slated to be at 8.8 percent in 2014-15
(RE). The slightly lower figure for own tax revenue relative to GSDP in 2009-10 reflects
consensus of the revenue impact of introduction of State VAT.
Table A.3 shows the performance of own tax revenues in Tamil Nadu relative to
GSDP in terms of major taxes. It also provides annual buoyancy and growth rates of
major taxes. Sales tax (State VAT) is the major source of own tax revenues, followed by
state stamps and registration duties and state excise duties. In 2009-10 the own tax
buoyancy was only 0.44 and then it steadily increased to 1.75 in 2011-2012. During this
period, the State VAT buoyancy also steadily increased from 0.49 to 1.91. Buoyancies of
other taxes also improved during this period. Currently the own tax buoyancy is 0.95 and
state VAT buoyancy is 0.94.
Fiscal Transfers
Fiscal transfers to Tamil Nadu come from Finance Commission transfers, Plan grants, and
grants under various centrally sponsored schemes. In the aggregate, the transfers
remained around 2.8-4.2 per cent during 2004-05 to 2015-16 (BE).
Government Expenditure
On the expenditure side, there has been a steady improvement in the capital outlay since
2005-06, which is estimated at 2.21 percent for 2015-16 BE. The revenue expenditure
was kept more or less stable at slightly below 14 percent of GSDP. It should be
recognized that while maintaining a high tax-GSDP ratio Government of Tamil Nadu has
also historically had very high salary expenditure relative to its total revenue expenditure
due to its thrust on social sectors.

66
Table A.3: Own Tax Revenues in Tamil Nadu: 2004-05 to 2013-14
Taxes 2004-05
2005-06
2006-07
2007-08
2008-09
2009-10
2010-11
2011-12
2012-13
2013-14
2014-15RE
2015-16BE
As percent of Own Tax Revenue
Sales Tax 67.14 66.68 63.83 61.30 61.38 62.01 59.88 60.97 61.81 72.62 71.78 71.68
State Excise 13.17 13.62 14.35 16.08 17.09 18.44 16.99 16.76 17.02 6.83 7.43 7.59
Stamps and Registration 8.29 8.94 10.79 12.85 11.26 10.02 9.73 11.06 10.73 11.19 10.88 10.81
Motor Vehicle tax 5.24 4.82 4.54 5.01 5.08 5.54 5.57 5.21 5.51 5.00 4.99 5.08
Goods andPass. Tax 3.95 4.22 4.48 3.71 2.91 2.99 3.40 3.57 3.16 2.50 2.89 2.86
Others 2.22 1.71 2.00 1.06 2.29 1.00 4.43 2.43 1.77 1.86 2.03 1.97
Own Tax Revenue 100 100 100 100 100 100 100 100 100 100 100 100
As percent of GSDP
Sales Tax 5.93 6.03 5.71 5.18 5.15 4.72 4.89 5.44 5.91 6.27 6.30 6.26
State Excise 1.16 1.23 1.28 1.36 1.43 1.41 1.39 1.50 1.63 0.59 0.65 0.66
Stamps and Registration 0.73 0.81 0.97 1.08 0.95 0.76 0.80 0.99 1.03 0.97 0.96 0.94
Motor Vehicle tax 0.46 0.44 0.41 0.42 0.43 0.42 0.45 0.46 0.53 0.43 0.44 0.44
Goods andPass. Tax 0.35 0.38 0.40 0.31 0.24 0.23 0.28 0.32 0.30 0.22 0.25 0.25
Others 0.20 0.16 0.18 0.09 0.19 0.08 0.36 0.22 0.17 0.16 0.18 0.17
Own Tax Revenue 8.84 9.05 8.94 8.44 8.39 7.62 8.17 8.92 9.57 8.63 8.78 8.74

67
Annual (Nominal) Growth Rate (percent)
2005-06
2006-07
2007-08
2008-09
2009-10
2010-11
2011-12
2012-13
2013-14
2014-15RE
2015-16BE
Sales Tax 19.69 13.97 2.42 13.87 9.61 26.27 26.82 21.36 21.55 15.01 11.87
State Excise 24.62 25.49 19.51 20.81 17.12 20.40 22.91 21.56 -58.48 26.64 14.44
Stamps and Registration
29.95 43.77 26.93 -0.29 -3.47 26.99 41.50 16.18 7.92 13.07 11.31
Motor Vehicle tax 10.86 12.08 17.63 15.26 18.43 31.38 16.58 26.68 -6.23 16.18 14.09
GoodsandPass. Tax 28.94 26.25 -11.74 -10.82 11.56 48.89 30.60 6.04 -18.16 34.40 11.00
Others -6.74 38.9 -43.7 146.7 -52.6 478.4 -31.6 -12.8 8.80 27.1 8.60
Own Tax Revenue 20.50 19.06 6.65 13.73 8.50 30.7 24.56 19.7 3.46 16.4 12.02
GSDP 17.73 20.44 12.98 14.40 19.53 21.92 14.07 11.64 14.68 14.34 12.59
Tax Buoyancy (percent)
Sales Tax 1.11 0.68 0.19 0.96 0.49 1.20 1.91 1.84 1.47 1.05 0.94
State Excise 1.39 1.25 1.50 1.45 0.88 0.93 1.63 1.85 -3.98 1.86 1.15
Stamps and Registration
1.69 2.14 2.08 -0.02 -0.18 1.23 2.95 1.39 0.54 0.91 0.90
Motor Vehicle tax 0.61 0.59 1.36 1.06 0.94 1.43 1.18 2.29 -0.42 1.13 1.12
Goods and Pass. Tax 1.63 1.28 -0.91 -0.75 0.59 2.23 2.17 0.52 -1.24 2.40 0.87
Others -0.38 1.91 -3.37 10.19 -2.69 21.82 -2.24 -1.10 0.60 1.89 0.68
Own Tax Revenue 1.16 0.93 0.51 0.95 0.44 1.40 1.75 1.69 0.24 1.14 0.95
Source (Basic Data): State Budget Documents of Tamil Nadu (Various Years); RE-Revised Estimates; BE-Budget Estimates.

68
REFERENCES
Barro, Robert J. and X. Sala-i-Martin (1991), “Convergence Across States and Regions”, Brookings Papers on Economic Activity, Vol.1991, No.1, pp.107-182.
Krugman, P. (1991), “Increasing Returns and Economic Geography”, Journal of Political Economy, Vol.99, No.3, pp.483-499.
Porter, Michael E. (2003), “The Economic Performance of Regions”, Regional Studies, Vol.37.6 and 7, pp.549–578.
Shankar, Raja and Anwar Shah (2003), “Bridging the Economic Divide within Countries: A
Score Card on the Performance of Regional Policies in Reducing Regional Income Disparities”, World Development, Vol.13, No.8, pp 1421-1441.
Solow, Robert (1956), “A Contribution to the Theory of Economic Growth”, Quarterly Journal of Economics, Vol.7, No.1, pp.65–94.

* Working papers are downloadable from MSE website http://www.mse.ac.in $ Restricted circulation
* Working Paper 160/2017 An Alternative Argument of Green Solow Model in Developing Economy Context Santosh K. Sahu, Arjun Shatrunjay
* Working Paper 161/2017 Technical Efficiency of Agricultural Production in India: Evidence from REDS Survey Santosh K. Sahu, Arjun Shatrunjay
* Working Paper 162/2017 Does Weather Sensitivity of Rice Yield Vary Across Regions? Evidence from Eastern and Southern India Anubhab Pattanayak , K. S. Kavi Kumar
* Working Paper 163/2017 Cost of Land Degradation in India P. Dayakar
* Working Paper 164/2017 Microfinance and Women Empowerment- Empirical Evidence from the Indian States Saravanan, Devi Prasad DASH
* Working Paper 165/2017 Financial Inclusion, Information and Communication Technology Diffusion and Economic Growth: A Panel Data Analysis Amrita Chatterjee and Nitigya Anand
* Working Paper 166/2017 Task Force on Improving Employment Data - A Critique T.N. Srinivasan
* Working Paper 167/2017 Predictors of Age-Specific Childhood Mortality in India
G. Naline, Brinda Viswanathan
MSE Working Papers Recent Issues

MSE Monographs
* Monograph 28/2014 Fiscal Instruments for Climate Friendly Industrial Development in Tamil Nadu D.K. Srivastava, K.R. Shanmugam, K.S. Kavi Kumar and Madhuri Saripalle
* Monograph 29/2014 Prevalence of Undernutrition and Evidence on Interventions: Challenges for India Brinda Viswanathan
* Monograph 30/2014 Counting The Poor: Measurement And Other Issues C. Rangarajan and S. Mahendra Dev
* Monograph 31/2015 Technology and Economy for National Development: Technology Leads to Nonlinear Growth Dr. A. P. J. Abdul Kalam, Former President of India
* Monograph 32/2015 India and the International Financial System Raghuram Rajan
* Monograph 33/2015 Fourteenth Finance Commission: Continuity, Change and Way Forward Y.V. Reddy
* Monograph 34/2015 Farm Production Diversity, Household Dietary Diversity and Women’s BMI: A Study of Rural Indian Farm Households Brinda Viswanathan
* Monograph 35/2016 Valuation of Coastal and Marine Ecosystem Services in India: Macro Assessment K. S. Kavi Kumar, Lavanya Ravikanth Anneboina, Ramachandra Bhatta, P. Naren, Megha Nath, Abhijit Sharan, Pranab Mukhopadhyay, Santadas Ghosh, Vanessa da Costa, Sulochana Pednekar
* Monograph 36/2017 Underlying Drivers of India’s Potential Growth C.Rangarajan and D.K. Srivastava
* Monograph 37/2018 India: The Need for Good Macro Policies Ashok K. Lahiri
* Monograph 38/2018 Finances of Tamil Nadu Government K R Shanmugam
MONOGRAPH 39/2018
GROWTH DYNAMICS OF TAMIL NADU ECONOMY
K R Shanmugam
MADRAS SCHOOL OF ECONOMICS Gandhi Mandapam Road
Chennai 600 025
India
March 2018