monitoring mechanistic details in the synthesis of pyrimidines via real-time, ultrafast...
TRANSCRIPT

Monitoring Mechanistic Details in the Synthesis of Pyrimidines viaReal-Time, Ultrafast Multidimensional NMR SpectroscopyZulay D. Pardo,‡ Gregory L. Olsen,† María Encarnacion Fernandez-Valle,§ Lucio Frydman,*,†
Roberto Martínez-Alvarez,‡ and Antonio Herrera*,‡,§
†Department of Chemical Physics, Weizmann Institute of Science, 76100 Rehovot, Israel‡Departamento de Química Organica I and §CAI de RMN y RSE, Facultad de Ciencias Químicas, Universidad Complutense, 28040Madrid, Spain
*S Supporting Information
ABSTRACT: Recent years have witnessed unprecedented advancesin the development of fast multidimensional NMR acquisitiontechniques. This progress could open valuable new opportunities forthe elucidation of chemical and biochemical processes. This studydemonstrates one such capability, with the first real-time Two-dimensional (2D) dynamic analysis of a complex organic reactionrelying on unlabeled substrates. Implementing such measurementsrequired the development of new ultrafast 2D methods, capable ofmonitoring multiple spectral regions of interest as the reactionprogressed. The alternate application of these acquisitions in aninterleaved, excitation-optimized fashion, allowed us to extract new structural and dynamic insight concerning the reactionbetween aliphatic ketones and triflic anhydride in the presence of nitriles to yield alkylpyrimidines. Up to 2500 2D NMR datasets were thus collected over the course of this nearly 100 min long reaction, in an approach resembling that used in functionalmagnetic resonance imaging. With the aid of these new frequency-selective low-gradient strength experiments, supplemented bychemical shift calculations of the spectral coordinates observed in the 2D heteronuclear correlations, previously postulatedintermediates involved in the alkylpyrimidine formation process could be confirmed, and hitherto undetected ones were revealed.The potential and limitations of the resulting methods are discussed.
1. INTRODUCTIONHeterocycles’ significance is central in modern chemistry.1
Among nitrogen-containing heterocycles, pyrimidines playunique roles as integral constituents in many pharmaceutical,functional, and natural materials.2 Understanding and control-ling laboratory preparations of pyrimidinic derivatives havetherefore become an important field of synthetic chemistry.3
Recently we focused our attention on one-pot syntheses ofvarious heterocyclic derivatives and developed alternatives foran easier preparation of a wide range of azaheterocycliccompounds.4 Other elegant procedures have been alsodescribed for the synthesis of pyrimidine derivatives5 andoxazoles.6 Several of these studies revealed details of themechanism of pyrimidine formation when reacting carbonylcompounds with strong electrophiles, such as trifluorometha-nesulfonic acid anhydride (triflic anhydride, Tf2O).
7 Still,despite the importance of these reactions, large gaps inknowledge remain about the variety of intermediates andmechanistic routes involved in their formation, and key detailsabout the structural information associated to the kinetics ofthese processes remain to be elucidated.Real-time NMR measurements could open unique oppor-
tunities in the analysis of complex chemical problems such asthis one. Two-dimensional (2D) NMR, in particular, couldenable one to monitor and assign transient intermediates in the
reaction as well as to quantify their overall kinetics offormation. Doing so, however, requires completing the 2DNMR measurement in time scales compatible with the chemicalchanges occurring following a sudden triggering of the reaction.Much progress has taken place during recent years in the areaof accelerating multidimensional NMRboth in the areas oforganic and biomolecular acquisitions. Efforts that have made2D spectroscopy compatible with the tracking of rapidtransformations include Hadamard-encoded versions of hetero-nuclear (HSQC) and homonuclear (TOCSY) NMR exploitinga priori information,8 compressed sensing acquisitions wherethe usual Nyquist demands for the FT-based sampling of aNMR domain can be alleviated,9 and so-called “ultrafast” (UF)acquisition schemes whereby arbitrary 2D NMR correlationscan be established in a single-scan fashion.10 The latterapproach in particular replaces the indirect-domain parametrictime encoding of 2D NMR with a spatiotemporal manipulation,effectively imparting all the increments that would be involvedin a conventional experimentin their entiretywithin onesingle scan.11 The spatial patterns imparted by indirect domainevolution frequencies encoded in such a manner can besubsequently read out with the aid of suitable magnetic field
Received: October 28, 2011Published: January 4, 2012
Article
pubs.acs.org/JACS
© 2012 American Chemical Society 2706 dx.doi.org/10.1021/ja210154g | J. Am. Chem.Soc. 2012, 134, 2706−2715

gradients. Using such rapid acquisition 2D NMR methods, anumber of fast-reacting systems have been recently monitoredin real time. These have included biomolecular single- andmultiple-quantum heteronuclear correlations (HSQC andHMQC) on proteins and nucleic acids12 as well as TOCSYand multiple-bond correlation experiments on reacting organicsystems.13a Included among the latter were studies on thesynthesis of alkyl- and alkylaryl-pyrimidines from aliphatic andaromatic ketones, whereby series of complete 2D NMR datasets were collected on 100% abundant isotopes to observe thechanges in chemical species occurring as the reactionsprogressed.We have recently studied these reactions for the specific case
of the addition of 3-pentanone 1 to acetonitrile-d3 in thepresence of triflic anhydride (Scheme 1). In these studies 2D
ultrafast TOCSY homonuclear acquisitions revealed thepresence of intermediates 2−4, and the generation of thefinal reaction products 5 and 6 was revealed (Scheme 2).13b
Two-dimensional ultrafast heteronuclear multiple bond corre-lation spectroscopy (HMBC) experiments on specificallylabeled precursors were also implemented to elucidate thechemical nature and evolution of reactive quaternary centersinvolved in this reaction. Upon monitoring a similarcondensation that starting from 13C-carbonyl-labeled acetophe-none 7 lead to alkylaryl-pyrimidine 9 as main product (Scheme3), such experiments permitted the detection of theintermediate (trifluorormethylsulfonyloxy)carbenium ion 8.13c
Unfortunately, label-based experiments such as these have anarrow focus that may obscure a full and unambiguousidentification of all transient intermediates generated duringthe course of the reaction. To extract such importantmechanistic information, it would be necessary to implementmore general 2D NMR correlations. Particularly useful could besite-identifying heteronuclear correlations covering the fullpossible range of chemical shifts that might arise, so that bothpermanent as well as transient species can be characterized.Running ultrafast HSQC experiments at natural abundance innon-labeled samples, however, would not be a trivial endeavor.Indeed in single scan sequences, the spectral widths SW2 andSW1 along the directly and indirectly sampled dimensions arerelated to one another. Moreover these parameters as well asthe effective spectral resolution Δν1 desired along the indirectdomain define the gradient strength Ga required to read out theindirect domain spectral width according to (SW1SW2)/(Δv1)∼ γaGaL, where L is the encoded sample length. The per scan
signal-to-noise ratio (SNR) is in turn also governed by theγaGaL frequency span, which becomes the filter bandwidth thatneeds to be used for this kind of measurement. Noise in thiskind of experiment thereby behaves proportionally to√(SW1·SW2/Δv1). For the kind of HSQC and HMBCexperiments that would be needed to characterize a prioriunknown intermediates that can fall anywhere in the aliphatic/olefinic/aromatic range, as is the case for the kind of reactiondepicted in Scheme 3, this relation would impose high strainson the gradient strengths that would be necessary (≈80 G/cmfor covering an indirect domain spanning ≈150 ppm, a directdomain of ≈4 kHz, and the typical 1.8 cm sample length). Evenworse, the associated noise penalties would become untenablefor the ensuing kind of filter bandwidths.One of the aims of this work consisted in developing a
methodology which would allow us to monitor the necessaryspectral widths while bypassing such stringent demands.Strategies have been discussed in the recent literature capableof alleviating the gradient strengths needed to decode a givenspectral bandwidth in single-scan 2D NMR, including thefolding of peaks along the direct and indirect domain as well asshifting of peaks into a single, congruent band of detection.14 Inthe present instance, however, we decided to explore analternative route that, while still alleviating the gradient’sdemands, could still furnish a direct reading of the chemicalshift information about the transient reaction intermediates. Todo so a new family of experiments was devised incorporating(i) the selective excitation of different spectral bands of interest(aliphatic, olefinic, aromatic) and (ii) the interleaving of real-time ultrafast acquisitions targeting these spectral bandsthrough consecutive scans. With the aid of such strategies itwas possible to interrogate the nature of the chemical dynamicsin Scheme 3 using unlabeled compounds, recording literallythousands of 2D heteronuclear correlation spectra within thecourse of these hour-long processes. With the aid of such data,of ancillary 1D NMR measurements, and of computer-basedestimators of chemical shift values, new transient intermediateswere detected, and their kinetics of generation/consumptioncharacterized. All this led us to propose a new two-pathwaymechanism for the triflate-mediated addition of acetonitrile-d3to arylketones.
2. MATERIALS AND METHODSTo address the spectral-width/spectral-resolution issues just men-tioned, we decided to attempt the observation of the reaction inScheme 3 at natural abundance by modifying a general, broadbandheteronuclear correlation experiment, into a multiple-windowobservation mode. In other words, instead of implementing ultrafastsequences covering in excess of 100 ppm in the 13C domain, thetargeted direct- and indirect-domain windows were split into regionsexpected to possess the peaks of interest. Areas that were a priori,known to be devoid of peaks, were consequently ignored. Moreover,these multiple spectrally selective versions of single-bond hetero-nuclear correlation ultrafast sequences were run in an interleavedfashion so as to employ the relaxation recovery delay of one spectral
Scheme 1
Scheme 2
Journal of the American Chemical Society Article
dx.doi.org/10.1021/ja210154g | J. Am. Chem.Soc. 2012, 134, 2706−27152707

region to collect the data pertaining to another spectral regionverymuch like multislice imaging experiments perform their optimizedacquisitions in frecuency-shifted 3D MRI.15 To do so in the ultrafastinstances, care had to be made to either avoid the excitation of 1Hsignals outside the targeted region or, alternatively, to make sure thatunencoded regions were addressed by an even number of (π)H
rotations so as to return their magnetizations to a relaxation-optimizedlongitudinal state. (13C manipulations being less critical for all casesgiven that 1H initiated, indirectly detected sequences were assayed.)Three spectral windows were selected for these observations, usuallyinvolving ≈1.5 ppm along the 1H and ≈10−20 ppm along the 13Cdimension. These windows encompassed: (i) an ‘aliphatic’ regioncentered at 2.2 ppm (1H) and 28.7 ppm (13C); (ii) an ‘olefinic’ regionat 5.8 ppm (1H) and 110.9 ppm (13C) set to follow transientintermediates; and (iii) an aromatic ‘pyrimidinic’ region centered at 8.2ppm (1H) and 117.4 ppm (13C) to track formation of the final reactionproduct 2,4-dimethyl-6-phenylpyrimidine-d6 (9). A typical scheme ofthese pulse sequences is illustrated in Figure 1. This consists of a seriesof back-to-back heteronuclear correlations involving two continuousconstant-time spatial encoding processes for monitoring the indirectdomain 13C evolution. As each one of these additive processesinvolved a (π)H decoupling pulse in their center, no overall rotation ofthe proton magnetizations resulted from the t1 period. The twoINEPT transfers in each of these sequences incorporated sinc(π/2)H
excitations and two hard (π)H pulses, thereby fulfilling the band-selectivity requirements of these sequences. These multiwindowedconstant-time ultrafast 2D NMR data sets were collected on a VarianVNMRS 600 MHz NMR spectrometer using a triply tuned HCNsingle-gradient probe at 298 K. The constant-time spatial encodingadiabatic (π)C pulses needed for the spatial encoding were generatedusing the Varian Pbox software package, with these chirped pulsessweeping a bandwidth [Oi−Of] = 49 519 Hz in 2.5 ms, applied inconjunction with 25 G/cm encoding gradients. All protons wereselectively excited in their appropriate bandwidths with 1.42 ms long, 1kHz bandwidth (π/2)H pulses. All experiments used 180° phase
cycling of both the initial (π/2)C hard pulse and the receiver phase, forensuring a more complete suppression of the natural abundancebackground. Acquisitions used gradient strengths of Ga = 6.35 or 10.6G/cm and filter bandwidths of either 25 or 42 kHz (as noted in thetext). Further acquisition parameters included N2 = 40 cycles of ±gradient pairs, a physical sampling dwell time of 2 μs, and gradientdurations Ta = 0.60 ms each. Square (π)C pulses were applied inbetween all acquisition gradients for heteronuclear decouplingpurposes. Purge gradient pulses preceding acquisition were 1.60 msin duration, at 6.35 G/cm (10.6 G/cm for the experiment usinglabeled starting material (7) to probe the olefinic region).
The reaction described in Scheme 3 was initially monitored usingspectral windows spanning 800.8 Hz in 1H and 2500 Hz in 13C. Topermit an enhanced sensitivity, the 13C window sizes were furtherreduced to 1500 Hz in subsequent tests. Gradients and bandwidthswere adjusted accordingly, as noted below. Each 0.5 mLacetophenone-acetonitrile solution was pretuned and preshimmedprior to injection of a small aliquot (≈56 μL) of Tf2O. A mixing devicewas used for this injection, including a syringe feeding directly into theNMR tube inside the magnet (see Supporting Information). Datacollection was initiated prior to injection of Tf2O. Preliminary testsmonitoring 13C-labeled acetophenone (7) used two scans per 2Dspectrum. Reactions monitoring unlabeled acetophenone (7) wereacquired using 12 scans per FID and a four-step phase cycle, again with180° phase cycling of both 13C π/2 pulses and of the receiver phase.Each double-window HSQC data set thus required 4.16 s per scanwhen using the 2 s recycle delay. Total times per 2D spectrum were8.32 and 49.9 s for monitoring of labeled and nonlabeled reactants,respectively. This back-to-back application of separate ultrafast HSQCexperiments, targeting different windows of interest, permitted theparallel observation of multiple spectral windows in the same real-timeacquisition batch. While as many as four distinct spectral regions weremonitored in certain runs, only two windows per experiment (Figure1) are presented in this work. The resulting concatenated time-domainsignals were separated into FIDs corresponding to the individual
Scheme 3
Figure 1. Multiwindowed ultrafast HSQC pulse sequence involving: a selective excitation of protons in the targeted spectral window; an INEPTmagnetization transfer to carbon; four chirped pulses applied in the presence of suitable gradients and (π)H decoupling pulses to give a constant-timespatial encoding of the carbon evolution; a selective transfer of this encoded information to protons; and low-strength ±Ga gradient pairs acting asread-out of the resulting encoded signals. After shifting the irradiation frequencies to a second spectral window, the sequence is then immediatelyrepeated to acquire a second FID addressing a different spectral region. Selective excitation and spatial encoding used 1.42 ms sinc π/2 pulses and2.5 ms π chirp pulses, respectively. Encoding gradient strengths were 25 G/cm. Read out of encoded signals typically used N2 =40 cycles and a Ga of6.35 or 10.6 G/cm. The narrow independent windows targeting specific spectral regions of interest permits use of these low-strength gradients,providing corresponding increases in SNR and enabling the detection of nonlabeled samples.
Journal of the American Chemical Society Article
dx.doi.org/10.1021/ja210154g | J. Am. Chem.Soc. 2012, 134, 2706−27152708

Figure 2. Real-time 1D 1H NMR series recorded as a function of time (only a small subset of the resulting spectra hereby shown). Colored arrowsshow the positions of specific signals from products and intermediates participating in the reaction between acetophenone (7) (0.183 mmol) andtriflic anhydride (0.275 mmol) in acetonitrile-d3 (as both a coreactant and solvent) at 298 K. The red arrow at (2.60 ppm, 0.0 min) indicates thesignal of methyl group from starting acetophenone. Light-blue and purple arrows show signals from final products, aromatic proton H-5 (8.32 ppm,2.1 min) in pyrimidine (9), and the methylidene protons (5.85 and 5.49 ppm, 51.2 min) in vinyl triflate (10), respectively. Gray (3.28 ppm), blue(2.11 ppm), green (2.04 ppm), and magenta (1.87 ppm) arrows represent the position of methyl group in different aliphatic intermediates; gold(5.90/5.57 ppm) arrows present the positions of methylidene protons from olefinic intermediates as well.
Figure 3. Normalized integrals as a function of time, taken from the real-time 1D 1H NMR series shown in Figure 2. The integrals were measured bytaking the characteristic signals for the initial ketone (7, red), the final pyrimidine (9, light blue), vinyl triflate (10, purple), and the intermediate (8,gray) as well as for other new intermediates detected in these studies. The right-hand panel presents an expanded description of these compounds’time dependencies.
Journal of the American Chemical Society Article
dx.doi.org/10.1021/ja210154g | J. Am. Chem.Soc. 2012, 134, 2706−27152709
windows, then processed into 2D spectra in the usual ultrafast fashion,and characterized using custom-written Matlab scripts. To aid in theelucidation of the reaction intermediate structures, 1H NMR chemicalshifts were estimated using Advanced Chemistry Development, Inc.(ACD/Laboratories) Software V8.0, and 13C NMR shifts werecalculated within the GIAO approximation16 on the PCM-M06-2X/6-31+G* (solvent = acetonitrile)17,18 with optimized geometries usingthe Gaussian 09 suite of programs.19
3. RESULTS AND DISCUSSION
3.1. Real-Time 1D Measurements. A variety ofpreliminary 1D 1H NMR data were taken to delineate thespectral windows to be used for the main 2D studies. Figure 2illustrates a representative set of such tests. In addition tosignals corresponding to reagents and products (Scheme 3),these tests revealed over a dozen transient signals in the 1Haliphatic and olefinic regions. These signalsarising on top ofthe 1H NMR resonances belonging to reagents and productssuggest the presence of a number of candidate aliphatic andolefinic intermediates that had not been previously noticed.Aliphatic intermediates will be characterized by singlet signalsfrom methyl group present, whereas olefinic intermediates will
show doublets produced by the diastereotopic protons from themethylidene group. Figure 3 presents a more quantitativedescription on the appearance and disappearance of thesedifferent species, showing the time-dependent intensities ofproducts 7, 9, and 10 as well as of intermediate 8 (cf. Scheme3). Also shown is the kinetic behavior of an additional numberof aliphatic and olefinic intermediates arising during thereaction.
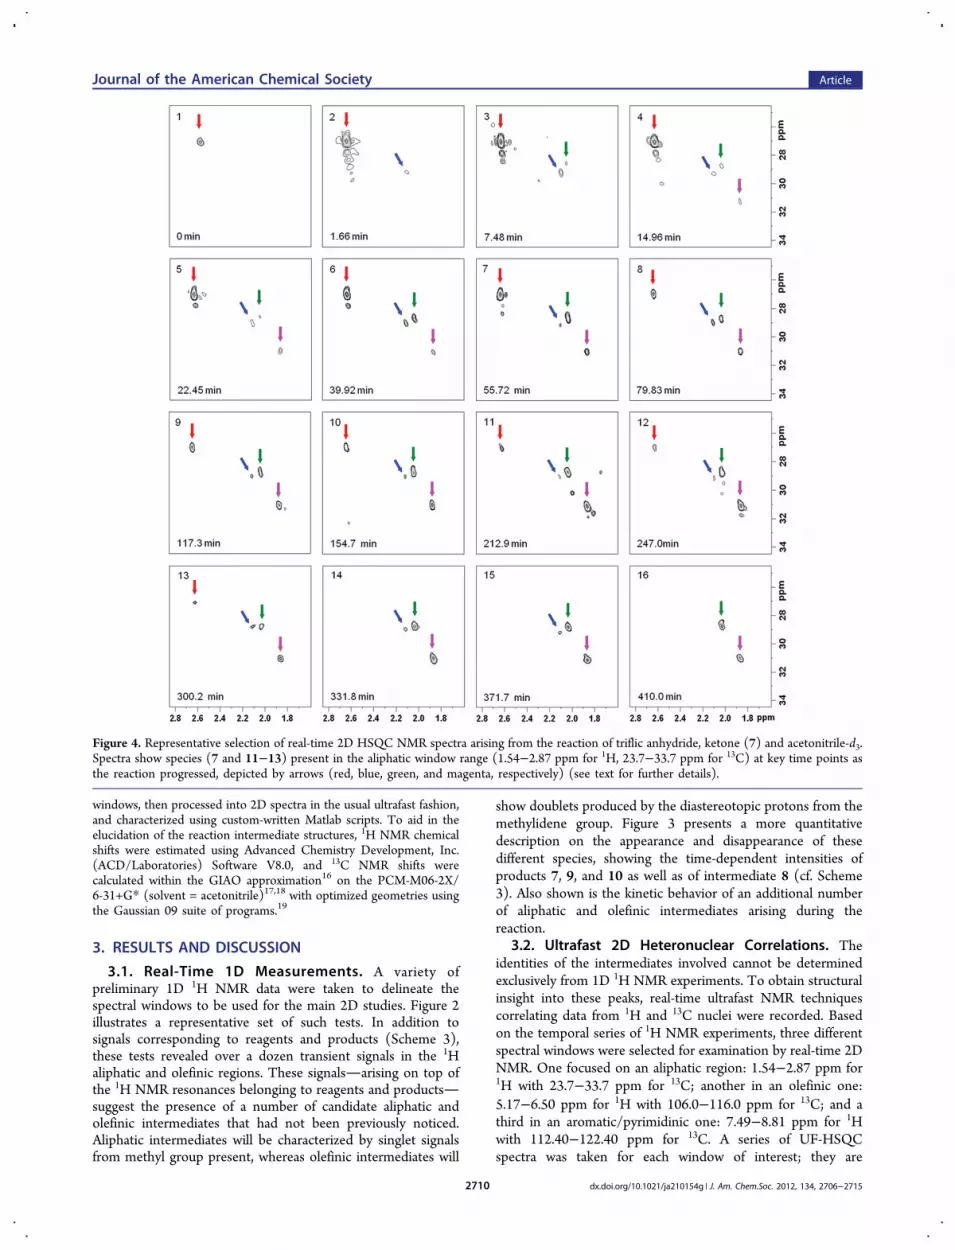
3.2. Ultrafast 2D Heteronuclear Correlations. Theidentities of the intermediates involved cannot be determinedexclusively from 1D 1H NMR experiments. To obtain structuralinsight into these peaks, real-time ultrafast NMR techniquescorrelating data from 1H and 13C nuclei were recorded. Basedon the temporal series of 1H NMR experiments, three differentspectral windows were selected for examination by real-time 2DNMR. One focused on an aliphatic region: 1.54−2.87 ppm for1H with 23.7−33.7 ppm for 13C; another in an olefinic one:5.17−6.50 ppm for 1H with 106.0−116.0 ppm for 13C; and athird in an aromatic/pyrimidinic one: 7.49−8.81 ppm for 1Hwith 112.40−122.40 ppm for 13C. A series of UF-HSQCspectra was taken for each window of interest; they are
Figure 4. Representative selection of real-time 2D HSQC NMR spectra arising from the reaction of triflic anhydride, ketone (7) and acetonitrile-d3.Spectra show species (7 and 11−13) present in the aliphatic window range (1.54−2.87 ppm for 1H, 23.7−33.7 ppm for 13C) at key time points asthe reaction progressed, depicted by arrows (red, blue, green, and magenta, respectively) (see text for further details).
Journal of the American Chemical Society Article
dx.doi.org/10.1021/ja210154g | J. Am. Chem.Soc. 2012, 134, 2706−27152710
illustrated in Figures 4 and 5. Colored arrows in these plotsdenote cross-peaks representing reagents, products, andintermediates that participate in the reaction. Cross-peaksassigned to starting ketone (7) and final products vinyl triflate(10) and pyrimidine (9) were confirmed by 1D and 2D spectra(see the Supporting Information). Values of chemical shifts ofhighlighted (bold) nuclei are shown in Scheme 4.
Figure 4 illustrates a series of representative 2D UF-HSQCspectra recorded for the aliphatic window at ca. 30 s delay. Atotal of 500 HSQC spectra was taken in a typical kineticprogression, where data acquisition was begun immediatelyprior to the sudden addition of triflic anhydride to a solution ofketone (7) in acetonitrile-d3 (Figure 4 highlights only 16 ofthese, a full 3D animation made from the total set of HSQCexperiments is given as Supporting Information). Prior to theTf2O injection, the cross-peak of the methyl group of (7) isclearly observed (0 min, red arrow). 1.66 min after initiation ofthe reaction a new cross-peak at δ = 2.09/28.40 ppm (bluearrow) is seen. Then, at ca. 7.48 and 14.97 min, two additional
cross-peaks at 2.02/28.10 ppm (green arrow) and 1.82/30.30ppm (magenta arrow), respectively, were clearly detected. Theintensity of these cross-peaks changed with time, rising andfalling during the course of the reaction (see Figure 6).A series of representative 2D UF-HSQC spectra were
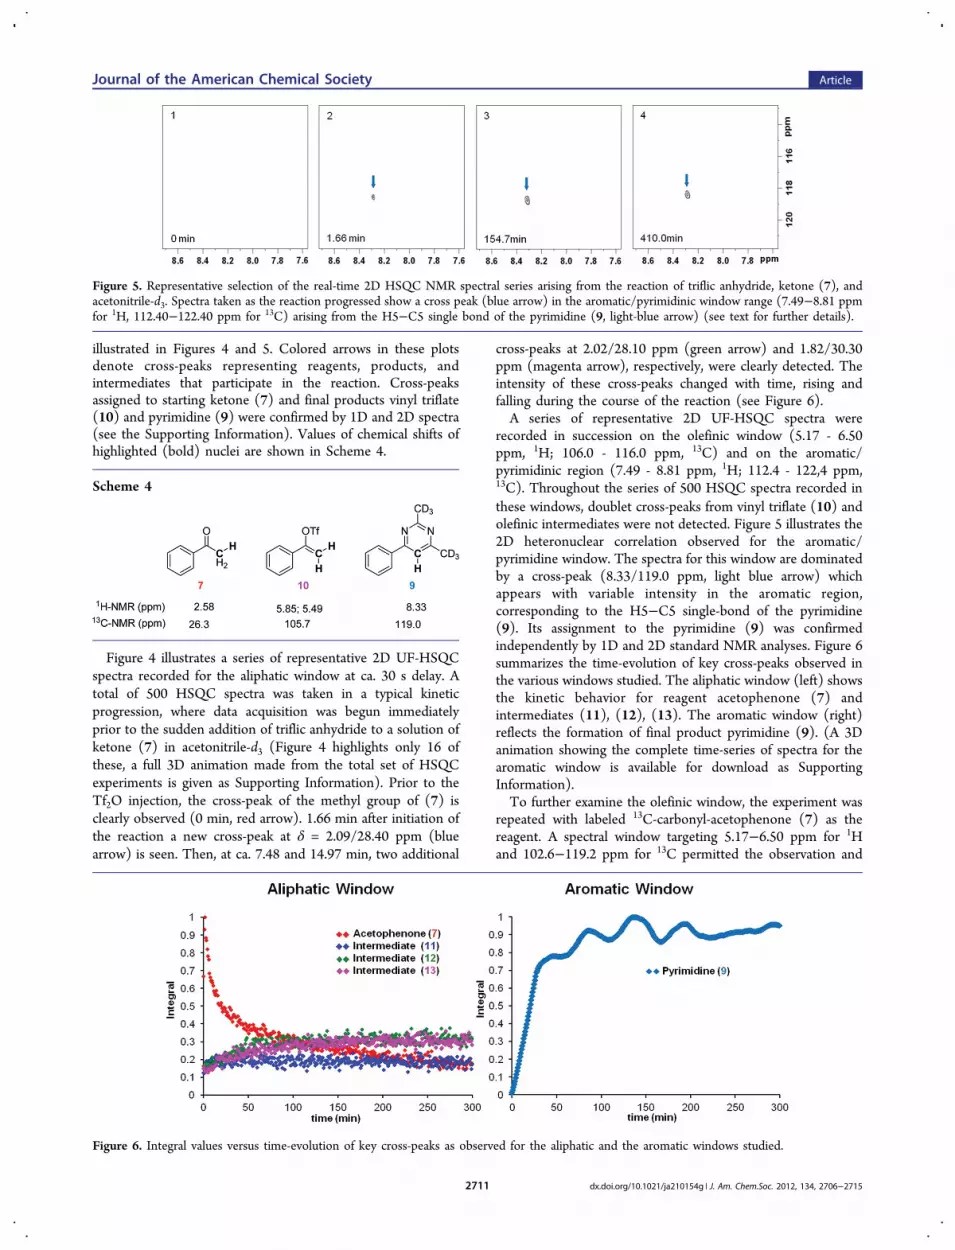
recorded in succession on the olefinic window (5.17 - 6.50ppm, 1H; 106.0 - 116.0 ppm, 13C) and on the aromatic/pyrimidinic region (7.49 - 8.81 ppm, 1H; 112.4 - 122,4 ppm,13C). Throughout the series of 500 HSQC spectra recorded inthese windows, doublet cross-peaks from vinyl triflate (10) andolefinic intermediates were not detected. Figure 5 illustrates the2D heteronuclear correlation observed for the aromatic/pyrimidine window. The spectra for this window are dominatedby a cross-peak (8.33/119.0 ppm, light blue arrow) whichappears with variable intensity in the aromatic region,corresponding to the H5−C5 single-bond of the pyrimidine(9). Its assignment to the pyrimidine (9) was confirmedindependently by 1D and 2D standard NMR analyses. Figure 6summarizes the time-evolution of key cross-peaks observed inthe various windows studied. The aliphatic window (left) showsthe kinetic behavior for reagent acetophenone (7) andintermediates (11), (12), (13). The aromatic window (right)reflects the formation of final product pyrimidine (9). (A 3Danimation showing the complete time-series of spectra for thearomatic window is available for download as SupportingInformation).To further examine the olefinic window, the experiment was
repeated with labeled 13C-carbonyl-acetophenone (7) as thereagent. A spectral window targeting 5.17−6.50 ppm for 1Hand 102.6−119.2 ppm for 13C permitted the observation and
Figure 5. Representative selection of the real-time 2D HSQC NMR spectral series arising from the reaction of triflic anhydride, ketone (7), andacetonitrile-d3. Spectra taken as the reaction progressed show a cross peak (blue arrow) in the aromatic/pyrimidinic window range (7.49−8.81 ppmfor 1H, 112.40−122.40 ppm for 13C) arising from the H5−C5 single bond of the pyrimidine (9, light-blue arrow) (see text for further details).
Scheme 4
Figure 6. Integral values versus time-evolution of key cross-peaks as observed for the aliphatic and the aromatic windows studied.
Journal of the American Chemical Society Article
dx.doi.org/10.1021/ja210154g | J. Am. Chem.Soc. 2012, 134, 2706−27152711

comparison of olefinic products and intermediates. A total of1200 HSQC spectra taken under these conditions within thecourse of the reaction revealed, in addition to the expecteddoublet of cross-peaks from vinyl triflate (10, purple arrow), anew doublet of cross-peaks (Figure 7). The rise and fall of thesecross-peaks (dark-yellow arrows) show its character asintermediate. Figure 7 (bottom) also displays the kineticbehavior of the new olefinic intermediates (14) and/or (15).Additionally the presence of a time-increasing cross-peak at6.20/106.5 was observed. As seen in Figure 7, the kinetics ofthe vinyl triflate (10) are in good agreement with those seeninitially in the nonlabeled reaction. For a 3D animation see theSupporting Information.
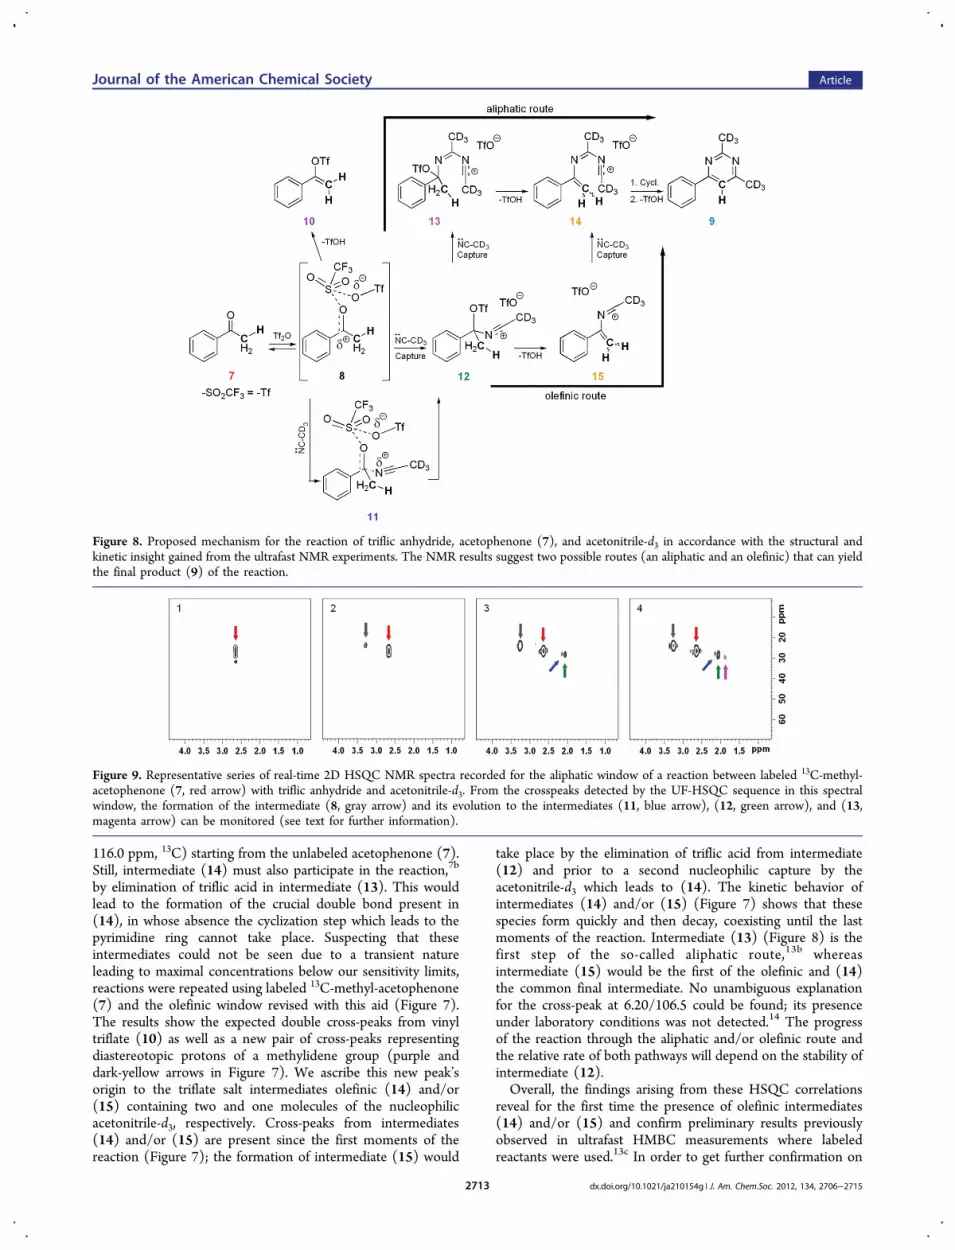
4. DISCUSSIONThe time-evolution of the peak intensities observed in thevarious real-time 1D and 2D spectra illustrated in the precedingsection suggest a complex sequence of events underlying theevolution of the starting acetophenone (7) to the finalpyrimidine (9). A mechanism capable of rationalizing all theobserved peaks is depicted in Figure 8. The HSQC seriesrecorded on the 1.54−2.87 ppm, 1H, and 23.7−33.7 ppm, 13Caliphatic window, indicates that the reaction starts with an
electrophilic attack of the S-atom of one of the SO2 groups oftriflic anhydride on the O-atom of the carbonyl group ofacetophenone (7) leading to the rapid formation of anintermediate (8), whose presence we have detected in thepast by ultrafast 2D HMBC experiments,13c,20 but whose cross-peaks fall outside the window targeted here. Evolution of (8) bynucleophilic capture by acetonitrile-d3 leads to the complex(11), which evolves to the nitrilium-salt intermediate (12).21,22
The reaction continues, and an additional nucleophilic captureby the acetonitrile-d3 takes place forming intermediate (13). Inorder to confirm these intermediates, measurements wererepeated using labeled 13C-methyl-acetophenone (7) and astandard UF-HSQC sequence,23 which permits monitoring of(examination) an expanded acquisition window (4.50−0.50ppm, 1H; 63.60−3.60 ppm, 13C). These results frommonitoring of the methyl labeled reactant (7) confirmed theformation of intermediate (8) and its evolution to inter-mediates (11−13) (Figure 9).Elimination of triflic anhydride from intermediate (8) would
lead to vinyl triflate (10), which should form as a side product.Cross-peaks from (10) and/or from other possible olefinicintermediates like (14), however, were not observed in theHSQC of the olefinic window (5.17−6.50 ppm, 1H; 106.0−
Figure 7. Representative selection of real-time 2D HSQC NMR spectra arising from the reaction of triflic anhydride, labeled 13C-methyl-acetophenone (7), and acetonitrile-d3. Spectra show species (10) and (14/15) present for the olephinic window range (5.17−6.50 ppm 1H, 102.6−119.2 ppm 13C) indicated by purple and dark-yellow arrows, respectively (top). The left bottom panel shows the time-dependent peak intensities(integrals) of the vinyl triflate (10) and the newly found intermediates (14/15) which represent the variation in their respective concentrationsduring the course of the reaction. The right bottom panel shows the olefinic peaks in a 1H NMR spectrum of isolated and purified vinyl triflate.
Journal of the American Chemical Society Article
dx.doi.org/10.1021/ja210154g | J. Am. Chem.Soc. 2012, 134, 2706−27152712
116.0 ppm, 13C) starting from the unlabeled acetophenone (7).Still, intermediate (14) must also participate in the reaction,7b
by elimination of triflic acid in intermediate (13). This wouldlead to the formation of the crucial double bond present in(14), in whose absence the cyclization step which leads to thepyrimidine ring cannot take place. Suspecting that theseintermediates could not be seen due to a transient natureleading to maximal concentrations below our sensitivity limits,reactions were repeated using labeled 13C-methyl-acetophenone(7) and the olefinic window revised with this aid (Figure 7).The results show the expected double cross-peaks from vinyltriflate (10) as well as a new pair of cross-peaks representingdiastereotopic protons of a methylidene group (purple anddark-yellow arrows in Figure 7). We ascribe this new peak’sorigin to the triflate salt intermediates olefinic (14) and/or(15) containing two and one molecules of the nucleophilicacetonitrile-d3, respectively. Cross-peaks from intermediates(14) and/or (15) are present since the first moments of thereaction (Figure 7); the formation of intermediate (15) would
take place by the elimination of triflic acid from intermediate(12) and prior to a second nucleophilic capture by theacetonitrile-d3 which leads to (14). The kinetic behavior ofintermediates (14) and/or (15) (Figure 7) shows that thesespecies form quickly and then decay, coexisting until the lastmoments of the reaction. Intermediate (13) (Figure 8) is thefirst step of the so-called aliphatic route,13b whereasintermediate (15) would be the first of the olefinic and (14)the common final intermediate. No unambiguous explanationfor the cross-peak at 6.20/106.5 could be found; its presenceunder laboratory conditions was not detected.14 The progressof the reaction through the aliphatic and/or olefinic route andthe relative rate of both pathways will depend on the stability ofintermediate (12).Overall, the findings arising from these HSQC correlations
reveal for the first time the presence of olefinic intermediates(14) and/or (15) and confirm preliminary results previouslyobserved in ultrafast HMBC measurements where labeledreactants were used.13c In order to get further confirmation on
Figure 8. Proposed mechanism for the reaction of triflic anhydride, acetophenone (7), and acetonitrile-d3 in accordance with the structural andkinetic insight gained from the ultrafast NMR experiments. The NMR results suggest two possible routes (an aliphatic and an olefinic) that can yieldthe final product (9) of the reaction.
Figure 9. Representative series of real-time 2D HSQC NMR spectra recorded for the aliphatic window of a reaction between labeled 13C-methyl-acetophenone (7, red arrow) with triflic anhydride and acetonitrile-d3. From the crosspeaks detected by the UF-HSQC sequence in this spectralwindow, the formation of the intermediate (8, gray arrow) and its evolution to the intermediates (11, blue arrow), (12, green arrow), and (13,magenta arrow) can be monitored (see text for further information).
Journal of the American Chemical Society Article
dx.doi.org/10.1021/ja210154g | J. Am. Chem.Soc. 2012, 134, 2706−27152713

the nature of the detected intermediates, we exploited thevaluable insight arising from the chemical shifts observed alongthe correlated 1H and 13C dimensions. Table 1 shows the
experimental chemical shifts arising from the ultrafast series andcompares them against expectations stemming from the variousstructures that are postulated to participate in the reactionscheme proposed in Figure 8. The 1H NMR chemical shiftestimations were performed for the nitrilium-salt intermediates(12−15), using the commercial chemical shift calculatorsoftware ACD/Laboratories (release 8.00). 13C NMR shiftswere calculated within the GIAO approximation on the PCM-M06-2X/6-31+G* (solvent = acetonitrile) with optimizedgeometries using the Gaussian 09 suite of programs. In all caseswe find very good agreement between the observed values andthe values predicted/calculated for the postulated structures;these calculations permit to distinguish between (14) and (15)and assign (14) to the triflic olefinic nitrilium-salt intermediateformed.
5. CONCLUSIONS
The real-time spectroscopic approaches herein describedallowed us to uncover a new and interesting sequence ofevents in the mechanistic pathway of the alkylpyrimidineformation from aliphatic ketones and alkyl nitriles promoted bytriflic anhydride. This was largely thanks to the advent of newultrafast 2D NMR techniques that, operating under lowgradients made possible by the use of selective band excitations,succeeded in monitoring the organic reaction using unlabeledcompounds. Using this new selective and low-gradient-strengthbased UF sequence, it was possible to confirm the presence ofintermediates reported in earlier studies such as (8) and (14) aswell as intermediates (11−13) that were here detected for thefirst time. Estimations and calculations of NMR chemical shiftsare in very good agreement with the proposed structures. Thesefindings have permitted us to propose for the first time a new
and complete mechanism involving two different andconcurrent pathwaysone aliphatic and the other olefinicfor the progress of the reaction. The evolution from the startingketone to the final pyrimidine could be monitored andrationalized in high detail. In summary, we believe that real-time dynamic 2D NMR methodologies of the kind described inthis work could open valuable new ways in the kineticmonitoring and characterization of complex dynamic chemicalsystems and in the elucidation of the variety of mechanismsunderlying these transformations.
■ ASSOCIATED CONTENT*S Supporting InformationFurther details regarding experimental procedures, 1D and 2Dspectra of products, and 3D animations. Complete ref 19. Thismaterial is free of charge via the Internet at http://pubs.acs.org.
■ AUTHOR INFORMATIONCorresponding [email protected]; [email protected]
■ ACKNOWLEDGMENTSThe authors acknowledge financial support from MICINN(grant CTQ2010-14936), the Israel Science Foundation (ISF447/09), ERC Advanced grant no. 246754, EU’S BioNMRgrant no. 261863, a Helen and Kimmel Award for InnovativeInvestigation, and the generosity of the Perlman FamilyFoundation. G.O. acknowledges postdoctoral support fromthe Feinberg Graduate School (Dean Fellowship) and from theFulbright Foundation. Z.P. acknowledges Universidad Com-plutense de Madrid for a predoctoral fellowship. We gratefullyacknowledge Dr. Israel Fernandez and Angel Sanchez (UCM)for theoretical calculations and predictions of 13C chemicalshifts.
■ REFERENCES(1) (a) Pozharskii, A. F.; Soldatenkov, A. T.; Katritzky, A. R. InHeterocycles in Life and Society; Wiley-VCH: Weinheim, Germany,1997. (b) Eicher, T.; Hauptmann, S. In The Chemistry of Heterocycles,2nd ed.; Wiley-VCH: Weinheim, Germany, 2003. (c) Katritzky, A. R.In Advances in Heterocyclic Chemistry; Academic Press: Oxford, U.K.,2002; Vol.82.(2) Rewcastle, G. W. In Comprehensive Heterocyclic Chemistry III;Aitken, A., Ed.; Elsevier Science: Oxford, U.K., 2008; Vol, 8, pp117.Ahmad, O. K.; Hill, M. D.; Movassaghi, M. J. Org. Chem. 2009, 74,8460−8463.(3) (a) von Angerer, S. In Science of Synthesis; Yamamoto, Y., Ed.;Thieme: Stuttgart, Germany, 2003; Vol. 16, pp 379. (b) Hill, M. D.;Movassaghi, M. Chem.−Eur. J. 2008, 14, 6836−6844.(4) (a) Herrera, A.; Martínez-Alvarez, R.; Ramiro, P.; Molero, D.;Almy, J. J. Org. Chem. 2006, 71, 3026−3032. (b) Herrera, A.;Martínez-Alvarez, R.; Martín, N.; Chioua, M.; Chioua, R.; Sanchez-Vazquez, A.; Molero, D.; Almy, J. Tetrahedron 2009, 65, 1697−1703.(c) Herrera, A.; Martínez-Alvarez, R.; Martín, N.; Chioua, M.; Chioua,R.; Sanchez-Vazquez, A.; Molero, D.; Almy, J. Tetrahedron 2009, 65,5817−5823. (d) Herrera, A.; Martínez-Alvarez, R.; Ramiro, P.;Sanchez, A.; Torres, R. J. Org. Chem. 2004, 69, 4545−4547.(e) Martínez-Alvarez, R.; Herrera, A. Targets Heterocycl. Syst. 2008,12, 59−85.(5) (a) Movassaghi, M.; Hill, M. D. J. Am. Chem. Soc. 2006, 128,14254−14255. (b) Movassaghi, M.; Hill, M. D. J. Am. Chem. Soc. 2006,128, 4592−4593. (c) Hill, M. D.; Movassaghi, M. Synthesis 2007,1115−1119. (d) Movassaghi, M.; Hill, M. D. Nat.Protoc. 2007, 2,2018−2023. (e) Ahmad, O. K.; Hill, M. D.; Movassaghi, M. J. Org.Chem. 2009, 74, 8460−8463. (f) Menor-Salvan, C.; Ruiz-Bermejo, M.;
Table 1. Observed and Calculated Chemical Shifts of theDifferent Species Involved in the Reaction
observed(CD3CN)
a calculated (CDCl3)b calculated Gaussian 09d
1H 13C 1H 13C
7 2.64 26.33 2.60 24,70f
196.90 193.05f (216.00)e
8 3.26 23.71 28.75e
195.2 202.40e
9a,c 8.33 119.01 6.85 123.02e
10 5.85 105.76 5.94 103.20f (118.60e)5.49 4.50
11 2.09 28.40 31.21e
12 2.01 28.05 1.64 33.60e
13 1.84 30.26 2.04 33.30e
14 5.89 114.50 5.08 110.70e
5.54 4.9715 5.89 114.50 5.15 146.60e
5.54 4.99aSee the Supporting Information. bAveraged values of chemical shiftsACD/Laboratories (release 8.00). cDifferences between observed andcalculated chemical shifts are due to the nature of solvent. dCalculatedwith TMS (13C = TMS value Gaussian 09 − value 13C compoundGaussian 09). eObtained with M06-2X approximation. fObtained withB3LYP approximation.
Journal of the American Chemical Society Article
dx.doi.org/10.1021/ja210154g | J. Am. Chem.Soc. 2012, 134, 2706−27152714

Guzman, G. I.; Osuna-Esteban, S.; Veintemillas-Verdaguer, S. Chem.−Eur. J. 2009, 15, 4411−4418. (g) Bannwarth, P.; Vailleix, A.; Gree, D.;Gree, R. J. Org. Chem. 2009, 74, 4646−4649. (h) Yan, S.; Tang, Y.; Yu,F.; Lin, J. Helv. Chim. Acta 2011, 94, 487−490. (i) Lin, M.; Chen, Q-z.;Zhu, Y.; Chen, X-l.; Cai, J-j.; Pan, Y-m.; Zhan, Z-p. Synlett 2011,1179−1183.(6) Lai, P-S; Taylor, M. S. Synthesis 2010, 1449−1452.(7) (a) García Martínez, A.; Herrera Fernandez, A.; Moreno Jimenez,F.; García Fraile, A.; Subramanian, L. R.; Hanack, M. J. Org. Chem.1992, 57, 1627−1630. (b) Herrera, A.; Martínez-Alvarez, R.; Chioua,M.; Chioua, R.; Sanchez, A. Tetrahedron 2002, 58, 10053−10058.Chemical transformations induced by triflic anhydride were reviewed,see: (c) Baraznenok, I. L.; Nenajdenko, V. G.; Balenkova, E. S.Tetrahedron 2000, 56, 3077−3119.(8) (a) Kupce, E.; Nishida, T.; Freeman, R. Prog. Nucl. Magn. Reson.Spectrosc. 2003, 42, 95−122. (b) Kupce, E.; Freeman, R. J. Magn.Reson. 2003, 162, 300−310.(9) Hoch, J. C.; Stern, A. S. Method Enzymol. 2001, 338, 159−78.(10) (a) Gal, M.; Frydman, L. In Multidimensional NMR methods forthe Solution State; Morris, G. A., Emsley, J. W., Eds.; Wiley&Sons:Chichester, U.K., 2010; pp 43−60. (b) Mishkovsky, M.; Frydman, L.Annu. Rev. Phys. Chem. 2009, 60, 429−448.(11) Frydman, L.; Scherf, T.; Lupulescu.. Proc. Natl. Acad. Sci. U.S.A.2002, 99, 15958−15862.(12) (a) Gal, M.; Schanda, P.; Brutscher.; Frydman, L. J. Am. Chem.Soc. 2007, 129, 1372−1377. (b) Gal, M.; Lee, M. K.; Varani, G.;Frydman, L. Proc. Natl. Acad. Sci. U.S.A. 2010, 107, 9192−9197.(13) (a) Gal, M.; Mishkovsky, M.; Frydman, L. J. Am. Chem. Soc.2006, 128, 951−956. (b) Herrera, A.; Fernandez-Valle, E.; Martínez-Alvarez, R.; Molero, D.; Pardo, Z. D.; Saez, E.; Gal, M. Angew. Chem.,Int. Ed. 2009, 48, 6274−6277. (c) Herrera, A.; Fernandez-Valle, E.;Gutierrez, E. M.; Martínez-Alvarez, R.; Molero, D.; Pardo, Z. D.; Saez,E. Org. Lett. 2010, 12, 144−147.(14) (a) Pelupessy, P.; Duma, L.; Bodenhausen, G. J. Magn. Reson.2008, 194, 169−174. (b) Shrot, Y.; Frydman, L. J. Chem. Phys. 2009,131, 224516/1−224516/11. (c) Giradeau, P.; Shrot, Y.; Frydman, L. J.Am. Chem. Soc. 2009, 131, 13902−13903. (d) Giradeau, P.; Akoka, S.J. Magn. Reson. 2010, 205, 171−176.(15) Brunner, P.; Ernst, R. R. J. Magn. Reson. 1979, 33, 83−106.(16) Wolinski, K.; Hinton, J. F.; Pulay, P. J. Am. Chem. Soc. 1990,112, 8251−8260.(17) M06−2X method: Zhao, Y.; Truhlar, D. G. Acc. Chem. Res.2008, 41, 157−167.(18) PCM method: (a) Miertus, S.; Scrocco, E.; Tomasi, J. Chem.Phys. 1981, 55, 117−129. (b) Pascual-Ahuir, J. L.; Silla, E.; Tunon, I. J.Comput. Chem. 1994, 15, 1127−1138. (c) Barone, V.; Cossi, M. J.Phys. Chem. A 1998, 102, 1995−2001.(19) Frisch, M. J. et al. Gaussian 09, revision B.01, Gaussian, Inc.:Wallingford, CT, 2009.(20) 13C NMR data for carbocations: (a) Breitmeier, E.; Voelter, W.In Carbon-13 NMR Spectroscopy, 3rd ed.; VCH: New York, 1987.(b) Stadler, D.; Goeppert, A.; Rasul, G.; Olah, G. A.; Prakash, S.; Bach,T. J. Org. Chem. 2009, 74, 312−318.(21) Kanemasa, S. In Science of Synthesis; Murahashi, S., Ed.; Thieme:Stuttgart, 2001; Vol 19, pp 53−65.(22) (a) Darbeau, R. W.; Gibble, R. E.; Pease, R. S.; Bridges, D. E.;Siso, L. M.; Heurtin, D. J. J. Chem. Soc., Perkin Trans. 2 2001, 1084−1090. (b) White, E. H.; DePinto, J. T.; Polito, A. J.; Bauer, I.; Roswell,D. F. J. Am. Chem. Soc. 1988, 110, 3708−3709.(23) Shrot, Y.; Shapira, B.; Frydman, L. J. Magn. Reson. 2004, 171,163−170.
Journal of the American Chemical Society Article
dx.doi.org/10.1021/ja210154g | J. Am. Chem.Soc. 2012, 134, 2706−27152715