momentum trading by institutions
TRANSCRIPT
Momentum Trading by Institutions
S.G. BADRINATH and SUNIL WAHAL*
ABSTRACTWe document the equity trading practices of approximately 1,200 institutions fromthe third quarter of 1987 through the third quarter of 1995. We decompose tradingby institutions into the initiation of new positions ~entry!, the termination of pre-vious positions ~exit!, and adjustments to ongoing holdings. Institutions act as mo-mentum traders when they enter stocks but as contrarian traders when they exitor make adjustments to ongoing holdings. We find significant differences in trad-ing practices among different types of institutions.
IN A CELEBRATED ARTICLE published almost a half century ago, Friedman ~1953!argues that rational speculation must stabilize asset prices. More recently,DeLong et al. ~1990! show that momentum traders ~also referred to as trendchasers or positive feedback traders! can, in fact, destabilize stock prices andthereby threaten the efficiency of financial markets. DeLong et al.’s proofhas inspired numerous empirical investigations that focus almost exclu-sively on the behavior of institutional investors. There are at least two rea-sons for this focus. First, a large fraction of corporate equity is held byinstitutional investors; institutional ownership of shares in U.S. firms in-creased from approximately 7 percent in 1950 to over 50 percent in 1999~Federal Reserve Board, 2000!. Second, institutions are frequently alleged toherd and to follow potentially destabilizing investment strategies ~see, e.g.,Lakonishok, Shleifer, and Vishny ~1992a!!.1 DeLong et al. note that trend
* Badrinath is with the College of Business Administration, San Diego State University.Wahal is with the Goizueta Business School, Emory University. Portions of this research werecompleted while the first author was at Rutgers University. Mehmet Ozbilgin and Vassil Mihovprovided helpful research assistance. Doug McIntyre and Ron Harris provided excellent com-putational assistance. We thank an anonymous referee, Hank Bessembinder, Jeff Busse, Jen-nifer Conrad, Richard Green, Paul Irvine, Steve Jones, Bing Liang, Laura Starks ~the AFAdiscussant!, Russ Wermers, Marc Zenner, and seminar participants at SMU, the University ofKansas, the University of Western Ontario, the American Finance Association meetings in Bos-ton, the EFMA meetings in Barcelona, and the SFA meetings in Florida for valuable comments.We also thank Stephen Packs of the Office of Legal Disclosure, Securities and Exchange Com-mission, for assistance in interpreting 13-F rulings.
1 The correlation between changes in institutional ownership and other equity market phe-nomena has also not gone unnoticed. Campbell et al. ~2001! document an increase in firm-levelvolatility between 1962 and 1997 and speculate that the increase in institutional ownershipmay be responsible for this effect. Malkiel and Xu ~1999! find evidence consistent with thisidea. Other studies suggest that institutional trading might be responsible for the turn-of-the-year effect ~Sias and Starks ~1997a!!, serial correlation in daily returns ~Sias and Starks ~1997b!!,the small-firm effect ~Gompers and Metrick ~2001!!, or cross-autocorrelation in equity returns~Badrinath, Kale, and Noe ~1995!!.
THE JOURNAL OF FINANCE • VOL. LVII, NO. 6 • DECEMBER 2002
2449

chasing can cause momentum ~or positive autocorrelation! in stock prices.This causal link between trend chasing and price momentum also underliesHong and Stein’s ~1999! behavioral model, in which trading by one class ofagents produces momentum in stock prices. Hong and Stein’s model explic-itly requires the presence of momentum traders, and in a discussion of theempirical implications of their model, they specifically point to momentumtrading by institutions.
A growing number of empirical studies address momentum trading byinstitutions, with somewhat conf licting results. Lakonishok et al. ~1992a!analyze the quarterly holdings of a sample of pension funds and find littleevidence of momentum trading. Grinblatt, Titman, and Wermers ~1995!examine the quarterly holdings of 274 mutual funds and find that 77 per-cent of the funds in their sample engage in momentum trading ~see alsoWermers ~1999!!. Nofsinger and Sias ~1999! examine total institutional hold-ings of individual stocks and find evidence of intraperiod momentum trad-ing. Using a different sample, Gompers and Metrick ~2001! investigate therelation between institutional holdings and lagged returns and conclude thatonce they control for firm size, there is no evidence of momentum trading.
These studies are limited in their ability to capture the full range of in-stitutional trading practices, in part because they restrict their cross-sectional analysis to particular subsets of institutions. Lakonishok et al. ~1992a!consider only pension funds, and Grinblatt et al. ~1995! and Wermers ~1999!consider only mutual funds. They are also limited because they examineaggregate institutional holdings in a firm ~as in Nofsinger and Sias ~1999!and Gompers and Metrick ~2001!!. Since different institutions are often buy-ers and sellers in the same securities, aggregating their holdings obscuresthe correlation between changes in individual portfolio holdings and pastreturns. Finer data confirm that institutions are frequently the marginaltrader and are often on both sides of a trade.2
We examine a broad range of institutions and employ a methodology thatreveals complex patterns in institutional trading. We investigate changes inthe quarterly portfolio holdings of pension funds, mutual funds, investmentadvisors, insurance companies, commercial banks and trusts, investment banksand brokers, and colleges and foundations. Our methodology separates changesin quarterly portfolio holdings into ~1! the initiation of a new position in astock ~entry!, ~2! the termination of a previous position in a stock ~exit!, and~3! other additions to or reductions in existing positions ~adjustments to on-going holdings!. This decomposition links our empirical work to theoreticalmodels such as Hong and Stein ~1999!, in which entry and exit decisionsconvey more information than adjustments to ongoing holdings because ofconstraints on short sales.
2 Internal analysis of audit trail data by the NYSE Research Department indicates that inMay 2000 ~the most recent month for which figures are available!, institutional investors ac-counted for 64 percent of all order f low. The remainder is accounted for as follows: individualinvestors ~4 percent!, broker-dealers ~27 percent!, f loor-entered orders ~3 percent!, and uniden-tified ~2 percent!. We are grateful to George Sofianos for providing this information.
2450 The Journal of Finance

Our data consist of the quarterly equity holdings of 1,200 institutions thatfiled a 13-F statement with the SEC from the third quarter of 1987 throughthe third quarter of 1995. These holdings represent approximately 6.7 mil-lion portfolio positions and an equity market value of $1.8 trillion towardthe end of our sample period. We follow Grinblatt et al. ~1995! and measuremomentum trading as the cross-product of lagged returns and changes ineach institution’s portfolio weights. We detect only modest evidence of mo-mentum trading over our sample period. The average cross-product of changesin portfolio weights and one-quarter ~one-year! lagged returns is five ~seven!basis points. This implies that, on average, the returns on stocks held byinstitutions at the end of a quarter are only five basis points higher than onstocks held at the beginning of the previous quarter.
The decomposition of changes in holdings into entry, exit, and adjustmentsto ongoing holdings produces a richer set of results. Entry and exit togetheraccount for almost 25 percent of all changes in portfolio holdings. Institu-tions initiate positions in a stock after price increases; for entry, the averagecross-product of changes in portfolio weights and one-quarter ~one-year! laggedreturns is 0.26 percent ~1.2 percent!. Institutions also terminate previouspositions in a stock after price increases; for exit, at the one-quarter ~one-year! horizon, the average cross-product is 20.13 percent ~20.83 percent!.Thus, institutions act as momentum traders when they initiate new posi-tions in a stock and as contrarian traders when they terminate previouspositions in a stock. For adjustments to ongoing holdings, the average cross-products are 20.08 percent for the one-quarter horizon and 20.31 percentfor the one-year horizon.
Entry and exit are concentrated in the shares of small firms with highreturn volatility, while adjustments to ongoing holdings are more common inthe shares of larger firms. The proportion of the dollar value of an institu-tion’s portfolio devoted to entry is positively related to lagged returns. Theseresults are consistent with the predictions of the Hong and Stein ~1999!model. Hong and Stein introduce the notion of a “momentum cycle,” whichthey define as the period of positive return autocorrelation subsequent tothe arrival of news. Traders who initiate a position in a stock early in themomentum cycle generate positive profits from continued upward price mo-mentum, while late entrants suffer losses due to price reversals followingthe cycle. Thus, the profitability of momentum trading is related to the trad-er ’s ability to time entry and exit. Lee and Swaminathan ~2000! note thatthe turning point between momentum and reversal is not easily determinedex ante and empirically confirm that late-cycle momentum trading gener-ates negative profits. If institutions invest at different points in the momen-tum cycle, then entry-to-exit returns should be equal to zero, on average.This is precisely the result that we observe—average entry-to-exit excessreturns are close to zero for all holding periods of up to six quarters, and thedistribution of momentum traders in the early and late stages of the cycle isessentially uniform.
Such diversity in trading behavior is also evident when we examine theportfolios of different types of institutions. The sensitivity of changes in hold-
Momentum Trading by Institutions 2451

ings to past returns is significantly higher for investment advisors and mu-tual funds than for pension funds and banks. This is particularly importantbecause investment advisors and mutual funds represent two of the largestsectors of the active money management industry and are the most widelystudied. Further, when we classify institutions by their investment styles,we find that growth and growth-and-value institutions are momentum trad-ers, but that institutions following value-based strategies are contrarian.
Our results are relevant for the literatures on both institutional tradingand asset pricing. Given the extremely small correlation between changes inholdings and lagged returns at the portfolio level, there appears to be littlereason to view institutional trading as generally destabilizing to asset prices.Our results also suggest that focusing on particular subsets of institutionsprovides an incomplete view of the trading landscape, accounting at least inpart for the apparent differences in results documented by other studies. Forexample, Gompers and Metrick ~2001! find no evidence of momentum trad-ing using changes in firm-level institutional ownership, because momentumtrading by mutual funds is offset by contrarian trading by other institutions.From an asset pricing perspective, the large cross-sectional variation in trad-ing behavior lends itself to alternative interpretations. On the one hand,Hong and Stein ~1999, p. 2167! argue that “such heterogeneity cannot beunderstood in the context of the standard rational model, where there is onlyone correct style, that which processes all available information in an opti-mal fashion.” On the other hand, a set of traders following a particular ~de-stabilizing! investment strategy should, in a rational world, create arbitrageopportunities that elicit an offsetting investment style. We document pre-cisely such variation in investment styles.
The paper proceeds as follows. Section I discusses the data and sampleconstruction. Section II explores various ways to measure momentum trad-ing. Section III presents empirical results. Section IV discusses robustnessissues and additional results. Section V concludes.
I. Data and Sample Construction
Our holdings data come from filings by institutions under Section 13-F ofthe Securities and Exchange Act of 1934. We provide a brief description ofthese rules and procedures below. A more complete description of regulationscan be found in Lemke and Lins ~1987!.
A. Reporting Requirements
Section 13-F stipulates that all investment managers with discretion over13-F securities worth $100 million or more must report their holdings to theSEC at the end of each quarter. Thirteen-F securities include common stock,preferred stock, and convertible debt. The SEC’s definition of investmentmanagers includes banks, investment advisors ~both domestic and foreign!,nonprofit institutions, investment companies, pension funds, colleges and
2452 The Journal of Finance

foundations, insurance companies, broker-dealers, and investment banks.State pension funds are not required to file 13-F statements, but some, suchas CalPERS, do so voluntarily. Investment discretion is generally defined asthe de jure or de facto power to buy or sell securities. It is important that thepower of security selection be vested with the institution, because our inter-est is in the relation between trading by institutions and past-period re-turns. When two or more investment managers share investment discretion,only one manager reports holdings to the SEC. Despite efforts to relate re-porting requirements to investment discretion, aggregation can add noise tothe measurement of trading behavior, particularly for mutual funds. Forexample, all the holdings of Fidelity ’s individual mutual funds are aggre-gated and reported under Fidelity Management and Research. The portfoliomanagers of the various individual mutual funds under the Fidelity um-brella might exercise investment discretion and pursue different investmentstyles, but 13-F reporting requirements do not capture this distinction.
B. Sample Construction
We obtain quarterly institutional holdings for all NYSE, AMEX, and Nasdaqfirms from the third quarter of 1987 through the third quarter of 1995.These data are collected by CDA Investment Technologies under an agree-ment with the SEC. CDA, in turn, provides these data to Compact Dis-closure, whose CDs we use to extract a security identifier, the number ofshares of each firm held by each institution, and the net number of sharesbought or sold by the institution over that quarter. Our sample consists ofapproximately 6.7 million such quarterly portfolio positions reported by1,200 institutions.
We match the reconstructed portfolio composition database with prices,market values, and returns from the CRSP databases. We search the entireCUSIP history on CRSP to reconcile discrepancies between the two databases.
C. Data Checks and Adjustments
We first verify the accuracy and consistency of the data by comparing thereported changes in holdings with the changes in holdings inferred fromsuccessive end-of-quarter positions. Approximately 1 percent of the mis-matches are due to rounding errors. Another 10 percent of the mismatchesare due to stock splits and related distributions. We confirm the distribu-tions using CRSP factor adjustments and adjust the data accordingly. Wheninstitutions file a 13-F statement after the required 45-day period, we back-fill their holdings using corrected filing dates. For each institution, we dropthe first and last quarter of our time series to avoid artificially introducingentry and exit into the portfolios. Finally, we eliminate involuntary exits dueto mergers, consolidations, and bankruptcies as identified by CRSP delistingcodes.
A bias may result from the reporting format employed by Compact Dis-closure. If more than 250 institutions own a stock, Compact Disclosure
Momentum Trading by Institutions 2453

reports only the holdings of the largest 250 institutions. The ~smaller! hold-ings of the remaining institutions are summed and reported as an aggre-gate, thereby inducing an upward bias in our estimates of entry and exit.3The original CDA data do not suffer from this aggregation problem. Weperform a number of checks to assess the impact of this aggregation. First,we use the original CDA tapes from the last quarter of each calendar year tocalculate the percentage of firms in which institutional holdings are aggre-gated. Less than three percent of the firms in each quarter are affected bythe aggregation. Second, we purchase original CDA data for the third quar-ter of 1991 to determine the magnitude of the upward bias in entry and exit.The percentages of portfolio revisions representing entry and exit for thesequarters in the original CDA data are 10.5 percent and 9.1 percent. Corre-sponding estimates using the Compact Disclosure data are 10 percent and8 percent, respectively. This suggests that the magnitude of the upward biasis not large. Third, we recalculate our results in two subsamples that arefree of the aggregation bias: ~1! a subsample formed after eliminating allfirms with any aggregated holdings, and ~2! a subsample from original CDAdata without the aggregation ~the last quarter in each of the eight years!.The results are similar to those reported in the paper.
II. Measuring Momentum Trading
A. The Basic Measure
We follow Grinblatt et al. ~1995! and define a portfolio weight wijt ~theweight in stock i for institution j at time t! as
wijt 5Pit Hijt
(i51
N
Pi Hijt
, ~1!
where Pit is the end-of-quarter price of stock i at time t and Hijt is thenumber of shares held by institution j in stock i at time t. A portfolio ad-justment is then simply a change in the portfolio weight from t 2 l tot~wijt 2 wijt2l !. However, a portfolio weight can change over successive pe-riods due to either a change in holdings or a change in the price of thesecurity. Grinblatt et al. ~1995! refer to the latter as passive momentum.Since our interest is in momentum trading, we adjust for this passive mo-mentum by calculating both end- and beginning-of-quarter portfolio weightswith the same price. We use an end-of-quarter price for this normalization,but average prices produce similar results. Our basic momentum measure,
3 Compact Disclosure informs us that they apply this aggregation rule due to a data storageconstraint at the firm level. Most of the time, the cutoff point is 250 institutions per firm.Although it can sometimes vary between 240 and 260, it never drops below 240.
2454 The Journal of Finance

ITMjt ~k, l !, is simply the sum of the cross-products of individual securityweight changes with returns. Specifically,
ITMjt ~k, l ! 5 (i51
N
~wijt 2 wijt2l !~Ri, t2k 2 Rm, t2k!, ~2!
where Ri, t2k is a holding-period return for stock i, Rm, t2k is the holding-period return for the S&P 500, l indicates the time frame over which theportfolio weight changes are measured, and k indicates the duration overwhich the corresponding lagged returns are measured. Since the weights inequation ~2! at t 2 l and t are evaluated at the same end-of-quarter prices,they differ from each other only because of active trading.
When l equals one, the weight changes are measured over successive quar-ters. When l equals two or four, the weight changes are measured over six-month or one-year intervals, respectively, permitting us to examine portfoliorevisions involving trading strategies that take more than a quarter to ex-ecute. We present results only for quarterly portfolio weight changes or lequal to one; results using l equal to two or four are available upon request.By varying k, we are able to examine the importance of different prior-period return horizons on the decision to change portfolio holdings. We allowk to take on values of zero, one, two, and four, corresponding to current-quarter returns and one-quarter, two-quarter, and four-quarter lagged re-turns, respectively. The two- and four-quarter lagged returns are six-monthand one-year holding-period returns. Our choice of k is motivated by Jegadeeshand Titman ~1993! who form momentum portfolios after conditioning on three-,six-, nine-, and 12-month lagged returns. When k equals zero, we cannotdistinguish between institutions trading on intraquarter price changes andthe price impact of their trades. There are no such interpretation issueswhen k is greater than zero, and we focus our attention on these estimates.
B. Methodological Issues and Alternatives
The measure in equation ~2! produces an estimate for each institution ineach quarter and allows us to examine variations in momentum trading overtime, across different types of institutions, and across different holding pe-riods. The measure is easy to interpret, because a positive ~negative! valueimplies momentum ~contrarian! trading.
The quarterly changes in portfolio holdings represent transactions of vary-ing intensity, including the entry and exit of firms into and out of the port-folio. Entry and exit can distort the basic momentum measure. Consider aninstitution that owns 1,000 shares in security i1 and zero shares in securityi2 at the beginning of the quarter. Assume that the price of each security is$1. The beginning-of-quarter portfolio weights for these securities are oneand zero, respectively. If this institution then purchases 500 shares in secu-rity i1 and 1,000 shares in security i2, the resulting portfolio weights are 0.6and 0.4, respectively. Even though the institution added to its holdings of
Momentum Trading by Institutions 2455
security i1, its portfolio weight in that security declined because of the entryof a new security into the portfolio. A similar distortion in weights occurswhen an institution terminates its position in a security.4
From one perspective, a negative weight change in security i1 is appropri-ate because a smaller proportion of new funds are placed in i1, relative to astrategy that rebalances holdings to maintain a status quo in weights. How-ever, we wish to measure incremental trading per se, rather than weightchanges induced by price movements or entry0exit. Therefore, we separateportfolio changes into three groups: entry, exit, and adjustments to ongoingholdings. We then compute the momentum measure separately for each group.Thus, for entry ~exit!, the momentum measure is the same as in equation~2!, but we only sum weight changes when wijt2l 5 0 ~wijt 5 0!. Since theweights no longer sum to one, the sum of the weight changes is nonzero.Thus, weight changes for entry ~exit! are always positive ~negative!. How-ever, since the other term in the cross-product is excess returns, which canbe positive or negative, the momentum measure for each component shouldapproach zero under the null hypothesis of no momentum ~or contrarian!trading.
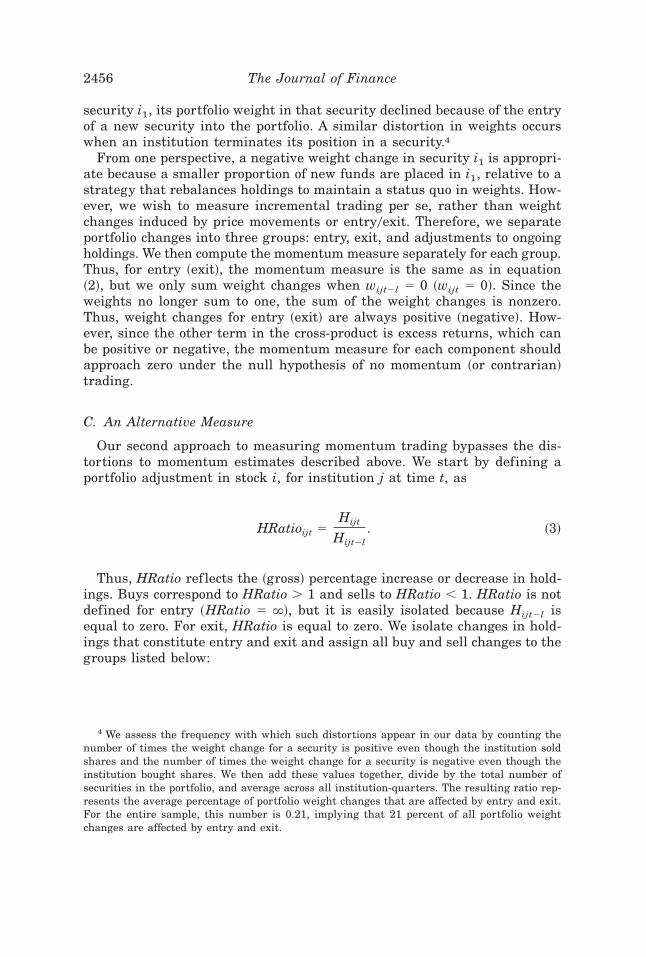
C. An Alternative Measure
Our second approach to measuring momentum trading bypasses the dis-tortions to momentum estimates described above. We start by defining aportfolio adjustment in stock i, for institution j at time t, as
HRatioijt 5Hijt
Hijt2l. ~3!
Thus, HRatio ref lects the ~gross! percentage increase or decrease in hold-ings. Buys correspond to HRatio . 1 and sells to HRatio , 1. HRatio is notdefined for entry ~HRatio 5 `!, but it is easily isolated because Hijt2l isequal to zero. For exit, HRatio is equal to zero. We isolate changes in hold-ings that constitute entry and exit and assign all buy and sell changes to thegroups listed below:
4 We assess the frequency with which such distortions appear in our data by counting thenumber of times the weight change for a security is positive even though the institution soldshares and the number of times the weight change for a security is negative even though theinstitution bought shares. We then add these values together, divide by the total number ofsecurities in the portfolio, and average across all institution-quarters. The resulting ratio rep-resents the average percentage of portfolio weight changes that are affected by entry and exit.For the entire sample, this number is 0.21, implying that 21 percent of all portfolio weightchanges are affected by entry and exit.
2456 The Journal of Finance

Buy Quartiles Sell Quartiles
1. Low-buy ~1.1 $ HRatio . 1! 1. Low-sell ~1 . HRatio $ 0.9!2. Med-buy ~1.3 $ HRatio . 1.1! 2. Med-sell ~0.9 . HRatio $ 0.7!3. High-buy ~HRatio . 1.3! 3. High-sell ~0.7 . HRatio!4. Entry 4. Exit
Each group represents an increasing level of trading intensity. For exam-ple, the low-buy group represents changes of up to 10 percent of the beginning-of-quarter holdings, while the high-buy group represents changes in holdingsgreater than 30 percent. We also isolate positions in which there is no changein holdings in the quarter ~HRatio 5 1!. We refer to the eight buy0sell groupsas buy and sell quartiles, despite an unequal number of observations in eachgroup. The predetermined cutoffs preserve a sufficiently large number ofobservations in each group and provide symmetry in the magnitude of port-folio revisions for both buys and sells.
HRatio allows us to parsimoniously characterize changes in holdings anddoes not suffer from measurement problems caused by entering and exitingsecurities. Since the ratio uses only the change in the number of shares overthe quarter, there are no passive momentum effects caused by changingprices. Also, the inf luence of the small upward bias in entry and exit causedby aggregation in our data source ~when more than 250 institutions holdshares in a particular firm! is minimized by HRatio because, at worst, itcauses a misclassification from the high-buy ~high-sell! to the entry ~exit!group. To determine if changes in holdings are due to momentum trading,we compute average excess returns for all portfolio revisions in a quartile.5Since quartile formation takes place across all portfolio revisions in a par-ticular quarter, it is useful to view each quartile as representing tradingintensity in one “giant” institutional portfolio. Therefore, we use HRatioquartiles to assess momentum within institutional portfolios rather thanacross types of institutions.
III. Empirical Results
A. Sample Characteristics
Table I shows fourth-quarter averages of the number of reporting institu-tions, the number of securities in an institution’s portfolio, and the dollarvalue of an institution’s portfolio. As expected, the data show a monotonicincrease in the average value of institutional portfolios over the sample pe-riod, from $988 million in the last quarter of 1987 to $1,598 million by thelast quarter of 1994. This monotonic increase remains even after we def late
5 The same security can appear multiple times in the calculation of average excess returns,since different institutions can hold ~and revise their holdings! in the same stock. This lack ofindependence does not bias estimates, because it is exactly the type of phenomena we areattempting to capture and it is not due to a regression error. If two institutions purchase asecurity that went up in price in the prior quarter, both portfolio revisions represent momen-tum trading and are detected by both the ITM and HRatio methods.
Momentum Trading by Institutions 2457
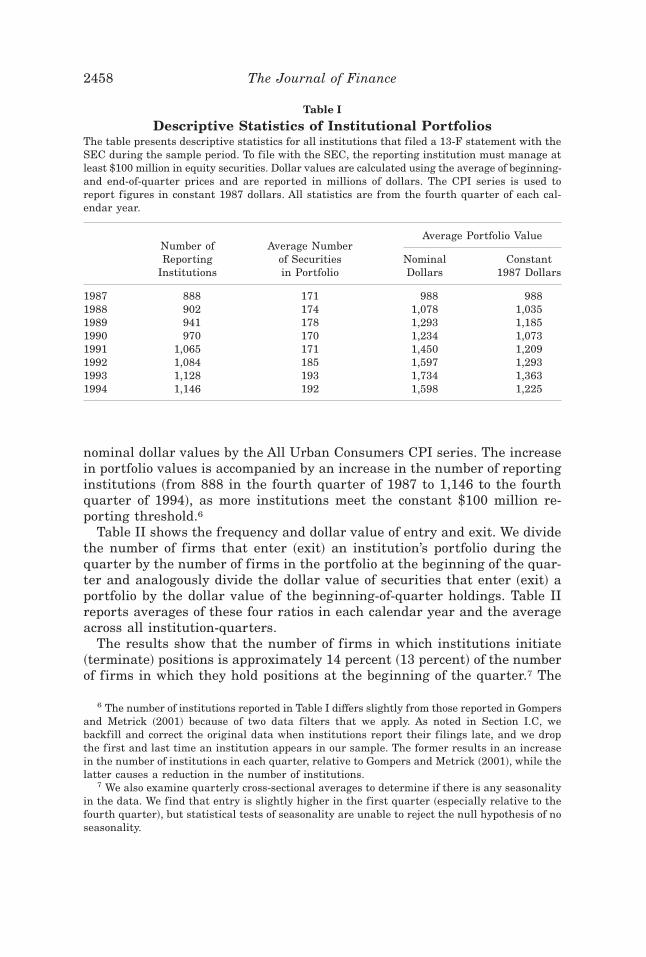
nominal dollar values by the All Urban Consumers CPI series. The increasein portfolio values is accompanied by an increase in the number of reportinginstitutions ~from 888 in the fourth quarter of 1987 to 1,146 to the fourthquarter of 1994!, as more institutions meet the constant $100 million re-porting threshold.6
Table II shows the frequency and dollar value of entry and exit. We dividethe number of firms that enter ~exit! an institution’s portfolio during thequarter by the number of firms in the portfolio at the beginning of the quar-ter and analogously divide the dollar value of securities that enter ~exit! aportfolio by the dollar value of the beginning-of-quarter holdings. Table IIreports averages of these four ratios in each calendar year and the averageacross all institution-quarters.
The results show that the number of firms in which institutions initiate~terminate! positions is approximately 14 percent ~13 percent! of the numberof firms in which they hold positions at the beginning of the quarter.7 The
6 The number of institutions reported in Table I differs slightly from those reported in Gompersand Metrick ~2001! because of two data filters that we apply. As noted in Section I.C, webackfill and correct the original data when institutions report their filings late, and we dropthe first and last time an institution appears in our sample. The former results in an increasein the number of institutions in each quarter, relative to Gompers and Metrick ~2001!, while thelatter causes a reduction in the number of institutions.
7 We also examine quarterly cross-sectional averages to determine if there is any seasonalityin the data. We find that entry is slightly higher in the first quarter ~especially relative to thefourth quarter!, but statistical tests of seasonality are unable to reject the null hypothesis of noseasonality.
Table I
Descriptive Statistics of Institutional PortfoliosThe table presents descriptive statistics for all institutions that filed a 13-F statement with theSEC during the sample period. To file with the SEC, the reporting institution must manage atleast $100 million in equity securities. Dollar values are calculated using the average of beginning-and end-of-quarter prices and are reported in millions of dollars. The CPI series is used toreport figures in constant 1987 dollars. All statistics are from the fourth quarter of each cal-endar year.
Average Portfolio ValueNumber ofReporting
Institutions
Average Numberof Securitiesin Portfolio
NominalDollars
Constant1987 Dollars
1987 888 171 988 9881988 902 174 1,078 1,0351989 941 178 1,293 1,1851990 970 170 1,234 1,0731991 1,065 171 1,450 1,2091992 1,084 185 1,597 1,2931993 1,128 193 1,734 1,3631994 1,146 192 1,598 1,225
2458 The Journal of Finance

average dollar value of both entry and exit is approximately 8 percent of thebeginning-of-quarter portfolio value, implying that in dollar terms, entryand exit together constitute almost 16 percent of all trading activity. Thus,both the frequency and magnitude of entry and exit appear to be economi-cally important.
B. Momentum within Institutional Portfolios
B.1. The ITM Measure
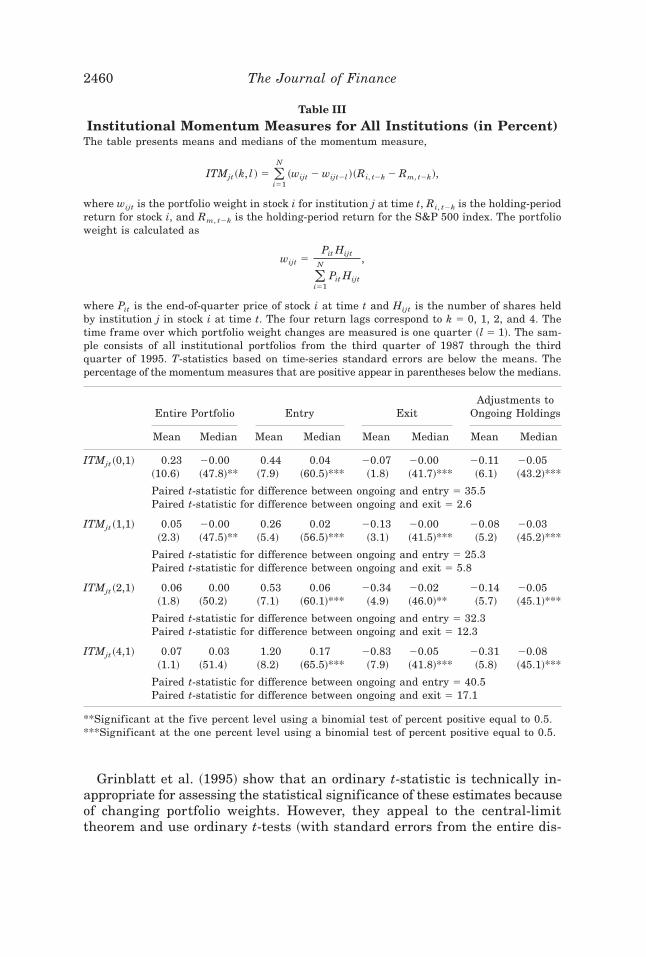
We calculate our first measure of momentum trading, ITMjt ~k, l !, for eachinstitution’s portfolio in each quarter. We use k equal to zero, one, two, andfour for the calculations, corresponding to contemporaneous returns and one-quarter, six-month, and one-year lagged returns, respectively. Table III showsmeans and medians for the momentum measure for the entire portfolio aswell as for the three groups: entry, exit, and adjustments to ongoing hold-ings. In this and future tables, all ITMjt ~k, l ! momentum estimates are pre-sented as percentages ~that is, the estimate is multiplied by 100!.
Table II
Frequency and Magnitude of Entry and ExitColumn ~1! shows the average number of firms entering an institution’s portfolio during thequarter scaled by the number of firms in the portfolio at the beginning of the quarter. Column~2! shows the average number of firms exiting an institution’s portfolio during the quarterscaled by the number of firms in the portfolio at the beginning of the quarter. Column ~3! showsthe average dollar value of shares purchased in firms entering an institution’s portfolio scaledby the dollar value of the portfolio at the beginning of the quarter. Column ~4! shows theaverage dollar value of shares sold in firms exiting an institution’s portfolio scaled by the dollarvalue of the portfolio at the beginning of the quarter. Each variable is averaged across allinstitutions in a quarter and then across quarters in a calendar year. Due to data availability,averages for 1987 are computed from two quarters ~Q3 and Q4! and averages for 1995 arecomputed from three quarters ~Q1, Q2, and Q3!. Averages across all 33 quarters appear at thebottom of the table.
Ratios Based on Numberof Firms in Portfolio
Ratios Based onDollar Value of Portfolios
~1!Entry
~2!Exit
~3!Entry
~4!Exit
1987 0.138 0.112 0.082 0.0591988 0.137 0.124 0.080 0.0741989 0.138 0.123 0.083 0.0741990 0.124 0.130 0.073 0.0751991 0.137 0.119 0.080 0.0671992 0.141 0.126 0.085 0.0721993 0.152 0.139 0.090 0.0841994 0.146 0.143 0.087 0.0851995 0.151 0.157 0.092 0.112
Average ~33 quarters! 0.140 0.130 0.084 0.078
Momentum Trading by Institutions 2459
Grinblatt et al. ~1995! show that an ordinary t-statistic is technically in-appropriate for assessing the statistical significance of these estimates becauseof changing portfolio weights. However, they appeal to the central-limittheorem and use ordinary t-tests ~with standard errors from the entire dis-
Table III
Institutional Momentum Measures for All Institutions (in Percent)The table presents means and medians of the momentum measure,
ITMjt ~k, l ! 5 (i51
N
~wijt 2 wijt2l !~Ri, t2k 2 Rm, t2k!,
where wijt is the portfolio weight in stock i for institution j at time t, Ri, t2k is the holding-periodreturn for stock i, and Rm, t2k is the holding-period return for the S&P 500 index. The portfolioweight is calculated as
wijt 5Pit Hijt
(i51
N
Pit Hijt
,
where Pit is the end-of-quarter price of stock i at time t and Hijt is the number of shares heldby institution j in stock i at time t. The four return lags correspond to k 5 0, 1, 2, and 4. Thetime frame over which portfolio weight changes are measured is one quarter ~l 5 1!. The sam-ple consists of all institutional portfolios from the third quarter of 1987 through the thirdquarter of 1995. T-statistics based on time-series standard errors are below the means. Thepercentage of the momentum measures that are positive appear in parentheses below the medians.
Entire Portfolio Entry ExitAdjustments to
Ongoing Holdings
Mean Median Mean Median Mean Median Mean Median
ITMjt ~0,1! 0.23 20.00 0.44 0.04 20.07 20.00 20.11 20.05~10.6! ~47.8!** ~7.9! ~60.5!*** ~1.8! ~41.7!*** ~6.1! ~43.2!***
Paired t-statistic for difference between ongoing and entry 5 35.5Paired t-statistic for difference between ongoing and exit 5 2.6
ITMjt ~1,1! 0.05 20.00 0.26 0.02 20.13 20.00 20.08 20.03~2.3! ~47.5!** ~5.4! ~56.5!*** ~3.1! ~41.5!*** ~5.2! ~45.2!***
Paired t-statistic for difference between ongoing and entry 5 25.3Paired t-statistic for difference between ongoing and exit 5 5.8
ITMjt ~2,1! 0.06 0.00 0.53 0.06 20.34 20.02 20.14 20.05~1.8! ~50.2! ~7.1! ~60.1!*** ~4.9! ~46.0!** ~5.7! ~45.1!***
Paired t-statistic for difference between ongoing and entry 5 32.3Paired t-statistic for difference between ongoing and exit 5 12.3
ITMjt ~4,1! 0.07 0.03 1.20 0.17 20.83 20.05 20.31 20.08~1.1! ~51.4! ~8.2! ~65.5!*** ~7.9! ~41.8!*** ~5.8! ~45.1!***
Paired t-statistic for difference between ongoing and entry 5 40.5Paired t-statistic for difference between ongoing and exit 5 17.1
**Significant at the five percent level using a binomial test of percent positive equal to 0.5.***Significant at the one percent level using a binomial test of percent positive equal to 0.5.
2460 The Journal of Finance
tribution of estimates!, since they are virtually identical to asymptotic z-tests.We follow their lead in reporting t-statistics, but note that estimates acrossquarters are unlikely to be independent. Therefore, we first calculate cross-sectional means for each quarter and use their distribution ~across 33 quar-ters! to generate standard errors and t-statistics. The t-statistics from thisFama–MacBeth-type approach are more conservative than the ordinaryt-statistics used by Grinblatt et al. We also report the percentage of positiveestimates and use binomial tests to assess their statistical significance. Fi-nally, we show paired t-statistics for the difference in means between entryand changes to ongoing holdings as well as between exit and changes toongoing holdings.
Table III highlights several important results. For the entire portfolio, theaverage momentum estimate is positive and statistically significant acrossall return lags, but the magnitude is quite small. For one-quarter laggedreturns ~k 5 1!, the average value of ITMjt ~k, l ! is only 0.05 percent perquarter, implying that, on average, stocks held by institutions at the end ofa quarter had returns over that quarter that were only five basis pointshigher than the corresponding returns on stocks held at the beginning of theprevious quarter. In contrast, Grinblatt et al. ~1995! find that the momen-tum estimate for mutual funds over the same horizon is 0.3 percent, sixtimes as large. Moreover, the distribution of our estimates is skewed. Me-dian values are significantly smaller than the mean and, in two cases, arenegative. Even though the average momentum estimate is slightly positive,the average institution appears to be slightly contrarian.
Perhaps this result is not surprising. After all, our sample encompasses alarge number of institutions, and, for every buyer, there must be a seller. Ifinstitutions generally trade with each other, the market-clearing conditionimplies that estimates of aggregate momentum trading must be close tozero. However, if institutions trade with individuals and0or other institu-tions, then aggregating all institutions would account for the lack of eco-nomically significant momentum trading.8 Regardless, the small magnitudeof aggregate momentum trading alleviates the concern that institutional trad-ing generally destabilizes stock prices.
The other columns of Table III, which provide separate momentum esti-mates for entry, exit, and adjustments to ongoing holdings, show strikingdifferences. Both the mean and median momentum measures are small andnegative for adjustments to ongoing holdings. For one-quarter lagged re-turns ~k 5 1!, the mean is 20.08 and the median is 20.03. As the return lagincreases, the mean estimates increase, but the medians remain small. For
8 We can never be sure if our sample institutions trade with each other, with individuals, orwith other institutions. We can, however, get a general sense of how much trading volume in astock is accounted for by the institutions in our database. To do so, we sum the change inquarter-to-quarter holdings by all institutions in each firm-quarter and divide this by totaltrading volume for that firm-quarter. The average of this ratio ~across all firm-quarters! is0.65, implying that our sample institutions account for at least 65 percent of total tradingvolume.
Momentum Trading by Institutions 2461

entry, both the mean and median momentum estimates are positive andsubstantially larger across all return lags. For one-quarter ~one-year! laggedreturns, the mean for entry is 0.26 percent ~1.20 percent! with a t-statistic of5.4 ~8.2!. Paired t-tests easily reject the null hypothesis that the mean forentry is equal to that for adjustments to ongoing holdings. The momentumestimates for exit are uniformly negative and also larger in magnitude thanthose for the ongoing adjustments group. Using a one-year return lag, themean for exit ~ongoing adjustments! is 20.83 ~20.31! with a t-statistic of 7.9~5.8!. A paired t-test also rejects equality between exit and the ongoing ad-justments group ~t-statistic 5 17.1!.
It is interesting to consider the net effect of entry, exit, and adjustments toongoing holdings on the entire portfolio. Since the momentum estimate forentry is typically larger than that for exit, the effects of net entry0exit arepositive and dominate the weak contrarian behavior observed in adjust-ments to ongoing holdings. Summing the three estimates for one-year laggedreturns ~20.31 1 1.20 2 0.83! results in an average estimate for the entireportfolio of 0.07, which is clearly driven by the effects of net entry0exit. Thisresult is consistent with Gompers and Metrick ~2001!, who conclude thatonce they control for firm size, there is no evidence of ~aggregate! momen-tum trading. Our results suggest that, even unconditionally, this is the case.When momentum matters, it does so at the time of entry.
B.2. The HRatio Measure
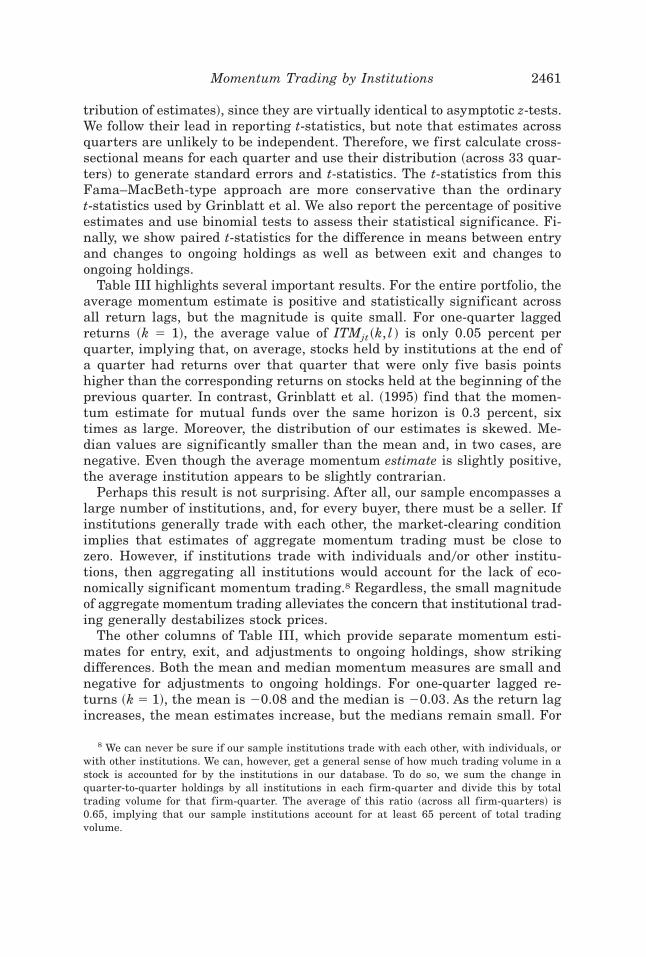
We next describe momentum trading using our second measure, HRatio.In Panel A of Table IV, we report the number of observations that fall intoeach of the eight buy0sell HRatio groups described in Section II.C, as well asa no-change group. Panel A also shows the average intensity of changes inholdings in each group, calculated as the dollar value of the portfolio revi-sion ~the change in the number of shares times the average price! scaled bythe beginning-of-quarter portfolio value. The data show a monotonic rela-tion between the intensity of the portfolio revision and the buy0sell quar-tiles. For example, the average entry ~exit! decision represents 0.59 percent~0.56 percent! of the entire portfolio. In contrast, the average low-buy ~low-sell! decision represents only 0.02 percent ~0.03 percent! of the entire port-folio. This suggests that the primary mechanism by which institutions adjusttheir portfolios is entry and exit.
In Panel B, we show the average S&P 500-adjusted excess return at var-ious return lags ~k 5 0, 1, 2, and 4!. Next to each return are paired t-statisticsthat represent tests of differences from the no-change group. The panel showsthat across both buys and sells, and regardless of the horizon, prior excessreturns are positive. This is consistent with the entry0exit results in Table IIIin that entry ref lects momentum trading, but exit shows contrarian behav-ior. However, there is dramatic variation in both the returns and the teststatistics across the groups. Average returns prior to entry are always sta-tistically and economically larger than the no-change group. As one moves
2462 The Journal of Finance
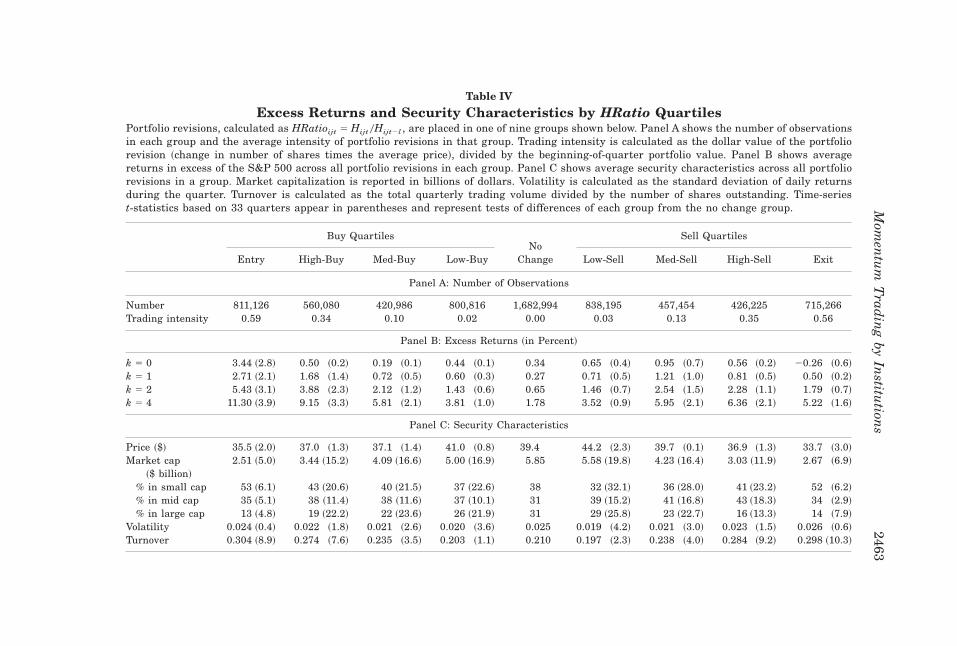
Table IV
Excess Returns and Security Characteristics by HRatio QuartilesPortfolio revisions, calculated as HRatioijt 5 Hijt 0Hijt2l , are placed in one of nine groups shown below. Panel A shows the number of observationsin each group and the average intensity of portfolio revisions in that group. Trading intensity is calculated as the dollar value of the portfoliorevision ~change in number of shares times the average price!, divided by the beginning-of-quarter portfolio value. Panel B shows averagereturns in excess of the S&P 500 across all portfolio revisions in each group. Panel C shows average security characteristics across all portfoliorevisions in a group. Market capitalization is reported in billions of dollars. Volatility is calculated as the standard deviation of daily returnsduring the quarter. Turnover is calculated as the total quarterly trading volume divided by the number of shares outstanding. Time-seriest-statistics based on 33 quarters appear in parentheses and represent tests of differences of each group from the no change group.
Buy Quartiles Sell Quartiles
Entry High-Buy Med-Buy Low-BuyNo
Change Low-Sell Med-Sell High-Sell Exit
Panel A: Number of Observations
Number 811,126 560,080 420,986 800,816 1,682,994 838,195 457,454 426,225 715,266Trading intensity 0.59 0.34 0.10 0.02 0.00 0.03 0.13 0.35 0.56
Panel B: Excess Returns ~in Percent!
k 5 0 3.44 ~2.8! 0.50 ~0.2! 0.19 ~0.1! 0.44 ~0.1! 0.34 0.65 ~0.4! 0.95 ~0.7! 0.56 ~0.2! 20.26 ~0.6!
k 5 1 2.71 ~2.1! 1.68 ~1.4! 0.72 ~0.5! 0.60 ~0.3! 0.27 0.71 ~0.5! 1.21 ~1.0! 0.81 ~0.5! 0.50 ~0.2!
k 5 2 5.43 ~3.1! 3.88 ~2.3! 2.12 ~1.2! 1.43 ~0.6! 0.65 1.46 ~0.7! 2.54 ~1.5! 2.28 ~1.1! 1.79 ~0.7!
k 5 4 11.30 ~3.9! 9.15 ~3.3! 5.81 ~2.1! 3.81 ~1.0! 1.78 3.52 ~0.9! 5.95 ~2.1! 6.36 ~2.1! 5.22 ~1.6!
Panel C: Security Characteristics
Price ~$! 35.5 ~2.0! 37.0 ~1.3! 37.1 ~1.4! 41.0 ~0.8! 39.4 44.2 ~2.3! 39.7 ~0.1! 36.9 ~1.3! 33.7 ~3.0!
Market cap~$ billion!
2.51 ~5.0! 3.44 ~15.2! 4.09 ~16.6! 5.00 ~16.9! 5.85 5.58 ~19.8! 4.23 ~16.4! 3.03 ~11.9! 2.67 ~6.9!
% in small cap 53 ~6.1! 43 ~20.6! 40 ~21.5! 37 ~22.6! 38 32 ~32.1! 36 ~28.0! 41 ~23.2! 52 ~6.2!
% in mid cap 35 ~5.1! 38 ~11.4! 38 ~11.6! 37 ~10.1! 31 39 ~15.2! 41 ~16.8! 43 ~18.3! 34 ~2.9!
% in large cap 13 ~4.8! 19 ~22.2! 22 ~23.6! 26 ~21.9! 31 29 ~25.8! 23 ~22.7! 16 ~13.3! 14 ~7.9!
Volatility 0.024 ~0.4! 0.022 ~1.8! 0.021 ~2.6! 0.020 ~3.6! 0.025 0.019 ~4.2! 0.021 ~3.0! 0.023 ~1.5! 0.026 ~0.6!
Turnover 0.304 ~8.9! 0.274 ~7.6! 0.235 ~3.5! 0.203 ~1.1! 0.210 0.197 ~2.3! 0.238 ~4.0! 0.284 ~9.2! 0.298 ~10.3!
Mom
entu
mT
radin
gby
Institu
tions
2463

across the buy quartiles, there is an almost monotonic decline in both aver-age returns and their statistical significance. For example, for the one-quarter lagged return ~k 5 1!, the excess return for entry is 2.7 percent anddeclines monotonically to 0.6 percent for the low-buy group. On the sell side,only 2 of the 16 excess returns are statistically different from the no-changegroup, and there is no discernible pattern across the quartiles.9
These results clearly indicate the source of trading momentum: Entry isassociated with the largest lagged returns as well as the greatest portfoliorevision intensity. It is possible that entry and exit are concentrated in par-ticular types of securities, and we turn to this next.
B.3. Security Characteristics
In Panel C of Table IV, we show the characteristics of the securities ineach of the nine groups. We calculate two measures of firm size: ~1! marketvalue at the beginning of the quarter, and ~2! the percentage of portfoliorevisions in small-cap ~less than $1 billion in market value!, mid-cap ~$1 bil-lion to $5 billion in market value!, and large-cap ~greater than $5 billion inmarket value! stocks. We also calculate average volatility ~standard devia-tion of daily returns during the quarter!, turnover ~total quarterly tradingvolume scaled by the number of shares outstanding!, and price level ~as ofthe beginning of the quarter!. Each average is calculated across all portfoliorevisions in a quarter and then across quarters.
We start by examining average price levels across the nine groups becauselarge differences in prices could substantially inf luence our inferences. Forexample, the formation of the HRatio quartiles gives each security equalweight, so that a 10 percent increase in holdings of a stock trading at $10per share is given the same weight as a 10 percent increase in holdings of astock trading at $100 per share. Panel C of Table IV shows some differencesin price levels; average prices generally decline as portfolio revision inten-sity increases. However, these differences are quite small. Average prices arein the $30–$40 range and the variation in prices across quartiles is about$5, suggesting that equally weighting the portfolio revisions is not likely tocause any systematic bias in quartile formation.
Differences in other security characteristics across the nine groups areevident. Over 53 percent ~52 percent! of all entry ~exit! takes place in small
9 This could be because our benchmark is too small. However, the choice of a benchmark ismotivated by our desire to understand trading behavior rather than assess risk-adjusted per-formance. The latter typically motivates the use of multifactor models ~see Fama and French~1993! and Carhart ~1997!!. In contrast, we seek to describe how an institution revises itsholdings in a security, conditional on a lagged return. Grinblatt and Keloharju ~2000! face asimilar dilemma and use raw returns. We could also use raw returns, but our sample period isone of generally rising prices. We use the S&P 500 return as a benchmark, because it is oftenused to judge money managers’ performance. As a robustness check, we employ two other bench-marks and discuss these results in Section IV.
2464 The Journal of Finance

firms. This is consistent with Bennett, Sias, and Starks ~2000!, who reportan increased institutional preference for smaller firms with high risk. Forthe low-buy ~low-sell! group, this percentage declines to 37 percent ~32 per-cent!. The decline in firm size from entry ~exit! to the low-buy ~low-sell!group is monotonic. Not surprisingly, as the percentage of small-cap firmsdeclines across quartiles, the percentage of large-cap firms increases. Sim-ilar declines are evident in volatility and turnover.
B.4. Further Evidence on Entry and Exit
The previous section shows that momentum trading takes place primar-ily through entry. It is possible that this result is simply the artifact ofnaïve portfolio strategies and0or institutional constraints on investmentdecisions. Consider, for example, an institution such as an index fund thatwishes to hold a value-weighted portfolio of stocks. In the presence of trans-action costs, this institution would add stocks to its portfolio when theymeet a minimum market capitalization threshold. A price increase obvi-ously causes stocks to meet such a threshold. Other institutional prefer-ences could also independently cause entry to be positively correlated withprior price increases. For example, investment managers constrained byconsiderations of prudence may be more likely to add securities that havereached a minimum size threshold ~see Badrinath, Gay, and Kale ~1989!and Del Guercio ~1996!!. Alternatively, institutional preferences for cer-tain stock characteristics, such as liquidity, may be correlated with pastprice increases ~see Falkenstein ~1996!!. The fact that entry takes placeafter price increases is consistent with the above explanations. However,these explanations also require that exit take place after price declines—aneffect that we do not observe. This suggests that such simple explanationsare, at best, only partly responsible for the entry and exit patterns that wedocument.
Our results could also ref lect the trading behavior described by Hong andStein ~1999!. In their model, information diffusion is slower in small stocks,causing positive autocorrelation in prices, and inducing momentum tradersto submit buy orders. This is consistent with our evidence that entry takesplace in small stocks. Moreover, the intensity of trading should be positivelyrelated to the degree of price momentum, and average entry-to-exit profitsshould be positive.
In Panel A of Table V, we categorize all entry and exit decisions into fourquartiles based on two measures of trading intensity. The first measure isthe dollar value of the portfolio revision, scaled by the beginning-of-quarterportfolio value; the second measure is the number of shares bought or sold,scaled by the total shares outstanding for that security. Panel A shows theaverage intensity ~using both measures! and average excess returns at var-ious lags for each quartile. The figures for the no-change group are alsoreported for comparison purposes and paired t-statistics for differences fromthe no-change group appear in parentheses.
Momentum Trading by Institutions 2465
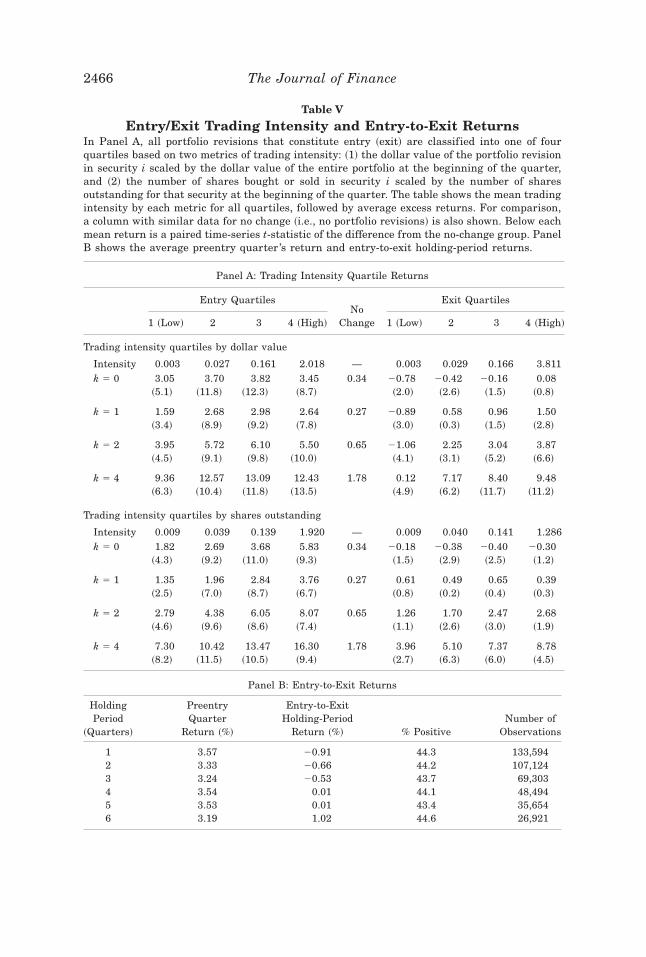
Table V
Entry/Exit Trading Intensity and Entry-to-Exit ReturnsIn Panel A, all portfolio revisions that constitute entry ~exit! are classified into one of fourquartiles based on two metrics of trading intensity: ~1! the dollar value of the portfolio revisionin security i scaled by the dollar value of the entire portfolio at the beginning of the quarter,and ~2! the number of shares bought or sold in security i scaled by the number of sharesoutstanding for that security at the beginning of the quarter. The table shows the mean tradingintensity by each metric for all quartiles, followed by average excess returns. For comparison,a column with similar data for no change ~i.e., no portfolio revisions! is also shown. Below eachmean return is a paired time-series t-statistic of the difference from the no-change group. PanelB shows the average preentry quarter ’s return and entry-to-exit holding-period returns.
Panel A: Trading Intensity Quartile Returns
Entry Quartiles Exit Quartiles
1 ~Low! 2 3 4 ~High!
NoChange 1 ~Low! 2 3 4 ~High!
Trading intensity quartiles by dollar value
Intensity 0.003 0.027 0.161 2.018 — 0.003 0.029 0.166 3.811k 5 0 3.05 3.70 3.82 3.45 0.34 20.78 20.42 20.16 0.08
~5.1! ~11.8! ~12.3! ~8.7! ~2.0! ~2.6! ~1.5! ~0.8!
k 5 1 1.59 2.68 2.98 2.64 0.27 20.89 0.58 0.96 1.50~3.4! ~8.9! ~9.2! ~7.8! ~3.0! ~0.3! ~1.5! ~2.8!
k 5 2 3.95 5.72 6.10 5.50 0.65 21.06 2.25 3.04 3.87~4.5! ~9.1! ~9.8! ~10.0! ~4.1! ~3.1! ~5.2! ~6.6!
k 5 4 9.36 12.57 13.09 12.43 1.78 0.12 7.17 8.40 9.48~6.3! ~10.4! ~11.8! ~13.5! ~4.9! ~6.2! ~11.7! ~11.2!
Trading intensity quartiles by shares outstanding
Intensity 0.009 0.039 0.139 1.920 — 0.009 0.040 0.141 1.286k 5 0 1.82 2.69 3.68 5.83 0.34 20.18 20.38 20.40 20.30
~4.3! ~9.2! ~11.0! ~9.3! ~1.5! ~2.9! ~2.5! ~1.2!
k 5 1 1.35 1.96 2.84 3.76 0.27 0.61 0.49 0.65 0.39~2.5! ~7.0! ~8.7! ~6.7! ~0.8! ~0.2! ~0.4! ~0.3!
k 5 2 2.79 4.38 6.05 8.07 0.65 1.26 1.70 2.47 2.68~4.6! ~9.6! ~8.6! ~7.4! ~1.1! ~2.6! ~3.0! ~1.9!
k 5 4 7.30 10.42 13.47 16.30 1.78 3.96 5.10 7.37 8.78~8.2! ~11.5! ~10.5! ~9.4! ~2.7! ~6.3! ~6.0! ~4.5!
Panel B: Entry-to-Exit Returns
HoldingPeriod
~Quarters!
PreentryQuarter
Return ~%!
Entry-to-ExitHolding-Period
Return ~%! % PositiveNumber of
Observations
1 3.57 20.91 44.3 133,5942 3.33 20.66 44.2 107,1243 3.24 20.53 43.7 69,3034 3.54 0.01 44.1 48,4945 3.53 0.01 43.4 35,6546 3.19 1.02 44.6 26,921
2466 The Journal of Finance

Excess returns for entry are systematically positive and generally increaseacross the quartiles. The quartiles provide a convenient economic interpre-tation. For example, the fourth entry quartile shows that a 12.4 percentexcess return over the prior year ~k 5 4! induces institutions to devote 2 per-cent of their portfolio to the stock. One way to judge the economic signifi-cance of these portfolio revisions is to compare them to the average equallyweighted portfolio. As shown in Table I, the average number of securities ininstitutional portfolios over the entire sample period is 179. This impliesequal portfolio weights of 0.56 percent, which suggests that a two-percentage-point adjustment is meaningful. Similarly, by the second measure, a 16.3 per-cent annual excess return results in institutions buying 1.9 percent of theoutstanding shares. Again, 1.9 percent of the outstanding shares representsan economically large block of equity. Consistent with the results in Table IV,the exit quartile excess returns are substantially smaller. Also, in 9 out of 32cases, the returns are statistically insignificant.
These results are consistent with Hong and Stein’s ~1999! model. Theirmodel also implies that, on average, momentum trading is profitable. Todetermine if this is the case, we examine entry-to-exit returns over variousholding periods in Panel B of Table V. We restrict the sample to only thosecases in which we can clearly identify both entry and exit and calculate theholding period of each stock from the quarter after entry. We then calculatethe average preentry quarterly excess return and the entry-to-exit excessholding-period return using the S&P 500 as the benchmark. For the latter,since compounding starts the quarter after entry, the holding-period returndoes not include the price impact of the trades that go into establishing theportfolio position. We report results for holding periods ranging from onethrough six quarters.
The results show an average positive preentry return of about 3 percent.This is similar to the preentry return of 3.4 percent in Table IV. The entry-to-exit returns, however, are negative for holding periods from one to threequarters and only marginally positive thereafter. On balance, excess returnsare close to zero. Risk adjustments and round-trip transaction costs in thesesmall stocks are only likely to further lower these returns. Although someinstitutions may profit from trend chasing, momentum trading does not ap-pear to be profitable on average and is at odds with the Hong and Stein~1999! model.
This result is somewhat puzzling, particularly since Jegadeesh and Titman~1993, 2001! show that momentum profits can be quite large. A reconcilia-tion between the two sets of results lies in recognizing that Jegadeesh andTitman base their results on a portfolio approach in which each security isassigned to 1 of 10 return-based portfolios every month. The winner portfolio~referred to as P1! contains securities with the highest returns in the portfolioformation period ~which can vary from 3 to 12 months!. Similarly, the loserportfolio ~P10! contains securities with the lowest returns in the portfolioformation period. The Jegadeesh and Titman ~1993! momentum strategyconsists of going long in the winner portfolio and short in the loser portfolio.
Momentum Trading by Institutions 2467

In the case of institutions, we only observe the long side of the strategy.Therefore, if entry takes place in stocks that are in the P1 portfolio, thenentry-to-exit returns should be positive. If entry takes place in both the earlyand late stages of the momentum cycle ~that is, in portfolios P1 throughP10!, then entry-to-exit returns should be equal to zero. To determine if thisis the case, we assign each entry-to-exit observation to portfolios P1 throughP10 based on the procedure in Jegadeesh and Titman ~1993!.10 We thenexamine the distribution of these portfolio assignments. We find that ap-proximately 60 percent of the entry-to-exit observations fall in portfolios P1through P5, but only 12 percent fall in the P1 portfolio. A x2 of the nullhypothesis of a uniform distribution fails to reject. Evidently, entry takesplace in both the early and late stages of the momentum cycle. This is con-sistent with Lee and Swaminathan’s ~2000! observation that momentum cyclesfor individual securities are “far less deterministic” than those for portfoliosand suggests that accurately timing these cycles is a difficult undertaking.The fact that the distribution of entry-to-exit returns includes both winnersand losers suggests that institutions follow diverse trading strategies.Accordingly, we shift our focus from trading within institutional portfolios~entry, exit, and adjustments to ongoing holdings! to trading behavior acrossdifferent types of institutions.
C. Momentum Trading across Institutional Portfolios
There are significant differences in the operating environment, incentives,size, investment style, taxation, regulation, and organization of different typesof institutions that may be systematically related to trading behavior. Wediscuss such differences below.
C.1. Factors Influencing Institutional Trading Decisions
Commercial banks manage assets delegated to them from two primarysources, trust accounts and pension plans. Trust assets are subject to “prudent-expert” considerations, which require a tilting of portfolios toward “high-quality” securities ~see Badrinath et al. ~1989! and Del Guercio ~1996!!. Pensionassets are often managed by investment advisory firms that are, in turn,sometimes owned by commercial banks.
Larger pension funds, colleges, and foundations often manage all or a por-tion of their assets internally. Since pension funds are subject to the Em-ployees Retirement Income Security Act ~ERISA!, they too are partiallyconstrained by prudence considerations. Unlike banks, pension funds arepermitted to consider the positive effects of portfolio diversification. Theassets of pension funds, colleges, and foundations are considered nontaxable.Frequently, pension funds segment their equity portfolios into passive and
10 We thank Jennifer Conrad and Bob Dittmar for providing these portfolio assignments.They are based on a six-month return for the portfolio formation period.
2468 The Journal of Finance

actively managed segments and employ independent investment advisors tomanage the latter segment.
Independent investment advisors and money managers are employed byprivate and public pension funds, colleges, and foundations, as well as bywealthy individual investors. Investment advisors typically retain invest-ment discretion over the assets delegated to them and are evaluated on aquarterly or annual basis, either by the provider of funds or by outside con-sultants. Lakonishok et al. ~1991! argue that the quarterly or annual eval-uation of investment advisors can cause them to engage in window dressing~i.e., selling losers at the end of the evaluation period!. Lakonishok, Shleifer,and Vishny ~1992b! argue that the structure of the money managementindustry is fraught with agency problems and that these agency problemsexplain the relative underperformance of investment advisors.
The assets of mutual funds originate largely from individual investors.Therefore, they are not inf luenced by prudence considerations. Unless theyare in 401K or IRA accounts, they are not tax exempt. Individuals do notmonitor mutual fund performance in the same way that pension funds mon-itor investment advisors. However, individuals can redeem their shares ondemand, thereby inf luencing the relation between asset f low and perfor-mance ~see, e.g., Sirri and Tufano ~1998!!. Del Guercio and Tkac ~1998! ex-amine differences in this relation for both mutual and pension funds andfind that mutual fund f lows are related to raw returns and pension fundreturns are related to performance relative to the S&P 500.
Unlike other types of institutions, funds invested by insurance companiesare not delegated to them by other institutional or individual investors. In-surance company portfolio managers are not subject to oversight and regu-lar evaluation by policyholders. Badrinath, Kale, and Ryan ~1996! note thatsafety-net considerations under a model investment law prescribed by theNational Association of Insurance Commissioners ~NAIC! explain only a smallportion of the cross-sectional dispersion in insurance company equity holdings.
Trading decisions can also be inf luenced by the investment style of theinstitution. Many institutions offer several investment vehicles ~accounts orfunds! that use different investment styles. For example, an investment ad-visor might offer an investment vehicle that follows a value-based strategyor another vehicle that invests based on earnings momentum. Still othersoffer diversified investment products that mimic the performance of marketindices.
In addition to differences in regulation, institution type, and investmentstyle, the level of an institution’s holdings in a particular security and0orsubgroup of securities can also play an important role in trading decisions.For instance, insurance companies are prohibited from investing more than10 percent of their assets in any one security. The ownership of more than5 percent of a firm’s stock automatically triggers additional reporting re-quirements for all institutions. Also, as the size of an institution’s position ina particular security becomes larger, the cost of trading that block in thefuture is likely to increase. As the dollar volume of assets under management
Momentum Trading by Institutions 2469

increases, these constraints could force some institutions to invest incremen-tal assets in smaller and perhaps riskier securities ~Bennett et al. ~2000!!.
C.2. Institution Classification Procedures
We manually match each institution in our sample with a textual descrip-tion of the institution from the Money Market Directory of Pension Fundsand their Investment Advisors ~1990 to 1995!, Weisenberger Investment Com-panies’ Yearbook ~1992 to 1995!, and Nelson’s Directory of Investment Man-agers ~1988 to 1995!. Based on these descriptions, each institution is classifiedinto one of the following categories: commercial banks and trusts, collegesand foundations, investment banks and broker-dealers, insurance compa-nies, money managers and investment advisors, mutual funds, corporate andpublic pension funds, and others. Our classifications are finer than thoseprovided by CDA in that we break out pension funds, investment banks andbroker-dealers, and colleges and foundations ~CDA classifies these as others!.
We use data purchased from the publishers of the Money Market Directoryof Pension Funds and Their Investment Advisors to attribute an investmentstyle to each institution. For each institution covered by the Money MarketDirectory, the data show yes0no responses to a list of 18 style classifications.As many of these classifications are similar in spirit, we collapse the re-sponses into four broad style categories:
1. Growth: Institutions that identify their style as one characterized byconsistent growth and0or earnings momentum.
2. Value: Institutions that identify their styles as some combination oflow P0E, contrarian, yield, bottom-up, or fundamental strategies.
3. Growth and value: Institutions that identify their styles as character-ized by some combination of growth and value strategies.
4. Diversified0miscellaneous: Institutions that manage multiple funds withdifferent investment styles, and also those that follow indexing strategies.
Details of the institution type and investment style classification proce-dures are available upon request.
C.3. Momentum Trading and Types of Institutions
In Table VI, we report estimates of our momentum measure ITMjt ~k, l ! byinstitution type for all return lags ~all values of k!. The table is separatedinto Panel A for entry, Panel B for exit, and Panel C for adjustments toongoing holdings. Each panel contains equal-weighted means, time-seriest-statistics, and the percentage of positive momentum measures.
For entry ~Panel A!, the average momentum measures are positive andstatistically significant across all types of institutions and all return lags.While the results clearly show momentum trading by all types of institu-tions, when new securities are added to their portfolios, there is consider-able variation in the estimates. The largest estimates are for mutual funds.These are followed by two clusters. Investment banks and brokers, insur-
2470 The Journal of Finance

ance companies, and money managers and investment advisors form onecluster, in which average momentum estimates are just below those for mu-tual funds ~for one-year lagged returns, the estimates are around 0.65 per-cent!. Banks, colleges and foundations, and pension funds form another cluster,with substantially lower estimates of momentum trading ~for one-year laggedreturns, these estimates cluster around 0.18 percent!.
For exit, Panel B shows that across all return lags and all types of insti-tutions, 23 of the 28 mean estimates are negative. Once again, there is con-siderable cross-sectional variation, with clusters forming around exactly thesame types of institutions as for entry. Momentum estimates for exit aresomewhat smaller than those for entry. Although we do not report them inthe table, net entry0exit estimates are uniformly positive. Changes in ongo-ing holdings show some momentum behavior for commercial banks, invest-ment banks, and insurance companies, and contrarian behavior for theremaining types of institutions; 19 of the 28 estimates ~across all return lagsand all institution types! are negative. Consistent with the results in Table III,the momentum estimates for the ongoing adjustments group are substan-tially smaller than those for entry and exit.
C.4. Momentum Trading and Investment Styles
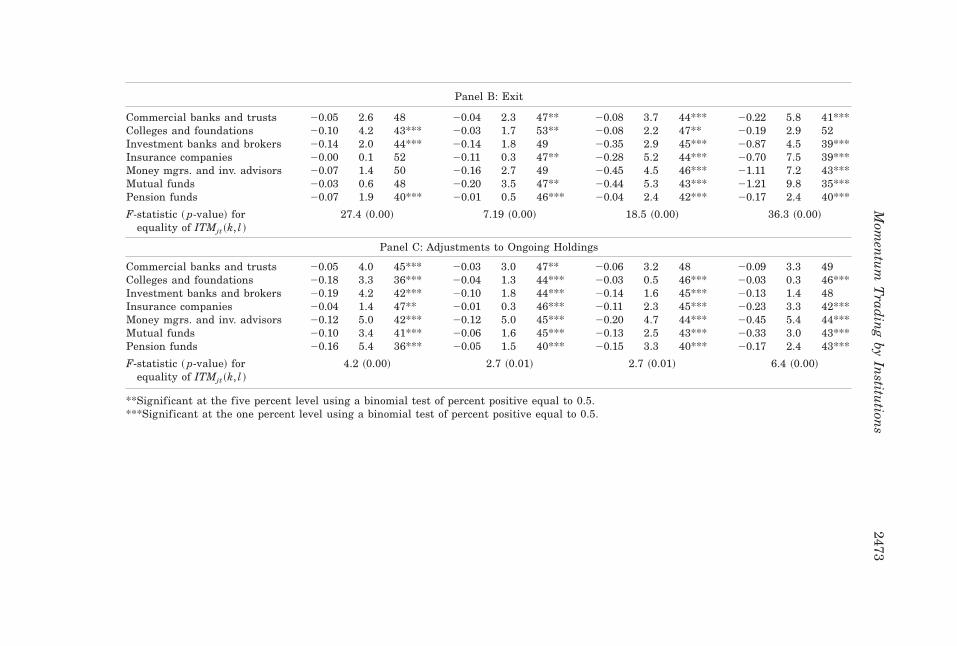
Table VII shows estimates of momentum trading for institutions classifiedby the four investment style categories. Panel A shows estimates for entry,Panel B shows estimates for exit, and Panel C contains estimates for ad-justments to ongoing holdings.
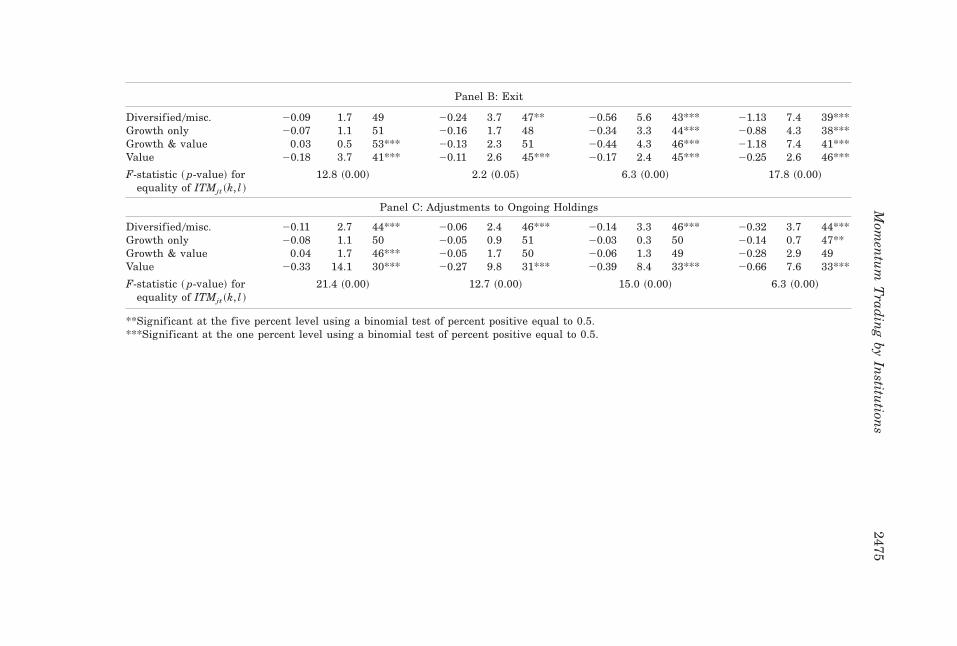
Entry ~Panel A! shows evidence of momentum trading across all returnlags for institutions following diversified, growth, and growth-and-value in-vestment styles. There is no evidence that institutions that follow value strat-egies add securities to their portfolios after price run-ups; two of the estimatesare positive and two are negative, but all four are extremely small. Exit~Panel B! shows evidence of contrarian behavior across all investment styles,although once again, the magnitude of contrarian trading is smallest forvalue traders. For the ongoing adjustments group ~Panel C!, the estimatesare small and close to zero for all investment styles except value, for whichthe average estimates are large and negative across all four return lags.
In general, the estimates are consistent with these institutions’ stated in-vestment styles. Across all return lags, F-tests easily reject the null hypoth-eses that the estimates are equal across institution type ~Table VI! and acrossinvestment style ~Table VII!.
IV. Robustness Issues and Additional Results
As a robustness check, we use a buy-sell decomposition of ITMjt ~k, l ! thatfollows Grinblatt et al. ~1995!. We use partial sums in equation ~2!, wherefor buys ~sells!, the summation only takes place when wijt . wijt2l ~wijt ,wijt2l !, and instead of subtracting a market return, we subtract the mean
Momentum Trading by Institutions 2471
Table VI
Institutional Momentum Measures by Institution Type (in Percent)The table presents means of the momentum measure,
ITMjt ~k, l ! 5 (i51
N
~wijt 2 wijt2l !~Ri, t2k 2 Rm, t2k!,
for institutions with each investment style from the third quarter of 1987 to the third quarter of 1995. The four return lags correspond to k 50, 1, 2, and 4. The time frame over which portfolio weight changes are measured is one quarter ~l 5 1!. The momentum measure is calculatedseparately for entry, exit, and adjustments to ongoing holdings. T-statistics are based on time-series standard errors.
ITMjt ~0,1! ITMjt ~1,1! ITMjt ~2,1! ITMjt ~4,1!
Mean t % Pos Mean t % Pos Mean t % Pos Mean t % Pos
Panel A: Entry
Commercial banks and trusts 0.09 4.0 60*** 0.07 3.7 56*** 0.16 5.0 61*** 0.40 5.7 67***Colleges and foundations 0.08 1.4 54** 0.06 2.5 55*** 0.17 3.7 59*** 0.60 2.4 64***Investment banks and brokers 0.47 4.1 61*** 0.30 3.1 60*** 0.65 4.9 62*** 1.32 5.9 69***Insurance companies 0.34 7.7 63*** 0.21 5.2 58*** 0.43 6.5 64*** 0.97 7.2 69***Money mgrs. and inv. advisors 0.58 7.5 61*** 0.34 5.1 58*** 0.70 6.8 59*** 1.56 8.4 64***Mutual funds 0.60 7.6 64*** 0.39 5.9 60*** 0.82 6.8 64*** 1.80 9.3 71***Pension funds 0.02 0.5 56*** 0.01 0.4 57*** 0.01 0.3 61*** 0.30 3.7 66***
F-statistic ~ p-value! for 42.8 ~0.00! 22.9 ~0.00! 33.9 ~0.00! 54.0 ~0.00!equality of ITMjt ~k, l !
2472T
he
Jou
rnal
ofF
inan
ce
Panel B: Exit
Commercial banks and trusts 20.05 2.6 48 20.04 2.3 47** 20.08 3.7 44*** 20.22 5.8 41***Colleges and foundations 20.10 4.2 43*** 20.03 1.7 53** 20.08 2.2 47** 20.19 2.9 52Investment banks and brokers 20.14 2.0 44*** 20.14 1.8 49 20.35 2.9 45*** 20.87 4.5 39***Insurance companies 20.00 0.1 52 20.11 0.3 47** 20.28 5.2 44*** 20.70 7.5 39***Money mgrs. and inv. advisors 20.07 1.4 50 20.16 2.7 49 20.45 4.5 46*** 21.11 7.2 43***Mutual funds 20.03 0.6 48 20.20 3.5 47** 20.44 5.3 43*** 21.21 9.8 35***Pension funds 20.07 1.9 40*** 20.01 0.5 46*** 20.04 2.4 42*** 20.17 2.4 40***
F-statistic ~ p-value! forequality of ITMjt ~k, l !
27.4 ~0.00! 7.19 ~0.00! 18.5 ~0.00! 36.3 ~0.00!
Panel C: Adjustments to Ongoing Holdings
Commercial banks and trusts 20.05 4.0 45*** 20.03 3.0 47** 20.06 3.2 48 20.09 3.3 49Colleges and foundations 20.18 3.3 36*** 20.04 1.3 44*** 20.03 0.5 46*** 20.03 0.3 46***Investment banks and brokers 20.19 4.2 42*** 20.10 1.8 44*** 20.14 1.6 45*** 20.13 1.4 48Insurance companies 20.04 1.4 47** 20.01 0.3 46*** 20.11 2.3 45*** 20.23 3.3 42***Money mgrs. and inv. advisors 20.12 5.0 42*** 20.12 5.0 45*** 20.20 4.7 44*** 20.45 5.4 44***Mutual funds 20.10 3.4 41*** 20.06 1.6 45*** 20.13 2.5 43*** 20.33 3.0 43***Pension funds 20.16 5.4 36*** 20.05 1.5 40*** 20.15 3.3 40*** 20.17 2.4 43***
F-statistic ~ p-value! forequality of ITMjt ~k, l !
4.2 ~0.00! 2.7 ~0.01! 2.7 ~0.01! 6.4 ~0.00!
**Significant at the five percent level using a binomial test of percent positive equal to 0.5.***Significant at the one percent level using a binomial test of percent positive equal to 0.5.
Mom
entu
mT
radin
gby
Institu
tions
2473
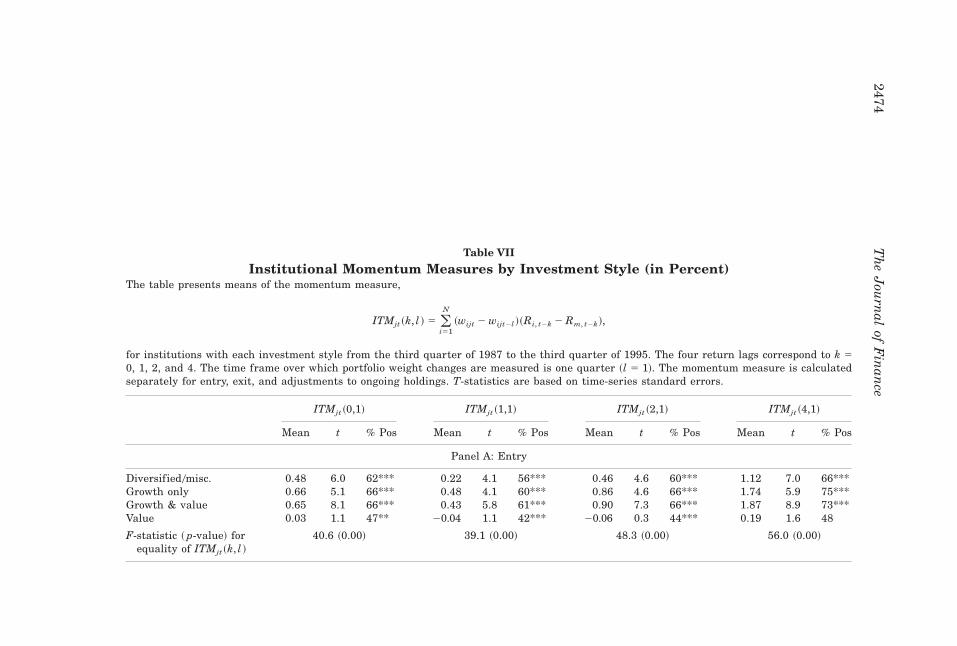
Table VII
Institutional Momentum Measures by Investment Style (in Percent)The table presents means of the momentum measure,
ITMjt ~k, l ! 5 (i51
N
~wijt 2 wijt2l !~Ri, t2k 2 Rm, t2k!,
for institutions with each investment style from the third quarter of 1987 to the third quarter of 1995. The four return lags correspond to k 50, 1, 2, and 4. The time frame over which portfolio weight changes are measured is one quarter ~l 5 1!. The momentum measure is calculatedseparately for entry, exit, and adjustments to ongoing holdings. T-statistics are based on time-series standard errors.
ITMjt ~0,1! ITMjt ~1,1! ITMjt ~2,1! ITMjt ~4,1!
Mean t % Pos Mean t % Pos Mean t % Pos Mean t % Pos
Panel A: Entry
Diversified0misc. 0.48 6.0 62*** 0.22 4.1 56*** 0.46 4.6 60*** 1.12 7.0 66***Growth only 0.66 5.1 66*** 0.48 4.1 60*** 0.86 4.6 66*** 1.74 5.9 75***Growth & value 0.65 8.1 66*** 0.43 5.8 61*** 0.90 7.3 66*** 1.87 8.9 73***Value 0.03 1.1 47** 20.04 1.1 42*** 20.06 0.3 44*** 0.19 1.6 48
F-statistic ~ p-value! for 40.6 ~0.00! 39.1 ~0.00! 48.3 ~0.00! 56.0 ~0.00!equality of ITMjt ~k, l !
2474T
he
Jou
rnal
ofF
inan
ce
Panel B: Exit
Diversified0misc. 20.09 1.7 49 20.24 3.7 47** 20.56 5.6 43*** 21.13 7.4 39***Growth only 20.07 1.1 51 20.16 1.7 48 20.34 3.3 44*** 20.88 4.3 38***Growth & value 0.03 0.5 53*** 20.13 2.3 51 20.44 4.3 46*** 21.18 7.4 41***Value 20.18 3.7 41*** 20.11 2.6 45*** 20.17 2.4 45*** 20.25 2.6 46***
F-statistic ~ p-value! forequality of ITMjt ~k, l !
12.8 ~0.00! 2.2 ~0.05! 6.3 ~0.00! 17.8 ~0.00!
Panel C: Adjustments to Ongoing Holdings
Diversified0misc. 20.11 2.7 44*** 20.06 2.4 46*** 20.14 3.3 46*** 20.32 3.7 44***Growth only 20.08 1.1 50 20.05 0.9 51 20.03 0.3 50 20.14 0.7 47**Growth & value 0.04 1.7 46*** 20.05 1.7 50 20.06 1.3 49 20.28 2.9 49Value 20.33 14.1 30*** 20.27 9.8 31*** 20.39 8.4 33*** 20.66 7.6 33***
F-statistic ~ p-value! forequality of ITMjt ~k, l !
21.4 ~0.00! 12.7 ~0.00! 15.0 ~0.00! 6.3 ~0.00!
**Significant at the five percent level using a binomial test of percent positive equal to 0.5.***Significant at the one percent level using a binomial test of percent positive equal to 0.5.
Mom
entu
mT
radin
gby
Institu
tions
2475

return over the subsequent four quarters. We calculate these buy and sellITMjt~k, l ! measures quarterly for each institution. The results are less sharpthan HRatio because of the mixing of entry0exit with adjustments to ongoingholdings, but, in general, the patterns are similar to those reported in the paper.
We also check the robustness of our momentum results using alternativereturn benchmarks. We use the CRSP value-weighted index to calculate ex-cess returns and obtain results similar to those reported in the paper. Wenext use an in-sample benchmark that is an equally weighted return of allsecurities in which institutions hold positions in that quarter. This bench-mark reduces excess returns for all HRatio quartiles. For example, for aone-quarter return lag ~k 5 1!, average preentry ~preexit! excess returns fallfrom 5.4 percent ~1.7 percent! to 4.4 percent ~0.7 percent!. The decline inreturns is larger for sell than for buy quartiles, and all average excess re-turns remain positive ~except exit when k 5 0!. Entry-to-exit returns alsodecline and remain statistically indistinguishable from zero. In sum, ourresults are not dramatically affected by the choice of return benchmarks.Results are available upon request.
V. Conclusions
We investigate the trading behavior of institutional investors from the thirdquarter of 1987 through the third quarter of 1995. We employ quarterlyportfolio holdings of 1,200 institutions in approximately 5,000 firms over thesample period. These data represent about 6.7 million portfolio positionsand an equity market value of $1.8 trillion toward the end of the sampleperiod. Our analysis takes two forms. First, we decompose trading activitywithin institutional portfolios into the initiation of new equity positions ~en-try!, the termination of previous equity positions ~exit!, and other adjust-ments to existing holdings. Second, we examine trading practices by differenttypes of institutions and by institutions with different investment strategies.
We find that institutions act as momentum traders when they enter stocksbut they act as contrarian traders both when they exit and when they makeadjustments to ongoing holdings. The dollar value of an institution’s port-folio devoted to entry or exit is positively related to lagged returns, andentry0exit typically takes place in small firms, consistent with Hong andStein ~1999!. We find no evidence of institutional prescience—after a simplemarket adjustment and with no transaction costs, average entry-to-exit re-turns are close to zero. This appears to ref lect a diversity in trading prac-tices. Such diversity is also evident across different types of institutions. Thesensitivity of changes in holdings to past returns is significantly higher forinvestment advisors and mutual funds than for pension funds and banks.Institutions that claim to follow growth and growth-and-value strategies aremomentum traders, whereas institutions following value strategies are con-trarian. Because of the large cross-sectional variation in institutional tradingbehavior, institutional trading is not, in the aggregate, destabilizing to stockprices.
2476 The Journal of Finance
With a large fraction of aggregate wealth under their management, insti-tutions are frequently the marginal price-setting agents in securities mar-kets. Therefore, an understanding of their trading behavior is an importantprerequisite to an understanding of the dynamics of stock prices. Our char-acterization of institutional trading practices is designed to provide such anunderstanding. The large variation in trading practices among different typesof institutions suggests that focusing on particular subsets of institutionsprovides a less than complete picture of trading behavior. The observationthat mutual funds engage in momentum trading is not sufficient to concludethat their trading destabilizes asset prices because there are other types ofinstitutions that follow offsetting strategies. This suggests that models inwhich multiple agents interact with each other may have an advantage oversingle-agent models in which all investors suffer from the same cognitivebias ~Barberis, Shleifer, and Vishny ~1998! and Daniel, Hirshleifer, and Sub-rahmanyam ~1998!!.
REFERENCES
Badrinath, S. G., Gerald D. Gay, and Jayant R. Kale, 1989, Patterns of institutional invest-ment, prudence and the managerial “safety-net” hypothesis, Journal of Risk and Insurance56, 605–629.
Badrinath, S. G., Jayant R. Kale, and Thomas H. Noe, 1995, Of shepherds, sheep and thecross-autocorrelation in equity returns, Review of Financial Studies 2, 401–430.
Badrinath, S. G., Jayant R. Kale, and Harley Ryan, 1996, Characteristics of insurance companyequity holdings, Journal of Risk and Insurance 63, 49–76.
Barberis, Nicholas, Andrei Shleifer, and Robert Vishny, 1998, A model of investor sentiment,Journal of Financial Economics 43, 307–343.
Bennett, James, Richard Sias, and Laura Starks, 2000, Investment competition, greener pas-tures and dynamic institutional preferences, Working paper, University of Texas at Austin.
Campbell, John, Martin Lettau, Burton Malkiel, and Yexiao Xu, 2001, Have individual stocksbecome more volatile? An empirical exploration of idiosyncratic risk, Journal of Finance 56,1–44.
Carhart, Mark, 1997, On persistence in mutual fund performance, Journal of Finance 52, 57–83.Daniel, Kent, David Hirshleifer, and Avanidhar Subrahmanyam, 1998, Investor psychology and
security market under- and overreactions, Journal of Finance 53, 1839–1885.Del Guercio, Diane, 1996, The distorting effect of the prudent-man laws on institutional equity
investments, Journal of Financial Economics 40, 31–62.Del Guercio, Diane, and Paula Tkac, 1998, The determinants of the f low of funds of managed
portfolios: Mutual funds versus pension funds, Working paper, University of Oregon.De Long, J. Bradford, Andrei Shleifer, Lawrence H. Summers, and Robert J. Waldmann, 1990,
Positive feedback investment strategies and destabilizing rational speculation, Journal ofFinance 45, 379–396.
Falkenstein, Eric, 1996, Preferences for stock characteristics as revealed by mutual fund port-folio holdings, Journal of Finance 51, 111–135.
Fama, Eugene, and Kenneth French, 1993, Common factors in the returns of stocks and bonds,Journal of Financial Economics, 33, 3–56.
Federal Reserve Board, 2000, Flow of funds accounts of the United States, http:00www.federalreserve.gov0releases0.
Friedman, Milton, 1953, The case for f lexible exchange rates, Essays in Positive Economics~University of Chicago Press, Chicago, IL!.
Gompers, Paul A., and Andrew Metrick, 2001, Institutional investors and equity prices, Quar-terly Journal of Economics 116, 229–259.
Momentum Trading by Institutions 2477

Grinblatt, Mark, and Matti Keloharju, 2000, The investment behavior and performance of var-ious investor types: A study of Finland’s unique data set, Journal of Financial Economics55, 43–68.
Grinblatt, Mark, Sheridan Titman, and Russ Wermers, 1995, Momentum investment strat-egies, portfolio performance and herding: A study of mutual fund behavior, American Eco-nomic Review 85, 1088–1105.
Hong, Harrison, and Jeremy C. Stein, 1999, A unified theory of underreaction, momentumtrading and overreaction in asset markets, Journal of Finance 54, 2143–2184.
Jegadeesh, Narasimhan, and Sheridan Titman, 1993, Returns to buying winners and sellinglosers: Implications for stock market efficiency, Journal of Finance 48,65–91.
Jegadeesh, Narasimhan, and Sheridan Titman, 2001, Profitability of momentum strategies: Anevaluation of alternative explanations, Journal of Finance 56, 699–720.
Lakonishok, Josef, Andrei Shleifer, Richard H. Thaler, and Robert W. Vishny, 1991, Windowdressing by pension fund managers, American Economic Review 81, 227–231.
Lakonishok, Josef, Andrei Shleifer, and Robert W. Vishny, 1992a, The impact of institutionaltrading on stock prices, Journal of Financial Economics 32, 23–43.
Lakonishok, Josef, Andrei Shleifer, and Robert W. Vishny, 1992b, The structure and perfor-mance of the money management industry, Brookings Papers: Microeconomics, 339–391.
Grinblatt, Mark, Sheridan Titman, and Russ Wermers, 1995, Momentum investment strat-egies, portfolio performance and herding: A study of mutual fund behavior, American Eco-nomic Review 85, 1088–1105.
Lee, Charles, and Bhaskaran Swaminathan, 2000, Price momentum and trading volume, Jour-nal of Finance 55, 2017–2069.
Lemke, Thomas P., and Gerald T. Lins, 1987, Disclosure of equity holdings by institutionalinvestment managers: An analysis of Section 13~F! of the Securities Exchange Act of 1934,The Business Lawyer 43, 93–119.
Malkiel, Burton, and Yexiao Xu, 1999, The structure of stock market volatility, Working paper,Princeton University.
Money Market Directory of Pension Funds and Their Investment Advisors, 1990–1995 ~MoneyMarket Directories Inc., Charlottesville, VA!.
Nelson’s Directory of Investment Managers, 1988–1995 ~Nelson Publications, Port Chester, NY!.Nofsinger, John, and Richard Sias, 1999, Herding and feedback trading by institutional and
individual investors, Journal of Finance 54, 2263–2295.Sias, Richard W., and Laura T. Starks, 1997a, Institutions and individuals at the turn of the
year, Journal of Finance 52, 1543–1562.Sias, Richard W., and Laura T. Starks, 1997b, Return autocorrelation and institutional inves-
tors, Journal of Financial Economics 46, 103–131.Sirri, Erik, and Peter Tufano, 1998, Costly search and mutual fund f lows, Journal of Finance
53, 1589–1622.Wermers, Russ, 1999, Mutual fund herding and the impact on stock prices, Journal of Finance
54, 581–622.Wiesenberger Investment Companies Yearbook, 1992–1995 ~CDA0Wiesenberger, Rockville, MD!.
2478 The Journal of Finance